The euro cash changeover, inflation perceptions and the media
Upload
uni-marburgCategory
view
0download
0
1
Term Paper European Monetary Economics
TOPIC 24: INFLATION DIFFERENCES IN THE EURO AREA
Name: Apalowo Toluth
Email: [email protected]
Matriculation Number: 2609665
Name of the Program: Economics and Institutions
~Blank Space for Comments of Examiner~
Examiner: Prof. Bernd Hayo / Matthias Uhl Grade:

2
I. INTRODUCTION
The underlying objective of the European Central Bank (ECB) as contained in Article
105 of the treaty on European Union states: “The primary objective of the ECB shall be to
maintain price stability. Without prejudice to the objective of price stability, the ECB shall
support the general economic policies in the Community with a view to contributing to the
achievement of the objectives of the Community as laid down in Article 2.”
The dispersion of inflation across the euro area countries has broadly stabilized since
the inception of the euro. Looking back towards the beginning of the 1990s, the degree of
inflation dispersion, measured as the (un-weighted) standard deviation among the 12 euro
area Member States, was characterized by a strong downward trend. The high degree of
dispersion, of around 6 percentage points, observed in the early 1990s was mainly the result
of very high levels of inflation in a few countries. Between 1994 and 1998, inflation
dispersion continued to decline, reaching its lowest level since the start of the Stage Three of
EMU, namely less than 1 percentage point, around the second half of 1999. José Manuel
González-Páramo (2005)
After its decline over the nineties, the divergence of national inflation rates within the
euro area started to rise again after the launch of the single currency in 1999. Since then,
inflation differentials have remained quite pronounced and, above all, very persistent. The
relative positions of European countries in terms of inflation have actually changed very
slowly since the creation of the Economic and Monetary Union (EMU): Germany and Austria
systematically demonstrated below-average annual inflation rates, whereas Spain, Greece and
Ireland remained among the most inflationary countries (with annualized inflation rates that
sometimes exceeded 5%).
Alberola and Tyrvainen (1998) reiterate that Inflation differentials in EMU could be
explained with the so-called Balassa Samuelson (BS) hypothesis1. Balassa and Samuelson
(1964) observed that technological progress has historically been faster in the traded goods
sector than in the non-traded goods sector. A rise in productivity in the traded goods sector
will bid up nominal wages in the entire economy because of sectorial labor mobility;
producers in the non-traded goods sector will only meet the higher wages if there is a rise in
the relative price of non-traded goods. Within a country, differentials in sectorial productivity
growth induce dual inflation; when countries are compared, differences in dual inflation
1 More explanations of the Balassa and Samuelson hypothesis is explained under the theoretical model review

3
translate into real exchange rate variation. In the context of a monetary union, the effect of the
BS model is that countries with faster productivity growth in the tradable goods sector and/or
slower growth in the non-traded goods sector are expected to suffer from higher inflation
The study seeks to review past theoretical and empirical works on the inflation
differentials in the euro area and hope to proffer answer to an important question: the reason
for the inflation differences in spite of the encompassing monetary policy in the euro area.
Following the introduction, section II describes the theoretical model review, section
III reviews past empirical investigations on inflation differentials, section IV seeks to
elucidate asymmetry national inflation based on monetary policy perspective while section V
shows the conclusion
II. THEORETICAL MODEL REVIEW
Balassa (1964) and Samuelson (1964)2 suggested that differences in sectorial
productivity growth are associated with changes in relative prices between countries.
Since labor is assumed to be mobile between sectors, nominal wages tend to equalize.
Furthermore, real wages in each sector, measured in terms of their own prices, are equal to
marginal productivity. Balassa and Samuelson noted that productivity tends to grow faster in
the tradable goods sector because technological progress is embedded in new capital and
tradable goods are more capital intensive than services. All this implies that productivity
growth differentials in favor of traded goods are reflected in higher non-traded goods
inflation. As a result, countries with higher productivity growth tend to have higher aggregate
CPI inflation and their real exchange rate, that is, the relative price of foreign goods to
domestically produced goods (measured in domestic currency) tends to appreciate.
Alberola and Tyrvainen (1998) “decomposed” the productivity hypothesis of BS into
two statements. Sectorial inflation differentials is said to be a result of productivity growth
differentials between the tradable sector and the non-tradable sector. Secondly, dual inflation
induces real exchange rate variability which, in the case of EMU, will be reflected in inflation
differentials among countries.
2 Several studies of inflation differentials were done based on this hypothesis. See Alberola and Tyrvainen
(1998), Licheron (2008), ECB (1999, 2002, 2004).
4
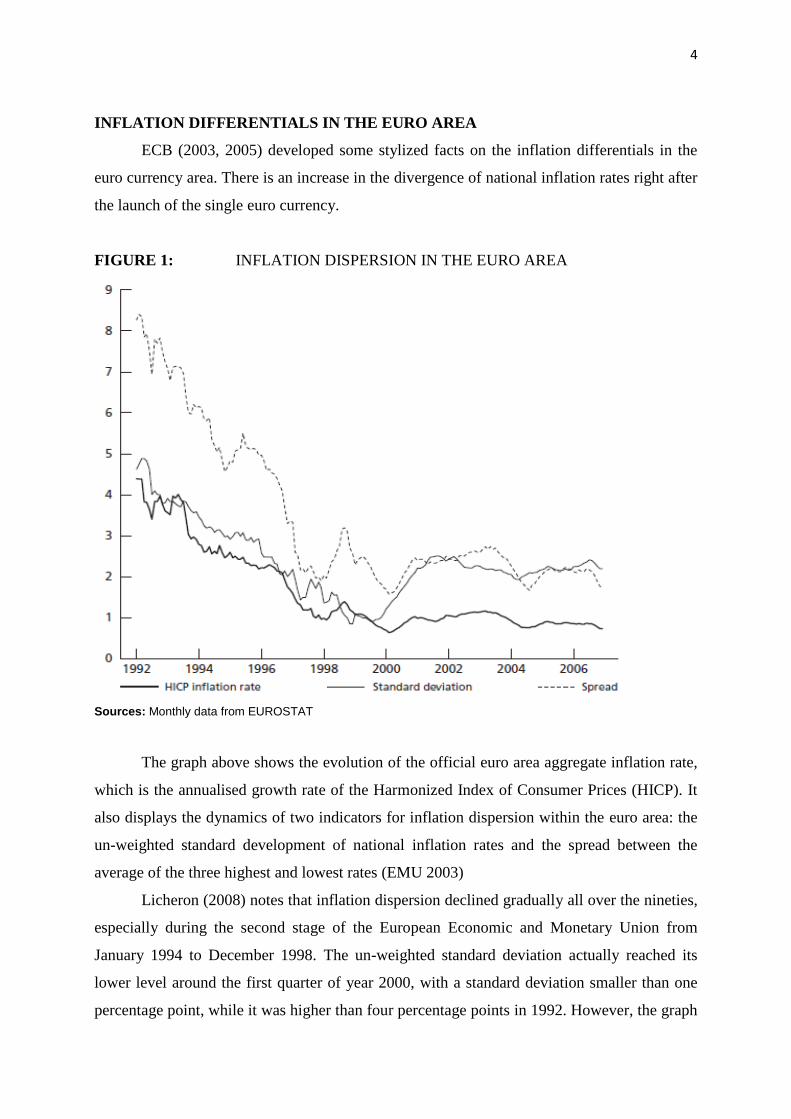
INFLATION DIFFERENTIALS IN THE EURO AREA
ECB (2003, 2005) developed some stylized facts on the inflation differentials in the
euro currency area. There is an increase in the divergence of national inflation rates right after
the launch of the single euro currency.
FIGURE 1: INFLATION DISPERSION IN THE EURO AREA
Sources: Monthly data from EUROSTAT
The graph above shows the evolution of the official euro area aggregate inflation rate,
which is the annualised growth rate of the Harmonized Index of Consumer Prices (HICP). It
also displays the dynamics of two indicators for inflation dispersion within the euro area: the
un-weighted standard development of national inflation rates and the spread between the
average of the three highest and lowest rates (EMU 2003)
Licheron (2008) notes that inflation dispersion declined gradually all over the nineties,
especially during the second stage of the European Economic and Monetary Union from
January 1994 to December 1998. The un-weighted standard deviation actually reached its
lower level around the first quarter of year 2000, with a standard deviation smaller than one
percentage point, while it was higher than four percentage points in 1992. However, the graph

5
suggests a slight increase in inflation dispersion since the beginning of the year 2000, which is
even more pronounced when looking at the spread. It appears that the downward trend of
national inflation dispersion broke off and reversed suddenly after 1999, year of the
completion of the euro area.
Angeloni and Ehrmann (2004) and Hofmann and Remsperger (2005) in their empirical
work as cited by Licheron (2008) explains that inflation differential in the euro area shows a
strong persistence. The inflation position of each member states of the euro area does not
seem to change much between 1999 and 2006.
TABLE 1 DEVIATION OF ANNUAL HICP INFLATION RATES FROM THE
OFFICIAL EMU INFLATION RATE (1999-2006)
Sources: Yearly data from OECD economic outlook
The table above depicts the annual deviations of national inflation rates from the
official euro area aggregate inflation rate since the launch of the euro area in 1999 to 2006.
Germany and Austria systematically displayed HICP inflation rates below the euro area
average, whereas Spain, Greece, Ireland and Portugal have almost always been among the
most inflationary countries. Those countries often exhibited inflation rates one percentage
point above the euro average. In the case of Ireland, the annual growth rate of consumer
prices even reached 5.25% in the year 2000 (3.13 percentage points above the euro average).
Belgium, Finland, France and the Netherlands are the only member countries that exhibited
inflation rates fluctuating around the euro average without being systematically higher or
lower.

6
THE UNITED STATES AS A BENCHMARK FOR INFLATION DIFFERENTIALS
IN THE EURO AREA
In explaining the inflation differentials in the Euro area, it is of utmost importance to
compare it with a large “monetary union” like the United States to ascertain if the differential
in the euro area is a recent phenomenon, or if there is an historical evidence to back it.
Several research works has been done both theoretically and empirically as form of
comparative studies between the inflation differentials in the US and the Euro area3
Inflation differentials in the United States are typically persistent, but they are not
permanent and price levels in the different regions of the US tend to revert to their initial
relative levels. ECB (2003)
ECB (2003) using both the range and the standard deviation of inflation to measure
inflation differentials in the US4 found a similar pattern with that of the euro area. This
similarity of results in the two monetary unions is surprising as the United States is an
integrated entity both economically and politically, it shares a common language and culture
and shows a high level of labour mobility and these socio-economic factors would be highly
expected to mitigate inflation differentials in the United States.
In contrast, the present countries in the Euro area are not so integrated in comparison
with the United States. Also, there is a single federal government in the US therefore; fiscal
policy remains the obligation of the national government and productivity levels and standard
of living are more divergent in the euro area countries than they are in the United States. With
this, it is expected that the inflation differentials in the euro area should be more pronounced
than the regional economies in the United States. Alternatively, it is plausible to argue that
euro area countries are more diversified economically than that of the United States and make
it less vulnerable to economic shocks and this should make euro area inflation differentials to
be more limited than that of the regional economy in the United States.
All in all, the US experience is an indication that differences in inflation rates in
different regions are normal even in a long established monetary union like the United States.
However looking at its persistence rate as established in the previous subsection, it is
common knowledge that the inflation differentials in the euro area is persistent and even more
so in comparison with that of the regional economies in the United States in the same time
3 Licheron (2008), ECB (1999, 2003)
4 ECB (1999) got the inflation of the US from the Bureau of Labour Statistics (BLS). They published a dataset of
annual observation on consumer price index in 17 US cities for the period 1919 – 1998.

7
frame. None of the Metropolitan Statistical Areas (MSA) demonstrated an inflation rate
systematically above or below the United States average, and relative positions often reversed
over the period 1999-2006. In other words, none of the MSA experienced the same situation
as Spain, Greece, Ireland or Portugal, with inflation differentials well above one percentage
point and persistent almost over the whole period Licheron (2008)5.
FIGURE 2 INFLATION DIFFERENCES IN THE EURO AREA AND THE UNITED
STATES
Note: The dispersion indicator is the un-weighted standard deviation of inflation rates (in percentage points)
Sources: Monthly data from EUROSTAT and the U.S. Bureau of Labor Statistics.
5 The four U.S. Census Regions are: Northeast (including the MSA of New York, Philadelphia, Boston and
Pittsburgh), Midwest (including Chicago, Detroit, St Louis and Cleveland), South (Washington, Dallas, Houston,
Atlanta and Miami) and West (Los Angeles, San Francisco and Seattle)

8
Figure 2 shows the un-weighted standard deviation for the inflation rates of the four
U.S. Census Regions, as well as the one calculated for 16 U.S. Metropolitan Statistical Areas
(MSA).Since the implementation of the single currency in January 1999, inflation dispersion
within the euro area has remained slightly higher than the one noticed within the Census
Regions, but perfectly in line with the one observed within the MSA. As Angeloni and
Ehrmann (2004) note, the division of the United States which is the most closely comparable
to the euro area national division seems to be somewhere between the Census Regions and the
MSA.
THEORETICAL ARGUMENT ON INFLATION DIFFERENTIALS IN A
MONETARY UNION
So far, we have established the presence of inflation differentials in both the euro area
and the regional economies of the United States. The former being a new phenomenon and
the latter can be said to have stood the test of time.
Licheron (2008) investigates some theoretical arguments that can explain inflation
differentials within a monetary union and relates it to the situation obtainable in the euro area
since the launch of the single currency.
In this section, we review the main theoretical remark opined by Licheron for the
causes of inflation differentials in the euro area.
Inflation differentials can be explained under two underlying factors; the convergence
factors and structural difference factors. The convergence factors consist of price level
convergence and income convergence while the structural differences encompass different
levels of inflexibilities in wages, different exposure to external economic shocks. These
differences can exacerbate a long lasting inflation differential that can be more disturbing for
the ECB and the member countries of the euro area.
ECB (2003) reasons that a big chunks of the persistent inflation differentials in the
euro area maybe a result of differences in the “wage-setting” mechanism (including in some
countries the automatic indexation of wages to prices) or in the price-setting mechanism
(including disparities in the frequency of price changes, which influences the degree of
inflation persistence).
In another paper, Andres et al (2003) to explain inflation differentials build a 2-
country model where each country produces differentiated goods traded in monopolistic
competitive markets. Price discrimination occurs due to differentiated demand conditions and
price adjustment costs: the key parameters in the model are the elasticity of demand and the

9
slope of the Phillips curve, both of which are country-specific. There is no inflation
persistence, only price-level stickiness. The model is adjusted to simulate the characteristics
of the larger and less open euro area countries.
The authors suggest that in their currency area inflation differences depend more on
the characteristics of local demand than on price dormancy.
Looking at these differentials from another economic angle, persistence inflation
differentials may also be the result of different degrees of exposure to exchange rates
movements or external shocks, which Licheron (2008) explained by two factors. First,
openness rates to extra-EMU6 trade remain very different across euro area member countries:
Ireland and the Netherlands are small economies that have large trade shares with countries
outside the EMU (extra-EMU imports amount to more than 30% of total GDP in those two
countries), whereas imports from non-EMU countries only stand for less than 12% of total
GDP in France, Italy and Portugal. That’s why the exposure to shifts in bilateral exchange
rates (especially the euro/dollar rate) varies widely between EMU countries. Second, even if
the bilateral exchange rates are the same for all EMU countries, nominal effective exchange
rates may differ due to different patterns of trade. This implies that, even for two countries
that display the same extra-EMU openness rate, differences in the geographical or industrial
composition of imports can generate differences in the aggregate import price dynamics, and
consequently on national inflation rates.
To conclude this section, another reason to note for the persistent inflation differentials
in the euro area is that oil dependency, i.e. the share of oil imports in the national GDP, varies
greatly across euro area countries (from about 2.5% in Greece and Portugal to less than 1.5%
in France and Germany). Consequently, shifts in the oil price may have asymmetric effects on
the evolution of national prices. Égert et al. (2004) emphasize that the lasting increase in the
crude oil price may partly explain the persistence of inflation differentials in the EMU, since
the most inflationary countries are simultaneously those which depend the most on external
energy supply and have the more energy-intensive productions.
6 Extra-EMU trade are international trade between one EMU member country and the rest of the world outside
the EMU

10
III. REVIEW OF PAST EMPIRICAL WORKS TO EXPLAIN INFLATION
DIFFERENTIALS IN THE EURO AREA
In this section, we review some past empirical works (mostly econometrics) done by
researchers and erudite economists to explain the underlying reason for the differences in
national inflation rates among the member countries of the euro area.
We will start with the resounding work of Licheron (2008). To explain the inflation
differentials in the euro area in the period 1999-2006, he constructs a dynamic panel data
model and estimates the model using the “System Generalized Methods of Moments”
(GMM). He found that euro area inflation differentials are mainly propelled by two factors:
Firstly, they are somewhat the results of differences in the exposure to nominal effective
exchange rates deviations, as well as differences in the exposure to oil price shocks.
Secondly, inflation differentials are also the reflection of remaining differences in cyclical
positions (output gap) combined with a rather high degree of inflation persistence. To explain
these two factors further, he opined that the inflationary effects of a positive output gap are in
fact much stronger than the disinflationary impact of a negative output gap. In the same way,
exchange rate depreciations and oil price increases seem to have a much stronger effect on
inflation differentials than exchange rates appreciations and oil price decreases do on inflation
differentials in the euro area.
Angeloni and Ehrmann (2004) in an ECB working paper series build a stylised 12-
country empirical panel model using quarterly data from 1998-2003 with each country
consisting of two equations; aggregate demand and aggregate supply.
Results show that inflation persistence plays a central role in amplifying and perpetuating
inflation and other cyclical differentials of the member countries in the euro area. They also
found that differences in national inflation rate in the euro area maybe as a result of some
similar features they all have in common which is notably persistence in national inflation
rates.
Alberola (2000) provides the first post EMU data analysis on cross country inflation
differentials in the euro area. The paper delves into the Balassa-Samuelson model and tries to
find a correlation of the model into inflation differentials in the euro area through empirical
analysis.
The study uses co-integration analysis of data on relative prices, relative productivities
and relative wages in eight of the initial eleven countries that met the euro area convergence
criteria in January, 1999.

11
The traditional Balassa-Samuelson hypothesis establishes a negative relationship
between sectorial inflation differentials and relative productivities. In a simulation study of
the model to what is obtainable in the euro area; the standard BS hypothesis is accepted only
in Germany, Spain, and Belgium out of the eight countries in which data are available.
Inflation differential is a result of productivity differentials between tradable and non-
tradable sectors. They found that the difference between the high inflation countries and low
inflation countries may attain around 2 percent in annual terms.
However, because inflation in traded goods is a common characteristics found in all
countries, these differentials indicates differences in non-traded goods inflation rate in the
eight euro area countries studied.
Sinn and Reutter (2001) in a study similar to Alberola (2000) based on empirical
estimates of the BS model found that some countries display very large differences in
productivity growth between the two sectors while some other countries do not. The authors
concluded that these differences are likely to result in a divergence of the inflation rates of up
to 2.7 percentage points in the euro area.7
Honohan and Lane (2003) estimated a multivariate panel using annual 1999-2001 data
where the spreads of national inflation rates from the area average are regressed on proxies of
the catch-up effect and on three macroeconomic variables: nominal exchange rate changes;
the fiscal balance, and the output gap. The conclusion is that "much of [inflation divergence]
is attributable to the differential impact on different member states of the weakness of the
euro or international currency markets in the early months of the union.
IV. NATIONAL INFLATION RATES ASYMMETRY: MONETARY POLICY
PERSPECTIVE
To measure the asymmetric effects of monetary policy on national inflation rates, Sinn
and Reutter (2001) argued that the previous inflation target of the Bundesbank should not be
adopted by the European Central Bank because Europe’s diversity in national productivity
growth rates implies substantial relative price changes among the different countries.
They said to tolerate for these changes without causing deflation in any country, the
common monetary has to be looser than the previous German one. They found that the ECB
has to allow roughly one additional percentage point of inflation in the aggregate beyond what
had been considered appropriate for Germany alone. The Bundesbank traditionally had aimed
7 The concluding part of their findings will be discussed in the next section.

12
at an inflation rate of 1.5% to accommodate for Germany’s internal structural change. If this
target remains valid for Germany within the European currency union, the euro-11 countries
need an aggregate inflation target of about 2.5% or more.
Sinn et al (2001) postulate that this has significant implications for some of the fast
growing economies like Spain, Ireland or Finland if these countries inflation rates lie far
outside the range which the Bundesbank would have tolerated in Germany, there is no reason
to complain. Rates of 3%, 3.9% and 4.2% respectively would be natural implications of the
Balassa-Samuelson effects indicating natural changes in relative prices rather than a
dangerous weakening of the euro.
The conclusion they made from the paper was that the ECB should tolerate
substantially higher inflation rate in the euro area than the one Bundesbank is used to in
Germany.
In a 2005 public speech by a member of the executive board of the ECB, Jose Manuel
on whether the strategy of the ECB has been successful in conducting monetary policy in euro
area and in coping with the challenge posed by the differentials in inflation observed among
euro area countries, he was affirmative and said “The ECB’s clear and unambiguous
quantitative definition of price stability, its high degree of credibility and its strong focus on
the attainment of its primary objective have allowed inflation expectations in the euro area to
be maintained in line with its definition of price stability. This has resulted in low interest
rates and extremely favorable financing conditions to the benefit of all euro area economies”.
V. CONCLUSION
In this paper, we found different factors that explain inflation differentials in the euro
area. Theoretical literature explains the convergence and the structural difference factors
while empirical findings conclude on differences in cyclical positions and inflation
persistence among other empirical investigation stated in the paper.
Inflation and growth differences among euro area countries are likely to remain
prominent in European political debates for a long time. In the euro area, regional economic
divergences are more likely to occur than in other currency area, a phenomenon that can only
increase once the area is enlarged to new entrants.
What remains open however is if these differentials are beneficial or pose as a
constraint to the monetary union?

13
VI. REFERENCES
Alberola, E. (2000). Interpreting inflation differentials in the euro area. Banco de España
Economic Bulletin, pp.61-70.
Alberola-Ila, E. and Tyrväinen, T. (1998). Is there scope for inflation differentials in EMU?.
An empirical evaluation of the Balassa-Samuelson model in EMU countries.
Andres, J., Ortega, E., Valles, J. and de España, B. (2003). Market structure and inflation
differentials in the European Monetary Union.
Angeloni, I. and Ehrmann, M. (2004). Euro area inflation differentials. European Central
Bank, Working Paper 388, September.
Balassa, B. (1964). The purchasing-power parity doctrine: a reappraisal. The Journal of
Political Economy, pp.584--596.
Egert, B., Ritzberger-Gruenwald, D. and Silgoner, M. (2004). Inflation differentials in
Europe: past experience and future prospects. Monetary Policy & The Economy, (1),
pp.47--72.
European Central Bank, (1999). Inflation differentials in a monetary union. Frankfurt:
Monthly Bulletin (October), pp.35-44.
European Central Bank, (2002). Price level convergence and competition in the euro area.
Frankfurt: Monthly Bulletin, August, pp.39-49.
European Central Bank, (2003). Inflation differentials in the euro area: Potential causes and
policy implications. Frankfurt.
European Central Bank, (2005). Monetary policy and inflation differentials in a
heterogeneous currency area. Frankfurt: Monthly Bulletin, May, pp.61-77.
González-Páramo, J. (2014). ECB: Inflation differentials in the euro area. [online]
Ecb.europa.eu. Available at:
http://www.ecb.europa.eu/press/key/date/2005/html/sp050523.en.html [Accessed 25 Jun.
2014].

14
Hofmann, B. and Remsperger, H. (2005). Inflation differentials among the euro area
countries: potential causes and consequences. Journal of Asian Economics, 16(3),
pp.403--419.
Honohan, P. and Lane, P. (2003). Divergent inflation rates in EMU. Economic Policy, 18(37),
pp.357--394.
Licheron, J. (2008). Explaining inflation differentials in the euro area. Economie
internationale, (4), pp.73--97.
Samuelson, P. (1964). Theoretical notes on trade problems. The Review of Economics and
Statistics, pp.145--154.
Sinn, H. and Reutter, M. (2001). The minimum inflation rate for Euroland.
Treaty on European Union, (1992). Maastricht Treaty.

15
VII. DECLARATION
I hereby confirm that my work does not violate core principles of scientific integrity; in
particular I have refrained from cheating, fabrication, and plagiarism. I understand
that violating these principles implies that I will fail this course.
Copyright © 2022 FDOKUMEN