Indicator Review Project - Phase II Final Report
27
2012 Provincial-Municipal Indicator Committee 12/2012 Indicator Review Project - Phase II Final Report
-
Upload
khangminh22 -
Category
Documents
-
view
0 -
download
0
Transcript of Indicator Review Project - Phase II Final Report
2012
Provincial-Municipal
Indicator Committee
12/2012
Indicator Review Project - Phase II Final Report

i
Executive Summary
The Municipal Indicators are a set of financial, community, governance and performance indicators designed so that municipal staff, councils and the public can better understand their local governments. A joint committee was established in 2010 to review the program and recommend changes. The Committee consists of representatives from the Union of Nova Scotia Municipalities, the Association of Municipal Administrators of Nova Scotia, the Dalhousie College of Continuing Education and Service Nova Scotia and Municipal Relations. This report outlines the work completed in phase II of the review for the funding partners. The intention is to outline the work accomplished to date, seek approval for the changes recommended, and identify future priorities for the Municipal Indicator Program. The key project during this phase of the review was the development, consultation and review of the Financial Condition Index, a tool providing a “snapshot” view of a municipality’s financial condition. The Committee also completed the preliminary research to develop a tool for assessing municipal governance, and considered improvements to the service performance indicators and the website which hosts the program. Finally, the Committee considered the success of the FCI consultation and plans to develop additional training and outreach sessions to increase use and understanding of the program.
Summary of Recommendations
The UNSM and AMA boards endorse the finalized model of the index to SNSMR. SNSMR implement the finalized municipal profile & Financial Condition Index as
additional layers to the municipal indicators. The partners commit to review the FCI in 5 years to ensure relevance of current
indicators & thresholds. The Committee develop a governance indicator tool. SNSMR coordinate with other departments to reduce reporting duplication. The Committee continue to work on improving service performance indicators. The Committee work with SNSMR to improve the website. SNSMR continue to provide resources to the program to ensure its relevance and
usefulness. AMANS, UNSM, Dalhousie, and SNSMR work together to develop, fund and promote
training opportunities to support the municipal indicator program.
ii
Table of Contents
EXECUTIVE SUMMARY .............................................................................................................................................................. I
SUMMARY OF RECOMMENDATIONS ................................................................................................................................................................ I
1 - INTRODUCTION .................................................................................................................................................................... 1
COMMITTEE MEMBERSHIP ............................................................................................................................................................................ 2 ACKNOWLEDGEMENTS ................................................................................................................................................................................... 2
2 - FINANCIAL CONDITION INDEX........................................................................................................................................ 3
DESIGN PROCESS ............................................................................................................................................................................................. 3 CONSULTATION PROCESS ............................................................................................................................................................................... 4 FINALIZED MODEL PROPOSAL ...................................................................................................................................................................... 4
3 - GOVERNANCE INDICATORS ............................................................................................................................................. 7
4 - SERVICE PERFORMANCE INDICATORS ........................................................................................................................ 8
5 - INDICATORS WEBSITE ....................................................................................................................................................... 9
6 - OUTREACH & TRAINING................................................................................................................................................. 10
7 - CONCLUSIONS .................................................................................................................................................................... 11
APPENDIX 1: PHASE II TERMS OF REFERENCE ............................................................................................................ 12
APPENDIX 2: WORKING MODEL OF THE FINANCIAL CONDITION INDEX........................................................... 15
APPENDIX 3: FCI WORKSHOP ATTENDANCE & FEEDBACK SUMMARY .............................................................. 22
1
1 - Introduction The Municipal Indicators are a set of financial, community, governance and performance indicators designed so that municipal staff, councils and the public can better understand their local governments. The Indicators were launched on the Service Nova Scotia and Municipal Relations (SNSMR) website in 2002, with over 40 different indicators for each municipality dating from 2000. The program is intended to provide valuable comparative information to support governance, management & policy development in municipal governments. Since its inception, the program has undergone a series of reviews to assess the scope, effectiveness and reliability of the indicators. The reviews were conducted by SNSMR staff, indicator users, and by a graduate student commissioned by the Association of Municipal Administrators (AMANS). The most recent review began in 2010 and was led by a joint Committee of Union of Nova Scotia Municipalities (UNSM), AMANS, Dalhousie College of Continuing Education and SNSMR representatives. Each of the reviews included suggestions to improve the indicators, better educate program users and encourage timelier reporting. The 2010 review Committee was provided with a set of objectives, which included establishing a vision for the municipal indicators program. Highlights from the phase I work include a proposed reorganization of the municipal indicators, a synopsis of the results of previous reviews, and the piloting of a workshop to solicit detailed feedback from indicator users. The current Committee (Phase II of the 2010 review) was tasked with developing an implementation report for the 2010 review (See Appendix 1 for the terms of Reference for Phase II of the Committee’s work). The research and deliberations of the Committee fell into five distinct areas. The Financial Condition Index is a tool developed to provide a “snapshot” view of a municipality’s financial condition. The Committee undertook a thorough design, consultation and review process to finalize the proposed model described in section 2. The Committee, with the assistance of the Municipal Finance Corporation also undertook some preliminary research to develop a tool for enhancing the measurement of governance indicators in the program. A summary of the research is provided in Section 3. Building on the pilot workshop conducted in Phase I, Section 4 describes the Committee’s review and analysis of the input provided by municipal staff on the service performance indicators. Section 5 describes a suggested approach for improving the municipal indicators website. Finally, Section 6 provides a short proposal for developing training and outreach sessions to increase the use and understanding of the indicators.

2
Committee Membership
Rennie Bugley, President of the Association of Municipal Administrators, and CAO of the Municipality of the County of Cumberland served as the Phase II Committee Chair. Several members of the original committee also committed to remaining on the Committee through phase II. The list of current Committee members is provided in the Table 1 below.
Table 1. Municipal Indicator Committee Members Organization Representative UNSM Clarence Prince, Deputy Mayor, CBRM
AMANS Rennie Bugley, CAO, Cumberland County
Kim Durling, Director of Finance, Kings County Jeff Gushue, CAO, Town of Yarmouth
SNSMR Tara Manual, Manager, Municipal Finance Paul Wills, Municipal Advisor Alex Dumaresq, Senior Policy Analyst
Dalhousie Continuing Education
Professor Jack Novack
Acknowledgements
The Committee would like to thank the many individuals and organizations who supported the work completed in the past 2 years. Several Committee members not listed above also volunteered their time as Committee members: Greg Herret, CAO (co-chair of Phase I), Town of Amherst; Amery Boyer, CAO, Town of Annapolis Royal; and Emily Lutz, Municipal Intern, Municipality of the County of Cumberland. The Municipalities of the County of Kings and the Town of New Glasgow were instrumental in hosting the first workshops to review the Financial Condition Index. The Committee would like to thank Kelly Sloan, Kim Durling and Sophie Ke in particular for their assistance. The Committee would also like to thank Dr. Mark Gilbert and the Dalhousie School of Public Administration for guidance during the research and development of the prototype of the financial condition index. Finally, the Committee would like to thank Kristen Stallard & the Municipal finance Corporation for their assistance researching and developing the framework for the proposed governance indicators tool.
3
2 - Financial Condition Index
The Financial Condition Index (FCI) is a tool designed to increase understanding of municipal financial condition. It is targeted at senior municipal staff, council and the public and is designed to provide a “snapshot” view of a municipality’s financial condition. The FCI can help identify if there are patterns in results on financial indicators, and to provide points of comparison for municipalities interested in assessing and improving financial health. The FCI was designed to help identify challenging financial situations. A recommended minimum or maximum threshold was selected for each indicator to serve as a warning sign. Thresholds are set with consideration for the normal operating range for Nova Scotia municipalities, so on most indicators, average or just below average values will meet the recommended minimum or maximum threshold. Negative results on a single indicator should not be cause for alarm, however, multiple negative results indicate further review may be required. Because of this design, the FCI is well suited for identifying areas of concern, but should not be used to pick the “best” municipality. The FCI is not intended to be a substitute for a comprehensive examination of a municipality’s financial information. The index is only intended to provide a quick snapshot of financial condition, and should not be seen as an all-encompassing evaluation of municipal performance. The results of the FCI are presented in a dashboard which summarizes each municipality’s results. Trends over time and provincial average information provide comparison points for indicator scores. By combining a range of information in a single document, users can quickly see where their municipality is doing well and where they may want to focus efforts for investigation or improvement. In addition, a notes section provides context to the scores, identifying unique circumstances and highlighting trends over time.
Design Process
Prior to the design phase of the project a literature review was completed examining academic and practitioner models for assessing financial condition. Some of the key sources reviewed included: CICA literature on government finance, PSAB financial indicators, methodologies of credit rating agencies, Academic literature on municipal finance and performance measurement, financial models developed in other jurisdictions, and key indicators used in sustainability and financial assessments in other provinces, states, and countries. Information from municipal financial statements, provincial databases, Property Valuation Services Corporation assessment data, and Statistics Canada Census information was used to calculate scores for twenty indicators grouped into four index dimensions, which
4
contribute to an overall score. The indicators and thresholds included in the working model are described in Appendix 2.
Consultation Process
Presentations were made to all regional AMA meetings (with the exception of Cumberland Region, which did not hold a regional meeting during the review period). The purpose of these presentations was to introduce the concept, record suggestions, and encourage AMA members to attend the workshops. Between May and October of 2012, four workshops were held across the province for chief administrative officers and senior finance staff. Sixty-two people attended the workshops representing 43 municipalities. The Committee is extremely proud to have attracted the interest and suggestions of over 80% of all municipalities in the province during the consultation phase. Based on the input received through the evaluation forms used at the workshops, the sessions were an effective consultation tool. 52 (84%) of all participants completed an evaluation form, and 98% of them reported finding the session useful. Over 90% of the respondents also indicated that the workshop improved their understanding of the municipal indicator program, and they are more likely to use the indicators after attending a session. Feedback on the financial condition index was also very positive. Almost 80% of respondents indicated that the FCI would be of benefit to their municipality. Furthermore, approximately three quarters of the respondents indicated they would use the FCI to explain financial information to their council. The Committee interprets this information as a strong endorsement of the tool from senior municipal staff in Nova Scotia. For more detailed information on workshop attendance & feedback see appendix 3.
Finalized Model Proposal
After reviewing the comments provided through the consultation process, the Committee engaged in a series of discussions on what changes were required to improve the working model. Based on feedback received from the workshops the Committee agreed: Municipal Profile Page: Building on the concept of the financial dashboard, a municipal profile should be created for each municipality on the indicators webpage, containing information that should be used to interpret all municipal indicators. The page should include: information on the size of the unit, its revenue sources, and areas of expenditure, and a socio-economic profile, including population trends and demographic information.
5
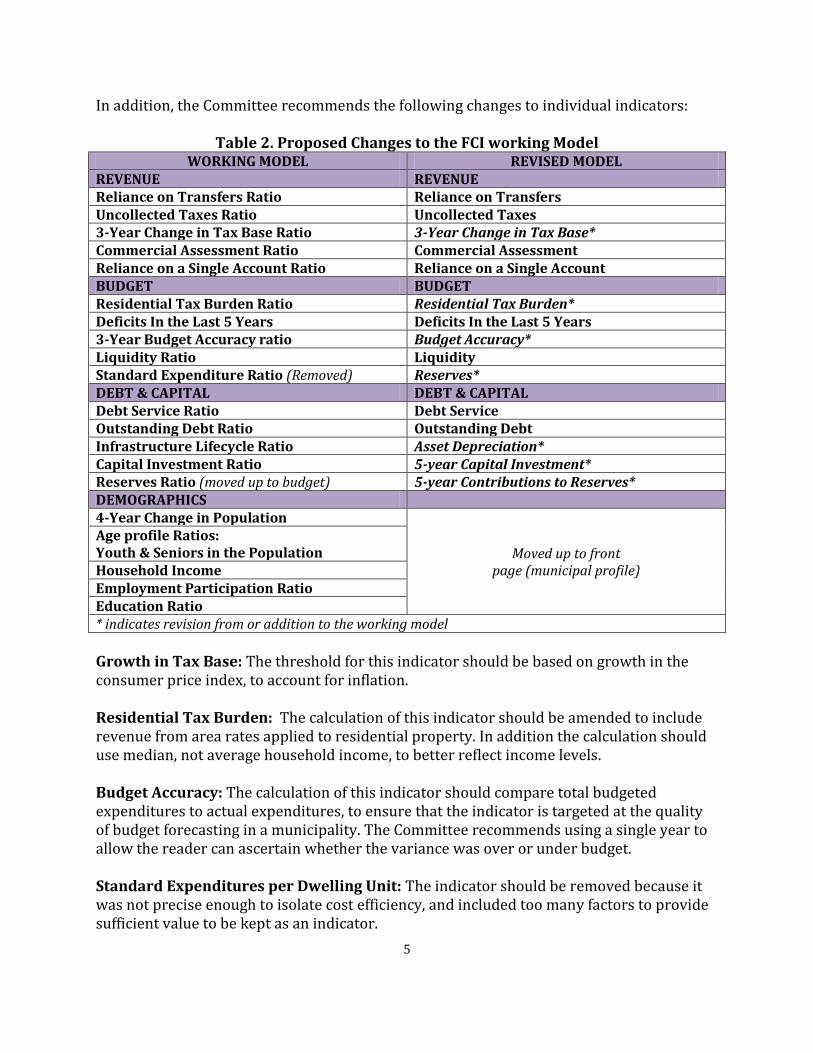
In addition, the Committee recommends the following changes to individual indicators:
Table 2. Proposed Changes to the FCI working Model WORKING MODEL REVISED MODEL
REVENUE REVENUE Reliance on Transfers Ratio Reliance on Transfers Uncollected Taxes Ratio Uncollected Taxes 3-Year Change in Tax Base Ratio 3-Year Change in Tax Base* Commercial Assessment Ratio Commercial Assessment Reliance on a Single Account Ratio Reliance on a Single Account BUDGET BUDGET Residential Tax Burden Ratio Residential Tax Burden* Deficits In the Last 5 Years Deficits In the Last 5 Years 3-Year Budget Accuracy ratio Budget Accuracy* Liquidity Ratio Liquidity Standard Expenditure Ratio (Removed) Reserves* DEBT & CAPITAL DEBT & CAPITAL Debt Service Ratio Debt Service Outstanding Debt Ratio Outstanding Debt Infrastructure Lifecycle Ratio Asset Depreciation* Capital Investment Ratio 5-year Capital Investment* Reserves Ratio (moved up to budget) 5-year Contributions to Reserves* DEMOGRAPHICS 4-Year Change in Population
Moved up to front page (municipal profile)
Age profile Ratios: Youth & Seniors in the Population Household Income Employment Participation Ratio Education Ratio * indicates revision from or addition to the working model
Growth in Tax Base: The threshold for this indicator should be based on growth in the consumer price index, to account for inflation. Residential Tax Burden: The calculation of this indicator should be amended to include revenue from area rates applied to residential property. In addition the calculation should use median, not average household income, to better reflect income levels. Budget Accuracy: The calculation of this indicator should compare total budgeted expenditures to actual expenditures, to ensure that the indicator is targeted at the quality of budget forecasting in a municipality. The Committee recommends using a single year to allow the reader can ascertain whether the variance was over or under budget. Standard Expenditures per Dwelling Unit: The indicator should be removed because it was not precise enough to isolate cost efficiency, and included too many factors to provide sufficient value to be kept as an indicator.
6
Reserves: the indicator should be calculated using only operating reserves to distinguish between capital and operating reserves. Infrastructure lifecycle: Change the name of the indicator to Depreciation of Assets to Improve the clarity of this indicator. Switch to non-consolidated data for consistency with other indicators. Capital Investment: Change the calculation of this indicator to a 5-year span to smooth out large investments in major assets1. Five years was chosen because it is the time span used in municipal capital investment plans. Switch the data used to non-consolidated for consistency with other indicators. Contributions to reserves: An additional indicator was required to complement the capital investment indicator because municipalities may be setting money in reserves for a major capital project. To address this, the Committee recommends including an indicator dividing total contributions to reserves over the previous 5 years divided by total depreciation over the same 5 years. 4-year Change in Population: Switch to a 5-year period and use Census data in place of the annual estimates calculated between census periods. Age Profile: Include more age groups to complement existing data. Recommendations:
The UNSM and AMA boards endorse the finalized model of the index to SNSMR. SNSMR implement the finalized municipal profile & financial condition index as
additional layers to the municipal indicators. The partners commit to review the model in 5 years. New indicators may be
developed and changing trends and pressures may affect the relevance and importance of thresholds. Therefore the model should be periodically reviewed to ensure its relevance.
The Committee continue discussion with FRAM, public works mangers and other relevant parties to develop further capital indicators, including the possibility of assessing condition of assets, and compliance with environmental regulation.
SNSMR Add new indicator for effect of 1 cent tax increase to the general indicators and that the calculation include provincial properties for which a grant in lieu of taxes is paid.
The Committee pursue further research to determine the feasibility of developing a tax burden indicator for commercial property owners, similar to the existing indicator for residential property.
1 Due to limited data availability, the committee recommends using 3 years of data until the full 5 year is
available.
7
3 - Governance Indicators
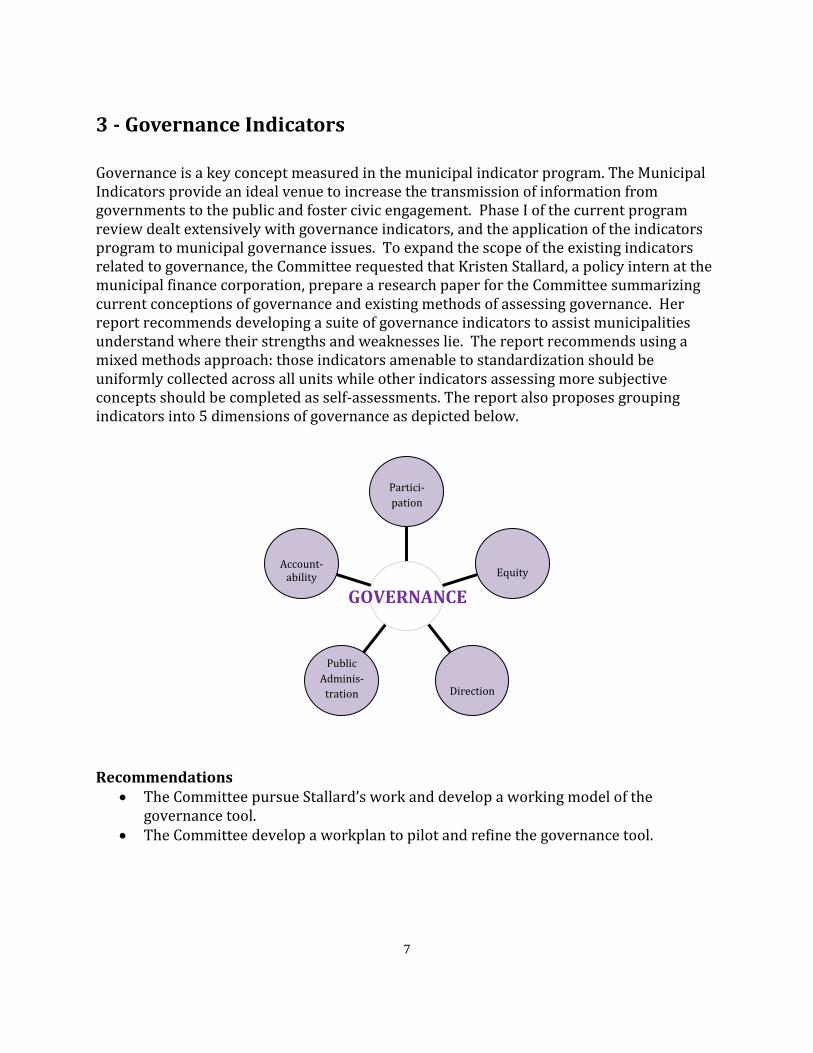
Governance is a key concept measured in the municipal indicator program. The Municipal Indicators provide an ideal venue to increase the transmission of information from governments to the public and foster civic engagement. Phase I of the current program review dealt extensively with governance indicators, and the application of the indicators program to municipal governance issues. To expand the scope of the existing indicators related to governance, the Committee requested that Kristen Stallard, a policy intern at the municipal finance corporation, prepare a research paper for the Committee summarizing current conceptions of governance and existing methods of assessing governance. Her report recommends developing a suite of governance indicators to assist municipalities understand where their strengths and weaknesses lie. The report recommends using a mixed methods approach: those indicators amenable to standardization should be uniformly collected across all units while other indicators assessing more subjective concepts should be completed as self-assessments. The report also proposes grouping indicators into 5 dimensions of governance as depicted below.
Recommendations
The Committee pursue Stallard’s work and develop a working model of the governance tool.
The Committee develop a workplan to pilot and refine the governance tool.
Account-
ability
Public
Adminis-
tration
Direction
Equity
Partici-
pation
GOVERNANCE

8
4 - Service performance Indicators
Information on the cost, level and quality of service provided is essential information in any performance measurement program. Unfortunately, non-financial information for the municipal indicator program has proven harder to produce, and the current data collection arrangements through the Financial Information Return are cumbersome, time-consuming, and increase the possibility of inaccuracies. Standardized, province-wide statistics on some service outcomes is already reported to other provincial departments. SNSMR must work more closely with its counterparts to reduce reporting requirements and improve the quality of its service performance indicators. To expand the indicator program beyond existing measures collected by other departments, a critical review of service areas and indicators to determine which are most valuable and which are most in need of improvement. Recommendations
SNSMR coordinate with other departments to reduce duplication between schedule W of the FIR and other provincial reporting requirements.
The Committee prepare a workplan for improving service performance indicators that prioritizes service areas for measurement. The workplan should also involve consultation with service area experts on types of indicators needed and data collection methods.
9
5 - Indicators Website
Recurring comments from previous reviews identified issues with the web interface of the indicators. SNSMR recently completed an update of their website and instituted a streamlined process for revisions to the site. The timing of these changes is well suited to handle the changes to the municipal indicators proposed in this report. SNSMR should take advantage of the momentum built through the workshops by promptly updating their website to ensure municipalities see it as a timely and valuable source of information. Recommendations
The Committee should continue to work with SNSMR to improve the website as follows: Timely posting of updated municipal indicators, profiles and FCI dashboards. New and expanded definitions for indicators including greater descriptions,
uses and rationale for calculation and thresholds where applicable. Reorganized indicators based on the pillars identified in phase I and
incorporating the new tools developed by the Committee. A link to the new municipal profiles on the Municipal services home page map. A resource library related to specific indicators and dimensions to assist
municipalities improve indicator results.
The AMA should request that its members provide a link on their municipal websites to the municipal indicator program website.

10
6 - Outreach & Training
One of the key objectives given to the Committee by the partners was to educate municipal officials on the importance and usefulness of the indicators. Through the FCI consultation the Committee did undertake four workshops, and a secondary objective of those workshops was to increase awareness, understanding and use of the indicators. The evaluations forms completed at the sessions suggest that the workshops were an effective vehicle to increase understanding and use of the indicators. Further work is necessary. The workshops held to date have been targeted at municipal finance officials and senior managers, many of whom already know of and are users of the municipal indicators. These workshops were also designed with the primary goal of soliciting expert advice on the improvement of the indicators, not increasing awareness and educating less familiar users. In addition to providing training to municipal staff, the partners should commit to developing regularly available training sessions for municipal staff, councillors and the public on what the indicators are, how they are accessed, and what they can tell the user. Recommendation:
The Committee work with the AMA Education Committee and other relevant partners to develop Municipal Indicator Program training modules.
Dalhousie College of Continuing Education include information on the Municipal Indicator Program in its local government certificate programs.
AMANS, UNSM, Dalhousie, and SNSMR work together to fund and promote training opportunities to support the municipal indicator program.
11
7 - Conclusions
The Committee is pleased to report many accomplishments during phase II of this project. The Committee feels that the Financial Condition Index is now ready to be added to the municipal indicator program, and a series of changes to the website can be made to improve its usefulness. The Committee also believes that solid foundations have been laid for further expansion and improvement of the program, especially in the area of governance indicators, service performance indicators and a training and outreach program. Unfortunately, the committee was unable to make progress towards the inclusion of green indicators in the program. It is anticipated that upon completion of the new Climate Change Action Plans the committee will be better positioned to develop green indicators for the municipal sector. The Committee is thankful for the support of the partners, and is hopeful that they will continue to support the program. We recognize that the progress made during this review would not have been achieved without the dedication of SNSMR staff time and resources. The Committee strongly urges SNSMR to continue to assign resources to the program to ensure that the indicators remain current and the changes recommended in this report are implemented.
Summary of Recommendations
The UNSM and AMA boards endorse the finalized model of the index to SNSMR. SNSMR implement the finalized municipal profile & financial condition index as
additional layers to the municipal indicators. The partners commit to review the FCI in 5 years to ensure relevance of current
indicators & thresholds. The Committee develop a governance indicator tool. SNSMR coordinate with other departments to reduce reporting duplication. The Committee continue to work on improving service performance indicators. The Committee work with SNSMR to improve the website. SNSMR continue to provide resources to the program to ensure its relevance and
usefulness. AMANS, UNSM, Dalhousie, and SNSMR work together to develop, fund and promote
training opportunities to support the municipal indicator program.
12
Appendix 1: Phase II Terms of Reference
BACKGROUND:
The Municipal Indicators are a set of financial, community, governance and performance
indicators to be used to better understand the challenges facing Municipal Units in Nova Scotia.
In the past, there have been multiple reviews conducted for the Municipal Indicators Program.
Each of these reviews has provided suggestions for improvements to the program, in hopes to
enhance the usability and dependability of the municipal indicators.
The initial Municipal Indicators Report was presented in August, 2002. A review of the
Municipal Indicators followed in July 2007 prepared by internal staff and users. Another review
was conducted by Ryan Piccott, MPA candidate for the AMA, and was finalized in May 2009.
Most recently, a joint Committee (AMA and SNSMR) prepared a report presented in June 2010.
All the reports provide recommendations for changes to the data to improve the indicators as
well as other items to better educate Municipal users and encourage more timely reporting. The
recommendations in the latest June 2010 report included SNSMR to provide a dedicated
resource to the project to move forward with implementation of other recommendations.
In October 2010, a letter was received advising that a dedicated resource could not be provided
at this time; however, SNSMR would continue to partner with the AMA to implement project
recommendations.
The Town of Amherst and Municipality of Cumberland County have since agreed to dedicate
resources to move the project forward.
COMMITTEE PURPOSE:
The Municipal Indicators Committee will be responsible for:
Discuss and recommend changes
Ensuring the vision of the indicators is maintained
Develop an implementation plan – i.e. for updating the indicators, educating Municipal
Users and/or Council, etc…
Identifying ways to improve data collection
Explore the possibility of Green indicators
The Committee will ensure that both the municipal and provincial points of view are represented
in the intended improvements to the municipal indicators program.

13
The Committee will document the vision of the Municipal Indicators vision, the pillars, to ensure
the goals of the indicators for the future is not lost.
A work plan will be created to provide an outline and timelines for completion.
Accepted changes will be implemented by SNSMR staff upon approval of the AMA Board and
SNSMR.
OBJECTIVES:
Establish agreed upon vision for the municipal indicators program
Establish an agreed upon work plan for changes to the indicators data
Accept/Reject any proposed changes
Prepare a report for SNSMR and AMA Board
Ensure approved changes are implemented
DELIVERABLES
Proposed Recommended changes to the indicators and Implementation report for
SNSMR and AMA review
MEMBERSHIP
The Committee will be composed of representatives from AMA (2), a UNSM board member (1),
SNSMR (3), and someone from the academic community (1). A representative from AMA will
serve as the Chair of the Committee.
MEETINGS
Meetings will be held at a frequency that is needed to conduct the business of the Committee. It
is estimated that the Committee will meet every 4 weeks
The Committee will present its work to date at the 2011 spring AMA workshop.
Any items of disagreement will be resolved at the Committee level.
KEY STAKEHOLDERS
AMA
UNSM
Municipal Units of Nova Scotia
The Province of Nova Scotia
The general public
College of Continuing Education of Dalhousie University
14
SUCCESS FACTORS
The Committee will be successful if there is a final implementation plan or similar deliverable
produced by the Committee that clearly outlines: (1) where improvements can be made to the
existing Municipal Indicators Program; (2) how relevant information will be collected and
managed at the municipal level, and (3) the assignment of municipal roles and responsibilities
regarding data/information collection.
The objective of the Committee’s final deliverable is to enable municipalities to make
improvements to their current system of recording and measuring progress, through the use of
indicators, with the aim of understanding and improving:
Financial management, performance and efficiency
Progress towards achieving sustainability goals, as outlined in ICSP documents
General efficiencies in the area of municipal operations
Strategic decision making based on broad based community indicators identifying
demographics, opportunities and challenges external to the corporate municipal unit
In addition:
To increase the understanding and application of the concepts of performance
measurement at the local government level, and help explain how they contribute to
stronger accountability and improved delivery of services.
To provide a forum for sharing information and best practices on the use of performance
measurement as a tool to enhance local government service efficiency and effectiveness.
To demonstrate the evolving and beneficial application of performance measurement
through the use of indicators from a broad range of settings.
RISKS
Achieving buy-in from staff who will be asked to perform regular operational
requirements and complete work for the indicators project. There may be push back
depending on staff perspectives of the value of indicators and depending on their current
work load.
Staff involved in program evaluation or performance management initiatives may feel
that their work is being criticized or unnecessarily judged. Thoughtful presentation of the
value, purpose and uses of the data collection and analysis is required to ensure staff
understand the importance of, and do not feel threatened by, the initiative
Ensuring that the accurate data can be collected for the current and any new indicators.
This is key to the value indicators will have for Municipalities.
Maintaining the workplan timeline. It may be difficult to maintain the work plan timeline
as other priorities may easily justify pushing aside indicator project work.
Achieving buy-in from Municipalities. With upcoming pressures for government to get
back to a balanced budget, Municipalities may not be able/willing to participate or see the
value in Municipal Indicators until more prosperous times emerge.
Having all stakeholders agree on what are meaningful indicators may also be a challenge.
15
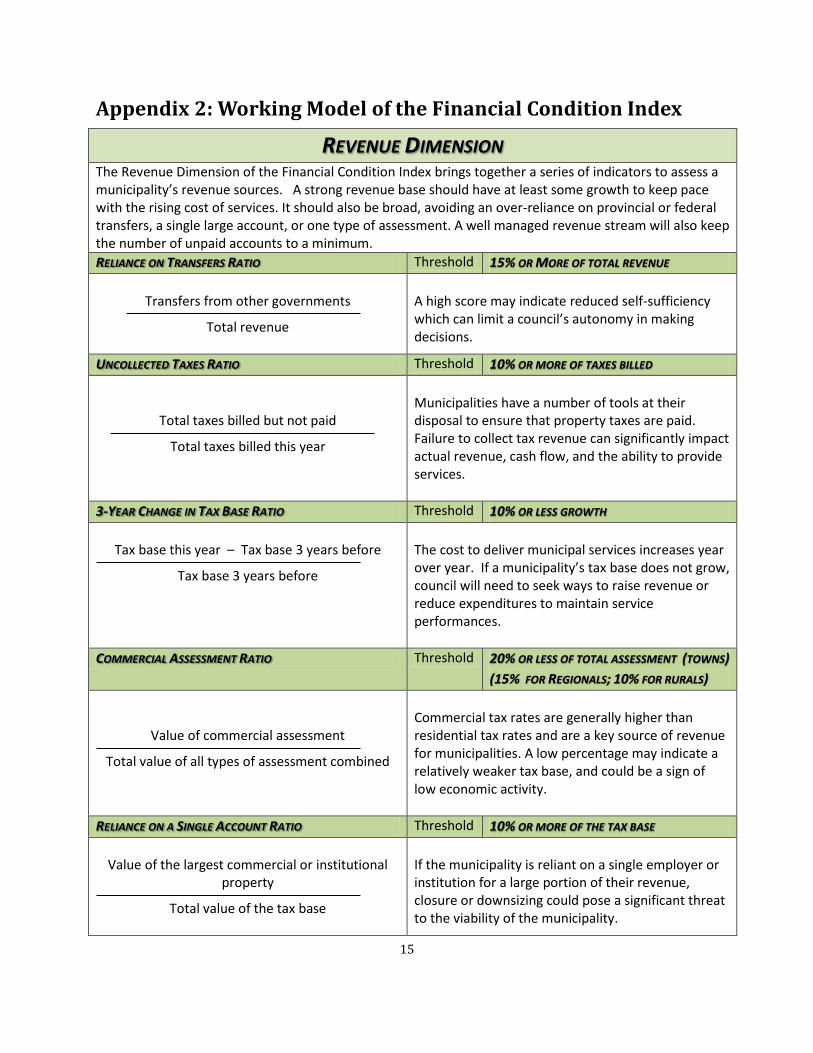
Appendix 2: Working Model of the Financial Condition Index
REVENUE DIMENSION The Revenue Dimension of the Financial Condition Index brings together a series of indicators to assess a municipality’s revenue sources. A strong revenue base should have at least some growth to keep pace with the rising cost of services. It should also be broad, avoiding an over-reliance on provincial or federal transfers, a single large account, or one type of assessment. A well managed revenue stream will also keep the number of unpaid accounts to a minimum.
RELIANCE ON TRANSFERS RATIO Threshold 15% OR MORE OF TOTAL REVENUE
Transfers from other governments
Total revenue
A high score may indicate reduced self-sufficiency which can limit a council’s autonomy in making decisions.
UNCOLLECTED TAXES RATIO Threshold 10% OR MORE OF TAXES BILLED
Total taxes billed but not paid
Total taxes billed this year
Municipalities have a number of tools at their disposal to ensure that property taxes are paid. Failure to collect tax revenue can significantly impact actual revenue, cash flow, and the ability to provide services.
3-YEAR CHANGE IN TAX BASE RATIO Threshold 10% OR LESS GROWTH
Tax base this year – Tax base 3 years before
Tax base 3 years before
The cost to deliver municipal services increases year over year. If a municipality’s tax base does not grow, council will need to seek ways to raise revenue or reduce expenditures to maintain service performances.
COMMERCIAL ASSESSMENT RATIO Threshold 20% OR LESS OF TOTAL ASSESSMENT (TOWNS)
(15% FOR REGIONALS; 10% FOR RURALS)
Value of commercial assessment
Total value of all types of assessment combined
Commercial tax rates are generally higher than residential tax rates and are a key source of revenue for municipalities. A low percentage may indicate a relatively weaker tax base, and could be a sign of low economic activity.
RELIANCE ON A SINGLE ACCOUNT RATIO Threshold 10% OR MORE OF THE TAX BASE
Value of the largest commercial or institutional
property
Total value of the tax base
If the municipality is reliant on a single employer or institution for a large portion of their revenue, closure or downsizing could pose a significant threat to the viability of the municipality.

16
For a more detailed description of each indicator and its calculation see the technical definitions.
17
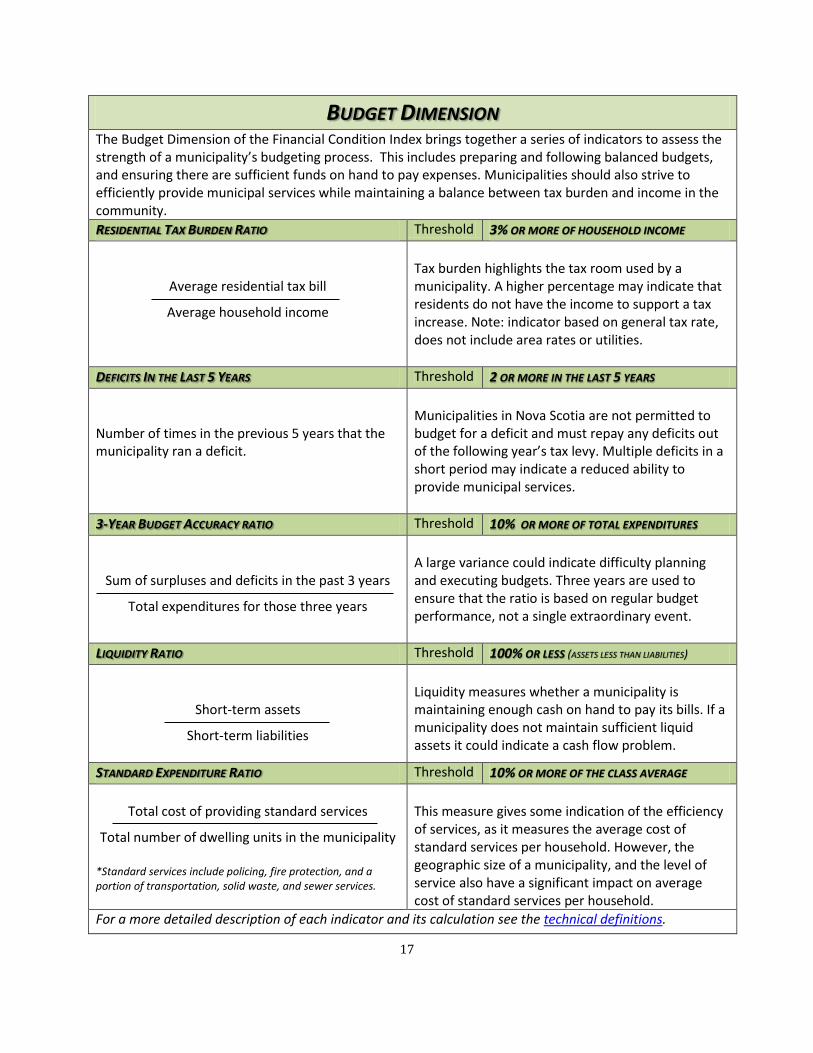
BUDGET DIMENSION The Budget Dimension of the Financial Condition Index brings together a series of indicators to assess the strength of a municipality’s budgeting process. This includes preparing and following balanced budgets, and ensuring there are sufficient funds on hand to pay expenses. Municipalities should also strive to efficiently provide municipal services while maintaining a balance between tax burden and income in the community.
RESIDENTIAL TAX BURDEN RATIO Threshold 3% OR MORE OF HOUSEHOLD INCOME
Average residential tax bill
Average household income
Tax burden highlights the tax room used by a municipality. A higher percentage may indicate that residents do not have the income to support a tax increase. Note: indicator based on general tax rate, does not include area rates or utilities.
DEFICITS IN THE LAST 5 YEARS Threshold 2 OR MORE IN THE LAST 5 YEARS
Number of times in the previous 5 years that the municipality ran a deficit.
Municipalities in Nova Scotia are not permitted to budget for a deficit and must repay any deficits out of the following year’s tax levy. Multiple deficits in a short period may indicate a reduced ability to provide municipal services.
3-YEAR BUDGET ACCURACY RATIO Threshold 10% OR MORE OF TOTAL EXPENDITURES
Sum of surpluses and deficits in the past 3 years
Total expenditures for those three years
A large variance could indicate difficulty planning and executing budgets. Three years are used to ensure that the ratio is based on regular budget performance, not a single extraordinary event.
LIQUIDITY RATIO Threshold 100% OR LESS (ASSETS LESS THAN LIABILITIES)
Short-term assets
Short-term liabilities
Liquidity measures whether a municipality is maintaining enough cash on hand to pay its bills. If a municipality does not maintain sufficient liquid assets it could indicate a cash flow problem.
STANDARD EXPENDITURE RATIO Threshold 10% OR MORE OF THE CLASS AVERAGE
Total cost of providing standard services
Total number of dwelling units in the municipality *Standard services include policing, fire protection, and a portion of transportation, solid waste, and sewer services.
This measure gives some indication of the efficiency of services, as it measures the average cost of standard services per household. However, the geographic size of a municipality, and the level of service also have a significant impact on average cost of standard services per household.
For a more detailed description of each indicator and its calculation see the technical definitions.

18
19
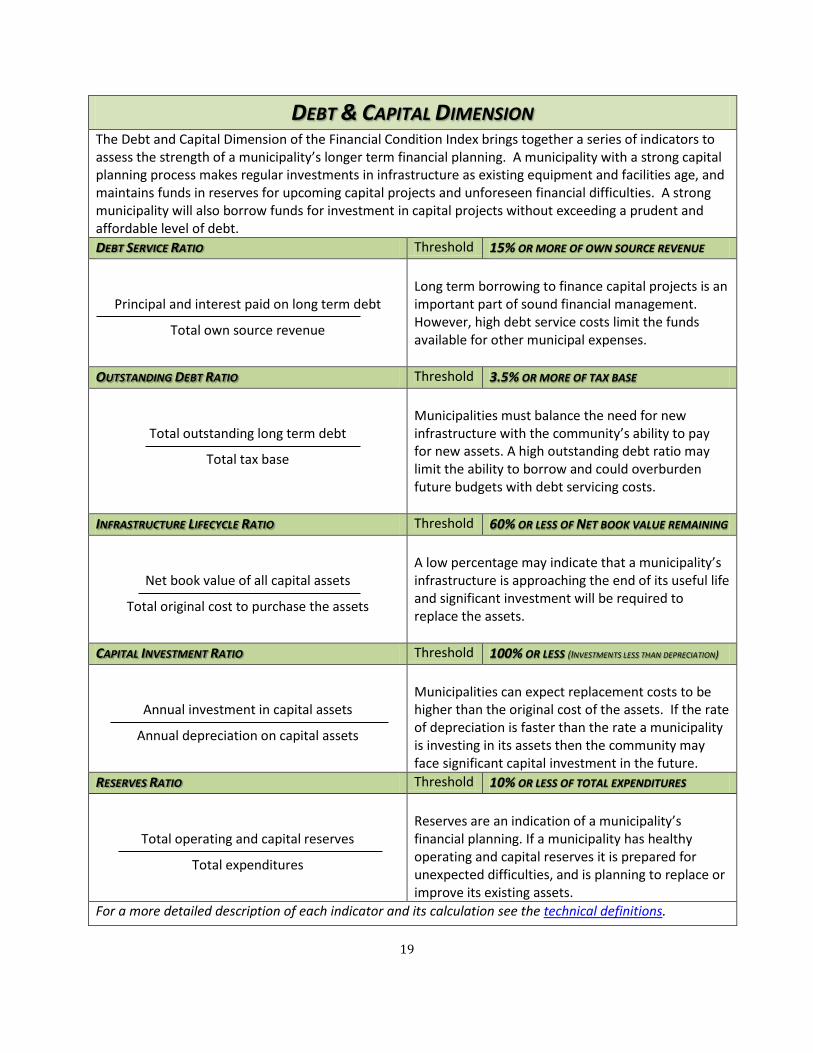
DEBT & CAPITAL DIMENSION The Debt and Capital Dimension of the Financial Condition Index brings together a series of indicators to assess the strength of a municipality’s longer term financial planning. A municipality with a strong capital planning process makes regular investments in infrastructure as existing equipment and facilities age, and maintains funds in reserves for upcoming capital projects and unforeseen financial difficulties. A strong municipality will also borrow funds for investment in capital projects without exceeding a prudent and affordable level of debt.
DEBT SERVICE RATIO Threshold 15% OR MORE OF OWN SOURCE REVENUE
Principal and interest paid on long term debt
Total own source revenue
Long term borrowing to finance capital projects is an important part of sound financial management. However, high debt service costs limit the funds available for other municipal expenses.
OUTSTANDING DEBT RATIO Threshold 3.5% OR MORE OF TAX BASE
Total outstanding long term debt
Total tax base
Municipalities must balance the need for new infrastructure with the community’s ability to pay for new assets. A high outstanding debt ratio may limit the ability to borrow and could overburden future budgets with debt servicing costs.
INFRASTRUCTURE LIFECYCLE RATIO Threshold 60% OR LESS OF NET BOOK VALUE REMAINING
Net book value of all capital assets
Total original cost to purchase the assets
A low percentage may indicate that a municipality’s infrastructure is approaching the end of its useful life and significant investment will be required to replace the assets.
CAPITAL INVESTMENT RATIO Threshold 100% OR LESS (INVESTMENTS LESS THAN DEPRECIATION)
Annual investment in capital assets
Annual depreciation on capital assets
Municipalities can expect replacement costs to be higher than the original cost of the assets. If the rate of depreciation is faster than the rate a municipality is investing in its assets then the community may face significant capital investment in the future.
RESERVES RATIO Threshold 10% OR LESS OF TOTAL EXPENDITURES
Total operating and capital reserves
Total expenditures
Reserves are an indication of a municipality’s financial planning. If a municipality has healthy operating and capital reserves it is prepared for unexpected difficulties, and is planning to replace or improve its existing assets.
For a more detailed description of each indicator and its calculation see the technical definitions.
20
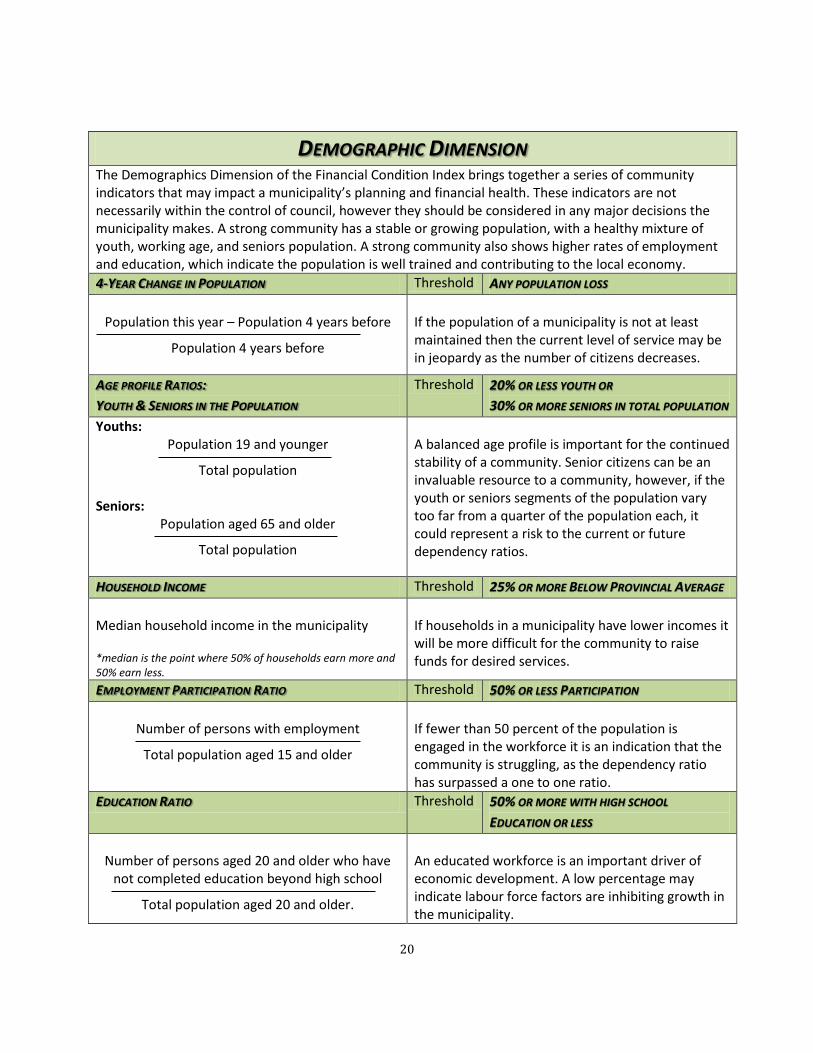
DEMOGRAPHIC DIMENSION The Demographics Dimension of the Financial Condition Index brings together a series of community indicators that may impact a municipality’s planning and financial health. These indicators are not necessarily within the control of council, however they should be considered in any major decisions the municipality makes. A strong community has a stable or growing population, with a healthy mixture of youth, working age, and seniors population. A strong community also shows higher rates of employment and education, which indicate the population is well trained and contributing to the local economy.
4-YEAR CHANGE IN POPULATION Threshold ANY POPULATION LOSS
Population this year – Population 4 years before
Population 4 years before
If the population of a municipality is not at least maintained then the current level of service may be in jeopardy as the number of citizens decreases.
AGE PROFILE RATIOS:
YOUTH & SENIORS IN THE POPULATION
Threshold 20% OR LESS YOUTH OR
30% OR MORE SENIORS IN TOTAL POPULATION
Youths: Population 19 and younger
Total population Seniors:
Population aged 65 and older
Total population
A balanced age profile is important for the continued stability of a community. Senior citizens can be an invaluable resource to a community, however, if the youth or seniors segments of the population vary too far from a quarter of the population each, it could represent a risk to the current or future dependency ratios.
HOUSEHOLD INCOME Threshold 25% OR MORE BELOW PROVINCIAL AVERAGE
Median household income in the municipality *median is the point where 50% of households earn more and 50% earn less.
If households in a municipality have lower incomes it will be more difficult for the community to raise funds for desired services.
EMPLOYMENT PARTICIPATION RATIO Threshold 50% OR LESS PARTICIPATION
Number of persons with employment
Total population aged 15 and older
If fewer than 50 percent of the population is engaged in the workforce it is an indication that the community is struggling, as the dependency ratio has surpassed a one to one ratio.
EDUCATION RATIO Threshold 50% OR MORE WITH HIGH SCHOOL
EDUCATION OR LESS
Number of persons aged 20 and older who have
not completed education beyond high school
Total population aged 20 and older.
An educated workforce is an important driver of economic development. A low percentage may indicate labour force factors are inhibiting growth in the municipality.

21
For a more detailed description of each indicator and its calculation see the technical definitions.
22
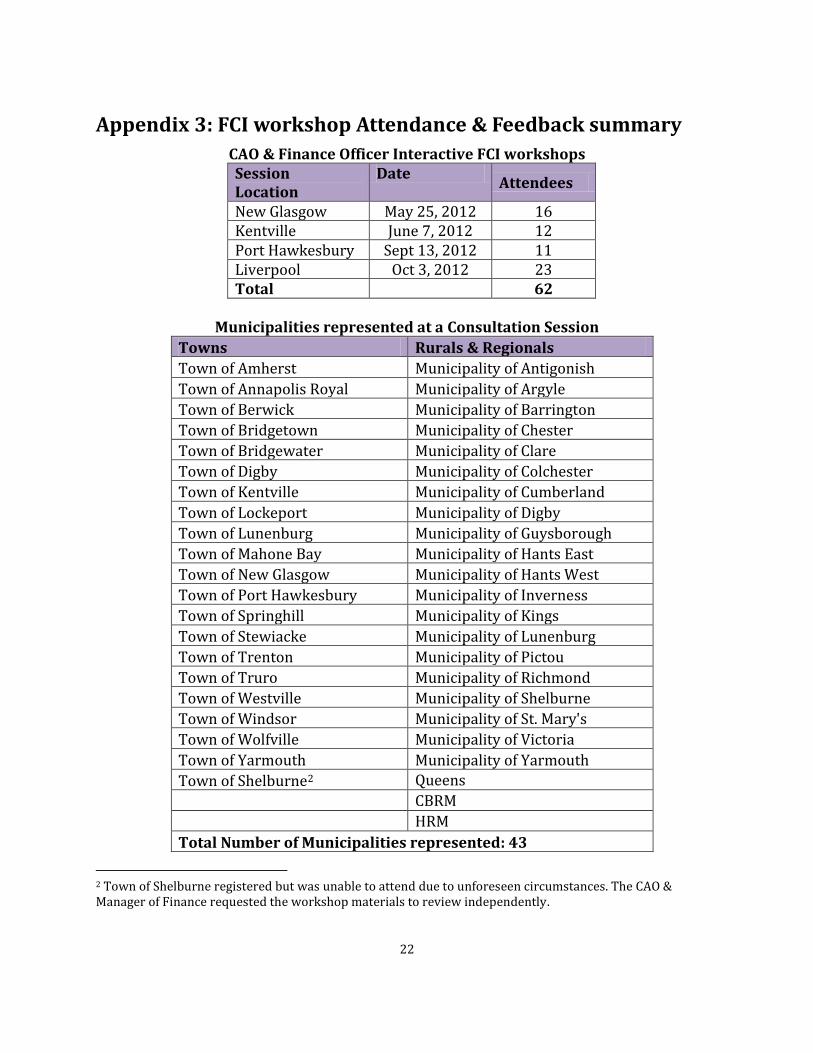
Appendix 3: FCI workshop Attendance & Feedback summary
CAO & Finance Officer Interactive FCI workshops Session Location
Date Attendees
New Glasgow May 25, 2012 16 Kentville June 7, 2012 12 Port Hawkesbury Sept 13, 2012 11 Liverpool Oct 3, 2012 23 Total 62
Municipalities represented at a Consultation Session
Towns Rurals & Regionals
Town of Amherst Municipality of Antigonish
Town of Annapolis Royal Municipality of Argyle
Town of Berwick Municipality of Barrington
Town of Bridgetown Municipality of Chester
Town of Bridgewater Municipality of Clare
Town of Digby Municipality of Colchester
Town of Kentville Municipality of Cumberland
Town of Lockeport Municipality of Digby
Town of Lunenburg Municipality of Guysborough
Town of Mahone Bay Municipality of Hants East
Town of New Glasgow Municipality of Hants West
Town of Port Hawkesbury Municipality of Inverness
Town of Springhill Municipality of Kings
Town of Stewiacke Municipality of Lunenburg
Town of Trenton Municipality of Pictou
Town of Truro Municipality of Richmond
Town of Westville Municipality of Shelburne
Town of Windsor Municipality of St. Mary's
Town of Wolfville Municipality of Victoria
Town of Yarmouth Municipality of Yarmouth
Town of Shelburne2 Queens
CBRM
HRM
Total Number of Municipalities represented: 43
2 Town of Shelburne registered but was unable to attend due to unforeseen circumstances. The CAO & Manager of Finance requested the workshop materials to review independently.

23
Workshop Evaluation form Summary
The table below summarizes the responses to the workshop evaluation form distributed at the conclusion of each session. 52 participants completed a form, although not all respondents answered each question, resulting in response totals for individual questions summing to less than 52. The % yes column was calculated by dividing the total number of yes responses by the total number of forms completed (52) regardless of how many individuals responded the each individual questions.
Question Yes No % Yes 1) Did you find session useful?
51 0 98%
2) Do you have a better understanding of the municipal indicators now than before the workshop?
49 2 94%
3) Are you more likely to use the municipal indicators after having completed this workshop?
48 2 92%
4) Do you think the financial condition index will be of benefit to your municipality?
41 1 79%
5) Would you use the financial condition index to help you explain financial results or decisions to your council?
38 1 73%
6) Did you find that the workshop format is an effective way to get your input on municipal indicators?
43 0 83%