antimicrobial-resistance-in-zoonotic-and-indicator-bacteria ...
336
EFSA Journal 2014;12(3):3590 Suggested citation: EFSA (European Food Safety Authority) and ECDC (European Centre for Disease Prevention and Control), 2014. The European Union Summary Report on antimicrobial resistance in zoonotic and indicator bacteria from humans, animals and food in 2012. EFSA Journal 2014;12(3):3590, 336 pp., doi:10.2903/j.efsa.2014.3590 Available online: www.efsa.europa.eu/efsajournal © European Food Safety Authority, 2014 SCIENTIFIC REPORT OF EFSA AND ECDC The European Union Summary Report on antimicrobial resistance in zoonotic and indicator bacteria from humans, animals and food in 2012 1 European Food Safety Authority 2,3 European Centre for Disease Prevention and Control 2,3 European Food Safety Authority (EFSA), Parma, Italy European Centre for Disease Prevention and Control (ECDC), Stockholm, Sweden This scientific output, published on 18 July 2014, replaces the earlier version published on 25 March 2014*. ABSTRACT The antimicrobial resistance data among zoonotic and indicator bacteria in 2012, submitted by 26 European Union Member States, were jointly analysed by the EFSA and the ECDC. Resistance in zoonotic Salmonella and Campylobacter isolates from humans, animals and food and resistance in indicator Escherichia coli, as well as data on methicillin-resistant Staphylococcus aureus, in animals and food were addressed. Resistance in human isolates was mainly interpreted using clinical breakpoints, while microbiological resistance in animal and food isolates was assessed using epidemiological cut-off values. Resistance was commonly found in isolates from humans, animals and food, although marked disparities in resistance were frequently observed between Member States. In Salmonella from humans, high resistance levels were recorded to ampicillin, sulfonamides and tetracyclines, while resistance to third- generation cephalosporins and fluoroquinolones remained low. In Salmonella and Escherichia coli isolates from fowl, pigs, cattle and meat thereof, microbiological resistance to ampicillin, tetracyclines and sulfonamides was commonly detected, while microbiological resistance to third-generation cephalosporins was generally low. High to very high microbiological resistance to (fluoro)quinolones was observed in Salmonella isolates from turkeys, fowl and broiler meat. In Campylobacter from humans, resistance to ampicillin, ciprofloxacin, nalidixic acid and tetracyclines was high, while resistance to erythromycin was low to moderate. High to extremely high microbiological resistance to ciprofloxacin, nalidixic acid and tetracyclines was observed in Campylobacter isolates from fowl, broiler meat, pigs and cattle, whereas much lower levels were observed for erythromycin and gentamicin. Increasing trends for ciprofloxacin resistance was observed in Campylobacter isolates from humans, broilers and/or pigs in several Member States. Multi- resistance and co-resistance to critically important antimicrobials in both human and animal isolates were presented, and for the first time, multi-resistance patterns in Salmonella serovars. Very few isolates from animals were co-resistant to critically important antimicrobials. A minority of isolates from animals belonging to a few Salmonella serovars (notably Kentucky and Infantis) were resistant to high levels of ciprofloxacin. © European Food Safety Authority, European Centre for Disease Prevention and Control, 2014 KEY WORDS antimicrobial resistance, zoonotic bacteria, indicator bacteria 1 On request from EFSA, Question No EFSA-Q-2013-00214, approved on 24 February 2014. 2 Correspondence: in EFSA: [email protected]; in ECDC: [email protected] 3 Acknowledgements: EFSA and ECDC wish to thank the members of the Scientific Network for Zoonoses Monitoring Data, former Task Force on Zoonoses Data Collection (EFSA) and the Food and Waterborne Diseases and Zoonoses Network (ECDC) who provided the data and reviewed the report. Also, the contribution of EFSA’s staff members: Pierre-Alexandre Belœil, Pia Mäkelä, Anca Stoicescu, Valentina Rizzi, Anne-Laure Moufle, Roisin Rooney, Kenneth Mulligan, Francesca Riolo, Mario Monguidi, Saghir Bashir, Angela Cohen, Gina Cioacata and Klaudia Chrzastek, the contributions of ECDC’s staff members: Therese Westrell, Johanna Takkinen and Liselott Diaz Högberg, and the contributions of EFSA’s contractors: the Animal Health and Veterinary Laboratory Agency of the United Kingdom: Sarah Easthope, Catherine Tallentire and Christopher Teale, and the University of Hasselt: Stijn Jaspers and Marc Aerts, for the support provided to this scientific output. * Changes have been made to human data in the Campylobacter chapter where resistance levels to ciprofloxacin in Iceland have been modified in Tables CA2 and CA4. In addition, text revision has been done in text boxes related to the revision of epidemiological cut-off values presented in the Introduction part on page 12, in the E. coli chapter on page 201, and in Materials and methods chapter on page 248. The changes do not affect the main findings and the overall discussion of the report. To avoid any confusion the original version of the output has been removed from the website but is available on request.
-
Upload
khangminh22 -
Category
Documents
-
view
0 -
download
0
Transcript of antimicrobial-resistance-in-zoonotic-and-indicator-bacteria ...

EFSA Journal 2014;12(3):3590
Suggested citation: EFSA (European Food Safety Authority) and ECDC (European Centre for Disease Prevention and Control),
2014. The European Union Summary Report on antimicrobial resistance in zoonotic and indicator bacteria from humans, animals and
food in 2012. EFSA Journal 2014;12(3):3590, 336 pp., doi:10.2903/j.efsa.2014.3590
Available online: www.efsa.europa.eu/efsajournal
© European Food Safety Authority, 2014
SCIENTIFIC REPORT OF EFSA AND ECDC
The European Union Summary Report on antimicrobial resistance in zoonotic
and indicator bacteria from humans, animals and food in 20121
European Food Safety Authority2,3
European Centre for Disease Prevention and Control2,3
European Food Safety Authority (EFSA), Parma, Italy
European Centre for Disease Prevention and Control (ECDC), Stockholm, Sweden
This scientific output, published on 18 July 2014, replaces the earlier version published on 25 March 2014*.
ABSTRACT
The antimicrobial resistance data among zoonotic and indicator bacteria in 2012, submitted by 26 European Union
Member States, were jointly analysed by the EFSA and the ECDC. Resistance in zoonotic Salmonella and
Campylobacter isolates from humans, animals and food and resistance in indicator Escherichia coli, as well as data on
methicillin-resistant Staphylococcus aureus, in animals and food were addressed. Resistance in human isolates was
mainly interpreted using clinical breakpoints, while microbiological resistance in animal and food isolates was assessed
using epidemiological cut-off values. Resistance was commonly found in isolates from humans, animals and food,
although marked disparities in resistance were frequently observed between Member States. In Salmonella from
humans, high resistance levels were recorded to ampicillin, sulfonamides and tetracyclines, while resistance to third-
generation cephalosporins and fluoroquinolones remained low. In Salmonella and Escherichia coli isolates from fowl,
pigs, cattle and meat thereof, microbiological resistance to ampicillin, tetracyclines and sulfonamides was commonly
detected, while microbiological resistance to third-generation cephalosporins was generally low. High to very high
microbiological resistance to (fluoro)quinolones was observed in Salmonella isolates from turkeys, fowl and broiler
meat. In Campylobacter from humans, resistance to ampicillin, ciprofloxacin, nalidixic acid and tetracyclines was high,
while resistance to erythromycin was low to moderate. High to extremely high microbiological resistance to
ciprofloxacin, nalidixic acid and tetracyclines was observed in Campylobacter isolates from fowl, broiler meat, pigs and
cattle, whereas much lower levels were observed for erythromycin and gentamicin. Increasing trends for ciprofloxacin
resistance was observed in Campylobacter isolates from humans, broilers and/or pigs in several Member States. Multi-
resistance and co-resistance to critically important antimicrobials in both human and animal isolates were presented,
and for the first time, multi-resistance patterns in Salmonella serovars. Very few isolates from animals were co-resistant
to critically important antimicrobials. A minority of isolates from animals belonging to a few Salmonella serovars
(notably Kentucky and Infantis) were resistant to high levels of ciprofloxacin.
© European Food Safety Authority, European Centre for Disease Prevention and Control, 2014
KEY WORDS
antimicrobial resistance, zoonotic bacteria, indicator bacteria
1 On request from EFSA, Question No EFSA-Q-2013-00214, approved on 24 February 2014. 2 Correspondence: in EFSA: [email protected]; in ECDC: [email protected] 3 Acknowledgements: EFSA and ECDC wish to thank the members of the Scientific Network for Zoonoses Monitoring Data,
former Task Force on Zoonoses Data Collection (EFSA) and the Food and Waterborne Diseases and Zoonoses Network (ECDC)
who provided the data and reviewed the report. Also, the contribution of EFSA’s staff members: Pierre-Alexandre Belœil, Pia
Mäkelä, Anca Stoicescu, Valentina Rizzi, Anne-Laure Moufle, Roisin Rooney, Kenneth Mulligan, Francesca Riolo, Mario
Monguidi, Saghir Bashir, Angela Cohen, Gina Cioacata and Klaudia Chrzastek, the contributions of ECDC’s staff members:
Therese Westrell, Johanna Takkinen and Liselott Diaz Högberg, and the contributions of EFSA’s contractors: the Animal Health
and Veterinary Laboratory Agency of the United Kingdom: Sarah Easthope, Catherine Tallentire and Christopher Teale, and the
University of Hasselt: Stijn Jaspers and Marc Aerts, for the support provided to this scientific output.
* Changes have been made to human data in the Campylobacter chapter where resistance levels to ciprofloxacin in Iceland have been
modified in Tables CA2 and CA4. In addition, text revision has been done in text boxes related to the revision of epidemiological
cut-off values presented in the Introduction part on page 12, in the E. coli chapter on page 201, and in Materials and methods
chapter on page 248. The changes do not affect the main findings and the overall discussion of the report. To avoid any confusion
the original version of the output has been removed from the website but is available on request.

EU summary report on antimicrobial resistance in zoonotic and indicator bacteria from
humans, animals and food 2012
EFSA Journal 2014;12(3):3590 2
EUROPEAN UNION SUMMARY REPORT
Antimicrobial resistance in zoonotic and indicator bacteria from humans, animals and food in the
European Union in 2012
Approved on 24 February 2014 Published on 25 March 2014
Suggested citation: EFSA (European Food Safety Authority) and ECDC (European Centre for Disease Prevention and Control), 2014. The European Union Summary Report on antimicrobial resistance in zoonotic and indicator bacteria from humans, animals and food in 2012. EFSA Journal 2014;12(3):3590, 336 pp., doi:10.2903/j.efsa.2014.3590 Available online: www.efsa.europa.eu/efsajournal

EU summary report on antimicrobial resistance in zoonotic and indicator bacteria from
humans, animals and food 2012
EFSA Journal 2014;12(3):3590 3
About EFSA
The European Food Safety Authority (EFSA), located in Parma, Italy, was established and funded by the European Union (EU) as an independent agency in 2002 following a series of food scares that caused the European public to voice concerns about food safety and the ability of regulatory authorities to protect consumers. EFSA provides objective scientific advice on all matters, in close collaboration with national authorities and in open consultation with its stakeholders, with a direct or indirect impact on food and feed safety, including animal health and welfare and plant protection. EFSA is also consulted on nutrition in relation to EU legislation. EFSA’s work falls into two areas: risk assessment and risk communication. In particular, EFSA’s risk assessments provide risk managers (EU institutions with political accountability, i.e. the European Commission, the European Parliament and the Council) with a sound scientific basis for defining policy-driven legislative or regulatory measures required to ensure a high level of consumer protection with regard to food and feed safety. EFSA communicates to the public in an open and transparent way on all matters within its remit. Collection and analysis of scientific data, identification of emerging risks and scientific support to the European Commission, particularly in the case of a food crisis, are also part of EFSA’s mandate, as laid down in the founding Regulation (EC) No 178/2002
4 of 28 January 2002.
About ECDC
The European Centre for Disease Prevention and Control (ECDC), an EU agency based in Stockholm, Sweden, was established in 2005. The objective of ECDC is to strengthen Europe’s defences against infectious diseases. According to Article 3 of the founding Regulation (EC) No 851/2004
5 of 21 April 2004,
ECDC’s mission is to identify, assess and communicate current and emerging threats to human health posed by infectious diseases. In order to achieve this mission, ECDC works in partnership with national public health bodies across Europe to strengthen and develop EU-wide disease surveillance and early warning systems. By working with experts throughout Europe, ECDC pools Europe’s knowledge in health so as to develop authoritative scientific opinions about the risks posed by current and emerging infectious diseases.
About the report
Based on Article 33 in the Regulation (EC) 178/2002, EFSA’s Zoonoses Unit is responsible for examining data on zoonoses, antimicrobial resistance and food-borne outbreaks collected from the Member States in accordance with Directive 2003/99/EC
6 and for preparing the European Union Summary Report from the
results. Regarding antimicrobial resistance data from 2012, this European Union Summary Report was produced in collaboration with ECDC and the Animal Health and Veterinary Laboratories Agency (AHVLA), the United Kingdom and the University of Hasselt in Belgium, contracted by EFSA.
Acknowledgements
The institutions and their staff members contributing to the monitoring and reporting of antimicrobial resistance in humans, animals and food in the Member States and other reporting countries are gratefully acknowledged for providing data and valuable comments for the report.
Contributions received from Therese Westrell and Liselott Diaz Högberg from ECDC, and Pierre-Alexandre Belœil, Pia Mäkelä, Anca Stoicescu, Valentina Rizzi, Anne-Laure Moufle, Roisin Rooney, Kenneth Mulligan, Francesca Riolo, Mario Monguidi, Saghir Bashir, Angela Cohen, Gina Cioacata and Klaudia Chrzastek from EFSA, as well as from Sarah Easthope, Nicola Groves, Catherine Tallentire and Christopher Teale from the AHVLA, and Stijn Jaspers and Marc Aerts from the University of Hasselt in the preparation of this report are kindly appreciated.
4 Regulation (EC) No 178/2002 of the European Parliament and of the Council of 28 January 2002 laying down the general principles
and requirements of food law, establishing the European Food Safety Authority and laying down procedures in matters of food safety. OJ L 31, 1.2.2002, p. 1-24.
5 Regulation (EC) No 851/2004 of the European Parliament and of the Council of 21 April 2004 establishing a European centre for
disease prevention and control. OJ L 142, 30.4.2004, p. 1-11. 6 Directive 2003/99/EC of the European Parliament and of the Council of 17 November 2003 on the monitoring of zoonoses and
zoonotic agents, amending Council Decision 90/424/EEC and repealing Council Directive 92/117/EEC. OJ L 325, 12.12.2003, p. 31-40.

EU summary report on antimicrobial resistance in zoonotic and indicator bacteria from
humans, animals and food 2012
EFSA Journal 2014;12(3):3590 4
Summary
Zoonoses are infections and diseases that are transmissible between animals and humans. Infection can be acquired directly from animals, or through the ingestion of contaminated foodstuffs. The severity of these diseases in humans can vary from mild symptoms to life-threatening conditions. The zoonotic bacteria that are resistant to antimicrobials are of special concern, since they might compromise the effective treatment of infections in humans. In order to follow the occurrence of antimicrobial resistance in zoonotic bacteria isolated from humans, animals and food in the European Union, information is collected and analysed from the European Union Member States.
In 2012, 26 Member States reported data on antimicrobial resistance in zoonotic bacteria to the European Commission and the European Food Safety Authority, and 19 Member States submitted data to the European Centre for Disease Prevention and Control. In addition, three other European countries provided information. Assisted by its contractors, the Animal Health and Veterinary Laboratories Agency in the United Kingdom and the University of Hasselt in Belgium, the European Food Safety Authority and the European Centre for Disease Prevention and Control analysed the data, the results of which are published in this European Union Summary Report on antimicrobial resistance. Information on resistance was reported regarding Salmonella and Campylobacter isolates from human cases, food and animals, whereas data on indicator Escherichia coli and indicator enterococci isolates related only to animals and food. Information was reported by some Member States on the occurrence of methicillin-resistant Staphylococcus aureus in animals and food; the antimicrobial susceptibility of methicillin-resistant Staphylococcus aureus isolates was additionally reported by two countries.
Data on antimicrobial resistance in isolates from human cases were mainly interpreted by using clinical breakpoints, while the quantitative data on antimicrobial resistance in isolates from food and animals were assessed using harmonised epidemiological cut-off values that detect microbiological resistance, i.e. reduced susceptibility to the antimicrobials tested, as well as using clinical breakpoints where considered appropriate. Direct comparisons should only be made between isolates from different sources using the same measure of determining resistance (i.e. by applying the same breakpoint).
The reporting of antimicrobial resistance data at isolate-based level by a significant number of Member States allowed the second analysis at the European Union level of multi-resistance and co-resistance patterns to critically important antimicrobials in both human and animal isolates. Detailed analyses of multi-drug resistance in certain Salmonella serovars, including analysis of high-level resistance to ciprofloxacin and pentavalent resistance, were possible for Member States reporting isolate-based data and included for the first time in the report. In addition, for certain bacterial species, antimicrobial resistance data could be analysed at the production-type level, such as broilers, laying hens and breeders of Gallus gallus, which allows the analysis of the data to be fine-tuned.
Antimicrobial resistance was commonly detected in isolates of Salmonella and Campylobacter from human cases as well as from food-producing animals and food in the European Union. This was also the case for indicator (commensal) Escherichia coli isolated from animals and food. For many of the antimicrobials, the levels of resistance varied greatly between different Member States.
In the European Union, the occurrence of resistance in Salmonella isolates from cases of salmonellosis in humans was high for ampicillin, streptomycin, sulfonamides and tetracyclines and moderate for nalidixic acid, with high levels of multi-drug resistance observed in some countries. Resistance to the critically important antimicrobials for human medicine, cefotaxime (a third-generation cephalosporin) and ciprofloxacin (a fluoroquinolone), was relatively low, although the resistance levels for ciprofloxacin were generally higher in countries using more sensitive interpretive criteria, such as epidemiological cut-off values. Co-resistance to ciprofloxacin and cefotaxime among Salmonella isolates was very low. The resistance levels also differed substantially between the three most commonly reported serovars, with higher resistance to ciprofloxacin, gentamicin and nalidixic acid observed in Salmonella Enteritidis than in Salmonella Typhimurium and monophasic Salmonella Typhimurium and the opposite for the other antimicrobials.
There was a high level of resistance to ampicillin, ciprofloxacin, nalidixic acid and tetracyclines among Campylobacter isolates from human cases, with high and very high levels of multi-drug resistance observed in some countries. The levels of resistance to erythromycin in human Campylobacter jejuni isolates was overall low, but moderately high in Campylobacter coli. Very high resistance levels to ciprofloxacin were reported in human Campylobacter isolates, with increasing trends observed in several Member States.

EU summary report on antimicrobial resistance in zoonotic and indicator bacteria from
humans, animals and food 2012
EFSA Journal 2014;12(3):3590 5
Almost one in six human Campylobacter coli isolates were also resistant to both erythromycin and ciprofloxacin, which is worrying as these two antimicrobials are the clinically most important for treatment of campylobacteriosis in humans.
The high proportions of Salmonella, Campylobacter and indicator Escherichia coli isolates exhibiting ‘microbiological resistance’ or reduced susceptibility to fluoroquinolones (ciprofloxacin) remain of concern. In Salmonella spp. isolates of food and animal origin, the highest occurrence of resistance to ciprofloxacin was noted in fattening turkeys, broiler meat, turkeys and broilers of Gallus gallus, where the proportion of such isolates varied between 46.0 % and 86.2 % in the reporting Member State group. Ciprofloxacin resistance was recorded more often in broilers than in breeders and laying hens. Two Member States demonstrated a significant increasing trend for ciprofloxacin and nalidixic acid resistance and one a decreasing trend for both antimicrobials in Salmonella species from Gallus gallus over the period from 2006 to 2012. Considering the indicator Escherichia coli isolates, the levels of ciprofloxacin resistance observed in isolates from broilers and pigs were 52.7 % and 7.5 %, respectively. Furthermore, high to extremely high resistance to fluoroquinolones was commonly observed in Campylobacter isolates from Gallus gallus and broiler meat, as well as from pigs and cattle, at levels ranging from 32.0 % (Campylobacter coli from pigs) to 82.7 % (Campylobacter coli from meat from broilers).
Resistance to the third-generation cephalosporin cefotaxime was observed in Salmonella spp. isolates from Gallus gallus, turkeys, pigs, cattle and meat derived from broilers, pigs and bovine at very low or low levels varying between 0.4 % and 4.5 %, as well as in indicator Escherichia coli isolates from Gallus gallus, pigs and cattle at low or moderate levels ranging from 1.4 % to 10.2 %. Resistance to erythromycin was detected in Campylobacter isolates from Gallus gallus, pigs, cattle and broiler meat at levels of 0.4 % (Campylobacter jejuni from Gallus gallus) to 23.9 % (Campylobacter coli from pigs).
Among Salmonella isolates from meat and animals, microbiological resistance to tetracyclines, ampicillin and sulfonamides was reported at levels of 9.5 % to 66.7 % and it was higher in isolates from pigs and turkeys than in those from broilers, laying hens, breeding hens and cattle. Resistance to ciprofloxacin and nalidixic acid was higher in Salmonella isolates from fattening turkeys and broilers (41.5-86.2 %) than it was in isolates from breeding hens, laying hens, pigs or cattle (5.8-25.5 %). In isolates of Campylobacter from meat and animals, resistance was commonly detected to tetracyclines at levels up to 76.8 %, whereas much lower resistance was reported to gentamicin (levels lower than 4.1 %).
Among indicator Escherichia coli from broilers and pigs, microbiological resistance to tetracyclines, ampicillin and sulfonamides was commonly reported at levels of 29.5 % to 54.7 %, resistance levels being lower in laying hens (18.3 % to 25.2 %). In the case of cattle, levels of resistance to these antimicrobials fell within the range 34.7 % to 46.7 % in younger age groups, mainly fattening veal calves, but values were lower in older cattle, mainly adult cows. In general, resistance levels were lower among isolates from cattle and layers than in isolates from broilers and pigs.
Multi-resistance (reduced susceptibility to at least three antimicrobial classes according to epidemiological cut-off values) was generally high in Salmonella isolates from broilers, pigs and cattle in those countries reporting isolate-based data. However, co-resistance/reduced susceptibility to the clinically important antimicrobials ciprofloxacin and cefotaxime in the same isolate was detected in very few isolates of Salmonella species. Multi-resistance was either not detected or reported at very low or low levels in Campylobacter jejuni isolates from broilers, and co-resistance to ciprofloxacin and erythromycin at the same time was reported at low levels. High-level ciprofloxacin resistance was observed in a limited number of Salmonella isolates, notably belonging to the serovars Kentucky and Infantis, from broilers, laying hens and turkeys, but not in isolates from pigs or cattle, although it was detected in isolates from pig meat. A small number of serovars, including notably the serovar Infantis, displayed pentavalent resistance, which is potentially significant because certain Salmonella serovars which have shown epidemic spread have shown such pentavalent resistance in the past.
Several statistically significant national trends in resistance levels in isolates from animals were observed. Among Salmonella isolates, more decreasing than increasing trends were found, whereas in the case of Campylobacter, the statistically significant national trends were mostly increasing.

EU summary report on antimicrobial resistance in zoonotic and indicator bacteria from
humans, animals and food 2012
EFSA Journal 2014;12(3):3590 6
TABLE OF CONTENTS
Summary ........................................................................................................................................................... 4
1. Introduction ................................................................................................................................................... 9
1.1. Antimicrobial resistance monitoring and reporting at European Union level ............................... 9
1.2. Epidemiological cut-off values and clinical breakpoints ............................................................... 11
1.3. Developments in the harmonised monitoring of antimicrobial resistance .................................. 13
2. Main findings ............................................................................................................................................... 14
2.1. Main findings of the European Union Summary Report on antimicrobial resistance 2012 ....... 14
2.2. Zoonotic and indicator agent-specific summaries ......................................................................... 16
2.2.1. Salmonella ................................................................................................................................................. 16
2.2.1.1. In humans ..................................................................................................................................... 17
2.2.1.2. In animals and food ...................................................................................................................... 17
2.2.2. Campylobacter ........................................................................................................................................... 19
2.2.2.1. In humans ..................................................................................................................................... 19
2.2.2.2. In animals and food ...................................................................................................................... 19
2.2.3. Indicator (commensal) Escherichia coli ..................................................................................................... 20
2.2.4. Methicillin-resistant Staphylococcus aureus .............................................................................................. 22
3. Antimicrobial resistance in Salmonella.................................................................................................... 23
3.1. Introduction ......................................................................................................................................... 23
3.2. Overview of reported resistance data in Salmonella from humans, animals and food .............. 24
3.3. Antimicrobial resistance in Salmonella isolates from humans ..................................................... 25
3.3.1. Antimicrobial resistance in Salmonella spp. in humans ............................................................................. 26
3.3.1.1. Resistance levels in Salmonella spp. isolates from human cases ................................................ 26
3.3.1.2. Comparison of resistance levels in Salmonella spp. isolates acquired within EU/EEA and in
other geographical regions ............................................................................................................. 26
3.3.1.3. Multi-drug resistance among Salmonella spp. isolates from human cases ................................... 30
3.3.2. Antimicrobial resistance in Salmonella Enteritidis in humans .................................................................... 31
3.3.2.1. Resistance levels in Salmonella Enteritidis isolates from human cases ....................................... 31
3.3.2.2. Trends in resistance levels in Salmonella Enteritidis isolates from human cases ......................... 34
3.3.3. Antimicrobial resistance in Salmonella Typhimurium in humans ............................................................... 36
3.3.3.1. Resistance levels in Salmonella Typhimurium isolates from human cases ................................. 36
3.3.3.2. Trends in resistance levels in Salmonella Typhimurium isolates from human cases ................... 36
3.3.4. Antimicrobial resistance in monophasic Salmonella Typhimurium 1,4,[5],12:i:- in humans ....................... 41
3.3.4.1. Resistance levels in monophasic Salmonella Typhimurium 1 4,[5],12:i:- isolates human cases .. 41
3.4. Antimicrobial resistance in Salmonella isolates from animals and food ..................................... 43
3.4.1. Antimicrobial resistance in Salmonella isolates from food ......................................................................... 44
3.4.1.1. Meat from broilers and spent hens (Gallus gallus)........................................................................ 44
3.4.1.2. Meat from pigs. ... ...........................................................................................................................48
3.4.1.3. Meat from bovine animals...............................................................................................................52
3.4.2. Antimicrobial resistance in Salmonella isolates from animals .................................................................... 54
3.4.2.1. Domestic fowl (Gallus gallus) ....................................................................................................... 54
3.4.2.2. Turkeys ......................................................................................................................................... 76
3.4.2.3. Pigs ............................................................................................................................................... 81
3.4.2.4. Cattle (bovine animals) ................................................................................................................. 93
3.4.3. Comparison of ‘clinical’ and ‘microbiological’ resistance to ciprofloxacin ................................................. 101
3.4.4. Further analysis of multi-drug resistance in certain Salmonella serovars ................................................ 103
3.4.4.1. Multi- drug resistance patterns. .................................................................................................. 103
3.4.4.2. Co-resistance to cefotaxime and ciprofloxacin. .......................................................................... 103
3.4.4.3. Analysis of high-level ciprofloxacin resistance ............................................................................ 106
3.4.4.4. Analysis of pentavalent resistance ............................................................................................. 107
3.5. Overview of the findings of antimicrobial resistance in Salmonella at Member State reporting group level, 2012……...…. .............................................................................................. 109
3.6. Discussion ........................................................................................................................................ 112
4. Antimicrobial resistance in Campylobacter .......................................................................................... 115
4.1. Introduction ....................................................................................................................................... 115

EU summary report on antimicrobial resistance in zoonotic and indicator bacteria from
humans, animals and food 2012
EFSA Journal 2014;12(3):3590 7
4.2. Overview of reported data in humans, animals and food ............................................................ 116
4.3. Antimicrobial resistance in Campylobacter isolates from humans ............................................ 117
4.3.1. Antimicrobial resistance in Campylobacter spp. in humans ..................................................................... 118
4.3.1.1. Resistance levels in Campylobacter spp. isolates from human cases ........................................ 118
4.3.1.2. Comparison of resistance levels in Campylobacter spp. isolates acquired within EU/EEA and
in other geographical regions ....................................................................................................... 118
4.3.2. Antimicrobial resistance in Campylobacter jejuni in humans ................................................................... 121
4.3.2.1. Resistance levels in Campylobacter jejuni isolates from human cases ...................................... 121
4.3.2.2. Trends in resistance levels in Campylobacter jejuni isolates from human cases ........................ 121
4.3.2.3. Multi-drug resistance among Campylobacter jejuni isolates from human cases ......................... 121
4.3.3. Antimicrobial resistance in Campylobacter coli in humans ...................................................................... 126
4.3.3.1. Resistance levels in Campylobacter coli isolates from human cases ......................................... 126
4.3.3.2. Trends in resistance levels in Campylobacter coli isolates from human cases ........................... 126
4.3.3.3. Multi-drug resistance among Campylobacter coli isolates from human cases ............................ 126
4.4. Antimicrobial resistance in Campylobacter isolates from animals and food ............................ 131
4.4.1. Antimicrobial resistance in Campylobacter isolates from food .............................................................. …132
4.4.1.1. Meat from broilers and spent hens (Gallus gallus).......................................................................132
4.4.2. Antimicrobial resistance in Campylobacter isolates from animals ......................... ....................................133
4.4.2.1. Domestic fowl (Gallus gallus): broilers ...................... ...................................................................133
4.4.2.2. Pigs ............................................................................................................................................. 145
4.4.2.3. Cattle (bovine animals) ............................................................................................................... 151
4.5. Overview of the findings on antimicrobial resistance in Campylobacter at reporting Member State group level, 2012 ..................................................................................................... 156
4.6. Discussion ........................................................................................................................................ 157
5. Antimicrobial resistance in indicator Escherichia coli ......................................................................... 160
5.1. Introduction ....................................................................................................................................... 160
5.2. Antimicrobial resistance in indicator Escherichia coli isolates from animals and food .......... 160
5.2.1. Antimicrobial resistance in indicator Escherichia coli isolates from food .................................................. 161
5.2.1.1. Representaive sampling and monitoring ..................................................................................... 161
5.2.1.2. Meat from broilers (Gallus gallus) .............................................................................................. .161
5.2.1.3. Meat from pigs ........................................................................................................................... .162
5.2.1.4. Meat from bovine animals .......................................................................................................... .162
5.2.1.5. Multi-resistance among Escherichia coli isolates from meat…….. ............................................ .162
5.2.1.6. Comparison of resistance among Escherichia coli isolates from meat and animals ................... 162
5.2.2. Antimicrobial resistance in indicator Escherichia coli isolates from animals ............................................ 165
5.2.2.1. Domestic fowl (Gallus gallus) ..................................................................................................... 165
5.2.2.2. Pigs ............................................................................................................................................. 177
5.2.2.3. Cattle (bovine animals) ............................................................................................................... 188
5.3. Multi-drug resistance patterns in indicator E. coli in 2012 .......................................................... 197
5.3.1. Multi-drug resistance in E. coli isolates from broilers ............................................................................... 197
5.3.2. Multi-drug resistance in E. coli isolates from fattening pigs ..................................................................... 197
5.4. Overview of findings on indicator E. coli resistance at reporting Member State group level, 2012 ................................................................................................................................................... 198
5.5. Discussion ........................................................................................................................................ 200
6. Methicillin-resistant Staphylococcus aureus ........................................................................................ 203
6.1. Introduction ....................................................................................................................................... 203
6.2. Methicillin-resistant Staphylococcus aureus - reports from individual MSs ............................. 204
6.2.1. Methicillin-resistant Staphylococcus aureus in food ................................................................................. 204
6.2.2. Methicillin-resistant Staphylococcus aureus in animals ........................................................................... 206
6.2.2.1. Monitoring MRSA in food-producing animals .............................................................................. 206
6.2.2.2. Clinical investigations for MRSA in food-producing animals ....................................................... 208
6.2.2.3. Clinical investigations for MRSA in companion animals ............................................................. 208
6.2.2.4. Temporal trends in occurrence of MRSA ................................................................................... 209
6.2.3. Susceptibility testing of methicillin-resistant Staphylococcus aureus isolates .......................................... 210
6.2.3.1. MRSA isolates from cattle .......................................................................................................... 210
6.2.3.2. MRSA isolates from fattening pigs .............................................................................................. 211

EU summary report on antimicrobial resistance in zoonotic and indicator bacteria from
humans, animals and food 2012
EFSA Journal 2014;12(3):3590 8
6.3. Discussion ........................................................................................................................................ 213
7. Third-generation cephalosporin resistance in Escherichia coli and Salmonella .............................. 214
7.1. Introduction ....................................................................................................................................... 214
7.2. Third-generation cephalosporin resistance in Salmonella isolates from animals and food .... 215
7.2.1. Third-generation cephalosporin resistance in Salmonella isolates from food .......................................... 215
7.2.2. Third-generation cephalosporin resistance in Salmonella isolates from animals ..................................... 218
7.2.2.1. Resistance levels in Gallus gallus (fowl) ..................................................................................... 218
7.2.2.2. Resistance levels in turkeys ....................................................................................................... 221
7.2.2.3. Resistance levels in pigs ............................................................................................................ 222
7.2.2.4. Resistance levels in cattle .......................................................................................................... 224
7.2.3. Salmonella serovars from animals demonstrating resistance to third-generation cephalsoporins .......... 225
7.2.4. Reporting of specific data on ESBL in Salmonella ................................................................................... 225
7.3. Third-generation cephalosporin resistance in indicator E. coli isolates from food and animals… .......................................................................................................................................... 226
7.3.1. Third-generation cephalosporin resistance in indicator E. coli isolates from food .................................... 226
7.3.2. Third-generation cephalosporin resistance in indicator E. coli isolates from animals .............................. 227
7.3.2.1. Resistance levels in Gallus gallus (fowl) ..................................................................................... 227
7.3.2.2. Resistance levels in pigs ............................................................................................................ 228
7.3.2.3. Resistance levels in cattle .......................................................................................................... 229
7.4. Comparison of cefotaxime resistance in Salmonella spp. and indicator E. coli isolates from animals .............................................................................................................................................. 230
7.5. Discussion ........................................................................................................................................ 232
8. Materials and methods ............................................................................................................................. 234
8.1. Antimicrobial susceptibility data from humans available in 2012 .............................................. 234
8.1.1. Salmonella data of human origin ............................................................................................................. 234
8.1.2. Campylobacter data of human origin ....................................................................................................... 238
8.2. Antimicrobials susceptibility data from animals and food available in 2012 ............................. 242
8.2.1. Data reported under Directive 2003/99/EC in 2012 ................................................................................. 242
8.2.1.1. Resistance data in Salmonella and Campylobacter from animals and food ............................... 243
8.2.1.2. Resistance data in indicator bacteria .......................................................................................... 243
8.2.1.3. Resistance data to third-generation cephalosporins ................................................................... 243
8.2.1.4. Data on methicillin-resistant Staphylococcus aureus (MRSA) .................................................... 243
8.3. Antimicrobials used for susceptibility testing in animals and food ........................................... 244
8.3.1. Antimicrobials for susceptibility testing of Salmonella .............................................................................. 244
8.3.2. Antimicrobials for susceptibility testing of Campylobacter ....................................................................... 246
8.3.3. Antimicrobials for susceptibility testing of Escherichia coli ....................................................................... 247
8.3.4. Antimicrobials for susceptibility testing of MRSA ..................................................................................... 248
8.4. Data description and analysis ......................................................................................................... 248
8.4.1. Description and analysis of antimicrobial resistance data ........................................................................ 248
8.4.2. Analysis of multi-resistance and co-resistance data ................................................................................ 251
8.4.2.1. Analysis of multi-resistance patterns .......................................................................................... 251
8.4.2.2. Analysis of co-resistance ............................................................................................................ 252
9. References ................................................................................................................................................ 253
Appendices ................................................................................................................................................... 258
Appendix 1. Frequency distributions of Salmonella serovars in animals and food in 2012 antimicrobial resistance data ......................................................................................................... 258
Appendix 2. Antimicrobial resistance in Salmonella-qualitative data ............................................... 266
Appendix 3. Frequency distributions of complete susceptibility and multiple resistance ............. 272
Appendix 4. Multi-resistance patterns .................................................................................................. 287
Appendix 5. High-levels resistance to ciprofloxacin ........................................................................... 321
Appendix 6. Level 3 Tables ..................................................................................................................... 330
Appendix 7. List of abbreviations, Antimicrobial substances, Member States and other reporting countries, definitions ...................................................................................................... 331
Appendix 8. List of institutions contributing to AMR monitoring in animals and food ................... 335

EU summary report on antimicrobial resistance in zoonotic and indicator bacteria from
humans, animals and food 2012
EFSA Journal 2014;12(3):3590 9
1. INTRODUCTION
The antimicrobial agents used in food-producing animals in Europe are frequently the same, or belong to the same classes, as those used in human medicine. Antimicrobial resistance is the main undesirable side effect of antimicrobial use in both humans and animals and results from the continuous positive selection of resistant bacterial clones, whether these are pathogenic, commensal or even environmental bacteria. This will modify the population structure of microbial communities, leading to accelerated evolutionary trends with unpredictable consequences for human health. The use of antimicrobials can differ in humans and food-producing animals, in terms of both the methods of administration and the quantities administered; there are important variations between and within food-producing animal species, as well as between countries.
Bacterial resistance to antimicrobials occurring in food-producing animals can spread to people not only via food-borne routes, but also by routes such as water or environmental contamination as well as through direct animal contact. Campylobacter, Salmonella and some strains of Escherichia coli are examples of zoonotic bacteria which can infect people by the food-borne route. Infections with bacteria which are resistant to antimicrobials may result in treatment failures or necessitate the use of second-line antimicrobials for therapy. The commensal bacterial flora can also form a reservoir of resistance genes which may transfer between bacterial species, including transference to organisms capable of causing disease in both humans and animals (EFSA, 2008).
The monitoring of antimicrobial resistance in zoonotic and commensal bacteria in food-producing animals and food thereof is a prerequisite for understanding the development and diffusion of resistance, providing relevant risk assessment data, and evaluating targeted interventions. Resistance monitoring entails specific and continuous data collection, analysis and reporting that quantitatively follow temporal trends in the occurrence and distribution of resistance to antimicrobials, and should also allow the identification of emerging or specific patterns of resistance.
1.1. Antimicrobial resistance monitoring and reporting at the European Union level
According to Directive 2003/99/EC on the monitoring of zoonoses and zoonotic agents, Member States (MSs) are obliged to monitor and report antimicrobial resistance in Salmonella and Campylobacter isolates obtained from healthy food-producing animals and from food. In addition, Commission Decision 2007/407/EC
7 lays down detailed requirements on the harmonised monitoring and reporting of antimicrobial
resistance of Salmonella isolates from various poultry populations and pigs, sampled under the corresponding national control and monitoring programmes of Salmonella. The monitoring and reporting of antimicrobial resistance data from the indicator organisms Escherichia coli and enterococci is voluntary.
Decision 1082/20138 on serious cross-border threats to health and repealing Decision No 2119/98/EC, as
complemented by Decision 2000/96/EC9 with amendment Decision 2003/542/EC
10 on the diseases to be
progressively covered by the network, provides the basis for data collection on human diseases in MSs and reporting to the European Centre for Disease Prevention and Control (ECDC). ECDC has provided data on zoonotic infections in humans, as well as their analyses, for the Community Summary Reports since 2005. Starting in 2007, data on human cases have been reported from The European Surveillance System (TESSy), maintained by ECDC.
This EU Summary Report 2012 includes data related to the occurrence of antimicrobial resistance both in isolates from animals and foodstuffs, collected in the framework of Directive 2003/99/EC, and in isolates from human cases, derived from the networks under Decision 2119/98/EC. This report is a joint collaboration between the European Food Safety Authority (EFSA) and ECDC with the assistance of EFSA’s contractors, the Animal Health and Veterinary Laboratories Agency (AHVLA) in the United Kingdom and the University of
7 Commission Decision 2007/407/EC of 12 June 2007 on a harmonised monitoring of antimicrobial resistance in Salmonella in poultry and pigs. OJ L 153, 14.6.2007, p. 26–29.
8 Decision No 1082/2013/EU of the European Parliament and of the Council of 22 October 2013 on serious cross-border threats to health and repealing Decision No 2119/98/EC. OJ L 293, 5.11.2013, p. 1–15.
9 Commission Decision 2009/539/EC of 10 July 2009 amending Decision 2000/96/EC on communicable diseases to be progressively covered by the Community network under Decision No 2119/98/EC of the European Parliament and of the Council. OJ L 180, 11.7.2009, p. 22–23.
10 Commission Decision 2003/542/EC of 17 July 2003 amending Decision 2000/96/EC as regards the operation of dedicated surveillance networks. OJ L 185, 24.7.2003, p. 55–58.

EU summary report on antimicrobial resistance in zoonotic and indicator bacteria from
humans, animals and food 2012
EFSA Journal 2014;12(3):3590 10
Hasselt in Belgium. MSs, other reporting countries, the European Commission (EC) and the relevant European Union Reference Laboratories (EU-RL) were consulted while preparing the report. The efforts made by MSs, the reporting non-MSs and the EC in the reporting of zoonoses data and in the preparation of this report are gratefully acknowledged.
The main issues when comparing antimicrobial resistance data originating from different countries are the use of different laboratory methods and different interpretive criteria of resistance. These issues have been addressed by the development of EFSA’s guidelines for harmonised monitoring and reporting of resistance in food-producing animals and food thereof. The resistance monitoring performed under these guidelines utilises epidemiological cut-off values (ECOFFs) which separate the naïve, susceptible wild-type bacterial populations from isolates that have developed reduced susceptibility to a given antimicrobial agent (Kahlmeter et al., 2003). The ECOFFs may differ from breakpoints used for clinical purposes, which are defined against a background of clinically relevant data, including therapeutic indication, clinical response data, dosing schedules, pharmacokinetics and pharmacodynamics. In the EU Summary Reports on antimicrobial resistance from 2004 to 2011, ECOFFs were applied to minimum inhibitory concentration (MIC) data to define resistant Salmonella, Campylobacter, indicator E. coli and indicator enterococci isolates from animals and food. The use of harmonised methods and ECOFFs ensured the comparability of data over time at the country level and also facilitated the comparison of the occurrence of resistance between MSs. The same methods and principles have been applied in this 2012 Summary Report on antimicrobial resistance.
The antimicrobial susceptibility data reported to EFSA for the year 2012 for Campylobacter, Salmonella and indicator E. coli isolates from animals and food were analysed and all quantitative data were interpreted using ECOFFs. This report also includes results of phenotypic monitoring of resistance caused by extended-spectrum beta-lactamases (ESBLs) in Salmonella and indicator E. coli, conferring resistance to third-generation cephalosporins, as well as the second investigation at the EU level of the occurrence of complete susceptibility and multi-resistance in data reported at the isolate level. A list of the antimicrobials included in this evaluation of multi-resistance can be found in Chapter 8 ‘Materials and methods’. The majority of antimicrobial resistance data reported to EFSA by MSs comprised data collected in accordance with EFSA’s monitoring guidelines; quantitative disc diffusion data constituted only a small percentage of the total data and were analysed in the report as qualitative data only. This has circumvented the problem that ECOFFs are not available for the different disc diffusion methods used by MSs.
The report also encompasses resistance in Salmonella and Campylobacter isolates from human cases of salmonellosis and campylobacteriosis, respectively. These data were reported as qualitative data (with one exception), mostly interpreted using clinical breakpoints (CBPs), by MSs to TESSy. An important general feature of this report is that human data are largely based on susceptibility testing of clinical isolates, whereas animal data are based mainly on the testing of isolates from healthy animals, where testing has been performed in accordance with EFSA’s recommendations. The data on zoonotic bacteria from humans have largely been collated and collected using CBPs. Such data are therefore not always directly comparable with data from food-producing animals and food, which have been analysed using ECOFFs. Indeed, the use of ECOFFs in animal and food isolates generally conveys the picture of ‘microbiological resistance’ levels in these isolates higher than ‘clinical resistance’ levels recorded in human isolates, where CBPs have been used. These issues are discussed further in the chapters on Campylobacter and Salmonella. Universal adoption and understanding of the distinction between CBPs and ECOFFs would enable clinicians to choose the appropriate treatment based on information relevant to the individual patient, yet would recognise that epidemiologists need to be aware of small changes in bacterial susceptibility, which may indicate emerging resistance and allow for appropriate control measures to be considered. ECOFFs, CBPs and related concepts regarding antimicrobial resistance/susceptibility are presented in detail hereafter.

EU summary report on antimicrobial resistance in zoonotic and indicator bacteria from
humans, animals and food 2012
EFSA Journal 2014;12(3):3590 11
1.2. Epidemiological cut-off values and clinical breakpoints
The European Committee on Antimicrobial Susceptibility Testing (EUCAST) has defined clinical breakpoints (CBPs) and epidemiological cut-off values (ECOFFs). A microorganism is defined as clinically resistant when the degree of resistance shown is associated with a high likelihood of therapeutic failure. The microorganism is categorised as resistant by applying the appropriate CBP in a defined phenotypic test system, and this breakpoint may alter with legitimate changes in circumstances (for example alterations in dosing regime, drug formulation, patient factors).
A microorganism is defined as wild-type for a bacterial species when no acquired or mutational resistance mechanisms are present to the antimicrobial in question. A microorganism is categorised as wild-type for a given bacterial species presenting a lower minimum inhibitory concentration (MIC) to the antimicrobial in question than the appropriate ECOFF in a defined phenotypic test system. This cut-off value will not be altered by changing circumstances (such as alterations in frequency of antimicrobial administration). Wild-type microorganisms may or may not respond clinically to antimicrobial treatment. A microorganism is defined as non-wild-type for a given bacterial species by the presence of an acquired or mutational resistance mechanism to the antimicrobial in question. A microorganism is categorised as non-wild-type for a given bacterial species by applying the appropriate ECOFF value in a defined phenotypic test system; non-wild-type organisms are considered to show ‘microbiological resistance’ (as opposed to ‘clinical resistance’). CBPs and ECOFFs may be the same, although it is often the case that the ECOFF is lower than the CBP.
Comparative advantages and disadvantages of the use of CBPs versus ECOFFs (see box hereafter) have been taken into account in the detailed specifications for harmonised monitoring schemes on antimicrobial resistance in animals and food devised by EFSA. These guidelines have been published (EFSA, 2007, 2008) and the terminology used is that devised by EUCAST (Kahlmeter et al., 2003). As far as possible, ECOFFs have been used in this report, as recommended in the guidelines, to determine non-wild-type organisms also termed ‘microbiologically resistant’ organisms, and to ensure that results from different MSs are comparable. Hereafter in this report, ‘microbiologically antimicrobial-resistant’ organisms are referred to as ‘resistant’ for brevity.
CLINICAL BREAKPOINTS (CLINICAL RESISTANCE)
The clinician, or veterinarian, choosing an antimicrobial agent to treat humans or animals with a bacterial infection requires information that the antimicrobial selected is effective against the bacterial pathogen. Such information will be used, together with clinical details such as the site of infection, ability of the antimicrobial to reach the site of infection, formulations available and dosage regimes, when determining an appropriate therapeutic course of action. The in vitro susceptibility of the bacterial pathogen can be determined and clinical breakpoints used to ascertain whether the organism is likely to respond to treatment. Clinical breakpoints (CBPs) will take into account the clinical behaviour of the drug following administration and assume that a clinical response will be obtained if the drug is given as recommended and there are no other adverse factors which affect the outcome. Conversely, if the CBP indicates resistance, then it is likely that treatment will be unsuccessful. Frequency of dosing is one factor that can affect the antimicrobial concentration achieved at the site of infection. Therefore, different dosing regimes can lead to the development of different CBPs, as occurs in some countries for certain antimicrobials where different therapeutic regimes are in place. Although the rationale for the selection of different CBPs may be clear, their use makes the interpretation of results from different countries in reports of this type problematic, as the results are not directly comparable between those different countries.

EU summary report on antimicrobial resistance in zoonotic and indicator bacteria from
humans, animals and food 2012
EFSA Journal 2014;12(3):3590 12
The EUCAST ECOFFs which should be applied to interpret the results obtained by MSs are quoted in Commission Decision 2007/407/EC. However, since this Decision was adopted, there have been some minor changes to a few of the ECOFFs for some antimicrobials. This occurs because, as more data are collected relating to more bacterial isolates, the normal distribution of the wild-type population can in some cases be better defined. This 2012 EU Summary Report interprets the antimicrobial resistance data in accordance with the current Decision. The Decision is currently undergoing review by the EC, notably on the basis of the technical specifications proposed for harmonised monitoring of antimicrobial resistance in animals and food recently issued by EFSA (EFSA, 2012a, b, c), and the expected revision in the future will update a number of the ECOFFs to be used.
REVISION OF EPIDEMIOLOGICAL CUT-OFF VALUES
The epidemiological cut-off value (ECOFF) for E. coli versus ciprofloxacin has been recently revised by the European Committee on Antimicrobial Susceptibility Testing (EUCAST). Wild-type isolates are now considered to have a ciprofloxacin minimum inhibitory concentration lower than or equal to 0.06 mg/L (which is a change from the original tentative ECOFF of 0.03 mg/L and which now corresponds to the ECOFF for Salmonella spp.). The proportion of isolates showing microbiological resistance according to this breakpoint will alter when the new breakpoint is adopted and in fact will be reduced. For reasons of continuity and to comply with the current legislation where applicable, the ECOFFs used in this report have been those adopted in EFSA’s recommendations (EFSA, 2007, 2008) and quoted in Commission Decision 2007/407/EC. For these reasons, the most recent revisions by EUCAST have not been included in this report. The report for 2013 will incorporate all of these changes in a comprehensive revision, which will also re-evaluate the historical data using the revised ECOFFs, as well as taking into account revised EU legislation in this area, which will include the revised ECOFFs.
EPIDEMIOLOGICAL CUT-OFF VALUES (MICROBIOLOGICAL RESISTANCE)
For a given bacterial species, the pattern of the minimum inhibitory concentration (MIC) distribution or the inhibition zone diameter distribution (i.e. the frequency of occurrence of each given MIC or zone diameter plotted against the MIC value or zone diameter obtained) can enable the separation of the wild-type population of microorganisms from those populations which show a degree of resistance. The wild-type susceptible population is assumed to have no acquired or mutational resistance and commonly shows a normal distribution.
When bacteria acquire resistance by a clearly defined and efficacious mechanism, such as the acquisition of a plasmid bearing a gene which produces an enzyme capable of destroying the antimicrobial, then the MIC or zone diameter distribution commonly shows two major sub-populations, one a fully susceptible normal distribution of isolates and the other a fully resistant population which has acquired the resistance mechanism. Resistance may be achieved by a series of small steps, such as changes in the permeability of the bacterial cell wall to the antimicrobial or other mechanisms which confer a degree of resistance. In this case, there may be populations of organisms which occur lying between the fully susceptible population and more resistant populations. The epidemiological cut-off value (ECOFF) indicates the MIC or zone diameter above which the pathogen has some detectable reduction in susceptibility. ECOFFs are derived by testing an adequate number of isolates to ensure that the wild-type population can be confidently identified for a given antimicrobial. The clinical breakpoint, which is set to determine the therapeutic effectiveness of the antimicrobial, may fail to detect emergent resistance. Conversely, the ECOFF detects any deviation in susceptibility from the wild-type population, although it may not be appropriate for determining the likelihood of success or failure for clinical treatment.

EU summary report on antimicrobial resistance in zoonotic and indicator bacteria from
humans, animals and food 2012
EFSA Journal 2014;12(3):3590 13
1.3. Developments in the harmonised monitoring of antimicrobial resistance
The ECDC has, during 2012 and 2013, arranged several expert workshops together with its Food- and Waterborne Diseases and Zoonoses (FWD) network in order to develop an EU protocol for harmonised monitoring of antimicrobial resistance in human Salmonella and Campylobacter isolates (ECDC, 2014). Consultation was also sought from EFSA, EUCAST and the EU Reference Laboratory for Antimicrobial Resistance to facilitate comparison of data between countries and with results from the antimicrobial resistance monitoring performed in isolates from animals and food products. The protocol is effective from 2014 and supports the implementation of the Commission Action Plan on antimicrobial resistance.
In 2012, EFSA, at the request of the EC, reviewed and revised the detailed specifications for the harmonised monitoring of antimicrobial resistance in food-producing animals (EFSA, 2007, 2008). Three reports have been produced describing proposals to improve (1) the harmonisation, analysis and reporting of data on antimicrobial resistance in animals and food collected from the MSs (EFSA, 2012a), (2) the harmonised monitoring and reporting of antimicrobial resistance in Salmonella, Campylobacter and indicator E. coli and Enterococcus spp. bacteria transmitted through food (EFSA, 2012b) and (3) the harmonised monitoring and reporting of antimicrobial resistance in methicillin-resistant Staphylococcus aureus (EFSA, 2012c).
A NEW LEGISLATION ON HARMONISED MONITORING OF ANTIMICROBIAL RESISTANCE IN ANIMALS AND
FOOD
In 2013, based on the proposals issued by EFSA, the European Commission put forward and discussed with the MSs a new legislation on the harmonised monitoring of antimicrobial resistance in Salmonella, Campylobacter and indicator bacteria in food-producing animals and food. The Commission Decision 2013/652/EU11 of 12 November 2013 establishes a list of combinations of bacterial species, food-producing animal populations and food products and sets up priorities for the monitoring of antimicrobial resistance from a public health perspective.
Monitoring of antimicrobial resistance in E. coli become mandatory, as it is for Salmonella and C. jejuni in the major food producing animal population and their derived meat. Sampling should be performed at the level of domestically produced animal populations, corresponding to different production types, and not at the animal species level, with the aim of collecting data that, in the future, could be combined with those on exposure to antimicrobials. The concept of a threshold is introduced for some animal populations and their derived meat to determine whether monitoring of antimicrobial resistance should be mandatory. Provisions have been taken where possible to exploit samples that would be collected under other existing control programmes.
Microdilution methods for testing are confirmed and this should be accompanied by the application of European Committee on Antimicrobial Susceptibility Testing epidemiological cut-off values (ECOFFs) for the interpretation of microbiological resistance. The harmonised panel of antimicrobials used for Salmonella, Campylobacter, E. coli and Enterococcus spp. is broadened with the inclusion of substances that either are important for human health or can provide clearer insight into the resistance mechanisms involved. The concentration ranges to be used ensure that both the ECOFF and the clinical breakpoint are included so that comparability of results with human data is made possible.
The specific monitoring of extended-spectrum beta-lactamase-, AmpC- and carbapenemase-producing Salmonella and indicator commensal E. coli is also foreseen. The collection and reporting of data is to be performed at the isolate level, in order to enable more in-depth analyses to be conducted, in particular on the occurrence of multi-resistance. The Commission Implementing Decision 2013/652/EU will enter into force in 2014, as well as the Commission Implementing Decision 2013/653/EU12 of 12 November 2013 as regards a Union financial aid towards a coordinated control plan for antimicrobial resistance monitoring in zoonotic agents in 2014.
11
Commission Implementing Decision 2013/652/EU of 12 November 2013 on the monitoring and reporting of antimicrobial resistance in zoonotic and commensal bacteria. OJ L 303, 14.11.2013, p. 26–39.
12 Commission Implementing Decision 2013/653/EU of 12 November 2013 as regards a Union financial aid towards a coordinated control plan for antimicrobial resistance monitoring in zoonotic agents in 2014. OJ L 303, 14.11.2013, p. 40–47.

EU summary report on antimicrobial resistance in zoonotic and indicator bacteriafrom humans, animals and food 2012
EFSA Journal 2014;12(3):3590 14
2. MAIN FINDINGS
2.1. Main findings of the European Union Summary Report on antimicrobial resistance 2012
• In 2012, MSs reported qualitative data (and one non-MS reported quantitative data) on antimicrobial resistance in Salmonella and Campylobacter isolates from human cases mostly interpreted by using clinical breakpoints (CBPs) to define the resistant isolates. In contrast, quantitative data (minimum inhibitory concentrations (MICs) and/or inhibition zone diameter (IZD) results) on antimicrobial resistance, reported for isolates from food and animals, were interpreted by using epidemiological cut-off values (ECOFFs). ECOFFs are often lower than CBPs, and this can result in more isolates being classified as resistant, although that is dependent on the distribution of MICs obtained.
• Antimicrobial resistance was regularly observed in isolates of Salmonella and Campylobacter from human cases as well as from food-producing animals and food in the EU. For many of the antimicrobials, the levels of resistance varied greatly between different MSs and animal production types.
• Fluoroquinolones, such as ciprofloxacin, and third-generation cephalosporins, such as cefotaxime, are considered critically important antimicrobials in the treatment of severe or invasive salmonellosis in humans. Likewise, fluoroquinolones and macrolides, such as erythromycin, are considered critically important for treating severe Campylobacter infections. Therefore, special attention was paid to resistance against these substances in the analyses of the data.
• ‘Clinical resistance’ at the EU level in Salmonella spp. isolates from human cases was high (between 23.6 % and 30.0 %) to ampicillin, streptomycin, sulfonamides and tetracyclines. In contrast, resistance to ciprofloxacin and cefotaxime was relatively low (on average <6 % and <2 %, respectively); however, even low levels of resistance to these critically important antimicrobials are important. The determined resistance levels to ciprofloxacin were influenced by the interpretive criteria used in each country, resulting in higher resistance levels in countries using more sensitive criteria. The introduction of harmonised EUCAST methods and interpretive criteria in more and more MSs is therefore much welcomed and supported by ECDC.
• Multi-drug resistance (MDR, defined as reduced susceptibility to at least three antimicrobial classes) was high to very high in human Salmonella isolates in eight out of 12 reporting countries; however, there were very low levels of co-resistance to ciprofloxacin and cefotaxime. Furthermore, more than half of all Salmonella isolates were susceptible to the complete range of antimicrobials tested.
• In food and animal isolates, the highest occurrence of ‘microbiological resistance’ to ciprofloxacin was noted in Salmonella spp. isolates from fattening turkeys, broiler meat and fowl (Gallus gallus) (from 37.3 % to 86.2 % at the MS group level). The further sub-division of the Gallus gallus species into production types revealed higher overall resistance to ciprofloxacin in Salmonella spp. isolates from
CLINICAL RESISTANCE AND MICROBIOLOGICAL RESISTANCE: USE OF CLINICAL BREAKPOINTS AND EPIDEMIOLOGICAL CUT-OFF VALUES
Development of resistance in bacteria is a major threat to public health. It is therefore important to detect any occurrence of resistance and increases in resistance levels as early as possible. In this report, acquired resistance in bacteria is denoted ‘microbiological resistance’ and harmonised epidemiological cut-off values (ECOFFs) are used to interpret the results of susceptibility testing in isolates from animals and food. In contrast, results of susceptibility testing of clinical isolates from humans are interpreted using clinical breakpoints (CBPs) to guide medical treatment of the patient. The CBP is in many cases less sensitive than the ECOFF for a specific bacteria–drug combination, resulting in that isolates interpreted with ECOFFs more often will be classified as (microbiologically) resistant than isolates interpreted with CBPs. Direct comparisons between isolates from different sources should therefore only be made when the criteria for interpretation is at the same level (see breakpoint figures SA1 and CA1). The harmonisation efforts on antimicrobial resistance monitoring in humans led by ECDC include introduction of quantitative reporting. This will enable use of ECOFFs for interpretation of susceptibility testing results from human isolates.

EU summary report on antimicrobial resistance in zoonotic and indicator bacteriafrom humans, animals and food 2012
EFSA Journal 2014;12(3):3590 15
broilers (46.0 %) than in those from breeding hens (25.5 %) or laying hens (19.4 %). In cattle, pigs and pig meat, low resistance levels were observed (7.6 %–9.1 %).
• ‘Microbiological resistance’ to cefotaxime (a third-generation cephalosporin) was observed in Salmonella spp. isolates from Gallus gallus, turkeys, pigs and cattle and in meat derived from broilers, pigs and cattle, but at low or very low levels (0.4 %–4.5 %), when all reporting MSs were considered. However, even low levels of resistance to this critically important antimicrobial are important. Resistance to cefotaxime was not detected in Salmonella strains isolated from cattle in reporting countries in 2011, but was detected in a single MS in 2012.
• ‘Microbiological resistance’ to tetracyclines, ampicillin and sulfonamides was frequently reported among Salmonella spp. isolates from meat and animals (9.5 %–66.7 % at MS group level). Resistance to these antimicrobials was higher in isolates from pigs, turkeys and cattle (34.5 %–66.7 %) than in isolates from Gallus gallus (21.2 %–28.3 %).
• Multi-drug resistance (MDR, reduced susceptibility to at least three antimicrobial classes according to ECOFFs) was high in Salmonella spp. isolates from animals in some countries reporting isolate-based data; however, co-resistance/reduced susceptibility to the clinically important antimicrobials, ciprofloxacin and cefotaxime, was at very low to low levels.
• Detailed analyses of MDR in certain Salmonella serovars, including analysis of high-level resistance to ciprofloxacin and pentavalent resistance, was possible for MSs reporting isolate-based data from animals and food. High-level ciprofloxacin resistance was observed in a limited number of Salmonella isolates, notably belonging to the serovars Kentucky and Infantis, from broilers, laying hens and turkeys, but not in isolates from pigs or cattle, although it was detected in isolates from pig meat. A small number of serovars, in particular S. Infantis, displayed pentavalent resistance, which is potentially significant because certain Salmonella serovars which have shown epidemic spread have shown such pentavalent resistance in the past.
• MDR data on Salmonella isolates from animals and meat also provided evidence relating to (1) the non-detection of a serovar (S. Enteritidis) with a particular resistance pattern which has shown increased virulence for humans and (2) the spread of particular strains of Salmonella which have a typical antimicrobial resistance pattern (well-illustrated by monophasic S. Typhimurium isolates, where examination of the antimicrobial resistance patterns shown allows presumptive identification of the main clones which have been described).
• The ‘clinical resistance’ among Campylobacter spp. isolates from human cases was high (between 32.4 % and 48.8 %) for ampicillin, ciprofloxacin, nalidixic acid and tetracyclines. Low resistance levels (average 3.1 %) were observed to the clinically important antimicrobial erythromycin. Multi-resistance in human Campylobacter isolates was moderate or high in some countries. Levels of co-resistance to the clinically important antimicrobials, ciprofloxacin and erythromycin, were on average low among Campylobacter jejuni (C. jejuni) isolates and moderate among Campylobacter coli (C. coli) isolates. However, even low levels of co-resistance to both of these critically important antimicrobials are of significance.
• Extremely high ‘microbiological resistance’ levels to ciprofloxacin (a fluoroquinolone) was commonly observed in C. coli isolates from broiler meat and broilers (Gallus gallus) (82.7 % and 78.4 %, respectively), with somewhat lower levels in C. jejuni (59.5 % and 44.1 %, respectively). High levels were also reported for isolates from pigs and cattle (32.0 % to 32.9 %). Important differences were observed between animal species and MSs.
• ‘Microbiological resistance’ to erythromycin was detected at very low to moderate levels in Campylobacter isolates from broilers (Gallus gallus) and broiler meat (0.4 %–16.5 %). The highest level of resistance to erythromycin at the reporting MS group level was observed in C. coli isolates from pigs (23.9 %), while the level of erythromycin resistance in isolates of C. jejuni from cattle across reporting MSs was very low (0.6 %).
• Considering all reporting MSs, ‘microbiological resistance’ to nalidixic acid and tetracyclines was common among Campylobacter isolates from meat and animals (31.6 %–81.0 %), whereas resistance

EU summary report on antimicrobial resistance in zoonotic and indicator bacteriafrom humans, animals and food 2012
EFSA Journal 2014;12(3):3590 16
to gentamicin was low (0.2 %–4.1 %). As for Salmonella, levels of resistance to nalidixic acid followed closely those observed for ciprofloxacin.
• Multi-resistance (reduced susceptibility to at least three antimicrobial classes according to ECOFFs) was generally low in C. jejuni isolates from broilers and co-resistance to the clinically important antimicrobials, ciprofloxacin and erythromycin, was, in the same isolates, either not detected or recorded at low levels. Multi-resistance and co-resistance levels were generally higher in C. coli isolates from broilers and fattening pigs.
• Analysis of MDR data for Campylobacter can also provide indications of certain mechanisms of resistance. Resistance to ciprofloxacin and erythromycin in Campylobacter is usually the result of mutation with or without the additional action of efflux pumps. Additionally, the efflux pump CmeABC has been shown to confer a degree of resistance to erythromycin, ciprofloxacin and tetracyclines. Isolates of both C. coli and C. jejuni, from animals and humans were detected which showed resistance to erythromycin, ciprofloxacin and tetracyclines, raising the possibility that CmeABC may have been responsible for, or contributed to, the observed pattern of ‘microbiological resistance’.
• Several statistically significant national trends in resistance levels in isolates from animals were observed. Among Salmonella spp. isolates, more decreasing than increasing trends were found, whereas in Campylobacter isolates the statistically significant national trends were mostly increasing. Increasing (decreasing) trends in resistance to (fluoro)quinolones in C. jejuni, C. coli and E. coli in broilers and pigs were observed in a number of countries having consistently reported AMR data through active monitoring programmes over the last years.
• Among indicator (commensal) E. coli isolates from animals, ‘microbiological resistance’ to ampicillin, streptomycin sulfonamides and tetracyclines, was commonly reported in Gallus gallus and pigs (29.5 %–54.7 %), lower levels being reported in cattle (24.5 %–30.6 %). Resistance to ciprofloxacin and nalidixic acid was highest among E. coli isolates from Gallus gallus (57.6 % and 47.4 %, respectively), while levels were lower in pigs and cattle (4.9 %–12.2 %). Cefotaxime resistance was low in pigs and cattle (1.4 % and 2.4 %, respectively), and moderate in isolates from Gallus gallus (10.2 %), considering all reporting MSs. At the MS level, resistance to cefotaxime in indicator E. coli showed wider variation in some species or production types, for example ranging between 0 % and 13.5 % in broilers.
• Indicator E. coli from meat from Gallus gallus, pigs and cattle showed moderate or high levels of resistance to ampicillin, sulfonamides and tetracyclines, considering all reporting MSs. Resistance to cefotaxime was 3 % or less in E. coli from meat from all three animal species and for all reporting MSs.
• In general, resistance to third-generation cephalosporins in E. coli was higher than that observed in Salmonella spp. (in which resistance was sometimes not detected) for the same species of animals, which is consistent with the hypothesis that E. coli may provide a reservoir of cephalosporin resistance genes for organisms such as Salmonella.
• Multi-resistance was high in indicator (commensal) E. coli isolates from animals in some countries reporting isolate-based data; however, co-resistance to the clinically important antimicrobials, ciprofloxacin and cefotaxime, was generally reported at very low to low levels. Considering the E. coli for which isolate-based data was available, ciprofloxacin ‘microbiological resistance’ was a frequent component of MDR patterns in E. coli from broilers occurring in 72.3 % of isolates, whereas it occurred in 16.0 % of MDR patterns in isolates from pigs.
2.2. Zoonotic and indicator agent-specific summaries
2.2.1. Salmonella The Salmonella spp. data presented in this report comprise results for all reported Salmonella serovars which have been amalgamated to represent the overall occurrence of antimicrobial resistance in Salmonella within humans and the various animal and food categories. The differences in the distribution and prevalence of particular serovars and phage types of Salmonella in different countries and in different animal species, and their associated patterns of resistance, may explain some of the differences in the levels of

EU summary report on antimicrobial resistance in zoonotic and indicator bacteriafrom humans, animals and food 2012
EFSA Journal 2014;12(3):3590 17
antimicrobial resistance observed as well as in those of multi-resistance. The spread of particularly resistant clones, and the occurrence of resistance genes within these clones, can be exacerbated by the use of antimicrobials in the human and animal populations and the selective pressure this exerts. Other factors, such as foreign travel by humans, international food trade, animal movements, farming systems, animal husbandry and the pyramidal structure of some types of animal primary production can also influence the spread of resistant clones.
In addition to the amalgamated data for Salmonella spp., resistance data for the most numerous Salmonella serovars in humans, S. Enteritidis, S. Typhimurium and monophasic S. Typhimurium, were analysed separately.
2.2.1.1. In humans
In 2012, 19 MSs and two non-MSs provided information on antimicrobial resistance in Salmonella isolates from cases of salmonellosis in humans.
The reported data represented 25.6 % of the confirmed salmonellosis cases reported in the EU/European Economic Area (EEA) in 2012. ‘Clinical resistance’ in human Salmonella isolates was high for ampicillin (27.6 %), streptomycin (23.6 %), sulfonamides (28.9 %) and tetracyclines (30.0 %), and moderate for nalidixic acid (14.4 %), and high levels of multi-resistance were observed in some countries (28.9 % overall). For these first four antimicrobials this was largely a result of the high to extremely high resistance levels observed among S. Typhimurium and monophasic S. Typhimurium isolates. However, more than half of all isolates tested were susceptible to the complete range of antimicrobials in the human data collection. In addition, the resistance to the clinically important antimicrobials, ciprofloxacin and cefotaxime, was on average relatively low (5.1 % and 1.1 %, respectively), although in the case of ciprofloxacin, markedly higher in countries using more sensitive interpretive criteria such as EUCAST ECOFFs. Co-resistance to ciprofloxacin and cefotaxime among isolates was very low (0.2 %). Resistance to quinolones (ciprofloxacin and nalidixic acid) was generally higher in S. Enteritidis isolates than in S. Typhimurium isolates.
When assessed by geographical region, Salmonella spp. isolates acquired within the EU/EEA countries exhibited greater resistance to ampicillin, sulfonamides, streptomycin and tetracyclines, while the highest levels of resistance to ciprofloxacin were observed in isolates from cases that had travelled in Asia, Africa or European countries outside of the EU/EEA.
2.2.1.2. In animals and food
In 2012, information on antimicrobial resistance in Salmonella isolates from animals and food was reported by 19 MSs and two non-MSs.
Among Salmonella spp. isolates from Gallus gallus, the resistance level to tetracyclines, ampicillin and sulfonamides in all reporting MSs was at a high level, 25.9 %, 21.2 % and 28.3 %, respectively. Resistance to ciprofloxacin and nalidixic acid was higher (37.3 % and 34.3 %, respectively), for all reporting MSs. In general, there were large variations in the levels of resistance to these antimicrobials between different reporting MSs. The occurrence of resistance to cefotaxime in all reporting MSs was low, at 4.5 %.
For the second year, data were presented at the production-type level, where possible, throughout the report. In 2012, 13 MSs reported quantitative data from broilers, and 12 MSs reported quantitative data from laying hens. In general, the levels of resistance in this production type were slightly higher in isolates from broilers than those reported when all Gallus gallus production types were considered for isolates from layers or breeding flocks. Twelve MSs reported quantitative data from laying hens in 2012, and in contrast to the data from broilers, the levels of resistance in this production type were lower than those reported when all Gallus gallus were considered. Quantitative data on isolates of Salmonella spp. from breeding flocks of Gallus gallus were reported by four MSs in 2012 and the levels of resistance among isolates from breeding flocks of Gallus gallus were generally higher than those observed in laying hens but lower than in isolates from broilers.
Multi-resistance levels (reduced susceptibility to at least three different antimicrobial classes using ECOFFs) were generally high in Salmonella spp. isolates from broilers and moderate in those from laying hens. In general, co-resistance to ciprofloxacin and cefotaxime was low, and not detected when using CBPs.

EU summary report on antimicrobial resistance in zoonotic and indicator bacteriafrom humans, animals and food 2012
EFSA Journal 2014;12(3):3590 18
Some MSs showed statistically significant increasing trends in resistance among Salmonella spp. isolates from Gallus gallus over the years 2006 to 2012, whereas other MSs exhibited decreasing trends. Statistically significant decreasing trends were more frequently observed than significant increasing trends. Two MSs demonstrated a significant increasing trend for ciprofloxacin and nalidixic acid ‘microbiological resistance’ and one a decreasing trend for both antimicrobials. In particular, resistance to cefotaxime remained generally low, very low or absent in reporting MSs between 2006 and 2012.
Resistance in S. Enteritidis was lower than in Salmonella spp. isolates from Gallus gallus. In S. Enteritidis, the occurrence of resistance for all reporting MSs was 3.3 % for tetracyclines, 5.5 % for ampicillin and 4.3 % for sulfonamides, whereas the level of ‘microbiological resistance’ to ciprofloxacin and nalidixic acid was 23.9 % and 22.2 %, respectively.
In Salmonella spp. isolates from broiler meat, resistance levels for all reporting MSs for tetracyclines and sulfonamides were high and very high at 48.9 % and 53.0 %, respectively. ‘Microbiological resistance’ to ciprofloxacin and nalidixic acid resistance was also very high, with overall resistance levels of 63.1 % and 57.3 %, respectively. The resistance level for cefotaxime was low, at 4.3 %.
Among Salmonella spp. isolates from turkeys, the level of resistance to tetracyclines, ampicillin and sulfonamides in all reporting MSs was very high at 66.7 %, 56.5 % and 58.9 %, respectively. The levels of resistance to ciprofloxacin and nalidixic acid were also very high and high, at 59.9 % and 42.0 %, respectively, for all reporting MSs. Often, there were large variations in the levels of resistance to these antimicrobials among the different reporting MSs. The occurrence of resistance to cefotaxime in all reporting MSs was very low, at 0.8 %. Five MSs reported quantitative data from fattening turkeys and, in general, the levels of resistance in this production type were slightly higher than those reported when all turkey production types were considered. Multi-resistance was generally very high in Salmonella spp. isolates from turkeys; however, co-resistance to ciprofloxacin and cefotaxime (interpreted using CBPs) was not detected.
For Salmonella spp. isolates from pigs, resistance levels in the reporting group of MSs were very high: 63.3 % for tetracyclines and sulfonamides, and 60.2 % for ampicillin. Ciprofloxacin and nalidixic acid ‘microbiological resistance’ levels remained low, at 7.6 % and 5.8 %, respectively, and the level of resistance to cefotaxime was also low, at 2.3 % overall. Five MSs reported quantitative data from fattening pigs and the levels of resistance in this production type were lower than those reported when all pig production types were considered. Resistance to tetracyclines, ampicillin and sulfonamides was common in Salmonella spp. from pig meat, 49.2 %, 47.5 % and 53.5 %, respectively, considering all reporting MSs. ‘Microbiological resistance’ to ciprofloxacin and nalidixic acid was at a low level (7.6 % and 4.2 %, respectively) and cefotaxime resistance was very low, at 0.9 %. The trends in resistance observed in Salmonella spp. isolates from pigs over the years 2006 to 2012 remained stable in some countries, while fluctuation was observed in others. Among the few statistically significant national trends, slightly more decreasing trends were observed than increasing ones. However, it is noteworthy that ‘microbiological resistance’ to cefotaxime remained generally low, very low or absent in reporting MSs over the period 2006 to 2012. Multi-resistance was generally very high in Salmonella spp. isolates from fattening pigs; however, co-resistance to ciprofloxacin and cefotaxime was not detected when using CBPs.
Among Salmonella spp. isolates from cattle, the occurrence of resistance to tetracyclines, ampicillin and sulfonamides in all reporting MSs was high, at 36.0 %, 34.5 % and 42.4 %, respectively. The level of resistance to ciprofloxacin and nalidixic acid was low, 9.1 % for both, for all reporting MSs, while cefotaxime resistance was observed among the reporting MSs at a very low level (0.4 %). Although variation was observed between MSs in the level of resistance to some antimicrobials, overall trends in resistance between 2006 and 2012 were mainly decreasing ones among Salmonella spp. from cattle. Variability between MSs was observed in multi-resistance levels in Salmonella spp. isolates from cattle; however, co-resistance to ciprofloxacin and cefotaxime was not detected when using CBPs. The few statistically significant trends observed in resistance levels among Salmonella isolates from cattle were all decreasing ones.
With respect to detailed analyses of MDR in Salmonella serovars, high-level resistance to ciprofloxacin in S. Kentucky was identified in isolates from broilers, laying hens and turkeys. S. Kentucky with high-level ciprofloxacin resistance was also detected in meat from turkeys and in meat from broilers. S. Kentucky isolates showing high-level resistance to ciprofloxacin are likely to belong to the clone of S. Kentucky sequence type 198, which recently emerged in North Africa and the Middle East exhibiting such resistance and which has subsequently been detected in poultry in some European countries.

EU summary report on antimicrobial resistance in zoonotic and indicator bacteriafrom humans, animals and food 2012
EFSA Journal 2014;12(3):3590 19
S. Infantis showing high-level ciprofloxacin resistance, together with resistance to a core antimicrobial pairing of sulfonamides and tetracyclines (but with other resistances which were not invariably present in all high-level ciprofloxacin S. Infantis isolates) was detected in meat from broilers, pig meat and broilers. The occurrence of S. Infantis with this resistance pattern in several MSs and in different types of animal or meat probably indicates that either a clone of S. Infantis showing such resistance has spread within Europe or that several clones have gained such high-level ciprofloxacin resistance independently. In addition to showing high-level ciprofloxacin resistance, S. Infantis also featured as a serovar displaying ‘pentavalent’ resistance that is resistance to ampicillin, chloramphenicol, streptomycin, sulfonamides and tetracyclines. A small number of serovars displayed this resistance phenotype which is potentially significant because certain Salmonella serovars which have shown epidemic spread have shown such pentavalent resistance in the past. Although a relatively low number of serovars were detected showing such pentavalent resistance, these included several important serovars relevant to public health, including, for example, S. Saintpaul, as well as S. Typhimurium.
Resistance to ampicillin, chloramphenicol, streptomycin, sulfonamides, tetracyclines and trimethoprim was not detected in isolates of S. Enteritidis from animals or meat for which isolate-based data was available. This pattern of resistance has previously been reported in human S. Enteritidis isolates which possess a combined virulence-resistance plasmid; such strains cause human infections of increased severity. The absence of certain resistance phenotypes can therefore be just as significant as the detection of resistance in evaluating the current situation in Europe.
Considering monophasic S. Typhimurium, the MDR results assist in tracking the increasing spread of this Salmonella serovar. Different clones have been identified and using the MDR information it is possible to presumptively identify each clone. The so-called ‘Spanish clone’ is resistant to ampicillin, chloramphenicol, gentamicin, streptomycin, sulfonamides, tetracyclines and trimethoprim, whereas the ‘US clone’ is fully susceptible and the ‘European clone’ is resistant to ampicillin, streptomycin, sulfonamides and tetracyclines. The pattern associated with the Spanish clone was only seen in 1.8 % (5 out of 279) isolates from fattening pigs, where the pattern associated with the European clone was much more frequently detected.
2.2.2. Campylobacter
2.2.2.1. In humans
Overall, 14 MSs and one non-MS provided information on antimicrobial resistance in isolates from campylobacteriosis cases in humans for the year 2012.
Data from antimicrobial susceptibility testing represented 17.9 % of the total confirmed campylobacteriosis cases reported in the EU/EEA in 2012. Fewer countries reported results for Campylobacter than for Salmonella. The variety of methods and interpretive criteria used by MSs in antimicrobial susceptibility testing for Campylobacter was still large, even though some harmonisation towards the use of EUCAST CBPs could be observed. The launch of CBPs for disc diffusion by EUCAST in 2012 will most likely facilitate this harmonisation further, as many countries use disc diffusion for testing of human isolates.
The ‘clinical resistance’ levels in human Campylobacter isolates were highest for nalidixic acid (48.8 %) and ciprofloxacin (47.4 %) followed by ampicillin (36.4 %) and tetracyclines (32.4 %), with high levels of multi-resistance observed in some countries. Resistance to the clinically important antimicrobial erythromycin was low overall (3.1 %), but moderately high in C. coli (15.1 %), although the number of isolates of this species tested was small.
Sufficient data were available for levels of resistance to be compared by geographical region for ciprofloxacin, erythromycin, nalidixic acid and tetracyclines. Isolates acquired in EU/EEA countries had the lowest frequency of resistance to all these antimicrobials, with resistance to both ciprofloxacin and erythromycin notably lower than in isolates acquired in Asia and Africa. However, the number of isolates tested that originated from infections acquired outside of the EU/EEA was very low.
2.2.2.2. In animals and food
In 2012, 15 MSs and one non-MS reported quantitative MIC data for Campylobacter isolates from food and animals. Five MSs additionally reported qualitative data where the method of testing was not specified; however, these data are not presented in the report. When considering all host species, the highest levels of resistance were seen for the (fluoro)quinolones (ciprofloxacin and nalidixic acid) and tetracyclines.

EU summary report on antimicrobial resistance in zoonotic and indicator bacteriafrom humans, animals and food 2012
EFSA Journal 2014;12(3):3590 20
Resistance to erythromycin and gentamicin was comparatively low among Campylobacter isolates from food and animals. Resistance was generally higher in C. coli than in C. jejuni from the same host species (Gallus gallus).
For C. jejuni isolates from Gallus gallus, resistance was high for ciprofloxacin (44.1 %), nalidixic acid (41.4 %) and tetracyclines (34.1 %), while levels of resistance to erythromycin and gentamicin were very low, at 0.4 % and 0.7 %, respectively. A similar pattern was seen for C. coli isolates from Gallus gallus; however, levels of resistance were higher overall. Levels of resistance to ciprofloxacin, nalidixic acid and tetracyclines were extremely high at 78.4 %, 75.7 % and 73.1 %, respectively, while levels of resistance to erythromycin and gentamicin were moderate (11.2 %) and low (4.1 %), respectively.
Multi-resistance (reduced susceptibility to at least three antimicrobial classes according to ECOFFs) was very low, low or not detected in C. jejuni isolates from broilers, and co-resistance to the clinically important antimicrobials ciprofloxacin and erythromycin in the same isolates was either not detected or recorded at low levels in the reporting MSs. The situation was different for C. coli from broilers where multi-resistance as a percentage of all isolates received by the individual MSs ranged from 3.0 % to 55.6 % and co-resistance to ciprofloxacin and erythromycin ranged from 0 % to 22.2 %.
Although resistance to ciprofloxacin and nalidixic acid in Gallus gallus varied greatly among reporting MSs over the period 2006 to 2012, some statistically increasing trends in resistance to these antimicrobials were observed for several MSs, both for C. jejuni and C. coli.
For C. jejuni isolates from broiler meat, resistance, considering all reporting MSs, ranged from high to very high for ciprofloxacin (59.5 %), nalidixic acid (57.9 %) and tetracyclines (47.5 %), while levels of resistance to erythromycin and gentamicin ranged from low to very low at 1.8 % and 0.7 %, respectively. A similar pattern was seen for C. coli isolates from broiler meat; however, levels of resistance were higher overall. Levels of resistance to ciprofloxacin and nalidixic acid were extremely high at 82.7 % and 81.0 %, respectively, very high for tetracyclines at 57.3 %, moderate for erythromycin at 16.5 % and low for gentamicin at 1.7 %.
C. coli isolates from pigs were derived from fattening pigs (one MS did not specify the production level). Resistance to ciprofloxacin, nalidixic acid and tetracyclines ranged from high to extremely high at 32.0 %, 31.6 % and 76.8 %, respectively. Resistance was high to erythromycin (23.9 %) and low to gentamicin (2.9 %). Resistance to ciprofloxacin and/or nalidixic acid in C. coli from pigs showed a significantly increasing trend in three reporting MSs over the period 2006 to 2012.
Multi-resistance (reduced susceptibility to at least three antimicrobial classes according to ECOFFs) varied greatly in occurrence with C. coli isolates from pigs from the different MSs, ranging from 3.9 % to 97.3 %. Co-resistance to the clinically important antimicrobials, ciprofloxacin and erythromycin, was low for three reporting countries, ranging from 2.9 % to 9.4 %, but extremely high in one MS at 76.7 %.
C. jejuni isolates from cattle were also considered. Overall, resistance was high for ciprofloxacin (32.9 %), nalidixic acid (32.5 %) and tetracyclines (43.5 %), while resistance to erythromycin and gentamicin was very low at 0.6 % and 0.2 %, respectively. No statistically significant trends in ciprofloxacin and nalidixic acid resistance were observed in any of the reporting countries, but erythromycin resistance significantly decreased statistically in the Netherlands over the period 2006 to 2012.
Multi-resistance (reduced susceptibility to at least three antimicrobial classes according to ECOFFs) ranged from 0 % to 12.3 % in C. jejuni isolates from cattle from the reporting MSs. Co-resistance to the clinically important antimicrobials, ciprofloxacin and erythromycin, was low or not detected.
2.2.3. Indicator (commensal) Escherichia coli
Eleven MSs and two non-MSs reported quantitative data on antimicrobial resistance in indicator E. coli isolates from animals and food in 2012. Most of the data related to isolates from Gallus gallus, pigs and cattle; four MSs reported results for meat derived from each of those species.
Indicator E. coli from meat from Gallus gallus, pigs and cattle showed high or very high levels of ‘microbiological resistance’ to ampicillin, sulfonamides and tetracyclines, considering all reporting MSs. Resistance was less than 4 % to gentamicin, less than 3 % to cefotaxime and less than 7 % to

EU summary report on antimicrobial resistance in zoonotic and indicator bacteriafrom humans, animals and food 2012
EFSA Journal 2014;12(3):3590 21
chloramphenicol for all reporting MSs and for meat from all three animal species. The levels of resistance were therefore broadly similar for meat from broilers, pigs and bovine animals for all reporting MSs for these antimicrobials. The situation was different for ciprofloxacin and nalidixic acid, where ‘microbiological resistance’ was high in meat from broilers considering all reporting MSs at 29.1 % and 24.1 %, respectively, but low in meat from pigs and cattle at less than 7 %.
Most data on Gallus gallus referred to broilers, although two MSs provided data on E. coli from laying hens. Resistance levels were in general higher among E. coli from broilers than from laying hens. Regarding broilers, the highest overall ‘microbiological resistance’ levels observed at the reporting MS group level were to ciprofloxacin (52.7 %), ampicillin (50.4 %), sulfonamides (45.4 %), tetracyclines (43.3 %), nalidixic acid (43.2 %) and streptomycin (38.4 %). The isolates from laying hens also most commonly showed reduced susceptibility to these antimicrobials, but resistance levels were lower, ranging between 10.1 % and 43.3 %. Resistance to cefotaxime was low in both broilers (6.2 %) and layers (6.0 %). There was substantial variation in the level of resistance to these antimicrobials between reporting MSs. Countries mostly reported relatively stable resistance in E. coli isolates from Gallus gallus between 2006 and 2012. However, statistically significant trends in resistance to all of these antimicrobials, except tetracyclines, have been identified: these trends have more commonly been increasing ones than decreasing ones.
Concerning indicator E. coli isolates from pigs, the highest overall ‘microbiological resistance’ levels in the reporting group of MSs were observed for tetracyclines (54.7 %), streptomycin (50.3 %), sulfonamides (41.7 %) and ampicillin (29.5 %). Resistance to both ciprofloxacin and nalidixic acid was low at 7.5 % and 4.9 %, respectively. Overall, only 1.4 % of isolates were resistant to cefotaxime. There were large differences in the occurrence of resistance between MSs. There were fewer statistically significant trends than in isolates from Gallus gallus. No significant trends were observed for cefotaxime.
Multi-resistance levels (reduced susceptibility to at least three antimicrobial classes according to ECOFFs) were generally high in indicator E. coli isolates from broilers and pigs, and in a number of reporting countries. Co-resistance/reduced susceptibility to the clinically important antimicrobials, ciprofloxacin and cefotaxime, was also detected in very few isolates from these species.
In the reporting group of MSs, resistance levels in indicator E. coli isolates from cattle were generally lower than among isolates from Gallus galllus and pigs. The highest resistance levels observed were to tetracyclines (30.6 %), sulfonamides (28.3 %), streptomycin (25.1 %) and ampicillin (24.5 %). ‘Microbiological resistance’ to ciprofloxacin was moderate, at 12.2 %, and resistance to nalidixic acid was low, at 8.6 %. Overall, only a few isolates (2.4 %) expressed resistance to cefotaxime. The occurrence of resistance was variable between MSs for most of the antimicrobials. As for Salmonella, some MSs presented data at the production-type level for cattle, although only three MSs did so. One of these MSs reported much higher resistance among younger animals, mainly fattening veal calves, compared with older cattle, mainly adult cows, but this was not observed in the other countries. There have been numerous statistically significant trends in resistance since 2006, mainly of a decreasing nature.
Strains of E. coli are not separated on phenotypic characteristics (e.g. serotype) in the current monitoring programme and a less detailed analysis is therefore possible than for Salmonella where isolates can be sub-divided by serovar. The common core patterns of ‘microbiological resistance’ to ampicillin, streptomycin, sulfonamides, tetracyclines and trimethoprim (and combinations thereof) frequently observed in the monitoring of E. coli isolates are probably related to the presence of class 1 or class 2 integrons, which generally carry genes conferring resistance to these antimicrobials. A common core of ‘microbiological resistance’ to ampicillin, sulfonamides and tetracyclines, generally with ‘microbiological resistance’ to ciprofloxacin and frequently with such resistance to streptomycin and trimethoprim, was discernible in broilers. However, no single pattern or patterns of ‘microbiological resistance’ occurred at a high frequency in broilers. In fattening pigs, two MDR patterns were predominant (streptomycin, sulfonamides, tetracyclines and streptomycin, sulfonamides, tetracyclines, ampicillin and trimethoprim) and each accounted for more than 5 % of the total number of E. coli isolates from fattening pigs for which isolate-based data were available. Ciprofloxacin resistance (microbiological) frequently occurred as a component of MDR in E. coli from broilers and was observed in 72.3 % of MDR isolates (120 out of 166), whereas ‘microbiological resistance’ to ciprofloxacin occurred infrequently as a component of MDR in pigs and was present in 16.0 % (32 out of 200) of porcine MDR in E. coli isolates.

EU summary report on antimicrobial resistance in zoonotic and indicator bacteriafrom humans, animals and food 2012
EFSA Journal 2014;12(3):3590 22
2.2.4. Methicillin-resistant Staphylococcus aureus
A low number of MSs reported the results of monitoring food for methicillin-resistant Staphylococcus aureus (MRSA). MRSA was detected in meat from broilers, turkeys, pigs and bovine animals. Some MSs also examined products such as fish and fruit and detected MRSA in a low number of such products. The occurrence of MRSA in meat and products derived from animals may reflect colonisation of those animals with MRSA; however, the occurrence of MRSA in products such as fish and fruit may also reflect contamination from human personnel who may be colonised with MRSA involved in the preparation of such foods. Strain typing would probably assist in elucidating the likely origin of MRSA isolates in these samples. Some MSs undertook comprehensive monitoring at various stages along the food chain revealing interesting differences in the occurrence of MRSA at different stages of food production.
In relation to healthy food-producing animals, MRSA was detected in meat-producing turkey flocks, but not in breeding flocks in one MS. There was a large degree of variation between MSs in the occurrence of MRSA in pigs, with one MS not detecting MRSA in a farm-based national survey, whilst another MS reported that 99 % of animals were positive in slaughterhouse monitoring. Three MSs examined cattle for MRSA; the number of animals which were positive in sampling on farms for one MS was considerably lower than when calves were sampled at slaughter. The occurrence of MRSA in dairy cows in this MS (9.9 %) was similar to the occurrence in calves under one year old (10.2 %), both types of animals being sampled on farms. In calves under one year old monitored at slaughterhouse through sampling of nasal swabs, the occurrence of MRSA ranged from 45.0 % to 47.1 %. Sheep and goats were investigated by one MS and no MRSA was detected. Molecular typing data was reported by one MS in relation to isolates from cattle; the majority of isolates were spa-type t011 belonging to MRSA clonal complex (CC) 398, the common livestock-associated type of MRSA occurring in Europe.
Several MSs reported results of clinical investigations which yielded MRSA in food-producing animals and companion animals. MRSA was detected in cats, dogs and horses in one MS as well as in clinical diagnostic samples from pigs.
Temporal trends in the occurrence of MRSA in animals could be assessed for two MSs and one non-MS. Monitoring of sheep and goats on farms in 2011 and 2012 in one MS did not reveal the presence of MRSA in these animals in either year. A further MS monitored calves under one year old on the farms in 2010 and 2012 and reported similar numbers of animals positive for MRSA in each year (19.6 % and 19.2 %, respectively). The same MS also reported results on the occurrence of MRSA in meat production turkeys, at the farm in 2010 and 2012. The prevalence reported was moderate in both years (19.6 % in 2010 and 12.8 % in 2012). One non-MS reported data on the occurrence of MRSA in fattening pigs at slaughter through the monitoring of nasal swabs in consecutive years from 2009 to 2012. The numbers of animals positive for MRSA showed a slow increase over this period from 2.2 % in 2009 to 18.1 % in 2012. Molecular typing data were also available for these MRSA isolates, the majority of which belonged to spa-type t034, CC398, while much lower numbers of MRSA sequence type ST 49 were reported.

EU summary report on antimicrobial resistance in zoonotic and indicator bacteriafrom humans, animals and food 2012
EFSA Journal 2014;12(3):3590 23
3. ANTIMICROBIAL RESISTANCE IN SALMONELLA
3.1. Introduction
Salmonella is an important zoonotic pathogen of economic significance in both humans and animals. The genus Salmonella is divided into two species: S. enterica and S. bongori. There are six sub-species of S. enterica and most Salmonella belong to the sub-species S. enterica subsp. enterica. Salmonella are further sub-divided into serovars based on the serological reactions of their somatic O-antigens and flagellar H-antigens. Different serovars have often been named based on the location where the serovar was first isolated. In this report, the organisms are identified by genus followed by serovar, e.g. S. Typhimurium. There are more than 2,500 serovars of zoonotic Salmonella which have been recognised, and the prevalence of these different serovars can change over time.
Human salmonellosis is usually characterised by the acute onset of fever, abdominal pain, nausea and sometimes vomiting. The majority of Salmonella infections result in mild, self-limiting, gastrointestinal illness and usually do not require antimicrobial treatment. In some patients the infection may be more serious and the associated dehydration can be life threatening. Invasive disease, such as Salmonella bacteraemia or meningitis, can occur in a smaller sub-set of patients, with a higher risk in patients who are immuno-compromised. In cases of severe enteric disease, or when Salmonella invades and causes a bloodstream infection, effective antimicrobials are essential for treatment and can be life saving. The treatment of choice for Salmonella infection is fluoroquinolones for adults and third-generation cephalosporins for children. Resistance in Salmonella to these first-line treatments, resulting in infections with antimicrobial-resistant strains, may cause treatment failure, which in turn can lead to more severe outcomes in patients. Salmonellosis has also been associated with long-term or chronic sequelae, e.g. reactive arthritis.
The common reservoir of non-typhoidal Salmonella strains is the intestinal tract of a wide range of domestic and wild animals. A wide variety of food stuffs of both animal and plant origin can be contaminated with Salmonella, which may cause infection in humans. Transmission usually occurs when the bacteria are introduced during food preparation or are allowed to multiply in food (for example because of inadequate storage temperature, inadequate cooking or cross-contamination of ready-to-eat food and uncooked food). Salmonella may also be transmitted through direct contact with infected animals or humans, or by contact with contaminated environments.
Overall, considering all Salmonella infections in the EU, S. Enteritidis and S. Typhimurium are the serovars most frequently associated with human illness. S. Enteritidis cases in humans are most commonly associated with the consumption of contaminated eggs and poultry meat, while S. Typhimurium cases are mostly associated with the consumption of contaminated pig, bovine and poultry meat.
In animals, particularly in certain species, sub-clinical infections or healthy carriage can be common. The organism may spread rapidly and easily between animals in a herd or flock without the animals showing any clinical signs in some cases and animals may become intermittent or persistent carriers. In other species, clinical disease may occur following Salmonella infection and, in particular, cattle may succumb to fever, diarrhoea and abortion following infection, particularly with some serovars such as S. Dublin. In calves, Salmonella can cause outbreaks of diarrhoea with high mortality. Fever and diarrhoea are less common in pigs than in cattle and sheep and poultry may also show no signs of infection.
Salmonella spp. comprise the amalgamated results for all Salmonella serovars reported by a MS. In the case of sampling in animals performed in accordance with EFSA’s recommendations (EFSA, 2007) and related to National Salmonella Control Programmes (NCP), there is a defined method of selecting isolates for inclusion in the monitoring. The relative contribution of different serovars possessing a particular resistance should ideally be considered when interpreting the results, in order to evaluate the influence of clonal dissemination of serovars. If a MS has reported the susceptibility of particular serovars and excluded others, then this would introduce a source of bias in the susceptibility figures relating to Salmonella spp.

EU summary report on antimicrobial resistance in zoonotic and indicator bacteriafrom humans, animals and food 2012
EFSA Journal 2014;12(3):3590 24
3.2. Overview of reported resistance data in Salmonella from humans, animals and food
Nineteen MSs, as well as Iceland and Norway, provided data for 2012 on human Salmonella isolates. Countries reported qualitative data (i.e. interpreted antibiotic susceptibility testing (AST) results for tested isolates; susceptible (S), intermediate (I) or resistant (R)) with the exception of Norway, which used the isolate-based reporting under piloting at ECDC to report measured IZDs. Twenty MSs and two non-MSs (Norway and Switzerland) reported quantitative MIC and disc inhibition zones data on the antimicrobial resistance of Salmonella isolates recovered from animals and food in 2012. Table SA1 presents an overview of the MSs reporting on antimicrobial resistance, either MIC or IZD data, on Salmonella spp. from humans and various animal and food categories in 2012.
Table SA1. Overview of countries reporting antimicrobial resistance data using MICs and disc diffusion inhibition zones on Salmonella spp. (all serovars) from humans and various animal and food categories in 2012
Method Origin Total number of MSs reporting Countries
Diffusion
Human 12 MSs: AT, EE, ES, FR, GR, HU, IT, LU, LT, RO, SI, SK 2 Non-MSs: IS, NO
Gallus gallus (fowl) 1 MS: GR Meat from broilers (Gallus gallus) 1 MS: GR
Meat from pigs 1 MS: GR
Dilution
Human 10 MSs: DE, DK, FR, HU, IE, MT, NL, RO, SK, UK
Gallus gallus (fowl) 18 MSs: AT, BE, CZ, DE, DK, ES, FI, HU, IE, IT, LV, NL, PL, PT, RO, SK, SE, UK Non-MS: CH
Turkeys 13 MSs: AT, BE, CZ, DE, ES, FI, HU, IE, IT ,PL, PT, SK, UK
Pigs 16 MSs: BE, CZ, DE, DK, EE, ES, FI, HU, IE, IT, LV, NL, PL, RO, SK, SE Non-MS: CH
Cattle (bovine animals) 12 MSs: BE, CZ, DK, EE, ES, FI, DE, IE, IT, LV, NL, SE Non-MSs: NO, CH
Meat from broilers (Gallus gallus) 14 MSs: BE, CZ, DE, EE, ES, HU, IE, IT, LV, NL, PL, PT,
RO, SK Meat from turkeys 10 MSs: CZ, DE, EE, HU, IE, IT, LV, PL, PT, SK
Meat from pigs 14 MSs: BE, CZ, DE, DK, EE, ES, HU, IE, IT, LV, NL, PL, RO, SK
Meat from bovine animals 9 MSs: CZ, DE, EE, ES, FI, HU, IE, IT, NL MIC: minimum inhibitory concentration. Note: for abbreviations of Member States (MS) and other reporting countries see Appendix 7.

EFSA Journa
3.3. Antim
METHODSSALMONE
The methobetween (AST) of Centre forreference Salmonellthe ClinicaEuropean a combinantimicrobStates appbreakpoin
Of the 10concentrafor four: ceis three dCLSI cliniinterpretedhave usedresistance
Figure SAinterpret animals o
MIC: minimuNote: CLSI (
al 2014;12(3):
microbial re
S AND INTEELLA ISOLAT
od of testingcountries. TSalmonella r Disease P
laboratoriesa (and Camal and LaboCommittee
nation of EUbials includedplied epidem
nts.
0 antimicrobition values oefotaxime, ci
dilution steps ical breakpod with cautiod the same e are likely to
A1. Compaminimum i
or food
um inhibitory con(M100-S22 2012
E
:3590
esistance in
ERPRETIVE CTES FROM HU
g for antimicrThe methods
are presentPrevention ans to harmon
mpylobacter). oratory Standon Antimicro
UCAST andd in the ASTmiological cu
ials reportedor zone diamiprofloxacin, lower than
oint (Figure on and no dimethod ove
o be valid, alt
arison of cinhibitory c
ncentration. 2), EUCAST clin
EU summary r
n Salmonel
CRITERIA USUMANS
robial susceps and interpted in Table nd Control (Enise the guiWhile nine
dards Instituobial Suscepd CLSI (sincT for Salmoneut-off values
d from bothmeters differ m
gentamicin athe EUCASSA1). The
irect comparer the time pthough sensi
linical breaconcentratio
nical breakpoint
report on antim
lla isolates
SED FOR A
ptibility and tpretive criteri
MM1 ChapECDC) is woidelines andof the reporte (CLSI), tw
ptibility Testince EUCASTella). Five co(ECOFFs) f
human andmarkedly beand trimethoT clinical breresults for
rison betweeperiod coveritivity may va
akpoints anon data rep
ts (2011), EUCA
microbial resi
s from hum
ANTIMICROBI
the selectionia used for
pter 8. Materorking togethd interpretiverting countriewo countriesng (EUCASTT do not prountries usedfrom EUCAS
d animal/foodtween the cli
oprim. In parteakpoint andthese four
en countries red by the rary dependin
nd epidemioported for
AST ECOFFS (a
istance in zoonfrom huma
mans
IAL SUSCEP
n of the isolaantimicrobia
rials and meher with thee criteria bees in 2012 ws were only T) and an addrovide clinicd other criterST, while the
d isolates, tinical breakpticular, the Ed five dilutionantimicrobiashould be m
report, the trng on the spe
ological cuSalmonella
as by EFSA, 20
notic and indians, animals a
PTIBILITY TE
ates to be tesal susceptibiethods. The
e national pueing used in
were using crusing criteriditional five w
cal breakpoinria. Two of the other appl
the minimumpoints and thECOFF for cipn steps loweals must themade. Whererends in occecific thresho
t-off valuesspp. from
007).
icator bacteriaand food 2012
25
ESTING OF
sted varied ility testing
European ublic health n AST for riteria from ia from the were using nts for all he Member lied clinical
m inhibitory he ECOFFs profloxacin er than the erefore be e countries currence of olds used.
s used to m humans,
a2
5

EU summary report on antimicrobial resistance in zoonotic and indicator bacteriafrom humans, animals and food 2012
EFSA Journal 2014;12(3):3590 26
3.3.1. Antimicrobial resistance in Salmonella spp. in humans
In total, 23,625 Salmonella spp. isolates were tested by the 19 reporting MSs, as well as Iceland and Norway, for resistance to one or more antimicrobials, representing 25.6 % (N=92,443) of all confirmed human salmonellosis cases reported in the EU/EEA in 2012. Levels of resistance are only shown when at least 20 isolates are tested. The number of antimicrobials tested per isolate varied by country. Ampicillin and ciprofloxacin were tested by all 19 MSs and 2 non-MSs, while sulfonamides were only tested by 15 MSs and 1 non-MS. Please note that the Danish data were excluded from Table SA2 since Denmark only reported data for S. Typhimurium and monophasic S. Typhimurium and inclusion of these data would have skewed the EU average for Salmonella spp. In order to better assess the impact from food consumed within each reporting country on the antimicrobial resistance levels found in human Salmonella isolates, the analysis focused on domestically-acquired cases. Several countries, however, did not provide information on travel (or non-travel) of their cases. Cases with unknown travel status were therefore also included in the analysis. A separate analysis was made on travel-associated cases by geographical regions.
3.3.1.1. Resistance levels in Salmonella spp. isolates from human cases
The highest average levels of resistance in human Salmonella spp. isolates in 2012 were reported for tetracyclines (30.0 %; N=15,233), sulfonamides (28.9 %; N=14,582), ampicillin (27.6 %, N=18,972) and streptomycin (23.6 %; N=16,643) (Table SA2). However, as in previous years, wide variability in frequencies of resistance to different antimicrobials was observed among the reporting countries. The variability may reflect the differences in the Salmonella population that people are exposed to in different countries, but may also arise due to differences in testing or sampling methods applied by individual countries as well as the use of different interpretive criteria. Sampling bias could also arise by only including isolates from hospitalised cases. This may explain some of the extreme observations.
Resistance levels can also differ substantially between Salmonella serovars and therefore an in-depth analysis is presented separately below for the three most common serovars, S. Enteritidis, S. Typhimurium and monophasic S. Typhimurium 1,4,[5],12:i:-,.
3.3.1.2. Comparison of resistance levels in Salmonella spp. isolates acquired within EU/EEA and in other geographical regions
To compare resistance levels in isolates acquired across the world, isolates from travel-associated cases were classified into seven different geographical regions13 EU/EEA, non-EU/EEA, Africa, Asia, North and Central America, South America and Oceania, based on the probable country of infection. Isolates from non-travel-associated cases were combined with those from cases infected in another EU/EEA country. Please note that the number of isolates tested per region does not necessarily reflect the number of travels to that region. Moreover, only 13 isolates were tested for infections acquired in Oceania and the results for this region should therefore be interpreted with caution.
Varying levels of resistance were observed among Salmonella spp. infections acquired in the different geographical regions (Table SA3). Isolates acquired within EU/EEA countries had the highest level of resistance to ampicillin (27.8 %; N=20,124), streptomycin (23.9 %; N=17,759), sulfonamides (29.2 %; N=15,686) and tetracyclines (30.2 %; N=16,340) of all regions. Resistance levels to ciprofloxacin was however higher in isolates from all other regions and particularly high in isolates originating in Asia (22.7 %; N=1,160), Africa (20.5 %; N=774) and Europe (non-EU/EEA countries) (19.5 %, N=41). Resistance levels to cefotaxime was also higher in isolates acquired in South America (4.8 %; N=21), Africa (2.1 %; N=767) and Asia (1.5 %; N=1,145) compared to the EU/EEA (1.1 %; N=18,949), though only a few isolates were tested from South America (Table SA3).
13 Regional classification from United Nations Statistical Division. Available online http://unstats.un.org/unsd/methods/m49/m49regin.htm
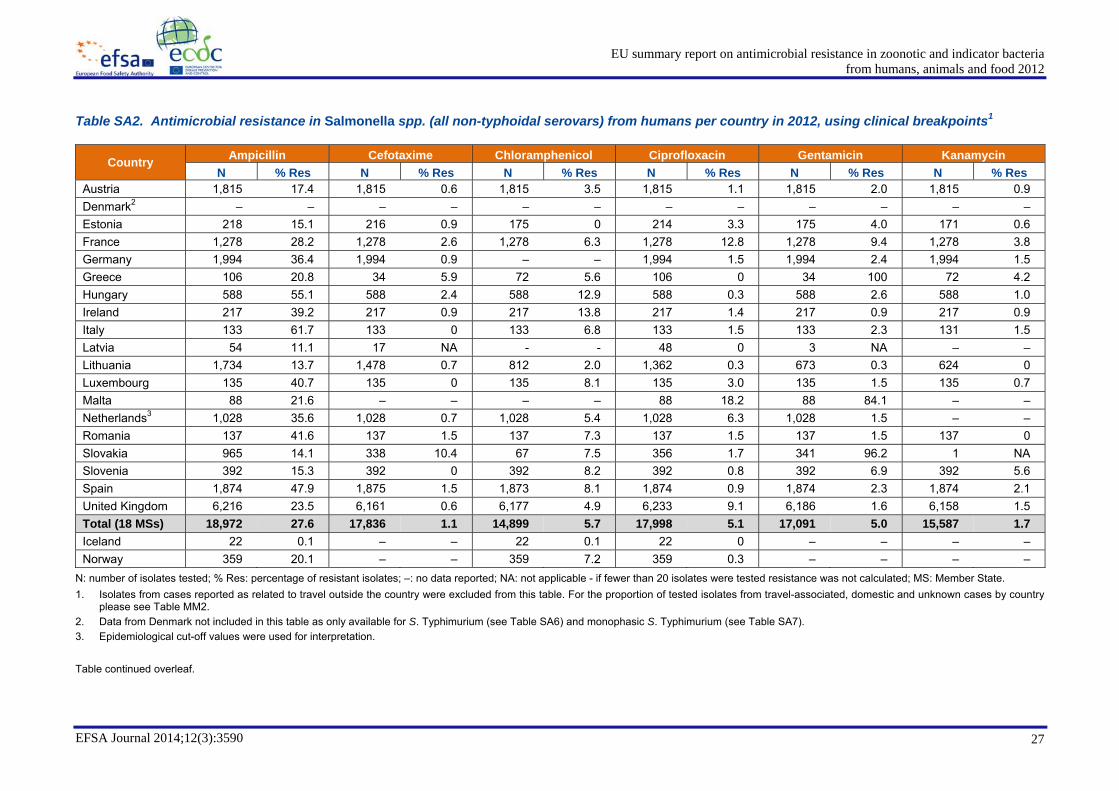
EU summary report on antimicrobial resistance in zoonotic and indicator bacteriafrom humans, animals and food 2012
EFSA Journal 2014;12(3):3590 27
Table SA2. Antimicrobial resistance in Salmonella spp. (all non-typhoidal serovars) from humans per country in 2012, using clinical breakpoints1
Country Ampicillin Cefotaxime Chloramphenicol Ciprofloxacin Gentamicin Kanamycin N % Res N % Res N % Res N % Res N % Res N % Res
Austria 1,815 17.4 1,815 0.6 1,815 3.5 1,815 1.1 1,815 2.0 1,815 0.9 Denmark2 – – – – – – – – – – – – Estonia 218 15.1 216 0.9 175 0 214 3.3 175 4.0 171 0.6 France 1,278 28.2 1,278 2.6 1,278 6.3 1,278 12.8 1,278 9.4 1,278 3.8 Germany 1,994 36.4 1,994 0.9 – – 1,994 1.5 1,994 2.4 1,994 1.5 Greece 106 20.8 34 5.9 72 5.6 106 0 34 100 72 4.2 Hungary 588 55.1 588 2.4 588 12.9 588 0.3 588 2.6 588 1.0 Ireland 217 39.2 217 0.9 217 13.8 217 1.4 217 0.9 217 0.9 Italy 133 61.7 133 0 133 6.8 133 1.5 133 2.3 131 1.5 Latvia 54 11.1 17 NA - - 48 0 3 NA – – Lithuania 1,734 13.7 1,478 0.7 812 2.0 1,362 0.3 673 0.3 624 0 Luxembourg 135 40.7 135 0 135 8.1 135 3.0 135 1.5 135 0.7 Malta 88 21.6 – – – – 88 18.2 88 84.1 – – Netherlands3 1,028 35.6 1,028 0.7 1,028 5.4 1,028 6.3 1,028 1.5 – – Romania 137 41.6 137 1.5 137 7.3 137 1.5 137 1.5 137 0 Slovakia 965 14.1 338 10.4 67 7.5 356 1.7 341 96.2 1 NA Slovenia 392 15.3 392 0 392 8.2 392 0.8 392 6.9 392 5.6 Spain 1,874 47.9 1,875 1.5 1,873 8.1 1,874 0.9 1,874 2.3 1,874 2.1 United Kingdom 6,216 23.5 6,161 0.6 6,177 4.9 6,233 9.1 6,186 1.6 6,158 1.5 Total (18 MSs) 18,972 27.6 17,836 1.1 14,899 5.7 17,998 5.1 17,091 5.0 15,587 1.7 Iceland 22 0.1 – – 22 0.1 22 0 – – – – Norway 359 20.1 – – 359 7.2 359 0.3 – – – –
N: number of isolates tested; % Res: percentage of resistant isolates; –: no data reported; NA: not applicable - if fewer than 20 isolates were tested resistance was not calculated; MS: Member State. 1. Isolates from cases reported as related to travel outside the country were excluded from this table. For the proportion of tested isolates from travel-associated, domestic and unknown cases by country
please see Table MM2. 2. Data from Denmark not included in this table as only available for S. Typhimurium (see Table SA6) and monophasic S. Typhimurium (see Table SA7). 3. Epidemiological cut-off values were used for interpretation. Table continued overleaf.

EU summary report on antimicrobial resistance in zoonotic and indicator bacteriafrom humans, animals and food 2012
EFSA Journal 2014;12(3):3590 28
Table SA2 (continued). Antimicrobial resistance in Salmonella spp. (all non-typhoidal serovars) from humans per country in 2012, using clinical breakpoints1
Country Nalidixic acid Streptomycin Sulfonamides Tetracyclines Trimethoprim N % Res N % Res N % Res N % Res N % Res
Austria 1,815 16.4 1,815 18.5 1,815 17.9 1,815 19.4 1,815 3.3 Denmark2 – – – – – – – – – – Estonia 174 21.3 169 10.7 171 9.9 172 11.0 214 1.4 France 1,278 23.5 1,278 33.2 1,278 36.0 1,278 37.7 1,278 6.6 Germany 1,993 9.9 1,994 43.5 – – – – 1,994 8.4 Greece 73 6.8 72 18.1 – – 72 22.2 30 6.7 Hungary 588 33.0 588 46.9 588 57.1 588 55.3 588 8.0 Ireland 217 7.4 217 39.2 217 43.3 217 42.9 217 8.3 Italy 133 5.3 133 62.4 133 61.7 132 64.4 133 6.0 Latvia – – – – – – – – 53 0 Lithuania 643 11.7 623 6.6 622 6.4 621 9.0 1,736 2.2 Luxembourg 135 10.4 135 39.3 135 40.0 135 36.3 135 4.4 Malta – – – – – – – – 88 46.6 Netherlands3 1,028 5.5 1,028 35.3 1,028 34.8 1,028 37.6 – – Romania 137 23.4 136 27.2 136 62.5 137 27.7 137 15.3 Slovakia 7 NA 11 NA 38 5.3 613 11.9 – – Slovenia 392 8.9 392 15.6 390 16.9 392 19.9 392 2.6 Spain 1,875 22.6 1,874 39.2 1,873 44.2 1,875 47.0 1,874 6.4 United Kingdom 6,201 11.5 6,178 8.7 6,158 23.9 6,158 26.6 6,228 8.8 Total (18 MSs) 16,689 14.4 16,643 23.6 14,582 28.9 15,233 30.0 16,912 6.9 Iceland 3 NA – – – – – – 22 0 Norway 359 10.3 47 91.5 47 95.7 359 21.4 359 3.9
N: number of isolates tested; % Res: percentage of resistant isolates; –: no data reported; NA: not applicable - if fewer than 20 isolates were tested resistance was not calculated; MS: Member State. 1. Isolates from cases reported as related to travel outside the country were excluded from this table. For the proportion of tested isolates from travel-associated, domestic and unknown cases by country
please see table MM2. 2. Data from Denmark not included in this table as only available for S. Typhimurium (see Table SA6) and monophasic S. Typhimurium (see Table SA7). 3. Epidemiological cut-off values were used for interpretation.

EU summary report on antimicrobial resistance in zoonotic and indicator bacteriafrom humans, animals and food 2012
EFSA Journal 2014;12(3):3590 29
Table SA3. Antimicrobial resistance in Salmonella spp. (all non-typhoidal serovars) from humans acquired in the EU/EEA and other geographical regions in 2012, using clinical breakpoints1
Country Ampicillin Cefotaxime Chloramphenicol Ciprofloxacin Gentamicin Kanamycin N % Res N % Res N % Res N % Res N % Res N % Res
Europe (EU/EEA Countries) 20,124 27.8 18,949 1.1 16,038 5.7 19,157 5.4 18,209 4.8 16,671 1.7 Europe (non-EU/EEA Countries) 41 4.9 40 0 36 2.8 41 19.5 40 7.5 38 2.6 Africa 773 20.2 767 2.1 756 7.8 774 20.5 770 7.1 734 2.7 Asia 1,158 24.3 1,145 1.5 1,132 6.9 1,160 22.7 1,147 4.6 1,075 4.0 Northern and Central America 178 3.4 175 0 176 2.3 181 10.5 178 2.8 173 0.6 South America 21 9.5 21 4.8 19 10.5 21 9.5 21 4.8 18 11.1 Oceania 13 15.4 13 0 13 15.4 13 15.4 13 7.7 13 0
Country Nalidixic acid Streptomycin Sulfonamides Tetracyclines Trimethoprim N % Res N % Res N % Res N % Res N % Res
Europe (EU/EEA Countries) 17,814 14.2 17,759 23.9 15,686 29.2 16,340 30.2 18,041 6.8 Europe (non-EU/EEA Countries) 38 26.3 38 5.3 35 5.7 35 11.4 40 5.0 Africa 769 22.9 768 10.7 754 21.6 755 26.2 739 14.3 Asia 1,147 22.9 1,146 10.9 1,126 24.6 1,128 25.7 1,086 10.7 Northern and Central America 177 10.2 177 5.1 174 10.9 174 11.5 177 5.6 South America 21 19.0 21 14.3 19 15.8 19 10.5 18 11.1 Oceania 13 15.4 13 7.7 13 15.4 13 15.4 13 7.7
N: number of isolates tested; % Res: percentage of resistant isolates; NA: not applicable - if less than 10 isolates were tested resistance was not calculated. 1. Epidemiological cut-off values were used for interpretation in the Netherlands and Denmark.

EU summary report on antimicrobial resistance in zoonotic and indicator bacteriafrom humans, animals and food 2012
EFSA Journal 2014;12(3):3590 30
3.3.1.3. Multi-drug resistance among Salmonella spp. isolates from human cases
Thirteen MSs tested isolates for the full range of antimicrobials included in the human data collection for Salmonella spp., however as Denmark only provided data for serovars Salmonella Typhimurium and monophasic S. Typhimurium, which are known to be multi-drug resistant, the Danish data were excluded from the analysis to avoid bias.
About half of the human Salmonella spp. isolates in the 12 MSs were susceptible to all 10 antimicrobials (51.3 %; N=13,496), varying from 13.2 % (N=136) in Romania to 74.8 % (N=612) in Lithuania (Table SA4). Multi-drug resistance was high (28.9 %; N=13,496; country average 33.5 %) at the EU level, with the highest levels reported from Italy (63.1 %; N=130) and Hungary (55.8 %; N=588). The proportions of isolates susceptible to all and resistant (or non-susceptible) to any one up to 10 antimicrobials are presented by MSs in Figure SA2. The proportions differed substantially between countries. Isolates resistant to five antimicrobials were reported from all 12 MSs, and seven MSs (Austria, France, Hungary, Ireland, Lithuania, Spain and the United Kingdom) even reported a few isolates resistant to 9 or all 10 antimicrobials. The serotypes of those isolates resistant to 9 or 10 antimicrobials included monophasic S. Typhimurium 1,4,[5],12:i:- (six isolates), S. Brandenburg (four), S. Typhimurium (four), S. Infantis (three), S. Montevideo (three), S. Agona (one), S. Albany (one), S. Concord (one), S. Derby (one), S. Haifa (one), S. Havana (one), S. Kentucky (one), and S. Panama (one).
Few isolates exhibited co-resistance to both ciprofloxacin and cefotaxime at the EU level (0.2 %; N=13,496) (Table SA4).
Table SA4. Complete susceptibility, multi-resistance and co-resistance (non-susceptibility) to ciprofloxacin and cefotaxime as determined by clinical breakpoints in Salmonella spp. from humans by MS, 20121
Country Susceptible to all (%) Multi-resistant (%) Co-resistant to Cip and Ctx (%)
Austria (N=1,815) 57.6 19.0 0.1 Estonia (N=167) 64.1 11.4 0 France (N=1,278) 49.1 37.0 0.4 Hungary (N=588) 16.5 55.8 0.2 Ireland (N=217) 52.5 41.9 0 Italy (N=130) 33.1 63.1 0 Lithuania (N=612) 74.8 7.2 0 Luxembourg (N=135) 43.7 40.7 0 Romania (N=136) 13.2 38.2 0 Slovenia (N=390) 64.4 16.4 0 Spain (N=1,870) 18.7 47.4 0.1 United Kingdom (N=6,158) 60.9 23.7 0.3 Total (12 MSs) (N=13,496) 51.3 28.9 0.2
N: total number of isolates tested for susceptibility against the whole common antimicrobial set for Salmonella; Cip: ciprofloxacin; Ctx: cefotaxime; MS: Member State. Susceptible to all: proportion of isolates clinically susceptible to all antimicrobial substances of the European Centre for Disease Prevention and Control (ECDC) common set for Salmonella. Multi-resistant: proportion of isolates clinically non-susceptible (resistant and intermediate) to at least three different antimicrobial substances belonging to any three antimicrobial families from the ECDC common antimicrobial set for Salmonella. Co-resistant to Cip and Ctx: proportion of isolates clinically non-susceptible to both ciprofloxacin and cefotaxime. 1. Isolates from cases reported as related to travel outside the country were excluded from this table. For the proportion of tested
isolates from travel-associated, domestic and unknown cases by country please see table MM2.

EU summary report on antimicrobial resistance in zoonotic and indicator bacteriafrom humans, animals and food 2012
EFSA Journal 2014;12(3):3590 31
Figure SA2. Frequency distribution of Salmonella spp. isolates from humans completely susceptible or resistant to 1 to 10 antimicrobials, as determined by clinical breakpoints, 20121
N: total number of isolates tested for susceptibility against the whole common antimicrobial set for Salmonella Susceptible: total number of isolates susceptible to all antimicrobial substances of the common set for Salmonella. res1-res10: total number of isolates non-susceptible (resistant and intermediate) to between 1 and 10 antimicrobial substances of the common set for Salmonella. 1. Isolates from cases reported as related to travel outside the country were excluded from this graph. For the proportion of tested
isolates from travel-associated, domestic and unknown cases by country please see table MM2.
3.3.2. Antimicrobial resistance in Salmonella Enteritidis in humans
As in previous years, S. Enteritidis was the most common Salmonella serovar identified in 2012, with 34,019 cases reported in the EU/EEA. Seventeen MSs and Norway reported data on antimicrobial resistance in S. Enteritidis isolates for ≥20 isolates (ranging from 13 MSs for sulfonamides to all 17 MSs and Norway for ciprofloxacin and ampicillin (Table SA5)).
3.3.2.1. Resistance levels in Salmonella Enteritidis isolates from human cases
The highest level of resistance among S. Enteritidis isolates in 2012 was observed for nalidixic acid (18.8 %; N=4,628). By country, the highest level was observed in Spain (60.3 %; N=527), followed by Romania (37.0 %; N=46), France (31.7 %; N=101) and Estonia (26.3 %; N=137) (Table SA5).
Compared with the data presented in this report for 2011 (EFSA and ECDC, 2013), the average level of resistance to ciprofloxacin was significantly lower in 2012 (4.9 %; N=5,598 in 2012 vs 12.7 %; N=7,965 in 2011). This can be explained by the exclusion in 2012 of isolates acquired during travelling as ciprofloxacin resistance levels were markedly higher in all other parts of the world than in the EU/EEA (see further Table SA3). Another reason for the lower resistance level is also that the countries reporting the highest ciprofloxacin resistance levels in 2011 (Denmark and Italy) did not test or only tested very few isolates of S. Enteritidis in 2012, thus having less effect on the total average than in 2011. By country, the highest resistance to ciprofloxacin in 2012 was reported in the United Kingdom (14.2 %; N=1,636), followed by the Netherlands (9.6 %; N=281) and Malta (7.4 %; N=27), all three of which used sensitive interpretive criteria for this antimicrobial.
As in previous years, resistance to cefotaxime was generally not detected or very low in the reporting MSs in 2012, total average 0.7 % (N=5,588), with the exception of Slovakia (11.3 %; N=240) (Table SA5). In Slovakia, cefotaxime resistance is not tested at the National Public Health Reference Laboratory and the methods and breakpoints applied in the testing laboratories are not known. Other noteworthy observations were the extremely high resistance levels to gentamicin among S. Enteritidis in Slovakia (97.1 %; N=244) and Malta (96.3 %; N=27), and the high resistance level to sulfonamides in Romania (41.3 %; N=46) and to trimethoprim/sulfamethoxazole in Malta (33.3 %; N=27) (Table SA5).
0 % 20 % 40 % 60 % 80 % 100 %
United Kingdom (N=6,158)
Spain (N=1,870)
Slovenia (N=390)
Romania (N=136)
Luxembourg (N=135)
Lithuania (N=612)
Italy (N=130)
Ireland (N=217)
Hungary (N=588)
France (N=1,278)
Estonia (N=167)
Austria (N=1,815)
Susceptible
res1
res2
res3
res4
res5
res6
res7
res8
res9
res10
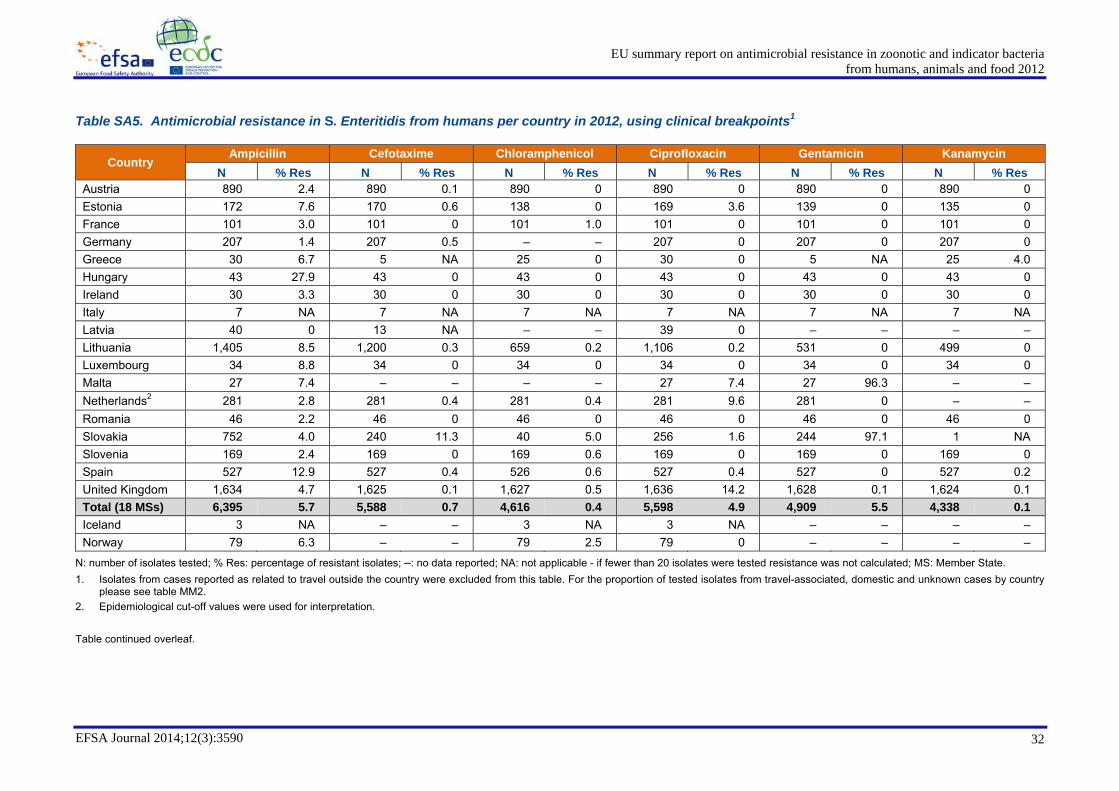
EU summary report on antimicrobial resistance in zoonotic and indicator bacteriafrom humans, animals and food 2012
EFSA Journal 2014;12(3):3590 32
Table SA5. Antimicrobial resistance in S. Enteritidis from humans per country in 2012, using clinical breakpoints1
Country Ampicillin Cefotaxime Chloramphenicol Ciprofloxacin Gentamicin Kanamycin
N % Res N % Res N % Res N % Res N % Res N % Res Austria 890 2.4 890 0.1 890 0 890 0 890 0 890 0 Estonia 172 7.6 170 0.6 138 0 169 3.6 139 0 135 0 France 101 3.0 101 0 101 1.0 101 0 101 0 101 0 Germany 207 1.4 207 0.5 – – 207 0 207 0 207 0 Greece 30 6.7 5 NA 25 0 30 0 5 NA 25 4.0 Hungary 43 27.9 43 0 43 0 43 0 43 0 43 0 Ireland 30 3.3 30 0 30 0 30 0 30 0 30 0 Italy 7 NA 7 NA 7 NA 7 NA 7 NA 7 NA Latvia 40 0 13 NA – – 39 0 – – – – Lithuania 1,405 8.5 1,200 0.3 659 0.2 1,106 0.2 531 0 499 0 Luxembourg 34 8.8 34 0 34 0 34 0 34 0 34 0 Malta 27 7.4 – – – – 27 7.4 27 96.3 – – Netherlands2 281 2.8 281 0.4 281 0.4 281 9.6 281 0 – – Romania 46 2.2 46 0 46 0 46 0 46 0 46 0 Slovakia 752 4.0 240 11.3 40 5.0 256 1.6 244 97.1 1 NA Slovenia 169 2.4 169 0 169 0.6 169 0 169 0 169 0 Spain 527 12.9 527 0.4 526 0.6 527 0.4 527 0 527 0.2 United Kingdom 1,634 4.7 1,625 0.1 1,627 0.5 1,636 14.2 1,628 0.1 1,624 0.1 Total (18 MSs) 6,395 5.7 5,588 0.7 4,616 0.4 5,598 4.9 4,909 5.5 4,338 0.1 Iceland 3 NA – – 3 NA 3 NA – – – – Norway 79 6.3 – – 79 2.5 79 0 – – – –
N: number of isolates tested; % Res: percentage of resistant isolates; –: no data reported; NA: not applicable - if fewer than 20 isolates were tested resistance was not calculated; MS: Member State. 1. Isolates from cases reported as related to travel outside the country were excluded from this table. For the proportion of tested isolates from travel-associated, domestic and unknown cases by country
please see table MM2. 2. Epidemiological cut-off values were used for interpretation. Table continued overleaf.
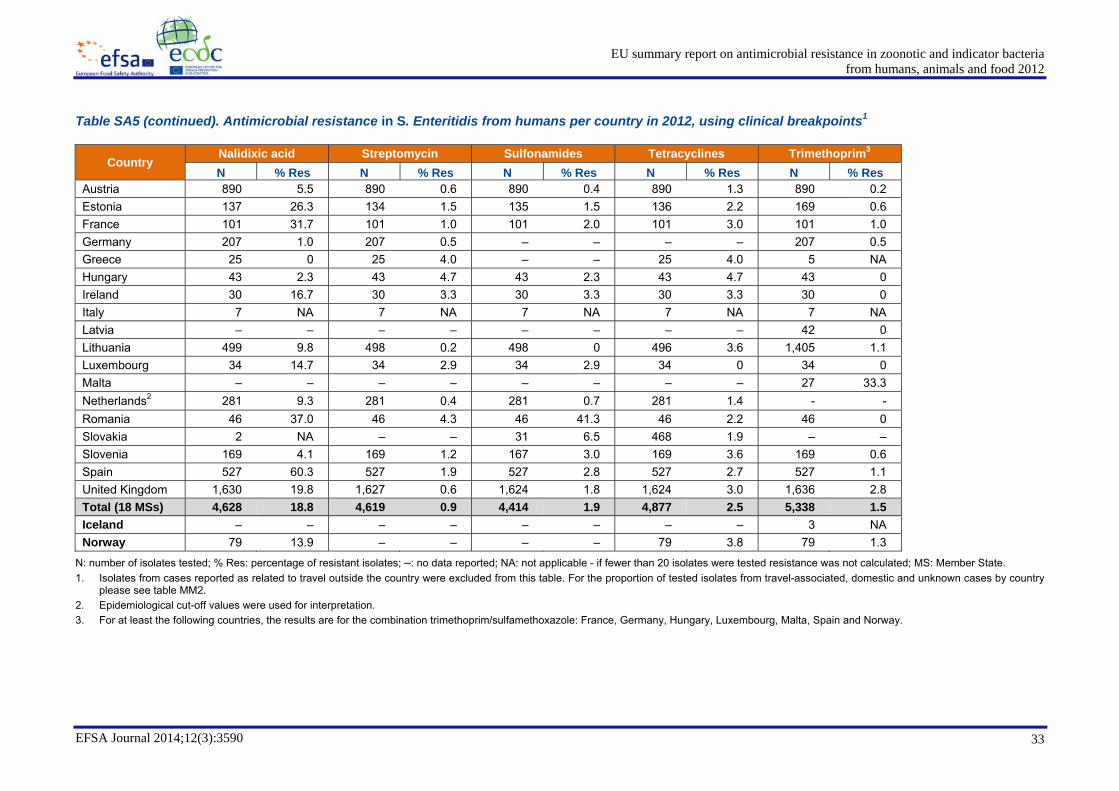
EU summary report on antimicrobial resistance in zoonotic and indicator bacteriafrom humans, animals and food 2012
EFSA Journal 2014;12(3):3590 33
Table SA5 (continued). Antimicrobial resistance in S. Enteritidis from humans per country in 2012, using clinical breakpoints1
Country Nalidixic acid Streptomycin Sulfonamides Tetracyclines Trimethoprim3
N % Res N % Res N % Res N % Res N % Res Austria 890 5.5 890 0.6 890 0.4 890 1.3 890 0.2 Estonia 137 26.3 134 1.5 135 1.5 136 2.2 169 0.6 France 101 31.7 101 1.0 101 2.0 101 3.0 101 1.0 Germany 207 1.0 207 0.5 – – – – 207 0.5 Greece 25 0 25 4.0 – – 25 4.0 5 NA Hungary 43 2.3 43 4.7 43 2.3 43 4.7 43 0 Ireland 30 16.7 30 3.3 30 3.3 30 3.3 30 0 Italy 7 NA 7 NA 7 NA 7 NA 7 NA Latvia – – – – – – – – 42 0 Lithuania 499 9.8 498 0.2 498 0 496 3.6 1,405 1.1 Luxembourg 34 14.7 34 2.9 34 2.9 34 0 34 0 Malta – – – – – – – – 27 33.3 Netherlands2 281 9.3 281 0.4 281 0.7 281 1.4 - - Romania 46 37.0 46 4.3 46 41.3 46 2.2 46 0 Slovakia 2 NA – – 31 6.5 468 1.9 – – Slovenia 169 4.1 169 1.2 167 3.0 169 3.6 169 0.6 Spain 527 60.3 527 1.9 527 2.8 527 2.7 527 1.1 United Kingdom 1,630 19.8 1,627 0.6 1,624 1.8 1,624 3.0 1,636 2.8 Total (18 MSs) 4,628 18.8 4,619 0.9 4,414 1.9 4,877 2.5 5,338 1.5 Iceland – – – – – – – – 3 NA Norway 79 13.9 – – – – 79 3.8 79 1.3
N: number of isolates tested; % Res: percentage of resistant isolates; –: no data reported; NA: not applicable - if fewer than 20 isolates were tested resistance was not calculated; MS: Member State. 1. Isolates from cases reported as related to travel outside the country were excluded from this table. For the proportion of tested isolates from travel-associated, domestic and unknown cases by country
please see table MM2. 2. Epidemiological cut-off values were used for interpretation. 3. For at least the following countries, the results are for the combination trimethoprim/sulfamethoxazole: France, Germany, Hungary, Luxembourg, Malta, Spain and Norway.

EFSA Journa
3.3.2.2. Tr
Country-spepresented i10 isolates
In eight MSisolates restrends of ciDenmark inbe explaineresistance lN=1,751 in the whole p
Figure SA3Direct comp
% re
sist
ant i
sola
tes
Note: CountrieIreland, Latvia1. Isolates f
isolates fr2. Guideline
Antimicro(DTU)/Clifrom CLSEUCAST
al 2014;12(3):
rends in res
ecific trendsn Figures SAper year wer
Ss (Austria, sistant to cipprofloxacin r 2010, contin
ed by changlevels obser2011 to 14.
period.
3. Resistancparisons betw
es reporting zer, Romania and from cases reporom travel-asso
es for interpretobial Susceptibinical and Labo
SI), Lithuania (C), Slovakia (CBP
E
:3590
sistance le
s in resistanA3 and SA4re included.
France, Greprofloxacin wresistance lenuing in 201ges made inrved in the U2 %; N=1,63
ce to ciproflween countri
ro resistant isolaSlovenia; MS: Morted as relatedciated, domestitive criteria: Dility Testing (Eratory StandardB from CLSI), LP from EUCAST
EU summary r
evels in Sal
nce to cipro4. Only count
eece, Hungawere reportedevels across1, and in Ita
n the interprUnited Kingd36 in 2012).
loxacin in Sies should be
ates in the periMember State.d to travel outsidc and unknownenmark (epide
EUCAST)), Estods Institute (CLSLuxembourg (CT), Spain (CB fr
report on antim
lmonella En
ofloxacin antries reportin
ry, Ireland, d in the five
s countries (Fly and Maltaretive criteriadom, which In Luxembo
. Enteritidise avoided ow
Year iod were not sh
de the country w cases by countmiological cut-onia (Clinical bSI)), Germany (PB from CLSI),rom CLSI), the U
microbial resi
nteritidis is
nd cefotaximng data for a
Latvia, Rom year periodFigure SA3) in 2011. Toa. No informfluctuated g
ourg, a decre
s in humans wing to the us
hown as graphs
were excluded try please see T-off values (ECbreakpoints (C(CBP from Deut Malta (CBP froUnited Kingdom
istance in zoonfrom huma
solates fro
me over theat least three
mania and Sld. There wer. A sharp in our knowled
mation was reatly over t
easing trend
in reportingse of differen
s: Austria, Fran
from the graphTable MM2. COFFs) from tBP) from Techtsches Institut fom EUCAST), th
m (CBP from HP
notic and indians, animals a
m human c
years 200e consecutiv
ovenia) andre few similacrease was dge, none ofavailable to the period (could be ob
g MSs, 2008nt interpretive
ce, Greece, Hu
hs. For the prop
the European hnical Universitfür Normung (Dhe Netherlands
PA). See also Ta
icator bacteriaand food 2012
34
cases
8–2012 areve years and
Iceland, noarities in theobserved in
f these couldexplain the
e.g. 35.6 %;bserved over
8–20121 e criteria2
ungary, Iceland,
portion of tested
Committee onty of DenmarkIN)), Italy (CBP (ECOFFs from
able MM1.
a2
4
e d
o e n d e ; r
,
d
n k P m

EFSA Journa
The cefotaxDenmark, Hperiod. A shin cefotaximalthough thea slight incrchanged to
Figure SA4
Direct comp
% re
sist
ant i
sola
tes
MS: Member SNote: CountrieLuxembourg a1. Isolates fr
isolates fr2. Guideline
Testing ((CLSI)), GNetherlanUnited Ki
al 2014;12(3):
xime resistanHungary, Irelaharp decreasme resistancee breakpointrease in the rEUCAST br
4. Resistanc
parisons betw
State. es reporting zend Slovenia. rom cases reporom travel-asso
es for interpretiv(EUCAST)), EsGermany (CBPnds (ECOFFs frngdom (CBP fro
E
:3590
nce were genand, Latvia, se in resistane levels cout was changeresistance lereakpoints wh
ce to cefotax
ween countri
ero resistant is
orted as relatedciated, domestie criteria: Austr
stonia (CBP froP from Deutschrom EUCAST), om the Health P
EU summary r
nerally at veLuxembourg
nce levels wald be observed from ≥64 evel was obshich, howeve
xime in S. E
ies should be
solates in the
d to travel outsidc and unknown
ria (Clinical breaom Technical Uhes Institut für
Romania (CBPProtection Agen
report on antim
ry low levelsg and Slovenas observed ved in 2010 mg/L to ≥4 m
served in 201er, are the sa
Enteritidis in
e avoided ow
Year
period were n
de the country w cases by count
akpoints (CBP) University of DNormung (DIN)P from CLSI), Scy (HPA)). See
microbial resi
s in 2008 to 2nia did not rein Estonia aor 2011 in th
mg/L in 201011 and a drasame as CLSI
n humans in
wing to the us
not shown as g
were excluded try please see Tfrom the Europe
Denmark (DTU))), Italy (CBP fSlovakia (CBP also Table MM
istance in zoonfrom huma
2012 in repoeport any resnd Italy in 20he countries
0. One excepstic increaseI regarding c
n reporting M
se of differen
graphs: Denma
from the graphTable MM2. ean Committee /Clinical and Lfrom CLSI), Litfrom EUCAST)1.
notic and indians, animals a
orting MSs (Fistant isolate
011. No visib using CLSI
ption was Sloe in 2012 (whcefotaxime).
MSs, 2008–2
nt interpretive
ark, Hungary,
s. For the prop
on AntimicrobiaLaboratory Stanhuania (CBP fr), Spain (CBP f
icator bacteriaand food 2012
35
Figure SA4).es during theble increases
breakpointsovakia wherehen Slovakia
20121
e criteria2
Ireland, Latvia,
portion of tested
al Susceptibilityndards Instituterom CLSI), thefrom CLSI), the
a2
5
. e s s e a
,
d
y e e e

EU summary report on antimicrobial resistance in zoonotic and indicator bacteriafrom humans, animals and food 2012
EFSA Journal 2014;12(3):3590 36
3.3.3. Antimicrobial resistance in Salmonella Typhimurium in humans
As in previous years, S. Typhimurium was the second most common Salmonella serovar identified in 2012, with 18,248 cases reported in the EU/EEA. Sixteen MSs and Norway reported data on antimicrobial resistance in S. Typhimurium isolates for ≥20 isolates (ranging from 13 MSs for kanamycin and sulfonamides to all 16 MSs and Norway for ciprofloxacin and ampicillin) (Table SA6).
3.3.3.1. Resistance levels in Salmonella Typhimurium isolates from human cases
The highest level of resistance in S. Typhimurium was observed for ampicillin (66.6 %; N=4,183), tetracyclines (63.7 %; N=3,272), sulfonamides (62.4 %; N=3,182) and streptomycin (46.2 %; N=3,951) (Table SA6). The levels of resistance to these antimicrobials were high to extremely high in the reporting MSs. Resistance levels observed in S. Typhimurium isolates to the two clinically most important antimicrobials were 2.2 % (N=4,114) for ciprofloxacin and 0.9 % (N=4,057) for cefotaxime. The highest resistance levels to ciprofloxacin were observed in the United Kingdom (4.3 %; N=1,686), the Netherlands (4.0 %; N=224) and Denmark (2.6 %; N=117), all three of which used more sensitive interpretive criteria than other countries. The highest level of resistance to cefotaxime was observed in France (3.6 %; N=110) (Table SA6).
Other noteworthy observations were the extremely high resistance in S. Typhimurium to gentamicin in Slovakia (92.9 %; N=56) and to streptomycin in Germany (82.3 %; N=744) (Table SA6).
3.3.3.2. Trends in resistance levels in Salmonella Typhimurium isolates from human cases
Country-specific trends in S. Typhimurium resistance to ciprofloxacin and cefotaxime over the years 2008 to 2012 are presented in Figures SA5 and SA6, respectively. Only countries reporting data for at least three consecutive years and 10 isolates per year were included.
The five-year trend (2008–2012) in resistance to ciprofloxacin by country showed that the countries using more sensitive interpretive criteria throughout the period (Denmark, the Netherlands and the United Kingdom) reported consistently higher levels of resistance compared with other countries (Figure SA5). A slight increasing trend over the period was observed in Denmark and decreasing trends were observed in Luxembourg and the Netherlands. A peak (smaller or larger) in resistance levels could be noted in 2010 in Denmark, Estonia, Lithuania, Luxembourg, the Netherlands and the United Kingdom, while in Italy, Malta and Slovakia, a peak was observed in 2011. Austria, France, Greece and Slovenia did not report any resistant isolates during the period.
There were few common trends between countries regarding cefotaxime resistance in S. Typhimurium during the period 2008 to 2012 (Figure SA6). An exception was a proportionally large increase in resistance levels observed in 2012 compared with previous years in Denmark, Hungary, Ireland and the Netherlands, and compared with 2011 in Lithuania, Romania and Spain. Please note, however, that the number of cefotaxime resistant isolates overall was very low and therefore even minor increases or decreases in the number of resistant isolates may influence the proportion of resistant isolates. A peak (smaller or larger) in resistance levels could also be noted in 2010 in Germany, Italy, Lithuania, the Netherlands and Spain, while in Austria, Slovakia and the United Kingdom, a peak was observed in 2011. Luxembourg did not report any resistant isolates during the period.

EU summary report on antimicrobial resistance in zoonotic and indicator bacteriafrom humans, animals and food 2012
EFSA Journal 2014;12(3):3590 37
Table SA6. Antimicrobial resistance in S. Typhimurium from humans per country in 2012, using clinical breakpoints1
Country Ampicillin Cefotaxime Chloramphenicol Ciprofloxacin Gentamicin Kanamycin N % Res N % Res N % Res N % Res N % Res N % Res
Austria 236 56.8 236 0.4 236 21.2 236 0 236 1.3 236 1.7 Denmark2 117 48.7 117 1.7 117 13.7 117 2.6 117 2.6 117 2.6 Estonia 19 NA 19 NA 10 NA 19 NA 10 NA 10 NA France 110 60.9 110 3.6 110 43.6 110 0 110 0 110 0.9 Germany 744 81.2 744 0.9 – – 744 0 744 0.9 744 1.9 Greece 29 37.9 15 NA 14 NA 29 0 15 NA 14 NA Hungary 240 72.1 240 2.1 240 26.7 240 0 240 0.8 240 0.8 Ireland 59 59.3 59 1.7 59 45.8 59 1.7 59 1.7 59 1.7 Italy 33 69.7 33 0 33 12.1 33 0 33 0 33 0 Latvia 11 NA 4 NA - - 6 NA 3 NA – – Lithuania 132 59.8 116 0.9 87 16.1 119 0 70 0 66 0 Luxembourg 27 70.4 27 0 27 25.9 27 0 27 0 27 0 Malta 7 NA – – – – 7 NA 7 NA – – Netherlands2 224 60.7 224 0.9 224 18.3 224 4.0 224 0.9 – – Romania 54 75.9 54 1.9 54 18.5 54 1.9 54 1.9 54 0 Slovakia 114 71.1 56 1.8 20 15.0 56 0 56 92.9 - - Slovenia 32 28.1 32 0 32 12.5 32 0 32 0 32 0 Spain 316 76.9 316 1.3 316 30.1 316 0 316 0.9 316 3.2 United Kingdom 1,679 63.0 1,655 0.4 1,662 12.3 1,686 4.3 1,666 1.6 1,654 1.6 Total (19 MSs) 4,183 66.6 4,057 0.9 3,241 18.3 4,114 2.2 4,019 3.0 3,712 1.7 Iceland 8 NA – – 8 NA 8 NA – – – – Norway 76 28.9 – – 76 21.1 76 0 – – – –
N: number of isolates tested; % Res: percentage of resistant isolates; –: no data reported; NA: not applicable - if fewer than 20 isolates were tested resistance was not calculated; MS: Member State. 1. Isolates from cases reported as related to travel outside the country were excluded from this table. For the proportion of tested isolates from travel-associated, domestic and unknown cases by country
please see table MM2. 2. Epidemiological cut-off values were used for interpretation. Table continued overleaf.

EU summary report on antimicrobial resistance in zoonotic and indicator bacteriafrom humans, animals and food 2012
EFSA Journal 2014;12(3):3590 38
Table SA6 (continued). Antimicrobial resistance in S. Typhimurium from humans per country in 2012, using clinical breakpoints1
Country Nalidixic acid Streptomycin Sulfonamides Tetracyclines Trimethoprim3
N % Res N % Res N % Res N % Res N % Res Austria 236 2.5 236 55.9 236 54.2 236 58.5 236 4.7 Denmark2 117 1.7 117 52.1 117 53.0 117 31.6 117 7.7 Estonia 10 NA 9 NA 10 NA 10 NA 19 NA France 110 6.4 110 61.8 110 66.4 110 64.5 110 5.5 Germany 744 9.9 744 82.3 – – – – 744 10.2 Greece 14 NA 14 NA – – 14 NA 12 NA Hungary 240 2.9 240 57.1 240 64.2 240 59.6 240 12.1 Ireland 59 8.5 59 55.9 59 61.0 59 61.0 59 16.9 Italy 33 3.0 33 69.7 33 72.7 33 72.7 33 12.1 Latvia – – – – – – – – 8 NA Lithuania 66 12.1 66 48.5 66 48.5 66 43.9 135 5.9 Luxembourg 27 3.7 27 55.6 27 63.0 27 59.3 27 0 Malta – – – – – – – – 7 NA Netherlands2 224 3.6 224 50.0 224 55.8 224 57.1 – – Romania 54 3.7 54 51.9 54 83.3 54 51.9 54 27.8 Slovakia 3 NA 8 NA 4 NA 80 53.8 – – Slovenia 32 9.4 32 31.3 32 28.1 32 31.3 32 6.3 Spain 316 15.2 316 57.6 316 74.1 316 76.3 316 12.0 United Kingdom 1,671 4.5 1,662 22.6 1,654 63.1 1,654 68.5 1,685 14.7 Total (19 MSs) 3,956 6.4 3,951 46.2 3,182 62.4 3,272 63.7 3,834 12.0 Iceland 2 NA – – – – – – 8 NA Norway 76 7.9 14 NA 14 NA 76 27.6 76 1.3
N: number of isolates tested; % Res: percentage of resistant isolates; –: no data reported; NA: not applicable - if fewer than 20 isolates were tested resistance was not calculated; MS: Member State. 1. Isolates from cases reported as related to travel outside the country were excluded from this table. For the proportion of tested isolates from travel-associated, domestic and unknown cases by country
please see table MM2. 2. Epidemiological cut-off values were used for interpretation. 3. For at least the following countries, the results are for the combination trimethoprim/sulfamethoxazole: France, Germany, Hungary, Luxembourg, Malta, Spain and Norway.

EFSA Journa
Figure SA5
Direct comp
% re
sist
ant i
sola
tes
MS: Member SNote: Countrie1. Isolates fr
isolates fr2. Guideline
Antimicro(DTU)/Cli(CBP fromCLSI), MCLSI), the
al 2014;12(3):
5. Resistanc
parisons betw
State. es reporting zerorom cases reporom travel-asso
es for interpretobial Susceptibinical and Labom EUCAST), Iralta (CB from Ee United Kingdo
E
:3590
ce to ciprofl
ween countri
o resistant isolaorted as relatedciated, domestitive criteria: Deility Testing (E
oratory Standardreland (CBP froEUCAST), the om (CBP from th
EU summary r
loxacin in S
ies should be
tes in the periodd to travel outsidc and unknownenmark (epide
EUCAST)), Estods Institute (CL
om EUCAST), ItNetherlands (Ehe Health Prote
report on antim
. Typhimuri
e avoided ow
Year
d were not showde the country w cases by countmiological cut-onia (Clinical b
LSI)), Germany taly (CBP from
ECOFFs from Eection Agency (H
microbial resi
ium in huma
wing to the us
wn as graphs: Awere excluded try please see T-off values (ECbreakpoints (C(CBP from DeuCLSI), Lithuan
EUCAST), SlovaHPA)). See also
istance in zoonfrom huma
ans in repor
se of differen
Austria, France, from the graph
Table MM2. COFFs) from tBP) from Techutsches Institut ia (CBP from Cakia (CBP from
o Table MM1.
notic and indians, animals a
rting MSs, 2
nt interpretive
Greece and Slos. For the prop
the European hnical Universitfür Normung (
CLSI), Luxembom EUCAST), Sp
icator bacteriaand food 2012
39
008–20121
e criteria2
ovenia. portion of tested
Committee onty of DenmarkDIN)), Hungary
ourg (CBP frompain (CBP from
a2
9
d
n k y
m m

EFSA Journa
Figure SA6
Direct comp
% re
sist
ant i
sola
tes
MS: Member SNote: Countrie1. Isolates fr
isolates fr2. Guideline
Testing (ETechnicafür NormuCLSI), theCLSI), Sp
al 2014;12(3):
6. Resistanc
parisons betw
State. es reporting zerorom cases reporom travel-asso
es for interpretivEUCAST)), Denl University of Dung (DIN)), Hue Netherlands (pain (CBP from
E
:3590
ce to cefotax
ween countri
o resistant isolaorted as relatedciated, domestie criteria: Austrnmark (epidemiDenmark (DTU)/ngary (CBP fro(ECOFFs from ECLSI), the Unite
EU summary r
xime in S. T
ies should be
tes in the periodd to travel outsidc and unknown
ria (Clinical breaological cut-off /Clinical and Laom EUCAST), IEUCAST), Romed Kingdom (CB
report on antim
Typhimurium
e avoided ow
Year
d were not showde the country w cases by count
akpoints (CBP) values (ECOFFboratory StandaIreland (CBP fr
mania (CBP fromBP from the He
microbial resi
m in humans
wing to the us
wn as graphs: Lwere excluded try please see Tfrom the EuropeFs) from EUCASards Institute (Crom EUCAST), m CLSI), Slovakalth Protection A
istance in zoonfrom huma
s in reportin
se of differen
uxembourg. from the graph
Table MM2. ean CommitteeST), Estonia (C
CLSI)), GermanyItaly (CBP from
kia (CBP from EAgency (HPA)).
notic and indians, animals a
ng MSs, 200
nt interpretive
s. For the prop
on AntimicrobiaClinical breakpoiy (CBP from Dem CLSI), LithuaEUCAST), Slove. See also Table
icator bacteriaand food 2012
40
08-20121
e criteria2
portion of tested
al Susceptibilityints (CBP) from
eutsches Institutania (CBP fromenia (CBP frome MM1.
a2
0
d
y m t
m m

EU summary report on antimicrobial resistance in zoonotic and indicator bacteriafrom humans, animals and food 2012
EFSA Journal 2014;12(3):3590 41
3.3.4. Antimicrobial resistance in monophasic Salmonella Typhimurium 1,4,[5],12:i:- in humans
Since the introduction of a separate serovar code in the reporting in 2010, monophasic S. Typhimurium 1,4,[5],12:i:- has become the third most common Salmonella serovar in humans. In 2012, 5,932 cases were reported by the EU/EEA countries. Eight MSs reported data on antimicrobial resistance in monophasic S. Typhimurium 1,4,[5],12:i:- isolates for ≥20 isolates for all 11 antimicrobials except for kanamycin and trimethoprim which seven MSs reported data for (Table SA7).
3.3.4.1. Resistance levels in monophasic Salmonella Typhimurium 1,4,[5],12:i:- isolates human cases
Extremely high levels of resistance were observed for tetracyclines (92.7 %; N=1,263), ampicillin (89.5 %; N=1,263), sulfonamides (89.1 %; N=1,262) and streptomycin (86.9 %; N=1,263) in monophasic S. Typhimurium 1,4,[5],12:i:- (Table SA7). This resistance pattern, ASSuT, is a well-known character for monophasic S. Typhimurium 1,4,[5],12:i:- and was observed at similar levels in all nine reporting MSs.
Resistance levels to the two clinically most important antimicrobials were 0.7 % (N=1,263) for ciprofloxacin and 2.1 % (N=1,263) for cefotaxime, which regarding ciprofloxacin was lower than in other S. Typhimurium but regarding cefotaxime was higher. The highest resistance levels to ciprofloxacin was observed in Italy (3.2 %; N=62) and Denmark (1.9 %; N=107). It should be noted that Denmark used ECOFFs for interpretation which are more sensitive than the clinical breakpoints for ciprofloxacin. The highest levels of resistance to cefotaxime were observed in France (5.2 %; N=115), Spain (2.8 %; N=571) and Austria (2.1 %; N=95) (Table SA7).

EU summary report on antimicrobial resistance in zoonotic and indicator bacteriafrom humans, animals and food 2012
EFSA Journal 2014;12(3):3590 42
Table SA7. Antimicrobial resistance in monophasic S. Typhimurium 1,4,[5],12:i:- from humans per country in 2012, using clinical breakpoints1
Country Ampicillin Cefotaxime Chloramphenicol Ciprofloxacin Gentamicin Kanamycin
N % Res N % Res N % Res N % Res N % Res N % Res Austria 95 93.7 95 2.1 95 5.3 95 0 95 3.2 95 2.1 Denmark2 107 83.2 107 0 107 0 107 1.9 107 0.9 107 0 Estonia 12 NA 12 NA 12 NA 12 NA 12 NA 12 NA France 115 90.4 115 5.2 115 2.6 115 0 115 0 115 0 Ireland 45 86.7 45 0 45 0 45 0 45 0 45 0 Italy 62 91.9 62 0 62 6.5 62 3.2 62 3.2 60 0 Luxembourg 30 96.7 30 0 30 6.7 30 0 30 3.3 30 3.3 Netherlands2 226 85.4 226 0.9 226 2.7 226 0.9 226 2.2 - - Spain 571 90.9 571 2.8 571 5.3 571 0.5 571 3.7 571 3.2 Total (9 MSs) 1,263 89.5 1,263 2.1 1,263 4.0 1,263 0.7 1,263 3.2 1,035 2.0
Country Nalidixic acid Streptomycin Sulfonamides Tetracyclines Trimethoprim N % Res N % Res N % Res N % Res N % Res
Austria 95 0 95 92.6 95 93.7 95 91.6 95 6.3 Denmark2 107 0 107 87.9 107 89.7 107 96.3 107 0 Estonia 12 NA 12 NA 12 NA 12 NA 12 NA France 115 2.6 115 89.6 115 92.2 115 93.0 115 6.1 Ireland 45 2.2 45 97.8 45 97.8 45 97.8 45 0 Italy 62 3.2 62 90.3 62 90.3 62 90.3 62 3.2 Luxembourg 30 3.3 30 90.0 30 93.3 30 80.0 30 10.0 Netherlands2 226 0.4 226 88.1 226 85.4 226 94.2 - - Spain 571 1.8 571 83.0 570 87.7 571 91.9 571 6.8 Total (9 MSs) 1,263 1.4 1,263 86.9 1,262 89.1 1,263 92.7 1,037 5.5
N: number of isolates tested; % Res: percentage of resistant isolates; –: no data reported; NA: not applicable - if fewer than 20 isolates were tested resistance was not calculated; MS: Member States. 1. Isolates from cases reported as related to travel outside the country were excluded from this table. For the proportion of tested isolates from travel-associated, domestic and unknown cases by country
please see table MM2. 2. Epidemiological cut-off values were used for interpretation.

EU summary report on antimicrobial resistance in zoonotic and indicator bacteriafrom humans, animals and food 2012
EFSA Journal 2014;12(3):3590 43
3.4. Antimicrobial resistance in Salmonella isolates from animals and food
Nineteen MSs and two non-MSs (Norway and Switzerland) reported quantitative MIC data and one MS reported IZD data on antimicrobial resistance in Salmonella isolates recovered from animals and food in 2012. The MSs reporting either MIC or IZD data, for each animal or food category, are listed in Tables SA1, SA8 and SA9. As quantitative IZD data constitute a relatively small percentage of the total data available, these data have, therefore, been analysed as qualitative data only. The susceptibility test results for Salmonella isolates reported as qualitative data are presented in Appendix 2.
In this report, antimicrobial resistance data for all reported Salmonella isolates were collated to generate a figure for Salmonella spp. (covering all reported serovars) for each country, year and animal/food category. In addition, the Salmonella serovars which are most prevalent and significant for public health, S. Enteritidis, S. Typhimurium and monophasic S. Typhimurium, were reported separately where sufficient quantitative data were available from the various animal/food categories. Frequency distributions of serovars per animal and meat categories are presented in Appendix 1.
Table SA8. Overview of countries reporting quantitative antimicrobial resistance data using MIC and disc inhibition zones on S. Typhimurium from various animal and food categories in 2012
Method Origin Total number of MSs reporting Countries
Diffusion Gallus gallus (fowl) 1 MS: GR Meat from pig 1 MS: GR
Dilution
Gallus gallus (fowl) 12 MSs: AT, BE, DE, DK, ES, FI, HU, IT, PL, RO, SE, UK Non-MS: CH
Turkeys 7 MSs: AT, BE, DE, ES, FI, IT, UK
Pigs 14 MSs: BE, CZ, DE, DK, EE, ES, FI, HU, IE, LV, NL, RO, SE, SK Non-MS: CH
Cattle (bovine animals) 11 MSs: BE, CZ, DE, DK, EE, ES, FI, IE, IT, NL, SE Non-MS: CH
Meat from broilers (Gallus gallus) 3 MSs: IE, IT, LV
Meat from turkeys 4 MSs: DE, HU, IT, PT Meat from pigs 12 MSs: BE, CZ, DE, DK, EE, HU, IE, IT, LV, NL, PL, RO Meat from bovine animals 7 MSs: CZ, DE, EE, FI, IE, IT, NL
Note: For abbreviations of Member States (MS) and other reporting countries, see Appendix 7; MIC: minimum inhibitory concentration.
Table SA9. Overview of countries reporting quantitative antimicrobial resistance data using MIC and disc inhibition zones on S. Enteritidis from various animal and food categories in 2012
Method Origin Total number of MSs reporting Countries
Diffusion Gallus gallus (fowl) 1 MS: GR
Dilution
Gallus gallus (fowl) 15 MSs: AT, BE, CZ, DE, DK, ES, HU, IT, LV, NL, PL, PT, RO, SK, UK Non-MS: CH
Turkeys 5 MSs: AT, CZ, DE, HU, SK Pigs 5 MSs: BE, DE, DK, EE, HU
Cattle (bovine animals) 4 MSs: BE, CZ, DK, EE Non-MS: CH
Meat from broilers (Gallus gallus) 7 MSs: BE, CZ, DE, LV, NL, PL, SK
Meat from pigs 2 MSs: CZ, RO Meat from turkeys 3 MSs: CZ, DE, HU
Note: For abbreviations of Member States (MS) and other reporting countries, see Appendix 7; MIC: minimum inhibitory concentration.

EU summary report on antimicrobial resistance in zoonotic and indicator bacteriafrom humans, animals and food 2012
EFSA Journal 2014;12(3):3590 44
In this chapter, resistance to ampicillin, cefotaxime, ciprofloxacin, chloramphenicol, gentamicin, nalidixic acid, sulfonamides and tetracyclines has been analysed in detail in line with the antimicrobials listed in the EFSA monitoring and reporting specifications for antimicrobial resistance in Salmonella (EFSA, 2007). The occurrence of resistance to these substances was tabulated, temporal trends and spatial distribution of resistance was drawn and the multi-resistance and a specific co-resistance pattern was analysed. The results of these analyses are displayed in this report according to the following inclusion criteria: whenever a country subjected more than 10 isolates to susceptibility testing for a given animal or food category then these data were not included in any further analyses. In addition, tables were generated and analysis was performed only if four or more countries tested and reported quantitative data for a given Salmonella category and sampling origin.
• Temporal trend graphs of resistance were generated showing resistance to ampicillin, cefotaxime, ciprofloxacin and nalidixic acid for Salmonella isolates from animals and food over the 2006–2012 period. Only countries which had reported data for four or more years during 2006–2012 were included. Data from 2004 and 2005 were excluded from the temporal trends graphs because of the relative scarcity of data compared with the 2006–2012 period. Statistical analysis of the trend within individual countries was performed using logistic regression when data were available for five or more years.
• The spatial distributions of ampicillin and nalidixic acid resistance rates in Salmonella spp. from Gallus gallus, turkeys, pigs and cattle were presented. For countries where resistance level figures for 2012 were not available, 2011 figures were used instead.
• Multi-resistance was analysed in isolate-based data on Salmonella isolates tested for the full harmonised set of antimicrobials (nine substances) belonging to different classes. Multi-resistance was defined as the non-susceptibility to at least three different antimicrobial classes. The proportions of isolates susceptible to all antimicrobials and resistant (non-susceptible) from one to nine antimicrobials are presented. Co-resistance to cefotaxime (Ctx) and ciprofloxacin (Cip) was estimated as these two antimicrobials are of particular interest in human medicine in the case of treatment of severe salmonellosis. Co-resistance was addressed using both ECOFFs (Ctx>0.5 mg/L and Cip>0.06 mg/L) and clinical breakpoints (Ctx>2 mg/L and Cip>1 mg/L). Complete susceptibility and multi-resistance were analysed for isolate-based resistance data reported by the MSs and the results are shown at Appendix 4.
The antimicrobials selected by the different MSs and non-MSs for susceptibility testing of Salmonella are shown in Chapter 8 Materials and methods, Table MM6. For further information on reported MIC distributions and number of resistant isolates for apramycin, ceftazidime, ceftiofur, colistin, florfenicol, kanamycin, neomycin, spectinomycin, streptomycin and trimethoprim, refer to the Level 3 tables published on the EFSA website.
3.4.1. Antimicrobial resistance in Salmonella isolates from food
This section describes the MIC data for isolates of Salmonella spp. and S. Enteritidis from meat from broilers, Salmonella spp., S. Typhimurium and monophasic S. Typhimurium from meat from pigs and Salmonella spp. from meat from bovine animals.
3.4.1.1. Meat from broilers and spent hens (Gallus gallus)
Quantitative MIC susceptibility data for isolates of Salmonella spp. from broiler meat from 12 MSs in 2012 are included in the following analysis. Data for S. Typhimurium isolates are not presented separately for meat from broilers as no MS tested more than 10 isolates.
Representative sampling and monitoring
In reporting MSs, data on antimicrobial resistance in Salmonella isolates from meat from Gallus gallus derived from active monitoring carried out within the framework of either official sampling or Hazard Analysis and Critical Point Control (HACCP) and own-check programmes. Samples of meat from broilers and spent hens were collected randomly at either the slaughterhouse, the cutting/processing plant, or at retail outlets. In Belgium, the Czech Republic, Ireland and Romania, representative random sampling of meat from

EU summary report on antimicrobial resistance in zoonotic and indicator bacteriafrom humans, animals and food 2012
EFSA Journal 2014;12(3):3590 45
broilers, whether carcase swabs or samples of neck skin, fresh meat, minced meat, meat products or meat preparations, was carried out entirely or primarily at the slaughterhouse or at the processing plant. In Portugal and Romania, sampling of fresh meat and meat preparations from broilers was also performed at retail. Moreover, Belgium was the only reporting MS to monitor resistance in Salmonella isolates derived from swabbing of both carcases of spent hens and chilled broilers at the slaughterhouse. Germany, Hungary, the Netherlands, Poland and Spain did not provide any details on the sampling scheme used.
Resistance levels in Salmonella spp. isolates from meat from broilers and spent hens
Table SA10 describes the occurrence of resistance to selected antimicrobials in Salmonella spp. isolated mostly from broiler meat in MSs in 2012.
In 2012, resistance to ampicillin, sulfonamides and tetracyclines was generally high to extremely high in the reporting MSs, although levels of resistance were highly variable across countries, ranging from 0 % to 48.6 % for ampicillin and from 0 % to 87.3 % for both sulfonamides and tetracyclines. Resistance levels to chloramphenicol and gentamicin were typically lower, a number of MSs observing no resistance to one or both of these antimicrobials. Variation in the resistance recorded was important, between 0 % and 18.1 % for chloramphenicol and from 0 % to 45.5 % for gentamicin.
As in previous years, the occurrence of resistance to ciprofloxacin and nalidixic acid was typically similar within MSs, while, between countries, resistance levels ranged from 0 % to 100 %. The overall level of resistance to cefotaxime across the reporting MSs remained low in 2012 at 4.3 %, as generally resistance was either not detected or observed at low levels. The Netherlands reported a high level of resistance to cefotaxime of 31.1 %, which was similar to that (31.9 %) reported in 2011.
Considering the figures at reporting MS group level for Salmonella spp. isolated from broiler meat, there were increases in the levels of resistance to sulfonamides and tetracyclines which stood at 44.8 % and 43.7 % in 2011 and were 53.0 % and 48.9 % in 2012. However, there are a number of factors which can influence changes in the occurrence of resistance in Salmonella spp. in different years: (1) differences in the contributing MSs and their relative contribution to the total, since levels of resistance vary greatly between MSs, (2) differences in the relative contribution of different serovars (which can vary greatly in the resistances shown), (3) changes in the level of resistance.
Salmonella spp. comprise the amalgamated results for all Salmonella serovars reported by a reporting MS for a different animal or food category. The relative contribution of different serovars possessing a particular resistance should ideally be considered when interpreting the results, in order to evaluate the influence of clonal dissemination of serovars. The chapter has also presented data at the individual serovar level for a number of Salmonella serovars.
Resistance levels in Salmonella Enteritidis isolates from meat from broilers and spent hens
Resistance among S. Enteritidis isolates from broiler meat in reporting MSs was generally lower than that reported in Salmonella spp. As low numbers of isolates of S. Enteritidis (fewer than 10) were recovered from meat from broilers in the Czech Republic, Germany, the Netherlands and Slovakia, these countries have been excluded from the detailed analysis, leaving only Belgium, Latvia and Poland contributing to the analysis; thus, there are insufficient data to present a specific table.
Data from Belgium showed marked differences in the occurrence of ciprofloxacin resistance in Salmonella spp. from meat from broilers and spent hens. While no resistance was detected in isolates from spent hens there was 39.5 % ciprofloxacin resistance in isolates from broilers.
One isolate (4.3 %) was resistant to ampicillin, sulfonamides and tetracyclines in Latvia, while four isolates (15.4 %) were resistant to ampicillin and sulfonamides and one isolate (3.8 %) was resistant to tetracyclines in Poland.
In both Latvia and Poland, no resistance was detected to cefotaxime, chloramphenicol and gentamicin, while resistance to ciprofloxacin and nalidixic acid was recorded in both countries. In Latvia, 16 isolates (69.6 %) were resistant to both antimicrobials, while 14 isolates and 13 isolates (53.8 % and 50.0 %) were resistant to ciprofloxacin and nalidixic acid, respectively.

EU summary report on antimicrobial resistance in zoonotic and indicator bacteriafrom humans, animals and food 2012
EFSA Journal 2014;12(3):3590 46
Table SA10. Resistance (%) to ampicillin, cefotaxime, chloramphenicol, ciprofloxacin, gentamicin, nalidixic acid, sulfonamides and tetracyclines among Salmonella spp. from meat from broilers and spent hens in MSs reporting MIC data in 2012, using harmonised epidemiological cut-off values
Country Ampicillin Cefotaxime Chloramphenicol Ciprofloxacin Gentamicin Nalidixic acid Sulfonamides Tetracyclines N % Res N % Res N % Res N % Res N % Res N % Res N % Res N % Res
Belgium1 43 34.9 43 0 43 0 43 39.5 43 0 43 39.5 43 11.6 43 0 Belgium2 66 0 66 0 66 0 66 0 66 0 66 0 66 0 66 0 Czech Republic 47 4.3 47 0 47 0 47 34.0 47 0 47 34.0 47 34.0 – – Germany 94 39.4 94 12.8 94 18.1 94 70.2 94 3.2 94 58.5 94 58.5 94 48.9 Hungary 164 4.3 168 0.6 168 1.8 168 97.6 168 1.2 168 95.8 168 79.8 168 76.8 Ireland 70 22.9 70 2.9 70 7.1 70 11.4 70 4.3 70 11.4 70 21.4 70 7.1 Latvia 32 9.4 32 0 32 3.1 32 53.1 32 0 32 53.1 32 9.4 32 6.3 Netherlands 74 48.6 74 31.1 74 9.5 74 51.4 72 1.4 74 47.3 74 52.7 74 36.5 Poland 93 23.7 93 0 93 2.2 93 67.7 93 1.1 93 52.7 93 35.5 93 31.2 Portugal 37 24.3 37 0 37 5.4 37 13.5 37 13.5 37 13.5 37 43.2 37 56.8 Romania 189 18.0 189 1.1 189 10.1 189 89.4 189 5.3 189 89.9 189 87.3 189 87.3 Slovakia 14 0 14 0 14 0 14 71.4 14 0 14 71.4 14 71.4 14 71.4 Spain 33 27.3 – – 15 0 33 100 33 45.5 33 21.2 – – 15 26.7 Total (12 MSs) 956 19.9 927 4.3 942 5.9 960 63.1 958 4.2 960 57.3 927 53.0 895 48.9
MS: Member State; MIC: minimum inhibitory concentration; N: number of isolates tested, % Res: percentage of resistant isolates; –: no data reported. 1. Broilers 2. Spent hens
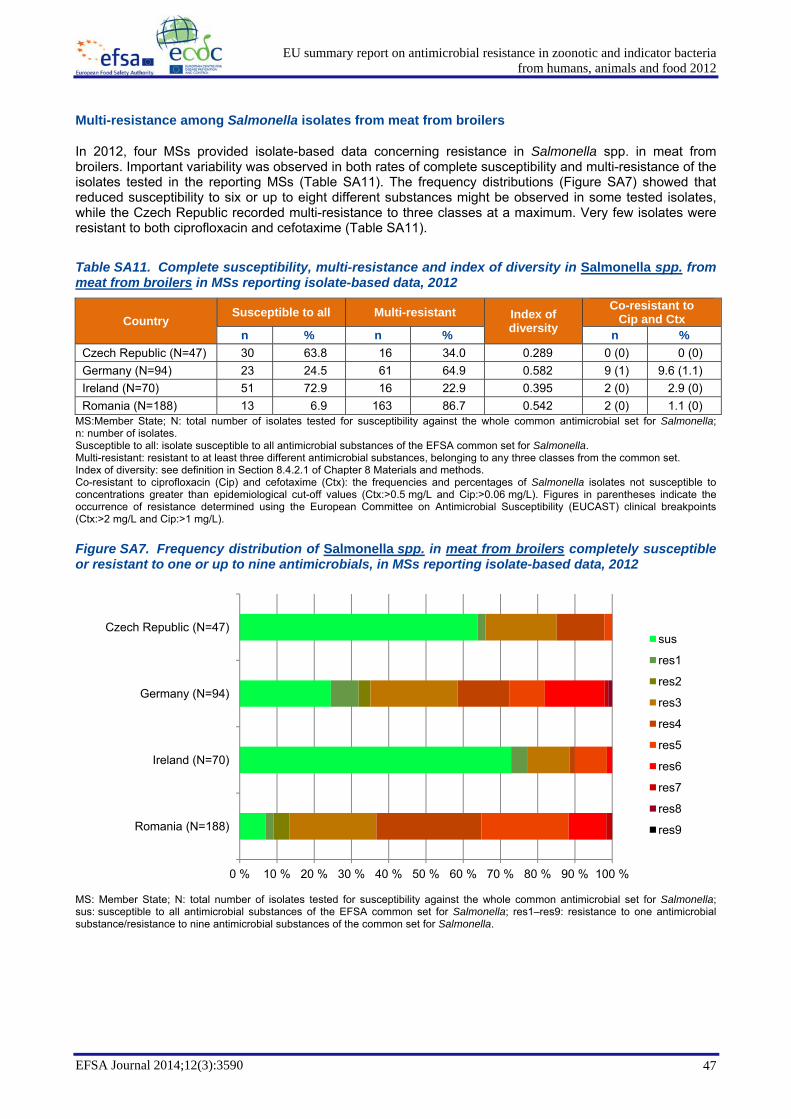
EU summary report on antimicrobial resistance in zoonotic and indicator bacteriafrom humans, animals and food 2012
EFSA Journal 2014;12(3):3590 47
Multi-resistance among Salmonella isolates from meat from broilers
In 2012, four MSs provided isolate-based data concerning resistance in Salmonella spp. in meat from broilers. Important variability was observed in both rates of complete susceptibility and multi-resistance of the isolates tested in the reporting MSs (Table SA11). The frequency distributions (Figure SA7) showed that reduced susceptibility to six or up to eight different substances might be observed in some tested isolates, while the Czech Republic recorded multi-resistance to three classes at a maximum. Very few isolates were resistant to both ciprofloxacin and cefotaxime (Table SA11).
Table SA11. Complete susceptibility, multi-resistance and index of diversity in Salmonella spp. from meat from broilers in MSs reporting isolate-based data, 2012
Country Susceptible to all Multi-resistant Index of
diversity
Co-resistant toCip and Ctx
n % n % n % Czech Republic (N=47) 30 63.8 16 34.0 0.289 0 (0) 0 (0) Germany (N=94) 23 24.5 61 64.9 0.582 9 (1) 9.6 (1.1) Ireland (N=70) 51 72.9 16 22.9 0.395 2 (0) 2.9 (0) Romania (N=188) 13 6.9 163 86.7 0.542 2 (0) 1.1 (0)
MS:Member State; N: total number of isolates tested for susceptibility against the whole common antimicrobial set for Salmonella; n: number of isolates. Susceptible to all: isolate susceptible to all antimicrobial substances of the EFSA common set for Salmonella. Multi-resistant: resistant to at least three different antimicrobial substances, belonging to any three classes from the common set. Index of diversity: see definition in Section 8.4.2.1 of Chapter 8 Materials and methods. Co-resistant to ciprofloxacin (Cip) and cefotaxime (Ctx): the frequencies and percentages of Salmonella isolates not susceptible to concentrations greater than epidemiological cut-off values (Ctx:>0.5 mg/L and Cip:>0.06 mg/L). Figures in parentheses indicate the occurrence of resistance determined using the European Committee on Antimicrobial Susceptibility (EUCAST) clinical breakpoints (Ctx:>2 mg/L and Cip:>1 mg/L).
Figure SA7. Frequency distribution of Salmonella spp. in meat from broilers completely susceptible or resistant to one or up to nine antimicrobials, in MSs reporting isolate-based data, 2012
MS: Member State; N: total number of isolates tested for susceptibility against the whole common antimicrobial set for Salmonella; sus: susceptible to all antimicrobial substances of the EFSA common set for Salmonella; res1–res9: resistance to one antimicrobial substance/resistance to nine antimicrobial substances of the common set for Salmonella.
0 % 10 % 20 % 30 % 40 % 50 % 60 % 70 % 80 % 90 % 100 %
Romania (N=188)
Ireland (N=70)
Germany (N=94)
Czech Republic (N=47)sus
res1
res2
res3
res4
res5
res6
res7
res8
res9

EU summary report on antimicrobial resistance in zoonotic and indicator bacteriafrom humans, animals and food 2012
EFSA Journal 2014;12(3):3590 48
3.4.1.2. Meat from pigs
Twelve MSs reported quantitative MIC data for Salmonella spp. from pig meat in 2012. Data for S. Enteritidis isolates are not presented separately for meat from pigs as none of the MSs reporting data tested more than 10 isolates. Tables SA12 and SA13 present the level of resistance to selected antimicrobials for Salmonella spp. and S. Typhimurium.
Representative sampling and monitoring
Pig meat sample types collected at the slaughterhouse by Belgium, Estonia, Ireland and Poland consisted mainly of carcase swabs, while different kinds of meat samples (fresh meat, minced meat and meat preparations) were collected by the Czech Republic, Denmark, Estonia, Ireland, Italy and Romania either at meat cutting/processing plants, at retail outlets or at catering outlets. Whether based on official sampling or HACCP and own-check programmes, objective sampling was primarily carried out in MSs reporting information on sampling design. Conversely, Germany, Hungary, Poland and Spain did not report detailed information on the sampling design of meat from pigs used.
Resistance levels in Salmonella spp. isolates from meat from pigs
Salmonella spp. isolated from pig meat mostly displayed high to extremely high occurrence of resistance to ampicillin, tetracyclines and sulfonamides, although resistance varied from not detected (in Latvia on 13 isolates) to very/extremely high levels across the reporting MSs, varying from 0 % to nearly 70 % for ampicillin and sulfonamides and to more than 90 % for tetracyclines. Chloramphenicol resistance remained moderate, at 12.6 %, at MS group level, and ranged from 0 % to 44.4 % among the reporting MSs. Overall, gentamicin resistance was 2.4 % in the reporting group of MSs; it was not detected in seven MSs and ranged between 0.4 % and 31.3 % in the remaining five reporting MSs. The proportion of Salmonella spp. isolates resistant to ciprofloxacin and nalidixic acid was generally low to moderate among the reporting MSs. Once more in 2012, Denmark and Estonia did not detect resistance to either ciprofloxacin or nalidixic acid, and neither did Latvia on the limited number of 13 isolates tested. Resistance to cefotaxime in reporting MSs was either not detected (in eight MSs) or reported at low levels, ranging from 0.6 % to 3.0 %, between the four MSs reporting resistance.
Resistance levels in Salmonella Typhimurium isolates from meat from pigs
Ten MSs reported quantitative MIC data for S. Typhimurium isolates from pig meat in 2012. Although the features of the resistance in S. Typhimurium parallel those observed in Salmonella spp., resistance levels to most of the antimicrobials in S. Typhimurium isolates were typically higher than the levels reported in Salmonella spp. isolates in the vast majority of reporting MSs. Contrastingly, in Denmark, S. Typhimurium isolates presented lower levels of resistance to ampicillin, sulfonamides and tetracyclines than the overall group of Salmonella spp. isolates. The 13 S. Typhimurium isolates tested in Latvia did not exhibit resistance to any of the antimicrobials tested.
Resistance levels in monophasic Salmonella Typhimurium isolates from meat from pigs
As low numbers of isolates of monophasic S. Typhimurium (fewer than 10) were recovered from meat from pigs in the Czech Republic, Greece, Hungary, Italy, the Netherlands and Slovakia, these countries have been excluded from the detailed analysis, leaving only Denmark, Germany and Ireland contributing to the analysis; thus, there are insufficient data to present a specific table.
Denmark detected no resistance to cefotaxime, gentamicin, ciprofloxacin and nalidixic acid. In both Germany and Ireland, no resistance was detected to cefotaxime. Resistance was detected against ampicillin, sulfonamides and tetracyclines at extremely high levels ranging from 73.9 % to 100 %. One isolate (2.7 %) was resistant to both ciprofloxacin and nalidixic acid in Germany, whilst Ireland reported no resistance for these antimicrobials. One isolate (4.5 %) was resistant to chloramphenicol in Denmark, nine (24.3 %) in Germany and two (8.7 %) in Ireland. Denmark detected no resistance to gentamicin whilst one isolate and two isolates (2.7 % and 8.7 %, respectively) were resistant to gentamicin in Germany and Ireland, respectively.

EU summary report on antimicrobial resistance in zoonotic and indicator bacteriafrom humans, animals and food 2012
EFSA Journal 2014;12(3):3590 49
Table SA12. Resistance (%) to ampicillin, cefotaxime, chloramphenicol, ciprofloxacin, gentamicin, nalidixic acid, sulfonamides and tetracyclines among Salmonella spp. isolates from meat from pigs in MSs reporting MIC data in 2012, using harmonised epidemiological cut-off values
Country Ampicillin Cefotaxime Chloramphenicol Ciprofloxacin Gentamicin Nalidixic acid Sulfonamides Tetracyclines N % Res N % Res N % Res N % Res N % Res N % Res N % Res N % Res
Belgium 262 60.7 262 1.5 262 11.5 262 1.1 262 0.4 262 1.1 262 60.3 262 45.4 Czech Republic 33 42.4 33 3.0 33 12.1 33 6.1 33 0 33 6.1 33 51.5 – – Denmark1 41 56.1 41 0 41 2.4 41 0 41 0 41 0 41 61.0 41 51.2 Estonia 22 4.5 22 0 22 4.5 22 0 22 0 22 0 22 13.6 22 9.1 Germany 163 49.1 163 0.6 163 14.1 163 6.1 163 0.6 163 5.5 163 50.3 163 49.1 Hungary 16 68.8 16 0 16 31.3 16 12.5 16 0 16 12.5 16 56.3 16 93.8 Ireland 69 53.6 69 0 69 17.4 69 1.4 69 4.3 69 1.4 69 69.6 69 66.7 Italy 85 41.2 85 0 85 10.6 85 1.2 85 2.4 85 1.2 85 50.6 85 58.8 Latvia 13 0 13 0 13 0 13 0 13 0 13 0 13 0 13 0 Netherlands 52 28.8 52 0 52 1.9 52 3.8 51 0 52 3.8 52 42.3 52 34.6 Poland 31 22.6 22 0 31 9.7 31 16.1 31 0 11 9.1 31 16.1 31 32.3 Romania 125 37.6 125 1.6 125 16.0 125 10.4 125 4.8 125 11.2 125 60.8 125 54.4 Spain 34 58.8 – – 18 44.4 34 97.1 32 31.3 34 11.8 – – 18 66.7 Total (13 MSs) 946 47.5 903 0.9 930 12.6 946 7.6 943 2.4 926 4.2 912 53.5 897 49.2
MS: Member State; MIC: minimum inhibitory concentration; N: total number of isolates tested; % Res: percentage of resistant isolates; –: no data reported. 1. Denmark reported only monophasic S. Typhimurium and S. Typhimurium isolates.

EU summary report on antimicrobial resistance in zoonotic and indicator bacteriafrom humans, animals and food 2012
EFSA Journal 2014;12(3):3590 50
Table SA13. Resistance (%) to ampicillin, cefotaxime, chloramphenicol, ciprofloxacin, gentamicin, nalidixic acid, sulfonamides and tetracyclines among S. Typhimurium isolates from meat from pigs in MSs reporting MIC data in 2012, using harmonised epidemiological cut-off values
Country Ampicillin Cefotaxime Chloramphenicol Ciprofloxacin Gentamicin Nalidixic acid Sulfonamides Tetracyclines N % Res N % Res N % Res N % Res N % Res N % Res N % Res N % Res
Belgium 105 73.3 105 1.0 105 13.3 105 1.0 105 0 105 1.0 105 69.5 105 52.4 Denmark 18 27.8 18 0 18 0 18 0 18 0 18 0 18 38.9 18 11.1 Germany 58 51.7 58 0 58 19.0 58 8.6 58 0 58 8.6 58 56.9 58 56.9 Hungary 10 80.0 10 0 10 40.0 10 10.0 10 0 10 10.0 10 60.0 10 100 Ireland 22 63.6 22 0 22 36.4 22 4.5 22 0 22 4.5 22 72.7 22 63.6 Italy 18 100 18 0 18 27.8 18 0 18 0 18 0 18 100 18 100 Latvia 13 0 13 0 13 0 13 0 13 0 13 0 13 0 13 0 Netherlands 16 50.0 16 0 16 6.3 16 6.3 16 0 16 6.3 16 50.0 16 50.0 Poland 11 45.5 11 0 11 18.2 11 9.1 11 0 11 9.1 11 45.5 11 63.6 Romania 43 62.8 43 2.3 43 34.9 43 18.6 43 2.3 43 14.0 42 66.7 42 71.4 Total (10 MSs) 314 61.1 314 0.6 314 19.1 314 5.7 314 0.3 314 5.1 313 62.0 313 56.5
MS: Member State; MIC: minimum inhibitory concentration; N: number of isolates tested; % Res: percentage of resistant isolates.

EU summary report on antimicrobial resistance in zoonotic and indicator bacteriafrom humans, animals and food 2012
EFSA Journal 2014;12(3):3590 51
Multi-resistance among Salmonella spp. isolates from meat from pigs
In 2012, seven MSs provided isolate-based data concerning resistance in Salmonella spp. in meat from pigs. In most cases, complete susceptibility in the isolates tested ranged between 20 % and 40 % and multi-resistance was typically high to very high. Contrastingly, complete susceptibility reached above 85 % and multiresistance was lower than 15 % in Estonia, although these figures were assessed on an isolate sample of small size (Table SA14). The frequency distributions (Figure SA8) showed similarities among the multi-resistance recorded in three reporting MSs, with some isolates showing reduced susceptibility to up to six or seven different substances, while Estonia recorded multi-resistance to four classes at a maximum. Very few isolates were resistant to both ciprofloxacin and cefotaxime in a single MS (Table SA14).
Table SA14. Complete susceptibility, multi-resistance and index of diversity in Salmonella spp. from meat from pigs in MSs reporting isolate-based data, 2012
Country Susceptible to all Multi-resistant Index of
diversity
Co-resistant toCip and Ctx
n % n % n % Czech Republic (N=33) 12 36.4 14 42.4 0.464 0 (0) 0 (0) Denmark1 (N=41) 12 29.3 24 58.5 0.315 0 (0) 0 (0) Estonia (N=22) 19 86.4 3 13.6 0.189 0 (0) 0 (0) Germany (N=163) 62 38.0 79 48.5 0.46 0 (0) 0 (0) Ireland (N=69) 15 21.7 41 59.4 0.545 0 (0) 0 (0) Italy (N=85) 32 37.6 43 50.6 0.5 0 (0) 0 (0) Romania (N=125) 30 24.0 70 56.0 0.427 1 (0) 0.8 (0)
MS: Member State; N: total number of isolates tested for susceptibility against the whole common antimicrobial set for Salmonella; n: number of isolates. Susceptible to all: isolate susceptible to all antimicrobial substances of the EFSA common set for Salmonella. Multi-resistant: resistant to at least three different antimicrobial substances, belonging to any three classes from the common set. Index of diversity: see definition in Section 8.4.2.1 of Chapter 8 Materials and methods. Co-resistant to ciprofloxacin (Cip) and cefotaxime (Ctx): the frequencies and percentages of Salmonella isolates not susceptible to concentrations greater than epidemiological cut-off values (Ctx:>0.5 mg/L and Cip:>0.06 mg/L). Figures in parentheses indicate the occurrence of resistance determined using the European Committee on Antimicrobial Susceptibility (EUCAST) clinical breakpoints (Ctx:>2 mg/L and Cip:>1 mg/L). 1. Denmark reported only monophasic S. Typhimurium and S. Typhimurium isolates.
Figure SA8. Frequency distribution of Salmonella spp. in meat from pigs completely susceptible or resistant to one or up to nine antimicrobials, in MSs reporting isolate-based data, 2012
MS: Member State; N: total number of isolates tested for susceptibility against the whole common antimicrobial set for Salmonella; sus: susceptible to all antimicrobial substances of the EFSA common set for Salmonella; res1–res9: resistance to one antimicrobial substance/resistance to nine antimicrobial substances of the common set for Salmonella. Note: Denmark reported only monophasic S. Typhimurium and S. Typhimurium isolates.
0 % 10 % 20 % 30 % 40 % 50 % 60 % 70 % 80 % 90 % 100 %
Romania (N=125)
Italy (N=85)
Ireland (N=69)
Germany (N=163)
Estonia (N=22)
Denmark (N=41)
Czech Republic (N=33)sus
res1
res2
res3
res4
res5
res6
res7
res8
res9

EU summary report on antimicrobial resistance in zoonotic and indicator bacteriafrom humans, animals and food 2012
EFSA Journal 2014;12(3):3590 52
3.4.1.3. Meat from bovine animals
Five MSs reported quantitative MIC data for Salmonella spp. from bovine meat in 2012. Table SA15 presents the level of resistance to selected antimicrobials for Salmonella spp. isolates.
Representative sampling and monitoring
Monitoring and surveillance programmes for Salmonella spp. in meat from bovine animals are in place in Germany, Ireland, Italy, the Netherlands and Spain, while surveillance of HACCP and own checks submissions takes place in Ireland. Sample types collected by MSs at slaughterhouses consisted of carcase swabs. Germany, Ireland, the Netherlands and Spain tested meat, without details about sampling stage. Italy tested meat preparations at retail outlets.
Resistance levels in Salmonella spp. isolates from meat from bovine animals
Among the five reporting MSs, Salmonella spp. isolated from meat from bovine animals generally displayed high levels of resistance to ampicillin, sulfonamides and tetracyclines, varying from 20.8 % to 78.6 % for ampicillin, 25.0 % to 55.6 % for sulfonamides and 10.0 % to 61.5 % for tetracyclines. Chloramphenicol resistance was low, at 9.9 %, at MS group level, and ranged from 0 % to 25.0 % across the reporting MSs, with the Netherlands and Spain detecting no resistance. Gentamicin resistance was only detected in Spain (57.1 %). Resistance to either ciprofloxacin or nalidixic acid was generally similar among the reporting MSs, ranging from no resistance detected to low/moderate levels, with the notable exception of Spain reporting high resistance to nalidixic acid (28.6 %) and extremely high resistance to ciprofloxacin (100 %). The occurrence of resistance to cefotaxime was generally not detected in reporting MSs, as only the Netherlands reported 5.6 % resistance.
Multi-resistance among Salmonella spp. isolates from meat from bovine animals
As only three MSs reported resistance for isolate-based data on 10 or more isolates of Salmonella spp. from meat from bovine animals, the corresponding multi-resistance analysis is not presented in this report.
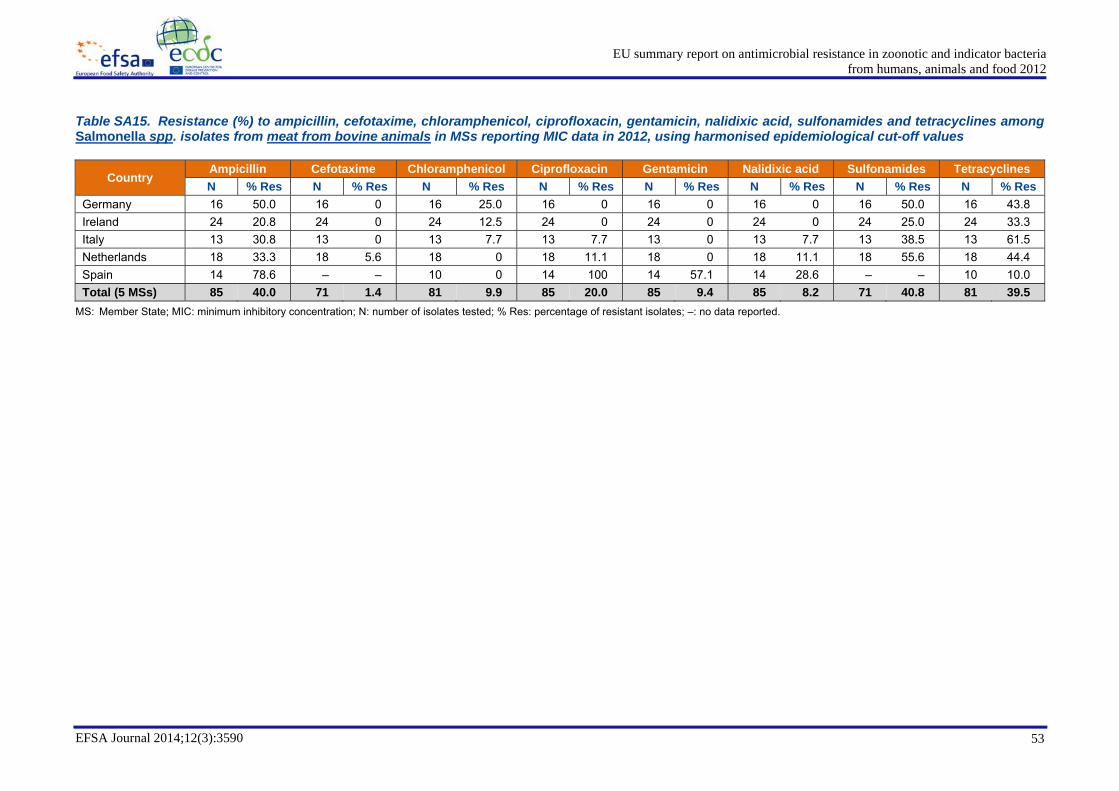
EU summary report on antimicrobial resistance in zoonotic and indicator bacteria from humans, animals and food 2012
EFSA Journal 2014;12(3):3590 53
Table SA15. Resistance (%) to ampicillin, cefotaxime, chloramphenicol, ciprofloxacin, gentamicin, nalidixic acid, sulfonamides and tetracyclines among Salmonella spp. isolates from meat from bovine animals in MSs reporting MIC data in 2012, using harmonised epidemiological cut-off values
Country Ampicillin Cefotaxime Chloramphenicol Ciprofloxacin Gentamicin Nalidixic acid Sulfonamides Tetracyclines N % Res N % Res N % Res N % Res N % Res N % Res N % Res N % Res
Germany 16 50.0 16 0 16 25.0 16 0 16 0 16 0 16 50.0 16 43.8 Ireland 24 20.8 24 0 24 12.5 24 0 24 0 24 0 24 25.0 24 33.3 Italy 13 30.8 13 0 13 7.7 13 7.7 13 0 13 7.7 13 38.5 13 61.5 Netherlands 18 33.3 18 5.6 18 0 18 11.1 18 0 18 11.1 18 55.6 18 44.4 Spain 14 78.6 – – 10 0 14 100 14 57.1 14 28.6 – – 10 10.0 Total (5 MSs) 85 40.0 71 1.4 81 9.9 85 20.0 85 9.4 85 8.2 71 40.8 81 39.5
MS: Member State; MIC: minimum inhibitory concentration; N: number of isolates tested; % Res: percentage of resistant isolates; –: no data reported.

EU summary report on antimicrobial resistance in zoonotic and indicator bacteriafrom humans, animals and food 2012
EFSA Journal 2014;12(3):3590 54
3.4.2. Antimicrobial resistance in Salmonella isolates from animals
3.4.2.1. Domestic fowl (Gallus gallus)
In 2012, 16 MSs submitted quantitative antimicrobial susceptibility data for Salmonella spp. from Gallus gallus. As in previous years, an overview of all data relating to Gallus gallus including breeding and laying hens and broiler flocks, as well as unspecified flocks of Gallus gallus, is presented. However, as in 2011, data from flocks of broilers, laying hens and breeders are also presented separately.
Representative sampling and monitoring
In the vast majority of MSs, isolates for antimicrobial resistance testing are obtained from national surveillance and control programmes carried out according to the EU legislation. In Latvia, isolates were obtained from faecal samples from broilers before slaughter and from laying hens on the farm.
Resistance levels in Salmonella spp. isolates from Gallus gallus
Table SA16 shows the level of resistance to antimicrobials among isolates of Salmonella spp. from Gallus gallus in 2012. There was generally high resistance reported to ampicillin, sulfonamides and tetracyclines in the reporting MS group, although the levels of resistance varied between 0 % and 44.4 % for ampicillin, between 0 % and 57.5 % for sulfonamides and between 6.3 % and 55.9 % for tetracyclines across the 16 reporting countries. Resistance to chloramphenicol and gentamicin was mostly either not detected or reported at low levels among the reporting MSs. The levels of resistance to ciprofloxacin and nalidixic acid were mostly moderate to very high within individual MSs, although four MSs did not detect resistance or reported low resistance to these compounds. This considerable disparity in resistance to ciprofloxacin and nalidixic acid among Salmonella isolates, from different MSs, may reflect the variability of serovars of Salmonella spp. included in the analyses of the different MSs. Cefotaxime resistance was reported by 11 of the 16 reporting MSs at low levels, with the exception of Belgium which reported for the first time in 2012 susceptibility results at a level of 18.1 %.
Resistance levels in Salmonella spp. isolates from broilers
Thirteen MSs reported quantitative data on resistance among isolates of Salmonella spp. from broiler flocks in 2012 (Table SA17). Resistance to ampicillin and tetracyclines varied from low to high levels among the reporting MSs, while resistance to sulfonamides was moderate to high in all reporting MSs. For chloramphenicol and gentamicin, absence or low levels of resistance were mostly reported, as only Romania reported moderate resistance to these substances. Resistance to ciprofloxacin and nalidixic acid was generally high in the reporting MSs, although Denmark, Ireland and the United Kingdom reported either no resistance or low levels of resistance to both compounds. Cefotaxime resistance was either not detected or observed at very low and low levels, with the exception of Italy which reported a moderate resistance at 13.3 %. In general, the levels of resistance in broiler flocks were slightly higher than those reported when all Gallus gallus were considered, as this category includes data from broilers, laying hens and breeders.
Resistance levels in Salmonella spp. isolates from laying hens
Twelve MSs reported quantitative data on resistance among isolates of Salmonella spp. from laying hens in 2012 (Table SA18). Resistance to ampicillin, sulfonamides and tetracyclines was generally reported at low to moderate levels across the reporting MSs, with the exception of Romania reporting high resistance to these substances. Resistance to chloramphenicol and gentamicin was either not detected or recorded at low levels, ranging from 0 % to 3.7 % and from 0 % to 6.2 %, respectively. Portugal reported resistance only to ciprofloxacin (9.4 %) and nalidixic acid (12.5 %). Resistance to ciprofloxacin and nalidixic acid was generally reported at moderate to high levels, while Germany, the Netherlands and the United Kingdom recorded low resistance to these substances. Latvia observed no resistance to both compounds. Cefotaxime resistance was observed only by Austria and Italy at low levels of 1.6 % and 1.2 %. Generally, resistance in laying hens was similar to or lower than that reported in broilers.

EU summary report on antimicrobial resistance in zoonotic and indicator bacteriafrom humans, animals and food 2012
EFSA Journal 2014;12(3):3590 55
Resistance levels in Salmonella spp. isolates from breeding flocks
Quantitative data on isolates of Salmonella spp. from breeding flocks of Gallus gallus were reported by four MSs in 2012 (Table SA19). The breeder categories reported were: unspecified breeding flocks, unspecified grandparent breeding flocks, parent breeding flocks for the broiler production line and elite breeding flocks for egg production line. The levels of resistance among isolates from breeding flocks of Gallus gallus were generally higher than those observed in laying hens. The occurrence of resistance to ampicillin, sulfonamides and tetracyclines was high across the reporting MSs (22.7 %, 20.9 % and 32.5 %, respectively). High levels of resistance to ciprofloxacin and nalidixic acid were observed at the MS group level (25.5 % and 22.7 % respectively), but these levels were at almost half of the level reported for broilers. For these antimicrobials, reported resistance levels ranged from 7.4 % to 53.1 %. The Czech Republic and Poland reported no resistance to cefotaxime, chloramphenicol and gentamicin. The overall occurrence of gentamicin resistance, considering all reporting MSs, was 5.5 %. Cefotaxime resistance was reported by two MSs with an overall resistance at MS group level of 1.8 %.

EU summary report on antimicrobial resistance in zoonotic and indicator bacteriafrom humans, animals and food 2012
EFSA Journal 2014;12(3):3590 56
Table SA16. Resistance (%) to ampicillin, cefotaxime, chloramphenicol, ciprofloxacin, gentamicin, nalidixic acid, sulfonamides and tetracyclines among Salmonella spp. isolates from Gallus gallus in MSs reporting MIC data in 2012, using harmonised epidemiological cut-off values
Country Ampicillin Cefotaxime Chloramphenicol Ciprofloxacin Gentamicin Nalidixic acid Sulfonamides Tetracyclines N % Res N % Res N % Res N % Res N % Res N % Res N % Res N % Res
Austria 176 4.0 176 0.6 176 1.1 176 18.2 176 0.6 176 16.5 176 17.0 176 22.7 Belgium 664 44.4 664 18.1 664 7.1 664 39.0 664 3.5 664 37.0 664 37.0 664 24.4 Czech Republic 386 4.7 386 0.3 386 0 386 19.4 386 1.3 386 19.2 386 18.1 – – Denmark 28 32.1 28 0 28 0 28 0 28 0 28 0 28 28.6 28 32.1 Germany 238 6.7 238 0.8 238 2.1 238 14.3 238 0 238 22.7 238 15.5 238 13.0 Hungary 261 9.2 261 0.4 261 1.1 261 69.0 261 1.9 261 67.4 261 57.5 261 55.9 Ireland 38 10.5 38 0 38 0 38 2.6 38 0 38 2.6 38 10.5 38 7.9 Italy 328 21.3 328 5.2 328 4.0 328 23.8 328 2.4 328 23.5 328 18.0 328 25.3 Latvia 14 7.1 14 0 14 0 14 0 14 0 14 0 14 0 14 7.1 Netherlands 192 22.9 192 4.2 192 3.1 192 18.2 192 5.2 192 16.1 192 15.1 192 9.4 Poland 739 7.8 739 0.7 739 2.2 738 39.2 739 0 739 35.0 734 12.1 739 8.4 Portugal 79 6.3 174 2.3 174 2.9 174 23.6 174 0 174 21.8 174 10.9 174 6.3 Romania 964 41.2 964 5.3 964 10.9 964 68.4 964 15.7 964 58.6 964 52.9 964 47.4 Slovakia 85 0 85 0 85 0 85 30.6 85 0 85 30.6 85 25.9 85 25.9 Spain 179 9.5 179 0.6 179 1.1 179 22.3 179 3.4 179 19.0 179 8.4 179 12.3 United Kingdom 236 4.7 236 0 236 2.1 236 2.1 236 4.2 236 2.1 236 17.4 236 21.6 Total (16 MSs) 4,607 21.2 4,702 4.5 4,702 4.4 4,701 37.3 4,702 4.7 4,702 34.3 4,697 28.3 4,316 25.9
MS: Member State; MIC: minimum inhibitory concentration; N: number of isolates tested; % Res: percentage of resistant isolates; –: no data reported.

EU summary report on antimicrobial resistance in zoonotic and indicator bacteriafrom humans, animals and food 2012
EFSA Journal 2014;12(3):3590 57
Table SA17. Resistance (%) to ampicillin, cefotaxime, chloramphenicol, ciprofloxacin, gentamicin, nalidixic acid, sulfonamides and tetracyclines among Salmonella spp. isolates from broilers in MSs reporting MIC data in 2012, using harmonised epidemiological cut-off values
Country Ampicillin Cefotaxime Chloramphenicol Ciprofloxacin Gentamicin Nalidixic acid Sulfonamides Tetracyclines N % Res N % Res N % Res N % Res N % Res N % Res N % Res N % Res
Austria 113 3.5 113 0 113 0 113 22.1 113 0 113 22.1 113 18.6 113 23.9 Czech Republic 351 4.0 351 0.3 351 0 351 20.8 351 1.4 351 20.5 351 19.4 – – Denmark 24 29.2 24 0 24 0 24 0 24 0 24 0 24 29.2 24 29.2 Hungary 175 6.9 175 0.6 175 1.1 175 90.3 175 1.1 175 90.3 175 77.7 175 73.7 Ireland 38 10.5 38 0 38 0 38 2.6 38 0 38 2.6 38 10.5 38 7.9 Italy 105 37.1 105 13.3 105 4.8 105 32.4 105 6.7 105 30.5 105 31.4 105 38.1 Netherlands 130 27.7 130 6.2 130 3.1 130 24.6 130 7.7 130 21.5 130 16.9 130 6.2 Poland 189 6.3 189 0.5 189 0.5 189 40.7 189 0 189 36.5 189 14.8 189 10.1 Portugal 27 18.5 122 3.3 122 4.1 122 27.9 122 0 122 26.2 122 15.6 122 9.0 Romania 784 43.9 784 6.4 784 12.2 784 73.0 784 17.5 784 62.0 784 57.4 784 48.7 Slovakia 55 0 55 0 55 0 55 41.8 55 0 55 41.8 55 34.5 55 34.5 Spain 29 34.5 29 3.4 29 3.4 29 65.5 29 13.8 29 62.1 29 20.7 29 31.0 United Kingdom 170 5.3 170 0 170 2.9 170 2.4 170 5.9 170 2.4 170 21.8 170 25.3 Total (13 MSs) 2,190 22.6 2,285 3.5 2,285 5.2 2,285 46.0 2,285 7.7 2,285 41.5 2,285 37.2 1,934 36.0
MS: Member State; MIC: minimum inhibitory concentration; N: number of isolates tested; % Res: percentage of resistant isolates; –: no data reported.

EU summary report on antimicrobial resistance in zoonotic and indicator bacteriafrom humans, animals and food 2012
EFSA Journal 2014;12(3):3590 58
Table SA18. Resistance (%) to ampicillin, cefotaxime, chloramphenicol, ciprofloxacin, gentamicin, nalidixic acid, sulfonamides and tetracyclines among Salmonella spp. isolates from laying hens in MSs reporting MIC data in 2012, using harmonised epidemiological cut-off values
Country Ampicillin Cefotaxime Chloramphenicol Ciprofloxacin Gentamicin Nalidixic acid Sulfonamides Tetracyclines N % Res N % Res N % Res N % Res N % Res N % Res N % Res N % Res
Austria 63 4.8 63 1.6 63 3.2 63 11.1 63 1.6 63 6.3 63 14.3 63 20.6 Germany 51 3.9 51 0 51 2.0 51 2.0 51 0 51 2.0 51 9.8 51 2.0 Hungary 86 14.0 86 0 86 1.2 86 25.6 86 3.5 86 20.9 86 16.3 86 19.8 Italy 161 15.5 161 1.2 161 3.1 161 18.0 161 0 161 18.0 161 10.6 161 16.8 Latvia 14 7.1 14 0 14 0 14 0 14 0 14 0 14 0 14 7.1 Netherlands 54 3.7 54 0 54 3.7 54 5.6 54 0 54 5.6 54 1.9 54 5.6 Poland 132 5.3 132 0 132 0 132 25.8 132 0 132 22.0 132 5.3 132 0.8 Portugal 32 0 32 0 32 0 32 9.4 32 0 32 12.5 32 0 32 0 Romania 145 22.1 145 0 145 2.8 145 46.2 145 6.2 145 43.4 145 30.3 145 37.2 Slovakia 29 0 29 0 29 0 29 10.3 29 0 29 10.3 29 10.3 29 10.3 Spain 150 4.7 150 0 150 0.7 150 14.0 150 1.3 150 10.7 150 6.0 150 8.7 United Kingdom 66 3.0 66 0 66 0 66 1.5 66 0 66 1.5 66 6.1 66 12.1 Total (12 MSs) 983 9.5 983 0.3 983 1.6 983 19.4 983 1.5 983 17.4 983 11.5 983 14.3
MS: Member State; MIC: minimum inhibitory concentration; N: number of isolates tested; % Res: percentage of resistant isolates.
Table SA19. Resistance (%) to ampicillin, cefotaxime, chloramphenicol, ciprofloxacin, gentamicin, nalidixic acid, sulfonamides and tetracyclines among Salmonella spp. isolates from breeders of Gallus gallus in MSs reporting MIC data in 2012, using harmonised epidemiological cut-off values
Country Ampicillin Cefotaxime Chloramphenicol Ciprofloxacin Gentamicin Nalidixic acid Sulfonamides Tetracyclines N % Res N % Res N % Res N % Res N % Res N % Res N % Res N % Res
Czech Republic 27 11.1 27 0 27 0 27 7.4 27 0 27 7.4 27 7.4 – – Italy 36 8.3 36 2.8 36 2.8 36 16.7 36 2.8 36 19.4 36 13.9 36 22.2 Poland 15 0 15 0 15 0 15 20.0 15 0 15 20.0 15 0 15 0 Romania 32 59.4 32 3.1 32 15.6 32 53.1 32 15.6 32 40.6 32 50.0 32 59.4 Total (4 MSs) 110 22.7 110 1.8 110 5.5 110 25.5 110 5.5 110 22.7 110 20.9 83 32.5
MS: Member State; MIC: minimum inhibitory concentration; N: number of isolates tested; % Res: percentage of resistant isolates; –: no data reported.

EU summary report on antimicrobial resistance in zoonotic and indicator bacteriafrom humans, animals and food 2012
EFSA Journal 2014;12(3):3590 59
Resistance levels in Salmonella Enteritidis isolates from Gallus gallus
Susceptibility data on S. Enteritidis isolates from Gallus gallus were reported by 13 MSs in 2012 (Table SA20). Resistance to ampicillin, sulfonamides and tetracyclines was generally not detected or recorded at low levels in most MSs, with the exceptions of Belgium and Romania which reported moderate to high levels of resistance to these substances. Chloramphenicol and gentamicin resistance was often rarely detected or recorded at low levels; resistance to these substances in the reporting MS group equalled 0.8 % and 0.4 %, respectively. In contrast to the other antimicrobials tested, the occurrence of ciprofloxacin and nalidixic acid resistance varied substantially, from 0 % to 88.9 % for ciprofloxacin, and, from 0 % to 92.6 % for nalidixic acid, among three distinct groups of reporting MSs. While seven MSs either did not detect any resistance or recorded low resistance, two MSs reported moderate resistance and the four remaining MSs, high to extremely high resistance. Once more, the levels of ciprofloxacin and nalidixic acid resistance, within each MS, were generally very similar, as would be expected. Resistance to cefotaxime in S. Enteritidis was reported only by Belgium, Poland and Portugal in 2012, making the overall resistance at MS group level low at 1.3 %. Interestingly, Germany did not observe any resistance to the substances tested in the S. Enteritidis isolates from Gallus gallus.
Resistance levels in Salmonella Enteritidis isolates from broilers
Six MSs reported quantitative data on isolates of S. Enteritidis from broiler flocks in 2012 (Table SA20). Among the six reporting MSs, the overall resistance to ampicillin was low, at 3.2 %, and no resistance was reported by the Czech Republic and Slovakia. The overall levels of resistance to sulfonamides and tetracyclines were 2.7 % and 3.0 %, respectively. Austria was the only country to report no resistance to ciprofloxacin and nalidixic acid among isolates of S. Enteritidis from broiler flocks. Portugal was the only country to observe resistance to cefotaxime, at the low level of 5.3 %.
Resistance levels in Salmonella Enteritidis isolates from laying hens
Quantitative data on isolates of S. Enteritidis from laying hens were reported by 10 MSs in 2012 (Table SA20). The levels of resistance among isolates from laying hens were generally either similar (Poland, Slovakia) or higher (Romania) than those observed in broiler flocks, when considering the MSs reporting for both populations. Austria, Germany and Slovakia did not observe resistance to any of the antimicrobials tested. The occurrence of resistance to ampicillin, sulfonamides and tetracyclines was low across the reporting MSs (4.1 %, 4.7 % and 3.6 %, respectively). Only four MSs observed resistance to sulfonamides and tetracyclines with values varying from 2.3 % to 18.2 % and from 2.3 % to 15.2 %, respectively. Moderate levels of resistance to ciprofloxacin and nalidixic acid were observed at the MSs group level (18.5 % and 17.1 %, respectively). For these antimicrobials, reported resistance levels reported ranged from 0 % to 36.3 %. No resistance was observed to cefotaxime and chloramphenicol. Hungary and Romania were the only countries to report resistance to gentamicin at low levels of 4.0 % and 1.5 %, respectively.

EU summary report on antimicrobial resistance in zoonotic and indicator bacteriafrom humans, animals and food 2012
EFSA Journal 2014;12(3):3590 60
Table SA20. Resistance (%) to ampicillin, cefotaxime, chloramphenicol, ciprofloxacin, gentamicin, nalidixic acid, sulfonamides and tetracyclines among S. Enteritidis isolates from Gallus gallus in MSs reporting MIC data in 2012, using harmonised epidemiological cut-off values
Country Ampicillin Cefotaxime Chloramphenicol Ciprofloxacin Gentamicin Nalidixic acid Sulfonamides Tetracyclines N % Res N % Res N % Res N % Res N % Res N % Res N % Res N % Res
All Gallus gallus Austria 36 2.8 36 0 36 0 36 0 36 0 36 0 36 0 36 0 Belgium 81 23.5 81 14.8 81 6.2 81 17.3 81 2.5 81 16.0 81 16.0 81 11.1 Czech Republic 251 0 251 0 251 0 251 1.2 251 0 251 0.8 251 0.4 – – Germany 80 0 80 0 80 0 80 0 80 0 80 0 80 0 80 0 Hungary 26 3.8 26 0 26 0 26 0 26 3.8 26 0 26 3.8 26 0 Italy 31 3.2 31 0 31 0 31 12.9 31 0 31 12.9 31 3.2 31 6.5 Latvia 11 9.1 11 0 11 0 11 0 11 0 11 0 11 0 11 9.1 Netherlands 38 2.6 38 0 38 0 38 7.9 38 0 38 7.9 38 0 38 0 Poland 496 6.9 496 0.6 496 0.4 496 43.3 496 0 496 39.3 496 3.8 496 0.8 Portugal 27 7.4 27 3.7 27 3.7 27 88.9 27 0 27 92.6 27 3.7 27 7.4 Romania 76 7.9 76 0 76 2.6 76 27.6 76 2.6 76 27.6 76 22.4 76 18.4 Slovakia 47 0 47 0 47 0 47 2.1 47 0 47 2.1 47 0 47 0 Spain 45 4.4 45 0 45 0 45 28.9 45 0 45 28.9 45 2.2 45 2.2 Total (13 MSs) 1,245 5.5 1,245 1.3 1,245 0.8 1,245 23.9 1,245 0.4 1,245 22.2 1,245 4.3 994 3.3
MS: Member State; MIC: minimum inhibitory concentration; N: number of isolates tested; % Res: percentage of resistant isolates; –: no data reported. Note: Data reported under 'All Gallus gallus' include data which have been reported by production level. Table continued overleaf.

EU summary report on antimicrobial resistance in zoonotic and indicator bacteriafrom humans, animals and food 2012
EFSA Journal 2014;12(3):3590 61
Table SA20 (continued.) Resistance (%) to ampicillin, cefotaxime, chloramphenicol, ciprofloxacin, gentamicin, nalidixic acid, sulfonamides and tetracyclines among S. Enteritidis isolates from Gallus gallus in MSs reporting MIC data in 2012, using harmonised epidemiological cut-off values
Country Ampicillin Cefotaxime Chloramphenicol Ciprofloxacin Gentamicin Nalidixic acid Sulfonamides Tetracyclines N % Res N % Res N % Res N % Res N % Res N % Res N % Res N % Res
Broiler flocks Austria 21 4.8 21 0 21 0 21 0 21 0 21 0 21 0 21 0 Czech Republic 236 0 236 0 236 0 236 1.3 236 0 236 0.8 236 0.4 – – Poland 131 6.1 131 0 131 0 131 39.7 131 0 131 35.9 131 3.8 131 0 Portugal 19 10.5 19 5.3 19 5.3 19 100 19 0 19 100 19 5.3 19 10.5 Romania 10 30.0 10 0 10 20.0 10 50.0 10 10.0 10 50.0 10 50.0 10 40.0 Slovakia 21 0 21 0 21 0 21 4.8 21 0 21 4.8 21 0 21 0 Total (6 MSs) 438 3.2 438 0.2 438 0.7 438 18.3 438 0.2 438 16.9 438 2.7 202 3.0
Laying hen flocks Austria 15 0 15 0 15 0 15 0 15 0 15 0 15 0 15 0 Germany 21 0 21 0 21 0 21 0 21 0 21 0 21 0 21 0 Hungary 25 4.0 25 0 25 0 25 0 25 4.0 25 0 25 4.0 25 0 Italy 28 3.6 28 0 28 0 28 14.3 28 0 28 14.3 28 0 28 3.6 Latvia 11 9.1 11 0 11 0 11 0 11 0 11 0 11 0 11 9.1 Netherlands 38 2.6 38 0 38 0 38 7.9 38 0 38 7.9 38 0 38 0 Poland 91 6.6 91 0 91 0 91 36.3 91 0 91 30.8 91 3.3 91 0 Romania 66 4.5 66 0 66 0 66 24.2 66 1.5 66 24.2 66 18.2 66 15.2 Slovakia 25 0 25 0 25 0 25 0 25 0 25 0 25 0 25 0 Spain 43 4.7 43 0 43 0 43 25.6 43 0 43 25.6 43 2.3 43 2.3 Total (10 MSs) 363 4.1 363 0 363 0 363 18.5 363 0.6 363 17.1 363 4.7 363 3.6
MS: Member State; MIC: minimum inhibitory concentration; N: number of isolates tested; % Res: percentage of resistant isolates; –: no data reported. Note: Data reported under 'All Gallus gallus' include data which have been reported by production level.

EU summary report on antimicrobial resistance in zoonotic and indicator bacteriafrom humans, animals and food 2012
EFSA Journal 2014;12(3):3590 62
Resistance levels in Salmonella Typhimurium isolates from Gallus gallus
Five MSs reported quantitative MIC antimicrobial susceptibility data for S. Typhimurium isolates from Gallus gallus in 2012 (Table SA21). Only three MSs provided production level information with these data: in Austria and Hungary, two isolates of S. Typhimurium were from broiler flocks and eight were from laying hens. Germany reported 13 isolates from broiler flocks.
The overall level of resistance to ampicillin, sulfonamides and tetracyclines, in the reporting MS group, was higher among S. Typhimurium isolates from Gallus gallus (39.5 %, 46.0 % and 35.5 %, respectively), than in S. Enteritidis isolates and all Salmonella spp. isolates as a whole. All MSs detected resistance to ampicillin, sulfonamides and tetracyclines generally at high levels, and the occurrence of resistance ranged from 7.1 % to 86.7 %, 10.0 % to 86.7 % and 7.1 % to 80.0 %, respectively. Among individual MSs, the level of ciprofloxacin resistance varied from 0 % in Austria, Germany and Hungary, to 66.7 % in Poland. Similarly, the level of resistance to nalidixic acid among individual MSs varied from 0 % in Austria and Hungary, to 60.0 % in Poland. Austria and Belgium reported resistance to gentamicin at low levels of 10.0 % and 2.1 %, respectively. Cefotaxime resistance was observed only by Belgium (10.6 %).
Resistance levels in Salmonella Infantis isolates from Gallus gallus
Nine MSs reported quantitative MIC antimicrobial susceptibility data for S. Infantis isolates from Gallus gallus in 2012 (Table SA22). Only Belgium did not provide production level information with these data.
The resistance to sulfonamides and tetracyclines varied markedly and were generally high to extremely high among the reporting MSs. A similar situation occurred regarding the resistance to ciprofloxacin and nalidixic acid. When reported, resistance to ampicillin varied between low, moderate and high levels. Cefotaxime resistance was not detected or recorded at very low levels by most reporting MSs and was observed at a high level by Italy (27.6 %), at a moderate level by Belgium (14.3 %) and at a low level by Romania (7.6 %).
Resistance levels in Salmonella Kentucky isolates from Gallus gallus
Five MSs reported quantitative MIC antimicrobial susceptibility data for S. Kentucky isolates from Gallus gallus in 2012 (Table SA23). All MSs provided production level information with these data.
Generally, MSs reported resistance to ampicillin, sulfonamides and tetracyclines at high to extremely high levels. Conversely, Ireland recorded low to moderate resistance to these substances. The occurrence of resistance to ciprofloxacin and nalidixic acid was generally extremely high in the reporting MSs, with the exception of Ireland detecting 3 % resistance. Resistance to chloramphenicol was low to moderate. Ireland and Italy were the only MSs not reporting resistance to gentamicin, while the three remaining MSs reported high to extremely high levels of resistance. Cefotaxime resistance was observed only in Italy and Romania at around the 10 % level, making the overall resistance at MS group level 6.3 %.

EU summary report on antimicrobial resistance in zoonotic and indicator bacteriafrom humans, animals and food 2012
EFSA Journal 2014;12(3):3590 63
Table SA21. Resistance (%) to ampicillin, cefotaxime, chloramphenicol, ciprofloxacin, gentamicin, nalidixic acid, sulfonamides and tetracyclines among S. Typhimurium isolates from Gallus gallus in MSs reporting MIC data in 2012, using harmonised epidemiological cut-off values
Country Ampicillin Cefotaxime Chloramphenicol Ciprofloxacin Gentamicin Nalidixic acid Sulfonamides Tetracyclines N % Res N % Res N % Res N % Res N % Res N % Res N % Res N % Res
Austria 10 20.0 10 0 10 20.0 10 0 10 10.0 10 0 10 30.0 10 30.0 Belgium 47 63.8 47 10.6 47 14.9 47 25.5 47 2.1 47 23.4 47 68.1 47 53.2 Germany 42 7.1 42 0 42 7.1 42 0 42 0 42 47.6 42 19.0 42 7.1 Hungary 10 10.0 10 0 10 10.0 10 0 10 0 10 0 10 10.0 10 10.0 Poland 15 86.7 15 0 15 80.0 15 66.7 15 0 15 60.0 15 86.7 15 80.0 Total (5 MSs) 124 39.5 124 4.0 124 20.2 124 17.7 124 1.6 124 32.3 124 46.0 124 35.5
MS: Member State; MIC: minimum inhibitory concentration; N: number of isolates tested; % Res: percentage of resistant isolates.
Table SA22. Resistance (%) to ampicillin, cefotaxime, chloramphenicol, ciprofloxacin, gentamicin, nalidixic acid, sulfonamides and tetracyclines among S. Infantis isolates from Gallus gallus in MSs reporting MIC data in 2012, using harmonised epidemiological cut-off values
Country Ampicillin Cefotaxime Chloramphenicol Ciprofloxacin Gentamicin Nalidixic acid Sulfonamides Tetracyclines N % Res N % Res N % Res N % Res N % Res N % Res N % Res N % Res
Austria 25 0 25 0 25 0 25 96.0 25 0 25 96.0 25 96.0 25 96.0 Belgium 28 21.4 28 14.3 28 0 28 17.9 28 10.7 28 17.9 28 21.4 28 7.1 Czech Republic 52 15.4 52 0 52 0 52 96.2 52 0 52 96.2 52 96.2 – – Hungary 172 4.7 172 0.6 172 1.2 172 94.2 172 0.6 172 95.3 172 83.7 172 79.1 Italy 29 41.4 29 27.6 29 0 29 62.1 29 3.4 29 65.5 29 55.2 29 55.2 Poland 118 3.4 118 0 118 0 118 44.1 118 0 118 44.1 118 44.1 118 39.0 Romania 303 23.4 303 7.6 303 9.2 303 98.3 303 6.3 303 97.0 303 82.8 303 82.8 Slovakia 25 0 25 0 25 0 25 88.0 25 0 25 88.0 25 88.0 25 88.0 Spain 13 0 13 0 13 0 13 7.7 13 0 13 7.7 13 7.7 13 0 Total (9 MSs) 765 14.2 765 4.7 765 3.9 765 82.6 765 3.1 765 82.5 765 74.0 713 69.7
MS: Member State; MIC: minimum inhibitory concentration; N: number of isolates tested; % Res: percentage of resistant isolates; –: no data reported.

EU summary report on antimicrobial resistance in zoonotic and indicator bacteriafrom humans, animals and food 2012
EFSA Journal 2014;12(3):3590 64
Table SA23. Resistance (%) to ampicillin, cefotaxime, chloramphenicol, ciprofloxacin, gentamicin, nalidixic acid, sulfonamides and tetracyclines among S. Kentucky isolates from Gallus gallus in MSs reporting MIC data in 2012, using harmonised epidemiological cut-off values
Country Ampicillin Cefotaxime Chloramphenicol Ciprofloxacin Gentamicin Nalidixic acid Sulfonamides Tetracyclines N % Res N % Res N % Res N % Res N % Res N % Res N % Res N % Res
Czech Republic 11 63.6 11 0 11 0 11 54.5 11 45.5 11 54.5 11 54.5 – – Ireland 33 12.1 33 0 33 3.0 33 3.0 33 0 33 3.0 33 9.1 33 3.0 Italy 30 56.7 30 10.0 30 6.7 30 93.3 30 0 30 93.3 30 16.7 30 40.0 Romania 74 97.3 74 9.5 74 5.4 74 100 74 94.6 74 95.9 74 95.9 74 94.6 Spain 10 40.0 10 0 10 10.0 10 60.0 10 50.0 10 60.0 10 50.0 10 40.0 Total (5 MSs) 158 65.8 158 6.3 158 5.1 158 72.8 158 50.6 158 70.9 158 57.0 147 59.2
MS: Member State; MIC: minimum inhibitory concentration; N: number of isolates tested; % Res: percentage of resistant isolates; –: no data reported.

EU summary report on antimicrobial resistance in zoonotic and indicator bacteriafrom humans, animals and food 2012
EFSA Journal 2014;12(3):3590 65
Temporal trends in resistance among Salmonella spp. isolates from Gallus gallus
Figures SA9 to SA11 indicate how the level of resistance to selected antimicrobials in Salmonella spp. isolates from Gallus gallus has changed over the period 2006–2012 in the MSs. It is important to note that because some antimicrobial resistance is associated with particular serovars or clones within serovars, fluctuations in the occurrence of resistance in Salmonella spp. isolates within a country may result from changes in the proportions of different Salmonella serovars which contribute to the total numbers of Salmonella spp. isolates tested.
For the majority of MSs, resistance to ampicillin decreased slightly between 2011 and 2012, although the slight increase observed in Denmark between 2010 and 2011 was continued in 2012. Across the seven years of data, levels of resistance to ampicillin remained broadly constant for most of the reporting MSs, while decreasing trends were observed in Italy and the Netherlands (Figure SA9). The level of resistance to cefotaxime in Salmonella spp. was generally low, very low or absent in reporting MSs between 2006 and 2012. A statistically significant decreasing trend, for five or more years, was observed in Italy and Spain (Figure SA10). Statistically significant increasing trends in resistance to ciprofloxacin and nalidixic acid were registered in three MSs for five or more years over the 2006–2012 period. Spain observed a statistically significant decreasing trend in resistance to both antimicrobials, while Italy and the Netherlands observed a significant decrease in resistance to ciprofloxacin only.
Figure SA9. Trends in ampicillin resistance in tested Salmonella spp. isolates from Gallus gallus in reporting MSs, 2006-2012, quantitative data
MS: Member State. Note: Statistically significant increasing or decreasing trends for five or more years, as tested by a logistic regression model (p ≤0.05),
were observed in Germany (↑), Italy (↓), the Netherlands (↓) and Poland (↑).

EU summary report on antimicrobial resistance in zoonotic and indicator bacteriafrom humans, animals and food 2012
EFSA Journal 2014;12(3):3590 66
Figure SA10. Trends in cefotaxime resistance in tested Salmonella spp. isolates from Gallus gallus in reporting MSs, 2006-2012, quantitative data
MS: Member State. Note: A statistically significant decreasing trend for five or more years, as tested by logistic regression model (p ≤0.05), was observed
for Italy (↓) and Spain (↓).

EU summary report on antimicrobial resistance in zoonotic and indicator bacteriafrom humans, animals and food 2012
EFSA Journal 2014;12(3):3590 67
Figure SA11. Trends in ciprofloxacin and nalidixic acid resistance in tested Salmonella spp. isolates from Gallus gallus in reporting MSs, 2006-2012, quantitative data
MS: Member State. Note: A statistically significant increasing trend over five or more years, as tested by a logistic regression model (p ≤0.05), was observed
in Austria (↑), and Slovakia (↑) for both ciprofloxacin and nalidixic acid and in Poland (↑) for ciprofloxacin. A statistically significant decreasing trend was observed for ciprofloxacin in Italy (↓) and the Netherlands (↓), and for both ciprofloxacin and nalidixic acid in Spain (↓).

EU summary report on antimicrobial resistance in zoonotic and indicator bacteriafrom humans, animals and food 2012
EFSA Journal 2014;12(3):3590 68
Temporal trends in resistance among S. Enteritidis isolates from Gallus gallus
Figure SA12 indicates how the level of resistance to selected antimicrobials in S. Enteritidis isolates from Gallus gallus has changed over the period 2006–2012 in the MSs. Most of the reporting MSs observed a similarity in their trends in resistance to ciprofloxacin and nalidixic acid among isolates of S. Enteritidis from Gallus gallus over the 2006-2012 period. However, statistically significant decreasing trends were observed in Germany, the Netherlands and Spain for both substances, while a significant increasing trend was observed in Poland, also for both substances.
Figure SA12. Trends in ciprofloxacin and nalidixic acid resistance in tested S. Enteritidis isolates from Gallus gallus in reporting MSs, 2006-2012, quantitative data
MS: Member State. Note: A statistically significant decreasing trend for five or more years, as tested by a logistic regression model (p ≤ 0.05), was observed
in the Czech Republic (↓), Germany (↓), the Netherlands (↓) and Spain (↓) for both ciprofloxacin and nalidixic acid. A statistically significant increasing trend was observed in Poland (↑) and Portugal (↑) for both ciprofloxacin and nalidixic acid.

EU summary report on antimicrobial resistance in zoonotic and indicator bacteriafrom humans, animals and food 2012
EFSA Journal 2014;12(3):3590 69
Spatial distribution of resistance among Salmonella isolates from Gallus gallus
Figures SA13 to SA14 show the spatial distributions of ampicillin and nalidixic acid resistance in Salmonella spp. isolated from Gallus gallus in 2012. Figure SA13 illustrates important variability in levels of ampicillin resistance in Salmonella spp. across the EU and the absence of a clear spatial distribution. Figure SA14 illustrates either the continued absence or the low prevalence of resistance to nalidixic acid in Salmonella spp. in Northern and Western Europe, but high levels of resistance in Southern and Eastern Europe.
Figure SA13. Spatial distribution of ampicillin resistance among Salmonella spp. from Gallus gallus in countries reporting MIC data in 20121
MIC: minimum inhibitory concentration; MS: Member State. Note:Percentages shown in this map refer to countries which reported quantitative MIC data for more than 10 isolates in 2012. When
quantitative 2012 data were not available, 2011 data have been used instead. The countries labelled as ‘qualitative data’ therefore include those reporting either inhibition zone diameter data, MIC data for fewer than 10 isolates, or purely qualitative data (as proportion of resistant isolates).
1. For France, 2011 data were used.

EU summary report on antimicrobial resistance in zoonotic and indicator bacteriafrom humans, animals and food 2012
EFSA Journal 2014;12(3):3590 70
Figure SA14. Spatial distribution of nalidixic acid resistance among Salmonella spp. from Gallus gallus in countries reporting MIC data in 20121
MIC: minimum inhibitory concentration; MS: Member State. Note:Percentages shown in this map refer to countries which reported quantitative MIC data for more than 10 isolates in 2012. When
quantitative 2012 data were not available, 2011 data have been used instead. The countries labelled as ‘qualitative data’ therefore include those reporting either inhibition zone diameter data, MIC data for fewer than 10 isolates, or purely qualitative data (as proportion of resistant isolates).
1. For France, 2011 data were used.

EU summary report on antimicrobial resistance in zoonotic and indicator bacteriafrom humans, animals and food 2012
EFSA Journal 2014;12(3):3590 71
Multi-resistance among Salmonella spp. isolates from broilers and laying hens of Gallus gallus
In 2012, 10 MSs reported isolate-based data on resistance in Salmonella spp. from broiler flocks, which represents 2 more reporting countries compared with 2011, while isolate-based data concerning resistance in Salmonella spp. from laying hen flocks were reported by 9 MSs in 2012, which accounts for 3 additional reporting countries compared with the previous year.
Complete susceptibility was typically very high (≥ 50 %) in tested isolates from laying hens and generally similar or higher than those observed in tested isolates from broilers, which varied substantially among reporting MSs from 7.4 % in Hungary to up to 81.6 % in Ireland (Tables SA24 and SA25). Similarly, multi-resistance rates in laying hens were mostly low to moderate (≤ 20 %) among reporting MSs, except in Romania, where 37.9 % of tested isolates exhibited reduced susceptibility to three or more substances, while, in broilers, multi-resistance rates were generally moderate to high, with the exception of Ireland, which reported a low level of multi-resistance, and Hungary and Romania, which recorded very high levels of multi-resistance.
Considering the multi-resistance distributions of Salmonella spp. isolates in broilers and laying hens (Figures SA15 and SA16), higher proportions of isolates exhibiting reduced susceptibility to an important number of different substances were generally observed in broilers compared with laying hens. While in Italy and Romania, some isolates showed reduced susceptibility to a maximum of eight and nine different substances in broilers, which were higher numbers than in certain isolates from laying hens in the same country. The opposite was true in Austria, Hungary and Spain, where the maximum numbers of substances to which a number of isolates were multi-resistant were higher in laying hens than in broilers.
Very few isolates were resistant to both ciprofloxacin and cefotaxime in Salmonella spp. isolates from laying hens and broilers (Tables SA24 and SA25).
Multi-resistance among S. Enteritidis isolates from broilers and laying hens of Gallus gallus
In 2012, three MSs provided isolate-based data concerning resistance in S. Enteritidis in broilers and six MSs provided isolate-based data concerning resistance in S. Enteritidis in laying hens.
Levels of complete susceptibility were commonly very high in S. Enteritidis isolates from broilers and laying hens and multi-resistance was either not detected or observed at low levels (Tables SA26 and SA27). An exception to this is Romania where rates of both complete susceptibility and multi-resistance were high in isolates from broilers (although assessed on a small sample of 10 isolates only) and multi-resistance was moderate in isolates from laying hens. One S. Enteritidis isolate from broilers exhibited multi-resistance to eight different classes.
Co-resistance to both ciprofloxacin and cefotaxime, in S. Enteritidis isolates, from laying hens and broilers was not observed in the reporting MSs (Tables SA26 and SA27).

EU summary report on antimicrobial resistance in zoonotic and indicator bacteriafrom humans, animals and food 2012
EFSA Journal 2014;12(3):3590 72
Table SA24. Complete susceptibility, multi-resistance and index of diversity in Salmonella spp. from broilers in MSs reporting isolate-based data, 2012
Table SA25. Complete susceptibility, multi-resistance and index of diversity in Salmonella spp. from laying hens in MSs reporting isolate-based data, 2012
Country Susceptible
to all Multi-
resistant Index of diversity
Co-resistant toCip and Ctx
n % n % n % Austria (N=113) 82 72.6 23 20.4 0.243 0 (0) 0 (0) Czech Republic (N=351) 271 77.2 67 19.1 0.385 0 (0) 0 (0) Denmark (N=24) 17 70.8 7 29.2 0 0 (0) 0 (0) Hungary (N=175) 13 7.4 128 73.1 0.279 0 (0) 0 (0) Ireland (N=38) 31 81.6 3 7.9 0.264 0 (0) 0 (0) Italy (N=105) 55 52.4 43 41.0 0.67 13 (0) 12.4 (0) Romania (N=781) 135 17.3 474 60.7 0.648 41 (2) 5.2 (0.3) Spain (N=29) 6 20.7 10 34.5 0.394 1 (0) 3.4 (0) United Kingdom (N=17) 5 29.4 2 11.8 0.162 0 (0) 0 (0)
Country Susceptible
to all Multi-
resistant Index of diversity
Co-resistant to Cip and Ctx
n % n % n % Austria (N=63) 47 74.6 9 14.3 0.361 0 (0) 0 (0) Germany (N=51) 44 86.3 1 2.0 0.221 0 (0) 0 (0) Hungary (N=86) 59 68.6 16 18.6 0.38 0 (0) 0 (0) Italy (N=161) 111 68.9 23 14.3 0.372 2 (0) 1.2 (0) Romania (N=145) 72 49.7 55 37.9 0.450 0 (0) 0 (0) Spain (N=150) 119 79.3 8 5.3 0.321 0 (0) 0 (0) United Kingdom (N=11) 10 90.9 1 9.1 0 0 (0) 0 (0)
MS:Member State; N: total number of isolates tested for susceptibility against the whole common antimicrobial set for Salmonella; n: number of isolates. Susceptible to all: isolate susceptible to all antimicrobial substances of the EFSA common set for Salmonella. Multi-resistant: resistant to at least three different antimicrobial substances, belonging to any three classes from the common set. Index of diversity: see definition in Section 8.4.2.1 of Chapter 8 Materials and methods. Co-resistant to ciprofloxacin (Cip) and cefotaxime (Ctx): the frequencies and percentages of Salmonella isolates not susceptible to concentrations greater than epidemiological cut-off values (Ctx:>0.5 mg/L and Cip:>0.06 mg/L). Figures in parentheses indicate the occurrence of resistance determined using the European Committee on Antimicrobial Susceptibility Testing (EUCAST) clinical breakpoints (Ctx:>2 mg/L and Cip: >1mg/L).

EU summary report on antimicrobial resistance in zoonotic and indicator bacteriafrom humans, animals and food 2012
EFSA Journal 2014;12(3):3590 73
Figure SA15. Frequency distribution of Salmonella spp. isolates from broilers completely susceptible or resistant to one to nine antimicrobials in MSs reporting isolate-based data, 2012
Figure SA16. Frequency distribution of Salmonella spp. isolates from laying hens completely susceptible or resistant to one to nine antimicrobials in MSs reporting isolate-based data, 2012
MS: Member State; N: total number of isolates tested for susceptibility against the whole common antimicrobial set for Salmonella; sus: susceptible to all antimicrobial substances of the EFSA common set for Salmonella; res1–res9: resistance to one antimicrobial substance/resistance to nine antimicrobial substances of the common set for Salmonella.
0 % 20 % 40 % 60 % 80 % 100 %
United Kingdom (N=17)
Spain (N=29)
Romania (N=781)
Italy (N=105)
Ireland (N=38)
Hungary (N=175)
Denmark (N=24)
Czech Republic (N=351)
Austria (N=113)
sus
res1
res2
res3
res4
res5
res6
res7
res8
res9
0 % 20 % 40 % 60 % 80 % 100 %
United Kingdom (N=11)
Spain (N=150)
Romania (N=145)
Italy (N=161)
Hungary (N=86)
Germany (N=51)
Austria (N=63)
sus
res1
res2
res3
res4
res5
res6
res7
res8
res9

EU summary report on antimicrobial resistance in zoonotic and indicator bacteriafrom humans, animals and food 2012
EFSA Journal 2014;12(3):3590 74
Table SA26. Complete susceptibility, multi-resistance and index of diversity in S. Enteriditis from broilers in MSs reporting isolate-based data, 2012
Table SA27. Complete susceptibility, multi-resistance and index of diversity in S. Enteriditis from laying hens in MSs reporting isolate-based data, 2012
Country Susceptible
to all Multi-
resistant Index of diversity
Co-resistant toCip and Ctx
n % n % n % Austria (N=21) 20 95.2 0 0 0 0 (0) 0 (0) Czech Republic (N=236) 231 97.9 0 0 0.068 0 (0) 0 (0) Romania (N=10) 4 40.0 5 50.0 0.315 0 (0) 0 (0)
Country Susceptible
to all Multi-resistant Index of diversity
Co-resistant to Cip and Ctx
n % n % n % Austria (N=15) 15 100 0 0 NA 0 (0) 0 (0) Germany (N=21) 21 100 0 0 NA 0 (0) 0 (0) Hungary (N=25) 23 92.0 0 0 0.086 0 (0) 0 (0) Italy (N=28) 22 78.6 0 0 0 0 (0) 0 (0) Romania (N=66) 49 74.2 11 16.7 0.336 0 (0) 0 (0) Spain (N=43) 32 74.4 1 2.3 0.14 0 (0) 0 (0)
MS:Member State; N: total number of isolates tested for susceptibility against the whole common antimicrobial set for Salmonella; n: number of isolates. Susceptible to all: isolate susceptible to all antimicrobial substances of the EFSA common set for Salmonella. Multi-resistant: resistant to at least three different antimicrobial substances, belonging to any three classes from the common set. Index of diversity: see definition in Section 8.4.2.1 of Chapter 8 Materials and methods. Co-resistant to ciprofloxacin (Cip) and cefotaxime (Ctx): the frequencies and percentages of Salmonella isolates not susceptible to concentrations greater than epidemiological cut-off values (Ctx:>0.5 mg/L and Cip:>0.06 mg/L). Figures in parentheses indicate the occurrence of resistance determined using the European Committee on Antimicrobial Susceptibility Testing (EUCAST) clinical breakpoints (Ctx:>2 mg/L and Cip: >1 mg/L).

EU summary report on antimicrobial resistance in zoonotic and indicator bacteriafrom humans, animals and food 2012
EFSA Journal 2014;12(3):3590 75
Figure SA17. Frequency distribution of S. Enteritidis isolates from broilers completely susceptible or resistant to one to nine antimicrobials in MSs reporting isolate-based data, 2012
Figure SA18. Frequency distribution of S. Enteritidis isolates from laying hens completely susceptible or resistant to one to nine antimicrobials in MSs reporting isolate-based data, 2012
MS: Member State; N: total number of isolates tested for susceptibility against the whole common antimicrobial set for Salmonella; sus: susceptible to all antimicrobial substances of the EFSA common set for Salmonella; res1–res9: resistance to one antimicrobial substance/resistance to nine antimicrobial substances of the common set for Salmonella.
0 % 20 % 40 % 60 % 80 % 100 %
Romania (N=10)
Czech Republic (N=236)
Austria (N=21) sus
res1
res2
res3
res4
res5
res6
res7
res8
res9
0 % 20 % 40 % 60 % 80 % 100 %
Spain (N=43)
Romania (N=66)
Italy (N=28)
Hungary (N=25)
Germany (N=21)
Austria (N=15)
sus
res1
res2
res3
res4
res5
res6
res7
res8
res9

EU summary report on antimicrobial resistance in zoonotic and indicator bacteriafrom humans, animals and food 2012
EFSA Journal 2014;12(3):3590 76
3.4.2.2. Turkeys
In 2012, nine MSs submitted quantitative antimicrobial susceptibility data for Salmonella spp. from turkeys, in accordance with the EU legislation. This section includes data from fattening flocks and unspecified flocks of turkeys. Seven MSs reported data on S. Typhimurium in turkeys and five MSs reported data on monophasic S. Typhimurium in turkeys; however, no country submitted sufficient data to warrant inclusion in the report.
Representative sampling and monitoring
In the reporting MSs, Austria, the Czech Republic, Germany, Hungary, Ireland, Italy, Poland, Spain and the United Kingdom, antimicrobial resistance monitoring in Salmonella spp. isolates from turkeys relied primarily on the national control and eradication programme of Salmonella based on census sampling of fattening flocks in accordance with EU regulations. Only one representative Salmonella isolate per positive epidemiological unit (flock), derived from environmental samples of faeces or dust, was gathered to account for clustering. In some reporting countries, representative subsets of Salmonella isolates were randomly selected at the laboratory for susceptibility testing, whereas, in some others, all the Salmonella isolates recovered were tested for susceptibility. Either no or incomplete information on antimicrobial resistance monitoring in turkeys was provided by Hungary, Italy, Poland and the United Kingdom.
Resistance levels in Salmonella spp. isolates from turkeys
Data on antimicrobial resistance among Salmonella spp. in turkeys were reported by nine MSs in 2012 (Table SA28). The occurrence of resistance to ampicillin, sulfonamides and tetracyclines was generally high to extremely high across the reporting MSs. An exception to this is Austria which reported low resistance to tetracyclines. For chloramphenicol and gentamicin, contrasting levels of resistance were observed. As for chloramphenicol, two-thirds of the reporting MSs did not record resistance or observed low resistance, while one-third reported moderate to high resistance, and for gentamicin, high resistance were reported by two-thirds of the reporting MSs, while the remaining MSs observed low resistance. Resistance levels to ciprofloxacin and nalidixic acid were high to extremely high among the reporting MSs, except in the United Kingdom which reported low resistance. Cefotaxime resistance was very low in the reporting group of nine MSs at 0.8 %, with only Italy, Poland and Spain reporting any cefotaxime-resistant isolates at low proportions of 4.2 %, 3.6 % and 1.2 %, respectively. In contrast to the general feature, Ireland detected resistance only to sulfonamides and tetracyclines at low levels in a small sample of 11 Salmonella spp. isolates.
The feature of the resistance observed in the sub-set of Salmonella spp. isolates obtained from fattening turkey flocks in five MSs generally paralleled that described above in Salmonella spp. in turkeys with high to extremely high resistance to ampicillin, ciprofloxacin, nalidixic acid, sulfonamides and tetracyclines, low to moderate resistance to gentamicin and an absence of or low resistance to cefotaxime and chloramphenicol.
Eight MSs reported resistance among Salmonella spp. isolates from both broilers (Gallus gallus) and turkeys in 2012. As previously observed in 2010 and 2011, resistance was much higher in turkeys than in broilers, in particular for ampicillin, ciprofloxacin, chloramphenicol, gentamicin, nalidixic acid, sulfonamides and tetracyclines. More reporting MSs did not detect resistance to cefotaxime in isolates from turkeys than in isolates from Gallus gallus and thus, overall, resistance was lower (0.8 %) in turkeys than in Gallus gallus (4.8 %). The difference in resistance levels between the two species needs to be interpreted with caution because, except for Spain, resistance levels in Salmonella spp. isolates from turkeys are estimated on lower numbers of isolates compared with Gallus gallus.
Resistance levels in Salmonella Kentucky isolates from turkeys
Hungary and Poland reported quantitative MIC antimicrobial susceptibility data for S. Kentucky isolates from turkeys in 2012 and the results are presented in Table SA29. High levels of resistance to ampicillin, ciprofloxacin, gentamicin, nalidixic acid, sulfonamides and tetracyclines were recorded by both MSs, while resistance was not detected in cefotaxime and chloramphenicol.

EU summary report on antimicrobial resistance in zoonotic and indicator bacteriafrom humans, animals and food 2012
EFSA Journal 2014;12(3):3590 77
Table SA28. Resistance (%) to ampicillin, cefotaxime, chloramphenicol, ciprofloxacin, gentamicin, nalidixic acid, sulfonamides and tetracyclines among Salmonella spp. isolates from turkeys in MSs reporting MIC data in 2012, using harmonised epidemiological cut-off values
Country Ampicillin Cefotaxime Chloramphenicol Ciprofloxacin Gentamicin Nalidixic acid Sulfonamides Tetracyclines
N % Res N % Res N % Res N % Res N % Res N % Res N % Res N % Res Turkeys
Austria 38 23.7 38 0 38 0 38 78.9 38 7.9 38 78.9 38 26.3 38 5.3 Czech Republic 27 55.6 27 0 27 0 27 81.5 27 29.6 27 81.5 27 29.6 – – Germany 87 55.2 87 0 87 2.3 87 32.2 87 21.8 87 28.7 87 57.5 87 48.3 Hungary 174 51.1 174 0 174 0.6 174 91.4 174 20.7 174 84.5 174 33.9 174 55.2 Ireland 14 0 14 0 14 0 14 0 14 0 14 0 14 14.3 14 14.3 Italy 48 62.5 48 4.2 48 12.5 48 37.5 48 25.0 48 37.5 48 58.3 48 97.9 Poland 55 50.9 55 3.6 55 21.8 55 52.7 55 25.5 55 45.5 55 54.5 55 58.2 Spain 169 95.9 169 1.2 169 56.8 169 89.9 169 3.0 169 21.3 169 85.2 169 91.7 United Kingdom 142 31.7 142 0 142 0.7 142 9.9 142 0.7 142 9.9 142 79.6 142 76.8 Total (9 MSs) 754 56.5 754 0.8 754 15.6 754 59.9 754 13.0 754 42.0 754 58.9 727 66.7
Fattening turkeys Austria 38 23.7 38 0 38 0 38 78.9 38 7.9 38 78.9 38 26.3 38 5.3 Czech Republic 20 40.0 20 0 20 0 20 75.0 20 10.0 20 75.0 20 10.0 – – Germany 12 50.0 12 0 12 0 12 0 12 8.3 12 0 12 58.3 12 66.7 Hungary 174 51.1 174 0 174 0.6 174 91.4 174 20.7 174 84.5 174 33.9 174 55.2 Spain 169 95.9 169 1.2 169 56.8 169 89.9 169 3.0 169 21.3 169 85.2 169 91.7 Total (5 MSs) 413 66.3 413 0.5 413 23.5 413 86.2 413 11.4 413 55.2 413 53.8 393 66.4
MS: Member State; MIC: minimum inhibitory concentration; N: number of isolates tested; % Res: percentage of resistant isolates; –: no data reported.
Table SA29. Resistance (%) to ampicillin, cefotaxime, chloramphenicol, ciprofloxacin, gentamicin, nalidixic acid, sulfonamides and tetracyclines among S. Kentucky isolates from turkeys in MSs reporting MIC data in 2012, using harmonised epidemiological cut-off values
Country Ampicillin Cefotaxime Chloramphenicol Ciprofloxacin Gentamicin Nalidixic acid Sulfonamides Tetracyclines N % Res N % Res N % Res N % Res N % Res N % Res N % Res N % Res
Hungary 35 100 35 0 35 0 35 100 35 97.1 35 100 35 97.1 35 97.1 Poland 11 90.9 11 0 11 0 11 100 11 100 11 100 11 100 11 100 Total (2 MSs) 46 97.8 46 0 46 0 46 100 46 97.8 46 100 46 97.8 46 97.8
MS: Member State; MIC: minimum inhibitory concentration; N: number of isolates tested; % Res: percentage of resistant isolates.
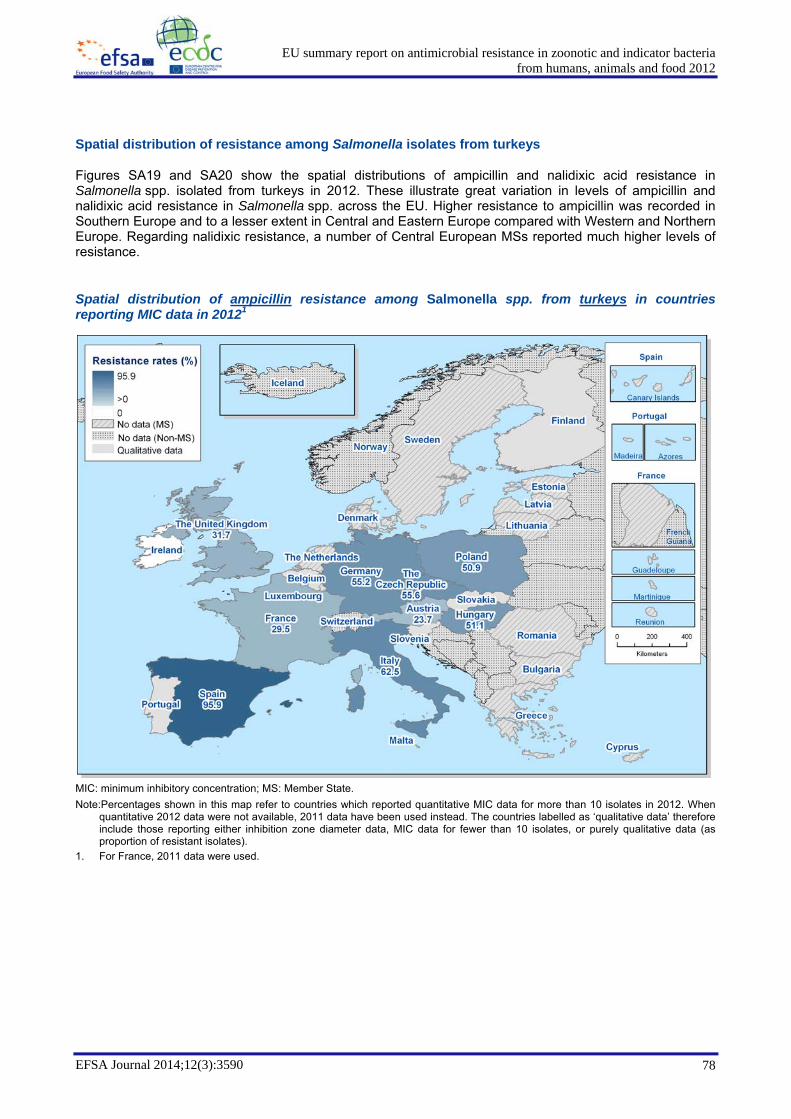
EU summary report on antimicrobial resistance in zoonotic and indicator bacteriafrom humans, animals and food 2012
EFSA Journal 2014;12(3):3590 78
Spatial distribution of resistance among Salmonella isolates from turkeys
Figures SA19 and SA20 show the spatial distributions of ampicillin and nalidixic acid resistance in Salmonella spp. isolated from turkeys in 2012. These illustrate great variation in levels of ampicillin and nalidixic acid resistance in Salmonella spp. across the EU. Higher resistance to ampicillin was recorded in Southern Europe and to a lesser extent in Central and Eastern Europe compared with Western and Northern Europe. Regarding nalidixic resistance, a number of Central European MSs reported much higher levels of resistance.
Spatial distribution of ampicillin resistance among Salmonella spp. from turkeys in countries reporting MIC data in 20121
MIC: minimum inhibitory concentration; MS: Member State. Note:Percentages shown in this map refer to countries which reported quantitative MIC data for more than 10 isolates in 2012. When
quantitative 2012 data were not available, 2011 data have been used instead. The countries labelled as ‘qualitative data’ therefore include those reporting either inhibition zone diameter data, MIC data for fewer than 10 isolates, or purely qualitative data (as proportion of resistant isolates).
1. For France, 2011 data were used.

EU summary report on antimicrobial resistance in zoonotic and indicator bacteriafrom humans, animals and food 2012
EFSA Journal 2014;12(3):3590 79
Figure SA19. Spatial distribution of nalidixic acid resistance among Salmonella spp. from turkeys in countries reporting MIC data in 20121
MIC: minimum inhibitory concentration; MS: Member State. Note:Percentages shown in this map refer to countries which reported quantitative MIC data for more than 10 isolates in 2012. When
quantitative 2012 data were not available, 2011 data have been used instead. The countries labelled as ‘qualitative data’ therefore include those reporting either inhibition zone diameter data, MIC data for fewer than 10 isolates, or purely qualitative data (as proportion of resistant isolates).
1. For France, 2011 data were used.
Multi-resistance among Salmonella spp. isolates from turkeys
In 2012, seven MSs provided isolate-based data concerning resistance in Salmonella spp. from turkeys; one more than in 2011. Complete susceptibility was exhibited by less than one-quarter of the isolates tested in most of the reporting MSs with, in particular, Italy and Spain reporting low to very low levels of susceptibility. Contrastingly, Ireland reported 85.7 % of complete susceptibility, although, in this case, it was assessed on an isolate sample of small size. Multi-resistance was high to extremely high in most reporting MSs ranging from 26.3 % in Austria to 95.3 % in Spain (Table SA30), while moderate multi-resistance was reported in Ireland. The frequency distributions (Figure SA21) showed similarities among multi-resistance recorded in Austria, the Czech Republic, Germany and Hungary with some isolates showing reduced susceptibility to as many as five and six different substances, while Italy and Spain reported isolates showing reduced susceptibility to up to seven and nine antimicrobials. Ireland recorded multi-resistance to no more than three classes of antimicrobials at a maximum.
Very few isolates were resistant to both ciprofloxacin and cefotaxime (Table SA30).

EU summary report on antimicrobial resistance in zoonotic and indicator bacteriafrom humans, animals and food 2012
EFSA Journal 2014;12(3):3590 80
Table SA30. Complete susceptibility, multi-resistance and index of diversity in Salmonella spp. from turkeys in MSs reporting isolate-based data, 2012
Country Susceptible to all Multi-resistant Index of
diversity
Co-resistant toCip and Ctx
n % n % n % Austria (N=38) 7 18.4 10 26.3 0.231 0 (0) 0 (0) Czech Republic (N=27) 2 7.4 11 40.7 0.427 0 (0) 0 (0) Germany (N=87) 20 23.0 51 58.6 0.365 0 (0) 0 (0) Hungary (N=174) 11 6.3 96 55.2 0.426 0 (0) 0 (0) Ireland (N=14) 12 85.7 2 14.3 0 0 (0) 0 (0) Italy (N=48) 0 0 39 81.2 0.554 1 (0) 2.1 (0) Spain (N=169) 3 1.8 161 95.3 0.601 2 (0) 1.2 (0)
MS: Member State; N: total number of isolates tested for susceptibility against the whole common antimicrobial set for Salmonella; n: number of isolates. Susceptible to all: isolate susceptible to all antimicrobial substances of the EFSA common set for Salmonella. Multi-resistant: resistant to at least three different antimicrobial substances, belonging to any three classes from the common set. Index of diversity: see definition in Section 8.4.2.1 of Chapter 8 Materials and methods. Co-resistant to ciprofloxacin (Cip) and cefotaxime (Ctx): the frequencies and percentages of Salmonella isolates not susceptible to concentrations greater than epidemiological cut-off values (Ctx:>0.5 mg/L and Cip:>0.06 mg/L). Figures in parentheses indicate the occurrence of resistance determined using the European Committee on Antimicrobial Susceptibility Testing (EUCAST) clinical breakpoints (Ctx:>2 mg/L and Cip:>1 mg/L).
Figure SA20. Frequency distribution of Salmonella spp. in turkeys completely susceptible or resistant to one to nine antimicrobials, in MSs reporting isolate-based data, 2012
MS: Member State; N: total number of isolates tested for susceptibility against the whole common antimicrobial set for Salmonella; sus: susceptible to all antimicrobial substances of the EFSA common set for Salmonella; res1–res9: resistance to one antimicrobial substance/resistance to nine antimicrobial substances of the common set for Salmonella.
Multi-resistance among S. Enteritidis and S. Typhimurium isolates from turkeys
Generally, the S. Enteritidis, S. Typhimurium and monophasic S. Typhimurium isolates from turkey flocks were very rare in the isolate-based dataset of the reporting MSs. Data on multi-resistance in these serovars from turkeys are therefore not presented in this report, as the inclusion criteria (more than three reporting countries providing data on more than 10 isolates per production type) were not met.
0 % 10 % 20 % 30 % 40 % 50 % 60 % 70 % 80 % 90 % 100 %
Spain (N=169)
Italy (N=48)
Ireland (N=14)
Hungary (N=174)
Germany (N=87)
Czech Republic (N=27)
Austria (N=38)
sus
res1
res2
res3
res4
res5
res6
res7
res8
res9

EU summary report on antimicrobial resistance in zoonotic and indicator bacteriafrom humans, animals and food 2012
EFSA Journal 2014;12(3):3590 81
3.4.2.3. Pigs
Quantitative MIC data for Salmonella spp. isolated from pigs from 10 MSs in 2012 are included in the following analyses.
Representative sampling and monitoring
Isolates from Spain and some of the isolates from Estonia were collected as part of monitoring plans, whereas Germany and Italy and also Estonia tested isolates obtained through passive surveillance via diagnostic submissions. Denmark collected isolates from sub-clinical infections detected via the serological surveillance programme, from healthy pigs at slaughter. Sample types collected by MSs were generally faecal, while Estonia and Spain also tested ileocaecal lymph nodes at slaughter.
Resistance levels in Salmonella spp. isolates from pigs
Data describing the occurrence of resistance to selected antimicrobials in isolates of Salmonella spp. from pigs are presented in Table SA31. Isolates tested by Denmark, Germany and the Netherlands made up over 77 % of the total isolates tested in 2012, so the results from these three countries will have influenced the overall levels reported at MS group level.
Resistance to ampicillin, sulfonamides and tetracyclines was generally high to extremely high, ranging from more than 30 % to about 90 % among the reporting MSs. The only exception to this was Estonia which reported an ampicillin resistance of 18.8 %. Although lower, resistance to chloramphenicol varied between 0 % and 33.3 % among the reporting MSs, while gentamicin resistance was typically low in the reporting MSs ranging from 0 % to 10.4 %.
Three MSs detected no resistance or reported very low resistance to either ciprofloxacin or nalidixic acid in Salmonella spp. isolates from pigs. Among the MSs which did detect resistance, the occurrence of ciprofloxacin and nalidixic acid resistance mostly ranged from about 5 % to 25 %, with the exception of Poland which recorded a ciprofloxacin resistance of 60.0 %. Resistance to cefotaxime was generally not detected or reported at low levels in Salmonella spp. in pigs, with only three MSs reporting cefotaxime resistance ranging from 2.1 % to 11.2 %.
Five MSs reported quantitative data on isolates of Salmonella spp. from fattening pigs in 2012 (Table SA31). At the reporting MS group level, the overall resistance to ampicillin, sulfonamides and tetracyclines were high, at 35.2 %, 40.1 % and 45.6 %, respectively. Low levels of resistance to ciprofloxacin and to nalidixic acid were observed at the MS group level (4.1 % and 3.7 %, respectively), with values varying from 0 % to 23.7 %. As usually observed, the levels of resistance within each MS were generally very similar for the two compounds. In Salmonella spp. from fattening pigs, Denmark and Spain were the only countries to report resistance to gentamicin at levels of 2.9 % and 10.4 %, respectively. Cefotaxime resistance was observed only by Spain at a low level of 6.3 %.
Quantitative data on isolates of Salmonella spp. from breeding pigs were reported by one MS in 2012 (Table SA31).
Resistance levels in Salmonella Typhimurium isolates from pigs
Quantitative MIC antimicrobial susceptibility results for S. Typhimurium isolates from pigs were reported by five MSs in 2012 (Table SA32). More than half of isolates tested (52.6 %) were from Germany, so the results from Germany will have more bearing on the overall levels. The occurrence of resistance to ampicillin, chloramphenicol, sulfonamides and tetracyclines among S. Typhimurium isolates from pigs was higher than that reported in Salmonella spp., with the overall level of resistance in the reporting MS group being 76.7 % for ampicillin, 30.1 % for chloramphenicol, 77.5 % for sulfonamides and 71.7 % for tetracyclines. Among the individual reporting MSs, resistance to ampicillin ranged from 41.3 % to 85.5 %, resistance to chloramphenicol ranged from 14.5 % to 53.3 %, resistance to sulfonamides ranged from 46.0 % to 86.1 % and resistance to tetracyclines ranged from 36.5 % to 93.3 %. Resistance to ciprofloxacin and gentamicin was fairly similar in S. Typhimurium and Salmonella spp. (7.5 % vs. 7.6 % and 3.7 % vs 3.4 %, respectively). Resistance to cefotaxime and nalidixic acid was similar in S. Typhimurium and Salmonella spp. (2.3 % and

EU summary report on antimicrobial resistance in zoonotic and indicator bacteriafrom humans, animals and food 2012
EFSA Journal 2014;12(3):3590 82
5.8 %, respectively). In the reporting MS group, cefotaxime resistance was detected in S. Typhimurium isolates from Belgium at a moderate level (10.7 %), and from Germany at a low level (1.1 %).
Resistance levels in monophasic Salmonella Typhimurium isolates from pigs
Table SA33 describes the resistance among isolates of monophasic S. Typhimurium from pigs. Six MSs reported quantitative data from pigs. As for S. Typhimurium, more than half of isolates tested (55.2 %) were from Germany, so the results from Germany will have more bearing on the overall levels. The levels of resistance to ampicillin, sulfonamides and tetracyclines reported in monophasic S. Typhimurium were much higher than the levels reported in Salmonella spp. from pigs (91.3 % vs. 60.2 %, 91.0 % vs. 63.3 % and 93.5 % vs 63.3 %, respectively).
Extremely high resistance to ampicillin, sulfonamides and tetracyclines was observed across all reporting MSs (91.3 %, 91.0 % and 93.5 %, respectively), and this ranged from 84.0 % to 94.3 % for ampicillin, from 84.0 % to 93.9 % for sulfonamides and from 80.0 % to 100 % for tetracyclines. Low levels of resistance to chloramphenicol (9.4 %) and gentamicin (5.1 %) were reported at the MS group level, and ranged from 2.5 % to 30.0 % and from 0 % to 21.4 %, respectively. In addition, low resistance to ciprofloxacin and nalidixic acid was reported at the MS group level (8.7 % and 5.6 %, respectively). Denmark and the Netherlands observed no resistance to both compounds, while in the remaining four MSs, resistance ranged from 3.9 % to 60.0 %. Cefotaxime resistance was observed by Belgium, Germany and Spain making the overall resistance, at MS group level, 2.7 %.
Resistance levels in Salmonella Derby isolates from pigs
Table SA34 describes the resistance among isolates of S. Derby from pig. Four MSs reported quantitative data from pigs. The levels of resistance to ampicillin, sulfonamides and tetracyclines reported in S. Derby were lower than the levels reported in Salmonella spp. from pigs (12.4 % vs. 60.3 %, 22.8 % vs. 63.4 % and 31.3 % vs. 63.4 %, respectively). Low levels of resistance to chloramphenicol, ciprofloxacin and gentamicin (1.2 %) were reported at the MS group level. The levels of resistance to nalidixic acid and cefotaxime were low at the MS group level.
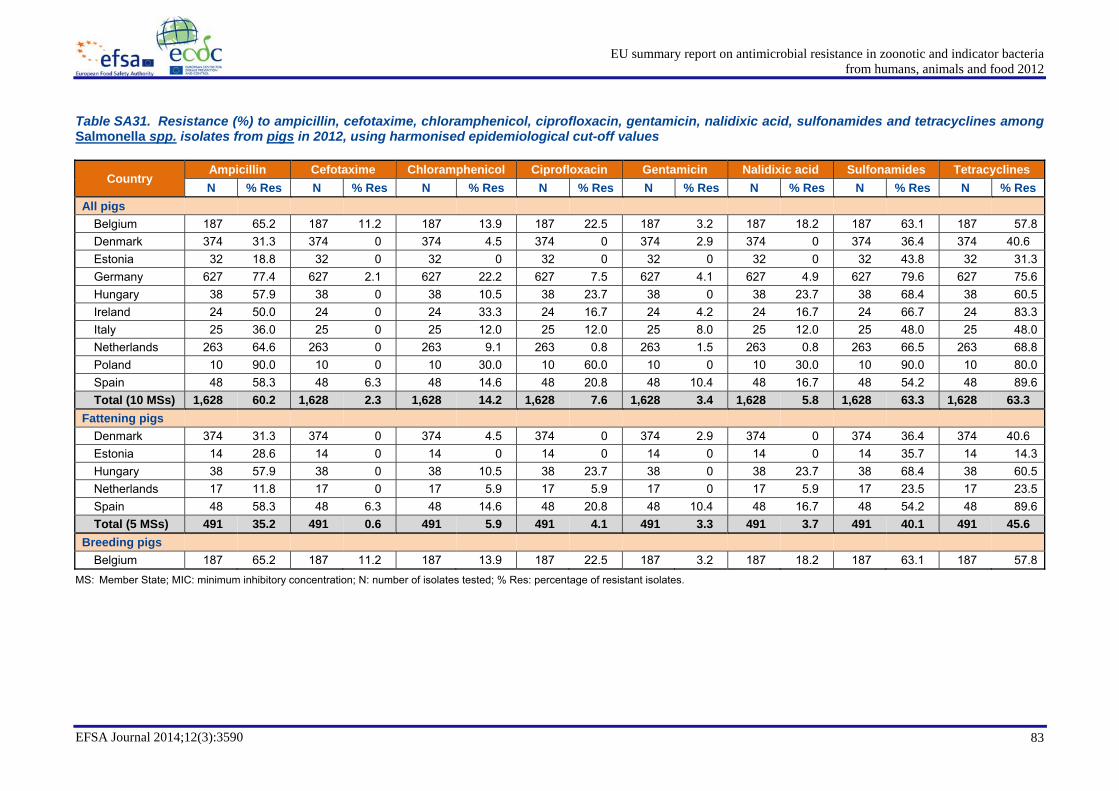
EU summary report on antimicrobial resistance in zoonotic and indicator bacteriafrom humans, animals and food 2012
EFSA Journal 2014;12(3):3590 83
Table SA31. Resistance (%) to ampicillin, cefotaxime, chloramphenicol, ciprofloxacin, gentamicin, nalidixic acid, sulfonamides and tetracyclines among Salmonella spp. isolates from pigs in 2012, using harmonised epidemiological cut-off values
Country Ampicillin Cefotaxime Chloramphenicol Ciprofloxacin Gentamicin Nalidixic acid Sulfonamides Tetracyclines N % Res N % Res N % Res N % Res N % Res N % Res N % Res N % Res
All pigs Belgium 187 65.2 187 11.2 187 13.9 187 22.5 187 3.2 187 18.2 187 63.1 187 57.8 Denmark 374 31.3 374 0 374 4.5 374 0 374 2.9 374 0 374 36.4 374 40.6 Estonia 32 18.8 32 0 32 0 32 0 32 0 32 0 32 43.8 32 31.3 Germany 627 77.4 627 2.1 627 22.2 627 7.5 627 4.1 627 4.9 627 79.6 627 75.6 Hungary 38 57.9 38 0 38 10.5 38 23.7 38 0 38 23.7 38 68.4 38 60.5 Ireland 24 50.0 24 0 24 33.3 24 16.7 24 4.2 24 16.7 24 66.7 24 83.3 Italy 25 36.0 25 0 25 12.0 25 12.0 25 8.0 25 12.0 25 48.0 25 48.0 Netherlands 263 64.6 263 0 263 9.1 263 0.8 263 1.5 263 0.8 263 66.5 263 68.8 Poland 10 90.0 10 0 10 30.0 10 60.0 10 0 10 30.0 10 90.0 10 80.0 Spain 48 58.3 48 6.3 48 14.6 48 20.8 48 10.4 48 16.7 48 54.2 48 89.6 Total (10 MSs) 1,628 60.2 1,628 2.3 1,628 14.2 1,628 7.6 1,628 3.4 1,628 5.8 1,628 63.3 1,628 63.3
Fattening pigs Denmark 374 31.3 374 0 374 4.5 374 0 374 2.9 374 0 374 36.4 374 40.6 Estonia 14 28.6 14 0 14 0 14 0 14 0 14 0 14 35.7 14 14.3 Hungary 38 57.9 38 0 38 10.5 38 23.7 38 0 38 23.7 38 68.4 38 60.5 Netherlands 17 11.8 17 0 17 5.9 17 5.9 17 0 17 5.9 17 23.5 17 23.5 Spain 48 58.3 48 6.3 48 14.6 48 20.8 48 10.4 48 16.7 48 54.2 48 89.6 Total (5 MSs) 491 35.2 491 0.6 491 5.9 491 4.1 491 3.3 491 3.7 491 40.1 491 45.6
Breeding pigs Belgium 187 65.2 187 11.2 187 13.9 187 22.5 187 3.2 187 18.2 187 63.1 187 57.8
MS: Member State; MIC: minimum inhibitory concentration; N: number of isolates tested; % Res: percentage of resistant isolates.

EU summary report on antimicrobial resistance in zoonotic and indicator bacteriafrom humans, animals and food 2012
EFSA Journal 2014;12(3):3590 84
Table SA32. Resistance (%) to ampicillin, cefotaxime, chloramphenicol, ciprofloxacin, gentamicin, nalidixic acid, sulfonamides and tetracyclines among S. Typhimurium isolates from pigs in 2012, using harmonised epidemiological cut-off values
Country Ampicillin Cefotaxime Chloramphenicol Ciprofloxacin Gentamicin Nalidixic acid Sulfonamides Tetracyclines N % Res N % Res N % Res N % Res N % Res N % Res N % Res N % Res
All pigs Belgium 75 81.3 75 10.7 75 20.0 75 20.0 75 2.7 75 13.3 75 74.7 75 66.7 Denmark 63 41.3 63 0 63 17.5 63 0 63 1.6 63 0 63 46.0 63 36.5 Germany 273 82.8 273 1.1 273 37.7 273 6.6 273 5.1 273 5.5 273 86.1 273 79.5 Ireland 15 60.0 15 0 15 53.3 15 20.0 15 6.7 15 20.0 15 73.3 15 93.3 Netherlands 55 85.5 55 0 55 14.5 55 0 55 0 55 0 55 76.4 55 74.5 Total (5 MSs) 481 76.7 481 2.3 481 30.1 481 7.5 481 3.7 481 5.8 481 77.5 481 71.7
Fattening pigs Denmark 63 41.3 63 0 63 17.5 63 0 63 1.6 63 0 63 46.0 63 36.5
Breeding pigs Belgium 75 81.3 75 10.7 75 20.0 75 20.0 75 2.7 75 13.3 75 74.7 75 66.7
MS: Member State; MIC: minimum inhibitory concentration; N: number of isolates tested; % Res: percentage of resistant isolates.

EU summary report on antimicrobial resistance in zoonotic and indicator bacteriafrom humans, animals and food 2012
EFSA Journal 2014;12(3):3590 85
Table SA33. Resistance (%) to ampicillin, cefotaxime, chloramphenicol, ciprofloxacin, gentamicin, nalidixic acid, sulfonamides and tetracyclines among monophasic S. Typhimurium isolates from pigs in 2012, using harmonised epidemiological cut-off values
Country Ampicillin Cefotaxime Chloramphenicol Ciprofloxacin Gentamicin Nalidixic acid Sulfonamides Tetracyclines N % Res N % Res N % Res N % Res N % Res N % Res N % Res N % Res
Belgium 41 90.2 41 19.5 41 14.6 41 26.8 41 7.3 41 24.4 41 87.8 41 87.8 Denmark 81 84.0 81 0 81 2.5 81 0 81 7.4 81 0 81 84.0 81 87.7 Germany 228 94.3 228 0.9 228 9.6 228 7.5 228 3.1 228 3.9 228 93.9 228 96.5 Netherlands 39 92.3 39 0 39 7.7 39 0 39 5.1 39 0 39 92.3 39 94.9 Poland 10 90.0 10 0 10 30.0 10 60.0 10 0 10 30.0 10 90.0 10 80.0 Spain 14 85.7 14 7.1 14 21.4 14 14.3 14 21.4 14 7.1 14 92.9 14 100 Total (6 MSs) 413 91.3 413 2.7 413 9.4 413 8.7 413 5.1 413 5.6 413 91.0 413 93.5
MS: Member State; MIC: minimum inhibitory concentration; N: number of isolates tested; % Res: percentage of resistant isolates.
Table SA34. Resistance (%) to ampicillin, cefotaxime, chloramphenicol, ciprofloxacin, gentamicin, nalidixic acid, sulfonamides and tetracyclines among S. Derby isolates from pigs in 2012, using harmonised epidemiological cut-off values
MS: Member State; MIC: minimum inhibitory concentration; N: number of isolates tested; % Res: percentage of resistant isolates.
Country Ampicillin Cefotaxime Chloramphenicol Ciprofloxacin Gentamicin Nalidixic acid Sulfonamides Tetracyclines N % Res N % Res N % Res N % Res N % Res N % Res N % Res N % Res
Belgium 14 21.4 14 7.1 14 7.1 14 7.1 14 0 14 14.3 14 50.0 14 28.6 Denmark 176 9.7 176 0 176 2.3 176 0 176 1.1 176 0 176 16.5 176 31.3 Germany 42 28.6 42 11.9 42 2.4 42 9.5 42 2.4 42 9.5 42 38.1 42 23.8 Netherlands 28 0 28 0 28 0 28 0 28 0 28 0 28 25.0 28 42.9 Total (4 MSs) 260 12.3 260 2.3 260 2.3 260 1.9 260 1.2 260 2.3 260 22.7 260 31.2

EU summary report on antimicrobial resistance in zoonotic and indicator bacteriafrom humans, animals and food 2012
EFSA Journal 2014;12(3):3590 86
Temporal trends in resistance among Salmonella isolates from pigs
The temporal variation in the level of resistance to selected antimicrobials in Salmonella spp., isolated from pigs between 2006 and 2012, is presented in Figures SA22 to SA24. The figures demonstrate that, in some MSs, resistance levels have continued to fluctuate; however, in other countries, such as in Germany and Sweden, the occurrence of resistance has remained fairly stable in recent years. Over the seven reporting years, significantly decreasing trends in resistance were reported by the Netherlands for ampicillin, while Ireland, Italy and Spain reported statistically significant increasing trends in resistance to the same substance (Figure SA22). Considering resistance to (fluoro) quinolones, ciprofloxacin and nalidixic acid, Estonia and Germany reported statistically decreasing trends in resistance to both compounds over the 2006–2012 period. In contrast, Spain showed increasing trends in resistance to these two substances. Additionally, Ireland registered an increasing trend in resistance to ciprofloxacin (Figure SA24). Cefotaxime resistance among Salmonella spp. isolates from pigs remained either low, very low or absent in the reporting MSs between 2006 and 2012; and no significant trends were detected for MSs reporting five or more years of data (Figure SA23).
Figure SA21. Trends in ampicillin resistance in Salmonella spp. from pigs in reporting MSs, 2006-2012, quantitative data
MS: Member State. Note: Statistically significant increasing or decreasing trends for five or more years, as tested by a logistic regression model (p ≤0.05), were observed in Ireland (↑), Italy (↑), the Netherlands (↓) and Spain (↑). Danish data are not comparable between years: data from 2006-2010 contained only S. Typhimurium isolates while all the isolates were reported in 2011 and 2012.

EU summary report on antimicrobial resistance in zoonotic and indicator bacteriafrom humans, animals and food 2012
EFSA Journal 2014;12(3):3590 87
Figure SA22. Trends in cefotaxime resistance in Salmonella spp. from pigs in reporting MSs, 2006-2012, quantitative data
MS: Member State. Note: No statistically significant trend for five or more years, as tested by a logistic regression model (p ≤0.05), was observed in any of
the reporting countries.

EU summary report on antimicrobial resistance in zoonotic and indicator bacteriafrom humans, animals and food 2012
EFSA Journal 2014;12(3):3590 88
Figure SA23. Trends in ciprofloxacin and nalidixic acid resistance in Salmonella spp. from pigs in reporting MSs, 2006-2012, quantitative data
MS: Member State. Note: A statistically significant decreasing trend for five or more years, as tested by a logistic regression model (p ≤0.05), was observed in Estonia (↓) and Germany (↓) for both ciprofloxacin and nalidixic acid. A statistically significant increasing trend was observed in Spain (↑) for both ciprofloxacin and nalidixic acid and in Ireland (↑) for ciprofloxacin. Danish data are not comparable between years: data from 2006-2010 contained only S. Typhimurium isolates while all the isolates were reported in 2011 and 2012.
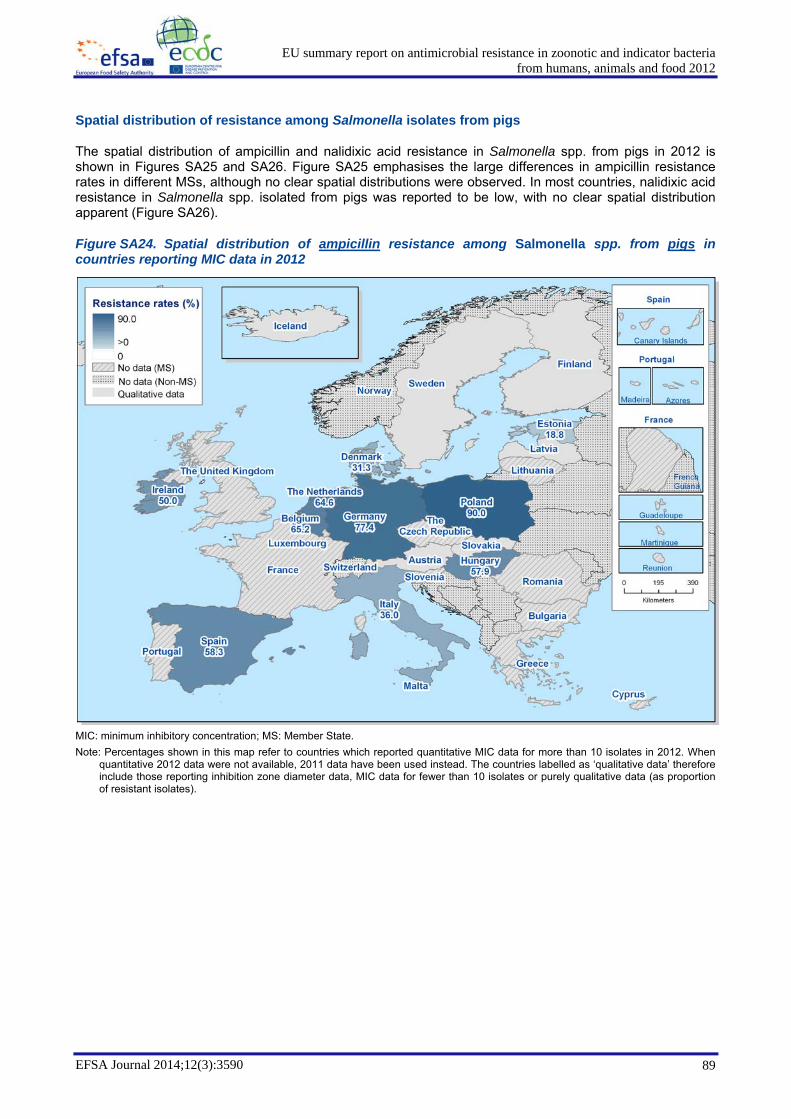
EU summary report on antimicrobial resistance in zoonotic and indicator bacteriafrom humans, animals and food 2012
EFSA Journal 2014;12(3):3590 89
Spatial distribution of resistance among Salmonella isolates from pigs
The spatial distribution of ampicillin and nalidixic acid resistance in Salmonella spp. from pigs in 2012 is shown in Figures SA25 and SA26. Figure SA25 emphasises the large differences in ampicillin resistance rates in different MSs, although no clear spatial distributions were observed. In most countries, nalidixic acid resistance in Salmonella spp. isolated from pigs was reported to be low, with no clear spatial distribution apparent (Figure SA26).
Figure SA24. Spatial distribution of ampicillin resistance among Salmonella spp. from pigs in countries reporting MIC data in 2012
MIC: minimum inhibitory concentration; MS: Member State. Note: Percentages shown in this map refer to countries which reported quantitative MIC data for more than 10 isolates in 2012. When
quantitative 2012 data were not available, 2011 data have been used instead. The countries labelled as ‘qualitative data’ therefore include those reporting inhibition zone diameter data, MIC data for fewer than 10 isolates or purely qualitative data (as proportion of resistant isolates).
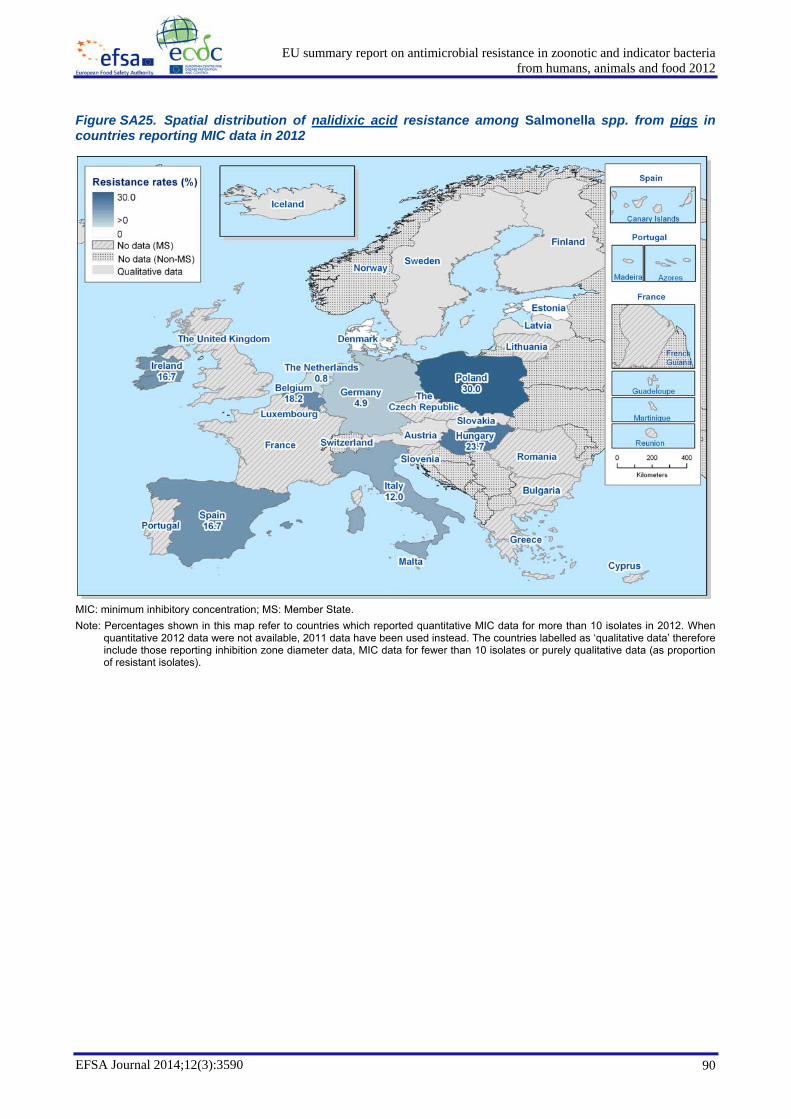
EU summary report on antimicrobial resistance in zoonotic and indicator bacteriafrom humans, animals and food 2012
EFSA Journal 2014;12(3):3590 90
Figure SA25. Spatial distribution of nalidixic acid resistance among Salmonella spp. from pigs in countries reporting MIC data in 2012
MIC: minimum inhibitory concentration; MS: Member State. Note: Percentages shown in this map refer to countries which reported quantitative MIC data for more than 10 isolates in 2012. When
quantitative 2012 data were not available, 2011 data have been used instead. The countries labelled as ‘qualitative data’ therefore include those reporting inhibition zone diameter data, MIC data for fewer than 10 isolates or purely qualitative data (as proportion of resistant isolates).

EU summary report on antimicrobial resistance in zoonotic and indicator bacteriafrom humans, animals and food 2012
EFSA Journal 2014;12(3):3590 91
Multi-resistance among Salmonella spp. isolates from fattening pigs
In 2012, seven MSs provided isolate-based data concerning resistance in Salmonella spp. from pigs. The levels of complete susceptibility varied between the reporting MSs, from 6.2 % in Spain to 64.3 % in Estonia. The multi-resistance levels were high to very high in all reporting MSs, ranging from 34.0 % in Denmark to 76.9 % in Germany (Table SA35). The frequency distributions (Figure SA27) showed discrepancies among the multi-resistance recorded in the reporting MSs with some isolates showing reduced susceptibility to up to eight different substances in Italy and Spain, while Estonia recorded multi-resistance to three classes at a maximum. Very few isolates were resistant to both antimicrobials ciprofloxacin and cefotaxime (Table SA35).
Table SA35. Complete susceptibility, multi-resistance and index of diversity in Salmonella spp. from fattening pigs in MSs reporting isolate-based data, 2012
Country Susceptible to all Multi-resistant Index of
diversity
Co-resistant toCip and Ctx
n % n % n % Denmark (N=374) 179 47.9 127 34.0 0.388 0 (0) 0 (0) Estonia (N=14) 9 64.3 5 35.7 0.151 0 (0) 0 (0) Germany (N=627) 89 14.2 482 76.9 0.544 5 (0) 0.8 (0) Hungary (N=38) 9 23.7 27 71.1 0.414 0 (0) 0 (0) Ireland (N=24) 2 8.3 15 62.5 0.586 0 (0) 0 (0) Italy (N=25) 10 40.0 12 48.0 0.586 0 (0) 0 (0) Spain (N=48) 3 6.2 28 58.3 0.562 2 (0) 4.2 (0)
MS: Member State; N: total number of isolates tested for susceptibility against the whole common antimicrobial set for Salmonella; n: number of isolates. Susceptible to all: isolate susceptible to all antimicrobial substances of the EFSA common set for Salmonella. Multi-resistant: resistant to at least three different antimicrobial substances, belonging to any three classes from the common set. Index of diversity: see definition in Section 8.4.2.1 of Chapter 8 Materials and methods. Co-resistant to ciprofloxacin (Cip) and cefotaxime (Ctx): the frequencies and percentages of Salmonella isolates not susceptible to concentrations greater than epidemiological cut-off values (Ctx:>0.5 mg/L and Cip:>0.06 mg/L). Figures in parentheses indicate the occurrence of resistance determined using the European Committee on Antimicrobial Susceptibility Testing (EUCAST) clinical breakpoints (Ctx:>2 mg/L and Cip:>1 mg/L).
Figure SA26. Frequency distribution of Salmonella spp. from fattening pigs isolates completely susceptible or resistant to one to nine antimicrobials in MSs reporting isolate-based data, 2012
MS: Member State; N: total number of isolates tested for susceptibility against the whole common antimicrobial set for Salmonella; sus: susceptible to all antimicrobial substances of the EFSA common set for Salmonella; res1–res9: resistance to one antimicrobial substance/resistance to nine antimicrobial substances of the common set for Salmonella.
0 % 10 % 20 % 30 % 40 % 50 % 60 % 70 % 80 % 90 % 100 %
Spain (N=48)
Italy (N=25)
Ireland (N=24)
Hungary (N=38)
Germany (N=627)
Estonia (N=14)
Denmark (N=374)
sus
res1
res2
res3
res4
res5
res6
res7
res8
res9

EU summary report on antimicrobial resistance in zoonotic and indicator bacteriafrom humans, animals and food 2012
EFSA Journal 2014;12(3):3590 92
Multi-resistance among S. Typhimurium isolates from fattening pigs
In 2012, three MSs provided isolate-based resistance data on S. Typhimurium from pigs concerning more than 10 isolates. Rates of full susceptibility and multi-resistance are respectively lower and higher than those assessed in Salmonella spp. for the three MSs reporting for both groups. Resistance to both ciprofloxacin and cefotaxime in S. Typhimurium isolates from pigs was not observed in the three reporting MSs (Table SA36).
Table SA36. Complete susceptibility, multi-resistance and index of diversity in S. Typhimurium from fattening pigs in MSs reporting isolate-based data, 2012
Country Susceptible to all Multi-resistant Index of
diversity
Co-resistant toCip and Ctx
n % n % n % Denmark (N=63) 31 49.2 27 42.9 0.458 0 (0) 0 (0) Germany (N=273) 24 8.8 221 81.0 0.519 0 (0) 0 (0) Ireland (N=15) 0 0 10 66.7 0.593 0 (0) 0 (0)
MS: Member State; N: total number of isolates tested for susceptibility against the whole common antimicrobial set for Salmonella; n: number of isolates. Susceptible to all: isolate susceptible to all antimicrobial substances of the EFSA common set for Salmonella. Multi-resistant: resistant to at least three different antimicrobial substances, belonging to any three classes from the common set. Index of diversity: see definition in Section 8.4.2.1 of Chapter 8 Materials and methods. Co-resistant to ciprofloxacin (Cip) and cefotaxime (Ctx): the frequencies and percentages of Salmonella isolates not susceptible to concentrations greater than epidemiological cut-off values (Ctx: >0.5 mg/L and Cip: >0.06 mg/L). Figures in parentheses indicate the occurrence of resistance determined using the European Committee on Antimicrobial Susceptibility Testing (EUCAST) clinical breakpoints (Ctx: >2 mg/L and Cip: >1 mg/L).
Figure SA27. Frequency distribution of S. Typhimurium from fattening pigs isolates completely susceptible or resistant to one to nine antimicrobials in MSs reporting isolate-based data, 2012
MS: Member State; N: total number of isolates tested for susceptibility against the whole common antimicrobial set for Salmonella; sus: susceptible to all antimicrobial substances of the EFSA common set for Salmonella; res1–res9: resistance to one antimicrobial substance/resistance to nine antimicrobial substances of the common set for Salmonella.
0 % 10 % 20 % 30 % 40 % 50 % 60 % 70 % 80 % 90 % 100 %
Ireland (N=15)
Germany (N=273)
Denmark (N=63) sus
res1
res2
res3
res4
res5
res6
res7
res8
res9

EU summary report on antimicrobial resistance in zoonotic and indicator bacteriafrom humans, animals and food 2012
EFSA Journal 2014;12(3):3590 93
3.4.2.4. Cattle (bovine animals)
In this report, calves, dairy cattle, beef cows and heifers are included under the term ‘cattle’. Quantitative MIC data for Salmonella spp. isolated from cattle in seven MSs in 2012 are included in the following analysis of antimicrobial resistance levels.
Representative sampling and monitoring
Isolates tested by Belgium, Finland, Germany, Ireland and Sweden were obtained through national monitoring programmes and generally consisted of faecal samples. Finland also tested lymph nodes at slaughter. Italy obtained isolates through passive surveillance.
Resistance levels in Salmonella spp. isolates from cattle
The levels of resistance to selected antimicrobials in isolates of Salmonella spp. from cattle reported by MSs in 2012 are presented in Table SA37. Isolates tested by Belgium, Germany and the Netherlands made up over 68 % of the total isolates tested in 2012, so the results from these countries will have influenced the overall levels reported at MS group level. High levels of resistance to ampicillin, sulfonamides and tetracyclines were commonly reported in Salmonella spp. from cattle in 2012; considering all reporting MSs, the levels of resistance were 34.5 %, 42.4 % and 36.0 %, respectively. Ampicillin resistance ranged from 13.2 % to 61.1 % across reporting MSs, the range for sulfonamides was 17.6 % to 66.7 %, while the range for tetracyclines was 5.3 % to 58.3 %. As in the previous year, only Germany and Italy reported resistance to gentamicin, making the overall resistance 1.1 %.
At MS group level, the overall occurrence of resistance to both ciprofloxacin and nalidixic acid was 9.1 %. Finland and Sweden were the only MSs to report no resistance to ciprofloxacin or nalidixic acid in Salmonella spp. isolates from cattle. Cefotaxime resistance was only reported by Belgium (2.4 %).
Resistance levels in Salmonella Typhimurium isolates from cattle
Table SA38 shows the level of resistance reported on S. Typhimurium isolates from cattle in 2012. Across the six reporting MSs, the level of resistance to ampicillin and tetracyclines was high, at 43.4 % and 44.9 %, respectively. The resistance levels reported by individual MSs varied from 11.4 % to 84.0 % for ampicillin and from 6.3 % to 83.3 % for tetracyclines. There were very high levels of resistance to sulfonamides (50.0%), ranging from 11.4 % to 91.7 %. The overall resistance to chloramphenicol was high (21.3 %) at MS group level, which varied from 0 % to 66.7 %. As in the previous year, resistance to gentamicin in S. Typhimurium isolates from cattle was detected only in Germany at the low level of 2.9 %.
The occurrence of resistance to both ciprofloxacin and nalidixic acid in the reporting MS group as a whole was low (2.2 % for ciprofloxacin and 2.9 % for nalidixic acid) as Belgium was the only country to report resistance (12.0 % for ciprofloxacin and 16.0 % for nalidixic acid). Cefotaxime resistance in S. Typhimurium isolates from cattle in 2012, as in 2011, was not reported by any MS.
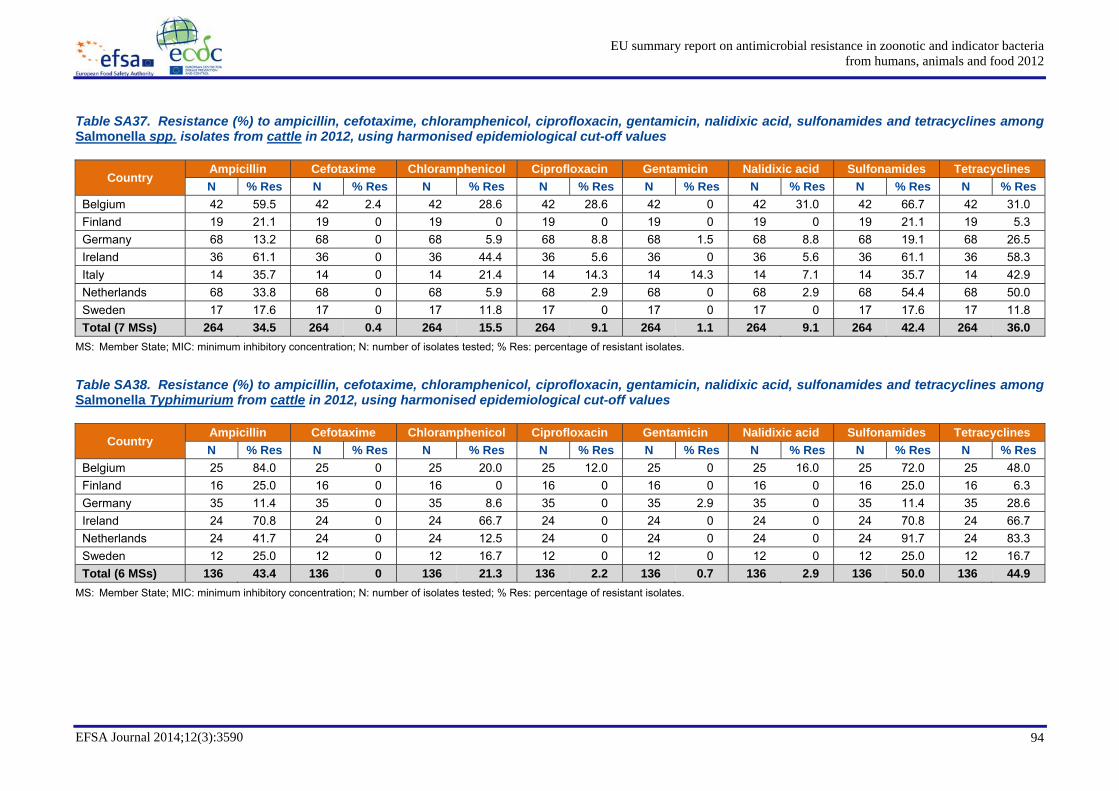
EU summary report on antimicrobial resistance in zoonotic and indicator bacteriafrom humans, animals and food 2012
EFSA Journal 2014;12(3):3590 94
Table SA37. Resistance (%) to ampicillin, cefotaxime, chloramphenicol, ciprofloxacin, gentamicin, nalidixic acid, sulfonamides and tetracyclines among Salmonella spp. isolates from cattle in 2012, using harmonised epidemiological cut-off values
Country Ampicillin Cefotaxime Chloramphenicol Ciprofloxacin Gentamicin Nalidixic acid Sulfonamides Tetracyclines N % Res N % Res N % Res N % Res N % Res N % Res N % Res N % Res
Belgium 42 59.5 42 2.4 42 28.6 42 28.6 42 0 42 31.0 42 66.7 42 31.0 Finland 19 21.1 19 0 19 0 19 0 19 0 19 0 19 21.1 19 5.3 Germany 68 13.2 68 0 68 5.9 68 8.8 68 1.5 68 8.8 68 19.1 68 26.5 Ireland 36 61.1 36 0 36 44.4 36 5.6 36 0 36 5.6 36 61.1 36 58.3 Italy 14 35.7 14 0 14 21.4 14 14.3 14 14.3 14 7.1 14 35.7 14 42.9 Netherlands 68 33.8 68 0 68 5.9 68 2.9 68 0 68 2.9 68 54.4 68 50.0 Sweden 17 17.6 17 0 17 11.8 17 0 17 0 17 0 17 17.6 17 11.8 Total (7 MSs) 264 34.5 264 0.4 264 15.5 264 9.1 264 1.1 264 9.1 264 42.4 264 36.0
MS: Member State; MIC: minimum inhibitory concentration; N: number of isolates tested; % Res: percentage of resistant isolates.
Table SA38. Resistance (%) to ampicillin, cefotaxime, chloramphenicol, ciprofloxacin, gentamicin, nalidixic acid, sulfonamides and tetracyclines among Salmonella Typhimurium from cattle in 2012, using harmonised epidemiological cut-off values
Country Ampicillin Cefotaxime Chloramphenicol Ciprofloxacin Gentamicin Nalidixic acid Sulfonamides Tetracyclines N % Res N % Res N % Res N % Res N % Res N % Res N % Res N % Res
Belgium 25 84.0 25 0 25 20.0 25 12.0 25 0 25 16.0 25 72.0 25 48.0 Finland 16 25.0 16 0 16 0 16 0 16 0 16 0 16 25.0 16 6.3 Germany 35 11.4 35 0 35 8.6 35 0 35 2.9 35 0 35 11.4 35 28.6 Ireland 24 70.8 24 0 24 66.7 24 0 24 0 24 0 24 70.8 24 66.7 Netherlands 24 41.7 24 0 24 12.5 24 0 24 0 24 0 24 91.7 24 83.3 Sweden 12 25.0 12 0 12 16.7 12 0 12 0 12 0 12 25.0 12 16.7 Total (6 MSs) 136 43.4 136 0 136 21.3 136 2.2 136 0.7 136 2.9 136 50.0 136 44.9
MS: Member State; MIC: minimum inhibitory concentration; N: number of isolates tested; % Res: percentage of resistant isolates.

EU summary report on antimicrobial resistance in zoonotic and indicator bacteriafrom humans, animals and food 2012
EFSA Journal 2014;12(3):3590 95
Temporal trends in resistance among Salmonella isolates from cattle
It is evident from Figures SA29 and SA30 that large variations exist between MSs in the level of resistance to some antimicrobials, particularly ampicillin. The figures illustrate the trends in resistance to ampicillin ciprofloxacin and nalidixic acid among Salmonella isolates from cattle from 2006 to 2012. As in 2011, trends in resistance over time were mainly decreasing among Salmonella spp. from cattle. Germany experienced statistically significant decreasing trends in resistance to ampicillin (Figure SA29), and Germany also reported statistically significant decreasing trends in resistance to tetracyclines (data were not presented). No significant trends were observed in the reported resistance to ciprofloxacin and nalidixic acid between 2006 and 2012 (Figure SA30).
Figure SA28. Trends in ampicillin resistance in Salmonella spp. from cattle in reporting MSs, 2006-2012, quantitative data
MS: Member State. Note: A statistically significant decreasing trend for five or more years, as tested by a logistic regression model (p ≤0.05), was observed
in Germany (↓).

EU summary report on antimicrobial resistance in zoonotic and indicator bacteriafrom humans, animals and food 2012
EFSA Journal 2014;12(3):3590 96
Figure SA29. Trends in ciprofloxacin and nalidixic acid resistance in Salmonella spp. from cattle in reporting MSs, 2006-2012, quantitative data
MS: Member State. Note: For both ciprofloxacin and nalidixic acid, no statistically significant trend for five or more years, as tested by a logistic regression
model (p ≤0.05), was observed in any of the reporting countries.

EU summary report on antimicrobial resistance in zoonotic and indicator bacteriafrom humans, animals and food 2012
EFSA Journal 2014;12(3):3590 97
Spatial distribution of resistance among Salmonella isolates from cattle
Figures SA31 and SA32 show the spatial distributions of ampicillin and nalidixic acid resistance in Salmonella spp. isolated from cattle in 2012. Figure SA31 illustrates the absence of a clear spatial distribution. Figure SA32 illustrates the continued absence, or low prevalence, of resistance to nalidixic acid in Salmonella spp. isolated from cattle in Europe.
Figure SA30. Spatial distribution of ampicillin resistance among Salmonella spp. from cattle in countries reporting MIC data in 20121
MIC: minimum inhibitory concentration; MS: Member State. Note: Percentages shown in this map refer to countries which reported quantitative MIC data for more than 10 isolates in 2012. When
quantitative 2012 data were not available, 2011 data have been used instead. The countries labelled as ‘qualitative data’ therefore include those reporting inhibition zone diameter data, MIC data for less than 10 isolates, or purely qualitative data (as proportion of resistant isolates).
1. For Norway, 2011 data were used.

EU summary report on antimicrobial resistance in zoonotic and indicator bacteriafrom humans, animals and food 2012
EFSA Journal 2014;12(3):3590 98
Figure SA31. Spatial distribution of nalidixic acid resistance among Salmonella spp. from cattle in countries reporting MIC data in 20121
Note: Percentages shown in this map refer to countries which reported quantitative MIC data for more than 10 isolates in 2012. When
quantitative 2012 data were not available, 2011 data have been used instead. The countries labelled as ‘qualitative data’ therefore include those reporting inhibition zone diameter data, MIC data for less than 10 isolates, or purely qualitative data (as proportion of resistant isolates). MIC: minimum inhibitory concentration; MS: Member State.
1. For Norway, 2011 data were used.

EU summary report on antimicrobial resistance in zoonotic and indicator bacteriafrom humans, animals and food 2012
EFSA Journal 2014;12(3):3590 99
Multi-resistance among Salmonella spp. isolates from cattle
In 2012, six MSs reported isolate-based data concerning resistance in Salmonella spp. from cattle. The proportions of complete susceptible isolates were generally high to extremely high and varied between the reporting MSs, from 19.0 % in Belgium to 82.4 % in Sweden. Two reporting MSs (Finland and Sweden) reported moderate levels of multi-resistance in isolates tested from cattle, while the remaining MSs reported high levels of multi-resistance ranging between 20.6 % and 58.3 % (Table SA39). The frequency distributions (Figure SA33) showed that Belgium, Germany, Ireland and Italy detected isolates exhibiting reduced susceptibility to higher numbers of different substances (six to seven classes) than the two other MSs (five classes). Few isolates were resistant to both antimicrobials ciprofloxacin and cefotaxime (Table SA39).
Table SA39. Complete susceptibility, multi-resistance and index of diversity in Salmonella spp. from cattle in MSs reporting isolate-based data, 2012
Country Susceptible to all Multi-resistant Index of
diversity
Co-resistant toCip and Ctx
n % n % n % Belgium (N=42) 8 19.0 21 50.0 0.551 1 (0) 2.4 (0) Finland (N=19) 15 78.9 2 10.5 0.317 0 (0) 0 (0) Germany (N=68) 45 66.2 14 20.6 0.409 0 (0) 0 (0) Ireland (N=36) 12 33.3 21 58.3 0.336 0 (0) 0 (0) Italy (N=14) 8 57.1 6 42.9 0.414 0 (0) 0 (0) Sweden (N=17) 14 82.4 3 17.6 0.203 0 (0) 0 (0)
MS: Member State; N: total number of isolates tested for susceptibility against the whole common antimicrobial set for Salmonella; n: number of isolates. Susceptible to all: isolate susceptible to all antimicrobial substances of the EFSA common set for Salmonella. Multi-resistant: resistant to at least three different antimicrobial substances, belonging to any three classes from the common set. Index of diversity: see definition in Section 8.4.2.1 of Chapter 8 Materials and methods. Co-resistant to ciprofloxacin (Cip) and cefotaxime (Ctx): the frequencies and percentages of Salmonella isolates not susceptible to concentrations greater than epidemiological cut-off values (Ctx:>0.5 mg/L and Cip:>0.06 mg/L). Figures in parentheses indicate the occurrence of resistance determined using the European Committee on Antimicrobial Susceptibility Testing (EUCAST) clinical breakpoints (Ctx:>2 mg/L and Cip:>1 mg/L).
Figure SA32. Frequency distribution of Salmonella spp. from cattle completely susceptible or resistant to one to nine antimicrobials in MSs reporting isolate-based data, 2012
MS: Member State; N: total number of isolates tested for susceptibility against the whole common antimicrobial set for Salmonella; sus: susceptible to all antimicrobial substances of the EFSA common set for Salmonella; res1–res9: resistance to one antimicrobial substance/resistance to nine antimicrobial substances of the common set for Salmonella.
0 % 10 % 20 % 30 % 40 % 50 % 60 % 70 % 80 % 90 % 100 %
Sweden (N=17)
Italy (N=14)
Ireland (N=36)
Germany (N=68)
Finland (N=19)
Belgium (N=42)
sus
res1
res2
res3
res4
res5
res6
res7
res8
res9
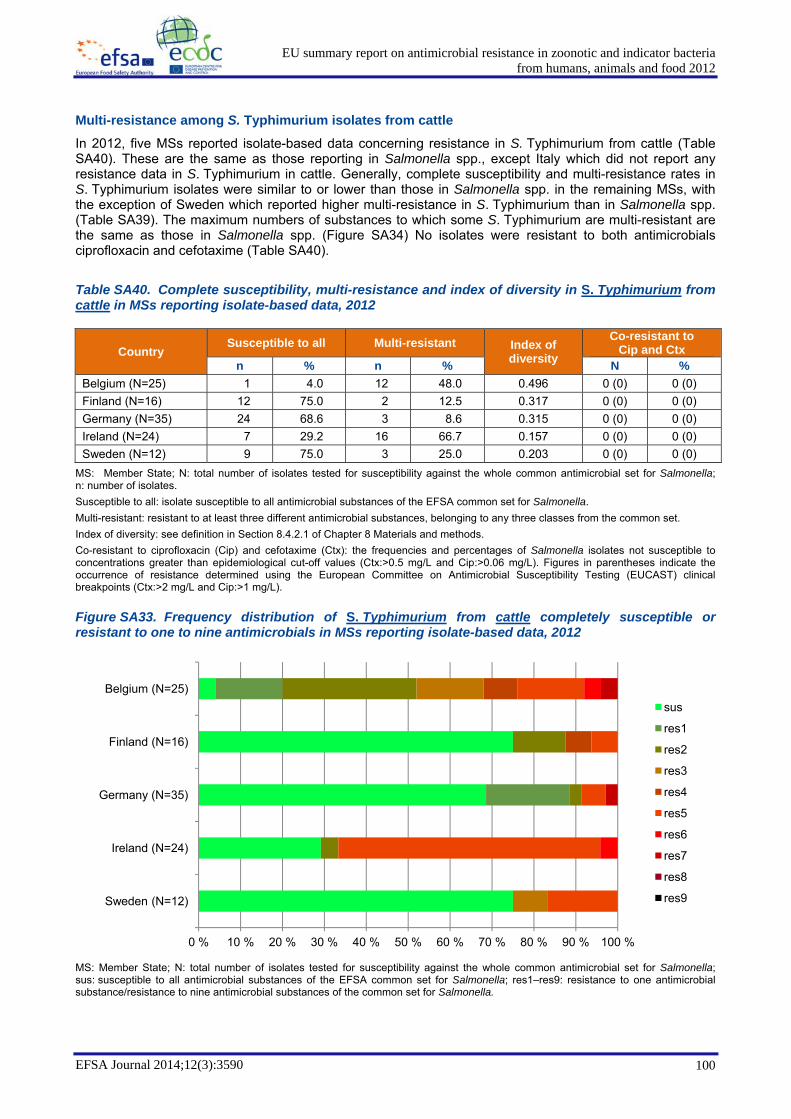
EU summary report on antimicrobial resistance in zoonotic and indicator bacteriafrom humans, animals and food 2012
EFSA Journal 2014;12(3):3590 100
Multi-resistance among S. Typhimurium isolates from cattle
In 2012, five MSs reported isolate-based data concerning resistance in S. Typhimurium from cattle (Table SA40). These are the same as those reporting in Salmonella spp., except Italy which did not report any resistance data in S. Typhimurium in cattle. Generally, complete susceptibility and multi-resistance rates in S. Typhimurium isolates were similar to or lower than those in Salmonella spp. in the remaining MSs, with the exception of Sweden which reported higher multi-resistance in S. Typhimurium than in Salmonella spp. (Table SA39). The maximum numbers of substances to which some S. Typhimurium are multi-resistant are the same as those in Salmonella spp. (Figure SA34) No isolates were resistant to both antimicrobials ciprofloxacin and cefotaxime (Table SA40).
Table SA40. Complete susceptibility, multi-resistance and index of diversity in S. Typhimurium from cattle in MSs reporting isolate-based data, 2012
Country Susceptible to all Multi-resistant Index of
diversity
Co-resistant toCip and Ctx
n % n % N % Belgium (N=25) 1 4.0 12 48.0 0.496 0 (0) 0 (0) Finland (N=16) 12 75.0 2 12.5 0.317 0 (0) 0 (0) Germany (N=35) 24 68.6 3 8.6 0.315 0 (0) 0 (0) Ireland (N=24) 7 29.2 16 66.7 0.157 0 (0) 0 (0) Sweden (N=12) 9 75.0 3 25.0 0.203 0 (0) 0 (0)
MS: Member State; N: total number of isolates tested for susceptibility against the whole common antimicrobial set for Salmonella; n: number of isolates. Susceptible to all: isolate susceptible to all antimicrobial substances of the EFSA common set for Salmonella. Multi-resistant: resistant to at least three different antimicrobial substances, belonging to any three classes from the common set. Index of diversity: see definition in Section 8.4.2.1 of Chapter 8 Materials and methods. Co-resistant to ciprofloxacin (Cip) and cefotaxime (Ctx): the frequencies and percentages of Salmonella isolates not susceptible to concentrations greater than epidemiological cut-off values (Ctx:>0.5 mg/L and Cip:>0.06 mg/L). Figures in parentheses indicate the occurrence of resistance determined using the European Committee on Antimicrobial Susceptibility Testing (EUCAST) clinical breakpoints (Ctx:>2 mg/L and Cip:>1 mg/L).
Figure SA33. Frequency distribution of S. Typhimurium from cattle completely susceptible or resistant to one to nine antimicrobials in MSs reporting isolate-based data, 2012
MS: Member State; N: total number of isolates tested for susceptibility against the whole common antimicrobial set for Salmonella; sus: susceptible to all antimicrobial substances of the EFSA common set for Salmonella; res1–res9: resistance to one antimicrobial substance/resistance to nine antimicrobial substances of the common set for Salmonella.
0 % 10 % 20 % 30 % 40 % 50 % 60 % 70 % 80 % 90 % 100 %
Sweden (N=12)
Ireland (N=24)
Germany (N=35)
Finland (N=16)
Belgium (N=25)sus
res1
res2
res3
res4
res5
res6
res7
res8
res9

EU summary report on antimicrobial resistance in zoonotic and indicator bacteriafrom humans, animals and food 2012
EFSA Journal 2014;12(3):3590 101
3.4.3. Comparison of ‘clinical’ and ‘microbiological resistance’ to ciprofloxacin
Fluoroquinolones, including ciprofloxacin, are recognised as being critically important in human medicine and often constitute the first-line treatment for invasive salmonellosis. Therefore, the high levels of ciprofloxacin resistance observed among Salmonella spp., from some animal species that were discussed earlier in this chapter, are of concern. Resistance levels were particularly high among Gallus gallus and turkeys when interpreted using the EUCAST ECOFFs.
When the data were re-analysed using the CLSI breakpoints, the resistance levels were considerably lower (Table SA41). Four countries reported very high or extremely high resistance to ciprofloxacin among Salmonella spp. from turkeys when using the EUCAST ECOFFS. One of the nine countries reporting more than 10 isolates detected no resistance. However, when the CLSI breakpoints were applied to analyse these data, high resistance was detected only in the Czech Republic (33.3 %), Poland (21.8 %) and Hungary (20.1 %). Among Salmonella spp. from Gallus gallus, resistance levels reached up to 69.0 % using the EUCAST ECOFFs and only three of the 17 countries reporting more than 10 isolates detected no resistance. However, using the CLSI breakpoints, resistance was only found in six countries, at low levels in Romania (8.9 %), Belgium (1.7 %), the Czech Republic (1.6 %), Hungary (1.9 %) and Spain (3.4 %) and at a very low level in Poland (0.3 %). Regarding Salmonella spp. from pigs, when using the EUCAST ECOFFS, one of the eight countries reporting more than 10 isolates detected no resistance. However, when the CLSI breakpoints were applied to analyse these data, low resistance was detected only in Belgium (2.7 %). Several countries reported low, moderate or high resistance among Salmonella spp. from cattle when EUCAST ECOFFS were used. None of these countries were found to have any resistant isolates when using the CLSI breakpoints.
The geographical distribution of the occurrence of resistance to ciprofloxacin in turkeys and the fact that this parallels the occurrence of S. Kentucky in farm animal species indicates how the clonal spread of one serovar can influence the overall picture.

EU summary report on antimicrobial resistance in zoonotic and indicator bacteriafrom humans, animals and food 2012
EFSA Journal 2014;12(3):3590 102
Table SA41. Resistance (%) to ciprofloxacin among Salmonella spp. from Gallus gallus, turkeys, pigs and cattle in 2012, using harmonised epidemiological cut-off values or CLSI breakpoints
Country Gallus gallus1 Turkeys2 Pigs3 Cattle4 N EUCAST % Res CLSI % Res N EUCAST % Res CLSI % Res N EUCAST % Res CLSI % Res N EUCAST % Res CLSI % Res
Austria 176 18.2 0 38 78.9 0 – – – – – – Belgium 664 39.0 1.7 – – – 187 22.5 2.7 42 28.6 0 Czech Republic 386 19.4 1.6 27 81.5 33.3 – – – – – – Denmark 28 0 0 – – – 374 0 0 – – – Estonia – – – – – – 32 0 0 – – – Finland – – – – – – – – – 19 0 0 Germany 238 14.3 0 87 32.2 1.1 627 7.5 0 68 8.8 0 Hungary 261 69.0 1.9 174 91.4 20.1 38 23.7 0 – – – Ireland 38 2.6 0 14 0 0 24 16.7 0 36 5.6 0 Italy 328 23.8 0 48 37.5 0 25 12.0 0 14 14.3 0 Latvia 14 0 0 – – – – – – – – – Netherlands 192 18.2 0 – – – 263 0.8 0 68 2.9 0 Poland 738 39.2 0.3 55 52.7 21.8 10 60.0 0 – – – Portugal 174 23.6 0 – – – – – – – – – Romania 964 68.4 8.9 – – – – – – – – – Slovakia 85 30.6 0 – – – – – – – – – Spain 179 22.3 3.4 169 89.9 1.2 48 20.8 0 – – – Sweden – – – – – – – – – 17 0 0 United Kingdom 236 2.1 0 142 9.9 0 – – – – – –
CLSI: Clinical and Laboratory Standards Institute; EUCAST: European Committee on Antimicrobial Susceptibility Testing; –: no data reported. 1. Gallus gallus: in Finland and Sweden, five and eight isolates were respectively sensitive to ciprofloxacin (minimum inhibitory concentration (MIC) below the epidemiological cut-off value (ECOFF)). 2. Turkeys: in Slovakia, two isolates (N=4) displayed reduced susceptibility to ciprofloxacin (MIC above both the EUCAST and CLSI thresholds), while, in Belgium, Finland and Portugal, two, one and nine
isolates, respectively, were sensitive to ciprofloxacin (MIC below the EUCAST ECOFF). 3. Pigs: in Finland, Latvia and Sweden, five, three and four isolates, respectively were sensitive to ciprofloxacin (MIC below the EUCAST ECOFF). 4. Cattle: in Estonia, one isolate (N=7) displayed reduced susceptibility to ciprofloxacin (MIC above both the EUCAST and CLSI thresholds), while, in Latvia and Spain, two and nine isolates, respectively,
were sensitive to ciprofloxacin (MIC below the EUCAST ECOFF).

EU summary report on antimicrobial resistance in zoonotic and indicator bacteriafrom humans, animals and food 2012
EFSA Journal 2014;12(3):3590 103
3.4.4. Further analysis of multi-drug resistance in certain Salmonella serovars
In the paragraphs above, the ‘summary indicators’ of multi-drug resistance (MDR)14 have been tabulated showing notably the proportion of isolates which are fully susceptible, multi-drug resistant and co-resistant to ciprofloxacin and cefotaxime. Graphs also show the proportions of isolates resistant to different numbers of antimicrobials; corresponding data are also set out in Appendix 3. The information relating to Salmonella spp. from a MS often covers a variety of different serovars, each of which may have a different propensity to exhibit antimicrobial resistance and because the serovars which are prevalent in different MSs may vary, this will account for some of the pronounced variation in the recorded MDR parameters for Salmonella spp. which is evident in different MSs. S. Enteritidis in general exhibited much lower MDR than S. Typhimurium; however, there were marked differences between MSs in the occurrence of MDR for each of these serovars. The analysis of such patterns is most useful when applied at the serovar level, therefore MDR is considered briefly for Salmonella spp. and then several serovars of current importance are examined individually.
3.4.4.1. Multi-drug resistance patterns
Salmonella spp.
The patterns of resistance exhibited by all reported Salmonella serovars comprise aggregated data from a variety of different serovars and are presented in Appendix 4 (Appendix Tables MDRP1 to MDRP7). A range of different resistance genes, occurring in different combinations and associated with different genetic elements occurs in Salmonella and consequently the range of patterns obtained is large. Detailed analysis of the specific patterns of resistance detected is the most useful when it is performed at the serovar level. However, the overall data from all Salmonella spp. have also been examined to determine which serovars demonstrate pentavalent resistance to ampicillin, chloramphenicol, sulfonamides, streptomycin and tetracyclines. This pattern of resistance (which may occur with additional resistance) has been demonstrated by a number of Salmonella serovars which have spread epidemically in animals, such as S. Typhimurium definitive phage types 104 and 204c, as well as S. Newport. See Section 3.4.4.4 Analysis of pentavalent resistance.
Salmonella Enteritidis
Information on MDR was available for S. Enteritidis isolates from broilers and laying hens. MDR was uncommon in S. Enteritidis isolates, occurring in only 1.9 % of 270 isolates from broilers and 5.8 % of 206 isolates from laying hens (Appendix Tables MDRP8 and MDRP9). All MDR isolates from laying hens and the majority (4 out of 5) of MDR isolates from broilers were resistant to ciprofloxacin. Ampicillin, sulfonamide and tetracycline resistance was commonly observed as components of the MDR patterns. S. Enteritidis phage type 1 (PT1) from broilers commonly shows resistance to nalidixic acid and ciprofloxacin; however, other phage types (for example PT4, 7 and 21) may also demonstrate resistance to this antimicrobial, although usually less frequently (EFSA, 2007). Phage type 8 commonly showed susceptibility to the antimicrobials tested in EFSA’s baseline survey of broilers in the EU in 2005-2006. Otherwise, S. Enteritidis showed a greatly reduced propensity to display MDR than S. Typhimurium did.
Salmonella Typhimurium
S. Typhimurium showed a wide diversity of MDR patterns, especially evident in fattening pigs and cattle, species from which the largest numbers of isolates were available. It is noteworthy that the commonest pattern of MDR was resistance to ampicillin, chloramphenicol, streptomycin, sulfonamides and tetracyclines in all types of animals except broilers, where it was the second most commonly observed pattern (Appendix Tables MDRP10 to MDRP13). This pattern has commonly been associated with S. Typhimurium definitive phage type 104 in recent years, although it can also be seen as part of the pattern in other phage types, such as DT193 and U288 (these latter types also frequently display trimethoprim resistance). Resistance to cefotaxime was not detected as part of the MDR profiles in cattle and ciprofloxacin resistance was usually uncommon in S. Typhimurium MDR isolates, although it was most frequent in pigs, where gentamicin resistance was also more frequently detected.
14 Multi-drug resistance is defined as resistance to any three antimicrobials in the panel recommended by EFSA – and considering resistance to nalidixic acid and ciprofloxacin as a single resistance.

EU summary report on antimicrobial resistance in zoonotic and indicator bacteriafrom humans, animals and food 2012
EFSA Journal 2014;12(3):3590 104
Monophasic Salmonella Typhimurium
The patterns of multi-drug resistance for monophasic S. Typhimurium isolates from broilers, layers, turkeys, fattening pigs and cattle as well as meat from turkeys, pigs and cattle are shown in Appendix Tables MDRP14 to MDRP21. The most frequent pattern of resistance observed was resistance to ampicillin, streptomycin, sulfonamides and tetracyclines in all categories, except meat from turkeys, where this pattern with additional resistance to ciprofloxacin was predominant. Germany was the only MS providing data for meat from turkeys and contributed most of the isolates from turkeys; although resistance to ampicillin, streptomycin, sulfonamides and tetracyclines predominated in isolates from turkeys from this MS, this pattern with additional ciprofloxacin resistance was most commonly observed in isolates from turkey meat. More than 86 % of isolates exhibited MDR from all categories, except turkeys, where more than 70 % were MDR. The numbers of isolates received from categories other than pigs and meat from pigs were less than 20 and only two to four different resistance patterns were detected; these frequently involved acquisition of resistance to one or more of chloramphenicol, gentamicin, ciprofloxacin and trimethoprim, with or without loss of resistance to sulfonamide, ampicillin and tetracyclines. Streptomycin resistance was invariably present in the MDR isolates in all categories except from pigs and meat from pigs, where it was only absent from 5 out of 377 isolates. Among the reporting countries of isolate-based data, Germany contributed the majority of isolates for all categories, except broilers and laying hens, and the diversity of MDR patterns observed for this MS may be a reflection of the greater number of isolates examined.
Salmonella Kentucky
The patterns of MDR for S. Kentucky isolates from broilers, laying hens and meat from broilers are shown in Appendix Tables MDRP22 to MDRP24. More than 80 % of isolates from broilers had the core resistance pattern to ampicillin, ciprofloxacin, gentamicin, sulfonamides and tetracyclines, often with resistance to streptomycin. The core pattern with additional streptomycin resistance was also the most commonly observed pattern in meat from broilers. Although in laying hens the commonest pattern was resistance to ampicillin, ciprofloxacin and tetracyclines, the pattern of resistance to ampicillin, ciprofloxacin, gentamicin, sulfonamides and tetracyclines (in some cases with additional resistance) was also observed.
Salmonella Derby
There were very few S. Derby isolates reported from broilers, cattle and meat from cattle (ten or less) (Appendix Tables MDRP25 to MDRP30). S. Derby isolates from turkeys were 99.2 % MDR, whereas the situation for isolates from pigs and meat from pigs was markedly different with 17.4 % and 25.3 % respectively, exhibiting MDR. Resistance to streptomycin, sulfonamides and tetracyclines was the most frequently observed MDR pattern in isolates from both pigs and pig meat. Ciprofloxacin resistance was uncommon in S. Derby isolates from pigs occurring in only 2.4 % of the isolates for which isolate-based data was available. This contrasts with the situation in turkeys, where the most common resistance pattern was resistance to ampicillin, chloramphenicol, ciprofloxacin, sulfonamides, tetracyclines and trimethoprim, occurring in 49.6 % of isolates. Ciprofloxacin resistance was present in more than 90 % of S. Derby isolates from turkeys (Appendix Tables MDRP28).
Salmonella Infantis
Information on MDR was available for 529 S. Infantis isolates from broilers and 162 from broiler meat (Appendix Tables MDRP33 and MDRP31). Lower numbers of isolates were available from laying hens (36), turkeys (27), fattening pigs (18) and meat from pigs (23). The number of different MDR patterns obtained was approximately in proportion to the number of available isolates from each animal and food category. A very diverse range of 43 different MDR patterns was reported for 529 S. Infantis from broilers. Resistance to ciprofloxacin was invariably present as a component of the MDR patterns in broilers and turkeys and occurred in almost all isolates from broiler meat and laying hens; it was less common in MDR isolates from pigs and pig meat. Resistance to a common core antimicrobial pattern of ciprofloxacin, sulfonamides and tetracyclines occurred in 97.5 % (158 out of 162) of S. Infantis isolates from broiler meat and 82.4 % (436 out of 529) of isolates from broilers, 77.8 % (28 out of 36) from laying hens, 92.6 % (25 out of 27) from turkeys, 39.0 % (7 out of 18) of isolates from pigs and 13.0 % (3 out of 23) of isolates from pig meat. Resistance to ciprofloxacin, streptomycin, sulfonamides and tetracyclines (a pattern associated with S. Infantis definitive phage type 213) occurred in 29.9 % (158 out of 529) of S. Infantis isolates from broilers alone or with additional resistances, while 19.4 % (7 out of 36) of isolates from laying hens, 18.5 % (5 out of 27) of isolates

EU summary report on antimicrobial resistance in zoonotic and indicator bacteriafrom humans, animals and food 2012
EFSA Journal 2014;12(3):3590 105
from turkeys and 27.2 % (44 out of 162) of isolates from broiler meat showed this core pattern of resistance. Ciprofloxacin, streptomycin, sulfonamide and tetracycline resistance was uncommon in pigs and meat from pigs occurring in 5.6 % (1 out of 18) and 8.7 % (2 out of 23) of S. Infantis isolates, respectively.
3.4.4.2. Co-resistance to cefotaxime and ciprofloxacin Table SA42 describes those Salmonella serovars which were co-resistant to both cefotaxime and ciprofloxacin using EUCAST clinical breakpoints. In this table, data derived from the testing of fewer than 10 isolates and from fewer than four reporting countries have been included. The table also describes the resistance patterns for such isolates (applying ECOFFs for the other antimicrobials). Co-resistance to cefotaxime and ciprofloxacin has relevance for public health, since these are frequently the two main antimicrobials used for first-line treatment of human patients with salmonellosis.
Table SA42. Co-resistance to cefotaxime and ciprofloxacin (applying EUCAST clinical breakpoints)
Source Total number
isolates for which relevant data
available
Number of isolates resistant to
cefotaxime and ciprofloxacin1 (%)
Serovar (number of isolates) and resistance pattern(s) of isolates of this serovar co-
resistant to cefotaxime and ciprofloxacin2
Meat from broilers (Gallus gallus)
410 7 (1.7 %)
Other serovars (5) AmpCtxCipNalSuTet
S. Infantis (1) AmpCtxChlCipNalSuTetTmp
S. Rissen (1) AmpCtxChlCipNalSuTetTmp
Broilers 1,641 28 (1.7 %)
S. Agona (1) AmpCtxChlCipGenNalStrSuTetTmp
S. Hadar (6) AmpCtxChlCipNalStrSuTmp and AmpCtxCipNalSuTetTmp
S. Infantis (14) AmpCtxCipNalSuTetTmp AmpCtxCipNalSuTet AmpCtxCipNal AmpCtxCipGenNalSuTetTmp AmpCtxCipGenNalStrSuTet and AmpCtxChlCipGenNalStrSuTetTmp
S. Kentucky (1) AmpCtxCipNal
S. Livingstone (2) AmpCtxCipGenNalStrSu and AmpCtxChlCipNalSuTetTmp
S. Mbandaka (1) AmpCtxCipNalSuTetTmp
S. Senftenberg (2) AmpCtxChlCipGenNalSu
S. Thompson (1) AmpCtxCipNalSuTetTmp
Laying hens 686 2 (0.3 %) S. Kentucky (2) AmpCtxCipNal
Turkeys 567 1 (0.2 %) S. Derby (1) AmpCtxChlCipNalStrSuTetTmp
Fattening pigs and unspecified 1,155 5 (0.4 %)
S. Derby (4) AmpCtxCipNalStrSuTmp
S. Typhimurium, monophasic (1) AmpCtxCipNalStrSuTetTmp
Cattle (bovine animals) 212 1 (0.5 %) S. Livingstone (1) AmpCtxCipNalStrSuTetTmp
1. European Committee on Antimicrobial Susceptibility Testing (EUCAST) clinical breakpoints were applied for cefotaxime (R>2 mg/L) and ciprofloxacin (R>1 mg/L).
2. EUCAST epidemiological cut-off values were applied for antimicrobials other than cefotaxime and ciprofloxacin.

EU summary report on antimicrobial resistance in zoonotic and indicator bacteriafrom humans, animals and food 2012
EFSA Journal 2014;12(3):3590 106
Considering the Salmonella serovars showing co-resistance to cefotaxime and ciprofloxacin, multi-drug resistant S. Infantis with co-resistance to cefotaxime and ciprofloxacin was infrequent among Salmonella isolates on broiler meat, comprising 0.2 % (1 out of 410) of the total available; however, it was the most common serovar which exhibited co-resistance at the clinical breakpoint for cefotaxime and ciprofloxacin in broilers, where it accounted for 0.8 % (14 out of 1,641) of the total isolates from broilers. Other serovars exhibiting co-resistance generally occurred at a low frequency and were detected as one or two MDR isolates, apart from S. Hadar in broilers (6 out of 1,641 isolates) and S. Derby in pigs (4 out of 1,155 isolates). The same co-resistant serovar (S. Infantis) was therefore detected in broilers and broiler meat. Co-resistance to cefotaxime and ciprofloxacin was most frequently observed in Salmonella serovars from broilers, affecting 1.7 % of isolates and involving eight different serovars. Co-resistance affected less than 1 % of Salmonella isolates from other categories of livestock. Isolate-based data were available for fewer isolates from cattle (212) than for the other species and a single MDR isolate of S. Livingstone was detected from cattle exhibiting co-resistance to cefotaxime and ciprofloxacin. Interestingly, the resistance pattern observed (AmpCtxCipNalStrSuTetTmp), but without trimethoprim resistance was also observed in an isolate of S. Livingstone from broilers, suggesting possible transmission of this MDR serovar between these livestock sectors.
3.4.4.3. Analysis of high-level ciprofloxacin resistance High-level resistance to ciprofloxacin in Salmonella of animal and food origin, as well as the serovars displaying such resistance, are shown in Appendix 5. A variety of serovars displayed high-level ciprofloxacin resistance and were frequently resistant to other antimicrobials.
Considering those serovars occurring most frequently and in a number of different MSs and types, S. Kentucky was represented in isolates from Romania, the Czech Republic, Spain and Hungary from broilers from Romania, Spain and Hungary from laying hens and from the Czech Republic, Spain and Hungary from turkeys. It was also detected in single isolates from meat from turkeys in the Czech Republic and from meat from broilers in Ireland. S. Infantis was the second most frequently encountered in a number of different MSs. A single isolate of S. Typhimurium showing high-level ciprofloxacin resistance was reported from meat from pigs.
A particular clone of S. Kentucky sequence type 198 with high-level ciprofloxacin resistance has been detected in Africa and the middle East (Le Hello et al., 2011) and has been subsequently detected in poultry in some European countries (Wasyl and Hoszowski, 2012). S. Kentucky showing such high-level resistance to ciprofloxacin was detected in several MSs in 2012 and from a number of different sources. The occurrence of this serovar/phenotype is only evident in MSs reporting isolate-based data. The MSs detecting such isolates in broilers include Romania (8.2 %; 64 out of 781), the Czech Republic (1.4 %; 5 out of 351), Spain (13.8 %; 4 out of 29) and Hungary (0.6 %; 1 out of 175). In laying hens, it was detected in Romania (2.7 %; 4 out of 146), Spain (1.3 %; 2 out of 150) and Hungary (2.3 %; 2 out of 86) and in turkeys in the Czech Republic (33.3 %; 9 out of 27), Spain (1.2 %; 2 out of 169) and Hungary (19.0 %; 33 out of 174). The Czech Republic detected S. Kentucky with high-level ciprofloxacin resistance in meat from turkeys (1 out of 10; 10.0 %), while Ireland detected it in meat from broilers (1.4 %; 1 out of 70). S. Kentucky with high-level ciprofloxacin resistance has therefore been reported from a larger number of MSs in 2012 than was the case in 2011 and is now being detected in all three types of poultry, which are monitored (broilers, laying hens and turkeys), as well as in broiler and turkey meat. Its occurrence may be under-estimated because not all MSs report isolate-based data and some MSs have reported the occurrence of unspecified serovars which possess this phenotype. Genotypic typing data were not available; therefore, the isolates with this phenotype cannot be definitively assigned to the ST198 clone of S. Kentucky.
Salmonella serovars displaying high-level ciprofloxacin resistance were reported in poultry only and were not detected in fattening pigs or cattle in the reporting MSs. However, single isolates of S. Typhimurium and S. Infantis displaying such resistance were recovered from pig meat in two MSs and these MSs did not examine isolates from fattening pigs. The diversity of serovars displaying high-level ciprofloxacin resistance in poultry differed between MSs and was greatest in Romania which detected it in the serovars Agona, Infantis, Kentucky, Liverpool, Livingstone, Rissen and Tennessee in broilers and in the serovars Albany, Corvallis, Hadar, Kentucky and Thompson from laying hens. Hungary also detected high-level resistance to ciprofloxacin in serovars other than Kentucky; namely in S. Stanley from turkeys, S. Saintpaul from laying hens and S. Infantis from broilers. High-level resistance to fluoroquinolones in Salmonella generally involves multiple mutations of the DNA gyrase genes which are chromosomally located and therefore not transferable between bacteria in bacterial conjugation. The results suggest that clonal spread of S. Kentucky with high-level ciprofloxacin resistance may be occurring in EU MSs; however, genetic confirmation would be required

EU summary report on antimicrobial resistance in zoonotic and indicator bacteriafrom humans, animals and food 2012
EFSA Journal 2014;12(3):3590 107
to substantiate this observation. Moreover, a range of different serovars showing high-level resistance to ciprofloxacin is emerging in some MSs and this may be the result of the selective pressure of usage of fluoroquinolones.
S. Infantis with high-level ciprofloxacin resistance was detected in several MSs, raising the possibility that this serovar is also spreading clonally in poultry and possibly other species in Europe. In total, 14 isolates were recovered from Romania (broilers and broiler meat), Hungary (broilers) and the Czech Republic (pig meat). In addition to high-level ciprofloxacin resistance, all isolates were also resistant to sulfonamides and tetracyclines, with some possessing a range of additional resistances. Genetic examination would be required to investigate whether this represents clonal expansion of a high-level ciprofloxacin-resistant strain or multiple independent evolutions of several different strains. S. Infantis resistant to nalidixic acid, streptomycin, sulfonamides and tetracyclines belonging to definitive phage type 213 has been reported from several European countries (Nógrády et al., 2012). This pattern of resistance has also been noted in S. Infantis isolates from broilers in Iran (Rahmani et al., 2013), while resistance to nalidixic acid, tetracyclines and nitrofurantoin has been reported in Israel (Gal-Mor et al., 2010).
3.4.4.4. Analysis of pentavalent resistance The occurrence of such pentavalent resistance in different serovars is shown in Table SA43. Some such serovars were detected sporadically with only one reported instance (e.g. S. Wisbech, S. Kapemba) while others were detected at higher frequencies (e.g. S. Infantis) and sometimes in several different types of livestock (S. Infantis). In view of the observation that pentavalent resistance has been shown by many of the serovars which have become highly prevalent over the last few decades; describing these serovars in this way may provide an early indication of newly emerging epidemic strains.
Table SA43. Salmonella serovars detected with pentavalent resistance amongst those for which isolate-based data is available
Origin Serovars detected with pentavalent1 resistance
Meat from broilers S. Java (2), S. Infantis (1), S. Typhimurium (3)
Meat from pigs S. enterica subsp. enterica (2), S. Typhimurium (33), S. 1,4,[5],12:i:- (3), S. Kapemba (1), S. 4,12:i:- (1), S. Infantis (1), S. Typhimurium, monophasic (1), other serovars (1)
Meat from turkeys Other serovars (1)
Broilers S. Agona (1), S. Infantis (10), S. Liverpool (5), S. Tennessee (2), S. Senftenberg (2), S. Kentucky (4), S. Typhimurium (3), S. Saintpaul (1)
Laying hens S. Typhimurium (4), S. Kentucky (1), S. Infantis (1)
Turkeys S. 1,4,[5],12:i:- (1), S. Agona (1), S. Derby (13), S. Hadar (1), S. Typhimurium (1), S. Wisbech (1), S. London (3), S. Anatum (1)
Fattening pigs S. Typhimurium (112), S. 1,4,[5],12:i:- (20), Other serovars (7), S. enterica subsp. enterica (2), S. 4,12:i:- (1), S. Typhimurium, monophasic (2), S. Choleraesuis (1), not typeable (1)
Cattle S. Typhimurium (28), S. Rissen (1) 1. Resistance to ampicillin, chloramphenicol, streptomycin, sulfonamides and tetracyclines.
S. Infantis features as a serovar displaying pentavalent resistance, occurring at a relatively higher frequency in some animal categories (and in more than one different type of animal), as well as showing high-level ciprofloxacin resistance. It has also been detected in more than one MS. The detection of high-level ciprofloxacin resistance, associated with sulfonamide and tetracycline or pentavalent resistance in S. Infantis warrants further investigation to determine the relationship between those isolates currently occurring in animals and human as well as the relation to isolates detected in previous years.
Pentavalent resistance in Salmonella serovars can be related to the presence of the genetic structure known as Salmonella genomic island 1 (SGI1), which has been detected in a number of different serovars including Agona, Java, Albany and Newport in addition to S. Typhimurium (Velge et al., 2005). Recent genetic analysis (Beutlich et al., 2011) has shown the occurrence of several variations of the basic pattern of pentavalent resistance associated with SGI1 in European Salmonella isolates, related to the deletion and acquisition of different resistance genes. Thus, the ‘classical’ resistance pattern associated with SGI1 is conferred by the resistance genes blaPSE-1, floR, sul1, tet(G) and aadA2, whereas the variant SGI-1A occurring in S. Derby, has these genes together with dfrA10, conferring trimethoprim resistance. SGI-1C

EU summary report on antimicrobial resistance in zoonotic and indicator bacteriafrom humans, animals and food 2012
EFSA Journal 2014;12(3):3590 108
(also detected in S. Derby) has a deletion such that only aadA2 and sul1 remain, conferring resistance to streptomycin and sulfonamides. SGI-1M was a variant detected in S. Typhimurium with blaPSE-1, floR, sul1, tet(G) and aadB, the latter gene conferring gentamicin resistance. SGI1-K1 is a variant of SGI-1 described in S. Kentucky ST198 (Le Hello et al., 2011) showing high-level ciprofloxacin resistance, which also carries gentamicin resistance (conferred by aacA5), as well as genes conferring resistance to ampicillin, sulfonamides, streptomycin and tetracyclines. This MDR pattern (with additional resistance to ciprofloxacin) was that most frequently observed in S. Kentucky isolates from broilers and was also observed in isolates from laying hens and meat from broilers. Another pattern detected in S. Kentucky with high-level ciprofloxacin resistance was also evident; namely ampicillin, sulfonamide and tetracycline resistance, which has been associated with the Salmonella genomic island variant SGI1-K2.
MDR was uncommon in S. Enteritidis isolates, occurring in only 1.9 % of 270 isolates from broilers and 5.8 % of 206 isolates from laying hens, a marked contrast to the position in S. Typhimurium. All MDR isolates from laying hens and the majority (4 out of 5) MDR isolates from broilers were resistant to ciprofloxacin; resistance to ampicillin, sulfonamides and tetracyclines was also generally observed in MDR isolates. There were no S. Enteritidis isolates recovered from animals which were resistant to the antimicrobials ampicillin, chloramphenicol, sulfonamides, streptomycin, tetracyclines and trimethoprim. This resistance phenotype has been associated with a combined virulence–resistance plasmid in S. Enteritidis (a hybrid plasmid carrying both virulence and resistance determinants) and allows increased intra-cellular proliferation resulting in more severe human infections; an African origin was suspected in a European study of several isolates from humans (Rodriguez et al., 2012). This resistance phenotype might occur through other genetic configurations and cannot be used to confirm the presence of the combined virulence–resistance plasmid. However, it serves to illustrate how the data may be used to assess the possible incursion of such strains into the EU and to flag isolates for possible further investigation.
S. Typhimurium displayed a diverse range of resistance patterns, including patterns which can be associated with particular definitive phage types, such as ampicillin, chloramphenicol, streptomycin, sulfonamide and tetracycline resistance (associated with DT104) and this core pattern plus additional resistance to trimethoprim (which can be associated with phage types such as DT193 and U288). Resistance to ampicillin, chloramphenicol, gentamicin, sulfonamides and tetracyclines (the ‘SGI-1M pattern’, see above), albeit with additional resistances, was observed in 3.2 % (11 out of 341) of S. Typhimurium isolates from pigs. Cefotaxime resistance was not observed as part of MDR patterns in S. Typhimurium and resistance to ciprofloxacin was relatively uncommon. The wide range of resistance patterns detected may reflect the considerable diversity of strain types exhibited by this serovar (which may be a very old serovar) and consequently differences in the acquisition or ability to acquire resistance genes (Lan et al., 2009). Some of the definitive phage types of S. Typhimurium have been considered to have complex origins (Lan et al., 2009) and therefore might also differ in their propensity to develop or acquire resistance.
The majority of monophasic S. Typhimurium demonstrated the typical pattern of ‘tetravalent’ resistance to ampicillin, streptomycin, sulfonamides and tetracyclines, with this pattern plus resistance to ciprofloxacin prominent in isolates from turkey meat. The core pattern with additional resistance to trimethoprim was the second most commonly observed pattern in isolates from fattening pigs. The relative frequency of occurrence of the different patterns is likely to be biased by the relative contributions from individual MSs, because different MSs have reported variations in the patterns of resistance in this serovar. Monophasic S. Typhimurium with chromosomally encoded resistance to ampicillin, streptomycin, sulfonamides and tetracyclines have become particularly common in numerous EU countries since 2000, while Spanish U302-based monophasic strains have also been found to be multi-resistant, most frequently to ampicillin, chloramphenicol, gentamicin, streptomycin, sulfonamides, tetracyclines and trimethoprim (EFSA BIOHAZ Panel, 2010b). Strains showing resistance to ampicillin, streptomycin, sulfonamides and tetracyclines carrying the resistance genes blaTEM, strA-strB, sul2 and tet(B) (generally belonging to phage definitive types 120 or 193) have been considered the ‘European’ clone and carry Salmonella genomic island 2. Two other lineages have been described, the ‘Spanish’ clone referred to above and the ‘US’ clone, which is generally susceptible (Bugarel et al., 2013). A recent study of isolates from diverse sources in France ascribed 71 % of isolates to the Spanish clone and 2 % to the US clone (Bugarel et al., 2013). The pattern of resistance to ampicillin, chloramphenicol, gentamicin, streptomycin, sulfonamides, tetracyclines and trimethoprim was only described in 1.8 % (5 out of 279) of isolates from fattening pigs, whilst the pattern associated with the European clone was much more frequently detected. Resistance to cefotaxime as part of MDR was observed in 1.1 % of isolates from fattening pigs (3 out of 279) and one of these monophasic S. Typhimurium isolates was resistant to all antimicrobials in the test panel.

EU summary report on antimicrobial resistance in zoonotic and indicator bacteriafrom humans, animals and food 2012
EFSA Journal 2014;12(3):3590 109
Ten isolates were detected which were resistant to all nine antimicrobials in the test panel, including the single monophasic S. Typhimurium isolate from fattening pigs (0.1 %; 1 out of 983) and a single isolate of S. Agona from turkeys (0.2 %; 1 out of 567). In broilers, 0.5 % (8 out of 1 659) of Salmonella isolates were resistant to all of the antimicrobials in the test panel, comprising the serovars Infantis (two), Kentucky (two), Agona, Liverpool, Senftenberg and Tennessee. The two S. Kentucky isolates, one of the Infantis isolates and the Agona isolate demonstrated high-level ciprofloxacin resistance with MICs >4 mg/L.
There were only very few S. Derby isolates from broilers, cattle and meat from cattle (10 or less). MDR to streptomycin, sulfonamides and tetracyclines which was observed in both of only two S. Derby isolates from cattle was the commonest pattern observed in S. Derby isolates from fattening pigs. Different MSs were involved, but, where a MDR pattern and serovar are common in one species and the same pattern but at a lower frequency is observed in another species, spill over from a major reservoir host to a minor one is a possible explanation. The findings at EU level relating to pigs are therefore broadly consistent with a French study of isolates from pigs, pig meat and humans which found that 69.2 % were simultaneously resistant to streptomycin, sulfonamides and tetracyclines (Kerouanton et al., 2013). In Spain, 85.7 % of porcine S. Derby isolates were resistant to tetracyclines, 85.7 % to streptomycin, 71.4 % to sulfonamides and 50 % to ampicillin, whilst 42.8 % showed trimethoprim/sulfonamide resistance and 7.1 % were resistant to nalidixic acid (Valdezate et al., 2005). These prevalences of resistance are consistent with the MDR patterns observed. Isolates of S. Derby from pigs were markedly different from those in turkeys in relation to their tendency to display MDR (99.2 % in turkeys; 17.4 % in pigs) and the extent to which ciprofloxacin is a component of MDR patterns (2.3 % in MDR isolates from pigs; more than 90 % in MDR isolates from turkeys). SGI1-A has been described in S. Derby and comprised resistance to ampicillin, chloramphenicol, streptomycin, sulfonamides and tetracyclines (‘pentavalent’ resistance) with additional resistance to trimethoprim. This pattern was observed in isolates from turkeys and - with additional resistance to ciprofloxacin - was the most commonly observed MDR pattern in that animal species.
3.5. Overview of the findings of antimicrobial resistance in Salmonella at Member State reporting group level, 2012
Figures SA35 and SA36 illustrate the resistance levels for the groups of MSs reporting quantitative MIC data in 2012. These data were not all derived from the same group of MSs, which needs to be considered when interpreting these figures. Resistance levels to ampicillin, chloramphenicol, sulfonamides and tetracyclines in S. Typhimurium from Gallus gallus were higher than in S. Enteritidis from Gallus gallus. However, resistance to ciprofloxacin and nalidixic acid was higher in S. Enteritidis than in S. Typhimurium. In terms of all Salmonella spp., resistance levels in isolates from broiler meat were higher than those in isolates from Gallus gallus. This represents a return to the pattern observed in 2009 with an increase in resistance in isolates from broiler meat compared with the levels reported in 2010.
In a very similar pattern to that observed in 2010, resistance levels to tetracyclines, sulfonamides and ampicillin were higher in Salmonella isolated from turkeys, pigs and cattle than in isolates from Gallus gallus, whereas, for ciprofloxacin and nalidixic acid, the highest resistance was observed in turkeys and in Gallus gallus. The levels of resistance to sulfonamides and tetracyclines in isolates from turkeys decreased in 2012, whereas the levels of resistance to these antimicrobials in isolates from pigs increased compared with 2010.

EU summary report on antimicrobial resistance in zoonotic and indicator bacteriafrom humans, animals and food 2012
EFSA Journal 2014;12(3):3590 110
Figure SA34. Resistance to ampicillin, cefotaxime, chloramphenicol, ciprofloxacin, gentamicin, nalidixic acid, sulfonamides and tetracyclines in Salmonella spp., S. Enteritidis and S. Typhimurium from Gallus gallus and Salmonella spp. from meat from broilers at reporting MS group level in 2012
MS: Member State.
0
10
20
30
40
50
60
70
80
90
100
Salmonella spp.from Gallus gallus 2012 (16 MSs)
S. Enteritidis from Gallus gallus 2012 (13 MSs)
S. Typhimurium from Gallus gallus 2012 (5 MSs)
Salmonella spp. from broiler meat 2012 (12 MSs)
% re
sistance at repo
rting MS grou
p level
Ampicillin Cefotaxime Chloramphenicol Ciprofloxacin Gentamicin Nalidixic acid Sulfonamides Tetracyclines
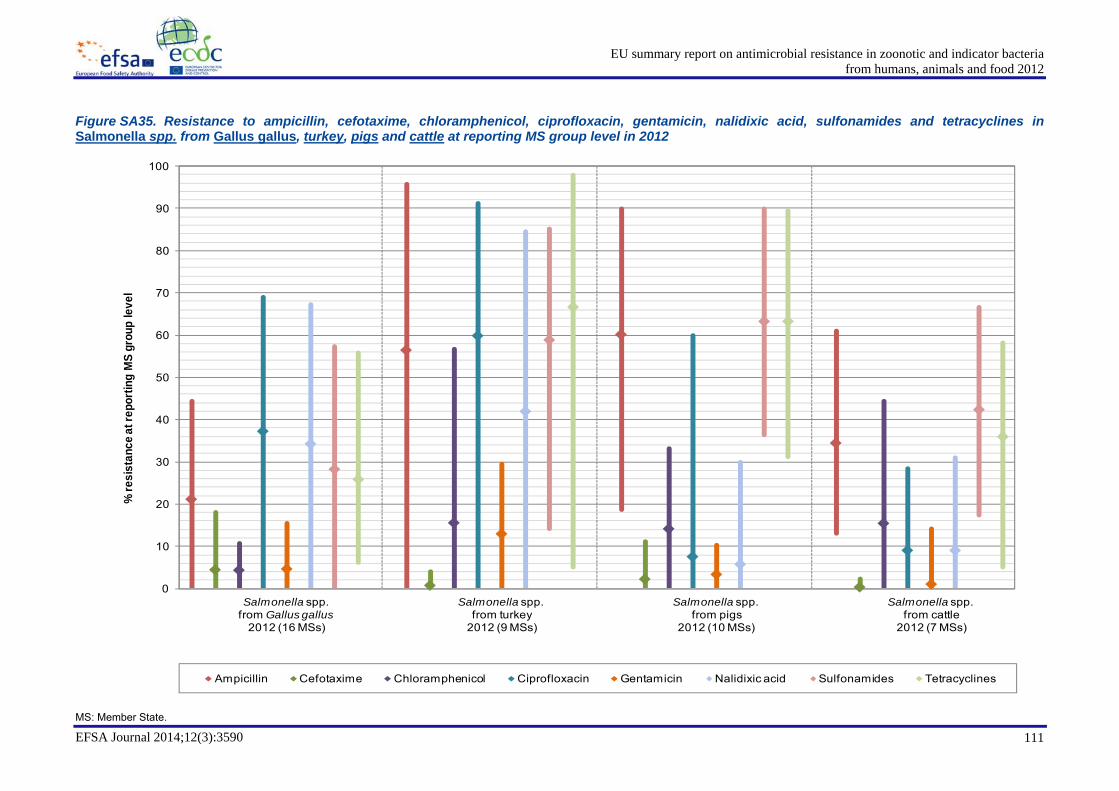
EU summary report on antimicrobial resistance in zoonotic and indicator bacteriafrom humans, animals and food 2012
EFSA Journal 2014;12(3):3590 111
Figure SA35. Resistance to ampicillin, cefotaxime, chloramphenicol, ciprofloxacin, gentamicin, nalidixic acid, sulfonamides and tetracyclines in Salmonella spp. from Gallus gallus, turkey, pigs and cattle at reporting MS group level in 2012
MS: Member State.
0
10
20
30
40
50
60
70
80
90
100
Salmonella spp.from Gallus gallus
2012 (16 MSs)
Salmonella spp.from turkey
2012 (9 MSs)
Salmonella spp.from pigs
2012 (10 MSs)
Salmonella spp. from cattle
2012 (7 MSs)
% re
sist
ance
at re
porti
ng M
S gr
oup
leve
l
Ampicillin Cefotaxime Chloramphenicol Ciprofloxacin Gentamicin Nalidixic acid Sulfonamides Tetracyclines

EU summary report on antimicrobial resistance in zoonotic and indicator bacteriafrom humans, animals and food 2012
EFSA Journal 2014;12(3):3590 112
3.6. Discussion
Salmonellosis continues to be the second most commonly reported zoonotic disease in humans in the EU, exceeded only by campylobacteriosis, although there has been a significant decline in human salmonellosis cases over the period 2007 to 2012. This decrease is assumed to be mainly the result of a reduction in Salmonella prevalence in flocks of laying hens, broilers and turkeys, probably as a result of the national control and monitoring programmes implemented by the MSs in the corresponding production sectors (EFSA and ECDC, 2014).
In 2012, information on antimicrobial resistance in Salmonella isolates from human cases was reported by 19 MSs and two non-MS. The number of isolates submitted by these countries corresponded to one-quarter of the salmonellosis cases reported within the EU in 2012 and is considered a representative sample. MSs not reporting antimicrobial resistance data are, however, still encouraged to do so, in order to achieve the best possible assessment of the levels of antimicrobial resistance in human Salmonella isolates in the EU. A novelty in this year’s report was that isolates from cases notified as having been acquired during travelling outside of the reporting country were excluded from all analyses except the analysis of resistance in difference geographical regions. This was done to better assess the impact on Salmonella isolates from food consumed within each reporting country on the antimicrobial resistance levels found in human isolates in that country. Please note, however, that imported food, which can constitute a large proportion of the food available in some countries, is not covered by this report.
Resistance in human Salmonella isolates was high for ampicillin, sulfonamides, streptomycin and tetracyclines and moderate for nalidixic acid. These first four compounds are antimicrobials that are or have been commonly used for treatment of animals and formerly were commonly used in humans. For these four antimicrobials, the important resistance observed was largely the result of the high to extremely high resistance levels observed among S. Typhimurium and particularly monophasic S. Typhimurium isolates. This corresponding resistance pattern (ASSuT) is that which is most commonly observed among the emerging monophasic S. Typhimurium definitive phage type 193 out of 120 strains (EFSA BIOHAZ Panel, 2010b). In contrast, resistance to the clinically important antimicrobials, ciprofloxacin and cefotaxime, was relatively low among the isolates tested. However, levels of resistance to ciprofloxacin were generally higher in countries using ECOFFs or other sensitive breakpoints, as both CLSI and EUCAST clinical breakpoints for ciprofloxacin resistance are significantly higher than the ECOFF. Resistance to quinolones (ciprofloxacin and nalidixic acid) was also generally higher in S. Enteritidis isolates than in S. Typhimurium isolates of human origin.
There was a rather poor correlation between ciprofloxacin and nalidixic acid resistance levels observed in human isolates in 2012. This could possibly be the result of the problem of detecting low-level ciprofloxacin resistance in Salmonella when using disc diffusion. In the ECDC external quality assurance scheme for Salmonella, it was also concluded that the use of different, sometimes non-standardised, interpretive criteria resulted in deviating results, rather than a lack of accuracy or performance in the laboratories (ECDC, 2012). In the EU protocol for harmonised monitoring of antimicrobial resistance in human Salmonella and Campylobacter isolates, ECDC is therefore promoting the use of EUCAST methods and breakpoints in all laboratories submitting AST results to TESSy, and advise laboratories using disc diffusion for ciprofloxacin to also test for nalidixic acid (ECDC, 2014).
About 30 % of human Salmonella spp. isolates from the 13 MSs which tested all antimicrobials in the test panel exhibited multi-drug resistance, meaning that they were clinically non-susceptible to at least three different antimicrobial classes. Two MSs recorded MDR levels above 50 %. However, about half of all isolates tested were susceptible to the complete range of antimicrobials reported for humans. Co-resistance to the critically important antimicrobials, ciprofloxacin and cefotaxime, was low and observed in a total of 27 isolates (out of 13,496 isolates tested) reported by five of the 12 reporting MSs.
The MDR levels observed in human isolates were sometimes higher than those observed in animals and meat. This can be explained by the fact that both clinically resistant and clinically intermediate results were combined to estimate MDR in human isolates and the clinical breakpoints for only 4 out of 10 antimicrobials (cefotaxime and ciprofloxacin regarding both CLSI and EUCAST, gentamicin and trimethoprim regarding only CLSI) had higher MIC values (i.e. being less sensitive) than the ECOFFs and for two antimicrobials (chloramphenicol and tetracyclines) the relationship was the reverse, i.e. the clinical breakpoint was more sensitive than the ECOFF. This resulted in a lower than expected difference in MDR estimates between human and animal/food isolates.

EU summary report on antimicrobial resistance in zoonotic and indicator bacteriafrom humans, animals and food 2012
EFSA Journal 2014;12(3):3590 113
A striking observation was that many human isolates were resistant to a large number of antimicrobials, some even to all 10. This could reflect the impact of use of antimicrobials in humans, in addition to that in food-producing animals, or exposure to sources of Salmonella other than those associated with food-producing animals. A proportion of the Salmonella infections occurring in humans in a given MS is likely to be associated with food-producing animals in that MS, while other infections will be associated with a variety of other sources, including imported foods and spices, foreign travel, other types of animals (such as pet reptiles) or the environment. Some human infections can also occur through spread between affected human patients. As mentioned above, travel-associated cases (where the information was provided) were excluded from the analysis in order to reduce this bias.
In order to assess the importance of travel-associated infections, antimicrobial resistance was also analysed based on the most likely country of infection and aggregated by geographical region. Overall, human Salmonella spp. isolates acquired within the EU/EEA countries exhibited greater resistance to ampicillin, streptomycin, sulfonamides and tetracyclines than isolates from any other region, while the highest levels of resistance to ciprofloxacin were observed in isolates acquired from Asia, Africa and European countries outside of the EU/EEA.
In Salmonella isolates from animals and meat, information on antimicrobial resistance was reported by 19 MSs and two non-MS in accordance with EFSA’s recommendations (EFSA, 2007) in 2012. The (quantitative) MIC results obtained using the methods recommended by EFSA provided the most harmonised and comparable set of data for reporting MSs, and these datasets have therefore been analysed in detail. For the second time, this EU Summary Report has examined the levels of resistance in isolates within different production types of animal species. Differences in animal husbandry and physiological differences between animals involved in different production types (e.g. fattening veal calves and dairy cattle) make evaluation of the antimicrobial resistance results at the animal species level difficult, where the production types of the species in question are not comparable. Sub-division of resistance data allows for more accurate analysis; however, this is possible only where sufficient information on production type has been submitted. In 2012, the large number of MSs providing data on isolates from Gallus gallus by production type allowed for more accurate analysis. However, more information is required at the production level for other animal species, particularly cattle, to improve these sections of the report in future years.
As mentioned above, some antimicrobials such as ampicillin, sulfonamides and tetracyclines have been widely used for many years in veterinary medicine to treat bacterial diseases. The levels of resistance to these antimicrobials are generally moderate to high among isolates from food-producing animals and meat products thereof. For ampicillin, sulfonamides and tetracyclines, as well as chloramphenicol, resistance levels were highest in isolates from pigs, followed closely by isolates from turkeys and then cattle. Isolates from Gallus gallus displayed the least resistance to these antimicrobials within the reported data, but were still at moderate to high levels. Considering the production level data for Salmonella spp. and S. Enteritidis from Gallus gallus, higher levels of resistance were generally observed among isolates from broiler flocks than in isolates from laying hen flocks. This was particularly evident for tetracyclines and sulfonamides. This may reflect the relative infrequency with which laying hens are treated with antimicrobials compared with broilers, as well as the limited numbers of antimicrobial compounds which are authorised for the treatment of laying hens in many EU MSs.
The highest occurrence of resistance to ciprofloxacin was noted in Salmonella from turkeys, fowl (Gallus gallus) and broiler meat. The ciprofloxacin resistance level for the Gallus gallus species can be further sub-divided into production types and reveals a difference between Salmonella isolates from laying hens (19.4 % resistance) and broilers (46.3 % resistance). An equal number of MSs had significant increasing and decreasing national trends for ciprofloxacin and/or nalidixic acid resistance in Salmonella spp. isolates from Gallus gallus over the 2006 to 2012 period. These observations relating to Salmonella spp. may reflect the occurrence of S. Enteritidis phage type 1 in Gallus gallus within these MSs, since this phage type commonly displays resistance to nalidixic acid and ciprofloxacin. Similarly, in turkeys, the dissemination of certain serovars, such as S. Newport and S. Infantis, in some MSs, which, again, are commonly resistant to nalidixic acid and ciprofloxacin, may affect the overall levels of resistance among all Salmonella spp. In addition, the reporting of resistance results for an expanded number of individual serovars in this report enables some of the resistances which are associated with particular serovars to be clearly seen.
Resistance to third-generation cephalosporins, such as cefotaxime, was detected in Salmonella isolates from turkeys, fowl (Gallus gallus), pigs, cattle and the meat derived from broilers and pigs, but at low or very low levels when all reporting MSs were considered. However, there was some variability in third-generation cephalosporin resistance observed between the different animal or meat origins in the reporting MSs.

EU summary report on antimicrobial resistance in zoonotic and indicator bacteriafrom humans, animals and food 2012
EFSA Journal 2014;12(3):3590 114
Belgium, Poland and Portugal detected cefotaxime resistance in S. Enteritidis from Gallus gallus in 2012, whereas, in 2011, Austria and Hungary reported resistant isolates and, in 2010, cefotaxime resistance in S. Enteritidis from Gallus gallus was reported only by the Czech Republic. As S. Enteritidis is one of the main serovars affecting humans, the emergence of resistance to third-generation cephalosporins is extremely undesirable.
Antimicrobial resistance in certain Salmonella serovars and phage types may be related not only to the selective pressure exerted by the use of antimicrobials, but also to the clonal diffusion of these Salmonella serovars and phage types, and may also be influenced by factors such as on-farm hygienic management and animal movements and trade. It was evident in both humans and animals that isolates of S. Typhimurium displayed higher levels of resistance than isolates of S. Enteritidis to ampicillin, chloramphenicol, streptomycin, sulfonamides and tetracyclines. This is usually observed among the data reported by MSs and is not surprising, since certain phage types of S. Typhimurium have an associated pattern of pentavalent resistance to these antimicrobials. The same pattern was observed in 2011, whereas in 2010 the majority of significant trends were increasing. Ultimately, it would be most useful to correlate trends and the occurrence of antimicrobial resistance with the usage of antimicrobial compounds in each animal production type that is monitored.
The multi-drug resistance levels (proportions of isolates showing reduced susceptibility to more than three antimicrobial classes according to ECOFFs) in Salmonella spp. isolates were generally high in the animal populations investigated, with notable variations between reporting countries. A striking exception to this is the multi-resistance levels recorded in isolates from laying hens, which are generally low to moderate, in particular compared with those observed in isolates from broilers. Generally, the proportions of Salmonella spp. isolates susceptible to all or resistant (or non-susceptible) to any one of up to nine antimicrobials differed substantially among the reporting countries, and the relative contribution of different serovars, which may exhibit particular MDR patterns, should be borne in mind when comparing the situation between the reporting countries. The occurrence of co-resistance to cefotaxime and ciprofloxacin (determined using ECOFFs) differed between MSs and was not detected in isolates from the majority of MSs reporting isolate-based data. In the MSs where it was detected, co-resistance to these antimicrobials in Salmonella spp. occurred at very low to moderate levels in isolates from broiler meat, broilers, layers, turkeys, pigs and cattle. Applying clinical breakpoints, co-resistance to cefotaxime and ciprofloxacin was detected in Salmonella isolates from meat from broilers and broilers. Co-resistance using ECOFFs was detected for a single Salmonella isolate from meat from pigs.
An additional goal of the monitoring programme is to highlight strains of Salmonella which may be emerging in several MSs and which have particular patterns of resistance or show specific resistances of importance. Detailed analyses of multi-drug resistance patterns in Salmonella serovars, including analysis of high-level resistance to ciprofloxacin and pentavalent resistance and investigation of co-resistance to both cefotaxime and ciprofloxacin, was possible for MSs reporting isolate-based data and is included for the first time in this report. This is particularly important for the antimicrobial ciprofloxacin, where isolates can develop increasing resistance in a step-wise and incremental manner. Pentavalent resistance (i.e. resistance to ampicillin, chloramphenicol, streptomycin, sulfonamides and tetracyclines) is a characteristic shown by several serovars which have become highly prevalent over the last few decades. High-level ciprofloxacin resistance was observed in a limited number of S. Kentucky isolates from broilers, laying hens and turkeys, but not in isolates from pigs or cattle, although it was detected in isolates from pig meat. S. Infantis showing high-level ciprofloxacin resistance, together with resistance to a core antimicrobial pairing of sulfonamides and tetracyclines (but with other resistances which were not invariably present in all high-level ciprofloxacin Infantis isolates), was detected in meat from broilers, pig meat and broilers. The occurrence of S. Infantis with this resistance pattern in several MSs and in different types of animal or meat probably indicates that either a clone of S. Infantis showing such resistance has spread within Europe or several clones have gained such high-level ciprofloxacin resistance independently. In addition to showing high-level ciprofloxacin resistance, S. Infantis also featured as a serovar displaying ‘pentavalent’ resistance, that is resistance to ampicillin, chloramphenicol, streptomycin, sulfonamides and tetracyclines. A small number of serovars displayed pentavalent resistance which is potentially significant because certain Salmonella serovars which have shown epidemic spread have shown such pentavalent resistance in the past. Therefore, describing those serovars which exhibit pentavalent resistance, their frequency of occurrence and whether they are distributed across one or several different types of animals or MSs is likely to provide useful information on new and emerging MDR serovars.

EU summary report on antimicrobial resistance in zoonotic and indicator bacteria
from humans, animals and food 2012
EFSA Journal 2014;12(3):3590 115
4. ANTIMICROBIAL RESISTANCE IN CAMPYLOBACTER
4.1. Introduction
Campylobacteriosis continues to be the most commonly reported zoonosis in humans in the EU. In 2012, the number of confirmed cases of Campylobacter reported in the EU however decreased by 4.3 % compared with 2011. The EU notification rate of confirmed cases of human campylobacteriosis shows a statistically significant increasing trend in the last five years, 2008 to 2012 (EFSA and ECDC, 2014). In 2012, about one quarter of the fresh broiler meat samples were reported positive, even though there were large differences between the MSs (EFSA and ECDC, 2014). In reporting countries, the prevalence of campylobacteriosis in broiler flocks remained mainly at levels similar to previous years (EFSA and ECDC, 2014).
ZOONOTIC CAMPYLOBACTER
The Campylobacter species most commonly associated with human infection are C. jejuni followed by C. coli and C. lari, but other species are also known to cause infections in humans. The infective dose of these bacteria is generally low.
The incubation period in humans ranges from two to five days. Patients may experience mild to severe symptoms, commonly including watery, sometimes bloody, diarrhoea, abdominal pain, fever, headache and nausea. Infections are usually self-limiting and last only a few days; treatment with antimicrobials is therefore usually not required. Extra-intestinal infections, invasive infections or post-infection complications such as reactive arthritis and neurological disorders can occur, but these are infrequent. C. jejuni is a recognised antecedent cause of Guillain–Barré syndrome, a form of paralysis that can sometimes result in dysfunction of the respiratory and neurological systems and can even be fatal.
Thermotolerant Campylobacter species are widespread in nature. The primary reservoirs are the alimentary tract of birds and mammals including food-producing animals (poultry, cattle, pigs and sheep). Campylobacter species have been isolated from pet animals, including cats and dogs, from wild birds, from water and from various environmental samples. Clinical disease resulting from infection with thermotolerant Campylobacter species is rare in animals.
Campylobacter can readily contaminate various food-stuffs including meat, particularly poultry meat, raw milk and dairy products, and less frequently fish and fish products, mussels and fresh vegetables. Considering sporadic human cases, consumption of poultry meat, drinking water from untreated water sources and contact with pets and other animals have been identified as significant and major sources of infection. Drinking water contaminated with Campylobacter has caused large outbreaks.

EU summary report on antimicrobial resistance in zoonotic and indicator bacteria
from humans, animals and food 2012
EFSA Journal 2014;12(3):3590 116
4.2. Overview of reported data in humans, animals and food
Fourteen MSs and Iceland provided data for 2012 on Campylobacter isolates from human cases. These countries reported qualitative data, i.e. interpreted antimicrobial susceptibility testing (AST) results for tested isolates (S, I or R), mainly derived from diffusion methods.
In 2012, 15 MSs and 1 non-MS (Switzerland) reported quantitative dilution data on antimicrobial resistance in Campylobacter isolates from animals and food. AST was carried out only for C. jejuni and C. coli, all other Campylobacter species were excluded from the monitoring programme of antimicrobial resistance in Campylobacter. Twelve MSs reported data where no method was specified.
Table CA1 presents an overview of the countries reporting antimicrobial resistance data on Campylobacter spp. from humans and various animal and food categories in 2012.
Table CA1. Overview of countries reporting antimicrobial resistance data using MIC and disc diffusion zones on Campylobacter coli and Campylobacter jejuni from humans and various animal and food categories in 2012
Bacterial species
Method Origin Total number of MSs reporting
Countries
C. coli
Diffusion Human 8 MSs: EE, FR, IT, LT, LU, NL, RO, SI
Dilution
Human 9 MSs: AT, ES, HU, LU, MT, NL, SI, SK, UK
Gallus gallus (fowl) 7 MSs: AT, CZ, ES, FR, HU, NL, RO
Non-MS: CH
Turkeys 2 MSs: DE, NL
Pigs 5 MSs: DK,ES, FR, HU, NL
Non-MS: CH
Cattle (bovine animals) 3 MSs: DE, ES, NL
Non-MS: CH
Meat from broilers (Gallus gallus)
7 MSs: AT, BE, CZ, EE, HU, NL, PL, RO
Meat from turkeys 6 MSs: DE, EE, HU, NL, PL, RO
Meat from pigs 2 MSs: BE, PL
Meat from bovine animals
2 MSs: DE, PL
C. jejuni
Diffusion Human 8 MSs: EE, FR, IT, LT, LU, NL, RO, SI
Non-MS: IS
Dilution
Human 9 MSs: AT, ES, HU, LU, MT, NL, SI, SK, UK
1 Non-MS: IS
Gallus gallus (fowl) 11
MSs: AT, CZ, DK, ES, FI, FR, HU, IT, NL,
RO, SE
Non-MS: CH
Turkeys 2 MSs: DE, NL
Pigs 1 MS: HU
Non-MS: CH
Cattle (bovine animals) 5 MSs: DE, DK ,ES, FI, NL
Non-MS: CH
Meat from broilers (Gallus gallus)
8 MSs: AT, BE, CZ, DK, EE, HU ,NL, PL, RO
Meat from turkeys 6 MSs: DE, EE, HU, NL, PL, RO
Meat from pigs 1 MS: PL
Meat from bovine animals
1 MS: PL
MIC: minimum inhibitory concentration.
Note: For abbreviations of Member States (MS) and other reporting countries, see Appendix 7.

EU summary report on antimicrobial resistance in zoonotic and indicator bacteria
from humans, animals and food 2012
EFSA Journal 2014;12(3):3590 117
4.3. Antimicrobial resistance in Campylobacter isolates from humans
METHODS AND INTERPRETIVE CRITERIA USED FOR ANTIMICROBIAL SUSCEPTIBILITY TESTING OF CAMPYLOBACTER ISOLATES FROM HUMANS
The method of testing for antimicrobial susceptibility varies between countries. Disc diffusion was the most common method in 2012, but often a combination of disc diffusion and dilution was used, depending on the reason for the testing. In several countries, the reference laboratories type only a fraction of the isolates. The remaining isolates are typed by hospitals or local laboratories and the methods used by these are not reported. The guidelines used for the methodology and interpretation of antimicrobial susceptibility testing for Campylobacter differed between countries and also within countries for different antimicrobials, but were more harmonised in 2012 than in 2011 (for detailed information, see Chapter 8 Materials and methods, Table MM3). The guidelines used by several national public health reference laboratories were from the French Society for Microbiology (CA-SFM), Clinical and Laboratory Standards Institute (CLSI) and European Committee on Antimicrobial Susceptibility Testing (EUCAST).
Of the five antimicrobials tested in both human and animal/food isolates, resistance according to the EUCAST clinical breakpoints and ECOFFS were at the same MIC value or only differing by one concentration step for ciprofloxacin, erythromycin and tetracycline, while no EUCAST clinical breakpoints were available for gentamicin and nalidixic acid. The CA-SFM breakpoints differed from the ECOFFS by two concentration steps for tetracycline, the combination of C. coli/erythromycin and the combination of C. jejuni/gentamicin. In all other cases the breakpoints for CA-SFM and the ECOFFs were at the same MIC value or only differing by one concentration step. The level of resistance determined by CLSI breakpoints and ECOFFS were at the same MIC value or only differing by one concentration step. Exceptions were for tetracycline and the combination of C. jejuni/erythromycin where there was a two-step difference. CLSI clinical breakpoints were not available for gentamicin or nalidixic acid (Figure CA1).Owing to the variety of breakpoints used under each set of guidelines, results should be interpreted with caution in the case of antimicrobials where there are major differences in the interpretive criteria.
Figure CA1. Comparison of clinical breakpoints and epidemiological cut-off values used to interpret MIC data reported for Campylobacter spp. from humans, animals or food
MIC: minimum inhibitory concentration.
Note: CLSI (2010), EUCAST clinical breakpoints (2012), CA-SFM (2010), EUCAST ECOFFS (as of EFSA, 2007).

EU summary report on antimicrobial resistance in zoonotic and indicator bacteria
from humans, animals and food 2012
EFSA Journal 2014;12(3):3590 118
4.3.1. Antimicrobial resistance in Campylobacter spp. in humans
Fourteen MSs and Iceland submitted data for 2012 on antimicrobial susceptibility of Campylobacter spp. isolates from human clinical cases to ECDC. This accounted for 38,835 Campylobacter spp. isolates, representing 17.9 % of the total number of confirmed cases of campylobacteriosis reported in the EU/EEA in 2012 (N=217,261).Thirteen MSs and Iceland reported susceptibility results for more than 20 isolates, which was the limit set for presenting the level of resistance by country. Romania reported susceptibility results for fewer than 20 isolates and was included only in the analysis totals.
In order to better assess the impact from food consumed within each reporting country on the antimicrobial resistance levels found in human Campylobacter isolates, the analysis focused on domestically-acquired cases. Several countries however did not provide any information on travel (or non-travel) of their cases. Cases with unknown travel status were therefore also included in the analysis. A separate analysis was made on travel-associated cases by geographical regions.
4.3.1.1. Resistance levels in Campylobacter spp. isolates from human cases
A large variation was observed among the reporting countries with regard to the number of antimicrobials tested, ranging from 8 countries testing for amoxicillin to all 15 countries testing for ciprofloxacin and erythromycin (Table CA2). This most likely reflects the variation in the clinical importance of the antimicrobials. The highest average level of resistance in all Campylobacter spp. isolates from human cases was observed for nalidixic acid (48.8 %; N=21,491) and ciprofloxacin (47.4 %; N=36,172) followed by ampicillin (36.4 %; N=7,768) and tetracyclines (32.4 %; N=6,824) (Table CA2).
The observed variability in resistance levels may reflect the differences in the Campylobacter population that people are exposed to in different countries. Variability may also arise due to differences in testing or sampling methods applied by individual countries as well as the use of different interpretive criteria. Sampling bias could also arise by only including isolates from hospitalised cases. This may explain some of the extreme observations.
4.3.1.2. Comparison of resistance levels in Campylobacter spp. isolates acquired within EU/EEA and in other geographical regions
To compare resistance levels in isolates acquired across the world, isolates from travel-associated cases were classified into seven different geographical regions
15 EU/EEA, non-EU/EEA, Africa, Asia, North and
Central America, South America and Oceania, based on the probable country of infection. Only a limited amount of isolates were tested and/or reported from travel-associated cases outside of Europe (Table CA3). Data on resistance to four antimicrobials (ciprofloxacin, erythromycin, nalidixic acid and tetracyclines) were reported for ≥10 isolates from infections acquired in three geographical regions (EU/EEA, Africa and Asia). The frequencies of resistance to all four antimicrobials were noticeably higher in isolates that had been acquired in Asia and Africa compared with those acquired within the EU/EEA, with about two-fold higher levels of ciprofloxacin resistance and about three-fold higher levels of resistance to erythromycin (Table CA3).
Since the resistance levels differ substantially between C. jejuni and C. coli, the two most commonly reported Campylobacter species, further results are presented separately for these two species.
15
Regional classification from the United Nations Statistical Division. Available online:
http://unstats.un.org/unsd/methods/m49/m49regin.htm

EU summary report on antimicrobial resistance in zoonotic and indicator bacteria
from humans, animals and food 2012
EFSA Journal 2014;12(3):3590 119
Table CA2. Antimicrobial resistance in Campylobacter spp. from humans per country in 2012, using clinical breakpoints1
Country Amoxicillin Ampicillin Ciprofloxacin Erythromycin Gentamicin Nalidixic acid Tetracyclines
N % Res N % Res N % Res N % Res N % Res N % Res N % Res
Austria 387 0.3 387 29.2 387 62.3 387 1.8 387 0.3 387 60.7 387 31.8
Estonia 90 6.7 87 41.4 231 64.5 212 0.9 92 1.1 95 66.3 201 17.4
France 4,727 0.2 4,728 31.3 4,643 52.9 4,727 3.7 4,727 0.2 4,728 54.8 – –
Hungary – – – – 71 77.5 71 1.4 – – – – – –
Italy – – 184 65.8 254 62.6 251 6.4 172 2.3 146 70.5 170 52.4
Lithuania – – – – 195 85.1 227 0.4 – – – – – –
Luxembourg 561 0.2 561 47.2 561 62.0 561 2.7 561 0 561 62.6 561 47.2
Malta – – – – 214 76.2 214 26.6 – – – – – –
Netherlands – – – – 3,483 58.5 2,976 2.6 – – – – 1,519 32.8
Romania – – – – 19 NA 19 NA 19 NA 19 NA 19 NA
Slovakia 3 NA 125 28.0 1,109 31.8 1,302 1.5 27 11.1 – – 1,235 11.4
Slovenia 788 5.5 981 35.2 981 68.0 981 0.8 981 0.2 787 61.6 981 21.9
Spain 228 1.8 228 49.1 228 83.8 228 7.9 228 3.1 228 96.1 228 72.8
United Kingdom 214 14.5 487 66.1 23,796 42.6 23,868 3.0 1,048 0.4 14,540 44.2 1,523 43.8
Total (14 MSs) 6,998 1.4 7,768 36.4 36,172 47.4 36,024 3.1 8,242 0.4 21,491 48.8 6,824 32.4
Iceland – – – – 29 34.5 29 0 – – – – – –
MS: Member State; N: number of isolates tested; % Res: percentage of resistant isolates; –: no data reported; NA: not applicable - if fewer than 20 isolates were tested resistance was not calculated.
1. Isolates from cases reported as related to travel outside the country were excluded from this table. For the proportion of tested isolates from travel-associated, domestic and unknown cases by country please see table MM4.

EU summary report on antimicrobial resistance in zoonotic and indicator bacteria
from humans, animals and food 2012
EFSA Journal 2014;12(3):3590 120
Table CA3. Antimicrobial resistance in Campylobacter spp. reported to be acquired within the EU and in other geographical regions in 2012, using clinical breakpoints
Country Amoxicillin Ampicillin Ciprofloxacin Erythromycin Gentamicin Nalidixic acid Tetracyclines
N % Res N % Res N % Res N % Res N % Res N % Res N % Res
Europe (EU/EEA countries) 7,000 1.4 7,848 36.8 36,386 40.5 36,080 3.1 8,256 0.4 21,543 48.9 6,847 32.4
Europe (non-EU/EEA countries) 1 NA 3 NA 7 NA 7 NA 1 NA 4 NA 2 NA
Africa 0 NA 6 NA 35 74.3 32 9.4 7 NA 23 78.3 7 NA
Asia 4 NA 7 NA 63 81.0 62 8.1 9 NA 35 80.0 14 57.1
Northern and Central America No observations No observations 8 NA 8 NA 1 NA 7 NA 2 NA
South America No observations No observations 1 NA 1 NA No observations 1 NA No Observations
Oceania No observations No observations No observations No observations No observations No observations No Observations
N: number of isolates tested; % Res: percentage of resistant isolates; –: no data reported; NA: not applicable - if fewer than 20 isolates were tested resistance was not calculated.

EU summary report on antimicrobial resistance in zoonotic and indicator bacteria
from humans, animals and food 2012
EFSA Journal 2014;12(3):3590 121
4.3.2. Antimicrobial resistance in Campylobacter jejuni in humans
As in previous years, C. jejuni was the most common Campylobacter species identified in 2012, with 81,621 cases reported in the EU/EEA. In 2012, 13 MSs and Iceland reported data on antimicrobial resistance in C. jejuni for ≥20 isolates (ranging from 6 MSs for amoxicillin to all 14 countries for ciprofloxacin and erythromycin (Table CA4)).
4.3.2.1. Resistance levels in Campylobacter jejuni isolates from human cases
The highest frequencies of resistance in C. jejuni isolates were observed for ciprofloxacin (54.1 %; N=11,551) and nalidixic acid (53.3 %; N=6,765) (Table CA4).
Macrolides, e.g. erythromycin, are the first choice drugs for the treatment of campylobacteriosis in humans (ECDC et al., 2009). The level of resistance for erythromycin reported in humans was low, on average 1.4 % (N=11,080). In the EU, the highest proportions of resistant isolates were reported by Malta with 10.9 % (N=138) and Italy with 5.4 % (N=202) (Table CA4).
Ciprofloxacin is the second-choice drug for treatment of campylobacteriosis in humans (ECDC et al., 2009) although resistance evolves rapidly. Resistance to ciprofloxacin reported by the countries was very low to extremely high (0.3 % to 91.9 %). The highest levels of resistance, 91.9 % (N=99) and 84.1 % (N=182), were reported by Lithuania and Spain, respectively (Table CA4). Nalidixic acid is normally used as an indicator of ciprofloxacin resistance. Resistance to nalidixic acid and ciprofloxacin was comparable and the levels of resistance to nalidixic acid ranged from 40.8 % to 96.2 % (Table CA4).
4.3.2.2. Trends in resistance levels in Campylobacter jejuni isolates from human cases
Country-specific trends in resistance to ciprofloxacin during the period 2008 to 2012 are presented in Figure CA2. Only countries reporting data for at least three consecutive years and 10 isolates per year were included. Trends of increasing resistance could be observed in most reporting countries over the period, with the exception of Italy and the United Kingdom. Increases were most noticeable in Estonia, Iceland, Lithuania (from 2009 and onwards) and Malta.
Country-specific trends for erythromycin over the years 2008 to 2012 are presented in Figure CA3. There were few common trends between countries over the years. The exception was a peak in resistance observed in 2010 in Iceland (3.1 %; N=32), Luxembourg (3.6 %; N=528) and Slovenia (2.4 %; N=911). In the years before and after 2010, resistance levels in all three countries were markedly lower. In some other countries, a peak was instead observed in 2011: Estonia (1.2 %; N=165), France (1.7 %; N=4,171), Italy (6.9 %; N=174), Lithuania (0.3 %, N=296) and the Netherlands (2.8 %, N=2,501). In the United Kingdom, a decreasing trend could be observed over the whole period.
4.3.2.3. Multi-drug resistance among Campylobacter jejuni isolates from human cases
Five MSs, Austria, Estonia, Luxembourg, Slovenia and Spain, tested at least 10 isolates for the full range of antimicrobials included in the human data collection for C. jejuni, and these isolates were included in the multi-drug resistance analysis. Overall, 18.0 % (N=1,799) of the human C. jejuni isolates were susceptible to all six antimicrobials, with particularly low levels of susceptibility reported from Spain (1.6 %; N=182) (Table CA5). Multi-drug resistance was, on average, high in the five MSs (24.8 %; N=1,799; country average 24.8 %). There was large variation in the level of multi-resistance between countries ranging from 14.3 % (N=84) in Estonia to 42.3 % (N=182) in Spain (Table CA5). The proportions of C. jejuni isolates susceptible to all or resistant (non-susceptible) to any up to six antimicrobials by MS are presented in Figure CA4. Isolates resistant to up to five antimicrobials were reported from two MSs (Slovenia and Spain). No MS reported any isolates resistant to all six antimicrobials. Few isolates exhibited co-resistance to both ciprofloxacin and erythromycin in the five MSs (1.4 %; N=1,799) (Table CA5).
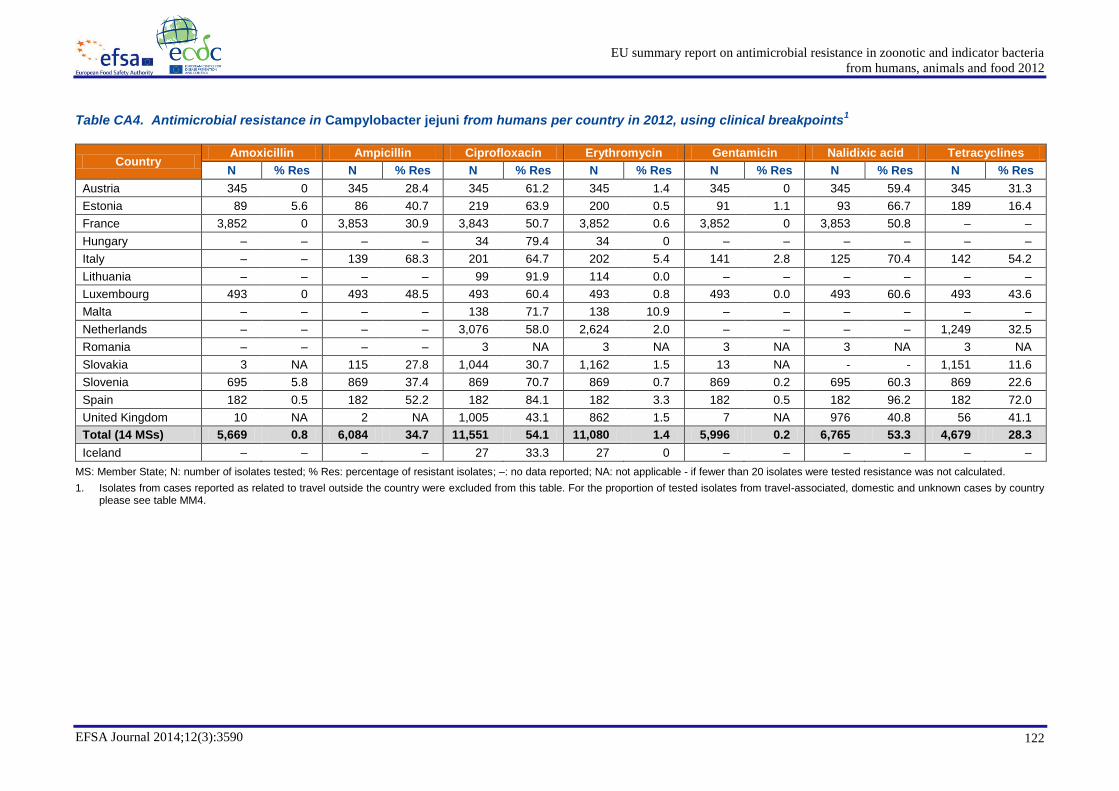
EU summary report on antimicrobial resistance in zoonotic and indicator bacteria
from humans, animals and food 2012
EFSA Journal 2014;12(3):3590 122
Table CA4. Antimicrobial resistance in Campylobacter jejuni from humans per country in 2012, using clinical breakpoints1
Country Amoxicillin Ampicillin Ciprofloxacin Erythromycin Gentamicin Nalidixic acid Tetracyclines
N % Res N % Res N % Res N % Res N % Res N % Res N % Res
Austria 345 0 345 28.4 345 61.2 345 1.4 345 0 345 59.4 345 31.3
Estonia 89 5.6 86 40.7 219 63.9 200 0.5 91 1.1 93 66.7 189 16.4
France 3,852 0 3,853 30.9 3,843 50.7 3,852 0.6 3,852 0 3,853 50.8 – –
Hungary – – – – 34 79.4 34 0 – – – – – –
Italy – – 139 68.3 201 64.7 202 5.4 141 2.8 125 70.4 142 54.2
Lithuania – – – – 99 91.9 114 0.0 – – – – – –
Luxembourg 493 0 493 48.5 493 60.4 493 0.8 493 0.0 493 60.6 493 43.6
Malta – – – – 138 71.7 138 10.9 – – – – – –
Netherlands – – – – 3,076 58.0 2,624 2.0 – – – – 1,249 32.5
Romania – – – – 3 NA 3 NA 3 NA 3 NA 3 NA
Slovakia 3 NA 115 27.8 1,044 30.7 1,162 1.5 13 NA - - 1,151 11.6
Slovenia 695 5.8 869 37.4 869 70.7 869 0.7 869 0.2 695 60.3 869 22.6
Spain 182 0.5 182 52.2 182 84.1 182 3.3 182 0.5 182 96.2 182 72.0
United Kingdom 10 NA 2 NA 1,005 43.1 862 1.5 7 NA 976 40.8 56 41.1
Total (14 MSs) 5,669 0.8 6,084 34.7 11,551 54.1 11,080 1.4 5,996 0.2 6,765 53.3 4,679 28.3
Iceland – – – – 27 33.3 27 0 – – – – – –
MS: Member State; N: number of isolates tested; % Res: percentage of resistant isolates; –: no data reported; NA: not applicable - if fewer than 20 isolates were tested resistance was not calculated.
1. Isolates from cases reported as related to travel outside the country were excluded from this table. For the proportion of tested isolates from travel-associated, domestic and unknown cases by country please see table MM4.
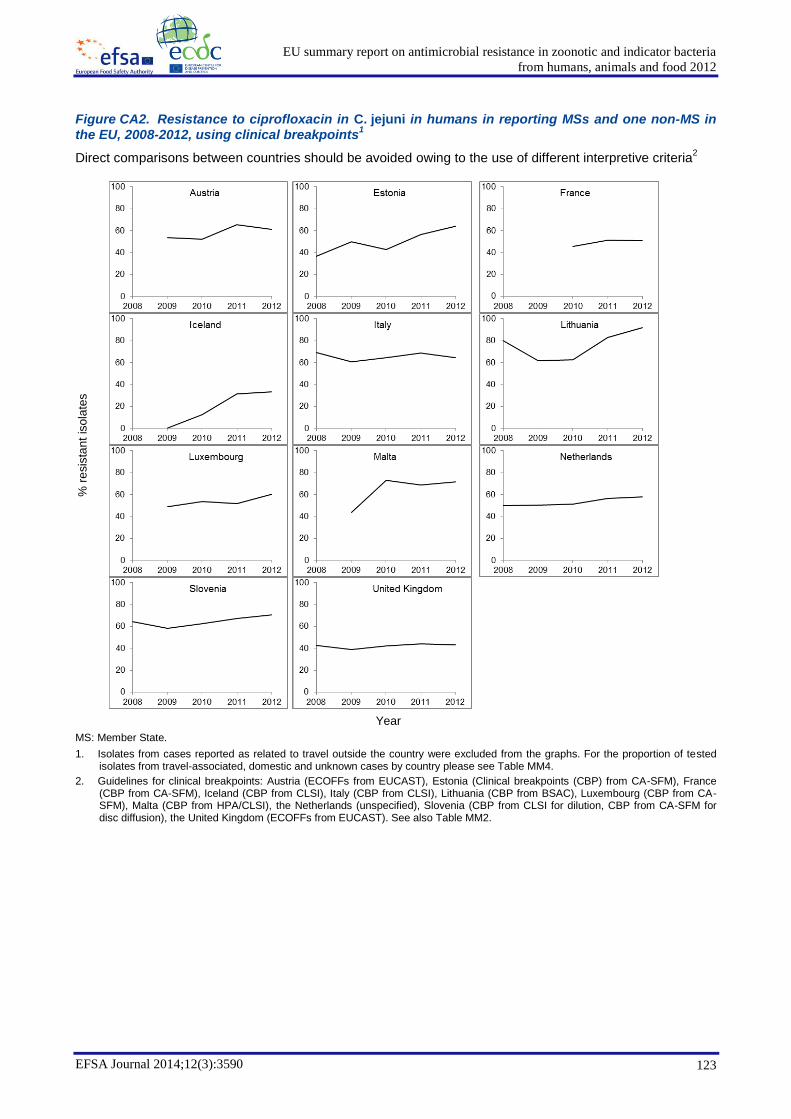
EU summary report on antimicrobial resistance in zoonotic and indicator bacteria
from humans, animals and food 2012
EFSA Journal 2014;12(3):3590 123
Figure CA2. Resistance to ciprofloxacin in C. jejuni in humans in reporting MSs and one non-MS in the EU, 2008-2012, using clinical breakpoints
1
Direct comparisons between countries should be avoided owing to the use of different interpretive criteria2
% r
esis
tan
t is
ola
tes
Year
MS: Member State.
1. Isolates from cases reported as related to travel outside the country were excluded from the graphs. For the proportion of tested isolates from travel-associated, domestic and unknown cases by country please see Table MM4.
2. Guidelines for clinical breakpoints: Austria (ECOFFs from EUCAST), Estonia (Clinical breakpoints (CBP) from CA-SFM), France (CBP from CA-SFM), Iceland (CBP from CLSI), Italy (CBP from CLSI), Lithuania (CBP from BSAC), Luxembourg (CBP from CA-SFM), Malta (CBP from HPA/CLSI), the Netherlands (unspecified), Slovenia (CBP from CLSI for dilution, CBP from CA-SFM for disc diffusion), the United Kingdom (ECOFFs from EUCAST). See also Table MM2.

EU summary report on antimicrobial resistance in zoonotic and indicator bacteria
from humans, animals and food 2012
EFSA Journal 2014;12(3):3590 124
Figure CA3. Resistance to erythromycin in C. jejuni in humans in reporting MSs and one non-MS in the EU, 2008-2012, using clinical breakpoints
1
Direct comparisons between countries should be avoided owing to the use of different interpretive criteria2
% r
esis
tan
t is
ola
tes
Year
MS: Member State.
1. Isolates from cases reported as related to travel outside the country were excluded from the graphs. For the proportion of tested isolates from travel-associated, domestic and unknown cases by country please see table MM4.
2. Guidelines for clinical breakpoints: Austria (ECOFFs from EUCAST), Estonia (CBP from CA-SFM), France (CBP from CA-SFM), Iceland (CBP from CLSI), Italy (CBP from CLSI), Lithuania (CBP from BSAC), Luxembourg (CBP from CA-SFM), the Netherlands (unspecified), Slovenia (CBP from CLSI for dilution, CBP from CA-SFM for disc diffusion), the United Kingdom (ECOFFs from EUCAST). See also Table MM3.

EU summary report on antimicrobial resistance in zoonotic and indicator bacteria
from humans, animals and food 2012
EFSA Journal 2014;12(3):3590 125
Table CA5. Complete susceptibility, multi-resistance and co-resistance (non-susceptibility) to ciprofloxacin and erythromycin, as determined by clinical breakpoints, in C. jejuni from humans by MS, 2012
1
Country Susceptible to all (%) Multi-resistant (%) Co-resistant to Cip and Ery (%)
Austria (N=345) 28.4 14.8 1.4
Estonia (N=84) 8.3 14.3 0
Luxembourg (N=493) 21.3 28.6 2.2
Slovenia (N=695) 16.0 23.9 0.7
Spain (N=182) 1.6 42.3 2.7
Total (5 MSs) (N=1,799) 18.0 24.8 1.4
N: total number of isolates tested for susceptibility against the whole common antimicrobial set for Campylobacter; Cip: ciprofloxacin; Ery: erythromycin; MS: Member State.
Susceptible to all: proportion of isolates susceptible to all antimicrobial substances of the ECDC common set for Campylobacter. Multi-resistant: proportion of isolates resistant to at least three different antimicrobial substances, belonging to any three antimicrobial families from the ECDC common antimicrobial set for Campylobacter. Co-resistant to Cip and Ery: proportion of isolates not susceptible to both Cip and Ery.
1. Isolates from cases reported as related to travel outside the country were excluded from this table. For the proportion of tested isolates from travel-associated, domestic and unknown cases by country please see table MM4.
Figure CA4. Frequency distribution of completely susceptible isolates and resistant isolates to from one to six antimicrobials, as determined by clinical breakpoints, in C. jejuni from humans by MS,
20121
N: total number of isolates tested for susceptibility against the whole common antimicrobial set for Campylobacter; MS: Member State.
Susceptible: total number of isolates susceptible to all antimicrobial substances of the common set for C. jejuni. res1-res6: total number of isolates resistant to between one and six antimicrobial substances of the common set for C. jejuni. 1. Isolates from cases reported as related to travel outside the country were excluded from the graph. For the proportion of tested
isolates from travel-associated, domestic and unknown cases by country please see table MM4.
0 % 10 % 20 % 30 % 40 % 50 % 60 % 70 % 80 % 90 % 100 %
Spain (N=182)
Slovenia (N=695)
Luxembourg (N=493)
Estonia (N=84)
Austria (N=345)
Susceptible
res1
res2
res3
res4
res5
res6

EU summary report on antimicrobial resistance in zoonotic and indicator bacteria
from humans, animals and food 2012
EFSA Journal 2014;12(3):3590 126
4.3.3. Antimicrobial resistance in Campylobacter coli in humans
C. coli was the second most common Campylobacter species identified in 2012, with 6,231 cases reported in the EU/EEA. In 2012, nine MSs reported data on antimicrobial resistance in C. jejuni for ≥20 isolates (ranging from five MSs for amoxicillin to all nine countries for ciprofloxacin and erythromycin (Table CA6)).
4.3.3.1. Resistance levels in Campylobacter coli isolates from human cases
The highest percentage of resistance among C. coli isolates was observed for nalidixic acid (69.9 %; N=1,002) and ciprofloxacin (69.0 %; N=1,322), followed by tetracyclines (49.7 %; N=328) and ampicillin (36.0 %; N=926) (Table CA6). The percentage of resistance to ciprofloxacin was highly correlated with resistance to nalidixic acid in four of the six countries which tested both antimicrobials and in two countries the percentage of resistance was higher to nalidixic acid than to ciprofloxacin. The percentage of human C. coli isolates resistant to erythromycin was 15.1 % (N=1,264), which was considerably higher than for C. jejuni (1.4 %). The highest levels of resistance to erythromycin were reported from Spain (27.3 %; N=44), but the number of isolates tested was low (Table CA6).
4.3.3.2. Trends in resistance levels in Campylobacter coli isolates from human cases
Country-specific trends in resistance to ciprofloxacin during the period 2008 to 2012 are presented in Figure CA5. Only countries reporting data for at least three consecutive years and 10 isolates per year were included. Increasing trends over the period were observed in Austria, Luxembourg, the Netherlands and Slovenia (from 2009). A drop in resistance was observed in several countries in 2011: France (58.1 %, N=735), Italy (46.2 %; N=13), Lithuania (74.4 %; N=39), Malta (53.8 %; N=39), Slovenia (52.4 %, N=42) and Spain (78.4 %, N=51) (Figure CA5).
There were few similarities in resistance trends for erythromycin between countries over the years 2008 to 2012 (Figure CA6) except that a peak in resistance could be observed in several countries in 2011: Austria (8.3 %; N=36), Lithuania (2.2 %; N=45), Luxembourg (23.3 %; N=60), the Netherlands (15.5 %; N=110) and Slovenia (7.1 %; N=42). A trend of increasing resistance to erythromycin was observed in the Netherlands over the five-year period and a decreasing trend was observed in Italy, although in the case of Italy only a small number of isolates were tested (N=10-30). The peak in resistance observed in Spain in 2010 could be because only 10 isolates were tested that year.
4.3.3.3. Multi-drug resistance among Campylobacter coli isolates from human cases
Four MSs, Austria, Luxembourg, Slovenia and Spain, tested at least 10 isolates for the full range of antimicrobials included in the human data collection for C. coli and these isolates were included in the multi-drug resistance analysis. Overall, only 6.4 % (N=188) of the human C. coli isolates were susceptible to all six antimicrobials, with particularly low levels of susceptibility reported in Slovenia (0 %; N=36) and Spain (0 %; N=44) (Table CA7). On average, the level of multi-drug resistance was high (35.1 %; N=188; country average 33.3 %) (Table CA7). The proportions of C. coli isolates susceptible to all or resistant (non-susceptible) to any one up to six antimicrobials by MS are presented in Figure CA7. All four countries reported isolates resistant to up to four antimicrobials, three MSs reported isolates resistant to up to five antimicrobials and one isolate was reported from one MS resistant to all six. The overall level of co-resistance to both ciprofloxacin and erythromycin was moderate across these four countries (16.0 %; N=188) (Table CA7).
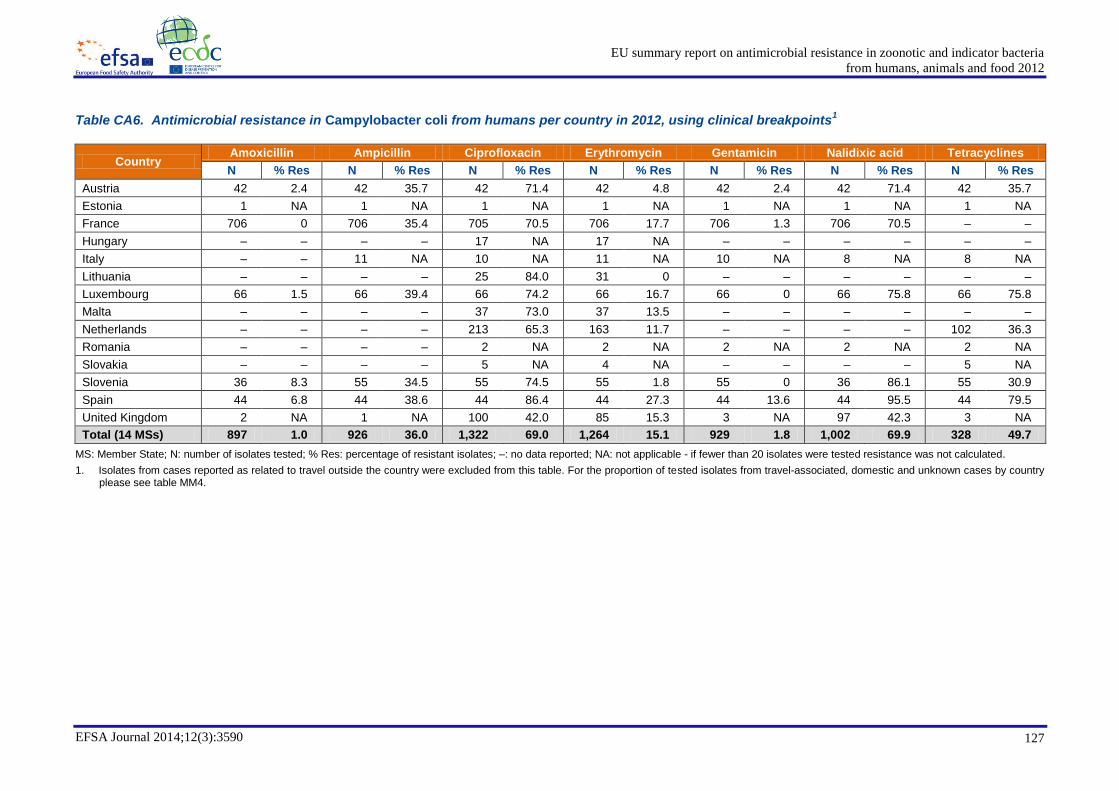
EU summary report on antimicrobial resistance in zoonotic and indicator bacteria
from humans, animals and food 2012
EFSA Journal 2014;12(3):3590 127
Table CA6. Antimicrobial resistance in Campylobacter coli from humans per country in 2012, using clinical breakpoints1
Country Amoxicillin Ampicillin Ciprofloxacin Erythromycin Gentamicin Nalidixic acid Tetracyclines
N % Res N % Res N % Res N % Res N % Res N % Res N % Res
Austria 42 2.4 42 35.7 42 71.4 42 4.8 42 2.4 42 71.4 42 35.7
Estonia 1 NA 1 NA 1 NA 1 NA 1 NA 1 NA 1 NA
France 706 0 706 35.4 705 70.5 706 17.7 706 1.3 706 70.5 – –
Hungary – – – – 17 NA 17 NA – – – – – –
Italy – – 11 NA 10 NA 11 NA 10 NA 8 NA 8 NA
Lithuania – – – – 25 84.0 31 0 – – – – – –
Luxembourg 66 1.5 66 39.4 66 74.2 66 16.7 66 0 66 75.8 66 75.8
Malta – – – – 37 73.0 37 13.5 – – – – – –
Netherlands – – – – 213 65.3 163 11.7 – – – – 102 36.3
Romania – – – – 2 NA 2 NA 2 NA 2 NA 2 NA
Slovakia – – – – 5 NA 4 NA – – – – 5 NA
Slovenia 36 8.3 55 34.5 55 74.5 55 1.8 55 0 36 86.1 55 30.9
Spain 44 6.8 44 38.6 44 86.4 44 27.3 44 13.6 44 95.5 44 79.5
United Kingdom 2 NA 1 NA 100 42.0 85 15.3 3 NA 97 42.3 3 NA
Total (14 MSs) 897 1.0 926 36.0 1,322 69.0 1,264 15.1 929 1.8 1,002 69.9 328 49.7
MS: Member State; N: number of isolates tested; % Res: percentage of resistant isolates; –: no data reported; NA: not applicable - if fewer than 20 isolates were tested resistance was not calculated.
1. Isolates from cases reported as related to travel outside the country were excluded from this table. For the proportion of tested isolates from travel-associated, domestic and unknown cases by country please see table MM4.

EU summary report on antimicrobial resistance in zoonotic and indicator bacteria
from humans, animals and food 2012
EFSA Journal 2014;12(3):3590 128
Figure CA5. Resistance to ciprofloxacin in C. coli in humans in reporting MSs in the EU, 2008-2012, using clinical breakpoints
1
Direct comparisons between countries should be avoided owing to the use of different interpretive criteria2
% r
esis
tan
t is
ola
tes
Year
MS: Member State.
1. Isolates from cases reported as related to travel outside the country were excluded from the graphs. For the proportion of tested isolates from travel-associated, domestic and unknown cases by country please see Table MM4.
2. Guidelines for clinical breakpoints: Austria (ECOFFs from EUCAST), France (CBP from CA-SFM), Italy (CBP from CLSI), Lithuania (CBP from BSAC), Luxembourg (CCBP from A-SFM), Malta (CBP from HPA/CLSI), the Netherlands (unspecified), Slovenia (CBP from CLSI for dilution, CBP from CA-SFM for disc diffusion), Spain (CBP from CLSI). See also Table MM3.

EU summary report on antimicrobial resistance in zoonotic and indicator bacteria
from humans, animals and food 2012
EFSA Journal 2014;12(3):3590 129
Figure CA6. Resistance to erythromycin in C. coli in humans in reporting MSs in the EU, 2008-2012, using clinical breakpoints
1
Direct comparisons between countries should be avoided owing to the use of different interpretive criteria2
% r
esis
tan
t is
ola
tes
Year
MS: Member State.
1. Isolates from cases reported as related to travel outside the country were excluded from the graphs. For the proportion of tested isolates from travel-associated, domestic and unknown cases by country please see Table MM4.
2. Guidelines for clinical breakpoints: Austria (ECOFFs from EUCAST), France (CBP from CA-SFM), Italy (CBP from CLSI), Lithuania (CBP from BSAC), Luxembourg (CBP from CA-SFM), the Netherlands (unspecified), Slovenia (CBP from CLSI for dilution, CBP from CA-SFM for disc diffusion), Spain (CBP from CLSI). See also Table MM3.

EU summary report on antimicrobial resistance in zoonotic and indicator bacteria
from humans, animals and food 2012
EFSA Journal 2014;12(3):3590 130
Table CA7. Complete susceptibility, multi-resistance and co-resistance (non-susceptibility) to ciprofloxacin and erythromycin, as determined by clinical breakpoints, in C. coli from humans by MS, 2012
1
Country Susceptible to all (%) Multi-resistant (%) Co-resistant to Cip and Ery (%)
Austria (N=42) 9.5 16.7 2.4
Luxembourg (N=66) 12.1 45.5 24.2
Slovenia (N=36) 0 19.4 5.6
Spain (N=44) 0 50.0 25.0
Total (4 MSs) (N=188) 6.4 35.1 16.0
N: total number of isolates tested for susceptibility against the whole common antimicrobial set for Campylobacter; Cip: ciprofloxacin; Ery: erythromycin; MS: Member State.
Susceptible to all: proportion of isolates susceptible to all antimicrobial substances of the ECDC common set for Campylobacter. Multi-resistant: proportion of isolates resistant to at least three different antimicrobial substances, belonging to any three antimicrobial families from the ECDC common antimicrobial set for Campylobacter. Co-resistant to Cip and Ery: proportion of isolates not susceptible to both Cip and Ery.
1. Isolates from cases reported as related to travel outside the country were excluded from this table. For the proportion of tested isolates from travel-associated, domestic and unknown cases by country please see table MM4.
Figure CA7. Frequency distribution of C. coli isolates completely susceptible or resistant to one to six antimicrobials, as determined by clinical breakpoints, from humans by MS, 2012
1
N: total number of isolates tested for susceptibility against the whole common set of antimicrobial substances for C. coli; MS: Member States.
Susceptible: total number of isolates susceptible to all antimicrobial substances of the common set for C. coli. res1–res6: total number of isolates resistant to between one and six antimicrobial substances of the common set for C. coli. 1. Isolates from cases reported as related to travel outside the country were excluded from this graph. For the proportion of tested
isolates from travel-associated, domestic and unknown cases by country please see Table MM4.
0 % 10 % 20 % 30 % 40 % 50 % 60 % 70 % 80 % 90 % 100 %
Spain (N=44)
Slovenia (N=36)
Luxembourg (N=66)
Austria (N=42)
Susceptible
res1
res2
res3
res4
res5
res6

EU summary report on antimicrobial resistance in zoonotic and indicator bacteriafrom humans, animals and food 2012
EFSA Journal 2014;12(3):3590 131
4.4. Antimicrobial resistance in Campylobacter isolates from animals and food
The countries reporting on Campylobacter resistance from various animal and food sampling origins, in 2012 are presented in Table CA1. Antimicrobials selected by the different MSs, and non-MSs, for susceptibility testing of C. jejuni and C. coli, are shown in Chapter 8 Materials and methods, Table MM8.
In this chapter, resistance to ciprofloxacin, erythromycin, gentamicin, nalidixic acid and tetracyclines is described in detail. The occurrence of resistance is tabulated, a portrait of temporal evolution and spatial distribution of resistance is drawn and the multi-resistance is analysed. These analyses were performed, and the corresponding results presented, depending on whether a minimum of four or more countries reported quantitative data for a given Campylobacter species and the origin of sample (animal population and food category), and whether data were related to at least 10 isolates per country, origin of sample and year. C. jejuni and C. coli are both addressed, as monitoring data on the prevalence of Campylobacter in broilers and broiler meat in some reporting countries can reveal that C. coli prevalence is either not negligible or even of the same magnitude as that of C. jejuni (EFSA and ECDC, 2014).
• Temporal trend graphs were generated, showing percentage resistance to different antimicrobials among Campylobacter isolates, per sample origin, over the period 2006 to 2012, by year of sampling. Temporal trend graphs were included only for countries which had reported on four or more years in the 2006 to 2012 period.
• The spatial distributions of ciprofloxacin and erythromycin resistance rates in C. jejuni from Gallus gallus and C. coli from pigs are presented. For countries where resistance level figures for 2012 were not available, 2011 figures were used instead. For cattle, the number of reporting countries was lower than in the case of the other animal species monitored and, therefore, no spatial distribution maps were generated.
• Multi-resistance was analysed in the isolate-based dataset of Campylobacter isolates tested for the full harmonised set of five antimicrobials (ciprofloxacin, erythromycin, gentamicin, streptomycin and tetracyclines) belonging to different classes. ‘Multi-resistance’ was defined as non-susceptibility to at least three different antimicrobial classes. The proportions of isolates susceptible to all and resistant (non-susceptible) to any one of up to five antimicrobials are presented. Co-resistance to ciprofloxacin and erythromycin was also estimated as these two antimicrobials are of particular interest in human medicine in the treatment of campylobacteriosis.
Further information on reported MIC distributions and numbers of C. jejuni and C. coli isolates resistant to amoxicillin/clavulanic acid, ampicillin chloramphenicol, ciprofloxacin, clarithromycin, erythromycin,
THE REVISION OF EUCAST ECOFFS FOR CAMPYLOBACTER
There have been some recent minor revisions to the epidemiological cut-off value (ECOFF) provided by the European Committee on Antimicrobial Susceptibility Testing (EUCAST). Thus, the EUCAST ciprofloxacin ECOFF for C. coli is currently susceptible (i.e. wild-type) ≤0.5 mg/L, a decline of one log value from the previous ECOFF value of resistant (i.e. non-wild-type) >1 mg/L described on the EUCAST website and recorded in Table MM11. Similarly, the ECOFF values for C. coli and erythromycin, C. coli and nalidixic acid and C. jejuni and both ciprofloxacin and tetracyclines have declined by one dilution step. Conversely, the ECOFF has increased by one log dilution for C. jejuni versus gentamicin and streptomycin. Although deviation from wild-type susceptibility is a fixed microbiological characteristic, as greater numbers of bacterial isolates are tested, the wild-type distribution may become better defined and minor changes in the ECOFF might therefore be expected. The breakpoints used in this report to discriminate between ‘microbiologically resistant’ and wild-type bacteria are identical to those used in previous reports for Campylobacter and so there should be no effect of methodological changes when comparisons are made between years. When EFSA’s recommendations are revised to include the latest EUCAST ECOFFs and new legislation (Decision 2013/652) incorporating those recommendations enters into force in 2014, then the historical data are likely to be re-interpreted, using the new EUCAST ECOFFs. Reference to the minimum inhibitory concentration distribution tables for C. coli and C. jejuni, which are published in the Level 3 tables, shows that the effect of these changes is in most cases likely to be small.

EU summary report on antimicrobial resistance in zoonotic and indicator bacteriafrom humans, animals and food 2012
EFSA Journal 2014;12(3):3590 132
gentamicin, imipenem, nalidixic acid, neomycin, streptomycin, sulfonamides, tetracyclines and tulathromycin can be found in the Level 3 tables published on the EFSA website.
4.4.1. Antimicrobial resistance in Campylobacter isolates from food
In 2012, more than four MSs provided quantitative antimicrobial resistance data for C. jejuni and/or C. coli isolates only from broiler meat, so the analysis of other food categories is not presented in this report.
4.4.1.1. Meat from broilers and spent hens (Gallus gallus)
Representative sampling and monitoring
In the reporting MSs, data on antimicrobial resistance in Campylobacter isolates from meat from Gallus gallus derived from active monitoring programmes were based mainly on the random collection of broiler meat samples obtained either at the slaughterhouse, at the processing plant or at retail outlets. In Austria, Denmark, Estonia and Romania, representative random sampling of meat from broilers, whether neck skin, fresh meat, minced meat or meat preparation, was carried out entirely or primarily at wholesale or retail outlets. In Poland, sampling of broiler meat and broiler carcases was performed at retail outlets and at the slaughterhouse, respectively, while, in Hungary, meat samples were gathered at processing plants. In Belgium, Campylobacter isolates were derived from carcase swabs of spent hens and chilled broiler carcases collected at the slaughterhouse.
Resistance levels among C. jejuni and C. coli isolates from meat from broilers
In 2012, eight and six MSs provided quantitative antimicrobial resistance data for C. jejuni and C. coli isolates, respectively, from broiler meat (Table CA8 and Table CA9). Although resistance is typically higher among C. coli than C. jejuni, common features in the levels of resistance to ciprofloxacin, erythromycin, gentamicin, nalidixic acid and tetracyclines can be observed in the two Campylobacter species. For the commonly used antimicrobials, resistance to tetracyclines and nalidixic acid generally ranged from high to extremely high levels, whereas resistance to gentamicin varied less among reporting MSs and was either undetected or recorded at low levels. For clinically important antimicrobials, resistance to ciprofloxacin was high to extremely high in reporting MSs and closely paralleled the results obtained for nalidixic acid (as expected), whereas resistance to erythromycin was much lower considering all reporting MSs. However, the recorded levels of resistance to erythromycin were contrasting considering C. jejuni and C. coli, with higher levels generally observed in C. coli. In contrast to the other reporting MSs, Romania recorded a moderate resistance level to erythromycin in C. jejuni at 14.1 %. Belgium, the Netherlands and Romania reported moderate to high resistance to erythromycin in C. coli, whereas Austria, Hungary and Poland either did not detect resistance or reported low resistance. In Belgium, where resistance was monitored in a parallel fashion in carcases of spent hens and broilers, Campylobacter isolates from spent hens’ meat exhibited either similar or lower resistance levels to those observed in isolates from broiler meat.
Table CA8. Resistance (%) to ciprofloxacin, erythromycin, gentamicin, nalidixic acid and tetracyclines among Campylobacter jejuni from meat from broilers in MSs reporting MIC data in 2012, using harmonised epidemiological cut-off values
Country Ciprofloxacin Erythromycin Gentamicin Nalidixic acid Tetracyclines
N % Res N % Res N % Res N % Res N % Res Austria 60 63.3 60 0 60 0 60 56.7 60 33.3 Belgium1 75 57.3 75 1.3 75 0 75 57.3 75 64.0 Belgium2 106 28.3 106 1.9 106 0 106 27.4 106 37.7 Denmark 66 28.8 66 0 66 0 66 28.8 66 15.2 Estonia 33 51.5 33 3.0 33 3.0 33 51.5 33 24.2 Hungary 22 81.8 22 0 22 4.5 – – 22 54.5 Netherlands 241 55.6 241 0.8 241 0 241 55.6 241 50.6 Poland 157 88.5 157 0 157 0 157 86.0 157 59.2 Romania 64 81.3 64 14.1 64 6.3 64 82.8 64 59.4 Total (8 MSs) 824 59.5 824 1.8 824 0.7 802 57.9 824 47.5
MS: Member State; MIC: minimum inhibitory concentration; N: number of isolates tested; % Res: percentage of resistant isolates; –: no data reported. 1. Meat from broilers. 2. Meat from spent hens.

EU summary report on antimicrobial resistance in zoonotic and indicator bacteriafrom humans, animals and food 2012
EFSA Journal 2014;12(3):3590 133
Table CA9. Resistance (%) to ciprofloxacin, erythromycin, gentamicin, nalidixic acid and tetracyclines among Campylobacter coli from meat from broilers in MSs reporting MIC data in 2012, using harmonised epidemiological cut-off values
Country Ciprofloxacin Erythromycin Gentamicin Nalidixic acid Tetracyclines
N % Res N % Res N % Res N % Res N % Res Austria 30 73.3 30 0 30 0 30 73.3 30 33.3 Belgium1 30 80.0 30 26.7 30 0 30 70.0 30 86.7 Belgium2 43 65.1 43 16.3 43 4.7 43 65.1 43 62.8 Hungary 47 87.2 47 2.1 47 0 – – 47 34.0 Netherlands 126 83.3 126 23.8 126 0.8 126 83.3 126 62.7 Poland 116 89.7 116 5.2 116 0 116 89.7 116 64.7 Romania 81 82.7 81 32.1 81 6.2 81 80.2 81 46.9 Total (6 MSs) 473 82.7 473 16.5 473 1.7 426 81.0 473 57.3
MS: Member State; MIC: minimum inhibitory concentration; N: number of isolates tested; % Res: percentage of resistant isolates; –: no data reported. 1. Meat from broilers. 2. Meat from spent hens.
Multi-resistance among C. jejuni and C. coli isolates from meat from broilers and spent hens
As only three MSs and one non-MS reported isolate-based resistance data on 10 or more isolates of C. jejuni and C. coli, respectively, from broiler meat, the corresponding multi-resistance analysis is not presented in this report.
4.4.2. Antimicrobial resistance in Campylobacter isolates from animals
4.4.2.1. Domestic fowl (Gallus gallus): broilers
Representative sampling and monitoring
In this section, data on antimicrobial resistance in Campylobacter isolates from fowl (Gallus gallus) are completely derived from broilers. The vast majority of samples was collected from healthy broilers at the slaughterhouse. Entire caeca or caecal content samples were collected in Austria, the Czech Republic, Spain and Sweden, cloacal swabs in Denmark and Switzerland, and faeces before slaughter in Finland. In contrast, in Romania, sampling of faeces was carried out on the farm in the framework of the national control programme for Salmonella. For the majority of the MSs specifying details of the sampling strategy, sampling was randomised throughout the year, with the exception of Finland, where sampling was more intense over the high-risk period of the summer months. In accordance with EFSA’s recommendations (EFSA, 2007), only one representative sample of caecal content per flock/batch, derived from either a unique carcase or a number of carcases, was gathered to account for clustering. Typically, given the relatively high prevalence of Campylobacter in broilers, representative subsets of C. jejuni and C. coli isolates recovered from caecal samples, each representing one flock, were randomly selected at the laboratory for susceptibility testing. No information on the sampling strategy was provided by two MSs (Hungary and the Netherlands).
Resistance levels among C. jejuni and C. coli isolates from broilers
For 2012, quantitative data on C. jejuni isolates from broilers were provided by 10 MSs and one non-MS (Table CA10), while quantitative data on C. coli isolates were submitted by six MSs and one non-MS (Table CA11). Generally, in both C. jejuni and C. coli, resistance to gentamicin and erythromycin was either undetected or recorded at low to moderate levels, while resistance to tetracyclines and quinolones (ciprofloxacin and nalidixic acid) was high to extremely high among reporting MSs. A striking exception to this was the low to moderate resistance in C. jejuni isolates reported by the Nordic countries (Denmark, Finland and Sweden); corresponding resistance data on C. coli were not detected by these MSs. Romania also reported low levels of resistance to quinolones in C. jejuni. Typically, resistance in C. coli was either similar or greater than that observed in C. jejuni in those MSs reporting results for both Campylobacter species. Considering C. jejuni and C. coli, levels of resistance to ciprofloxacin and nalidixic acid were rather

EU summary report on antimicrobial resistance in zoonotic and indicator bacteriafrom humans, animals and food 2012
EFSA Journal 2014;12(3):3590 134
similar within each species as expected. Resistance to erythromycin and gentamicin in C. jejuni showed differences between reporting MSs, with either no resistance detected or resistance detected at low levels.
Generally, resistance in C. coli and C. jejuni from broiler meat and broilers was reported at rather similar levels in the MSs reporting data on both animal and meat origins. An exception to this was resistance to quinolones (nalidixic acid and ciprofloxacin) in Romania where resistance levels in broilers (3.6 %) proved to be much lower than those recorded in isolates from broiler meat, which were approximately 80 %.
Table CA10. Resistance (%) to ciprofloxacin, erythromycin, gentamicin, nalidixic acid and tetracyclines among Campylobacter jejuni from Gallus gallus (broilers) in countries reporting MIC data in 2012, using harmonised epidemiological cut-off values
Country Ciprofloxacin Erythromycin Gentamicin Nalidixic acid Tetracyclines
N % Res N % Res N % Res N % Res N % Res Austria 108 75.9 108 0 108 0 108 64.8 108 29.6 Czech Republic 39 84.6 39 0 39 2.6 39 76.9 39 35.9 Denmark 41 14.6 41 0 41 0 41 14.6 41 14.6 Finland 83 2.4 83 0 83 0 83 2.4 83 2.4 France 49 49.0 49 4.1 49 0 49 46.9 49 49.0 Hungary 46 87.0 46 0 46 0 46 84.8 46 43.5 Netherlands 102 61.8 102 0 102 0 102 61.8 102 59.8 Romania 83 3.6 83 0 83 2.4 83 3.6 83 51.8 Spain 32 96.9 32 3.1 32 6.3 32 93.8 32 90.6 Sweden 100 17.0 100 0 100 0 100 17.0 100 2.0 Total (10 MSs) 683 44.1 683 0.4 683 0.7 683 41.4 683 34.1 Switzerland 171 33.3 171 0 171 0 171 33.3 171 22.2
MS: Member State; MIC: minimum inhibitory concentration; N: number of isolates tested; % Res: percentage of resistant isolates.
Table CA11. Resistance (%) to ciprofloxacin, erythromycin, gentamicin, nalidixic acid and tetracyclines among Campylobacter coli from Gallus gallus (broilers) in countries reporting MIC data in 2012, using harmonised epidemiological cut-off values
Country Ciprofloxacin Erythromycin Gentamicin Nalidixic acid Tetracyclines
N % Res N % Res N % Res N % Res N % Res Austria 33 66.7 33 0 33 0 33 66.7 33 45.5 Czech Republic 17 94.1 17 0 17 5.9 17 76.5 17 41.2 France 78 65.4 78 15.4 78 0 78 62.8 78 92.3 Hungary 63 79.4 63 1.6 63 0 63 81.0 63 52.4 Netherlands 23 82.6 23 21.7 23 4.3 23 82.6 23 69.6 Spain 54 96.3 54 22.2 54 16.7 54 90.7 54 98.1 Total (6 MSs) 268 78.4 268 11.2 268 4.1 268 75.7 268 73.1 Switzerland 14 50.0 14 14.3 14 0 14 50.0 14 50.0
MS: Member State; MIC: minimum inhibitory concentration; N: number of isolates tested; % Res: percentage of resistant isolates.
Temporal trends in resistance among C. jejuni isolates from broilers
Figures CA8 and CA9 present the observed temporal trends in antimicrobial resistance in C. jejuni isolates from Gallus gallus over the period 2006 to 2012. As in previous years, resistance to ciprofloxacin and nalidixic acid varied greatly among reporting MSs in 2012. When considering resistance to both ciprofloxacin and nalidixic acid, statistically significant increasing trends were observed in Austria, Denmark, France, Spain and Switzerland for five or more years (Figure CA8). For erythromycin, levels of resistance remained absent or low over the period 2006 to 2012 and a statistically significant decreasing trend in erythromycin resistance was detected in the Czech Republic and Hungary over the reporting period (Figure CA9). With regards to gentamicin, resistance remained generally at levels lower than 10 % with slight fluctuations for all reporting countries over the period 2006 to 2012 (data not shown). For tetracyclines, important variations in

EU summary report on antimicrobial resistance in zoonotic and indicator bacteriafrom humans, animals and food 2012
EFSA Journal 2014;12(3):3590 135
resistance levels were observed among reporting countries and statistically significant increasing trends were seen in the Czech Republic, Denmark, the Netherlands and Spain over the period 2006 to 2012 (data not shown).
Figure CA8. Trends in ciprofloxacin and nalidixic acid resistance in Campylobacter jejuni from Gallus gallus in reporting MSs and non-MSs, 2006–2012, quantitative data
MS: Member State. Note: A statistically significant increasing trend over five or more years, as tested by a logistic regression model (p ≤0.05), was observed
for both ciprofloxacin and nalidixic acid in Austria (↑), Denmark (↑), France (↑), Spain (↑) and Switzerland (↑), for ciprofloxacin in the Czech Republic (↑) and for nalidixic acid in Hungary (↑).

EU summary report on antimicrobial resistance in zoonotic and indicator bacteriafrom humans, animals and food 2012
EFSA Journal 2014;12(3):3590 136
Figure CA9. Trends in erythromycin resistance in Campylobacter jejuni from Gallus gallus in reporting MSs and non-MSs, 2006–2012, quantitative data
MS: Member State. Note: A statistically significant decreasing trend over five or more years, as tested by a logistic regression model (p ≤0.05), was
observed in the Czech Republic (↓) and Hungary (↓).
Temporal trends in resistance among C. coli isolates from broilers
Figures CA10 and CA11 present observed trends in antimicrobial resistance in C. coli from Gallus gallus. In 2012, as was the case in previous years, a high degree of variation was observed in levels of resistance to ciprofloxacin and nalidixic acid among reporting MSs. For ciprofloxacin and nalidixic acid, statistically significant increasing trends, for the last five or more years, were observed in Austria, France, Spain and Switzerland (Figure CA10). For erythromycin (Figure CA11), resistance was generally lower over the reporting period than for the other antimicrobials presented. A similar situation was observed for gentamicin over the period with resistance levels reported lower than 10 % with the exception of Spain (data not shown). Resistance to erythromycin and gentamicin increased significantly over the seven years presented in Spain. Over the same period, resistance levels to tetracyclines varied from 30 % to 100 % for most of the reporting countries. France, Spain and Switzerland also exhibited statistically increasing trends in resistance to tetracyclines (data not shown).

EU summary report on antimicrobial resistance in zoonotic and indicator bacteriafrom humans, animals and food 2012
EFSA Journal 2014;12(3):3590 137
Figure CA10. Trends in ciprofloxacin and nalidixic acid resistance in Campylobacter coli from Gallus gallus in reporting MSs and one non-MS, 2006–2012, quantitative data
MS: Member State. Note: A statistically significant increasing trend over five or more years, as tested by a logistic regression model (p ≤0.05), was observed
for both ciprofloxacin and nalidixic acid in Austria (↑), France (↑), Spain (↑) and Switzerland (↑) and for nalidixic acid in Hungary (↑).

EU summary report on antimicrobial resistance in zoonotic and indicator bacteriafrom humans, animals and food 2012
EFSA Journal 2014;12(3):3590 138
Figure CA11. Trends in erythromycin resistance in Campylobacter coli from Gallus gallus in reporting MSs and one non-MS, 2006–2012, quantitative data
MS: Member State. Note: A statistically significant increasing trend over five or more years, as tested by a logistic regression model (p ≤0.05), was observed
in Spain (↑).
Spatial distribution of resistance among C. jejuni isolates from broilers
Figures CA12 and CA13 show the spatial distribution of ciprofloxacin and erythromycin resistance in C. jejuni from Gallus gallus. For both antimicrobials, overall resistance was lower among the reporting Nordic countries than in the rest of the European reporting countries.

EU summary report on antimicrobial resistance in zoonotic and indicator bacteriafrom humans, animals and food 2012
EFSA Journal 2014;12(3):3590 139
Figure CA12. Spatial distribution of ciprofloxacin resistance among Campylobacter jejuni from broilers of Gallus gallus in countries reporting MIC data in 20121
Figure CA13. Spatial distribution of erythromycin resistance among Campylobacter jejuni from broilers of Gallus gallus in countries reporting MIC data in 20121
Note: Percentages shown in this map refer to countries that reported quantitative MIC data for more than 10 isolates in 2012. When quantitative 2012 data were not available, 2011 data have been used
instead. MIC: minimum inhibitory concentration. 1. For Germany, Ireland and Norway, 2011 data were used.
EU summary report on antimicrobial resistance in zoonotic and indicator bacteriafrom humans, animals and food 2012
EFSA Journal 2014;12(3):3590 140
Multi-resistance among C. jejuni and C. coli isolates from broilers
In 2012, five MSs and one non-MS reported isolate-based data on resistance in C. jejuni isolates from broilers, while three MSs and one non-MS provided isolate-based data regarding resistance in C. coli isolates from broilers.
Analysis of the multi-resistance showed that there was a large variation in the levels of complete susceptibility among the reporting countries. Complete susceptibility to the common set of antimicrobials for Campylobacter (five antimicrobials) was generally found in more than 20 % of the C. jejuni isolates tested in the reporting MSs, and reached up to 78.0 % in Denmark and 80.0 % in Sweden, while in Hungary and Spain the proportion of fully susceptible isolates was much lower. In C. coli isolates, complete susceptibility was generally either comparable or lower than that observed in C. jejuni.
Multiple resistance (reduced susceptibility to three or more antimicrobial classes) was not recorded or was detected at levels lower than 5 % in C. jejuni isolates in most reporting countries, while in Spain 9.4 % of isolates exhibited multi-resistance (Table CA12). In C. coli the occurrence of multi-resistance was either comparable or greater than that reported in C. jejuni isolates (Table CA13). The frequency distributions (Figures CA14 and CA15) showed variation between different reporting countries. Most of the reporting countries detected resistance to a maximum of three antimicrobial classes in C. jejuni (Figure CA14), whereas multi-resistant C. coli isolates generally displayed reduced susceptibility to three to five different classes of antimicrobials (Figure CA15).
The important co-resistance for public health, i.e. resistance to both ciprofloxacin and erythromycin, was generally undetected in C. jejuni isolates, while a number of C. coli isolates from Hungary, Spain and Switzerland exhibited such co-resistance. The term co-resistance has been defined as two or more resistance genes which are genetically linked, i.e. located adjacent or close to each other on a mobile genetic element (Chapman, 2003). For brevity, the term is used slightly more loosely in this report and indicates two or more phenotypic resistances to different classes of antimicrobials, exhibited by the same bacterial isolate.

EU summary report on antimicrobial resistance in zoonotic and indicator bacteriafrom humans, animals and food 2012
EFSA Journal 2014;12(3):3590 141
Table CA12. Complete susceptibility, multi-resistance and index of diversity in Campylobacter jejuni from broilers in MSs and non-MSs reporting isolate-based data, 2012
Table CA13. Complete susceptibility, multi-resistance and index of diversity in Campylobacter coli from broilers in MSs and one non-MS reporting isolate-based data, 2012
Country Susceptible to all Multi-resistant Index of
diversity
Co-resistant to
Cip and Ery n % n % n %
Austria (N=108) 22 20.4 4 3.7 0.283 0 0 Denmark (N=41) 32 78.0 0 0 0.202 0 0 Hungary (N=46) 4 8.7 0 0 0.21 0 0 Spain (N=32) 1 3.1 3 9.4 0.313 1 3.1 Sweden (N=100) 80 80.0 0 0 0 0 0 Switzerland (N=171) 98 57.3 1 0.6 0.23 0 0
Country Susceptible to all Multi-resistant Index of
diversity
Co-resistant to
Cip and Ery n % n % n %
Austria (N=33) 6 18.2 1 3.0 0.284 0 0 Hungary (N=63) 9 14.3 3 4.8 0.307 1 1.6 Spain (N=54) 1 1.9 30 55.6 0.793 12 22.2 Switzerland (N=14) 4 28.6 3 21.4 0.549 2 14.3
MS: Member State; N: total number of isolates tested for susceptibility against the whole common antimicrobial set for Campylobacter; n: number of isolates. Susceptible to all: isolate susceptible to all antimicrobial substances of the EFSA common set for Campylobacter. Multi-resistant: resistant to at least three different antimicrobial substances, belonging to any three antimicrobial families from the common antimicrobial set. Index of diversity: see definition in Section 8.4.2.1 of Chapter 8 Materials and methods. Co-resistant to Cip and Ctx: the frequencies and percentages of isolates not susceptible to ciprofloxacin concentrations >1 mg/L and erythromycin concentrations >16 mg/L for C. coli and to ciprofloxacin concentrations >1 mg/L and erythromycin concentrations >16 mg/L for C. jejuni.

EU summary report on antimicrobial resistance in zoonotic and indicator bacteriafrom humans, animals and food 2012
EFSA Journal 2014;12(3):3590 142
Figure CA14. Frequency distribution of Campylobacter jejuni isolates completely susceptible and resistant to one to five antimicrobials in broilers in MSs and non-MSs reporting isolate-based data, 2012
Figure CA15. Frequency distribution of Campylobacter coli isolates completely susceptible and resistant to one to five antimicrobials, in broilers in MSs and one non-MS reporting isolate-based data, 2012
MS: Member State; N: total number of isolates tested for susceptibility against the whole common antimicrobial set for Campylobacter; sus: susceptible to all antimicrobial substances of the EFSA common set for Campylobacter; res1–res5: resistance to one antimicrobial substance/resistance to five antimicrobial substances of the common set for Campylobacter.
0 % 20 % 40 % 60 % 80 % 100 %
Switzerland (N=171)
Sweden (N=100)
Spain (N=32)
Hungary (N=46)
Denmark (N=41)
Austria (N=108)
sus
res1
res2
res3
res4
res5
0 % 20 % 40 % 60 % 80 % 100 %
Switzerland (N=14)
Spain (N=54)
Hungary (N=63)
Austria (N=33)
sus
res1
res2
res3
res4
res5

EU summary report on antimicrobial resistance in zoonotic and indicator bacteriafrom humans, animals and food 2012
EFSA Journal 2014;12(3):3590 143
Multi-resistance patterns in C. jejuni and C. coli isolates from broilers
Considering C. jejuni, isolate-based data were available from five contributing MSs which reported details of 498 isolates. The isolates reported by Denmark (N=41), Hungary (N=46) and Sweden (N=100) are not addressed in this table as they were not multi-resistant. Analysis of the patterns of resistance to erythromycin, ciprofloxacin, tetracyclines, streptomycin and gentamicin was possible for 164 C. coli isolates from four contributing MSs which provided isolate-based data. Tables CA14 and CA15 summarise the different resistance patterns obtained and show the frequency with which these patterns were observed in each MS and for the MS group as a whole. Considering the isolates showing multi-resistance (i.e. resistance to any three or more antimicrobials of those listed above), the proportion of resistant isolates is expressed both as a proportion of the total multi-resistant isolates and as a proportion of the total number of C. jejuni isolates contributed by the reporting MS group.
Among the 311 C. jejuni isolates from broilers from the reporting group of MSs submitting isolate-based data, 2.6 % (n=8) exhibited multi-resistance (Table CA14). The commonest pattern of multi-resistance was resistance to ciprofloxacin, tetracyclines and streptomycin, occurring in six of eight resistant isolates reported by submitting MSs. A single isolate was reported which showed resistance to all of the antimicrobials in the multi-resistance panel, although this only accounted for 0.3 % of the total C. jejuni isolates for which isolate-based data was available. The situation differed in C. coli where 2.4 % of the total number of C. coli isolates, for which isolate-based data was available, showed multi-resistance to all of the antimicrobials in the test panel.
Table CA14. Multi-resistance patterns of interest in Campylobacter jejuni from broilers in MSs one non-MS reporting isolate-based data, 2012
Multi-resistance pattern
Group of reporting countries (N=311)
Aus
tria
(N
=108
)
Spai
n (N
=32)
Switz
erla
nd
(N=1
71)
Ery
Cip
Tet
Str
Gen
n % group % n n n
R R R 6 75.0 1.9 4 1 1 R R R 1 12.5 0.3 0 1 0
R R R R R 1 12.5 0.3 0 1 0 Total 8 100 2.6 4 3 1
MS: Member State; N: total number of isolates tested for susceptibility against the whole common antimicrobial set for Campylobacter; Ery: erythromycin; Cip: ciprofloxacin; Tet: tetracyclines; Str: streptomycin; Gen: gentamicin; n: number of multi-resistant isolates; R: minimum inhibitory concentration above the European Committee on Antimicrobial Susceptibility Testing epidemiological cut-off values.
The proportion of isolates of C. jejuni from broilers showing multi-resistance, as well as the diversity of multi-resistance within that multiple resistant population, was lower than that observed in C. coli from broilers. The proportion of the total number of C. coli isolates from broilers showing resistance to all antimicrobials in the panel (2.4 %) was identical to the figure found for pigs for C. coli isolates which showed an identical pattern of resistance (2.4 %).
Among the 164 C. coli isolates from broilers tested in the reporting group of MSs submitting isolate-based data, 22.6 % (n=37) showed multi-resistance to three or more antimicrobials (Table CA15). The commonest resistance pattern detected was resistance to ciprofloxacin, tetracyclines and streptomycin occurring in 10.4 % of the multi-resistant isolates. This pattern of resistance together with additional erythromycin resistance occurred in 3.7 % of isolates, while a further 2.4 % of isolates demonstrated additional resistance to gentamicin. These three resistance patterns accounted for more than 70 % of the multi-resistant isolates which were detected. Gentamicin resistance has a component of multiple drug resistance patterns and was only observed in Spain. This resistance was not detected in the other reporting MSs. Interestingly, Spain was the only MS providing isolate-based data to report gentamicin resistance in C. jejuni, although other MSs (the Czech Republic and Romania), which did not report isolate-based data, also detected gentamicin resistance in C. jejuni (Table CA10). The range of different resistance patterns observed was greater in

EU summary report on antimicrobial resistance in zoonotic and indicator bacteriafrom humans, animals and food 2012
EFSA Journal 2014;12(3):3590 144
C. coli than for C. jejuni; Spain contributed isolates with a greater range of different resistance patterns than other MSs, although this may have merely reflected the small isolate sample size from other MSs.
Table CA15. Multi-resistance patterns of interest in Campylobacter coli from broilers in MSs and one non-MS reporting isolate-based data, 2012
Multi-resistance pattern Group of reporting countries (N=164)
Aus
tria
(N
=33)
Hun
gary
(N
=63)
Spai
n (N
=54)
Switz
erla
nd
(N=1
4)
Ery
Cip
Tet
Str
Gen
n % group % n n n n
R R R 17 46.0 10.4 1 2 13 1 R R R R 6 16.2 3.7 0 0 5 1 R R R 4 10.8 2.4 0 1 3 0 R R R R R 4 10.8 2.4 0 0 4 0 R R R R 3 8.1 1.8 0 0 3 0 R R R 2 5.4 1.2 0 0 2 0
R R R 1 2.7 0.6 0 0 0 1 Total 37 100 22.6 1 3 30 3
N: total number of isolates tested for susceptibility against the whole common antimicrobial set for Campylobacter and multi-resistant; Ery: erythromycin; Cip: ciprofloxacin; Tet: tetracyclines; Str: streptomycin; Gen: gentamicin; n: number of multi-resistant isolates; R: minimum inhibitory concentration above the European Committee on Antimicrobial Susceptibility Testing epidemiological cut-off values
Comparison of resistance in broilers and meat from broilers
Considering individual MSs, the levels of ciprofloxacin resistance were generally lower in C. coli and C. jejuni isolates from meat from broilers than in isolates from broilers. Generally, resistance levels to all antimicrobials were higher in C. coli than in C. jejuni for the same host species. Similarly, the levels of multi-resistance (reduced susceptibility to at least three different antimicrobial classes) in C. coli isolates from broilers were much higher than those detected in C. jejuni isolates of the same origin. However, it should be borne in mind that, despite the high levels of resistance/multi-resistance observed, C. coli is much less prevalent in poultry than C. jejuni.

EU summary report on antimicrobial resistance in zoonotic and indicator bacteriafrom humans, animals and food 2012
EFSA Journal 2014;12(3):3590 145
4.4.2.2. Pigs
Representative sampling and monitoring
In the reporting MSs, antimicrobial resistance monitoring in Campylobacter isolates from pigs was based primarily on active monitoring plans involving random sampling of healthy pig carcases at the slaughterhouse. The sampling plan was typically stratified per slaughterhouse, by allocating the number of samples collected per slaughterhouse in proportion with the annual throughput of that slaughterhouse. An approximately equal distribution of the collected samples over the year enabled the different seasons to be covered. Only one representative faecal sample per epidemiological unit (batch/farm), either derived from a unique carcase or pooled from a number of carcases, was gathered to account for clustering, in accordance with EFSA’s recommendations (EFSA, 2007). In the reporting MSs, antimicrobial resistance monitoring in Campylobacter spp. in pigs focused on C. coli, as this is the more prevalent Campylobacter species in pigs. Because of the very low C. jejuni prevalence in pigs, the number of samples required to be collected to achieve a sufficient number of C. jejuni isolates would have been too large to be cost effective. In some reporting countries, representative subsets of C. coli isolates recovered from faecal samples were randomly selected at the laboratory for susceptibility testing, whereas, in others, all C. coli isolates were tested for susceptibility.
Resistance levels among C. coli isolates from pigs
In 2012, quantitative data were provided by five MSs and one non-MS (Switzerland) on C. coli isolates from pigs (Table CA16). C. coli isolates tested were mainly derived from fattening pigs (the production type was not specified for the Netherlands). As seen in 2011, the range of resistance to the antimicrobials studied varied greatly between the reporting countries in 2012. However, in general, the levels of resistance to tetracyclines observed were high to extremely high, while those to nalidixic acid, ciprofloxacin and erythromycin were moderate to high. Exceptions to this general pattern of resistance to these substances were observed for isolates from Denmark, which reported the lowest occurrence of resistance (at low to moderate levels), and Spain, which recorded the highest resistance, at levels classed as extremely high. Resistance to fluoroquinolones (ciprofloxacin) and quinolones (nalidixic acid) proved to be very similar in all reporting countries. In contrast, gentamicin resistance was either undetected or reported at low level. Only Spain recorded a moderate resistance to gentamicin.
Table CA16. Resistance (%) to ciprofloxacin, erythromycin, gentamicin, nalidixic acid and tetracyclines among Campylobacter coli from pigs1 in countries reporting MIC data in 2012, using harmonised epidemiological cut-off values
Country Ciprofloxacin Erythromycin Gentamicin Nalidixic acid Tetracyclines
N % Res N % Res N % Res N % Res N % Res Denmark 103 11.7 103 6.8 103 0 103 11.7 103 14.6 France 96 40.6 96 36.5 96 0 96 39.6 96 91.7 Hungary 53 50.9 53 13.2 53 3.8 53 50.9 53 88.7 Netherlands 232 12.5 232 11.2 232 0.4 232 12.5 232 88.4 Spain 73 97.3 73 79.5 73 17.8 73 95.9 73 100 Total (5 MSs) 557 32.0 557 23.9 557 2.9 557 31.6 557 76.8 Switzerland 144 41.0 144 9.0 144 0.7 144 38.9 144 31.9
MIC: minimum inhibitory concentration; MS: Member State; N: number of isolates tested; % Res: percentage of resistant isolates. 1. The C. coli isolates tested were derived from fattening pigs. For the Netherlands, the production level was not specified.

EU summary report on antimicrobial resistance in zoonotic and indicator bacteriafrom humans, animals and food 2012
EFSA Journal 2014;12(3):3590 146
Temporal trends in resistance among C. coli isolates from pigs
Figures CA16 and CA17 show the trends in antimicrobial resistance observed in C. coli from pigs over the period 2006–2012. For most of the antimicrobials considered, levels of resistance have remained relatively stable between 2006 and 2012. For ciprofloxacin and nalidixic acid, a statistically significant increasing trend was seen for Spain, while France and Switzerland reported significantly increasing levels of resistance to ciprofloxacin over the reporting period. Levels of erythromycin resistance increased significantly in France, the Netherlands and Spain and, for gentamicin, resistance increased significantly in Spain (data not shown). When considering tetracyclines (data not shown), marked differences in resistance were observed among reporting countries: Switzerland and Denmark reported resistance of around 30 % and 10 %, respectively, while France, Hungary, the Netherlands and Spain recorded levels greater than 80 %, over the 2006 to 2012 period. Resistance to tetracyclines demonstrated a significantly increasing trend in Denmark during the period 2006 to 2012.
Figure CA16. Trends in ciprofloxacin and nalidixic acid resistance in Campylobacter coli from pigs in reporting MSs and one non-MS, 2006–2012, quantitative data
Note: A statistically significant increasing trend over five or more years, as tested by a logistic regression model (p ≤0.05), was observed in Spain (↑) for both ciprofloxacin and nalidixic acid and in France (↑) and Switzerland (↑) for ciprofloxacin; MS: Member State.

EU summary report on antimicrobial resistance in zoonotic and indicator bacteriafrom humans, animals and food 2012
EFSA Journal 2014;12(3):3590 147
Figure CA17. Trends in erythromycin resistance in Campylobacter coli from pigs in reporting MSs and one non-MS, 2006–2012, quantitative data
MS: Member State. Note: A statistically significant increasing trend over five or more years, as tested by a logistic regression model (p ≤0.05), was observed
in France (↑), the Netherlands (↑) and Spain (↑);
Spatial distribution of resistance among C. coli isolates from pigs
Figures CA18 and CA19 show the spatial distributions of ciprofloxacin and erythromycin resistance in C. coli from pigs. For both erythromycin and ciprofloxacin, the highest levels of resistance were reported by Southern countries, while Northern countries reported lower levels.

EU summary report on antimicrobial resistance in zoonotic and indicator bacteriafrom humans, animals and food 2012
EFSA Journal 2014;12(3):3590 148
Figure CA18. Spatial distribution of ciprofloxacin resistance among Campylobacter coli from pigs in countries reporting MIC data in 20121
Figure CA19. Spatial distribution of erythromycin resistance among Campylobacter coli from pigs in countries reporting MIC data in 20121
MIC: minimum inhibitory concentration; MS: Member State. Note: Percentages shown in this map refer to countries that reported quantitative MIC data for more than 10 isolates in 2012. When quantitative 2012 data were not available, 2011 data have been used instead. 1. For Sweden, 2011 data were used.

EU summary report on antimicrobial resistance in zoonotic and indicator bacteriafrom humans, animals and food 2012
EFSA Journal 2014;12(3):3590 149
Multi-resistance among C. coli isolates from pigs
In 2012, three MSs and one non-MS reported isolate-based data on resistance in C. coli isolates from pigs. Analysis of the multi-resistance showed that there was a large variation in the levels of complete susceptibility and multi-resistance among the reporting countries. Isolates exhibiting complete susceptibility accounted for 33.0 % in Denmark and 14.6 % in Switzerland, while in Hungary and Spain none of the isolates tested were completely susceptible (Table CA17). Conversely, multi-resistance was low in Denmark (3.9 %), moderate in Switzerland (19.4 %), high in Hungary (49.1 %) and extremely high in Spain (97.3 %). The frequency distributions (Figure CA20) showed an important diversity between the reporting countries. Hungary, Spain and Switzerland reported isolates displaying reduced susceptibility to up to four or five different classes of antimicrobials. In addition, a high proportion of isolates showing co-resistance to ciprofloxacin and erythromycin was observed in isolates from Spain.
Table CA17. Complete susceptibility, multi-resistance and index of diversity in Campylobacter coli from fattening pigs in MSs and one non-MS reporting isolate-based data, 2012
Country Susceptible to all Multi-resistant Index of
diversity
Co-resistant toCip and Ery
n % n % n % Denmark (N=103) 34 33.0 4 3.9 0.28 3 2.9 Hungary (N=53) 0 0 26 49.1 0.662 5 9.4 Spain (N=73) 0 0 71 97.3 0.74 56 76.7 Switzerland (N=144) 21 14.6 28 19.4 0.471 6 4.2
MS: Member State; N: total number of isolates tested for susceptibility against the whole common antimicrobial set for Campylobacter; n: number of isolates; Cip: ciprofloxacin; Ery: erythromycin. Susceptible to all: isolate susceptible to all antimicrobial substances of the EFSA common set for Campylobacter. Multi-resistant: resistant to at least three different antimicrobial substances, belonging to any three antimicrobial families from the common antimicrobial set. Index of diversity: see definition in Section 8.4.2.1 of Chapter 8 Materials and methods. Co-resistant to Cip and Ery: the frequencies and percentages of C. coli isolates not susceptible to ciprofloxacin concentrations >1 mg/L and erythromycin concentrations >16 mg/L.
Figure CA20. Frequency distribution of Campylobacter coli isolates completely susceptible and resistant to one to five antimicrobials, in fattening pigs in MSs and one non-MS reporting isolate-based data, 2012
N: total number of isolates tested for susceptibility against the whole common antimicrobial set for Campylobacter; MS: Member State; sus: susceptible to all antimicrobial substances of the EFSA common set for Campylobacter; res1–res5: resistance to one antimicrobial substance/resistance to five antimicrobial substances of the common set for Campylobacter.
0 % 10 % 20 % 30 % 40 % 50 % 60 % 70 % 80 % 90 % 100 %
Switzerland (N=144)
Spain (N=73)
Hungary (N=53)
Denmark (N=103)
sus
res1
res2
res3
res4
res5

EU summary report on antimicrobial resistance in zoonotic and indicator bacteriafrom humans, animals and food 2012
EFSA Journal 2014;12(3):3590 150
Multi-resistance pattern in C. coli isolates from fattening pigs
Isolate-based data was available for 373 C. coli isolates from fattening pigs, contributed by three reporting MSs and one non-MS, from which 34.6 % exhibited different patterns of multi-resistance (Table CA18). The commonest multi-resistance pattern observed in fattening pigs was resistance to ciprofloxacin, tetracyclines and streptomycin, occurring in 13.1 % of the total number of isolates for which isolate-based data was available. The next most common pattern of multi-resistance comprised resistance to the preceding antimicrobials, together with resistance to erythromycin. Taken together, these patterns of resistance accounted for more than 70 % of the total multiple drug resistance C. coli isolates from pigs. The range of multi-resistance patterns observed in C. coli from pigs was greater than that observed in broilers and unlike in broilers, gentamicin resistance, as part of the multi-resistance pattern, was observed in three of four reporting MSs. Although Denmark contributed a large number of isolates (N=103), the diversity of resistance patterns observed in Denmark, and the numbers of multi-resistant isolates as a proportion of the total isolates reported, was lower than for the remaining three MSs which reported data. Most (greater than 85 %) multiply resistant C. coli isolates from pigs were resistant to tetracyclines and streptomycin as a component of the multi-resistance pattern. Most isolates which were resistant to gentamicin were also resistant to streptomycin. Resistance to ciprofloxacin and tetracyclines was observed in more than 90 % of multi-resistance C. coli isolates from pigs.
Table CA18. Multi-resistance patterns of interest in Campylobacter coli from fattening pigs in MSs and one non-MS reporting isolate-based data, 2012
Multi-resistance pattern Group of reporting countries (N=373)
Den
mar
k (N
=103
)
Hun
gary
(N
=53)
Spai
n (N
=73)
Switz
erla
nd
(N=1
44)
Ery
Cip
Tet
Str
Gen
n % group % n n n n
R R R 49 38.0 13.1 2 18 11 18 R R R R 43 33.3 11.5 0 3 39 1 R R R 10 7.8 2.7 1 1 7 1 R R R R R 9 7.0 2.4 0 1 8 0 R R R 7 5.4 1.9 0 2 1 4 R R R R 4 3.1 1.1 0 1 2 1
R R R 4 3.1 1.1 1 0 0 3 R R R R 2 1.6 0.5 0 0 2 0 R R R R 1 0.8 0.3 0 0 1 0
Total 129 100 34.6 4 26 71 28 MS: Member State; N: total number of isolates tested for susceptibility against the whole common antimicrobial set for Campylobacter and multi-resistant; Ery: erythromycin; Cip: ciprofloxacin; Tet: tetracyclines; Str: streptomycin; Gen: gentamicin; n: number of multi-resistant isolates; R: minimum inhibitory concentration above the European Committee on Antimicrobial Susceptibility Testing epidemiological cut-off values.

EU summary report on antimicrobial resistance in zoonotic and indicator bacteriafrom humans, animals and food 2012
EFSA Journal 2014;12(3):3590 151
4.4.2.3. Cattle (bovine animals)
Representative sampling and monitoring
In 2012, data on antimicrobial resistance among C. jejuni isolates from cattle include samples collected both at the slaughterhouse (Denmark, Finland, Germany, Spain and Switzerland) and at the farm level (the Netherlands). These countries tested different production types and ages of cattle, including veal calves, young meat production animals, adult cattle and dairy cows; Denmark and Finland did not specify the type of cattle which were tested. Slaughterhouse sampling programmes were randomised over the year and stratified by the number of slaughtered animals by abattoirs across the MSs. The sampling was evenly distributed throughout the year or a significant part of the year to account for a possible seasonal effect. Only one caecal or faecal sample per bovine animal carcase was collected. In the reporting MSs, antimicrobial resistance monitoring in Campylobacter spp. in cattle focused on C. jejuni, as this is the more prevalent Campylobacter species in cattle. In some reporting countries, representative subsets of Campylobacter isolates recovered from animal samples were randomly selected at the laboratory for susceptibility testing, while, in some others, all isolates were tested for susceptibility.
Resistance levels among C. jejuni isolates from cattle
For 2012, five MSs and one non-MS provided quantitative data on C. jejuni isolates from cattle (Table CA19). C. jejuni isolates tested were derived from veal calves (Germany, the Netherlands), young cattle (Spain, Switzerland), dairy cows (the Netherlands) and production type unspecified (Denmark and Finland). As seen in 2011, the range of resistance to the antimicrobials studied varied greatly between the reporting countries in 2012. The levels of resistance to ciprofloxacin, nalidixic acid and tetracyclines were generally high, while resistance to erythromycin and gentamicin was either not detected or recorded at low to very low levels.
Table CA19. Resistance (%) to ciprofloxacin, erythromycin, gentamicin, nalidixic acid and tetracyclines among Campylobacter jejuni from cattle1 in countries reporting MIC data in 2012, using harmonised epidemiological cut-off values
Country Ciprofloxacin Erythromycin Gentamicin Nalidixic acid Tetracyclines N % Res N % Res N % Res N % Res N % Res
All cattle Denmark 89 14.6 89 1.1 89 0 89 15.7 89 0 Finland 72 13.9 72 0 72 0 72 13.9 72 2.8 Germany 73 49.3 73 2.7 73 0 73 43.8 73 76.7 Netherlands 178 31.5 178 0 178 0.6 178 31.5 178 61.8 Spain 68 63.2 68 0 68 0 68 64.7 68 60.3 Total (5 MSs) 480 32.9 480 0.6 480 0.2 480 32.5 480 43.5 Switzerland 38 36.8 38 2.6 38 0 38 39.5 38 44.7 Veal calves Germany 73 49.3 73 2.7 73 0 73 43.8 73 76.7 Netherlands 137 38.7 137 0 137 0.7 137 38.7 137 78.1 Total (2 MSs) 210 42.4 210 1.0 210 0.5 210 40.5 210 77.6 Young cattle (1–2 years) Spain 68 63.2 68 0 68 0 68 64.7 68 60.3 Switzerland 38 36.8 38 2.6 38 0 38 39.5 38 44.7 Dairy cows Netherlands 41 7.3 41 0 41 0 41 7.3 41 7.3 Unspecified type of cattle Denmark 89 14.6 89 1.1 89 0 89 15.7 89 0 Finland 72 13.9 72 0 72 0 72 13.9 72 2.8 Total (2 MSs) 161 14.3 161 0.6 161 0 161 14.9 161 1.2
MS: Member State; MIC: minimum inhibitory concentration; N: number of isolates tested; % Res: percentage of resistant isolates. 1. Data presented in this table were derived from a variety of production types. These include veal calves (Germany, the
Netherlands), young cattle (Spain, Switzerland), dairy cows (the Netherlands) and production type unspecified (Denmark and Finland).

EU summary report on antimicrobial resistance in zoonotic and indicator bacteriafrom humans, animals and food 2012
EFSA Journal 2014;12(3):3590 152
Temporal trends in resistance among C. jejuni isolates from cattle
Figures CA21 and CA22 show the temporal trends in resistance for C. jejuni from cattle. As seen in C. coli in pigs, levels of resistance for C. jejuni in cattle have remained relatively stable over the 2006–2012 reporting period for individual MSs. In general, resistance to ciprofloxacin, nalidixic acid and tetracyclines was relatively higher than levels of resistance to erythromycin and gentamicin for the reporting MSs. When considering trends in ciprofloxacin, nalidixic acid (Figure CA21) and gentamicin resistance, no significant changes were observed over the reporting period. For erythromycin, a significantly decreasing trend was observed in the Netherlands when tested by a logistic regression model (Figure CA22), and for tetracyclines a significantly decreasing trend was observed in Austria and a significantly increasing trend was observed in the Netherlands (data not shown).
Figure CA21. Trends in ciprofloxacin and nalidixic acid resistance in Campylobacter jejuni from cattle in reporting MSs, 2006–2012, quantitative data
MS: Member State. Note: No statistically significant trends over five or more years, as tested by a logistic regression model (p ≤ 0.05), were observed in any
of the reporting countries;

EU summary report on antimicrobial resistance in zoonotic and indicator bacteriafrom humans, animals and food 2012
EFSA Journal 2014;12(3):3590 153
Figure CA22. Trends in erythromycin resistance in Campylobacter jejuni from cattle in reporting MSs, 2006–2012, quantitative data
MS: Member State. Note: A statistically significant decreasing trend over five or more years, as tested by a logistic regression model (p ≤ 0.05), was
observed in the Netherlands (↓);
Multi-resistance among C. jejuni isolates from cattle
In 2012, three MSs and one non-MS reported isolate-based data on resistance in C. jejuni isolates from differing cattle populations (Table CA20). Difference in the cattle populations monitored may most likely partly explain the variability observed in summary indicators of multi-resistance among reporting countries. Germany, which monitored veal calves specifically, reported the highest level of multi-resistance (12.3 %) and the lowest level of complete susceptibility (16.4 %) among the reported data, while Spain and Switzerland, which monitored young cattle (1–2 years), recorded high levels of complete susceptibility and similar low levels of multi-resistance at around 5 %. Conversely, Denmark, which reported resistance data on an unspecified cattle population, recorded an extremely high level of complete susceptibility and did not detect any multi-resistant C. jejuni isolates. While the resistant isolates monitored were only resistant to one substance in Denmark, other reporting countries (Germany, Spain and Switzerland) detected isolates displaying reduced susceptibility to up to three or four different classes of antimicrobials (Figure CA23). In addition, only a few isolates exhibited co-resistance to both ciprofloxacin and erythromycin.

EU summary report on antimicrobial resistance in zoonotic and indicator bacteriafrom humans, animals and food 2012
EFSA Journal 2014;12(3):3590 154
Table CA20. Complete susceptibility, multi-resistance and index of diversity in Campylobacter jejuni from cattle in MSs and one non-MS reporting isolate-based data, 2012
Country Susceptible to all Multi-resistant Index of
diversity
Co-resistant toCip and Ery
n % n % n % Denmark (N=89) 75 84.3 0 0 0 0 0 Germany (N=73) 12 16.4 9 12.3 0.434 2 2.7 Spain (N=68) 17 25.0 4 5.9 0.323 0 0 Switzerland (N=38) 18 47.4 2 5.3 0.428 1 2.6
MS: Member State; N: total number of isolates tested for susceptibility against the whole common antimicrobial set for Campylobacter; n: number of isolates; Cip: ciprofloxacin; Ery: erythromycin. Susceptible to all: isolate susceptible to all antimicrobial substances of the EFSA common set for Campylobacter. Multi-resistant: resistant to at least three different antimicrobial substances, belonging to any three antimicrobial families from the common antimicrobial set. Index of diversity: see definition in Section 8.4.2.1 of Chapter 8 Materials and methods. Co-resistant to Cip and Ery: the frequencies and percentages of C. jejuni isolates not susceptible to ciprofloxacin concentrations >1 mg/L and erythromycin concentrations >4 mg/L.
Figure CA23. Frequency distribution of Campylobacter jejuni isolates completely susceptible and resistant to one to five antimicrobials, in cattle in MSs and one non-MS reporting isolate-based data, 2012
MS: Member State; N: total number of isolates tested for susceptibility against the whole common antimicrobial set for Campylobacter; sus: susceptible to all antimicrobial substances of the EFSA common set for Campylobacter; res1–res5: resistance to one antimicrobial substance/resistance to five antimicrobial substances of the common set for Campylobacter.
0 % 10 % 20 % 30 % 40 % 50 % 60 % 70 % 80 % 90 % 100 %
Switzerland (N=38)
Spain (N=68)
Germany (N=73)
Denmark (N=89)
sus
res1
res2
res3
res4
res5

EU summary report on antimicrobial resistance in zoonotic and indicator bacteriafrom humans, animals and food 2012
EFSA Journal 2014;12(3):3590 155
Multi-resistance pattern in C. jejuni isolates from cattle
Isolate-based data were available for 268 C. jejuni isolates submitted by four reporting countries. Denmark did not detect multi-resistance in C. jejuni from cattle. In the remaining reporting countries the most common pattern of multi-resistance was resistance to ciprofloxacin, tetracyclines and streptomycin, occurring in 80 % of multi-resistance isolates (Table CA21). Gentamicin resistance was not detected in multi-resistance isolates of C. jejuni from cattle.
Table CA21. Multi-resistance patterns of interest in Campylobacter jejuni from cattle in MSs and one non-MSs reporting isolate-based data, 2012
Multi-resistance pattern Group of reporting countries (N=179)
Ger
man
y (N
=73)
Spai
n (N
=68)
Switz
erla
nd
(N=3
8)
Ery
Cip
Tet
Str
Gen
n % group % n n n
R R R 12 80.0 6.7 7 4 1 R R R R 2 13.3 1.1 1 0 1 R R R 1 6.7 0.6 1 0 0
Total 15 100 8.4 9 4 2 MS: Member State; N: total number of isolates tested for susceptibility against the whole common antimicrobial set for Campylobacter and multi-resistant; Ery: erythromycin; Cip: ciprofloxacin; Tet: tetracyclines; Str: streptomycin; Gen: gentamicin; n: number of multi-resistant isolates; R: minimum inhibitory concentration above the European Committee on Antimicrobial Susceptibility Testing epidemiological cut-off values.

EU summary report on antimicrobial resistance in zoonotic and indicator bacteriafrom humans, animals and food 2012
EFSA Journal 2014;12(3):3590 156
4.5. Overview of the findings on antimicrobial resistance in Campylobacter at reporting Member State group level, 2012
Figure CA24 shows the resistance levels in the reporting MS group based on the quantitative data submitted in 2012 for the various animal species and meat derived from those animal species. These data may derive from different MS groups, which should be considered when interpreting the figure. As was the case in previous years, C. coli isolates tended to be more resistant than C. jejuni isolates. Direct comparisons of the levels of resistance in Campylobacter from Gallus gallus and in broiler meat may not be entirely appropriate because different MSs have reported different proportions of isolates tested from meat and live fowl. The levels of resistance sometimes differ between different MSs and the relative contribution of individual MSs can affect the summary group level figures.
Figure CA24. Resistance to ciprofloxacin, erythromycin, gentamicin, nalidixic acid and tetracyclines in Campylobacter jejuni and Campylobacter coli from fowl, pigs and cattle at reporting MS group level in 2012
MS: Member State.
0
10
20
30
40
50
60
70
80
90
100
Campylobacter jejunifrom broiler meat2012 (8 MSs)
Campylobacter colifrom broiler meat2012 (6 MSs)
Campylobacter jejunifrom Gallus gallus2012 (10 MSs)
Campylobacter colifrom Gallus gallus2012 (6 MSs)
Campylobacter colifrom pigs
2012 (5 MSs)
Campylobacter jejunifrom cattle2012 (5 MSs)
% re
sistance at repo
rting MS grou
p level
Ciproflaxin Erythromycin Gentamicin Nalidixic acid Tetracyclines

EU summary report on antimicrobial resistance in zoonotic and indicator bacteriafrom humans, animals and food 2012
EFSA Journal 2014;12(3):3590 157
4.6. Discussion
Campylobacter causes a large number of human cases of gastro-enteritis and has been the most frequently reported cause of human food-borne zoonoses in the EU since 2004 (EFSA and ECDC, 2014). The majority of campylobacteriosis cases are self-limiting, however chronic symptoms (Guillain–Barré syndrome, acute transverse myelitis, myocarditis, and reactive arthritis) may also develop as a result of intestinal infection. Bacteraemia is very rare, except for infections with C. fetus. Resistance to antimicrobials in Campylobacter is of concern because of the large number of cases of human infection and the fact that some cases require treatment. Treatment of enteric infections in humans may involve administration of fluoroquinolones, such as ciprofloxacin, or macrolides, such as erythromycin (ECDC et al., 2009). The rapid increase in resistance in C. jejuni to fluoroquinolones concurrent with discoveries of associations between postinfectious irritable bowel syndrome and a longer duration of untreated Campylobacter infection (Kirkpatrick and Tribble, 2011) is therefore worrying.
In 2012, information on antimicrobial resistance in Campylobacter isolates from human cases of campylobacteriosis was collated from 14 MSs and one non-MS (Iceland). The data submitted by these countries represented isolates from 18 % of the human campylobacteriosis cases reported within the EU/EEA in 2012. A novelty in this year’s report was that isolates from cases notified as having been acquired during travelling outside of the reporting country, were excluded from all analysis except the analysis on resistance in difference geographical regions. This was done to better assess the impact on Campylobacter isolates from food consumed within each reporting country on the antimicrobial resistance levels found in human isolates in that country. Please note however that imported food, which can constitute a large proportion of the food available in some countries, is not covered by this report.
There was a large variation in the guidelines used for interpreting the susceptibility tests for human Campylobacter isolates among countries. In two MSs, two different guidelines were also applied in order to cover all antimicrobials under monitoring. Although the clinical breakpoints used for the dilution test for Campylobacter were less variable than those for Salmonella, the breakpoints for disc diffusion differed significantly depending on the guidelines used, particularly for ciprofloxacin. Disc diffusion was still the most common method of testing for antimicrobial susceptibility in human isolates, sometimes in combination with gradient strip. Only four countries used micro-broth dilution. The disc diffusion method and clinical breakpoints established by EUCAST in 2012 are therefore much welcomed and is recommended by the ECDC in the EU protocol for harmonised monitoring of antimicrobial resistance in human Salmonella and Campylobacter isolates (ECDC, 2014).
There was also a large variation with regard to the number of antimicrobials tested among the reporting countries, which reflects the clinical importance of the antimicrobials. Erythromycin and ciprofloxacin were the antimicrobials for which the greatest numbers of human Campylobacter spp. isolates were tested. The levels of resistance in human C. jejuni isolates to erythromycin was overall low, but moderately high in C. coli, although the number of tested isolates for this bacterial species was small. Very high resistance levels to ciprofloxacin were reported in human Campylobacter isolates, with increasing trends observed in several MSs.
In order to assess the importance of travel-associated infections, antimicrobial resistance was also analysed based on the most likely country of infection reported. Human isolates acquired in Asia and Africa had the highest frequency of resistance to the antimicrobials tested, with two and three times higher resistance levels to ciprofloxacin and erythromycin than in isolates acquired within the EU/EEA. This could affect which antimicrobials could be applied for successful treatment of severe travel-associated cases.
Human antimicrobial susceptibility data were available for the full range of antimicrobials from five MSs for C. jejuni and from four MSs for C. coli. Overall, only one in six (18.0 %) human C. jejuni isolates and one in twenty (6.4 %) human C. coli isolates were fully susceptible to all antimicrobials. On average, one quarter of C. jejuni (24.8 %) and one third of C. coli (35.1 %) isolates exhibited multi-drug resistance, meaning that they were clinically non-susceptible to at least three different antimicrobial groups. The clinical breakpoints used to interpret the human data were, in some cases, more sensitive than the ECOFFs when intermediate and resistant results were combined. The human data also covered two penicillins which were not included in the animal/food testing. All these factors could explain the generally higher proportion of multi-resistance observed in humans compared with animals, particularly for C. jejuni, which was the most common species in humans. Co-resistance to the critically important antimicrobials ciprofloxacin and erythromycin was, on

EU summary report on antimicrobial resistance in zoonotic and indicator bacteriafrom humans, animals and food 2012
EFSA Journal 2014;12(3):3590 158
average, low for C. jejuni (1.4 %) but detected in one out of six (16.0 %) C. coli isolates, although in the case of C. coli fewer isolates were tested.
The data relating to the susceptibility of Campylobacter of food and animal origin reported by MSs were, in general well harmonised with almost all MSs adopting the EFSA guidelines and recommendations. Overall, levels of antimicrobial resistance in Campylobacter isolates from animals and food were similar to those in 2011. Considering all reporting MSs, ciprofloxacin resistance in C. jejuni from Gallus gallus and cattle was 44.1 % and 32.9 % respectively, while in C. coli from Gallus gallus and pigs it was 78.4 % and 32.0 %.
Among Campylobacter isolates from Gallus gallus and broiler meat, very high to extremely high levels of resistance, to one or more antimicrobials, were reported by a number of MSs, with the exception of some Nordic countries, as well as Central and Eastern European countries, particularly when using ECOFFs as interpretive criteria of reduced susceptibility or ‘microbiological resistance’. For example, extremely high resistance rates to ciprofloxacin were notably detected. Over the period 2009–2011, the highest levels of resistance to quinolones and fluoroquinolones were in general detected in Campylobacter isolates from Gallus gallus. In 2012, however, the highest levels of resistance to these antimicrobials were detected in Campylobacter isolates from broiler meat. In those MSs which reported resistance in Campylobacter isolates from both broiler meat and broilers, levels of resistance were generally similar, although C. coli isolates from broiler meat tended to exhibit slightly higher resistance compared with C. coli isolates from broilers. Interestingly, C. jejuni and C. coli isolates from meat from spent hens tested in Belgium presented lower levels of ciprofloxacin resistance than those observed in isolates from meat from broilers.
This high level of ciprofloxacin resistance in Campylobacter from broiler meat is of particular concern, since the EFSA Panel on Biological Hazards (BIOHAZ), in its recent scientific opinion on the quantification of the risk of campylobacteriosis posed to humans by broiler meat, estimated that the handling, preparation and consumption of broiler meat may account for 20 % to 30 % of human campylobacteriosis cases, while 50 % to 80 % of cases may be attributed to the chicken (broiler) reservoir as a whole (EFSA BIOHAZ Panel, 2010a). In 2012, ciprofloxacin resistance in C. coli isolates from humans was 69.0 % for all contributing MSs (range: 42.0–86.4 %) and 32.0 % in pigs (range: 11.7–97.3 %). However, the picture is clearly complex in relation to the sources of human infections because these may be related to consumption of pig or poultry meat (as well as other sources). International trade also means that consumers may be exposed to meat produced in a number of different countries. Similar considerations apply when comparing resistance levels in humans and animals for other resistances. However, resistance to gentamicin, in C. coli from humans, meat from broilers, broilers and pigs does show similarities at the MS level. While gentamicin resistance was reported in C. coli from Gallus gallus (16.7 %) and pigs (17.8 %) from Spain but was not reported in broilers (Austria, France), meat from broilers (Austria) or pigs (France), C. coli from human infections showed 13.6 %, 2.4 % and 1.3 % gentamicin resistance in Spain, Austria and France, respectively. However, Campylobacter strains from the broiler reservoir may also reach humans via routes other than food (e.g. the environment or by direct contact).
In 2012, ciprofloxacin resistance in C. jejuni isolates from humans was 54.1 % for all contributing MSs (range: 30.7 %–91.9 %) and 44.1 % in broilers (range: 2.4 %–96.9 %). These figures and the possible reasons why the levels of resistance in humans and animals may or may not show correlations have been discussed in detail in previous reports in a dedicated farm to fork chapter which has not been included in the analysis for 2012. However, similar factors will apply to the 2012 data and readers are referred to earlier EU Summary Reports for detailed discussion of the ciprofloxacin and erythromycin results in campylobacter isolates from man and animals.
Over the period 2006 to 2012, statistically significant increasing trends in ciprofloxacin and nalidixic acid resistance in C. jejuni from broilers were observed over five or more years in five reporting countries; this was also observed in C. coli from broilers in three MSs. Considering C. coli from pigs a statistically significant increasing trend for ciprofloxacin/nalidixic acid resistance, was observed for three reporting countries. Comparison of these results and trends with the relevant antimicrobial usage figures might reveal interesting insights into the development of resistance.
Regarding resistance to erythromycin, a representative of the macrolides (commonly used in the treatment of human campylobacteriosis) in all reporting MSs, erythromycin resistance in C. jejuni from Gallus gallus and cattle was 0.4 % and 0.6 %, respectively, while, in C. coli from Gallus gallus and pigs, resistance equalled 11.2 % and 23.9 %, respectively. This situation in which low to moderately high levels of resistance were registered is similar to that observed over the 2009 to 2011 period. In countries which reported results

EU summary report on antimicrobial resistance in zoonotic and indicator bacteriafrom humans, animals and food 2012
EFSA Journal 2014;12(3):3590 159
for C. coli from both pigs and Gallus gallus and C. jejuni from Gallus gallus, resistance to erythromycin has usually been highest in C. coli isolates from pigs and lower in the isolates from the other sources, for each country, over the period 2009 to 2011. Similar results have also been observed in other studies in which macrolide-resistant isolates of C. coli from food animals have mainly been of porcine origin (Gibreel and Taylor, 2006).
Levels of erythromycin resistance increased in C. coli from broilers in some reporting countries between 2011 and 2012. Several MSs, are implementing policies to reduce the amount of antimicrobials used in livestock production and it is important to gauge the effect this may have on the occurrence of resistance.
Two MSs provided data on multiple drug resistance for C. coli and C. jejuni from both humans and animals. Although some lack of harmonisation16 may preclude detailed direct comparison of the multi-resistance figures in isolates from animals and humans, some trends are evident. The MS with the higher proportion of multi-resistance in broilers (in both Campylobacter spp.) also reported a high proportion of multi-resistance in isolates from humans. Considering these two MSs, parallel trends are also evident for certain other resistance characteristics (for example gentamicin and erythromycin resistance, co-resistance to ciprofloxacin and erythromycin). In the MS that provided the most comprehensive data among the reporting MSs, it is interesting that the figures for co-resistance to erythromycin and ciprofloxacin for C. coli isolates from humans are intermediate between those for broilers and pigs. The breakpoints used to define resistance in C. coli, from humans and animals, for ciprofloxacin and erythromycin are, however, slightly different (Figure CA1) and although this is a small difference of one dilution, ideally the criteria in this type of analysis should be fully harmonised.
Campylobacter generally develops resistance to the different antimicrobials in the common test panel by different mechanisms. Resistance to ciprofloxacin and erythromycin in Campylobacter is usually the result of mutation with or without the additional action of efflux pumps (Piddock et al., 2003; Ge et al., 2005; Luangtongkum et al., 2009). Additionally, the efflux pump CmeABC has been shown to confer a degree of resistance to erythromycin, ciprofloxacin and tetracyclines (Ge et al., 2005). Some isolates of both C. coli and C. jejuni, from animals and humans, showed resistance to erythromycin, ciprofloxacin and tetracyclines, raising the possibility that CmeABC may have been responsible, or contributed to the observed pattern of resistance. In multiple resistant isolates of C. coli and C. jejuni which were gentamicin resistant, streptomycin resistance was also observed, occurring for example, in seven of nine gentamicin resistant and multiply resistant C. coli isolates and in one of the two C. jejuni isolates from broilers which showed gentamicin resistance. Recently a cluster of aminoglycoside modifying enzymes has been reported in C. coli from broiler chickens in China (Qin et al., 2012). A novel genomic island carrying multiple aminoglycoside resistance genes on the C. coli chromosome was identified by the researchers who showed that the genomic island can be transferred experimentally to C. jejuni and was associated with particular clones of C. jejuni in broilers in China where it was first detected. The aminoglycoside modifying enzymes found to be present on this genomic island, include those conferring resistance to gentamicin and streptomycin, as well as to certain other aminoglycosides (neomycin, kanamycin and tobramycin). The occurrence of isolates of C. coli and C. jejuni, resistant to both gentamicin and streptomycin, suggests that resistance genes to each of these aminoglycosides have been acquired by these multiple resistant isolates. The genomic island described by Qin et al. (2012) contained a truncated tetracycline resistance gene, illustrating the potential of this set of aminoglycoside resistance genes to capture other resistance genes. Streptomycin and tetracycline resistance were commonly associated with each other in multiple drug-resistant strains of both C. coli and C. jejuni. Conjugative plasmids have been described in C. jejuni, which can carry clusters of aminoglycoside resistance genes (Nirdnoy et al., 2005); however, it appears that both streptomycin and gentamicin resistance can occur independently of each other in at least some C. coli and C. jejuni isolates.
16 The antimicrobial substances included in the analysis of multiple drug resistance in isolates from humans and animals and the
interpretive thresholds of resistance, either clinical breakpoints or ECOFFs, have not yet been harmonised between both sectors.

EU summary report on antimicrobial resistance in zoonotic and indicator bacteriafrom humans, animals and food 2012
EFSA Journal 2014;12(3):3590 160
5. ANTIMICROBIAL RESISTANCE IN INDICATOR ESCHERICHIA COLI
5.1. Introduction
Commensal E. coli is commonly chosen as an indicator of antimicrobial resistance in Gram-negative bacterium, as it is commonly present in animal faeces, is relevant to human medicine and can often acquire conjugative plasmids, which are resistance determinants transferred between enteric bacteria. Commensal E. coli, present in the intestine of farm animals, have a reservoir of resistance genes that can spread horizontally to zoonotic and other bacteria present in the food chain. Commensal indicator organisms, rather than pathogenic types of E. coli, such as enterotoxigenic E. coli (ETEC) or verotoxigenic E. coli (VTEC), are the target of the monitoring of indicator E. coli. The monitoring of antimicrobial resistance in indicator E. coli, isolated from either randomly selected healthy animals or derived carcases and meat thereof, and chosen to be representative of the general population, provides valuable data on the resistance occurring in that population.
Determining the occurrence of resistance to antimicrobials in indicator E. coli provides data useful for investigating the relationship with the selective pressure exerted by the use of antimicrobials on the intestinal population of bacteria in food-producing animals. Indicator E. coli are also useful as representatives of the Enterobacteriaceae to monitor the emergence and changes in the proportion of bacteria possessing ESBLs. The EFSA monitoring guidelines (EFSA, 2008) recommend that monitoring may be carried out at the farm or slaughterhouse levels and that at least 90 % of the animal population in a MS should be included in the sampling frame. Samples should be collected randomly from selected holdings or flocks, or randomly selected within the slaughterhouse. Samples collected (and subsequently tested) in accordance with the EFSA recommendations should therefore be comparable between MSs.
5.2. Antimicrobial resistance in indicator Escherichia coli isolates from animals and food
In total, 11 MSs and 2 non-MSs (Norway and Switzerland) reported quantitative MIC data on antimicrobial resistance in commensal (indicator) E. coli isolates from animals in 2012. In addition, five of these countries provided MIC data on isolates collected from food. Table EC1 shows the countries that reported data concerning indicator E. coli in 2012. Antimicrobials selected by the different MSs and non-MSs for MIC susceptibility testing of indicator E. coli are shown in Chapter 8 Materials and methods, Table MM9.
Antimicrobial susceptibility data were interpreted using ECOFFs to determine organisms exhibiting reduced susceptibility, i.e. showing ‘microbiological resistance’ (as opposed to ‘clinical resistance’). For reasons of continuity and because other amendments have also been made to the ECOFFs for some other antimicrobial - organism combinations by EUCAST, the ECOFFs used in this report have been those adopted in EFSA’s 2008 recommendations (EFSA, 2008). Of particular note is that ‘microbiological resistance’ to ciprofloxacin was addressed using ECOFF Cip >0.03 mg/L in this report (see Section 5.5 Discussion, for further details).
The proportions of resistant isolates to the antimicrobial agents ampicillin, cefotaxime, chloramphenicol, ciprofloxacin, gentamicin, nalidixic acid, streptomycin, sulfonamides and tetracyclines are described in detail later in this chapter. The tables of occurrence of resistance were generated, and multi-drug resistance analysis was performed if more than four countries reported quantitative data per sampling origin. In addition, only data where 10 or more isolates were available per country, per sampling origin, per year, are included in the report. In the graphs illustrating trends in the evolution of antimicrobial resistance over time, results for MIC data interpreted using ECOFFs are shown. Only a few MSs have reported data for the seven consecutive years from 2006 to 2012, as the monitoring of resistance in indicator E. coli is performed on a voluntary basis.
Where the minimum criteria for detailed analysis were met, multi-resistance was analysed in the isolate-based dataset on the indicator E. coli isolates tested for the full harmonised set of nine antimicrobials belonging to different classes. Multi-resistance is defined as non-susceptibility to at least three different antimicrobial classes. The proportions of isolates susceptible to all antimicrobial substances tested and resistant (non-susceptible) to any one up to nine substances are presented. Co-resistance to cefotaxime and ciprofloxacin was estimated as these two antimicrobials are of particular interest in human medicine. Co-resistance was addressed using both ECOFFs (Ctx >0.25 mg/L and Cip >0.03 mg/L) and clinical breakpoints (Ctx >2 mg/L and Cip >1 mg/L).

EU summary report on antimicrobial resistance in zoonotic and indicator bacteriafrom humans, animals and food 2012
EFSA Journal 2014;12(3):3590 161
Table EC1. Overview of countries reporting MIC and disc inhibition zones on indicator Escherichia coli from animals and food in 2012
Method Origin Total number of MSs reporting Countries
Diffusion
Cattle (bovine animals) 1 MS: PT Meat from broilers (Gallus gallus) 1 MS: SI Meat from pigs 1 MS: SI Meat from bovine animals 1 MS: SI
Dilution
Gallus gallus (fowl) 8 MSs: AT, BE, DK, FR, HU, NL, PL, SE Non-MSs: CH, NO
Turkeys 3 MSs: DE, NL, PL
Pigs 7 MSs: AT, BE, DK, FR, HU, NL, PL Non-MS: CH
Cattle (bovine animals) 7 MSs: AT, BE, DE, DK, FI, NL, PL Non-MS: CH
Meat from broilers (Gallus gallus) 5 MSs: DK, ES, HU, NL, SE Non-MS: NO
Meat from turkeys 3 MSs: DE, HU, NL Meat from pigs 4 MSs: DK, ES, HU, NL Meat from bovine animals 5 MSs: DE, DK, ES, HU, NL
MIC: minimum inhibitory concentration. Note: For abbreviations of Member States (MS) and other reporting countries see Appendix 7.
For further information on reported MIC distributions and numbers of resistant isolates for ampicillin, apramycin, cefazolin, cefepime, cefotaxime, cefoxitin, cefpodoxime, ceftazidime, ceftiofur, ceftriaxone, cephalothin, chloramphenicol, ciprofloxacin, colistin, florfenicol, gentamicin, imipenem, kanamycin, meropenem, nalidixic acid, neomycin, spectinomycin, streptomycin, sulfonamides, trimethoprim and tetracyclines for E. coli in 2012, please refer to the Level 3 Tables published on the EFSA website.
5.2.1. Antimicrobial resistance in indicator Escherichia coli isolates from food
In 2012, six MSs and one non-MS (Norway) reported quantitative MIC data for E. coli isolates from meat from bovine animals, broilers (Gallus gallus) and pigs.
5.2.1.1. Representative sampling and monitoring
The antimicrobial resistance data in indicator E. coli isolates from the three kinds of meat reported by Denmark, Germany, the Netherlands, Spain, Sweden and Norway mostly derived from active and representative monitoring programmes. Only one MS did not report details on either the sampling stages or on the sampling design of meat samples. In Denmark, E. coli isolates originated from meat sampled at wholesale and retail outlets, collected randomly in all regions of the country and spread evenly throughout the year, in the framework of three centrally coordinated sampling plans corresponding to each kind of meat. In Sweden, E. coli isolates originated from broiler meat collected randomly in all regions of the country and sampled between 23 October 2012 and 24 January 2013.
5.2.1.2. Meat from broilers (Gallus gallus)
The occurrence of resistance to selected antimicrobials in indicator E. coli isolates from broiler meat, in four reporting MSs and one non-MS, in 2012, is presented in Table EC2.
Considering data from the four reporting MSs, resistance levels to ampicillin, sulfonamides and tetracyclines were high at 33.7 %, 28.6 % and 22.2 %, respectively. The resistance to these antimicrobials was highly variable across the reporting MSs, ranging from 18.5 % to 57.7 % for ampicillin, from 16.3 % to 45.7 % for sulfonamides and from 11.7 % to 34.3 % for tetracyclines. Conversely, resistance to chloramphenicol and gentamicin at the reporting MS group level was low at 4.0 % and 3.2 %, respectively; resistance levels

EU summary report on antimicrobial resistance in zoonotic and indicator bacteriafrom humans, animals and food 2012
EFSA Journal 2014;12(3):3590 162
ranged from 0 % to 12.5 % for chloramphenicol and from 0 % to 6.9 % for gentamicin. Resistance to ciprofloxacin and nalidixic acid, among reporting MSs, was 29.1 % and 24.1 %, respectively. The overall level of resistance to cefotaxime across the reporting MSs was low in 2012, at 3.0 %.
5.2.1.3. Meat from pigs
Among the four reporting MSs, E. coli isolated from pig meat displayed high levels of resistance to ampicillin sulfonamides and tetracyclines (20.4 %, 23.2 % and 23.5 %, respectively). Chloramphenicol resistance was low at 2.6 %. Overall, gentamicin resistance was 1.5 % in the reporting group of MSs; it was not detected in two MSs. The proportion of E. coli isolates resistant to ciprofloxacin and nalidixic acid among the reporting MSs was low at 5.6 % and 5.1 %. The occurrence of resistance to cefotaxime among all reporting MSs was low at 1.1 %.
5.2.1.4. Meat from bovine animals
Among the four reporting MSs, E. coli isolated from meat bovine animals displayed moderate levels of resistance to ampicillin and sulfonamides (18.7 % for both antimicrobials) and high level of resistance to tetracyclines (20.8 %). Chloramphenicol resistance was low, at 6.6 %, for the reporting group of MSs. Overall, gentamicin resistance was 2.1 % in the reporting group of MSs; it was not detected in Denmark and Hungary. The proportion of E. coli isolates resistant to ciprofloxacin and nalidixic acid among the reporting MSs were 6.9 % and 5.9 %, respectively. The occurrence of resistance to cefotaxime among all reporting MSs was low at 1.7 % with one MS reporting no resistance.
5.2.1.5. Multi-resistance among Escherichia coli isolates from meat
As too few MSs reported multi-resistance isolate-based data on more than 10 isolates of indicator E. coli in food, tables and graphs on multi-resistance are not presented in this report.
5.2.1.6. Comparison of resistance among Escherichia coli isolates from meat and animals
Four MSs reported on antimicrobial resistance in meat, but those which did generally reported comparable resistance levels in meat as in the corresponding source animal species. Indeed, Denmark reported resistance in isolates from broiler meat broadly comparable to that recorded in isolates from broilers. Resistance recorded by Denmark in isolates from pig meat is roughly similar to that reported from pigs. Similarly, in cattle, resistance in isolates from meat from cattle recorded in Denmark and Germany was roughly comparable to that reported for bovine animals in the same MSs (Tables EC4 and EC15), for which Germany reported on isolates from young meat production animals and Denmark reported on isolates from unspecified cattle type.

EU summary report on antimicrobial resistance in zoonotic and indicator bacteriafrom humans, animals and food 2012
EFSA Journal 2014;12(3):3590 163
Table EC2. Resistance (%) to ampicillin, cefotaxime, chloramphenicol, ciprofloxacin, gentamicin, nalidixic acid, streptomycin, sulfonamides and tetracyclines among indicator Escherichia coli from meat from broilers (Gallus gallus) in countries reporting MIC data in 2012, using harmonised epidemiological cut-off values
Country Ampicillin Cefotaxime Chloramphenicol Ciprofloxacin Gentamicin Nalidixic acid Streptomycin Sulfonamides Tetracyclines N % Res N % Res N % Res N % Res N % Res N % Res N % Res N % Res N % Res
Denmark 197 21.8 197 1.0 197 0.5 197 3.6 197 0 197 3.6 197 8.1 197 16.8 197 11.7 Hungary 64 26.6 64 0 64 12.5 64 75.0 64 3.1 64 75.0 64 14.1 64 35.9 64 32.8 Netherlands 175 57.7 175 8.0 175 6.9 175 41.1 175 6.9 175 38.9 175 41.1 175 45.7 175 34.3 Sweden 92 18.5 92 0 92 0 – – 92 3.3 92 4.3 92 6.5 92 16.3 92 14.1 Total (4 MSs) 528 33.7 528 3.0 528 4.0 436 29.1 528 3.2 528 24.1 528 19.5 528 28.6 528 22.2 Norway 197 6.1 197 0.5 197 0 – – 197 0 197 2.0 197 3.0 197 8.1 – –
MS: Member State; MIC: minimum inhibitory concentration; N: number of isolates tested; % Res: percentage of resistant isolates; –: no data reported. Table EC3. Resistance (%) to ampicillin, cefotaxime, chloramphenicol, ciprofloxacin, gentamicin, nalidixic acid, streptomycin, sulfonamides and tetracyclines among indicator Escherichia coli from meat from pigs in MSs reporting MIC data in 2012, using harmonised epidemiological cut-off values
MS: Member State; MIC: minimum inhibitory concentration; N: number of isolates tested; % Res: percentage of resistant isolates; –: no data reported.
Country Ampicillin Cefotaxime Chloramphenicol Ciprofloxacin Gentamicin Nalidixic acid Streptomycin Sulfonamides Tetracyclines N % Res N % Res N % Res N % Res N % Res N % Res N % Res N % Res N % Res
Denmark 73 32.9 73 1.4 73 1.4 73 1.4 73 0 73 0 73 35.6 73 30.1 73 27.4 Hungary 14 28.6 14 0 14 7.1 14 28.6 14 0 14 28.6 14 21.4 14 35.7 14 35.7 Netherlands 98 8.2 98 1.0 98 2.0 98 3.1 98 2.0 98 3.1 98 15.3 98 16.3 98 18.4 Spain 11 36.4 – – 11 9.1 11 27.3 11 9.1 11 27.3 11 45.5 – – 11 27.3 Total (4 MSs) 196 20.4 185 1.1 196 2.6 196 5.6 196 1.5 196 5.1 196 25.0 185 23.2 196 23.5

EU summary report on antimicrobial resistance in zoonotic and indicator bacteriafrom humans, animals and food 2012
EFSA Journal 2014;12(3):3590 164
Table EC4. Resistance (%) to ampicillin, cefotaxime, chloramphenicol, ciprofloxacin, gentamicin, nalidixic acid, streptomycin, sulfonamides and tetracyclines among indicator Escherichia coli from meat from bovine animals in MSs reporting MIC data in 2012, using harmonised epidemiological cut-off values
Country Ampicillin Cefotaxime Chloramphenicol Ciprofloxacin Gentamicin Nalidixic acid Streptomycin Sulfonamides Tetracyclines N % Res N % Res N % Res N % Res N % Res N % Res N % Res N % Res N % Res
Denmark 46 4.3 46 0 46 0 46 2.2 46 0 46 2.2 46 4.3 46 4.3 46 6.5 Germany 71 39.4 71 4.2 71 16.9 71 14.1 71 4.2 71 12.7 71 35.2 71 38.0 71 43.7 Hungary 31 9.7 31 3.2 31 0 31 3.2 31 0 31 3.2 31 6.5 31 6.5 31 12.9 Netherlands 141 14.9 141 0.7 141 5.0 141 5.7 141 2.1 141 4.3 141 16.3 141 16.3 141 15.6 Total (4 MSs) 289 18.7 289 1.7 289 6.6 289 6.9 289 2.1 289 5.9 289 18.0 289 18.7 289 20.8
MS: Member State; MIC: minimum inhibitory concentration; N: number of isolates tested; % Res: percentage of resistant isolates.

EU summary report on antimicrobial resistance in zoonotic and indicator bacteriafrom humans, animals and food 2012
EFSA Journal 2014;12(3):3590 165
5.2.2. Antimicrobial resistance in indicator Escherichia coli isolates from animals
5.2.2.1. Domestic fowl (Gallus gallus)
Representative sampling and monitoring
In this section, data on antimicrobial resistance in indicator E. coli isolates from fowl (Gallus gallus) are presented separately for broilers and laying hens. The majority of MSs collected isolates as part of their national monitoring programmes of antimicrobial resistance. In all reporting countries except Norway, monitoring programmes were based on random sampling of healthy broilers at the slaughterhouse. Indicator E. coli isolates were isolated from caecal contents in Austria and France, from intestinal content in Sweden and from cloacal swabs in Denmark and Switzerland, by sampling healthy broilers at slaughter. In Norway, indicator E. coli were isolated from faeces sampled from Gallus gallus on the farm. Hungary and Poland did not report information on the sample type, sampling context and sampling stage.
Resistance levels among Escherichia coli isolates from Gallus gallus
In 2012, seven MSs and one non-MS provided quantitative data concerning antimicrobial resistance in E. coli from broilers, among which two MSs (Poland and Sweden) also provided comparable data concerning E. coli from laying hens (Table EC5). In addition, Norway reported E. coli resistance data in parent breeders for broiler production, while Belgium reported data at Gallus gallus species level without distinguishing between animal populations of origin.
Generally, the occurrence of resistance in E. coli isolates from broilers varied markedly between reporting countries. Resistance to ampicillin, streptomycin, sulfonamides and tetracyclines was generally high to very or extremely high in most reporting countries, with the exceptions of Sweden, reporting low to moderate resistance to these substances, and Denmark, recording low to moderate resistance to streptomycin and tetracyclines. Resistance to chloramphenicol was generally low to moderate with only Poland reporting high resistance and Denmark and Sweden no or very low resistance. In all reporting countries, gentamicin resistance was reported at very low to low levels.
Resistance to ciprofloxacin and nalidixic acid was generally high to very or extremely high among the reporting countries, with the exception of Denmark recording low resistance to these substances. A side-by-side comparison of resistance to ciprofloxacin and nalidixic acid in each reporting country shows that similar levels of resistance to both antimicrobials were typically recorded. Resistance to cefotaxime was generally low in most reporting countries, although two MSs reported moderate levels of resistance.
Resistance features in E. coli isolates from laying hens, tested in Poland and Sweden, were similar to those observed in isolates from broilers in the same MSs, although resistance levels in laying hens were in some cases less than half those reported in broilers. However, in Sweden, where resistance is typically low, resistance levels to cefotaxime, chloramphenicol, gentamicin, sulfonamides and tetracyclines were similar in broilers and laying hens. Although lower levels of resistance were typically reported in Sweden compared with Poland, Poland recorded high resistance to ciprofloxacin in laying hens.
In addition, Norway reported resistance data on E. coli isolates from parent breeders for broiler production at low to moderate levels.
Belgium was the only MS to report resistance data at the species level of Gallus gallus, potentially including a mixture of data on broilers and laying hens: high to extremely high resistance levels to all the antimicrobials tested except to gentamicin were recorded.

EU summary report on antimicrobial resistance in zoonotic and indicator bacteriafrom humans, animals and food 2012
EFSA Journal 2014;12(3):3590 166
Table EC5. Resistance (%) to ampicillin, cefotaxime, chloramphenicol, ciprofloxacin, gentamicin, nalidixic acid, streptomycin, sulfonamides and tetracyclines among indicator Escherichia coli from Gallus gallus in countries reporting MIC data in 2012, using harmonised epidemiological cut-off values
Country Ampicillin Cefotaxime Chloramphenicol Ciprofloxacin Gentamicin N % Res N % Res N % Res N % Res N % Res
All Gallus gallus Austria 130 26.9 130 3.1 130 8.5 130 65.4 130 0.8 Belgium 325 79.7 325 28.0 325 44.6 325 79.7 325 5.8 Denmark 115 20.0 115 1.7 115 0 115 7.8 115 0 France 201 58.2 201 10.4 201 6.5 201 35.8 201 1.5 Hungary 105 52.4 105 7.6 104 9.6 104 74.0 104 1.9 Netherlands 292 69.9 292 5.8 292 16.4 292 51.4 292 8.6 Poland 328 61.0 328 10.7 328 12.5 328 63.7 328 5.5 Sweden 255 11.8 255 0.4 255 0.4 – – 255 0.8 Total (8 MSs) 1,751 52.7 1,751 10.2 1,750 15.4 1,495 57.6 1,750 4.0 Norway 113 15.0 113 0.9 113 0 – – 113 0 Switzerland 185 32.4 185 2.2 185 1.1 185 46.5 185 0.5
Broilers Austria 130 26.9 130 3.1 130 8.5 130 65.4 130 0.8 Denmark 115 20.0 115 1.7 115 0 115 7.8 115 0 France 201 58.2 201 10.4 201 6.5 201 35.8 201 1.5 Hungary 105 52.4 105 7.6 104 9.6 104 74.0 104 1.9 Netherlands 292 69.9 292 5.8 292 16.4 292 51.4 292 8.6 Poland 171 86.0 171 13.5 171 21.1 171 82.5 171 8.2 Sweden 194 14.4 194 0 194 0.5 – – 194 0.5 Total (7 MSs) 1,208 50.4 1,208 6.2 1,207 9.9 1,013 52.7 1,207 3.8 Switzerland 185 32.4 185 2.2 185 1.1 185 46.5 185 0.5
Laying hens Poland 157 33.8 157 7.6 157 3.2 157 43.3 157 2.5 Sweden 61 3.3 61 1.6 61 0 – – 61 1.6 Total (2 MSs) 218 25.2 218 6.0 218 2.3 157 43.3 218 2.3
Parent breeders for broiler production Norway 113 15.0 113 0.9 113 0 – – 113 0
MS: Member State; MIC: minimum inhibitory concentration; N: number of isolates tested; % Res: percentage of resistant isolates.

EU summary report on antimicrobial resistance in zoonotic and indicator bacteriafrom humans, animals and food 2012
EFSA Journal 2014;12(3):3590 167
Table EC5 (continued). Resistance (%) to ampicillin, cefotaxime, chloramphenicol, ciprofloxacin, gentamicin, nalidixic acid, streptomycin, sulfonamides and tetracyclines among indicator Escherichia coli from Gallus gallus in countries reporting MIC data in 2012, using harmonised epidemiological cut-off values
Country Nalidixic acid Streptomycin Sulfonamides Tetracyclines N % Res N % Res N % Res N % Res
All Gallus gallus Austria 130 65.4 130 42.3 130 44.6 130 30.8 Belgium 325 77.8 325 81.5 325 80.0 325 68.3 Denmark 115 7.8 115 11.3 115 20.9 115 7.8 France 201 29.4 201 40.3 201 57.7 201 76.1 Hungary 104 71.2 104 26.0 104 32.7 104 36.5 Netherlands 292 50.0 292 58.2 292 62.7 292 50.7 Poland 328 54.0 328 36.3 328 46.0 328 44.5 Sweden 255 10.6 255 7.8 255 9.4 255 11.4 Total (8 MSs) 1,750 47.4 1,750 42.9 1,750 48.6 1,750 44.9 Norway 113 0.9 113 1.8 113 8.8 113 5.3 Switzerland 185 45.9 185 14.6 185 24.9 185 33.5
Broilers Austria 130 65.4 130 42.3 130 44.6 130 30.8 Denmark 115 7.8 115 11.3 115 20.9 115 7.8 France 201 29.4 201 40.3 201 57.7 201 76.1 Hungary 104 71.2 104 26.0 104 32.7 104 36.5 Netherlands 292 50.0 292 58.2 292 62.7 292 50.7 Poland 171 73.1 171 58.5 171 66.7 171 66.7 Sweden 194 12.4 194 8.8 194 9.8 194 10.8 Total (7 MSs) 1,207 43.2 1,207 38.4 1,207 45.4 1,207 43.3 Switzerland 185 45.9 185 14.6 185 24.9 185 33.5
Laying hens Poland 157 33.1 157 12.1 157 23.6 157 20.4 Sweden 61 4.9 61 4.9 61 8.2 61 13.1 Total (2 MSs) 218 25.2 218 10.1 218 19.3 218 18.3
Parent breeders for broiler production Norway 113 0.9 113 1.8 113 8.8 113 5.3
MS: Member State; MIC: minimum inhibitory concentration; N: number of isolates tested; % Res: percentage of resistant isolates.

EU summary report on antimicrobial resistance in zoonotic and indicator bacteriafrom humans, animals and food 2012
EFSA Journal 2014;12(3):3590 168
Temporal trends in resistance among indicator Escherichia coli isolates from broilers of Gallus gallus
Figures EC1 to EC5 display temporal trends in resistance to selected antimicrobials in indicator E. coli from broilers of Gallus gallus over the seven-year study period of 2006 to 2012. It is of note that the 2010 and 2011 resistance levels in Germany presented in these figures combine data on broilers and laying hens, while in the other reporting countries resistance data derive from broilers only.
The figures illustrate the wide variation in resistance between MSs for many of the antimicrobials. Spain and the Netherlands tended to report the highest levels of resistance to most antimicrobials over the period, although Austria, Spain and the Netherlands reported the highest resistance to quinolones between 2010 and 2012 and France, Spain and the Netherlands reported the highest resistance to tetracyclines from 2007 to 2012. Conversely, Denmark often recorded the lowest resistance levels reported.
The resistance to ciprofloxacin reported over the study period was high to very high for all reporting countries, with the exception of Denmark for the whole period, of Germany for the years 2010 and 2011 (combine broiler and laying hen data), and of Norway for the period 2011 to 2012, which in all three cases was below 20 %. Figure EC3 clearly demonstrates the close similarity in resistance levels to ciprofloxacin and nalidixic acid in most MSs. There was less variation between countries in the resistance to cefotaxime and chloramphenicol, which, in most countries, was at a moderate or low level. However, although resistance levels in 2012 tended to be generally similar to those observed in 2011, there were a few exceptions; for example, in Poland (data not shown) and Switzerland, resistance to ampicillin and cefotaxime in broiler flocks increased from 2011 to 2012. Such inter-annual evolutions need to be confirmed by longer term trends.
Resistance levels for many of the antimicrobials were broadly stable or had shown only gradual increases or decreases. Nevertheless, there was evidence of statistically significant trends in the occurrence of resistance to some of the antimicrobials over five or more years. Austria reported significant increases in resistance to ciprofloxacin, nalidixic acid and streptomycin. France reported significant increases in resistance to ampicillin, cefotaxime, ciprofloxacin and streptomycin. Denmark also reported statistically significant increasing trends in resistance to ampicillin and cefotaxime, although resistance levels are lower than those recorded in France. Switzerland also reported an increase in resistance to ampicillin, ciprofloxacin and nalidixic acid. Contrastingly, the Netherlands reported significant declines in resistance to cefotaxime and ciprofloxacin, in particular over the last three years. There were no significant trends in resistance to tetracyclines in any of the reporting countries.

EU summary report on antimicrobial resistance in zoonotic and indicator bacteriafrom humans, animals and food 2012
EFSA Journal 2014;12(3):3590 169
Figure EC1. Trends in ampicillin resistance in indicator Escherichia coli from broilers of Gallus gallus1 in reporting MSs and one non-MS, 2006–2012, quantitative data
Note: Statistically significant increasing trends over five or more years, as tested by a logistic regression model (p ≤0.05), were observed
in Denmark (↑), France (↑) and Switzerland (↑). MS: Member State. 1. The data from Germany in 2010 and 2011 originated from broilers and laying hens.
Figure EC2. Trends in cefotaxime resistance in indicator Escherichia coli from broilers of Gallus gallus in reporting MSs and one non-MS, 2006–2012, quantitative data
Note: Statistically significant increasing or decreasing trends over five or more years, as tested by a logistic regression model (p ≤0.05),
were observed in Denmark (↑), France (↑) and the Netherlands (↓). MS: Member State.

EU summary report on antimicrobial resistance in zoonotic and indicator bacteriafrom humans, animals and food 2012
EFSA Journal 2014;12(3):3590 170
Figure EC3. Trends in ciprofloxacin and nalidixic acid resistance in indicator Escherichia coli from broilers of Gallus gallus1 in reporting MSs and two non-MSs, 2006–2012, quantitative data
MS: Member State. Note: Statistically significant increasing or decreasing trends over five or more years, as tested by a logistic regression model (p ≤0.05),
were observed in Austria (↑) and Switzerland (↑) for both ciprofloxacin and nalidixic acid and in France (↑) and the Netherlands (↓) for ciprofloxacin.
1. The data from Germany in 2010 and 2011 originated from broilers and laying hens.

EU summary report on antimicrobial resistance in zoonotic and indicator bacteriafrom humans, animals and food 2012
EFSA Journal 2014;12(3):3590 171
Figure EC4. Trends in streptomycin resistance in indicator Escherichia coli from broilers of Gallus gallus1 in reporting MSs and one non-MS, 2006–2012, quantitative data
Note: A statistically significant increasing trend over six years, as tested by a logistic regression model (p ≤0.05), was observed in
Austria (↑) and France (↑). MS: Member State. 1. The data from Germany in 2010 and 2011 originated from broilers and laying hens.
Figure EC5. Trends in tetracyclines resistance in indicator Escherichia coli from broilers of Gallus gallus1 in reporting MSs and one non-MS, 2006–2012, quantitative data
Note: No statistically significant trends over five or more years, as tested by a logistic regression model (p ≤0.05), were observed in any
of the reporting countries. MS: Member State. 1. The data from Germany in 2010 and 2011 originated from broilers and laying hens.

EU summary report on antimicrobial resistance in zoonotic and indicator bacteriafrom humans, animals and food 2012
EFSA Journal 2014;12(3):3590 172
Spatial distribution of resistance among indicator Escherichia coli from broilers of Gallus gallus
The spatial distributions of nalidixic acid and tetracycline resistance in E. coli from Gallus gallus are shown in Figures EC6 and EC7. The Nordic countries reported the lowest levels of resistance to both antimicrobials. The highest resistance to tetracyclines tended to be reported by the most western countries, while the spatial pattern for nalidixic acid was less clear.
Figure EC6. Spatial distribution of nalidixic acid resistance among indicator Escherichia coli from broilers1 of Gallus gallus in countries reporting MIC data in 20122
MS: Member State; MIC: minimum inhibitory concentration. Note: Percentages shown in this map refer to countries that reported quantitative MIC data for more than 10 isolates in 2012. When
quantitative 2012 data were not available, 2011 data were used instead. 1. The data from Norway originated from parent breeders for broiler production and data from Belgium originated from unspecified
production type. 2. For Finland, Germany, Ireland and Spain, 2011 data were used.

EU summary report on antimicrobial resistance in zoonotic and indicator bacteriafrom humans, animals and food 2012
EFSA Journal 2014;12(3):3590 173
Figure EC7. Spatial distribution of tetracycline resistance among indicator Escherichia coli from broilers1 of Gallus gallus in countries reporting MIC data in 20122
MS: Member State; MIC: minimum inhibitory concentration. Note: Percentages shown in this map refer to countries that reported quantitative MIC data for more than 10 isolates in 2012. When
quantitative 2012 data were not available, 2011 data were used instead. 1. The data from Norway originated from parent breeders for broiler production and data from Belgium originated from unspecified
production type. 2. For Finland, Germany, Ireland and Spain 2011 data were used.
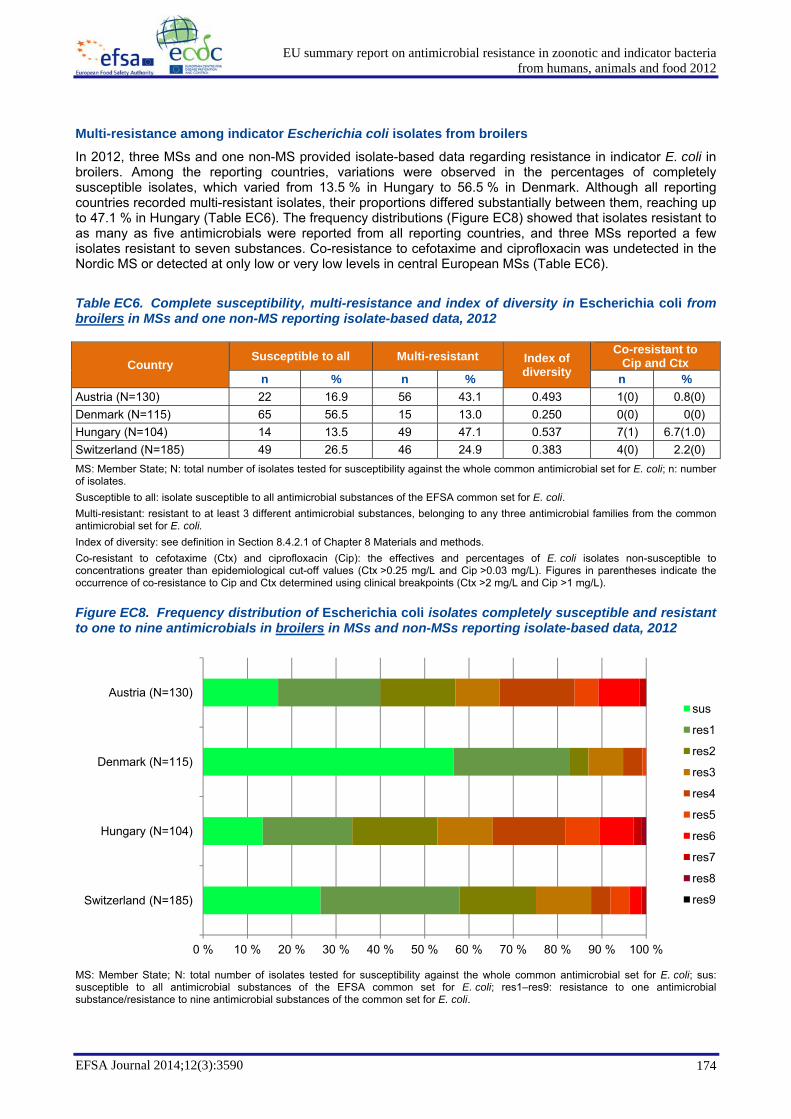
EU summary report on antimicrobial resistance in zoonotic and indicator bacteriafrom humans, animals and food 2012
EFSA Journal 2014;12(3):3590 174
Multi-resistance among indicator Escherichia coli isolates from broilers
In 2012, three MSs and one non-MS provided isolate-based data regarding resistance in indicator E. coli in broilers. Among the reporting countries, variations were observed in the percentages of completely susceptible isolates, which varied from 13.5 % in Hungary to 56.5 % in Denmark. Although all reporting countries recorded multi-resistant isolates, their proportions differed substantially between them, reaching up to 47.1 % in Hungary (Table EC6). The frequency distributions (Figure EC8) showed that isolates resistant to as many as five antimicrobials were reported from all reporting countries, and three MSs reported a few isolates resistant to seven substances. Co-resistance to cefotaxime and ciprofloxacin was undetected in the Nordic MS or detected at only low or very low levels in central European MSs (Table EC6).
Table EC6. Complete susceptibility, multi-resistance and index of diversity in Escherichia coli from broilers in MSs and one non-MS reporting isolate-based data, 2012
Country Susceptible to all Multi-resistant Index of
diversity
Co-resistant to Cip and Ctx
n % n % n % Austria (N=130) 22 16.9 56 43.1 0.493 1(0) 0.8(0) Denmark (N=115) 65 56.5 15 13.0 0.250 0(0) 0(0) Hungary (N=104) 14 13.5 49 47.1 0.537 7(1) 6.7(1.0) Switzerland (N=185) 49 26.5 46 24.9 0.383 4(0) 2.2(0) MS: Member State; N: total number of isolates tested for susceptibility against the whole common antimicrobial set for E. coli; n: number of isolates. Susceptible to all: isolate susceptible to all antimicrobial substances of the EFSA common set for E. coli. Multi-resistant: resistant to at least 3 different antimicrobial substances, belonging to any three antimicrobial families from the common antimicrobial set for E. coli. Index of diversity: see definition in Section 8.4.2.1 of Chapter 8 Materials and methods. Co-resistant to cefotaxime (Ctx) and ciprofloxacin (Cip): the effectives and percentages of E. coli isolates non-susceptible to concentrations greater than epidemiological cut-off values (Ctx >0.25 mg/L and Cip >0.03 mg/L). Figures in parentheses indicate the occurrence of co-resistance to Cip and Ctx determined using clinical breakpoints (Ctx >2 mg/L and Cip >1 mg/L).
Figure EC8. Frequency distribution of Escherichia coli isolates completely susceptible and resistant to one to nine antimicrobials in broilers in MSs and non-MSs reporting isolate-based data, 2012
MS: Member State; N: total number of isolates tested for susceptibility against the whole common antimicrobial set for E. coli; sus: susceptible to all antimicrobial substances of the EFSA common set for E. coli; res1–res9: resistance to one antimicrobial substance/resistance to nine antimicrobial substances of the common set for E. coli.
0 % 10 % 20 % 30 % 40 % 50 % 60 % 70 % 80 % 90 % 100 %
Switzerland (N=185)
Hungary (N=104)
Denmark (N=115)
Austria (N=130)sus
res1
res2
res3
res4
res5
res6
res7
res8
res9

EU summary report on antimicrobial resistance in zoonotic and indicator bacteriafrom humans, animals and food 2012
EFSA Journal 2014;12(3):3590 175
Multi-/co-resistance patterns among indicator Escherichia coli isolates from broilers
As expected, most isolates resistant to ciprofloxacin were also resistant to nalidixic acid when using ECOFFs as thresholds. Several E. coli isolates from Hungary were resistant to cefotaxime but not to ceftazidime, hence they appear in Table EC6 but not in Table EC7. Considering resistance patterns in isolates co-resistant to ciprofloxacin and cefotaxime (Table EC8), a number of isolates were also resistant to sulfonamides, streptomycin and tetracyclines. Trimethoprim resistance was also observed, while resistance to nalidixic acid and ampicillin was expected in isolates co-resistant to cefotaxime and ciprofloxacin. Analysing occurrence of higher levels of resistance to ciprofloxacin in E. coli reveals marked differences between MSs (Table EC9).
Table EC7. Multi-/co-resistance patterns of interest in Escherichia coli from broilers in MSs and one non-MS reporting isolate-based data, 2012
Multi-/co-resistance pattern Group of reporting countries (N=534)
Aus
tria
(N
=130
)
Den
mar
k (N
=115
)
Hun
gary
(N
=104
)
Switz
erla
nd
(N=1
85)
Am
p
Caz
Ctx
Chl
Cip
Gen
Nal
Str
Su
Tet
Tmp n % group
% n n n n
R R 253 98.1 47.4 85 9 74 85 R R R 5 1.9 0.9 1 0 0 4
Total 258 100 48.3 86 9 74 89 MS: Member State; N: total number of isolates tested for susceptibility against the whole common antimicrobial set for E. coli and multi-resistant; Amp: ampicillin; Caz: ceftazidime; Ctx: cefotaxime; Chl: chloramphenicol; Cip: ciprofloxacin; Gen: gentamicin; Nal: nalidixic acid; Str: streptomycin; Su: sulfonamides; Tet: tetracyclines; Tmp: trimethroprim; n: number of multi-/co-resistant isolates; R: minimum inhibitory concentration above the European Committee on Antimicrobial Susceptibility Testing (EUCAST) epidemiological cut-off values (ECOFFs).
Table EC8. Co-resistance to cefotaxime and ciprofloxacin in Escherichia coli from broilers in MSs and one non-MS reporting isolate-based data, 2012
Country
Resistance to both Cip and Ctx,
applying ECOFFs1
Resistance to both Cip and Ctx, applying clinical breakpoints1
Multi-resistance patterns of isolates resistant to both
Cip and Ctx, applying ECOFFs1 (number of isolates) n (%) n (%)
Austria (N=130) 1 (0.8 %) 0 (0 %) AmpCtxChlCipNalSuTet (1) Denmark (N=115) 0 (0 %) 0 (0 %) NA
Hungary (N=104) 7 (6.7 %) 1 (1.0 %)
AmpCtxCipNal (3) AmpCtxCipNalSuTetTmp (1) AmpCtxCipNalStrSuTmp (1) AmpCtxCipNalStrSuTetTmp (1) AmpCtxChlCipNalSuTmp (1)
Total (3 MSs) (N=349) 8 (2.3 %) 1 (0.3 %)
Switzerland (N=185) 4 (2.2 %) 0 (0 %) AmpCtxCipNalSuTet (2) AmpCtxCipNal (1) AmpCtxCipNalSuTetTmp (1)
MS: Member State; N: total number isolates for which relevant data are available; n: number of co-resistant isolates; Cip: ciprofloxacin; Ctx: cefotaxime. 1. European Committee on Antimicrobial Susceptibility Testing (EUCAST) epidemiological cut-off values (ECOFFs) and clinical
breakpoints were applied. .

EU summary report on antimicrobial resistance in zoonotic and indicator bacteriafrom humans, animals and food 2012
EFSA Journal 2014;12(3):3590 176
Table EC9. Ciprofloxacin resistance assessed at differing thresholds in indicator Escherichia coli from broilers in MSs and one non-MS reporting isolate-based data, 2012
Country
Isolates resistant
at >0.03mg/L1
Cip
Isolates resistant
at >1mg/L2
Cip
Isolates resistant
at >2mg/L3
Cip
Isolates resistant
at >4mg/L4
Cip
Resistance patterns of isolates resistant at >4mg/L Cip
(number of isolates)
n (%) n (%) n (%) n (%)
Austria (N=130) 85 (65.4 %) 8 (6.2 %) 4 (3.1 %) 4 (3.1 %)
ChlCipNalStrSuTet (1) AmpCipNalStrSuTet (1) AmpCipNalStrSuTetTmp (1) AmpChlCipGenNalSuTmp (1)
Denmark (N=115) 9 (7.8 %) 1 (0.9 %) 1 (0.9 %) 0 (0 %) NA
Hungary (N=104) 77 (74 %) 35 (33.7 %) 28 (26.9 %) 24 (23.1 %)
CipNal (4) AmpCipNal (3) AmpCipNalTet (2) AmpCipNalStrSuTetTmp (2) CipNalTet (1) CipNalSuTet (1) CipNalSuTetTmp (1) AmpCipNalTmp (1) AmpCipNalTetTmp (1) AmpCipNalSuTmp (1) AmpCipNalSuTet (1) AmpChlCipNalSuTmp (1) AmpChlCipNalSuTetTmp (1) AmpChlCipNalStrSuTet (1) AmpChlCipNalStrSuTetTmp (1) AmpChlCipGenNalStrSuTetTmp (1) AmpCtxChlCipNalSuTmp (1)
Total (3 MSs)(N=349) 171 (49.0 %) 44 (12.6 %) 33 (9.5 %) 28 (8.0 %)
Switzerland (N=185) 86 (46.5 %) 11 (5.9 %) 10 (5.4 %) 9 (4.9 %)
AmpCipNalTet (5) CipNal (1) CipNalSuTetTmp (1) AmpCipNalSuTetTmp (1) AmpCipGenNalStrSuTmp (1)
MS: Member State; N: total number isolates for which relevant data are available; n: number of resistant isolates; Cip: ciprofloxacin. 1. European Committee on Antimicrobial Susceptibility Testing (EUCAST) epidemiological cut-off values (ECOFFs). 2. EUCAST clinical breakpoint. 3. High breakpoint. 4. Very high breakpoint.

EU summary report on antimicrobial resistance in zoonotic and indicator bacteriafrom humans, animals and food 2012
EFSA Journal 2014;12(3):3590 177
5.2.2.2. Pigs
Representative sampling and monitoring
In 2012, seven MSs and one non-MS (Switzerland) provided quantitative antimicrobial resistance data on indicator E. coli in pigs which were included in the following analysis (Table EC10). These data were not split by production type, as isolates originated from either fattening pigs or breeding animals (Belgium) or the production type was not specified. The majority of MSs collected isolates as part of their national monitoring programme of antimicrobial resistance, mostly based on random sampling of healthy slaughter pig carcases at the slaughterhouse. A two-stage stratified sampling design, with slaughterhouses as primary sampling units and carcases as secondary units, with proportional allocation of the number of samples to the annual throughput of the slaughterhouse, was typically applied in the reporting countries. The sample collection was approximately evenly distributed over the year. Only one representative faecal sample per epidemiological unit (batch), either derived from a unique carcase or pooled from a number of carcases, was gathered to account for clustering. Hungary did not report detailed information on sample type and sampling context.
Resistance levels among Escherichia coli isolates from pigs
In 2012, resistance to ampicillin in E. coli isolates from pigs was generally high among reporting MSs, ranging from 22.0 % to 48.5 % - except in Austria which recorded a 12.9 % resistance, while resistance to streptomycin, sulfonamides and tetracyclines was high to very high in all reporting countries, ranging from 36.8 % to 59.9 %, 22.9 % to 60.0 % and 29.2 % to 69.1 %, respectively. Conversely, resistance to chloramphenicol was low to moderate in most reporting countries, with the notable exception of Belgium reporting, as in 2011, a high resistance of 30.2 %, while gentamicin resistance was generally recorded at low to very low levels. Resistance to ciprofloxacin and nalidixic acid was low to moderate among all reporting countries, ranging between 0.7 % and 16.6 %, and resistance to cefotaxime was either not detected or reported at low levels in all reporting countries.

EU summary report on antimicrobial resistance in zoonotic and indicator bacteriafrom humans, animals and food 2012
EFSA Journal 2014;12(3):3590 178
Table EC10. Resistance (%) to ampicillin, cefotaxime, chloramphenicol, ciprofloxacin, gentamicin, nalidixic acid, streptomycin, sulfonamides and tetracyclines among isolates of indicator Escherichia coli from pigs in countries reporting MIC data in 2012, using harmonised epidemiological cut-off values
Country Ampicillin Cefotaxime Chloramphenicol Ciprofloxacin Gentamicin
N % Res N % Res N % Res N % Res N % Res Austria1 140 12.9 140 0 140 2.1 140 5.0 140 0 Belgium2 205 48.3 205 2.9 205 30.2 205 16.6 205 1.0 Denmark1 152 28.9 152 0.7 152 3.3 152 0.7 152 0.7 France1 200 22.0 200 2.0 200 9.5 200 8.5 200 3.0 Hungary1 68 48.5 68 1.5 68 14.7 68 13.2 68 2.9 Netherlands1 284 25.0 284 0 284 11.6 284 1.1 284 2.1 Poland3 190 29.5 190 2.6 190 8.9 190 11.6 190 2.6 Total (7 MSs) 1,239 29.5 1,239 1.4 1,239 12.0 1,239 7.5 1,239 1.8 Switzerland1 185 20.0 185 1.1 185 4.9 185 3.2 185 1.1
Country Nalidixic acid Streptomycin Sulfonamides Tetracyclines N % Res N % Res N % Res N % Res
Austria1 140 5.0 140 52.1 140 22.9 140 50.7 Belgium2 205 12.2 205 53.7 205 60.0 205 61.5 Denmark1 152 0.7 152 42.1 152 34.9 152 35.5 France1 200 3.0 200 46.0 200 44.0 200 63.5 Hungary1 68 10.3 68 36.8 68 35.3 68 69.1 Netherlands1 284 1.1 284 59.9 284 45.4 284 56.3 Poland3 190 6.3 190 46.8 190 35.8 190 48.9 Total (7 MSs) 1,239 4.9 1,239 50.3 1,239 41.7 1,239 54.7 Switzerland1 185 3.2 185 46.5 185 38.9 185 29.2
MIC: minimum inhibitory concentration; N: number of isolates tested; % Res: percentage of resistant isolates; MS: Member State. 1. Fattening pigs. 2. Breeding animals. 3. Unspecified production type.

EU summary report on antimicrobial resistance in zoonotic and indicator bacteriafrom humans, animals and food 2012
EFSA Journal 2014;12(3):3590 179
Temporal trends in resistance among indicator Escherichia coli isolates from pigs
Figures EC9 to EC13 display the trends in resistance to selected antimicrobials in indicator E. coli from pigs over the period 2006 to 2012. There was variation in the resistance levels in different MSs, particularly for tetracyclines (Figure EC13). However, the differences between MSs were often not as marked as was observed for isolates from Gallus gallus. In some cases, this was because the resistance levels tended to be lower than those observed in Gallus gallus (e.g. ampicillin; Figure EC9), whereas, for others, it was due to the resistance levels all being higher than those recorded in Gallus gallus (e.g. streptomycin; Figure EC12). Cefotaxime resistance has been below 5 % in all countries since 2005, and at a lower level than in Gallus gallus (Figure EC10). Resistance to both ciprofloxacin and nalidixic acid has also generally been at a low level since 2005 (Figure EC11).
For many of the antimicrobials, the resistance levels were relatively stable with only minor fluctuations or gradual changes. There were fewer statistically significant trends than observed among isolates from Gallus gallus. Denmark reported significant increases in resistance to ampicillin, Switzerland reported significant increases in resistance to ciprofloxacin and nalidixic acid. In contrast, the Netherlands reported significant declines in resistance to ampicillin, ciprofloxacin and tetracyclines, and France reported significant declines in resistance to streptomycin and tetracyclines. No statistically significant trends were observed in resistance to cefotaxime.
Figure EC9. Trends in ampicillin resistance in indicator Escherichia coli from pigs in reporting MSs and one non-MS, 2006–2012, quantitative data
MS: Member State. Note: Statistically significant increasing and decreasing trends over seven years, as tested by a logistic regression model (p ≤0.05),
were observed in Denmark (↑) and the Netherlands (↓).

EU summary report on antimicrobial resistance in zoonotic and indicator bacteriafrom humans, animals and food 2012
EFSA Journal 2014;12(3):3590 180
Figure EC10. Trends in cefotaxime resistance in indicator Escherichia coli from pigs in reporting MSs and non-MS, 2006–2012, quantitative data
MS: Member State. Note: No statistically significant trends over five or more years, as tested by a logistic regression model (p ≤0.05), were observed in any
of the reporting countries.

EU summary report on antimicrobial resistance in zoonotic and indicator bacteriafrom humans, animals and food 2012
EFSA Journal 2014;12(3):3590 181
Figure EC11. Trends in ciprofloxacin and nalidixic acid resistance in indicator Escherichia coli from pigs in reporting MSs and one non-MS, 2006–2012, quantitative data
MS: Member State. Note: Statistically significant increasing or decreasing trends over five or more years, as tested by a logistic regression model (p ≤0.05),
were observed in Switzerland (↑) for both ciprofloxacin and nalidixic acid, in France (↑) and the Netherlands (↓) for ciprofloxacin.

EU summary report on antimicrobial resistance in zoonotic and indicator bacteriafrom humans, animals and food 2012
EFSA Journal 2014;12(3):3590 182
Figure EC12. Trends in streptomycin resistance in indicator Escherichia coli from pigs in reporting MSs and one non-MS, 2006–2012, quantitative data
Note: A statistically significant decreasing trend over seven years, as tested by a logistic regression model (p ≤0.05), was observed in
France (↓). MS: Member State.
Figure EC13. Trends in tetracycline resistance in indicator Escherichia coli from pigs in reporting MSs and one non-MS, 2006–2012, quantitative data
Note: Statistically significant decreasing trend over seven years, as tested by a logistic regression model (p ≤0.05), were observed in
France (↓) and the Netherlands (↓). MS: Member State.

EU summary report on antimicrobial resistance in zoonotic and indicator bacteriafrom humans, animals and food 2012
EFSA Journal 2014;12(3):3590 183
Spatial distribution of resistance among indicator Escherichia coli isolates from pigs
The spatial distribution of nalidixic acid and tetracycline resistance in indicator E. coli from pigs is shown in Figures EC14 and EC15, respectively. For nalidixic acid, most countries reported low levels of resistance so the spatial pattern was less clear. Figure EC15 illustrates the variability in levels of tetracyclines resistance in E. coli across the EU and the absence of a clear spatial distribution.
Figure EC14. Spatial distribution of nalidixic acid resistance among indicator Escherichia coli from pigs in countries reporting MIC data in 20121
MS: Member State; MIC: minimum inhibitory concentration. Note: Percentages shown in this map refer to countries that reported quantitative MIC data for more than 10 isolates in 2012. When
quantitative 2012 data were not available, 2011 data were used instead. 1. For Estonia, Germany, Spain and Sweden, 2011 data were used.

EU summary report on antimicrobial resistance in zoonotic and indicator bacteriafrom humans, animals and food 2012
EFSA Journal 2014;12(3):3590 184
Figure EC15. Spatial distribution of tetracycline resistance among indicator Escherichia coli from pigs in countries reporting MIC data in 20121
MS: Member State; MIC: minimum inhibitory concentration. Note: Percentages shown in this map refer to countries that reported quantitative MIC data for more than 10 isolates in 2012. When
quantitative 2012 data were not available, 2011 data were used instead. 1. For Estonia, Germany, Spain and Sweden, 2011 data were used.

EU summary report on antimicrobial resistance in zoonotic and indicator bacteriafrom humans, animals and food 2012
EFSA Journal 2014;12(3):3590 185
Multi-resistance among indicator Escherichia coli isolates from fattening pigs
Three MSs and one non-MS tested the complete harmonised set of antimicrobials for E. coli and reported isolate-based data. Around 40 % of the isolates tested were susceptible to the nine antimicrobials of the set in three reporting countries, while the proportion was lower than 25 % in Hungary. Multi-resistance levels (i.e. reduced susceptibility to three or more antimicrobial classes) were high in all reporting countries (Table EC11), ranging between about one-quarter and half of the indicator E. coli isolates from pigs. The frequency distributions (Figure EC16) showed that all reporting countries detected multi-resistance to as many as six or seven antimicrobial classes. Very few isolates exhibited co-resistance to cefotaxime and ciprofloxacin using either ECOFFs or clinical breakpoints as interpretive criteria (Table EC11).
Table EC11. Complete susceptibility, multi-resistance and index of diversity in Escherichia coli from fattening pigs in MSs and one non-MSs reporting isolate-based data, 2012
Country Susceptible to all Multi-resistant Index of
diversity
Co-resistant to Cip and Ctx
n % n % n % Austria (N=140) 53 37.9 34 24.3 0.379 0(0) 0(0) Denmark (N=152) 63 41.5 49 32.2 0.428 0(0) 0(0) Hungary (N=68) 16 23.5 34 50.0 0.516 0(0) 0(0) Switzerland (N=185) 80 43.2 64 34.6 0.420 1(0) 0.5(0)
MS: Member State; N: total number of isolates tested for susceptibility against the whole common antimicrobial set for E. coli; n: number of isolates. Susceptible to all: isolate susceptible to all antimicrobial substances of the EFSA common set for E. coli. Multi-resistant: resistant to at least 3 different antimicrobial substances, belonging to any three antimicrobial families from the common antimicrobial set for E. coli. Index of diversity: see definition in Section 8.4.2.1 of Chapter 8 Materials and methods. Co-resistant to cefotaxime (Ctx) and ciprofloxacin (Cip): the effectives and percentages of E. coli isolates non-susceptible to concentrations greater than epidemiological cut-off values (Ctx >0.25 mg/L and Cip >0.03 mg/L). Figures in parentheses indicate the occurrence of co-resistance to Cip and Ctx determined using clinical breakpoints (Ctx >2 mg/L and Cip >1 mg/L).
Figure EC16. Frequency distribution of Escherichia coli isolates completely susceptible and resistant to one to nine antimicrobials in fattening pigs in MSs and one non-MS reporting isolate-based data, 2012
MS: Member State; N: total number of isolates tested for susceptibility against the whole common antimicrobial set for E. coli; sus: susceptible to all antimicrobial substances of the EFSA common set for E. coli; res1–res9: resistance to one antimicrobial substance/resistance to nine antimicrobial substances of the common set for E. coli.
0 % 10 % 20 % 30 % 40 % 50 % 60 % 70 % 80 % 90 % 100 %
Switzerland (N=185)
Hungary (N=68)
Denmark (N=152)
Austria (N=140) sus
res1
res2
res3
res4
res5
res6
res7
res8
res9

EU summary report on antimicrobial resistance in zoonotic and indicator bacteriafrom humans, animals and food 2012
EFSA Journal 2014;12(3):3590 186
Multi-/co-resistance patterns among indicator Escherichia coli isolates from fattening pigs
Indicator E. coli isolates resistant to cefotaxime and ciprofloxacin were only observed in Switzerland among reporting countries and streptomycin, sulphonamide and tetracycline resistance was also often present in the isolates tested (Table EC13). These additional resistances (together with trimethoprim resistance in some cases) were also noted in E. coli isolates showing high-level ciprofloxacin resistance (Table EC14).
Table EC12. Multi-/co-resistance patterns of interest in Escherichia coli from fattening pigs in MSs and one non-MS reporting isolate-based data, 2012
Multi-/co-resistance pattern Group of reporting countries (N=545)
Aus
tria
(N
=140
)
Den
mar
k (N
=152
)
Hun
gary
(N
=68)
Switz
erla
nd
(N=1
85)
Am
p
Caz
Ctx
Chl
Cip
Gen
Nal
Str
Su
Tet
Tmp n % group % n n n n
R R 20 95.2 3.7 7 1 7 5 R R R 1 4.8 0.2 0 0 0 1
Total 21 100 3.9 7 1 7 6 MS: Member State; N: total number of isolates tested for susceptibility against the whole common antimicrobial set for E. coli and multi-resistant; Amp: ampicillin; Caz: ceftazidime; Ctx: cefotaxime; Chl: chloramphenicol; Cip: ciprofloxacin; Gen: gentamicin; Nal: nalidixic acid; Str: streptomycin; Su: sulfonamides; Tet: tetracyclines; Tmp: trimethroprim; n: number of multi-/co-resistant isolates; R: minimum inhibitory concentration above European Committee on Antimicrobial Susceptibility Testing (EUCAST) epidemiological cut-off values (ECOFFs).
Table EC13. Co-resistance to cefotaxime and ciprofloxacin in Escherichia coli from fattening pigs in MSs and one non-MS reporting isolate-based data, 2012
Country
Resistance to bothCip and Ctx,
applying ECOFFs1
Resistance to both Cip and Ctx, applying clinical breakpoints1
Multi-resistance patterns of isolates resistant to both
Cip and Ctx, applying ECOFFs1 (number of isolates) n (%) n (%)
Austria (N=140) 0 (0 %) 0 (0 %) NA Denmark (N=152) 0 (0 %) 0 (0 %) NA Hungary (N=68) 0 (0 %) 0 (0 %) NA Total (3 MSs) (N=360) 0 (0 %) 0 (0 %) Switzerland (N=185) 1 (0.5 %) 0 (0 %) AmpCtxCip (1)
MS: Member State; N: total number isolates for which relevant data are available; n: number of co-resistant isolates; Cip: ciprofloxacin; Ctx: cefotaxime; NA: not applicable. 1. European Committee on Antimicrobial Susceptibility Testing (EUCAST) epidemiological cut-off values (ECOFFs) and clinical
breakpoints were applied.

EU summary report on antimicrobial resistance in zoonotic and indicator bacteriafrom humans, animals and food 2012
EFSA Journal 2014;12(3):3590 187
Table EC14. Ciprofloxacin resistance assessed at differing thresholds in indicator Escherichia coli from fattening pigs in MSs and one non-MS reporting isolate-based data, 2012
Country
Isolates resistant
at >0.03 mg/L1
Cip
Isolates resistant
at >1 mg/L2
Cip
Isolates resistant
at >2 mg/L3
Cip
Isolates resistant
at >4 mg/L4
Cip
Resistance patterns of isolates resistant at >4 mg/L Cip
(number of isolates)
n (%) n (%) n (%) n (%)
Austria (N=140) 7 (5.0 %) 4 (2.9 %) 4 (2.9 %) 4 (2.9 %) AmpCipNalStrSuTetTmp (2) CipNalStrTetTmp (1) AmpCipNalTet (1)
Denmark (N=152) 1 (0.7 %) 0 (0 %) 0 (0 %) 0 (0 %) NA
Hungary (N=68) 9 (13.2 %) 2 (2.9 %) 2 (2.9 %) 2 (2.9 %) AmpCipNalTet (1) AmpCipNalStrSuTetTmp (1)
Total (3 MSs) (N=360) 17 (4.7 %) 6 (1.7 %) 6 (1.7 %) 6 (1.7 %) Switzerland (N=185) 6 (3.2 %) 0 (0 %) 0 (0 %) 0 (0 %) NA
MS: Member State; N: total number isolates for which relevant data are available; n: number of resistant isolates; Cip: ciprofloxacin; NA: not applicable. 1. European Committee on Antimicrobial Susceptibility Testing (EUCAST) epidemiological cut-off values (ECOFFs). 2. EUCAST clinical breakpoint. 3. High breakpoint. 4. Very high breakpoint.

EU summary report on antimicrobial resistance in zoonotic and indicator bacteriafrom humans, animals and food 2012
EFSA Journal 2014;12(3):3590 188
5.2.2.3. Cattle (bovine animals)
Representative sampling and monitoring
In 2012, quantitative data for E. coli in cattle were provided by seven MSs and one non-MS (Switzerland) (Table EC15). These countries tested different production types and ages of cattle, including calves, young cattle, meat production animals, adult cattle and dairy cows; Denmark and Poland did not specify the type of cattle that were tested.
Among the reporting MSs, antimicrobial resistance monitoring in indicator E. coli isolates from cattle was chiefly based on monitoring plans of healthy bovine animals randomly selected within the slaughterhouses (Austria, Denmark, Finland and Switzerland). Indicator E. coli isolates were isolated from caecal contents in Austria, from recto-anal swabs in Switzerland and from faeces in Denmark and Finland by sampling healthy cattle at slaughter. Belgium and Poland did not report information on the sample type, sampling context and sampling stage.
The overall results for cattle presented in Table EC15 include all isolates of E. coli that were collected from this animal species by MSs which tested more than 10 isolates from cattle in total. Results are also presented for the specific production levels of cattle from which these E. coli isolates originated. Some MSs tested fewer than 10 isolates from individual production types. In such cases, the data for these production types are included in the overall results for cattle but are not presented in the production level-specific sections of this table.
Resistance levels among Escherichia coli isolates from cattle
The occurrence of resistance to gentamicin and nalidixic acid was less common, with an overall level at the reporting MS group of 3.1 %, and 8.6 %, respectively. Two countries reported no resistance to cefotaxime, with the highest resistance levels being 8.8 % and 2.6 %, recorded by Belgium and Poland among mixed herds and unspecified production type, respectively.
In indicator E. coli isolates from calves of less than one year of age, tested in Austria, Germany and the Netherlands, resistance to ampicillin, streptomycin, sulfonamides and tetracyclines was generally moderate to high, while resistance to chloramphenicol and gentamicin was recorded at low to moderate and low levels, respectively. The occurrence of resistance to (fluoro)quinolones and third-generation cephalosporins was less common, as ciprofloxacin and nalidixic acid resistance was reported at low to moderate levels, while resistance to cefotaxime was low to very low. Switzerland, which monitored indicator E. coli resistance in bovine animals for meat production, recorded similar features of resistance to the same panel of substances, although at a slightly lower level.
Austria which also submitted data concerning young cattle (aged one to two years) and adult cattle (over two years) reported lower resistance levels in these age groups than in calves of less than one year; only resistance to streptomycin, sulfonamides and tetracyclines was detected at around 5 %, while no resistance was recorded to the other substances of the common panel. The Netherlands reported much lower resistance, at around 1 % levels, among dairy cows than among veal calves.

EU summary report on antimicrobial resistance in zoonotic and indicator bacteriafrom humans, animals and food 2012
EFSA Journal 2014;12(3):3590 189
Table EC15. Resistance (%) to ampicillin, cefotaxime, chloramphenicol, ciprofloxacin, gentamicin, nalidixic acid, streptomycin, sulfonamides and tetracyclines among isolates of Escherichia coli from cattle in countries reporting MIC data in 2012, using harmonised epidemiological cut-off values
Country Ampicillin Cefotaxime Chloramphenicol Ciprofloxacin Gentamicin
N % Res N % Res N % Res N % Res N % Res All cattle
Austria 273 5.9 273 0.7 273 2.2 273 2.2 273 0.7 Belgium 364 56.0 364 8.8 364 31.0 364 33.8 364 6.0 Denmark 98 5.1 98 0 98 2.0 98 0 98 0 Finland 295 1.7 295 0 295 0 – – 295 0.3 Germany 515 46.8 515 2.5 515 17.5 515 16.5 515 6.4 Netherlands 559 13.6 559 0.5 559 7.7 559 3.4 559 1.4 Poland 190 7.9 190 2.6 190 2.6 190 5.3 190 2.6 Total (7 MSs) 2,294 24.5 2,294 2.4 2,294 11.3 1,999 12.2 2,294 3.1 Switzerland 187 14.4 187 0.5 187 3.7 187 3.2 187 5.9
Calves (under 1 year) Austria 151 10.6 151 1.3 151 3.3 151 4.0 151 1.3 Germany 515 46.8 515 2.5 515 17.5 515 16.5 515 6.4 Netherlands 285 25.6 285 0.7 285 14.4 285 6.0 285 2.5 Total (3 MSs) 951 34.7 951 1.8 951 14.3 951 11.4 951 4.4
Young cattle (1–2 years) Austria 73 0 73 0 73 0 73 0 73 0
Meat production animals Switzerland 187 14.4 187 0.5 187 3.7 187 3.2 187 5.9
Adult over 2 years Austria 49 0 49 0 49 2.0 49 0 49 0
Dairy cows Netherlands 274 1.1 274 0.4 274 0.7 274 0.7 274 0.4
Mixed herds Belgium 364 56.0 364 8.8 364 31.0 364 33.8 364 6.0 Finland 295 1.7 295 0 295 0 – – 295 0.3 Total (2 MSs) 659 31.7 659 4.9 659 17.1 364 33.8 659 3.5
MIC: minimum inhibitory concentration; MS: Member State; N: number of isolates tested; % Res: percentage of resistant isolates. Table continued overleaf.

EU summary report on antimicrobial resistance in zoonotic and indicator bacteriafrom humans, animals and food 2012
EFSA Journal 2014;12(3):3590 190
Table EC15 (continued). Resistance (%) to ampicillin, cefotaxime, chloramphenicol, ciprofloxacin, gentamicin, nalidixic acid, streptomycin, sulfonamides and tetracyclines among isolates of Escherichia coli from cattle in countries reporting MIC data in 2012, using harmonised epidemiological cut-off values
Country Nalidixic acid Streptomycin Sulfonamides Tetracyclines N % Res N % Res N % Res N % Res
All cattle Austria 273 1.8 273 12.5 273 11.4 273 14.7 Belgium 364 28.6 364 51.6 364 59.3 364 58.2 Denmark 98 0 98 6.1 98 6.1 98 7.1 Finland 295 0 295 5.4 295 3.4 295 2.4 Germany 515 12.0 515 43.3 515 50.1 515 53.0 Netherlands 559 2.9 559 16.3 559 17.0 559 25.2 Poland 190 5.3 190 8.9 190 17.4 190 11.6 Total (7 MSs) 2,294 8.6 2,294 25.1 2,294 28.3 2,294 30.6 Switzerland 187 3.2 187 24.6 187 26.2 187 24.6
Calves (under 1 year) Austria 151 3.3 151 18.5 151 17.2 151 22.5 Germany 515 12.0 515 43.3 515 50.1 515 53.0 Netherlands 285 5.3 285 30.9 285 32.6 285 48.1 Total (3 MSs) 951 8.6 951 35.6 951 39.6 951 46.7
Young cattle (1–2 years) Austria 73 0 73 5.5 73 4.1 73 5.5
Meat production animals Switzerland 187 3.2 187 24.6 187 26.2 187 24.6
Adult over 2 years Austria 49 0 49 4.1 49 4.1 49 4.1
Dairy cows Netherlands 274 0.4 274 1.1 274 0.7 274 1.5
Mixed herds Belgium 364 28.6 364 51.6 364 59.3 364 58.2 Finland 295 0 295 5.4 295 3.4 295 2.4 Total (2 MSs) 659 15.8 659 31.0 659 34.3 659 33.2
MIC: minimum inhibitory concentration; MS: Member State; N: number of isolates tested; % Res: percentage of resistant isolates.

EU summary report on antimicrobial resistance in zoonotic and indicator bacteriafrom humans, animals and food 2012
EFSA Journal 2014;12(3):3590 191
Temporal trends in resistance among indicator Escherichia coli isolates from cattle
Figures EC17 to EC21 display the trends in resistance to selected antimicrobials in E. coli from cattle. It should be noted that the figures presented for each country combine the results for all cattle production types and/or ages submitted each year. As in the other livestock species, the resistance levels varied substantially between MSs for several of the antimicrobials, including ampicillin, streptomycin and tetracyclines. Austria and Denmark reported the lowest levels of resistance for many of the antimicrobials. As in pigs, cefotaxime resistance has been below 5 % in all countries since 2005 (Figure EC18).
Considering the previous years of reporting, the resistance levels reported by Denmark in 2011 and 2012 were broadly comparable. In Austria, the studied population changed in 2012 with calves being over-represented compared with the other age of groups in the years before 2012; therefore, statistical trends were not calculated. Switzerland reported decreases in resistance to most antimicrobials between 2010 and 2012, which is most probably because the study population in 2010 was veal calves less than six months old whereas in 2011 older cattle (>12 months) were sampled. In Germany, resistance rates were much lower in 2011 than in 2010 and in 2012. However, in 2010 and 2012 veal calves were tested while in 2011 young beef animals were tested which usually differ in management and antimicrobial exposure.
Some countries, such as Denmark and the Netherlands, have shown relatively stable resistance levels or only minor fluctuations or trends since 2006 whereas other countries, such as Germany and Switzerland, have shown more substantial fluctuations in resistance levels that are, at least partially, due to the sampling of different cattle production types in different years. There have been numerous statistically significant trends in resistance levels since 2006; for example, Germany and the Netherlands showed significant declines in resistance to five of the antimicrobials. Significant decreasing trends were also observed in Denmark and Switzerland.
Figure EC17. Trends in ampicillin resistance in indicator Escherichia coli from cattle in reporting MSs and one non-MS, 2006–2012, quantitative data
M: Member State. Note: Statistically significant increasing or decreasing trends over five or more years, as tested by a logistic regression model (p ≤0.05),
were observed in Germany (↓), the Netherlands (↓) and Switzerland (↓).

EU summary report on antimicrobial resistance in zoonotic and indicator bacteriafrom humans, animals and food 2012
EFSA Journal 2014;12(3):3590 192
Figure EC18. Trends in cefotaxime resistance in indicator Escherichia coli from cattle in reporting MSs and one non-MS, 2006–2012, quantitative data
M: Member State. Note: No statistically significant trends over five or more years, as tested by a logistic regression model (p ≤0.05), were observed in any
of the reporting countries.

EU summary report on antimicrobial resistance in zoonotic and indicator bacteriafrom humans, animals and food 2012
EFSA Journal 2014;12(3):3590 193
Figure EC19. Trends in ciprofloxacin and nalidixic acid resistance in indicator Escherichia coli from cattle in reporting MSs and one non-MS, 2006–2012, quantitative data
M: Member State. Note: Statistically significant decreasing trends over five or more years, as tested by a logistic regression model (p ≤0.05), were
observed in Germany (↓) and the Netherlands (↓) for both ciprofloxacin and nalidixic acid, in Denmark (↓) and Estonia (↓) for ciprofloxacin.

EU summary report on antimicrobial resistance in zoonotic and indicator bacteriafrom humans, animals and food 2012
EFSA Journal 2014;12(3):3590 194
Figure EC20. Trends in streptomycin resistance in indicator Escherichia coli from cattle in reporting MSs and one non-MS, 2006–2012, quantitative data
Note: Statistically significant increasing and decreasing trends over five or more years, as tested by a logistic regression model
(p ≤0.05), were observed in Estonia (↓), Germany (↓), the Netherlands (↓) and Switzerland (↓). MS: Member State.
Figure EC21. Trends in tetracycline resistance in indicator Escherichia coli from cattle in reporting MSs and one non-MS, 2006–2012, quantitative data
Note: Statistically significant increasing and decreasing trends over five or more years, as tested by a logistic regression model
(p ≤0.05), were observed in Germany (↓), the Netherlands (↓) and Switzerland (↓). MS: Member State.

EU summary report on antimicrobial resistance in zoonotic and indicator bacteriafrom humans, animals and food 2012
EFSA Journal 2014;12(3):3590 195
Spatial distribution of resistance among indicator Escherichia coli isolates from cattle
The spatial distributions of nalidixic acid and tetracycline resistance among E. coli from cattle are shown in Figures EC22 and EC23. Nevertheless, there was still some evidence that the lowest resistance to tetracyclines occurred in the northern countries and the highest occurred in the southern and western countries. With respect to nalidixic acid, the majority of countries reported low levels of resistance and no spatial pattern was evident.
Figure EC22. Spatial distribution of nalidixic acid resistance among indicator Escherichia coli from cattle in countries reporting MIC data in 20121
MIC: minimum inhibitory concentration; MS: Member State. Note: Percentages shown in this map refer to countries that reported quantitative MIC data for more than 10 isolates in 2012. When
quantitative 2012 data were not available, 2011 data were used instead. The countries labelled as ‘qualitative data’ therefore include those reporting MIC data for fewer than 10 isolates or purely qualitative data (as proportion of resistant isolates).
1. For Spain, 2011 data were used.

EU summary report on antimicrobial resistance in zoonotic and indicator bacteriafrom humans, animals and food 2012
EFSA Journal 2014;12(3):3590 196
Figure EC23. Spatial distribution of tetracycline resistance among indicator Escherichia coli from cattle in countries reporting MIC data in 20121
MIC: minimum inhibitory concentration; MS: Member State. Note: Percentages shown in this map refer to countries that reported quantitative MIC data for more than 10 isolates in 2012. When
quantitative 2012 data were not available, 2011 data were used instead. The countries labelled as ‘qualitative data’ therefore include those reporting MIC data for fewer than 10 isolates or purely qualitative data (as proportion of resistant isolates).
1. For Spain, 2011 data were used.
Multi-resistance among indicator Escherichia coli isolates from cattle
No tables and graphs on multi-resistance are presented in this report for E. coli in cattle because too few MSs reported multi-resistance isolate-based data on more than 10 isolates for the different production types of cattle.

EU summary report on antimicrobial resistance in zoonotic and indicator bacteriafrom humans, animals and food 2012
EFSA Journal 2014;12(3):3590 197
5.3. Multi-drug resistance patterns in indicator E. coli in 2012
The MDR patterns in indicator E. coli from broilers and fattening pigs, in MSs reporting isolate-based data, are shown in Appendix 4, Table MDRP37, and Appendix 4, Table MDRP38, respectively.
5.3.1. Multi-drug resistance in E. coli isolates from broilers
A large number of different resistance patterns in indicator E. coli isolates from broilers were evident (57 different patterns displayed by 534 isolates), reflecting the diverse nature of the E. coli strains which have been tested. Although no single pattern occurred at a frequency of greater than 3 % amongst the MDR patterns obtained from broilers, a common core of resistance to ampicillin, sulfonamides and tetracyclines, generally with resistance to ciprofloxacin and frequently with resistance to streptomycin and trimethoprim, was discernible. Several resistance patterns which occurred at a higher frequency included resistance to cefotaxime; however, cefotaxime resistance also occurred as a component of infrequent resistance patterns. Ciprofloxacin resistance frequently occurred as a component of MDR in E. coli from broilers and was observed in 72.3 % of MDR isolates (120 out of 166).
5.3.2. Multi-drug resistance in E. coli isolates from fattening pigs
The overall range of different patterns observed in indicator E. coli isolates from pigs in MSs reporting isolate-based data was similar to that seen in broilers, with a large number of different resistance patterns evident (54 different patterns displayed by 565 isolates), again reflecting the diverse nature of the E. coli strains which have been tested. Particular MDR patterns were predominant in fattening pigs, with two patterns occurring at a frequency of greater than 14 % amongst the MDR patterns obtained, and each of these patterns comprising more than 5 % of the E. coli isolates for which isolate-based data was available. In pigs, E. coli with either of two MDR patterns (pattern one: streptomycin, sulfonamides and tetracyclines, and pattern two: streptomycin, sulfonamides, tetracyclines, ampicillin and trimethoprim), therefore, accounted for approximately 10 % of the total number of E. coli isolates for which isolate-based data were available. Resistance to streptomycin, sulfonamides and tetracyclines formed a common core in both of these MDR patterns and also occurred as a recurring core pattern in isolates showing additional resistances. Considering those resistance patterns occurring at a higher frequency in pigs, these did not generally include resistance to cefotaxime; however, cefotaxime resistance did occur as a component of infrequent resistance patterns. Ciprofloxacin resistance occurred infrequently as a component of MDR in pigs and was present in 16 % of porcine MDR E. coli isolates (32 out of 200).

EU summary report on antimicrobial resistance in zoonotic and indicator bacteriafrom humans, animals and food 2012
EFSA Journal 2014;12(3):3590 198
5.4. Overview of findings on indicator E. coli resistance at reporting MS group level, 2012
Figures EC24 and EC25 display the resistance levels among E. coli isolates in the reporting MS group, based on quantitative data submitted in 2012. These data were not all derived from the same group of MSs, which needs to be considered when interpreting these figures.
The levels of resistance were broadly similar for meat from broilers, pigs and bovine animals for all reporting MSs for these antimicrobials (Figure EC24). The situation was different for ciprofloxacin and nalidixic acid, where resistance was high in meat from broilers considering all reporting MSs at 29.1 % and 24.1 % respectively, but low in meat from pigs and meat from bovine animals at less than 7 %.
The resistance levels observed in E. coli isolates from cattle were lower than in E. coli isolates from either Gallus gallus or pigs, most notably for ampicillin, streptomycin, sulfonamides and tetracyclines (Figure EC25). The variations at the reporting MS group level between years could be attributable to different MSs contributing data and different production types of livestock being sampled. The MSs that provided data for all three livestock species in both 2011 and 2012 usually reported the lowest resistance levels among cattle.
As in previous years, isolates from pigs had the highest levels of resistance to streptomycin and tetracyclines, while isolates from Gallus gallus had the highest resistance to ampicillin, ciprofloxacin, nalidixic acid and sulfonamides. Resistance to chloramphenicol and gentamicin was relatively low in all types of livestock, with the highest resistance level occurring in Gallus gallus. This differs from the situation in 2010, when the highest resistance levels for these two antimicrobials were observed in cattle. Chloramphenicol has not been used for food production animals in the EU for several years; thus, the resistance observed must either indicate persistence of resistance genes or co-selection resulting from use of related compounds (such as florfenicol). The lowest levels of resistance were usually observed to cefotaxime; the highest level of resistance to this antimicrobial occurred in isolates from Gallus gallus, which was also the case in previous years.
Figure EC24. Resistance in indicator Escherichia coli from meat from broilers, meat from pigs and meat from bovine animals to ampicillin, cefotaxime, chloramphenicol, ciprofloxacin, gentamicin, nalidixic acid, streptomycin, sulfonamides and tetracyclines at reporting MS group level, in 2012
MS: Member State.
0
10
20
30
40
50
60
70
80
90
100
E. coli from meatfrom broilers2012 (4 MSs)
E. coli frommeat from pigs2012 (4 MSs)
E. coli from meatfrom bovine animals
2012 (4 MSs)
% re
sist
ance
at r
epor
ting
MS
grou
p le
vel
Ampicillin Cefotaxime Chloramphenicol Ciprofloxacin Gentamicin Nalidixic acid Streptomycin Sulfonamides Tetracyclines
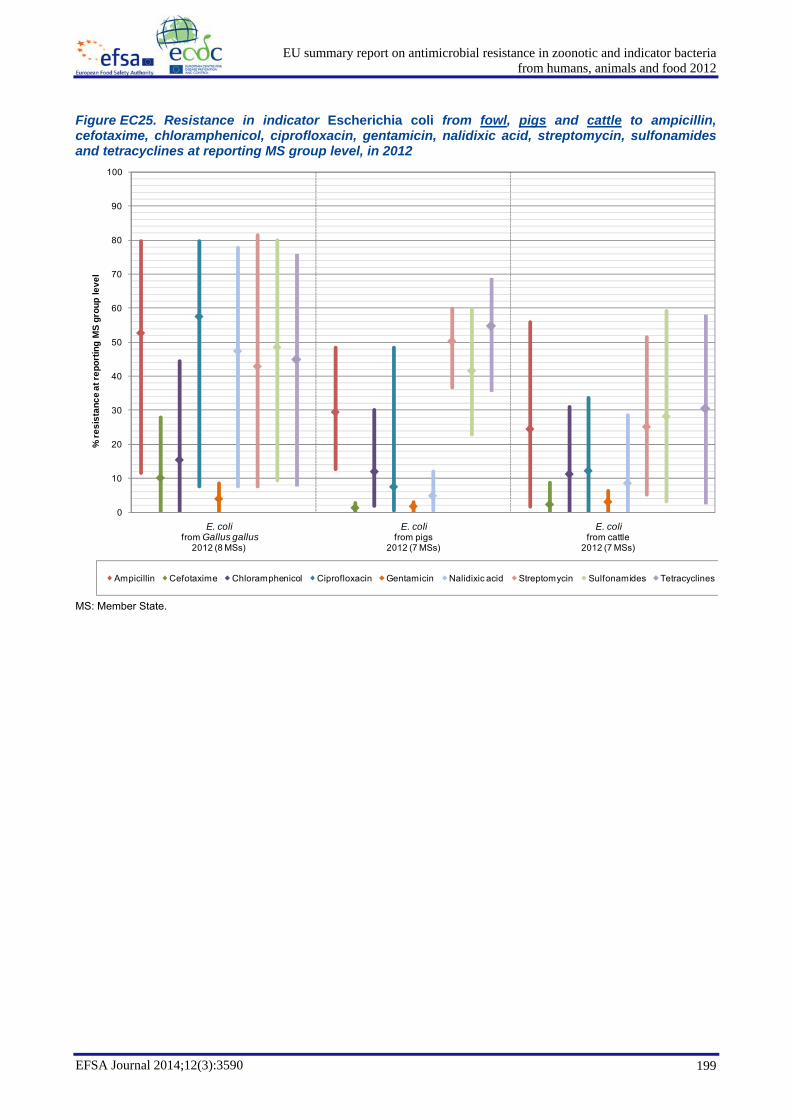
EU summary report on antimicrobial resistance in zoonotic and indicator bacteriafrom humans, animals and food 2012
EFSA Journal 2014;12(3):3590 199
Figure EC25. Resistance in indicator Escherichia coli from fowl, pigs and cattle to ampicillin, cefotaxime, chloramphenicol, ciprofloxacin, gentamicin, nalidixic acid, streptomycin, sulfonamides and tetracyclines at reporting MS group level, in 2012
MS: Member State.
0
10
20
30
40
50
60
70
80
90
100
E. coli from Gallus gallus
2012 (8 MSs)
E. colifrom pigs
2012 (7 MSs)
E. colifrom cattle
2012 (7 MSs)
% re
sist
ance
at r
epor
ting
MS
grou
p le
vel
Ampicillin Cefotaxime Chloramphenicol Ciprofloxacin Gentamicin Nalidixic acid Streptomycin Sulfonamides Tetracyclines

EU summary report on antimicrobial resistance in zoonotic and indicator bacteriafrom humans, animals and food 2012
EFSA Journal 2014;12(3):3590 200
5.5. Discussion
Antimicrobial resistance in indicator commensal E. coli from animals and food can be used to examine the reservoir of resistance genes occurring in those bacteria that could be transferred to bacteria that are pathogenic for humans and/or animals. The major factor influencing the occurrence of resistance to antimicrobials in indicator E. coli is likely to be the selective pressures exerted by use of antimicrobials in the different food animal populations; variations in usage between animal species may also contribute to the observed differences in resistance levels between the animal species. Indicator E. coli are thus also of interest when investigating possible associations between the usage of antimicrobials in a given country and the occurrence of resistance in an animal species, because of their ubiquity in food-producing animals. Multi-resistance data, available for the first time in 2012, indicates that the co-resistance phenomenon should be considered when analysing the relationship between antimicrobial use and resistance in animals.
A total of 11 MSs and 2 non-MSs provided quantitative MIC data, in 2012, on at least one of the livestock species. Reported antimicrobial resistance data in E. coli isolates from food-producing animals and food, derived mainly from active and representative monitoring programmes, were chiefly based on randomised sampling performed at the slaughterhouse. At the reporting MS group level, a high level of resistance was observed to several antimicrobials among food-producing animals, with some countries reporting a very or extremely high occurrence of resistance. As resistance levels tend to vary substantially between countries, the variation in resistance in Gallus gallus, pigs and cattle observed between the years 2009 and 2012, at the overall MS group level, may partly result from different MSs contributing to data as well as different production types of livestock being sampled.
In 2012, four MSs reported on antimicrobial resistance in each category of meat, but those which did generally reported comparable resistance levels in meat as in the corresponding source animal species. Resistance levels were generally higher among E. coli isolates from Gallus gallus and pigs than isolates from cattle. This was the second year that resistance data were reported separately for different production types of Gallus gallus and cattle. However, only two countries provided data on laying hens, and both of these MSs also provided data on broilers. Although there is limited information available for 2011 and 2012 on which to draw firm conclusions, resistance levels were generally higher among broilers than in laying hens. Similarly, in 2012, only two MSs reported on more than one production type or age group of cattle. The Netherlands reported much higher resistance levels among younger animals and a similar trend to higher resistance in young animals was also observed in Austria. Regional differences in the occurrence of resistance were evident for some antimicrobials for indicator E. coli from broilers and pigs. This may reflect differences in the structure of the respective livestock sectors, with pyramidal production systems more common in pigs and broilers.
Generally, the highest resistance levels were identified for ampicillin, sulfonamides and tetracyclines, which are commonly used therapeutically in animals. Moreover, some countries have shown statistically significant increasing or decreasing trends in resistance to these antimicrobials over five or more years since 2006. At the MS group level, resistance to gentamicin was highest in Gallus gallus (4.0 %) and lowest in pigs (1.8 %). Gentamicin is an interesting antimicrobial because there are differences in the degree of usage in different MSs of this and other antimicrobials to which cross-resistance may occur (for example apramycin).
Resistance was also identified to fluoroquinolones (ciprofloxacin), a class of antimicrobials recognised to be critically important in human medicine. Although resistance was generally similar in E. coli from meat from broilers, pigs and cattle, for all of the antimicrobials tested for the group of reporting MSs, resistance to nalidixic acid and ciprofloxacin was a notable exception, as much higher levels of resistance were recorded in E. coli isolates from meat from broilers than from meat from the other species. Similarly, the occurrence of resistance to nalidixic acid and ciprofloxacin was higher in E. coli from broilers than in isolates from pigs and cattle. As resistance to fluoroquinolones commonly includes a mutational component, this suggests that either E. coli from broilers are exposed to greater selective pressure from the overall use of fluoroquinolones, or the use of fluoroquinolones at a particular part of the production pyramid (which selects for mutational resistance there) engenders resistance which is subsequently disseminated to flocks lower in the pyramid by the spread and transfer of resistant bacterial clones. Although the occurrence of high-level fluoroquinolone resistance is likely to be influenced by the degree of fluoroquinolone usage, it is also likely to be influenced by the degree to which terminal hygiene and disinfection procedures allow strains, which have developed some resistance, to persist and colonise the subsequent group of animals. The occurrence of resistance to nalidixic acid was often similar then that for ciprofloxacin, suggesting that mutation in the topoisomerase enzymes (gyrA or parC) may, in those cases, have been responsible for resistance. However, in some MSs, the occurrence of resistance to ciprofloxacin was slightly higher than that obtained for nalidixic acid. In these

EU summary report on antimicrobial resistance in zoonotic and indicator bacteria
from humans, animals and food 2012
EFSA Journal 2014;12(3):3590 201
cases, mechanisms such as transferable fluoroquinolone resistance conferred by qnr genes may have been responsible for resistance; as such plasmid-mediated mechanisms can result in that phenotypic pattern of resistance. One country has shown statistically significant decreasing trends in resistance to ciprofloxacin in all species over five or more years since 2006.
Resistance to third-generation cephalosporins (cefotaxime), another class categorised as critically important in human medicine, was infrequently detected in 2012. There were few countries which reported significant increasing or decreasing trends in resistance to cefotaxime over five or more years since 2006. EFSA has published recommendations for surveillance of indicator E. coli resistant to cefotaxime, which would extend the scope of the current monitoring by including selective culture for such organisms (EFSA, 2012b). Current procedures rely on random selection of indicator E. coli isolates from primary culture plates; selective culture could additionally be used to detect the presence or absence of isolates resistant to cefotaxime in a sample (within the detection limit of the chosen method). Monitoring using selective media for cefotaxime resistance would thus detect cefotaxime-resistant E. coli present as a minor component of the total bacterial flora in the test sample and which might only occasionally be detected by random sampling from non-selective culture plates. The occurrence of third-generation cephalosporin resistance was still generally low, although a number of reporting MSs recorded high to moderate levels in E. coli from Gallus gallus, and resistance was typically higher in isolates from Gallus gallus than in pigs or cattle. The findings in relation to third-generation cephalosporin resistance are discussed further in Chapter 7.
Although the levels of multi-resistance17
were relatively high in indicator E. coli isolates from both broilers and pigs in most reporting countries, co-resistance to cefotaxime and ciprofloxacin was detected at very low or low levels in broilers, but not in pigs, in the reporting MSs in 2012. This year, for the first time in this report, the multi-drug resistance patterns shown by indicator E. coli from broilers and pigs from MSs reporting isolate-based data have been included. A common core of resistance to ampicillin, sulfonamides and tetracyclines, generally with resistance to ciprofloxacin and frequently with resistance to streptomycin and trimethoprim, was discernible in broilers where no single pattern or patterns of resistance occurred at a high frequency. In fattening pigs, two MDR patterns were predominant (pattern one: streptomycin, sulfonamides, tetracyclines and streptomycin, and pattern two: sulfonamides, tetracyclines, ampicillin and trimethoprim) and each accounted for more than 5 % of the total number of E. coli isolates from fattening pigs for which isolate-based data were available. The occurrence of these particular patterns might reflect spread of particular clones of bacteria which exhibit that pattern of resistance or dissemination of plasmids carrying those resistances and possibly being transmitted between different strains of E. coli. In broilers, ciprofloxacin resistance was particularly noted in MDR patterns and resistance to this compound can be mediated through chromosomal mutations or through transferable mechanisms of resistance. Ciprofloxacin resistance frequently occurred as a component of MDR in E. coli from broilers and was observed in 72.3 % of MDR
17
Proportions of isolates showing reduced susceptibility to at least three antimicrobial classes according to epidemiological cut-off values.
REVISION OF EPIDEMIOLOGICAL CUT-OFF VALUES FOR CIPROFLOXACIN FOR E. COLI
The epidemiological cut-off value (ECOFF) for E. coli versus ciprofloxacin has been recently revised by the European Committee on Antimicrobial Susceptibility Testing (EUCAST). Wild-type isolates are now considered to have a ciprofloxacin minimum inhibitory concentration (MIC) lower than or equal to 0.06 mg/L, an increase from the previous ECOFF of 0.03 mg/L. The proportion of isolates showing microbiological resistance according to this breakpoint will alter when the new breakpoint is adopted and in fact will be reduced. For reasons of continuity and to comply with the current legislation where applicable, the ECOFFs used in this report have been those adopted in EFSA’s recommendations (EFSA, 2007, 2008). For these reasons, the most recent revisions by EUCAST have not been included in this report. The report for 2013 will incorporate all of these changes in a comprehensive revision, which will also re-evaluate the historical data using the revised ECOFFs, as well as taking into account revised EU legislation in this area, which will include revised ECOFFs.
The reported MIC distributions for E. coli versus ciprofloxacin are available on the EFSA website in ‘Level 3 Tables’. From these it can be seen that the total number of E. coli reported was 8,580. Of these, 32.7 % were resistant considering the ECOFF of >0.03 mg/L whereas 25.6 % were resistant considering the ECOFF of >0.06 mg/L.

EU summary report on antimicrobial resistance in zoonotic and indicator bacteriafrom humans, animals and food 2012
EFSA Journal 2014;12(3):3590 202
isolates (120 out of 166), whereas ciprofloxacin resistance occurred infrequently as a component of MDR in pigs and was present in 16.0 % (32 out of 200) of porcine MDR E. coli isolates.
Several resistance patterns, which occurred at a higher frequency in E. coli from broilers, included resistance to cefotaxime; however, cefotaxime resistance also occurred as a component of infrequent resistance patterns in this species. Considering the resistance patterns occurring at a higher frequency in pigs, these did not generally include resistance to cefotaxime; however, cefotaxime resistance did occur as a component of infrequent resistance patterns. Resistance to cefotaxime may be conferred by ESBL or AmpC beta-lactamase enzymes; in E. coli the former are generally carried on plasmids, whereas AmpC resistance may be carried on plasmids or relate to mutations of the promoter region of the endogenous beta-lactamase carried by E. coli. Further characterisation of cefotaxime resistance shown by these isolates, which has been recommended by EFSA (EFSA, 2012b) in particular phenotypic and genetic characterisation of the resistance, would allow particular resistance patterns to be identified which are associated with the carriage of ESBL or AmpC enzymes. This has potential implications for control through the identification of antimicrobials which might encourage the spread of cefotaxime resistance through co-selection.
A recent study in Spain examined the integrons carried by E. coli isolates recovered from healthy broilers and pigs (Marchant et al., 2013). Integrons can be associated with particular antimicrobial resistance genes and in the Spanish study both class 1 and class 2 integrons were detected in pigs and chickens. Class 1 integrons classically carry the resistance gene sul1; additionally, both types of integrons in the Spanish study often carried genes associated with streptomycin and trimethoprim resistance, while resistance genes conferring chloramphenicol and gentamicin resistance were detected in the variable region of class 1 integrons only. The widespread occurrence of integrons and their associated antimicrobial resistance genes in animal E. coli is likely to account for some of the resistance patterns (or associations between resistances) which are evident in the MDR tables and probably explains why sulfonamide, streptomycin and trimethoprim resistance are common components of MDR patterns. The Spanish study also reported that the presence of integrons was associated with resistance to amoxicillin (equivalent to ampicillin for resistance purposes) and tetracyclines. The common core patterns of resistance to ampicillin, streptomycin, sulfonamides, tetracyclines and trimethoprim (and combinations thereof) frequently observed in the monitoring of E. coli isolates are probably therefore related to the presence of integrons.
There may be numerous permutations in the ways in which resistance genes may be arranged or accumulated by E. coli, and attempting to relate the resistance phenotype to the likely underlying mechanisms of resistance is therefore difficult. Full resistance to all of the antimicrobials in the test panel was noted only for a single E. coli isolate from pigs and there might be numerous ways in which such resistance might develop. It is interesting, however, that such resistance has been described before in E. coli isolates from animals and has been reported, for example, in E. coli recovered from cattle in France (Meunier et al., 2010).

EU summary report on antimicrobial resistance in zoonotic and indicator bacteriafrom humans, animals and food 2012
EFSA Journal 2014;12(3):3590 203
6. METHICILLIN-RESISTANT STAPHYLOCOCCUS AUREUS
6.1. Introduction
The EFSA’s assessment of the public health significance of MRSA in animals and food (EFSA, 2009c) and the Joint Scientific Report of ECDC, EFSA and EMEA on MRSA in livestock, companion animals and food (EFSA, 2009a) provide more background information and recommendations on MRSA. A principal recommendation is that monitoring of food-producing animals, in particular intensively reared animals, is carried out periodically in conjunction with a systematic surveillance of MRSA in humans so that trends in the diffusion and evolution of zoonotically-acquired MRSA in humans can be identified. In particular, isolate samples, representative of various animal and food origins, should be analysed for lineage determination, antimicrobial susceptibility and virulence-associated traits. These issues were reviewed in the recent EFSA Scientific Report proposing technical specifications to improve the harmonisation of the monitoring and reporting of the prevalence, genetic diversity and multi-resistance profile of MRSA in food-producing animals and food thereof (EFSA, 2012c) (see Section 6.3 Discussion below for further information).
METHICILLIN-RESISTANT STAPHYLOCOCCUS AUREUS (MRSA) MRSA has been recognised as an important cause of healthcare-associated infections in humans for decades. Strains of MRSA have also emerged which are particularly associated with community-associated infections in humans. Moreover, in recent years, MRSA has also been detected in several animal species, notably including pigs and companion animals as well as some other farm animal species. Hospital-associated MRSA and community-associated MRSA are those strains predominantly affecting humans, while they generally do not involve food-producing animals; however, livestock-associated MRSA may also be harboured by humans, especially where there is occupational contact with affected livestock. Livestock-associated MRSA may cause illness in humans, although transmissibility between humans has been shown to be very limited, even in healthcare facilities.
Antimicrobial susceptibility in European invasive Staphylococcus aureus isolates is reported by the Member States (MSs) to the European Antimicrobial Resistance Surveillance Network (EARS-Net) (ECDC, 2013). Molecular typing data are not reported and, thus, where there may be possible links to the animal reservoir, these cannot be detected easily with current monitoring procedures, at least at the European level. Recent EARS-Net data showed decreasing or stabilising percentages of MRSA in reported invasive S. aureus isolates (both healthcare and community associated) in most European countries, which might reflect the beneficial impact of improved infection control routines implemented in several countries. However, MRSA remains a human public health priority, as the percentage of MRSA remains above 25 % in 7 out of 30 countries, mainly in Eastern and Southern Europe (ECDC, 2013).
Molecular typing techniques, such as spa-typing and multi-locus sequence typing (MLST), are commonly used in S. aureus to sub-type strains and determine lineages. In spa-typing, different genetic types or strains of MRSA are designated by a number with the prefix t, while in MLST, strains are designated by a sequence type (ST) number. Using such typing results, often in conjunction with certain other virulence and antimicrobial resistance characteristics, it is possible to sub-divide strains of MRSA into groups characterised by differing epidemiology. These techniques are of particular relevance, for instance, in the investigation of outbreaks, such as in the clinical case of hospital-associated MRSA, in transmission events, for example of livestock-associated MRSA, and in the detection of emerging strains showing new and/or multiple resistance patterns.
Pigs are acknowledged as an important source of colonisation of a particular strain of MRSA (designated ST398-multi-locus sequence type 398) for pig farmers and veterinarians, and their families, through direct or indirect contact with pigs. In some countries, other livestock (for example poultry and veal calves) have also become colonised. This recently recognised strain, MRSA ST398, which appears to be primarily acquired by occupational exposure to colonised pigs (or other colonised farmed livestock), can, on occasion, cause infections in humans and can be introduced into healthcare settings. In order to increase awareness and to assess the occurrence of MRSA in pig primary production across the EU, the occurrence and diversity of MRSA and MRSA ST398 in pig holdings in MSs were assessed through an EU-wide baseline survey (EFSA, 2009b, 2010a).

EU summary report on antimicrobial resistance in zoonotic and indicator bacteriafrom humans, animals and food 2012
EFSA Journal 2014;12(3):3590 204
6.2. Methicillin-resistant Staphylococcus aureus - reports from individual MSs
Livestock-associated MRSA isolates are the principal focus of this chapter, which summarises the prevalence of MRSA results in various food-producing animal species and food reported by MSs to EFSA in 2012. The chapter also includes prevalence data on companion animals reported by an increasing number of MSs compared with 2011. Ten MSs - Belgium (cattle), Finland (pigs), Germany (cattle, turkeys and food), Hungary (cattle, Gallus gallus, geese, goats, pigs, sheep and turkeys), Ireland (dogs), the Netherlands (birds, cats, cattle, dogs, goats, pigs, sheep and solipeds), Poland (food), Slovakia (cats, cattle, chinchillas, dogs, Gallus gallus, goats, pigs and sheep), Slovenia (food) and Spain (food) - and one non-MS, Switzerland (pigs), submitted data on MRSA prevalence in animals and food in their national zoonoses reports for 2012 (Table MRSA1). The methods for the isolation of MRSA from animals and food to date have not been harmonised at the EU level and, therefore, the methods used by individual reporting MSs may differ in sensitivity.
In addition, data on antimicrobial resistance of MRSA isolates and Staphylococcus aureus from food-producing animals were reported by only two countries in 2012.
Table MRSA1. Overview of countries reporting data on MRSA in animals and food in 2012
Data Origin Total number of MSs reporting Countries
Animals
Companion animals: cats and dogs 3 MSs: IE, NL, SK Cattle (bovine animals) 5 MSs: BE, DE, HU, NL, SK Sheep and goats 3 MSs: HU, NL, SK
Pigs 4 MSs: FI, HU, NL, SK Non-MS: CH
Poultry: Gallus gallus (fowl), geese and turkeys 3 MSs: DE, HU, SK Solipeds, domestic 1 MS: NL Other animals: birds and chinchillas 2 MSs: NL, SK
Food
Cheeses, dairy products and milk 3 MSs: DE, ES, PL Fish, fishery products and crustaceans 1 MS: PL Fruits 1 MS: ES Meat 3 MSs: DE, ES, SI Other food 1 MS: DE
Note: For abbreviations of Member States (MS) and other reporting countries see Appendix 7. MRSA: Methicillin-resistant Staphylococcus aureus.
6.2.1. Methicillin-resistant Staphylococcus aureus in food
In 2012, four MSs - Germany, Poland, Slovenia and Spain - reported information on the occurrence of MRSA in various categories of food, as summarised in Table MRSA2. Germany investigated a wide range of meat from turkeys and bovine animals for MRSA. Poland examined samples of raw fish and raw cows’ milk for the presence of MRSA. Slovenia investigated 74 samples of meat from pigs, among which 14 samples tested positive for MRSA. Spain examined a range of food products for MRSA and the positive isolates were obtained from fruits (two isolates: 1.8 %), meat from broilers (25 isolates: 12.4 %) and meat from pigs (one isolate: 0.8 %). The corresponding spa-typing data were not available from those reporting MSs, positive isolates being reported of unspecified spa-type.
Generally, meat from several different sources proved positive for MRSA, including meat from poultry, pigs and cattle. Certain types of poultry meat tested positive for MRSA most frequently, reaching a prevalence greater than 60 % in turkey meat, exceeding that observed in the other kinds of meat tested (beef and pork).

EU summary report on antimicrobial resistance in zoonotic and indicator bacteriafrom humans, animals and food 2012
EFSA Journal 2014;12(3):3590 205
Table MRSA2. MRSA in food, 2012
Food species/ country Description Sample
unit Number of units tested
Number (%) positive for
MRSA Meat from broilers (Gallus gallus)
Spain Meat preparation Single 201 25 (12.4) Meat from turkeys
Germany Carcase, at slaughterhouse1, monitoring Slaughter
Batch 353 242 (68.6)
Fresh, at retail, monitoring Single 749 282 (37.7) Spain Minced meat/meat products/meat preparation2 Single 11 0
Meat from pigs Slovenia Fresh, at cutting plant, monitoring Single 74 14 (18.9) Spain Fresh/minced meat/meat products3 Single 122 1 (0.8)
Meat from bovine animals
Germany Carcase, at slaughterhouse, monitoring Single 312 96 (30.8) At retail, monitoring Single 421 44 (10.5)
Milk, cows'
Poland Raw milk for manufacture-intended for manufacture of Raw or low heat-treated products, monitoring Single 12 1 (8.3)
Milk, goats'
Spain Raw milk for manufacture, at processing plant, Monitoring Single 5 0
Fish Poland Raw, at processing plant Single 100 4 (4.0)
Fruits Spain Pre-cut and ready-to-eat, at retail, monitoring Single 109 2 (1.8)
MRSA: Methicillin-resistant Staphylococcus aureus. 1. Sample type: neck skin. 2. Meat preparation (N=6, n=0); minced meat (N=1, n=0); meat products (N=4, n=0). 3. Fresh (N=60, n=1); minced meat (N=3, n=0); meat products (N=59, n=0).

EU summary report on antimicrobial resistance in zoonotic and indicator bacteriafrom humans, animals and food 2012
EFSA Journal 2014;12(3):3590 206
6.2.2. Methicillin-resistant Staphylococcus aureus in animals
6.2.2.1. Monitoring MRSA in food-producing animals
Belgium, Germany, Finland, the Netherlands and Switzerland reported information on the prevalence of MRSA in food-producing animals and/or their immediate environment within a monitoring, surveillance or unspecified sampling context. The results are summarised in Table MRSA3.
Regarding the monitoring approaches, in Finland, a national prevalence survey was performed in the 68 pig breeding holdings with a specific pathogen-free status through nasal swabbing of 60 randomly selected animals, per holding, and boot swabbing of every unit of the holding between October 2011 and March 2013. In Switzerland, the monitoring of MRSA in pigs was based on random sampling of 397 healthy slaughter pig carcases in the slaughter plants accounting for 85 % of the total pig production in the country. The sampling plan was stratified proportionally to the annual production of the slaughterhouse and evenly distributed over the year to address any seasonal effect.
MRSA prevalence in fattening pigs in Switzerland was comparatively moderate at 18.1 % (72 isolates from 397 samples tested), while in Finland MRSA was not detected in either boot swabs or nasal swabs collected at farms in national monitoring. Of particular note was the extremely high MRSA prevalence recorded in the Netherlands in slaughter pigs (99.0 %) and cattle (79.0 %), both sampled at the slaughterhouse by nasal swabbing in 2012. Germany reported a high prevalence (45.0 %) in calves under one year of age sampled at slaughter, while, considering the same animal population sampled on the farm by means of environmental dust sampling, the prevalence of positive herds was 19.2 %. A flock prevalence of 12.8 % was also recorded in fattening flocks of turkeys in Germany. Belgium also reported a high prevalence (47.1 %) in calves under one year of age sampled at the slaughterhouse, while the prevalences in herds of calves under one year sampled on the farm and in dairy cows were of the same magnitude (10.2 % and 9.9 %, respectively).
A number of different spa-types were reported (Table MRSA3, shown as footnotes). The majority of isolates from pigs in Switzerland were spa-type t034, with lower numbers of t011; both of these spa-types are associated with MRSA CC398 and accounted for 97 % (70 out of 72) of the MRSA isolates from fattening pigs in Switzerland, with the remaining MRSA isolates belonging to spa-type t208, which is associated with ST49. Belgium provided spa-type data for MRSA isolates from calves less than one year old on the farm and at the slaughterhouse, as well as from adult dairy cattle on farms. Spa-type t011 was predominant in samples from calves as well as in adult dairy cows and is associated with ST398. The other spa-types reported from Belgian cattle were present in much lower numbers and of these, t1456 and t1451 were both detected in the baseline survey of breeding pigs (EFSA, 2009b) and are associated with CC398 and related to t011. Spa-types t1985, t3423 and t6228 are also all associated with CC398 but were not detected in the baseline survey of breeding pigs. Spa-type t121 is associated with MLST ST8, while t037 and t388 are associated with ST239 and both of these MRSA sequence types (ST8 and ST239) are considered to be hospital-associated strains of MRSA. t037 ST239 was also recovered from Belgian poultry in 2011 (Butaye and Nemeghaire, 2012).

EU summary report on antimicrobial resistance in zoonotic and indicator bacteriafrom humans, animals and food 2012
EFSA Journal 2014;12(3):3590 207
Table MRSA3. MRSA in food-producing animals (excluding clinical investigations), 2012
Animal species/ country
Production type/description Sample unit
Number of units tested
Number (%) positive for
MRSA Turkeys
Germany Breeding flocks, unspecified, at farm, dust, monitoring Flock 16 0
Meat production flocks, at farm, dust, monitoring Flock 235 30 (12.8)Pigs
Finland
Breeding animals, at farm, boot swabs, survey - national survey Holding 68 0
Breeding animals, at farm, nasal swabs, survey - national survey Holding 68 0
Netherlands At slaughterhouse, nasal swabs, monitoring Herd1 104 103 (99.0)
Switzerland2 Fattening pigs, at slaughterhouse, nasal swabs, monitoring Animal 397 72 (18.1)
Cattle (bovine animals)
Belgium
Calves (under 1 year), at farm, nasal swabs3 Herd 187 19 (10.2)Calves (under 1 year), at slaughterhouse, nasal swabs4
Slaughter batch 104 49 (47.1)
Dairy cows, at farm, nasal swabs, monitoring5 Animal 141 14 (9.9)
Germany Calves (under 1 year), at farm, dust, monitoring Herd 240 46 (19.2)Calves (under 1 year), at slaughterhouse, nasal swabs, monitoring Animal 320 144 (45.0)
Netherlands At slaughterhouse, nasal swabs, monitoring Herd1 100 79 (79.0)Goats
Netherlands At farm, monitoring Animal 221 0Sheep
Netherlands At farm, monitoring Animal 467 0MRSA: Methicillin-resistant Staphylococcus aureus. 1. 10 animals per herd. 2. 61 and 9 isolates were of the spa-types t034 and t011, respectively, which belonged to CC398 and 2 of the spa-type t208 (ST49). 3. Isolates belonged to the spa-types t011 (16), t1456 (1), t121 (1) and t1985 (1). 4. Isolates belonged to the spa-types t011 (40), t1456 (1), t1451 (3), t1985 (3), t3423 (1) and one was not typed. 5. Isolates belonged to the spa-types t011 (8), t1456 (1), t6228 (2), t037 (1), t388 (1) and one was not typed.

EU summary report on antimicrobial resistance in zoonotic and indicator bacteriafrom humans, animals and food 2012
EFSA Journal 2014;12(3):3590 208
6.2.2.2. Clinical investigations for MRSA in food-producing animals
Clinical investigations often differ from monitoring data in food-producing animals or meat in that selective culture methods may not be used, the number of units tested may be low and the sample may involve a biased sample population. These data are not prevalence data and cannot be extrapolated at the population/group level. However, the results were nevertheless presented in this report, because it is considered important to report the range of animals/animal populations which can be affected.
In 2012, three MSs (Hungary, the Netherlands and Slovakia) reported information on results of clinical investigations for MRSA in different kinds of food-producing animals, which tested, most frequently, negative (Table MRSA4). Only the Netherlands reported six positive for MRSA (out of 11 samples tested) in a clinical investigation context in pigs.
Table MRSA4. MRSA in food-producing animals, clinical investigations, 2012
Animal species/ country
Production type/description Sample unit
Number of units
tested
Number (%) positive for
MRSA Gallus gallus (fowl)
Hungary At farm Flock 24 0 Slovakia Broilers day-old chicks, at farm, organ/tissue animal 3 0
Turkeys Hungary At farm Flock 7 0
Geese Hungary At farm Flock 13 0
Pigs Hungary At farm Holding 11 0 Netherlands – Animal 11 6 (54.5) Slovakia Fattening pigs, at farm Animal 7 0
Cattle (bovine animals) Hungary At farm Herd 39 0 Netherlands – Animal 11 0
Slovakia Calves (under 1 year), at farm Animal 3 0 Dairy cows, at farm, milk Animal 130 0
Goats Hungary At farm Herd 2 0 Netherlands – Animal 14 0 Slovakia Animals over 1 year, at farm, milk Animal 6 0
Sheep Hungary At farm Herd 2 0 Netherlands – Animal 1 0 Slovakia Milk ewes, at farm, milk Animal 2 0
MRSA: Methicillin-resistant Staphylococcus aureus.
6.2.2.3. Clinical investigations for MRSA in companion animals
Three MSs reported data on MRSA in companion animals compared with one in 2011 (Table MRSA5). Ireland, the Netherlands and Slovakia reported MRSA data from samples taken from pets and horses. In all of these cases, the bacteria were isolated from clinical specimens sent for routine bacteriology. MRSA was confirmed in 14 horses, 10 dogs and 3 cats in the Netherlands and in 1 dog in Ireland, in 2012. The corresponding spa-typing data were not available.

EU summary report on antimicrobial resistance in zoonotic and indicator bacteriafrom humans, animals and food 2012
EFSA Journal 2014;12(3):3590 209
Table MRSA5. MRSA in companion animals, clinical investigations, 2012
Animal species/ country
Production type/description Sample unit
Number of units tested
Number (%) positive for
MRSA Cats
Netherlands Pet animals Animal 32 3 (9.4) Slovakia Pet animals Animal 8 0
Dogs Ireland At farm Animal 92 1 (1.1) Netherlands Pet animals Animal 63 10 (15.9)
Slovakia Pet animals, faeces Animal 5 0 Pet animals, organ/tissue Animal 2 0 Pet animals Animal 133 0
Solipeds, domestic Netherlands Horses Animal 48 14 (29.2)
MRSA: Methicillin-resistant Staphylococcus aureus.
6.2.2.4. Temporal trends in the occurrence of MRSA
Although methodological differences may occur between reporting countries, where repeat studies were performed in countries the same methods were usually employed. This was, for example, the case in Switzerland where a pre-enrichment in Mueller-Hinton broth, supplemented with 6.5 % salt, followed by culture through selective broth, containing cefoxitin and aztreonam, and final plating onto an MRSA-selective agar, were typically performed.
Germany reported annual results on the occurrence of MRSA in calves, at the herd/farm level, in 2010 and 2012 and, in both years, similar moderate levels of prevalence were registered at 19.6 % (of 296 samples tested) and 19.2 % (of 240 samples tested), respectively (Table MRSA6). Germany also reported results on the occurrence of MRSA in fattening turkeys for meat production, at the flock level, in 2010 and 2012, and the prevalence reported was moderate in both years (19.6 % in 2010 and 12.8 % in 2012). No data on the genotypes of the strains of MRSA isolated were reported to EFSA.
The Netherlands also monitored, consistently, the prevalence of MRSA in goats and sheep over the period 2011 to 2012. Interestingly, out of around 200 samples tested in goats and the 450 samples tested in sheep in 2012, none of them tested positive.
Switzerland reported results on the yearly prevalence of MRSA in fattening pigs over the period 2009 to 2012. Prevalence had significantly increased in 2012 compared with the previous years, when it was low: from 2.2 % in 2009, the prevalence increased threefold in 2010 and 2011 (5.9 % and 5.6 %, respectively) and reached 18.1 % in 2012. The marked increase is primarily the result of the diffusion of clones of spa-types t034 and t011, both belonging to the clonal complex CC398, within the Swiss population of fattening pigs. Switzerland also noted the continuing presence of ST49 t208 at a much lower frequency in pigs in 2012. Switzerland was the first country to describe the presence of this previously undescribed clonal lineage of MRSA in pigs (Overesch et al., 2011), suggesting that selection may have occurred within the Swiss pig population. Evidence to support the fact that MRSA ST49 t208 may have emerged in pigs in Switzerland includes the observation that methicillin-susceptible S. aureus (MSSA), belonging to spa-type t208, had previously been described in Switzerland in pigs. However, occurrence data for the years 2011 and 2012 suggest that ST49 strains did not show a spread, similar to CC398 strains, in the sampled population over the same period. This spa-type is otherwise rarely recorded in Europe, having been described in only one human infection in the United Kingdom and in three cases of skin infection and laryngeal ulceration in wild squirrels (Overesch et al., 2011).

EU summary report on antimicrobial resistance in zoonotic and indicator bacteriafrom humans, animals and food 2012
EFSA Journal 2014;12(3):3590 210
Table MRSA6. Temporal occurrence of MRSA in animals
Country Year Production type/description Sample unit Number of units tested
Number (%) positive for
MRSA
Germany 2010 Cattle (bovine animals), calves (under
1 year), at farm, monitoring Herd 296 58 (19.6)
2012 Cattle (bovine animals), calves (under 1 year), at farm, monitoring Herd 240 46 (19.2)
Germany 2010 Turkeys, meat production flocks, at
farm, dust, monitoring Flock 112 22 (19.6)
2012 Turkeys, meat production flocks, at farm, dust, monitoring Flock 235 30 (12.8)
Netherlands 2011 Goats, at farm, monitoring Animal 214 0 2012 Goats, at farm, monitoring Animal 221 0
Netherlands 2011 Sheep, at farm, monitoring Animal 564 0 2012 Sheep, at farm, monitoring Animal 467 0
Switzerland
2009 Fattening pigs, at slaughter, nasal swabs Animal 405 8 (2.2)1
2010 Fattening pigs, at slaughter, nasal swabs Animal 392 23 (5.9)2
2011 Fattening pigs, at slaughterhouse, nasal swabs, monitoring Animal 392 22 (5.6)3
2012 Fattening pigs, at slaughterhouse, nasal swabs, monitoring Animal 397 72 (18.1)4
MRSA: Methicillin-resistant Staphylococcus aureus. 1. In 2009, isolates were reported as unspecified genotypes. 2. In 2010, 17 isolates were of genotype ST398-t034-V, one was of genotype ST398-t011-V and five were of genotype ST49-t208-V. 3. In 2011, 19 isolates were of genotype ST398-t034-V, one was of genotype ST398-t011-V, one was of genotype ST49-t208-V and
one was of genotype ST1-t2279-IVc. 4. In 2012, 61 isolates belonged to genotype CC398-t034, nine belonged to genotype CC398-t011 and two belonged to genotype
ST49-t208.
6.2.3. Susceptibility testing of methicillin-resistant Staphylococcus aureus isolates
In 2012, data on the susceptibility of MRSA and S. aureus isolates were reported only by Belgium and Switzerland. Both countries used a broth dilution method and EUCAST ECOFFs to determine the susceptibility of isolates to cefotoxin, chloramphenicol, ciprofloxacin, clindamycin, erythromycin, fusidic acid, gentamicin, kanamycin, linezolid, mupirocin, quinupristin/dalfopristin, sulfamethoxazole, tetracyclines, tiamulin and vancomycin. All of the 78 MRSA strains isolated from cattle in Belgium and the 72 MRSA isolates from pigs in Switzerland were resistant to cefoxitin, as expected (data not shown).
6.2.3.1. MRSA isolates from cattle
Considering the susceptibility of MRSA isolates from cattle reported by Belgium, 3 isolates belonged to spa-type t1456 (CC398), 3 isolates belonged to spa-type t1451 (CC398) and 64 isolates belonged to spa-type t011 (CC398). For the remaining eight isolates tested in 2012, no spa-typing data were available.
Among MRSA isolates (N=78) from different types of cattle (dairy cows, meat production animals, young cattle (one to two years)) in Belgium tested in 2012, with the exception of resistance to vancomycin, resistance was detected for all antimicrobials tested (Table MRSA7). Resistance was reported at extremely high levels for tetracycline (96.2 % resistant), clindamycin and erythromycin (88.5 % resistant), kanamycin (82.1 % resistant), gentamicin (78.2 % resistant); at high levels for ciprofloxacin (42.3 % resistant), fusidic acid (28.2 % resistant), quinupristin/dalfopristin and sulfamethoxazole (24.4 % resistant); at moderate levels for tiamulin (17.9 % resistant), chloramphenicol (12.8 % resistant) and mupirocin (11.5 % resistant); and at low levels for linezolid (1.3 % resistant).

EU summary report on antimicrobial resistance in zoonotic and indicator bacteriafrom humans, animals and food 2012
EFSA Journal 2014;12(3):3590 211
6.2.3.2. MRSA isolates from fattening pigs
Considering the susceptibility of MRSA isolates from fattening pigs reported by Switzerland, 2 isolates belonged to the genotype spa-type t208 (ST49), 9 isolates belonged to spa-type t011 (CC398) and 61 isolates belonged to spa-type t034 (CC398). Thirty-four isolates belonging to the most commonly detected genotype CC 398-t034 shared an identical resistance profile. These showed resistance to beta-lactams, tetracyclines, macrolides, lincosamides, trimethoprim, pleuromutilins, streptomycin and quinupristin/dalfopristin. Twenty-one additional isolates were resistant to all these antimicrobials except for streptomycin, whereas two isolates had additional resistance to all tested aminoglycosides.
Among MRSA isolates (N=72) from pigs in Switzerland, no resistance was detected to chloramphenicol, fusidic acid, linezolid and vancomycin (Table MRSA7). Resistance was reported at extremely high levels to tetracycline (100 % resistant), clindamycin and erythromycin (90.3 % resistant), tiamulin (86.1 % resistant) and quinupristin/dalfopristin (84.7 % resistant), and at low levels for gentamicin and kanamycin (6.9 % resistant), ciprofloxacin (4.2 % resistant), sulfamethoxazole (2.8 % resistant) and mupirocin (1.4 % resistant).
Thirty-four isolates, belonging to the most commonly detected genotype CC 398-t034, in fattening pigs in Switzerland shared an identical resistance profile exhibiting resistance to beta-lactams, tetracyclines, macrolides, lincosamides, trimethoprim, pleuromutilins, streptomycin and quinupristin/dalfopristin. Genes conferring multiple antibiotic resistance have been detected in MRSA ST398 isolates, such as vga genes conferring resistance to pleuromutilins, streptogramin A and lincosamides (Hauschild et al., 2012) and the cfr gene providing resistance to pleuromutilins, streptogramin A, lincosamides, phenicols and oxazolidinones (Kehrenberg et al., 2009). Only a single MRSA isolate from Belgian cattle was resistant to linezolid, suggesting that cfr genes, if present, were rare in this population. The genes vga(A) and vga(C) confer resistance to the lincosamide clindamycin but not to the macrolide erythromycin (Kadlec et al., 2010); however, resistance to the lincosamide clindamycin and the macrolide erythromycin occurred at the same level in both Swiss pigs and Belgian cattle, perhaps suggesting that erm genes may be responsible and that they are constitutively expressed. Indeed, erm genes were frequently detected in bovine MRSA CC398 isolates in a recent Belgian study (Vandendriessche et al., 2013). Tetracycline resistance is common in MRSA CC398 (De Neeling et al., 2007). Considering the aminoglycosides gentamicin and kanamycin, there are differences in the occurrence of resistance in Swiss pigs and Belgian cattle, which may reflect the exposure of these different animal species to antimicrobials. Resistance to ciprofloxacin and fusidic acid can arise by mutation and again differences in the occurrence of resistance are evident in cattle and pigs in the different countries. Studies in Belgium have also detected differences in the occurrence of resistance in MRSA isolates from veal calves and pigs, with the levels of resistance proving higher in veal calves (Vandendriessche et al., 2013). Vancomycin is one of the antimicrobials of last resort for treating S. aureus infections in humans and resistance to this antimicrobial is currently infrequent. None of the isolates from cattle and pigs, tested for susceptibility, was resistant to vancomycin.

EU summary report on antimicrobial resistance in zoonotic and indicator bacteriafrom humans, animals and food 2012
EFSA Journal 2014;12(3):3590 212
Table MRSA7. Resistance (%) to chloramphenicol, ciprofloxacin, clindamycin, erythromycin, fusidic acid, gentamicin, kanamycin, linezolid, mupirocin, quinupristin/dalfopristin, sulfamethoxazole, tetracyclines, tiamulin and vancomycin among MRSA from food and animals in countries reporting MIC data in 2012, using harmonised epidemiological cut-off values
Country Chloramphenicol Ciprofloxacin Clindamycin Erythromycin Fusidic acid
N % Res N % Res N % Res N % Res N % Res Cattle (bovine animals)
Belgium 78 12.8 78 42.3 78 88.5 78 88.5 78 28.2 Pigs
Switzerland 72 0 72 4.2 72 90.3 72 90.3 72 0
Country Gentamicin Kanamycin Linezolid Mupirocin Quinupristin/
Dalfopristin N % Res N % Res N % Res N % Res N % Res
Cattle (bovine animals) Belgium 78 78.2 78 82.1 78 1.3 78 11.5 78 24.4
Pigs Switzerland 72 6.9 72 6.9 72 0 72 1.4 72 84.7
Country Sulfamethoxazole Tetracyclines Tiamulin Vancomycin
N % Res N % Res N % Res N % Res Cattle (bovine animals)
Belgium 78 24.4 78 96.2 78 17.9 78 0 Pigs
Switzerland 72 2.8 72 100 72 86.1 72 0 MRSA: Methicillin-resistant Staphylococcus aureus; MIC: minimum inhibitory concentration; N: number of isolates tested; % Res: percentage of resistant isolates. Note: All MRSA isolates tested were also resistant to cefoxitin, as expected.

EU summary report on antimicrobial resistance in zoonotic and indicator bacteriafrom humans, animals and food 2012
EFSA Journal 2014;12(3):3590 213
6.3. Discussion
Although food is not currently considered to be a relevant source of MRSA infection or colonisation of humans (EFSA, 2009c), the monitoring of MRSA in various food products performed in several MSs consistently indicates that MRSA can be detected, quite frequently, in different types of food. In situations where livestock are colonised by MRSA, meat or raw milk produced from these animals may also on occasion be contaminated with MRSA, as generally shown by the monitoring results. The detection of MRSA in low numbers of samples of raw fish (Poland) and fruit (Spain) may also possibly indicate contamination from colonised workers preparing such food. Nevertheless, it is of note that the laboratory techniques used to detect MRSA employ selective bacterial culture and, therefore, low levels of contamination can be detected. In each case, molecular typing would be very useful in investigating the strains of MRSA involved, which might assist in interpreting the findings and unravelling the epidemiology.
Where data are available in classes of animals tested both on the farm and at slaughter, comparison of the proportion of MRSA-positive animals generally reveals a higher prevalence when animals are tested at slaughter compared with animals tested on farms. This may reflect either cross-colonisation of animals during transport to abattoirs (or while in temporary lairage pens at the slaughterhouse) or acquisition of the organism from various sources encountered during transport and lairage (pens, human contact, vehicles and so forth). It is therefore of note that the high prevalence of MRSA in pigs (99.0 %) and in cattle (79.0 %) in the Netherlands was assessed at slaughter.
Livestock-associated (LA)-MRSA is considered a poor coloniser of humans and occurs uncommonly in persons without contact with livestock (Graveland et al., 2010). However, considering those people who do have contact with livestock, recent research has shown that livestock veterinarians can carry MRSA CC398 for prolonged periods (Verkade et al., 2013), while studies of pig farmers and their household members (Garcia-Graells et al., 2013) showed that the risk of acquisition of MRSA by household members was strongly dependent on their exposure to pigs on the farm. Similar findings have been reported in relation to fattening turkeys and persons living on fattening turkey farms in Germany, where people with frequent access to the turkey accommodation were found to be more likely to carry MRSA (Richter et al., 2012). An increased risk of MRSA carriage has also been reported in personnel working at broiler slaughterhouses, especially where personnel have direct contact with live birds (Mulders et al., 2010). The technique of whole-genome mapping has recently been used in the Netherlands to show that veterinarians can carry and transmit different LA-MRSA strains at the same time (Bosch et al., 2013). LA-MRSA is not generally considered to spread via food and the selective techniques used for isolation mean that low levels of contamination can be identified. The public health risk posed by LA-MRSA has been assessed to be of minor importance as long as the occurrence of strains with acquired toxin genes remains very uncommon (Vandendriessche et al., 2013).
Two MSs reported spa-type data for MRSA isolates from food-producing animals and the results from Belgium for cattle were interesting in that spa-types t121 (associated with MLST ST8) and t037 and t388 (associated with ST239) are considered to be hospital-associated strains of MRSA. t037 ST239 was also recovered from Belgian poultry in 2011 (Butaye and Nemeghaire, 2012). The occurrence of ST239 in different food-producing animals in different years indicates that this is a further strain of MRSA able to colonise different animal species and reinforces the value of such ongoing surveillance.
EFSA TEHNICAL SPECIFICATION ON HARMONISED MONITORING OF MRSA
In 2012, EFSA published a Scientific Report describing technical specifications for the harmonised monitoring and reporting of antimicrobial resistance in methicillin-susceptible Staphylococcus aureus (MRSA) in food-producing animals and food (EFSA, 2012c). The technical specifications should enable collection of harmonised data from Member States on both the degree on which food-producing animals (and food produced from them) are colonised with MRSA, and the strains of MRSA involved. A new definition of MRSA includes those strains harbouring the mecC gene and the laboratory methods adapted accordingly, so that those strains can be also targeted by the harmonised routine monitoring. The situation with regard to MRSA and some food-producing animal species has changed substantially over the last decade; therefore, the proposed monitoring aims to provide a means to detect, without undue delay, further developments which may occur, in particular regarding the possible emergence of MRSA strains displaying particular virulence or resistance patterns and/or their potential transfer and diffusion between human and animal populations. Ongoing evolution and development of the situation relating to MRSA in food-producing animals may be exemplified by the recent description of MRSA ST49 in pigs in Switzerland (Overesch et al., 2011).

EU summary report on antimicrobial resistance in zoonotic and indicator bacteriafrom humans, animals and food 2012
EFSA Journal 2014;12(3):3590 214
7. THIRD-GENERATION CEPHALOSPORIN RESISTANCE IN ESCHERICHIA COLI AND SALMONELLA
7.1. Introduction
RESISTANCE TO THIRD-GENERATION CEPHALOSPORINS: THE IMPORTANCE OF ESBLS AND AMPC ENZYMES
Extended-spectrum beta-lactamases (ESBLs) are considered to be an important emerging issue in Gram-negative bacteria of public health significance. Bacteria which possess ESBL resistance are usually resistant to third-generation cephalosporins, which are critically important antibiotic drugs for the treatment of systemic or invasive Gram-negative bacterial infections in humans. These drugs play a critical role in the treatment of certain invasive Salmonella infections, particularly in children, in whom the use of fluoroquinolones may not be favoured because of certain potential adverse effects. A low level of resistance in Salmonella may therefore still constitute an important finding. Commensal bacteria, such as indicator Escherichia coli, may contribute to the dissemination of ESBL resistance because such resistance is usually transferable.
Salmonella and E. coli may become resistant to third-generation cephalosporins by several different mechanisms. Among these different mechanisms, the most common is the acquisition of beta-lactamase enzymes on plasmids (small covalently closed circles of DNA which can be transferred between bacteria during bacterial conjugation). There are several different types of beta-lactamase which can confer resistance to third-generation cephalosporins. These are conveniently sub-divided into four classes, designated A to D: ESBL enzymes of the TEM, SHV and CTX-M families belong to class A, while class C includes the AmpC beta-lactamases.
Wild-type Salmonella isolates never possess a beta-lactamase of any class. For beta-lactamases to occur in Salmonella, acquisition must generally have occurred by conjugation, usually with other Enterobacteriaceae through transfer of plasmids. Although all four different types of beta-lactamase classes have been described in Salmonella globally, within the EU, the most important types of beta-lactamase resistance acquired by Salmonella are primarily ESBL resistance and, secondly, AmpC resistance. E. coli can acquire beta-lactamases from other bacteria in a similar fashion to Salmonella but, since it also possesses an endogenous AmpC beta-lactamase, in some circumstances this can be activated, conferring resistance to third-generation cephalosporins.
The position has been further complicated in recent years by the emergence of resistance to carbapenems in human medicine. Carbapenems are used for the treatment of highly resistant infections in humans, including, for example, the treatment of infections with Gram-negative bacteria which possess ESBL enzymes. These compounds are not used in food-producing animals anywhere within the EU. Resistance to carbapenems in Gram-negative bacteria is usually related to the acquisition of carbapenemase enzymes and a number of different types are recognised. Although carbapenem antimicrobials are not used in food-producing animals in the EU, resistance has occasionally been detected in bacteria carried by animals (Woodford et al., 2013) and dissemination from humans to animals directly or through environmental routes is suspected. In view of the great importance of the carbapenem compounds, they have been added to the panels of antimicrobials recommended for testing by Member States to improve surveillance for resistance (EFSA, 2012b).
EU summary report on antimicrobial resistance in zoonotic and indicator bacteriafrom humans, animals and food 2012
EFSA Journal 2014;12(3):3590 215
The EFSA guidelines for monitoring resistance in indicator E. coli (EFSA, 2008) state that cefotaxime is a good substrate for what are currently the most common and important ESBLs in humans in Europe, the CTX-M enzymes, which can therefore be used as an indicator for ESBL resistance. ECOFFs for Salmonella and E. coli for the antimicrobial cefotaxime facilitate detection of CTX-M ESBLs, but resistance to cefotaxime may, of course, be conferred by mechanisms of resistance other than ESBLs, such as certain other types of beta-lactamases, including AmpC beta-lactamases. In this chapter, the occurrence of resistance is given, where available, for both cefotaxime and ceftazidime. As very few MSs reported data on resistance to ceftiofur, and because this compound is not considered optimal for the detection of ESBL enzymes, results for ceftiofur are not included in this chapter. Furthermore, because this report covers only phenotypic monitoring, it is not possible to determine the class or exact type of beta-lactamase enzyme which is responsible for conferring the resistance detected to third-generation cephalosporins.
The monitoring reported here and performed in accordance with EFSA’s guidelines (EFSA, 2008), does not utilise selective primary isolation media containing cephalosporins so the results generally relate to organisms chosen effectively at random from primary culture media. In certain types of monitoring, selective media containing cephalosporins may be used to investigate the presence or absence of cephalosporin-resistant organisms in a particular sample (within the limit of detection) and, in that case, a different type of result would be obtained from such monitoring, which has a greater sensitivity. Ideally, the establishment of optimum phenotypic testing systems for sensitive, specific and rapid detection of ESBLs would be a very important component of antimicrobial resistance monitoring programmes. Recommendations for such monitoring recently developed by EFSA (EFSA, 2012b) notably put forward further testing of isolates which are resistant to third-generation cephalosporins, including testing to establish whether isolates have an ESBL- or AmpC-producing phenotype.
7.2. Third-generation cephalosporin resistance in Salmonella isolates from animals and food
7.2.1. Third-generation cephalosporin resistance in Salmonella isolates from food
In 2012, the results of testing for resistance to third-generation cephalosporins in Salmonella spp. isolates recovered from meat from broilers, meat from pigs and meat from bovine animals were reported by 11, 12 and 4 MSs, respectively (Table ESBL1). In most reporting MSs, resistance was either not detected or reported at low levels in the three kinds of meat. Resistance to cefotaxime was typically equal or similar to that observed to ceftazidime at the MS level. Considering all MSs, the apparent difference in resistance to each compound in meat from broilers largely reflects differences in the number of sensitive isolates contributing to the denominator.

EU summary report on antimicrobial resistance in zoonotic and indicator bacteriafrom humans, animals and food 2012
EFSA Journal 2014;12(3):3590 216
Table ESBL1. Resistance (%) to cefotaxime and ceftazidime in Salmonella spp. isolates from meat from broilers, pigs and bovine animals tested by MSs in 2012
Country Cefotaxime Ceftazidime
N % Res N % Res Meat from broilers
Belgium 109 0 109 0 Czech Republic 47 0 47 0 Germany 94 12.8 94 11.7 Hungary 168 0.6 – – Ireland 70 2.9 70 2.9 Latvia 32 0 – – Netherlands 74 31.1 74 29.7 Poland 93 0 93 0 Portugal 37 0 – – Romania 189 1.1 – – Slovakia 14 0 14 0 Total (11 and 7 MSs) 927 4.3 501 7.0
Meat from pigs Belgium 262 1.5 262 1.5 Czech Republic 33 3.0 33 3.0 Denmark 41 0 – – Estonia 22 0 22 0 Germany 163 0.6 163 0.6 Hungary 16 0 – – Ireland 69 0 69 0 Italy 85 0 85 0 Latvia 13 0 – – Netherlands 52 0 52 0 Poland 22 0 20 0 Romania 125 1.6 – – Total (12 and 8 MSs) 903 0.9 706 0.8
Meat from bovine animals Germany 16 0 16 0 Ireland 24 0 24 0 Italy 13 0 13 0 Netherlands 18 5.6 18 5.6 Total (4 MSs) 71 1.4 71 1.4
MS: Member State; N: number of isolates tested; % Res: percentage of resistant isolates; –: no data reported.

EU summary report on antimicrobial resistance in zoonotic and indicator bacteriafrom humans, animals and food 2012
EFSA Journal 2014;12(3):3590 217
Similar observations of resistance to cefotaxime or ceftazidime generally not detected or reported at low levels may be made in S. Enteritidis from meat from broilers (Table ESBL2) and in S. Typhimurium isolates and monophasic S. Typhimurium isolates from meat from pigs (Tables ESBL3 and ESBL4). Exceptions to this are resistance to cefotaxime and ceftazidime in Salmonella spp. isolates from broiler meat recorded at levels greater than 10 % in Germany and around 30 % in the Netherlands (Table ESBL1).
Table ESBL2. Resistance (%) to cefotaxime and ceftazidime in S. Enteritidis isolates from meat from broilers tested by MSs in 2012
Country Cefotaxime Ceftazidime
N % Res N % Res Belgium 31 0 31 0 Latvia 23 0 – – Poland 26 0 26 0 Total (3 and 2 MSs) 80 0 57 0
MS: Member State; N: number of isolates tested; % Res: percentage of resistant isolates; –: no data reported.
Table ESBL3. Resistance (%) to cefotaxime and ceftazidime in S. Typhimurium isolates from meat from pigs tested by MSs in 2012
Country Cefotaxime Ceftazidime
N % Res N % Res Belgium 105 1.0 105 1.0 Denmark 18 0 – – Germany 58 0 58 0 Hungary 10 0 – – Ireland 22 0 22 0 Italy 18 0 18 0 Latvia 13 0 – – Netherlands 16 0 16 0 Poland 11 0 – – Romania 43 2.3 – – Total (10 and 5 MSs) 314 0.6 219 0.5
MS: Member State; N: number of isolates tested; % Res: percentage of resistant isolates; –: no data reported.
Table ESBL4. Resistance (%) to cefotaxime and ceftazidime in monophasic S. Typhimurium isolates from meat from pigs tested by MSs in 2012
Country Cefotaxime Ceftazidime
N % Res N % Res Denmark 22 0 – – Germany 37 0 37 0 Ireland 23 0 23 0 Total (3 and 2 MSs) 82 0 60 0
MS: Member State; N: number of isolates tested; % Res: percentage of resistant isolates; –: no data reported.

EU summary report on antimicrobial resistance in zoonotic and indicator bacteriafrom humans, animals and food 2012
EFSA Journal 2014;12(3):3590 218
7.2.2. Third-generation cephalosporin resistance in Salmonella isolates from animals
7.2.2.1. Resistance levels in Gallus gallus (fowl)
Resistance to third-generation cephalosporins in Salmonella spp. from Gallus gallus is shown in Table ESBL5. A low level of resistance to cefotaxime of 4.5 %, and to ceftazidime of 4.8 %, was reported in Salmonella spp. isolates from all reporting MSs, reflecting either no or very low to low resistance recorded in nearly all reporting countries. Only Belgium recorded much higher levels of resistance at 18.1 % to cefotaxime and 17.3 % to ceftazidime.
Table ESBL5. Resistance (%) to cefotaxime and ceftazidime in Salmonella spp. isolates from Gallus gallus tested by MSs in 2012
Country Cefotaxime Ceftazidime
N % Res N % Res Austria 176 0.6 176 0.6 Belgium 664 18.1 664 17.3 Czech Republic 386 0.3 386 0.3 Denmark 28 0 – – Germany 238 0.8 238 0.8 Hungary 261 0.4 – – Ireland 38 0 38 0 Italy 328 5.2 328 3.4 Latvia 14 0 – – Netherlands 192 4.2 192 4.2 Poland 739 0.7 739 0.8 Portugal 174 2.3 – – Romania 964 5.3 964 5.7 Slovakia 85 0 85 0 Spain 179 0.6 179 0.6 United Kingdom 236 0 216 0 Total (16 and 12 MSs) 4,702 4.5 4,205 4.8
MS: Member State; N: number of isolates tested; % Res: percentage of resistant isolates; –: no data reported.
Considering differing populations of Gallus gallus separately, levels of resistance to third-generation cephalosporins in Salmonella ssp. isolates from broiler, laying hen and breeding flocks were reported by 13, 12 and 4 MSs, respectively, in 2012 (Table ESBL6) and were generally either not detected or recorded at low levels. The levels of resistance in broilers were generally slightly higher than those reported when all Gallus gallus were considered, as most reporting MSs detected resistance, while, in laying hen and breeding flocks, resistance was generally not recorded. In Salmonella spp. from laying hen and breeding flocks, only three (Austria, Italy and Romania) and two MSs (Italy and Romania) detected low level resistance to third-generation cephalosporins out of the 12 and 4 reporting MSs, respectively. In broilers, three MSs reported levels of resistance to third-generation cephalosporins greater than 5 %.

EU summary report on antimicrobial resistance in zoonotic and indicator bacteriafrom humans, animals and food 2012
EFSA Journal 2014;12(3):3590 219
Table ESBL6. Resistance (%) to cefotaxime and ceftazidime in Salmonella spp. isolates from broilers, laying hens and breeding hens of Gallus gallus tested by MSs in 2012
Country Cefotaxime Ceftazidime
N % Res N % Res Broilers
Austria 113 0 113 0 Czech Republic 351 0.3 351 0.3 Denmark 24 0 – – Hungary 175 0.6 – – Ireland 38 0 38 0 Italy 105 13.3 105 7.6 Netherlands 130 6.2 130 6.2 Poland 189 0.5 189 0.5 Portugal 122 3.3 – – Romania 784 6.4 784 6.3 Slovakia 55 0 55 0 Spain 29 3.4 29 3.4 United Kingdom 170 0 153 0 Total (13 and 10 MSs) 2,285 3.5 1,947 3.5
Laying hens Austria 63 1.6 63 1.6 Germany 51 0 51 0 Hungary 86 0 – – Italy 161 1.2 161 1.2 Latvia 14 0 – – Netherlands 54 0 54 0 Poland 132 0 132 0 Portugal 32 0 – – Romania 145 0 145 2.8 Slovakia 29 0 29 0 Spain 150 0 150 0 United Kingdom 66 0 63 0 Total (12 and 9 MSs) 983 0.3 848 0.8
Breeding flocks Czech Republic 27 0 27 0 Italy 36 2.8 36 2.8 Poland 15 0 15 0 Romania 32 3.1 32 6.3 Total (4 MSs) 110 1.8 110 2.7
MS: Member State; N: number of isolates tested; % Res: percentage of resistant isolates; –: no data reported.

EU summary report on antimicrobial resistance in zoonotic and indicator bacteriafrom humans, animals and food 2012
EFSA Journal 2014;12(3):3590 220
The resistance to cefotaxime and ceftazidime in S. Enteritidis isolates from Gallus gallus, broilers and laying hens, reported, respectively, by 13, 6 and 10 MSs (Table ESBL7), was most generally not detected in reporting MSs. In contrast, resistance to both cefotaxime and ceftazidime was reported at moderate levels (14.8 %) in Belgium. Among the reporting MSs on broilers, Portugal observed resistance to cefotaxime, at the low level of 5.3 %. Considering isolates from laying hens, Romania was the only MS to report resistance to ceftazidime at a level of 6.1 %, while resistance to cefotaxime was not detected in this country.
Table ESBL7. Resistance (%) to cefotaxime and ceftazidime in S. Enteritidis isolates from Gallus gallus tested by MSs in 2012
Country Cefotaxime Ceftazidime
N % Res N % Res All Gallus gallus
Austria 36 0 36 0 Belgium 81 14.8 81 14.8 Czech Republic 251 0 251 0 Germany 80 0 80 0 Hungary 26 0 – – Italy 31 0 31 0 Latvia 11 0 – – Netherlands 38 0 38 0 Poland 496 0.6 496 0.8 Portugal 27 3.7 – – Romania 76 0 76 5.3 Slovakia 47 0 47 0 Spain 45 0 45 0 Total (13 and 10 MSs) 1,245 1.3 1,181 1.7
Broilers Austria 21 0 21 0 Czech Republic 236 0 236 0 Poland 131 0 131 0 Portugal 19 5.3 – – Romania 10 0 10 0 Slovakia 21 0 21 0 Total (6 and 5 MSs) 438 0.2 419 0
Laying hens Austria 15 0 15 0 Germany 21 0 21 0 Hungary 25 0 – – Italy 28 0 28 0 Latvia 11 0 – – Netherlands 38 0 38 0 Poland 91 0 91 0 Romania 66 0 66 6.1 Slovakia 25 0 25 0 Spain 43 0 43 0 Total (10 and 8 MSs) 363 0 327 1.2
MS: Member State; N: number of isolates tested; % Res: percentage of resistant isolates; –: no data reported.
Resistance to third-generation cephalosporins in S. Typhimurium isolates from Gallus gallus (Table ESBL8) was reported by five MSs. Belgium was the only MS to detect resistance at levels of 10.6 % to cefotaxime and 14.9 % to ceftazidime.

EU summary report on antimicrobial resistance in zoonotic and indicator bacteriafrom humans, animals and food 2012
EFSA Journal 2014;12(3):3590 221
Table ESBL8. Resistance (%) to cefotaxime and ceftazidime in S. Typhimurium isolates from Gallus gallus tested by MSs in 2012
Country Cefotaxime Ceftazidime
N % Res N % Res Austria 10 0 10 0 Belgium 47 10.6 47 14.9 Germany 42 0 42 0 Hungary 10 0 – – Poland 15 0 15 0 Total (5 and 4 MSs) 124 4.0 114 6.1
MS: Member State; N: number of isolates tested; % Res: percentage of resistant isolates; –: no data reported.
7.2.2.2. Resistance levels in turkeys
Resistance to cefotaxime and ceftazidime in Salmonella spp. isolates from turkeys, mainly fattening turkeys, is shown in Table ESBL9. Nine MSs reported results for cefotaxime and eight MSs reported results for ceftazidime. Resistance to both cefotaxime and ceftazidime was reported by Italy and Poland at low proportions, whereas Spain reported 1.2 % resistance to cefotaxime only.
Table ESBL9. Resistance (%) to cefotaxime and ceftazidime in Salmonella spp. isolates from turkeys tested by MSs in 2012
Country Cefotaxime Ceftazidime
N % Res N % Res Turkeys
Austria 38 0 38 0 Czech Republic 27 0 27 0 Germany 87 0 87 0 Hungary 174 0 – – Ireland 14 0 14 0 Italy 48 4.2 48 4.2 Poland 55 3.6 55 3.6 Spain 169 1.2 169 0 United Kingdom 142 0 141 0 Total (9 and 8 MSs) 754 0.8 579 0.7
Fattening turkeys Austria 38 0 38 0 Czech Republic 20 0 20 0 Germany 12 0 12 0 Hungary 174 0 – – Spain 169 1.2 169 0 Total (5 and 4 MSs) 413 0.5 239 0
MS: Member State; N: number of isolates tested; % Res: percentage of resistant isolates; –: no data reported.
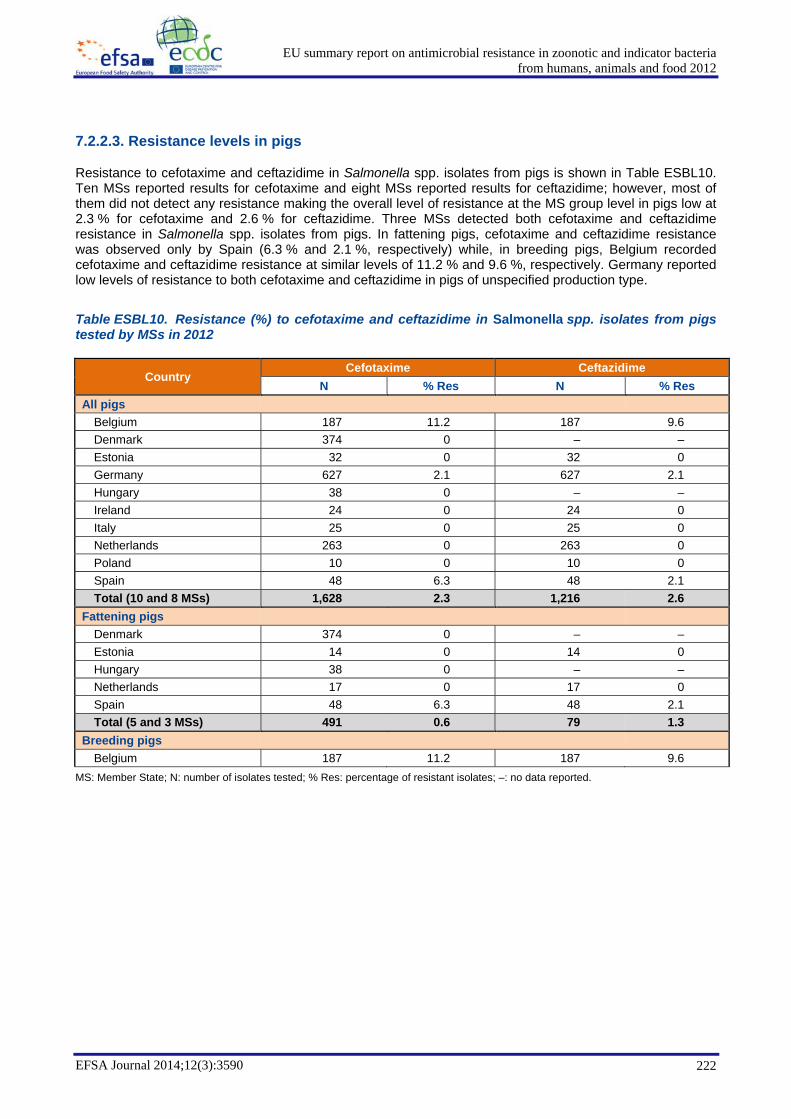
EU summary report on antimicrobial resistance in zoonotic and indicator bacteriafrom humans, animals and food 2012
EFSA Journal 2014;12(3):3590 222
7.2.2.3. Resistance levels in pigs
Resistance to cefotaxime and ceftazidime in Salmonella spp. isolates from pigs is shown in Table ESBL10. Ten MSs reported results for cefotaxime and eight MSs reported results for ceftazidime; however, most of them did not detect any resistance making the overall level of resistance at the MS group level in pigs low at 2.3 % for cefotaxime and 2.6 % for ceftazidime. Three MSs detected both cefotaxime and ceftazidime resistance in Salmonella spp. isolates from pigs. In fattening pigs, cefotaxime and ceftazidime resistance was observed only by Spain (6.3 % and 2.1 %, respectively) while, in breeding pigs, Belgium recorded cefotaxime and ceftazidime resistance at similar levels of 11.2 % and 9.6 %, respectively. Germany reported low levels of resistance to both cefotaxime and ceftazidime in pigs of unspecified production type.
Table ESBL10. Resistance (%) to cefotaxime and ceftazidime in Salmonella spp. isolates from pigs tested by MSs in 2012
Country Cefotaxime Ceftazidime
N % Res N % Res All pigs
Belgium 187 11.2 187 9.6 Denmark 374 0 – – Estonia 32 0 32 0 Germany 627 2.1 627 2.1 Hungary 38 0 – – Ireland 24 0 24 0 Italy 25 0 25 0 Netherlands 263 0 263 0 Poland 10 0 10 0 Spain 48 6.3 48 2.1 Total (10 and 8 MSs) 1,628 2.3 1,216 2.6
Fattening pigs Denmark 374 0 – – Estonia 14 0 14 0 Hungary 38 0 – – Netherlands 17 0 17 0 Spain 48 6.3 48 2.1 Total (5 and 3 MSs) 491 0.6 79 1.3
Breeding pigs Belgium 187 11.2 187 9.6
MS: Member State; N: number of isolates tested; % Res: percentage of resistant isolates; –: no data reported.

EU summary report on antimicrobial resistance in zoonotic and indicator bacteriafrom humans, animals and food 2012
EFSA Journal 2014;12(3):3590 223
Results relating to resistance to third-generation cephalosporins in S. Typhimurium from pigs, were reported by five and four MSs for cefotaxime and ceftazidime, respectively, and are shown in Table ESBL11. Among reporting MSs, Belgium and Germany were the only countries to report cefotaxime and ceftazidime resistance in S. Typhimurium, at the same levels, for both substances, of 10.7 % and 1.1 %, respectively. The overall levels of resistance for all reporting MSs were, therefore, at low levels of 2.3 % for cefotaxime and 2.6 % for ceftazidime.
Table ESBL11. Resistance (%) to cefotaxime and ceftazidime in S. Typhimurium isolates from pigs tested by MSs in 2012
Country Cefotaxime Ceftazidime
N % Res N % Res All pigs
Belgium 75 10.7 75 10.7 Denmark 63 0 – – Germany 273 1.1 273 1.1 Ireland 15 0 15 0 Netherlands 55 0 55 0 Total (5 and 4 MSs) 481 2.3 418 2.6
Fattening pigs Denmark 63 0 – –
Breeding pigs Belgium 75 10.7 75 10.7
MS: Member State; N: number of isolates tested; % Res: percentage of resistant isolates; –: no data reported.
The occurrence of resistance to cefotaxime and ceftazidime in monophasic S. Typhimurium isolates from pigs is shown in Table ESBL12. Six MSs reported results for cefotaxime and five MSs reported results for ceftazidime. Resistance to third-generation cephalosporins was detected by Belgium at moderate levels for both antimicrobials (19.5 % for cefotaxime and 14.6 % for ceftazidime) and by Germany at a very low level (0.9 % for both antimicrobials), while Spain recorded resistance only to cefotaxime at 7.1 %.
Table ESBL12. Resistance (%) to cefotaxime and ceftazidime in monophasic S. Typhimurium isolates from pigs tested by MSs in 2012
Country Cefotaxime Ceftazidime
N % Res N % Res Belgium 41 19.5 41 14.6 Denmark 81 0 – – Germany 228 0.9 228 0.9 Netherlands 39 0 39 0 Poland 10 0 10 0 Spain 14 7.1 14 0 Total (6 and 5 MSs) 413 2.7 332 2.4
MS: Member State; N: number of isolates tested; % Res: percentage of resistant isolates; –: no data reported.

EU summary report on antimicrobial resistance in zoonotic and indicator bacteriafrom humans, animals and food 2012
EFSA Journal 2014;12(3):3590 224
7.2.2.4. Resistance levels in cattle
Among the seven MSs reporting data on resistance to cefotaxime and five for ceftazidime in Salmonella spp. from cattle (Table ESBL13), only Belgium reported resistance of 2.4 % to both antimicrobials in 2012. None of the S. Typhimurium isolates tested exhibited any resistance to these compounds amongst the six and four, respectively, reporting MSs (Table ESBL14).
Table ESBL13. Resistance (%) to cefotaxime and ceftazidime in Salmonella spp. isolates from cattle tested by MSs and non-MS in 2012
Country Cefotaxime Ceftazidime
N % Res N % Res Belgium 42 2.4 42 2.4 Finland 19 0 – – Germany 68 0 68 0 Ireland 36 0 36 0 Italy 14 0 14 0 Netherlands 68 0 68 0 Sweden 17 0 – – Total (7 and 5 MSs) 264 0.4 228 0.4
MS: Member State; N: number of isolates tested; % Res: percentage of resistant isolates; –: no data reported.
Table ESBL14. Resistance (%) to cefotaxime and ceftazidime in S. Typhimurium isolates from cattle tested by MSs in 2012
Country Cefotaxime Ceftazidime
N % Res N % Res Belgium 25 0 25 0 Finland 16 0 – – Germany 35 0 35 0 Ireland 24 0 24 0 Netherlands 24 0 24 0 Sweden 12 0 – – Total (6 and 4 MSs) 136 0 108 0
MS: Member State; N: number of isolates tested; % Res: percentage of resistant isolates; –: no data reported.

EU summary report on antimicrobial resistance in zoonotic and indicator bacteriafrom humans, animals and food 2012
EFSA Journal 2014;12(3):3590 225
7.2.3. Salmonella serovars from animals demonstrating resistance to third-generation cephalosporins
Third-generation cephalosporin resistance was identified in a range of Salmonella serovars in 2012. Reporting MSs do not necessarily list all of the Salmonella serovars identified, and so the list of affected serovars is likely to be incomplete. In 2010, 2011 and 2012, the following third-generation cephalosporin-resistant serovars were identified from one or more sources (pigs, Gallus gallus and/or cattle) and from one or more MSs: S. Derby, S. Enteritidis, S. Infantis, S. Kentucky, S. Livingstone, S. London, S. Java and S. Typhimurium. In addition to these serovars, S. 1,9,12:l,v:-, S. Choleraesuis, S. Lamberhurst, S. Montevideo and S. Ordonez with third-generation cephalosporin resistance were identified in 2011. Isolates from turkeys (S. Bovismorbificans from France, S. Bredeney from Hungary and S. Muenchen from Spain) and domestic solipeds (S. Typhimurium DT104 from Ireland) were also found to express resistance to third-generation cephalosporins in 2011. Among the serovars identified as resistant to third-generation cephalosporins, monophasic S. Typhimurium was identified in pigs from Belgium, Germany and Spain in 2012 (Table ESBL 12).
7.2.4. Reporting of specific data on ESBL in Salmonella
In 2012, EFSA published a report (EFSA, 2012b) providing detailed recommendations and discussions relating to how future surveillance for third-generation cephalosporin, ESBL, AmpC and carbapenem resistance monitoring could be enhanced. Using for the first time the new functionalities of the EFSA Data Collection Framework recently introduced, one MS (Spain) reported data on the identity of the ESBL and other enzymes detected in Salmonella isolates from fattening pigs. Two isolates (of serovars S. Derby and monophasic S. Typhimurium) were reported producing CTX-M-1 and CTX-M-14, respectively. CTX-M-1 is an ESBL enzyme which has been previously recognised in pigs in several MSs. One S. Typhimurium isolate produced the enzyme OXA-1, which confers resistance to the action of clavulanic acid, a beta-lactamase enzyme inhibitor, by breaking down the clavulanate compound.

EU summary report on antimicrobial resistance in zoonotic and indicator bacteriafrom humans, animals and food 2012
EFSA Journal 2014;12(3):3590 226
7.3. Third-generation cephalosporin resistance in indicator E. coli from food and animals
7.3.1. Third-generation cephalosporin resistance in indicator E. coli isolates from food
Three MSs (Denmark, Hungary and the Netherlands) reported results for resistance to cefotaxime in E. coli isolates from meat from broilers, meat from pigs and meat from bovine animals in 2012, and Sweden and Germany also reported data from meat from broilers and meat from bovine animals, respectively. Germany and the Netherlands tested ceftazidime and recorded similar resistance levels to those obtained for cefotaxime. Overall, resistance to third-generation cephalosporins was either not detected or reported at low levels ranging between 0.5 % and 8.0 %. Interestingly, the 2012 results for broiler meat from the Netherlands (8.0 % for cefotaxime and 6.3 % for ceftazidime) represent a decrease in the figures obtained for 2011, when 31.9 % of isolates were resistant to both antimicrobials.
Table ESBL15. Resistance (%) to cefotaxime and ceftazidime in E. coli isolates from meat from broilers, meat from pigs and meat from bovine animals tested by MSs in 2012
Country Cefotaxime Ceftazidime
N % Res N % Res Meat from broilers
Denmark 197 1.0 – – Hungary 64 0 – – Netherlands 175 8.0 175 6.3 Sweden 92 0 – – Total (4 and 1 MSs) 528 3.0 175 6.3 Norway 197 0.5 – –
Meat from pigs Denmark 73 1.4 – – Hungary 14 0 – – Netherlands 98 1.0 98 1.0 Total (3 and 1 MSs) 185 1.1 98 1.0
Meat from bovine animals Denmark 46 0 – – Germany 71 4.2 71 4.2 Hungary 31 3.2 – – Netherlands 141 0.7 141 0.7 Total (4 and 2 MSs) 289 1.7 212 1.9
MS: Member State; N: number of isolates tested; % Res: percentage of resistant isolates; –: no data reported.

EU summary report on antimicrobial resistance in zoonotic and indicator bacteriafrom humans, animals and food 2012
EFSA Journal 2014;12(3):3590 227
7.3.2. Third-generation cephalosporin resistance in indicator E. coli isolates from animals
7.3.2.1. Resistance levels in Gallus gallus (fowl)
Table ESBL16 summarises data on resistance in indicator E. coli isolates from Gallus gallus tested by eight reporting MSs, as well as Norway and Switzerland, distinguishing, where possible, between broilers and laying hens. All reporting countries tested resistance to cefotaxime and five reporting MSs also tested isolates for ceftazidime resistance. The levels of resistance reported were generally low, although Belgium reported 28 % resistance in Gallus gallus. The level of cefotaxime resistance (5.8 %) in E. coli from broilers reported by the Netherlands in 2012 represents a decline compared with 2011 and 2010, when 8.1 % and 18 % resistance, respectively, was reported. In the case of Poland where resistance to cefotaxime and ceftazidime was reported in isolates from both broilers and laying hens, the levels of resistance, when considering isolates from broiler flocks, were approximately twice that reported from laying hens.
Table ESBL16. Resistance (%) to cefotaxime and ceftazidime in indicator E. coli isolates from Gallus gallus tested by MSs and non-MSs in 2012
Country Cefotaxime Ceftazidime
N % Res N % Res All Gallus gallus
Austria 130 3.1 130 3.1 Belgium 325 28.0 325 24.9 Denmark 115 1.7 – – France 201 10.4 201 9.5 Hungary 105 7.6 – – Netherlands 292 5.8 292 6.2 Poland 328 10.7 328 6.1 Sweden 255 0.4 – – Total (8 and 5 MSs) 1,751 10.2 1,276 11.1 Norway 113 0.9 – – Switzerland 185 2.2 185 2.2
Broilers Austria 130 3.1 130 3.1 Denmark 115 1.7 – – France 201 10.4 201 9.5 Hungary 105 7.6 – – Netherlands 292 5.8 292 6.2 Poland 171 13.5 171 8.2 Sweden 194 0 – – Total (7 and 4 MSs) 1,208 6.2 794 6.9 Switzerland 185 2.2 185 2.2
Laying hens Poland 157 7.6 157 3.8 Sweden 61 1.6 – – Total (2 and 1 MSs) 218 6.0 157 3.8
MS: Member State; N: number of isolates tested; % Res: percentage of resistant isolates; –: no data reported.

EU summary report on antimicrobial resistance in zoonotic and indicator bacteriafrom humans, animals and food 2012
EFSA Journal 2014;12(3):3590 228
7.3.2.2. Resistance levels in pigs
Table ESBL17 shows resistance to cefotaxime and ceftazidime in indicator E. coli from pigs. Overall, the levels of resistance in reporting countries were low generally. Austria and the Netherlands detected no resistance in indicator E. coli from pigs.
Table ESBL17. Resistance (%) to cefotaxime and ceftazidime in indicator E. coli isolates from pigs tested by MSs and non-MSs in 2012
Country Cefotaxime Ceftazidime
N % Res N % Res Austria 140 0 140 0 Belgium 205 2.9 205 3.4 Denmark 152 0.7 – – France 200 2.0 200 2.0 Hungary 68 1.5 – – Netherlands 284 0 284 0 Poland 190 2.6 190 2.6 Total (7 and 5 MSs) 1,239 1.4 1,019 1.6 Switzerland 185 1.1 185 1.1
MS: Member State; N: number of isolates tested; % Res: percentage of resistant isolates; –: no data reported.

EU summary report on antimicrobial resistance in zoonotic and indicator bacteriafrom humans, animals and food 2012
EFSA Journal 2014;12(3):3590 229
7.3.2.3. Resistance levels in cattle
The results of examinations for third-generation cephalosporin resistance in indicator E. coli from cattle are shown in Table ESBL18. Seven MSs and Switzerland tested indicator E. coli isolates from cattle for cefotaxime and five MSs and Switzerland tested these isolates for ceftazidime resistance. The overall occurrence of resistance to cefotaxime was 2.4 % and to ceftazidime was 2.6 % in all reporting MSs and this represents an increase on the figures of 0.9 % and 0.6 %, respectively, reported in 2011. Denmark and Finland did not detect cefotaxime resistance in indicator E. coli from cattle in 2012, and in the remaining MSs a low or very low level (0.4-9.9 %) of resistance to both antimicrobials was detected.
Table ESBL18. Resistance (%) to cefotaxime and ceftazidime in indicator E. coli isolates tested from cattle by MSs and non-MS in 2012
Country Cefotaxime Ceftazidime
N % Res N % Res All cattle
Austria 273 0.7 273 0.4 Belgium 364 8.8 364 9.9 Denmark 98 0 – – Finland 295 0 – – Germany 515 2.5 515 1.7 Netherlands 559 0.5 559 0 Poland 190 2.6 190 2.1 Total (7 and 5 MSs) 2,294 2.4 1,901 2.6 Switzerland 187 0.5 187 0
Calves (under 1 year) Austria 151 1.3 151 0.7 Germany 515 2.5 515 1.7 Netherlands 285 0.7 285 0 Total (3 MSs) 951 1.8 951 1.1
Young cattle (1–2 years) Austria 73 0 73 0
Meat production animals Switzerland 187 0.5 187 0
Adult over 2 years Austria 49 0 49 0
Dairy cows Netherlands 274 0.4 274 0
Mixed herds Belgium 364 8.8 364 9.9 Finland 295 0 – – Total (2 and 1 MSs) 659 4.9 364 9.9
MS: Member State; N: number of isolates tested; % Res: percentage of resistant isolates; –: no data reported.

EU summary report on antimicrobial resistance in zoonotic and indicator bacteriafrom humans, animals and food 2012
EFSA Journal 2014;12(3):3590 230
7.4. Comparison of cefotaxime resistance in Salmonella spp. and indicator E. coli isolates from animals
Indicator commensal E. coli in healthy animals may constitute a reservoir of resistance genes which can be transferred to zoonotic organisms, such as Salmonella, and this process may be particularly enhanced in some circumstances, for example under selection pressure resulting from antimicrobial usage. Once Salmonella isolates have acquired plasmids carrying genes conferring resistance to third-generation cephalosporins (either ESBL or AmpC resistance genes), the dissemination of such resistant Salmonella clones will also play a major part in influencing the occurrence of third-generation cephalosporin resistance.
Considering the prevalence of resistance to cefotaxime and resistance in MSs to Salmonella spp. and E. coli in all species for which relevant data are available, then in all reporting MSs where resistance was detected in 2012, the prevalence of resistance is higher in E. coli than it is in Salmonella spp. with the sole exception of Belgium and isolates from pigs. Table ESBL19 summarises the data and illustrates some interesting observations relating to the occurrence of cefotaxime resistance in Salmonella spp. and E. coli in MSs.
Where resistance is detected in Salmonella spp. in a MS, it is also invariably present in E. coli in that reporting MS and usually occurs at a higher level (with only one exception). Some MSs do not report cefotaxime resistance in Salmonella spp. or in E. coli for some food-producing animals. The degree of resistance observed in Salmonella spp. and E. coli may be correlated, in those MSs, which have a high level of resistance in Salmonella spp. and have a high level of resistance in E. coli. However, the correlation does not always hold true and would not be expected to hold where clonal dissemination of particular strains of Salmonella were responsible for the observed prevalence of resistance in Salmonella spp. It tends to appear that, in most MSs, commensal E. coli is the primary reservoir of beta-lactamase resistance, which is less frequently observed in Salmonella spp.
The data reported by the Netherlands are interesting because occurrence of resistance is assessed on a large number of samples tested. Resistance in E. coli isolates was detected at low levels in meat from pigs (1.0 %) and bovine animals (0.7 %), but at higher levels in meat from broilers (8.0 %). The figure for broilers represents a considerable decline from the figure reported in 2011 (31.9 %). It is desirable that these resistance figures are as low as possible. In the last years, a number of initiatives have occurred in the Netherlands, including changes to relevant antimicrobial authorisations and strenuous efforts to reduce antimicrobial consumption in livestock, which may have influenced the observed resistance levels. The decline in cefotaxime resistance observed in broilers in the Netherlands (18 %, 8.1 % and 5.8 % in 2010, 2011 and 2012, respectively) parallels the decline observed in broiler meat. In other MSs, a low occurrence of resistance to cefotaxime was generally recorded, since many countries tested a rather small sample size or reported only single-resistant isolates. As a result, minor fluctuations in the observed percentage of resistance are probably to be expected.
All MSs detected resistance to cefotaxime in broilers except Sweden; the prevalence ranged from 1.7 % to 13.5 %. Where MSs reported data for both pigs and broilers, the levels observed in pigs were consistently lower. In cattle, some MSs reported that cefotaxime resistance in cattle was intermediate, lying between that observed in pigs and broilers (Austria, Belgium and the Netherlands), while Poland found that levels in pigs and cattle were very similar and Switzerland observed that cefotaxime resistance in pigs exceeded that observed in cattle. However, it is of note that differences in the types of cattle sampled may make direct comparisons between MSs inappropriate.

EU summary report on antimicrobial resistance in zoonotic and indicator bacteriafrom humans, animals and food 2012
EFSA Journal 2014;12(3):3590 231
Table ESBL19. Resistance (%)to cefotaxime in Salmonella spp. and indicator E. coli isolates in MSs in 2012 testing both bacterial species in either Gallus gallus, pigs or cattle
Country Gallus gallus Pigs Cattle
Salmonella spp. E. coli Salmonella spp. E. coli Salmonella spp. E. coli N % Res N % Res N % Res N % Res N % Res N % Res
Austria 176 0.6 130 3.1 – – – – – – – – Belgium 664 18.1 325 28.0 187 11.2 205 2.9 42 2.4 364 8.8 Denmark 28 0 115 1.7 374 0 152 0.7 – – – – Finland – – – – – – – – 19 0 295 0 Germany – – – – – – – – 68 0 515 2.5 Hungary 261 0.4 105 7.6 38 0 68 1.5 – – – – Netherlands 192 4.2 292 5.8 263 0 284 0 68 0 559 0.5 Poland 739 0.7 328 10.7 10 0 190 2.6 – – – –
MS: Member State; N: number of isolates tested; % Res: percentage of resistant isolates; –: no data reported.

EU summary report on antimicrobial resistance in zoonotic and indicator bacteriafrom humans, animals and food 2012
EFSA Journal 2014;12(3):3590 232
7.5. Discussion
In 2012, as in 2011, resistance to third-generation cephalosporins was generally detected at low levels in Salmonella and indicator E. coli isolates recovered from major food-producing animals and meat thereof. In most MSs, the prevalence of resistance to cefotaxime in both Salmonella spp. and E. coli was equal to that observed for ceftazidime. Although resistance assessed using ECOFFs tends to usually detect resistance to both compounds, this is not always the case and differences in resistance to each compound may be observed, reflecting whether the ESBL enzyme conferring resistance is primarily a cefotaximase or a ceftazidimase. ESBLs belonging to the CTX-M family (primarily, though not entirely, cefotaximases) are currently the most important types of ESBL in both animals and humans in the majority of MSs. However, EFSA has recommended that both cefotaxime and ceftazidime are included in future harmonised mandatory monitoring to ensure optimal detection of all ESBLs (EFSA, 2012b) (see box below), as surveillance procedures should anticipate possible changes in the status of different ESBL enzymes.
While resistance to cefotaxime in Salmonella spp. isolates recovered from meat from broilers was reported at low or moderate levels in most reporting MSs, one MS recorded around 30 % resistance to both cefotaxime and ceftazidime in 2012 and 2011. In most MSs, the observed levels of resistance in meat from broilers and Gallus gallus (or broilers) showed many similarities; however, in a number of MSs, differences in the levels of cefotaxime resistance in meat and the species from which the meat was produced were observed. For example, in Belgium, resistance to cefotaxime or ceftazidime was not detected in Salmonella spp. from meat from broilers, while resistance to the same compounds was reported at moderate levels in Gallus gallus. Conversely, in Germany and the Netherlands, the cefotaxime resistance was recorded at a lower level in Salmonella spp. isolates from Gallus gallus than in isolates from poultry meat. The reasons underlying the absence of a clear correlation between the prevalence of resistance observed in livestock and then in meat derived from those animals within a MS may be related to the lack of direct comparability between the target populations used for the monitoring in retail meat and in broilers. The retail meat monitored may notably include not only domestic poultry meat, but also imported meat from other countries.
Considering all MSs, resistance to cefotaxime in Salmonella spp. recovered from meat from pigs and cattle was 0.9 % and 1.4 % respectively, which are both lower than the figure of 4.3 % reported for meat from broilers. Two factors contribute to this observed difference: (1) the proportion of reporting MSs which did not report resistance to cefotaxime in meat from pigs and cattle was higher than that for meat from broilers, and (2) in MSs which did report resistance, the levels of resistance reported for Salmonella spp. from meat broilers were higher than for meat from pigs and cattle.
The results have been presented by animal production type (where available and relevant) and this is the second year in which animal production type has been included in this way. Differences in the occurrence of resistance may be related to husbandry methods, age or stage of production, the degree of antimicrobial usage or the influence the structure of the particular livestock industry may have on clonal spread of resistant organisms. The prevalence of resistance to cefotaxime in Salmonella spp. was higher in broilers than in laying hens (when resistance was detected) for all MSs (except Austria). Laying hens tend to be infrequently treated with antimicrobials, especially once in lay. S. Enteritidis from broilers and layers were susceptible to cefotaxime from most MSs, although Belgium reported moderate cefotaxime resistance in S. Enteritidis from Gallus gallus and was the only MS to report moderate resistance in S. Typhimurium from Gallus gallus. Romania reported isolates resistant to ceftazidime, but susceptible to cefotaxime in laying hens, suggesting that a ceftazidimase enzyme may have been present. Salmonella spp. resistant to cefotaxime was most frequently observed in broilers and the proportion of MSs observing any degree of resistance was higher than that for other animal species (turkeys, pigs and cattle).
Breeding animals may play a role in the clonal dissemination of resistance in particular serovars of Salmonella when animals colonised at breeding units are moved to fattening farms. A proportion of the reporting MSs observed cefotaxime resistance in Salmonella spp. isolates from breeding flocks of Gallus gallus and from breeding pigs. Belgium, Germany and Spain all reported cefotaxime resistance in S. Typhimurium or monophasic S. Typhimurium from pigs, and both of these serovars are significant causes of human salmonellosis. In cattle, the level of resistance for Salmonella spp. from cattle was very low and the S. Typhimurium isolates tested were all susceptible to cefotaxime. Only one MS (Belgium) reported third-generation cephalosporin resistance in Salmonella spp. isolates from cattle.
EU summary report on antimicrobial resistance in zoonotic and indicator bacteriafrom humans, animals and food 2012
EFSA Journal 2014;12(3):3590 233
Some Salmonella serovars have particular public health significance because they either are common causes of human salmonellosis or have acquired resistance to a large number of different antimicrobial compounds (or even exhibit both of these traits). Resistance to third-generation cephalosporins was detected in a number of serovars of particular public health importance, including S. Typhimurium, S. Enteritidis, S. Infantis, S. Kentucky, S. Java and monophasic S. Typhimurium. Among those serovars showing multiple antimicrobial resistance, S. Kentucky and S. Java are particularly important because they also often show other resistances, including resistance to fluoroquinolones (the other main antimicrobial used in the first-line treatment of human salmonellosis). Previous outbreaks of ESBL-producing salmonellae affecting poultry and humans have occurred, for example involving S. Virchow (Weill et al., 2004; Bertrand et al., 2006), and it is important that the monitoring performed can identify such serovars. It may be assumed that, even though the monitoring has not been designed to detect outbreaks, it should hopefully reflect indirectly serovars involved in a large outbreak(s). Considering these Salmonella serovars of particular public health importance, no resistance to cefotaxime was detected in S. Typhimurium in meat from pigs in the period 2010 to 2011, while two MSs (Belgium and Romania) detected cefotaxime resistance in the same serovar of the same origin in 2012. Belgium, Poland and Portugal detected cefotaxime resistance in S. Enteritidis from Gallus gallus in 2012, as Austria and Hungary did in 2011; however, no cefotaxime resistance was detected in S. Enteritidis in meat from broilers in 2012.
Although thorough cooking and appropriate food hygiene procedures kills any bacteria present on food and prevents cross-contamination of foods with resistant or susceptible bacteria, it is highly desirable that the level of resistance in zoonotic organisms is very low or zero, especially in relation to important antimicrobials for human treatment. Among the strains of E. coli occurring in animals, some may be able to cause infections in humans (many will be largely harmless animal commensals) and some, although they are primarily commensals of animals, may be able to transiently or permanently colonise the human intestine. During transient colonisation or passage through the human intestine, E. coli may be able to exchange their resistance plasmids with the commensal E. coli flora of humans. Therefore, it is also desirable that resistance to important antimicrobials for human treatment is also very low or zero in animal strains of E. coli, which might otherwise form a reservoir of resistance genes.
FUTURE HARMONISED MONITORING OF ESBLS AND AMPC ENZYMES
EFSA’s Scientific Report on the harmonised monitoring and reporting of antimicrobial resistance in Salmonella, Campylobacter and indicator E. coli and Enterococcus spp. bacteria transmitted through food (EFSA, 2012b) has discussed further enhancement of surveillance in this area. In particular, detailed recommendations have been made for the isolation and identification of extended-spectrum beta-lactamases (ESBL) and AmpC E. coli and methods have been described which would promote a harmonised and, therefore, comparable approach to monitoring across the EU. Further characterisation of isolates in this way will allow possible links between animals and humans to be investigated and provide a better indication of the overall significance of any resistance to third-generation cephalosporins which is detected. Based on the proposals of EFSA, the European Commission has put forward and discussed with the Member States a new piece of legislation on the harmonised monitoring of antimicrobial resistance in food-producing animals and food, including details provisions on the monitoring of ESBL- and AmpC-producing Salmonella and indicator commensal E. coli. The new legislation (Decision 2013/652) will enter into force in 2014.

EU summary report on antimicrobial resistance in zoonotic and indicator bacteriafrom humans, animals and food 2012
EFSA Journal 2014;12(3):3590 234
8. MATERIALS AND METHODS
8.1. Antimicrobial susceptibility data from humans available in 2012
MSs report results from AST to ECDC through TESSy. The data used in this report were submitted in connection to the annual data collection for the European Union Summary Report of Trends and Sources of Zoonoses and Zoonotic Agents end of May 2013.
8.1.1. Salmonella data of human origin
Nineteen MSs, as well as Iceland and Norway, provided data for 2012. The antimicrobials reported on for Salmonella are ampicillin, cefotaxime, chloramphenicol, ciprofloxacin, gentamicin, kanamycin, nalidixic acid, streptomycin, sulfonamides, tetracyclines and trimethoprim. Some countries reported on all of these and others on only a few. Countries reported qualitative data, i.e. interpreted AST results for tested isolates (susceptible (S), intermediate (I) or resistant (R)), with the exception of Norway which used the isolate-based reporting under piloting at ECDC to report measured IZDs. The Norwegian data were then interpreted by ECDC, using the most recent clinical breakpoints from EUCAST where applicable and otherwise breakpoints from CLSI (Table MM1).
The public health reference laboratories were asked via e-mail to provide an update about which methods and which guidelines were being used for testing and interpretation. It should be noted that the public health reference laboratories in several countries type only a fraction of the isolates. The remaining isolates are then typed by hospitals or local laboratories, and the methods used by these are often unknown. Eight MSs plus Iceland and Norway used only disc diffusion methods, six other MSs used only dilution methods and another four MSs used a combination of the two depending on the situation and the antimicrobial (Table MM1 (continued)). The method used in one MS was unknown.
The guidelines used for the interpretation differed between countries (Table MM1). Nine countries used guidelines from CLSI, two used guidelines from EUCAST, five used a combination of the two and another five countries used another guideline (often national). Compared with 2011, two MSs and Iceland had changed to EUCAST from CLSI (and more followed in 2013). Clinical breakpoints were applied in all countries but two, which used EUCAST ECOFFs. For 4 of the 11 antimicrobials addressed, the MIC value for the CLSI breakpoints and the EUCAST ECOFFs are equivalent: chloramphenicol, nalidixic acid, sulfonamides and tetracyclines. Please note that CLSI define clinical resistance breakpoints as ‘more than or equal to’ a certain MIC value, while EUCAST use ‘more than’ a certain value. This means that a CLSI breakpoint of ≥32 mg/L is the same as a EUCAST breakpoint of >16 mg/L.; see Table MM1 and Figure SA1. For three antimicrobials (cefotaxime, ciprofloxacin and gentamicin), the MIC values or zone diameters differ markedly between the clinical breakpoints and the ECOFFs. This is particularly the case for ciprofloxacin, for which the ECOFF is three times more sensitive than the EUCAST clinical breakpoint and five times more sensitive than the CLSI clinical breakpoint (Figure SA1). Results for these three antimicrobials must therefore be interpreted with caution, and no direct comparison between countries should be made.
Results are presented for countries reporting data for more than 20 isolates for the antimicrobial in question. Trend lines within the period 2008 to 2012 are shown for those countries reporting data for at least three consecutive years and 10 isolates per year. Countries which did not detect any resistant isolates during the period are mentioned but not shown in the graphs. Results are presented separately for the top three most important serovars: S. Enteritidis, S. Typhimurium and monophasic S. Typhimurium.
In order to better assess the impact from food consumed within each reporting country on the antimicrobial resistance levels found in human Salmonella isolates, the analysis focused on domestically acquired cases. However, since several countries had not provided any information on travel (or non-travel) of their cases, cases with unknown travel status were included in the analysis. The proportion of travel-associated, domestic and unknown cases among the tested Salmonella isolates is presented in Table MM2. An analysis was also made on the most likely country of infection of each disease case to compare resistance levels in human Salmonella infections acquired within the EU/EEA with those acquired when travelling in regions outside the EU/EEA.

EU summary report on antimicrobial resistance in zoonotic and indicator bacteriafrom humans, animals and food 2012
EFSA Journal 2014;12(3):3590 235
Table MM1. Breakpoints used by MSs for the interpretation of 2012 susceptibility data on Salmonella of human origin
Country Ampicillin Cefotaxime Chloramphenicol Ciprofloxacin Gentamicin Kanamycin
Guidelines MIC mm MIC mm MIC mm MIC mm MIC mm MIC mm
Austria – ≤13 – ≤16 – ≤16 – ≤18 – ≤13 – ≤13 EUCAST 2012 for Amp, Ctx, Chl, Cip, Gen. CLSI 2012 for Kan
Denmark >8 – >0.5 – >16 – >0.06 – >2 – >4 – EUCAST ECOFFS. Neomycin is reported under kanamycim
Estonia ≥32 ≤13 ≥1 ≤27 ≥32 ≤12 ≥0.125 <30 ≥16 ≤12 – ≤13 WHO Collaborating Centre 2010, DTU Food (breakpoints based on CLSI)
France – <16 – <23 – <23 >1 <22 – <16 – <15 CA-SFM 2011 Germany >8 – >8 – NA NA >2 – >4 – >16 – German DIN standard Greece1 – ≤13 – ≤22 – ≤12 – ≤15 – ≤12 – ≤13 CLSI 2011
Hungary >8 <14 >2 <17 >8 <17 >0.064 – >4 <14 – <14 EUCAST 2012 except for Kan where CLSI 2012 was applied
Ireland >8 – >2 – >8 – >1 – >4 – ≥64 – EUCAST 2012 except for Kan where CLSI 2012 was applied
Italy ≥32 ≤13 ≥64 ≤14 ≥32 ≤12 ≥4 ≤15 ≥16 ≤12 ≥64 ≤13 CLSI M100-S17-S19 Latvia1 ≥32 ≤13 NA NA NA NA ≥4 ≤15 NA NA NA NA CLSI Lithuania1 ≥32 ≤13 ≥64 ≤14 ≥32 ≤12 ≥4 ≤15 ≥16 ≤12 ≥64 ≤13 CLSI M100-S17-S19 Luxembourg – ≤13 – ≤22 – ≤12 – ≤15 – ≤12 – ≤13 CLSI 2012
Malta ≥16 – ≥4 NA ≥16 NA ≥2 – ≥8 – NA NA Biomerieux Vitek II system; follows EUCAST 2010
Netherlands1 >4 – >0.5 – >16 – >0.06 – >2 – NA NA EUCAST ECOFFS from 2007. For Str EFSA and Su CLSI
Romania1 ≥32 ≤13 ≥4 ≤22 ≥32 ≤12 ≥4 ≤15 ≥16 ≤12 ≥64 ≤13 CLSI 2012 Slovakia >8 <14 >2 <17 >8 <17 >2 <19 >4 <14 NA NA EUCAST Slovenia – ≤13 – ≤22 – ≤12 – ≤15 – ≤12 – ≤13 CLSI M100-S22, 2012 Spain – ≤13 – ≤22 – ≤12 – ≤15 – ≤12 – ≤13 CLSI-2010 M100-S-20 Vol.30 United Kingdom ≥8 – ≥1 – ≥8 – ≥0.125 – ≥4 – ≥16 – HPA methodology based on Frost (1994) Iceland – <14 NA NA – <17 – <19 NA NA NA NA EUCAST 2012 Norway – <14 NA NA – <17 – <19 NA NA NA NA EUCAST 2012
MS: Member State; MIC, minimum inhibitory concentration; –: this method is not used for the antimicrobial in question; NA: not applicable since this antimicrobial is not reported to The European Surveillance System or fewer than 20 isolates tested; EUCAST: European Committee on Antimicrobial Susceptibility Testing; ECOFF: epidemiological cut-off value; WHO: World Health Organization; DTU: Technical University of Denmark; CA-SFM: French Society for Microbiology; DIN: Deutsches Institut für Normung; CLSI: Clinical and Laboratory Standards Institute; HPA: Health Protection Agency. 1. Interpretive criteria and comments shown are from the 2010 or 2011 report as clinical breakpoints for 2012 were not reported.
Table continued overleaf.

EU summary report on antimicrobial resistance in zoonotic and indicator bacteriafrom humans, animals and food 2012
EFSA Journal 2014;12(3):3590 236
Table MM1 (continued). Breakpoints used by MSs for the interpretation of 2012 susceptibility data on Salmonella of human origin
Country Nalidixic acid Streptomycin Sulfonamides Tetracyclines Trimethoprim Guidelines Method MIC mm MIC mm MIC mm MIC mm MIC mm Austria – ≤13 – ≤11 – ≤12 – ≤11 – ≤14 EUCAST 2012 for Tmp. CLSI 2012 for Nal, Str, Su, Tet Disc diffusion Denmark >16 – >16 – >256 – >8 – >2 – EUCAST ECOFFS. EFSA ECOFF for sulfonamides Dilution
Estonia ≥32 ≤13 ≥32 ≤11 ≥512 ≤12 ≥16 ≤11 ≥16 ≤10 WHO Collaborating Centre 2010, DTU Food (breakpoints based on CLSI) Disc diffusion
France >16 <15 – <15 – <12 – <17 – <13 CA-SFM 2011. Combination trimethoprim/sulfamethoxazole tested
Disc diffusion and dilution (gradient strip)
Germany >16 – >16 – NA NA NA NA > 16 – German DIN standard. Combination trimethoprim/sulfamethoxazole tested Dilution
Greece1 – ≤13 – ≤11 NA NA – ≤11 – ≤10 CLSI 2011 Disc diffusion
Hungary – <14 – <12 – <13 – <12 >4 <11 CLSI 2012 except for Stx EUCAST 2012. Combination trimethoprim/sulfamethoxazole tested
Disc diffusion and dilution (gradient strip)
Ireland >16 – >32 – ≥512 – ≥16 – >4 – EUCAST 2012 except for Su and Tet CLSI 2012 and Str EFSA 2007 Dilution
Italy ≥32 ≤13 – ≤11 ≥512 ≤12 ≥16 ≤11 ≥16 ≤10 CLSI M100 S17 S19 Disc diffusion Latvia1 NA NA NA NA NA NA NA NA ≥16 ≤10 CLSI Not reported Lithuania1 ≥32 ≤13 – ≤11 ≥512 ≤12 ≥16 ≤11 ≥16 ≤10 CLSI M100-S17-S19 Disc diffusion
Luxembourg – ≤13 – ≤11 – ≤12 – ≤11 – ≤10 CLSI 2012. Combination trimethoprim/sulfamethoxazole tested Disc diffusion
Malta NA NA NA NA NA NA NA NA ≥160 – Biomerieux Vitek II system; follows EUCAST 2010 except for Stx. Combination trimethoprim/sulfamethoxazole tested Dilution
Netherlands >16 – >32 – – – >8 – NA NA EUCAST ECOFFS. For Str EFSA and Su CLSI Dilution
Romania1 ≥32 ≤13 ≥32 ≤11 ≥512 ≤12 ≥16 ≤11 ≥16 ≤10 CLSI 2012 Disc diffusion and dilution (gradient strip)
Slovakia >16 <12 NA NA >256 <13 >8 <12 >4 <13 CLSI except for Stx EUCAST. Combination trimethoprim/sulfamethoxazole tested
Disc diffusion and dilution
Slovenia – ≤13 – ≤11 – ≤12 – ≤11 – ≤10 CLSI M100-S22, 2012 Disc diffusion
Spain – ≤13 – ≤11 – – – ≤11 – ≤10 CLSI-2010 M100-S-20 Vol.30. Combination trimethoprim/sulfamethoxazole tested Disc diffusion
United Kingdom ≥16 – ≥16 – ≥64 – ≥8 – ≥2 – HPA methodology based on Frost (1994) Dilution (in agar breakpoint)
Iceland – NA NA NA NA NA NA NA – < 13 EUCAST 2012 Disc diffusion Norway – ≤13 – ≤11 – ≤12 – ≤11 – <13 CLSI 2012 except for Stx EUCAST 2012 Disc diffusion
MS: Member State; MIC: minimum inhibitory concentration; –: this method is not used for the antimicrobial in question; NA: not applicable since this antimicrobial is not reported to The European Surveillance System or fewer than 20 isolates tested; EUCAST: European Committee on Antimicrobial Susceptibility Testing; ECOFF: epidemiological cut-off value; WHO: World Health Organization; DTU: Technical University of Denmark; CA-SFM: French Society for Microbiology; DIN: Deutsches Institut für Normung; CLSI: Clinical and Laboratory Standards Institute; HPA: Health Protection Agency. 1. Interpretive criteria and comments shown are from the 2010 or 2011 report as clinical breakpoints for 2012 were not reported.

EU summary report on antimicrobial resistance in zoonotic and indicator bacteriafrom humans, animals and food 2012
EFSA Journal 2014;12(3):3590 237
Table MM2. Proportion of tested Salmonella spp. isolates from human cases associated with travel, domestic cases and cases with unknown travel information by country in 2012
Country Tested isolates Travel-associated Domestic Unknown
N % % % Austria 1,888 4 96 0 Denmark 609 36 64 0 Estonia 238 8 92 0 France 1,278 0 0 100 Germany 2,039 2 98 0 Greece 112 5 88 7 Hungary 588 0 100 0 Ireland 306 29 12 59 Italy 134 1 13 86 Latvia 60 2 98 0 Lithuania 1,744 0 0 100 Luxembourg 135 0 0 100 Malta 88 0 100 0 Netherlands 1,160 11 89 0 Romania 137 0 0 100 Slovakia 1,010 1 99 0 Slovenia 392 0 0 100 Spain 1,880 0 76 23 United Kingdom 8,644 28 21 51 Total (19 MSs) 22,442 13 47 39 Iceland 33 33 45 21 Norway 1,322 73 17 10
MS: Member State; N: number of the tested isolates.
Multi-drug resistance of human Salmonella spp. to 10 antimicrobials were also analysed. The 10 antimicrobials included were ampicillin, cefotaxime, chloramphenicol, ciprofloxacin/nalidixic acid, gentamicin, kanamycin, streptomycin, sulfonamides, tetracyclines and trimethoprim. Of these, only kanamycin is not on the list of antimicrobials tested for in food and animal isolates. Resistance to nalidixic acid and ciprofloxacin was addressed together: in the event that an isolate was resistant or exhibited intermediate resistance to either of these antimicrobials, the isolate was classified as non-susceptible to the combined antimicrobial ciprofloxacin/nalidixic acid, as the two substances belong to the same antimicrobial family.
Multi-drug resistance of an isolate was defined as non-susceptibility to at least three different antimicrobial classes (Magiorakos et al., 2012). Co-resistance to ciprofloxacin and cefotaxime was also estimated as these two antimicrobials are considered the most important for treatment of severe salmonellosis (ECDC et al., 2009). Only countries which reported the results of tests on the full range of antimicrobials were included in the analysis.

EU summary report on antimicrobial resistance in zoonotic and indicator bacteriafrom humans, animals and food 2012
EFSA Journal 2014;12(3):3590 238
8.1.2. Campylobacter data of human origin
Fourteen MSs and Iceland provided data for 2012. The antimicrobials reported on for Campylobacter were amoxicillin, ampicillin, ciprofloxacin, erythromycin, gentamicin, nalidixic acid and tetracyclines. Some countries reported on all of these and others on only a few (Table MM3). Countries reported qualitative data, i.e. interpreted AST results for tested isolates (S, I or R).
National public health reference laboratories were asked to provide the methods and guidelines used for testing and interpretation. AST for Campylobacter seems to be performed in local or regional laboratories to a higher extent than for Salmonella and the methods and guidelines used outside of the national public health laboratories may therefore not be known. Five countries used disc diffusion for their routine testing, while six countries used dilution or gradient strip (Table MM3). Four countries used both disc diffusion and dilution, depending on the circumstances and the antimicrobial.
The guidelines used for the interpretation at the national level differed between countries (Table MM3). Four countries used guidelines from the French Society for Microbiology (CA-SFM), three used guidelines from CLSI (M45-A), two used guidelines from EUCAST, two used a combination of CA-SFM and CLSI and four used other guidelines. Of the five antimicrobials reported on from both human and animal/food isolates, the EUCAST clinical breakpoints and ECOFFS were at the same MIC values except for ciprofloxacin and the combination C. coli/erythromycin, where the ECOFF was one dilution higher than the clinical breakpoint. No clinical breakpoints were available for gentamicin and nalidixic acid. The CA-SFM breakpoints were generally also in the same range or one dilution higher or lower than the ECOFF except for the combination C. coli/erythromycin, and tetracycline, where it was two dilution steps higher than the ECOFFs. The CLSI breakpoints were often set at up to two dilutions higher than the ECOFF (Figure CA1). Results for the antimicrobials for which there are major differences in the interpretive criteria should be interpreted with caution, and direct comparisons between countries should be avoided.
Results are presented for countries reporting data for more than 20 isolates for the antimicrobial in question. Trend lines within the period 2008 to 2012 are shown for those countries reporting data for at least three consecutive years and 10 isolates per year. Countries which did not detect any resistant isolates during the period are mentioned but not shown in the graphs. Results are presented separately for the two most important Campylobacter species: C. jejuni and C. coli.
In order to better assess the impact from food consumed within each reporting country on the antimicrobial resistance levels found in human Campylobacter isolates, the analysis focused on domestically acquired cases. However, since several countries had not provided any information on travel (or non-travel) of their cases, cases with unknown travel status were included in the analysis. The proportion of travel-associated, domestic and unknown cases among the tested Campylobacter isolates is presented in Table MM4. An analysis was also made on the most likely country of infection of each disease case to compare resistance levels in human Campylobacter infections acquired within the EU/EEA with those acquired when travelling in regions outside the EU/EEA.
Multi-drug resistance of human C. jejuni and C. coli to six antimicrobials was also analysed. The six antimicrobials were amoxicillin, ampicillin, ciprofloxacin/nalidixic acid, erythromycin, gentamicin and tetracyclines. Of these, amoxicillin and ampicillin are not on the list of antimicrobials tested for in food and animal isolates. Resistance was addressed to both nalidixic acid and ciprofloxacin together: in the event that an isolate was resistant or exhibited intermediate resistance to either of these antimicrobials, the isolate was classified as non-susceptible to the combined antimicrobial ciprofloxacin/nalidixic acid, as the two substances belong to the same antimicrobial family.
Multi-drug resistance of an isolate was defined as non-susceptibility to at least three different antimicrobial classes (Magiorakos et al., 2012). Co-resistance to ciprofloxacin and erythromycin was also estimated as these two antimicrobials are considered the most important for treatment of severe salmonellosis (ECDC et al., 2009). Only countries which reported the results of tests on the full range of antimicrobials were included in the analysis.

EU summary report on antimicrobial resistance in zoonotic and indicator bacteriafrom humans, animals and food 2012
EFSA Journal 2014;12(3):3590 239
Table MM3. Breakpoints used by MSs for the interpretation of 2012 susceptibility data on Campylobacter of human origin
Country Amoxicillin Ampicillin Ciprofloxacin Erythromycin Gentamicin Nalidixic acid Tetracyclines
Guidelines Method MIC mm MIC mm MIC mm MIC mm MIC mm MIC mm MIC mm
Austria >8 – >8 – >0.5 – >41 >82 – >2 – >16 – >2 – EUCAST 2012 Combination amoxicillin/clavulanate tested
Dilution
Estonia >16/2 < 14 >16 <14 >1 <22 >4 <17 >4 <16 >16 <15 >8 <17 CA-SFM 2010 Combination amoxicillin/clavulanate tested
Disc diffusion
France – < 14 – <14 – <22 – <17 – <16 – <15 NA NA CA-SFM. Combination amoxicillin/clavulanate tested
Disc diffusion
Italy NA NA – ≤6 – ≤6 – ≤6 – ≤6 – ≤6 – ≤6
CLSI M45-A Vol.26 no 19 for Cip and Ery. Same criteria applied for remaining antimicrobials
Disc diffusion
Hungary NA NA NA NA >4 – >41 >162 NA NA NA NA NA NA NA Unspecified reference Dilution (gradient strip)
Lithuania3 NA NA NA NA – ≤17 – ≤19 NA NA NA NA NA NA BSAC for disc diffusion Disc diffusion
Luxembourg – < 14 – < 14 >1 – >4 – – <16 – <15 NA <17 CA-SFM 2012 Disc diffusion and dilution (gradient strip)
Malta NA NA NA NA ≥1 – ≥4 – NA NA NA NA NA NA Personal communication from HPA in 2004
Dilution (gradient strip)
Netherlands3 NA NA NA NA ≥1.0–1.5 ≤ 19–20 ≥1.5–2.0 <13–≤23 NA NA NA NA ≥2–8 ≤17–28 Survey in 12 clinical labs in the Netherlands in 2009
Disc diffusion and dilution
Romania3 NA NA NA NA NA NA NA NA NA NA NA NA NA NA CA-SFM 2010 Combination amoxicillin/clavulanate tested
Disc diffusion
MS: Member State; MIC: minimum inhibitory concentration; –: this method is not used for the antimicrobial in question; NA: not applicable since this antimicrobial is not reported to The European Surveillance System or fewer than 20 isolates tested; EUCAST: European Committee on Antimicrobial Susceptibility Testing; CA-SFM: French Society for Microbiology; CLSI: Clinical and Laboratory Standards Institute; BSAC: British Society for Antimicrobial Chemotherapy; HPA: Health Protection Agency. 1. Breakpoint used for C. jejuni. 2. Breakpoint used for C. coli. 3. Interpretive criteria and comments shown are from the 2010 or 2011 report; clinical breakpoints for 2012 were not reported. Table continued overleaf.

EU summary report on antimicrobial resistance in zoonotic and indicator bacteriafrom humans, animals and food 2012
EFSA Journal 2014;12(3):3590 240
Table MM3 (continued). Breakpoints used by MSs for the interpretation of 2012 susceptibility data on Campylobacter of human origin
Country Amoxicillin Ampicillin Ciprofloxacin Erythromycin Gentamicin Nalidixic acid Tetracyclines
Guidelines Method MIC mm MIC mm MIC mm MIC mm MIC mm MIC mm MIC mm
Slovakia3 NA NA NA NA ≥4 – ≥32 – NA NA NA NA ≥16 – CLSI Dilution
Slovenia – < 14 – <14 ≥4 <22 ≥32 <17 – <16 – <15 – <17
CA-SFM 2010 for disc diffusion and CLSI M45-A for Cip and Ery gradient strip. Combination amoxicillin/clavulanate tested
Disc diffusion and dilution (gradient strip)
Spain >16/2 – NA NA ≥4 – ≥32 – >4 – >16 – ≥16 –
CA-SFM 2010 for Amx, Gen, Nal. CLSI-2010 M45AE for Cip, Ery, Tet Combination amoxicillin/clavulanate tested
Dilution (gradient strip)
United Kingdom3 – – >16 – >1 – >4 – >1 – >16 – >2 – EUCAST
Dilution (microbroth and gradient strip)
Iceland NA NA NA NA ≥4 ≤6 ≥32 ≤6 NA NA NA NA NA NA CLSI M45A2 2010
Disc diffusion and dilution (gradient strip)
MS: Member State; MIC: minimum inhibitory concentration; NA: not applicable since this antimicrobial is not reported to The European Surveillance System or fewer than 20 isolates tested; –: this method is not used for the antimicrobial in question; CA-SFM: French Society for Microbiology; CLSI: Clinical and Laboratory Standards Institute; EUCAST: European Committee on Antimicrobial Susceptibility Testing. 1. Breakpoint used for C. jejuni. 2. Breakpoint used for C. coli. 3. Interpretive criteria and comments shown are from the 2010 or 2011 report; clinical breakpoints for 2012 were not reported.

EU summary report on antimicrobial resistance in zoonotic and indicator bacteriafrom humans, animals and food 2012
EFSA Journal 2014;12(3):3590 241
Table MM4. Proportion of tested Campylobacter spp. isolates from human cases associated with travel, domestic cases and cases with unknown travel information by country in 2012
Country Tested isolates Travel-associated Domestic Unknown
N % % % Austria 387 0 0 100 Estonia 246 6 94 0 France 4,728 0 0 100 Hungary 71 0 100 0 Italy 319 9 24 67 Lithuania 228 0 72 27 Luxembourg 561 0 0 100 Malta 214 0 100 0 Netherlands 3,708 6 94 0 Romania 19 0 0 100 Slovakia 1,371 1 99 0 Slovenia 982 0 2 98 Spain 228 0 75 25 United Kingdom 25,715 1 11 89 Total (14 MSs) 38,777 1 22 77 Iceland 58 50 34 16
MS: Member State; N: number of the tested isolates.

EU summary report on antimicrobial resistance in zoonotic and indicator bacteriafrom humans, animals and food 2012
EFSA Journal 2014;12(3):3590 242
8.2. Antimicrobial susceptibility data from animals and food available in 2012
8.2.1. Data reported under Directive 2003/99/EC in 2012
MSs generated data on antimicrobial susceptibility through the testing of zoonotic and indicator bacteria isolated from various animal species/production types and food categories, sampled through a number of different national schemes. Isolates may have been collected by different monitoring approaches, either by active monitoring of animals and foods or, in some cases, by passive monitoring based on diagnostic submission of samples from clinical cases of disease in animals, or from foods sampled as part of investigatory work. In the case of passive monitoring, the isolates tested often constituted a sub-sample of the total isolates available at the National Reference Laboratory (NRL). Clinical investigation data were not accounted for in this report.
Dilution and disc diffusion testing methods were used by reporting MSs for susceptibility testing, and both quantitative and qualitative data were reported at the EU level.
‘Quantitative data’ derived from dilution methods consisted of the number of isolates having a specific MIC value (measured in mg/L) relative to the total number of isolates tested, for each antimicrobial agent and in each specific food/animal category.
‘Quantitative data’ derived from diffusion methods comprised the number of isolates having a specific IZD (measured in mm) relative to the total number of isolates tested, for each antimicrobial agent and in each food/animal category.
‘Qualitative data’ consisted of the number of isolates out of the total number of isolates that were resistant to each antimicrobial agent in each food/animal category; qualitative data can be generated either from MIC determination or from disc diffusion testing.
For the year 2012, 26 MSs and 3 non-MSs reported data on antimicrobial resistance in tested Salmonella and Campylobacter, commensal E. coli or MRSA isolates from food-producing animals and/or food. Data on antimicrobial resistance in tested Salmonella and Campylobacter have been reported on a mandatory basis under Directive 2003/99/EC and data on antimicrobial resistance in tested commensal E. coli and commensal enterococci or MRSA isolates have been reported by the MSs on a voluntary basis. An overview of the MSs and non-MSs reporting antimicrobial resistance data (which were included in this report) in 2012 is shown in Table MM5.
Table MM5. MSs reporting data in 2012 from animals and food and description of data included in the report
Bacteria Number of MSs and non-MSs
reporting quantitative or qualitative data
Number of the tested included in the report
MIC dilution Diffusion
Salmonella 24 MSs+3 non-MSs 73,840 3,821 Campylobacter 15 MSs+1 non-MS 18,191 – Indicator Escherichia coli 13 MSs+2 non-MSs 63,298 – MRSA1 1 MS+1 non-MS 2,100 –
MS: Member State; MIC: minimum inhibitory concentration; MRSA: methicillin-resistant Staphylococcus aureus. 1. In 2012, 10 MSs and one non-MS reported data on the occurrence of MRSA.
For the purpose of this report, only quantitative dilution and quantitative disc diffusion data have been considered.

EU summary report on antimicrobial resistance in zoonotic and indicator bacteriafrom humans, animals and food 2012
EFSA Journal 2014;12(3):3590 243
8.2.1.1. Resistance data in Salmonella and Campylobacter from animals and food
Quantitative (MIC) results on antimicrobial resistance in Salmonella isolates from animals and food were reported by 20 MSs and 2 non-MSs (Norway and Switzerland) in 2012. The information collected by these countries was in accordance with EFSA’s recommendations (EFSA, 2007); these data are described in Chapter 3. The countries reported results for only low numbers of isolates (fewer than 10) have been excluded from the analysis.
In 2012, 15 MSs and 1 non-MS (Switzerland) reported data on antimicrobial resistance in Campylobacter. All Campylobacter results were reported as MIC values in accordance with EFSA’s recommendations (EFSA, 2007). These data are described in Chapter 4.
8.2.1.2. Resistance data in indicator bacteria
For indicator (commensal) E. coli, a total of 11 MSs and 2 non-MSs (Norway and Switzerland) reported quantitative dilution (MIC) results from animals or meat derived from those animals; these data are described in Chapter 5. Some countries reported results for only low numbers of isolates (fewer than 10); these data have been excluded from the analysis. Slovenia and Portugal reported quantitative results for indicator E. coli isolates tested according to CLSI recommendations and using the CLSI disc diffusion method.
8.2.1.3. Resistance data to third-generation cephalosporins
In relation to third-generation cephalosporin resistance in indicator E. coli and Salmonella spp., EFSA’s recommendations suggest the use of cefotaxime alone to detect important types of resistance (EFSA, 2007). Most MSs reported results for cefotaxime; some also reported results for ceftazidime; these data are described in Chapter 7. Cefotaxime is likely to detect the presence of most cefotaximases (CTX-M enzymes), which appear to be currently the most prevalent type of ESBL enzymes in bacteria isolated from food-producing animals in the EU. The use of cefotaxime will also detect the presence of AmpC enzymes in Salmonella or E. coli. Some ESBLs are ceftazidimases rather than cefotaximases (particularly enzymes in the TEM and SHV families of ESBLs). Although testing both cefotaxime and ceftazidime is therefore optimal for the detection of all ESBLs and AmpC enzymes, EFSA’s guidelines have recommended testing cefotaxime to detect all CTX-M enzymes mainly for reasons of affordability.
8.2.1.4. Data on methicillin-resistant Staphylococcus aureus (MRSA)
Data relating to MRSA prevalence were reported by 10 MSs and one non-MS (Switzerland). Among these, Switzerland reported data on resistance in MRSA isolates from pigs and Belgium in MRSA isolates from cattle. The methods for collecting and testing samples for MRSA are not harmonised between MSs and as a result MSs may use differing procedures. Owing to the variety of methods employed by MSs, these are explained in detail within Chapter 6 to enable readers to better follow the procedures carried out by individual countries.
There is an important difference between the methods used to isolate Salmonella, Campylobacter and indicator E. coli and that used to isolate MRSA. For the former group of organisms, there is no selective medium used to isolate from primary samples organisms possessing a particular resistance, whereas, for MRSA, antimicrobials are used to selectively isolate only those Staphylococcus aureus isolates which are resistant to methicillin. Some MSs may have sampled particular production types of animals (for example laying hens in Gallus gallus or veal calves in cattle), and this introduces another source of possible variation which may account for observed differences between MSs.

EU summary report on antimicrobial resistance in zoonotic and indicator bacteriafrom humans, animals and food 2012
EFSA Journal 2014;12(3):3590 244
8.3. Antimicrobials used for susceptibility testing in animals and food
The antimicrobials incorporated in this summary analysis were selected based on their relative public health importance and as representatives of different antimicrobial classes, taking into account EFSA’s reports and recommendations on the harmonised monitoring and reporting of antimicrobial susceptibility data (EFSA 2007, 2008).
8.3.1. Antimicrobials for susceptibility testing of Salmonella
In 2012, both dilution and disc diffusion methods were used to test the susceptibility of Salmonella isolates from animals and food by MSs. Tables MM6 and MM7 show the antimicrobials selected by the different countries for susceptibility testing. Quantitative dilution results allowed MIC distributions to be reported for Salmonella for the following antimicrobials: ampicillin, apramycin, cefotaxime, ceftazidime, ceftiofur, chloramphenicol, ciprofloxacin, colistin, florfenicol, gentamicin, kanamycin, nalidixic acid, neomycin, spectinomycin, streptomycin, sulfonamides, trimethoprim and tetracyclines. For further information on reported MIC distributions and the number of resistant isolates, refer to the Level 3 tables published on the EFSA website.
Data on Salmonella which were reported as disc diffusion data are presented in Appendix 2. Although results may not be directly comparable between MSs, it is anticipated that in most cases procedures will not have changed markedly over time within a country, and therefore comparisons of the proportion of resistant isolates over time in that country may be possible.

EU summary report on antimicrobial resistance in zoonotic and indicator bacteriafrom humans, animals and food 2012
EFSA Journal 2014;12(3):3590 245
Table MM6. Antimicrobials selected for susceptibility testing of Salmonella isolates from animals and food by MSs and non-MSs reporting quantitative data as MIC distributions, in 2012
Country A
mpi
cilli
n
Apr
amyc
in
Cef
otax
ime
Cef
tazi
dim
e
Cef
tiofu
r
Chl
oram
phen
icol
Cip
roflo
xaci
n
Col
istin
Flor
feni
col
Gen
tam
icin
Kan
amyc
in
Nal
idix
ic a
cid
Neo
myc
in
Spec
tinom
ycin
Stre
ptom
ycin
Sulfo
nam
ides
Trim
etho
prim
Tetr
acyc
lines
Austria ● ● ● ● ● ● ● ● ● ● ● ● ● ● Belgium ● ● ● ● ● ● ● ● ● ● ● ● ● ● Czech Republic ● ● ● ● ● ● ● ● ● ● ● Denmark ● ● ● ● ● ● ● ● ● ● ● ● ● ● ● ● Estonia ● ● ● ● ● ● ● ● ● ● ● ● ● ● Finland ● ● ● ● ● ● ● ● ● ● ● ● Germany ● ● ● ● ● ● ● ● ● ● ● ● ● Hungary ● ● ● ● ● ● ● ● ● ● Ireland ● ● ● ● ● ● ● ● ● ● ● ● ● Italy ● ● ● ● ● ● ● ● ● ● ● ● ● Latvia ● ● ● ● ● ● ● ● ● ● ● ● Netherlands ● ● ● ● ● ● ● ● ● ● ● ● ● ● Norway ● ● ● ● ● ● ● ● ● Poland ● ● ● ● ● ● ● ● ● ● ● ● ● Portugal ● ● ● ● ● ● ● ● ● ● Romania ● ● ● ● ● ● ● ● ● ● ● ● ● ● Slovakia ● ● ● ● ● ● ● ● ● ● ● ● ● ● Spain ● ● ● ● ● ● ● ● ● ● ● ● ● ● Sweden ● ● ● ● ● ● ● ● ● ● ● ● Switzerland ● ● ● ● ● ● ● ● ● ● ● ● ● ● United Kingdom ● ● ● ● ● ● ● ● ● ● ●
MS: Member State; MIC: minimum inhibitory concentration. Note: Sulfonamides may include a variety of substances.
Table MM7. Antimicrobials selected for susceptibility testing of Salmonella isolates from animals and food by MSs reporting quantitative data as disc inhibition zones, in 2012
Country
Am
ikac
in
Am
pici
llin
Cef
epim
e
Cef
otax
ime
Chl
oram
phen
icol
Cip
roflo
xaci
n
Erta
pene
m
Gen
tam
icin
Imip
enem
Levo
floxa
cin
Mer
open
em
Nal
idix
ic a
cid
Pipe
raci
llin
Stre
ptom
ycin
Sulfo
nam
ides
Tetr
acyc
lines
Tobr
amyc
in
Trim
etho
prim
Greece ● ● ● ● ● ● ● ● ● ● Spain ● ● ● ● ● ● ● ● ● ● ● ● ● ● ● ● ● ●
MS: Member State. Note: Sulfonamides may include a variety of substances.

EU summary report on antimicrobial resistance in zoonotic and indicator bacteriafrom humans, animals and food 2012
EFSA Journal 2014;12(3):3590 246
8.3.2. Antimicrobials for susceptibility testing of Campylobacter
In 2012, all quantitative Campylobacter data were reported as MIC values, generated by dilution methods. Table MM8 shows the antimicrobials selected by the different countries for susceptibility testing of Campylobacter isolates. In this report, antimicrobial resistance was reported separately for C. jejuni and C. coli.
MIC distributions were analysed for the following antimicrobials: ciprofloxacin, chloramphenicol, erythromycin, gentamicin, nalidixic acid, streptomycin and tetracyclines. These antimicrobials were selected based on public health relevance and as representatives of different classes of antimicrobials. For further information on reported MIC distributions and the number of resistant isolates, refer to the Level 3 tables published on the EFSA website.
Table MM8. Antimicrobials selected for susceptibility testing of Campylobacter isolates from animals and food by MSs and non-MSs reporting quantitative data as MIC distributions, in 2012
Country
Am
oxic
illin
Am
pici
llin
Chl
oram
phen
icol
Cip
roflo
xaci
n
Cla
rithr
omyc
in
Eryt
hrom
ycin
Gen
tam
icin
Imip
enem
Nal
idix
ic a
cid
Neo
myc
in
Stre
ptom
ycin
Sulfo
nam
ides
Tetr
acyc
lines
Tula
thro
myc
in
Austria ● ● ● ● ● ● ● ● ● ● ● Belgium ● ● ● ● ● ● ● Czech Republic ● ● ● ● ● ● Denmark ● ● ● ● ● ● ● Estonia ● ● ● ● ● ● Finland ● ● ● ● ● ● France ● ● ● ● ● ● Germany ● ● ● ● ● ● ● Hungary ● ● ● ● ● ● ● Italy ● ● ● ● ● ● ● Netherlands ● ● ● ● ● ● ● ● ● ● ● ● Poland ● ● ● ● ● ●
Romania ● ● ● ● ● ● ● Spain ● ● ● ● ● ● ● ● Sweden ● ● ● ● ● ● Switzerland ● ● ● ● ● ● ●
MS: Member State; MIC: minimum inhibitory concentration. Note: Sulfonamides may include a variety of substances.

EU summary report on antimicrobial resistance in zoonotic and indicator bacteriafrom humans, animals and food 2012
EFSA Journal 2014;12(3):3590 247
8.3.3. Antimicrobials for susceptibility testing of Escherichia coli
In 2012, both dilution and disc diffusion methods were used to test the susceptibility of E. coli isolates from animals and food. Tables MM9 and MM10 show the antimicrobials selected by the different countries for susceptibility testing. In this report, susceptibility data from food and animal isolates are presented.
MIC distributions were analysed for the following antimicrobials: ampicillin, apramycin, cefotaxime, ceftazidime, ceftiofur, chloramphenicol, ciprofloxacin, colistin, florfenicol, gentamicin, kanamycin, meropenem, nalidixic acid, neomycin, spectinomycin, streptomycin, sulfonamides, trimethoprim and tetracyclines. These antimicrobials were selected based on their public health relevance and as representatives of different antimicrobial classes. For further information on reported MIC distributions and the number of resistant isolates, refer to the Level 3 tables published on the EFSA website.
Table MM9. Antimicrobials selected for susceptibility testing of Escherichia coli isolates from animals and food by MSs and non-MSs reporting quantitative data as MIC distributions, in 2012
Country
Am
pici
llin
Apr
amyc
in
Cef
otax
ime
Cef
tazi
dim
e
Cef
tiofu
r
Chl
oram
phen
icol
Cip
roflo
xaci
n
Col
istin
Flor
feni
col
Gen
tam
icin
Kan
amyc
in
Mer
open
em
Nal
idix
ic a
cid
Neo
myc
in
Spec
tinom
ycin
Stre
ptom
ycin
Sulfo
nam
ides
Trim
etho
prim
Tetr
acyc
lines
Austria ● ● ● ● ● ● ● ● ● ● ● ● Belgium ● ● ● ● ● ● ● ● ● ● ● ● ● ● Denmark ● ● ● ● ● ● ● ● ● ● ● ● ● ● ● ● Finland ● ● ● ● ● ● ● ● ● ● ● ● ● France ● ● ● ● ● ● ● ● ● ● ● ● Germany ● ● ● ● ● ● ● ● ● ● ● ● ● Hungary ● ● ● ● ● ● ● ● ● ● Netherlands ● ● ● ● ● ● ● ● ● ● ● ● ● ● Norway ● ● ● ● ● ● ● ● ● Poland ● ● ● ● ● ● ● ● ● ● ● ● ● Spain ● ● ● ● ● ● ● ● ● ● ● ● Sweden ● ● ● ● ● ● ● ● ● ● ● ● ● Switzerland ● ● ● ● ● ● ● ● ● ● ● ● ● ●
MS: Member State; MIC: minimum inhibitory concentration. Note: Sulfonamides may include a variety of substances.
Table MM10. Antimicrobials selected for susceptibility testing of Escherichia coli isolates from animals and food by one MS reporting quantitative data as disc inhibition zones, in 2012
Country
Am
ikac
in
Am
pici
llin
Cef
azol
in
Cef
otax
ime
Cef
oxiti
n C
efpo
doxi
me
Cef
tazi
dim
e C
epha
loth
in
Chl
oram
phen
icol
C
ipro
floxa
cin
Col
istin
En
roflo
xaci
n Er
tape
nem
Fl
orfe
nico
l G
enta
mic
in
Imip
enem
K
anam
ycin
M
arbo
floxa
cin
Mer
open
em
Mox
iflox
acin
N
alid
ixic
aci
d N
eom
ycin
N
itrof
uran
toin
N
orflo
xaci
n St
rept
omyc
in
Sulfo
nam
ides
Tr
imet
hopr
im
Tetr
acyc
lines
To
bram
ycin
Portugal ● ● ● ● ● ● ● ● ● ● ● ● ● ● ● ● ● ● ● ● ● ●
Slovenia ● ● ● ● ● ● ● ● ● ● ● ● ● ● ●
MS: Member State. Note: Sulfonamides may include a variety of substances.

EU summary report on antimicrobial resistance in zoonotic and indicator bacteriafrom humans, animals and food 2012
EFSA Journal 2014;12(3):3590 248
8.3.4. Antimicrobials for susceptibility testing of MRSA
In 2012, Belgium reported data on susceptibility testing of MRSA isolates from cattle and Switzerland reported data from pigs. Details of the antimicrobials selected by Belgium and Switzerland are provided in Chapter 6. For further information on reported MIC distributions and the number of resistant isolates, refer to the Level 3 tables published on the EFSA website.
8.4. Data description and analysis
8.4.1. Description and analysis of antimicrobial resistance data Methods to interpret, describe, and analyse antimicrobial resistance data were presented in detail in the 2004 to 2007 Community Summary Report on Antimicrobial Resistance (EFSA, 2010b).
Overview tables of the resistance data reported
Quantitative MIC data, generated by dilution methods recommended by EFSA, have been reported and analysed together; quantitative IZD data, which constitute a relatively small fraction of the total data, have not been included in the analysis of quantitative data and have been described separately in Appendix 2. The IZD data reported by MSs under Directive 2003/99/EC for the years 2004 to 2007 were interpreted as described in previous EU Summary Reports. Some MSs reported antimicrobial resistance data as both quantitative and qualitative data; in that case, only the quantitative data have been included. Data generated from the antimicrobial susceptibility testing and reported as quantitative/qualitative by MSs have been described in the overview tables of individual chapters.
MIC distributions, ECOFFs and the occurrence of resistance
For each combination of microorganism, antimicrobial and food or animal category tested, MIC distributions have been presented as frequency tables, giving the number of isolates tested having a given MIC at each test dilution (mg/L) of the antimicrobial. MIC distributions are available as Level 3 tables on the EFSA website.
Quantitative MIC data for Salmonella were, wherever possible, interpreted using ECOFFs as listed in Decision 2007/407/EC (corresponding to those published by EUCAST at the time of publication of the Decision) and presented in Table MM11. Subsequent amendments by EUCAST to the ECOFFs have not yet been incorporated; this will be achieved by issue of a revised Decision. An isolate was defined as ‘microbiologically resistant’ (i.e. displaying a decreased susceptibility) to a selected antimicrobial when its MIC value was above the ECOFF. A more sensitive MIC breakpoint or ECOFF (i.e. a lower MIC breakpoint or ECOFF) might be expected to result in more isolates being defined as clinically or microbiologically resistant, respectively; the number of isolates affected in that way will of course depend on the distribution of MIC results.
REVISION OF ECOFFS
The epidemiological cut-off value (ECOFF) for E. coli versus ciprofloxacin has been recently revised by the European Committee on Antimicrobial Susceptibility Testing (EUCAST). Wild-type isolates are now considered to have a ciprofloxacin minimum inhibitory concentration greater than 0.06 mg/L, an increase from the previous ECOFF of greater than 0.03 mg/L. The proportion of isolates showing microbiological resistance according to this breakpoint will alter when the new breakpoint is adopted and in fact will be reduced. For reasons of continuity and to comply with the current legislation where applicable, the ECOFFs used in this report have been those adopted in EFSA’s recommendations (EFSA 2007, 2008) and quoted in Commission Decision 2007/407/EC. For these reasons, the most recent revisions by EUCAST have not been included in this report. The report for 2013, will incorporate all of these changes in a comprehensive revision, which will also re-evaluate the historical data using the revised ECOFFs, as well as taking into account revised EU legislation in this area, which will include the revised ECOFFs.

EU summary report on antimicrobial resistance in zoonotic and indicator bacteriafrom humans, animals and food 2012
EFSA Journal 2014;12(3):3590 249
The occurrence of resistance to a number of antimicrobials was determined (giving the percentage of isolates ‘microbiologically resistant’ out of those tested) for Salmonella, Campylobacter, indicator E. coli and enterococcal isolates from Gallus gallus, turkeys, pigs and cattle, and meat from Gallus gallus, pigs and cattle and are presented and analysed in tables on the occurrence of resistance in this report. These are the animal and food categories most frequently reported on by most MSs. Additionally, for the first time, data have been presented at the production-type level where possible. Data are included only if quantitative MIC data are provided by more than four MSs or disc diffusion data are provided by more than two MSs for the bacterium–animal/food category combination. An exception to this rule has nevertheless been made in the chapters on Salmonella serovars of public health importance (see below) and on MRSA. Data reported from fewer than 10 tested isolates per combination and per MS are not included. Data are reported in separate chapters dedicated to each microorganism and in Appendix 1 for Salmonella data obtained from disc diffusion. In addition, the occurrence of resistance (i.e. resistance levels) in reporting MS groups was calculated as totals (the total number of resistant isolates out of the total number of tested isolates across reporting MSs), and not the weighted means.
Resistance in Salmonella serovars of public health importance
In this report, antimicrobial resistance in tested Salmonella isolates were aggregated to give a value for Salmonella spp. for each country and food/animal category. In addition, whenever sufficient data were transmitted by MSs for a particular food/animal category, the most prevalent Salmonella serovars, S. Enteritidis and S. Typhimurium, were also reported separately for that food/animal category. Additional tables have been included in this year’s report to describe the occurrence of antimicrobial resistance among Salmonella serovars of public health importance. In order to present a complete overview of the animal populations and food categories in which specific Salmonella serovars of public health importance have been recovered, data derived from fewer than four reporting countries have been included.
Data description
Throughout the report, the following definitions apply: Level or occurrence of antimicrobial resistance means the percentage of resistant isolates as a
proportion of the isolates tested of that microorganism. MS reporting group means the MSs that provided data and were included in the relevant table of
antimicrobial resistance for that bacterium–food or animal category–antimicrobial combination.
Terms used to describe the antimicrobial resistance levels are: rare: ......................... <0.1 % very low: .................. 0.1 % to 1 % low: ......................... >1 % to 10 % moderate: ................ >10 % to 20 % high: ........................ >20 % to 50 % very high: ................. >50 % to 70 % extremely high: ........ >70 %
These terms are applied to all antimicrobials. However, the significance of a given level of resistance will depend on the particular antimicrobial and its importance in human and veterinary medicine.
Temporal trends in resistance
Where the minimum criteria were met for the inclusion of data in this report (i.e. more than 10 isolates tested by a MS and more than four MSs reporting results for that antimicrobial, microorganism, food or animal category), then temporal trend graphs were generated showing the resistance to different antimicrobials over the 2006 to 2012 period, by plotting the level of resistance for each year of sampling. Only countries which had reported for four or more years in the 2006 to 2012 period were included.
In order to assess the statistical significance of temporal trends, the proportions of resistance were modelled against time in a logistic regression. Results were provided only where there were five years or more of available data to use in the model, and where the likelihood ratio test suggested that the model was meaningful. This analysis was carried out in SAS9.2 using the PROC LOGISTIC function for each country

EU summary report on antimicrobial resistance in zoonotic and indicator bacteriafrom humans, animals and food 2012
EFSA Journal 2014;12(3):3590 250
where temporal trend data were presented in the report. The PROC LOGISTIC function uses a logit transform to model proportion of prevalence against year, and provides estimates for both intercepts and slope. Models resulting in a p-value of <0.05 were considered to be significant.
For ciprofloxacin and nalidixic acid, resistance trends over time were visually explored for Salmonella, Campylobacter and indicator E. coli by trellis graphs, using the lattice package in the R software (http://www.r-project.org). Graphs were created for those countries for which resistance data were available for four or more years, for at least one of the two antimicrobials. MS-specific resistance levels trend graphs use a unique scale and countries are shown in alphabetical order.
Spatial analysis of resistance through maps
MS-specific antimicrobial resistance levels for selected bacterium/food or animal category combinations were plotted in maps for 2012, using ArcGIS 9.3. In the maps, resistance levels are presented with colours reflecting the continuous scale of resistance to the antimicrobial of interest among reporting MSs; thus, there might be some apparent discrepancies between the colours and resistance levels between maps. Percentages shown in this map refer to countries that reported quantitative MIC data for more than 10 isolates in 2012. When quantitative 2012 data were not available, the 2011 level of resistance was used instead and referred by a footnote to the map. The countries labelled as ‘qualitative data’ therefore include those reporting IZD data, MIC data for fewer than 10 isolates or purely qualitative data (as proportion of resistant isolates).
Table MM11. Epidemiological cut-off values used to interpret MIC distributions (mg/L) for bacteria from animals and food – the given values define the microbiologically resistant isolates
Antimicrobial agent Salmonella Escherichia coli Campylobacter
jejuni Campylobacter
coli mg/L mg/L mg/L mg/L
Ampicillin >4 >8 Apramycin >16 >16 Avilamycin Cefotaxime >0.5 >0.25 Ceftazidime >2 >0.5 Ceftiofur >2 >1 Chloramphenicol >16 >16 >16 >16 Ciprofloxacin >0.06 >0.03 >1 >1 Erythromycin >4 >16 Florfenicol >16 >16 Gentamicin >2 >2 >1 >2 Linezolid Nalidixic acid >16 >16 >16 >32 Neomycin >4 >8 Spectinomycin >64 Streptomycin >32 >16 >2 >4 Sulfonamides >2561 >64 Quinupristin/dalfopristin Tetracyclines >8 >8 >2 >2 Trimethoprim >2 >2 Vancomycin
MIC: minimum inhibitory concentration. 1. Cut-off values were not defined by the European Committee on Antimicrobial Susceptibility Testing; instead cut-off values defined
by the European Union Reference Laboratory on antimicrobial resistance (Technical University of Denmark) were used.

EU summary report on antimicrobial resistance in zoonotic and indicator bacteriafrom humans, animals and food 2012
EFSA Journal 2014;12(3):3590 251
8.4.2. Analysis of multi-resistance and co-resistance data
As a consequence of the availability of antimicrobial resistance data at an isolate-based level in an important number of MSs, the analysis of multi-resistance and co-resistance data becomes a feasible and important exercise in the light of the public health relevance of the emergence of multi-resistant bacteria. As a matter of fact, the analysis and reporting on multi-resistance in the 2012 EU Summary Report on antimicrobial resistance was previously recommended and endorsed by the Task Force on Zoonoses Data Collection at its meeting on antimicrobial resistance in April 2013.
The intention is to focus mainly on multi-/co-resistance patterns involving critically important antimicrobials according to the bacterial species, such as cephalosporins, fluoroquinolones and macrolides, and to summarise important information in the EU Summary Report. The occurrence of the isolates of a serotype/resistance pattern of interest is studied at the MS level and at the reporting MS group/EU level, as the overall picture for all MSs might show a more definite pattern of emergence and spread. In addition, the analysis of data may reveal the existence of new or emerging patterns of multi-resistance, particularly in Salmonella serotypes.
8.4.2.1. Analysis of multi-resistance patterns
Definitions
For the purpose of this analysis, a multi-resistant isolate is one defined as resistant to at least three different antimicrobial substances, belonging to any three antimicrobial families listed in the harmonised set of antimicrobials included in the EFSA recommendations (EFSA, 2007, 2008). Table MM12 lists those recommended antimicrobials.
Resistance to nalidixic acid and ciprofloxacin is addressed together: an isolate that is resistant to either of the two will be termed resistant to the combined antimicrobial ciprofloxacin/nalidixic acid, as the two substances belong to the same antimicrobial family.
By contrast, a fully susceptible isolate is one defined as non-resistant to all of the antimicrobial substances included in the set of substances recommended for Salmonella, Campylobacter and indicator E. coli.
The term co-resistance has been defined as two or more resistance genes which are genetically linked, i.e. located adjacent or close to each other on a mobile genetic element (Chapman, 2003). For brevity, the term is used slightly more loosely in this report and indicates two or more phenotypic resistances to different classes of antimicrobials, exhibited by the same bacterial isolate.
Table MM12. Harmonised set of antimicrobials listed in the EFSA recommendations
Zoonotic bacteria Indicator bacteria Salmonella Campylobacter coli/C. jejuni Escherichia coli
Ampicillin (Amp) Ciprofloxacin (Cip) Ampicillin (Amp) Cefotaxime (Ctx) Erythromycin (Ery) Cefotaxime (Ctx) Chloramphenicol (Chl) Gentamicin (Gen) Chloramphenicol (Chl) Ciprofloxacin (Cip) Streptomycin (Str) Ciprofloxacin (Cip) Gentamicin (Gen) Tetracycline (Tet) Gentamicin (Gen) Nalidixic acid (Nal) Nalidixic acid (Nal) Streptomycin (Str) Streptomycin (Str) Sulfonamides (Su) Sulfonamides (Su) Tetracycline (Tet) Tetracycline (Tet) Trimethoprim (Tmp) Trimethoprim (Tmp)

EU summary report on antimicrobial resistance in zoonotic and indicator bacteriafrom humans, animals and food 2012
EFSA Journal 2014;12(3):3590 252
Data analysis
The frequency and percentage of isolates that are considered susceptible/resistant to all of the antimicrobials tested were determined for Salmonella (Salmonella spp., S. Enteritidis, S. Typhimurium and monophasic S. Typhimurium), Campylobacter species and indicator E. coli for each country and each animal population/food category. Isolates for which no susceptibility data were provided for some of the antimicrobial substances were disregarded. Data analysis was presented for a particular country only when the number of tested isolates was at least 10, except for monophasic Salmonella Typhimurium.
Summary indicators of multi-resistance
To illustrate the relative proportions of multi-resistant isolates and the diversity of the resistance to multiple antimicrobials, graphical illustration was chosen. The percentages of isolates susceptible and resistant to one, two, three, etc., antimicrobials are shown using a composite bar graph displaying stacked bars, but only for certain combinations of bacterium–animal population or food category–MS of particular interest.
The objective is first to give an overview of the situation on multi-resistance through summary indicators:
- the proportion of fully susceptible isolates;
- the proportion of multi-resistant isolates;
- an index/indices of diversity, such as the entropy measure18, summarising the distributions of isolate frequencies and, thus, the diversity among the different categories of multi-resistance (resistance to one, two, three, etc., antimicrobials).
The ‘summary indicators’ of multi-resistance can be calculated and reported yearly and, therefore, used to follow evolution of the multi-resistance situation across animal populations/food categories and MSs over time.
Diversity of multi-resistance
Resistance can be limited to resistance to only one or two antimicrobial substances, or resistance can be equally spread out from resistance from the lower to the higher number of antimicrobial substances. In other words, the frequencies across the categories resistant to one, two, three substances, and so on, can follow different types of distributions: skewed to the right with higher frequencies for the lower numbers resistant; highly peaked or fully spread out; or even, at least in theory, with higher frequencies for the larger numbers resistant. The entropy measure quantifies the degree of diversity of resistance. The standardised unweighted entropy takes values between 0 and 1. It takes the value 0 if all resistance is of one single type (e.g. resistance to exactly two antimicrobial substances) and takes the maximal value 1 if resistance to any number of antimicrobial substances is occurring equally often. The unweighted version does not take any order into account. Therefore, particular frequencies at the lower numbers resistant lead to the same entropy value when having these particular frequencies at the higher number resistant. The weighted entropy takes higher values if resistance appears to higher numbers of antimicrobial substances.
8.4.2.2. Analysis of co-resistance
The co-resistance patterns of interest
Co-resistance to cefotaxime and ciprofloxacin was estimated in Salmonella and E. coli isolates, as these two antimicrobials are of particular interest in human medicine. Co-resistance was addressed using both ECOFFs and clinical breakpoints in isolates of these bacteria. In C. jejuni and C. coli isolates, co-resistance to ciprofloxacin and erythromycin was estimated as these two antimicrobials are of particular interest in human medicine in the treatment of severe campylobacteriosis. The interpretive ECOFFs used to address co-resistance to ciprofloxacin and erythromycin were, for C. jejuni, Cip>1 mg/L and Ery>4 mg/L and, for C. coli, Cip>1 mg/L and Ery>16 mg/L. These values may be considered as very similar to clinical breakpoints.
18 Weighted or unweighted entropy measures may be considered.
EU summary report on antimicrobial resistance in zoonotic and indicator bacteriafrom humans, animals and food 2012
EFSA Journal 2014;12(3):3590 253
9. REFERENCES
Bertrand S, Weill FX, Cloeckaert A, Vrints M, Mairiaux E, Praud K, Dierick K, Wildemauve C, Godard C, Butaye P, Imberechts H, Grimont PA and Collard JM, 2006. Clonal emergence of extended-spectrum beta-lactamase (CTX-M-2)-producing Salmonella enterica serovar Virchow isolates with reduced susceptibilities to ciprofloxacin among poultry and humans in Belgium and France (2000 to 2003). Journal of Clinical Microbiology, 44, 2897–2903.
Beutlich J, Jahn S, Malorny B, Hauser E, Hühn S, Schroeter A, Rodicio MR, Appel B, Threlfall J, Mevius D, Helmuth R and Guerra B, 2011. Antimicrobial Resistance and Virulence Determinants in European Salmonella Genomic Island 1-Positive Salmonella enterica Isolates from Different Origins. Applied and Environmental Microbiology, 77, 5655–5664.
Bosch T, Verkade E, van Luit M, Pot B, Vauterin P, Burggrave R, Savelkoul P, Kluytmans J and Schoul L, 2013. High resolution typing by whole genome mapping enables discrimination of LA-MRSA (CC398) strains and identification of transmission. PLoS One, 8, e66493.
Bugarel M, Vignaud M-L, Moury F, Fach P and Brisabois A, 2013. Molecular identification in monophasic and nonmotile variants of Salmonella enterica serovar Typhimurium. MicrobiologyOpen, 1, 481–489.
Butaye P and Nemeghaire S., 2012. MRSA Surveillance 2012: Bovines. Centrum voor Onderzoek in Diergeneeskunde en Agrochemie. Available online: http://www.amcra.be/sites/default/files/Report%20MRSA%20cattle%20data%202012.pdf
Chapman JS, 2003. Disinfectant resistance mechanisms, cross-resistance, and co-resistance. International Biodeterioration & Biodegradation, 51, 271–276.
De Neeling AJ, van den Broek MJM, Spalburg EC, van Santen-Verheuvel MG, Dam-Deisz WD, Boshuizen HC, van de Giessen AW, van Duijkeren E and Huijsdens XW, 2007. High prevalence of methicillin resistant Staphylococcus aureus in pigs. Veterinary Microbiology, 122, 366–372.
ECDC (European Centre for Disease Prevention and Control), EFSA (European Food Safety Authority), EMEA (European Medicines Agency) and SCENIHR (European Commission‘s Scientific Committee on Emerging and Newly Identified Health Risks), 2009. Joint Opinion on antimicrobial resistance (AMR) focused on zoonotic infections. EFSA Journal 2009;7(11):1372, 78 pp., doi:10.2903/j.efsa.2009.1372
ECDC (European Centre for Disease Prevention and Control), 2012. Third external quality assurance scheme for Salmonella typing. Available online: http://www.ecdc.europa.eu/en/publications/Publications/1204-TER-EQA-Salmonella-typing.pdf
ECDC (European Centre for Disease Prevention and Control), 2013. Antimicrobial resistance surveillance in Europe 2012. Annual Report of the European Antimicrobial Resistance Surveillance Network (EARS-Net). Stockholm: ECDC; 2013. Available online: http://ecdc.europa.eu/en/publications/Publications/antimicrobial-resistance-surveillance-europe-2012.pdf
ECDC (European Centre for Disease Prevention and Control), 2014. EU protocol for harmonised monitoring of antimicrobial resistance in human Salmonella and Campylobacter isolates. Stockholm: ECDC; 2014. Available online: http://www.ecdc.europa.eu/en/publications/Publications/harmonised-monitoring-antimicrobial-resistance-human-salmonella-campylobacter-isolates-EU-protocol.pdf
EFSA (European Food Safety Authority), 2007. Report of the Task Force of Zoonoses Data Collection
including a proposal for harmonized monitoring scheme of antimicrobial resistance in Salmonella in fowl (Gallus gallus), turkeys, and pigs and Campylobacter jejuni and C. coli in broilers. The EFSA Journal 2007, 96r, 1–46.
EFSA (European Food Safety Authority), 2008. Report from the Task Force on Zoonoses Data Collection including guidance for harmonized monitoring and reporting of antimicrobial resistance in commensal Escherichia coli and Enterococcus spp. from food animals. The EFSA Journal 2008, 141r, 1–44.
EFSA (European Food Safety Authority), 2009a. Joint scientific report of ECDC, EFSA and EMEA on meticillin resistant Staphylococcus aureus (MRSA) in livestock, companion animals and foods. EFSA-Q-

EU summary report on antimicrobial resistance in zoonotic and indicator bacteriafrom humans, animals and food 2012
EFSA Journal 2014;12(3):3590 254
2009-00612 (EFSA Scientific Report (2009) 301, 1–10) and EMEA/CVMP/SAGAM/ 62464/2009. The EFSA Journal 2009, 301r, 1-10.
EFSA (European Food Safety Authority), 2009b. Analysis of the baseline survey on the prevalence of methicillin-resistant Staphylococcus aureus (MRSA) in holdings with breeding pigs, in the EU, 2008, Part A: MRSA prevalence estimates; on request from the European Commission. EFSA Journal 2009;7(11):1376, 82 pp., doi:10.2903/j.efsa.2009.1376
EFSA (European Food Safety Authority), 2009c. Scientific opinion of the Panel on Biological Hazards on a request from the European Commission on Assessment of the public health significance of meticillin resistant Staphylococcus aureus (MRSA) in animals and foods. The EFSA Journal 2009, 993, 1–73.
EFSA (European Food Safety Authority), 2010a. Analysis of the baseline survey on the prevalence of methicillin-resistant Staphylococcus aureus (MRSA) in holdings with breeding pigs, in the EU, 2008, Part B: factors associated with MRSA contamination of holdings; on request from the European Commission. EFSA Journal 2010;8(6):1597, 67 pp., doi:10.2903/j.efsa.2010.1597
EFSA (European Food Safety Authority), 2010b. The Community Summary Report on antimicrobial resistance in zoonotic and indicator bacteria from animals and food in the European Union in 2004–2007. EFSA Journal 2010;8(4):1309, 306 pp., doi:10.2903/j.efsa.2010.1309
EFSA (European Food Safety Authority), 2012a. Technical specifications for the analysis and reporting of data on antimicrobial resistance (AMR) in the European Union Summary Report. EFSA Journal 2012;10(2):2587, 53 pp., doi:10.2903/j.efsa.2012.2587
EFSA (European Food Safety Authority), 2012b. Technical specifications on the harmonised monitoring and reporting of antimicrobial resistance in Salmonella, Campylobacter and indicator Escherichia coli and Enterococcus spp. bacteria transmitted through food. EFSA Journal 2012;10(6):2742, 64 pp., doi:10.2903/j.efsa.2012.2742
EFSA (European Food Safety Authority), 2012c. Technical specifications for the harmonised monitoring and reporting of antimicrobial resistance in methicillin-resistent Staphylococcus aureus in food-producing animals and foods. EFSA Journal 2012;10(10):2897, 56 pp., doi:10.2903/j.efsa.2012.2897
EFSA BIOHAZ Panel (EFSA Panel on Biological Hazards), 2010a. Scientific Opinion on Quantification of the risk posed by broiler meat to human campylobacteriosis in the EU. EFSA Journal 2010;8(1):1437, 89 pp., doi:10.2903/j.efsa.2010.1437
EFSA BIOHAZ Panel (EFSA Panel on Biological Hazards), 2010b. Scientific Opinion on monitoring and assessment of the public health risk of “Salmonella Typhimurium-like” strains. EFSA Journal 2010;8(10):1826, 48 pp., doi:10.2903/j.efsa.2010.1826
EFSA (European Food Safety Authority) and ECDC (European Centre for Disease Prevention and Control), 2013. The European Union Summary Report on Trends and Sources of Zoonoses, Zoonotic agents and Food-borne Outbreaks in 2011. EFSA Journal 2013;11(4):3129, 250 pp., doi:10.2903/j.efsa.2013.3129
EFSA (European Food Safety Authority) and ECDC (European Centre for Disease Prevention and Control), 2014. The European Union Summary Report on Trends and Sources of Zoonoses, Zoonotic agents and Food-borne Outbreaks in 2012. EFSA Journal 2014;12(2):3547, 312 pp., doi:10.2903/j.efsa.2014.3547
Frost J, 1994. Testing for resistance to antibacterial drugs. In: Methods in practical laboratory bacteriology. Ed Chart H. CRC Press, New York, USA, p. 73–82.
Gal-Mor O, Valinsky L, Weinberger M, Guy S, Jaffe J, Schorr YI, Raisfeld A, Agmon V and Nissaan I, 2010. Multidrug-resistant Salmonella enterica serovar Infantis in Israel. Emerging Infectious Diseases Journal, 16, 1754–1757.
Garcia-Graells C, van Cleef BA, Larsen J, Denis O, Skov R and Voss A, 2013. Dynamic of livestock-associated methicillin-resistant Staphylococcus aureus CC398 in pig farm households: a pilot study. PLoS One, 31, e65512.

EU summary report on antimicrobial resistance in zoonotic and indicator bacteriafrom humans, animals and food 2012
EFSA Journal 2014;12(3):3590 255
Ge B, McDermott PF, White DG and Meng J, 2005. Role of efflux pumps and topoisomerase mutations in fluoroquinolone resistance in Campylobacter jejuni and Campylobacter coli. Antimicrobial Agents and Chemotherapy, 49, 3347–3354.
Gibreel A and Taylor DE, 2006. Macrolide resistance in Campylobacter jejuni and Campylobacter coli. Journal of Antimicrobial Chemotherapy, 58, 243–255.
Graveland H, Wagenaar JA, Heesterbeek H, Mevius D, van Duijkeren E and Heederik D, 2010. Methicillin resistant Staphylococcus aureus ST398 in veal calf farming: human MRSA carriage related with animal antimicrobial usage and farm hygiene. PLoS ONE, 5, e10990.
Hauschild T, Fessler AT, Kadlec K, Billerbeck C and Schwarz S, 2012. Detection of the novel vga(E) gene in methicillin-resistant Staphylococcus aureus CC398 isolates from cattle and poultry. Journal of Antimicrobial Chemotherapy, 67, 503–504.
Kadlec K, Pomba CF, Couto N and Schwarz S, 2010. Small plasmids carrying vga(A) or vga(C) genes mediate resistance to lincosamides, pleuromutilins and streptogramin A antibiotics in methicillin-resistant Staphylococcus aureus ST398 from swine. Journal of Antimicrobial Chemotherapy, 65, 2692–2698.
Kahlmeter G, Brown DF, Goldstein FW, MacGowan AP, Mouton JW, Osterlund A, Rodloff A, Steinbakk M, Urbaskova P and Vatopoulos A, 2003. European harmonization of MIC breakpoints for antimicrobial susceptibility testing of bacteria. Journal of Antimicrobial Chemotherapy, 52, 145–148.
Kehrenberg C, Cuny C, Strommenger B, Schwarz S and Witte W, 2009. Methicillin-resistant and -susceptible Staphylococcus aureus strains of clonal lineages ST398 and ST9 from swine carry the multidrug resistance gene cfr. Antimicrobial Agents and Chemotherapy, 53, 779–781.
Kerouanton A, Rose V, Weill FX, Granier S and Denis M, 2013. Genetic diversity and antimicrobial resistance profiles of Salmonella enterica serotype Derby isolated from pigs, pork and humans in France. Foodborne Pathogens and Disease, 10, 977–984.
Kirkpatrick BD and Tribble DR, 2011. Update on human Campylobacter jejuni infections. Current opinion in Gastroenterology, 27, 1–7.
Lan R, Reeves PR and Octavia S, 2009. Population structure, origins and evolution of major Salmonella enterica clones. Infection, Genetics and Evolution, 9, 996–1005.
Le Hello S, Hendriksen RS, Doublet B, Fisher I, Nielsen EM, Whichard JM, Bouchrif B, Fashae K, Granier SA, Jourdan-Da Silva N, Cloeckaert A, Threlfall EJ, Angulo FJ, Aarestrup FM, Wain J and Weill FX, 2011. International spread of an epidemic population of Salmonella enterica serotype Kentucky ST198 resistant to ciprofloxacin. Journal of Infectious Diseases, 204, 675–684.
Luangtongkum T, Jeon B, Han J, Plummer P, Logue CM and Zhang Q, 2009. Antibiotic resistance in Campylobacter: emergence, transmission, and persistence. Future Microbiology, 4, 189–200.
Magiorakos AP, Srinivasan A, Carey RB, Carmeli Y, Falagas ME, Giske CG, Harbarth S, Hindler JF, Kahlmeter G, Olsson-Liljequist B, Paterson DL, Rice LB, Stelling J, Struelens MJ, Vatopoulos A, Weber JT and Monnet DL, 2012. Multidrug-resistant, extensively drug-resistant and pandrug-resistant bacteria: an international expert proposal for interim standard definitions for acquired resistance. Clinical Microbiology and Infection, 18, 268–281.
Marchant M, Vinué L, Torres C and Moreno MA, 2013. Change of integrons over time in Escherichia coli isolates recovered from healthy pigs and chickens. Veterinary Microbiology, 163, 124–132.
Meunier D, Jouy E, Lazizzera C, Doublet B, Kobisch M, Cloeckaert A and Madec J-Y, 2010. Plasmid-borne florfenicol and ceftiofur resistance encoded by the floR and blaCMY-2 genes in Escherichia coli isolates from diseased cattle in France. Journal of Medical Microbiology, 59, 467–471.
Mulders MN, Haenen AP, Geenen PL, Vesseur PC, Poldervaart ES, Bosch T, Huijsdens XW, Hengeveld PD, Dam-Deisz WD, Graat EA, Mevius D, Voss A and Van De Giessen AW, 2010. Prevalence of livestock-

EU summary report on antimicrobial resistance in zoonotic and indicator bacteriafrom humans, animals and food 2012
EFSA Journal 2014;12(3):3590 256
associated MRSA in broiler flocks and risk factors for 270 slaughterhouse personnel in the Netherlands. Epidemiology and Infection, 138, 743–755.
Nirdnoy W, Mason CJ and Guerry P, 2005. Mosaic structure of a multiple-drug-resistant,conjugative plasmid from Campylobacter jejuni. Antimicrobial Agents and Chemotherapy, 49, 2454–2459.
Nógrády N, Király M, Davies R and Nagy B, 2012. Multidrug resistant clones of Salmonella Infantis of broiler origin in Europe. International Journal of Food Microbiology, 157, 108–112.
Overesch G, Büttner S, Rossano A and Perreten V, 2011. The increase of methicillin-resistant Staphylococcus aureus (MRSA) and the presence of an unusual sequence type ST49 in slaughter pigs in Switzerland. BMC Veterinary Research, 7, 30–39.
Piddock LJ, Ricci V, Pumbwe L, Everett MJ and Griggs DJ, 2003. Fluoroquinolone resistance in Campylobacter species from man and animals: detection of mutations in topoisomerase genes. Journal of Antimicrobial Chemotherapy, 5, 19–26.
Popovic-Uroic T, 1989. Campylobacter jejuni and Campylobacter coli diarrhoea in rural and urban populations in Yugoslavia. Epidemiology and Infection, 102, 59–67.
Qin S, Wang Y, Zhang Q, Chen X, Shen Z, Deng F, Wu C and Shen J, 2012. Identification of a novel genomic island conferring resistance to multiple aminoglycoside antibiotics in Campylobacter coli. Antimicrobial Agents and Chemotherapy, 5, 5332–5339.
Rahmani M, Peighambari SM, Svendsen CA, Cavaco LM, Agersø Y and Hendriksen RS, 2013. Molecular clonality and antimicrobial resistance in Salmonella enterica serovars Enteritidis and Infantis from broilers in three Northern regions of Iran. BMC Veterinary Research, 9, 66.
Richter A, Sting R, Poppe C, Rau J, Tenhagen BA, Guerra B, Hafez HM and Fetsch A, 2012. Prevalence of types of methicillin-resistant Staphylococcus aureus in turkey flocks and personnel attending the animals. Epidemiololgy and Infection, 140, 2223–2232.
Rodríguez I, Rodicio MR, Guerra B and Hopkins K, 2012. Spread of multi-drug resistant invasive Salmonella enterica serovar Enteritidis. Emerging and Infectious Diseases, 18, 1173–1176.
Skirrow MB, 1998. Campylobacteriosis. In Zoonoses. Eds Palmer SR, Soulsby and Simpson DIH. Oxford University Press, Oxford, UK, p. 37-46.
Valdezate S, Vidal A, Herrera-León S, Pozo J, Rubio P, Usera MA, Carvajal A and Echeita A, 2005. Salmonella Derby clonal spread from pork. Emerging and Infectious Disease, 11, 694–698.
Vandendriessche S, Vanderhaeghen W, Soares FV, Hallin M, Catry B, Hermans K, Butaye P, Haesebrouck F, Struelens MJ and Denis O, 2013. Prevalence, risk factors and genetic diversity of methicillin-resistant Staphylococcus aureus carried by humans and animals across livestock production sectors. Journal of Antimicrobial Chemotherapy, 68, 1510–1516.
Velge P, Cloeckaert A and Barrow P, 2005. Emergence of Salmonella epidemics: the problems related to Salmonella enterica serotype Enteritidis and multiple antibiotic resistance in other major serotypes. Veterinary Research, 36, 267–288.
Verkade E, van Benthem B, den Bergh MK, van Cleef B, van Rijen M, Bosch T and Kluytmans J, 2013. Dynamics and determinants of Staphylococcus aureus carriage in livestock veterinarians: a prospective cohort study. Clinical Infectious Diseases, 57, e11–17.
Wasyl D and Hoszowski A, 2012. First isolation of ESBL-producing Salmonella and emergence of multiresistant Salmonella Kentucky in turkey in Poland. Food Research International, 45, 958–961.
Weill F-X, Lailler R, Praud K, Kérouanton A, Fabre L, Brisabois A, Grimont PAD and Cloeckaert A, 2004. Emergence of extended-spectrum-β-lactamase (CTX-M-9)-producing multiresistant strains of Salmonella enterica serotype Virchow in poultry and humans in France. Journal of Clinical Microbiology, 42, 5767–5773.

EU summary report on antimicrobial resistance in zoonotic and indicator bacteriafrom humans, animals and food 2012
EFSA Journal 2014;12(3):3590 257
Woodford N, Wareham DW, Guerra B and Teale C. 2013. Carbapenemase-producing Enterobacteriaceae and non-Enterobacteriaceae from animals and the environment: an emerging public health risk of our own making? Journal of Antimicrobial Chemotherapy, 69, 287-291.

EU summary report on antimicrobial resistance in zoonotic and indicator bacteriafrom humans, animals and food 2012
EFSA Journal 2014;12(3):3590 258
APPENDIX 1. Frequency distributions of salmonella serovars in animals and food in 2012 antimicrobial resistance data
Appendix Table SER1. Frequency distribution of Salmonella serovars in meat from broilers (Gallus gallus), in 2012
Serovars Countries and total number of MSs reporting Meat from broilers
(Gallus gallus) N % f
S. Infantis 8 MSs: CZ, EE, DE, HU, IT, PL, RO, SK 339 45.81 S. Enteritidis 7 MSs: BE, CZ, DE, LV, NL, PL, SK 99 13.38 S. Kentucky 3 MSs: HU, IE, RO 67 9.05 S. Paratyphi B 2 MSs: BE, NL 39 5.27 S. Java 1 MS: DE 31 4.19 S. Indiana 2 MSs: CZ, PL 23 3.11 S. Newport 2 MSs: CZ, PL 19 2.57 S. Heidelberg 1 MS: NL 15 2.03 S. Virchow 1 MS: RO 13 1.76 S. Colindale 1 MS: RO 12 1.62 S. Agona 2 MSs: CZ, SK 11 1.49 S. Typhimurium 3 MSs: IE, IT, LV 11 1.49 S. Hadar 2 MSs: IT, RO 9 1.22 S. Bredeney 1 MS: RO 7 0.95 S. Ohio 1 MS: CZ 6 0.81 S. Ruzizi 1 MS: RO 6 0.81 S. Rissen 1 MS: RO 5 0.68 S. 6,7:-:1,5 1 MS: CZ 4 0.54 S. Djugu 1 MS: RO 4 0.54 S. Grampian 1 MS: RO 4 0.54 S. Brandenburg 1 MS: RO 3 0.41 S. Montevideo 1 MS: CZ 3 0.41 S. Derby 2 MSs: CZ, DE 2 0.27 S. Gloucester 1 MS: RO 1 0.14 S. Isangi 1 MS: EE 1 0.14 S. Kottbus 1 MS: CZ 1 0.14 S. Livingstone 1 MS: RO 1 0.14 S. Mbandaka 1 MS: IT 1 0.14 S. Minnesota 1 MS: LV 1 0.14 S. Thompson 1 MS: IT 1 0.14 S. enterica subsp. enterica 1 MS: DE 1 0.14
MS: Member State; N: number of isolates tested; % f: percentage frequency of isolates tested.

EU summary report on antimicrobial resistance in zoonotic and indicator bacteriafrom humans, animals and food 2012
EFSA Journal 2014;12(3):3590 259
Appendix Table SER2. Frequency distribution of Salmonella serovars in meat from pigs, in 2012
Serovars Countries and total number of MSs reporting Meat from pigs
N % f S. Typhimurium 12 MSs: BE, CZ, DK, EE, DE, HU, IE, IT, LV, NL, PL, RO 322 47.08 S. Derby 8 MSs: CZ, EE, DE, HU, IE, IT, NL, RO 109 15.94 S. Typhimurium, monophasic 8 MSs: CZ, DK, DE, HU, IE, IT, NL, SK 108 15.79 S. Infantis 6 MSs: CZ, EE, DE, IE, IT, RO 27 3.95 S. Bredeney 2 MSs: IT, RO 16 2.34 S. Rissen 2 MSs: IT, RO 15 2.19 S. enterica subsp. enterica 4 MSs: CZ ,EE, DE, IT 15 2.19 S. Ruzizi 1 MS: RO 11 1.61 S. Brandenburg 2 MSs: IT, NL 8 1.17 S. Gloucester 1 MS: RO 6 0.88 S. Kortrijk 1 MS: RO 5 0.73 S. Agona 1 MS: EE 4 0.58 S. Virchow 1 MS: RO 4 0.58 S. Choleraesuis 2 MSs: CZ, IT 3 0.44 S. Livingstone 3 MSs: EE, IT, RO 3 0.44 S. Panama 1 MS: IT 3 0.44 S. Bovismorbificans 1 MS: RO 2 0.29 S. Colindale 1 MS: RO 2 0.29 S. Enteritidis 2 MSs: CZ, RO 2 0.29 S. Give 1 MS: IT 2 0.29 S. Kapemba 1 MS: IT 2 0.29 S. Thompson 1 MS: IT 2 0.29 S. enterica subsp. salamae 1 MS: IT 2 0.29 S. Bareilly 1 MS: EE 1 0.15 S. Bsilla 1 MS: RO 1 0.15 S. Dublin 1 MS: IE 1 0.15 S. Kottbus 1 MS: IT 1 0.15 S. London 1 MS: IT 1 0.15 S. Manhattan 1 MS: IT 1 0.15 S. Minnesota 1 MS: EE 1 0.15 S. Montevideo 1 MS: RO 1 0.15 S. Muenchen 1 MS: IT 1 0.15 S. Muenster 1 MS: IT 1 0.15 S. enterica subsp. diarizonae 1 MS: IT 1 0.15
N: number of isolates tested; % f: percentage frequency of isolates tested.

EU summary report on antimicrobial resistance in zoonotic and indicator bacteriafrom humans, animals and food 2012
EFSA Journal 2014;12(3):3590 260
Appendix Table SER3. Frequency distribution of Salmonella serovars in meat from bovine animals, in 2012
Serovars Countries and total number of MSs reporting Meat from bovine
animals N % f
S. Typhimurium 7 MSs: CZ, EE, FI, DE, IE, IT, NL 24 39.34 S. Derby 3 MSs: CZ, IE, IT 10 16.39 S. Typhimurium, monophasic 3 MSs: DE, IE, NL 7 11.48 S. Dublin 1 MS: IE 5 8.20 S. enterica subsp. enterica 2 MSs: CZ, DE 3 4.92 S. Infantis 2 MSs: HU, IE 2 3.28 S. Rissen 1 MS: IT 2 3.28 S. 9,12:lv:- 1 MS: CZ 1 1.64 S. Hadar 1 MS: IT 1 1.64 S. Kentucky 1 MS: IE 1 1.64 S. London 1 MS: CZ 1 1.64 S. Montevideo 1 MS: CZ 1 1.64 S. Muenster 1 MS: IT 1 1.64 S. Newport 1 MS: IE 1 1.64 S. Saintpaul 1 MS: IE 1 1.64
MS: Member State; N: number of isolates tested; % f: percentage frequency of isolates tested.

EU summary report on antimicrobial resistance in zoonotic and indicator bacteriafrom humans, animals and food 2012
EFSA Journal 2014;12(3):3590 261
Appendix Table SER4. Frequency distribution of Salmonella serovars in Gallus gallus (fowl), in 2012
Serovars Countries and total number of MSs reporting Gallus gallus
(fowl) N % f
S. Enteritidis 15 MSs: AT, BE, CZ, DK, DE, HU, IT, LV, NL, PL, PT, RO, SK, ES, UK 1,253 28.96
S. Infantis 14 MSs: AT, BE, CZ, DK, DE, HU, IT, LV, PL, RO, SK, ES, SE, UK 781 18.05
S. Mbandaka 9 MSs: AT, BE, CZ, HU, IT, PL, RO, ES, UK 237 5.48 S. Tennessee 5 MSs: AT, BE, CZ, HU, RO 203 4.69 S. Kentucky 8 MSs: BE, CZ, DK, HU, IE, IT, RO, ES 168 3.88 S. Paratyphi B 2 MSs: BE, NL 166 3.84 S. Typhimurium 12 MSs: AT, BE, DK, FI, DE, HU, IT, PL, RO, ES, SE, UK 161 3.72 S. Senftenberg 7 MSs: AT, BE, HU, IT, RO, ES, UK 156 3.61 S. Minnesota 1 MS: BE 126 2.91 S. Livingstone 8 MSs: AT, BE, HU, IT, RO, ES, SE, UK 117 2.70 S. Agona 7 MSs: AT, BE, HU, IT, RO, ES, UK 95 2.20 S. Montevideo 9 MSs: AT, BE, CZ, DK, HU, IT, RO, ES, UK 84 1.94 S. Liverpool 1 MS: RO 70 1.62 S. Thompson 6 MSs: AT, BE, HU, IT, RO, ES 48 1.11 S. Hadar 5 MSs: AT, BE, IT, RO, ES 42 0.97 S. Typhimurium, monophasic 9 MSs: AT, BE, DK, DE, IT, NL, PT, ES, UK 40 0.92 S. enterica subsp. enterica 3 MSs: CZ, DE, IT 39 0.90 S. Rissen 5 MSs: BE, IT, RO, ES, UK 37 0.86 S. Ohio 4 MSs: AT, CZ, ES, UK 33 0.76 S. Corvallis 3 MSs: IT, RO, ES 32 0.74 S. Kottbus 5 MSs: AT, BE, CZ, HU, IT 32 0.74 S. Kedougou 2 MSs: IT, UK 28 0.65 S. Derby 4 MSs: CZ, DK, IT, RO 21 0.49 S. Indiana 4 MSs: CZ, HU, PL, UK 19 0.44 S. Taksony 1 MS: RO 17 0.39 S. 6,7:-:1,5 2 MSs: CZ, ES 16 0.37 S. Virchow 5 MSs: BE, DE, IT, PT, ES 14 0.32 S. Bredeney 5 MSs: BE, HU, IT, RO, ES 13 0.30 S. Bovismorbificans 3 MSs: AT, DK, HU 12 0.28 S. Braenderup 4 MSs: AT, BE, CZ, ES 12 0.28 S. Muenchen 2 MSs: IT, ES 11 0.25 S. Newport 7 MSs: BE, CZ, HU, IT, RO, ES, UK 11 0.25 S. Anatum 4 MSs: BE, IT, ES, UK 10 0.23 S. Give 4 MSs: AT, BE, IT, UK 10 0.23 S. Uganda 1 MS: RO 10 0.23 S. Cerro 4 MSs: BE, HU, IT, ES 9 0.21 S. Havana 4 MSs: BE, IT, ES, UK 9 0.21 S. Lille 1 MS: CZ 9 0.21 S. 6,7:z29 1 MS: BE 8 0.18 S. Blockley 2 MSs: IT, RO 8 0.18 S. Java 2 MSs: DE, UK 8 0.18 S. Lexington 2 MSs: BE, IT 7 0.16 S. Amsterdam 2 MSs: BE, RO 6 0.14 S. Coeln 2 MSs: AT, IT 6 0.14 S. Gallinarum biovar Pullorum 2 MSs: IT, RO 6 0.14 S. Albany 1 MS: RO 5 0.12 S. Dabou 1 MS: ES 5 0.12 S. Dublin 3 MSs: AT, BE, UK 5 0.12 S. Glostrup 1 MS: RO 5 0.12 S. Isangi 1 MS: IT 5 0.12
Table continued overleaf.

EU summary report on antimicrobial resistance in zoonotic and indicator bacteriafrom humans, animals and food 2012
EFSA Journal 2014;12(3):3590 262
Appendix Table SER4 (continued). Frequency distribution of Salmonella serovars in Gallus gallus (fowl), in 2012
Serovars Countries and total number of MSs reporting Gallus gallus
(fowl) N % f
S. London 3 MSs: AT, IT, ES 5 0.12 S. Saintpaul 4 MSs: AT, BE, HU, IT 5 0.12 S. Stanley 2 MSs: CZ, HU 5 0.12 S. 6,7:-:- 2 MSs: BE, UK 4 0.09 S. Abony 1 MS: HU 4 0.09 S. Bareilly 1 MS: DK 4 0.09 S. Haifa 1 MS: IT 4 0.09 S. 3,19:-:- 1 MS: BE 3 0.07 S. 9:-:- 1 MS: BE 3 0.07 S. Cubana 2 MSs: RO, ES 3 0.07 S. Goverdhan 1 MS: DK 3 0.07 S. Hessarek 1 MS: BE 3 0.07 S. Idikan 1 MS: BE 3 0.07 S. Orion 1 MS: UK 3 0.07 S. Worthington 2 MSs: AT, BE 3 0.07 S. 4:i:- 1 MS: BE 2 0.05 S. Altona 1 MS: ES 2 0.05 S. Brandenburg 2 MSs: BE, ES 2 0.05 S. Gallinarum biovar Gallinarum 1 MS: RO 2 0.05 S. Goldcoast 2 MSs: ES, UK 2 0.05 S. Llandoff 2 MSs: AT, BE 2 0.05 S. Oranienburg 1 MS: AT 2 0.05 S. Ouakam 1 MS: BE 2 0.05 S. Szentes 1 MS: CZ 2 0.05 S. Veneziana 1 MS: IT 2 0.05 S. 1,3,19:-:- 1 MS: ES 1 0.02 S. 13,23:i:- 1 MS: BE 1 0.02 S. 4,12:-:- 1 MS: BE 1 0.02 S. 4,12:-:1,2 1 MS: SK 1 0.02 S. 4,12:d:- 1 MS: BE 1 0.02 S. 6,7:d:- 1 MS: BE 1 0.02 S. 6,7:z10:- 1 MS: UK 1 0.02 S. 6,8:z10:- 1 MS: BE 1 0.02 S. Agama 1 MS: UK 1 0.02 S. Chester 1 MS: RO 1 0.02 S. Djugu 1 MS: BE 1 0.02 S. Durham 1 MS: UK 1 0.02 S. Gallinarum 1 MS: AT 1 0.02 S. Heidelberg 1 MS: IT 1 0.02 S. Jerusalem 1 MS: BE 1 0.02 S. Manhattan 1 MS: IT 1 0.02 S. Meleagridis 1 MS: UK 1 0.02 S. Mikawasima 1 MS: ES 1 0.02 S. Muenster 1 MS: IT 1 0.02 S. Orion var. 15 1 MS: UK 1 0.02 S. Sandiego 1 MS: BE 1 0.02 S. Schwarzengrund 1 MS: UK 1 0.02 S. Soerenga 1 MS: ES 1 0.02 S. Toulon 1 MS: IT 1 0.02 S. Weltevreden 1 MS: IT 1 0.02 S. Yoruba 1 MS: BE 1 0.02
MS: Member State; N: number of isolates tested; % f: percentage frequency of isolates tested.

EU summary report on antimicrobial resistance in zoonotic and indicator bacteriafrom humans, animals and food 2012
EFSA Journal 2014;12(3):3590 263
Appendix Table SER5. Frequency distribution of Salmonella serovars in turkeys, in 2012
Serovars Countries and total number of MSs reporting Turkeys
N % f S. Derby 5 MSs: CZ, IE, IT, ES, UK 172 25.15 S. Stanley 3 MSs: AT, CZ, HU 78 11.40 S. Kentucky 5 MSs: CZ, HU, PL, SK, ES 59 8.63 S. Saintpaul 6 MSs: AT, CZ, DE, HU, IT, PL 51 7.46 S. Newport 5 MSs: CZ, HU, IT, SK, UK 47 6.87 S. Typhimurium, monophasic 4 MSs: DE, IT, ES, UK 28 4.09 S. Infantis 3 MSs: AT, DE, HU 27 3.95 S. Bredeney 2 MSs: HU, IT 25 3.65 S. Kedougou 1 MS: UK 25 3.65 S. Hadar 3 MSs: DE, IT, ES 23 3.36 S. Kottbus 4 MSs: CZ, HU, IT, UK 20 2.92 S. Indiana 2 MSs: ES, UK 17 2.49 S. London 1 MS: ES 17 2.49 S. Typhimurium 7 MSs: AT, BE, FI, DE, IT, ES, UK 17 2.49 S. Blockley 1 MS: IT 11 1.61 S. Mbandaka 1 MS: UK 10 1.46 S. Bovismorbificans 3 MSs: AT, HU, UK 8 1.17 S. Enteritidis 5 MSs: AT, CZ, DE, HU, SK 8 1.17 S. Agona 4 MSs: AT, HU, ES, UK 7 1.02 S. Senftenberg 3 MSs: HU, ES, UK 5 0.73 S. Schwarzengrund 1 MS: IT 4 0.58 S. Orion var. 15 1 MS: UK 3 0.44 S. 6,7:z10:- 1 MS: UK 2 0.29 S. Bardo 1 MS: UK 2 0.29 S. Haifa 1 MS: IT 2 0.29 S. Montevideo 2 MSs: AT, ES 2 0.29 S. enterica subsp. enterica 2 MSs: DE, IT 2 0.29 S. 3,15:-:- 1 MS: UK 1 0.15 S. 4,12:-:- 1 MS: BE 1 0.15 S. 4,12:b:- 1 MS: ES 1 0.15 S. Agama 1 MS: UK 1 0.15 S. Anatum 1 MS: IT 1 0.15 S. Dabou 1 MS: ES 1 0.15 S. Dembe 1 MS: ES 1 0.15 S. Java 1 MS: DE 1 0.15 S. Ohio 1 MS: UK 1 0.15 S. Tennessee 1 MS: HU 1 0.15 S. Wisbech 1 MS: ES 1 0.15 S. Worthington 1 MS: AT 1 0.15
MS: Member State; N: number of isolates tested; % f: percentage frequency of isolates tested.

EU summary report on antimicrobial resistance in zoonotic and indicator bacteriafrom humans, animals and food 2012
EFSA Journal 2014;12(3):3590 264
Appendix Table SER6. Frequency distribution of Salmonella serovars in pigs, in 2012
Serovars Countries and total number of MSs reporting Pigs
N % f S. Typhimurium 11 MS: BE, DK, EE, FI, DE, HU, IE, LV, NL, ES, SE 515 35.49 S. Typhimurium, monophasic 8 MSs: BE, DK, DE, IE, IT, NL, PL, ES 421 29.01 S. Derby 8 MSs: BE, DK, EE, DE, HU, IT, NL, ES 280 19.30 S. Infantis 5 MSs: BE, DK, EE, DE, HU 45 3.10 S. Livingstone 3 MSs: BE, DK, IT 22 1.52 S. Agona 2 MSs: BE, EE 21 1.45 S. Rissen 3 MSs: BE, IT, ES 19 1.31 S. enterica subsp. enterica 3 MSs: EE, DE, IT 13 0.90 S. group O:4 1 MS: HU 12 0.83 S. Choleraesuis 2 MSs: EE, IT 11 0.76 S. London 3 MSs: DK, IT, ES 11 0.76 S. Enteritidis 5 MSs: BE, DK, EE, DE, HU 10 0.69 S. Mbandaka 2 MSs: BE, DK 10 0.69 S. 4:i:- 1 MS: BE 8 0.55 S. Worthington 1 MS: EE 6 0.41 S. Anatum 1 MS: BE 5 0.34 S. Bovismorbificans 1 MS: HU 3 0.21 S. Brandenburg 2 MSs: BE, DK 3 0.21 S. Bredeney 2 MSs: HU, ES 3 0.21 S. Senftenberg 2 MSs: BE, IT 3 0.21 S. Give 2 MSs: BE, DK 2 0.14 S. Kapemba 1 MS: ES 2 0.14 S. Kentucky 2 MSs: IE, ES 2 0.14 S. Lexington 1 MS: EE 2 0.14 S. Montevideo 1 MS: EE 2 0.14 S. Paratyphi B 1 MS: BE 2 0.14 S. 4,12:-:1,2 1 MS: DK 1 0.07 S. 4,5,12:-:1,2 1 MS: DK 1 0.07 S. 4,5:b 1 MS: ES 1 0.07 S. 6,7:-:l,w 1 MS: DK 1 0.07 S. Abony 1 MS: IT 1 0.07 S. Brikama 1 MS: ES 1 0.07 S. Coeln 1 MS: IT 1 0.07 S. Gloucester 1 MS: BE 1 0.07 S. Goldcoast 1 MS: DK 1 0.07 S. Heidelberg 1 MS: DK 1 0.07 S. Jerusalem 1 MS: BE 1 0.07 S. Kedougou 1 MS: IT 1 0.07 S. Minnesota 1 MS: BE 1 0.07 S. Muenchen 1 MS: DK 1 0.07 S. Panama 1 MS: IT 1 0.07 S. Rideau 1 MS: BE 1 0.07 S. Stanley 1 MS: DK 1 0.07 S. enterica subsp. salamae 1 MS: IT 1 0.07
MS: Member State; N: number of isolates tested; % f: percentage frequency of isolates tested.

EU summary report on antimicrobial resistance in zoonotic and indicator bacteriafrom humans, animals and food 2012
EFSA Journal 2014;12(3):3590 265
Appendix Table SER7. Frequency distribution of Salmonella serovars in bovine animals, in 2012
Serovars Countries and total number of MSs reporting
Cattle (bovine animals)
N % f S. Typhimurium 9 MSs: BE, EE, FI, DE, IE, IT, NL, ES, SE 166 55.33 S. Dublin 7 MSs: BE, EE, DE, IE, LV, NL, SE 66 22.00 S. Typhimurium, monophasic 5 MSs: DE, IE, IT, NL, ES 29 9.67 S. Enteritidis 2 MSs: BE, EE 8 2.67 S. Montevideo 2 MSs: BE, ES 5 1.67 S. Java 1 MS: DE 4 1.33 S. Rissen 1 MS: ES 3 1.00 S. enterica subsp. enterica 2 MSs: EE, IT 3 1.00 S. 9:-:- 1 MS: BE 2 0.67 S. Chester 1 MS: EE 2 0.67 S. Derby 1 MS: ES 2 0.67 S. Livingstone 1 MS: BE 2 0.67 S. London 1 MS: IT 2 0.67 S. Agona 1 MS: SE 1 0.33 S. Duesseldorf 1 MS: SE 1 0.33 S. Hadar 1 MS: DE 1 0.33 S. Lille 1 MS: ES 1 0.33 S. Muenchen 1 MS: IT 1 0.33 S. enterica subsp. diarizonae 1 MS: SE 1 0.33
MS: Member State; N: number of isolates tested; % f: percentage frequency of isolates tested.

EU summary report on antimicrobial resistance in zoonotic and indicator bacteriafrom humans, animals and food 2012
EFSA Journal 2014;12(3):3590 266
APPENDIX 2. Antimicrobial resistance in Salmonella - qualitative data
2.1. Introduction
In 2012, two MSs, Greece and Spain, reported on antimicrobial resistance in Salmonella from animals (Greece: Gallus gallus) and food (Greece, meat from broilers and meat from pig, and Spain, egg products) as quantitative disc diffusion data, which have been analysed as qualitative data and presented in this chapter. In food, both countries reported less than 10 isolates. These disc diffusion data have been analysed using the breakpoints for resistance specified by the reporting MS and in accordance with the method used (Appendix Tables QSA1–QSA3).
In the case of data reported exclusively as qualitative data, when information on the thresholds used to interpret the resistance was also available, it has been possible to pool the data submitted by MSs and present them in this section. It should, however, be noted that countries may not have used the same threshold values or qualitative methods and so direct comparisons between the proportions of resistant isolates in MSs reporting only qualitative data should be interpreted with caution. For this reason, tables do not show the summary figure for the reporting MS group and the spatial distributions of the levels of resistance for Salmonella based on qualitative data are not shown here; this is in accordance with previous reports. Furthermore, for those countries that reported quantitative data on antimicrobial resistance as presented in Chapter 3, corresponding qualitative data have been excluded from the overview tables and analyses presented in this chapter.
Resistance to the following antimicrobial agents are described in detail below: ampicillin, chloramphenicol, ciprofloxacin, gentamicin, nalidixic acid, sulfonamides and tetracyclines.
Appendix Table QSA1. Overview of MSs reporting qualitative data on Salmonella spp. from animals and food in 2012
Origin Qualitative data
Total number ofMSs reporting Countries
Gallus gallus (fowl) 3 MSs: CY, LU, SI Non-MS: IS
Turkeys 3 MSs: CY, IE, SI
Pigs 3 MSs: AT, IE, LV Non-MS: IS
Cattle (bovine animals) 3 MSs: AT, IE, LU Meat from broilers (Gallus gallus) 5
MSs: AT, ES, LT, LU, SI Non-MS: IS
Meat from other poultry species 5 MSs: AT, ES, LT, PL, SI
Meat from pigs 4 MSs: AT, ES, LT, LU Non-MS: IS
Meat from bovine animals 3 MSs: AT, LU, ES Meat, mixed meat 2 MSs: ES, SI Fishery products 1 MS: ES Foodstuffs (unspecified) 1 MS: PT
Note: For abbreviations of Member States (MS) and other reporting countries, see Appendix 7.
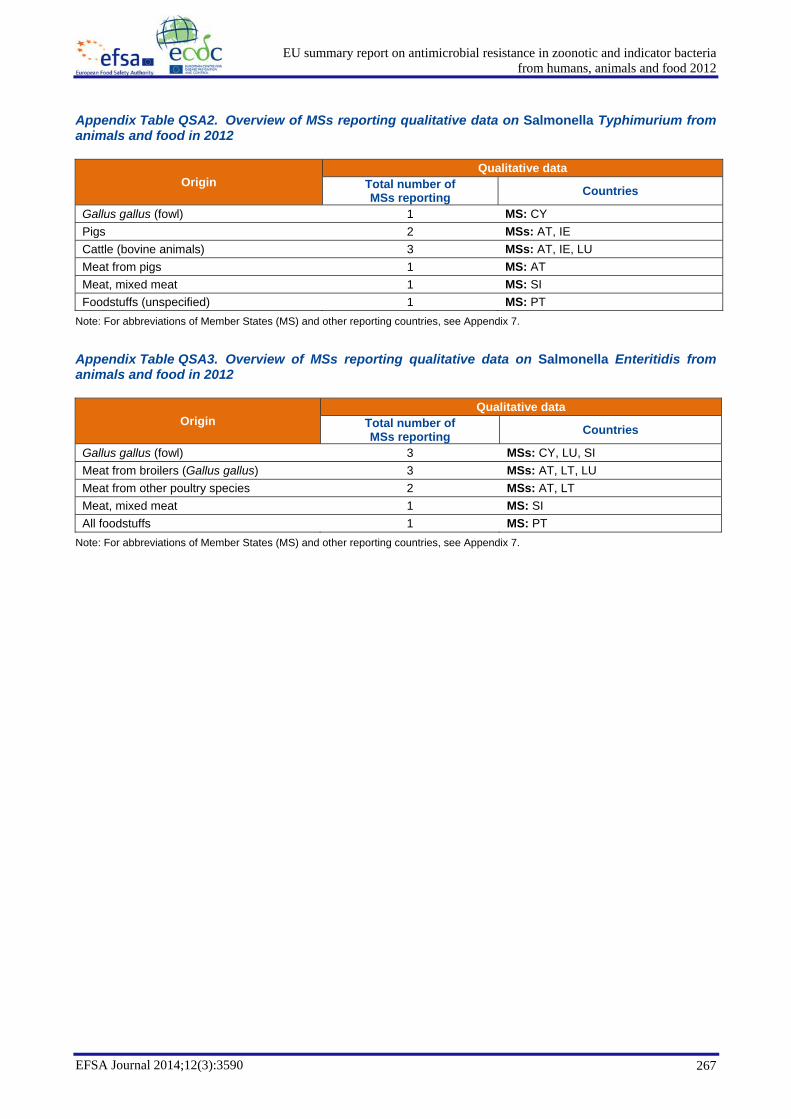
EU summary report on antimicrobial resistance in zoonotic and indicator bacteriafrom humans, animals and food 2012
EFSA Journal 2014;12(3):3590 267
Appendix Table QSA2. Overview of MSs reporting qualitative data on Salmonella Typhimurium from animals and food in 2012
Origin Qualitative data
Total number ofMSs reporting Countries
Gallus gallus (fowl) 1 MS: CY Pigs 2 MSs: AT, IE Cattle (bovine animals) 3 MSs: AT, IE, LU Meat from pigs 1 MS: AT Meat, mixed meat 1 MS: SI Foodstuffs (unspecified) 1 MS: PT
Note: For abbreviations of Member States (MS) and other reporting countries, see Appendix 7.
Appendix Table QSA3. Overview of MSs reporting qualitative data on Salmonella Enteritidis from animals and food in 2012
Origin Qualitative data
Total number of MSs reporting Countries
Gallus gallus (fowl) 3 MSs: CY, LU, SI Meat from broilers (Gallus gallus) 3 MSs: AT, LT, LU Meat from other poultry species 2 MSs: AT, LT Meat, mixed meat 1 MS: SI All foodstuffs 1 MS: PT
Note: For abbreviations of Member States (MS) and other reporting countries, see Appendix 7.

EU summary report on antimicrobial resistance in zoonotic and indicator bacteriafrom humans, animals and food 2012
EFSA Journal 2014;12(3):3590 268
2.2. Antimicrobial resistance in Salmonella isolates from food (qualitative data)
Meat from broilers (Gallus gallus), meat from pigs, meat from bovine animals
Resistance levels among Salmonella spp. isolates
Austria, Slovenia and Spain reported qualitative data on resistance among Salmonella spp. from meat from broilers in 2012. Austria and Spain, and the Netherlands and Spain, reported qualitative data on resistance among Salmonella spp. from meat from pigs and from meat from bovine animals, respectively. The results are presented in the table Appendix Tables QSA4.
2.3. Antimicrobial resistance in Salmonella isolates from animals (qualitative data)
2.3.1. Fowl (Gallus gallus)
2.3.1.1. Resistance levels among Salmonella
Four MSs and one non-MS reported qualitative data for isolates of Salmonella from Gallus gallus. The results are presented in the table Appendix Tables QSA5.
2.3.2. Pigs
Resistance levels among Salmonella
Austria and Iceland were the only countries to report qualitative data for isolates of Salmonella spp. from pigs. The results are presented in the table Appendix Tables QSA6.
2.3.3. Cattle (bovine animals)
Resistance levels among Salmonella
Austria was the only MS reported qualitative data for isolates of Salmonella spp. from cattle in 2012.The results are presented in the table Appendix Tables QSA6.

EU summary report on antimicrobial resistance in zoonotic and indicator bacteriafrom humans, animals and food 2012
EFSA Journal 2014;12(3):3590 269
Appendix Table QSA4. Resistance (%) to ampicillin, cefotaxime, chloramphenicol, ciprofloxacin, gentamicin, nalidixic acid, sulfonamides and tetracyclines among Salmonella spp. isolates from meat from broilers, from pigs and from bovine animals in MSs reporting qualitative data in 2012
Country Ampicillin Cefotaxime Chloramphenicol Ciprofloxacin Gentamicin Nalidixic acid Sulfonamides Tetracyclines
N % Res N % Res N % Res N % Res N % Res N % Res N % Res N % Res Meat from broilers Austria 61 1.6 61 0 61 3.3 61 1.6 61 0 61 73.8 61 67.2 61 68.9 Slovenia 15 6.7 – – 15 0 15 100 15 0 15 100 15 100 15 100 Spain 40 10.0 – – 22 0 40 2.5 40 2.5 40 17.5 – – 22 18.2 Meat from pigs Austria 19 57.9 19 0 19 15.8 19 0 19 0 19 10.5 19 57.9 19 68.4 Spain 67 43.3 18 5.6 51 25.5 50 0 67 0 67 10.4 37 70.3 51 86.3 Meat from bovine animals Netherlands 18 33.3 18 5.6 18 0 18 11.1 18 0 18 11.1 18 61.1 18 44.4 Spain 44 11.4 29 0 40 2.5 43 0 44 2.3 44 13.6 34 5.9 39 5.1
MS: Member State; N: number of isolates tested; % Res: percentage of resistant isolates; –: no data reported.
Appendix Table QSA5. Resistance (%) to ampicillin, cefotaxime, chloramphenicol, ciprofloxacin, gentamicin, nalidixic acid, sulfonamides and tetracyclines among Salmonella spp. isolates from Gallus gallus in MSs reporting qualitative data in 2012
Country Ampicillin Cefotaxime Chloramphenicol Ciprofloxacin Gentamicin Nalidixic acid Sulfonamides Tetracyclines
N % Res N % Res N % Res N % Res N % Res N % Res N % Res N % Res Cyprus 27 37.0 – – 27 3.7 27 40.7 27 29.6 27 37.0 27 33.3 27 40.7 Greece 72 0 72 0 72 0 72 0 71 0 72 13.9 72 100 72 8.3 Luxembourg 15 0 – – 13 0 15 13.3 15 0 13 0 15 0 15 0 Slovenia 63 12.7 – – 63 1.6 63 77.8 63 0 63 77.8 63 77.8 63 77.8 Iceland 10 0 – – 10 0 10 0 – – – – 10 0 – –
MS: Member State; N: number of isolates tested; % Res: percentage of resistant isolates; –: no data reported.

EU summary report on antimicrobial resistance in zoonotic and indicator bacteriafrom humans, animals and food 2012
EFSA Journal 2014;12(3):3590 270
Appendix Table QSA6. Resistance (%) to ampicillin, cefotaxime, chloramphenicol, ciprofloxacin, gentamicin, nalidixic acid, sulfonamides and tetracyclines among Salmonella spp. isolates from pigs and cattle in countries reporting qualitative data in 2012
Country Ampicillin Cefotaxime Chloramphenicol Ciprofloxacin Gentamicin Nalidixic acid Sulfonamides Tetracyclines
N % Res N % Res N % Res N % Res N % Res N % Res N % Res N % Res Pigs Austria 40 12.5 40 0 40 0 40 0 40 0 40 2.5 40 20.0 40 22.5 Iceland 11 45.5 – – 11 0 11 0 – – – – – – – – Cattle Austria 38 0 38 0 38 0 38 0 38 5.3 38 0 38 0 38 0
MS: Member State; N: number of isolates tested; % Res: percentage of resistant isolates; –: no data reported.
EU summary report on antimicrobial resistance in zoonotic and indicator bacteriafrom humans, animals and food 2012
EFSA Journal 2014;12(3):3590 271
2.4. Discussion
Very few countries reported qualitative data for Salmonella in 2012. Furthermore, it is difficult to compare accurately the data collected using disc diffusion techniques with those deriving from dilution methods and collected quantitatively as MIC data. Therefore, as in previous years, a detailed analysis and interpretation of the results has not been undertaken.
Greece used CLSI disc diffusion methods to test the Salmonella isolates recovered from Gallus gallus, and interpreted the results using CLSI breakpoints. The results will not be directly comparable to the results obtained by MSs performing broth microdilution MIC determinations and applying EUCAST ECOFFs to interpret those results and have therefore been presented separately.

EU summary report on antimicrobial resistance in zoonotic and indicator bacteriafrom humans, animals and food 2012
EFSA Journal 2014;12(3):3590 272
APPENDIX 3. Frequency distribution of complete susceptibility and multiple resistance
Appendix Table MDR1. Frequency distribution of completely susceptible isolates and resistant isolates to from one to nine antimicrobials, in Salmonella spp. from meat from broilers (Gallus gallus) in MSs reporting isolate-based data, 2012
Country Susceptible to all Resistant to 1 AMB Resistant to 2 AMB Resistant to 3 AMB Resistant to 4 AMB n % n % n % n % n %
Czech Republic (N=47) 30 63.8 1 2.1 0 0 9 19.2 6 12.8 Germany (N=94) 23 24.5 7 7.5 3 3.2 22 23.4 13 13.8 Ireland (N=70) 51 72.9 3 4.3 0 0 8 11.4 1 1.4 Romania (N=188) 13 6.9 4 2.1 8 4.3 45 23.9 53 28.2
Country Resistant to 5 AMB Resistant to 6 AMB Resistant to 7 AMB Resistant to 8 AMB Resistant to 9 AMB
n % n % n % n % n % Czech Republic (N=47) 1 2.1 0 0 0 0 0 0 0 0 Germany (N=94) 9 9.6 15 16.0 1 1.1 1 1.1 0 0 Ireland (N=70) 6 8.6 1 1.4 0 0 0 0 0 0 Romania (N=188) 42 22.3 19 10.1 3 1.6 0 0 0 0
N: total number of isolates tested for susceptibility against the whole common set of antimicrobial substances. n: number of resistant isolates per category of susceptibility or multiple resistance. %: percentage of resistant isolates per category of susceptibility or multiple resistance. AMB: antimicrobial substance(s).

EU summary report on antimicrobial resistance in zoonotic and indicator bacteriafrom humans, animals and food 2012
EFSA Journal 2014;12(3):3590 273
Appendix Table MDR2. Frequency distribution of completely susceptible isolates and resistant isolates to from one to nine antimicrobials, in Salmonella spp. from meat from pigs in MSs reporting isolate-based data, 2012
Country Susceptible to all Resistant to 1 AMB Resistant to 2 AMB Resistant to 3 AMB Resistant to 4 AMB n % n % n % n % n %
Czech Republic (N=33) 12 36.4 2 6.1 5 15.2 2 6.1 6 18.2 Denmark (N=41) 12 29.3 3 7.3 2 4.9 9 22.0 14 34.2 Estonia (N=22) 19 86.4 0 0 0 0 2 9.1 1 4.6 Germany (N=163) 62 38.0 15 9.2 7 4.3 9 5.5 44 27.0 Ireland (N=69) 15 21.7 6 8.7 7 10.1 5 7.3 21 30.4 Italy (N=85) 32 37.6 9 10.6 1 1.2 9 10.6 21 24.7 Romania (N=125) 30 24.0 24 19.2 1 0.8 33 26.4 18 14.4
Country Resistant to 5 AMB Resistant to 6 AMB Resistant to 7 AMB Resistant to 8 AMB Resistant to 9 AMB
n % n % n % n % n % Czech Republic (N=33) 5 15.2 1 3.0 0 0 0 0 0 0 Denmark (N=41) 0 0 1 2.4 0 0 0 0 0 0 Estonia (N=22) 0 0 0 0 0 0 0 0 0 0 Germany (N=163) 17 10.4 9 5.5 0 0 0 0 0 0 Ireland (N=69) 6 8.7 7 10.1 2 2.9 0 0 0 0 Italy (N=85) 7 8.2 5 5.9 1 1.2 0 0 0 0 Romania (N=125) 14 11.2 5 4.0 0 0 0 0 0 0
N: total number of isolates tested for susceptibility against the whole common set of antimicrobial substances. n: number of resistant isolates per category of susceptibility or multiple resistance. %: percentage of resistant isolates per category of susceptibility or multiple resistance. AMB: antimicrobial substance(s).

EU summary report on antimicrobial resistance in zoonotic and indicator bacteriafrom humans, animals and food 2012
EFSA Journal 2014;12(3):3590 274
Appendix Table MDR3. Frequency distribution of completely susceptible isolates and resistant isolates to from one to nine antimicrobials, in Salmonella spp. from broilers in MSs reporting isolate-based data, 2012
Country Susceptible to all Resistant to 1 AMB Resistant to 2 AMB Resistant to 3 AMB Resistant to 4 AMB n % n % n % n % n %
Austria (N=113) 82 72.6 7 6.2 1 0.9 16 14.2 7 6.2 Czech Republic (N=351) 271 77.2 11 3.1 2 0.6 35 10.0 24 6.8 Denmark (N=24) 17 70.8 0 0 0 0 0 0 7 29.2 Hungary (N=175) 13 7.4 19 10.9 15 8.6 90 51.4 35 20.0 Ireland (N=38) 31 81.6 3 7.9 1 2.6 1 2.6 2 5.3 Italy (N=105) 55 52.4 2 1.9 5 4.8 10 9.5 11 10.5 Romania (N=781) 135 17.3 99 12.8 76 9.7 117 15.0 137 17.5 Spain (N=29) 6 20.7 11 37.9 2 6.9 1 3.5 4 13.8 United Kingdom (N=17) 5 29.4 4 23.5 6 35.3 2 11.8 0 0
Country Resistant to 5 AMB Resistant to 6 AMB Resistant to 7 AMB Resistant to 8 AMB Resistant to 9 AMB
n % n % n % n % n % Austria (N=113) 0 0 0 0 0 0 0 0 0 0 Czech Republic (N=351) 4 1.1 4 1.1 0 0 0 0 0 0 Denmark (N=24) 0 0 0 0 0 0 0 0 0 0 Hungary (N=175) 3 1.7 0 0 0 0 0 0 0 0 Ireland (N=38) 0 0 0 0 0 0 0 0 0 0 Italy (N=105) 5 4.8 13 12.4 2 1.9 2 1.9 0 0 Romania (N=781) 100 12.8 79 10.1 26 3.3 7 0.9 8 1.0 Spain (N=29) 4 13.8 1 3.5 0 0 0 0 0 0 United Kingdom (N=17) 0 0 0 0 0 0 0 0 0 0
N: total number of isolates tested for susceptibility against the whole common set of antimicrobial substances. n: number of resistant isolates per category of susceptibility or multiple resistance. %: percentage of resistant isolates per category of susceptibility or multiple resistance. AMB: antimicrobial substance(s).

EU summary report on antimicrobial resistance in zoonotic and indicator bacteriafrom humans, animals and food 2012
EFSA Journal 2014;12(3):3590 275
Appendix Table MDR4. Frequency distribution of completely susceptible isolates and resistant isolates to from one to nine antimicrobials, in Salmonella spp. from laying hens in MSs reporting isolate-based data, 2012
Country Susceptible to all Resistant to 1 AMB Resistant to 2 AMB Resistant to 3 AMB Resistant to 4 AMB n % n % n % n % n %
Austria (N=63) 47 74.6 6 9.5 1 1.6 3 4.8 4 6.4 Germany (N=51) 44 86.3 2 3.9 4 7.8 0 0 0 0 Hungary (N=86) 59 68.6 7 8.1 4 4.7 11 12.8 1 1.2 Italy (N=161) 111 68.9 24 14.9 3 1.9 10 6.2 8 5.0 Romania (N=145) 72 49.7 14 9.7 4 2.8 16 11.0 25 17.2 Spain (N=150) 119 79.3 21 14.0 2 1.3 1 0.7 2 1.3 United Kingdom (N=11) 10 90.9 0 0 0 0 1 9.1 0 0
Country Resistant to 5 AMB Resistant to 6 AMB Resistant to 7 AMB Resistant to 8 AMB Resistant to 9 AMB
n % n % n % n % n % Austria (N=63) 2 3.2 0 0 0 0 0 0 0 0 Germany (N=51) 0 0 1 2.0 0 0 0 0 0 0 Hungary (N=86) 1 1.2 3 3.5 0 0 0 0 0 0 Italy (N=161) 2 1.2 3 1.9 0 0 0 0 0 0 Romania (N=145) 10 6.9 4 2.8 0 0 0 0 0 0 Spain (N=150) 4 2.7 0 0 0 0 1 0.7 0 0 United Kingdom (N=11) 0 0 0 0 0 0 0 0 0 0
N: total number of isolates tested for susceptibility against the whole common set of antimicrobial substances. n: number of resistant isolates per category of susceptibility or multiple resistance. %: percentage of resistant isolates per category of susceptibility or multiple resistance. AMB: antimicrobial substance(s).

EU summary report on antimicrobial resistance in zoonotic and indicator bacteriafrom humans, animals and food 2012
EFSA Journal 2014;12(3):3590 276
Appendix Table MDR5. Frequency distribution of completely susceptible isolates and resistant isolates to from one to nine antimicrobials, in Salmonella Enteritidis from broilers in MSs reporting isolate-based data, 2012
Country Susceptible to all Resistant to 1 AMB Resistant to 2 AMB Resistant to 3 AMB Resistant to 4 AMB n % n % n % n % n %
Austria (N=21) 20 95.2 1 4.8 0 0 0 0 0 0 Czech Republic (N=236) 231 97.9 4 1.7 1 0.4 0 0 0 0 Romania (N=10) 4 40.0 0 0 1 10.0 4 40.0 0 0
Country Resistant to 5 AMB Resistant to 6 AMB Resistant to 7 AMB Resistant to 8 AMB Resistant to 9 AMB
n % n % n % n % n % Austria (N=21) 0 0 0 0 0 0 0 0 0 0 Czech Republic (N=236) 0 0 0 0 0 0 0 0 0 0 Romania (N=10) 0 0 0 0 0 0 1 10.0 0 0
N: total number of isolates tested for susceptibility against the whole common set of antimicrobial substances. n: number of resistant isolates per category of susceptibility or multiple resistance. %: percentage of resistant isolates per category of susceptibility or multiple resistance. AMB: antimicrobial substance(s).

EU summary report on antimicrobial resistance in zoonotic and indicator bacteriafrom humans, animals and food 2012
EFSA Journal 2014;12(3):3590 277
Appendix Table MDR6. Frequency distribution of completely susceptible isolates and resistant isolates to from one to nine antimicrobials, in Salmonella Enteritidis from laying hens in MSs reporting isolate-based data, 2012
Country Susceptible to all Resistant to 1 AMB Resistant to 2 AMB Resistant to 3 AMB Resistant to 4 AMB n % n % n % n % n %
Austria (N=15) 15 100 0 0 0 0 0 0 0 0 Germany (N=21) 21 100 0 0 0 0 0 0 0 0 Hungary (N=25) 23 92.0 1 4 1 4.0 0 0 0 0 Italy (N=28) 22 78.6 6 21.4 0 0 0 0 0 0 Romania (N=66) 49 74.2 5 7.6 1 1.5 5 7.6 5 7.6 Spain (N=43) 32 74.4 9 20.9 1 2.3 0 0 0 0
Country Resistant to 5 AMB Resistant to 6 AMB Resistant to 7 AMB Resistant to 8 AMB Resistant to 9 AMB
n % n % n % n % n % Austria (N=15) 0 0 0 0 0 0 0 0 0 0 Germany (N=21) 0 0 0 0 0 0 0 0 0 0 Hungary (N=25) 0 0 0 0 0 0 0 0 0 0 Italy (N=28) 0 0 0 0 0 0 0 0 0 0 Romania (N=66) 1 1.5 0 0 0 0 0 0 0 0 Spain (N=43) 1 2.3 0 0 0 0 0 0 0 0
N: total number of isolates tested for susceptibility against the whole common set of antimicrobial substances. n: number of resistant isolates per category of susceptibility or multiple resistance. %: percentage of resistant isolates per category of susceptibility or multiple resistance. AMB: antimicrobial substance(s).

EU summary report on antimicrobial resistance in zoonotic and indicator bacteriafrom humans, animals and food 2012
EFSA Journal 2014;12(3):3590 278
Appendix Table MDR7. Frequency distribution of completely susceptible isolates and resistant isolates to from one to nine antimicrobials, in Salmonella spp. from turkeys in MSs reporting isolate-based data, 2012
Country Susceptible to all Resistant to 1 AMB Resistant to 2 AMB Resistant to 3 AMB Resistant to 4 AMB n % n % n % n % n %
Austria (N=38) 7 18.4 21 55.3 0 0 1 2.6 1 2.6 Czech Republic (N=27) 2 7.4 10 37.0 4 14.8 2 7.4 1 3.7 Germany (N=87) 20 23.0 10 11.5 6 6.9 5 5.8 31 35.6 Hungary (N=174) 11 6.3 53 30.5 14 8.1 52 29.9 6 3.5 Ireland (N=14) 12 85.7 0 0 0 0 2 14.3 0 0 Italy (N=48) 0 0 4 8.3 5 10.4 6 12.5 19 39.6 Spain (N=169) 3 1.8 2 1.2 3 1.8 5 3.0 23 13.6
Country Resistant to 5 AMB Resistant to 6 AMB Resistant to 7 AMB Resistant to 8 AMB Resistant to 9 AMB
n % n % n % n % n % Austria (N=38) 8 21.1 0 0 0 0 0 0 0 0 Czech Republic (N=27) 2 7.4 6 22.2 0 0 0 0 0 0 Germany (N=87) 15 17.2 0 0 0 0 0 0 0 0 Hungary (N=174) 17 9.8 21 12.1 0 0 0 0 0 0 Ireland (N=14) 0 0 0 0 0 0 0 0 0 0 Italy (N=48) 9 18.8 2 4.2 0 0 3 6.3 0 0 Spain (N=169) 42 24.9 76 45.0 14 8.3 0 0 1 0.6
N: total number of isolates tested for susceptibility against the whole common set of antimicrobial substances. n: number of resistant isolates per category of susceptibility or multiple resistance. %: percentage of resistant isolates per category of susceptibility or multiple resistance. AMB: antimicrobial substance(s).

EU summary report on antimicrobial resistance in zoonotic and indicator bacteriafrom humans, animals and food 2012
EFSA Journal 2014;12(3):3590 279
Appendix Table MDR8. Frequency distribution of completely susceptible isolates and resistant isolates to from one to nine antimicrobials, in Salmonella spp. from fattening pigs in MSs reporting isolate-based data, 2012
Country Susceptible to all Resistant to 1 AMB Resistant to 2 AMB Resistant to 3 AMB Resistant to 4 AMB n % n % n % n % n %
Denmark (N=374) 179 47.9 53 14.2 15 4.0 31 8.3 74 19.8 Estonia (N=14) 9 64.3 0 0 0 0 4 28.6 1 7.1 Germany (N=627) 89 14.2 28 4.5 28 4.5 24 3.8 220 35.1 Hungary (N=38) 9 23.7 1 2.6 1 2.6 11 29.0 11 29.0 Ireland (N=24) 2 8.3 6 25.0 1 4.2 3 12.5 4 16.7 Italy (N=25) 10 40.0 2 8.0 1 4.0 4 16.0 4 16.0 Spain (N=48) 3 6.2 13 27.1 4 8.3 1 2.1 11 22.9
Country Resistant to 5 AMB Resistant to 6 AMB Resistant to 7 AMB Resistant to 8 AMB Resistant to 9 AMB
n % n % n % n % n % Denmark (N=374) 18 4.8 4 1.1 0 0 0 0 0 0 Estonia (N=14) 0 0 0 0 0 0 0 0 0 0 Germany (N=627) 162 25.8 52 8.3 23 3.7 0 0 1 0.2 Hungary (N=38) 4 10.5 1 2.6 0 0 0 0 0 0 Ireland (N=24) 3 12.5 1 4.2 4 16.7 0 0 0 0 Italy (N=25) 1 4.0 2 8.0 0 0 1 4.0 0 0 Spain (N=48) 9 18.8 5 10.4 1 2.1 1 2.1 0 0
N: total number of isolates tested for susceptibility against the whole common set of antimicrobial substances. n: number of resistant isolates per category of susceptibility or multiple resistance. %: percentage of resistant isolates per category of susceptibility or multiple resistance. AMB: antimicrobial substance(s).

EU summary report on antimicrobial resistance in zoonotic and indicator bacteriafrom humans, animals and food 2012
EFSA Journal 2014;12(3):3590 280
Appendix Table MDR9. Frequency distribution of completely susceptible isolates and resistant isolates to from one to nine antimicrobials, in Salmonella Typhimurium from fattening pigs in MSs reporting isolate-based data, 2012
Country Susceptible to all Resistant to 1 AMB Resistant to 2 AMB Resistant to 3 AMB Resistant to 4 AMB n % n % n % n % n %
Denmark (N=63) 31 49.2 1 1.6 4 6.4 9 14.3 8 12.7 Germany (N=273) 24 8.8 9 3.3 19 7.0 6 2.2 47 17.2 Ireland (N=15) 0 0 4 26.7 1 6.7 1 6.7 1 6.7
Country Resistant to 5 AMB Resistant to 6 AMB Resistant to 7 AMB Resistant to 8 AMB Resistant to 9 AMB
n % n % n % n % n % Denmark (N=63) 9 14.3 1 1.6 0 0 0 0 0 0 Germany (N=273) 126 46.2 32 11.7 10 3.7 0 0 0 0 Ireland (N=15) 3 20.0 1 6.7 4 26.7 0 0 0 0
N: total number of isolates tested for susceptibility against the whole common set of antimicrobial substances. n: number of resistant isolates per category of susceptibility or multiple resistance. %: percentage of resistant isolates per category of susceptibility or multiple resistance. AMB: antimicrobial substance(s).

EU summary report on antimicrobial resistance in zoonotic and indicator bacteriafrom humans, animals and food 2012
EFSA Journal 2014;12(3):3590 281
Appendix Table MDR10. Frequency distribution of completely susceptible isolates and resistant isolates to from one to nine antimicrobials, in Salmonella spp. from cattle in MSs and non-MS reporting isolate-based data, 2012
Country Susceptible to all Resistant to 1 AMB Resistant to 2 AMB Resistant to 3 AMB Resistant to 4 AMB n % n % n % n % n %
Belgium (N=42) 8 19.0 4 9.5 9 21.4 7 16.7 5 11.9 Finland (N=19) 15 78.9 0 0 2 10.5 0 0 1 5.3 Germany (N=68) 45 66.2 8 11.8 1 1.5 3 4.4 8 11.8 Ireland (N=36) 12 33.3 2 5.6 1 2.8 0 0 5 13.9 Italy (N=14) 8 57.1 0 0 0 0 0 0 2 14.3 Sweden (N=17) 14 82.4 0 0 0 0 1 5.9 0 0
Country Resistant to 5 AMB Resistant to 6 AMB Resistant to 7 AMB Resistant to 8 AMB Resistant to 9 AMB
n % n % n % n % n % Belgium (N=42) 5 11.9 2 4.8 2 4.8 0 0 0 0 Finland (N=19) 1 5.3 0 0 0 0 0 0 0 0 Germany (N=68) 2 2.9 0 0 1 1.5 0 0 0 0 Ireland (N=36) 15 41.7 1 2.8 0 0 0 0 0 0 Italy (N=14) 3 21.4 1 7.1 0 0 0 0 0 0 Sweden (N=17) 2 11.8 0 0 0 0 0 0 0 0
N: total number of isolates tested for susceptibility against the whole common set of antimicrobial substances. n: number of resistant isolates per category of susceptibility or multiple resistance. %: percentage of resistant isolates per category of susceptibility or multiple resistance. AMB: antimicrobial substance(s).

EU summary report on antimicrobial resistance in zoonotic and indicator bacteriafrom humans, animals and food 2012
EFSA Journal 2014;12(3):3590 282
Appendix Table MDR11. Frequency distribution of completely susceptible isolates and resistant isolates to from one to nine antimicrobials, in Salmonella Typhimurium from cattle in MSs reporting isolate-based data, 2012
Country Susceptible to all Resistant to 1 AMB Resistant to 2 AMB Resistant to 3 AMB Resistant to 4 AMB n % n % n % n % n %
Belgium (N=25) 1 4.0 4 16.0 8 32.0 4 16.0 2 8.0 Finland (N=16) 12 75.0 0 0 2 12.5 0 0 1 6.3 Germany (N=35) 24 68.6 7 20.0 1 2.9 0 0 0 0 Ireland (N=24) 7 29.2 0 0 1 4.2 0 0 0 0 Sweden (N=12) 9 75.0 0 0 0 0 1 8.3 0 0
Country Resistant to 5 AMB Resistant to 6 AMB Resistant to 7 AMB Resistant to 8 AMB Resistant to 9 AMB
n % n % n % n % n % Belgium (N=25) 4 16.0 1 4.0 1 4.0 0 0 0 0 Finland (N=16) 1 6.3 0 0 0 0 0 0 0 0 Germany (N=35) 2 5.7 0 0 1 2.9 0 0 0 0 Ireland (N=24) 15 62.5 1 4.2 0 0 0 0 0 0 Sweden (N=12) 2 16.7 0 0 0 0 0 0 0 0
N: total number of isolates tested for susceptibility against the whole common set of antimicrobial substances. n: number of resistant isolates per category of susceptibility or multiple resistance. %: percentage of resistant isolates per category of susceptibility or multiple resistance. AMB: antimicrobial substance(s).

EU summary report on antimicrobial resistance in zoonotic and indicator bacteriafrom humans, animals and food 2012
EFSA Journal 2014;12(3):3590 283
Appendix Table MDR13. Frequency distribution of completely susceptible isolates and resistant isolates to from one to five antimicrobials, in Campylobacter jejuni from broilers in MSs and one non-MS reporting isolate-based data, 2012
Country Susceptible to all Resistant to 1 AMB Resistant to 2 AMB Resistant to 3 AMB Resistant to 4 AMB Resistant to 5 AMB
n % n % n % n % n % n % Austria (N=108) 22 20.4 58 53.7 24 22.2 4 3.7 0 0 0 0 Denmark (N=41) 32 78.0 6 14.6 3 7.3 0 0 0 0 0 0 Hungary (N=46) 4 8.7 24 52.2 18 39.1 0 0 0 0 0 0 Spain (N=32) 1 3.1 2 6.3 26 81.3 2 6.3 0 0 1 3.1 Sweden (N=100) 80 80.0 20 20.0 0 0 0 0 0 0 0 0 Switzerland (N=171) 98 57.3 51 29.8 21 12.3 1 0.6 0 0 0 0
N: total number of isolates tested for susceptibility against the whole common set of antimicrobial substances. n: number of resistant isolates per category of susceptibility or multiple resistance. %: percentage of resistant isolates per category of susceptibility or multiple resistance. AMB: antimicrobial substance(s).
Appendix Table MDR14. Frequency distribution of completely susceptible isolates and resistant isolates to from one to five antimicrobials, in Campylobacter coli from broilers in MSs and one non-MS reporting isolate-based data, 2012
Country Susceptible to all Resistant to 1 AMB Resistant to 2 AMB Resistant to 3 AMB Resistant to 4 AMB Resistant to 5 AMB
n % n % n % n % n % n % Austria (N=33) 6 18.2 16 48.5 10 30.3 1 3.0 0 0 0 0 Hungary (N=63) 9 14.3 23 36.5 28 44.4 3 4.8 0 0 0 0 Spain (N=54) 1 1.9 0 0 23 42.6 18 33.3 8 14.8 4 7.4 Switzerland (N=14) 4 28.6 1 7.1 6 42.9 2 14.3 1 7.1 0 0
N: total number of isolates tested for susceptibility against the whole common set of antimicrobial substances. n: number of resistant isolates per category of susceptibility or multiple resistance. %: percentage of resistant isolates per category of susceptibility or multiple resistance. AMB: antimicrobial substance(s).

EU summary report on antimicrobial resistance in zoonotic and indicator bacteriafrom humans, animals and food 2012
EFSA Journal 2014;12(3):3590 284
Appendix Table MDR15. Frequency distribution of completely susceptible isolates and resistant isolates to from one to five antimicrobials, in Campylobacter coli from fattening pigs in MSs and one non-MS reporting isolate-based data, 2012
Country Susceptible to all Resistant to 1 AMB Resistant to 2 AMB Resistant to 3 AMB Resistant to 4 AMB Resistant to 5 AMB
n % n % n % n % n % n % Denmark (N=103) 34 33.0 50 48.5 15 14.6 4 3.9 0 0 0 0 Hungary (N=53) 0 0 9 17.0 18 34.0 21 39.6 4 7.6 1 1.9 Spain (N=73) 0 0 0 0 2 2.7 19 26.0 44 60.3 8 11.0 Switzerland (N=144) 21 14.6 55 38.2 40 27.8 26 18.1 2 1.4 0 0
N: total number of isolates tested for susceptibility against the whole common set of antimicrobial substances. n: number of resistant isolates per category of susceptibility or multiple resistance. %: percentage of resistant isolates per category of susceptibility or multiple resistance. AMB: antimicrobial substance(s).
Appendix Table MDR16. Frequency distribution of completely susceptible isolates and resistant isolates to from one to five antimicrobials, in Campylobacter jejuni from cattle in MSs and one non-MS reporting isolate-based data, 2012
Country Susceptible to all Resistant to 1 AMB Resistant to 2 AMB Resistant to 3 AMB Resistant to 4 AMB Resistant to 5 AMB
n % n % n % n % n % n % Denmark (N=89) 75 84.3 14 15.7 0 0 0 0 0 0 0 0 Germany (N=73) 12 16.4 29 39.7 23 31.5 8 11.0 1 1.4 0 0 Spain (N=68) 17 25.0 18 26.5 29 42.7 4 5.9 0 0 0 0 Switzerland (N=38) 18 47.4 9 23.7 9 23.7 1 2.6 1 2.6 0 0
N: total number of isolates tested for susceptibility against the whole common set of antimicrobial substances. n: number of resistant isolates per category of susceptibility or multiple resistance. %: percentage of resistant isolates per category of susceptibility or multiple resistance. AMB: antimicrobial substance(s).

EU summary report on antimicrobial resistance in zoonotic and indicator bacteriafrom humans, animals and food 2012
EFSA Journal 2014;12(3):3590 285
Appendix Table MDR17. Frequency distribution of completely susceptible isolates and resistant isolates to from one to nine antimicrobials, in E. coli from broilers in MSs and one non-MS reporting isolate-based data, 2012
Country Susceptible to all Resistant to 1 AMB Resistant to 2 AMB Resistant to 3 AMB Resistant to 4 AMB n % n % n % n % n %
Austria (N=130) 22 16.9 30 23.1 22 16.9 13 10.0 22 16.9 Denmark (N=115) 65 56.5 30 26.1 5 4.4 9 7.8 5 4.4 Hungary (N=104) 14 13.5 21 20.2 20 19.2 13 12.5 17 16.4 Switzerland (N=185) 49 26.5 58 31.4 32 17.3 23 12.4 8 4.3
Country Resistant to 5 AMB Resistant to 6 AMB Resistant to 7 AMB Resistant to 8 AMB Resistant to 9 AMB
n % n % n % n % n % Austria (N=130) 7 5.4 12 9.2 2 1.5 0 0 0 0 Denmark (N=115) 1 0.9 0 0 0 0 0 0 0 0 Hungary (N=104) 8 7.7 8 7.7 2 1.9 1 1.0 0 0 Switzerland (N=185) 8 4.3 5 2.7 2 1.1 0 0 0 0
N: total number of isolates tested for susceptibility against the whole common set of antimicrobial substances. n: number of resistant isolates per category of susceptibility or multiple resistance. %: percentage of resistant isolates per category of susceptibility or multiple resistance. AMB: antimicrobial substance(s).
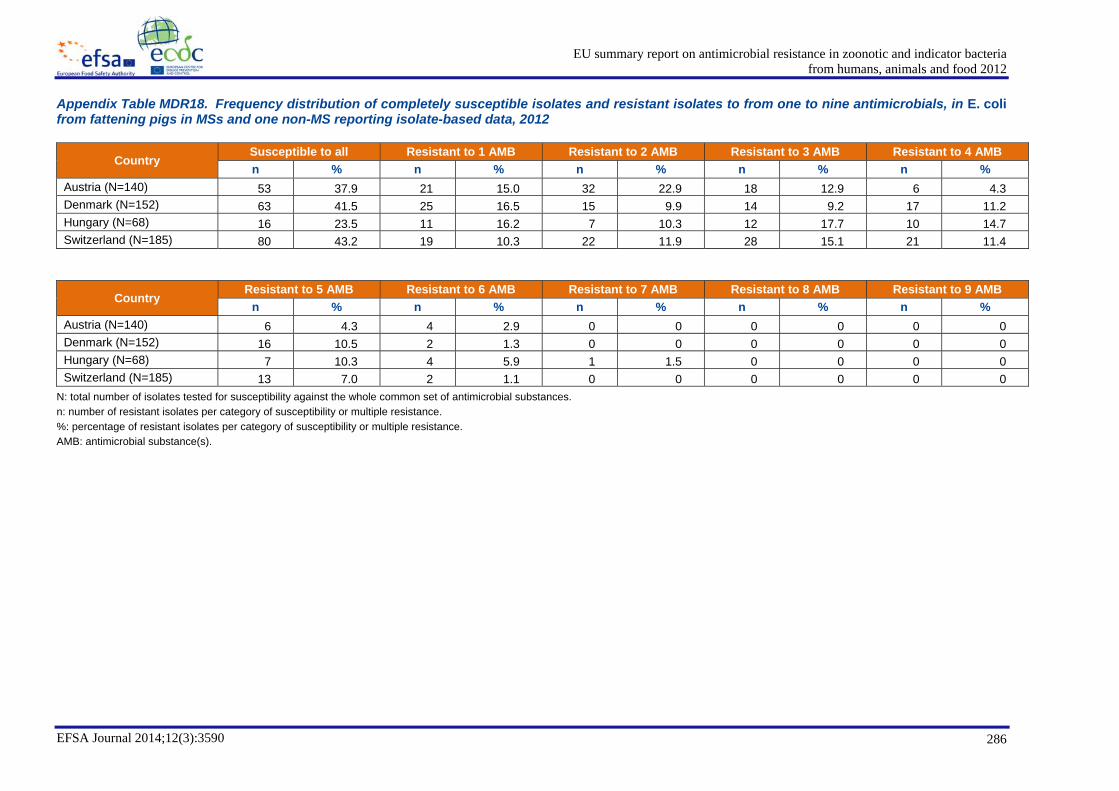
EU summary report on antimicrobial resistance in zoonotic and indicator bacteriafrom humans, animals and food 2012
EFSA Journal 2014;12(3):3590 286
Appendix Table MDR18. Frequency distribution of completely susceptible isolates and resistant isolates to from one to nine antimicrobials, in E. coli from fattening pigs in MSs and one non-MS reporting isolate-based data, 2012
Country Susceptible to all Resistant to 1 AMB Resistant to 2 AMB Resistant to 3 AMB Resistant to 4 AMB n % n % n % n % n %
Austria (N=140) 53 37.9 21 15.0 32 22.9 18 12.9 6 4.3 Denmark (N=152) 63 41.5 25 16.5 15 9.9 14 9.2 17 11.2 Hungary (N=68) 16 23.5 11 16.2 7 10.3 12 17.7 10 14.7 Switzerland (N=185) 80 43.2 19 10.3 22 11.9 28 15.1 21 11.4
Country Resistant to 5 AMB Resistant to 6 AMB Resistant to 7 AMB Resistant to 8 AMB Resistant to 9 AMB
n % n % n % n % n % Austria (N=140) 6 4.3 4 2.9 0 0 0 0 0 0 Denmark (N=152) 16 10.5 2 1.3 0 0 0 0 0 0 Hungary (N=68) 7 10.3 4 5.9 1 1.5 0 0 0 0 Switzerland (N=185) 13 7.0 2 1.1 0 0 0 0 0 0
N: total number of isolates tested for susceptibility against the whole common set of antimicrobial substances. n: number of resistant isolates per category of susceptibility or multiple resistance. %: percentage of resistant isolates per category of susceptibility or multiple resistance. AMB: antimicrobial substance(s).

EU summary report on antimicrobial resistance in zoonotic and indicator bacteriafrom humans, animals and food 2012
EFSA Journal 2014;12(3):3590 287
APPENDIX 4. Multi-resistance patterns
Appendix Table MDRP1. Multi-resistance patterns of interest in Salmonella spp. from meat from broilers in MSs reporting isolate-based data, 2012
Multi-resistance pattern MS group (N=399)
Cze
ch
Rep
ublic
(N
=47)
Ger
man
y
(N=9
4)
Irela
nd
(N=7
0)
Rom
ania
(N
=188
)
Am
p
Ctx
Chl
Cip
Gen
Str
Su
Tet
Tmp n % MS
group % n n n n
R R R 65 25.3 16.3 8 14 0 43 R R R R 43 16.7 10.8 0 2 0 41 R R R R R 26 10.1 6.5 0 0 0 26 R R R R 18 7.0 4.5 6 2 0 10
R R R R R R 16 6.2 4.0 0 14 0 2 R R R R R 10 3.9 2.5 0 8 2 0 R R R R R R 8 3.1 2.0 0 0 1 7 R R R 7 2.7 1.8 0 5 2 0
R R R R R 7 2.7 1.8 1 0 0 6 R R R R 6 2.3 1.5 0 6 0 0 R R R 5 1.9 1.3 0 1 2 2 R R R 5 1.9 1.3 0 1 4 0 R R R R R 5 1.9 1.3 0 0 0 5
R R R R R R 5 1.9 1.3 0 0 0 5 R R R R R R 4 1.6 1.0 0 0 0 4 R R R R R 3 1.2 0.8 0 0 0 3
R R R R 3 1.2 0.8 0 3 0 0 R R R R R R R 2 0.8 0.5 0 1 0 1 R R R R R 2 0.8 0.5 0 0 0 2
R R R R R 2 0.8 0.5 0 0 0 2 R R R R R 2 0.8 0.5 0 0 2 0 R R R R R R R 2 0.8 0.5 0 0 0 2 R R R R R 1 0.4 0.3 0 1 0 0
R R R R R 1 0.4 0.3 0 0 1 0 R R R R 1 0.4 0.3 0 0 0 1
Table continued overleaf.

EU summary report on antimicrobial resistance in zoonotic and indicator bacteriafrom humans, animals and food 2012
EFSA Journal 2014;12(3):3590 288
Appendix Table MDRP1 (continued). Multi-resistance patterns of interest in Salmonella spp. from meat from broilers in MSs reporting isolate-based data, 2012
Multi-resistance pattern MS group (N=399)
Cze
ch
Rep
ublic
(N
=47)
Ger
man
y
(N=9
4)
Irela
nd
(N=7
0)
Rom
ania
(N
=188
)
Am
p
Ctx
Chl
Cip
Gen
Str
Su
Tet
Tmp n % MS
group % n n n n
R R R R 1 0.4 0.3 0 0 0 1 R R R 1 0.4 0.3 1 0 0 0 R R R R 1 0.4 0.3 0 0 1 0 R R R R R 1 0.4 0.3 0 0 1 0 R R R R R R 1 0.4 0.3 0 1 0 0 R R R R R R 1 0.4 0.3 0 0 0 1 R R R R R R R R 1 0.4 0.3 0 1 0 0 R R R 1 0.4 0.3 0 1 0 0
Total 257 100 64.4 16 61 16 164 MS: Member State; Amp: ampicillin; Ctx: cefotaxime; Chl: chloramphenicol; Cip: ciprofloxacin; Gen: gentamicin; Str: streptomycin; Su: sulfonamides; Tet: tetracyclines; Tmp: trimethoprim. N: total number of isolates tested for susceptibility against the whole common antimicrobial set for Salmonella and multi-resistant; n: number of multi-resistant isolates; R: minimum inhibitory concentration (MIC) above epidemiological cut-off values (ECOFFs) from the European Committee on
Antimicrobial Susceptibility Testing (EUCAST).

EU summary report on antimicrobial resistance in zoonotic and indicator bacteriafrom humans, animals and food 2012
EFSA Journal 2014;12(3):3590 289
Appendix Table MDRP2. Multi-resistance patterns of interest in Salmonella spp. from meat from pigs in MSs reporting isolate-based data, 2012
Multi-resistance pattern MS group (N=538)
Cze
ch
Rep
ublic
(N
=33)
D
enm
ark
(N=4
1)
Esto
nia
(N=2
2)
Ger
man
y (N
=163
) Ire
land
(N
=69)
Ita
ly
(N=8
5)
Rom
ania
(N
=125
)
Am
p
Ctx
Chl
Cip
Gen
Str
Su
Tet
Tmp n % MS
group % n n n n n n n
R R R R 106 38.7 19.7 5 14 0 37 19 19 12 R R R 38 13.9 7.1 1 2 2 3 5 8 17
R R R R R 18 6.6 3.3 2 0 0 7 2 4 3 R R R R R 18 6.6 3.3 3 0 0 5 2 2 6 R R R R R R 16 5.8 3.0 0 1 0 4 5 5 1 R R R 12 4.4 2.2 1 7 0 3 0 0 1 R R R R 6 2.2 1.1 0 0 1 5 0 0 0 R R R R R R 6 2.2 1.1 1 0 0 5 0 0 0 R R R 5 1.8 0.9 0 0 0 0 0 0 5
R R R 5 1.8 0.9 0 0 0 0 0 0 5 R R R R 5 1.8 0.9 0 0 0 0 0 0 5 R R R R R 3 1.1 0.6 0 0 0 1 2 0 0
R R R R R 3 1.1 0.6 0 0 0 2 0 0 1 R R R R R R 3 1.1 0.6 0 0 0 0 0 0 3 R R R R 2 0.7 0.4 1 0 0 0 0 0 1
R R R 2 0.7 0.4 0 0 0 1 0 0 1 R R R R R 2 0.7 0.4 0 0 0 1 0 0 1 R R R R R R R 2 0.7 0.4 0 0 0 0 1 1 0 R R R R 2 0.7 0.4 0 0 0 0 0 2 0 R R R R R R 2 0.7 0.4 0 0 0 0 2 0 0 R R R 2 0.7 0.4 0 0 0 0 0 0 2 R R R R R 2 0.7 0.4 0 0 0 0 0 0 2 R R R 1 0.4 0.2 0 0 0 1 0 0 0 R R R 1 0.4 0.2 0 0 0 0 0 1 0 R R R R 1 0.4 0.2 0 0 0 0 1 0 0 R R R R R 1 0.4 0.2 0 0 0 0 0 1 0
Table continued overleaf.

EU summary report on antimicrobial resistance in zoonotic and indicator bacteriafrom humans, animals and food 2012
EFSA Journal 2014;12(3):3590 290
Appendix Table MDRP2 (continued). Multi-resistance patterns of interest in Salmonella spp. from meat from pigs in MSs reporting isolate-based data, 2012
Multi-resistance pattern MS group (N=538)
Cze
ch
Rep
ublic
(N
=33)
D
enm
ark
(N=4
1)
Esto
nia
(N=2
2)
Ger
man
y (N
=163
) Ire
land
(N
=69)
Ita
ly
(N=8
5)
Rom
ania
(N
=125
)
Am
p
Ctx
Chl
Cip
Gen
Str
Su
Tet
Tmp n % MS
group % n n n n n n n
R R R 1 0.4 0.2 0 0 0 0 0 0 1 R R R 1 0.4 0.2 0 0 0 0 0 0 1 R R R R 1 0.4 0.2 0 0 0 1 0 0 0 R R R 1 0.4 0.2 0 0 0 1 0 0 0 R R R R 1 0.4 0.2 0 0 0 0 1 0 0 R R R R 1 0.4 0.2 0 0 0 1 0 0 0 R R R R R R R 1 0.4 0.2 0 0 0 0 1 0 0 R R R R R 1 0.4 0.2 0 0 0 0 0 0 1 R R R R R 1 0.4 0.2 0 0 0 1 0 0 0 R R R R R R 1 0.4 0.2 0 0 0 0 0 0 1
Total 274 100 50.9 14 24 3 79 41 43 70 MS: Member State; Amp: ampicillin; Ctx: cefotaxime; Chl: chloramphenicol; Cip: ciprofloxacin; Gen: gentamicin; Str: streptomycin; Su: sulfonamides; Tet: tetracyclines; Tmp: trimethoprim. N: total number of isolates tested for susceptibility against the whole common antimicrobial set for Salmonella and multi-resistant; n: number of multi-resistant isolates; R: minimum inhibitory concentration (MIC) above epidemiological cut-off values (ECOFFs) from the European Committee on
Antimicrobial Susceptibility Testing (EUCAST).

EU summary report on antimicrobial resistance in zoonotic and indicator bacteriafrom humans, animals and food 2012
EFSA Journal 2014;12(3):3590 291
Appendix Table MDRP3. Multi-resistance patterns of interest in Salmonella spp. from broilers in MSs reporting isolate-based data, 2012
Multi-resistance pattern MS group (N=1,633)
Aus
tria
(N
=113
) C
zech
R
epub
lic
(N=3
51)
Den
mar
k
(N=2
4)
Hun
gary
(N
=175
) Ire
land
(N
=38)
Ita
ly
(N=1
05)
Rom
ania
(N
=781
) Sp
ain
(N=2
9)
Uni
ted
Kin
gdom
(N
=17)
Am
p C
tx
Chl
C
ip
Gen
St
r Su
Te
t Tm
p n % MS group % n n n n n n n n n
R R R 200 26.4 12.2 16 35 0 86 0 0 63 0 0 R R R R 83 11.0 5.1 5 19 0 28 0 0 31 0 0 R R R R 47 6.2 2.9 0 0 0 0 0 2 45 0 0
R R R R R R 47 6.2 2.9 0 4 0 0 0 0 43 0 0 R R R R 30 4.0 1.8 0 0 0 0 0 0 30 0 0 R R R R R 28 3.7 1.7 0 1 0 1 0 0 26 0 0 R R R R R 26 3.4 1.6 0 0 0 0 0 0 26 0 0
R R R R 24 3.2 1.5 0 5 0 5 0 2 12 0 0 R R R R R 18 2.4 1.1 0 0 0 0 0 1 16 1 0 R R R 16 2.1 1.0 0 0 0 0 0 0 16 0 0 R R R R R 15 2.0 0.9 0 3 0 2 0 0 10 0 0 R R R R 12 1.6 0.7 2 0 0 0 0 5 5 0 0 R R R R R R 11 1.5 0.7 0 0 0 0 0 10 1 0 0 R R R 10 1.3 0.6 0 0 0 1 0 2 6 1 0
R R R R 10 1.3 0.6 0 0 6 0 0 1 1 2 0 R R R R R R 9 1.2 0.6 0 0 0 0 0 0 9 0 0
R R R 8 1.1 0.5 0 0 0 0 0 0 8 0 0 R R R R R R 8 1.1 0.5 0 0 0 0 0 2 6 0 0 R R R R R R R R R 8 1.1 0.5 0 0 0 0 0 0 8 0 0 R R R 7 0.9 0.4 0 0 0 1 0 2 4 0 0 R R R R R R R R 6 0.8 0.4 0 0 0 0 0 2 4 0 0 R R R R 5 0.7 0.3 0 0 1 0 2 1 1 0 0 R R R 5 0.7 0.3 0 0 0 0 0 1 4 0 0 R R R R R R R 5 0.7 0.3 0 0 0 0 0 1 4 0 0 R R R R R 5 0.7 0.3 0 0 0 0 0 0 5 0 0 R R R R R R R 5 0.7 0.3 0 0 0 0 0 0 5 0 0
Table continued overleaf.

EU summary report on antimicrobial resistance in zoonotic and indicator bacteriafrom humans, animals and food 2012
EFSA Journal 2014;12(3):3590 292
Appendix Table MDRP3 (continued). Multi-resistance patterns of interest in Salmonella spp. from broilers in MSs reporting isolate-based data, 2012
Multi-resistance pattern MS group (N=1,633)
Aus
tria
(N
=113
) C
zech
R
epub
lic
(N=3
51)
Den
mar
k
(N=2
4)
Hun
gary
(N
=175
) Ire
land
(N
=38)
Ita
ly
(N=1
05)
Rom
ania
(N
=781
) Sp
ain
(N=2
9)
Uni
ted
Kin
gdom
(N
=17)
Am
p C
tx
Chl
C
ip
Gen
St
r Su
Te
t Tm
p n % MS group % n n n n n n n n n
R R R R R 5 0.7 0.3 0 0 0 0 0 0 5 0 0 R R R R R R R 5 0.7 0.3 0 0 0 0 0 0 5 0 0 R R R R R R R 5 0.7 0.3 0 0 0 0 0 0 5 0 0 R R R 4 0.5 0.2 0 0 0 0 0 0 3 0 1
R R R R 4 0.5 0.2 0 0 0 0 0 0 4 0 0 R R R R R R 4 0.5 0.2 0 0 0 0 0 0 4 0 0 R R R R R 3 0.4 0.2 0 0 0 0 0 0 1 2 0 R R R 3 0.4 0.2 0 0 0 0 0 1 2 0 0 R R R 3 0.4 0.2 0 0 0 0 0 0 3 0 0 R R R R 3 0.4 0.2 0 0 0 0 0 0 3 0 0 R R R R R 2 0.3 0.1 0 0 0 0 0 1 1 0 0 R R R R R 2 0.3 0.1 0 0 0 0 0 0 2 0 0 R R R R R R 2 0.3 0.1 0 0 0 0 0 0 2 0 0 R R R R 2 0.3 0.1 0 0 0 2 0 0 0 0 0 R R R R R 2 0.3 0.1 0 0 0 0 0 0 2 0 0
R R R 2 0.3 0.1 0 0 0 0 0 2 0 0 0 R R R R R R 2 0.3 0.1 0 0 0 0 0 0 2 0 0 R R R R R 2 0.3 0.1 0 0 0 0 0 2 0 0 0 R R R 2 0.3 0.1 0 0 0 0 0 0 2 0 0 R R R R R 2 0.3 0.1 0 0 0 0 0 0 2 0 0 R R R R R R 2 0.3 0.1 0 0 0 0 0 0 2 0 0 R R R R R R 2 0.3 0.1 0 0 0 0 0 0 2 0 0 R R R R R R 2 0.3 0.1 0 0 0 0 0 0 2 0 0 R R R R R R R 2 0.3 0.1 0 0 0 0 0 0 2 0 0 R R R R R R R R 2 0.3 0.1 0 0 0 0 0 0 2 0 0 R R R 1 0.1 0.1 0 0 0 0 1 0 0 0 0 R R R 1 0.1 0.1 0 0 0 0 0 0 0 0 1 R R R 1 0.1 0.1 0 0 0 0 0 1 0 0 0
Table continued overleaf.

EU summary report on antimicrobial resistance in zoonotic and indicator bacteriafrom humans, animals and food 2012
EFSA Journal 2014;12(3):3590 293
Appendix Table MDRP3 (continued). Multi-resistance patterns of interest in Salmonella spp. from broilers in MSs reporting isolate-based data, 2012
Multi-resistance pattern MS group (N=1,633)
Aus
tria
(N
=113
) C
zech
R
epub
lic
(N=3
51)
Den
mar
k (N
=24)
H
unga
ry
(N=1
75)
Irela
nd
(N=3
8)
Italy
(N
=105
) R
oman
ia
(N=7
81)
Spai
n (N
=29)
U
nite
d K
ingd
om
(N=1
7)
Am
p C
tx
Chl
C
ip
Gen
St
r Su
Te
t Tm
p n % MS group % n n n n n n n n n
R R R 1 0.1 0.1 0 0 0 0 0 0 1 0 0 R R R 1 0.1 0.1 0 0 0 1 0 0 0 0 0 R R R 1 0.1 0.1 0 0 0 1 0 0 0 0 0 R R R 1 0.1 0.1 0 0 0 0 0 0 1 0 0 R R R R 1 0.1 0.1 0 0 0 0 0 0 0 1 0 R R R R 1 0.1 0.1 0 0 0 0 0 0 1 0 0 R R R 1 0.1 0.1 0 0 0 0 0 1 0 0 0 R R R R R 1 0.1 0.1 0 0 0 0 0 0 1 0 0 R R R R R 1 0.1 0.1 0 0 0 0 0 0 1 0 0
R R R 1 0.1 0.1 0 0 0 0 0 0 1 0 0 R R R R 1 0.1 0.1 0 0 0 0 0 0 0 1 0 R R R 1 0.1 0.1 0 0 0 0 0 0 1 0 0 R R R R R 1 0.1 0.1 0 0 0 0 0 0 1 0 0 R R R R R 1 0.1 0.1 0 0 0 0 0 1 0 0 0 R R R R 1 0.1 0.1 0 0 0 0 0 0 1 0 0 R R R R R R 1 0.1 0.1 0 0 0 0 0 0 1 0 0 R R R R R R 1 0.1 0.1 0 0 0 0 0 0 1 0 0 R R R 1 0.1 0.1 0 0 0 0 0 0 1 0 0 R R R R R R 1 0.1 0.1 0 0 0 0 0 0 1 0 0 R R R R R R R 1 0.1 0.1 0 0 0 0 0 0 1 0 0 R R R R R R 1 0.1 0.1 0 0 0 0 0 0 0 1 0
Table continued overleaf.

EU summary report on antimicrobial resistance in zoonotic and indicator bacteriafrom humans, animals and food 2012
EFSA Journal 2014;12(3):3590 294
Appendix Table MDRP3 (continued). Multi-resistance patterns of interest in Salmonella spp. from broilers in MSs reporting isolate-based data, 2012
Multi-resistance pattern MS group (N=1,633)
Aus
tria
(N
=113
) C
zech
R
epub
lic
(N=3
51)
Den
mar
k
(N=2
4)
Hun
gary
(N
=175
) Ire
land
(N
=38)
Ita
ly
(N=1
05)
Rom
ania
(N
=781
) Sp
ain
(N=2
9)
Uni
ted
Kin
gdom
(N
=17)
Am
p C
tx
Chl
C
ip
Gen
St
r Su
Te
t Tm
p n % MS group % n n n n n n n n n
R R R R R R 1 0.1 0.1 0 0 0 0 0 0 1 0 0 R R R R R R R 1 0.1 0.1 0 0 0 0 0 0 1 0 0 R R R R 1 0.1 0.1 0 0 0 0 0 0 1 0 0 R R R 1 0.1 0.1 0 0 0 0 0 0 1 0 0 R R R R 1 0.1 0.1 0 0 0 0 0 0 1 0 0 R R R R R R 1 0.1 0.1 0 0 0 0 0 0 1 0 0 R R R R 1 0.1 0.1 0 0 0 0 0 0 1 0 0 R R R R R 1 0.1 0.1 0 0 0 0 0 0 0 1 0 R R R R R R R 1 0.1 0.1 0 0 0 0 0 0 1 0 0 R R R R R R 1 0.1 0.1 0 0 0 0 0 0 1 0 0 R R R R R R R 1 0.1 0.1 0 0 0 0 0 1 0 0 0 R R R R R R 1 0.1 0.1 0 0 0 0 0 1 0 0 0 R R R R R R R 1 0.1 0.1 0 0 0 0 0 0 1 0 0 R R R R R 1 0.1 0.1 0 0 0 0 0 0 1 0 0 R R R R R R R 1 0.1 0.1 0 0 0 0 0 0 1 0 0 R R R R R R R R 1 0.1 0.1 0 0 0 0 0 0 1 0 0
Total 757 100 46.4 23 67 7 128 3 43 474 10 2 MS: Member State; Amp: ampicillin; Ctx: cefotaxime; Chl: chloramphenicol; Cip: ciprofloxacin; Gen: gentamicin; Str: streptomycin; Su: sulfonamides; Tet: tetracyclines; Tmp: trimethoprim. N: total number of isolates tested for susceptibility against the whole common antimicrobial set for Salmonella and multi-resistant; n: number of multi-resistant isolates; R: minimum inhibitory concentration (MIC) above epidemiological cut-off values (ECOFFs) from the European Committee on
Antimicrobial Susceptibility Testing (EUCAST).

EU summary report on antimicrobial resistance in zoonotic and indicator bacteriafrom humans, animals and food 2012
EFSA Journal 2014;12(3):3590 295
Appendix Table MDRP4. Multi-resistance patterns of interest in Salmonella spp. from laying hens in MSs reporting isolate-based data, 2012
Multi-resistance pattern MS group (N=667)
Aus
tria
(N
=63)
Ger
man
y (N
=51)
Hun
gary
(N
=86)
Italy
(N
=161
)
Rom
ania
(N
=145
)
Spai
n (N
=150
) U
nite
d K
ingd
om
(N=1
1)
Am
p
Ctx
Chl
Cip
Gen
Str
Su
Tet
Tmp n % MS
group % n n n n n n n
R R R 20 17.7 3.0 3 0 8 0 9 0 0 R R R 11 9.7 1.6 0 0 3 6 2 0 0 R R R R 11 9.7 1.6 3 0 0 0 8 0 0
R R R R 8 7.1 1.2 0 0 0 0 8 0 0 R R R R 7 6.1 1.0 0 0 0 4 0 2 0 R R R R R 5 4.4 0.8 0 0 0 2 2 1 0 R R R R 5 4.4 0.8 0 0 1 0 4 0 0
R R R R R 5 4.4 0.8 0 0 0 0 5 0 0 R R R R R R 4 3.5 0.6 0 0 2 0 2 0 0 R R R R 4 3.5 0.6 0 0 0 0 4 0 0 R R R R R 3 2.6 0.4 2 0 1 0 0 0 0 R R R 3 2.6 0.4 0 0 0 0 3 0 0
R R R R 3 2.6 0.4 0 0 0 3 0 0 0 R R R R R 3 2.6 0.4 0 0 0 0 3 0 0 R R R 2 1.8 0.3 0 0 0 1 0 0 1
R R R R R R 2 1.8 0.3 0 0 1 1 0 0 0 R R R 2 1.8 0.3 0 0 0 0 2 0 0 R R R R R R 2 1.8 0.3 0 0 0 2 0 0 0 R R R 2 1.8 0.3 0 0 0 2 0 0 0 R R R 1 0.9 0.2 0 0 0 0 0 1 0 R R R R 1 0.9 0.2 1 0 0 0 0 0 0 R R R R 1 0.9 0.2 0 0 0 0 1 0 0 R R R R R 1 0.9 0.2 0 0 0 0 0 1 0
R R R 1 0.9 0.2 0 0 0 1 0 0 0 R R R R R 1 0.9 0.2 0 0 0 0 0 1 0 R R R R 1 0.9 0.2 0 0 0 1 0 0 0 R R R R R 1 0.9 0.2 0 0 0 0 0 1 0 R R R R R R 1 0.9 0.2 0 0 0 0 1 0 0 R R R R R R 1 0.9 0.2 0 1 0 0 0 0 0 R R R R R R 1 0.9 0.2 0 0 0 0 1 0 0 R R R R R R R R 5 4.4 0.8 0 0 0 0 0 1 0
Total 113 100 16.9 9 1 16 23 55 8 1 MS: Member State; Amp: ampicillin; Ctx: cefotaxime; Chl: chloramphenicol; Cip: ciprofloxacin; Gen: gentamicin; Str: streptomycin; Su: sulfonamides; Tet: tetracyclines; Tmp: trimethoprim. N: total number of isolates tested for susceptibility against the whole common antimicrobial set for Salmonella and multi-resistant; n: number of multi-resistant isolates; R: minimum inhibitory concentration (MIC) above epidemiological cut-off values (ECOFFs) from the European Committee on
Antimicrobial Susceptibility Testing (EUCAST).

EU summary report on antimicrobial resistance in zoonotic and indicator bacteriafrom humans, animals and food 2012
EFSA Journal 2014;12(3):3590 296
Appendix Table MDRP5. Multi-resistance patterns of interest in Salmonella spp. from turkeys in MSs reporting isolate-based data, 2012
Multi-resistance pattern MS group (N=557)
Aus
tria
(N
=38)
Cze
ch
Rep
ublic
(N
=27)
G
erm
any
(N=8
7)
Hun
gary
(N
=174
)
Irela
nd
(N=1
4)
Italy
(N
=48)
Spai
n (N
=169
)
Am
p
Ctx
Chl
Cip
Gen
Str
Su
Tet
Tmp n % MS
group % n n n n n n n
R R R R R R 69 18.6 12.4 0 0 0 0 0 0 69 R R R R R 41 11.1 7.4 0 0 2 0 0 0 39 R R R 39 10.5 7.0 0 2 0 37 0 0 0 R R R R R R 30 8.1 5.4 0 6 0 21 0 1 2 R R R R 20 5.4 3.6 0 0 17 0 0 2 1 R R R 19 5.1 3.4 1 0 3 15 0 0 0
R R R R 19 5.1 3.4 0 1 0 0 0 1 17 R R R R R 18 4.9 3.2 0 2 1 15 0 0 0 R R R R 15 4.1 2.7 0 0 2 0 0 11 2 R R R R R 13 3.5 2.3 3 0 10 0 0 0 0 R R R R R R R 13 3.5 2.3 0 0 0 0 0 0 13 R R R R 8 2.2 1.4 0 0 5 0 0 3 0 R R R 6 1.6 1.1 0 0 0 0 0 5 1 R R R R 5 1.4 0.9 1 0 1 3 0 0 0
R R R 5 1.4 0.9 0 0 1 0 0 0 4 R R R R R 5 1.4 0.9 5 0 0 0 0 0 0 R R R 3 0.8 0.5 0 0 0 0 2 1 0
R R R R R 3 0.8 0.5 0 0 0 0 0 3 0 R R R R 3 0.8 0.5 0 0 3 0 0 0 0 R R R R R R 3 0.8 0.5 0 0 0 0 0 0 3 R R R R R 2 0.5 0.4 0 0 1 1 0 0 0 R R R R R 2 0.5 0.4 0 0 0 0 0 2 0
R R R R 2 0.5 0.4 0 0 2 0 0 0 0 R R R R 2 0.5 0.4 0 0 0 2 0 0 0 R R R R R 2 0.5 0.4 0 0 0 0 0 2 0 R R R R 2 0.5 0.4 0 0 0 0 0 0 2 R R R R 2 0.5 0.4 0 0 1 0 0 1 0
Table continued overleaf.

EU summary report on antimicrobial resistance in zoonotic and indicator bacteriafrom humans, animals and food 2012
EFSA Journal 2014;12(3):3590 297
Appendix Table MDRP5 (continued). Multi-resistance patterns of interest in Salmonella spp. from turkeys in MSs reporting isolate-based data, 2012
Multi-resistance pattern MS group (N=557)
Aus
tria
(N
=38)
C
zech
R
epub
lic
(N=2
7)
Ger
man
y (N
=87)
Hun
gary
(N
=174
)
Irela
nd
(N=1
4)
Italy
(N
=48)
Spai
n (N
=169
)
Am
p
Ctx
Chl
Cip
Gen
Str
Su
Tet
Tmp n % MS
group % n n n n n n n
R R R R R R R R 2 0.5 0.4 0 0 0 0 0 2 0 R R R 1 0.3 0.2 0 0 1 0 0 0 0 R R R R 1 0.3 0.2 0 0 0 0 0 1 0 R R R R R 1 0.3 0.2 0 0 0 1 0 0 0
R R R R R 1 0.3 0.2 0 0 0 0 0 1 0 R R R R 1 0.3 0.2 0 0 0 1 0 0 0 R R R R R 1 0.3 0.2 0 0 0 0 0 0 1 R R R R R R 1 0.3 0.2 0 0 0 0 0 1 0 R R R R R R 1 0.3 0.2 0 0 0 0 0 0 1 R R R R 1 0.3 0.2 0 0 0 0 0 0 1 R R R R R 1 0.3 0.2 0 0 0 0 0 0 1 R R R R R 1 0.3 0.2 0 0 1 0 0 0 0 R R R R R R 1 0.3 0.2 0 0 0 0 0 0 1 R R R R R 1 0.3 0.2 0 0 0 0 0 0 1 R R R R R R R 1 0.3 0.2 0 0 0 0 0 0 1 R R R R R 1 0.3 0.2 0 0 0 0 0 1 0 R R R R R R R R 1 0.3 0.2 0 0 0 0 0 1 0 R R R R R R R R R 1 0.3 0.2 0 0 0 0 0 0 1
Total 370 100 66.4 10 11 51 96 2 39 161 MS: Member State; Amp: ampicillin; Ctx: cefotaxime; Chl: chloramphenicol; Cip: ciprofloxacin; Gen: gentamicin; Str: streptomycin; Su: sulfonamides; Tet: tetracyclines; Tmp: trimethoprim. N: total number of isolates tested for susceptibility against the whole common antimicrobial set for Salmonella and multi-resistant; n: number of multi-resistant isolates; R: minimum inhibitory concentration (MIC) above epidemiological cut-off values (ECOFFs) from the European Committee on
Antimicrobial Susceptibility Testing (EUCAST).

EU summary report on antimicrobial resistance in zoonotic and indicator bacteriafrom humans, animals and food 2012
EFSA Journal 2014;12(3):3590 298
Appendix Table MDRP6. Multi-resistance patterns in Salmonella spp. from fattening pigs in MSs reporting isolate-based data, 2012
Multi-resistance pattern MS group (N=1,150)
Den
mar
k (N
=374
)
Esto
nia
(N=1
4)
Ger
man
y (N
=627
)
Hun
gary
(N
=38)
Irela
nd
(N=2
4)
Italy
(N
=25)
Spai
n (N
=48)
Am
p C
tx
Chl
C
ip
Gen
St
r Su
Te
t Tm
p n % MS group% n n n n n n n
R R R R 280 40.6 24.3 60 0 198 8 4 2 8 R R R R R 90 13.0 7.8 4 0 81 1 0 1 3 R R R R R 75 10.9 6.5 9 0 60 3 3 0 0 R R R R R R 29 4.2 2.5 2 0 25 0 1 0 1 R R R 24 3.5 2.1 13 0 7 4 0 0 0 R R R R R R R 17 2.5 1.5 3 1 10 1 0 1 1 R R R R 17 2.5 1.5 0 0 14 0 3 0 0 R R R 12 1.7 1.0 3 1 3 0 2 3 0 R R R R R 11 1.6 1.0 7 0 3 1 0 0 0 R R R R R R 11 1.6 1.0 1 0 9 0 0 1 0 R R R R R R R 11 1.6 1.0 0 0 11 0 0 0 0 R R R R R R 10 1.4 0.9 0 0 9 0 1 0 0 R R R 8 1.2 0.7 0 0 5 0 0 1 2 R R R R R R 8 1.2 0.7 0 0 2 6 0 0 0 R R R R R 7 1.0 0.6 4 0 2 0 0 0 1 R R R R 7 1.0 0.6 0 0 6 1 0 0 0 R R R R R 6 0.9 0.5 3 0 2 0 0 1 0 R R R 6 0.9 0.5 1 0 5 0 0 0 0 R R R 4 0.6 0.3 2 0 2 0 0 0 0 R R R R 4 0.6 0.3 1 3 0 0 0 0 0 R R R 4 0.6 0.3 0 0 4 0 0 0 0 R R R R R R 3 0.4 0.3 2 0 1 0 0 0 0 R R R 3 0.4 0.3 2 0 1 0 0 0 0 R R R 3 0.4 0.3 1 0 2 0 0 0 0 R R R R 3 0.4 0.3 1 0 2 0 0 0 0 R R R R R 3 0.4 0.3 0 0 3 0 0 0 0 R R R R R R R R 3 0.4 0.3 0 0 3 0 0 0 0
Table continued overleaf.

EU summary report on antimicrobial resistance in zoonotic and indicator bacteriafrom humans, animals and food 2012
EFSA Journal 2014;12(3):3590 299
Appendix Table MDRP6 (continued). Multi-resistance patterns of interest in Salmonella spp. from fattening pigs in MSs reporting isolate-based data, 2012
Multi-resistance pattern MS group (N=1,150)
Den
mar
k (N
=374
)
Esto
nia
(N=1
4)
Ger
man
y (N
=627
)
Hun
gary
(N
=38)
Irela
nd
(N=2
4)
Italy
(N
=25)
Spai
n (N
=48)
Am
p
Ctx
Chl
Cip
Gen
Str
Su
Tet
Tmp n % MS
group % n n n n n n n
R R R R R 2 0.3 0.2 0 0 1 0 0 0 1 R R R R R R 2 0.3 0.2 2 0 0 0 0 0 0 R R R R 2 0.3 0.2 2 0 0 0 0 0 0 R R R 1 0.1 0.1 1 0 0 0 0 0 0 R R R 1 0.1 0.1 1 0 0 0 0 0 0 R R R 1 0.1 0.1 1 0 0 0 0 0 0 R R R R 1 0.1 0.1 0 0 0 0 1 0 0 R R R R 1 0.1 0.1 0 0 0 0 0 0 1 R R R 1 0.1 0.1 0 0 0 1 0 0 0 R R R R 1 0.1 0.1 0 0 0 0 0 0 1 R R R R R 1 0.1 0.1 1 0 0 0 0 0 0 R R R R 1 0.1 0.1 0 0 1 0 0 0 0
R R R R 1 0.1 0.1 0 0 1 0 0 0 0 R R R R R 1 0.1 0.1 0 0 0 0 0 0 1 R R R R 1 0.1 0.1 0 0 1 0 0 0 0 R R R 1 0.1 0.1 0 0 0 0 0 0 1 R R R 1 0.1 0.1 0 0 1 0 0 0 0 R R R R 1 0.1 0.1 0 0 1 0 0 0 0 R R R R R 1 0.1 0.1 0 0 0 1 0 0 0 R R R 1 0.1 0.1 0 0 1 0 0 0 0 R R R 1 0.1 0.1 0 0 0 0 0 1 0 R R R R R R 1 0.1 0.1 0 0 0 0 0 0 1 R R R R R 1 0.1 0.1 0 0 1 0 0 0 0 R R R 1 0.1 0.1 0 0 0 0 0 0 1 R R R R R R 1 0.1 0.1 0 0 0 0 0 0 1 R R R R R R 1 0.1 0.1 0 0 1 0 0 0 0 R R R R R R R 1 0.1 0.1 0 0 1 0 0 0 0 R R R R R R R R R 1 0.1 0.1 0 0 0 0 0 0 1
Total 690 100 60.0 127 5 480 27 15 12 25 MS: Member State; Amp: ampicillin; Ctx: cefotaxime; Chl: chloramphenicol; Cip: ciprofloxacin; Gen: gentamicin; Str: streptomycin; Su: sulfonamides; Tet: tetracyclines; Tmp: trimethoprim. N: total number of isolates tested for susceptibility against the whole common antimicrobial set for Salmonella and multi-resistant; n: number of multi-resistant isolates; R: minimum inhibitory concentration (MIC) above epidemiological cut-off values (ECOFFs) from the European Committee on
Antimicrobial Susceptibility Testing (EUCAST).

EU summary report on antimicrobial resistance in zoonotic and indicator bacteriafrom humans, animals and food 2012
EFSA Journal 2014;12(3):3590 300
Appendix Table MDRP7. Multi-resistance patterns of interest in Salmonella spp. from cattle in MSs reporting isolate-based data, 2012
Multi-resistance pattern MS group (N=205)
Bel
gium
(N
=42)
Finl
and
(N=1
9)
Ger
man
y (N
=68)
Irela
nd
(N=3
6)
Italy
(N
=14)
Spai
n (N
=9)
Swed
en
(N=1
7)
Am
p
Ctx
Chl
Cip
Gen
Str
Su
Tet
Tmp n % MS
group % n n n n n n n
R R R R R 25 33.8 12.2 4 0 2 15 2 0 2 R R R R 16 21.6 7.8 2 0 5 5 2 2 0 R R R 5 6.8 2.4 3 0 0 0 0 2 0 R R R R 3 4.1 1.5 3 0 0 0 0 0 0
R R R R R R 2 2.7 1.0 0 0 0 1 0 1 0 R R R R 2 2.7 1.0 0 0 2 0 0 0 0 R R R 2 2.7 1.0 2 0 0 0 0 0 0
R R R R R 2 2.7 1.0 0 0 0 0 0 2 0 R R R 1 1.4 0.5 0 0 1 0 0 0 0 R R R 1 1.4 0.5 0 0 1 0 0 0 0 R R R R 1 1.4 0.5 0 0 1 0 0 0 0 R R R 1 1.4 0.5 0 0 1 0 0 0 0 R R R R R 1 1.4 0.5 0 0 0 0 1 0 0
R R R 1 1.4 0.5 1 0 0 0 0 0 0 R R R 1 1.4 0.5 0 0 0 0 0 0 1 R R R R 1 1.4 0.5 0 1 0 0 0 0 0 R R R R R 1 1.4 0.5 0 1 0 0 0 0 0 R R R 1 1.4 0.5 1 0 0 0 0 0 0 R R R R R R 1 1.4 0.5 1 0 0 0 0 0 0 R R R R R R 1 1.4 0.5 0 0 0 0 1 0 0 R R R R R R R 1 1.4 0.5 0 0 1 0 0 0 0 R R R R R 1 1.4 0.5 1 0 0 0 0 0 0 R R R R R R 1 1.4 0.5 1 0 0 0 0 0 0 R R R R R R R 1 1.4 0.5 1 0 0 0 0 0 0 R R R R R R R 1 1.4 0.5 1 0 0 0 0 0 0
Total 74 100 36.1 21 2 14 21 6 7 3 MS: Member State; Amp: ampicillin; Ctx: cefotaxime; Chl: chloramphenicol; Cip: ciprofloxacin; Gen: gentamicin; Str: streptomycin; Su: sulfonamides; Tet: tetracyclines; Tmp: trimethoprim. N: total number of isolates tested for susceptibility against the whole common antimicrobial set for Salmonella and multi-resistant; n: number of multi-resistant isolates; R: minimum inhibitory concentration (MIC) above epidemiological cut-off values (ECOFFs) from the European Committee on
Antimicrobial Susceptibility Testing (EUCAST).

EU summary report on antimicrobial resistance in zoonotic and indicator bacteriafrom humans, animals and food 2012
EFSA Journal 2014;12(3):3590 301
Appendix Table MDRP8. Multi-resistance patterns of interest in Salmonella Enteritidis from broilers in MS reporting isolate-based data, 2012
Multi-resistance pattern MS (N=10)
Rom
ania
(N
=10)
Am
p
Ctx
Chl
Cip
Gen
Str
Su
Tet
Tmp n % MS n
R R R 2 40.0 20.0 2 R R R 1 20.0 10.0 1 R R R 1 20.0 10.0 1 R R R R R R R R 1 20.0 10.0 1
Total 5 100 50.0 5 MS: Member State; Amp: ampicillin; Ctx: cefotaxime; Chl: chloramphenicol; Cip: ciprofloxacin; Gen: gentamicin; Str: streptomycin; Su: sulfonamides; Tet: tetracyclines; Tmp: trimethoprim. N: total number of isolates tested for susceptibility against the whole common antimicrobial set for Salmonella and multi-resistant; n: number of multi-resistant isolates; R: minimum inhibitory concentration (MIC) above epidemiological cut-off values (ECOFFs) from the European Committee on
Antimicrobial Susceptibility Testing (EUCAST).
Appendix Table MDRP9. Multi-resistance patterns of interest in Salmonella Enteritidis from laying hens in MSs reporting isolate-based data, 2012
Multi-resistance pattern MS group (N=109)
Spai
n (N
=43)
Rom
ania
(N
=66)
Am
p
Ctx
Chl
Cip
Gen
Str
Su
Tet
Tmp n % MS
group % n n
R R R 4 33.3 3.7 0 4 R R R R 4 33.3 3.7 0 4
R R R 1 8.3 0.9 0 1 R R R R 1 8.3 0.9 0 1 R R R R R 1 8.3 0.9 1 0 R R R R R 1 8.3 0.9 0 1
Total 12 100 11.0 1 11 MS: Member State; Amp: ampicillin; Ctx: cefotaxime; Chl: chloramphenicol; Cip: ciprofloxacin; Gen: gentamicin; Str: streptomycin; Su: sulfonamides; Tet: tetracyclines; Tmp: trimethoprim. N: total number of isolates tested for susceptibility against the whole common antimicrobial set for Salmonella and multi-resistant; n: number of multi-resistant isolates; R: minimum inhibitory concentration (MIC) above epidemiological cut-off values (ECOFFs) from the European Committee on
Antimicrobial Susceptibility Testing (EUCAST).

EU summary report on antimicrobial resistance in zoonotic and indicator bacteriafrom humans, animals and food 2012
EFSA Journal 2014;12(3):3590 302
Appendix Table MDRP10. Multi-resistance patterns of interest in Salmonella Typhimurium from broilers in MSs reporting isolate-based data, 2012
Multi-resistance pattern MS group (N=8)
Rom
ania
(N
=1)
Italy
(N
=3)
Den
mar
k (N
=4)
Am
p
Ctx
Chl
Cip
Gen
Str
Su
Tet
Tmp n % MS
group % n n n
R R R R 4 57.1 50.0 1 0 3 R R R R R 2 28.6 25.0 0 2 0 R R R R R R R R 1 14.5 12.5 0 1 0
Total 7 100 87.5 1 3 3 MS: Member State; Amp: ampicillin; Ctx: cefotaxime; Chl: chloramphenicol; Cip: ciprofloxacin; Gen: gentamicin; Str: streptomycin; Su: sulfonamides; Tet: tetracyclines; Tmp: trimetoprim. N: total number of isolates tested for susceptibility against the whole common antimicrobial set for Salmonella and multi-resistant; n: number of multi-resistant isolates; R: minimum inhibitory concentration (MIC) above epidemiological cut-off values (ECOFFs) from the European Committee on
Antimicrobial Susceptibility Testing (EUCAST).
Appendix Table MDRP11. Multi-resistance patterns of interest in Salmonella Typhimurium from laying hens in MSs reporting isolate-based data, 2012
Multi-resistance pattern MS group (N=38)
Ger
man
y (N
=13)
Rom
ania
(N
=4)
Italy
(N
=5)
Am
p
Ctx
Chl
Cip
Gen
Str
Su
Tet
Tmp n % MS
group % n n n
R R R R 3 42.9 7.9 0 0 3 R R R R 1 14.3 2.6 0 0 1 R R R R R 1 14.3 2.6 0 1 0 R R R R R R 1 14.3 2.6 0 0 1 R R R R R R 1 14.3 2.6 1 0 0
Total 7 100 18.4 1 1 5 MS: Member State; Amp: ampicillin; Ctx: cefotaxime; Chl: chloramphenicol; Cip: ciprofloxacin; Gen: gentamicin; Str: streptomycin; Su: sulfonamides; Tet: tetracyclines; Tmp: trimetoprim. N: total number of isolates tested for susceptibility against the whole common antimicrobial set for Salmonella and multi-resistant; n: number of multi-resistant isolates; R: minimum inhibitory concentration (MIC) above epidemiological cut-off values (ECOFFs) from the European Committee on
Antimicrobial Susceptibility Testing (EUCAST).

EU summary report on antimicrobial resistance in zoonotic and indicator bacteriafrom humans, animals and food 2012
EFSA Journal 2014;12(3):3590 303
Appendix Table MDRP12. Multi-resistance patterns of interest in Salmonella Typhimurium from fattening pigs in MSs reporting isolate-based data, 2012
Multi-resistance pattern MS group (N=374)
Den
mar
k (N
=63)
Esto
nia
(N=6
)
Ger
man
y (N
=273
)
Hun
gary
(N
=8)
Irela
nd
(N=1
5)
Spai
n (N
=6)
Swed
en
(N=3
)
Am
p
Ctx
Chl
Cip
Gen
Str
Su
Tet
Tmp n % MS
group % n n n n n n n
R R R R R 73 26.5 19.5 9 0 58 2 3 0 1 R R R R R 62 22.5 16.6 0 0 62 0 0 0 0 R R R R 45 16.4 12.0 7 0 33 3 1 1 0 R R R R R R 16 5.8 4.3 0 0 15 0 1 0 0 R R R R R R R 9 3.3 2.4 0 0 6 0 3 0 0 R R R R 9 3.3 2.4 0 0 9 0 0 0 0 R R R 9 3.3 2.4 2 6 0 0 1 0 0
R R R 8 2.9 2.1 6 0 1 1 0 0 0 R R R R R R 7 2.5 1.9 0 0 6 1 0 0 0 R R R R R R 7 2.5 1.9 1 0 6 0 0 0 0 R R R R R R R 5 1.8 1.3 0 0 4 0 1 0 0 R R R R R 4 1.5 1.1 0 0 4 0 0 0 0 R R R R R R 3 1.1 0.8 0 0 3 0 0 0 0 R R R 2 0.7 0.5 1 0 1 0 0 0 0
R R R R 2 0.7 0.5 1 0 1 0 0 0 0 R R R R 2 0.7 0.5 0 0 2 0 0 0 0 R R R R R 2 0.7 0.5 0 0 2 0 0 0 0 R R R 1 0.4 0.3 0 0 1 0 0 0 0 R R R R 1 0.4 0.3 0 0 1 0 0 0 0 R R R R 1 0.4 0.3 0 0 1 0 0 0 0
R R R 1 0.4 0.3 0 0 1 0 0 0 0 R R R R R R 1 0.4 0.3 0 0 1 0 0 0 0 R R R 1 0.4 0.3 0 0 1 0 0 0 0 R R R R R 1 0.4 0.3 0 0 0 0 0 1 0 R R R 1 0.4 0.3 0 0 1 0 0 0 0 R R R R R R 1 0.4 0.3 0 0 1 0 0 0 0 R R R R R R 1 0.4 0.3 0 0 0 0 0 1 0
Total 275 100 73.5 27 6 221 7 10 3 1 MS: Member State; Amp: ampicillin; Ctx: cefotaxime; Chl: chloramphenicol; Cip: ciprofloxacin; Gen: gentamicin; Str: streptomycin; Su: sulfonamides; Tet: tetracyclines; Tmp: trimethoprim. N: total number of isolates tested for susceptibility against the whole common antimicrobial set for Salmonella and multi-resistant; n: number of multi-resistant isolates; R: minimum inhibitory concentration (MIC) above epidemiological cut-off values (ECOFFs) from the European Committee on
Antimicrobial Susceptibility Testing (EUCAST).

EU summary report on antimicrobial resistance in zoonotic and indicator bacteriafrom humans, animals and food 2012
EFSA Journal 2014;12(3):3590 304
Appendix Table MDRP13. Multi-resistance patterns of interest in Salmonella Typhimurium from cattle in MSs reporting isolate-based data, 2012
Multi-resistance pattern MS group (N=117)
Bel
gium
(N
=25)
Finl
and
(N=1
6)
Ger
man
y (N
=35)
Irela
nd
(N=2
4)
Italy
(N
=4)
Spai
n (N
=1)
Swed
en
(N=1
2)
Am
p
Ctx
Chl
Cip
Gen
Str
Su
Tet
Tmp n % MS
group % n n n n n n n
R R R R R 25 64.1 21.4 4 0 2 15 2 0 2 R R R R 3 7.7 2.6 2 0 0 0 0 1 0 R R R 3 7.7 2.6 3 0 0 0 0 0 0
R R R 1 2.6 0.9 1 0 0 0 0 0 0 R R R 1 2.6 0.9 0 0 0 0 0 0 1 R R R R 1 2.6 0.9 0 1 0 0 0 0 0 R R R R R 1 2.6 0.9 0 1 0 0 0 0 0 R R R R R R 1 2.6 0.9 1 0 0 0 0 0 0 R R R R R R 1 2.6 0.9 0 0 0 1 0 0 0 R R R R R R R 1 2.6 0.9 0 0 1 0 0 0 0 R R R R R R R 1 2.6 0.9 1 0 0 0 0 0 0
Total 39 100 33.3 12 2 3 16 2 1 3 MS: Member State; Amp: ampicillin; Ctx: cefotaxime; Chl: chloramphenicol; Cip: ciprofloxacin; Gen: gentamicin; Str: streptomycin; Su: sulfonamides; Tet: tetracyclines; Tmp: trimethoprim. N: total number of isolates tested for susceptibility against the whole common antimicrobial set for Salmonella and multi-resistant; n: number of multi-resistant isolates; R: minimum inhibitory concentration (MIC) above epidemiological cut-off values (ECOFFs) from the European Committee on
Antimicrobial Susceptibility Testing (EUCAST).
Appendix Table MDRP14. Multi-resistance patterns of interest in monophasic Salmonella Typhimurium from turkey meat in MS reporting isolate-based data, 2012
Multi-resistance pattern MS (N=22)
Ger
man
y (N
=22)
Am
p
Ctx
Chl
Cip
Gen
Str
Su
Tet
Tmp n % MS n
R R R R R 12 63.2 54.5 12 R R R R 7 36.8 31.8 7
Total 19 100 86.4 19 MS: Member State; Amp: ampicillin; Ctx: cefotaxime; Chl: chloramphenicol; Cip: ciprofloxacin; Gen: gentamicin; Str: streptomycin; Su: sulfonamides; Tet: tetracyclines; Tmp: trimethoprim. N: total number of isolates tested for susceptibility against the whole common antimicrobial set for Salmonella and multi-resistant; n: number of multi-resistant isolates; R: minimum inhibitory concentration (MIC) above epidemiological cut-off values (ECOFFs) from the European Committee on
Antimicrobial Susceptibility Testing (EUCAST).
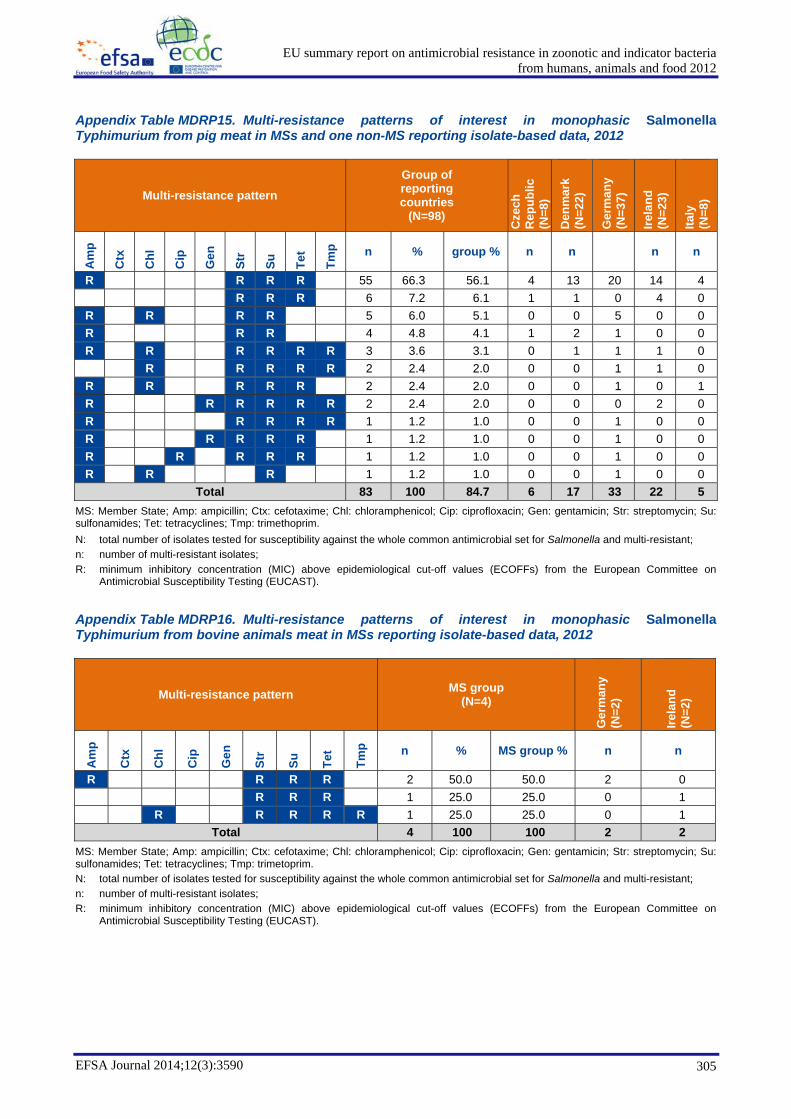
EU summary report on antimicrobial resistance in zoonotic and indicator bacteriafrom humans, animals and food 2012
EFSA Journal 2014;12(3):3590 305
Appendix Table MDRP15. Multi-resistance patterns of interest in monophasic Salmonella Typhimurium from pig meat in MSs and one non-MS reporting isolate-based data, 2012
Multi-resistance pattern Group of reporting countries
(N=98)
Cze
ch
Rep
ublic
(N
=8)
Den
mar
k (N
=22)
Ger
man
y (N
=37)
Irela
nd
(N=2
3)
Italy
(N
=8)
Am
p
Ctx
Chl
Cip
Gen
Str
Su
Tet
Tmp n % group % n n n n
R R R R 55 66.3 56.1 4 13 20 14 4 R R R 6 7.2 6.1 1 1 0 4 0
R R R R 5 6.0 5.1 0 0 5 0 0 R R R 4 4.8 4.1 1 2 1 0 0 R R R R R R 3 3.6 3.1 0 1 1 1 0 R R R R R 2 2.4 2.0 0 0 1 1 0
R R R R R 2 2.4 2.0 0 0 1 0 1 R R R R R R 2 2.4 2.0 0 0 0 2 0 R R R R R 1 1.2 1.0 0 0 1 0 0 R R R R R 1 1.2 1.0 0 0 1 0 0 R R R R R 1 1.2 1.0 0 0 1 0 0 R R R 1 1.2 1.0 0 0 1 0 0
Total 83 100 84.7 6 17 33 22 5 MS: Member State; Amp: ampicillin; Ctx: cefotaxime; Chl: chloramphenicol; Cip: ciprofloxacin; Gen: gentamicin; Str: streptomycin; Su: sulfonamides; Tet: tetracyclines; Tmp: trimethoprim. N: total number of isolates tested for susceptibility against the whole common antimicrobial set for Salmonella and multi-resistant; n: number of multi-resistant isolates; R: minimum inhibitory concentration (MIC) above epidemiological cut-off values (ECOFFs) from the European Committee on
Antimicrobial Susceptibility Testing (EUCAST).
Appendix Table MDRP16. Multi-resistance patterns of interest in monophasic Salmonella Typhimurium from bovine animals meat in MSs reporting isolate-based data, 2012
Multi-resistance pattern MS group (N=4)
Ger
man
y (N
=2)
Irela
nd
(N=2
)
Am
p
Ctx
Chl
Cip
Gen
Str
Su
Tet
Tmp n % MS group % n n
R R R R 2 50.0 50.0 2 0 R R R 1 25.0 25.0 0 1 R R R R R 1 25.0 25.0 0 1
Total 4 100 100 2 2 MS: Member State; Amp: ampicillin; Ctx: cefotaxime; Chl: chloramphenicol; Cip: ciprofloxacin; Gen: gentamicin; Str: streptomycin; Su: sulfonamides; Tet: tetracyclines; Tmp: trimetoprim. N: total number of isolates tested for susceptibility against the whole common antimicrobial set for Salmonella and multi-resistant; n: number of multi-resistant isolates; R: minimum inhibitory concentration (MIC) above epidemiological cut-off values (ECOFFs) from the European Committee on
Antimicrobial Susceptibility Testing (EUCAST).

EU summary report on antimicrobial resistance in zoonotic and indicator bacteriafrom humans, animals and food 2012
EFSA Journal 2014;12(3):3590 306
Appendix Table MDRP17. Multi-resistance patterns of interest in monophasic Salmonella Typhimurium from broilers in MSs reporting isolate-based data, 2012
Multi-resistance pattern MS group (N=8)
Den
mar
k (N
=4)
Spai
n (N
=4)
Am
p
Ctx
Chl
Cip
Gen
Str
Su
Tet
Tmp n % MS
group % n n
R R R R 5 71.4 62.5 3 2 R R R R 1 14.3 12.5 0 1 R R R R R R 1 14.3 12.5 0 1
Total 7 100 87.5 3 4 MS: Member State; Amp: ampicillin; Ctx: cefotaxime; Chl: chloramphenicol; Cip: ciprofloxacin; Gen: gentamicin; Str: streptomycin; Su: sulfonamides; Tet: tetracyclines; Tmp: trimethoprim. N: total number of isolates tested for susceptibility against the whole common antimicrobial set for Salmonella and multi-resistant; n: number of multi-resistant isolates; R: minimum inhibitory concentration (MIC) above epidemiological cut-off values (ECOFFs) from the European Committee on
Antimicrobial Susceptibility Testing (EUCAST).
Appendix Table MDRP18. Multi-resistance patterns of interest in monophasic Salmonella Typhimurium from laying hens in MSs reporting isolate-based data, 2012
Multi-resistance pattern MS group (N=11)
Den
mar
k (N
=1)
Italy
(N
=5)
Spai
n (N
=4)
Uni
ted
Kin
gdom
(N
=1)
Am
p
Ctx
Chl
Cip
Gen
Str
Su
Tet
Tmp n % MS
group % n n n n
R R R R 6 60.0 54.5 1 3 2 0 R R R R R 2 20.0 18.2 0 1 1 0 R R R 1 10.0 9.1 0 0 0 1
R R R R R 1 10.0 9.1 0 0 1 0 Total 10 100 90.9 1 4 4 1
MS: Member State; Amp: ampicillin; Ctx: cefotaxime; Chl: chloramphenicol; Cip: ciprofloxacin; Gen: gentamicin; Str: streptomycin; Su: sulfonamides; Tet: tetracyclines; Tmp: trimethoprim. N: total number of isolates tested for susceptibility against the whole common antimicrobial set for Salmonella and multi-resistant; n: number of multi-resistant isolates; R: minimum inhibitory concentration (MIC) above epidemiological cut-off values (ECOFFs) from the European Committee on
Antimicrobial Susceptibility Testing (EUCAST).
Appendix Table MDRP19. Multi-resistance patterns of interest in monophasic Salmonella Typhimurium from turkeys in MSs reporting isolate-based data, 2012
Multi-resistance pattern MS group (N=28)
Ger
man
y (N
=22)
Italy
(N
=4)
Spai
n (N
=1)
Uni
ted
Kin
gdom
(N
=1)
Am
p
Ctx
Chl
Cip
Gen
Str
Su
Tet
Tmp n % MS
group % n n n n
R R R R 17 85.0 60.7 15 0 1 1 R R R R R 1 5.0 3.6 1 0 0 0 R R R R R R 1 5.0 3.6 0 1 0 0 R R R R R 1 5.0 3.6 1 0 0 0
Total 20 100 71.4 17 1 1 1 MS: Member State;.Amp: ampicillin; Ctx: cefotaxime; Chl: chloramphenicol; Cip: ciprofloxacin; Gen: gentamicin; Str: streptomycin; Su: sulfonamides; Tet: tetracyclines; Tmp: trimethoprim N: total number of isolates tested for susceptibility against the whole common antimicrobial set for Salmonella and multi-resistant; n: number of multi-resistant isolates; R: minimum inhibitory concentration (MIC) above epidemiological cut-off values (ECOFFs) from the European Committee on
Antimicrobial Susceptibility Testing (EUCAST).

EU summary report on antimicrobial resistance in zoonotic and indicator bacteriafrom humans, animals and food 2012
EFSA Journal 2014;12(3):3590 307
Appendix Table MDRP20. Multi-resistance patterns of interest in monophasic Salmonella Typhimurium from fattening pigs in MSs reporting isolate-based data, 2012
Multi-resistance pattern MS group (N=279)
Den
mar
k (N
=29)
Ger
man
y (N
=228
)
Irela
nd
(N=6
)
Italy
(N
=2)
Spai
n (N
=14)
Am
p
Ctx
Chl
Cip
Gen
Str
Su
Tet
Tmp n % MS
group % n n n n n
R R R R 192 74.4 68.8 18 163 3 1 7 R R R R R 11 4.3 3.9 1 10 0 0 0 R R R R R R 10 3.9 3.6 0 9 0 0 1 R R R R R 10 3.9 3.6 0 10 0 0 0 R R R 7 2.7 2.5 2 5 0 0 0 R R R R R R 4 1.6 1.4 0 3 0 1 0 R R R R R 3 1.2 1.1 2 0 0 0 1 R R R 3 1.2 1.1 0 3 0 0 0 R R R R R R R 3 1.2 1.1 0 3 0 0 0 R R R R R R R 3 1.2 1.1 0 3 0 0 0 R R R 2 0.8 0.7 0 2 0 0 0 R R R 1 0.4 0.4 0 0 1 0 0 R R R R R 1 0.4 0.4 0 0 0 0 1
R R R R 1 0.4 0.4 0 0 0 0 1 R R R R R R 1 0.4 0.4 0 1 0 0 0 R R R R R 1 0.4 0.4 0 1 0 0 0 R R R R R 1 0.4 0.4 0 1 0 0 0 R R R R R R R R 1 0.4 0.4 0 0 0 0 1 R R R R R 1 0.4 0.4 0 1 0 0 0 R R R R R R R 1 0.4 0.4 0 0 0 0 1 R R R R R R R R R 1 0.4 0.4 0 1 0 0 0
Total 258 100 92.5 23 216 4 2 13 MS: Member State; Amp: ampicillin; Ctx: cefotaxime; Chl: chloramphenicol; Cip: ciprofloxacin; Gen: gentamicin; Str: streptomycin; Su: sulfonamides; Tet: tetracyclines; Tmp: trimethoprim. N: total number of isolates tested for susceptibility against the whole common antimicrobial set for Salmonella and multi-resistant; n: number of multi-resistant isolates; R: minimum inhibitory concentration (MIC) above epidemiological cut-off values (ECOFFs) from the European Committee on
Antimicrobial Susceptibility Testing (EUCAST).

EU summary report on antimicrobial resistance in zoonotic and indicator bacteriafrom humans, animals and food 2012
EFSA Journal 2014;12(3):3590 308
Appendix Table MDRP21. Multi-resistance patterns of interest in monophasic Salmonella Typhimurium from cattle in MSs reporting isolate-based data, 2012
Multi-resistance pattern MS group (N=15)
Ger
man
y (N
=7)
Irela
nd
(N=5
)
Italy
(N
=2)
Spai
n (N
=1)
Am
p
Ctx
Chl
Cip
Gen
Str
Su
Tet
Tmp n % MS
group % n n n n
R R R R 13 92.9 86.7 5 5 2 1 R R R 1 7.1 6.7 1 0 0 0
Total 14 100 93.3 6 5 2 1 MS: Member State; Amp: ampicillin; Ctx: cefotaxime; Chl: chloramphenicol; Cip: ciprofloxacin; Gen: gentamicin; Str: streptomycin; Su: sulfonamides; Tet: tetracyclines; Tmp: trimethoprim. N: total number of isolates tested for susceptibility against the whole common antimicrobial set for Salmonella and multi-resistant; n: number of multi-resistant isolates; R: minimum inhibitory concentration (MIC) above epidemiological cut-off values (ECOFFs) from the European Committee on
Antimicrobial Susceptibility Testing (EUCAST).
Appendix Table MDRP22. Multi-resistance patterns of interest in Salmonella Kentucky from broiler meat in MSs reporting isolate-based data, 2012
Multi-resistance pattern MS group (N=65)
Irela
nd
(N=6
0)
Rom
ania
(N
=5)
Am
p
Ctx
Chl
Cip
Gen
Str
Su
Tet
Tmp n % MS
group % n n
R R R R R R 6 50.0 9.2 1 5 R R R 4 33.3 6.2 4 0 R R R 1 8.3 1.5 1 0 R R R R 1 8.3 1.5 1 0
Total 12 100 18.5 7 5 MS: Member State; Amp: ampicillin; Ctx: cefotaxime; Chl: chloramphenicol; Cip: ciprofloxacin; Gen: gentamicin; Str: streptomycin; Su: sulfonamides; Tet: tetracyclines; Tmp: trimethoprim. N: total number of isolates tested for susceptibility against the whole common antimicrobial set for Salmonella and multi-resistant; n: number of multi-resistant isolates; R: minimum inhibitory concentration (MIC) above epidemiological cut-off values (ECOFFs) from the European Committee on
Antimicrobial Susceptibility Testing (EUCAST).

EU summary report on antimicrobial resistance in zoonotic and indicator bacteriafrom humans, animals and food 2012
EFSA Journal 2014;12(3):3590 309
Appendix Table MDRP23. Multi-resistance patterns of interest in Salmonella Kentucky from broilers in MSs reporting isolate-based data, 2012
Multi-resistance pattern MS group (N=120)
Cze
ch
Rep
ublic
(N
=9)
Hun
gary
(N
=1)
Irela
nd
(N=3
1)
Italy
(N
=2)
Rom
ania
(N
=68)
Spai
n (N
=6)
Am
p
Ctx
Chl
Cip
Gen
Str
Su
Tet
Tmp n % MS
group % n n n n n n
R R R R R R 45 57.0 37.5 4 0 0 0 41 0 R R R R R 17 21.5 14.2 1 1 0 0 15 0 R R R R R R R 4 5.1 3.3 0 0 0 0 4 0 R R R R R 2 2.5 1.7 0 0 0 0 0 2 R R R R R R R R R 2 2.5 1.7 0 0 0 0 2 0 R R R R 1 1.3 0.8 0 0 0 0 0 1
R R R R 1 1.3 0.8 0 0 1 0 0 0 R R R 1 1.3 0.8 0 0 0 1 0 0 R R R R 1 1.3 0.8 0 0 0 0 1 0 R R R R 1 1.3 0.8 0 0 0 0 1 0 R R R R R R R 1 1.3 0.8 0 0 0 0 1 0 R R R R R R R 1 1.3 0.8 0 0 0 0 1 0 R R R 1 1.3 0.8 0 0 0 1 0 0 R R R R R R R R 1 1.3 0.8 0 0 0 0 1 0
Total 79 100 65.8 5 1 1 2 67 3 MS: Member State; Amp: ampicillin; Ctx: cefotaxime; Chl: chloramphenicol; Cip: ciprofloxacin; Gen: gentamicin; Str: streptomycin; Su: sulfonamides; Tet: tetracyclines; Tmp: trimethoprim; N: total number of isolates tested for susceptibility against the whole common antimicrobial set for Salmonella and multi-resistant; n: number of multi-resistant isolates; R: minimum inhibitory concentration (MIC) above epidemiological cut-off values (ECOFFs) from the European Committee on Antimicrobial Susceptibility Testing (EUCAST).
Appendix Table MDRP24. Multi-resistance patterns of interest in Salmonella Kentucky from laying hens in MSs reporting isolate-based data, 2012
Multi-resistance pattern MS group (N=29)
Hun
gary
(N
=2)
Italy
(N
=19)
Rom
ania
(N
=4)
Spai
n (N
=4)
Am
p
Ctx
Chl
Cip
Gen
Str
Su
Tet
Tmp n % MS
group % n n n n
R R R 6 35.3 20.7 0 6 0 0 R R R R R R 3 17.7 10.3 2 0 1 0 R R R 2 11.8 6.9 0 2 0 0 R R R R R 1 5.9 3.4 0 0 0 1
R R R R 1 5.9 3.4 0 1 0 0 R R R R R 1 5.9 3.4 0 1 0 0 R R R R R 1 5.9 3.4 0 0 1 0 R R R R R R 1 5.9 3.4 0 1 0 0 R R R R R R R R 1 5.9 3.4 0 0 0 1
Total 17 100 58.6 2 11 2 2 MS: Member State; Amp: ampicillin; Ctx: cefotaxime; Chl: chloramphenicol; Cip: ciprofloxacin; Gen: gentamicin; Str: streptomycin; Su: sulfonamides; Tet: tetracyclines; Tmp: trimethoprim; N: total number of isolates tested for susceptibility against the whole common antimicrobial set for Salmonella and multi-resistant; n: number of multi-resistant isolates; R: minimum inhibitory concentration (MIC) above epidemiological cut-off values (ECOFFs) from the European Committee on Antimicrobial Susceptibility Testing (EUCAST).

EU summary report on antimicrobial resistance in zoonotic and indicator bacteriafrom humans, animals and food 2012
EFSA Journal 2014;12(3):3590 310
Appendix Table MDRP25. Multi-resistance patterns of interest in Salmonella Derby from pig meat in MSs reporting isolate-based data, 2012
Multi-resistance pattern MS group (N=80)
Ger
man
y (N
=28)
Irela
nd
(N=5
)
Italy
(N
=26)
Rom
ania
(N
=21)
Am
p
Ctx
Chl
Cip
Gen
Str
Su
Tet
Tmp n % MS
group % n n n n
R R R 16 64.0 20.0 1 1 7 7 R R R R R 3 12.0 3.8 1 0 1 1 R R R 1 4.0 1.3 1 0 0 0 R R R 1 4.0 1.3 0 0 1 0 R R R R 1 4.0 1.3 0 1 0 0 R R R R R 1 4.0 1.3 0 0 1 0
R R R 1 4.0 1.3 0 0 0 1 R R R R 1 4.0 1.3 0 0 1 0
Total 25 100 31.3 3 2 11 9 MS: Member State; Amp: ampicillin; Ctx: cefotaxime; Chl: chloramphenicol; Cip: ciprofloxacin; Gen: gentamicin; Str: streptomycin; Su: sulfonamides; Tet: tetracyclines; Tmp: trimethoprim. N: total number of isolates tested for susceptibility against the whole common antimicrobial set for Salmonella and multi-resistant; n: number of multi-resistant isolates; R: minimum inhibitory concentration (MIC) above epidemiological cut-off values (ECOFFs) from the European Committee on
Antimicrobial Susceptibility Testing (EUCAST).
Appendix Table MDRP26. Multi-resistance patterns of interest in Salmonella Derby from bovine animals meat in MSs reporting isolate-based data, 2012
Multi-resistance pattern MS group (N=8)
Cze
ch
Rep
ublic
(N
=3)
Italy
(N
=5)
Irela
nd
(N=2
)
Am
p
Ctx
Chl
Cip
Gen
Str
Su
Tet
Tmp n % MS
group % n n n
R R R 1 33.3 12.5 0 1 0 R R R R 1 33.3 12.5 1 0 0
R R R R R 1 33.3 12.5 0 1 0 Total 3 100 37.5 1 2 0
MS: Member State; Amp: ampicillin; Ctx: cefotaxime; Chl: chloramphenicol; Cip: ciprofloxacin; Gen: gentamicin; Str: streptomycin; Su: sulfonamides; Tet: tetracyclines; Tmp: trimethoprim. N: total number of isolates tested for susceptibility against the whole common antimicrobial set for Salmonella and multi-resistant; n: number of multi-resistant isolates; R: minimum inhibitory concentration (MIC) above epidemiological cut-off values (ECOFFs) from the European Committee on
Antimicrobial Susceptibility Testing (EUCAST).

EU summary report on antimicrobial resistance in zoonotic and indicator bacteriafrom humans, animals and food 2012
EFSA Journal 2014;12(3):3590 311
Appendix Table MDRP27. Multi-resistance patterns of interest in Salmonella Derby from broilers in MS reporting isolate-based data, 2012
Multi-resistance pattern MS (N=2)
Rom
ania
(N
=2)
Am
p
Ctx
Chl
Cip
Gen
Str
Su
Tet
Tmp n % MS n
R R R 1 50.0 50.0 1 R R R R 1 50.0 50.0 1
Total 2 100 100 2 MS: Member State; Amp: ampicillin; Ctx: cefotaxime; Chl: chloramphenicol; Cip: ciprofloxacin; Gen: gentamicin; Str: streptomycin; Su: sulfonamides; Tet: tetracyclines; Tmp: trimethoprim. N: total number of isolates tested for susceptibility against the whole common antimicrobial set for Salmonella and multi-resistant; n: number of multi-resistant isolates; R: minimum inhibitory concentration (MIC) above epidemiological cut-off values (ECOFFs) from the European Committee on
Antimicrobial Susceptibility Testing (EUCAST).
Appendix Table MDRP28. Multi-resistance patterns of interest in Salmonella Derby from turkeys in MSs reporting isolate-based data, 2012
Multi-resistance pattern MS group (N=124)
Irela
nd
(N=2
)
Italy
(N
=3)
Spai
n (N
=118
)
Uni
ted
Kin
gdom
(N
=1)
Am
p
Ctx
Chl
Cip
Gen
Str
Su
Tet
Tmp n % MS
group % n n n n
R R R R R R 62 50.0 50.0 0 0 62 0 R R R R R 39 31.5 31.5 0 0 39 0 R R R R R R R 10 8.1 8.1 0 0 10 0 R R R 3 2.4 2.4 2 0 0 1
R R R R 3 2.4 2.4 0 1 2 0 R R R R 1 0.8 0.8 0 0 1 0 R R R R R R 1 0.8 0.8 0 0 1 0 R R R R R 1 0.8 0.8 0 0 1 0 R R R R R R 1 0.8 0.8 0 0 1 0 R R R R R 1 0.8 0.8 0 0 1 0 R R R R R R R R 1 0.8 0.8 0 1 0 0 R R R R R R R R 1 0.8 0.8 0 1 0 0
Total 124 100 100 2 3 118 1 MS: Member State; Amp: ampicillin; Ctx: cefotaxime; Chl: chloramphenicol; Cip: ciprofloxacin; Gen: gentamicin; Str: streptomycin; Su: sulfonamides; Tet: tetracyclines; Tmp: trimethoprim. N: total number of isolates tested for susceptibility against the whole common antimicrobial set for Salmonella and multi-resistant; n: number of multi-resistant isolates; R: minimum inhibitory concentration (MIC) above epidemiological cut-off values (ECOFFs) from the European Committee on
Antimicrobial Susceptibility Testing (EUCAST).
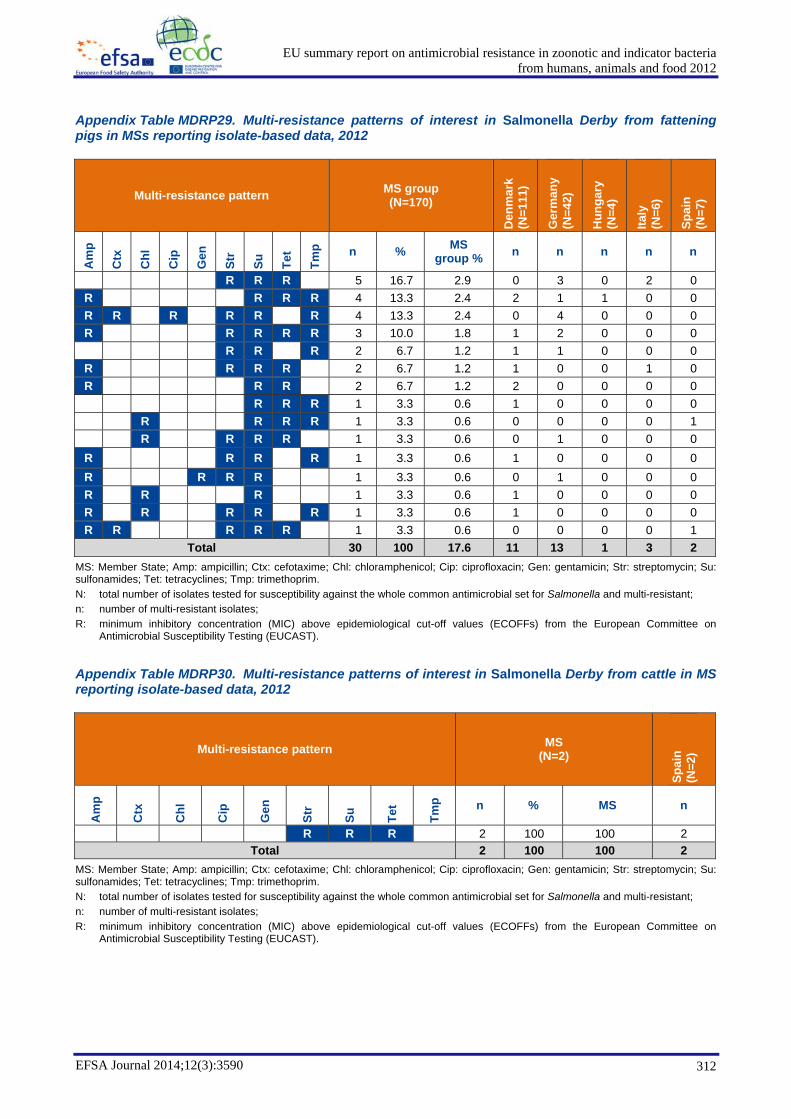
EU summary report on antimicrobial resistance in zoonotic and indicator bacteriafrom humans, animals and food 2012
EFSA Journal 2014;12(3):3590 312
Appendix Table MDRP29. Multi-resistance patterns of interest in Salmonella Derby from fattening pigs in MSs reporting isolate-based data, 2012
Multi-resistance pattern MS group (N=170)
Den
mar
k (N
=111
)
Ger
man
y (N
=42)
Hun
gary
(N
=4)
Italy
(N
=6)
Spai
n (N
=7)
Am
p
Ctx
Chl
Cip
Gen
Str
Su
Tet
Tmp n % MS
group % n n n n n
R R R 5 16.7 2.9 0 3 0 2 0 R R R R 4 13.3 2.4 2 1 1 0 0 R R R R R R 4 13.3 2.4 0 4 0 0 0 R R R R R 3 10.0 1.8 1 2 0 0 0 R R R 2 6.7 1.2 1 1 0 0 0
R R R R 2 6.7 1.2 1 0 0 1 0 R R R 2 6.7 1.2 2 0 0 0 0 R R R 1 3.3 0.6 1 0 0 0 0 R R R R 1 3.3 0.6 0 0 0 0 1 R R R R 1 3.3 0.6 0 1 0 0 0
R R R R 1 3.3 0.6 1 0 0 0 0 R R R R 1 3.3 0.6 0 1 0 0 0 R R R 1 3.3 0.6 1 0 0 0 0 R R R R R 1 3.3 0.6 1 0 0 0 0 R R R R R 1 3.3 0.6 0 0 0 0 1
Total 30 100 17.6 11 13 1 3 2 MS: Member State; Amp: ampicillin; Ctx: cefotaxime; Chl: chloramphenicol; Cip: ciprofloxacin; Gen: gentamicin; Str: streptomycin; Su: sulfonamides; Tet: tetracyclines; Tmp: trimethoprim. N: total number of isolates tested for susceptibility against the whole common antimicrobial set for Salmonella and multi-resistant; n: number of multi-resistant isolates; R: minimum inhibitory concentration (MIC) above epidemiological cut-off values (ECOFFs) from the European Committee on
Antimicrobial Susceptibility Testing (EUCAST).
Appendix Table MDRP30. Multi-resistance patterns of interest in Salmonella Derby from cattle in MS reporting isolate-based data, 2012
Multi-resistance pattern MS (N=2)
Spai
n (N
=2)
Am
p
Ctx
Chl
Cip
Gen
Str
Su
Tet
Tmp n % MS n
R R R 2 100 100 2 Total 2 100 100 2
MS: Member State; Amp: ampicillin; Ctx: cefotaxime; Chl: chloramphenicol; Cip: ciprofloxacin; Gen: gentamicin; Str: streptomycin; Su: sulfonamides; Tet: tetracyclines; Tmp: trimethoprim. N: total number of isolates tested for susceptibility against the whole common antimicrobial set for Salmonella and multi-resistant; n: number of multi-resistant isolates; R: minimum inhibitory concentration (MIC) above epidemiological cut-off values (ECOFFs) from the European Committee on
Antimicrobial Susceptibility Testing (EUCAST).

EU summary report on antimicrobial resistance in zoonotic and indicator bacteriafrom humans, animals and food 2012
EFSA Journal 2014;12(3):3590 313
Appendix Table MDRP31. Multi-resistance patterns of interest in Salmonella Infantis from broiler meat in MSs reporting isolate-based data, 2012
Multi-resistance pattern MS group (N=162)
Cze
ch
Rep
ublic
(N
=10)
Esto
nia
(N=2
)
Ger
man
y (N
=24)
Italy
(N
=3)
Rom
ania
(N
=123
)
Am
p
Ctx
Chl
Cip
Gen
Str
Su
Tet
Tmp n % MS
group % n n n n n
R R R 50 33.3 30.9 4 0 13 3 30 R R R R 43 28.7 26.5 0 0 2 0 41 R R R R R 26 17.3 16.0 0 0 0 0 26 R R R R 14 9.3 8.6 5 1 2 0 6 R R R R R 3 2.0 1.9 0 0 0 0 3 R R R R R 2 1.3 1.2 0 0 0 0 2
R R R R R R 2 1.3 1.2 0 0 0 0 2 R R R 1 0.7 0.6 0 1 0 0 0 R R R R 1 0.7 0.6 0 0 0 0 1 R R R R R 1 0.7 0.6 0 0 0 0 1 R R R R R 1 0.7 0.6 0 0 0 0 1 R R R R R R 1 0.7 0.6 0 0 0 0 1
R R R 1 0.7 0.6 1 0 0 0 0 R R R R R 1 0.7 0.6 0 0 0 0 1 R R R R R R 1 0.7 0.6 0 0 0 0 1 R R R R R R R 1 0.7 0.6 0 0 0 0 1 R R R R R R R 1 0.7 0.6 0 0 0 0 1
Total 150 100 92.6 10 2 17 3 118 MS: Member State; Amp: ampicillin; Ctx: cefotaxime; Chl: chloramphenicol; Cip: ciprofloxacin; Gen: gentamicin; Str: streptomycin; Su: sulfonamides; Tet: tetracyclines; Tmp: trimethoprim. N: total number of isolates tested for susceptibility against the whole common antimicrobial set for Salmonella and multi-resistant; n: number of multi-resistant isolates; R: minimum inhibitory concentration (MIC) above epidemiological cut-off values (ECOFFs) from the European Committee on
Antimicrobial Susceptibility Testing (EUCAST).
Appendix Table MDRP32. Multi-resistance patterns of interest in Salmonella Infantis from pig meat in MSs reporting isolate-based data, 2012
Multi-resistance pattern MS group (N=23)
Cze
ch
Rep
ublic
(N
=6)
Ger
man
y (N
=5)
Irela
nd
(N=2
)
Rom
ania
(N
=10)
Am
p
Ctx
Chl
Cip
Gen
Str
Su
Tet
Tmp n % MS
group % n n n n
R R R 5 38.5 21.7 0 0 0 5 R R R R 2 15.4 8.7 1 0 0 1
R R R R R 2 15.4 8.7 2 0 0 0 R R R 1 7.7 4.3 0 0 0 1
R R R 1 7.7 4.3 0 1 0 0 R R R R 1 7.7 4.3 0 1 0 0 R R R R R R R 1 7.7 4.3 0 0 1 0
Total 13 100 56.5 3 2 1 7 MS: Member State; Amp: ampicillin; Ctx: cefotaxime; Chl: chloramphenicol; Cip: ciprofloxacin; Gen: gentamicin; Str: streptomycin; Su: sulfonamides; Tet: tetracyclines; Tmp: trimethoprim. N: total number of isolates tested for susceptibility against the whole common antimicrobial set for Salmonella and multi-resistant; n: number of multi-resistant isolates; R: minimum inhibitory concentration (MIC) above epidemiological cut-off values (ECOFFs) from the European Committee on
Antimicrobial Susceptibility Testing (EUCAST).

EU summary report on antimicrobial resistance in zoonotic and indicator bacteriafrom humans, animals and food 2012
EFSA Journal 2014;12(3):3590 314
Appendix Table MDRP33. Multi-resistance patterns of interest in Salmonella Infantis from broilers in MSs reporting isolate-based data, 2012
Multi-resistance pattern MS group (N=529)
Aus
tria
(N
=21)
Cze
ch
Rep
ublic
(N
=51)
Hun
gary
(N
=157
)
Italy
(N
=17)
Rom
ania
(N
=283
)
Am
p
Ctx
Chl
Cip
Gen
Str
Su
Tet
Tmp n % MS
group % n n n n n
R R R 180 40.4 34.0 16 25 86 0 53 R R R R 78 17.5 14.7 5 16 28 0 29 R R R R 41 9.2 7.8 0 0 0 2 39 R R R R R 26 5.8 4.9 0 0 0 0 26
R R R R 18 4.0 3.4 0 5 5 2 6 R R R R R 12 2.7 2.3 0 3 2 0 7 R R R R R 12 2.7 2.3 0 0 0 0 12 R R R R R R 9 2.0 1.7 0 0 0 0 9 R R R R R 8 1.8 1.5 0 0 0 0 8
R R R R R R 7 1.6 1.3 0 0 0 1 6 R R R R R R 7 1.6 1.3 0 0 0 7 0 R R R R R 3 0.7 0.6 0 0 0 0 3 R R R R R 3 0.7 0.6 0 0 0 0 3 R R R R R 3 0.7 0.6 0 0 0 0 3 R R R R R 2 0.5 0.4 0 0 0 0 2 R R R R 2 0.5 0.4 0 0 2 0 0
R R R R R R 2 0.5 0.4 0 0 0 0 2 R R R R R R R 2 0.5 0.4 0 0 0 0 2 R R R R R R 2 0.5 0.4 0 0 0 0 2 R R R R R R R 2 0.5 0.4 0 0 0 0 2 R R R 2 0.5 0.4 0 0 0 0 2 R R R R R R R R 2 0.5 0.4 0 0 0 0 2 R R R R R R R R R 2 0.5 0.4 0 0 0 0 2 R R R 1 0.2 0.2 0 0 0 0 1 R R R 1 0.2 0.2 0 0 1 0 0 R R R 1 0.2 0.2 0 0 1 0 0 R R R 1 0.2 0.2 0 0 1 0 0
Table continued overleaf.

EU summary report on antimicrobial resistance in zoonotic and indicator bacteriafrom humans, animals and food 2012
EFSA Journal 2014;12(3):3590 315
Appendix Table MDRP33 (continued). Multi-resistance patterns of interest in Salmonella Infantis from broilers in MSs reporting isolate-based data, 2012
Multi-resistance pattern MS group (N=529)
Aus
tria
(N
=21)
Cze
ch
Rep
ublic
(N
=51)
Hun
gary
(N
=157
)
Italy
(N
=17)
Rom
ania
(N
=283
)
Am
p
Ctx
Chl
Cip
Gen
Str
Su
Tet
Tmp n % MS
group % n n n n n
R R R R R 1 0.2 0.2 0 0 0 0 1 R R R R R R 1 0.2 0.2 0 0 0 0 1 R R R R R 1 0.2 0.2 0 0 0 0 1 R R R R 1 0.2 0.2 0 0 0 0 1 R R R R R R R 1 0.2 0.2 0 0 0 0 1
R R R 1 0.2 0.2 0 0 0 0 1 R R R R 1 0.2 0.2 0 0 0 1 0 R R R R R R 1 0.2 0.2 0 0 0 0 1 R R R R R 1 0.2 0.2 0 0 0 0 1 R R R R R R 1 0.2 0.2 0 0 0 0 1 R R R R R R R R 1 0.2 0.2 0 0 0 0 1 R R R R R R R 1 0.2 0.2 0 0 0 0 1 R R R R R R 1 0.2 0.2 0 0 0 0 1 R R R R R R R 1 0.2 0.2 0 0 0 1 0 R R R R R R R 1 0.2 0.2 0 0 0 0 1 R R R R R R R 1 0.2 0.2 0 0 0 0 1
Total 445 100 84.1 21 49 126 14 235 MS: Member State; Amp: ampicillin; Ctx: cefotaxime; Chl: chloramphenicol; Cip: ciprofloxacin; Gen: gentamicin; Str: streptomycin; Su: sulfonamides; Tet: tetracyclines; Tmp: trimethoprim. N: total number of isolates tested for susceptibility against the whole common antimicrobial set for Salmonella and multi-resistant; n: number of multi-resistant isolates; R: minimum inhibitory concentration (MIC) above epidemiological cut-off values (ECOFFs) from the European Committee on
Antimicrobial Susceptibility Testing (EUCAST).

EU summary report on antimicrobial resistance in zoonotic and indicator bacteriafrom humans, animals and food 2012
EFSA Journal 2014;12(3):3590 316
Appendix Table MDRP34. Multi-resistance patterns of interest in Salmonella Infantis from laying hens in MSs reporting isolate-based data, 2012
Multi-resistance pattern MS group (N=36)
Aus
tria
(N
=4)
Den
mar
k (N
=1)
Hun
gary
(N
=15)
Rom
ania
(N
=16)
Am
p
Ctx
Chl
Cip
Gen
Str
Su
Tet
Tmp n % MS
group % n n n n
R R R 16 55.2 44.4 3 0 8 5 R R R R 5 17.2 13.9 0 0 1 4 R R R R 2 6.9 5.6 0 0 0 2
R R R R R 2 6.9 5.6 0 0 0 2 R R R 1 3.5 2.8 0 1 0 0 R R R R 1 3.5 2.8 0 0 0 1 R R R R R 1 3.5 2.8 0 0 0 1 R R R R R R 1 3.5 2.8 0 0 0 1
Total 29 100 80.6 3 1 9 16 MS: Member State; Amp: ampicillin; Ctx: cefotaxime; Chl: chloramphenicol; Cip: ciprofloxacin; Gen: gentamicin; Str: streptomycin; Su: sulfonamides; Tet: tetracyclines; Tmp: trimethoprim. N: total number of isolates tested for susceptibility against the whole common antimicrobial set for Salmonella and multi-resistant; n: number of multi-resistant isolates; R: minimum inhibitory concentration (MIC) above epidemiological cut-off values (ECOFFs) from the European Committee on
Antimicrobial Susceptibility Testing (EUCAST).
Appendix Table MDRP35. Multi-resistance patterns of interest in Salmonella Infantis from turkeys in MSs reporting isolate-based data, 2012
Multi-resistance pattern MS group (N=27)
Aus
tria
(N
=2)
Ger
man
y (N
=4)
Hun
gary
(N
=21)
Am
p
Ctx
Chl
Cip
Gen
Str
Su
Tet
Tmp n % MS
group % n n n
R R R 19 76.0 70.4 1 3 15 R R R R 5 20.0 18.5 1 1 3
R R R R 1 4.0 3.7 0 0 1 Total 25 100 92.6 2 4 19
MS: Member State; Amp: ampicillin; Ctx: cefotaxime; Chl: chloramphenicol; Cip: ciprofloxacin; Gen: gentamicin; Str: streptomycin; Su: sulfonamides; Tet: tetracyclines; Tmp: trimethoprim. N: total number of isolates tested for susceptibility against the whole common antimicrobial set for Salmonella and multi-resistant; n: number of multi-resistant isolates; R: minimum inhibitory concentration (MIC) above epidemiological cut-off values (ECOFFs) from the European Committee on
Antimicrobial Susceptibility Testing (EUCAST).

EU summary report on antimicrobial resistance in zoonotic and indicator bacteriafrom humans, animals and food 2012
EFSA Journal 2014;12(3):3590 317
Appendix Table MDRP36. Multi-resistance patterns of interest in Salmonella Infantis from fattening pigs in MSs reporting isolate-based data, 2012
Resistance pattern MS group (N=18)
Ger
man
y (N
=10)
Hun
gary
(N
=8)
Am
p
Ctx
Chl
Cip
Gen
Str
Su
Tet
Tmp n % MS
group % n n
R R R 6 50.0 33.3 0 6 R R R R R 2 16.7 11.1 2 0 R R R R 2 16.7 11.1 2 0 R R R 1 8.3 5.6 1 0 R R R R 1 8.3 5.6 0 1
Total 12 100 66.7 5 7 MS: Member State; Amp: ampicillin; Ctx: cefotaxime; Chl: chloramphenicol; Cip: ciprofloxacin; Gen: gentamicin; Str: streptomycin; Su: sulfonamides; Tet: tetracyclines; Tmp: trimethoprim. N: total number of isolates tested for susceptibility against the whole common antimicrobial set for Salmonella and multi-resistant; n: number of multi-resistant isolates; R: minimum inhibitory concentration (MIC) above epidemiological cut-off values (ECOFFs) from the European Committee on
Antimicrobial Susceptibility Testing (EUCAST).
Appendix Table MDRP37. Multi-resistance patterns of interest in Escherichia coli from broilers in MSs and one non-MS reporting isolate-based data, 2012
R R R 13 7.8 2.4 0 0 5 8 R R R R R R 11 6.6 2.1 6 0 2 3 R R R R 9 5.4 1.7 7 0 1 1 R R R R 9 5.4 1.7 8 0 1 0
R R R R 8 4.8 1.5 0 3 1 4 R R R 6 3.6 1.1 1 0 2 3
R R R 6 3.6 1.1 3 2 1 0 R R R 6 3.6 1.1 1 3 0 2 R R R R R 5 3.0 0.9 3 1 1 0 R R R R R R R 5 3.0 0.9 2 0 1 2 R R R 5 3.0 0.9 1 0 0 4
R R R R 5 3.0 0.9 3 0 2 0 R R R R R 5 3.0 0.9 0 0 1 4 R R R R 4 2.4 0.8 2 0 1 1
R R R R R 4 2.4 0.8 1 0 1 2 R R R 4 2.4 0.8 1 0 0 3 R R R 4 2.4 0.8 0 0 3 1 R R R 3 1.8 0.6 1 0 1 1
R R R R 3 1.8 0.6 0 2 1 0 R R R R 3 1.8 0.6 0 0 1 2 R R R R R R 3 1.8 0.6 1 0 2 0 R R R 3 1.8 0.6 0 3 0 0
Table continued overleaf.
Multi-resistance pattern Group of reporting countries (N=534)
Aus
tria
(N
=130
)
Den
mar
k (N
=115
)
Hun
gary
(N
=104
)
Switz
erla
nd
(N=1
85)
Am
p
Ctx
Chl
Cip
Gen
Str
Su
Tet
Tmp n % group % n n n n

EU summary report on antimicrobial resistance in zoonotic and indicator bacteriafrom humans, animals and food 2012
EFSA Journal 2014;12(3):3590 318
Appendix Table MDRP37 (continued). Multi-resistance patterns of interest in Escherichia coli from broilers in MSs and one non-MS reporting isolate-based data, 2012
R R R 2 1.2 0.4 1 0 0 1 R R R R 2 1.2 0.4 1 0 1 0 R R R R R R 2 1.2 0.4 1 0 1 0 R R R R R R 2 1.2 0.4 0 0 1 1 R R R R 2 1.2 0.4 0 0 2 0
R R R R 2 1.2 0.4 0 0 2 0 R R R R R 2 1.2 0.4 0 0 0 2 R R R 1 0.6 0.2 1 0 0 0 R R R R R 1 0.6 0.2 0 0 1 0 R R R R 1 0.6 0.2 1 0 0 0 R R R R R 1 0.6 0.2 1 0 0 0 R R R R R 1 0.6 0.2 1 0 0 0 R R R R R R 1 0.6 0.2 1 0 0 0 R R R R 1 0.6 0.2 0 0 1 0
R R R 1 0.6 0.2 0 1 0 0 R R R 1 0.6 0.2 1 0 0 0 R R R 1 0.6 0.2 0 0 1 0 R R R R 1 0.6 0.2 0 0 1 0 R R R 1 0.6 0.2 1 0 0 0 R R R R 1 0.6 0.2 0 0 1 0 R R R R R 1 0.6 0.2 0 0 1 0 R R R R R R 1 0.6 0.2 0 0 0 1 R R R R R 1 0.6 0.2 0 0 1 0 R R R R R 1 0.6 0.2 0 0 1 0 R R R R R 1 0.6 0.2 0 0 1 0 R R R R R R 1 0.6 0.2 1 0 0 0 R R R R R R R R 1 0.6 0.2 0 0 1 0 R R R 1 0.6 0.2 1 0 0 0 R R R R 1 0.6 0.2 0 0 1 0 R R R R R 1 0.6 0.2 1 0 0 0 R R R R R R 1 0.6 0.2 0 0 1 0 R R R R R R R 1 0.6 0.2 0 0 1 0 R R R R R R 1 0.6 0.2 1 0 0 0 R R R R R R 1 0.6 0.2 0 0 1 0 R R R R R R 1 0.6 0.2 1 0 0 0
Total 166 100 31.1 56 15 49 46 MS: Member State; Amp: ampicillin; Ctx: cefotaxime; Chl: chloramphenicol; Cip: ciprofloxacin; Gen: gentamicin; Str: streptomycin; Su: sulfonamides; Tet: tetracyclines; Tmp: trimethoprim. N: total number of isolates tested for susceptibility against the whole common antimicrobial set for E. coli and multi-resistant; n: number of multi-resistant isolates; R: minimum inhibitory concentration (MIC) above epidemiological cut-off values (ECOFFs) from the European Committee on
Antimicrobial Susceptibility Testing (EUCAST).
Multi-resistance pattern Group of reporting countries (N=534)
Aus
tria
(N
=130
)
Den
mar
k (N
=115
)
Hun
gary
(N
=104
)
Switz
erla
nd
(N=1
85)
Am
p
Ctx
Chl
Cip
Gen
Str
Su
Tet
Tmp n % group % n n n n
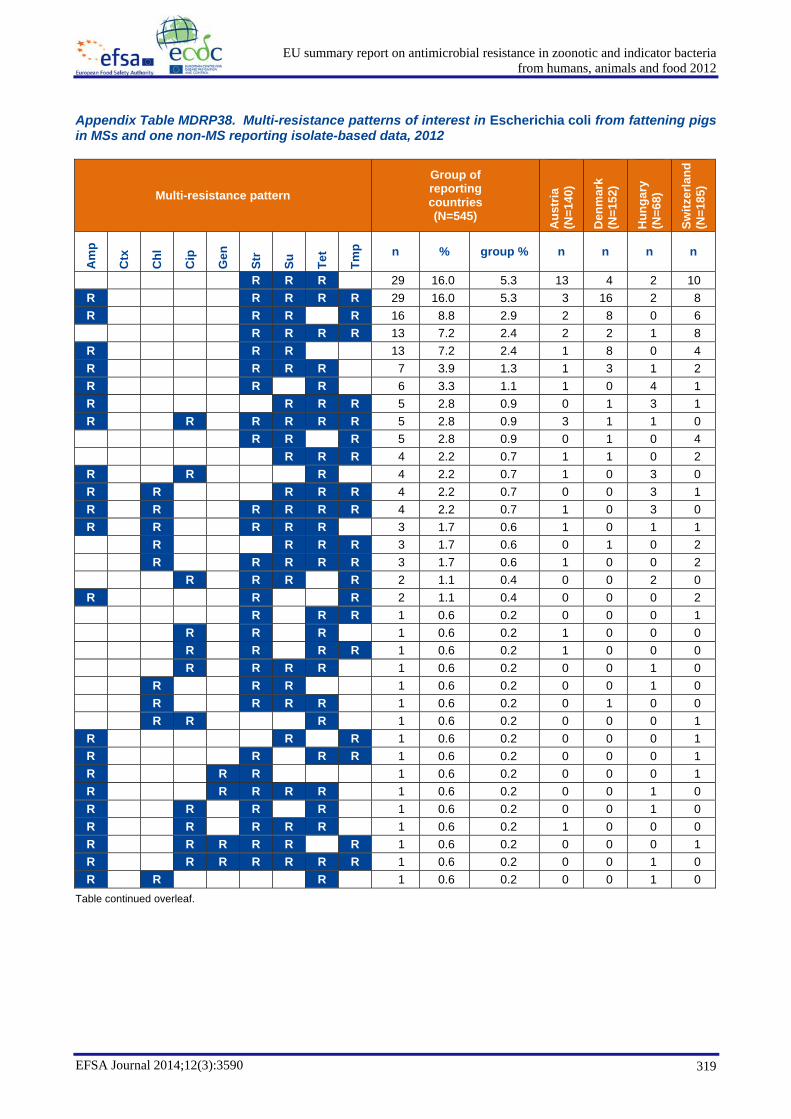
EU summary report on antimicrobial resistance in zoonotic and indicator bacteriafrom humans, animals and food 2012
EFSA Journal 2014;12(3):3590 319
Appendix Table MDRP38. Multi-resistance patterns of interest in Escherichia coli from fattening pigs in MSs and one non-MS reporting isolate-based data, 2012
Multi-resistance pattern Group of reporting countries (N=545)
Aus
tria
(N
=140
)
Den
mar
k (N
=152
)
Hun
gary
(N
=68)
Switz
erla
nd
(N=1
85)
Am
p
Ctx
Chl
Cip
Gen
Str
Su
Tet
Tmp n % group % n n n n
R R R 29 16.0 5.3 13 4 2 10 R R R R R 29 16.0 5.3 3 16 2 8 R R R R 16 8.8 2.9 2 8 0 6 R R R R 13 7.2 2.4 2 2 1 8
R R R 13 7.2 2.4 1 8 0 4 R R R R 7 3.9 1.3 1 3 1 2 R R R 6 3.3 1.1 1 0 4 1 R R R R 5 2.8 0.9 0 1 3 1 R R R R R R 5 2.8 0.9 3 1 1 0 R R R 5 2.8 0.9 0 1 0 4 R R R 4 2.2 0.7 1 1 0 2
R R R 4 2.2 0.7 1 0 3 0 R R R R R 4 2.2 0.7 0 0 3 1 R R R R R R 4 2.2 0.7 1 0 3 0 R R R R R 3 1.7 0.6 1 0 1 1 R R R R 3 1.7 0.6 0 1 0 2 R R R R R 3 1.7 0.6 1 0 0 2 R R R R 2 1.1 0.4 0 0 2 0
R R R 2 1.1 0.4 0 0 0 2 R R R 1 0.6 0.2 0 0 0 1 R R R 1 0.6 0.2 1 0 0 0 R R R R 1 0.6 0.2 1 0 0 0 R R R R 1 0.6 0.2 0 0 1 0 R R R 1 0.6 0.2 0 0 1 0 R R R R 1 0.6 0.2 0 1 0 0 R R R 1 0.6 0.2 0 0 0 1
R R R 1 0.6 0.2 0 0 0 1 R R R R 1 0.6 0.2 0 0 0 1 R R R 1 0.6 0.2 0 0 0 1 R R R R R 1 0.6 0.2 0 0 1 0 R R R R 1 0.6 0.2 0 0 1 0 R R R R R 1 0.6 0.2 1 0 0 0 R R R R R R 1 0.6 0.2 0 0 0 1 R R R R R R R 1 0.6 0.2 0 0 1 0 R R R 1 0.6 0.2 0 0 1 0
Table continued overleaf.

EU summary report on antimicrobial resistance in zoonotic and indicator bacteriafrom humans, animals and food 2012
EFSA Journal 2014;12(3):3590 320
Appendix Table MDRP38 (continued). Multi-resistance patterns of interest in Escherichia coli from fattening pigs in MSs and one non-MS reporting isolate-based data, 2012
Multi-resistance pattern Group of reporting countries (N=545)
Aus
tria
(N
=140
)
Den
mar
k (N
=152
)
Hun
gary
(N
=68)
Switz
erla
nd
(N=1
85)
Am
p
Ctx
Chl
Cip
Gen
Str
Su
Tet
Tmp n % group % n n n n
R R R R 1 0.6 0.2 0 0 0 1 R R R R 1 0.6 0.2 0 0 1 0 R R R R 1 0.6 0.2 0 1 0 0 R R R R R 1 0.6 0.2 0 0 0 1 R R R R R R 1 0.6 0.2 0 1 0 0 R R R 1 0.6 0.2 0 0 1 0 R R R R R R 1 0.6 0.2 0 0 0 1 R R R 1 0.6 0.2 0 0 0 1
Total 181 100 33.2 34 49 34 64 MS: Member State; Amp: ampicillin; Ctx: cefotaxime; Chl: chloramphenicol; Cip: ciprofloxacin; Gen: gentamicin; Str: streptomycin; Su: sulfonamides; Tet: tetracyclines; Tmp: trimethoprim. N: total number of isolates tested for susceptibility against the whole common antimicrobial set for E. coli and multi-resistant; n: number of multi-resistant isolates; R: minimum inhibitory concentration (MIC) above epidemiological cut-off values (ECOFFs) from the European Committee on
Antimicrobial Susceptibility Testing (EUCAST).

EU summary report on antimicrobial resistance in zoonotic and indicator bacteriafrom humans, animals and food 2012
EFSA Journal 2014;12(3):3590 321
APPENDIX 5. High-level resistance to ciprofloxacin
Appendix Table HLCR1. High-level ciprofloxacin resistance in Salmonella serovars from broiler meat in MSs reporting isolate-based data, 2012
Country
Isolates resistant at
> 0.06 mg/L1 Cip
Isolates resistant at
> 1 mg/L2 Cip
Isolates resistant at
> 2 mg/L3 Cip
Isolates resistant at
> 4 mg/L4 Cip Resistance patterns of isolates
resistant at > 4 mg/L Cip
Salmonella serovars
n (%) n (%) n (%) n (%) Czech Republic (N=47) 16 (34.0 %) 0 (0 %) 0 (0 %) 0 (0 %) NA NA Estonia (N=3) 2 (66.7 %) 0 (0 %) 0 (0 %) 0 (0 %) NA NA Germany (N=94) 66 (70.2 %) 1 (1.1 %) 0 (0 %) 0 (0 %) NA NA Ireland (N=70) 8 (11.4 %) 1 (1.4 %) 1 (1.4 %) 1 (1.4 %) AmpCipGenNalStrSuTet (1) S. Kentucky Italy (N=8) 4 (50.0 %) 0 (0 %) 0 (0 %) 0 (0 %) NA NA Romania (N=188) 168 (89.4%) 14 (7.4 %) 3 (1.6 %) 1 (0.5 %) CipNalSuTetTmp(1) S. Infantis Total (6 MSs) (N=410) 264 (64.4 %) 16 (3.9 %) 4 (1.0 %) 2 (0.5 %)
MS: Member State; Cip: ciprofloxacin; N: Total number isolates for which relevant data are available; n: number of resistant isolates; NA: not applicable. 1: European Committee on Antimicrobial Susceptibility Testing (EUCAST) epidemiological cut-off values (ECOFFs). 2: EUCAST clinical breakpoint. 3: High breakpoint. 4: Very high breakpoint.
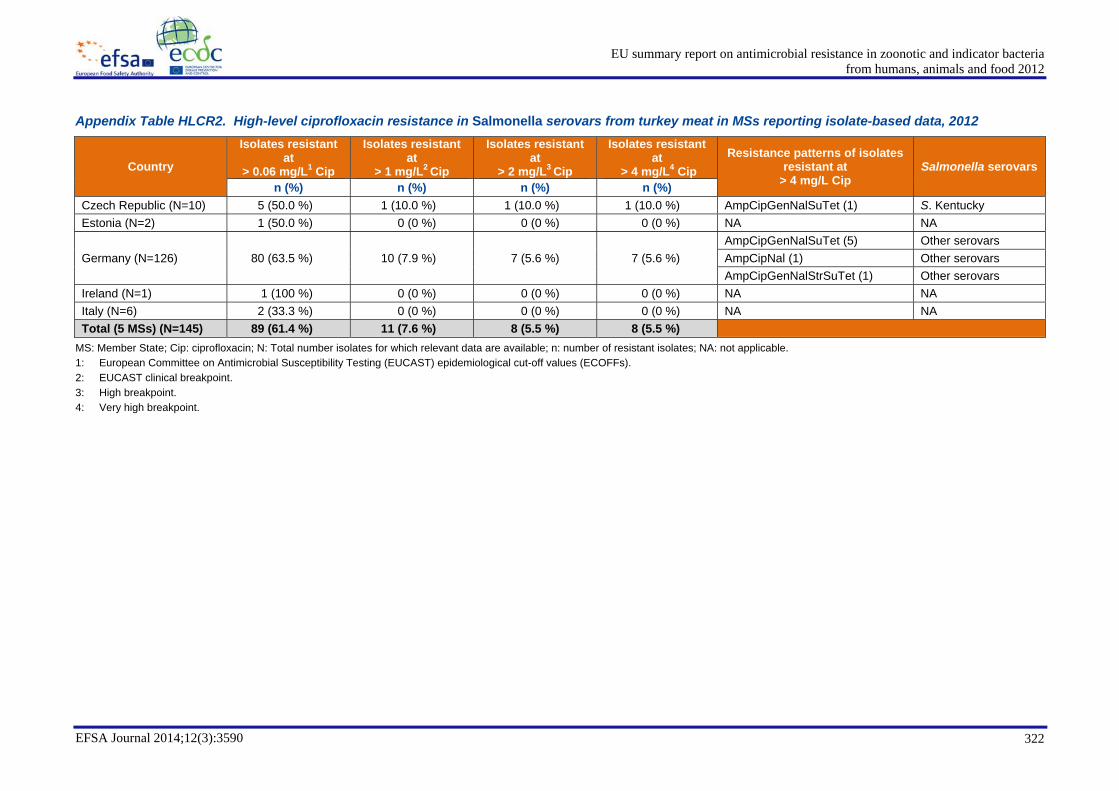
EU summary report on antimicrobial resistance in zoonotic and indicator bacteriafrom humans, animals and food 2012
EFSA Journal 2014;12(3):3590 322
Appendix Table HLCR2. High-level ciprofloxacin resistance in Salmonella serovars from turkey meat in MSs reporting isolate-based data, 2012
Country
Isolates resistant at
> 0.06 mg/L1 Cip
Isolates resistant at
> 1 mg/L2 Cip
Isolates resistant at
> 2 mg/L3 Cip
Isolates resistant at
> 4 mg/L4 Cip Resistance patterns of isolates
resistant at > 4 mg/L Cip
Salmonella serovars
n (%) n (%) n (%) n (%) Czech Republic (N=10) 5 (50.0 %) 1 (10.0 %) 1 (10.0 %) 1 (10.0 %) AmpCipGenNalSuTet (1) S. Kentucky Estonia (N=2) 1 (50.0 %) 0 (0 %) 0 (0 %) 0 (0 %) NA NA
Germany (N=126) 80 (63.5 %) 10 (7.9 %) 7 (5.6 %) 7 (5.6 %) AmpCipGenNalSuTet (5) Other serovars AmpCipNal (1) Other serovars AmpCipGenNalStrSuTet (1) Other serovars
Ireland (N=1) 1 (100 %) 0 (0 %) 0 (0 %) 0 (0 %) NA NA Italy (N=6) 2 (33.3 %) 0 (0 %) 0 (0 %) 0 (0 %) NA NA Total (5 MSs) (N=145) 89 (61.4 %) 11 (7.6 %) 8 (5.5 %) 8 (5.5 %)
MS: Member State; Cip: ciprofloxacin; N: Total number isolates for which relevant data are available; n: number of resistant isolates; NA: not applicable. 1: European Committee on Antimicrobial Susceptibility Testing (EUCAST) epidemiological cut-off values (ECOFFs). 2: EUCAST clinical breakpoint. 3: High breakpoint. 4: Very high breakpoint.

EU summary report on antimicrobial resistance in zoonotic and indicator bacteriafrom humans, animals and food 2012
EFSA Journal 2014;12(3):3590 323
Appendix Table HLCR3. High-level ciprofloxacin resistance in Salmonella serovars from pig meat in MSs reporting isolate-based data, 2012
Country
Isolates resistant at
> 0.06 mg/L1 Cip
Isolates resistant at
> 1 mg/L2 Cip
Isolates resistant at
> 2 mg/L3 Cip
Isolates resistant at
> 4 mg/L4 Cip Resistance patterns of isolates
resistant at > 4 mg/L Cip
Salmonella serovars
n (%) n (%) n (%) n (%) Czech Republic (N=33) 2 (6.1 %) 1 (3.0 %) 1 (3.0 %) 1 (3.0 %) CipNalStrSuTet (1) S. Infantis Denmark (N=41) 0 (0 %) 0 (0 %) 0 (0 %) 0 (0 %) NA NA Estonia (N=22) 0 (0 %) 0 (0 %) 0 (0 %) 0 (0 %) NA NA Germany (N=163) 10 (6.1 %) 0 (0 %) 0 (0 %) 0 (0 %) NA NA Ireland (N=69) 1 (1.4 %) 0 (0 %) 0 (0 %) 0 (0 %) NA NA Italy (N=85) 1 (1.2 %) 0 (0 %) 0 (0 %) 0 (0 %) NA NA Romania (N=125) 13 (10.4 %) 1(0.8 %) 1 (0.8 %) 1 (0.8 %) AmpChlCipSuTetTmp(1) S. Typhimurium Total (7 MSs) (N=538) 27 (5.0 %) 2 (0.4 %) 2 (0.4 %) 2 (0.4 %)
MS: Member State; Cip: ciprofloxacin; N: Total number isolates for which relevant data are available; n: number of resistant isolates; NA: not applicable. 1: European Committee on Antimicrobial Susceptibility Testing (EUCAST) epidemiological cut-off values (ECOFFs). 2: EUCAST clinical breakpoint. 3: High breakpoint. 4: Very high breakpoint.

EU summary report on antimicrobial resistance in zoonotic and indicator bacteriafrom humans, animals and food 2012
EFSA Journal 2014;12(3):3590 324
Appendix Table HLCR4. High-level ciprofloxacin resistance in Salmonella serovars from broilers in MSs reporting isolate-based data, 2012
Country
Isolates resistant at
> 0.06 mg/L1 Cip
Isolates resistant at
> 1 mg/L2 Cip
Isolates resistant at
> 2 mg/L3 Cip
Isolates resistant at
> 4 mg/L4 Cip Resistance patterns of isolates
resistant at > 4 mg/L Cip
Salmonella serovars
n (%) n (%) n (%) n (%) Austria (N=113) 25 (22.1 %) 0 (0 %) 0 (0 %) 0 (0 %) NA NA
Czech Republic (N=351) 73 (20.8 %) 14 (4.0 %) 14 (4.0 %) 5 (1.4 %) AmpCipGenNalStrSuTet (4) S. Kentucky AmpCipGenNalSuTet (1) S. Kentucky
Denmark (N=24) 0 (0 %) 0 (0 %) 0 (0 %) 0 (0 %) NA NA Germany (N=8) 2 (25.0 %) 0 (0 %) 0 (0 %) 0 (0 %) NA NA
Hungary (N=175) 158 (90.3 %) 5 (2.9 %) 4 (2.3 %) 2 (1.1 %) AmpCipGenNalSuTet (1) S. Kentucky AmpCipNalSuTet (1) S. Infantis
Ireland (N=38) 1 (2.6 %) 0 (0 %) 0 (0 %) 0 (0 %) NA NA Italy (N=105) 34 (32.4 %) 1 (1.0 %) 1 (1.0 %) 0 (0 %) NA NA
Spain (N=29) 19 (65.5 %) 6 (20.7 %) 5 (17.2 %) 4 (13.8 %) AmpCipGenNalStrSu (2) S. Kentucky CipGenNalSuTet (1) S. Kentucky AmpCipNal (1) S. Kentucky
Sweden (N=1) 0 (0 %) 0 (0 %) 0 (0 %) 0 (0 %) NA NA Table continued overleaf.

EU summary report on antimicrobial resistance in zoonotic and indicator bacteriafrom humans, animals and food 2012
EFSA Journal 2014;12(3):3590 325
Appendix Table HLCR4 (continued). High-level ciprofloxacin resistance in Salmonella serovars from broilers in MSs reporting isolate-based data, 2012
Country
Isolates resistant at
> 0.06 mg/L1 Cip
Isolates resistant at
> 1 mg/L2 Cip
Isolates resistant at
> 2 mg/L3 Cip
Isolates resistant at
> 4 mg/L4 Cip Resistance patterns of isolates
resistant at > 4 mg/L Cip
Salmonella serovars
n (%) n (%) n (%) n (%)
Romania (N=781) 572 (73.2 %) 138 (17.7%) 106 (13.6 %) 86 (11.0 %)
AmpCipGenNalStrSuTet (39) S. Kentucky AmpCipGenNalSuTet (13) S. Kentucky AmpCtxCipGenNalStrSuTet (4) S. Kentucky AmpCtxChlCipGenNalStrSuTetTmp (2) S. Kentucky AmpCipNal (1) S. Kentucky AmpCipNalSuTet (1) S. Kentucky AmpCipGenNalSu (1) S. Kentucky AmpCipGenNalStrSuTetTmp(1) S. Kentucky AmpChlCipGenNalStrSuTet (1) S. Kentucky AmpCtxCmCipGenNalStrSuTet (1) S. Kentucky AmpCip (1) S. Agona AmpCtxCmCipGenNalStrSuTetTmp (1) S. Agona CipGenNalSuTetTmp (2) S. Infantis AmpCipGenNalSuTet (2) S. Infantis AmpCipGenNalSuTetTmp (2) S. Infantis AmpCipGenNalStrSuTetTmp (2) S. Infantis AmpCipSuTetTmp (1) S. Infantis AmpChlCipNalStrSuTet (1) S. Infantis AmpCtxCmCipGenNalStrSuTetTmp(1) S. Infantis AmpChlCipSu (1) S. Liverpool AmpChlCipSuTmp (1) S. Liverpool AmpCipGenNalSuTet (3) S. Tennessee AmpCipTet (1) S. Tennessee AmpCipGenNalStrSuTetTmp(1) S. Tennessee AmpCipNalSuTet (1) S. Livingstone CipNalSuTet (1) S. Rissen
United Kingdom (N=17) 1 (5.9 %) 0 (0 %) 0 (0 %) 0 (0 %) NA NA Total (11 MSs) (N=1,641) 885 (54.2 %) 164 (10.0 %) 130 (8.0 %) 97(5.9 %)
MS: Member State; Cip: ciprofloxacin; N: Total number isolates for which relevant data are available; n: number of resistant isolates; NA: not applicable. 1: European Committee on Antimicrobial Susceptibility Testing (EUCAST) epidemiological cut-off values (ECOFFs). 2: EUCAST clinical breakpoint. 3: High breakpoint. 4: Very high breakpoint.

EU summary report on antimicrobial resistance in zoonotic and indicator bacteriafrom humans, animals and food 2012
EFSA Journal 2014;12(3):3590 326
Appendix Table HLCR5. High-level ciprofloxacin resistance in Salmonella serovars from laying hens in MSs reporting isolate-based data, 2012
Country
Isolates resistant at
> 0.06 mg/L1 Cip
Isolates resistant at
> 1 mg/L2 Cip
Isolates resistant at
> 2 mg/L3 Cip
Isolates resistant at
> 4 mg/L4 Cip Resistance patterns of isolates
resistant at > 4 mg/L Cip
Salmonella serovars
n (%) n (%) n (%) n (%) Austria (N=63) 7 (11.1 %) 0 (0 %) 0 (0 %) 0 (0 %) NA NA Czech Republic (N=8) 0 (0 %) 0 (0 %) 0 (0 %) 0 (0 %) NA NA Denmark(N=4) 0 (0 %) 0 (0 %) 0 (0 %) 0 (0 %) NA NA Finland (N=5) 0 (0 %) 0 (0 %) 0 (0 %) 0 (0 %) NA NA Germany (N=51) 1 (2 %) 0 (0 %) 0 (0 %) 0 (0 %) NA NA
Hungary (N=86) 22 (25.6 %) 3 (3.5 %) 3 (3.5 %) 3 (3.5 %) AmpCipGenNalStrSuTet (2) S. Kentucky AmpCipNalStrSuTetTmp (1) S. Saintpaul
Italy (N=161) 29 (18.0 %) 0 (0 %) 0 (0 %) 0 (0 %) NA NA
Romania (N=145) 67 (46.2 %) 13 (9.0 %) 10 (6.9%) 9 (6.2 %)
Cip (2) S. Kentucky AmpCipGenNalSuTet (1) S. Kentucky AmpCipGenNalStrSuTet (1) S. Kentucky CipNalTmp (1) S. Thompson AmpCipGenNalStrSuTet (1) S. Hadar AmpCipNalSu (1) S. Albany Cip (1) S. Corvallis AmpCipGenNalSuTet (1) S. Corvallis
Spain (N=150) 21 (14.0 %) 3 (2.0 %) 2 (1.3 %) 2 (1.3 %) CipGenNalStrSuTet (1) S. Kentucky AmpChlCipGenNalStrSuTetTmp (1) S. Kentucky
Sweden (N=2) 0 (0 %) 0 (0 %) 0 (0 %) 0 (0 %) NA NA United Kingdom (N=11) 0 (0 %) 0 (0 %) 0 (0 %) 0 (0 %) NA NA Total (11 MSs) (N=686) 147 (21.4 %) 19 (2.8 %) 15 (2.2 %) 14 (2 %)
MS: Member State; Cip: ciprofloxacin; N: Total number isolates for which relevant data are available; n: number of the resistant isolates; NA: Not applicable. 1: European Committee on Antimicrobial Susceptibility Testing (EUCAST) epidemiological cut-off values (ECOFFs). 2: EUCAST clinical breakpoint. 3: High breakpoint. 4: Very high breakpoint.

EU summary report on antimicrobial resistance in zoonotic and indicator bacteriafrom humans, animals and food 2012
EFSA Journal 2014;12(3):3590 327
Appendix Table HLCR6. High-level ciprofloxacin resistance in Salmonella serovars from turkeys in MSs reporting isolate-based data, 2012
Country
Isolates resistant at
> 0.06 mg/L1 Cip
Isolates resistant at
> 1 mg/L2 Cip
Isolates resistant at
> 2 mg/L3 Cip
Isolates resistant at
> 4 mg/L4 Cip Resistance patterns of isolates
resistant at > 4 mg/L Cip
Salmonella serovars
n (%) n (%) n (%) n (%) Austria (N=38) 30 (78.9 %) 0 (0 %) 0 (0 %) 0 (0 %) NA NA
Belgium (N=2) 1 (50.0 %) 0 (0 %) 0 (0 %) 0 (0 %) NA NA
Czech Republic (N=27) 22 (81.5 %) 9 (33.3 %) 9 (33.3 %) 9 (33.3 %) AmpCipGenNalStrSuTet (6) S. Kentucky AmpCipGenNalSuTet (2) S. Kentucky AmpCipNal (1) S. Kentucky
Finland (N=1) 0 (0 %) 0 (0 %) 0 (0 %) 0 (0 %) NA NA Germany (N=87) 28 (32.2 %) 3 (3.4 %) 1 (1.1 %) 1 (1.1 %) AmpCipGenNalSuTet (1) Other serovars
Hungary (N=174) 159 (91.4 %) 38 (21.8 %) 37 (21.3 %) 35 (20.1 %)
AmpCipGenNalStrSuTet (18) S. Kentucky AmpCipGenNalSuTet (14) S. Kentucky AmpCipNal (1) S. Kentucky AmpCipGenNalSuTet (1) S. Stanley AmpCipGenNalStrSuTet (1) S. Stanley
Ireland (N=14) 0 (0 %) 0 (0 %) 0 (0 %) 0 (0 %) NA NA Italy (N=48) 18 (37.5 %) 0 (0 %) 0 (0 %) 0 (0 %) NA NA Spain (N=169) 152 (89.9 %) 2 (1.2 %) 2 (1.2 %) 2 (1.2 %) AmpCipGenNalStrSuTet (2) S. Kentucky United Kingdom (N=7) 1 (14.3 %) 0 (0 %) 0 (0 %) 0 (0 %) NA NA Total (10 MSs) (N=567) 411 (72.5 %) 52 (9.2 %) 49 (8.6 %) 47 (8.3 %)
MS: Member State; Cip: ciprofloxacin; N: Total number isolates for which relevant data are available; n: number of the resistant isolates; NA: Not applicable. 1: European Committee on Antimicrobial Susceptibility Testing (EUCAST) epidemiological cut-off values (ECOFFs). 2: EUCAST clinical breakpoint. 3: High breakpoint. 4: Very high breakpoint.

EU summary report on antimicrobial resistance in zoonotic and indicator bacteriafrom humans, animals and food 2012
EFSA Journal 2014;12(3):3590 328
Appendix Table HLCR7. High-level ciprofloxacin resistance in Salmonella serovars from fattening pigs in MSs reporting isolate-based data, 2012
Country
Isolates resistant at
> 0.06 mg/L1 Cip
Isolates resistant at
> 1 mg/L2 Cip
Isolates resistant at
> 2 mg/L3 Cip
Isolates resistant at
> 4 mg/L4 Cip Resistance patterns of isolates
resistant at > 4 mg/L Cip
Salmonella serovars
n (%) n (%) n (%) n (%) Denmark (N=374) 0 (0 %) 0 (0 %) 0 (0 %) 0 (0 %) NA NA Estonia (N=14) 0 (0 %) 0 (0 %) 0 (0 %) 0 (0 %) NA NA Finland (N=2) 0 (0 %) 0 (0 %) 0 (0 %) 0 (0 %) NA NA Germany (N=627) 47 (7.5 %) 1 (0.2 %) 0 (0 %) 0 (0 %) NA NA Hungary(N= 38) 9 (23.7 %) 0 (0 %) 0 (0 %) 0 (0 %) NA NA Ireland (N=24) 4 (16.7 %) 0 (0 %) 0 (0 %) 0 (0 %) NA NA Italy (N=25) 3 (12.0 %) 0 (0 %) 0 (0 %) 0 (0 %) NA NA Spain (N=48) 10 (20.8 %) 0 (0 %) 0 (0 %) 0 (0 %) NA NA Sweden (N=3) 0 (0 %) 0 (0 %) 0 (0 %) 0 (0 %) NA NA Total (9 MSs) (N=1,155) 73 (6.3 %) 1 (0.1 %) 0 (0 %) 0 (0 %)
MS: Member State; Cip: ciprofloxacin; N: Total number isolates for which relevant data are available; n: number of the resistant isolates; NA: Not applicable. 1: European Committee on Antimicrobial Susceptibility Testing (EUCAST) epidemiological cut-off values (ECOFFs). 2: EUCAST clinical breakpoint. 3: High breakpoint. 4: Very high breakpoint.

EU summary report on antimicrobial resistance in zoonotic and indicator bacteriafrom humans, animals and food 2012
EFSA Journal 2014;12(3):3590 329
Appendix Table HLCR8. High-level ciprofloxacin resistance in Salmonella serovars from cattle in MSs reporting isolate-based data, 2012
Country
Isolates resistant at
> 0.06 mg/L1 Cip
Isolates resistant at
> 1 mg/L2 Cip Isolates resistant at
> 2 mg/L3 Cip Isolates resistant
at > 4 mg/L4 Cip
Resistance patterns of isolates resistant at
> 4 mg/L Cip Salmonella serovars
n (%) n (%) n (%) n (%) Belgium (N=42) 12 (28.6 %) 0 (0 %) 0 (0 %) 0 (0 %) NA NA Estonia (N=7) 1 (14.3 %) 0 (0 %) 0 (0 %) 0 (0 %) NA NA Finland (N=19) 0 (0 %) 0 (0 %) 0 (0 %) 0 (0 %) NA NA Germany (N=68) 6 (8.8 %) 0 (0 %) 0 (0 %) 0 (0 %) NA NA Ireland (N=36) 2 (5.6 %) 0 (0 %) 0 (0 %) 0 (0 %) NA NA Italy (N=14) 2 (14.3 %) 0 (0 %) 0 (0 %) 0 (0 %) NA NA Spain (N=9) 0 (0 %) 0 (0 %) 0 (0 %) 0 (0 %) NA NA Sweden (N=17) 0 (0 %) 0 (0 %) 0 (0 %) 0 (0 %) NA NA Total (8 MSs) (N=212) 23 (10.8 %) 0 (0 %) 0 (0 %) 0 (0 %)
MS: Member State; Cip: ciprofloxacin; N: Total number isolates for which relevant data are available; n: number of the resistant isolates; NA: Not applicable. 1: European Committee on Antimicrobial Susceptibility Testing (EUCAST) epidemiological cut-off values (ECOFFs). 2: EUCAST clinical breakpoint. 3: High breakpoint. 4: Very high breakpoint.
EU summary report on antimicrobial resistance in zoonotic and indicator bacteriafrom humans, animals and food 2012
EFSA Journal 2014;12(3):3590 330
APPENDIX 6. Level 3 Tables
Level 3 Tables, containing information on reported MIC distributions and data on the number of resistant isolates, are available on the EFSA website.

EU summary report on antimicrobial resistance in zoonotic and indicator bacteriafrom humans, animals and food 2012
EFSA Journal 2014;12(3):3590 331
APPENDIX 7. List of abbreviations, Antimicrobial substances, Member States and other reporting countries, definitions
List of abbreviations
Abbreviation Definition % Percentage of resistant isolates per category of susceptibility or multiple resistance % f Percentage frequency of isolates tested % Res Percentage of resistant isolates - No data reported AHVLA Animal Health and Veterinary Laboratories Agency AMB Antimicrobial substance AMR Antimicrobial resistance AST Antimicrobial susceptibility testing BIOHAZ EFSA Panel on Biological Hazards BSAC British Society for Antimicrobial Chemotherapy CA-SFM French Society for Microbiology CC Clonal complex CLSI Clinical and Laboratory Standards Institute CBP Clinical breakpoints CTX-M Cefotaximase DIN Deutsches Institut für Normung DNA desoxyribonucleic acid DTU Technical University of Denmark EARS-Net European Antimicrobial Resistance Surveillance Network EC European Commission ECDC European Centre for Disease Prevention and Control ECOFF epidemiological cut-off value EEA European Economic Area EFSA European Food Safety Authority EMA European Medicines Agency ESBL Extended Spectrum Beta-Lactamase ETEC Enterotoxigenic E. coli EU European Union EUCAST European Committee on Antimicrobial Susceptibility Testing EU-RL European Union Reference Laboratory FWD Food- and Waterborne Diseases and Zoonoses HACCP Hazard Analysis and Critical Control Point HPA Health Protection Agency (UK) I Intermediate IZD Inhibition Zone Diameter LA-MRSA Livestock- associated methicillin-resistant Staphylococcus aureus MDR Multiple Drug Resistance MIC Minimum Inhibitory Concentration MLST Nulti-locus Sequence Typing MRSA Methicillin-resistant Staphylococcus aureus MSSA Methicillin-susceptible Staphylococcus aureus MS Member State NA Not applicable NCP National Control Programme NRL National Reference Laboratory R Resistant
res1–res9 Resistance to one antimicrobial substance/resistance to nine antimicrobial substances of the common set for Salmonella
S Susceptible SGI Salmonella genomic island spp. species ST Sequence type TESSy The European Surveillance System

EU summary report on antimicrobial resistance in zoonotic and indicator bacteriafrom humans, animals and food 2012
EFSA Journal 2014;12(3):3590 332
VTEC Vero(cyto)toxigenic E. coli WHO World Health Organization
Antimicrobial substances
Abbreviation Antimicrobials Amp Ampicillin Caz Ceftazidime Chl Chloramphenicol Cip Ciprofloxacin Ctx Cefotaxime Ery Erythromycin Gen Gentamicin Nal Nalidixic acid Su Sulfonamides Str Streptomycin Tet Tetracycline Tmp Trimethoprim

EU summary report on antimicrobial resistance in zoonotic and indicator bacteriafrom humans, animals and food 2012
EFSA Journal 2014;12(3):3590 333
Member States of the European Union and other reporting countries in 2012
Member States of the European Union, 2012
Member State Country abbreviations
Austria AT
Belgium BE
Bulgaria BG
Cyprus CY
Czech Republic CZ*
Denmark DK
Estonia EE
Finland FI
France FR
Germany DE
Greece GR
Hungary HU
Ireland IE
Italy IT
Latvia LV
Lithuania LT
Luxembourg LU
Malta MT
Netherlands NL*
Poland PL
Portugal PT
Romania RO
Slovakia SK
Slovenia SI
Spain ES
Sweden SE
United Kingdom UK*
* In text, referred to as the Czech Republic, the Netherlands and the United Kingdom
Non-Member States reporting, 2012
Country Country abbreviations
Iceland IS
Norway NO
Switzerland CH

EU summary report on antimicrobial resistance in zoonotic and indicator bacteriafrom humans, animals and food 2012
EFSA Journal 2014;12(3):3590 334
Definitions
Term Definition and description
‘Antimicrobial resistant isolate’. In the case of quantitative data, an isolate was defined as ‘resistant’ to a selected antimicrobial when its minimum inhibitory concentration (MIC) value (in mg/L) was above the cut-off value or the disc diffusion diameter (in mm) was below the cut-off value. The cut-off values, used to interpret MIC distributions (mg/L) for bacteria from animals and food, are shown in Table MM11. In the case of qualitative data, an isolate was regarded resistant when the country reported it as resistant using its own cut-off value or break point.
‘Level of antimicrobial resistance’: The percentage of resistant isolates among the tested isolates.
‘Reporting MS group’: Member States (MSs) that provided data and were included in the relevant table for antimicrobial resistance data for the bacteria–food/animal category–antimicrobial combination.
Terms used to describe the antimicrobial resistance levels
Rare: < 0.1 % Very low: 0.1 % to 1 % Low: >1 % to 10 % Moderate: >10 % to 20 % High: >20 % to 50 % Very high: >50 % to 70 % Extremely high: >70 %

EU summary report on antimicrobial resistance in zoonotic and indicator bacteriafrom humans, animals and food 2012
EFSA Journal 2014;12(3):3590 335
APPENDIX 8. List of institutions contributing to antimicrobial resistance monitoring in animals and food
List of institutions contributing to antimicrobial resistance monitoring in animals and food
Member State Institution
Austria • Federal Ministry for Health • Austrian Agency for Health and Food Safety (AGES)
Belgium • Veterinary and Agrochemical Research Centre (CODA-CERVA), Uccle • Institute of Public Health, Brussels • Federal Agency for the Safety of the Food Chain, Brussels
Bulgaria • National Diagnostic and Research Veterinary Institute, Sofia • Bulgarian Food Safety Agency, Sofia
Cyprus • Veterinary Services, Nicosia • Ministry of Agriculture, Nicosia
Czech Republic • State Veterinary Institute, Prague and Olomouc • State Veterinary Administration of the Czech Republic, Prague
Denmark • National Food Institute, Technical University of Denmark • Danish Veterinary and Food Administration
Estonia • Estonian Veterinary and Food Laboratory, Tartu • Veterinary and Food Board, Tallinn
Finland • EVIRA, Finnish Food Safety Authority, Helsinki
France
• ANSES, French Agency for Food, Environmental Occupational Health and Safety: Fougères Laboratory, Maisons-Alfort Laboratory, Ploufragan/Plouzané Laboratory
• Ministère de l´agriculture, de l’alimentation, de la pêche, de la ruralité et de l’aménagement du terriroire, Direction Générale de l’Alimentation, Paris
Germany • Federal Institute for Risk Assessment (BfR), Berlin
Greece • Veterinary Laboratory, Chalkis • Ministry of Rural Development and Food, Athens
Hungary • Central Agricultural Office, Veterinary Diagnostical Directorate, Budapest • Ministry of Rural Agriculture, Budapest
Ireland • Central Veterinary Research Laboratory, Celbridge • Food Safety Authority of Ireland, Dublin
Italy • Istituto Zooprofilattico Sperimentale delle Regioni Lazio e Toscana, Rome • Ministry of Health, Rome
Latvia • Institute of Food Safety, Animal Health and Enviroment "BIOR", Animal Disease Diagnostic
Laboratory, Riga • Food and Veterinary Service of Latvia, Riga
Lithuania • National Food and Veterinary Risk Assessment Institute, Vilnius • State Food and Veterinary Service, Vilnius
Luxembourg • Laboratoire de Médecine Vétérinaire, Luxembourg
Malta • Ministry for Resources and Rural Affairs
Table continued overleaf.

EU summary report on antimicrobial resistance in zoonotic and indicator bacteriafrom humans, animals and food 2012
EFSA Journal 2014;12(3):3590 336
List of institutions contributing to antimicrobial resistance monitoring in animals and food (continued)
Member State Institution
Netherlands
• Central Veterinary Institute, part of Wageningen UR (CVI), Lelystad • National Institute of Public Health and the Environment (RIVM), Bilthoven • Ministry of Agriculture, Nature and Food Quality • Animal Health Service, Deventer
Poland • National Veterinary Research Institute, Pulawy • General Veterinary Inspectorate, WARSAW
Portugal • Laboratório Nacional de Investigação Veterinária, Lisbon • Direcção Geral de Veterinária, Lisbon
Romania • Institute for Diagnostic and Animal Heath, Bucharest • Institute for Hygiene and Veterinary Public Heath, Bucharest • National Sanitary Veterinary and Food Safety Authority, Bucharest
Slovakia • State Veterinary and Food Institute, Dolny Kubin and Bratislava • State Veterinary and Food Administration of the Slovak Republic
Slovenia • National Veterinary Institute, Veterinary Faculty, Ljubljana • Ministry for Agriculture and Environment, Veterinary Administration, Ljubljana
Spain
• Laboratorio Central de Sanidad Animal de Santa Fe, Granada • Laboratorio Central de Veterinaria de Algete, Madrid • VISAVET Health Surveillance Center, Complutense University, Madrid • Ministerio de Agricultura, Alimentación y Medio Ambiente • Agencia Española de Seguridad Alimentaria y Nutrición
Sweden • National Veterinary Institute (SVA), Department of Animal Health and Antimicrobial
Strategies, Uppsala • National Food Administration, Uppsala
United Kingdom • Animal Health and Veterinary Laboratories Agency (AHVLA)
Other reporting country Institution
Norway • Norwegian Veterinary Institute
Switzerland • ZOBA–Centre for Zoonoses, Bacterial Animal Diseases and Antimicrobial Resistance–
Institute of Veterinary Bacteriology, Vetsuisse Faculty, University of Bern • Swiss Federal Veterinary Office