Europe's water: An indicator-based assessment
99
Europe's water: An indicator-based assessment Authors: S. Nixon, Z. Trent, C. Marcuello, C. Lallana Contributions from: A. Zenetos, J. Grath, A. Scheidleder, J. Feher, A. Lazar, M. Joanny, G. Ærtebjerg, B. Fribourg-Blanc, J. Bøgestrand, N. Green, K. Nygaard, R. Bradford EEA project managers: Peter Kristensen Anita Künitzer Jock Martin Niels Thyssen Topic report 1/2003
-
Upload
khangminh22 -
Category
Documents
-
view
4 -
download
0
Transcript of Europe's water: An indicator-based assessment

I
Europe's water:An indicator-based assessment
Authors:S. Nixon, Z. Trent, C. Marcuello, C. Lallana
Contributions from: A. Zenetos, J. Grath, A. Scheidleder,J. Feher, A. Lazar, M. Joanny, G. Ærtebjerg, B. Fribourg-Blanc,
J. Bøgestrand, N. Green, K. Nygaard, R. Bradford
EEA project managers:Peter Kristensen
Anita KünitzerJock Martin
Niels Thyssen
Topic report 1/2003
II Europe's water: An indicator-based assessment
Layout: Brandenborg a/s
Legal notice
The contents of this report do not necessarily reflect the official opinion of the European Commission or other European Communities institutions. Neither the European Environment Agency nor any person or company acting on behalf of the Agency is responsible for the use that may be made of the information contained in this report.
A great deal of additional information on the European Union is available on the Internet.It can be accessed through the Europa server (http://europa.eu.int)
©EEA, Copenhagen, 2003
Reproduction is authorised provided the source is acknowledged
ISBN: 92-9167-581-4
European Environment AgencyKongens Nytorv 6DK-1050 Copenhagen KTel. (45) 33 36 71 00Fax (45) 33 36 71 99E-mail: [email protected]: http://www.eea.eu.int

Contents III
Contents
Executive summary . . . . . . . . . . . . . . . . . . . . . . . . . . . . . . . . . . . . . . . . . . . . . . . . V
1. Introduction . . . . . . . . . . . . . . . . . . . . . . . . . . . . . . . . . . . . . . . . . . . . . . . . . . . 9
1.1. Aim and scope . . . . . . . . . . . . . . . . . . . . . . . . . . . . . . . . . . . . . . . . . . . . 9
1.2. Structure of the assessment . . . . . . . . . . . . . . . . . . . . . . . . . . . . . . . . . . 9
1.3. Core set of indicators for water . . . . . . . . . . . . . . . . . . . . . . . . . . . . . . . 10
2. Ecological quality . . . . . . . . . . . . . . . . . . . . . . . . . . . . . . . . . . . . . . . . . . . . . . . 12
2.1. Background to the issue . . . . . . . . . . . . . . . . . . . . . . . . . . . . . . . . . . . . . 12
2.2. Indicators used . . . . . . . . . . . . . . . . . . . . . . . . . . . . . . . . . . . . . . . . . . . . 12
2.3. Assessments by indicator. . . . . . . . . . . . . . . . . . . . . . . . . . . . . . . . . . . . . 13Lengths of river of less than ‘good’ quality in national classifications . . . . . . 15Lakes of less than ‘good’ quality in national classifications . . . . . . . . . . . . . . 16Transitional and coastal waters less than ‘good’ quality in national
classifications . . . . . . . . . . . . . . . . . . . . . . . . . . . . . . . . . . . . . . . . . . . 17Progress in the implementation of the water framework directive . . . . . . . . 18Non-indigenous species in rivers and lakes . . . . . . . . . . . . . . . . . . . . . . . . . . 19Non-indigenous species in transitional and coastal waters . . . . . . . . . . . . . . 20Loss of habitats in transitional and coastal waters . . . . . . . . . . . . . . . . . . . . . 21Environmental impact of fishing . . . . . . . . . . . . . . . . . . . . . . . . . . . . . . . . . . 22
2.4. References . . . . . . . . . . . . . . . . . . . . . . . . . . . . . . . . . . . . . . . . . . . . . . . 23
3. Nutrients and organic pollution of water . . . . . . . . . . . . . . . . . . . . . . . . . . . . . 24
3.1. Background to the issue . . . . . . . . . . . . . . . . . . . . . . . . . . . . . . . . . . . . . 24
3.2. Indicators used . . . . . . . . . . . . . . . . . . . . . . . . . . . . . . . . . . . . . . . . . . . . 24
3.3. Assessments by indicator. . . . . . . . . . . . . . . . . . . . . . . . . . . . . . . . . . . . . 25Nitrate in groundwater . . . . . . . . . . . . . . . . . . . . . . . . . . . . . . . . . . . . . . . . . 30Organic matter in rivers . . . . . . . . . . . . . . . . . . . . . . . . . . . . . . . . . . . . . . . . . 31Nutrients in rivers . . . . . . . . . . . . . . . . . . . . . . . . . . . . . . . . . . . . . . . . . . . . . . 32Phosphorus in lakes . . . . . . . . . . . . . . . . . . . . . . . . . . . . . . . . . . . . . . . . . . . . 33Nutrients in coastal and marine waters . . . . . . . . . . . . . . . . . . . . . . . . . . . . . 35Discharges of organic matter from point sources . . . . . . . . . . . . . . . . . . . . . 37Loads of nutrients discharged to sea . . . . . . . . . . . . . . . . . . . . . . . . . . . . . . . 38Atmospheric deposition of nitrogen to marine and coastal waters . . . . . . . 39Development of urban waste water treatment . . . . . . . . . . . . . . . . . . . . . . . 40Use of fertilisers . . . . . . . . . . . . . . . . . . . . . . . . . . . . . . . . . . . . . . . . . . . . . . . 41Numbers of livestock . . . . . . . . . . . . . . . . . . . . . . . . . . . . . . . . . . . . . . . . . . . 43Nitrogen surplus in agricultural soils . . . . . . . . . . . . . . . . . . . . . . . . . . . . . . . 44Microbiological contamination of drinking water . . . . . . . . . . . . . . . . . . . . . 45Nitrate in drinking water . . . . . . . . . . . . . . . . . . . . . . . . . . . . . . . . . . . . . . . . 46Bathing water quality . . . . . . . . . . . . . . . . . . . . . . . . . . . . . . . . . . . . . . . . . . . 47Water transparency in lakes . . . . . . . . . . . . . . . . . . . . . . . . . . . . . . . . . . . . . . 48Chlorophyll in coastal and marine waters . . . . . . . . . . . . . . . . . . . . . . . . . . . 49Harmful phytoplankton in coastal waters . . . . . . . . . . . . . . . . . . . . . . . . . . . 50Oxygen in bottom layers of marine waters . . . . . . . . . . . . . . . . . . . . . . . . . . 51Implementation of the urban waste water treatment directive . . . . . . . . . . . 52Implementation of the nitrates directive . . . . . . . . . . . . . . . . . . . . . . . . . . . . 53
3.4. References . . . . . . . . . . . . . . . . . . . . . . . . . . . . . . . . . . . . . . . . . . . . . . . 54

IV Europe's water: An indicator-based assessment
4. Hazardous substances . . . . . . . . . . . . . . . . . . . . . . . . . . . . . . . . . . . . . . . . . . . 55
4.1. Background to the issue . . . . . . . . . . . . . . . . . . . . . . . . . . . . . . . . . . . . . 55
4.2. Indicators used . . . . . . . . . . . . . . . . . . . . . . . . . . . . . . . . . . . . . . . . . . . . 55
4.3. Assessments by indicator . . . . . . . . . . . . . . . . . . . . . . . . . . . . . . . . . . . . 56Heavy metals in rivers . . . . . . . . . . . . . . . . . . . . . . . . . . . . . . . . . . . . . . . . . . . 59Hazardous substances in lakes . . . . . . . . . . . . . . . . . . . . . . . . . . . . . . . . . . . . 60Loads of hazardous substances to seas . . . . . . . . . . . . . . . . . . . . . . . . . . . . . 61Sources of metals discharged to the North Sea . . . . . . . . . . . . . . . . . . . . . . 62Sources of organic substances discharged to water . . . . . . . . . . . . . . . . . . . 63Consumption of pesticides . . . . . . . . . . . . . . . . . . . . . . . . . . . . . . . . . . . . . . . 64Accidental oil spills from marine shipping . . . . . . . . . . . . . . . . . . . . . . . . . . . 66Illegal discharges of oil to sea . . . . . . . . . . . . . . . . . . . . . . . . . . . . . . . . . . . . 67Discharge of oil from refineries and offshore installations . . . . . . . . . . . . . . . 68Hazardous substances in drinking water . . . . . . . . . . . . . . . . . . . . . . . . . . . . 69Non-compliance with EU environmental quality standards . . . . . . . . . . . . . . 70Pesticides in surface and groundwater . . . . . . . . . . . . . . . . . . . . . . . . . . . . . 71Hazardous substances in marine organisms . . . . . . . . . . . . . . . . . . . . . . . . . . 72Biological effects of hazardous substances on aquatic organisms . . . . . . . . . 73
4.4 References . . . . . . . . . . . . . . . . . . . . . . . . . . . . . . . . . . . . . . . . . . . . . . . 74
5. Water quantity . . . . . . . . . . . . . . . . . . . . . . . . . . . . . . . . . . . . . . . . . . . . . . . . . 76
5.1. Background to the issue . . . . . . . . . . . . . . . . . . . . . . . . . . . . . . . . . . . . . 76
5.2. Indicators used . . . . . . . . . . . . . . . . . . . . . . . . . . . . . . . . . . . . . . . . . . . . 76
5.3. Assessments by indicator. . . . . . . . . . . . . . . . . . . . . . . . . . . . . . . . . . . . . 76Available water . . . . . . . . . . . . . . . . . . . . . . . . . . . . . . . . . . . . . . . . . . . . . . . . 80Water exploitation index. Total water abstraction . . . . . . . . . . . . . . . . . . . . . 82Water consumption index . . . . . . . . . . . . . . . . . . . . . . . . . . . . . . . . . . . . . . . 83Sectoral use of water . . . . . . . . . . . . . . . . . . . . . . . . . . . . . . . . . . . . . . . . . . . 84Agricultural water use . . . . . . . . . . . . . . . . . . . . . . . . . . . . . . . . . . . . . . . . . . 86Water use by households . . . . . . . . . . . . . . . . . . . . . . . . . . . . . . . . . . . . . . . . 87Overall reservoir stocks . . . . . . . . . . . . . . . . . . . . . . . . . . . . . . . . . . . . . . . . . 89Saltwater intrusion . . . . . . . . . . . . . . . . . . . . . . . . . . . . . . . . . . . . . . . . . . . . . 90Groundwater levels . . . . . . . . . . . . . . . . . . . . . . . . . . . . . . . . . . . . . . . . . . . . 91Water prices . . . . . . . . . . . . . . . . . . . . . . . . . . . . . . . . . . . . . . . . . . . . . . . . . . 92Water use efficiency . . . . . . . . . . . . . . . . . . . . . . . . . . . . . . . . . . . . . . . . . . . . 93Water leakage . . . . . . . . . . . . . . . . . . . . . . . . . . . . . . . . . . . . . . . . . . . . . . . . 94
5.4 References . . . . . . . . . . . . . . . . . . . . . . . . . . . . . . . . . . . . . . . . . . . . . . . 95
☺ Positive development in state or decreased pressure
" No clear development in state or pressure
# Negative development in state or increased pressure
$ Important finding (bad)
% Important finding (good)

Executive summary V
Executive summary
This report assesses the quality and quantity of Europe’s water. Its geographical scope is the European Union, EFTA and EU accession and candidate countries. Four water issues are assessed: ecological quality, eutrophication and organic pollution of water, hazardous substances and water quantity. This is done on the basis of 57 indicators selected for their representativeness and relevance.
Using these indicators, the report seeks to answer a number of questions that have been formulated to assess whether the broad objectives and targets of EU water policy are being achieved and to indicate where policy gaps may be occurring.
These objectives are set out in such documents as the European Commission’s sustainable development strategy, the common fisheries and common agricultural policies, sixth environment action programme and the forthcoming marine thematic strategy. Relevant EU legislation includes the water framework directive and the directives on integrated pollution prevention and control (IPPC), dangerous substances in water, urban waste water treatment, nitrates, bathing water and drinking water.
The water framework directive, which came into force at the end of 2000, will fundamentally change how water is monitored, assessed and managed in many European countries. One of the key concepts it introduces to legislation is ecological status.
At present it is not possible to obtain an overview of the ecological status of Europe’s waters as there are many significant shortfalls and gaps in countries’ information, monitoring and assessment systems.
However, existing river classification schemes based on biological elements indicate that the water quality in some rivers is improving.
In terms of habitats and biodiversity, the introduction of non-native animals and plants to rivers, lakes and marine waters is a threat to natural ecosystems. The rate of introduction is decreasing in Europe’s seas generally, but increasing in the Atlantic Ocean. (For inland waters the available information does not allow an assessment of trends.) In addition, coastal habitats are under intense pressure from high population densities, tourism and agriculture in coastal zones.
Traditionally, water-related legislation has largely focused on controlling emissions from point sources. However, to reach good ecological status of surface waters, this focus will need to be broadened to ensure that all human-related pressures are controlled, including those from diffuse sources, such as agricultural use of fertilisers and pesticides. Changes to the structures of water bodies as well as water abstractions and other physical changes such as damming and channelisation will also have to be addressed and controlled.
Ecological quality — key messages
$ There is a large gap between what is required by the water framework directive in terms of monitoring and classification of ecological status, and what is currently undertaken by countries.
☺ River water quality in Europe is improving in most countries.
$ The impact of agriculture on Europe’s water resources will have to be reduced if good surface water status and good groundwater status are to be achieved. This will require the integration of environmental and agricultural policies at a European level.
$ There is a large nitrogen surplus in the agricultural soils of EU countries that can potentially pollute both surface and groundwaters.

VI Europe's water: An indicator-based assessment
Pollution by oxygen-consuming substances and phosphorus has been markedly reduced due to lower discharges from waste water treatment plants and industry, while nitrate pollution, primarily from agriculture, has remained constant at a high level.
Control of point source emissions has led to noticeable improvements in the quality of many water bodies across Europe. Notable is the reduction of phosphorus and organic matter from sources such as urban waste water treatment works, as well as through the introduction of phosphate-free detergents in some countries. This has led to decreases in the concentrations of these indicators in Europe’s rivers and lakes.
There have also been associated decreases in riverine and direct discharges to Europe’s seas, though these have not generally been reflected in reductions in marine concentrations of nutrients. Better waste water treatment has led, additionally, to an
improvement in Europe’s bathing water quality.
Less success has been achieved in controlling diffuse sources of water pollution. This is shown in the relatively stable concentrations of nitrate in Europe’s rivers and groundwater, reflecting the large nitrogen surplus in agricultural soils and high livestock densities in EU countries. Nitrate can still be a problem for drinking water and its sources.
Pollution by heavy metals and some other heavily regulated chemicals is decreasing. For other substances no assessment can be made due to lack of data.
In some of Europe’s rivers, there has been success in reducing the concentrations of heavy metals listed in the dangerous substances directive. An associated reduction has been shown in the loads of these heavy metals and also of certain organic substances discharged to some of Europe’s seas. There is also evidence that these reductions are leading to decreases in the concentrations of some of these substances in marine biota in parts of Europe’s seas.
The reduction in emissions of hazardous substances has largely been achieved through the application of cleaner processes and
Nutrients and organic pollution — key messages
☺ Waste water treatment in all parts of Europe has improved significantly since the 1980s.
$ However, the percentage of population connected to waste water treatment is relatively low in Belgium, Ireland, southern Europe and in the accession countries.
☺ The quality of Europe’s rivers and lakes has improved markedly during the 1990s as a result of the reduction in loads of organic matter and phosphorus from waste water treatment and industry.
" Nitrate concentrations in rivers have remained relatively stable throughout the 1990s and are highest in those western European countries where agriculture is most intensive.
☺ Loads of both phosphorus and nitrogen from all quantified sources to the North Sea and Baltic Sea have decreased since the 1980s.
" Nutrient concentrations in Europe’s seas have generally remained stable over recent years, though a few stations in the Baltic, Black and North Seas have demonstrated a slight decrease in nitrate and phosphate concentrations.
# A smaller number of stations in the Baltic and North Seas showed an increase in phosphate concentrations.
" There is no evidence of a decrease (or increase) in levels of nitrate in Europe’s groundwater.
$ Nitrate in drinking water is a common problem across Europe, particularly from shallow wells.
☺ The quality of designated bathing waters (coastal and inland) has improved in Europe throughout the 1990s.
$ Despite this improvement, 10 % of Europe’s coastal and 28 % of inland bathing waters do not meet (non-mandatory) guide values.
Hazardous substances — key messages
☺ There have been significant reductions in the discharges/releases to water and of emissions to air of hazardous substances such as heavy metals, dioxins and polyaromatic hydrocarbons from most North Sea countries and to the north-east Atlantic since the mid-1980s.
☺ The loads of many hazardous substances to the Baltic Sea have been reduced by at least 50 % since the late 1980s.
$ There is very limited information on the loads of hazardous substances entering the Mediterranean and Black Seas, and none on how these have changed over recent years.
☺ Pollution of rivers by heavy metals and a few other heavily regulated chemicals is decreasing.
$ For the many other substances that are present in Europe’s water no assessment of change can be made, due to a lack of data.
$ Pesticide and metal contamination of drinking water supplies has been identified as a problem in many European countries.
☺ There is some evidence that the reduction in loads to water of some hazardous substances is leading to decreases in the concentrations of these substances in marine organisms in some of Europe’s seas.
$
Contaminant concentrations above limits for human consumption are still found in mussels and fish, mainly from estuaries of major rivers, near industrial point discharges and in harbours.
Executive summary VII
technology to industry. However, while discharges of oil from refineries and offshore installations have decreased, major accidental oil spills still occur too frequently within Europe’s seas.
Agriculture is a major source of pesticides. These occur in surface, groundwater and drinking water at levels of potential concern. Many other chemicals in the environment are also of potential concern but relatively little information is available about their presence and effects on the water environment. One emerging issue is the presence of endocrine disrupting substances in water, with sexual disruption of aquatic animals being reported by several European countries.
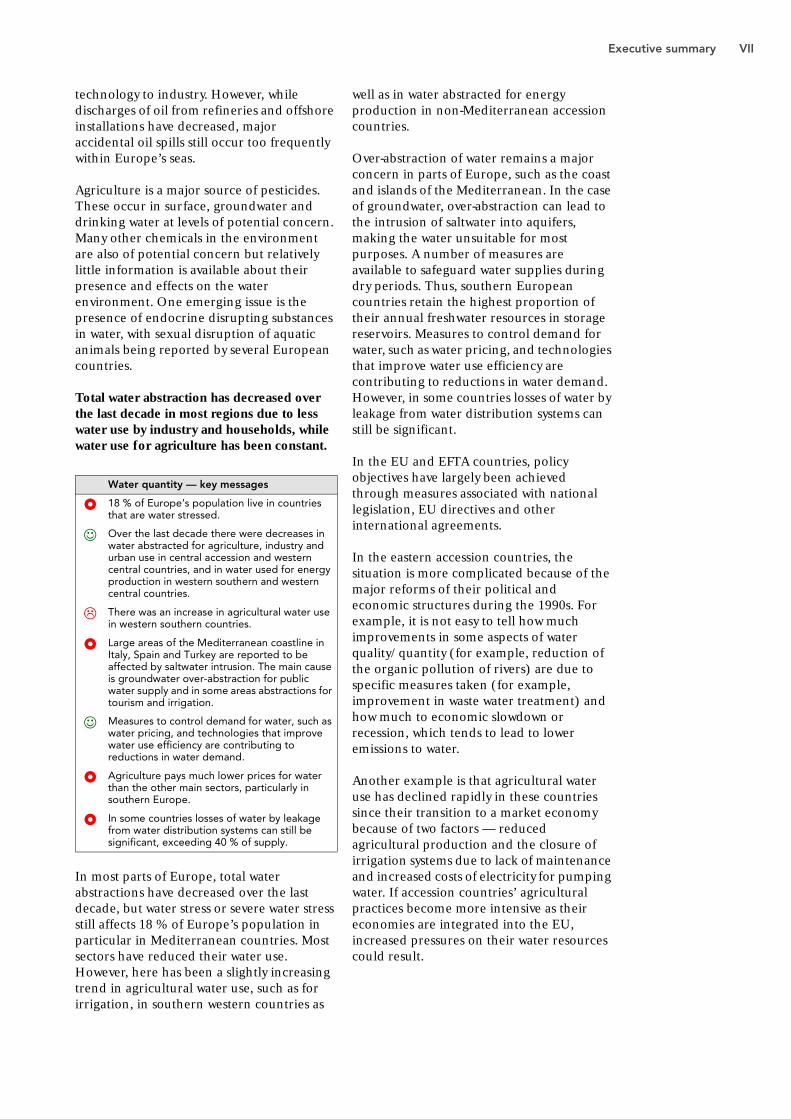
Total water abstraction has decreased over the last decade in most regions due to less water use by industry and households, while water use for agriculture has been constant.
In most parts of Europe, total water abstractions have decreased over the last decade, but water stress or severe water stress still affects 18 % of Europe’s population in particular in Mediterranean countries. Most sectors have reduced their water use. However, here has been a slightly increasing trend in agricultural water use, such as for irrigation, in southern western countries as
well as in water abstracted for energy production in non-Mediterranean accession countries.
Over-abstraction of water remains a major concern in parts of Europe, such as the coast and islands of the Mediterranean. In the case of groundwater, over-abstraction can lead to the intrusion of saltwater into aquifers, making the water unsuitable for most purposes. A number of measures are available to safeguard water supplies during dry periods. Thus, southern European countries retain the highest proportion of their annual freshwater resources in storage reservoirs. Measures to control demand for water, such as water pricing, and technologies that improve water use efficiency are contributing to reductions in water demand. However, in some countries losses of water by leakage from water distribution systems can still be significant.
In the EU and EFTA countries, policy objectives have largely been achieved through measures associated with national legislation, EU directives and other international agreements.
In the eastern accession countries, the situation is more complicated because of the major reforms of their political and economic structures during the 1990s. For example, it is not easy to tell how much improvements in some aspects of water quality/quantity (for example, reduction of the organic pollution of rivers) are due to specific measures taken (for example, improvement in waste water treatment) and how much to economic slowdown or recession, which tends to lead to lower emissions to water.
Another example is that agricultural water use has declined rapidly in these countries since their transition to a market economy because of two factors — reduced agricultural production and the closure of irrigation systems due to lack of maintenance and increased costs of electricity for pumping water. If accession countries’ agricultural practices become more intensive as their economies are integrated into the EU, increased pressures on their water resources could result.
Water quantity — key messages
$ 18 % of Europe’s population live in countries that are water stressed.
☺ Over the last decade there were decreases in water abstracted for agriculture, industry and urban use in central accession and western central countries, and in water used for energy production in western southern and western central countries.
# There was an increase in agricultural water use in western southern countries.
$ Large areas of the Mediterranean coastline in Italy, Spain and Turkey are reported to be affected by saltwater intrusion. The main cause is groundwater over-abstraction for public water supply and in some areas abstractions for tourism and irrigation.
☺ Measures to control demand for water, such as water pricing, and technologies that improve water use efficiency are contributing to reductions in water demand.
$ Agriculture pays much lower prices for water than the other main sectors, particularly in southern Europe.
$ In some countries losses of water by leakage from water distribution systems can still be significant, exceeding 40 % of supply.

VIII Europe's water: An indicator-based assessment
Eurowaternet is bringing tangible improvements in information about Europe’s water.
The EEA is adopting a top-down approach to developing indicators that will answer specific policy questions. This approach is
not yet always feasible as in some cases the appropriate datasets and dataflows are not available or developed at a European level. However, as this report shows, comparable data flows are improving as a result of the implementation of Eurowaternet, the EEA’s information network for water.
Eurowaternet’s continued development alongside the operational implementation by countries of the water framework directive and other major policy drivers will ensure that the quality of these indicators improves over time. The harmonisation and development of common policy relevant data flows and data needs for a number of users and policy makers will be a major contribution towards the goal of streamlining reporting on water.
Information — key messages
☺ Over the past eight years, implementation of Eurowaternet has led to marked improvements in information about Europe’s water.
% Eurowaternet is based on existing country monitoring and will in the future be adapted to meet the reporting needs of the water framework directive.
%
The EEA is developing a core set of water indicators to help streamlining of European water reporting and to make it more policy relevant.

Introduction 9
1. Introduction
1.1. Aim and scope
This report aims to present an assessment of Europe’s water resources based on 57 indicators chosen for their representativeness and relevance. It has been produced by the European Topic Centre on Water on behalf of the European Environment Agency. The assessment covers all water categories — groundwater, rivers, lakes, estuaries and other transitional waters’ (waters near river mouths), coastal and marine waters — in terms of quantity and quality. The report addresses and assesses four water issues using the analytical framework known as DPSIR. This allows a comprehensive assessment of the issues through examination of the relevant Driving forces and Pressures on the environment, the consequent State of the environment and its Impacts, and the Responses undertaken, and of the inter-linkages between each of these elements. The report also attempts to answer identified questions about broad policy objectives pertinent to Europe.
The four issues addressed are:
• ecological quality (Chapter 2);
• nutrients and organic matter pollution of water (Chapter 3);
• hazardous substances (Chapter 4); and
• water quantity (Chapter 5).
Each issue chapter provides a description of the relevant policies and related policy objectives. These lead to specific policy-relevant questions, which are answered using the identified indicators.
Europe in the context of this report includes all EEA countries. Regional or country grouping comparisons are made within the report. The two main country groupings used are:
Other country groupings have also been made to illustrate specific points or differences. In these cases the actual groupings used are given with the relevant indicator.
1.2. Structure of the assessment
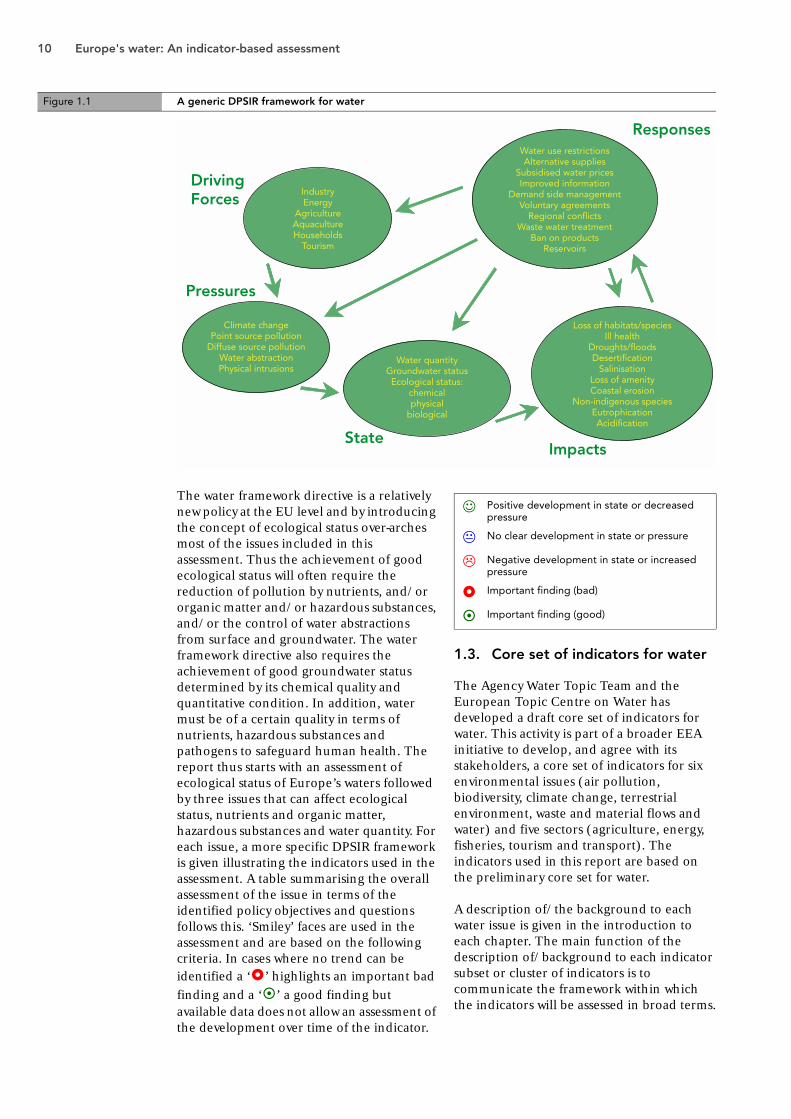
As described in the previous section, the assessment is based on the DPSIR framework. A generic DPSIR framework for water is shown in Figure 1.1.
The aim of managing Europe’s water is to safeguard human health whilst maintaining sustainable aquatic, and associated terrestrial, ecosystems. It is, therefore, important to quantify and identify the current state of, and impacts on, Europe’s water environment, and how these are changing with time. The state of water is determined by natural factors such geology and climate and also by the pressures exerted by human activities. Many of the pressures and the underlying driving forces are common to all or a number of the issues assessed in this report. For example, agriculture is a significant driving force in terms of ecological quality, nutrient and organic pollution, hazardous substances and water quantity.
EU and EFTA countries EU accession and candidate countries
Austria Bulgaria
Belgium Cyprus
Denmark Czech Republic
Finland Estonia
France Hungary
Germany Latvia
Greece Lithuania
Iceland Malta
Ireland Poland
Italy Romania
Liechtenstein Slovak Republic
Luxembourg Slovenia
Netherlands Turkey
Norway
Portugal
Spain
Sweden
Switzerland
UK
10 Europe's water: An indicator-based assessment
The water framework directive is a relatively new policy at the EU level and by introducing the concept of ecological status over-arches most of the issues included in this assessment. Thus the achievement of good ecological status will often require the reduction of pollution by nutrients, and/or organic matter and/or hazardous substances, and/or the control of water abstractions from surface and groundwater. The water framework directive also requires the achievement of good groundwater status determined by its chemical quality and quantitative condition. In addition, water must be of a certain quality in terms of nutrients, hazardous substances and pathogens to safeguard human health. The report thus starts with an assessment of ecological status of Europe’s waters followed by three issues that can affect ecological status, nutrients and organic matter, hazardous substances and water quantity. For each issue, a more specific DPSIR framework is given illustrating the indicators used in the assessment. A table summarising the overall assessment of the issue in terms of the identified policy objectives and questions follows this. ‘Smiley’ faces are used in the assessment and are based on the following criteria. In cases where no trend can be identified a ‘!’ highlights an important bad finding and a ‘"’ a good finding but available data does not allow an assessment of the development over time of the indicator.
1.3. Core set of indicators for water
The Agency Water Topic Team and the European Topic Centre on Water has developed a draft core set of indicators for water. This activity is part of a broader EEA initiative to develop, and agree with its stakeholders, a core set of indicators for six environmental issues (air pollution, biodiversity, climate change, terrestrial environment, waste and material flows and water) and five sectors (agriculture, energy, fisheries, tourism and transport). The indicators used in this report are based on the preliminary core set for water.
A description of/the background to each water issue is given in the introduction to each chapter. The main function of the description of/background to each indicator subset or cluster of indicators is to communicate the framework within which the indicators will be assessed in broad terms.
Figure 1.1 A generic DPSIR framework for water
ImpactsState
DrivingForces
Pressures
Responses
IndustryEnergy
AgricultureAquacultureHouseholds
Tourism
Water use restrictionsAlternative supplies
Subsidised water pricesImproved information
Demand side managementVoluntary agreements
Regional conflictsWaste water treatment
Ban on productsReservoirs
Loss of habitats/speciesIll health
Droughts/floodsDesertification
SalinisationLoss of amenityCoastal erosion
Non-indigenous speciesEutrophicationAcidification
Climate changePoint source pollution
Diffuse source pollutionWater abstractionPhysical intrusions
Water quantityGroundwater statusEcological status:
chemicalphysical
biological
☺ Positive development in state or decreased pressure
% No clear development in state or pressure
& Negative development in state or increased pressure
! Important finding (bad)
" Important finding (good)

Introduction 11
Indicator factsheets are available on the EEA’s web site (http://eea.eionet.eu.int:8980/Members/irc/eionet-circle/water/library?l=/indicator_factsheets&vm=detailed&sb=Title) for indicators that have already been developed; description sheets are being developed for those indicators for which there is a medium to long term timescale (two to five years) for implementation.
The EEA has developed Eurowaternet to produce comparable and timely data and information for water. However, the EEA’s
policy is also to use existing sources of information and data where possible, and to that end data has also been obtained from other organisations and institutions such as Eurostat, the Joint Research Centre, Marine Conventions and the European Commission’s Directorate-General for the Environment. Where there are no comparable datasets at the moment, ‘demonstration indicators’ have been formulated from national or regional examples. It is hoped that these indicators can be produced on a European basis once appropriate data flows have been established.

12 Europe's water: An indicator-based assessment
2. Ecological quality
2.1. Background to the issue
Populations of plants and animals in lakes, rivers and seas react to changes in their environment caused by changes in chemical water quality and physical disturbance of their habitat. Changes in species composition of organism groups like phytoplankton, algae, macrophytes, bottom dwelling animals and fish can be caused by changes in the climate, but also indicate changes in water quality caused by eutrophication and organic pollution, hazardous substances and oil and changes in their habitats caused by physical disturbance through damming, channelisation and dredging of rivers, construction of reservoirs, sand and gravel extraction in coastal waters, bottom trawling by fishing vessels etc. There are also biological pressures on populations, like the introduction of alien species through aquaculture and ballast water from maritime transport, and the stock of rivers and lakes with fish for recreational angling.
It is generally difficult to determine a clear relationship between observed changes in the ecosystem and the various chemical, physical and biological pressures that could have caused the effect. Ecological quality is therefore integrating all pressures and showing the overall status of the ecosystem.
The main policy objectives are:
• to achieve ‘good’ surface water and groundwater status by 2015; preventing further deterioration and protecting and enhancing the status of aquatic ecosystems (1);
• to promote sustainable use of seas and conserve marine ecosystems (2);
• to halt biodiversity decline by 2010 (3);• to protect and restore habitats and natural
systems and halt the loss of biodiversity by 2010 (4).
The water framework directive introduces for all surface waters a general requirement for
ecological protection, and aims at ‘good ecological status’ for all surface water. Good ecological status is defined in terms of the quality of the biological community based on quality elements such as invertebrate and fish fauna and composition and abundance of aquatic flora, the hydrological characteristics and the chemical characteristics; and are specified as allowing only a slight departure from the biological community, which would be expected in conditions of minimal anthropogenic impact.
As part of the implementation of the water framework directive over the coming 10 to 15 years, indicators describing the ecological quality of waters will be developed. However, much information at the member country level already exists on biological quality elements such as benthic invertebrates in rivers and phytoplankton in lakes and coastal waters. This information may be collated and presented as indicators to illustrate aspects of the ecological quality of European surface waters.
2.2. Indicators used
The DPSIR framework for assessing aquatic ecological quality is shown on the next page. The indicators used in this chapter are highlighted in yellow.
Indicators on driving forces and pressures illustrated in Figure 2.1 are presented in the main issues chapters: nutrients and organic pollution of water (Chapter 3), hazardous substances (Chapter 4), and water quantity (Chapter 5). These issues are intimately linked with the achievement of good ecological and good chemical status as defined and required by the water framework directive. For example, water abstractions either from surface or groundwaters, emissions of nutrients and hazardous substances from the different sectors and fishing can impact surface water ecosystems.
(1) Water framework directive, Article 4.(2) Sixth environment action programme: Towards a strategy to protect and conserve the marine environment
(COM(2002) 539).(3) Biodiversity convention.(4) Sustainable development strategy, p.12.

Ecological quality 13
2.3. Assessments by indicator
Existing national classification and assessment schemes for surface waters indicate that river and lake water quality have generally improved over recent years in response to reductions in some pressures upon them, for example, reductions in organic matter and phosphorus emissions (see Chapter 3). Though classification schemes for transitional and coastal waters are less frequently used by countries, the available examples indicate that water quality of most is at least good. Under the water framework directive, national classifications and assessments will be based on ecological and chemical status. Most, if not all, countries will have to adapt existing or develop new classification and assessment schemes to meet this requirement. This process is being helped by the European Commissions/Member States’ common implementation strategy for the water framework directive.
The presence of non-indigenous species in surface waters can impact ecological quality, for example, by predating or competing with native species. There is no information whether the problem is getting better or
worse in inland waters but in most of Europe’s seas (except the Atlantic Ocean) the rate of arrival of non-indigenous species has decreased since the 1970s. Europe’s coastline is extensively occupied and used by humans and the resulting activities put great pressures on natural habitats and ecosystems. Fishing is a significant socioeconomic activity in many parts of Europe. However, there is evidence that fishing is causing changes in marine ecosystem composition and functioning in some of Europe’s seas, indicating that stocks are being exploited at unsustainable rates. In addition, fishing can have significant impacts on marine mammal, turtle and bird populations through being accidentally caught in nets or on fishing lines.
Table 2.1 summarises the assessments as answers to main policy questions. More detailed information and assessments follow in the subsequent pages and indicator factsheets. Some of the indicators demonstrate some of the quality elements of the water framework directive: these indicators will be improved and replaced when the monitoring, assessments and classifications from the water framework directive become available over the coming years.
DPSIR framework for assessing aquatic ecological quality Figure 2.1
DrivingForces
Pressures
Responses
ImpactsState
Included in chapters onnutrients and organic matter,
hazardous substancesand water quantity
Implementation of thewater framework directive
Included in chapters onnutrients and organic matter,
hazardous substancesand water quantity Chemical and biological
quality included inchapters on nutrients and
organic matter andhazardous súbstances
Loss of habitatsNon-indigenous species
Rivers, lakes, transitional andcoastal water
of less than good qualityImpact of fishing

14 Europe's water: An indicator-based assessment
Table 2.1 Assessment of progress in meeting policy objectives in terms of ecological quality
Policy question Indicators Assessment
Is good surface water ecological status being achieved and the deterioration of aquatic ecosystems and habitats prevented?
Lengths of river less than ‘good’ quality in national classifications
☺☺☺☺ River water quality in Europe is improving in most countries
Lakes of less than ‘good’ quality in national classifications
☺☺☺☺ The proportion of lakes classified as less than good in national classifications has decreased since the 1980s
!!!!
There is a significant number of lakes in some of the accession countries that are considered as relatively pristine
Transitional and coastal waters less than ‘good’ quality in national classifications
! The majority of transitional and coastal waters are of good quality in the two countries used to test this demonstration indicator
Progress in the implementation of the water framework directive
! There is a large gap between what is required by the water framework directive in terms of monitoring and classification of ecological status, and what is currently undertaken by countries
Non-indigenous species in rivers and lakes ! The presence of non-indigenous species poses a major threat to river and lake ecosystems
Non-indigenous species in transitional and coastal waters
☺ The rate of arrival of non-indigenous species in most European seas has decreased since the 1970s
&&&& The exception being the Atlantic Ocean where it is still increasing
Loss of habitats in transitional and coastal waters
! There are intense pressures on transitional and coastal habitats in Europe due to high human population densities, tourism and agriculture being a major land use
Environmental impact of fishing & Fishing is causing a change in the ecosystem composition of the north east Atlantic Ocean, and the Mediterranean and Black Seas suggesting that fish stocks are being exploited at unsustainable rates.
! Fishing has a significant impact on cetacean, turtle and bird populations but comparable datasets are not available to properly assess the extent of the problem

Ecological quality 15
Policy question: Is good surface water ecological status being achieved and the deterioration of aquatic ecosystems and habitats prevented?
Lengths of river of less than ‘good’ quality in national classifications
River classification schemes are often designed to give an indication of the extent of pollution. There are many different types of schemes. Some are based solely on chemical and general physico-chemical parameters (for example, pH, dissolved oxygen, ammonium and biochemical oxygen demand), some on biological indices (usually based on macro-invertebrates) and some on a combination. Although all the countries have different schemes they give a general indication of river quality, particularly whether according to a country’s scheme there has been an improvement or not. None of the classification schemes meet the requirements of the water framework directive and hence there is at present no information enabling a direct assessment of the situation in relation to the objectives of the directive. Different types of schemes cannot be quantitatively compared hence Figure 2.2 is divided into three types (biological, physico-chemical, combined). Some countries have more than one national classification scheme and so results for each scheme are shown separately, for example England and Wales has a physico-chemical scheme and a biological scheme. This separation into types of scheme also illustrates that whilst one scheme may show an improvement in quality, another may show deterioration for example, the UK (Northern Ireland) chemical scheme showed an improvement whilst the biological scheme showed a deterioration. This was because the biological scheme reflects a degradation in habitat quality as well as changes in water quality. The majority of river classification schemes show an improvement in quality reflecting the effects of reduced pollution by human activities on the aquatic environment.
Figure 2.3 shows the percentage of rivers classified as less than good. There are large differences with countries such as the Czech Republic, Latvia and Poland having relatively large, and UK relatively small percentages less than good quality. However, there is a wide variation in the length of national rivers included in classification schemes. The average length of river classified was only about 30 % of the total length of river in the country. This means that the real picture can be very different from the one presented here.
Notes: Data shown are for different types of classification scheme (biological, physico-chemical and combined) by country.
Key message:
☺ River quality in Europe is improving in most countries
Change in river category between less than goodand good Figure 2.2
Percentage of rivers classified as less than good Figure 2.3
Source: EEA-ETC/WTR from national reports and questionnaire returns from NRCs.
UK (Northern Ireland)AlbaniaIreland
Bosnia and HerzegovinaLatvia
Czech RepublicUK (Scotland)
SloveniaLuxembourg
PolandFranceLatvia
UK (England and Wales)Poland
Czech Republic
Czech RepublicUK (England and Wales)
RomaniaAustria
GermanyUK (Northern Ireland)
Spain
Biological Physico-chemical Combined
% change per year of reporting period
-6 -4 0-2 2 4 6
� �
0 20 40 60 80 100
UK (Scotland) (2000)
Romania (2000)
Bosnia and Herzegovina (2000)
Finland (1997)
Poland (2000)
Latvia (2000)
UK (England and Wales) (2000)
Albania (2001)
(2000)
(2000)
(1999)
(2000)
(2000)
Czech Republic (1998)
UK (England and Wales) (2000)
(1997)
(2000)
UK (Northern Ireland (2000)
Slovak Republi (2000)
(2000)
UK (Northern Ireland)
Slovak Republic
France
Sweden
Poland
Ireland
Germany
Latvi
Biological Physico-chemical Combined
%
Source: EEA-ETC/WTR.

16 Europe's water: An indicator-based assessment
Policy question: Is good surface water ecological status being achieved and the deterioration of aquatic ecosystems and habitats prevented?
Notes: Ireland, 307 lakes classified according to trophic status (for example, chlorophyll a concentrations). Percentage of surface of lakes worse than eutrophic.Further information on the quality of lakes is given in Chapter 3 of this report.
Lakes of less than ‘good’ quality in national classifications
Some countries have developed national classification schemes for their lakes. These are generally based on nutrients (mainly phosphorus) and on chlorophyll a concentrations. None of the schemes comply with the requirements of the water framework directive. Even though the national classifications are not comparable with other country classifications, useful information is obtained by comparing the proportion of lakes that are considered and reported nationally to be of less than ‘good’ quality.
Figure 2.4 is based on examples of current national lake classification schemes. In Ireland and Switzerland there have been significant improvements in lake quality since the 1980s in terms of lake surface area (Ireland) and numbers of lakes (Switzerland). Norway and Finland have many thousands of lakes with Norway in particular having a very small proportion considered as being of bad or very bad quality.
An ecological assessment of lakes in four of the accession countries (Bulgaria, Slovak Republic, Estonia and Turkey) (Figure 2.5), was recently carried out by the World Wildlife Fund (WWF, 2000). Mountain lakes with minimal human pressures scored ‘high’ ecological status and even some large lake systems like Lake Peipsi in Estonia appear to be in a relatively ‘good’ ecological state. Unfortunately, some of the lakes are under pressure from pollution, overfishing, or water use for irrigation, industry and drinking.
Key messages:
☺ The proportion of lakes classified as less than good in national classifications has decreased since the 1980s
! There is a significant number of lakes in some of the accession countries that are considered as relatively pristine
Figure 2.4 Proportion of lakes of less than good quality as defined by national classifications
Figure 2.5 Ecological quality of lakes in four accession countries
% o
f la
kes/
lake a
rea
Ireland UK (Northern Ireland) FinlandSwitzerland Norway
1987
–90
1991
–94
1995
–97
1998
-200
019
99
1994
–97
70s a
nd 80s
1998
-200
019
95
80
60
40
20
0
Source: Environment in focus 2002 — Keyenvironmental indicators.UK (Northern Ireland): Number of eutrophic lakes based on total phosphorus concentrations in 13 lakes.http://www.afsni.ac.uk/Research/P_sources/sld008.htm.Finland: Based on water quality classification of 2061 lakes >1 km2.http://www.vyh.fi/eng/environ/sustdev/indicat/vesilaat.htm.Switzerland: Based on the total phosphorus concentrations in 13 lakes, less than good equating to concentrations less than 35 µg P/l.http://www.umwelt-schweiz.ch/buwal/de/fachgebiete/fg_gewasser/gewasserrubrik/unterseite5/index.html.Norway: Classification of 1 800 lakes based on concentrations of phosphorus and nitrogen.http://www.environment.no/Topics/Water/eutrophication/eutrophication.stm#A.
0
200
400
600
800
1000
1200
Bulgaria Estonia Slovak Rep. Turkey
Total number of lakes studied
Number of relatively pristine lakes
Num
ber
of
lake
s
Source: Water and Wetland index (WWF, 2000).
Demonstration indicator

Ecological quality 17
Policy question: Is good surface water ecological status being achieved and the deterioration of aquatic ecosystems and habitats prevented?
Transitional and coastal waters less than ‘good’ quality in national classifications
There are far fewer national classification schemes for transitional and coastal waters than there are for rivers. Those that are used are often based on a combination of chemical, biological and aesthetic measures.
The quality of estuaries in England and Wales showed little improvement between 1985 and 1995 (Figure 2.6). However between 1995 and 2000, the proportion of good quality estuaries increased and the proportion of poor and bad decreased reflecting the improvement measures introduced under the urban waste water treatment and bathing waters directives. The quality of estuaries in Scotland remained relatively constant between 1996 and 1999 (Figure 2.7).
Figure 2.8 shows the general classification of Finnish coastal waters based on water quality data from 1994 to 1997. The results indicate that only 12 % of their waters are considered to be of less than good quality. The poorer quality waters are generally because of eutrophication, hazardous substances or hygienic bacteria. Thus, for example, coastal waters close to large municipalities such as Helsinki were often classified as poor or passable.
Demonstration indicator Key message:
% The majority of transitional and coastal waters are of good quality in the two countries used to test this demonstration indicator.
Classification of estuaries in England and Wales Figure 2.6
Classification of estuaries in Scotland Figure 2.7
General classification of Finnish coastal waters basedon water quality data Figure 2.8
Source: Environment Agency of England and Wales.
1985 1990 1995 2000
% o
f es
tuar
y le
ngth
cla
ssif
ied
100
90
80
70
60
50
40
30
20
10
0
Bad Poor Fair Good
Seriously polluted Unsatisfactory Good Excellent
% o
f es
tuar
y le
ngth
cla
ssif
ied
100
80
60
40
20
01996 1997 1998 1999
Source: Scottish Environment Protection Agency.
% o
f co
asta
l wat
er
100
80
60
40
20
0
Poor Satisfactory Good Excellent
1
11
45
43
0.03 % poor
1994–97
Passable
Source: Finnish Environment Institute.

18 Europe's water: An indicator-based assessment
Policy question: Is good surface water ecological status being achieved and the deterioration of aquatic ecosystems and habitats prevented?
Notes: Note that the monitoring of zooplankton is not required by the water framework directive.
Progress in the implementation of the water framework directive
By December 2006, EU Member States are required to implement monitoring programmes to establish a coherent and comprehensive overview of the ecological and chemical status of surface waters within each river basin district. The monitoring results must also permit the classification of water bodies into five ecological status classes and into two chemical status classes. The directive details the biological, physico-chemical and hydromorphological quality elements and the pollutants that must be monitored for, and used in the subsequent
classifications. Traditionally EU Member States have focused on the monitoring of general physico-chemical (for example, dissolved oxygen and pH) quality elements, nutrients (nitrogen and phosphorus) and specific pollutants (for example, mercury and cadmium) rather than on the biological and hydromorphological components of aquatic ecosystems.
Many countries do not monitor or classify all the quality elements required by the water framework directive. Those countries that include some of the biological quality elements in national classifications will also have to modify their schemes to meet the requirements of the directive. Thus the directive will require most Member States to develop and extend their present monitoring and classifications schemes for all surface water categories — rivers, lakes, transitional and coastal waters.
Figure 2.9 summarises the biological quality elements that are currently used in national classification schemes for lakes and rivers, with an assessment (by national experts) as to whether the scheme is compatible with water framework directive requirements. At the moment not all EU Member States (and Norway) have national classification schemes for the biological quality elements for lakes and rivers. In terms of rivers the most commonly used biological quality element is benthic invertebrate fauna and the least commonly used is phytoplankton. For lakes, macrophytes are most frequently used in classification schemes. It is also clear that only a few of the present classification schemes for rivers and lakes are compatible with the requirements of the directive.
In terms of transitional and coastal water again not all countries monitor for the required biological quality elements and fewer use the results in national classification schemes (Figure 2.10). The most common biological elements monitored and classified are phytoplankton and phytobenthos/macrophytes, and the least common are fish and zooplankton.
Key messages:
! The presence of non-indigenous species poses a major threat to river and lake ecosystems
Figure 2.9Biological quality elements in river and lake classification systems in the EU (and Norway) and compatibility with water framework directive
Figure 2.10Biological quality elements monitored and categorised in national classifications in transitional and coastal waters in the EU (and Norway)
Lakes
Phytoplankton
PhytobenthosMacrophytes
FishBenthic invertebrate fauna
Rivers
PhytoplanktonBenthic invertebrate fauna
FishPhytoplankton
Macrophytes
% countries
0 20 40 60 80 100
Compatible Total
Source: EEA, compiled by ETC/WTR from contributions to the Common Implementation Strategy Working Group 2.3 (REFCOND). Information from 16 countries.
Macroinvertebrates
Phytobenthos/macrophytes
Phytoplankton
Fish
Phytoplankton
% countries0 20 40 60 80 100
Categorised Monitored
Source: EEA-ETC/WTR from contributions to the Common Implementation Strategy Working Groups 2.4 (COAST) and 2.7 Monitoring. Information from 14 countries with a coastline.

Ecological quality 19
Policy question: Is good surface water ecological status being achieved and the deterioration of aquatic ecosystems and habitats prevented?
Non-indigenous species in rivers and lakes
A non-indigenous species (also known as alien, exotic, invasive, non-native) is an organism in an ecosystem other than the one in which it evolved. Because it did not evolve there, it may cause havoc in its new environment, for example, by predating on and competing with native species, and disrupting food webs and introducing diseases. Non-indigenous species enter new ecosystems by being either intentionally or accidentally transported and released by man or by extending their geographical range following natural or man-made changes in the environment — for example, the construction of the Suez Canal.
The majority of non-indigenous species in inland waters have been introduced accidentally, are for aquaculture or for angling (Figure 2.11). For many species the ecological effects are unknown but of those having a known impact on the ecosystem, the effects have mainly been adverse. France (42) and Italy (36) have the most recorded introduced freshwater species.
These human-mediated invasions, often referred to as ‘ecological roulette’ or ‘biological pollution’, represent a growing problem due to the unexpected and harmful impacts they cause to the environment, economy and human health. The introduction of non-indigenous species is ranked as the second most important threat to biodiversity by the World Conservation Union (the first being habitat destruction).
Preventing future accidental introductions is the most difficult to tackle since it involves placing restrictions on the transfer of goods and people but introductions for aquaculture and angling could be more strictly controlled.
There are numerous examples of the ecological devastation that the introduction of non-indigenous species can cause. For example, Chinese mitten crabs (Eriocheir sinensis), originally from east Asia, now have a European distribution from Finland to southern France (Clark et al., 1998). It is predominantly a freshwater species but migrates to the sea to breed. It is believed to have arrived in the Thames in the ballast
Notes: Countries included: Austria, Belgium, Croatia, Czech Republic, Denmark, Estonia, Finland, France, Germany, Hungary, Iceland, Ireland, Italy, Latvia, Lithuania, Malta, Netherlands, Norway, Poland, Portugal, Romania, Slovak Republic, Spain, Sweden, Switzerland, UK.
water of ships. They cause riverbank erosion and destabilise unprotected engineering earthworks since they can burrow deeply into them. They can also cross dry land to invade other river systems where they cause damage to the freshwater community. In the UK, for example, they prey on the native crayfish, Austropotambius pallipes, which is already under threat from other non-native crayfish.
Key messages:
! The presence of non-indigenous species poses a major threat to river and lake ecosystems
Introduced freshwater species with an ecologicaleffect Figure 2.11
Accidental
Aquaculture
Angling/sport
Unknown
Diffused from other countries
Fisheries
Ornamental
Phyto-zooplankton control
Bait
Weed control
Fill ecological niche
Other reasons
Other pest control
Beneficial
Number of species
Rea
son
for
intr
od
ucti
on
0 5 10 15 20 25
Undecided Adverse
Source: EEA-ETC/NPB.

20 Europe's water: An indicator-based assessment
Policy question: Is good surface water ecological status being achieved and the deterioration of aquatic ecosystems and habitats prevented?
Non-indigenous species in transitional and coastal waters
About 660 non-indigenous marine species have arrived in European coastal waters through shipping, aquaculture and other man-made activities. The Mediterranean Basin has received about 500 such species, mostly via the Suez Canal (opened in 1869), while less than a hundred are known to have arrived in the Atlantic, North Sea and Baltic Sea coasts.
The rate of arrival has shown some signs of decreasing over the last two decades in the Mediterranean, Baltic, Black and North Seas. The arrival in the Atlantic Ocean of non-indigenous macroalgae and macrobenthic organisms appears to have accompanied stocks imported for aquaculture (Figure 2.12).
The primary mode of arrival in European seas is shipping (154 species) with aquaculture coming next (124 species). The mode of arrival varies among the regional seas (Map 2.1). Shipping and aquaculture contribute equally to the number of non-indigenous species in the Black Sea and the Baltic, whereas shipping is the major vector of arrival in the North Sea and aquaculture in the Atlantic Ocean respectively. Non-indigenous unicellular algae and zooplanktonic organisms, mainly arriving with ballast waters have reduced since 1980 in the Atlantic Ocean, North and Mediterranean Seas, presumably due to some preventative measures, whereas they have slightly increased in the Baltic and Black Seas. In the eastern Mediterranean most invertebrate and fish non-indigenous species originate from the Indo-Pacific Oceans and the Red Sea. Though the total rate of arrivals in the Mediterranean shows some sign of reduction those via the Suez Canal are still increasing (Golani et al., 2002; Galil et al., 2002; Zenetos et al., 2002).
Key messages:
☺ The rate of arrival of non-indigenous species in most European seas has decreased since the 1970s
& The exception being the Atlantic Ocean where it is still increasing
Figure 2.12 Arrival of non-indigenous marine species into European seas
North Sea Baltic Sea Black SeaMediterranean Sea Atlantic Sea
< 190
0
1900
–192
0
1920
–194
0
1940
–196
0
1960
–198
0
1980
–200
0
180
160
140
120
100
80
60
40
20
0
Num
ber
of
spec
ies
Source: NCMR and EEA-ETC/WTR.
Map 2.1 Mode of introduction of non-indigenous species into regional seas
Source: EEA-ETC/WTR.
Ecological quality 21
Policy question: Is good surface water ecological status being achieved and the deterioration of aquatic ecosystems and habitats prevented?
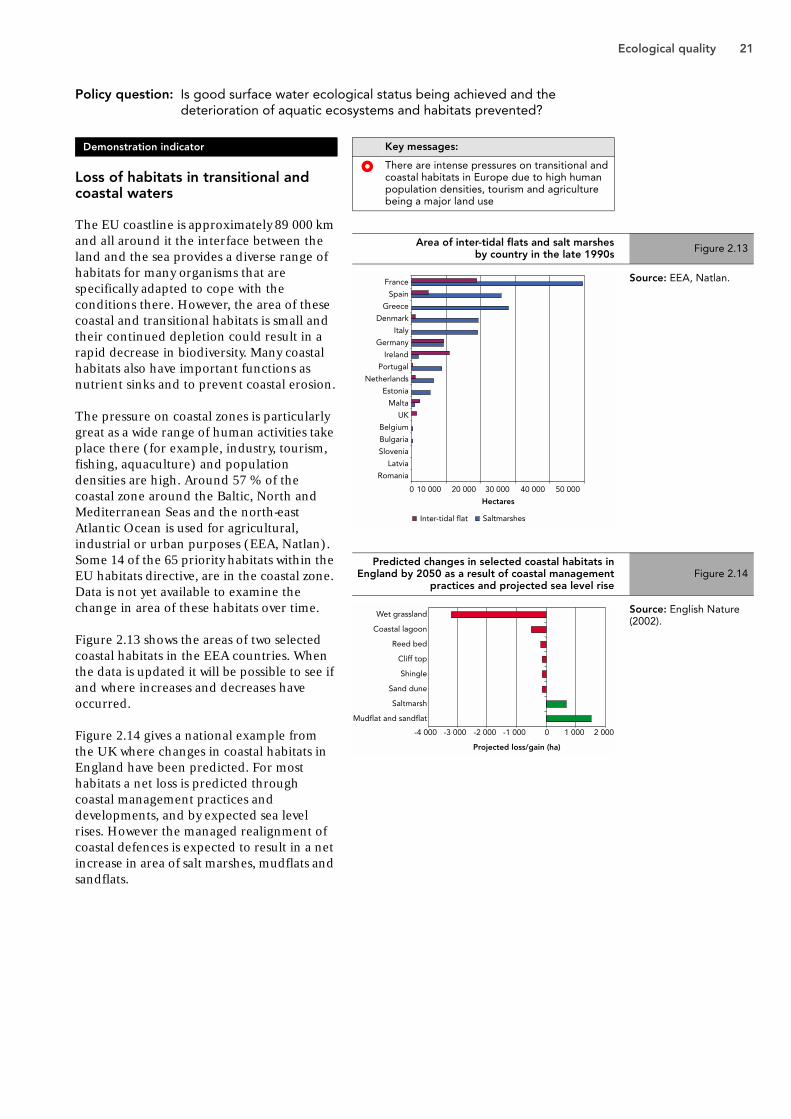
Loss of habitats in transitional and coastal waters
The EU coastline is approximately 89 000 km and all around it the interface between the land and the sea provides a diverse range of habitats for many organisms that are specifically adapted to cope with the conditions there. However, the area of these coastal and transitional habitats is small and their continued depletion could result in a rapid decrease in biodiversity. Many coastal habitats also have important functions as nutrient sinks and to prevent coastal erosion.
The pressure on coastal zones is particularly great as a wide range of human activities take place there (for example, industry, tourism, fishing, aquaculture) and population densities are high. Around 57 % of the coastal zone around the Baltic, North and Mediterranean Seas and the north-east Atlantic Ocean is used for agricultural, industrial or urban purposes (EEA, Natlan). Some 14 of the 65 priority habitats within the EU habitats directive, are in the coastal zone. Data is not yet available to examine the change in area of these habitats over time.
Figure 2.13 shows the areas of two selected coastal habitats in the EEA countries. When the data is updated it will be possible to see if and where increases and decreases have occurred.
Figure 2.14 gives a national example from the UK where changes in coastal habitats in England have been predicted. For most habitats a net loss is predicted through coastal management practices and developments, and by expected sea level rises. However the managed realignment of coastal defences is expected to result in a net increase in area of salt marshes, mudflats and sandflats.
Demonstration indicator Key messages:
! There are intense pressures on transitional and coastal habitats in Europe due to high human population densities, tourism and agriculture being a major land use
Area of inter-tidal flats and salt marshesby country in the late 1990s Figure 2.13
Predicted changes in selected coastal habitats inEngland by 2050 as a result of coastal management
practices and projected sea level riseFigure 2.14
France
Spain
Greece
Denmark
Italy
Germany
Ireland
Portugal
Netherlands
Estonia
Malta
UK
Belgium
Bulgaria
Slovenia
Latvia
Romania
Inter-tidal flat
0 10 000 20 000 30 000 40 000 50 000
Hectares
Saltmarshes
Source: EEA, Natlan.
Wet grassland
Coastal lagoon
Reed bed
Cliff top
Shingle
Sand dune
Saltmarsh
Mudflat and sandflat
-4 000 -3 000 -2 000 -1 000 0 1 000 2 000
Projected loss/gain (ha)
Source: English Nature (2002).

22 Europe's water: An indicator-based assessment
Policy question: Is good surface water ecological status being achieved and the deterioration of aquatic ecosystems and habitats prevented?
Environmental impact of fishing
Fishing gear is designed to maximise yields of target species and minimise cost of effort but they also trap non-target species and damage the marine environment and habitats. Non-target organisms affected include benthos, birds, marine mammals, marine reptiles (turtles), plants and non-target fish. The effects on non-target species can either be direct (for example, accidental entrapment)
or indirect (for example, through the alteration of energy transfers through trophic levels (5) thus reducing abundance and/or modifying relative size composition).
Capture fisheries tend to target the more valuable larger fish that are at higher trophic levels such as species that eat other fish. However, as overfishing reduces the populations of these fish, the landings of fish lower down the food web such as those species that eat zooplankton make up a larger proportion of the overall catch. This means a change in the ecosystem composition from fish eating species to plankton eating species. This is generally indicative of a negative impact on the whole ecosystem caused by fishing and has been called ‘fishing down marine food webs’. For example, Figure 2.15 shows that the mean trophic levels in both the north-east Atlantic and Mediterranean and Black Sea fishing areas have declined since 1950. It seems that fundamental changes in the structure of these marine ecosystems have occurred and it is likely that this is due to fishing. Fishing at lower trophic levels may suggest exploitation at unsustainable rates. It is also reported from the Baltic Sea that commercial fisheries are responsible for altered food web dynamics (Helcom, 2002).
There is particular concern about the impact of fishing on marine mammals, turtles and birds. Cetaceans (whales, dolphins and porpoises) are accidentally caught in drift nets and are in competition with fishermen for small pelagic resources. Drift nets and pelagic long lines are the major threats to birds and marine turtles. Even though there are no comparable datasets to properly assess the extent of the problem across Europe, there has been some efforts nationally or regionally to monitor the bycatch of mammals, birds and turtles. For example, Figure 2.16 shows that between about 20 and 55 % of all cetacean strandings (on which post mortems were undertaken) in England and Wales can be attributed to bycatch.
Key messages:
& Fishing is causing a change in the ecosystem composition of the north-east Atlantic Ocean, and the Mediterranean and Black Seas suggesting that fish stocks are being exploited at unsustainable rates
! Fishing has a significant impact on cetacean, turtle and bird populations but comparable datasets are not available to properly assess the extent of the problem
Figure 2.15Mean trophic level of fisheries landings for the north-east Atlantic, Mediterranean and Black Seas, 1950–98
Figure 2.16Cetacean strandings in England and Wales from bycatch as a percentage of strandings on which post mortems were carried out
1950
1954
1958
1962
1966
1970
1974
1978
1982
1986
1990
1994
1998
North-east Atlantic
3.70
3.60
3.50
3.40
3.30
3.20
3.10
Mean
tro
pic
leve
l
3.00
Mediterranean and Black Sea
Source: Adapted from Pauly et al., (1998) using Fishbase (Pauly and Christensen, 1997).
0
10
20
30
40
50
60
1991 1992 1993 1994 1995 1996 1997 1998 1999
% s
tran
din
gs
due
to
byc
atcy
Source: Source: DEFRA (2000).
(5) The level in the food web at which a group of organisms occurs. One way to detect ecosystem changes is to study the ratio of landings of predatory fish (piscivores) to landings of fish that feed on plankton (planktivores). As predatory fish are removed from the population, the proportion of plankton feeders in catches may grow.
Ecological quality 23
2.4. References
Clark, P. F., Rainbow P. S., Robbins, R. S., Smith, B., Yeomans, W. E., Thomas, M., Dobson, G. (1998). ‘The alien Chinese mitten crab, Eriocheir sinensis (Crustacea: Decapoda: Brachyura), in the Thames catchment’, J. Mar. Biol. Ass. UK, 78, pp. 1215–1221.
DEFRA (2000). ‘Cetacean strandings investigation: England and Wales and Posidon database’. Final report to DEFRA from Institute of Zoology, Zoological Society of London, Regents Park, London, UK.
EEA Natlan. http://dataservice.eea.eu.int/dataservice/available.asp?type=search&search=NATLAN&i=1.
English Nature (2002). ‘State of nature maritime — getting onto an even keel’.http://www.english-nature.org.uk/pubs/publication/PDF/SONmar.pdf.
Galil, B., Froglia, C. and Noel, P. CIESM (2002). Atlas of exotic species in the Mediterranean: Crustaceans. F. Briand (Ed). CIESM Publishers, Monaco, http://www.ciesm.org/publications/crustacean.html.
Golani, D., Orsi-Relini, L., Massuti, E. and Quingnard, J. P. (2002). CIESM Atlas of exotic species in the Mediterranean: Fishes. F. Briand (Ed) CIESM Publishers, Monaco 254 pp.
Helcom(2002). ‘Helcom’s 4th periodic assessment of the state of the marine environment of the Baltic Sea, 1994–98’. Helsinki Commission. Helsinki.
Pauly, D. and Christensen, V. (1997). ‘Trophic levels of fishes’. Box 16, p. 127 In R. Froese and D. Pauly (eds) FishBase 97: concepts, design and data sources. ICLARM, Manila.
Pauly, D., Christensen, V., Dalsgaard, J., Froese, R. and Torres Jr, F. (1998). ‘Fishing down marine food webs’. Science 279: pp. 860–863.
WWF (2000). ‘Water and wetland index — Results for five accession countries’ (5/12/2000) http://www.panda.org/news_facts/publications/europe/index.cfm?uPage=16.
Zenetos, A., Gofas, S., Russo, G. and Templado, J., (2002). CIESM Atlas of exotic species in the Mediterranean: Molluscs http://www.ciesm.org/atlas/molluscsintro.html.

24 Europe's water: An indicator-based assessment
3. Nutrients and organic pollution of water
3.1. Background to the issue
The overloading of seas, coastal waters, lakes and rivers with nutrients (nitrogen and phosphorus) can result in a series of adverse effects known as eutrophication. In severe cases of eutrophication, massive blooms of planktonic algae occur. Some blooms are toxic. As dead algae decompose, the oxygen in the water is used up; bottom-dwelling animals die and fish either die or leave the affected area. Increased nutrient concentrations can also lead to changes in the aquatic vegetation. The unbalanced ecosystem and changed chemical composition make the water body unsuitable for recreational and other uses such as fish farming, and the water becomes unacceptable for human consumption. The main source of nitrogen pollution is run-off from agricultural land, whereas most phosphorus pollution comes from households and industry.
The effects on the aquatic environment of organic pollution, caused by discharges from waste water treatment plants, sewage sludge disposal to coastal waters (in the Mediterranean Sea) industrial effluents and agricultural run-off, include reduced river water chemical and biological quality, as well as impaired biodiversity of aquatic communities and microbiological water quality. Increased industrial and agricultural production, coupled with more of the population being connected to sewerage systems, has initially resulted in increases in discharges of organic waste and nutrients into surface water in most European countries since the 1940s. Over the past 15 to 30 years, however, biological treatment of waste water has increased, and organic discharges have consequently decreased across most of Europe.
The main policy objectives, all taken from EU legislation and documents, are:
• to prevent further deterioration and to protect and enhance the status of aquatic ecosystems and to ensure the progressive reduction of pollution of groundwater and prevent its further pollution (6);
• to achieve levels of water quality that do not give rise to unacceptable risks to human health (and the environment) (7). Drinking water must be free of any microorganism, parasite or substance that could potentially endanger human health and nitrate levels must be less than the standards (guide level 25 mg NO3/l, maximum allowable concentration 50 mg NO3/l). In addition bathing water must achieve levels of microbiological contamination that do not give rise to significant impacts on or risks to human health (8);
• a progressive reduction of anthropogenic inputs of organic matter and nutrients into the water environment where these inputs are likely to cause eutrophication and depleted oxygen problems (9).
Proper and full implementation of the Urban Waste Water Treatment Directive (92/271/EEC) and of the Nitrates Directive (91/676/EEC) will be an important positive factor in reducing eutrophication (10). Member States shall implement the necessary measures to prevent deterioration of the status of all bodies of surface water and implement the measures necessary to prevent or limit the input of pollutants into groundwater (11).
3.2. Indicators used
The DPSIR framework for assessing eutrophication and pollution from organic matter is shown in Figure 3.1. The text in yellow are those indicators used in this chapter.
(6) Water framework directive, Article 4.(7) Sixth environmental action programme 5.2. Overall environment–health objective and Drinking Water
Directive (80/778/EEC and its revision 98/83/EC).(8) Bathing Water Directive (76/160/EEC).(9) Partly based on coming Marine Strategy (COM(2002) 539 final). (10) Sixth environmental action programme 4. Nature and biodiversity — Protection of a unique resource —
Marine environment (pp. 35–36) and 5.6 Ensuring the sustainable use and high quality of our water resources (pp. 45–46).
(11) Water framework directive, Article 4.
Nutrients and organic pollution of water 25
There are a number of policies relevant to these indicators.
• The Water Framework Directive (2000/60/EC) requires the achievement of good ecological status and good ecological potential of water bodies across the EU by 2015.
• The Bathing Water Directive (76/160/EEC) aims to protect the environment and public health by reducing the pollution of bathing waters.
• The Nitrates Directive (91/676/EEC) aims to reduce water pollution caused by nitrates by reducing the nitrogen input to agricultural land.
• The Urban Waste Water Treatment Directive (91/271/EEC) establishes levels of treatment according to the size of population served by the treatment works and the sensitivity of the waters receiving the treated effluent. This directive will lead to a reduction in nutrient and organic matter discharges from point sources.
• The Integrated Pollution Prevention and Control Directive (96/61/EC) aims to control and prevent pollution to water by reducing or eliminating emissions from industry.
• The Drinking Water Directive (98/83/EC) aims to ensure that water intended for human consumption is safe. Water intended for human consumption must be free of any micro-organisms, parasite or substance that could potentially endanger human health.
3.3. Assessments by indicator
A number of measures arising from EU and national legislation have been aimed at the reduction of pressures from socioeconomic sectors, in particular households, industry and agriculture. For example, the extent and type of treatment of waste water has improved and changed, resulting in significant reductions in emissions and discharges of organic matter and phosphorus, and to a lesser extent nitrogen, to Europe’s surface waters. In terms of agriculture, whilst there has been a reduction in usage of phosphorus fertilisers, nitrogen fertiliser usage has shown some signs of increasing in more recent years. There is, therefore, still a large nitrogen surplus in agricultural soils of EU countries that can pollute both surface and groundwaters.
There are distinct differences in the intensity of pressures on water in different parts of Europe. For example, levels of waste water treatment are lower in accession countries than in the EU, fertiliser usage is lower and pig and cattle numbers have dramatically
DPSIR framework for assessing eutrophication and pollution from organic matter Figure 3.1
Pressures
Responses
ImpactsState
IndustryAgriculture — livestock
density and fertiliser useHouseholds —
waste water treatment
Nitrate vulnerable zones and actionprogrammes under Nitrate Directive
Implementation of Urban Waste WaterTreatment Directive
Discharges from point sourceAtmospheric depositionLoads to coastal waters
Nitrogen balanceNitrogen and
phosphorus in rivers,lakes and marine watersNitrate in groundwaterOrganic matter in riversChlorophyll in lakes and
marine waters
Exceedance of standards fordrinking water and bathing waters
Secchi depth in lakesLow oxygen in bottom layers
of marine watersHarmful phytoplankton
in coastal waters
DrivingForces

26 Europe's water: An indicator-based assessment
decreased in the 1990s to numbers much lower than in other parts of Europe. These differences in pressures are because of differences in socioeconomic structures and developments, and result in distinct differences in water quality. For example, total ammonium and organic matter concentrations are less in rivers in EU countries compared to some accession countries where waste water treatment is less effective. Conversely, concentrations of nitrate are significantly higher in rivers in western countries where agriculture is more intensive than in accession countries. Northern Europe has the best-quality river water in terms of nutrients, reflecting the generally high levels of waste water treatment, low population density and low agricultural land use.
The reduction in pressures described above has resulted in improvement in the state of many water bodies in Europe. For example, there has been a decrease in phosphorus concentrations in rivers and lakes in Europe, and the water quality of rivers in terms of organic pollution has also improved. The reduction in phosphorus loads to lakes and consequent water concentration has led to improvements in lake quality, such as increases in water transparency. However, nitrate concentrations remained relatively high and stable in many European rivers during the 1990s, though there is some indication that concentrations have decreased in the Rhine. A similar picture is evident for Europe’s groundwater where nitrate concentrations have been relatively steady above background concentrations during the 1990s. It is perhaps not surprising that, as a result, nitrate is reported as a common problem in drinking water, particularly in supplies taken from contaminated shallow groundwater.
In Europe’s seas, nutrient concentrations have generally remained steady over recent years though there is evidence that concentrations have decreased at a few stations and at the mouth of the River Rhine (the latter reflecting changes in riverine
loads and concentrations). A few stations have also shown some increases in nutrient concentrations. Overall trends in the concentrations of chlorophyll in coastal and marine waters are also not clear. A possible consequence of increasing loads and concentrations of nutrients to Europe’s seas is a modification of the ratios of nitrogen, phosphorus and silicon which could lead to changes in phytoplankton species composition in favour of toxic species. However, there is no clear trend in shellfish poisoning events in European coastal waters. Another potential impact is an increase in phytoplankton biomass which on death ends up in sediments. This biomass or organic matter exerts an oxygen demand which, in poorly mixed waters, can lead to oxygen depletion in the overlying waters, and ultimately to the death of bottom-dwelling organisms. Even though low oxygen concentrations are a problem in specific estuaries and areas (for example, Danish coastal waters), there is no observable trend in the frequency of low oxygen concentrations in Europe’s seas.
The relevant EU directives that stipulate measures to reduce organic matter and nutrient/nitrate pollution (and associated microbial pollution) include the urban waste water treatment (UWWT), nitrates and bathing waters directives. However, the implementation of directives by EU Member States has been mixed. For example, the implementation of the nitrates directive has generally been extremely poor and many large European cities do not meet the treatment standards required by the UWWT directive. However, there have been significant improvements in bathing water quality during the 1990s, though 10 % of Europe’s coastal and 28 % of inland bathing waters do not meet (non-mandatory) guide levels given in the bathing water directive. Table 3.1 summarises the assessments as answers to main policy questions. More detailed information and assessments follow in the subsequent pages and indicator fact sheets.

Nutrients and organic pollution of water 27
Assessment of progress in meeting policy objectives for eutrophication and organic pollution Table 3.1
Policy question Indicators Assessment
Is pollution with nutrients and organic matter decreasing?
• Are nitrate concentrations in groundwater falling?
Nitrate in groundwater % There is no evidence of a decrease (or increase) in concentrations of nitrate in Europe’s groundwaters
!
Nitrate drinking water limit values are exceeded in around one third of the groundwater bodies for which information is currently available
• Are indicators of pollution with organic substances such as oxygen concentration, BOD and ammonium showing a positive trend?
Organic matter in rivers ☺ The organic pollution of rivers has decreased markedly in the 1990s
• Are nutrient concentrations in surface waters decreasing?
Nutrients in rivers ☺ Concentrations of phosphate have decreased in the rivers of the EU and accession countries during the 1990s, reflecting the general improvement in waste water treatment over this period
%%%% Nitrate concentrations in rivers have remained relatively stable throughout the 1990s and are highest in those western European countries where agriculture is most intensive
Phosphorus in lakes ☺ Eutrophication of European lakes is decreasing
! However, there are still many lakes and reservoirs with high concentrations of phosphorus due to human activities
! Phosphorus concentrations are highest in lakes in the accession countries and lowest in the northern countries
Nutrients in coastal and marine waters
%%%% Nutrient concentrations in Europe’s seas have generally remained stable over recent years, though a few stations in the Baltic, Black and North Seas have demonstrated a slight decrease in nitrate and phosphate concentrations
& A smaller number of stations in the Baltic and North Seas also showed an increase in phosphate concentrations
Are discharges of nutrients and organic matter decreasing?
• Are discharges of organic substances and nutrients increasing/decreasing?
Discharges of organic matter from point sources
☺ Over the past 15 to 30 years biological treatment of waste water has increased and organic discharges have consequently decreased across most of western Europe
☺ There have been marked reductions in the discharge of organic matter in the accession countries during the 1990s, and in the five countries for which data are available, organic matter from point sources declined by more than 75 % from 1992 to 2000
Loads of nutrients discharged to sea
☺ Loads of both phosphorus and nitrogen from all quantified sources to the North Sea and Baltic Sea have decreased since the 1980s
Atmospheric deposition of nitrogen to marine and coastal waters
% The total quantity of nitrogen deposited into the North Sea from the atmosphere has remained relatively stable throughout the 1990s
☺ Annual nitrogen depositions to the Baltic Sea have declined in the 1990s

28 Europe's water: An indicator-based assessment
• Are discharges from urban waste water treatment plants (households and small industries) being reduced?
Development of urban waste water treatment
☺ Waste water treatment in all parts of Europe has improved significantly since the 1980s
☺ In several countries in north-western Europe, there has been a marked increase in the population connected to tertiary waste water treatment in the 1990s resulting in marked reductions in phosphorus and nitrogen discharges
! However, the percentage of population connected to waste water treatment is relatively low in Belgium, Ireland, southern Europe and in the accession countries
• Is water pollution caused or induced by nitrates from agricultural sources being reduced?
Use of fertilisers ☺ Phosphate fertiliser consumption has been decreasing in both the EU and accession countries since the 1980s
% Nitrogen fertiliser consumption increased until the late 1980s and then started to decline but in recent years it has increased again in the EU and EFTA countries
! Phosphate and nitrogen fertiliser consumption per hectare of arable land is higher in the EU and EFTA countries than in the accession countries. Mineral fertilisers are still a very significant source of nutrient pollution
Numbers of livestock ☺ The numbers of pigs and cattle in eastern and northern Europe, and of cattle in western Europe have decreased during the 1990s
& In contrast, the numbers of pigs have increased in Mediterranean Europe over the same period
! Livestock density is high in western Europe. In combination with the high percentage of agricultural land in these countries, there is a high potential for nitrogen and phosphorus pollution
Nitrogen surplus in agricultural soils
! There is a large nitrogen surplus in the agricultural soils of EU countries that can potentially pollute both surface and groundwaters
Are the adverse effects of nutrients and organic pollution being reduced?
• Is water intended for human consumption (drinking water) wholesome and clean (free of microbiological contamination and nitrate concentrations less than 25 mg NO3/l)?
Microbiological contamination of drinking water
! There are problems with microbiological contamination of drinking water, particularly in the accession countries and Italy and Ireland
Nitrate in drinking water ! Nitrate in drinking water is a common problem across Europe, particularly from shallow wells
• Is bathing water quality improving?
Bathing water quality ☺ The quality of designated bathing waters (coastal and inland) has improved in Europe throughout the 1990s
! Despite this improvement, 10 % of Europe’s coastal and 28 % of inland bathing waters do not meet (non-mandatory) guide values
• Is the condition regarding eutrophication of Europe’s lakes, rivers and seas improving?
Water transparency in lakes ☺ The quality of water in terms of transparency has improved in European lakes since 1980 because of a reduction in concentrations of phosphorus resulting from measures to reduce discharges of phosphorus from point and other sources
Policy question Indicators Assessment

Nutrients and organic pollution of water 29
Chlorophyll in coastal and marine waters
% Generally no trend is observed in summer surface chlorophyll-a concentrations in the Baltic Sea, Greater North Sea or Greek coastal waters
Harmful phytoplankton in coastal waters
% There is no clear trend in shellfish poisoning events in European waters, though amnesic shellfish poisoning occurrences seem to occur more frequently than in the past
• Is the condition regarding eutrophication of Europe’s lakes, rivers and seas improving?
Oxygen in bottom layers of marine waters
% Generally no trend is observed in the frequency of low oxygen concentrations in the Baltic Sea, North Sea and Mediterranean Sea
! Low oxygen concentrations are a problem in specific estuaries with large inputs of nutrients and little mixing of the water column as well as in stratified coastal waters and in the deep troughs of the Baltic Sea and entire Black Sea
How effective are existing policies in reducing loading of nutrients and organic matter?
• Is the urban waste water treatment directive being implemented in Member States?
Implementation of the urban waste water treatment directive
! In 1998, only two EU countries were close to conforming to the requirement of the directive for their large agglomerations discharging into sensitive areas, and eight countries were far from conformity
! Many large cities did not have a sufficient standard of treatment to meet the objectives of the directive
• Is the nitrates directive being implemented in Member States?
Implementation of the nitrates directive
☺ Considerable progress has been made in most Member States in developing action programmes for nitrate vulnerable zones
! However, none of the action plans fully comply with the obligations that are specified in the nitrates directive
Policy question Indicators Assessment

30 Europe's water: An indicator-based assessment
Policy question: Is pollution with nutrients and organic matter decreasing?
Notes: The figure compares three time series containing different numbers of groundwater bodies, time spans and countries. It also shows the drinking water directive’s maximum allowable concentrations and guide levels, and the typical background concentration.1993–99 time series: Austria, Belgium, Bulgaria, Denmark, Estonia, Hungary, Latvia, Lithuania, Netherlands, Slovak Republic, Slovenia, Spain.1993–2000 time series: Austria, Belgium, Bulgaria, Denmark, Estonia, Latvia, Lithuania, Netherlands, Slovak Republic, Slovenia.1989–99 time series: Bulgaria, Denmark, Estonia, Hungary, Lithuania, Netherlands, Slovak Republic.
Notes: Figure 3.3 is based on the data for the latest year available (given after the country name). The numbers of groundwater bodies per country included in the presentation are given after the year. The four classes represent the percentage of sampling sites within each groundwater body where annual average nitrate concentrations exceed 50 mg NO3/l.
Nitrate in groundwater
Agriculture is the largest contributor of nitrogen pollution to groundwater. Nitrogen from excess fertiliser percolates through the soil and is detectable as elevated nitrate concentrations under aerobic conditions and as elevated ammonium concentrations under anaerobic conditions. The rate of percolation is often slow, and excess nitrogen concentrations may be the effects of pollution on the surface up to 40 years ago depending on the hydrogeological conditions.
The Nitrates Directive (91/676/EEC) aims to control nitrogen pollution and requires Member States to identify groundwaters that contain more than 50 mg/l nitrate or could contain more than 50 mg/l nitrate if preventative measures are not taken. In addition, the Drinking Water Directive (98/83/EC) sets a maximum allowable concentration for nitrate of 50 mg/l. It has been shown that consuming drinking water in excess of the nitrate limit can result in adverse health effects, especially in infants less than two months of age. Groundwater is a very important source of drinking water in many countries and it is often used untreated particularly from private wells.
Mean nitrate concentrations in groundwaters in Europe are above background concentrations (<10 mg/l (as NO3) (EEA, 2000)) but do not exceed 50 mg/l as NO3 (Figure 3.2). Elevated mean nitrate concentrations in 1996 and 1997 are mostly caused by single very high values. However, the annual mean nitrate concentration in at least one sampling site in about one third of the groundwater bodies (included in Eurowaternet) exceeds 50 mg/l nitrate (Figure 3.3). Concentrations higher than 50 mg NO3/l were detected frequently or very frequently in 39 groundwater bodies (14 %).
According to the latest European Commission report (EC 2002), 20 % of EU stations had concentrations in excess of the maximum allowable concentration and 40 % were in excess of the guide value in the drinking water directive (25 mg/l as NO3) in 1996–98. Countries showing an overall increase in nitrate concentrations in groundwater are France and Sweden.
Figure 3.2 Average nitrate concentration in European groundwater bodies
Figure 3.3Percentage of sampling sites in groundwater bodies where annual average concentrations exceed 50 mg/l nitrate
Nit
rate
mg
/l (
as N
O)
3
60
50
40
30
20
10
01989 1991 1993 1995 1997 1999
10 countries, 62 GW bodies 1993–2000
11 countries, 74 GW bodies 1993–19997 countries, 38 GW bodies 1989–1999
Drinking water directive maximum allowable concentration
Drinking water directive guide level
Background
Source: EEA Waterbase.
Sweden 2000–3
Latvia 2000–4
Lithuania 2000–5
Ireland 1998–3
Finland 1998–26
Greece 1998–65
Estonia 2000–5
Hungary 1999–11
Bulgaria 2001–64
Poland 2000–3
Czech Rep. 2000–39
Belgium 2001–2
Slovenia 2000–4
Netherlands 2001–8
Austria 2001–14
UK 1998–4
Slovak Rep. 2000–10
Denmark 2000–3
Germany 2000–2
Spain 1999–3
0 20 40 60 80 100% of groundwater bodies
NoneRare (< 25 %)
Frequent (25–50 %)Very frequent (> 50 %)
Source: EEA Waterbase.
Key messages:
% There is no evidence of a decrease (or increase) in concentrations of nitrate in Europe’s groundwaters
! Nitrate drinking water limit values are exceeded in around one third of the groundwater bodies for which information is currently available

Nutrients and organic pollution of water 31
Policy question: Is pollution with nutrients and organic matter decreasing?
Organic matter in rivers
Organic matter, measured as biochemical oxygen demand, and ammonium are key indicators of the oxygen content of water bodies. Concentrations of these determinants are normally raised as a result of organic pollution, caused by discharges from waste water treatment plants, industrial effluents and agricultural run-off. High biochemical oxygen demand indicates poor chemical and biological quality of river water and may reduce the biodiversity of aquatic communities and microbiological quality.
Increased industrial and agricultural production, coupled with more of the population being connected to sewerage systems, has resulted in increases in discharges of organic waste in most European countries since the 1940s. In many major European rivers, the oxygen decreased to low levels and the ecological quality was heavily affected. For example, the River Thames had no resident fish in the London reaches in the 1950s.
Ammonium and biochemical oxygen demand generally decreased in the 1990s, by 20–30 % and 40–60 % respectively. This reduction in organic pollution in the EU countries during the 1990s was largely due to the urban waste water treatment directive, which increased the level of treatment of waste water. There has also been some investment in improving waste water treatment in the accession countries but the decline in organic pollution in these countries is probably mainly due to declines in industry discharging organic matter.
The concentrations of biochemical oxygen demand and ammonium are lower in the EU countries than in the accession countries. The largest decreases in ammonium have been observed in those countries with highest concentrations at the beginning of the 1990s. However, concentrations of ammonium are still way above background concentrations.
The concentrations of ammonium have decreased in the rivers of the EU and accession countries in the 1990s. The lowest concentrations of ammonium are found in Finland, with the new Baltic States, the UK and Denmark also having ammonium concentrations generally below 100 mg N/l. The highest ammonium concentrations are found in Bulgaria, Germany, Hungary and
Notes: Number of stations in brackets.EU countries: Denmark, Germany, Finland, France, Sweden, UK.Accession countries: Bulgaria, Estonia, Hungary, Latvia, Lithuania, Poland, Slovak Republic, Slovenia.Background or natural concentrations of ammonium in rivers will vary across Europe and from river type to river type. The figure above gives a level that might be considered to be at the lower level of the ranges reported to be representative of ‘background’ concentrations. Ammonium exerts a demand on oxygen in water as it is transformed to oxidised forms of nitrogen. In addition it is toxic to aquatic life at certain concentrations in relation to water temperature, salinity and pH.
Notes: Number of stations in brackets.EU countries: Denmark, France, UKAccession countries: Bulgaria, Hungary, Slovak Republic, SIovenia.Background concentrations of biochemical oxygen demand are difficult to quantify and are likely to be at or below the detection limit of the analytical method of measurement, that is, between 1 and 2 mg O2/l.
Poland, where significant improvements were made in the 1990s with ammonium concentrations being more than halved.
Key messages:
☺ The organic pollution of rivers has decreased markedly in the 1990s
Concentration of total ammonium in rivers in EUand accession countries Figure 3.4
Concentration of biochemical oxygen demand inrivers in EU and accession countries Figure 3.5
0
50
100
150
200
250
300
350
400
450
500
1990
1991
1992
1993
1994
1995
1996
1997
1998
1999
2000
EU (526) AC (441) Background (low)
Am
mo
nium
µg
N/I
Source: EEA Waterbase.
0
1
2
3
4
5
6
BO
D5
mg
0/I
2
1990
1991
1992
1993
1994
1995
1996
1997
1998
1999
2000
EU (255) AC (191)
Source: EEA Waterbase.

32 Europe's water: An indicator-based assessment
Policy question: Is pollution with nutrients and organic matter decreasing?
Notes: Concentrations are the median of the annual average concentrations at each monitoring station. Numbers of stations are shown in brackets.Western Europe: Denmark, France, Germany, UK.Northern Europe: Finland, Sweden.Accession countries: Bulgaria, Estonia, Hungary, Latvia, Lithuania, Poland, Slovak Republic, Slovenia.
Notes: Concentrations are the median of the annual average concentrations at each monitoring station. Numbers of stations are shown in brackets.Western Europe: Denmark, France, Germany, UK.Northern Europe: Finland, Sweden.Accession countries, Bulgaria, Estonia, Hungary, Latvia, Lithuania, Poland, Slovak Republic, Slovenia.
Nutrients in rivers
Large inputs of nutrients arising from human activities into rivers can lead to eutrophication, adversely affecting the ecology and limiting the use of rivers for drinking water abstraction and recreation. Nutrients occur naturally but it is difficult to determine precise background concentrations for different types of river. Generally background concentrations for phosphate are approximately 10 µg/l as P and for nitrate are between 0.4 to 4 mg/l as NO3.
In western Europe and accession countries, nutrient concentrations are above these background levels. In the case of phosphate, concentrations above background levels may be having significant impacts on the ecological status of many rivers, particularly as phosphorus is the limiting nutrient in many freshwater systems. The concentrations of phosphate have decreased in western and accession countries in the 1990s, and in northern Europe are close to background levels.
The concentrations of nitrate are highest in the rivers of western Europe where agriculture is the most intensive, and lowest in northern Europe where concentrations are within background ranges. Concentrations in the accession countries are above background levels and have remained relatively unchanged throughout the 1990s. Concentrations in western Europe have remained relatively stable throughout the 1990s.
Nitrate concentration increases are evident in four rivers for which there is a long time series available. These are the river Rhine (which has shown recent decreases in concentrations), the River Ythan and the River Tyne in Scotland and the River Seine in France.
Figure 3.6 Phosphate concentrations in rivers in western and northern Europe and in accession countries
Figure 3.7 Nitrate concentrations in rivers in western and northern Europe and in accession countries
Figure 3.8 Nitrate concentrations since the 1950s in selected European rivers
1990
1991
1992
1993
1994
1995
1996
1997
1998
1999
2000
160
140
120
100
80
60
40
0
20
Pho
spha
te µ
g P
/I
Northern (127) Western (319)AC (387) Background
Source: EEA Waterbase.
1990
1991
1992
1993
1994
1995
1996
1997
1998
1999
2000
Western (385) AC (446)High background Low Background
Northern (138)
14
12
10
8
6
4
0
2
Nit
rate
mg
/I (
as N
o)
3
Source: EEA Waterbase.
0
5
10
15
20
25
30
35
40
Rhine at Bimmen/Lobith River YthanRiver Tyne River Seine
Nit
rate
mg
/I (
as N
o)
3
1955
1959
1963
1967
1971
1975
1979
1983
1987
1991
1995
1999
Source: UBA, 2001 (Rhine), SEPA, 2002 (Tyne and Ythan) and EEA Waterbase (Seine).
Key messages:
☺ Concentrations of phosphate have decreased in the rivers of the EU and accession countries during the 1990s reflecting the general improvement in waste water treatment over this period
% Nitrate concentrations in rivers have remained relatively stable throughout the 1990s and are highest in those western European countries where agriculture is most intensive
Nutrients and organic pollution of water 33
Policy question: Is pollution with nutrients and organic matter decreasing?
Phosphorus in lakes
It has been recognised since the 1970s that the discharge of anthropogenic nutrients has caused eutrophication in many European lakes. Eutrophic lakes exhibit increased phytoplankton growth (in particular diatoms and blue-green algae) which can make the water turbid and unattractive. Some algal blooms produce toxins and also tastes and odours that make it unsuitable for water supply. Low oxygen concentrations due to degradation of dead algae lead to the exclusion of fish and other animals.
Lakes tend to take longer to recover from eutrophication than rivers since they generally have lower flushing rates and huge reserves of phosphorus that can be released from the sediment. In freshwater bodies, phosphorus is usually the limiting nutrient for algal growth, so its concentration gives an indication of the trophic status of a lake.
The proportion of lakes and reservoirs with low phosphorus concentrations (< 25 µg P/l) has increased in the last 20 years and the proportion with relatively high concentrations (> 50 µg P/l) has decreased. This indicates that eutrophication in European lakes is decreasing. In the past, urban waste water has been a major source of nutrient pollution, but recently treatment has improved and outlets have been diverted away from many lakes. Diffuse pollution, particularly from agriculture, continues to be a problem. Phosphorus enrichment in lakes is a greater problem in accession and western countries than in the northern countries. This is because the northern countries have lower population densities, lower agricultural
Notes: Based on 369 lakes from Austria (5), Denmark (11), Finland (203), France (1), Germany (5), Ireland (6) and Sweden (138). Numbers of lakes in brackets.
Notes: Northern: Finland, Iceland, Norway, Sweden.Western: Austria, Denmark, France, Germany, Ireland, Netherlands, Spain, UK.Accession countries: Estonia, FYR Macedonia, Latvia, Lithuania, Hungary, Poland, Slovenia.
Key messages:
☺ Eutrophication of European lakes is decreasing
! However, there are still many lakes and reservoirs with high concentrations of phosphorus due to human activities
! Phosphorus concentrations are highest in lakes in the accession countries and lowest in the northern countries
Average summer concentration ofphosphorus in lakes Figure 3.9
Phosphorus concentrations in lakesin parts of Europe Figure 3.10
10
250–500
< 10
8
6
4
2
1981–85 1986–90 1991–95
% o
f la
kes
1996–20010
> 500
125–25050–12525–5010–25
µg P/l
Source: EEA Waterbase.
100
80
60
40
20
% o
f la
kes
0
250–500
< 10
> 500
125–25050–12525–5010–25
Northern (509) Western (191) AC (55)
µg P/l
Source: EEA Waterbase.
Total phosphorus concentrations in selected European large lakes Figure 3.11
Source: EEA: compiled by ETC/WTR from SoE reports.
0
20
40
60
80
100
120
1950 1960 1970 1980 1990 1999
Bodensee (CH, DE, AT) Mälaren (SE) L Como (IT)
50
100
150
200
250
300
1980 1985 1990 1995 2000
Neagh (GB) Erne (GB) Ijsselmeer (NL)
Pho
spho
rus
µg P
/I
Pho
spho
rus
µg P
/I
0
34 Europe's water: An indicator-based assessment
intensities and a longer tradition of removing phosphorus from waste water.
In two large lakes, which were previously highly polluted by phosphorus, the phosphorus concentrations have steadily decreased over the last decades, particularly in response to control of point sources (such as
the Bodensee and Ijsselmeer). In two other examples (Loughs Neagh and Erne) concentrations have steadily increased in spite of reducing point source loads. This is because of a steady build up of a surplus of phosphorus (arising from fertilisers) in the soils in the catchments draining into these two lakes.

Nutrients and organic pollution of water 35
Policy question: Are discharges of nutrients and organic matter decreasing?
Nutrients in coastal and marine waters
In marine and coastal waters, increased nutrient loads result in increases in phytoplankton biomass and changes in phytoplankton species composition which effect food web dynamics and light conditions. Eutrophication is a particular problem in semi-enclosed coastal water bodies, for example, sea lochs, where increased biomass can cause oxygen depletion. In addition, there are sometimes increases in toxic species of phytoplankton.
The mean winter surface concentrations of nitrate and phosphate and the nitrate/phosphate ratio are used to assess nutrient status since in winter biological uptake is at its lowest and nutrient concentrations are at their highest. The optimum N/P ratio for phytoplankton growth is 16:1 (by atoms). Lower ratios indicate nitrate limitation and higher ratios indicate phosphate limitation to further growth.
There have been significant decreases in riverine and direct loads of nitrogen and phosphorus into the Baltic and North Seas since 1985 (see Figure 3.14). However, no trend is observed in winter surface nitrate concentrations in the Greater North Sea (Figure 3.12 and Map 3.1 and 3.2). Individual countries, using different time series and assessment methods, have shown reductions in nitrate concentrations. For example, in Dutch coastal waters there is a nitrate decrease in line with the reduction found in the Rhine (see Figure 3.8). In the Black Sea, a slight decrease of nitrogen concentrations in the Romanian coastal waters and a steady decline in Turkish waters at the entrance of Bosphorus are reported (Black Sea Commission, 2002).
Decreasing trends are observed in winter surface phosphate concentrations at a number of stations in the Belgian, Dutch, Norwegian and Swedish coastal waters of the North Sea and Skagerrak, and in the Danish, German, Lithuanian and Swedish waters of the Baltic Sea area. Increasing trends are observed at two Finnish coastal stations in the Gulf of Finland due to hypoxia and upwelling of phosphate-rich bottom water in the late 1990s, and at a few Belgian and German coastal North Sea stations.
Notes: Trend analyses are based on time series 1985–2000 with each monitoring station having at least three years’ data in the period 1995–2000. Number of stations in brackets.Baltic Sea data from: Denmark, Finland, Germany, Latvia, Lithuania, Poland, Sweden.North Sea data from: Belgium, Denmark, Germany, Netherlands, Norway, Sweden, UK.
The phosphate concentrations are mainly low in the Mediterranean Sea but some hot spots are found on the west coast of Italy.
In the Black Sea there is no general trend in phosphate concentrations, but the Black Sea Commission has reported decreases in Turkish waters at the entrance to the Bosphorus (Black Sea Commission, 2002).
The N/P ratio is increasing at the Dutch and Norwegian stations in the North Sea but decreasing in the outer Elbe Estuary. The ratio is also increasing at some stations in the Baltic Sea and in the Mediterranean Sea ratios are very high all along the east coast of Italy indicating phosphorus limitation. In the Black Sea, the ratio is generally low (nitrogen limitation) except at a few Romanian stations where ratios of > 32 are found.
Key messages:
% Nutrient concentrations in Europe’s seas have generally remained stable over recent years, though a few stations in the Baltic, Black and North Seas have demonstrated a slight decrease in nitrate and phosphate concentrations
& A smaller number of stations in the Baltic and North Seas also showed an increase in phosphate concentrations
Nitrate and phosphate concentrations in North andBaltic Seas Figure 3.12
Decrease No trend Increase
0% of stations
20 40 60 80 100
North Sea —Nitrate (69)
North Sea —Phosphate (70)
Baltic Sea —Nitrate (90)
Baltic Sea —(89)Phosphate
Source: OSPAR, Helcom, ICES, BSC and EEA member countries compiled by EEA-ETC/WTR.

36 Europe's water: An indicator-based assessment
t
Notes: Average over 1995–2000. Winter period is January–February/March. Samples taken at 0–10 m. In addition, the results of trend analyses of time series 1985–2000 (with each monitoring station having at least three years data in the period 1995–2000 and at least five years data in all) are shown for each country by a pie diagram.
Map 3.1 Average winter surface concentrations of nitrate + nitrite in sea water.
Map 3.2 Average winter surface concentrations of phosphate in sea water
Source: OSPAR, Helcom, ICES, BSC and EEA member countries compiled by EEA-ETC/WTR.
3 2
Source: OSPAR, Helcom, ICES, BSC and EEA member countries compiled by EEA-ETC/WTR.

Nutrients and organic pollution of water 37
Policy question: Are discharges of nutrients and organic matter decreasing?
Discharges of organic matter from point sources
Organic pollution is caused by discharges of human waste water and industrial effluents, particularly industries that process organic matter such as wood processing and the food industry. In addition, the chemical industry and agricultural run-off (manure and slurry) also result in high BOD and ammonium concentrations, which are key indicators of organic pollution.
Organic matter discharged from urban waste water treatment plants has decreased in Denmark, Finland, the Netherlands and the UK. Organic matter discharged from point sources in the accession countries decreased dramatically in the 1990s. This may be partly due to the deep economic recession that occurred between 1990 and 1993, and the consequent decline in highly polluting heavy industry. Although their economies have since picked up and industrial output has increased, there has been a shift towards less polluting industries and improved waste water treatment.
Several types of industry that discharged large amounts of organic matter in the 1970s and 1980s, have since markedly reduced their discharges. This is because many industries have become cleaner rather than because production from these industries has declined. In fact, in many cases, production has increased whilst pollution has declined.
For example, discharges of organic matter from the European pulp and paper industry have declined as more mills now have secondary treatment of their effluents. However, the total amount of paper produced has increased during this time period. The move towards cleaner technologies is partly driven by the European directives such as the integrated pollution prevention and control (IPPC) directive, which requires large facilities to use the best available techniques (BAT) to make radical environmental improvements.
Notes: Discharge of organic matter (biochemical oxygen demand) from urban waste water treatment works in EU countries (Denmark, Finland, Netherlands, UK (E&W)), and from all point sources (such as urban waste water treatment works and industry) in accession countries (Czech Republic, Estonia, Latvia, Lithuania, Slovak Republic).
Key messages:
☺ Over the past 15 to 30 years, biological treatment of waste water has increased and organic discharges have consequently decreased across most of western Europe
☺ There have been marked reductions in the discharge of organic matter in the accession countries during the 1990s, and in the five countries for which data are available, organic matter from point sources declined by more than 75 % from 1992 to 2000
Discharge of organic matter from point sources Figure 3.13
1 0
00
to
nnes
1985
1987
1989
1991
1993
1995
1997
1999
2001
EU countries Accession countries
300
250
200
150
100
50
0
Source: EEA, compiled from national SOE reports.

38 Europe's water: An indicator-based assessment
Policy question: Are discharges of nutrients and organic matter decreasing?
Notes: Percentage reductions between 1985 and 2000 for the North Sea and late 1980s and 1995 for the Baltic Sea. Latest year: North Sea 2000, Baltic Sea 1995.
Notes: Percentage reductions between 1985 and 2000 for the North Sea and late 1980s and 1995 for the Baltic Sea. Latest year: North Sea 2000, Baltic Sea 1995.
Loads of nutrients discharged to sea
There is a complex relationship between riverine and direct discharges of nitrogen and phosphorus and the concentration of nutrients in coastal waters, estuaries, fjords and lagoons, which in turn affect their biological state. Measures to reduce the input of anthropogenic nutrients and to protect the marine environment are required by the Mediterranean Action Plan, Helsinki Convention 1992, OSPAR Convention 1998, and the Black Sea Convention.
In the North Sea, there have been significant reductions in the loads of phosphorus from urban waste water treatment works, industry and other sources between 1985 and 2000. The reduction from agriculture has been less and this source was the largest in 2000. Nitrogen discharges to the North Sea have decreased significantly from urban waste water treatment works, industry, agriculture and other sources between 1985 and 2000, with agriculture being the major source in 2000.
Even though the data for the Baltic Sea are less recent, they give a similar picture to the North Sea, with significant reductions in discharges of nitrogen and phosphorus from agriculture, urban waste water treatment works, industry and aquaculture. In 1995, the major source of phosphorus and nitrogen to the Baltic Sea was urban waste water treatment works and agriculture, respectively.
Data for the Black Sea are less comprehensive than for the Baltic and North Seas, but indicate that riverine discharges are the largest sources of nitrogen and phosphorus. For example, the Danube contributes to around 65 % of the total nitrogen and phosphorus load for all sources.
Comprehensive data are not available for the Mediterranean Sea but all coastal cities discharge their (treated or untreated) sewage to the sea and only 4 % have tertiary treatment, indicating that the nutrient input from this source may be high. Agriculture is also intensive in the region and 80 rivers have been identified as significantly contributing to the pollution of the Mediterranean (EEA, 1999).
Key messages:
☺ Loads of both phosphorus and nitrogen from all quantified sources to the North Sea and Baltic Sea have decreased since the 1980s
Figure 3.14 A Reduction of loads of nitrogen and phosphorus into the North and Baltic Seas since 1985
Figure 3.14 B Sectoral contribution to nitrogen and phosphorus loads in the North and Baltic Seas
Phosphorus(Baltic Sea)
Phosphorus(North Sea)
Nitrogen(Baltic Sea)
Nitrogen(North Sea)
800 20 40 60 100
Other sources/aquaculture IndustryUrban waste water treatment Agriculture
% reduction
Source: North Sea Progress Report 2002; Helcom, 2002.
800 20 40 60 100
Other sources/aquaculture IndustryUrban waste water treatment Agriculture
% contribution latest year
Phosphorus(Baltic Sea)
Phosphorus(North Sea)
Nitrogen(Baltic Sea)
Nitrogen(North Sea)
Source: North Sea Progress Report 2002; Helcom, 2002.

Nutrients and organic pollution of water 39
Policy question: Are discharges of nutrients and organic matter decreasing?
Atmospheric deposition of nitrogen to marine and coastal waters
Atmospheric deposition of oxidised or reduced nitrogen compounds can be considerable in many parts of Europe and can be a significant source of the total input of nutrients to surface water systems. For example, the relative proportions of nitrogen input for riverine, atmospheric and direct inputs into the North Sea are 10:3:1. In the Baltic Sea, riverine and direct inputs account for most of the nutrient load — three times more nitrogen and 10 times more phosphorus than the atmospheric input.
Key messages:
% The total quantity of nitrogen deposited into the North Sea from the atmosphere has remained relatively stable throughout the 1990s
☺ Annual nitrogen depositions to the Baltic Sea have declined in the 1990s
Nitrogen deposition in precipitation on the Northand Baltic Seas Figure 3.15
North Sea Baltic Sea
1990 1992 1994 1996 1998 2000
1.4
1.2
1
0.8
0.6
0.4
0.2
0
g N
/m/y
r2
Source: EMEP, EEA-ETC/ACC.

40 Europe's water: An indicator-based assessment
Policy question: Are discharges of nutrients and organic matter decreasing?
Notes: Only countries with data from all periods included, the number of countries in parentheses.Nordic: Iceland, Finland, Norway, Sweden.Central EEA: Austria, Denmark, Germany, Ireland, Luxembourg, Netherlands, Switzerland, United Kingdom.Southern: Greece, Spain.Accession countries: Bulgaria, Estonia, Hungary, Poland.
Notes: Data from Denmark, Finland, Netherlands, Norway (no nitrogen), Sweden.
Development of urban waste water treatment
Over the last 20 years, marked changes have occurred in the proportion of the population connected to waste water treatment as well as in the waste water treatment technology involved.
In the northern countries, most of the population are today connected to waste water treatment plants with tertiary treatment, which efficiently removes nutrients and organic matter from the waste water. In the central EEA countries, more than half of the waste water is treated by tertiary treatment, a quarter by only biological treatment which removes most of the organic matter and the ammonia. Southern countries and the accession countries for the moment only have around half of the population connected to waste water treatment plants. Some 30 to 40 % of the population are connected to secondary or tertiary treatment.
The improvement in waste water treatment was due to implementation of the urban waste water treatment directive (see the status of implementation at later indicator) and resulted in marked lower discharge of organic matter and nutrients to water.
In the countries included in Figure 3.17, the percentage of population connected to tertiary treatment increased from 40 to 80 % during the 1990s. Over the same period, the discharge of phosphorus and nitrogen from waste water treatment decreased by 60 and 30 % respectively. This difference reflects that nearly all the tertiary treatment plants have phosphorus removal while only some of the plants, in particular the large plants, have nitrogen removal.
Key messages:
☺ Waste water treatment in all parts of Europe has improved significantly since the 1980s
☺ In several countries in north-western Europe there has been a marked increase in the population connected to tertiary waste water treatment in the 1990s, resulting in marked reductions in phosphorus and nitrogen discharges
! However, the percentage of population connected to waste water treatment is relatively low in Belgium, Ireland, southern Europe and in the accession countries
Figure 3.16 Waste water treatment in regions of Europe between the 1980s and late 1990s
Figure 3.17 Nutrient discharges and waste water treatment in selected western European countries
100
90
80
70
60
50
0
30
20
10
0
% o
f p
op
ulat
ion
Tertiary Secondary Primary
80
Central (8)
90 95 Late90s
80 90 95 Late90s
92 9595 Late90s
80 92
Nordic (4) South (2) AC (4)
Source: EEA–ETC/WTR based on member countries’ data reported to OECD/Eurostat Joint Questionnaire, 2000.
0
20
40
60
80
100
1990
1991
1992
1993
1994
1995
1996
1997
1998
1999
0
20
40
60
80
100
Phosphorus discharge Nitrogen dischargeTertiary treatment
Ind
ex 1
99
0=
10
0
% o
f p
op
ulat
ion
Source: National SOE reports.

Nutrients and organic pollution of water 41
Policy question: Are discharges of nutrients and organic matter decreasing?
Use of fertilisers
A major source of nitrogen pollution is agriculture since nitrogen fertilisers and manure are used on arable crops to increase yields and productivity. In the EU, mineral fertilisers account for almost 50 % of nitrogen inputs into agricultural soils, and manure for 40 % (other inputs are biological fixation and atmospheric deposition) (EC, 2002b). When the amount of fertiliser applied is in excess of the amount that can be utilised by the crop, the nitrogen is easily lost and ends up polluting water bodies. Both increases in fertiliser use, and in animal manure to be disposed of, constitute a potential source for run-off of nutrients to inland waters.
In general, the use of both types of fertiliser per unit of arable land is higher in western Europe than in eastern Europe. This reflects the less intensive arable agricultural practices in the latter countries.
Notes: As nitrate generally moves relatively slowly in soil and groundwater there will often be a significant time lag between changes in agricultural practices and changes in nitrate concentrations in groundwater — typically between one and 20 years depending on the situation. The time frame in Figure 3.18 was chosen to reflect this potential time lag.EU + EFTA: Austria, Belgium, Denmark, Finland, France, Germany, Greece, Ireland, Italy, Luxembourg, Netherlands, Norway, Portugal, Spain, Sweden, Switzerland, United Kingdom.Accession countries and SE Europe: Albania, Bulgaria, Cyprus, Hungary, Malta, Poland, Romania.
Key messages:
☺ Phosphate fertiliser consumption has been decreasing in both the EU and accession countries since the 1980s
% Nitrogen fertiliser consumption increased until the late 1980s and then started to decline but in recent years it has increased again in the EU and EFTA countries
! Phosphate and nitrogen fertiliser consumption per hectare of arable land is higher in the EU and EFTA countries than in the accession countries. Mineral fertilisers are still a very important source of nutrient pollution
Changes in (a) phosphate and (b) nitrogenousfertiliser use Figure 3.18
EU + EFTAAccession countries and SE Europe
6
5
4
3
2
1
0
Mill
ion
tonn
es
1980
1982
1984
1986
1988
1990
1992
1994
1996
1998
(a)
EU + EFTAAccession countries and SE Europe
Mill
ion
tonn
es
(b)
0
2
4
6
8
10
12
1980
1982
1984
1986
1988
1990
1992
1994
1996
1998
Source: FAO.

42 Europe's water: An indicator-based assessment
Notes: Agricultural land area includes arable land, permanent crops and permanent pastures according to FAO definitions.
Map 3.3 Phosphate and nitrogen fertiliser usage per unit of agricultural land area
Source: FAO.

Nutrients and organic pollution of water 43
Policy question: Are discharges of nutrients and organic matter decreasing?
Numbers of livestock
The nitrates directive sets a limit for the amount of livestock manure applied to land each year, including by the animals themselves, of 170 kg N per hectare. This amount may be calculated on the basis of animal numbers. Livestock densities per agricultural area are highest in western Europe both as regards pigs and cattle. The northern region has relatively high densities of cattle, whereas the Mediterranean region has the highest densities of sheep and goats. Eastern Europe has low densities of both pigs, cattle and sheep/goats.
The most marked change in the numbers of livestock in the 1990s is a drastic reduction in both pigs and cattle in eastern Europe caused by the economic problems during the transition period. The Mediterranean region has had an increase in numbers of pigs over the same period. In northern and western countries of Europe there have been relatively minor reductions in cattle numbers. Northern countries have also seen a reduction in pig numbers whereas in western countries pig numbers remained relatively stable.
Notes: East: Bosnia-Herzegovina, Bulgaria, Croatia, Czech Republic, Estonia, Hungary, Latvia, Lithuania, Poland, Romania, Slovak Republic.Mediterranean: Albania, Greece, Italy, FYR Macedonia, Malta, Portugal, Slovenia, Spain.Northern: Finland, Iceland, Norway, Sweden.West: Austria, Belgium, Denmark, France, Germany, Ireland, Liechtenstein, Luxembourg, Netherlands, United Kingdom.
Key messages:
☺ The numbers of pigs and cattle in eastern and northern Europe, and of cattle in western Europe have decreased during the 1990s
& In contrast, the number of pigs have increased in Mediterranean Europe over the same period
! Livestock density is high in western Europe. In combination with the high percentage of agricultural land in these countries, there is a high potential for nitrogen and phosphorus pollution
Livestock densities in 2001 (a) and relative changes in cattle (b) and pig (c) numbersin different regions of Europe since 1990
Figure 3.19
Agriculture area
Agr. Area Pigs Cattle Sheep/goats
Heads/1 000 ha
1 200
1 000
800
600
400
200
0
60 %
50 %
40 %
30 %
20 %
10 %
0 %
East
Med
iterra
nean
NordicW
est
Region
East
Med
iterra
nean
NordicW
est
East Mediterranean Nordic West
0.4
0.5
0.6
0.7
0.8
0.9
1
1990
1991
1992
1993
1994
1995
1996
1997
1999
1998
2000
2001
Cat
tle
num
ber
s re
lati
ve t
o 1
990
East
Med
iterra
nean
NordicW
est
East Mediterranean Nordic West
1990
1991
1992
1993
1994
1995
1996
1997
1999
1998
2000
2001
0.6
0.7
0.8
0.9
1
1.1
1.2
Pig
num
ber
s re
lati
ve t
o 1
990
(c)
(b)
(a) Source: FAO.

44 Europe's water: An indicator-based assessment
Policy question: Are discharges of nutrients and organic matter decreasing?
Nitrogen surplus in agricultural soils
The nitrogen surplus is the difference between the input by mineral fertilisers, livestock manure, atmospheric deposition, biological nitrogen fixation and other inputs such as sewage sludge, and the output in the form of harvested crops. The nitrogen surplus indicates the nitrogen which potentially can be lost to groundwater and surface waters and cause eutrophication problems.
The nitrogen surplus in the EU countries (Map 3.4) is generally 50–100 kg N per hectare of agricultural area, but countries with very intensive agriculture such as the Netherlands have even higher surpluses. The nitrogen surplus in the period 1990–95 for the EU countries has remained nearly constant. The total input has been reduced by around 5 %, but this is compensated by a decrease in the removal by harvested crops (output). The highest nitrate surpluses are found in areas with high densities of livestock breeding and also where there is intensive agriculture and inappropriate agricultural practices such as leaving bare soils in winter which increases nitrate loss.
Key messages:
! There is a large nitrogen surplus in the agricultural soils of EU countries that can potentially pollute both surface and groundwaters
Figure 3.20 Estimate of nitrogen surplus for EU countries (kg N/ha)
NetherlandsLuxembourg
BelgiumGermanyDenmark
ItalyGreeceIrelandFranceFinland
UKSweden
SpainPortugal
Austria
1995 1993 1990
Nitrogen surplus kg N/ha
0 50 100 150 200 250
Source: Eurostat.
Map 3.4 Nitrogen surpluses in Europe
Source: EC, 2002b.
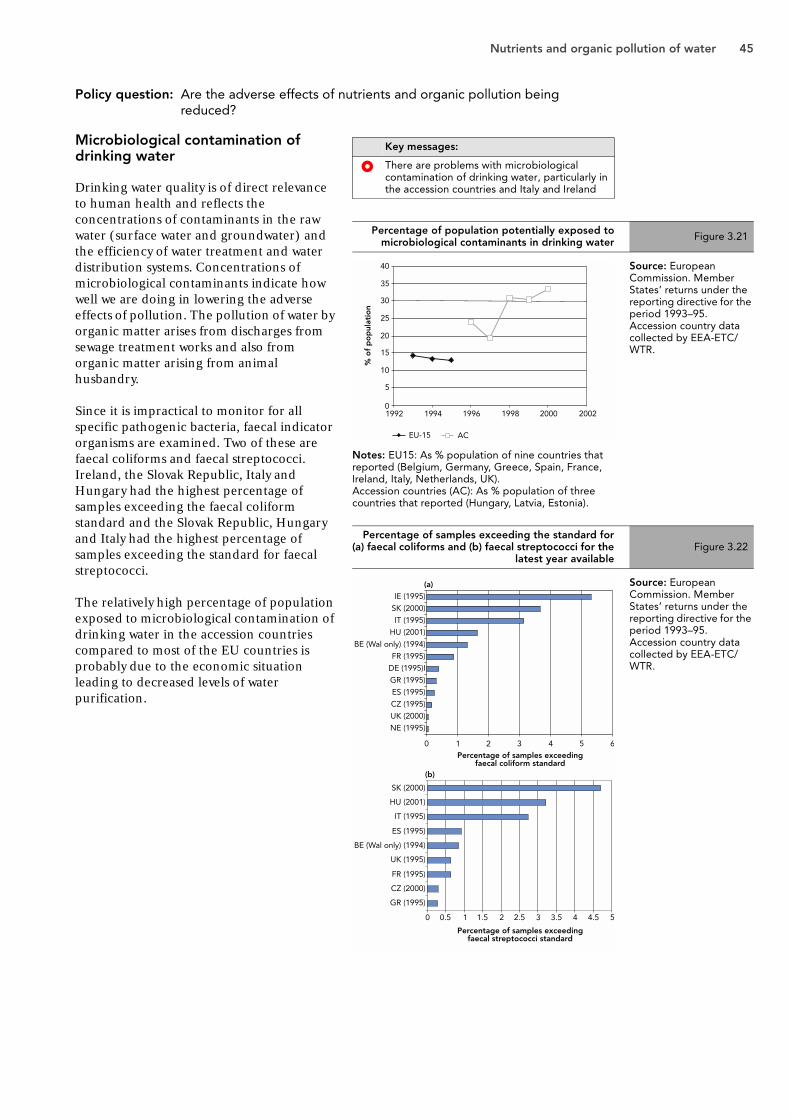
Nutrients and organic pollution of water 45
Policy question: Are the adverse effects of nutrients and organic pollution being reduced?
Microbiological contamination of drinking water
Drinking water quality is of direct relevance to human health and reflects the concentrations of contaminants in the raw water (surface water and groundwater) and the efficiency of water treatment and water distribution systems. Concentrations of microbiological contaminants indicate how well we are doing in lowering the adverse effects of pollution. The pollution of water by organic matter arises from discharges from sewage treatment works and also from organic matter arising from animal husbandry.
Since it is impractical to monitor for all specific pathogenic bacteria, faecal indicator organisms are examined. Two of these are faecal coliforms and faecal streptococci. Ireland, the Slovak Republic, Italy and Hungary had the highest percentage of samples exceeding the faecal coliform standard and the Slovak Republic, Hungary and Italy had the highest percentage of samples exceeding the standard for faecal streptococci.
The relatively high percentage of population exposed to microbiological contamination of drinking water in the accession countries compared to most of the EU countries is probably due to the economic situation leading to decreased levels of water purification.
Notes: EU15: As % population of nine countries that reported (Belgium, Germany, Greece, Spain, France, Ireland, Italy, Netherlands, UK).Accession countries (AC): As % population of three countries that reported (Hungary, Latvia, Estonia).
Key messages:
! There are problems with microbiological contamination of drinking water, particularly in the accession countries and Italy and Ireland
Percentage of population potentially exposed tomicrobiological contaminants in drinking water Figure 3.21
Percentage of samples exceeding the standard for(a) faecal coliforms and (b) faecal streptococci for the
latest year availableFigure 3.22
EU-15 AC
1992 1994 1996 1998 2000 2002
40
35
30
25
20
15
10
0
5
% o
f p
op
ulat
ion
Source: European Commission. Member States’ returns under the reporting directive for the period 1993–95. Accession country data collected by EEA-ETC/WTR.
IE (1995)
SK (2000)
IT (1995)
HU (2001)
BE (Wal only) (1994)
FR (1995)
DE (1995)I
GR (1995)
ES (1995)
CZ (1995)
UK (2000)
NE (1995)
0 0.5 1 1.5 2 2.5 3 3.5 4 4.5 5
GR (1995)
CZ (2000)
FR (1995)
UK (1995)
BE (Wal only) (1994)
ES (1995)
IT (1995)
HU (2001)
SK (2000)
Percentage of samples exceedingfaecal streptococci standard
Percentage of samples exceedingfaecal coliform standard
0 1 2 3 4 5 6
(b)
(a) Source: European Commission. Member States’ returns under the reporting directive for the period 1993–95. Accession country data collected by EEA-ETC/WTR.

46 Europe's water: An indicator-based assessment
Policy question: Are the adverse effects of nutrients and organic pollution being reduced?
Notes: Latest year in brackets.
Nitrate in drinking water
In many EU countries, nitrate contamination is the most common problem identified in national reports. Excess nitrate in drinking water is of particular concern in terms of human health, infants in particular being vulnerable (see indicator on nitrate in groundwaters). It is often a particular problem in rural water supplies, the standards of which are not necessarily reported or well monitored since they often only serve small populations. For example, in Belgium 29 % of 5 000 wells examined had nitrate concentrations in excess of 50 mg/l nitrate, the drinking water directive standard (OECD, 1997).
In France, Germany and Spain, over 3 % of drinking water samples exceeded nitrate standards. The significance of these exceedances has, however, not been quantified, as there is no complementary information on the duration and level of exceedance, and on the number of people exposed. Shallow private wells fed by percolation from intensively farmed agricultural land are particularly vulnerable to nitrate pollution. The vulnerability of private supplies is illustrated by the situation in Lithuania in the mid-1990s where less than 1.5 % of samples taken from public water supplies exceeded the nitrate standard, whereas nearly 50 % of samples from private supplies exceeded the standard. In other accession countries, the shallow wells in central and southern Poland and Hungary are known to be contaminated, and in Bulgaria it is estimated that, in the early 1990s, up to 80 % of the population was exposed to nitrate concentrations greater than 50 mg/l (OECD, 1995).
Key messages:
! Nitrate in drinking water is a common problem across Europe, particularly from shallow wells
Figure 3.23 Percentage of samples exceeding nitrate standards in drinking water
0 0.5 1 1.5 2 2.5 3 3.5 4
% of exceeding samples
Spain (1995)France (1995)
Germany (1995)Slovak Rep. (2000)Czech rep. (2000)
Italy (1995)Hungary (2001)
Belgium (Wallonia, 1994)Ireland (1995)
UK (2000)Latvia (2001)
Netherlands (1995)Greece (1995)
0
00
Source: European Commission. Member States’ returns under the reporting directive for the period 1993–95. Accession country data collected by EEA-ETC/WTR from national state of environment reports.

Nutrients and organic pollution of water 47
Policy question: Are the adverse effects of nutrients and organic pollution being reduced?
Bathing water quality
The Bathing Water Directive (76/160/EEC) was designed to protect the public from accidental and chronic pollution which could cause illness from recreational water use. It lists a number of parameters to be monitored, but the focus is on bacteriological quality. Human enteric viruses are the most likely pathogens responsible for waterborne diseases from recreational water use but detection methods are complex and costly for routine monitoring, and so the main parameters analysed for compliance with the directive are indicator organisms; total and faecal coliforms. Compliance with the mandatory standards and guide levels for these indicator organisms does not therefore guarantee that there is no risk to human health. However, since contamination arises from the discharge of effluents and also from diffuse sources, it is indicative of the general water quality.
In 2001, 97 % of coastal and 93 % of inland bathing waters complied with the mandatory standards, and 90 % of coastal and 72 % of inland bathing waters met guide values. Of the EU countries, Greece and Italy had the highest percentage of coastal waters reaching the guide values, Belgium and Finland the lowest in 2001. Ireland and Denmark had the highest percentage of inland bathing waters reaching the guide values, and Portugal and Spain the lowest. Notes: EU-15 countries.
Notes: For Estonia, quality is quoted according to national standards rather than those in the directive.
Key messages:
☺ The quality of designated bathing waters (coastal and inland) has improved in Europe throughout the 1990s
! Despite this improvement, 10 % of Europe’s coastal and 28 % of inland bathing waters do not meet (non-mandatory) guide values
Compliance of (a) coastal and (b) inland bathingwaters with mandatory and guideline values of the
bathing water directiveFigure 3.24
0
10
20
30
40
50
60
70
80
90
100
1992 1993 1994 1995 1996 1997 1998 1999 2000 2001
Year
Mandatory Guide
Per
cent
age
com
plia
nce
0
10
20
30
40
50
60
70
80
90
100
Per
cent
age
com
plia
nce
1992 1993 1994 1995 1996 1997 1998 1999 2000 2001
Year
Mandatory Guide
(a)
(b)
Source: EU Member States’ annual reports to the European Commission.
Compliance in 2001 of (a) coastal and (b) inland waters bathing waters with mandatory and guideline valuesof the bathing water directive Figure 3.25
0 20 40 60 80 100
Estonia
Monaco
Greece
Malta
Italy
Germany
Spain
Ireland
Denmark
Portugal
Sweden
Netherlands
France
UK
Finland
Belgium
% compliance
Guide Mandatory
0 20 40 60 80 100
Ireland
DenmarkFinland
Sweden
GermanyAustria
ItalyEstonia
Netherlands
LuxembourgFrance
BelgiumGreece
UK
HungarySpain
Portugal
% compliance
Guide Mandatory
Source: EU Member States’ annual reports to the European Commission.Accession countries: EEA-ETC/WTR.

48 Europe's water: An indicator-based assessment
Policy question: Are the adverse effects of nutrients and organic pollution being reduced?
Notes: 314 lakes. Countries included, Austria, Denmark, Estonia, Finland, France, Germany, Hungary, Ireland, Lithuania, Norway, Poland, Portugal, Spain, Sweden.
Water transparency in lakes
High nutrient concentrations promote algal growth resulting in high turbidity. This is a nuisance to the recreational use of lakes for bathing, fishing and the immediate visual impression. Large amounts of algae also adversely affect the entire lake ecosystem.
Transparency of lake water is commonly measured using a Secchi disc. The white disc is lowered into the water and the depth at which it is no longer visible from the surface is recorded. The summer Secchi depth in eutrophic lakes is generally less than in lakes that are not eutrophic. This is because of phytoplankton growth in eutrophic lakes that blocks the light and decreases the clarity of the water. The average summer Secchi depth in European lakes has increased since the 1980s (Figure 3.26) indicating decreasing eutrophication in these lakes resulting from the decrease in point source phosphorus loads in particular.
Key messages:
☺ The quality of water in terms of transparency has improved in European lakes since 1980 because of a reduction in concentrations of phosphorus resulting from measures to reduce discharges of phosphorus from point and other sources
Figure 3.26 Average summer Secchi depth
0
10
20
30
40
50
60
70
80
90
100
1981– 8519 19 1986– 90 19 –1991 95 19 –2096 01
< 0.5 m0.5–1.5 m1.5–3.0 m3.0–6.0 m>6.0 m%
of
lake
s
Source: EEA Waterbase.

Nutrients and organic pollution of water 49
Policy question: Are the adverse effects of nutrients and organic pollution being reduced?
Chlorophyll in coastal and marine waters
The measurement of chlorophyll-a levels is another way of monitoring eutrophication since in summer phytoplankton primary production and chlorophyll-a concentration is, in most areas, nutrient limited. The phytoplankton biomass expressed as chlorophyll-a determines the light conditions in the water column and so also affects the distribution of benthic vegetation. However, due to variations in freshwater run-off and hydrogeographic variability of the coastal zone and internal cycling processes, trends in chlorophyll-a concentrations as such can not be directly related to measures taken to reduce nutrient inputs. Concentrations are generally highest in estuaries and close to river mouths or big cities, and lowest in open marine waters mirroring the pattern of nutrient concentrations. A decreasing trend has been observed at a few stations in Danish estuaries, and an increasing trend has been found at a few stations in Belgian, Finnish, Lithuanian and Swedish coastal waters (Figure 3.27).
Map 3.5 shows clear differences in the geographical distribution concentration levels of chlorophyll-like pigments, especially in the eastern and southern North Sea and in the Baltic Sea. There are also relatively high concentrations seen in the Black Sea close to the Danube delta.
Notes: Number of stations in brackets.Baltic Sea: Denmark, Finland, Lithuania, Sweden.North Sea: Belgium, Denmark, Netherlands, Norway, Sweden.Mediterranean Sea: Greece.Results of trend analyses applied to time series for the period 1985–2000 (stations with at least three years data in the period 1995–2000 and at least five years in total) are shown with a bar chart for each sea region.
Notes: Average spring-summer (April–September) concentrations of chlorophyll-like pigments in European seas as determined from SeaWiFS satellite observations. The concentration scale (µg/l) is valid only for oceanic waters and overestimates to a large and variable degree the chlorophyll concentrations in coastal seas and the entire Baltic Sea as a result of high concentrations of coloured dissolved organic material (gelbstoff).
Key messages:
% Generally no trend is observed in summer surface chlorophyll-a concentrations in the Baltic Sea, Greater North Sea or Greek coastal waters
Average summer chlorophyll-a concentrations inEurope’s seas Figure 3.27
Average spring-summer concentrations ofchlorophyll like pigments in European seas
determined from satellite observationsMap 3.5
0 20 40 60 80 100
Baltic Sea (69)
Skagerrak-North Sea (42)
MediterraneanSea (6)
% of stations
Decreasing No trend Increasing
Source: EEA. Data from Helcom, OSPAR and EEA member countries.
20002000
0.2 0.6 1.2 2 5 10 25 >Chlorophyll concentrations
Source: Joint Research Centre, compiled by the EEA (2001).

50 Europe's water: An indicator-based assessment
Policy question: Are the adverse effects of nutrients and organic pollution being reduced?
Notes: ASP = amnesic shellfish poisoning.DSP = diarrhetic shellfish poisoning.PSP = paralytic shellfish poisoning.Data from Denmark, France, Germany, Iceland, Ireland, Netherlands, Norway, Portugal, Spain, Sweden, United Kingdom.
Harmful phytoplankton in coastal waters
Nutrient enrichment from increasing inputs from human activities can lead to modification of the nitrogen, phosphorus and silicon ratios, which could lead to changes in species composition, particularly enhancing flagellates species, including the main toxic species (Dinophysis, Alexandrium, Gymnodinium). Among the numerous (over 6 000) phytoplankton species existing all over the world, several toxic or harmful species have been recorded. Some toxic species produce toxins that are directly toxic to marine fauna, and others produce toxins, which accumulate in shellfish, fish, etc. The latter may then subsequently be transmitted to humans and, through consumption of contaminated seafood, become a serious health threat.
The occurrence of harmful algae, which are widely distributed in marine and coastal waters, does not necessarily imply poisoning events. The understanding of interactions between the physical and biological processes leading to harmful blooms is currently an active field of research. Additionally, the monitoring of poisoning events used to be focused on shellfish production areas.
For European waters, over the last 10 years, shellfish-poisoning events show fluctuations between years without a general trend for diarrhetic shellfish poisoning, and paralytic shellfish poisoning. Amnesic shellfish poisoning occurrences seem to occur more frequently than in the past (Figure 3.28).
Over the 1989–98 period for Europe, amnesic shellfish poisoning events are the less frequent with only five years of occurrence and one peak of more than five events (in 1998). Recent indications tend to show that amnesic shellfish poisoning is increasing. Events have been recorded in France in 2000, which was never the case before. Paralytic shellfish poisoning events are regularly observed. Their numbers were particularly high over the 1993–96 period. Diarrhetic shellfish poisoning is the most common type of poisoning.
Key messages:
% There is no clear trend in shellfish poisoning events in European waters, though amnesic shellfish poisoning occurrences seem to occur more frequently than in the past
Figure 3.28 Shellfish poisoning events in European waters
0
5
10
15
20
25
30
35
1989 1990 1991 1992 1993 1994 1995 1996 1997 1998
ASP DSP PSP
Num
ber
of
even
ts
Source: ICES-IOC Haedat (Harmful algae event data base).

Nutrients and organic pollution of water 51
Policy question: Are the adverse effects of nutrients and organic pollution being reduced?
Oxygen in bottom layers of marine waters
When the oxygen concentration in bottom water is below 2 mg O2/l the conditions are described as hypoxic and most bottom dwelling organisms, which are unable to escape, die. Most of the organic material in the sediment arises from sedimentation of dead phytoplankton. Its degradation rate is dependent on temperature. Consequently, oxygen deficiency is mostly observed in summer and autumn when bottom water temperature is high. The supply of oxygen to the bottom water depends on the hydrographical conditions of the specific area (wind conditions, stratification, advection, tidal mixing, etc.). Marine areas with strong stratification and small advective transport are sensitive to oxygen deficiency.
The coastal waters of the North Sea are generally not impacted by hypoxic conditions due to strong tidal mixing. The deeper parts of the Baltic Sea are characterised by frequent or permanent hypoxic conditions, which can be ascribed to the low exchange of bottom waters. The majority of coastal stations are not affected by hypoxia, except for a few fjords and stratified coastal waters that are prone to hypoxia. In the Mediterranean Sea, both the Italian and Greek coasts appear to have a low frequency of hypoxia, except for the Gulf of Saronikos where hypoxic conditions were observed (> 20 %) at five stations, four of these at depths below 200 m.
The inner Danish marine waters are frequently impacted by oxygen depletion. In 2002, the oxygen depletion started unusually early and was more extensive than normal (Danish Ministry of the Environment, 2002). This was attributed to the high level of precipitation (increasing nutrient run-off) in January/February, and again in June/July, combined with a long, calm and warm summer period. This provided ideal conditions for phytoplankton growth. Decomposition of the dead algae used up the oxygen in the bottom waters. The oxygen depletion severely affected the benthic invertebrates in many places. In the short term this will have affected demersal fish and diving ducks for which the benthic invertebrates are a food resource.
Notes: Number of stations in brackets.North Sea: Belgium, Denmark, Norway, Sweden.Baltic Sea: Denmark, Estonia, Finland, Germany, Lithuania, Poland, Sweden.Mediterranean Sea: Greece, Italy.
Key messages:
% Generally no trend is observed in the frequency of low oxygen concentrations in the Baltic Sea, North Sea and Mediterranean Sea
! Low oxygen concentrations are a problem in specific estuaries with large inputs of nutrients and little mixing of the water column as well as in stratified coastal waters and in the deep troughs of the Baltic Sea and entire Black Sea
Trends in the frequency of low oxygenconcentrations in bottom waters of Europe’s seas Figure 3.29
North Sea (44)
Baltic Sea (124)
MediterraneanSea (4)
0 20 40 60 80 100% of stations
Decreasing No trend Increasing
Source: Data from ICES and NRC’s contributions to Marinebase.Results of trend analyses applied to time series for the period 1985–2000 (stations with at least three years data in the period 1995–2000 and at least five years in total) are shown with a bar chart for each sea region.EEA. Data from Helcom, OSPAR and EEA member countries.

52 Europe's water: An indicator-based assessment
Policy question: How effective are existing policies in reducing loading of nutrients and organic matter?
Notes: Numbers of cities next to parts of pie. Cities with more than 150 000 population equivalents.
Implementation of the urban waste water treatment directive
The Urban Waste Water Treatment Directive (91/271/EEC) is an important Community water policy and its aim is to protect the environment from the adverse effects of urban waste water discharges. The directive sets minimum standards for the collection, treatment and disposal of waste water dependent upon the size of the agglomeration, and the type and sensitivity of the receiving waters. The directive has some important deadlines. The following assessment of the implementation of the directive is based on the Commission’s report 2002 on Member States’ implementation of the directive.
By 30 June 1993, the directive had to be transposed into national law. Many Member States were late in transposing the directive, the last being Italy in 1999.
Member States were required to identify sensitive areas at the latest by 31 December 1993. Sensitive areas are surface waters which may become eutrophic if protective action is not taken; drinking waters with nitrate exceeding standards and areas where further treatment is required to comply with other directives (for example, bathing waters or
shellfish waters). Six Member States have decided to apply stringent (tertiary) treatment over all their territory (all sensitive areas); nine other Member States have identified certain water bodies in their territory as a sensitive area. These areas were identified, with a greater or lesser degree of delay, between 1994 and 1999.
By 31 December 1998, Member States were required to ensure that waste water treatment facilities with stringent (tertiary) treatment were available for all agglomerations with a population equivalent greater than 10 000 where the effluent was being discharged into a sensitive area. Major delays in implementing have been found in most Member States. Taking the 3 243 agglomerations in which Member States have decided to provide tertiary treatment out of some 20 000 agglomerations affected by the directive, only Denmark and Austria were in a situation very close to conformity on 31 December 1998 and eight countries were far from conformity. However, most Member States had plans to achieve conformity in these agglomerations over the next few years.
A large number of the 527 cities with more than 150 000 population equivalents did not have a sufficient standard of treatment by the end of 1998 (Figure 3.30). A total of 37 had no treatment at all, including Brussels, Milan and Porto; while a total of 57 others including Aberdeen, Athens, Barcelona, Dublin, Florence, Liège and Marseille were still discharging a large part of their effluents untreated or had a very clearly insufficient level of treatment in place. The situation is, however, generally improving and some of these cities made the necessary investment in 1999–2002, or plan to complete work soon.
Key messages:
! In 1998, only two EU countries were close to conforming to the requirement of the directive for their large agglomerations discharging into sensitive areas, and eight countries were far from conformity
! Many large cities did not have a sufficient standard of treatment to meet the objectives of the directive
Figure 3.30 Urban waste water treatment in cities in the EU
Treatment in large European cities
Secondary plus full tertiary treatment
Full secondary and full secondary with incompletetertiary treatment
Incomplete secondary treatment or primary treatment
No treatment
No information
78
57
37
134
221
Source: EC (2002a).

Nutrients and organic pollution of water 53
Policy question: How effective are existing policies in reducing loading of nutrients and organic matter?
Implementation of the nitrates directive
In 1991, the EU Member States adopted Council Directive 91/676/EEC concerning the protection of waters against pollution caused by nitrates from agricultural sources (the nitrates directive). This directive requires Member States to designate nitrate vulnerable zones and to establish action plans for the minimisation of agricultural nitrate leaching in these zones. These plans should cover aspects of agricultural nutrient management and application that are particularly relevant for nitrate leaching. Annexes II and III of the nitrates directive spell out the main types of actions to be taken by the Member States. These include measures such as periods of prohibition of fertiliser application, restrictions for application of manure on sloped or frozen soils, manure storage, crop rotation, buffer strips etc.
Implementation of the nitrates directive across the EU has been generally extremely poor, with all but two countries (Denmark and Sweden) having infringement proceedings brought against them at some stage since the directive came into force in 1991. However
considerable progress has been made in most Member States in developing action programmes for nitrate vulnerable zones during the first action plan period (except Ireland which, until 2001, had not designated any nitrate vulnerable zones). The total area of nitrate vulnerable zones in June 2001 covered currently 38 % of the EU-15 area. Based on the assessment of the European Commission, this area should increase to at least 46 %. Designation and revision of nitrate vulnerable zones is still in progress in Belgium, Greece, Ireland and the UK. However, none of the action plans fully comply with the obligations that are specified in the directive. Only five countries reach a mean score higher than one (partly satisfactory). Considerable further action is required to ensure effective protection of surface and groundwaters from agricultural nitrate pollution in a clear majority of EU Member States.
Notes: Adequacy of national action plans under the EU nitrates directive.Mean compliance score for 12 aspects of the action plans.0 = unsatisfactory1 = partly satisfactory2 = fully satisfactory.
Key messages:
☺ Considerable progress has been made in most Member States in developing action programmes for nitrate vulnerable zones
! However, none of the action plans fully comply with the obligations that are specified in the directive
Nitrate vulnerable zones and related action plans Map 3.6
Source: EC (2002b).
0 0,5 1 1,5 2
Belgium — FlandersBelgium — Wallonia
DenmarkGermany
GreeceSpain
FranceItaly
LuxembourgNetherlands
AustriaPortugalFinland
SwedenUnited Kingdom

54 Europe's water: An indicator-based assessment
3.4. References
Black Sea Commission (2002) State of the environment of the Black Sea: Pressures and trends 1996–2000. Preprint copy August 2002. www.blacksea-commission.org.
Danish Ministry of the Environment (2002) Oxygen depletion: Danish marine waters severely affected. Danish Environment Newsletter, No 19, November 2002, Danish Ministry of the Environment, Copenhagen.
EC (2002a) Implementation of Council Directive 91/271/EEC of 21 May 1991 concerning urban waste water treatment, as amended by Commission Directive 98/15/EC of 27 February 1998.
EC (2002b) Report COM(2002)407 The implementation of Council Directive 91/676/EEC concerning the protection of waters against pollution caused by nitrates from agricultural sources. Synthesis from year 2000 Member States reports
EEA (1999) State and pressures of the marine and coastal Mediterranean environment. Environmental issues series No 5, Copenhagen.
EEA (2000) Groundwater quality and quantity in Europe. Environmental assessment report No 3, Copenhagen.
EEA (2001) Eutrophication in Europe’s coastal waters. Topic report 7/2001, Copenhagen.
Helcom(2002) Helcom’s fourth periodic assessment of the state of the marine environment of the Baltic Sea, 1994–98. Helsinki Commission, Helsinki.
North Sea Progress Report (2002) Fifth International Conference on the Protection of the North Sea, 20–21 March 2002, Bergen, Norway
OECD (1995) Environmental Performance Review, Bulgaria.
OECD (1997) Environmental Performance Review, Belgium.
Scottish Environment Protection Agency (SEPA). Annual Report 1999/2000. http://www.sepa.org.uk/publications/annual_report/9900/index.htm.
UBA, Vienna (2001) Umweltsituation in Österreich, Wien.

Hazardous substances 55
4. Hazardous substances
4.1. Background to the issue
Chemicals bring about benefits on which modern society is entirely dependent, for example, in food production, medicines, textiles, cars etc. They also make a vital contribution to the economic and social well-being of citizens in terms of trade and employment. The global production of chemicals has increased from 1 million tonnes in 1930 to 400 million tonnes today. We have about 100 000 different substances registered in the EU market, of which 10 000 are marketed in volumes of more than 10 tonnes, and a further 20 000 are marketed at 1 to 10 tonnes (12). Some of these will end up in the aquatic environment by use or during production. Many of the substances are potentially harmful to aquatic organisms and to humans through drinking water or by exposure during recreational activities.
The water framework directive (WFD) definition of hazardous substances is as follows.
‘Hazardous substances means substances or groups of substances that are toxic, persistent and liable to bio-accumulate; and other substances or groups of substances which give rise to an equivalent level of concern’.
The definition is very similar to those used by the Commissions that administer the Conventions covering the north-east Atlantic Ocean (OSPAR) and the Baltic Sea (Helcom).
Elevated concentrations of hazardous substances have been found in many of our waters, such as pesticides in groundwater, heavy metals in rivers and hazardous substances in coastal and more open marine water, in particular near point sources of pollution. Once there, some of these substances may be concentrated as they move up through the food chain. Ecological and health impacts of hazardous substances are complex and may include birth defects, cancers, and damage to nervous, reproductive and immune systems and may affect the different parts of the ecosystem.
Emissions of hazardous substances can be from point sources such as discharges from industries, waste water treatment plants, landfills, contaminated land and storage tanks and the burning of fossil fuels, or they can be oil from ships and off-shore installations, or may be related to more diffuse sources such as the use of pesticide or anti-fouling treatment on ships.
A number of initiatives are tackling these problems at global, European, national and regional levels, with some marine conventions providing binding legal frameworks and targeting zero emissions for several hazardous substances by 2020. The measures are generally focused on the banning or phasing-out of the most dangerous substances and a reduction in emissions by waste water treatment or cleaner technologies.
EU policies relevant to these indicators include:
• the Water Framework Directive (2000/60/EC) which requires the achievement of a good ecological status and good ecological potential of water bodies across the EU by 2015;
• the Dangerous Substances Directive (76/464/EEC) (which is being phased out as the WFD is implemented);
• the Integrated Pollution Prevention and Control Directive (96/61/EC) which aims to control and prevent pollution to water by reducing or eliminating emissions from industry; and
• the Drinking Water Directive (98/83/EC).
4.2. Indicators used
The DPSIR framework for assessing hazardous substances in water is shown in Figure 4.1. The text in yellow shows those indicators used in this chapter.
(12) White Paper on the strategy for a future chemicals policy COM(2001) 88.

56 Europe's water: An indicator-based assessment
4.3. Assessments by indicator
A relatively small number (compared to the number of chemicals used) of the most hazardous substances have been regulated at an EU level (dangerous substances directive, List I and List II substances) since the 1970s and 1980s. As a result, emissions and loads of these substances to air and water, and hence to the sea, have largely decreased since the mid-1980s in the EU. This reduction has led to decreases in concentrations of some heavy metals in the water of some European rivers, and in mussels at some locations in the north-east Atlantic Ocean and Mediterranean Sea. However, environmental quality standards are still exceeded for some List I and List II substances at locations in some rivers, and concentrations above limits for human consumption are still found in marine mussels and fish from estuaries of major rivers, near some industrial point discharges and in some harbours, and in fish in a few Nordic lakes.
The agricultural sector is a major user of pesticides. Pesticide consumption has remained relatively stable in EU countries in the 1990s. Consumption is lower in the accession countries, but has decreased reflecting the economic restructuring in these countries. Pesticides occur in surface waters and groundwaters at concentrations that are of potential concern for drinking water and aquatic organisms. This is reflected by many countries reporting pesticides (and
metals) as being a problem for their supply of drinking water.
The oil production and refining industry is a significant sector in terms of marine pollution. Oil pollution is a problem in Europe’s seas with, in particular, the Black Sea considered as being severely polluted near ports and around river mouths. Total (regulated) discharges from refineries in the EU (and Norway) have decreased during the 1990s even though oil production increased. However, the (larger) discharges from offshore installations show no clear trend. Oil pollution also arises from illegal discharges to the sea and from accidental oil spills. The former appear to be slowly decreasing in the North Sea, but remain steady in the Baltic Sea. There is no equivalent information for the Black and Mediterranean Seas. Also of major concern are the catastrophic accidental oil spills that still occur at irregular intervals in Europe’s seas.
There is a serious lack of information at a European level on the presence, concentration and effects of the many other potentially hazardous substances in water. For example, the presence and effects of endocrine-disrupting substances in water is an issue of emerging concern. Table 4.1 summarises the assessments as answers to main policy questions. More detailed information and assessments then follow in the subsequent pages and indicator factsheets.
Figure 4.1 DPSIR framework for assessing hazardous substances in water
Exceedance of drinking water standards
standardsBiological effects on aquatic organisms
Exceedance of environmental quality
DrivingForces
Pressures
Responses
ImpactsState
Implementation of EU policy framework
Emissions to airPoint source emissionsLoads to coastal waters
Accidental spills, illegal andregulated
Discharges of oilHazardous substances
in rivers, lakes and groundwater,and in marine
organisms
IndustryEnergy
AquacultureHouseholds
Transport and energy
Agriculture — pesticides

Hazardous substances 57
Assessment of progress in meeting policy objectives in terms of hazardous substances Table 4.1
Policy question Indicators Assessment
Is pollution of waters with hazardous substances decreasing?
• Are pollution levels with hazardous substances such as priority substances including pesticides decreasing?
Heavy metals in rivers ☺ The concentrations of the heavy metals regulated by the dangerous substances directive is decreasing in some European rivers where data series are available
Hazardous substances in lakes ! Based on data from the Nordic countries there are elevated concentrations of heavy metals and organic micropollutants in several lakes. In a few cases, fish are so contaminated that it is recommended they are not eaten
☺ The concentrations of banned substances such as PCB and DDT appear to be decreasing
Are discharges of hazardous substances from sectors decreasing?
• Are direct and riverine loads to seas increasing/decreasing?
Loads of hazardous substances to seas
☺ Direct and riverine inputs of cadmium, mercury, lead, zinc, lindane and PCBs into the north-east Atlantic have decreased between 1990 and 1999
☺ Atmospheric inputs of cadmium, lead and mercury into the North Sea have decreased between 1987 and 1995
☺ The loads of many hazardous substances to the Baltic Sea have been reduced by at least 50 % since the late 1980s
! There is very limited information on the loads entering the Mediterranean and Black Seas, and none on how these have changed over recent years
• In which sectors are discharges of hazardous substances increasing/decreasing?
Sources of metals discharged to the North Sea
☺ There have been significant reductions in the discharges/releases to water of some heavy metals from sectors in most North Sea countries, in particular from industrial activities and waste disposal. The reductions achieved for the agricultural and transport and infrastructure sectors were generally smaller
☺ There have also been significant reductions in the emissions to air of some heavy metals from the most important (in terms of relative loads) sectors in some North Sea countries, in particular from industrial activities and waste disposal. There have also been very significant reductions in lead emissions to air from the transport sector
• In which sectors are discharges of hazardous substances increasing/decreasing?
Sources of organic substances discharged to water
☺ There have been significant decreases in the emissions to air and water of dioxins and PAHs from most sectors in some North Sea countries between 1985 and 1999. This is particularly so for the industrial sector (water — dioxins and PAHs, air — PAHs), waste disposal (air — dioxins), small and medium enterprises (air — PAHs) and transport (air — PAHs)
% Over the last decade, the loads of some other organic substances, however, have remained relatively stable in some countries, for instance the Netherlands
• Is the agricultural sector reducing water pollution caused by pesticides?
Consumption of pesticides % Pesticide consumption per hectare of arable land in the EU decreased in the early 1990s but then rose again in the mid-1990s so that 1996 values were still similar to 1990
☺ Consumption in the accession countries steadily declined between 1993 and 1998 due to economic restructuring

58 Europe's water: An indicator-based assessment
• Are we reducing discharges from oil installations and ships and eliminating illegal discharges from these sources?
Accidental oil spills from marine shipping
% Major accidental oil tanker spills still occur at irregular intervals in European seas
Illegal discharges of oil to sea % The number of illegal oil spills has slowly decreased in the North Sea, but remains steady in the Baltic Sea. No aerial surveillance is conducted over the Mediterranean and the Black Seas
Discharge of oil from refineries and offshore installations
☺ Despite increased oil production, oil discharges from offshore installations and coastal refineries in the EU show no clear trend
Do present-day concentrations of hazardous substances have unacceptable impacts on human health and the environment?
• Is water intended for human consumption (drinking water) wholesome and clean (free of hazardous substances such as pesticides and lead)?
Hazardous substances in drinking water
! Pesticide and metal contamination of drinking water supplies has been identified as a problem in many European countries
• Do the levels of man-made chemicals give rise to significant risks to, and impacts on, human health and the environment?
Non-compliance with EU environmental quality standards
! Levels of List I substances in rivers are generally below EU environmental quality standards
! The monitoring of hazardous substances in surface waters is very variable between countries and it is as a result very difficult to draw conclusions about current concentrations and trends
• Are we reducing the impact of pesticides on surface water and groundwater?
Pesticides in surface water and groundwater
! Pesticides occur in surface waters and groundwaters at levels that are of potential concern for the supply of drinking water and because of adverse effects on aquatic organisms
Hazardous substances in marine organisms
☺ Concentrations of some hazardous substances are decreasing in marine organisms at some monitoring stations in the Mediterranean and Baltic Seas, and the north-east Atlantic Ocean in response to measures to reduce the inputs of these substances to these seas
% However, concentrations of some substances remained constant, despite the measures taken
! Contaminant concentrations above limits for human consumption are still found in mussels and fish, mainly from estuaries of major rivers, near some industrial point discharges and in some harbours
• Are there indications of negative trends in the aquatic ecosystem due to contamination by hazardous substances (for example, endocrine disruptors, TBT and intersex in snails, oiled sea birds)?
Biological effects of hazardous substances on aquatic organisms
! The presence of endocrine disrupting chemicals in the aquatic environment has been linked with sexual disruption of aquatic animals, and is an emerging issue of concern
Policy question Indicators Assessment

Hazardous substances 59
Policy question: Is pollution of waters with hazardous substances decreasing?
Heavy metals in rivers
Since the Industrial Revolution, humans have been releasing metals into the environment in damaging quantities. Aquatic ecosystems are particularly sensitive to such pollution since their food chains generally contain more trophic levels than on land and so bioaccumulation is enhanced.
Concentrations of cadmium and mercury have decreased in rivers in the EU since the late 1970s, reflecting the success of measures to eliminate pollution of these two List I substances under the dangerous substances directive (Figure 4.2). However, this information should be treated with some caution as the data are from relatively few stations and may not be representative. The dangerous substances directive also requires the pollution of List II substances to be reduced. List II metals include zinc, copper, nickel, chromium and lead. Data from the Rhine and Elbe indicate that the levels of some of these metals have also been reduced since the late 1980s (Figure 4.3).
In the Rhine, levels of certain heavy metals were reduced by between 50 and 90 % by the end of the 1980s compared with the early 1970s, though the Rhine is still subject to sizeable inputs of pollutant substances. This reduction was achieved by the control and reduction of point sources of these metals, and had a positive impact on aquatic communities in the Rhine.
In the Elbe, there have been considerable reductions in inputs of almost all substances, mainly as a result of the drastic drop in production and of factory closures but also due to the construction and modernisation of sewage treatment plants. However, heavy metal pollution is still high. The reduction in mercury was due primarily to the discontinuation of the amalgam process for chloride production in two factories in the new German Länder and the Czech Republic, and to remediation of existing contaminated sites.
Notes: Average of country annual average concentrations. In less polluted areas in, for example, Nordic countries, concentrations of cadmium and mercury are only 10 and 1 % of these values.Cadmium data from Belgium, Germany, Ireland, Luxembourg, Netherlands, UK.Mercury data from Belgium, France, Germany, Ireland, Netherlands, UK.
Key messages:
☺ The concentrations of the heavy metals regulated by the dangerous substances directive are decreasing in some European rivers where data series are available
Concentration of cadmium and mercury at riverstations Figure 4.2
Concentration of heavy metals in the rivers Rhineand Elbe Figure 4.3
0
0.2
0.4
0.6
0.8
1
1.2
1.4
1.6
1.8
0
0.05
0.1
0.15
0.2
0.25
Cadmium Mercury
1977
1979
1981
1983
1985
1987
1989
1991
1993
1995
Mer
cury
µg
/I
Cad
miu
m µ
g/I
Source: EU Member State returns under the exchange of information decision.
120
100
80
60
40
20
0
Rel
ativ
e to
1992
1988 1990 1992 19961994 1999
Rhine at Kleve-Bimmen
Cadium Zin
cLe
ad
Mer
cury
Copper
Chrom
ium
Nickel
1988 1990 1992 19961994 1999
Mer
cury
Copper
Chrom
ium Zinc
Nickel
Lead
Cadm
ium
Rel
ativ
e to
1992
Elbe at Schnackenburg180160140120100
80604020
0
Source: UBA (2001)
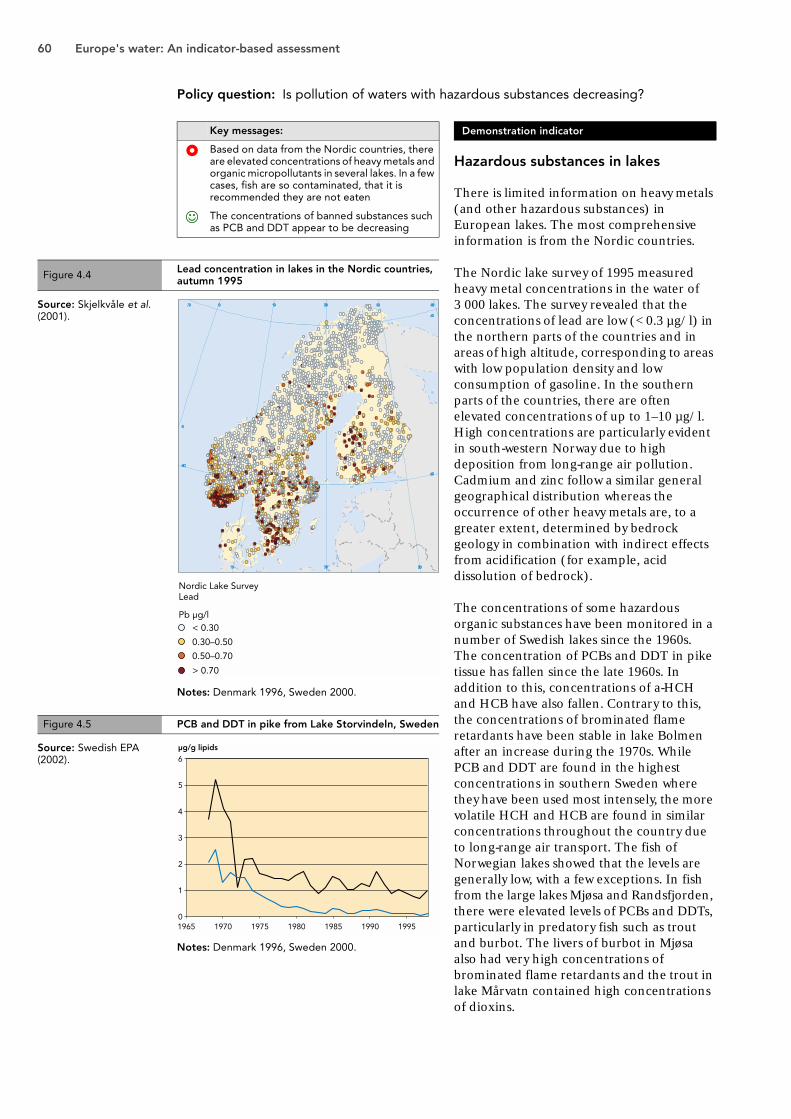
60 Europe's water: An indicator-based assessment
Policy question: Is pollution of waters with hazardous substances decreasing?
Notes: Denmark 1996, Sweden 2000.
Notes: Denmark 1996, Sweden 2000.
Hazardous substances in lakes
There is limited information on heavy metals (and other hazardous substances) in European lakes. The most comprehensive information is from the Nordic countries.
The Nordic lake survey of 1995 measured heavy metal concentrations in the water of 3 000 lakes. The survey revealed that the concentrations of lead are low (< 0.3 µg/l) in the northern parts of the countries and in areas of high altitude, corresponding to areas with low population density and low consumption of gasoline. In the southern parts of the countries, there are often elevated concentrations of up to 1–10 µg/l. High concentrations are particularly evident in south-western Norway due to high deposition from long-range air pollution. Cadmium and zinc follow a similar general geographical distribution whereas the occurrence of other heavy metals are, to a greater extent, determined by bedrock geology in combination with indirect effects from acidification (for example, acid dissolution of bedrock).
The concentrations of some hazardous organic substances have been monitored in a number of Swedish lakes since the 1960s. The concentration of PCBs and DDT in pike tissue has fallen since the late 1960s. In addition to this, concentrations of a-HCH and HCB have also fallen. Contrary to this, the concentrations of brominated flame retardants have been stable in lake Bolmen after an increase during the 1970s. While PCB and DDT are found in the highest concentrations in southern Sweden where they have been used most intensely, the more volatile HCH and HCB are found in similar concentrations throughout the country due to long-range air transport. The fish of Norwegian lakes showed that the levels are generally low, with a few exceptions. In fish from the large lakes Mjøsa and Randsfjorden, there were elevated levels of PCBs and DDTs, particularly in predatory fish such as trout and burbot. The livers of burbot in Mjøsa also had very high concentrations of brominated flame retardants and the trout in lake Mårvatn contained high concentrations of dioxins.
Key messages:
! Based on data from the Nordic countries, there are elevated concentrations of heavy metals and organic micropollutants in several lakes. In a few cases, fish are so contaminated, that it is recommended they are not eaten
☺ The concentrations of banned substances such as PCB and DDT appear to be decreasing
Figure 4.4 Lead concentration in lakes in the Nordic countries, autumn 1995
Figure 4.5 PCB and DDT in pike from Lake Storvindeln, Sweden
Nordic Lake SurveyLead
Pb g/lµ< 0.30
0.30–0.50
0.50–0.70
> 0.70
Source: Skjelkvåle et al. (2001).
6
5
4
3
2
1
0
µg/g lipids
1965 1970 1975 1980 1985 1990 1995
Source: Swedish EPA (2002).
Demonstration indicator

Hazardous substances 61
Policy question: Are discharges of hazardous substances from sectors decreasing?
Loads of hazardous substances to seas
The North Sea Conferences had set a target of a 50 to 70 % reduction in releases (discharges, emissions and losses) to water and air of several hazardous substances between 1985 and 1995. They further agreed on the one-generation cessation target (2020), which has also been adopted by the OSPAR Commission for the protection of the north-east Atlantic.
Helcom adopted a recommendation in May 2001 for the cessation of hazardous substance discharges/emissions by 2020 (Helcom, 2001a), with the ultimate aim of achieving concentrations in the environment near to background values for naturally occurring substances and close to zero for man-made synthetic substances.
The Mediterranean action plan has three protocols which control pollution to the sea, including the input of hazardous substances. The land-based sources protocol requires parties to eliminate pollution from certain hazardous substances and strictly limit pollution from others. Article VI of the Bucharest Convention aims to prevent pollution of the Black Sea by hazardous substances and matter.
The reduction in direct and riverine loads, and atmospheric inputs of some metals to the north-east Atlantic and North Sea (Figure 4.6), respectively, reflect the emission-reduction targets set by OSPAR, the implementation of the dangerous substances directive and the air pollution abatement policies in the countries surrounding the North Sea. The loads of many hazardous substances discharged to the Baltic Sea have been reduced, mainly due to the effective implementation of environmental legislation, the substitution of hazardous substances with harmless or less hazardous substances, and technological improvements (Helcom, 2001a; 2001b). In Estonia, Latvia, Lithuania, Poland and the Russian Federation, reductions have been mainly due to the economic crisis and the restructuring of manufacturing industry (Source: Helcom web page) as well as implementation of environmental legislation.
Notes: Loads relative to 1990.
In the Mediterranean, there is no available information of how loads of hazardous substances have changed over time. The Mediterranean action plan has estimated that riverine discharges to the Mediterranean are the largest source of mercury (92 %), lead (66 %), chromium (57 %) and zinc (72 %), though direct industrial discharges from the coastal zone are also significant (around 30 % of total) for chromium and lead.
Key messages:
☺ Direct and riverine inputs of cadmium, mercury, lead, zinc, lindane and PCBs into the north-east Atlantic have decreased between 1990 and 1999
☺ Atmospheric inputs of cadmium, lead and mercury into the North Sea have decreased between 1987 and 1995
☺ The loads of many hazardous substances to the Baltic Sea have been reduced by at least 50 % since the late 1980s
! There is very limited information on the loads entering the Mediterranean and Black Seas, and none on how these have changed over recent years
Direct and riverine inputs (a) into the north-eastAtlantic and (b) atmospheric inputs into the NorthSea of some heavy metals and organic substances
Figure 4.6
0
20
40
60
80
100
120
1991
1992
1993
1994
1995
1996
1997
1998
1999
Cadmium Mercury LeadZinc Lindane PCB7
0
50
100
150
200
250
Cadmium Mercury Lead
1990
1989
1988
1987
1995
1990
1991
1992
1993
1994
% r
elat
ive
to 1
99
0 lo
ads
% o
f lo
ads
in 1
99
0
(a)
(b)
Source: OSPAR (2000).

62 Europe's water: An indicator-based assessment
Policy question: Are discharges of hazardous substances from sectors decreasing?
Notes: Waste disposal includes municipal waste water.Discharges to water based on: Mercury: Denmark, Germany, Norway, Netherlands, Sweden. Cadmium: Denmark, Germany, Norway, Netherlands, Sweden. Lead: Denmark, Norway, Netherlands, Sweden. Copper: Germany, Norway, Netherlands, Sweden.
Notes: Waste disposal includes municipal waste water.Emissions to air based on: Mercury: Belgium, Norway, Netherlands, Sweden.Cadmium: Norway, Netherlands, Sweden.Lead: Norway, Netherlands, Sweden.Nickel: Denmark, Norway, Netherlands, Sweden.
Sources of metals discharged to the North Sea
North Sea States have met the 50 % reduction target for discharges/releases to water for a large number of the 37 North Sea Conference priority substances, and most also achieved the 70 % reduction target for mercury, cadmium and lead. However for some other substances, such as copper, targets were not consistently met. Industrial activities were the largest source of mercury, cadmium, lead and copper in 1985, and there had been significant reductions in all these metals by 1999 (99, 96, 98 and 88 %, respectively). Waste disposal was the second most important source of mercury, cadmium and copper in 1985, and again there had been significant decreases in loads to water by 1999 (54, 75 and 38 %, respectively). Waste disposal was the largest source of mercury, cadmium and lead, and a significant source of copper in 1999. Agricultural activities were also significant sources of these metals in 1985 and there had been reductions in the discharges of mercury (20 %), cadmium (32 %) and lead by 1999 (62 %), though in the case of copper there was an increase of 80 %. There had also been increases (108 %) in the releases of copper from transport and infrastructure over this period.
Atmospheric deposition is a source of heavy metals in marine waters, and thus the control and reduction of emissions to air is of relevance to the status of Europe’s seas. Industrial activities are major sources of mercury, cadmium, lead and nickel emissions to air though there were significant reductions (71, 82, 75 and 56 %, respectively) between 1985 and 1999 in releases from some North Sea countries. There have also been significant reductions of emissions of mercury (90 %), cadmium (95 %) and lead (97 %) from waste disposal. Transport and infrastructure was the largest source of lead and a major source of nickel in 1985, but whereas there had been a very significant reduction (99.8 %) in lead emissions by 1999, there had only been a 16 % reduction in nickel emissions. Lead emissions reduced from the transport sector as a result of the decrease in the use of leaded petrol.
Reductions have been achieved through the implementation of measures such as: the substitution of hazardous substances with less or non-hazardous substances; the banning of the use of substances; the development and application of best available techniques/best environment practice; development and use of clean technology; environmental taxes and voluntary agreements to reduce use.
Key messages:
☺ There have been significant reductions in the discharges/releases to water of some heavy metals from sectors in most North Sea countries, in particular from industrial activities and waste disposal. The reductions achieved for the agricultural and transport and infrastructure sectors were generally smaller
☺ There have also been significant reductions in the emissions to air of some heavy metals from the most important (in terms of relative loads) sectors in some North Sea countries, in particular from industrial activities and waste disposal. There have also been very significant reductions in lead emissions to air from the transport sector
Figure 4.7 Metal discharges to water in North Sea countries by source
Figure 4.8 Air emissions of metals in North Sea countries by source
0
20
40
60
80
100
Hg-1985
Hg-1999
Cd-1985
Cd-1999
Pb-1985
Pb-1999
Cu-1985
Cu-1999
Building materialsContaminated land and sedimentsIndustrial activities(covered by IPPC Directive)Households
Transport and infrastructureWaste disposalSmall and medium enterprisesAgricultural activities
% o
f to
tal l
oad
in 1
98
5Source: North Sea Progress Report, 2002.
0
20
40
60
80
100
% o
f 1
98
5 lo
ad
Hg-1985
Hg-1999
Cd-1985
Cd-1999
Pb-1985
Pb-1999
Ni-1985
Ni-1999
Building materialsContaminated land and sedimentsIndustrial activities(covered by IPPC Directive)Households
Transport and infrastructureWaste disposalSmall and medium enterprisesAgricultural activities
Source: North Sea Progress Report, 2002.

Hazardous substances 63
Policy question: Are discharges of hazardous substances from sectors decreasing?
Sources of organic substances discharged to water
The North Sea Conferences had agreed a 50 % reduction for 36 substances, most of which were organic substances. The largest reductions in discharges of dioxins and PAHs to water have been achieved in industry, though this remains the most important source for PAHs (Figure 4.9). For dioxins, waste disposal was the most significant source of air emissions in 1985 followed by households and industry. In 1999, there had been significant decreases in all sectors with industry as the most important source. For PAHs, industry was the most important source in 1995 and 1999 with small and medium enterprises, transport and households also being significant sources of emissions to air.
In the Netherlands, there have been significant reductions in the emissions of most of the substances monitored including hexachlorobutadiene, drins and PAHs but others such as xylene and ethylbenzene have remained relatively stable (Figure 4.10).
Notes: Based on data from:Water: Dioxins: Netherlands, Norway. PAH: Belgium, Netherlands, Norway. Air: Dioxins: Netherlands, Norway, Sweden. PAH: Belgium, Netherlands, Norway, Sweden.
Notes: The data includes emissions into sewers (indirect) plus those into surface waters (direct).
Key messages:
☺ There have been significant decreases in the emissions to air and water of dioxins and PAHs from most sectors in some North Sea countries between 1985 and 1999. This is particularly so for the industrial sector (water — dioxins and PAHs, air — PAHs), waste disposal (air — dioxins), small and medium enterprises (air — PAHs) and transport (air — PAHs)
% Over the last decade, the loads of some other organic substances, however, have remained relatively stable in some countries, for instance, the Netherlands
Main sources of (a) discharges to water and (b) emissions to air of dioxins and PAHs in
North Sea countries in 1985 and 1999Figure 4.9
Emissions of organic substances into water in theNetherlands Figure 4.10
0
20
40
60
80
100
Dioxins-1985
Dioxins-1999
PAHs-1985
PAHs-1999
% o
f 19
85 lo
ad
Dioxins-1985
Dioxins-1999
PAHs-1985
PAHs-1999
0
20
40
60
80
100
% o
f 19
85 lo
ad
(a) Water
(b) Air
Building materialsContaminated land and sedimentsIndustrial activities(covered by IPPC Directive)Households
Transport and infrastructureWaste disposalSmall and medium enterpriseAgricultural activities
Building materialsContaminated land and sedimentsIndustrial activities(covered by IPPC Directive)Households
Transport and infrastructureWaste disposalSmall and medium enterpriseAgricultural activities
Source: North Sea Progress Report 2002.
40
60
80
100
20
0
Rela
tive
to
1990
1990 1995 1998 1999 2000
Trich
loor
-
ethe
ne
Hexac
hloor
-
butad
iene
DRINS
Benzo
(a)-
pyren
ePA
H
1.1.
1 Tr
ichlo
or-
etha
ne
80
120
160
200
40
0
Rela
tive
to
1990
1990 1995 1998 1999 2000
Fluor
-
anth
ene
1.2
Dichlo
or-
etha
ne
Benze
ne
Tolue
ne
Xylene
sEt
hyl-
benze
ne
Source: Dutch Environmental Data Compendium 2001.

64 Europe's water: An indicator-based assessment
Policy question: Are discharges of hazardous substances from sectors decreasing?
Notes: It is important to note that these figures are mostly based on sales and for many countries actual pesticide consumption correlates closely with fluctuations in crop production. In agriculture, different types of pesticides are used for different crops. For example, greater volumes of fungicides tend to be applied for viticulture and greater volumes of herbicides for cereal crops.EU countries: Austria, Denmark, Finland, Germany, Netherlands, Portugal, Spain, Sweden, United Kingdom.Accession countries: Czech Republic, Estonia, Latvia, Poland, Romania, Slovenia, Slovak Republic.
Consumption of pesticides
Pesticides contribute to agricultural productivity but can be harmful to humans and the environment depending greatly on the toxicity of individual pesticides. The main source of pesticide pollution of water is from agriculture, but pollution also occurs from industrial discharges, pollution incidents, sewage treatment works, urban run-off and anti-fouling paints (particularly in coastal areas).
There has been a trend towards using active ingredients that are effective at lower concentrations. The reduction in pesticide consumption in accession countries was due to the economic transition in these countries that, in many cases, ended national support for farmers and saw an end to subsidies. However, some accession countries have recently seen a slight rise in the use of pesticides, but levels are still much lower than pre-economic transition. For example, in the Czech Republic, 4 302 t of pesticide active ingredients were used in 2000, compared to 8 920 t of active ingredient in 1990 (Czech Ministry of the Environment, 2001).
Map 4.1 shows the pesticide use per unit area of arable land for the latest year for which data is available. Generally consumption is higher in western Europe than in Nordic or eastern Europe. However, it is important to note that the total consumption figures are dominated by sulphur and copper products that are used in vineyards, orchards and on organic farms (European Commission, 2000).
Key messages:
% Pesticide consumption per hectare of arable land in the EU decreased in the early 1990s but then rose again in the mid-1990s so that 1996 values were still similar to 1990
☺ Consumption in the accession countries steadily declined between 1993 and 1998 due to economic restructuring
Figure 4.11 Pesticide consumption in EU and accession countries
1.5
2
2.5
kg a
ctiv
e in
gre
die
ntp
er h
a ar
able
land
1988 1990 1992 1994 1996 1998 2000
1
0.5
0
EU AC
Source: FAO.

Hazardous substances 65
Notes: Years: 1996 EU and 1998 accession countries
Use of herbicides, insecticides and fungicides across Europe Map 4.1
Source: FAO.

66 Europe's water: An indicator-based assessment
Policy question: Are discharges of hazardous substances from sectors decreasing?
Notes: Data are for spills above seven tonnes per spill. The mass of oil spilt is approximate, as some records do not contain the exact amount of oil spilt, but shows that there were less major spills from 1994 onwards than in the early 1990s.
Accidental oil spills from marine shipping
Oil spills to marine areas have a significant impact on environmental quality affecting all aspects of marine ecosystems. The consistency of oil can cause surface contamination and smothering of marine biota. In addition, its chemical components can cause acute toxic effects and long-term accumulative impacts. Marine life may also be affected in clean-up operations, either directly or through physical damage to marine and coastal habitats. Natural recovery is possible, but the time required depends on the size of spill. In the case of large accidental spills, expensive clean-up operations and programmes to save marine sea birds and sea life are required. The impacts of accidental spills can be catastrophic on coastal zones that are often sites designated for their high ecological quality. Spills can also have severe repercussions for tourism, aquaculture and fisheries in affected areas.
Key messages:
% Major accidental oil tanker spills still occur at irregular intervals in European seas
Figure 4.12 Accidental oil spills from tankers, combined carriers and barges in European seas
2 628250171109
3 7870
20 000
40 000
60 000
80 000
100 000
120 000
140 000
160 000
1989
1990
1991
1992
1993
1994
1995
1996
1997
1998
1999
2000
2001
Tonn
es
Source: 1990–98, Eurostat, based on data from ITOPF; 1999–2001, ITOPF.
Map 4.2 Large accidental oil spills from tankers in European seas
Source: EEA (2002) based on ITOPF data.

Hazardous substances 67
The indicator shows reported oil spills (greater than seven tonnes per spill) in the north-east Atlantic, Baltic and Mediterranean Seas (Figure 4.12). It provides a partial indication of the total amount of oil released to the marine environment from the transport of oil. The International Tanker Owners Pollution Federation (ITOPF) estimates that 83 % of the nearly 10 000 ship-related oil spill incidents are of a size less than seven tonnes. A few very large accidents are responsible for a high percentage of the oil spilt from maritime transport. For example, during the period 1990–99, from all the 346 accidental spills over seven tonnes, totalling 830 000 tonnes, just over 1 % of the accidents produced 75 % of the spilt oil volume. Thus the figures for a particular year may be determined by a single accident.
Oil production and consumption is increasing, as are net imports of oil to the EU, which increases the risk of oil spills. More rapid introduction of double hulls for tankers will help to reduce this risk. This is demonstrated by the break-up of the single hulled Prestige, carrying 77 000 tonnes of oil, off the north-west coast of Spain on 19 November 2002.
There is much sea-borne trade of oil in the Mediterranean Sea. Between 1987 and the end of 1996, an estimated 22 000 tonnes of oil were spilt as the result of shipping incidents (EEA, 1999). Oil spills from accidents at sea in the Black Sea are relatively small compared with the inputs of oil from domestic and industrial land-based sources and from the river Danube. However, the Black Sea is severely polluted with oil from illegal discharges (see next page for further details).

68 Europe's water: An indicator-based assessment
Policy question: Are discharges of hazardous substances from sectors decreasing?
Illegal discharges of oil to sea
The main sources of oil pollution in the marine environment are maritime transport, coastal refineries and offshore installations, land-based activities (either discharging directly or through riverine inputs) and atmospheric deposition.
No reliable data sources exist at present for marine oil pollution from land-based activities and atmospheric deposition. Illegal oil discharges from ships and offshore platforms are regularly observed at sea.
Oil pollution from illegal discharges tends to be a greater problem than from accidents since it is widespread and occurs continuously in offshore waters. Accidents involve a larger amount of oil but cause local impact which, on the other hand, receives high public attention when it reaches coastal waters. Specific aerial surveillance is
conducted over ‘special areas’ defined by international conventions. The annual frequency of observed oil slicks from aerial surveillance in maritime areas in the EU is a useful indicator of the trends in illegal oil discharges.
All discharges of oil are prohibited in the North Sea, Baltic Sea and Mediterranean, which are designated as International Maritime Organisation ‘special areas’. Aerial surveillance is conducted in order to prevent and detect any violation of these regulations from ships and platforms. In the North Sea, the number of oil slicks declined between 1990 and 2000. The high frequencies in 1997 and 1998 are due to methodological discrepancies where one country reported very small oil spills (less than 1 m3). The North Sea has been designated an IMO/Marpol special area only since 1 August 1999. In the Baltic Sea, the number of oil spills is more constant, showing little change in shipping habits of oil discharge.
No data on hydrocarbon pollution is available for the north-east Atlantic Ocean. Hydrocarbon pollution in the French and Italian Mediterranean areas of responsibility exceed 200 slick occurrences per year. But the data are available only at national level and are not commonly reported under the Barcelona Convention. There is no other report for the Mediterranean Sea, where there are about 40 oil-related sites (pipeline terminals, refineries, offshore platforms, etc.).
Much of the Black Sea is severely polluted with oil, especially near ports and river mouths. This is probably as a result of heavy boat traffic. Oil pollution along shipping lanes is especially heavy and is suggested to be caused by deballasting and bilge discharges.
Key messages:
% The number of illegal oil spills has slowly decreased in the North Sea, but remains steady in the Baltic Sea. No aerial surveillance is conducted over the Mediterranean and the Black Seas
Figure 4.13Annual number of observed slicks (a) and number of slicks per flight hour (b) in the North and Baltic Seas from aerial surveillance
0
200
400
600
800
1 000
1 200
1 400
1990 1991 1992 1993 1994 1995 1996 1997 1998 1999 2000
number of slicks (North Sea) number of slicks (Baltic sea)
0
0.05
0.1
0.15
0.2
0.25
0.3
0.35
1990 1991 1992 1993 1994 1995 1996 1997 1998 1999 2000
number of slicks/flight hour (North Sea)number of slicks/flight hour (Baltic sea)
(a)
(b)
Source: Bonn Agreement and Helcom (2002).
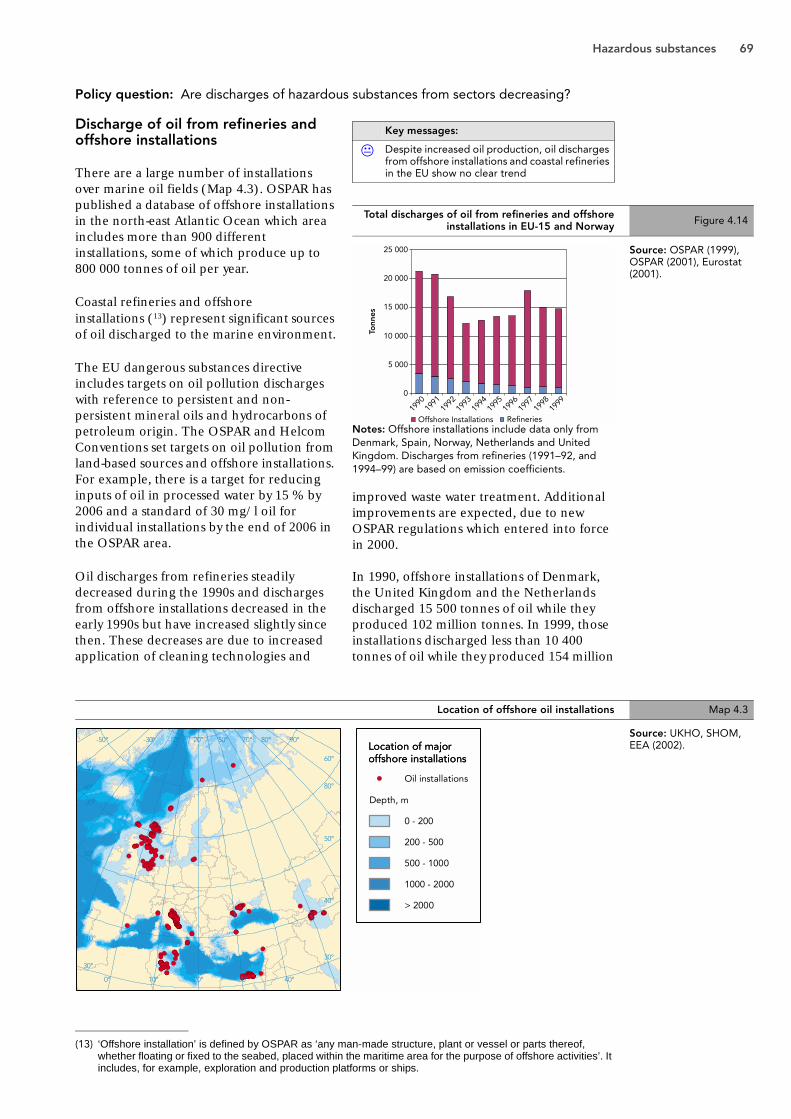
Hazardous substances 69
Policy question: Are discharges of hazardous substances from sectors decreasing?
Discharge of oil from refineries and offshore installations
There are a large number of installations over marine oil fields (Map 4.3). OSPAR has published a database of offshore installations in the north-east Atlantic Ocean which area includes more than 900 different installations, some of which produce up to 800 000 tonnes of oil per year.
Coastal refineries and offshore installations (13) represent significant sources of oil discharged to the marine environment.
The EU dangerous substances directive includes targets on oil pollution discharges with reference to persistent and non-persistent mineral oils and hydrocarbons of petroleum origin. The OSPAR and Helcom Conventions set targets on oil pollution from land-based sources and offshore installations. For example, there is a target for reducing inputs of oil in processed water by 15 % by 2006 and a standard of 30 mg/l oil for individual installations by the end of 2006 in the OSPAR area.
Oil discharges from refineries steadily decreased during the 1990s and discharges from offshore installations decreased in the early 1990s but have increased slightly since then. These decreases are due to increased application of cleaning technologies and
Notes: Offshore installations include data only from Denmark, Spain, Norway, Netherlands and United Kingdom. Discharges from refineries (1991–92, and 1994–99) are based on emission coefficients.
improved waste water treatment. Additional improvements are expected, due to new OSPAR regulations which entered into force in 2000.
In 1990, offshore installations of Denmark, the United Kingdom and the Netherlands discharged 15 500 tonnes of oil while they produced 102 million tonnes. In 1999, those installations discharged less than 10 400 tonnes of oil while they produced 154 million
(13) ‘Offshore installation’ is defined by OSPAR as ‘any man-made structure, plant or vessel or parts thereof, whether floating or fixed to the seabed, placed within the maritime area for the purpose of offshore activities’. It includes, for example, exploration and production platforms or ships.
Key messages:
% Despite increased oil production, oil discharges from offshore installations and coastal refineries in the EU show no clear trend
Total discharges of oil from refineries and offshoreinstallations in EU-15 and Norway Figure 4.14
0
5 000
10 000
15 000
20 000
25 000
1990
1991
1992
1993
1994
1995
1996
1997
1998
1999
Offshore Installations Refineries
Tonn
es
Source: OSPAR (1999), OSPAR (2001), Eurostat (2001).
Location of offshore oil installations Map 4.3
Source: UKHO, SHOM, EEA (2002).

70 Europe's water: An indicator-based assessment
tonnes. Between 1990 and 1998, the total refinery output across the EU increased by 15 %, while discharges decreased by 70 % (Eurostat, 2001).
The assessment of discharges from offshore installations in the Mediterranean and Black Seas is lacking. There are extensive oil refining and petrochemical industries
operating in the entire Mediterranean region (EEA, 1999) with 40 major refineries in 1997. The amount of oil discharged into the sea from 13 of these refineries was estimated in 1995 to be 782 tonnes (UNEP, 1996).

Hazardous substances 71
Policy question: Do present day concentrations of hazardous substances have unacceptable impacts on human health and the environment?
Hazardous substances in drinking water
The Drinking Water Directive (80/778/EEC), and its successor (98/83/EC which comes in force in 2003), aims to ensure that water intended for human consumption is safe. In addition to microbiological and physicochemical parameters, a number of toxic substances such as pesticides, polyaromatic hydrocarbons, cyanide compounds, and heavy metals are to be monitored. This is because the raw supply may be contaminated, for example, with pesticides from agricultural land which have leached into groundwater or from contamination within the distribution system, such as lead from piping. Some problems with pesticides and/or heavy metals in drinking water have been identified in national reports and by the European Union of National Associations of Water Suppliers and Waste Water Services (Eureau) (Map 4.4).
Pesticide pollution of drinking water has been identified as a problem in Belgium, Denmark, France, Germany, the Netherlands and the UK (Eureau, 2001) where it is estimated that between 5 and 10 % of resources are regularly contaminated with pesticides in excess of 0.1 µg/l. For example, in Germany in 1995, 10 % groundwater monitoring stations exceeded 0.1 µg/l particularly for atrazine despite its ban in 1991. One of the main causes of metal contamination of drinking water is from lead plumbing. For example, in France, extensive replacement of lead pipes is still required and in the UK, the use of lead solder is still common even though it has been illegal since 1987. In some of the accession countries, there are also problems with lead and other metals, for example, in the Czech Republic, barium and nickel are at levels that are of concern in some supplies and the Slovak Republic has recorded some high cadmium concentrations.
Key messages:
! Pesticide and metal contamination of drinking water supplies has been identified as a problem in many European countries
The threat of metal and pesticide contamination in drinking water Map 4.4
Metal and pesticidecontamination in drinking water
Metal and pesticidecontamination in drinking water
Metals
Pesticides
No data
Outside data coverage
Metals and pesticides
Source: Countries’ national reports, Eureau (2001).

72 Europe's water: An indicator-based assessment
Policy question: Do present day concentrations of hazardous substances have unacceptable impacts on human health and the environment?
Notes: European environmental quality standards are established for List I substances under the dangerous substances directive. Numbers in brackets equate to the number of stations at which substances are monitored. The concentrations recorded at the stations have been divided into ranges equivalent to less than 10 % of the substances’ EQS value, between 10 % and less than the EQS, and greater than the EQS value. The number on the right axis equates to the number of stations at which the EQS value is exceeded.
Notes: Monitoring sites downstream of discharges. The causes of failures include run-off from historically contaminated land, discharges from old mines and re-suspension of contaminated sediments from historic discharges. Consented discharges were not responsible for any of the failures.
Non-compliance with EU environmental quality standards
Environmental quality standards are set for some hazardous substances for application at an EU level (List I substances) under the dangerous substances directive, whilst others are set nationally (for example, List II substances). These standards are set to protect aquatic organisms. European standards will also be established for priority list substances and national standards for other pollutants under the water framework directive.
The best available information shows that concentrations of hazardous substances are generally quite low in water and exceedences of the dangerous substances environmental quality standards for List I substances are relatively rare (Figure 4.15). This is supported by information from England and Wales where the numbers of sites where environmental quality standards are exceeded have decreased during the 1990s. However, there are still a relatively high proportion of sites that are failing national environmental quality standards for List II substances (Figure 4.16).
The combined monitoring-based and modelling-based priority-setting scheme database (COMMPS) was developed by the European Commission to establish a list of priority substances for the water framework directive and as such is the best data source available at present. It contains over 750 000 data points from EU Member States but is biased towards a few countries that provided most information. Even though it is not certain whether or not the absence of data in the COMMPS database from a particular country indicates that no monitoring is undertaken, it is clear that there are very large differences in the number of substances and stations at which hazardous substances are monitored. This implies that many EU countries are not undertaking adequate monitoring for these substances. The number of hazardous substances monitored is highest in Germany, the UK and Austria and lowest in Finland, Ireland and Portugal. In addition, seven of the EU countries do not appear to monitor any of the substances that are on the water framework directive priority list.
Key messages:
! Levels of List I substances in rivers are generally below EU environmental quality standards
! The monitoring of hazardous substances in surface waters is very variable between countries and it is as a result very difficult to make conclusions about current concentrations and trends
Figure 4.15 Monitoring stations exceeding List I environmental quality standards in the period 1994–98
Figure 4.16 Non-compliance with List I and List II environmental quality standards in rivers in England and Wales
53
252291203225
761746431307540155
0 20 40 60 80 100Endrin (1 485)
Dieldrin (1 545)DDT 4,4' (1 222)
Isodrin (1 294)Aldrin (1 521)
1,2-Dichloroethane (1 199)Lindane (1 893)
Trichlorobenzene (1 002)Hexachlorobenzene (1 484)Pentachlorophenol (1 329)
Hexachlorobutadiene (1 234)Mercury (2 281)
Cadmium (4 644)Perchloroethylene (1 223)Trichloroethylene (1 595)
Chloroform (1 291)Carbon tetrachloride (1 081)
% of stations<10 % EQS 10 % EQS to EQS > EQS
Source: COMMPS database, Data analysis by EEA-ETC/WTR.
0
5
10
15
20
25
1992 1993 1994 1995 1996 1997 1998 1999 2000
List I List II
% n
on-c
om
pliant
site
s
Source: Environment Agency of England and Wales (2002).
Demonstration indicator

Hazardous substances 73
Policy question: Do present day concentrations of hazardous substances have unacceptable impacts on human health and the environment?
Pesticides in surface and groundwater
EU standards for the levels of pesticides in drinking water have to be complied with at the point of supply to the consumer (for example, less than 0.1 µg/l for individual pesticides) but standards are also useful for assessing concentrations in groundwater. Unfortunately, at a European level, the monitoring data on the concentrations of pesticides in water is limited.
Groundwater is often used as a drinking water source, yet there is limited information available on pesticide contamination and a lack of reliable and comparable data on European levels. In addition, the monitoring of pesticides is not yet undertaken in many countries.
Figures 4.17 and 4.18 show the occurrence of some commonly found pesticides in groundwater and surface waters in England and Wales — the data show no definite trends but indicate that some pesticides occur at concentrations that would be of concern if the water was drunk untreated. Many other countries report pesticide pollution of their groundwater. In Austria, between mid-1997 and mid-1999, about 15 % of sampling sites exceeded 0.1 µg/l for desethylatrazine and 10 % for atrazine. Trend analyses for atrazine of 247 sampling sites showed significant downward trends for 72 % of the sites. Atrazine was banned in 1995 and the ban seems to be effective (UBA Vienna, 2001). In Finland, pesticide pollution of groundwater is reported around tree nurseries (FEI, 2001). In France, over half of all monitoring points (52 %) are considered to be unaffected. Excessive contamination is suspected at 35 % of points and definitely present at 13 % of points. However, the available data covers only 75 % of France (RNDE, 2002). In Denmark, in 2001, pesticides were found to be present in 27 % of the well screens and concentrations of pesticides in 8.5 % of the screens exceeded the limit value for drinking water (Geus, 2002). In the UK, in 2000, about 9 % of the freshwater sites failed to meet the environmental quality standards at least once (Environment Agency of England and Wales, 2002). Even Sweden, which confirmed that pesticides do not cause problems in groundwater, reports sometimes on low but not insignificant concentrations of pesticides in groundwater (Swedish EPA, 2002).
Notes: Percentage of samples greater than 0.1 µg/l. Samples from surface waters and groundwater
Notes: Percentage of samples greater than 0.1 µg/l. A total of 180 different pesticides are analysed at over 3 000 locations (2 159 freshwater, 1 219 groundwater and 439 marine), at a frequency of four to 12 times a year giving over 200 000 determinations a year. The herbicides diuron, isoproturon and mecoprop are the pesticides found in all three water types and are the ones that most frequently exceed 0.1 µg/l in marine and freshwaters.
Demonstration indicator Key messages:
! Pesticides occur in surface waters and groundwaters at levels that are of potential concern for the supply of drinking water and because of adverse effects on aquatic organisms
Occurrence of some commonly found pesticides inEngland and Wales Figure 4.17
Frequently occurring pesticides in freshwater,marine water and groundwater in England and
Wales in 2000Figure 4.18
02468
101214161820
93–94 95 96– 97 98– 99 00–Iso
protu
ron
Mec
oprop
Diuron
MCPA
2.4-
D
Simaz
ine
Atrazin
e
PCSD
% s
amp
les
> 0
.1 µ
g/I
Source: Environment Agency of England and Wales (2002).
0 5 10 15 20 25 30 35
DichlobenilPentachlorophenol
TriclopyrBentazone
GlyphosphateMCPB
ChloroluronAtrazine
CarbendazimSimazine
Dichloroprop2,4-D
MCPAMecoprop
IsoproturonDiuron
% of samples >0.1µg/l
Groundwater Marine water Freshwater
Source: Environment Agency of England and Wales (2002).
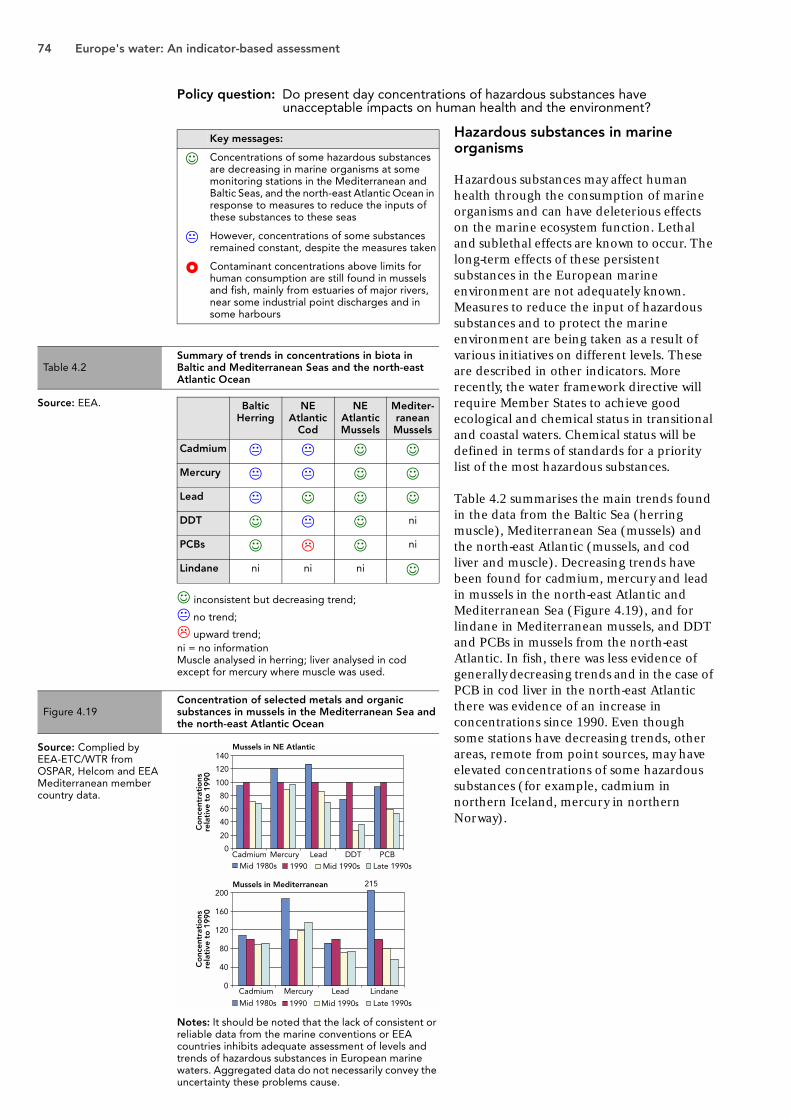
74 Europe's water: An indicator-based assessment
Policy question: Do present day concentrations of hazardous substances have unacceptable impacts on human health and the environment?
☺ inconsistent but decreasing trend;
% no trend;
& upward trend; ni = no informationMuscle analysed in herring; liver analysed in cod except for mercury where muscle was used.
Notes: It should be noted that the lack of consistent or reliable data from the marine conventions or EEA countries inhibits adequate assessment of levels and trends of hazardous substances in European marine waters. Aggregated data do not necessarily convey the uncertainty these problems cause.
Hazardous substances in marine organisms
Hazardous substances may affect human health through the consumption of marine organisms and can have deleterious effects on the marine ecosystem function. Lethal and sublethal effects are known to occur. The long-term effects of these persistent substances in the European marine environment are not adequately known. Measures to reduce the input of hazardous substances and to protect the marine environment are being taken as a result of various initiatives on different levels. These are described in other indicators. More recently, the water framework directive will require Member States to achieve good ecological and chemical status in transitional and coastal waters. Chemical status will be defined in terms of standards for a priority list of the most hazardous substances.
Table 4.2 summarises the main trends found in the data from the Baltic Sea (herring muscle), Mediterranean Sea (mussels) and the north-east Atlantic (mussels, and cod liver and muscle). Decreasing trends have been found for cadmium, mercury and lead in mussels in the north-east Atlantic and Mediterranean Sea (Figure 4.19), and for lindane in Mediterranean mussels, and DDT and PCBs in mussels from the north-east Atlantic. In fish, there was less evidence of generally decreasing trends and in the case of PCB in cod liver in the north-east Atlantic there was evidence of an increase in concentrations since 1990. Even though some stations have decreasing trends, other areas, remote from point sources, may have elevated concentrations of some hazardous substances (for example, cadmium in northern Iceland, mercury in northern Norway).
Key messages:
☺ Concentrations of some hazardous substances are decreasing in marine organisms at some monitoring stations in the Mediterranean and Baltic Seas, and the north-east Atlantic Ocean in response to measures to reduce the inputs of these substances to these seas
% However, concentrations of some substances remained constant, despite the measures taken
! Contaminant concentrations above limits for human consumption are still found in mussels and fish, mainly from estuaries of major rivers, near some industrial point discharges and in some harbours
Table 4.2Summary of trends in concentrations in biota in Baltic and Mediterranean Seas and the north-east Atlantic Ocean
Baltic Herring
NE Atlantic
Cod
NEAtlantic Mussels
Mediter-raneanMussels
Cadmium % % ☺ ☺Mercury % % ☺ ☺Lead % ☺ ☺ ☺DDT ☺ % ☺ ni
PCBs ☺ & ☺ ni
Lindane ni ni ni ☺
Figure 4.19Concentration of selected metals and organic substances in mussels in the Mediterranean Sea and the north-east Atlantic Ocean
Source: EEA.
Mussels in NE Atlantic
0
20
40
60
80
100
120
140
Cadmium Mercury Lead DDT PCBMid 1980s 1990 Mid 1990s Late 1990s
Mussels in Mediterranean 215
0
40
80
120
160
200
Cadmium Mercury Lead Lindane
Co
ncen
trat
ions
rela
tive
to
19
90
Co
ncen
trat
ions
rela
tive
to
19
90
Mid 1980s 1990 Mid 1990s Late 1990s
Source: Complied by EEA-ETC/WTR from OSPAR, Helcom and EEA Mediterranean member country data.

Hazardous substances 75
Policy question: Do present day concentrations of hazardous substances have unacceptable impacts on human health and the environment?
Biological effects of hazardous substances on aquatic organisms
An endocrine-disrupting chemical as defined by the WHO and adopted by the European Commission is ‘an exogenous substance or mixture that alters the function(s) of the endocrine system and consequently causes adverse health effects in an intact organism, or its progeny, or (sub) populations’.
Several classes of chemicals such as pesticides, phthalate plasticisers, dioxins and anti-fouling paints are known to have endocrine-disrupting properties (DMU, 1997; Royal Society, 2000). Pharmaceuticals with hormonal effects (such as, synthetic oestrogen used in contraceptives) are also emitted into the environment and the effects that these substances might have are also an increasing concern (e.g. UBA, Berlin 2001). There are currently 553 substances on a candidate list of substances for further evaluation of their roles in endocrine disruption drawn up by a study for the European Commission (2001).
A number of studies have now been carried out on freshwater and estuarine systems in Europe and endocrine disruption has been noticed in fish exposed to effluent from sewage treatment works. The main observation is the feminisation of males including the induction of vitellogenin (an egg yolk protein) and abnormal gonadal development. The effects on populations are, at present, unclear but it is generally considered to be mainly due to natural and synthetic oestrogens from domestic sewage.
The most undisputed evidence for endocrine-disrupting chemicals effecting wildlife populations is that for organo-tin compounds. Organo-tin compounds were first used in anti-fouling paints in the 1960s and have now been shown to cause imposex (penis formation induced in females) in over 100 species of marine molluscs.
Results from a study of wild roach in several English rivers in 1996 and 1997 showed that the prevalence and degree of feminisation of male fish was generally higher at river sites downstream of sewage treatment works than at sites upstream or in waters that do not receive sewage effluents (Figure 4.20). In one case, the sewage effluent contained alkylphenol detergents which are known to have endocrine-disrupting properties.
Notes: Reference: waters that do not receive sewage effluentsUpstream: sites upstream of sewage treatment worksDownstream: sites downstream of sewage treatment works
Similar feminisation of male roach has also been observed in two rivers polluted with waste water in Denmark (NERI, 2002).
Feminisation of flounder in estuarine and coastal waters in the UK has also been reported, even though abnormal sex ratios were not seen in any estuary (CEFAS, 1998). Here, it was concluded that oestrogenic hormones were not the major causative agent but were likely to be contributing to the observed effects. The presence of industrial effluents and chemicals in these waters also suggested that non-hormonal substances were major contributors to the effect.
Key messages:
! The presence of endocrine-disrupting chemicals in the aquatic environment has been linked with sexual disruption of aquatic animals, and is an emerging issue of concern.
Sexual disruption in wild fish in England Figure 4.20
30
40
50
60
Ave
rag
e p
erce
ntag
e in
ters
ex20
10
0Reference (5 sites) Upstream (5 sites) Downstream (8 sites)
Source: Environment Agency of England and Wales (2002).

76 Europe's water: An indicator-based assessment
4.4 References
Bonn Agreement. http://www.bonnagreement.org.
CEFAS (1998) Oestrogenic endocrine disruption on flounder (Platichthys flesus) from United Kingdom estuarine and marine waters. Science series technical report No 107. Lowestoft 1998.
Czech Ministry of the Environment (2001): Report on the environment in the Czech Republic in 2000.
DMU (1997): The state of the environment in Denmark. http://www.dmu.dk/1_viden/2_Publikationer/3_fagrapporter/rapporter/fr243.pdf.
Dutch environmental data compendium (2001) http://www.rivm.nl/environmentaldata/.
EEA (1999) State and pressures of the marine and coastal Mediterranean environment. Environmental assessment series, No 5. European Environment Agency, Copenhagen.
EEA 2002. Europe’s biodiversity — biogeographical regions and seas. Seas around Europe. The Caspian Sea. http://reports.eea.eu.int/report_2002_0524_154909/en/page171.html.
Environment Agency of England and Wales (2002). Environmental facts and figures: hormone disruption: http://www.environment-agency.gov.uk/yourenv/eff/wildlife/fish/161782.
Environment Agency of England and Wales (2002) Pesticides 2000: A summary of monitoring of the aquatic environment in England and Wales. Bristol, UK.
European Commission (2000) Plant protection in the EU — Consumption of plant protection products in the European Union.
European Commission (2001) Communication from the Commission to the Council and the European Parliament on the implementation of the Community strategy for endocrine disrupters — a range of substances suspected of interfering with the hormone systems of humans and wildlife. COM(2001)262. Brussels.
EUREAU (2001) Keeping raw drinking water resources safe from pesticides. Eureau position paper Eu1 — 01 — A56, Brussels April 2001.
Eurostat (2001). Environmental pressure indicators for the EU. Data 1985–98. European Commission, Luxembourg.
FEI — Finnish Environment Institute (2001): The Finnish Eurowaternet. Helsinki.http://www.vyh.fi/eng/orginfo/publica/electro/fe445/fe4451.pdf.
Geus (2002) Grundvandsovervågning 2002. Danmarks og Grønlands geologiske undersøgelser. Miljøministeriet, Copenhagen.
Helcom Convention. http://www.helcom.fi/.
Helcom(2001a) Environment of the Baltic Sea area 1994-1998. Baltic Sea Environment Proceedings No82A. Helsinki Commission. Helsinki.
Helcom(2001b) The implementation of the 1988 ministerial declaration on the protection of the marine environment of the Baltic Sea area with regard to hazardous substances. Helsinki Commission. Helsinki..
Helcom(2002) Implementation of the Helcom objective with regard to hazardous substances. Helsinki Commission. Helsinki.
NERI (2002) The state of the environment in Denmark, 2001. NERI Technical Report No 409. Ministry of the Environment, Copenhagen.
North Sea progress report 2002. http://www.dep.no/md/html/nsc/progressreport2002/hoved.html.
OSPAR (1999) Part I Discharges from refineries, 1981–97 Part II Discharges, waste handling and air emissions from offshore installations for 1996–1997. OSPAR Commission, London.
OSPAR (2000) Quality status report 2000, OSPAR Commission, London.
OSPAR (2001) Discharges, waste handling and air emissions from offshore installations for 1998–99. OSPAR Commission, London.
RNDE (2002): http://www.rnde.tm.fr/francais/frame/sygen.htm.

Hazardous substances 77
Royal Society (2000) Endocrine disrupting chemicals. The Royal Society, London. http://www.royalsoc.ac.uk/.
SHOM (Service Hydrographique et Océanographique de la Marine — France). Groupes d’avis aux navigateurs. http://www.shom.fr/.
Skjelkvåle, B.L., Andersen, T., Fjeld, E., Mannio, J.,Wilander, A., Johansson, K., Jensen, J.P., Moiseenko, T. 2001. Heavy metal surveys in Nordic lakes; concentrations, geographic patterns and relation to critical limits. Ambio, vol. 30, no. 1, p. 2-10.
Swedish EPA (2002): http://www.internat.environ.se/index.php3.
UBA, Berlin (2001) Water resources management in Germany. Part 2 Quality of inland surface waters, Berlin.
UBA, Vienna (2001) Umweltsituation in Österreich. Wien.
UKHO (United Kingdom Hydrography Office). Notices to mariners. http://www.hydro.gov.uk/
UNEP (1996) Survey of pollutants from land-based sources in the Mediterranean. MAP Technical Report Series No 109. UNEP, Athens.

78 Europe's water: An indicator-based assessment
5. Water quantity
5.1. Background to the issue
Water availability problems occur when the demand for water exceeds the amount available during a certain period. They occur frequently in areas with low rainfall and high population density, and in areas with intensive agricultural or industrial activity. Apart from water supply problems, over-exploitation of water has led to the drying-out of natural areas in western and southern Europe, and to salt-water intrusion in aquifers.
The overall abstraction and consumption of water resources is currently sustainable in the long-term perspective. However, some areas may be facing unsustainable trends, especially in southern Europe where much improved efficiency of water use, especially in agriculture, is needed to prevent seasonal water shortages. In addition, climate change may affect water resources and demand.
The three main consumptive users of water are agriculture, industry and the domestic sector.
The main policy objectives are:
• to ensure the rates of abstraction from our water resources are sustainable over the long term (14) and to promote sustainable water use based on a long-term protection of available water resources (15);
• to ensure a balance between abstraction and recharge of groundwater, with the aim of achieving good groundwater status by 2015 (16).
The water framework directive obliges Member States to use pricing for water-related services as an effective tool for promoting water conservation. This would also allow the environmental costs of water to be reflected in the price of water. National, regional and local authorities need, amongst other things, to introduce measures to improve the efficiency of water use and to
encourage changes in agricultural practices necessary to protect water resources (and quality). Leakage remains a major source of inefficiency of water use and in several countries objectives have been set to achieve major reductions in leakage.
EU Member States shall ensure by 2010:
• that water-pricing policies provide adequate incentives for users to use water resources efficiently, and thereby contribute to the environmental objectives of the water framework directive;
• an adequate contribution of the different water uses, disaggregated into at least industry, households and agriculture, to the recovery of the costs of water services.
5.2. Indicators used
The DPSIR framework for assessing water quantity resources is shown in Figure 5.1. The text in yellow are those indicators used in this report.
5.3. Assessments by indicator
There are large spatial and temporal differences across Europe in the amount of water available. These differences are expected to change as climate changes, with decreasing amounts of rain but with more intense rainfall events predicted to occur in southern Europe, and increasing rainfall in central and northern Europe. Southern Europe is expected to experience more summer droughts.
Pressures on water quantity arise from the main sectoral users of water such as agriculture, households, energy production and industry. The seasonal demand from tourism is a significant pressure, particularly in southern Europe. During the 1990s, there have been decreases in water abstracted for agriculture, industry and urban use in central accession and central western countries, and
(14) Sixth environmental action programme, 5.6 — Ensuring the sustainable use and high quality of our water resources (pp. 45–46).
(15) Water framework directive, Article 1.(16) Water framework directive, Article 4.

Water quantity 79
in water used for energy production in southern western and central western countries. However, there were increases in agricultural water use in southern western countries, and in water abstracted for energy production in central accession countries. Approximately 20 % of Europe’s population lives in countries that are water stressed with those countries with the highest agricultural water use having the highest water consumption, consuming in some cases over 10 % of their annual available water.
The impacts of over-abstraction of available water include decreases in groundwater levels that in turn can lead to impacts on associated aquatic and terrestrial ecosystems such as wetlands. In addition, over-abstraction of groundwater can lead to the intrusion of saltwater into coastal aquifers: this is a major concern and problem throughout Europe.
Measures (responses) to increase the amount of available water include the construction of storage reservoirs to safeguard supplies when other sources are stressed. This is particularly the case in southern Europe where a high proportion of water is used for irrigation. Other measures are aimed at reducing or controlling the demand for water including water pricing, water-saving devices and reduction of water leakage in distribution systems.
Table 5.1 summarises the assessments as answers to main policy questions. More detailed information and assessments then follow in the subsequent pages and indicator factsheets.
DPSIR conceptual framework for assessing water quantity resources Figure 5.1
Available water
Pressures
Responses
ImpactsState
Exploitation indexConsumption indexTotal abstractions
Sectoral water use:agriculture,
households, tourismSaltwater intrusionGroundwater levels
DrivingForces Industry
EnergyAgricultureAquacultureHouseholds
TourismClimate
Overall reservoir stocksWater prices
Water use efficiencyWater leakage
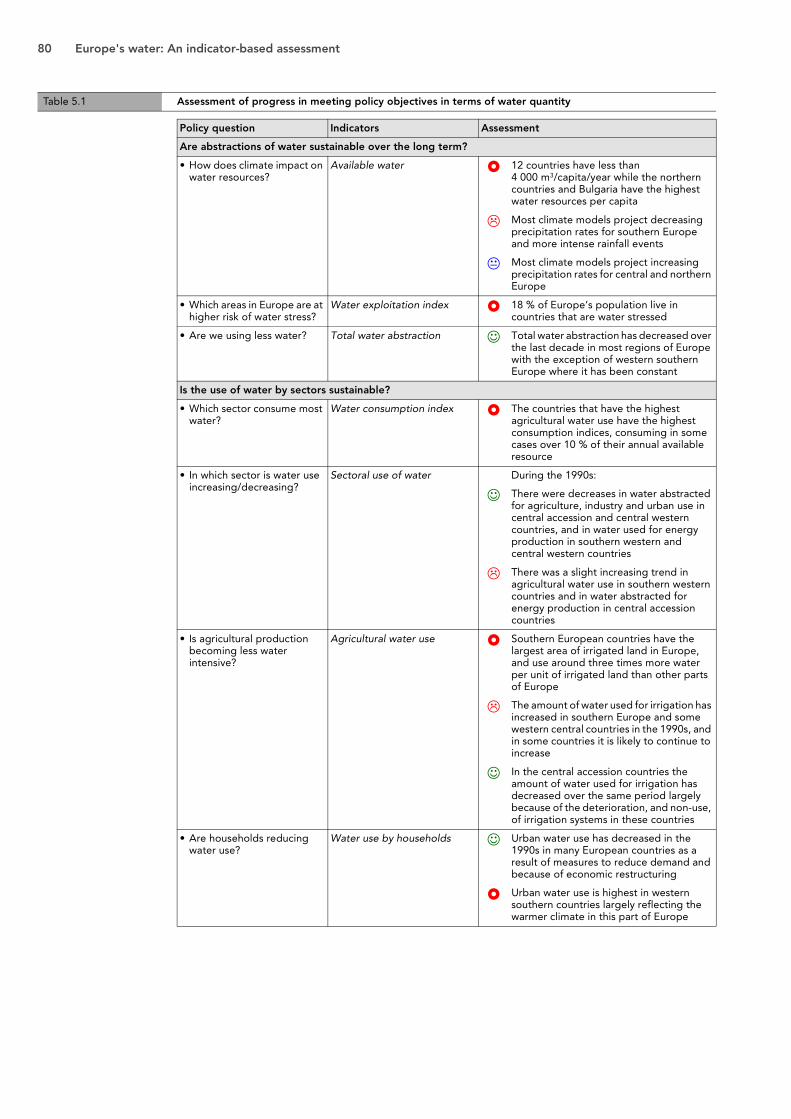
80 Europe's water: An indicator-based assessment
Table 5.1 Assessment of progress in meeting policy objectives in terms of water quantity
Policy question Indicators Assessment
Are abstractions of water sustainable over the long term?
• How does climate impact on water resources?
Available water ! 12 countries have less than 4 000 m3/capita/year while the northern countries and Bulgaria have the highest water resources per capita
& Most climate models project decreasing precipitation rates for southern Europe and more intense rainfall events
% Most climate models project increasing precipitation rates for central and northern Europe
• Which areas in Europe are at higher risk of water stress?
Water exploitation index ! 18 % of Europe’s population live in countries that are water stressed
• Are we using less water? Total water abstraction ☺ Total water abstraction has decreased over the last decade in most regions of Europe with the exception of western southern Europe where it has been constant
Is the use of water by sectors sustainable?
• Which sector consume most water?
Water consumption index ! The countries that have the highest agricultural water use have the highest consumption indices, consuming in some cases over 10 % of their annual available resource
• In which sector is water use increasing/decreasing?
Sectoral use of water During the 1990s:
☺ There were decreases in water abstracted for agriculture, industry and urban use in central accession and central western countries, and in water used for energy production in southern western and central western countries
& There was a slight increasing trend in agricultural water use in southern western countries and in water abstracted for energy production in central accession countries
• Is agricultural production becoming less water intensive?
Agricultural water use ! Southern European countries have the largest area of irrigated land in Europe, and use around three times more water per unit of irrigated land than other parts of Europe
& The amount of water used for irrigation has increased in southern Europe and some western central countries in the 1990s, and in some countries it is likely to continue to increase
☺ In the central accession countries the amount of water used for irrigation has decreased over the same period largely because of the deterioration, and non-use, of irrigation systems in these countries
• Are households reducing water use?
Water use by households ☺ Urban water use has decreased in the 1990s in many European countries as a result of measures to reduce demand and because of economic restructuring
! Urban water use is highest in western southern countries largely reflecting the warmer climate in this part of Europe

Water quantity 81
Are the impacts of water abstractions being reduced?
• Are there indications of low water availability/reduced water quality?
Overall reservoir stocks ! Southern European countries retain the highest proportion of their annual freshwater resources in storage reservoirs, often to safeguard supplies when other water resources are stressed. These countries use the highest proportion of their water resources for irrigation
! Hydropower generation is also a major use of storage reservoirs particularly in Nordic countries
Saltwater intrusion ! Saltwater intrusion as a result of increasing groundwater over-exploitation is a major concern in many aquifers throughout Europe
• Are impacts on wetlands and aquatic biota decreasing?
Groundwater levels ☺ Groundwater levels have increased in some European aquifers in response to decreases in groundwater abstraction
Are water prices and water saving technologies effective tools to improve water conservation?
• Is water pricing used as a tool for promoting efficient water use?
Water prices ☺ Many countries have made significant progress towards more effective water pricing policies that should reduce water demand
% However, far less progress has been made in the agricultural sector compared to the domestic and industrial sectors
• Are we changing to more efficient uses of water?
Water use efficiency ☺ Water use efficiency has been improved in various water-saving devices in households, public places and industry
Water leakage ! Leakage losses are significant in many urban areas
☺ Progress is being made in some countries to reduce water leakage from urban distribution systems
Policy question Indicators Assessment

82 Europe's water: An indicator-based assessment
Policy question: Are abstractions of water sustainable over the long term?
Available water
Precipitation is the source of all freshwater resources. Precipitation is unevenly distributed in Europe, being highest in the western part and in regions with mountains (Map 5.1). Annual average river run-off from rain varies from over 3 000 mm in western Norway to less than 25 mm in southern and central Spain, and is about 100 mm over large areas of eastern Europe.
The total renewable freshwater resource of a country is the total volume of river run-off and groundwater recharge generated annually by precipitation within the country, plus the total volume of actual flow of rivers coming from neighbouring territories. This resource is supplemented by water stored in lakes, reservoirs, icecaps and fossil groundwater. In absolute terms, the total renewable freshwater resource in Europe is around 3 500 km3/year. A total of 12 countries have less than 4 000 m3/capita/year, while the northern countries and Bulgaria have the highest water resources per capita (Figure 5.2).
Inflows from transboundary watersheds can be a significant percentage of freshwater resources in countries, either as surface flow (as is the case of Bulgaria) or as groundwater flow. The accession countries of the Danube basin have the highest dependency on external resources (above 70 % of their total resources). In western Europe, the Netherlands has the highest dependency (88 %), followed by Luxembourg and Portugal.
Climate changes are affecting precipitation patterns in Europe. In some parts of northern countries (Map 5.2) there has been an increase of more than 9 % of the annual precipitation per decade between 1946 and 1999 (IPCC, 2001 and Klein Tank et al., 2001). Decreasing trends in precipitation have been observed in parts of southern and central Europe. Most climate models project increasing precipitation rates for central and northern Europe and decreasing rates for southern Europe. The increasing rates are mainly due to more precipitation during the winter months, while southern Europe will experience more summer droughts.
Key messages:
! 12 countries have less than 4 000 m3/capita/year while the northern countries and Bulgaria have the highest water resources per capita
& Most climate models project decreasing precipitation rates for southern Europe and more intense rainfall events
% Most climate models project increasing precipitation rates for central and northern Europe
Figure 5.2 Water availability per capita and country
MaltaCyprus
Czech RepublicBelgium
PolandGermanyDenmark
United KingdomSpain
ItalyFranceTurkey
NetherlandsGreece
LithuaniaLuxembourg
PortugalSwitzerlandSlovak Rep.
HungaryEstonia
RomaniaAustriaIrelandLatvia
SloveniaSwedenFinland
BulgariaNorwayIceland
5 0000 10 000 15 000 20 000 25 000 30 000
87 500605 000
> 10 000
m /capita/year3
5 000–10 000 2 000–5 000 < 2 000
Source: Eurostat.

Water quantity 83
Average annual precipitation between 1940–95 in the EEA area (mm) Map 5.1
Trends in precipitation, 1946–99 Map 5.2
Source: Climate Research Unit (CRU), 1998.
Source: Klein Tank et al. (2001).

84 Europe's water: An indicator-based assessment
Policy question: Are abstractions of water sustainable over the long term?
Notes: Solid bar: Water exploitation index without water abstraction for energy cooling; dotted bar: WEI based on total water abstraction.
Notes: Western central: Austria, Belgium, Denmark, Germany, France, Luxembourg, Netherlands, UK.Western southern: France, Greece, Italy Portugal, Spain.Central accession: Bulgaria, Czech Republic, Estonia, Hungary, Latvia, Lithuania, Poland, Romania, Slovak Republic, Slovenia.Nordic: Iceland, Finland, Sweden and Norway: insufficient data for trend assessment.
Water exploitation indexTotal water abstraction
Abstractions for different uses exert the most significant pressure on the quantity of freshwater resources. The total water abstraction in Europe is about 353 km3/year, which means that 10 % of Europe’s total freshwater resources is abstracted. The water exploitation index (WEI) in a country is the mean annual total demand for freshwater divided by the long-term average freshwater resources. It gives an indication of how the total water demand puts pressure on the water resource. It also identifies those countries that have high demand in relation to their resources and therefore are prone to suffer problems of water stress.
For this assessment, the following threshold values/ranges for the water exploitation index have been used to indicate levels of water stress: (a) non-stressed countries < 10 %; (b) low stress 10 to < 20 %; (c) stressed 20 % to < 40 %; and (d) severe water stress ≥ 40 %. The threshold values/ranges above are averages and it would be expected that areas for which the water exploitation index is above 20 % would also be expected to experience severe water stress during drought or low river-flow periods.
A total of 20 countries (50 % of Europe’s population) can be considered as non-stressed (Figure 5.3), lying mainly in central and northern Europe. Nine countries can be considered as having low water stress (32 % of Europe’s population). These include, Belgium, Denmark and Romania and southern countries (Greece, Portugal and Turkey). Finally, there are four countries (Cyprus, Italy, Malta and Spain) which are considered to be water stressed (18 % of Europe’s population). Water stressed countries can face the problem of groundwater over-abstractions and the consequent water table depletion and salt- water intrusion in coastal aquifers.
Total water abstraction decreased during the 1990s by 30 % in the central accession countries and by 14 % in the western central countries while in the western southern European countries it has been constant.
Key messages:
! 18 % of Europe’s population live in countries that are water stressed
☺ Total water abstraction has decreased over the last decade in most regions of Europe with the exception of western southern Europe where it has been constant
Figure 5.3 Water exploitation index (WEI) in the late 1990s
Figure 5.4 Water abstraction in different regions of Europe
0 10 20 30 40 50
IcelandNorway
LatviaHungaryLithuania
Slovak Rep.SwedenBulgariaSlovenia
IrelandFinland
SwitzerlandAustria
The NetherlandsEstonia
LuxembourgFrancePoland
GermanyCzech Rep.
Engl. & WalesRomania
GreecePortugal
DenmarkTurkey
BelgiumItaly
SpainMalta
Cyprus
Water exploitation index (%)
WEI — Energy WEI
Source: Eurostat.
0
20
40
60
80
100
120
1990
1991
1992
1993
1994
1995
1996
1997
1998
Central accession
Western southern
Western central
Ind
ex 1
990=
100
Source: Eurostat.

Water quantity 85
Policy question: Is the use of water by sectors sustainable?
Water consumption index
The water consumption index is the total consumption divided by the long-term freshwater resources of a country. This index highlights those regions where higher consumptive uses are predominant, such as in the western southern countries.
For the purposes of this assessment, it has been assumed that 80 % of total water abstracted for agriculture, 20 % for urban use, 20 % for industry and 5 % for energy production is consumed and not returned to the water bodies from where it was abstracted. These figures are averages of the water consumed by the sectors as there are no data at national level on the water returned from the different sectors. These figures have been widely accepted, though they may vary by about 5 to 10 % depending on the sectors and other factors. For example, actual consumption in agriculture, the largest water-consuming sector, depends on climatic conditions, crop composition and irrigation techniques. Energy is the least consuming sector, returning 95–97 % of the abstracted water.
The average water consumption index in Europe is 3 %. This index falls to 1 % for some central western and accession countries, and in Nordic countries. The highest consumption indices are found in those countries where agricultural water use predominates such as Cyprus, Malta, Spain, Italy, Portugal and Greece. Even though countries such as Germany and Belgium have high exploitation indices, their consumption indices are relatively low, reflecting the predominant water uses in those countries, that is, water for energy production.
Notes: Malta has an exploitation index of over 100, indicating that it uses a volume of water that exceeds its annual freshwater resources. This is because more than half of Malta’s water supply comes from desalinated brackish water which is not included in the calculation of its freshwater resources.
Key messages:
! The countries that have the highest agricultural water use have the highest consumption indices, consuming in some cases over 10 % of their annual available resource
Consumption (left hand side) and exploitation index (right hand side) in European countries
in the late 1990sFigure 5.5
111.4
0.09
-30 -20 -10 0 10 20 30 40 50
MaltaBelgiumCyprus
SpainItaly
GermanyRomaniaLithuania
PolandFrance
PortugalTurkey
Czech Republic
DenmarkGreece
United Kingdom
Netherlands
HungaryAustria
Luxembourg
IrelandFinland
SloveniaSweden
Slovak Rep.Latvia
NorwayIceland
Index (%)
Non-stressedLow stress
StressedSevere stress
Consumption index
Source: Eurostat.

86 Europe's water: An indicator-based assessment
Policy question: Is the use of water by sectors sustainable?
Notes: Southern accession countries (AC): Malta, Cyprus, Turkey.Western southern: France, Greece, Italy, Portugal, Spain.Nordic: Iceland, Finland, Norway, Sweden.Central accession countries (AC): Bulgaria, Czech Republic, Estonia, Hungary, Latvia, Lithuania, Poland, Romania, Slovak Republic, Slovenia.Western central: Austria, Belgium, Denmark, Germany, Netherlands, UK.
Sectoral use of water
Sectors have different demands for water across Europe. On average, 33 % of total water abstraction in countries is used for agriculture, 16 % for urban use, 11 % for industry (excluding cooling), and 40 % for energy production.
Figure 5.6 shows the sectoral use of water per region in Europe. The southern accession countries and western southern countries use the largest percentages of abstracted water for agriculture (75 %, and 50 %, respectively). Irrigation is the most significant use of water in agriculture in southern countries. Western central and western accession countries are the largest users of water for energy production (including cooling water) (57 %), followed by urban use. In particular, Belgium, Germany and Estonia use more than half of the abstracted water for energy production.
The decrease of agricultural and industrial activities in central accession countries during the transition process led to decreases of about 70 % in water abstracted for agricultural and industrial uses in most of the countries (Figure 5.7). Agricultural activities reached their minima around the mid-1990s, but more recently countries are increasing crop and livestock production (EC, 2002). Data show a 30 % decrease in abstractions for public water supply (urban use) in central accession countries. In most of these countries, the new economic conditions led to water supply companies increasing the price of water and installing water meters in houses. This resulted in people using less water. Industries connected to the public systems also reduced their industrial production and hence water use. In most countries, the supply network is obsolete and losses in distribution systems require high abstraction volumes to maintain supply.
Key messages:
During the 1990s:
☺ There were decreases in water abstracted for agriculture, industry and urban use in central accession and central western countries, and in water used for energy production in southern western and central western countries
& There was a slightly increasing trend in agricultural water use in southern western countries and in water abstracted for energy production in central accession countries
Figure 5.6 Sectoral use of water in the late 1990s
0 %
20 %
40 %
60 %
80 %
100 %
ACSouthern
WesternSouthern
WesternNordic
ACCentral
WesternCentral
Use
Energy Industry Urban Agriculture
Source: Eurostat.

Water quantity 87
Notes: Western southern: France, Greece, Italy, Portugal, Spain.Western central: Austria, Belgium, Denmark, France, Germany, Netherlands, UK.Central accession countries: Bulgaria, Czech Republic, Estonia, Hungary, Latvia, Lithuania, Poland, Romania, Slovak Republic, Slovenia.
Sectoral use of water in three regions of Europe Figure 5.7
Energy production
0
20
40
60
80
100
120
Western Southern Western CentralAccession countries Central
Agriculture
Urban
Rel
ativ
e to
19
90
1990
1991
1992
1993
1994
1995
1996
1997
1998
Industry
0
20
40
60
80
100
120
Western Southern Western CentralAccession countries Central
Rel
ativ
e to
19
90
1990
1991
1992
1993
1994
1995
1996
1997
1998
0
20
40
60
80
100
120
Western Southern Western CentralAccession countries Central
Rel
ativ
e to
19
90
1990
1991
1992
1993
1994
1995
1996
1997
1998
0
20
40
60
80
100
120
Western Southern Western CentralAccession countries Central
Rel
ativ
e to
19
90
1990
1991
1992
1993
1994
1995
1996
1997
1998
Source: Eurostat.

88 Europe's water: An indicator-based assessment
Policy question: Is the use of water by sectors sustainable?
Notes to Figures 5.8 and 5.9:It has been assumed that the main use of water for agriculture is for irrigation.Central accession countries: Bulgaria, Czech Republic, Estonia, Hungary, Latvia, Lithuania, Poland, Romania, Slovak Republic, Slovenia.Western (central and Nordic) Austria, Belgium, Denmark, Finland, Germany, Iceland, Ireland, Luxembourg, Netherlands, Norway, Sweden, UK.Western Southern: France, Greece, Italy, Portugal, Spain.Southern accession: Cyprus, Malta, Turkey.
Agricultural water use
Agriculture is the largest water-consuming sector, in particular for irrigation. The role of irrigation differs between countries and regions because of climatic conditions. In southern Europe, it is an essential element of agricultural production, whereas in central and northern Europe, irrigation is generally used to improve production in dry summers. A major influence on the amount of irrigated land in the EU has been the common agricultural policy which regulates the type and quantity of crops grown.
The area of irrigated land in western southern and southern accession countries increased steadily between 1993 and 1999, whereas in western Europe it remained relatively constant, and in central accession countries it steadily decreased. Southern European countries (western and accession) account for 74 % of the total irrigated area in Europe. In countries such as Turkey, it is expected to further increase in the near future following new irrigation developments. Changes in the economic structure and land ownership, and the consequent collapse of large-scale irrigation and drainage systems and agriculture production have been the main drivers for the agriculture changes in the past 10 years in the central accession countries.
The mean water allocation for agriculture increased from around 4 700 to 5 600 m3/ha/year between 1993 and 1999. There were, however, large differences between regions and countries. In southern countries it is three to four times higher than anywhere else and an increase from around 6 100 to 7 200 m3/ha/year was observed over this period, largely due to the increase in Cyprus, Spain and Turkey. Portugal had the largest per unit consumption in these countries in 1999. France showed a 50 % reduction over this period even though the irrigated area increased, thus implying some increase in irrigation water efficiency and/or changes in the crops being irrigated. In most western (central and Nordic) countries, the mean water allocation has decreased, with the exception of Denmark and the UK, where water used per irrigated area has increased steadily from 1993 to 1999. The mean per unit water consumption in central accession countries decreased steadily from 1 250 in 1993 to 500 m3/ha/year in 1999. This is because, even though large areas may be equipped for irrigation, they are not necessarily irrigated. This is due to economic changes and difficulties in these countries.
Key messages:
! Southern European countries have the largest area of irrigated land in Europe, and use around three times more water per unit of irrigated land than other parts of Europe
& The amount of water used for irrigation has increased in southern Europe and some western central countries in the 1990s, and in some countries it is likely to continue to increase
☺ In the central accession countries, the amount of water used for irrigation has decreased over the same period, largely because of the deterioration, and non-use, of irrigation systems in these countries
Figure 5.8 Irrigated land in Europe
Figure 5.9 Water use for irrigation
Accession (northern)Accession (southern)
Western (central+Nordic)Western (southern)
0
2 000
4 000
6 000
8 000
10 000
12 000
1993 1994 1995 1996 1997 1998 1999
Are
a (1
000
ha)
Source: FAO, Eurostat, national reports.
0
1 000
2 000
3 000
4 000
5 000
6 000
7 000
8 000
1993 1994 1995 1996 1997 1998 1999
m/h
a3
Accession (northern)Accession (southern)
Western (central+Nordic)Western (southern)
Source: FAO, Eurostat, national reports.
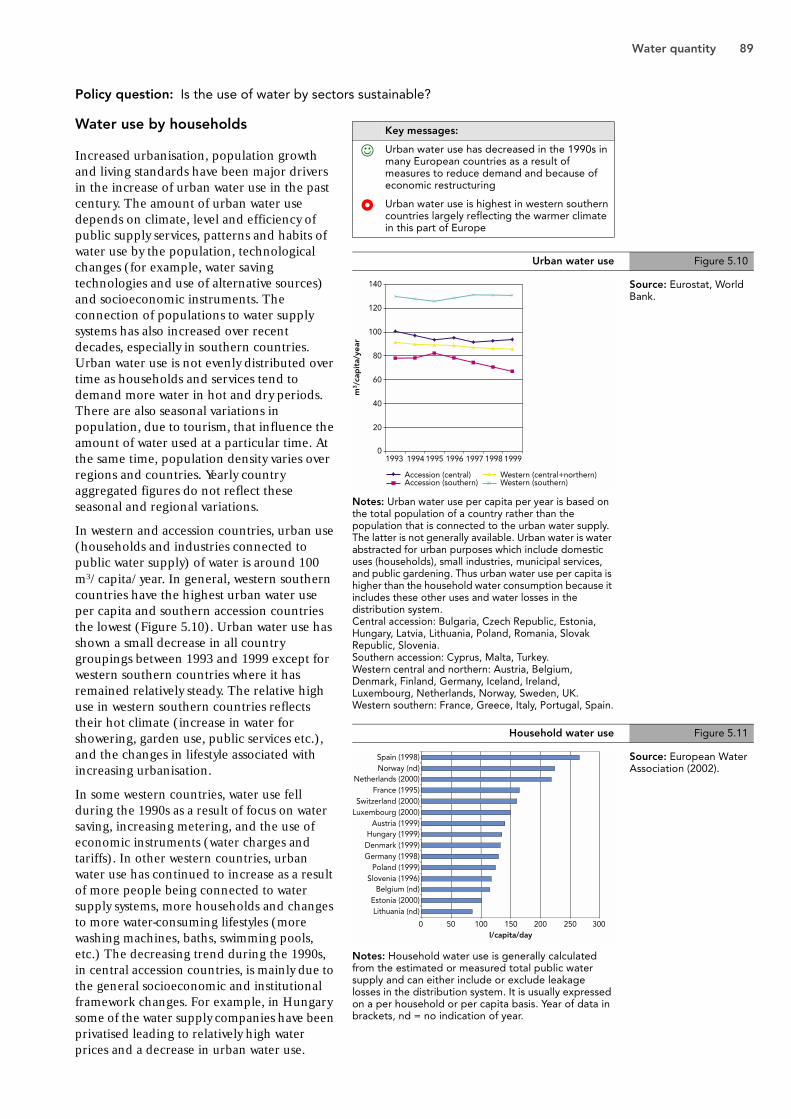
Water quantity 89
Policy question: Is the use of water by sectors sustainable?
Water use by households
Increased urbanisation, population growth and living standards have been major drivers in the increase of urban water use in the past century. The amount of urban water use depends on climate, level and efficiency of public supply services, patterns and habits of water use by the population, technological changes (for example, water saving technologies and use of alternative sources) and socioeconomic instruments. The connection of populations to water supply systems has also increased over recent decades, especially in southern countries. Urban water use is not evenly distributed over time as households and services tend to demand more water in hot and dry periods. There are also seasonal variations in population, due to tourism, that influence the amount of water used at a particular time. At the same time, population density varies over regions and countries. Yearly country aggregated figures do not reflect these seasonal and regional variations.
In western and accession countries, urban use (households and industries connected to public water supply) of water is around 100 m3/capita/year. In general, western southern countries have the highest urban water use per capita and southern accession countries the lowest (Figure 5.10). Urban water use has shown a small decrease in all country groupings between 1993 and 1999 except for western southern countries where it has remained relatively steady. The relative high use in western southern countries reflects their hot climate (increase in water for showering, garden use, public services etc.), and the changes in lifestyle associated with increasing urbanisation.
In some western countries, water use fell during the 1990s as a result of focus on water saving, increasing metering, and the use of economic instruments (water charges and tariffs). In other western countries, urban water use has continued to increase as a result of more people being connected to water supply systems, more households and changes to more water-consuming lifestyles (more washing machines, baths, swimming pools, etc.) The decreasing trend during the 1990s, in central accession countries, is mainly due to the general socioeconomic and institutional framework changes. For example, in Hungary some of the water supply companies have been privatised leading to relatively high water prices and a decrease in urban water use.
Notes: Urban water use per capita per year is based on the total population of a country rather than the population that is connected to the urban water supply. The latter is not generally available. Urban water is water abstracted for urban purposes which include domestic uses (households), small industries, municipal services, and public gardening. Thus urban water use per capita is higher than the household water consumption because it includes these other uses and water losses in the distribution system.Central accession: Bulgaria, Czech Republic, Estonia, Hungary, Latvia, Lithuania, Poland, Romania, Slovak Republic, Slovenia.Southern accession: Cyprus, Malta, Turkey.Western central and northern: Austria, Belgium, Denmark, Finland, Germany, Iceland, Ireland, Luxembourg, Netherlands, Norway, Sweden, UK.Western southern: France, Greece, Italy, Portugal, Spain.
Notes: Household water use is generally calculated from the estimated or measured total public water supply and can either include or exclude leakage losses in the distribution system. It is usually expressed on a per household or per capita basis. Year of data in brackets, nd = no indication of year.
Key messages:
☺ Urban water use has decreased in the 1990s in many European countries as a result of measures to reduce demand and because of economic restructuring
! Urban water use is highest in western southern countries largely reflecting the warmer climate in this part of Europe
Urban water use Figure 5.10
Household water use Figure 5.11
0
20
40
60
80
100
120
140
1993 1994 1995 1996 1997 1998 1999
m/c
apit
a/ye
ar3
Accession (central)Accession (southern)
Western (central+northern)Western (southern)
Source: Eurostat, World Bank.
0 50 100 150 200 250 300
Lithuania (nd)Estonia (2000)
Belgium (nd)Slovenia (1996)
Poland (1999)Germany (1998)Denmark (1999)Hungary (1999)
Austria (1999)Luxembourg (2000)Switzerland (2000)
France (1995)Netherlands (2000)
Norway (nd)Spain (1998)
I/capita/day
Source: European Water Association (2002).
90 Europe's water: An indicator-based assessment
Similarly in the Czech Republic, the water industry has been transferred from the State to municipalities with different forms of ownership, and water charges applied. In the Baltic States, meters were installed in private houses, higher water tariffs applied and renovation of old pipe systems carried out; all these measures have reduced urban water use. Bulgaria and Romania have relatively high urban water use per capita because of
breakdowns in water-supply networks, lack of water metering, water losses and water wastage.
The largest amount of household water used is found in Spain with 265 l/capita/day (Figure 5.11), followed by Norway (224 l/capita/day), Netherlands (218 l/capita/day and France (164 l/capita/day). Lithuania, Estonia and Belgium with 85, 100 and 115 l/capita/day, respectively, have the lowest household water use in those European countries with available information.

Water quantity 91
Policy question: Are the impacts of water abstractions being reduced?
Overall reservoir stocks
The use of storage reservoirs helps overcome the uneven distribution of natural water resources with time (see indicator on precipitation). Run-off in the wet season can be held back and used in the dry season (seasonal regulation), while water available in wet years can be stored and used in dry years (interannual regulation). The beneficial aspects of reservoirs in safeguarding water resources and supplies have to be balanced against the significant impacts that their construction and subsequent operation have on natural landscapes and ecosystems.
The primary functions of reservoirs in Europe are for hydroelectric power production, storage for public water supply and irrigation. Water is not always available to meet demands. In particular, water for urban use must be guaranteed and irrigation demands often need to be met during the dry season, when river discharges are at their annual lowest levels. Water storage by reservoirs helps to overcome this temporal unavailability of freshwater resources. In Europe, approximately 13 % of mean annual runoff is stored behind dams. It represents a significant increase in the standing stock of natural river water, with residence times for individual reservoirs spanning less than one day to several years.
The countries with the highest percentage volume of stored water in relation to their annual renewable freshwater resources (over 20 %) are Turkey, Spain and Cyprus (see Figure 5.12). These countries also use the highest percentage of their resources for irrigation. This activity demands the largest water volumes in the driest seasons, requiring winter storage. Spain and Cyprus are considered to be water stressed whilst Turkey has low water stress (see indicator on the water exploitation index). In many countries (such as Austria, Finland, France, Greece, Ireland, Italy, Norway, Portugal and Sweden) the majority of major reservoirs are used for hydropower production. In particular, the primary purpose of major reservoirs in Sweden and Norway is almost exclusively for hydroelectricity (EEA, 1999).
Notes: Countries included in each regional grouping are as defined in Figure 5.12.
Key messages:
! Southern European countries retain the highest proportion of their annual freshwater resources in storage reservoirs, often to safeguard supplies when other water resources are stressed. These countries use the highest proportion of their water resources for irrigation
! Hydropower generation is also a major use of storage reservoirs particularly in Nordic countries
Proportion of annual renewable freshwaterresources stored in reservoirs in European countries Figure 5.12
Proportion of annual renewable freshwaterresources stored in reservoirs in European regions Figure 5.13
0.3
0 20 40 60 80 100
SwedenFinland
Czech RepublicLithuaniaRomania
MaltaCyprusTurkeyIreland
GermanyBelgium
United KingdomNetherlands
AustriaItaly
FrancePortugalGreece
Spain
% stored in reservoirs
Western southernWestern centralSouthern accession
Northern accessionNordic
Source: EEA, FAO, UNECE, (2001).
0 20 40 60 80 100
Western central
Northernaccession
Nordic
Western southern
Southernaccession
Average % of annual resource stored in reservoirs
Source: EEA, FAO
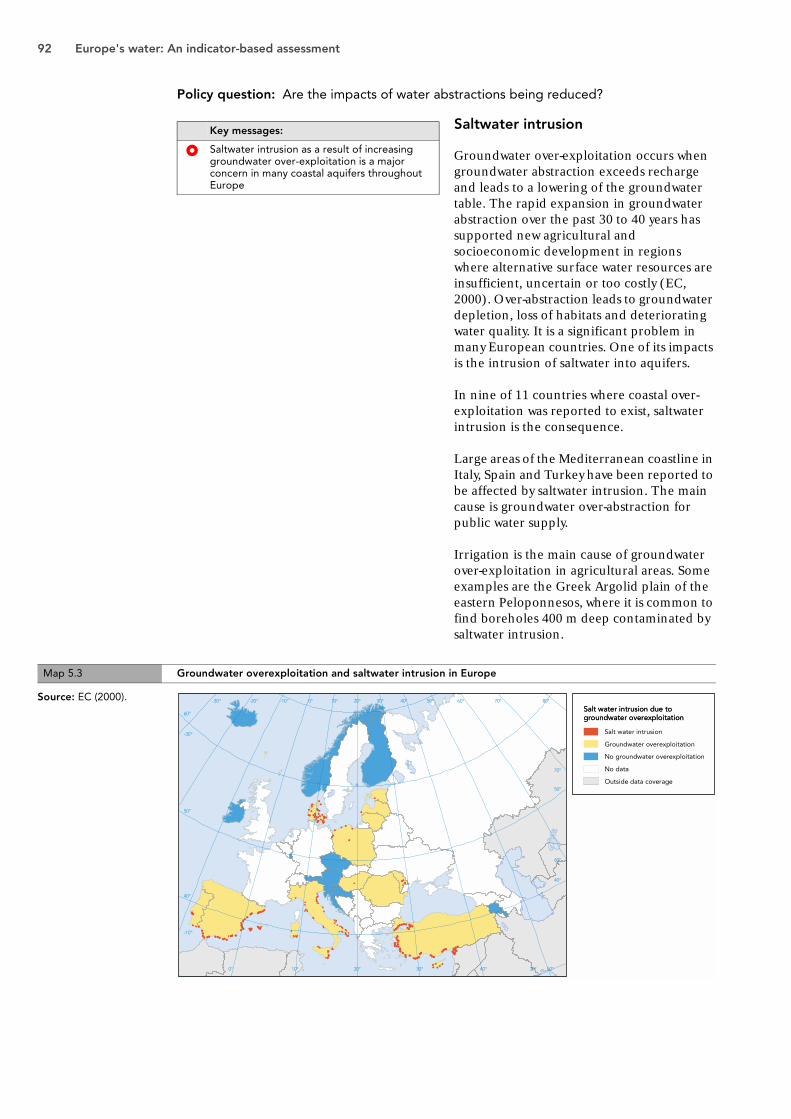
92 Europe's water: An indicator-based assessment
Policy question: Are the impacts of water abstractions being reduced?
Saltwater intrusion
Groundwater over-exploitation occurs when groundwater abstraction exceeds recharge and leads to a lowering of the groundwater table. The rapid expansion in groundwater abstraction over the past 30 to 40 years has supported new agricultural and socioeconomic development in regions where alternative surface water resources are insufficient, uncertain or too costly (EC, 2000). Over-abstraction leads to groundwater depletion, loss of habitats and deteriorating water quality. It is a significant problem in many European countries. One of its impacts is the intrusion of saltwater into aquifers.
In nine of 11 countries where coastal over-exploitation was reported to exist, saltwater intrusion is the consequence.
Large areas of the Mediterranean coastline in Italy, Spain and Turkey have been reported to be affected by saltwater intrusion. The main cause is groundwater over-abstraction for public water supply.
Irrigation is the main cause of groundwater over-exploitation in agricultural areas. Some examples are the Greek Argolid plain of the eastern Peloponnesos, where it is common to find boreholes 400 m deep contaminated by saltwater intrusion.
Key messages:
! Saltwater intrusion as a result of increasing groundwater over-exploitation is a major concern in many coastal aquifers throughout Europe
Map 5.3 Groundwater overexploitation and saltwater intrusion in Europe
Source: EC (2000).

Water quantity 93
Policy question: Are the impacts of water abstractions being reduced?
Groundwater levels
Over-abstraction of groundwater can lead to decreases in water levels in aquifers. In turn, these can lead to impacts on groundwater-dependent terrestrial and aquatic ecosystems such as wetlands. However, there are examples of how water resources can recover once over-abstraction has ceased.
For example, in Hungary (OECD, 2000) the intensity of groundwater use has fallen by one third since the mid-1980s. In Transdanubia, after over-abstraction of karstic groundwater by mining operations was halted in the early 1990s, the water table, which had fallen an average of 30 m, recovered. Intensive and non-balanced use of groundwater caused large underground depression fields, at Liepaja (1 000 km2) and Riga (7 000 km2) in Latvia, but decreased water consumption during the 1990s led to a gradual rise in the water level (Latvian Environment Agency, 2002) (Figure 5.14). In the Amsterdam Dunes, a large-scale artificial recharge scheme made possible a restoration of the freshwater store (EUCC, 2000). Since the Spanish La Mancha Occidental in the Upper Guadiana basin was declared over-exploited at the end of the 1980s, abstractions have fallen from 600 million m3 per year to the current 300 million m3, and there has been a marked recovery of the water stored in the aquifer, which also means a recovery of the valuable associated ecosystems (see Figure 5.15).
Demonstration indicator Key messages:
☺ Groundwater levels have increased in some European aquifers in response to decreases in groundwater abstraction
Groundwater level and water abstraction in Riga andLiepaja Figure 5.14
Annual abstractions from the aquifer (top) andwater-level recovery (bottom) at a representative
borehole in La Mancha OccidentalFigure 5.15
-15
-12
-9
-6
-3
0
1980 1983 1986 1989 1992 1995 19980
25
50
75
100
125
Groundwater level Water abstraction
Liepaja
-20
-15
-10
-5
0
1988 1990 1992 1994 1996 1998 20000
2
4
6
8
10
12
14
16
18
20
Ab
stra
ctio
n, m
il m
3
Leve
l, m
Riga
Ab
stra
ctio
n, m
il m
3
Leve
l, m
Groundwater level Water abstraction
Source: Latvian Environment Agency (2002).
0
100
200
300
400
500
600
1974 1976 1978 1980 1982 1984 1986 1988 1990 1992 1994 1996
35
30
25
20
15
10
5
0
1980 1982 1984 1986 1988 1990 1992 1994 1996 1998
Leve
l, m
Ab
stra
ctio
n,
mil
m3
Source: MMA (2000)
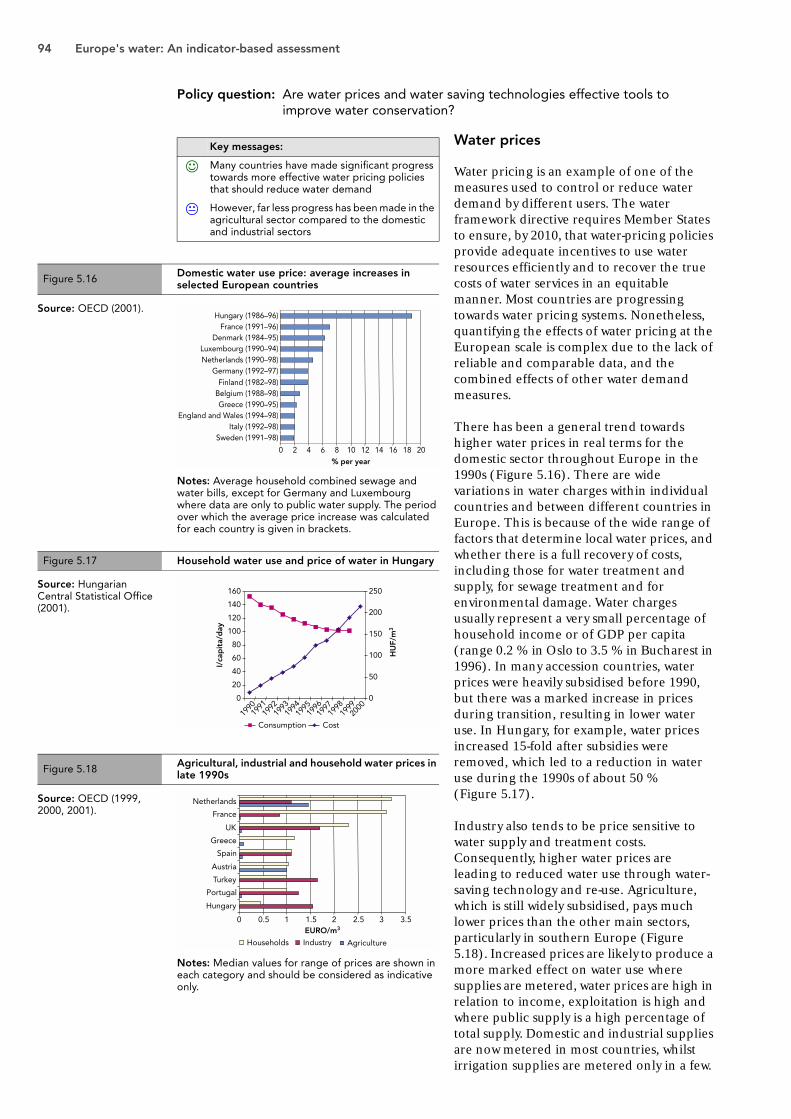
94 Europe's water: An indicator-based assessment
Policy question: Are water prices and water saving technologies effective tools to improve water conservation?
Notes: Average household combined sewage and water bills, except for Germany and Luxembourg where data are only to public water supply. The period over which the average price increase was calculated for each country is given in brackets.
Notes: Median values for range of prices are shown in each category and should be considered as indicative only.
Water prices
Water pricing is an example of one of the measures used to control or reduce water demand by different users. The water framework directive requires Member States to ensure, by 2010, that water-pricing policies provide adequate incentives to use water resources efficiently and to recover the true costs of water services in an equitable manner. Most countries are progressing towards water pricing systems. Nonetheless, quantifying the effects of water pricing at the European scale is complex due to the lack of reliable and comparable data, and the combined effects of other water demand measures.
There has been a general trend towards higher water prices in real terms for the domestic sector throughout Europe in the 1990s (Figure 5.16). There are wide variations in water charges within individual countries and between different countries in Europe. This is because of the wide range of factors that determine local water prices, and whether there is a full recovery of costs, including those for water treatment and supply, for sewage treatment and for environmental damage. Water charges usually represent a very small percentage of household income or of GDP per capita (range 0.2 % in Oslo to 3.5 % in Bucharest in 1996). In many accession countries, water prices were heavily subsidised before 1990, but there was a marked increase in prices during transition, resulting in lower water use. In Hungary, for example, water prices increased 15-fold after subsidies were removed, which led to a reduction in water use during the 1990s of about 50 % (Figure 5.17).
Industry also tends to be price sensitive to water supply and treatment costs. Consequently, higher water prices are leading to reduced water use through water-saving technology and re-use. Agriculture, which is still widely subsidised, pays much lower prices than the other main sectors, particularly in southern Europe (Figure 5.18). Increased prices are likely to produce a more marked effect on water use where supplies are metered, water prices are high in relation to income, exploitation is high and where public supply is a high percentage of total supply. Domestic and industrial supplies are now metered in most countries, whilst irrigation supplies are metered only in a few.
Key messages:
☺ Many countries have made significant progress towards more effective water pricing policies that should reduce water demand
% However, far less progress has been made in the agricultural sector compared to the domestic and industrial sectors
Figure 5.16 Domestic water use price: average increases in selected European countries
Figure 5.17 Household water use and price of water in Hungary
Figure 5.18 Agricultural, industrial and household water prices in late 1990s
0 2 4 6 8 10 12 14 16 18 20
Sweden (1991–98)Italy (1992–98)
England and Wales (1994–98)Greece (1990–95)
Belgium (1988–98)Finland (1982–98)
Germany (1992–97)Netherlands (1990–98)Luxembourg (1990–94)
Denmark (1984–95)France (1991–96)
Hungary (1986–96)
% per year
Source: OECD (2001).
0
20
40
60
80
100
120
140
160
1990
1991
1992
1993
1994
1995
199619
9719
9819
9920
000
50
100
150
200
250
Consumption Cost
I/ca
pit
a/d
ay
HU
F/m
3
Source: Hungarian Central Statistical Office (2001).
0 0.5 1 1.5 2 2.5 3 3.5
Hungary
Portugal
Turkey
Austria
Spain
Greece
UK
France
Netherlands
Households Industry Agriculture
EURO/m3
Source: OECD (1999, 2000, 2001).

Water quantity 95
Policy question: Are water prices and water saving technologies effective tools to improve water conservation?
Water use efficiency
Water demand management measures are being introduced to promote water use efficiency in the major water sectors. Improved water efficiency is being reinforced by water prices and European and national legislation.
Higher standards of living are changing water demand patterns. This is reflected mainly in increased domestic water use, especially from personal hygiene. Most of the European population has indoor toilets, showers and/or baths for daily use. The result is that most of the urban water consumption is for domestic use. Most of the water use in households is for toilet flushing (33 %), bathing and showering (20-32 %), and for washing machines and dishwashers (15 %). The proportion of water used for cooking and drinking (3 %) is minimal compared to the other uses. Statistics and experience has shown that there is a potential to improve the water efficiency of common household appliances such as toilets, taps and washing machines. For example, new technologies have reduced the amount of water used by domestic appliances such as washing machines and dishwashers over the last 30 years (Figure 5.19).
Data at the European scale are insufficient to undertake a thorough and quantitative assessment of the water savings achieved, and whether these are being introduced equally and with sufficient speed to meet policy requirements to improve the environment or to meet sustainability targets. Improvements in water use efficiency in the agricultural sector generally lag behind those in the urban and industrial sectors.
The impact of the use of household water-saving devices on total urban demand will be different depending on the proportion of household demand in total urban demand. For some countries, savings of up to 40 % of total urban demand might be achievable. In addition to maximising potential savings, it would be necessary to encourage market penetration of technological devices by increasing information for users and seeking the cooperation of producers.
Key messages:
☺ Water use efficiency has been improved in various water-saving devices in households, public places and industry
Water used for (a) washing machines and (b) dishwashers Figure 5.19
0
20
40
60
80
100
120
140
160
180
1970 1980 1985 1988 1992 1998
0
10
20
30
40
50
60
1970 1980 1985 1992 1997 1999
litre
s/cy
cle
litre
s/cy
cle
(a)
(b)
Source: Grypo (1999).

96 Europe's water: An indicator-based assessment
Policy question: Are water prices and water saving technologies effective tools to improve water conservation?
Notes: Year of data given in brackets.
Notes: Loss as percentage of total public water supply.
Water leakage
Losses of water in the distribution network can reach high percentages of the volume introduced. The problems with leakage are not only related to the efficiency of the network but also to water quality (contamination of drinking water if the pressure in the distribution network is very low). Leakage reduction applies to both distribution and customer supply networks.
Leakage losses are still significant in many urban areas (Figure 5.20). Commonly, this is due to the poor condition of water mains. Germany has low leakage levels due to a combination of favourable soil conditions, treatment to reduce the aggressiveness of the water supplied, easy access to repair mains and a high level of mains replacement. In accession countries, losses are significant and large parts of the distribution networks are made from worn asbestos cement pipes. Maintenance of the existing infrastructure is also neglected in most countries. Network losses in Slovenia in 1985 and 1990 were 31.7 and 30.4 % of total water urban supply, respectively, but increased to an average of 43.8 % during the period 1994–98 (Figure 5.21). In Slovenia, reconstruction of the water supply network started in 1995 by changing asbestos pipes.
Progress is being made to reduce leakage losses in some countries. In England and Wales, an active programme of leakage reduction reduced network losses from 29 to 22 % of the total distribution input between 1992/3 and 2000/1 (Figure 5.21). In Malta, leakage control policies have been introduced to reduce leakage rates by 55 % from 1995 to 2001. However, in Spain average water losses in the distribution network increased from 20.0 to 21.4 % between 1996 and 1999, with only four regions recording a reduction in water losses over this period.
Key messages:
! Leakage losses are significant in many urban areas
☺ Progress is being made in some countries to reduce water leakage from urban distribution systems
Figure 5.20 Losses from urban water networks
Figure 5.21 Urban leakage in Spain, UK and Slovenia
0 10 20 30 40 50
Germany (1999)Denmark (1997)
Finland (1999)Sweden (2000)
Spain (1999)UK (2000)
Slovak Rep. (1999)France (1997)
Italy (2001)Romania (1999)
Czech Rep.Ireland (2000)
Hungary (1995)Slovenia (1999)
Bulgaria
% of water supply
Source: EEA-ETC/WTR.
0
5
10
15
20
25
30
35
40
45
50
1990
1991
1992
1993
1994
1995
1996
1997
1998
1999
2000
Spain UK Slovenia
% lo
ss
Source: Spain, INES; UK, Ofwat; Slovenia, Statistical Office.

Water quantity 97
5.4 References
CRU (1998). Representing 20th century space-time climate variability. II Development of 1901–96 monthly grids of terrestrial surface climate. Climate Research Unit. School of Environmental Sciences, University of East Anglia, UK.
EC (2000). The environmental impacts of irrigation in the European Union. http://europa.eu.int/comm/environment/agriculture/pdf/irrigation/.pdf.
EC (2002). Agricultural situation in the candidate countries. Country reports. EC-DG Agriculture. Brussels.
EEA (1999). Lakes and reservoirs in the EEA area. Topic report No 1, European Environment Agency, Copenhagen.
EUCC (2000). Coastal guide on dune management. European Union for Coastal Conservation, International Secretariat, Leide, Netherlands, http://www.coastalguide.org/.
European Water Association (2002). European Water Association Yearbook 2002. Available from: http://www.ewaonline.de, Hennef, Germany.
Grypo (1999). Water efficiency in cities. International Conference. Ahoro de agua en la industria — Grypo BYSE Electrodomesticos. S.A. Zaragoza. Spain. 20–22 January 1999.
Hungarian Central Statistical Office, 2001: Towards the application of the international water-related environmental indicators in Hungary. In UNECE Env. Stat. 2001: Towards the application of the international water
related environmental indicators in Hungary (Hungary, CSO).See doc. 4http://www.unece.org/stats/documents/2001.10.env.htm.
IPCC (2001). Climate change 2001: The scientific basis. Contribution of Working Group 1 to the Third Assessment Report of Intergovernmental Panel on Climate Change the WMO/UNEP/IPCC. Chapters 1, 2, 9 and 10.
Klein Tank, A.M.G., J.B. Wijngaard, G.P. Können, R. Böhm, G. Damarée, A. Gocgeva, M. Mileta, S. Pashiardis, L. Heijkrlik, C. Kern-Hansen et al (2001). Daily surface air temperature and precipitation data set 1901–99 for European Climate Assessment (ECA), Int. J. of Climatol.
Latvian Environment Agency (2002). Environmental Indicators in Latvia 2002 http://www.vdc.lv/soe/2001_eng/.
MMA (2000). Libro Blanco del Agua en Espanna. Spanish Ministry of Environment, Madrid, 2000.
OECD (1998). Household water pricing in OECD countries.
OECD (1999). Compendium of environmental statistics.
OECD (2000). Environmental performance review Hungary.
OECD (2001). The price of water: trends in OECD countries.
UNECE (2001). Environmental performance reviews series Nº 13. Romania. UN Economic Commission for Europe. New York and Geneva.

98 Europe's water: An indicator-based assessment

Water quantity 99
European Environment Agency
Europe's water: An indicator-based assessment
2003 – 97 pp. – 21 x 29.7 cm
ISBN 92-9167-581-4