Three hundred ways to assess Europe's surface waters: An almost complete overview of biological...
11
Author's personal copy Ecological Indicators 18 (2012) 31–41 Contents lists available at SciVerse ScienceDirect Ecological Indicators jo ur nal homep age: www.elsevier.com/locate/ecolind Three hundred ways to assess Europe’s surface waters: An almost complete overview of biological methods to implement the Water Framework Directive Sebastian Birk a,∗ , Wendy Bonne b , Angel Borja c , Sandra Brucet b , Anne Courrat d , Sandra Poikane b , Angelo Solimini e , Wouter van de Bund b , Nikolaos Zampoukas b , Daniel Hering a a University of Duisburg-Essen, Faculty of Biology, Applied Zoology/Hydrobiology, Universitätsstraße 5, 45141 Essen, Germany b European Commission, Joint Research Centre, Institute for Environment and Sustainability, 21027 Ispra, Italy c AZTI-Tecnalia, Marine Research Division, Herrera Kaia, Portualdea s/n, 20110 Pasaia, Spain d CEMAGREF - UR EPBX, 50 avenue de Verdun, 33612 Cestas, France e Department of Public Health and Infectious Diseases, Sapienza University of Rome, Roma, Italy a r t i c l e i n f o Article history: Received 19 September 2011 Received in revised form 15 October 2011 Accepted 19 October 2011 Keywords: Bioassessment Ecological status boundaries Biological metric Pressure-impact relationship Taxonomic resolution Sampling precision and representativeness a b s t r a c t According to the Water Framework Directive (WFD), the status of European surface waters is assessed using aquatic organism groups. Here we present an overview of 297 assessment methods, based on a ques- tionnaire survey addressing authorities in all countries implementing the WFD. Twenty-eight countries reported on methods applied to rivers (30%), coastal waters (26%), lakes (25%) and transitional waters (19%). More than half of the methods are based on macroscopic plants (28%) or benthic invertebrates (26%); in addition, phytoplankton (21%), fish (15%) and phytobenthos (10%) were assessed. Countries of Central and Western Europe had developed almost all methods required for the WFD implementa- tion. Two main sampling strategies were discernable: small-scale sampling of the taxonomically diverse groups of benthic invertebrates and phytobenthos that demand elaborate processing, versus large-scale sampling of vast, species-poor plant stands or the mobile fish fauna. About three-quarters of meth- ods identified organisms to species-level while in particular phytoplankton-based methods used class- or phylum-level, or included no taxonomic information. Out of nine metric types distinguished, river methods used more sensitivity and trait metrics while for other water categories abundance metrics pre- vailed. Fish-based methods showed the highest number of metrics. Fifty-six percent of methods focussed on the detection of eutrophication and organic pollution, with shares decreasing from autotrophic to heterotrophic organism groups: phytoplankton > phytobenthos > macroscopic plants > benthic inverte- brates > fish fauna. The order was almost reverse for hydrological or morphological deterioration: fish fauna and macroscopic plants > benthic invertebrates > phytoplankton > phytobenthos. These pressures were mainly assessed by methods applied to rivers and transitional waters. The pressure-impact relation- ship of about one-third of methods was not tested empirically with methods for transitional waters being the least validated. The strength of relationships differed significantly between organism groups and water categories. The correlation coefficients generally covered a broad range (<0.4 to >0.8), but on aver- age with the pattern: phytoplankton > macroscopic plants > benthic invertebrates > phytobenthos and fish fauna. In terms of water categories the following order resulted: coastal waters > lakes > transitional waters > rivers. Status boundaries were mostly defined using statistical approaches. We advocate better reflection of the necessary sampling effort and precision, full validations of pressure-impact relationships and an implementation of more ecological components into classification. © 2011 Elsevier Ltd. All rights reserved. 1. Introduction Aquatic bioindicators are organisms accumulating toxic sub- stances or responding to environmental stress, such as pollution, ∗ Corresponding author Present address: Östvedavägen 180, 81040 Hedesunda, Sweden. Tel.: +46 72 7155117. E-mail address: [email protected] (S. Birk). nutrient enrichment, habitat loss or overexploitation (Adams, 2002). Bioindication requires standardized procedures including field sampling, sample processing and identification of collected organisms. The gathered information on occurring taxa is then usu- ally summarised in biological metrics (Karr and Chu, 1999), which are compared to standards or reference values and classified into quality classes. Each of these steps could be done in countless ways: sampling can be performed with different equipment, identifica- tion of organisms can be to different taxonomic levels and based on 1470-160X/$ – see front matter © 2011 Elsevier Ltd. All rights reserved. doi:10.1016/j.ecolind.2011.10.009
Transcript of Three hundred ways to assess Europe's surface waters: An almost complete overview of biological...
Author's personal copy
Ecological Indicators 18 (2012) 31–41
Contents lists available at SciVerse ScienceDirect
Ecological Indicators
jo ur nal homep age: www.elsev ier .com/ locate /eco l ind
Three hundred ways to assess Europe’s surface waters: An almost completeoverview of biological methods to implement the Water Framework Directive
Sebastian Birka,∗, Wendy Bonneb, Angel Borjac, Sandra Brucetb, Anne Courratd, Sandra Poikaneb,Angelo Soliminie, Wouter van de Bundb, Nikolaos Zampoukasb, Daniel Heringa
a University of Duisburg-Essen, Faculty of Biology, Applied Zoology/Hydrobiology, Universitätsstraße 5, 45141 Essen, Germanyb European Commission, Joint Research Centre, Institute for Environment and Sustainability, 21027 Ispra, Italyc AZTI-Tecnalia, Marine Research Division, Herrera Kaia, Portualdea s/n, 20110 Pasaia, Spaind CEMAGREF - UR EPBX, 50 avenue de Verdun, 33612 Cestas, Francee Department of Public Health and Infectious Diseases, Sapienza University of Rome, Roma, Italy
a r t i c l e i n f o
Article history:Received 19 September 2011Received in revised form 15 October 2011Accepted 19 October 2011
Keywords:BioassessmentEcological status boundariesBiological metricPressure-impact relationshipTaxonomic resolutionSampling precision and representativeness
a b s t r a c t
According to the Water Framework Directive (WFD), the status of European surface waters is assessedusing aquatic organism groups. Here we present an overview of 297 assessment methods, based on a ques-tionnaire survey addressing authorities in all countries implementing the WFD. Twenty-eight countriesreported on methods applied to rivers (30%), coastal waters (26%), lakes (25%) and transitional waters(19%). More than half of the methods are based on macroscopic plants (28%) or benthic invertebrates(26%); in addition, phytoplankton (21%), fish (15%) and phytobenthos (10%) were assessed. Countriesof Central and Western Europe had developed almost all methods required for the WFD implementa-tion. Two main sampling strategies were discernable: small-scale sampling of the taxonomically diversegroups of benthic invertebrates and phytobenthos that demand elaborate processing, versus large-scalesampling of vast, species-poor plant stands or the mobile fish fauna. About three-quarters of meth-ods identified organisms to species-level while in particular phytoplankton-based methods used class-or phylum-level, or included no taxonomic information. Out of nine metric types distinguished, rivermethods used more sensitivity and trait metrics while for other water categories abundance metrics pre-vailed. Fish-based methods showed the highest number of metrics. Fifty-six percent of methods focussedon the detection of eutrophication and organic pollution, with shares decreasing from autotrophic toheterotrophic organism groups: phytoplankton > phytobenthos > macroscopic plants > benthic inverte-brates > fish fauna. The order was almost reverse for hydrological or morphological deterioration: fishfauna and macroscopic plants > benthic invertebrates > phytoplankton > phytobenthos. These pressureswere mainly assessed by methods applied to rivers and transitional waters. The pressure-impact relation-ship of about one-third of methods was not tested empirically with methods for transitional waters beingthe least validated. The strength of relationships differed significantly between organism groups andwater categories. The correlation coefficients generally covered a broad range (<0.4 to >0.8), but on aver-age with the pattern: phytoplankton > macroscopic plants > benthic invertebrates > phytobenthos andfish fauna. In terms of water categories the following order resulted: coastal waters > lakes > transitionalwaters > rivers. Status boundaries were mostly defined using statistical approaches. We advocate betterreflection of the necessary sampling effort and precision, full validations of pressure-impact relationshipsand an implementation of more ecological components into classification.
© 2011 Elsevier Ltd. All rights reserved.
1. Introduction
Aquatic bioindicators are organisms accumulating toxic sub-stances or responding to environmental stress, such as pollution,
∗ Corresponding author Present address: Östvedavägen 180, 81040 Hedesunda,Sweden. Tel.: +46 72 7155117.
E-mail address: [email protected] (S. Birk).
nutrient enrichment, habitat loss or overexploitation (Adams,2002). Bioindication requires standardized procedures includingfield sampling, sample processing and identification of collectedorganisms. The gathered information on occurring taxa is then usu-ally summarised in biological metrics (Karr and Chu, 1999), whichare compared to standards or reference values and classified intoquality classes. Each of these steps could be done in countless ways:sampling can be performed with different equipment, identifica-tion of organisms can be to different taxonomic levels and based on
1470-160X/$ – see front matter © 2011 Elsevier Ltd. All rights reserved.doi:10.1016/j.ecolind.2011.10.009
Author's personal copy
32 S. Birk et al. / Ecological Indicators 18 (2012) 31–41
different keys, and there is a huge number of assessment metricsand procedures for class boundary setting. In Europe, bioassess-ment methods differ also geographically, as organism response tostress may vary by region and ecosystem type, different speciesmay occur, relevant stressors may differ and applicable taxonomicresolution may vary with the knowledge of the regional fauna andflora.
Over the last ten years biomonitoring of European aquaticecosystems changed substantially. The development was drivenby the EU Water Framework Directive 2000/60/EC (WFD), whichrequired assessment methods for different ecosystem types(“water categories”: rivers, lakes, transitional waters, coastalwaters) and different organism groups (“biological quality ele-ments” = BQEs: phytoplankton, aquatic flora, benthic invertebrates,fish). The WFD has changed management objectives from merelypollution control to ensuring ecosystem integrity (Borja et al.,2008). Deterioration and improvement of “ecological status” isdefined by the response of the biota, rather than by changes inenvironmental parameters. This response must be investigated atthe level of the “water body” (e.g. a river stretch, a lake or a partof a coastal water), which represents the classification and man-agement unit of the WFD. Water bodies of the same category aregrouped into “water body types”, for each of which undisturbed ref-erence states are defined (i.e. the taxa expected in the absence ofhuman pressures). In biological assessment, the observed conditionis compared against the reference status with the result given in fiveclasses: high status (no differences to reference conditions), goodstatus (slight differences), moderate status (moderate differences),poor and bad status (major differences). Good ecological status rep-resents the target value that all surface water bodies have to achievein the near future. While the WFD indicates what characteristics ofthe BQEs should be assessed (e.g. “abundance”, “community com-position”) it does not specify, however, which indices or metrics ofthese various elements should be used (Hering et al., 2010). Thisdecision was left to the EU Member States.
Just developing methods for the different combinations of BQEsand water categories would have resulted in about 20 methods.However, many countries preferred developing country-specificmethods, either to continue using existing time series by adaptingtheir national methods to the WFD, or to regard for the specificecoregional and biogeographic situation; therefore, a multitudeof methods resulted instead of a handful of methods applicableEurope-wide (e.g. Birk and Schmedtje, 2005; Borja et al., 2009).
Here we present for the first time an almost complete overviewof bioassessment methods for European aquatic ecosystems whichwere adapted or newly developed for the WFD. We search forcommonalities and differences within the full range of methods,focussing on the implementation of scientific concepts and stan-dards of aquatic bioassessment guided by six questions:
(a) Do the bioassessment methods cover all BQEs and water cate-gories across Europe? Ideally, the same BQEs should be appliedin all EU Member States allowing for an integrated ecologicalevaluation.
(b) Is the effort to acquire the biological data sufficient and feasibleto fulfil the assessment objectives? Sampling procedure greatlyinfluences the results of bioassessment. Thus, sampling must besufficiently precise and representative of the relevant BQE char-acteristics in time and space (de Jonge et al., 2006). At the sametime, sampling should not be overcomplicated to save costs.
(c) Is the taxonomic resolution appropriate for the assessmentmethod? Taxonomic composition represents a key parameterin the assessment of ecological status. The degree of taxo-nomic resolution is imperative for ecological precision, availableexpertise and associated costs.
(d) Is the selection of biological assessment metrics well-balanced?Biological metrics should reflect different types of responses tohuman disturbances and different levels of ecological hierarchyfrom individuals to landscape (Karr and Chu, 1999).
(e) Is the methods’ response to anthropogenic pressure known andquantified? Ecological classification should reflect the degree ofhuman influence on the aquatic ecosystem (Borja et al., 2011).
(f) Does the quality class boundary setting follow an ecologicalrationale? Boundaries should represent tipping-points in qual-ity defined by thresholds relevant to the ecosystem (Groffmanet al., 2006).
2. Material and methods
2.1. Data collection
Data on national assessment methods were collated usinga questionnaire. This process was part of the official reportingprocedure of the European intercalibration exercise to gain fulldescriptions of biological assessment methods used in nationalWFD monitoring programmes (European Commission, 2010). Weprepared a questionnaire following the principles described byOppenheim (1998) and Noelle-Neumann and Petersen (2005),comprising 66 questions that covered the topics general informa-tion, data acquisition and data evaluation (see supplementary data).Addressees included coordinators at national water administra-tions, members of the WFD Working Group on Ecological Status(ECOSTAT) and leading scientists in the European intercalibrationexercise. Expert selection ensured a complete coverage of coun-tries implementing the WFD and experts for each water categoryand BQE in the individual countries. We asked the recipients toforward the questionnaire to other experts, if necessary.
Data from questionnaires returned until November2010 were analysed in this publication. The full data wereentered into an online database (Birk et al., 2010) accessibleat http://www.wiser.eu/programme-and-results/data-and-guidelines/method-database/. To complete data gaps or clarifyambiguous information on specific aspects of reported methods,we consulted the scientific literature cited in the questionnaires.
2.2. Data analysis
We described the frequency distributions of selected parame-ters using pie charts, and compared the parameter values amongBQEs and water categories by with the Kruskal-Wallis H-Test. Forthis we defined analytical units (AU) by comparing the methodsbetween water categories, BQE or pressure-responses dependingon the research question. A method that is used in coastal and tran-sitional waters, for instance, was assigned to two AUs. For someanalyses we aggregated the BQEs freshwater macrophytes, marineangiosperms and macroalgae into “macroscopic plants”. Togetherwith freshwater phytobenthos these BQEs represent the “benthicflora”.
To analyse the categories of sampling and biological metricselection we applied Multiple Correspondence Analysis (MCA).Homogeneity in the dataset and the absence of rare categories werechecked in order to avoid bias (Escofier and Pagès, 1990). For themultivariate analyses data were analysed as complete disjunctivetables. Since the data basis comprised some incomplete informa-tion, the number of methods used in the analyses slightly differedwith research question (Table 1).
2.2.1. Coverage of aquatic bioassessmentTo summarise the outcomes of the questionnaire survey we
quantified the total number of biological assessment methods, anddescribed the relative shares of BQEs and water categories covered
Author's personal copy
S. Birk et al. / Ecological Indicators 18 (2012) 31–41 33
Table 1Number of national methods (N) and analytical units (AU) used in the analyses.
Analysed method components N AU
Availability of bioassessment methodsGeneral overview 297 324b, 300c
Methods’ completeness 290a 290Sampling
Sampling season 279 308d
Sample size 196 208c
Sampling site selection 278 305d
Taxonomic resolution 288 288Biological metric selection 290a 1170e
Pressure-impact relationshipScope of detected pressures 290 495b, 458c
Tested relationship 269 295b, 282c
Strength of relationship 110 119b, 115c
Number of observations to validate relationship 131 139b, 134c
Quality class boundary setting 259 259
a Including only methods for which biological assessment metrics werespecified.
b Number of AU among water categories.c Number of AU among biological quality elements.d “Active individuals” (i.e. analytical units) in Multiple Correspondence Analysis.e Biological metrics as “active individuals” in Multiple Correspondence Analysis.
Table 2Categories of the sampling criteria.
Criterion Categories
Sample size Small surface area (<20 m2)Medium surface area (20–100 m2)Large surface area (>100 m2)Entire water body
Samplingseason
Spring (mid-March to mid-June)Summer (mid-June to mid-September)Autumn (mid-September to end of November)Winter (December to mid-March)Number of sampled seasons
Sample siteselection
Expert-basedRandomStratified
by the methods. Furthermore, we evaluated if all BQEs and watercategories across Europe were covered by this survey. In theory,a country should have adopted assessment methods for each BQEdefined for each water category located within its territory. Werelated the number of methods that were actually described to thistheoretical value to gain the percent of method coverage for eachcountry.
2.2.2. SamplingIn order to investigate the sampling strategies of aquatic
bioassessment methods in Europe we analysed the informationabout sample size, sampling season and site selection. The dataprovided in the questionnaires were categorised (Table 2) andtested for differences in sample sizes between BQEs and water cat-egories. For the criteria of sampling season and site selection weapplied MCA. Aquatic flora was separated into macroscopic plantsand phytobenthos as we expected systematic sampling differencesbetween these elements. Phytoplankton methods were excludedfrom the analysis of sample size as it was not possible to categorisethe sampled volumes using the available data.
2.2.3. Taxonomic resolutionBy reviewing the list of assessment metrics used by each method
we identified which taxonomic level was required to allow forcalculating all metrics applied by the method. If, for example, (1)number of families and (2) total abundance of sampled organisms
were used in a multimetric scheme, family-level identification wasselected as the lowest taxonomic unit required by the method.
2.2.4. Biological metric selectionBased on existing metric classifications (Karr and Chu, 1999;
Hering et al., 2006) we grouped metrics into the following types:(1) metrics that did not account for ecological characteristics buttaxonomy (“taxonomy-based metrics”), (2) metrics that accountfor ecological characteristics (“autecology-based metrics”) and (3)non-biotic metrics (e.g. spatial extent of suitable habitats).
The first category (“taxonomy-based metrics”) were furthersubdivided as:
• richness metrics, i.e. number of taxa of a certain organism group(e.g. total taxa richness, richness of Ephemeroptera, Trichopteraand Plecoptera taxa) and proportional richness metrics,
• metrics of abundance and productivity (including age- and size-structure), also expressed as proportion of a total,
• diversity metrics, i.e. a combination of richness and abundancemetrics, and
• methods based on taxonomic assemblage comparisons betweensites (e.g. multivariate approaches).
The second category (“autecology-based metrics”) includedmetrics in which taxa were characterised by
• sensitivity to disturbance (whereas disturbance could be nutrientenrichment, organic pollution, acidification, etc.),
• autecological traits,• individual condition (e.g. individual health, physiological charac-
teristics)• native vs. non-native (alien) taxa.
2.2.5. Pressure-impact relationshipWe evaluated the questionnaire replies on the pressures
detected by each method, using four categories of pres-sure: eutrophication/organic pollution, hydrology/morphology (i.e.aquatic habitat deterioration, flow modification, hydromorpholog-ical degradation, riparian habitat alteration), other water qualityaspects (i.e. acidification, heavy metals, pollution by organic com-pounds such as DDT, PCB) and unspecific pressure (i.e. generaldegradation). We checked if the pressure-impact relationship wastested for method development. We reviewed the strength of therelationships (expressed as correlation coefficients) and the num-ber of observations used to empirically validate the relationships.If methods were tested against the same stressor at different waterbody types we averaged the correlation coefficients per pressurecategory. Responses to different pressures were kept separately inthe analysis.
2.2.6. Quality class boundary settingWe specified five approaches of boundary setting grouped
into ecological, statistical and expert-based types of classifications(Table 3). We assigned one classification type to each methodaccording to the approaches specified by the respondent. For mul-tiple statements we followed the hierarchy of setting optionsestablished by the European Commission (2003, 2010): If amongothers ecological approaches were used, we classified the assess-ment method accordingly. Any use of statistical setting withoutecological approaches resulted in a classification as statistical type.Expert-based setting was only assigned if stated by the respondentwithout mentioning ecological or statistical approaches.
Author's personal copy
34 S. Birk et al. / Ecological Indicators 18 (2012) 31–41
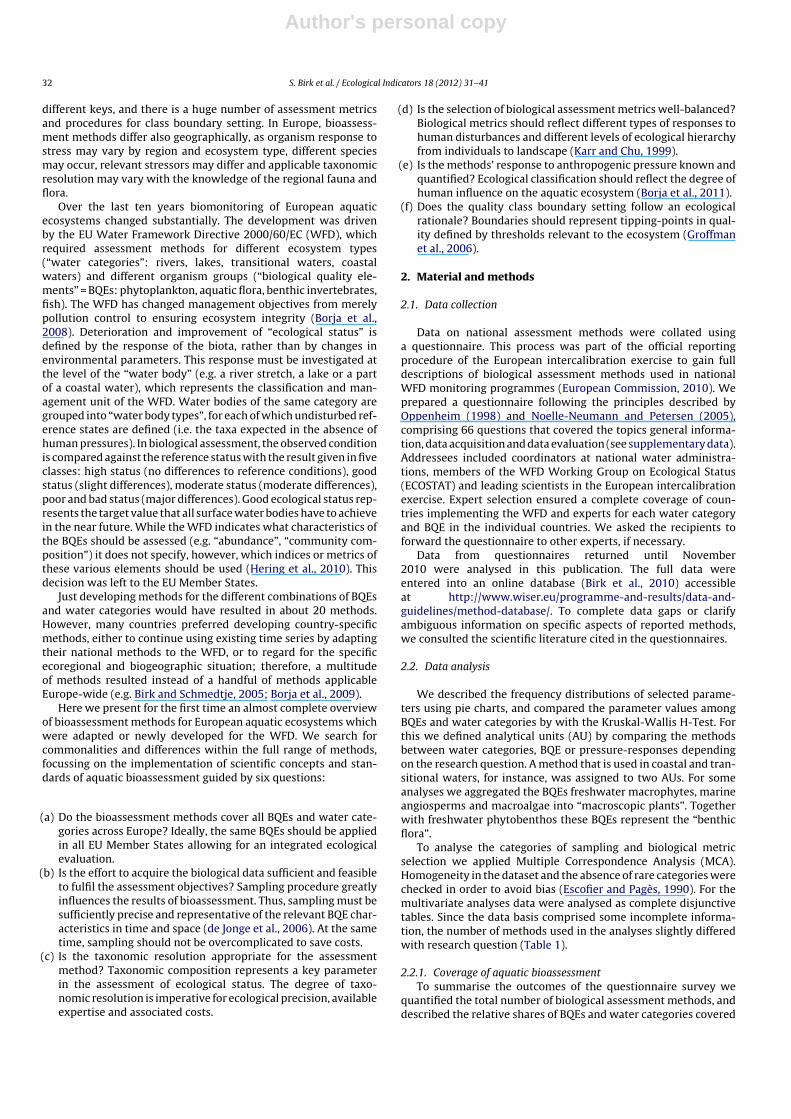
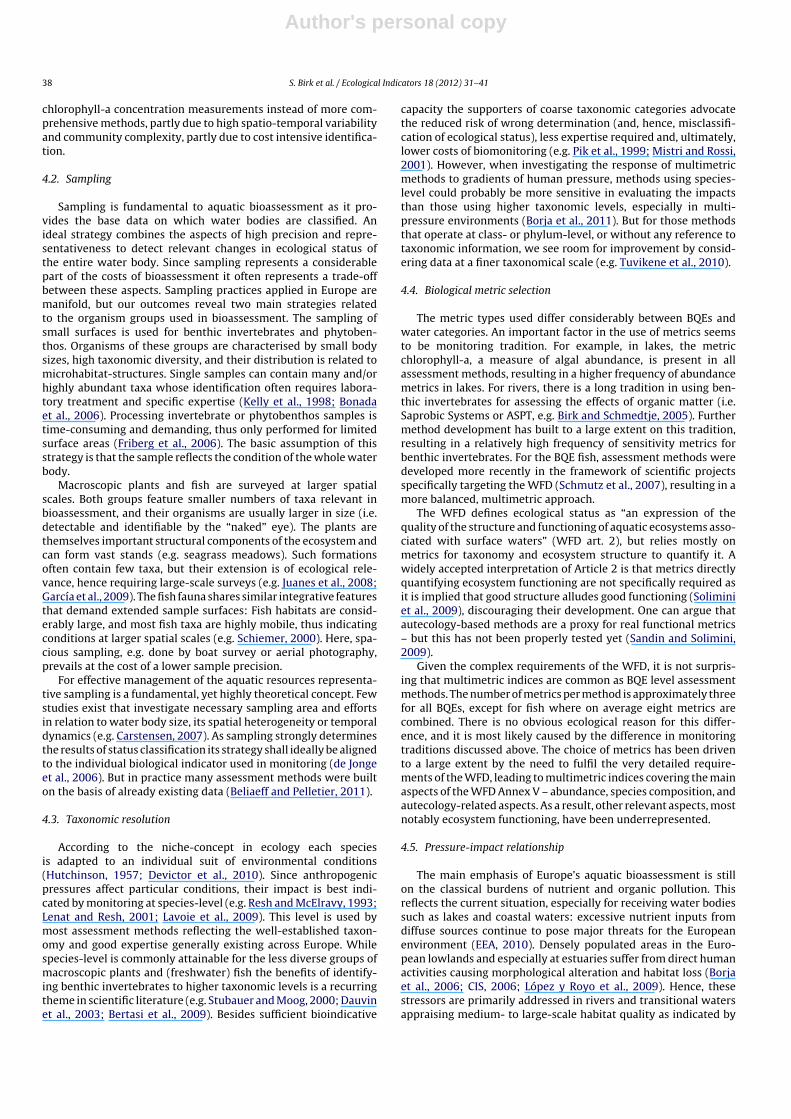
Fig. 1. Relative frequencies of selected features of aquatic assessment methods in Europe.
Table 3Types of ecological status class boundary setting.
Type of boundary setting Approaches specified in the questionnaire
Ecological Using discontinuities in the relationship ofanthropogenic pressure and the biologicalresponseUsing biological metrics that respond indifferent ways to the influence of the pressure(i.e. “paired” or “crossover” metrics)
Statistical High-good boundary derived from metricvariability at near-natural reference sitesEquidistant division of the existing gradient ofecological quality
Expert-based Class boundaries calibrated againstpre-classified sampling sites
3. Results
3.1. Coverage of aquatic bioassessment
A total of 28 European countries reported on 297 biologicalassessment methods (see supplementary data). River methodscomprised 30% of all methods reported; lake and coastal assess-ment methods accounted for about 25% each. Transitional waterswere least represented (19%) (Fig. 1). Benthic invertebrates werethe most prevalent biological group used in aquatic bioassess-ment followed by macroscopic plants and phytoplankton. Methodsevaluating fish fauna and phytobenthos were comparatively rare(Fig. 1), as monitoring of these biological groups is not required forall water categories.
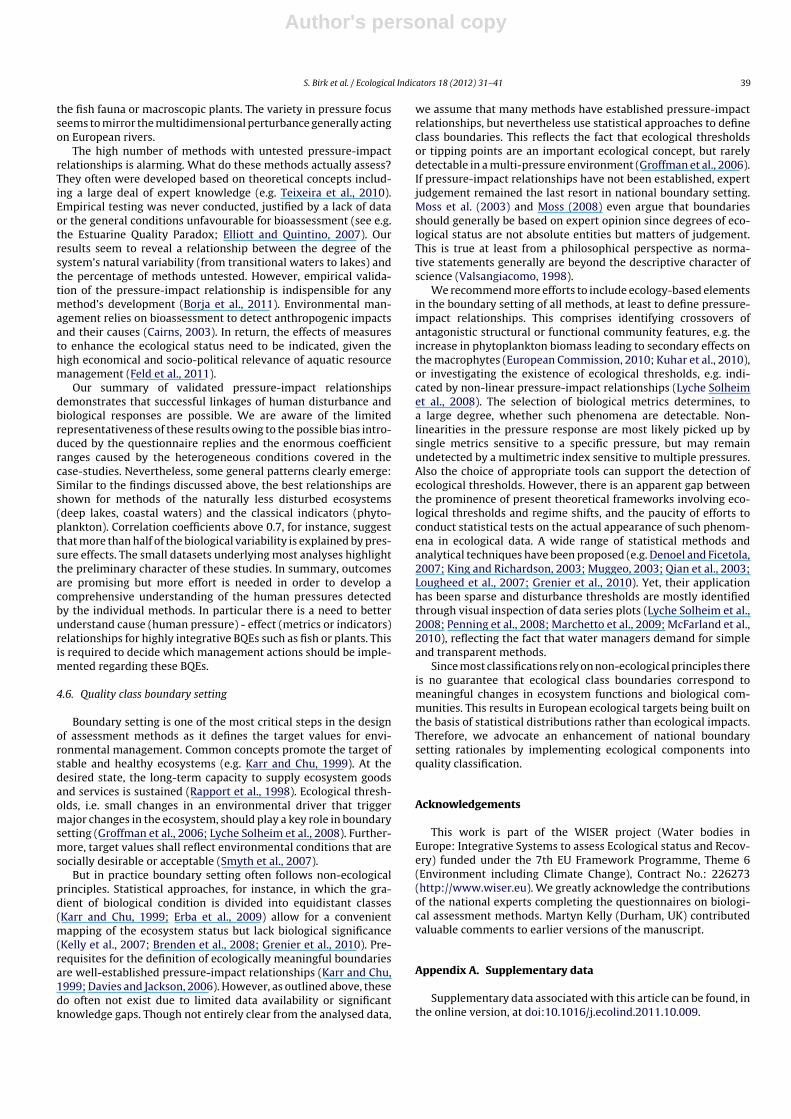
The overview covered 2/3 (66%) of the theoretical number ofassessment methods per European Member State (Fig. 2). Meth-ods monitoring invertebrates in rivers and phytoplankton in lakeswere most widely adopted (90% and 82%, respectively), and theleast adopted methods were those using phytoplankton in riversand phytobenthos in lakes (both 21%).
3.2. Sampling
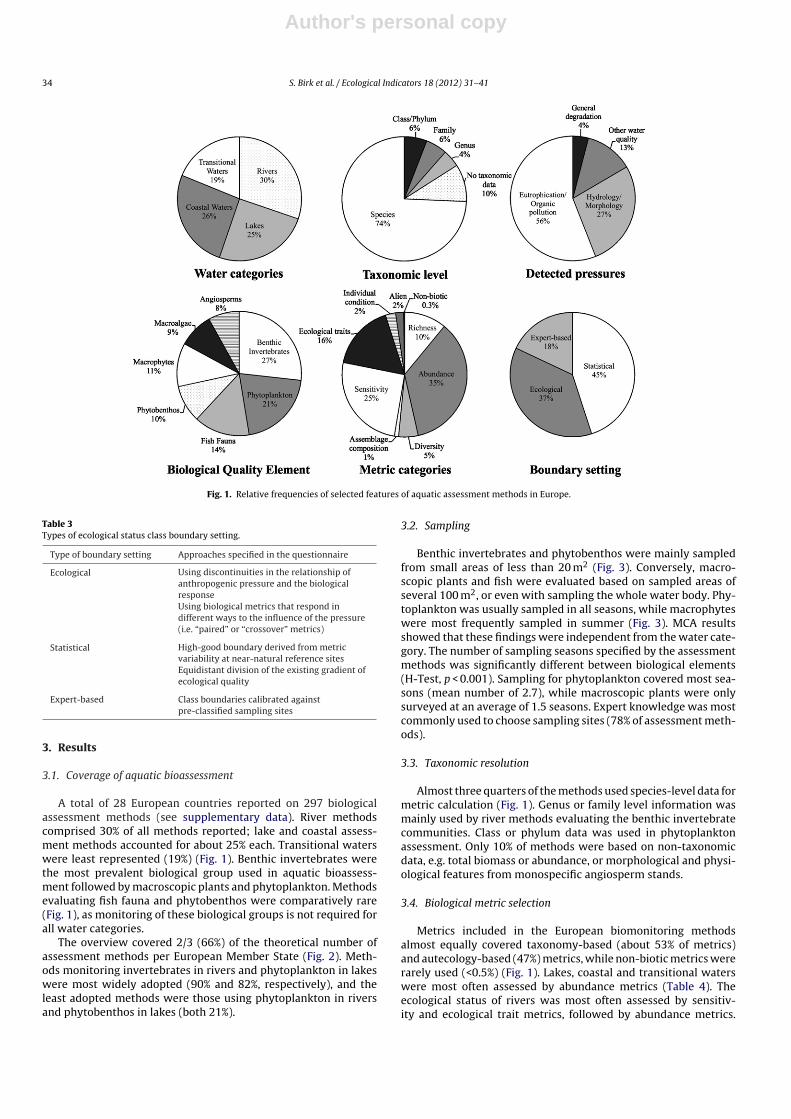
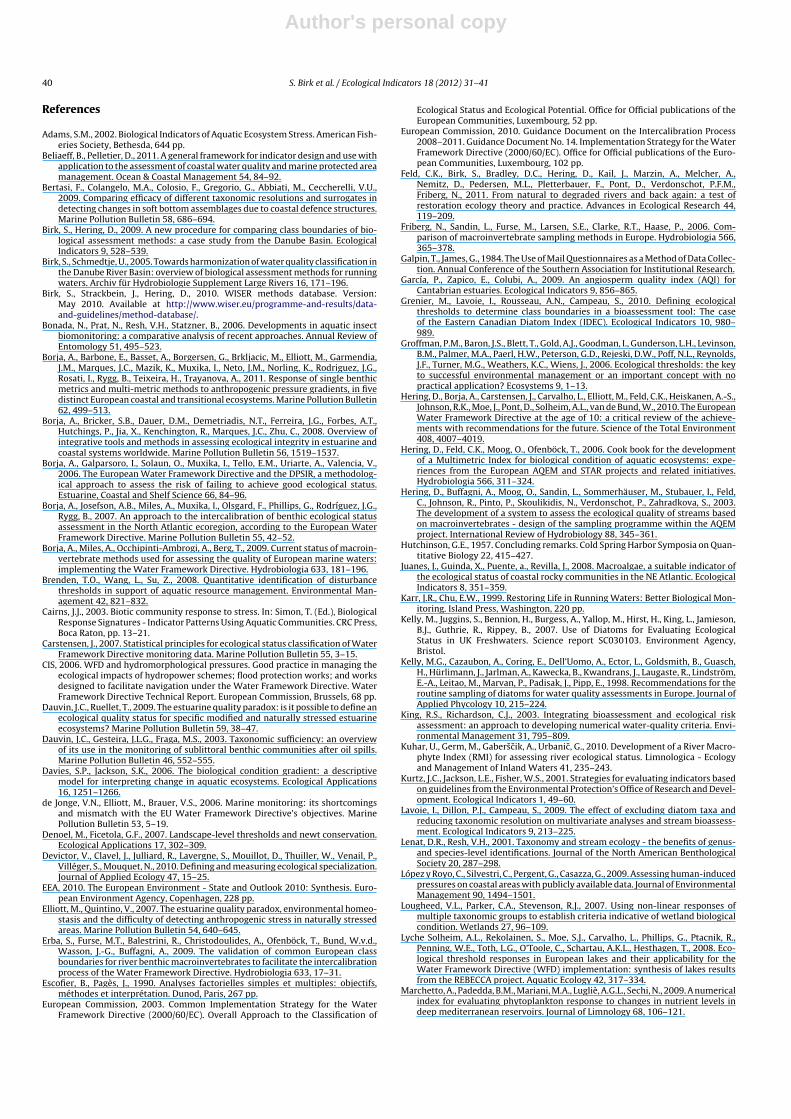
Benthic invertebrates and phytobenthos were mainly sampledfrom small areas of less than 20 m2 (Fig. 3). Conversely, macro-scopic plants and fish were evaluated based on sampled areas ofseveral 100 m2, or even with sampling the whole water body. Phy-toplankton was usually sampled in all seasons, while macrophyteswere most frequently sampled in summer (Fig. 3). MCA resultsshowed that these findings were independent from the water cate-gory. The number of sampling seasons specified by the assessmentmethods was significantly different between biological elements(H-Test, p < 0.001). Sampling for phytoplankton covered most sea-sons (mean number of 2.7), while macroscopic plants were onlysurveyed at an average of 1.5 seasons. Expert knowledge was mostcommonly used to choose sampling sites (78% of assessment meth-ods).
3.3. Taxonomic resolution
Almost three quarters of the methods used species-level data formetric calculation (Fig. 1). Genus or family level information wasmainly used by river methods evaluating the benthic invertebratecommunities. Class or phylum data was used in phytoplanktonassessment. Only 10% of methods were based on non-taxonomicdata, e.g. total biomass or abundance, or morphological and physi-ological features from monospecific angiosperm stands.
3.4. Biological metric selection
Metrics included in the European biomonitoring methodsalmost equally covered taxonomy-based (about 53% of metrics)and autecology-based (47%) metrics, while non-biotic metrics wererarely used (<0.5%) (Fig. 1). Lakes, coastal and transitional waterswere most often assessed by abundance metrics (Table 4). Theecological status of rivers was most often assessed by sensitiv-ity and ecological trait metrics, followed by abundance metrics.

Author's personal copy
S. Birk et al. / Ecological Indicators 18 (2012) 31–41 35
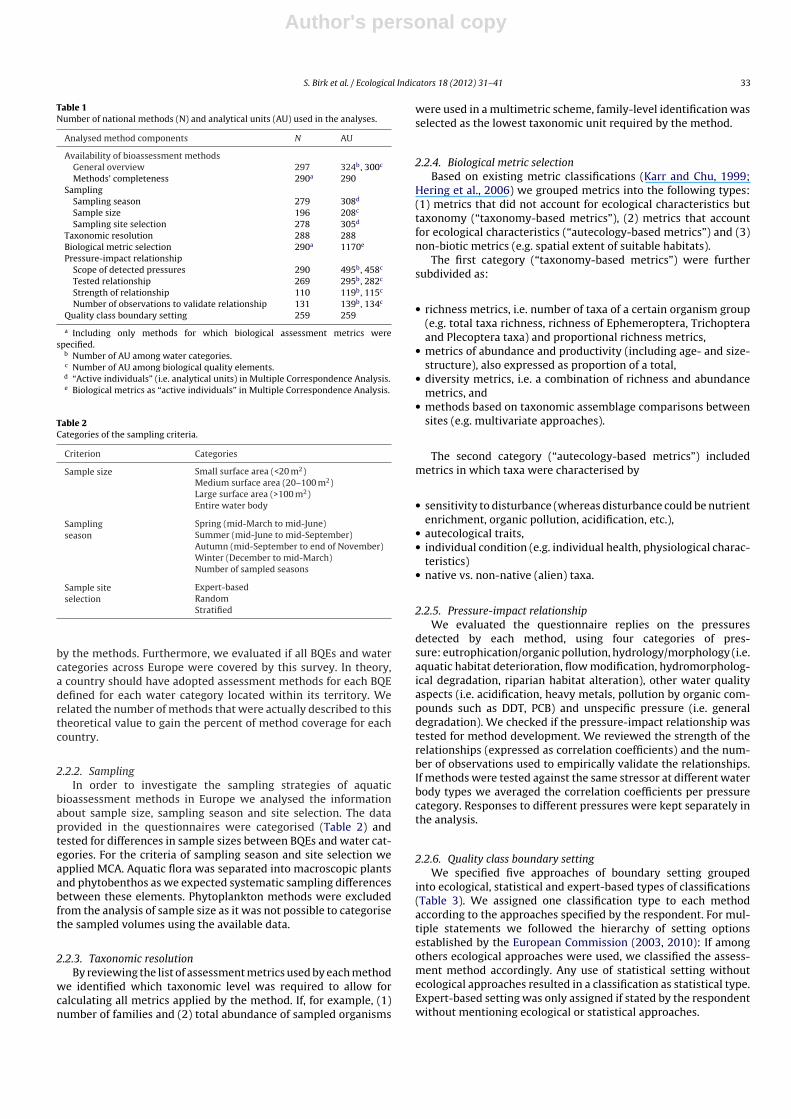
Fig. 2. Geographical distribution of the ratio of national methods resulting from this study compared to the number of methods required for national Water FrameworkDirective monitoring (country × water categories × biological quality elements). Colour codes: black: >75%, dark grey: 50%–75%, light grey: <50% (including Cyprus and Maltanot depicted on the map), white: not covered by the survey.
Sensitivity metrics were also widely-used in lake and coastalassessment while the assessment of transitional waters relied moreon the assessment of ecological traits. Richness metrics held a con-siderable share (7–13%) among all water categories. This share wasgenerally smaller for diversity metrics, which were usually appliedby invertebrate-based methods according to MCA results. MCA alsorevealed that non-native taxa were used mainly within fish-based
methods for rivers and lakes, and rarely in transitional waters.Metrics targeting individual condition were often associated withangiosperm methods, sensitivity metrics with phytobenthos meth-ods, and abundance metrics with phytoplankton methods.
The number of metrics used per method differed significantlybetween BQEs (H-Test; p < 0.05). Fish assessment methods hadthe highest number of metrics (mean: 7), followed by benthic
Table 4Percentage of metric types used in water categories. See text for type descriptions.
Coastal waters Lakes Rivers Transitional waters
Taxonomy-based
Richness 13.1 7.2 12.1 11.4Abundance 47.3 46.2 16.4 42.4Diversity 5.7 5.5 4.5 4.7Assemblage composition 0.4 1.0 0.5 3.0
Autecology-based
Sensitivity 20.8 25.7 37.3 10.2Ecological traits 5.3 11.0 25.7 21.6Individual condition 7.3 0 0.5 4.7Alien 0 3.4 3.0 0.8
Non-biotic 0 0 0 1.3

Author's personal copy
36 S. Birk et al. / Ecological Indicators 18 (2012) 31–41
Fig. 3. Share of sample sizes and sampling seasons among biological quality ele-ments.
invertebrates (4), macroscopic plants (4), phytoplankton (3) andphytobenthos (2). There were no differences between water cate-gories (H-Test; p = 0.15).
3.5. Pressure-impact relationship
More than half of the methods appraised the impact of eutroph-ication or organic pollution (Fig. 1). This especially applied tomethods evaluating lakes and coastal waters where almost 2/3 ofmethods focused on these stressors. Hydrological or morphologi-cal deterioration was detected by 27% of methods, most apparentfor transitional waters. Other water quality aspects were addressedby 13%. More than half of the river methods focused on pressuresother than eutrophication or organic pollution.
The share of methods detecting eutrophication or organic pollu-tions was markedly decreasing from autotrophic to heterotrophicelements: phytoplankton > phytobenthos > macroscopicplants > benthic invertebrates > fish fauna. An almost reverseorder was revealed for hydrological or morphological dete-rioration: Fish fauna and macroscopic plants > benthicinvertebrates > phytoplankton > phytobenthos. About 20% ofthe methods for each biological element (except phytoplankton)addressed other water quality aspects.
The pressure-impact relationship has not been tested or doc-umented for one-third of the methods, with clear differencesbetween water categories: For 46% of the methods applied totransitional waters the relationship was not documented, fol-lowed by methods for coastal waters (37%) and rivers (31%), whilelake methods were tested in 81% of cases. Methods using fishfauna or macroscopic plants were checked least frequently (44%and 43% unchecked, respectively) while phytoplankton, phytoben-thos and benthic invertebrates were the best validated biologicalelements (more than 75%). The number of case-studies to empir-ically validate the pressure-impact relationships was unequallydistributed between water categories and biological elements
Table 5Median coefficients of correlation and number of observations to validate thepressure-impact relationships per biological element (N = number of case-studies).
Biological element Correlation coefficient N # Observations N
Phytoplankton 0.76 30 400 34Phytobenthos 0.56 18 202 17Macroscopic plants 0.71 24 104 32Benthic invertebrates 0.64 33 103 36Fish fauna 0.55 7 484 12
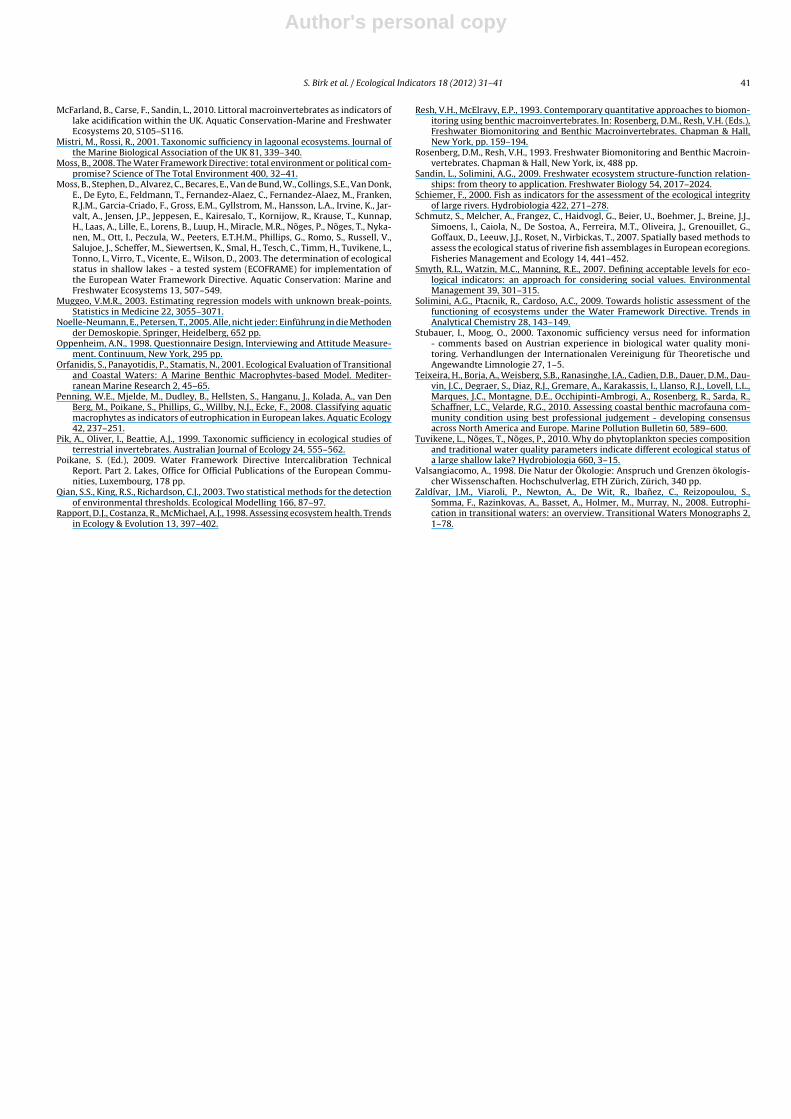
Fig. 4. Range of correlation coefficients gained from pressure-impact analysis in dif-ferent water categories. The number of case-studies per water category is specifiedbelow (total number = 110).
(Table 5). Most studies were reported for lakes (especially phyto-plankton), and least for transitional waters. Across water categoriesmost case-studies referred to benthic invertebrates, and least tofish fauna. The majority of studies tested the response to gra-dients of nutrient enrichment or organic pollution. The strengthof relationships differed significantly between biological elementsand water categories (H-Test, p < 0.05). The correlation coefficientsgenerally covered a broad range (<0.4 to >0.8), but on aver-age with the pattern: phytoplankton > macroscopic plants > benthicinvertebrates > phytobenthos and fish fauna (Table 5). In termsof water categories (Fig. 4) the following order resulted:coastal waters > lakes > transitional waters > rivers. The number ofobservations used to empirically validate the pressure-impact rela-tionship differed between water categories and biological elements(Table 5). On average, relationships were established based on 250samples (median value).
3.6. Quality class boundary setting
The class boundary setting of European assessment methodswas mostly based on statistical principles (45%), i.e. use of statisticalapproach without any ecological approach, and 37% of assessmentmethods used ecological approaches alone or together with otherapproaches to define boundaries. In 18% of cases class boundary set-ting was limited to expert judgement (Fig. 1). For the developmentof lake assessment methods mostly ecological approaches wereapplied (58%), especially in the assessment of phytoplankton (82%)and benthic flora (60%). Statistics-based boundary setting domi-nated the classifications of rivers and transitional waters (56%).In these categories only 24% of methods were based on ecologi-cal boundary setting. This especially applied to benthic fauna andflora in rivers, and benthic flora in transitional waters, where anecological approach was only used in about 20% of cases or less. Incoastal waters the classification of phytoplankton and benthic flora
Author's personal copy
S. Birk et al. / Ecological Indicators 18 (2012) 31–41 37
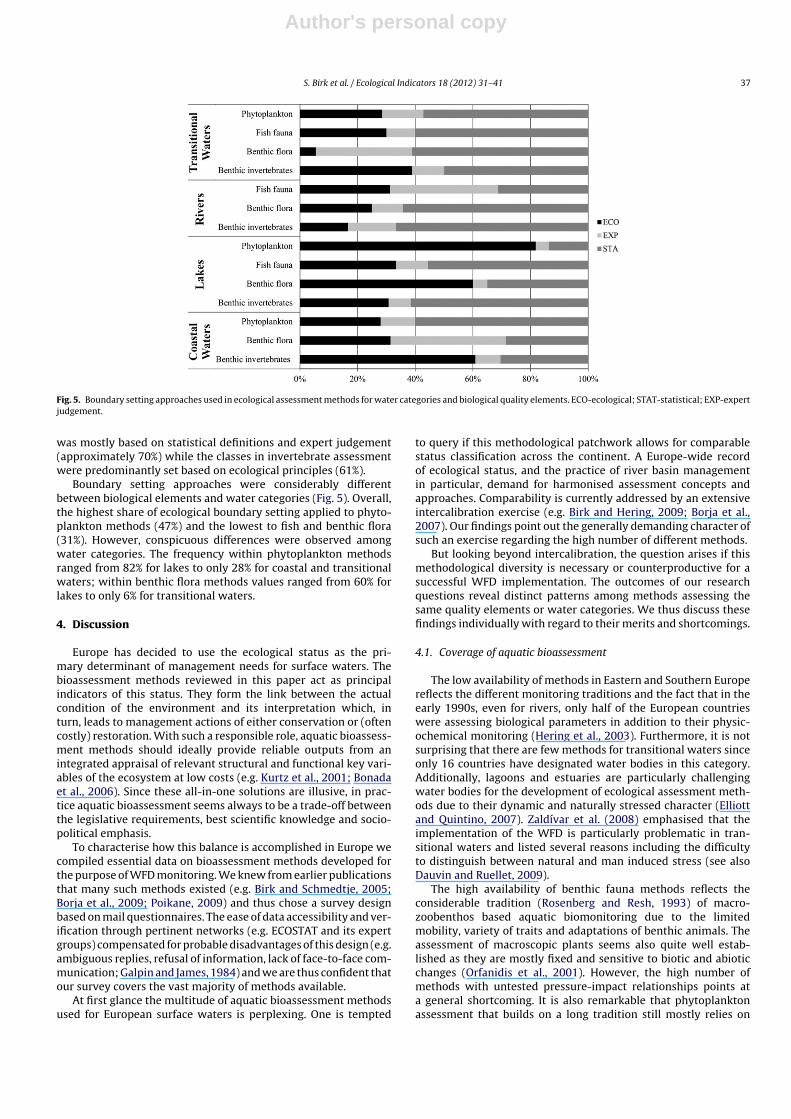
Fig. 5. Boundary setting approaches used in ecological assessment methods for water categories and biological quality elements. ECO-ecological; STAT-statistical; EXP-expertjudgement.
was mostly based on statistical definitions and expert judgement(approximately 70%) while the classes in invertebrate assessmentwere predominantly set based on ecological principles (61%).
Boundary setting approaches were considerably differentbetween biological elements and water categories (Fig. 5). Overall,the highest share of ecological boundary setting applied to phyto-plankton methods (47%) and the lowest to fish and benthic flora(31%). However, conspicuous differences were observed amongwater categories. The frequency within phytoplankton methodsranged from 82% for lakes to only 28% for coastal and transitionalwaters; within benthic flora methods values ranged from 60% forlakes to only 6% for transitional waters.
4. Discussion
Europe has decided to use the ecological status as the pri-mary determinant of management needs for surface waters. Thebioassessment methods reviewed in this paper act as principalindicators of this status. They form the link between the actualcondition of the environment and its interpretation which, inturn, leads to management actions of either conservation or (oftencostly) restoration. With such a responsible role, aquatic bioassess-ment methods should ideally provide reliable outputs from anintegrated appraisal of relevant structural and functional key vari-ables of the ecosystem at low costs (e.g. Kurtz et al., 2001; Bonadaet al., 2006). Since these all-in-one solutions are illusive, in prac-tice aquatic bioassessment seems always to be a trade-off betweenthe legislative requirements, best scientific knowledge and socio-political emphasis.
To characterise how this balance is accomplished in Europe wecompiled essential data on bioassessment methods developed forthe purpose of WFD monitoring. We knew from earlier publicationsthat many such methods existed (e.g. Birk and Schmedtje, 2005;Borja et al., 2009; Poikane, 2009) and thus chose a survey designbased on mail questionnaires. The ease of data accessibility and ver-ification through pertinent networks (e.g. ECOSTAT and its expertgroups) compensated for probable disadvantages of this design (e.g.ambiguous replies, refusal of information, lack of face-to-face com-munication; Galpin and James, 1984) and we are thus confident thatour survey covers the vast majority of methods available.
At first glance the multitude of aquatic bioassessment methodsused for European surface waters is perplexing. One is tempted
to query if this methodological patchwork allows for comparablestatus classification across the continent. A Europe-wide recordof ecological status, and the practice of river basin managementin particular, demand for harmonised assessment concepts andapproaches. Comparability is currently addressed by an extensiveintercalibration exercise (e.g. Birk and Hering, 2009; Borja et al.,2007). Our findings point out the generally demanding character ofsuch an exercise regarding the high number of different methods.
But looking beyond intercalibration, the question arises if thismethodological diversity is necessary or counterproductive for asuccessful WFD implementation. The outcomes of our researchquestions reveal distinct patterns among methods assessing thesame quality elements or water categories. We thus discuss thesefindings individually with regard to their merits and shortcomings.
4.1. Coverage of aquatic bioassessment
The low availability of methods in Eastern and Southern Europereflects the different monitoring traditions and the fact that in theearly 1990s, even for rivers, only half of the European countrieswere assessing biological parameters in addition to their physic-ochemical monitoring (Hering et al., 2003). Furthermore, it is notsurprising that there are few methods for transitional waters sinceonly 16 countries have designated water bodies in this category.Additionally, lagoons and estuaries are particularly challengingwater bodies for the development of ecological assessment meth-ods due to their dynamic and naturally stressed character (Elliottand Quintino, 2007). Zaldívar et al. (2008) emphasised that theimplementation of the WFD is particularly problematic in tran-sitional waters and listed several reasons including the difficultyto distinguish between natural and man induced stress (see alsoDauvin and Ruellet, 2009).
The high availability of benthic fauna methods reflects theconsiderable tradition (Rosenberg and Resh, 1993) of macro-zoobenthos based aquatic biomonitoring due to the limitedmobility, variety of traits and adaptations of benthic animals. Theassessment of macroscopic plants seems also quite well estab-lished as they are mostly fixed and sensitive to biotic and abioticchanges (Orfanidis et al., 2001). However, the high number ofmethods with untested pressure-impact relationships points ata general shortcoming. It is also remarkable that phytoplanktonassessment that builds on a long tradition still mostly relies on
Author's personal copy
38 S. Birk et al. / Ecological Indicators 18 (2012) 31–41
chlorophyll-a concentration measurements instead of more com-prehensive methods, partly due to high spatio-temporal variabilityand community complexity, partly due to cost intensive identifica-tion.
4.2. Sampling
Sampling is fundamental to aquatic bioassessment as it pro-vides the base data on which water bodies are classified. Anideal strategy combines the aspects of high precision and repre-sentativeness to detect relevant changes in ecological status ofthe entire water body. Since sampling represents a considerablepart of the costs of bioassessment it often represents a trade-offbetween these aspects. Sampling practices applied in Europe aremanifold, but our outcomes reveal two main strategies relatedto the organism groups used in bioassessment. The sampling ofsmall surfaces is used for benthic invertebrates and phytoben-thos. Organisms of these groups are characterised by small bodysizes, high taxonomic diversity, and their distribution is related tomicrohabitat-structures. Single samples can contain many and/orhighly abundant taxa whose identification often requires labora-tory treatment and specific expertise (Kelly et al., 1998; Bonadaet al., 2006). Processing invertebrate or phytobenthos samples istime-consuming and demanding, thus only performed for limitedsurface areas (Friberg et al., 2006). The basic assumption of thisstrategy is that the sample reflects the condition of the whole waterbody.
Macroscopic plants and fish are surveyed at larger spatialscales. Both groups feature smaller numbers of taxa relevant inbioassessment, and their organisms are usually larger in size (i.e.detectable and identifiable by the “naked” eye). The plants arethemselves important structural components of the ecosystem andcan form vast stands (e.g. seagrass meadows). Such formationsoften contain few taxa, but their extension is of ecological rele-vance, hence requiring large-scale surveys (e.g. Juanes et al., 2008;García et al., 2009). The fish fauna shares similar integrative featuresthat demand extended sample surfaces: Fish habitats are consid-erably large, and most fish taxa are highly mobile, thus indicatingconditions at larger spatial scales (e.g. Schiemer, 2000). Here, spa-cious sampling, e.g. done by boat survey or aerial photography,prevails at the cost of a lower sample precision.
For effective management of the aquatic resources representa-tive sampling is a fundamental, yet highly theoretical concept. Fewstudies exist that investigate necessary sampling area and effortsin relation to water body size, its spatial heterogeneity or temporaldynamics (e.g. Carstensen, 2007). As sampling strongly determinesthe results of status classification its strategy shall ideally be alignedto the individual biological indicator used in monitoring (de Jongeet al., 2006). But in practice many assessment methods were builton the basis of already existing data (Beliaeff and Pelletier, 2011).
4.3. Taxonomic resolution
According to the niche-concept in ecology each speciesis adapted to an individual suit of environmental conditions(Hutchinson, 1957; Devictor et al., 2010). Since anthropogenicpressures affect particular conditions, their impact is best indi-cated by monitoring at species-level (e.g. Resh and McElravy, 1993;Lenat and Resh, 2001; Lavoie et al., 2009). This level is used bymost assessment methods reflecting the well-established taxon-omy and good expertise generally existing across Europe. Whilespecies-level is commonly attainable for the less diverse groups ofmacroscopic plants and (freshwater) fish the benefits of identify-ing benthic invertebrates to higher taxonomic levels is a recurringtheme in scientific literature (e.g. Stubauer and Moog, 2000; Dauvinet al., 2003; Bertasi et al., 2009). Besides sufficient bioindicative
capacity the supporters of coarse taxonomic categories advocatethe reduced risk of wrong determination (and, hence, misclassifi-cation of ecological status), less expertise required and, ultimately,lower costs of biomonitoring (e.g. Pik et al., 1999; Mistri and Rossi,2001). However, when investigating the response of multimetricmethods to gradients of human pressure, methods using species-level could probably be more sensitive in evaluating the impactsthan those using higher taxonomic levels, especially in multi-pressure environments (Borja et al., 2011). But for those methodsthat operate at class- or phylum-level, or without any reference totaxonomic information, we see room for improvement by consid-ering data at a finer taxonomical scale (e.g. Tuvikene et al., 2010).
4.4. Biological metric selection
The metric types used differ considerably between BQEs andwater categories. An important factor in the use of metrics seemsto be monitoring tradition. For example, in lakes, the metricchlorophyll-a, a measure of algal abundance, is present in allassessment methods, resulting in a higher frequency of abundancemetrics in lakes. For rivers, there is a long tradition in using ben-thic invertebrates for assessing the effects of organic matter (i.e.Saprobic Systems or ASPT, e.g. Birk and Schmedtje, 2005). Furthermethod development has built to a large extent on this tradition,resulting in a relatively high frequency of sensitivity metrics forbenthic invertebrates. For the BQE fish, assessment methods weredeveloped more recently in the framework of scientific projectsspecifically targeting the WFD (Schmutz et al., 2007), resulting in amore balanced, multimetric approach.
The WFD defines ecological status as “an expression of thequality of the structure and functioning of aquatic ecosystems asso-ciated with surface waters” (WFD art. 2), but relies mostly onmetrics for taxonomy and ecosystem structure to quantify it. Awidely accepted interpretation of Article 2 is that metrics directlyquantifying ecosystem functioning are not specifically required asit is implied that good structure alludes good functioning (Soliminiet al., 2009), discouraging their development. One can argue thatautecology-based methods are a proxy for real functional metrics– but this has not been properly tested yet (Sandin and Solimini,2009).
Given the complex requirements of the WFD, it is not surpris-ing that multimetric indices are common as BQE level assessmentmethods. The number of metrics per method is approximately threefor all BQEs, except for fish where on average eight metrics arecombined. There is no obvious ecological reason for this differ-ence, and it is most likely caused by the difference in monitoringtraditions discussed above. The choice of metrics has been drivento a large extent by the need to fulfil the very detailed require-ments of the WFD, leading to multimetric indices covering the mainaspects of the WFD Annex V – abundance, species composition, andautecology-related aspects. As a result, other relevant aspects, mostnotably ecosystem functioning, have been underrepresented.
4.5. Pressure-impact relationship
The main emphasis of Europe’s aquatic bioassessment is stillon the classical burdens of nutrient and organic pollution. Thisreflects the current situation, especially for receiving water bodiessuch as lakes and coastal waters: excessive nutrient inputs fromdiffuse sources continue to pose major threats for the Europeanenvironment (EEA, 2010). Densely populated areas in the Euro-pean lowlands and especially at estuaries suffer from direct humanactivities causing morphological alteration and habitat loss (Borjaet al., 2006; CIS, 2006; López y Royo et al., 2009). Hence, thesestressors are primarily addressed in rivers and transitional watersappraising medium- to large-scale habitat quality as indicated by
Author's personal copy
S. Birk et al. / Ecological Indicators 18 (2012) 31–41 39
the fish fauna or macroscopic plants. The variety in pressure focusseems to mirror the multidimensional perturbance generally actingon European rivers.
The high number of methods with untested pressure-impactrelationships is alarming. What do these methods actually assess?They often were developed based on theoretical concepts includ-ing a large deal of expert knowledge (e.g. Teixeira et al., 2010).Empirical testing was never conducted, justified by a lack of dataor the general conditions unfavourable for bioassessment (see e.g.the Estuarine Quality Paradox; Elliott and Quintino, 2007). Ourresults seem to reveal a relationship between the degree of thesystem’s natural variability (from transitional waters to lakes) andthe percentage of methods untested. However, empirical valida-tion of the pressure-impact relationship is indispensible for anymethod’s development (Borja et al., 2011). Environmental man-agement relies on bioassessment to detect anthropogenic impactsand their causes (Cairns, 2003). In return, the effects of measuresto enhance the ecological status need to be indicated, given thehigh economical and socio-political relevance of aquatic resourcemanagement (Feld et al., 2011).
Our summary of validated pressure-impact relationshipsdemonstrates that successful linkages of human disturbance andbiological responses are possible. We are aware of the limitedrepresentativeness of these results owing to the possible bias intro-duced by the questionnaire replies and the enormous coefficientranges caused by the heterogeneous conditions covered in thecase-studies. Nevertheless, some general patterns clearly emerge:Similar to the findings discussed above, the best relationships areshown for methods of the naturally less disturbed ecosystems(deep lakes, coastal waters) and the classical indicators (phyto-plankton). Correlation coefficients above 0.7, for instance, suggestthat more than half of the biological variability is explained by pres-sure effects. The small datasets underlying most analyses highlightthe preliminary character of these studies. In summary, outcomesare promising but more effort is needed in order to develop acomprehensive understanding of the human pressures detectedby the individual methods. In particular there is a need to betterunderstand cause (human pressure) - effect (metrics or indicators)relationships for highly integrative BQEs such as fish or plants. Thisis required to decide which management actions should be imple-mented regarding these BQEs.
4.6. Quality class boundary setting
Boundary setting is one of the most critical steps in the designof assessment methods as it defines the target values for envi-ronmental management. Common concepts promote the target ofstable and healthy ecosystems (e.g. Karr and Chu, 1999). At thedesired state, the long-term capacity to supply ecosystem goodsand services is sustained (Rapport et al., 1998). Ecological thresh-olds, i.e. small changes in an environmental driver that triggermajor changes in the ecosystem, should play a key role in boundarysetting (Groffman et al., 2006; Lyche Solheim et al., 2008). Further-more, target values shall reflect environmental conditions that aresocially desirable or acceptable (Smyth et al., 2007).
But in practice boundary setting often follows non-ecologicalprinciples. Statistical approaches, for instance, in which the gra-dient of biological condition is divided into equidistant classes(Karr and Chu, 1999; Erba et al., 2009) allow for a convenientmapping of the ecosystem status but lack biological significance(Kelly et al., 2007; Brenden et al., 2008; Grenier et al., 2010). Pre-requisites for the definition of ecologically meaningful boundariesare well-established pressure-impact relationships (Karr and Chu,1999; Davies and Jackson, 2006). However, as outlined above, thesedo often not exist due to limited data availability or significantknowledge gaps. Though not entirely clear from the analysed data,
we assume that many methods have established pressure-impactrelationships, but nevertheless use statistical approaches to defineclass boundaries. This reflects the fact that ecological thresholdsor tipping points are an important ecological concept, but rarelydetectable in a multi-pressure environment (Groffman et al., 2006).If pressure-impact relationships have not been established, expertjudgement remained the last resort in national boundary setting.Moss et al. (2003) and Moss (2008) even argue that boundariesshould generally be based on expert opinion since degrees of eco-logical status are not absolute entities but matters of judgement.This is true at least from a philosophical perspective as norma-tive statements generally are beyond the descriptive character ofscience (Valsangiacomo, 1998).
We recommend more efforts to include ecology-based elementsin the boundary setting of all methods, at least to define pressure-impact relationships. This comprises identifying crossovers ofantagonistic structural or functional community features, e.g. theincrease in phytoplankton biomass leading to secondary effects onthe macrophytes (European Commission, 2010; Kuhar et al., 2010),or investigating the existence of ecological thresholds, e.g. indi-cated by non-linear pressure-impact relationships (Lyche Solheimet al., 2008). The selection of biological metrics determines, toa large degree, whether such phenomena are detectable. Non-linearities in the pressure response are most likely picked up bysingle metrics sensitive to a specific pressure, but may remainundetected by a multimetric index sensitive to multiple pressures.Also the choice of appropriate tools can support the detection ofecological thresholds. However, there is an apparent gap betweenthe prominence of present theoretical frameworks involving eco-logical thresholds and regime shifts, and the paucity of efforts toconduct statistical tests on the actual appearance of such phenom-ena in ecological data. A wide range of statistical methods andanalytical techniques have been proposed (e.g. Denoel and Ficetola,2007; King and Richardson, 2003; Muggeo, 2003; Qian et al., 2003;Lougheed et al., 2007; Grenier et al., 2010). Yet, their applicationhas been sparse and disturbance thresholds are mostly identifiedthrough visual inspection of data series plots (Lyche Solheim et al.,2008; Penning et al., 2008; Marchetto et al., 2009; McFarland et al.,2010), reflecting the fact that water managers demand for simpleand transparent methods.
Since most classifications rely on non-ecological principles thereis no guarantee that ecological class boundaries correspond tomeaningful changes in ecosystem functions and biological com-munities. This results in European ecological targets being built onthe basis of statistical distributions rather than ecological impacts.Therefore, we advocate an enhancement of national boundarysetting rationales by implementing ecological components intoquality classification.
Acknowledgements
This work is part of the WISER project (Water bodies inEurope: Integrative Systems to assess Ecological status and Recov-ery) funded under the 7th EU Framework Programme, Theme 6(Environment including Climate Change), Contract No.: 226273(http://www.wiser.eu). We greatly acknowledge the contributionsof the national experts completing the questionnaires on biologi-cal assessment methods. Martyn Kelly (Durham, UK) contributedvaluable comments to earlier versions of the manuscript.
Appendix A. Supplementary data
Supplementary data associated with this article can be found, inthe online version, at doi:10.1016/j.ecolind.2011.10.009.
Author's personal copy
40 S. Birk et al. / Ecological Indicators 18 (2012) 31–41
References
Adams, S.M., 2002. Biological Indicators of Aquatic Ecosystem Stress. American Fish-eries Society, Bethesda, 644 pp.
Beliaeff, B., Pelletier, D., 2011. A general framework for indicator design and use withapplication to the assessment of coastal water quality and marine protected areamanagement. Ocean & Coastal Management 54, 84–92.
Bertasi, F., Colangelo, M.A., Colosio, F., Gregorio, G., Abbiati, M., Ceccherelli, V.U.,2009. Comparing efficacy of different taxonomic resolutions and surrogates indetecting changes in soft bottom assemblages due to coastal defence structures.Marine Pollution Bulletin 58, 686–694.
Birk, S., Hering, D., 2009. A new procedure for comparing class boundaries of bio-logical assessment methods: a case study from the Danube Basin. EcologicalIndicators 9, 528–539.
Birk, S., Schmedtje, U., 2005. Towards harmonization of water quality classification inthe Danube River Basin: overview of biological assessment methods for runningwaters. Archiv für Hydrobiologie Supplement Large Rivers 16, 171–196.
Birk, S., Strackbein, J., Hering, D., 2010. WISER methods database. Version:May 2010. Available at http://www.wiser.eu/programme-and-results/data-and-guidelines/method-database/.
Bonada, N., Prat, N., Resh, V.H., Statzner, B., 2006. Developments in aquatic insectbiomonitoring: a comparative analysis of recent approaches. Annual Review ofEntomology 51, 495–523.
Borja, A., Barbone, E., Basset, A., Borgersen, G., Brkljacic, M., Elliott, M., Garmendia,J.M., Marques, J.C., Mazik, K., Muxika, I., Neto, J.M., Norling, K., Rodriguez, J.G.,Rosati, I., Rygg, B., Teixeira, H., Trayanova, A., 2011. Response of single benthicmetrics and multi-metric methods to anthropogenic pressure gradients, in fivedistinct European coastal and transitional ecosystems. Marine Pollution Bulletin62, 499–513.
Borja, A., Bricker, S.B., Dauer, D.M., Demetriadis, N.T., Ferreira, J.G., Forbes, A.T.,Hutchings, P., Jia, X., Kenchington, R., Marques, J.C., Zhu, C., 2008. Overview ofintegrative tools and methods in assessing ecological integrity in estuarine andcoastal systems worldwide. Marine Pollution Bulletin 56, 1519–1537.
Borja, A., Galparsoro, I., Solaun, O., Muxika, I., Tello, E.M., Uriarte, A., Valencia, V.,2006. The European Water Framework Directive and the DPSIR, a methodolog-ical approach to assess the risk of failing to achieve good ecological status.Estuarine, Coastal and Shelf Science 66, 84–96.
Borja, A., Josefson, A.B., Miles, A., Muxika, I., Olsgard, F., Phillips, G., Rodríguez, J.G.,Rygg, B., 2007. An approach to the intercalibration of benthic ecological statusassessment in the North Atlantic ecoregion, according to the European WaterFramework Directive. Marine Pollution Bulletin 55, 42–52.
Borja, A., Miles, A., Occhipinti-Ambrogi, A., Berg, T., 2009. Current status of macroin-vertebrate methods used for assessing the quality of European marine waters:implementing the Water Framework Directive. Hydrobiologia 633, 181–196.
Brenden, T.O., Wang, L., Su, Z., 2008. Quantitative identification of disturbancethresholds in support of aquatic resource management. Environmental Man-agement 42, 821–832.
Cairns, J.J., 2003. Biotic community response to stress. In: Simon, T. (Ed.), BiologicalResponse Signatures - Indicator Patterns Using Aquatic Communities. CRC Press,Boca Raton, pp. 13–21.
Carstensen, J., 2007. Statistical principles for ecological status classification of WaterFramework Directive monitoring data. Marine Pollution Bulletin 55, 3–15.
CIS, 2006. WFD and hydromorphological pressures. Good practice in managing theecological impacts of hydropower schemes; flood protection works; and worksdesigned to facilitate navigation under the Water Framework Directive. WaterFramework Directive Technical Report. European Commission, Brussels, 68 pp.
Dauvin, J.C., Ruellet, T., 2009. The estuarine quality paradox: is it possible to define anecological quality status for specific modified and naturally stressed estuarineecosystems? Marine Pollution Bulletin 59, 38–47.
Dauvin, J.C., Gesteira, J.L.G., Fraga, M.S., 2003. Taxonomic sufficiency: an overviewof its use in the monitoring of sublittoral benthic communities after oil spills.Marine Pollution Bulletin 46, 552–555.
Davies, S.P., Jackson, S.K., 2006. The biological condition gradient: a descriptivemodel for interpreting change in aquatic ecosystems. Ecological Applications16, 1251–1266.
de Jonge, V.N., Elliott, M., Brauer, V.S., 2006. Marine monitoring: its shortcomingsand mismatch with the EU Water Framework Directive’s objectives. MarinePollution Bulletin 53, 5–19.
Denoel, M., Ficetola, G.F., 2007. Landscape-level thresholds and newt conservation.Ecological Applications 17, 302–309.
Devictor, V., Clavel, J., Julliard, R., Lavergne, S., Mouillot, D., Thuiller, W., Venail, P.,Villéger, S., Mouquet, N., 2010. Defining and measuring ecological specialization.Journal of Applied Ecology 47, 15–25.
EEA, 2010. The European Environment - State and Outlook 2010: Synthesis. Euro-pean Environment Agency, Copenhagen, 228 pp.
Elliott, M., Quintino, V., 2007. The estuarine quality paradox, environmental homeo-stasis and the difficulty of detecting anthropogenic stress in naturally stressedareas. Marine Pollution Bulletin 54, 640–645.
Erba, S., Furse, M.T., Balestrini, R., Christodoulides, A., Ofenböck, T., Bund, W.v.d.,Wasson, J.-G., Buffagni, A., 2009. The validation of common European classboundaries for river benthic macroinvertebrates to facilitate the intercalibrationprocess of the Water Framework Directive. Hydrobiologia 633, 17–31.
Escofier, B., Pagès, J., 1990. Analyses factorielles simples et multiples: objectifs,méthodes et interprétation. Dunod, Paris, 267 pp.
European Commission, 2003. Common Implementation Strategy for the WaterFramework Directive (2000/60/EC). Overall Approach to the Classification of
Ecological Status and Ecological Potential. Office for Official publications of theEuropean Communities, Luxembourg, 52 pp.
European Commission, 2010. Guidance Document on the Intercalibration Process2008–2011. Guidance Document No. 14. Implementation Strategy for the WaterFramework Directive (2000/60/EC). Office for Official publications of the Euro-pean Communities, Luxembourg, 102 pp.
Feld, C.K., Birk, S., Bradley, D.C., Hering, D., Kail, J., Marzin, A., Melcher, A.,Nemitz, D., Pedersen, M.L., Pletterbauer, F., Pont, D., Verdonschot, P.F.M.,Friberg, N., 2011. From natural to degraded rivers and back again: a test ofrestoration ecology theory and practice. Advances in Ecological Research 44,119–209.
Friberg, N., Sandin, L., Furse, M., Larsen, S.E., Clarke, R.T., Haase, P., 2006. Com-parison of macroinvertebrate sampling methods in Europe. Hydrobiologia 566,365–378.
Galpin, T., James, G., 1984. The Use of Mail Questionnaires as a Method of Data Collec-tion. Annual Conference of the Southern Association for Institutional Research.
García, P., Zapico, E., Colubi, A., 2009. An angiosperm quality index (AQI) forCantabrian estuaries. Ecological Indicators 9, 856–865.
Grenier, M., Lavoie, I., Rousseau, A.N., Campeau, S., 2010. Defining ecologicalthresholds to determine class boundaries in a bioassessment tool: The caseof the Eastern Canadian Diatom Index (IDEC). Ecological Indicators 10, 980–989.
Groffman, P.M., Baron, J.S., Blett, T., Gold, A.J., Goodman, I., Gunderson, L.H., Levinson,B.M., Palmer, M.A., Paerl, H.W., Peterson, G.D., Rejeski, D.W., Poff, N.L., Reynolds,J.F., Turner, M.G., Weathers, K.C., Wiens, J., 2006. Ecological thresholds: the keyto successful environmental management or an important concept with nopractical application? Ecosystems 9, 1–13.
Hering, D., Borja, A., Carstensen, J., Carvalho, L., Elliott, M., Feld, C.K., Heiskanen, A.-S.,Johnson, R.K., Moe, J., Pont, D., Solheim, A.L., van de Bund, W., 2010. The EuropeanWater Framework Directive at the age of 10: a critical review of the achieve-ments with recommendations for the future. Science of the Total Environment408, 4007–4019.
Hering, D., Feld, C.K., Moog, O., Ofenböck, T., 2006. Cook book for the developmentof a Multimetric Index for biological condition of aquatic ecosystems: expe-riences from the European AQEM and STAR projects and related initiatives.Hydrobiologia 566, 311–324.
Hering, D., Buffagni, A., Moog, O., Sandin, L., Sommerhäuser, M., Stubauer, I., Feld,C., Johnson, R., Pinto, P., Skoulikidis, N., Verdonschot, P., Zahradkova, S., 2003.The development of a system to assess the ecological quality of streams basedon macroinvertebrates - design of the sampling programme within the AQEMproject. International Review of Hydrobiology 88, 345–361.
Hutchinson, G.E., 1957. Concluding remarks. Cold Spring Harbor Symposia on Quan-titative Biology 22, 415–427.
Juanes, J., Guinda, X., Puente, a., Revilla, J., 2008. Macroalgae, a suitable indicator ofthe ecological status of coastal rocky communities in the NE Atlantic. EcologicalIndicators 8, 351–359.
Karr, J.R., Chu, E.W., 1999. Restoring Life in Running Waters: Better Biological Mon-itoring. Island Press, Washington, 220 pp.
Kelly, M., Juggins, S., Bennion, H., Burgess, A., Yallop, M., Hirst, H., King, L., Jamieson,B.J., Guthrie, R., Rippey, B., 2007. Use of Diatoms for Evaluating EcologicalStatus in UK Freshwaters. Science report SC030103. Environment Agency,Bristol.
Kelly, M.G., Cazaubon, A., Coring, E., Dell’Uomo, A., Ector, L., Goldsmith, B., Guasch,H., Hürlimann, J., Jarlman, A., Kawecka, B., Kwandrans, J., Laugaste, R., Lindström,E.-A., Leitao, M., Marvan, P., Padisak, J., Pipp, E., 1998. Recommendations for theroutine sampling of diatoms for water quality assessments in Europe. Journal ofApplied Phycology 10, 215–224.
King, R.S., Richardson, C.J., 2003. Integrating bioassessment and ecological riskassessment: an approach to developing numerical water-quality criteria. Envi-ronmental Management 31, 795–809.
Kuhar, U., Germ, M., Gaberscik, A., Urbanic, G., 2010. Development of a River Macro-phyte Index (RMI) for assessing river ecological status. Limnologica - Ecologyand Management of Inland Waters 41, 235–243.
Kurtz, J.C., Jackson, L.E., Fisher, W.S., 2001. Strategies for evaluating indicators basedon guidelines from the Environmental Protection’s Office of Research and Devel-opment. Ecological Indicators 1, 49–60.
Lavoie, I., Dillon, P.J., Campeau, S., 2009. The effect of excluding diatom taxa andreducing taxonomic resolution on multivariate analyses and stream bioassess-ment. Ecological Indicators 9, 213–225.
Lenat, D.R., Resh, V.H., 2001. Taxonomy and stream ecology - the benefits of genus-and species-level identifications. Journal of the North American BenthologicalSociety 20, 287–298.
López y Royo, C., Silvestri, C., Pergent, G., Casazza, G., 2009. Assessing human-inducedpressures on coastal areas with publicly available data. Journal of EnvironmentalManagement 90, 1494–1501.
Lougheed, V.L., Parker, C.A., Stevenson, R.J., 2007. Using non-linear responses ofmultiple taxonomic groups to establish criteria indicative of wetland biologicalcondition. Wetlands 27, 96–109.
Lyche Solheim, A.L., Rekolainen, S., Moe, S.J., Carvalho, L., Phillips, G., Ptacnik, R.,Penning, W.E., Toth, L.G., O’Toole, C., Schartau, A.K.L., Hesthagen, T., 2008. Eco-logical threshold responses in European lakes and their applicability for theWater Framework Directive (WFD) implementation: synthesis of lakes resultsfrom the REBECCA project. Aquatic Ecology 42, 317–334.
Marchetto, A., Padedda, B.M., Mariani, M.A., Lugliè, A.G.L., Sechi, N., 2009. A numericalindex for evaluating phytoplankton response to changes in nutrient levels indeep mediterranean reservoirs. Journal of Limnology 68, 106–121.
Author's personal copy
S. Birk et al. / Ecological Indicators 18 (2012) 31–41 41
McFarland, B., Carse, F., Sandin, L., 2010. Littoral macroinvertebrates as indicators oflake acidification within the UK. Aquatic Conservation-Marine and FreshwaterEcosystems 20, S105–S116.
Mistri, M., Rossi, R., 2001. Taxonomic sufficiency in lagoonal ecosystems. Journal ofthe Marine Biological Association of the UK 81, 339–340.
Moss, B., 2008. The Water Framework Directive: total environment or political com-promise? Science of The Total Environment 400, 32–41.
Moss, B., Stephen, D., Alvarez, C., Becares, E., Van de Bund, W., Collings, S.E., Van Donk,E., De Eyto, E., Feldmann, T., Fernandez-Alaez, C., Fernandez-Alaez, M., Franken,R.J.M., Garcia-Criado, F., Gross, E.M., Gyllstrom, M., Hansson, L.A., Irvine, K., Jar-valt, A., Jensen, J.P., Jeppesen, E., Kairesalo, T., Kornijow, R., Krause, T., Kunnap,H., Laas, A., Lille, E., Lorens, B., Luup, H., Miracle, M.R., Nõges, P., Nõges, T., Nyka-nen, M., Ott, I., Peczula, W., Peeters, E.T.H.M., Phillips, G., Romo, S., Russell, V.,Salujoe, J., Scheffer, M., Siewertsen, K., Smal, H., Tesch, C., Timm, H., Tuvikene, L.,Tonno, I., Virro, T., Vicente, E., Wilson, D., 2003. The determination of ecologicalstatus in shallow lakes - a tested system (ECOFRAME) for implementation ofthe European Water Framework Directive. Aquatic Conservation: Marine andFreshwater Ecosystems 13, 507–549.
Muggeo, V.M.R., 2003. Estimating regression models with unknown break-points.Statistics in Medicine 22, 3055–3071.
Noelle-Neumann, E., Petersen, T., 2005. Alle, nicht jeder: Einführung in die Methodender Demoskopie. Springer, Heidelberg, 652 pp.
Oppenheim, A.N., 1998. Questionnaire Design, Interviewing and Attitude Measure-ment. Continuum, New York, 295 pp.
Orfanidis, S., Panayotidis, P., Stamatis, N., 2001. Ecological Evaluation of Transitionaland Coastal Waters: A Marine Benthic Macrophytes-based Model. Mediter-ranean Marine Research 2, 45–65.
Penning, W.E., Mjelde, M., Dudley, B., Hellsten, S., Hanganu, J., Kolada, A., van DenBerg, M., Poikane, S., Phillips, G., Willby, N.J., Ecke, F., 2008. Classifying aquaticmacrophytes as indicators of eutrophication in European lakes. Aquatic Ecology42, 237–251.
Pik, A., Oliver, I., Beattie, A.J., 1999. Taxonomic sufficiency in ecological studies ofterrestrial invertebrates. Australian Journal of Ecology 24, 555–562.
Poikane, S. (Ed.), 2009. Water Framework Directive Intercalibration TechnicalReport. Part 2. Lakes, Office for Official Publications of the European Commu-nities, Luxembourg, 178 pp.
Qian, S.S., King, R.S., Richardson, C.J., 2003. Two statistical methods for the detectionof environmental thresholds. Ecological Modelling 166, 87–97.
Rapport, D.J., Costanza, R., McMichael, A.J., 1998. Assessing ecosystem health. Trendsin Ecology & Evolution 13, 397–402.
Resh, V.H., McElravy, E.P., 1993. Contemporary quantitative approaches to biomon-itoring using benthic macroinvertebrates. In: Rosenberg, D.M., Resh, V.H. (Eds.),Freshwater Biomonitoring and Benthic Macroinvertebrates. Chapman & Hall,New York, pp. 159–194.
Rosenberg, D.M., Resh, V.H., 1993. Freshwater Biomonitoring and Benthic Macroin-vertebrates. Chapman & Hall, New York, ix, 488 pp.
Sandin, L., Solimini, A.G., 2009. Freshwater ecosystem structure-function relation-ships: from theory to application. Freshwater Biology 54, 2017–2024.
Schiemer, F., 2000. Fish as indicators for the assessment of the ecological integrityof large rivers. Hydrobiologia 422, 271–278.
Schmutz, S., Melcher, A., Frangez, C., Haidvogl, G., Beier, U., Boehmer, J., Breine, J.J.,Simoens, I., Caiola, N., De Sostoa, A., Ferreira, M.T., Oliveira, J., Grenouillet, G.,Goffaux, D., Leeuw, J.J., Roset, N., Virbickas, T., 2007. Spatially based methods toassess the ecological status of riverine fish assemblages in European ecoregions.Fisheries Management and Ecology 14, 441–452.
Smyth, R.L., Watzin, M.C., Manning, R.E., 2007. Defining acceptable levels for eco-logical indicators: an approach for considering social values. EnvironmentalManagement 39, 301–315.
Solimini, A.G., Ptacnik, R., Cardoso, A.C., 2009. Towards holistic assessment of thefunctioning of ecosystems under the Water Framework Directive. Trends inAnalytical Chemistry 28, 143–149.
Stubauer, I., Moog, O., 2000. Taxonomic sufficiency versus need for information- comments based on Austrian experience in biological water quality moni-toring. Verhandlungen der Internationalen Vereinigung für Theoretische undAngewandte Limnologie 27, 1–5.
Teixeira, H., Borja, A., Weisberg, S.B., Ranasinghe, J.A., Cadien, D.B., Dauer, D.M., Dau-vin, J.C., Degraer, S., Diaz, R.J., Gremare, A., Karakassis, I., Llanso, R.J., Lovell, L.L.,Marques, J.C., Montagne, D.E., Occhipinti-Ambrogi, A., Rosenberg, R., Sarda, R.,Schaffner, L.C., Velarde, R.G., 2010. Assessing coastal benthic macrofauna com-munity condition using best professional judgement - developing consensusacross North America and Europe. Marine Pollution Bulletin 60, 589–600.
Tuvikene, L., Nõges, T., Nõges, P., 2010. Why do phytoplankton species compositionand traditional water quality parameters indicate different ecological status ofa large shallow lake? Hydrobiologia 660, 3–15.
Valsangiacomo, A., 1998. Die Natur der Ökologie: Anspruch und Grenzen ökologis-cher Wissenschaften. Hochschulverlag, ETH Zürich, Zürich, 340 pp.
Zaldívar, J.M., Viaroli, P., Newton, A., De Wit, R., Ibanez, C., Reizopoulou, S.,Somma, F., Razinkovas, A., Basset, A., Holmer, M., Murray, N., 2008. Eutrophi-cation in transitional waters: an overview. Transitional Waters Monographs 2,1–78.