DISSERTATION ANTIMICROBIAL RESISTANCE ...
201
DISSERTATION ANTIMICROBIAL RESISTANCE SURVEILLANCE IN FEEDLOT CATTLE Submitted by Katharine M. Benedict Department of Clinical Sciences In partial fulfillment of the requirements For the Degree of Doctor of Philosophy Colorado State University Fort Collins, Colorado Spring 2011 Doctoral Committee: Advisor: Paul S. Morley Calvin W. Booker David C. Van Metre Randall J. Basaraba
-
Upload
khangminh22 -
Category
Documents
-
view
3 -
download
0
Transcript of DISSERTATION ANTIMICROBIAL RESISTANCE ...

DISSERTATION
ANTIMICROBIAL RESISTANCE SURVEILLANCE IN FEEDLOT CATTLE
Submitted by
Katharine M. Benedict
Department of Clinical Sciences
In partial fulfillment of the requirements
For the Degree of Doctor of Philosophy
Colorado State University
Fort Collins, Colorado
Spring 2011
Doctoral Committee: Advisor: Paul S. Morley Calvin W. Booker David C. Van Metre Randall J. Basaraba

Copyright by Katharine M. Benedict 2011
All Rights Reserved

ii
ABSTRACT
ANTIMICROBIAL RESISTANCE IN FEEDLOT CATTLE
Objectives: To develop and validate methodological components of a model for
surveillance of antimicrobial use and resistance in feedlot cattle.
Methods: A web-based survey of participants knowledgeable and interested in
antimicrobial use in beef feedlots was used to solicit responses regarding appropriate
metrics for quantifying, analyzing, and reporting antimicrobial exposures. The
accuracies of two susceptibility tests commonly recommended for surveillance programs
were determined using stochastic latent class analysis. Multivariable logistic and linear
regression was used to investigate associations between exposures to antimicrobial drugs
and antimicrobial resistance.
Results: When reporting antimicrobial use in the context of antimicrobial resistance,
survey participants believed that the Animal Defined Daily Dose metric was the most
accurate. The two susceptibility tests investigated had comparable accuracies for the
antimicrobial drugs tested. Exposure to parenteral tetracycline in the study feedlots was
associated with resistance to tetracycline; however, exposures to all other classes of
antimicrobials were not associated with antimicrobial resistance.

iii
Conclusions: Appropriate metrics for reporting and analyzing antimicrobial resistance are
necessary to accurately investigate associations between use and resistance, though
clarity of what the metric represents may be lost. Testing of susceptibility in surveillance
programs is equally valid by way of disk diffusion testing. Multivariable logistic
regression was an appropriate and useful method to investigate associations between use
and resistance. Parenteral exposures to antimicrobials did not drive antimicrobial
resistance at mid-feeding period.

iv
ACKNOWLEDGEMENTS
These projects were supported by grants from the Advancing Canadian
Agriculture and Agri-Food Program, the Canadian Cattlemen’s Association, Beef Cattle
Research Council (Project Number BCRC 6.41), the Alberta Beef Producers (Project
Number 0007-038RDB), and the College Research Council at Colorado State University.
The Public Health Agency of Canada coordinated the projects. The results and
conclusions of these projects were part of the reports for the Canadian Integrated
Programs for Antimicrobial Resistance Surveillance.
I gratefully acknowledge Jane Shaw and David Dargatz for their contributions in
developing the antimicrobial use survey, and Audrey Ruple for assistance in collection of
responses for the survey.
I gratefully acknowledge Trevor W. Alexander, Shaun R. Cook, Sherry A. Hunt,
and Lorna J. Selinger for their technical assistance regarding bacterial culture, isolation,
and susceptibility testing at the Lethbridge Research Center. I also gratefully
acknowledge Sherry Hannon for extraction and verification of antimicrobial use
information and Chelsea Flaig for extraction and verification of antimicrobial use
information as well as for coordinating collection and shipment of samples at Feedlot
Health Management Services.

v
PREFACE The three projects presented in this dissertation contributed to a large multi-
institution collaborative effort to develop a longitudinal antimicrobial resistance and use
surveillance program for the feedlot sector in Canada. The goal of this large-scale effort
was to develop and validate a practical model for monitoring antimicrobial susceptibility
in populations of feedlot cattle. Lead investigators represented five universities
(Colorado State University, University of Calgary, University of Guelph, University of
Lethbridge, and University of Saskatchewan), provincial and federal Canadian
government (Alberta Agriculture Food, Rural Development Food Safety Division,
Agriculture and Agri-Food Canada, and Public Health Agency of Canada), and one
private veterinary company (Feedlot Health Management Services) which managed the 4
large, commercial feedlots where the surveillance program was piloted.
In order to implement effective resistance control strategies, surveillance systems
must evaluate accurate and reliable data. Prior to collecting this data the methodology
related to sampling, shipping, testing, analyzing, and reporting should be validated for
efficiency and accuracy. The projects of this dissertation were focused on three specific
questions (listed below) about the methodology utilized in this pilot surveillance
program.

vi
Research Questions:
1) How should antimicrobial use data be quantified for analysis of antimicrobial
resistance and for reporting? (Chapter 2)
2) What is an appropriate testing method for determining susceptibility? (Chapter 3)
3) How should analysis be conducted to investigate associations between exposure
to antimicrobial drugs and antimicrobial resistance? (Chapter 4)
Each of these questions was investigated as an independent project. Objectives,
methods and materials, results, and discussion for each project are presented separately in
Chapters 2-4. Interpretive summaries for each chapter and the final Conclusions
(Chapter 5) describe how the project relates back to the aim of the large-scale
collaborative effort and the broader implications of the work. Other research
investigating the development, dissemination, and persistence of antimicrobial resistance
has been conducted globally for decades. A review of the previous work and existing
gaps in knowledge related to antimicrobial resistance surveillance in feedlot cattle is
presented in Chapter 1.

vii
DEDICATION
For the Benedicts, the Ritsicks, the Roberts, the Ellises, the Munzes, and the Morleys
whom have all provided their unconditional support through my training.

viii
TABLE OF CONTENTS
ABSTRACT…. ................................................................................................................... ii
ACKNOWLEDGEMENTS ................................................................................................ iv
PREFACE ........................................................................................................................... v
DEDICATION ..................................................................................................................vii
TABLE OF CONTENTS ................................................................................................ viii
LIST OF TABLES ..............................................................................................................x
LIST OF FIGURES .......................................................................................................... xi
CHAPTER 1: Literature Review ........................................................................................1
INTRODUCTION ........................................................................................................................... 2
SURVEILLANCE ........................................................................................................................... 7
ANTIMICROBIAL RESISTANCE IN CATTLE ........................................................................... 9
INDIRECT ASSOCIATIONS BETWEEN ANTIMICROBIAL USE AND RESISTANCE ....... 11
DIRECT ASSOCIATIONS BETWEEN ANTIMICROBIAL USE AND RESISTANCE ........... 14
ANTIMICROBIAL USE ............................................................................................................... 16
ANTIMICROBIAL USE POLICY ................................................................................................ 19
CHALLENGES IN ANTIMICROBIAL RESISTANCE SURVEILLANCE ............................... 24
REFERENCES .............................................................................................................................. 26
CHAPTER 2: Metrics for quantifying antimicrobial use in beef feedlots .....................39
INTERPRETIVE SUMMARY ...................................................................................................... 40
ABSTRACT ................................................................................................................................... 41
INTRODUCTION ......................................................................................................................... 43
MATERIALS AND METHODS ................................................................................................... 45
RESULTS ...................................................................................................................................... 51
DISCUSSION ................................................................................................................................ 62
FOOTNOTES ................................................................................................................................ 67
REFERENCES .............................................................................................................................. 68

ix
CHAPTER 3: Evaluation of resistance classification accuracy by latent class analysis of data from disk diffusion and broth microdilution for Escherichia coli and Mannheimia haemolytica recovered from feedlot cattle. ................................................71
INTERPRETIVE SUMMARY ...................................................................................................... 72
ABSTRACT ................................................................................................................................... 73
INTRODUCTION ......................................................................................................................... 75
MATERIALS AND METHODS ................................................................................................... 79
RESULTS ...................................................................................................................................... 90
DISCUSSION .............................................................................................................................. 101
FOOTNOTES .............................................................................................................................. 101
REFERENCES ............................................................................................................................ 107
CHAPTER 4: Associations between parenteral antimicrobial use and antimicrobial resistance in Escherichia coli sampled from individual feedlot cattle ..........................111
INTERPRETIVE SUMMARY .................................................................................................... 112
ABSTRACT ................................................................................................................................. 114
INTRODUCTION ....................................................................................................................... 116
MATERIALS AND METHODS ................................................................................................. 118
RESULTS .................................................................................................................................... 133
DISCUSSION .............................................................................................................................. 136
FOOTNOTES .............................................................................................................................. 139
REFERENCES ............................................................................................................................ 140
CHAPTER 5: Conclusions .............................................................................................142
APPENDIX 1: Survey Instrument .................................................................................151
APPENDIX 2: Survey Instrument – Decline.................................................................166
APPENDIX 3: Nasopharyngeal Swab Sampling Protocol ...........................................168
APPENDIX 4: Composite Fecal Sample Collection Protocol ......................................171
APPENDIX 5: Rectal Fecal Sample Collection Protocol .............................................174
APPENDIX 6: Sample Labeling and Transport Protocol ...........................................177
APPENDIX 7: E. coli Isolation Protocol .......................................................................180
APPENDIX 8: M. haemolytica Isolation Protocol ........................................................184

x
LIST OF TABLES
CHAPTER 2:
Table 1: Definitions of antimicrobial drug use (AMU) metrics. .................................................. 44 CHAPTER 3:
Table 1: Prior probability distributions .......................................................................................... 88
Table 2: Apparent prevalence of resistance by two tests ............................................................... 91
Table 3: Number of resistances per isolate detected by two test .................................................. 92
Table 4: Proportions of true resistance and true non-resistance by two tests ................................ 94
CHAPTER 4:
Table 1: Parenteral antimicrobial drugs administered in study population .................................. 124
Table 2: Number of resistances per isolate at two sampling points ............................................. 126
Table 3: Resistance patterns of isolates at two sampling points .................................................. 127
Table 4: Percentage and frequency of zone diamters ................................................................. 128
Table 5: Parenteral exposure to antimicrobials in sampled individuals ....................................... 130
Table 6: Exposure to parenteral antimicrobials in pens: .............................................................. 130
Table 7: FinalMultivariable logistic regression models ............................................................... 135

xi
LIST OF FIGURES CHAPTER 1:
Figure 1: Relationship between antibiotic use and development of resistance. ... ........................... 3
Figure 2: Network of resistance ....................................................................................................... 4 CHAPTER 2:
Figure 1: Change in participants’ level of concern about antimicrobial resistance ....................... 53
Figure 2: Participants’ perceived need for five different uses of antimicrobial drugs ................... 55
Figure 3: Participant selection of the top two antimicrobial drug use (AMU) metrics .................. 57 CHAPTER 3:
Figure 1: Misclassification in diagnostic tests ............................................................................... 75
Figure 2: Predictive values of resistance and non-resistance for Streptomycin ............................. 97
Figure 3: Predictive values of resistance and non-resistance for Tetracycline .............................. 99 CHAPTER 4:
Figure 1: Prevalence of resistance ............................................................................................... 129

1
CHAPTER 1: Literature Review

2
INTRODUCTION
Antimicrobial resistance is an emerging global threat to human and animal health
(Levy and Marshall 2004). Awareness of this problem is more widespread due to highly
publicized anecdotes about “superbugs” which defy treatment, but the problem itself is
nothing new (Newell et al. 2010). Within 2 decades of the discovery of penicillin,
researchers were already warning that misuse could lead to selection and propagation of
mutant resistant forms of bacteria (Fleming 1929; Levy 2002). One response to these
resistant variants in the past has been the application of new and “better” drugs. Different
antimicrobials were discovered and synthesized in the latter part of the 20th century on a
regular basis. However, no new antimicrobials are currently on the horizon that can
adequately compensate for the loss in susceptibilities to existing antimicrobials (The
Alliance for the Prudent Use of Antibiotics 2005). A “post-antibiotic” era in which no
antimicrobials will be able to combat simple infections is the ultimate fear driving efforts
to understand the complexities of antimicrobial resistance (Cohen 1992). It has been
suggested that resistances to antimicrobials which develop on the local scale left
unmanaged will lead to an untenable global problem and these once powerful will be
rendered useless (Levy 2001).
The use of antimicrobials is the hypothesized major driving force for the
occurrence of antimicrobial resistance (Figure 1, adapted from Barbosa and Levy 2000).
Theoretically, susceptible bacteria in the presence of an antimicrobial are eliminated from
heterogeneous populations of bacteria, while the resistant and even marginally
susceptible bacteria are left to proliferate. However, other factors such as overuse of

3
disinfectants and heavy metals in the environment are recognized as having an influence
as well (Levy 1998; Levy 2002). Beyond the initial use of antimicrobials, post-
therapeutic effects and residues in the environment are also pressures which select for
resistant variants of bacteria over susceptible ones (Gibbs et al. 2006; Levy and Marshall
2004).
Antibiotic Use Antibiotic Resistance
Production intensity
Feed sources
Animal movements within and between herds
Appropriateness of use
Infection control measures
Antibiotic residues
Cross selection
Gene transfer
Non-antibiotic selection
Dose/duration of treatment
Figure 1: Relationship between antibiotic use and development of resistance. Antibiotic use is the main factor in the forward process, i.e. selection of resistance, but other factors can influence that relationship. Factors dependent on management of animals are represented above the horizontal arrow, while factors related to the antibiotic itself and the genetic basis of resistance are represented below the horizontal arrow (adapted from Barbosa and Levy 2000).
Dissemination of antimicrobial resistance through clonal spread as well as by
transfer of resistance genes is of greater concern than the initial development (van den
Bogaard and Sobberingh 2000). New genetic methods are needed to trace antimicrobial
resistance within and between host populations (O’Brien 2002). Though antimicrobial

4
resistance can spread through many different routes, the transmission from agricultural
animals to humans is often scrutinized (Ferber 2000; Shea 2003). A concerning scenario
would be that the antimicrobial drugs used in food-producing animals would ultimately
lead to preventable health problems in consumers. A direct route between exposures to
antimicrobial drugs in food animals to human health problems is unlikely beyond
anecdotes of people working or living closely with the animals (Angulo et al. 2004; Fey
et al. 2000). However, human and animal microbial ecosystems do overlap in various
relationships and efforts to untangle the complexity should also take an ecological
approach (Figure 2, adapted from Witte 1998; Bywater 2004; Singer et al. 2006).
Meat Products
Animal feed
Culture plants
Food
FecesHospital admission
Surface water
Slurry
FecesCompanion
Animals
Food animals
Hospitalized patients
Humans in community
Antibiotic use for growth promotion, prophylaxis, and therapy
Antibiotic use for therapy and prophylaxis
Main reservoirs
Selective pressures
Waste water
Figure 2: Network of resistance. Ecological relationships between antibiotic-resistant bacteria and resistance genes: selective pressures, main reservoirs, and routes of transmission (adapted from Witte 1998).
5
The concerns about human health related to antimicrobial use are polarized
around 2 sets of issues (Barton 1998):
1) Issues that concern proponents of the view that antibiotic use in animals impinges on human health include:
The prevalence of antimicrobial resistant bacteria in food-producing animals Evidence that resistant organisms and genes encoding resistance can be passed
between animals and people and into the environment The large amount of antimicrobials fed as growth promotants or prophylactic
treatments in animals The use in animals of antimicrobials that are used therapeutically in human
medicine or which select for cross-resistance to antimicrobials used in human medicine,
2) Arguments for the view that antimicrobial resistance in human pathogens stems from improper use of those drugs in human medicine include:
Apart from growth promotants, antimicrobials are used much less in animals than in people
Use of antimicrobials in animals has not led to multi resistance problems seen in human medicine
The use of antimicrobials as growth promotants is important to the economics and sustainability of intensive livestock production and preventive and therapeutic treatments are essential for animal welfare.
Unfortunately, sound evidence regarding the above issues is sparse and the absence of
proof cannot be interpreted as the proof of absence (McGeer 1998). Placing emphasis on
the direction of pathogens spreading from food-producing animals to humans may lead
investigators to overlook equally important components of the ecology of these
pathogens (Barber 2001).
Research is needed in many areas regarding the development, dissemination, and
persistence capabilities of antimicrobial resistant organisms and resistance determinants
(McDermott et al 2002; McEwen et al. 2008). Food safety concerns have driven
investigations into the ability of foodborne bacteria to contaminate all steps in the

6
production of animal products. In 21 Alberta feedlots, common foodborne bacterial
pathogens were rarely detected in carcass and environmental samples (Donkersgoed et al.
2009). Documentation of the transmission of resistant organisms from animals to food
products to humans is limited (Piddock 1996). If contamination does occur, data have
shown that antimicrobial resistant E. coli can enter the food chain regardless of whether
or not cattle were administered growth promotants (Alexander et al. 2010). The pathway
between the development of resistance in food animals and health threats involves many
steps. Likely, the overall probability of transmission through all of these steps is low.
However, comprehensive risk assessments are still needed to document these
probabilities (Phillips et al. 2004).
The issue of antimicrobial resistance is multi-faceted and cannot be understood
with only one approach. However, this overwhelming problem should be attacked one
“patch” at a time (Levy 2002). Many calls for surveillance in agricultural populations to
monitor antimicrobial resistance have been made (Aarestrup 2005; Anderson 1999;
McEwen and Fedorka-Cray 2002; The Alliance for the Prudent Use of Antibiotics 2005).
Data from these surveillance programs would theoretically document baseline levels of
resistance and would allow earlier response to increasing resistance trends. Responding
to low levels of resistance rather than high levels may be crucial since resistance genes
are often difficult to eliminate (Austin et al. 1999; Lee et al. 2010; Salyers and Amabile-
Cuevas 1997).

7
SURVEILLANCE In the past, systems monitoring the usage of antimicrobial drugs may not have
been sufficient for specifically documenting and responding to antimicrobial resistance.
To comply with drug regulations, these early systems were less focused on antimicrobial
resistance than they were on detecting residues in food, allergic reactions, and drug
toxicities (Black 1984). However, recent efforts with specific focus on antimicrobial
resistance have been conducted as individual cross-sectional studies as well as large
scale, ongoing national programs (Aarestrup 2004; Bager 2000; Bronzwaer et al. 2002;
Hendriksen et al. 2008; Kaspar 2006). Examples of the organizations monitoring
antimicrobial resistance and use on the national scale include:
ARBAO II Antibiotic resistance in bacteria of animal origin—II (Europe) EARSS European Antimicrobial Resistance Surveillance System ESAC European Surveillance of Antimicrobial Consumption DANMAP Danish Integrated Antimicrobial Resistance
Monitoring and Research Programme JVARM Japanese Veterinary Resistance Monitoring System STRAMA Swedish Strategic Programme Against Antibiotic Resistance NARMS National Antimicrobial Resistance Monitoring System (USA) CIPARS Canadian Integrated Program for Antimicrobial Resistance
Surveillance
Additionally, the Global Advisory on Antibiotic Resistance Data (GAARD) with the
Initiative of the Alliance for the Prudent Use of Antibiotics (APUA) has produced
comprehensive reports on the state of antimicrobial susceptibility internationally. The
efforts of these monitoring systems have provided crucial data for their nations.
However, the World Health Organization (WHO) and the World Organization for Animal

8
Health (OIE) have both made calls for standardization of these programs to allow better
comparisons of the global state of antimicrobial resistance and use.
Though harmony is needed among systems, separate surveillance programs with
different goals are inevitable. In developing countries, routine and efficient methods for
prevention strategies conducted in developed countries may not be practical (Vlieghe et
al. 2010). Surveillance in critical care and tertiary care facilities often is more intensive
since nosocomial infections have a high probability of involving antimicrobial resistance
complications (Ogeer-Gylels et al. 2006). Despite the typical perception that companion
animals are not significant reservoirs for antimicrobial resistance, surveillance programs
tracking resistance in these populations are also important (DeVincent and Reid-Smith
2006; Guardabassi et al. 2004).
Many surveillance programs are currently in operation, yet optimal methodology
for conducting surveillance is unknown. Key features have been suggested for
surveillance such as having a statistically valid sampling program, avoiding “copy
strains,” and using standardized methodology in testing susceptibility (Wallman 2006).
Also, due to the need to elucidate associations with resistance, these surveillance
programs should document quantities of antimicrobial use (Singer et al. 2006; Bager
2000; Szhotnicki 2004). Beyond the details of program components, overall the greatest
current weakness concerning surveillance is simply a lack of adequate data and
appropriate response (Williams 2001).

9
ANTIMICROBIAL RESISTANCE IN CATTLE The level of antimicrobial resistance in cattle is relatively low according to studies
in dairy, cow calf beef, and feedlot herds. Less than 10% of Pasteurella spp. and
Mannheimia haemolytica isolates recovered from healthy calves on 16 dairy herds were
able to grow on oxytetracycline-selective media (Catry et al. 2006). Cattle with
respiratory infections also had overall low levels of resistance in isolates of respiratory
pathogens, except for resistance to sulfamethoxazole in P. multocida and M. haemolytica
and resistance to ampicillin in M. haemolytica (Schwarz et al. 2004). The majority of
commensal E. coli and Salmonella spp. recovered from the feces of dairy cows on farms
in 21 states had no resistance to a broad range of antimicrobial drugs (Lundin et al. 2008).
Resistances which do commonly exist in these populations are not classified as
being of very high importance to human health. Genetic investigations of antimicrobial
resistance in healthy lactating dairy cows have found that E. coli is an important reservoir
for tetracycline and other antimicrobial resistance determinants (Sawant et al. 2007).
Investigations of calves and cow-calf pairs found that resistance was rare to
antimicrobials classified as being of very high importance to human medicine. The most
common resistances in these populations were to tetracycline, sulfamethoxazole, and
streptomycin (Gow et al. 2008a). Cow calf farms were at lower risk than feedlots for
having E. coli isolates that were resistant to tetracycline, sulfamethoxazole, and
streptomycin. No resistances to ceftriaxone or ciprofloxacin were observed in the feedlot
isolates and less than 1% of isolates were resistant to gentamicin, nalidixic acid, and
ceftiofur (Carson et al. 2008b). A separate study also found that resistances to
tetracycline and sulfamethoxazole were common in feedlots (Dargatz et al. 2002).

10
However, most isolates of Salmonella recovered from pen floor samples at these 100
feedlots were susceptible to all antimicrobials tested. Despite lacking evidence of direct
threats to human health by way of antimicrobial resistance in these populations, the
perception is that the emergence of such a problem is possible and should be closely
monitored.
Molecular investigations have revealed multiple mechanisms of resistance that are
both transferable (plasmids and transposons) as well as permanent (chromosomal
changes) (Wilson 1990). Plasmids and transposons have a role in the spread of the
resistant genes in Pasteurella and Mannheimia isolates (Kehrenberg et al. 2001).
Plasmids also have been documented to conjugate with commonly between E. coli and
Salmonella. In an outbreak investigation of salmonellosis in calves, plasmids conferring
resistance to apramycin and several other antibiotics were transferred by conjugation in
vitro from E. coli to S. typhimurium (Hunter et al. 1992). Recently, a novel mechanism
(radical-induced mutagenesis) has been documented for the development of resistance to
antimicrobials when sublethal levels of different antimicrobials are applied (Kohanski et
al. 2010). Unfortunately, traditional testing methodologies which can identify
susceptibilities in antimicrobials may not be able to detect novel resistance phenotypes
(Tenover 2001). Selective pressures on bacteria can encourage the development of novel
resistance genes or can help establish acquired resistance traits (Kehrenberg et al. 2001).
However, the genes themselves are not responsible for the greater fitness advantage of
antimicrobial resistant E. coli in calves. Other factors such as the farm environment and
diet exert selective pressures (Khachatryan et al. 2006).

11
Multiple factors participate in establishing and maintaining antimicrobial
resistance. Feed can harbor genetic elements associated with resistance for feedlot cattle
by way of contamination with E. coli and Salmonella or residual determinants from feed
components such as wet distillers grain with solubles (Dargatz et al. 2005; Jacob et al.
2010). The environments of intensively managed animals such as feedlot cattle can
harbor resistant bacteria and resistance determinants (Alexander et al. 2009; Berge et al.
2010; Gibbs et al. 2006; Holzel et al 2009). Resistance occurrence also varies dependent
on certain host factors such as age (Berge et al. 2010; Gow et al. 2008a). Environmental
and host factors likely interact with other selective pressures and it is unlikely that any
single exposure factor can wholly account for the development and maintenance of
resistance (Harada and Asai 2010; Witte 2000).

12
INDIRECT ASSOCIATIONS BETWEEN ANTIMICROBIAL USE AND RESISTANCE Within the web of factors which are associated with antimicrobial resistance,
antimicrobial use is hypothesized to be a significant component. A classic model for
investigating associations between antimicrobial use and resistance indirectly has been to
compare resistance in production using conventional practices which include the use of
antimicrobials versus production in populations which have specifically excluded the use
of antimicrobials. These studies hypothesize that if antimicrobial use is significantly
associated with antimicrobial resistance, then differences in resistance will be detected
between the production methods. An investigation of Campylobacter spp. on swine
farms found no difference in the prevalence of this bacterium between antimicrobial-free
and conventional production methods, but did find a lower prevalence of antimicrobial
resistance in the antimicrobial free farms (Rollo et al. 2010). Though these authors noted
that resistances tended to decline as the number of years that a farm was antimicrobial-
free increased, they suggested that investigation of other interventions to reduce
resistance levels was warranted. Conversely, investigations of antimicrobial
susceptibility in organic (i.e., no or severely limited antimicrobial use) and conventional
dairy herds have documented that resistances in Campylobacter spp. were no different
between the production methods (Sato et al. 2004). Interestingly, these authors did find
that calves had higher levels of resistance than cows supporting previous statements
about other factors contributing to resistance. Additional comparison studies between
these dairies revealed that resistance prevalence in E. coli isolates were different for 7
antimicrobials, but not significantly different for 10 other antimicrobials (Sato et al.

13
2005). Controlling for age, conventional dairy farms had significantly higher rates of
resistance to ampicillin, streptomycin, kanamycin, gentamicin, chloramphenicol,
tetracycline, and sulfamethoxazole. Production practices of swine and dairy operations
are different from that of feedlot cattle, so extrapolation of these conclusions to feedlot
cattle may be limited.
A recent study compared resistances in pens of feedlot cattle reared using
conventional practices with those being fed without antimicrobial exposures (Morley et
al. 2011). These authors concluded that conventional feedlot production methods
(including parenteral and in-feed use of antimicrobials) do not predictably or uniformly
increase the prevalence of a resistance in non-type specific E. coli when compared to
production methods which restrict exposure to antimicrobial drugs. Additionally, though
no tetracyclines were administered in these populations of feedlot cattle, the resistance to
tetracycline increased temporally through the feeding period. Similarly, in a separate
study, resistance to streptomycin, sulfamethoxazole, and tetracycline increased
significantly from arrival to mid-point during the feeding period and persisted until
market-readiness (Carson et al. 2008b). Therefore, temporal and transient trends in the
prevalence of resistance, which vary between antimicrobial drugs, might account for
resistance levels rather than exposure to antimicrobial drugs. Conflicting conclusions
from these comparison studies support the need for more direct investigations in the
association between antimicrobial use and resistance. Well-designed association studies
are needed to shed more light on the lesser understood quantitative aspects of
antimicrobial resistance (Phillips 1998).

14
DIRECT ASSOCIATIONS BETWEEN ANTIMICROBIAL USE AND RESISTANCE
Evidence for and against direct associations between the use of antimicrobial
drugs and antimicrobial resistance has been documented. An early study tracking
antimicrobial use in feedlot calves and relating it to levels of resistance revealed that
therapy with a particular antimicrobial in the week prior to death, increased the level of
resistance to P. haemolytica to that antimicrobial (Martin et al. 1983). These authors also
made observations that resistance to penicillin, tetracyclines, and chloramphenicol
occurred more frequently together than expected by chance alone. Injectable
oxytetracycline in addition to in-feed chlortetracycline administered to cattle was
associated with an increase in the prevalence of resistance in commensal E. coli to
chloramphenicol and sulfisoxazole, but no other tested antimicrobials (O’Connor et al.
2008). Exposure to chlortetracycline for feedlot cattle was associated with a temporary
increase in the recovery of resistant E. coli and Enterococcus isolates (Platt et al. 2008).
Also of note, the ceftiofur-resistant E. coli isolates in this study actually declined during
the exposure to chlortetracycline. The transient expansion of multiple-resistant variants
of E. coli was found to be associated in a separate study with the parenteral
administration of ceftiofur crystalline-free acid to feedlot steers (Lowrance et al. 2007).
Susceptibility returned to baseline levels approximately 2 weeks after completion of the
ceftiofur crystalline-free acid administration. Positive associations between in-feed as
well as injectable tetracycline were found for resistance to tetracycline, streptomycin, and
sulfadiazine among non-type specific E. coli in feedlot cattle (Rao et al. 2010). However,
these authors concluded that the differences noted were relatively small and of

15
questionable practical relevance. In cattle receiving antimicrobials for metaphylaxis and
treatment in the absence of in-feed macrolides and tetracyclines, no associations were
found between antimicrobial use and resistance in recovered isolates of E. coli (Checkley
et al. 2008). A lack of any associations in Salmonella isolates between resistances and
the presence of antimicrobials in feed were noted in another study of feedlot cattle
(Dargatz et al. 2002). Specific investigation into resistances in E. coli isolates recovered
from feedlot cattle given subtherapeutic administration of tetracycline in combination
with sulfamethazine revealed associations with tetracycline and ampicillin resistances
(Alexander et al. 2008). However, these authors acknowledged that additional
environmental factors such as diet may be related to these resistances.
The studies described above specifically investigating the association between
antimicrobial use and antimicrobial resistances in cattle do provide some evidence that
associations exist in these populations. However, as always it is important to keep in
mind that association is not causation and further studies are warranted that can account
for confounding variables and other biases.

16
ANTIMICROBIAL USE Antimicrobial drugs are crucial to the health and management of agricultural
populations of animals. Administration of antimicrobials in feedlots is largely for the
prevention of liver abscesses and the prevention and treatment of bovine respiratory
disease. On all feedlots included in a representative national study, bovine respiratory
disease was the most common disease condition and nearly all of the feedlots included
injectable antimicrobial drugs (most commonly tilmicosin, florfenicol and tetracyclines)
as part of an initial course of treatment for bovine respiratory disease (NAHMS 1999). If
the therapeutic regimen used for initial treatment failed to result in a favorable response,
84% of the feedlots changed their choice of antimicrobial. Large feedlots were more
likely than small feedlots to administer antimicrobials metaphylactically to groups of
cattle to prevent bovine respiratory disease, though overall only 10.4% of cattle placed in
feedlots were administered antimicrobials for this reason. Many (83.2%) of the surveyed
feedlots also included antimicrobials in feed or water as a health or production
management tool. A Canadian study quantified the commonly used antimicrobials by
injection (oxytetracycline, penicillin, macrolides, florfenicol, and spectinomycin), in feed
(monensin, tylosin, lasolocid, and tetracyclines), and in water (lincomycin-
spectinomycin, chlortetraycline, and oxytetracycline) (Carson et al. 2008a). Though
usage of antimicrobials is common in North American feedlots, veterinarians weigh
multiple factors in the decision to utilize appropriate antimicrobials. A survey of feedlot
veterinarians indicated that the effects of moral beliefs on behavioral beliefs were
contingent on the condition such as the level of risks associated with treating or not

17
treating cattle and the effectiveness of antimicrobials in acute illness (McIntosh et al.
2009).
The ability of antimicrobials to treat or prevent an indication (efficacy) and the
ability to do this well (effectiveness) are major components in the decision to use these
drugs. Considering the health risks associated with antimicrobial resistance and the
potential association with antimicrobial drug use, evidence of usefulness of these drugs is
most definitely necessary. The approval process for new animal drug applications
through the Food and Drug Administration (FDA) requires that antimicrobial drugs meet
standards of effectiveness and safety. However, further independent field trials in the
feedlot sector often follow FDA approvals to further evaluate antimicrobials. Tilmicosin
and oxytetracycline in feedlot cattle have been shown to be useful as prophylactic (given
prior to an expected infection) antimicrobial drugs for reducing morbidity due to bovine
respiratory disease (Donkersgoed 1992; Frank and Duff 2000; Merrill et al. 1994;
Schunicht et al. 2000a). Given metaphylatically (at the time of an expected infection)
antimicrobials such as florfenicol and tulathromycin are also useful in managing bovine
respiratory disease (Booker et al. 2007; Duff and Galyean 2007; Frank et al. 2002).
Administration of antimicrobials for treatment of bovine respiratory disease is primarily
more effective if disease is recognized early (Cusack et al. 2003). The drugs which have
been found to be effective as treatment of undifferentiated fever include tulathromycin,
florfenicol, tilmicosin, trimethoprim-sulfadoxine, oxytetracycline, penicillin, and
ceftiofur (Batemen et al. 1990; Booker et al. 1997; Guichon et al. 1993; Harland et al.
1991; Jim et al. 1992; Jim et al. 1999; Mechor et al. 1988; Schunicht et al. 2007). Many
of these antimicrobials have been compared to one another to assert the comparable or

18
superior efficacy of one drug to another. The antimicrobial drugs discussed above also
improve growth efficiency which is a characteristic in feedlot production that is highly
regarded (Gorham et al. 1990; Merrill et al. 1994; Encinias et al. 2006; Schumann et al.
1990; Schunicht et al. 2002b). Cost effectiveness is another crucial characteristic of these
antimicrobials in the context of antimicrobial resistance and has also been investigated
for these drugs (Perrett et al. 2008; Booker et al. 2006; Schunicht et al. 2002a).
The impact of antimicrobial resistance on bovine respiratory disease is not well
established (Watts and Sweeney 2010). As previously described in the antimicrobial
resistance section, resistance in feedlot cattle is relatively low. Despite more common
resistances to tetracycline in feedlot populations, the efficacy of tetracyclines does not
seem to be compromised (Rao et al. 2010). However, a deficiency in information about
antimicrobial use complicates antimicrobial research and proper risk assessments are
needed to evaluate the potential loss of usefulness of antimicrobial drugs (Fraser et al.
2004; McEwen and Singer 2006). Additionally, since the microbial ecologies of animals
and humans are intertwined, any shared loss of usefulness (loss of susceptibility)
becomes a concern beyond the feedlot (Witte 1998; Bywater 2004; Singer et al. 2006).

19
ANTIMICROBIAL USE POLICY In the United States, the safety of drugs in target species was first regulated by the
Federal Food, Drug, and Cosmetic Act in 1938. Among many amendments to this act,
ones pivotal in the context of antimicrobial use in feedlot cattle categorized prescription
and over-the-counter drugs separately (1951) and provided for the authority of the Food
and Drug Administration Center for Veterinary Medicine (FDA-CVM) (1962). More
recently, the Animal Medicinal Drug Use Clarification Act of 1994 (AMDUCA) began to
regulate extra-label use of drugs by veterinarians. A current bill (Preservation of
Antibiotics for Medical Treatment Act of 2009 [PAMTA]) is still in the first step of the
legislative process and has the objective to preserve the effectiveness of medically
important antibiotics used in the treatment of human and animal diseases (Wren 2007).
Though not a formal regulation requirement, the Food Animal Residue Avoidance and
Depletion Database (FARAD) is a national tool sponsored by the United States
Department of Agriculture which aids in avoiding illegal drugs in foods of animal origin.
An extensive review of the scientific evidence related to antimicrobial resistance threats
to human health due to the use of antimicrobial drugs in animals was conducted by a
scientific advisory panel known as “The Facts about Antimicrobials in Animals and the
Impact on Resistance” (FAAIR 2002). This collection of researchers has made the
following recommendations:
1. Antimicrobial agents should not be used in agriculture in the absence of disease 2. Antimicrobials should be administered to animals only when prescribed by a
veterinarian 3. Quantitative data on antimicrobial use in agriculture should be made available to
inform public policy

20
4. The ecology of antimicrobial resistance should be considered by regulatory agencies in assessing human health risk associated with antimicrobial use in agriculture
5. Surveillance programs for antimicrobial resistance should be improved and expanded
6. The ecology of antimicrobial resistance in agriculture should be a research priority
In Canada, regulation of veterinary biologics and medicated feeds is done by the
Canadian Food Inspection Agency (CFIA). The Veterinary Drugs Directorate (VDD) is
the branch of Health Canada that approves drug products and determines withdrawal
times. Currently, extra-label use of drugs by veterinarians is not regulated by any
legislation, though Canadian offices of the global FARAD aids in determining
withdrawal times for such extra-label drug use. The list of drugs prohibited in food
animals in Canada is different from that of the United States (Dowling 2003).
International organizations have also addressed issues of antimicrobial resistance.
The World Organization for Animal Health (OIE) has published guidelines for veterinary
pharmaceutical industry, veterinary practitioners, dispensing pharmacists, and farmers
with the objective “to maintain antibiotic efficacy, to avoid dissemination of resistant
bacteria or resistance determinants, and to avoid the exposure of humans to resistance
through food” (Anthony et al. 2001). The World Health Organization (WHO) ranks and
updates antimicrobials according to their importance in human medicine in efforts to
develop risk management strategies (Collignon et al. 2009). These two organizations
also have made a joint report with the Food and Agriculture Organization (FAO) on
Critically Important Antimicrobials (2007). This meeting was a continuation of another
meeting of the three organizations in 2003 after recommendations from the Executive
Committee of the Codex Alimentarius Commission were discussed in 2001. Among

21
many recommendations from the Report of the Joint FAO/WHO/OIE Expert Meeting on
Critically Important Antimicrobials in 2007, one relevant to current surveillance efforts in
feedlot cattle is:
5. Antimicrobial resistance monitoring of foodborne pathogens and commensals (animal, human, food and commodity) should be implemented by all countries considering risk management measures, to enable the detection of hazards and accurately assess the success of selected interventions. Ideally, quantitative standardized minimum inhibitory concentration methods should be applied.
Precautionary bans on growth promotants have been established in Sweden
(1986) and the European Union (1997). These bans had roots in recommendations dating
back to 1969 with the Joint Committee on the use of Antibiotics in Animal Husbandry
and Veterinary Medicine in the United Kingdom which concluded that “the
administration of antibiotics to farm livestock, particularly at sub-therapeutic levels,
poses certain hazards to human and animal health; in particular it has led to resistance in
enteric bacteria of animal origin.” Since these bans, conflicting reports of success and
failure as a result of the bans have been reported. The occurrence of antimicrobial
resistance in a national population of food animals was ultimately reduced after the
government of Denmark banned avoparcin in 1995 and virgniamycin 1998 (Aarestrup et
al. 2001). However, a list of adverse consequences such as a deterioration of animal
health and an increase in the usage of therapeutic antibiotics in food animals which are of
direct importance to human medicine has also been reported (Casewell et al. 2003;
Bywater 2005). A separate study in Switzerland reports that the ban on growth
promotants in feedstuffs did not result in an increase in therapeutic use of antibiotics in
medicated feed (Arnold et al. 2004). Additionally, long-term evaluation of the bans in

22
swine showed an improvement in productivity (Aarestrup et al. 2010). A report
investigating the possibility of a similar ban in the United States has stated that
discontinuing use of antimicrobial drugs in swine production would initially decrease
feed efficiency, raise feed costs, reduce production, and raise prices to consumers
(Matthews 2001).
Prudent and judicious use of antimicrobial drugs has been suggested as a means to
reduce consumption and manage resistance in both human and veterinary medicine
(Shlaes et al. 1997; Morley et al. 2005). In Germany, the change in prescription patterns
of veterinarians in response to prudent use guidelines dramatically reduced antimicrobial
drug consumption within 2 years (Ungemach et al. 2006). Antibiotic stewardship and
consumption varies across European human hospitals, but studies are currently underway
to evaluate the impact of prudent use guidelines including optimal approaches to
respiratory infections, cycling antimicrobials in intensive care units, patient education
materials, and strategies to improve doctor-patient communication (Bruce et al. 2004;
McGowan 2000; Schwartz 1999). The FDA-CVM has recently distributed a draft
guidance for the judicious use of medically important antimicrobial drugs in food-
producing animals (2010) which puts forth two measures to phase in:
1. Limiting medically important antimicrobial drugs to uses in food-producing animals that are considered necessary for assuring animal health; and
2. Limiting such drugs to uses in food-producing animals that include veterinary
oversight or consultation.
In addition to prudent use, improved infection control and hygiene have been suggested
to further reduce consumption of antimicrobial drugs (van den Bogaard and Stobberingh
1999). These efforts together may have the ability to “turn the tide of antimicrobial

23
resistance” (Monnet and Kristinsson 2008). Yet, expectations of reversals in
antimicrobial resistance should be accepted with caution since adequate data are lacking
to detect these changes (Phillips 2001).

24
CHALLENGES IN ANTIMICROBIAL RESISTANCE SURVEILLANCE The burden of antimicrobial resistance has both health and economic impacts and
efforts to reduce these are warranted (Holmberg et al. 1987; Howard et al. 2001; Howard
and Scott 2005; McGowan 2001). Improved surveillance systems which investigate
associations between use and resistance can serve as “information for action” in
developing policies which reduce unnecessary prescribing and prolong the usefulness of
antibiotics (Livermore 1998). Minimum epidemiological and microbiological
requirements for establishing surveillance of antimicrobial resistance in bacteria of
animal origin have been defined (Caprioli et al. 2000). However, the intricacies of
surveillance components are not well understood. This chapter has described issues
surrounding antimicrobial resistance, surveillance efforts currently in place, the
prevalence of antimicrobial resistance in feedlot cattle, indirect and direct associations
between antimicrobial resistance and use, the necessity of antimicrobial use in feedlot
cattle, and the regulatory policies surrounding these issues. Some areas to consider
which represent gaps in knowledge about antimicrobial use and resistance are listed
below.
Summary of Gaps (bold indicates gaps being further considered in this dissertation): Genetic methods to trace antimicrobial resistance within and between host
populations

25
Ecological approaches to evaluation of microbial relationships between humans and
animals
Accurate quantification of antimicrobial use
Investigations of the dissemination and persistence of antimicrobial resistance
Comprehensive risk assessments of antimicrobial resistance
More antimicrobial resistance surveillance programs; local, national, and international
Optimization of methodology and standardization for surveillance programs
Susceptibility testing capable of detecting novel resistance
Prevalence of resistance in food-producing animals
Studies investigating direct associations between antimicrobial use and
resistance
Identification of other factors inflating or hiding true associations
Evaluation of prudent use and other interventions in changing trends in resistance

26
REFERENCES Aarestrup FM, Seyfarth AM, Emborg HD, Pedersen K, Hendriksen RS, and Bager F.
Effect of Abolishment of the Use of Antimicrobial Agents for Growth Promotion on Occurrence of Antimicrobial Resistance in Fecal Enterococci from Food Animals in Denmark. Antimicrob Agents Chemother 2001; 45:2054-2059.
Aarestrup FM. Monitoring of Antimicrobial Resistance among Food Animals: Principles and Limitations. J Vet Med Series B Vet Public Health 2004; 51:380-388.
Aarestrup FM. Veterinary Drug Usage and Antimicrobial Resistance in Bacteria of Animal Origin. Basic Clin Pharmacol Toxicol 2005; 96:271-281.
Aarestrup FM, Jensen VF, Emborg HD, Jacobsen E, and Wegener HC. Changes in the use of antimicrobials and the effects on productivity of swine farms in Denmark. Am J Vet Res 2010; 71:726-733.
Alexander TW, Reuter T, Sharma R, Yanke LJ, Topp E, and McAllister TA. Longitudinal characterization of resistant Escherichia coli in fecal deposits from cattle fed subtherapeutic levels of antimicrobials. Appl Environ Microbiol 2009; 75:7125-7134.
Alexander TW, Yanke LJ, Topp E, Olson ME, Read RR, Morck DW, and McAllister TA. Effect of Subtherapeutic Administration of Antibiotics on the Prevalence of Antibiotic-Resistant Escherichia coli Bacteria in Feedlot Cattle. Appl Environ Microbiol 2008; 74:4405-4416.
Alexander TW, Inglis GD, Yanke LJ, Topp E, Read RR, Reuter T, and McAllister TA. Farm-to-fork characterization of Escherichia coli associated with feedlot cattle with a known history of antimicrobial use. Int J Food Microbiol 2010; 137:40-48.
Anderson RM. The pandemic of antibiotic resistance. Nat Med 1999; 5:147-149.
Angulo FJ, Nargund VN, and Chiller TC. Evidence of an Association between Use of Anti-microbial Agents in Food Animals and Anti-microbial Resistance among Bacteria Isolated from Humans and the Human Health Consequences of Such Resistance. J Vet Med B Vet Public Health 2004; 51:374-379.
Anthony F, Acar J, Franklin A, Gupta R, Nicholls T, Tamura Y, Thompson S, Threlfall EJ, Vose D, van Vuuren M, and White DG. Antimicrobial resistance: responsible and prudent use of antimicrobial agents in veterinary medicine. Rev sci tech Off int Epiz 2001; 20:829-839.

27
Arnold S, Gassner B, Giger T, and Zwahlen R. Banning antimicrobial growth promoters in feedstuffs does not result in increased therapeutic use of antibiotics in medicated feed in pig farming. Pharmacoepidemiol Drug Saf 2004; 13:323-331.
Austin DJ, Kristinsson KG, and Anderson RM. The relationship between the volume of antimicrobial consumption in human communities and the frequency of resistance. Proc Natl Acad Sci U S A 1999; 96:1152-1156.
Bager F. DANMAP: monitoring antimicrobial resistance in Denmark. Int J Antimicrob Agents 2000; 14:271-274.
Barber DA. New perspectives on transmission of foodborne pathogens and antimicrobial resistance. J Am Vet Med Assoc 2001; 218:1559-1561.
Barbosa TM and Levy SB. The impact of antibiotic use on resistance development and persistence. Drug Resist Updat 2000; 3:303.
Barton MD. Does the use of antibiotics in animals affect human health? Aust Vet J 1998; 76:177-180.
Bateman KG, Martin SW, Shewan PE, and Menzies PI. An evaluation of antimicrobial therapy for undifferentiated bovine respiratory disease. Can Vet J 1990; 31:689-696.
Berge AC, Hancock DD, Sischo WM, and Besser TE. Geographic, farm, and animal factors associated with multiple antimicrobial resistance in fecal Escherichia coli isolates from cattle in the western United States. J Am Vet Med Assoc 2010; 236:1338-1344.
Black WD. The use of antimicrobial drugs in agriculture. Can J Physiol Pharmacol 1984; 62:1044-1048.
Booker CW, Jim GK, Guicho T, Schunicht OC, Thorlakson BE, and Lockwood PW. Evaluation of florfenicol for the treatment of undifferentiated fever in feedlot calves in western Canada. Can Vet J 1997; 38:555-560.
Booker CW, Schunicht OC, Guichon PT, Jim GK, Wildman BK, Pittman TJ, and Perret T. An evaluation of the metaphylactic effect of ceftiofur crystalline free acid in feedlot calves. Vet Ther 2006; 7:258-274.
Booker CW, Abutarbush SM, Schunicht OC, Jim GK, Perrett T, Wildman BK, Guichon PT, Pittman TJ, Jones, C, and Pollock CM. Evaluation of the efficacy of tulathromycin as a metaphylactic antimicrobial in feedlot calves. Vet Ther 2007; 8:183-200.

28
Bronzwaer SLAM, Cars O, Buchholz U, Molstad S, Goettsch W, Veldhuijzen IK, Kool JL, Sprenger MJW, Degener JE, and participants in the European Antimicrobial Resistance Surveillance System. A European study on the relationship between antimicrobial use and antimicrobial resistance. Emerg Infect Dis 2002; 8:278-282.
Bruce J, MacKenzie FM, Cookson B, Mollison J, van der Meer JWM, Krcmery V and Gould IM on behalf of the APRPAC Steering Group. Antibiotic stewardship and consumption: findings from a pan-European hospital study. J Antimicrob Chemother 2009; 64:853-860.
Bywater RJ. Veterinary Use of Antimicrobials and Emergence of Resistance in Zoonotic and Sentinel Bacteria in the EU. J Vet Med B Vet Public Health 2004; 51:361-363.
Bywater R. Identification and surveillance of antimicrobial resistance dissemination in animal production. Poult Sci 2005; 84:644-648.
Canadian Food Inspection Agency (CFIA). http://www.inspection.gc.ca/english/toce.shtml. Accessed September 10, 2010.
Caprioli A, Busani L, Martel JL, and Helmuth R. Monitoring of antibiotic resistance in bacteria of animal origin: epidemiological and microbiological methodologies. Int J Antimicrob Agents 2000; 14:295-301.
Carson CA, Reid-Smith R, Irwin RJ, Martin WS, and McEwen SA. Antimicrobial use on 24 beef farms in Ontario. Can J Vet Res 2008a; 72:109-118.
Carson CA, Reid-Smith R, Irwin RJ, Martin WS, and McEwen SA. Antimicrobial resistance in generic fecal Escherichia coli from 29 beef farms in Ontario. Can J Vet Res 2008b; 72:119-128.
Casewell M, Friis C, Marco E, McMullin P, and Phillips I. The European ban on growth-promoting antibiotics and emerging consequences for human and animal health. J Antimicrob Chemother 2003; 52:159-161.
Catry B, Decostere A, Schwarz S, Kehrenberg C, de Kruif A, and Haesebrouck F. Detection of Tetracycline-Resistant and Susceptible Pasteurellaceae in the Nasopharynx of Loose Group-Housed Calves. Vet Res Commun 2006; 30:707-715.
Checkley SL, Campbell JR, Chirino-Trejo M, Janzen ED, and McKinnon JJ. Antimicrobial resistance in generic fecal Escherichia coli obtained from beef cattle on arrival at the feedlot and prior to slaughter, and associations with volume of total individual cattle antimicrobial treatments in one western Canadian feedlot. Canadian J Vet Res 2008; 72:101-108.

29
Cohen ML. Epidemiology of Drug Resistance: Implications for a Post-Antimicrobial Era. Science 1992; 257:1050-1055.
Collignon P, Powers J, Chiller T, Aidara-Kane A, and Aarestrup F. Food Safety: World Health Organization Ranking of Antimicrobials According to Their Importance in Human Medicine: A Critical Step for Developing Risk Management Strategies for the Use of Antimicrobials in Food Production Animals. Clin Infect Dis 2009; 49:132-141.
Cusack PMV, McMeniman N, and Lean IJ. The medicine and epidemiology of bovine respiratory disease in feedlots. Aust Vet J 2003; 81:8.
Dargatz DA, Fedorka-Cray PJ, Ladely SR, Ferris KE, Green AL, and Headrick ML. Antimicrobial susceptibility patterns of Salmonella isolates from cattle in feedlots. J Am Vet Med Assoc 2002; 221:268-272.
Dargatz DA, Strohmeyer RA, Morley PS, Hyatt DR, and Salman MD. Characterization of Escherichia coli and Salmonella enterica from cattle feed ingredients. Foodborne Pathog Dis 2005; 2:341-347.
DeVincent SJ and Reid-Smith R. Stakeholder position paper: Companion animal veterinarian: Animal Antimicrobial Use Data Collection in the United States: Methodological Options. Prev Vet Med 2006; 73:181-189.
Donkersgoed JV. Meta-analysis of field trials of antimicrobial mass medication for prophylaxis of bovine respiratory disease in feedlot cattle. Can Vet J 1992; 33:786-795.
Donkersgoed JV, Bohaychuk V, Besser T, Song XM, Wagner B, Hancock D, Renter D, and Dargatz D. Occurrence of foodborne bacteria in Alberta feedlots. Can Vet J 2009; 50:166-172.
Dowling PM and Lopez HS. International perspectives in clinical pharmacology: Canada and Mexico. Vet Clin Food Anim Prac 2004; 19:707-713.
Duff GC and Galyean ML. Board-Invited Review: Recent advances in management of highly stressed, newly received feedlot cattle. J Anim Sci 2007; 85:823-840.
Encinias AM, Walker DA, Murdock CW, Reeves LA, Malcolm-Callis KJ, and Soto-Navarro S. Effects of prophylactic administration of ceftiofur crystalline free acid on health and performance of newly received beef calves. Proc Western Section Am Society Anim Sci 2006; 57.
FAAIR Scientific Advisory Panel. Policy Recommendations. Clin Infect Dis 2002; 34, S76.

30
Food Animal Residue Avoidance and Depletion Program (FARAD). http://www.farad.org/. Accessed September 10, 2010.
Ferber D. Antibiotic Resistance: Superbugs on the Hoof? Science 2000; 288:792-794.
Fey PD, Safranek TJ, Rupp ME, Dunne EF, Ribot E, Iwen PC, Bradford PA, Angulo FJ, and Hinrichs SH. Ceftriaxone-Resistant Salmonella Infection Acquired by a Child from Cattle. N Engl J Med 2000; 342:1242-1249.
Fleming A. On the antibacterial action of cultures of penicillium, with special reference to their use in the isolation of B. influenzae. Br J Exp Path 1929; 10:226-236.
Food and Agriculture Organization of the United Nations (FAO). http://www.fao.org/. Accessed September 10, 2010.
Food and Drug Administration (FDA). Federal Food, Drug, and Cosmetic Act. http://www.fda.gov/RegulatoryInformation/Legislation/FederalFoodDrugandCosmeticActFDCAct/default.htm. Accessed September 10, 2010.
Fraser E, Stephen C, Bowie WR, and Wetzstein M. Availability and estimates of veterinary antimicrobial use in British Columbia. Can Vet J 2004; 45:309-311.
Frank GH and Duff GC. Effects of tilmicosin phosphate, administered prior to transport or at time of arrival, and feeding of chlortetracycline, after arrival in a feedlot, on Mannheimia haemolytica in nasal secretions of transported steers. Am J Vet Res 2000; 61:1479-1483.
Frank GH, Briggs RE, Duff GC, Loan RW, and Purdy CW. Effects of vaccination prior to transit and administration of florfenicol at time of arrival in a feedlot on the health of transported calves and detection of Mannheimia haemolytica in nasal secretions. Am J Vet Res 2002; 63:251-256.
Gibbs SG, Green CF, Tarwater PM, Mota LC, Mena KD, and Scarpino PV. Isolation of Antibiotic-Resistant Bacteria from the Air Plume Downwind of a Swine Confined or Concentrated Animal Feeding Operation. Environ Health Perspect 2006; 114:1032-1037.
Gorham PE, Carroll LH, McAskill JW, Watkins LE, Ose EE, Tonkinson TV, and Merrill JK. Tilmicosin as a single injection treatment for respiratory disease of feedlot cattle. Can Vet J 1990; 31:826-829.
Guichon PT, Booker CW, and Jim GK. Comparison of two formulations of oxytetracycline given prophylactically to reduce the incidence of bovine respiratory disease in feedlot calves. Can Vet J 1993; 34:736-741.

31
Gow SP, Waldner CL, Rajic A, McFall ME, and Reid-Smith R. Prevalence of antimicrobial resistance in fecal generic Escherichia coli isolated in western Canadian cow-calf herds. Part I—Beef calves. Can J Vet Res 2008a; 72:82-90.
Gow SP, Waldner CL, Rajic A, McFall ME, and Reid-Smith R. Prevalence of antimicrobial resistance in fecal generic Escherichia coli isolated in western Canadian beef herds. Part II—Cows and cow-calf pairs. Can J Vet Res 2008a; 72:91-100.
Guardabassi L, Schwarz S, and Lloyd DH. Pet animals as reservoirs of antimicrobial-resistant bacteria: Review. J Antimicrob Chemother 2004; 54:321-332.
Harada K and Asai T. Role of antimicrobial selective pressure and secondary factors on antimicrobial resistance prevalence in Escherichia coli from food-producing animals in Japan. J Biomed and Biotechnol 2010; 1-12.
Harland RJ, Jim GK, Guichon T, Townsend HGG, and Janzen ED. Efficacy of parenteral antibiotics for disease prophylaxis in feedlot calves. Can Vet J 1991; 32:163-168.
Hendriksen RS, Mevius DJ, Schroeter A, Teale C, Meunier D, Butaye P, Franco A, Utinane A, Amado A, Moreno M, Greko C, Stark K, Bergold C, Myllyniemi AL, Wasyl D, Sunde M, and Aarestrup FM. Prevalence of antimicrobial resistance among bacterial pathogens isolated from cattle in different European countries: 2002-2004. Acta Vet Scand 2008; 50:1-10.
Holmberg SD, Solomon SL, and Blake PA. Health and Economic Impacts of Antimicrobial Resistance. Rev Infect Dis 1987; 9:1065-1078.
Holzel CS, Harms KS, Kuchenhoff H, Kunz A, Muller C, Meyer K, Schwaiger K, and Bauer J. Phenotypic and genotypic bacterial antimicrobial resistance in liquid pig manure is variously associated with contents of tetracyclines and sulfonamides. J Appl Microbiol 2009; 5:1642-1565.
Howard D, Cordell R, McGowan J, Packard R, Scott R, and Solomon S. Measuring the Economic Costs of Antimicrobial Resistance in Hospital Settings: Summary of the Centers for Disease Control and Prevention-Emory Workshop. Clin Infect Dis 2001; 33:1573-1578.
Howard D and Scott R. The Economic Burden of Drug Resistance. Clin Infect Dis 2005; 41:S283-S286.
Hunter JEB, Shelley JC, Walton JR, Hart CA, and Bennett M. Apramycin Resistance Plasmids in Escherichia coli: Possible Transfer to Salmonella typhimurium in Calves. Epidemiol Infect 1992; 108:271-278.

32
Jacob ME, Fox JT, Narayanan SK, Drouillard JS, Renter DG, and Nagaraja TG. Effects of feeding wet corn distillers grain with solubles with or without monensin and tylosin on the prevalence and antimicrobial susceptibilities of fecal foodborne pathogenic and commensal bacteria in feedlot cattle. J Anim Sci 2010; 86:1182-1190.
Jim GK, Booker CW and Guichon T. A comparison of trimethoprim-sulfadoxine and ceftiofur sodium for the treatment of respiratory disease in feedlot calves. Can Vet J 1992; 33:245-250.
Jim GK, Booker CW, Guichon T, Schunicht OC, Wildman BK, Johnson JC, and Lockwood PW. A comparison of florfenicol and tilmicosin for the treatment of undifferentiated fever in feedlot calves in western Canada. Can Vet J 1999; 40:179-184.
Kaspar H. Results of the antimicrobial agent susceptibility study raised in a representative, cross-sectional monitoring study on a national basis: Risk Management for the Limitation of Antibiotic Resistance - Federal Office of Consumer Protection and Food Safety in Co-operation with the Federal Institute for Risk Assessment. Scientific Symposium 14-16 November 2004. Int J Med Microbiol 2006; 296:69-79.
Kehrenberg C, Schulze-Tanzil G, Martel JL, Chaslus-Dancla E, and Schwarz S. Antimicrobial resistance in Pasteurella and Mannheimia: epidemiology and genetic basis. Vet Res 2001; 32:323-339.
Khachatryan AR, Hancock DD, Besser TE, and Call DR. Antimicrobial Drug Resistance Genes Do Not Convey a Secondary Fitness Advantage to Calf-Adapted Escherichia coli. Appl Environ Microbiol 2006; 72:443-448.
Kohanski MA, DePristo MA, and Collins JJ. Sublethal Antibiotic Treatment Leads to Multidrug Resistance via Radical-Induced Mutagenesis. Mol Cell 2010; 37: 311-320.
Lee HH, Molla MN, Cantor CR, and Collins JJ. Bacterial charity work leads to population-wide resistance. Nature 2010; 467:82-86.
Levy S. Antibiotic Resistance: Consequences of Inaction. Clin Infect Dis 2001; 33:S124-S129.
Levy SB. Antimicrobial resistance: bacteria on the defence. BMJ 1998; 317:612-613.
Levy SB. Factors impacting on the problem of antibiotic resistance. J Antimicrob Chemother 2002; 49:25-30.
Levy SB and Marshall B. Antibacterial resistance worldwide: causes, challenges and responses. Nat Med Suppl 2004; 10:S122-S129.

33
Livermore DM, McGowan AP, and Wale MCJ. Surveillance of antimicrobial resistance. BMJ 1998; 317:614-615.
Lowrance TC, Loneragan GH, Kunze DJ, Platt TM, Ives SE, Scott HM, Norby B, Echeverry A, and Brashears MM. Changes in antimicrobial susceptibility in a population of Escherichia coli isolated from feedlot cattle administered ceftiofur crystalline-free acid. Am J Vet Res 2007; 68:501-507.
Lundin JI, Dargatz DA, Wagner BA, Lombard JE, Hill AE, Ladely SR, Fedorka-Cray PJ. Antimicrobial drug resistance of fecal Escherichia coli and Salmonella spp. isolates from United States Dairy Cows. Foodborne Pathog Dis 2008; 5:7-19.
Matthews KH. Antimicrobial Drug Use and Veterinary Costs in U.S. Livestock Production. United States Department of Agriculture. Agriculture Information Bulletin 2001.
Martin SW, Meek AH, and Curtis RA. Antimicrobial use and feedlot calves: its association with culture rates and antimicrobial susceptibility. Can J Comp Med 1983; 47:6-10.
McDermott P, Zhao S, Wagner D, Simjee S, Walker R, and White D. The Food Safety Perspective of Antibiotic Resistance. Anim Biotechnol 2002; 13:71.
McEwen SA and Fedorka-Cray PJ. Antimicrobial Use and Resistance in Animals. Clin Infect Dis 2002; 34:S93.
McEwen SA and Singer RS. Stakeholder position paper: The need for antimicrobial use data for risk assessment: Animal Antimicrobial Use Data Collection in the United States: Methodological Options. Prev Vet Med 2006; 73:169-176.
McEwen SA, Boerlin P, Rajic A, and Reid-Smith R. Special Issue—Antimicrobial Resistance. Can J Vet Res 2008; 72:81.
McGeer AJ. Agricultural antibiotics and resistance in human pathogens: Villain or scapegoat? Can Med Assoc J 1998; 159:9.
McGowan JE. Strategies for study of the role of cycling on antimicrobial use and resistance. Infect Control Hosp Epidemiol 2000; 21:S36-S43.
McGowan JE. Economic Impact of Antimicrobial Resistance. Emerg Infect Dis 2001; 7:286.
McIntosh WMA, Schulz S, Dean W, Scott MH, Barling KS, and Takei I. Feedlot veterinarians' moral and instrumental beliefs regarding antimicrobial use in feedlot cattle. J Community Appl Soc Psychol 2009; 19:51-67.

34
Mechor GD, Jim GK, and Janzen ED. Comparison of penicillin, oxytetracycline, and trimethoprim-sulfadoxine in the treatment of acute undifferentiated bovine respiratory disease. Can Vet J 1988; 28:438-443.
Merrill JK, Jim GK, Guichon PT, and Booker CW. A comparison of prophylactic use of tilmicosin injection and long-acting oxytetracycline injection on morbidity, mortality and performance of feedlot cattle. J Anim Sci 1994; 72.
Morley PS, Apley MD, Besser TE, Burney DP, Fedorka-Cray PJ, Papich MG, Traub-Dargatz JL, and Weese JS. Antimicrobial Drug Use in Veterinary Medicine. J Vet Intern Med 2005; 19:617-629.
Morley PS, Dargatz DA, Hyatt DR, Dewell GA, Patterson G, and Wittum TE. Effects of Restricted Antimicrobial Exposure in Feedlot Cattle on Antimicrobial Resistance in Enteric Bacteria. Foodborne Pathog Dis 2011; 8:1-12.
Monnet DL and Kristinsson KG. Turning the tide of antimicrobial resistance: Europe shows the way. Euro Surveill 2008; 13:1-2.
National Animal Health Monitoring System (NAHMS). Highlights of NAHMS Feedlot ’99 Part III: Health Management and Biosecurity in U.S. Feedlots. 2000:12.
Newell DG, Koopmans M, Verhoef L, Duizer E, Aidara-Kane A, Sprong H, Opsteegh M, Langelaar M, Threfall J, Scheutz F, van der Giessen J, and Kruse H. Food-borne diseases - the challenges of 20 years ago still persist while new ones continue to emerge. Int J Food Microbiol 2010; 139:S3-S15.
O'Brien T. Emergence, Spread, and Environmental Effect of Antimicrobial Resistance: How Use of an Antimicrobial Anywhere Can Increase Resistance to Any Antimicrobial Anywhere Else. Clin Infect Dis 2002; 34:S78-S84.
O’Connor AM, Poppe C, and McEwen SA. Changes in the prevalence of resistant Escherichia coli in cattle receiving subcutaneously injectable oxytetracycline in addition to in-feed chlortetracycline compared with cattle receiving only in-feed chlortetracycline. Can J Vet Res 2002; 66:145-150.
Ogeer-Gyles JS, Matthews KA, and Boerlin P. Nosocomial infections and antimicrobial resistance in critical care medicine. J Vet Emerg Crit Care 2006; 16:1-18.
Perret T, Abutarbush SM, Wildman BK, Fuchs MT, Schunicht OC, Polluck CM, Fenton RK, Jim GK, Guichon PT, Booker CW, Berg J, Roder J, and Spire M. A comparison of florfenicol and tulathromycin for the treatment of undifferentiated fever in feedlot calves. Vet Ther 2008; 9:128-140.
Phillips I. The 1997 Garrod Lecture. The subtleties of antibiotic resistance. J Antimicrob Chemother 1998; 42:5-12.

35
Phillips I. Prudent Use of Antibiotics: Are Our Expectations Justified? Clin Infect Dis 2001; 33:S130-S132.
Phillips I, Casewell M, Cox T, De Groot B, Friis C, Jones R, Nightingale C, Preston R, and Waddell J. Does the use of antibiotics in food animals pose a risk to human health? A critical review of published data. J Antimicrob Chemother 2004; 53:28-52.
Piddock LJV. Does the use of antimicrobial agents in veterinary medicine and animal husbandry select antibiotic-resistant bacteria that infect man and compromise antimicrobial chemotherapy? J Antimicrob Chemother 1996; 38:1-3.
Platt TM, Loneragan GH, Scott HM, Norby B, Thomson DU, Brown MS, Ives SE, and Brashears MM. Antimicrobial susceptibility of enteric bacteria recovered from feedlot cattle administered chlortetracycline in feed. Am J Vet Res 2008; 69:988-996.
Rao S, Donkersgoed JV, Bohaychuk V, and Besser T. Antimicrobial drug use and antimicrobial resistance in enteric bacteria among cattle from Alberta feedlots. Foodborne Pathog Dis 2010; 7:449-457.
Rollo SN, Norby B, Bartlett PC, Scott HM, Wilson DL, Fajt VR, Linz JE, Bunner CE, Kaneene JB, and Huber JC. Prevalence and patterns of antimicrobial resistance in Campylobacter spp. isolated from pigs reared under antimicrobial-free and conventional production methods in eight states in the Midwestern United States. J Am Vet Med Assoc 2010; 236:201-210.
Salyers A and Amabile-Cuevas C. Why are antibiotic resistance genes so resistant to elimination? Antimicrob Agents Chemother 1997; 41:2321-2325.
Sato K, Bartlett PC, Kaneene JB, and Downes FB. Comparison of Prevalence and Antimicrobial Susceptibilities of Campylobacter spp. Isolates from Organic and Conventional Dairy Herds in Wisconsin. Appl Environ Microbiol 2004; 70:1442-1447.
Sato K, Bartlett PC, and Saeed MA. Antimicrobial susceptibility of Escherichia coli isolates from dairy farms using organic versus conventional production methods. J Am Vet Med Assoc 2005; 226:589-594.
Sawant AA, Hegde NV, Straley BA, Donaldson SC, Love BC, Knabel SJ, and Jayarao BM. Antimicrobial-Resistant Enteric Bacteria from Dairy Cattle. Appl Environ Microbiol 2007; 73:156-163.
Schumann FJ, Janzen ED, and McKinnon JJ. Prophylactic tilmicosin medication of feedlot calves at arrival. Can Vet J 1990; 31:285-288.

36
Schunicht OC, Guichon PT, Booker CW, Jim GK, Wildman BK, Hill BW, Ward TI, Bauck SW, and Jacobsen JA. A comparison of prophylactic efficacy of tilmicosin and a new formulation of oxytetracycline in feedlot calves. Can Vet J 2002a; 43:355-362.
Schunicht OC, Booker CW, Guichon PT, Jim GK, Wildman BK, Hill BW, Ward TI, and Bauck SW. An evaluation of the relative efficacy of a new formulation of oxytetracycline for the treatment of undifferentiated fever in feedlot calves in western Canada. Can Vet J 2002b; 43:940-945.
Schunicht OC, Booker CW, Guichon PT, Jim GK, Wildman BK, Pittman TJ, and Perrett T. An evaluation of the relative efficacy of tulathromycin for the treatment of undifferentiated fever in feedlot calves in Nebraska. Can Vet J 2007; 48:600-606.
Schwartz B. Preventing the spread of antimicrobial resistance among bacterial respiratory disease pathogens in industrialized countries: The case for judicious antimicrobial use. Clin Infect Dis 1999; 28:211-213.
Schwarz S, Kehrenberg C, Salmon SA, and Watts JL. In vitro activities of spectinomycin and comparator agents against Pasteurella multocida and Mannhemia haemolytica from respiratory tract infections of cattle. J Antimicrob Chemother 2004; 54:379-382.
Shea KM. Antibiotic Resistance: What Is the Impact of Agricultural Uses of Antibiotics on Children's Health? Pediatrics 2003; 112: 253-258.
Shlaes D, Gerding D, John J, Craig W, Bornstein D, Duncan R, Eckman M, Farrer W, Greene W, Lorian V, Levy S, McGowan J, Paul S, Ruskin J, Tenover F, and Watanakunakorn C. Society for Healthcare Epidemiology of America and Infectious Diseases Society of America Joint Committee on the Prevention of Antimicrobial Resistance: Guidelines for the Prevention of Antimicrobial Resistance in Hospitals. Clin Infect Dis 1997; 25:584-599.
Singer RS, Reid-Smith R, and Sischo WM. Stakeholder position paper: Epidemiological perspectives on antibiotic use in animals: Animal Antimicrobial Use Data Collection in the United States: Methodological Options. Prev Vet Med 2006; 73:153-161.
Singer RS, Ward MP, and Maldonado G. Can landscape ecology untangle the complexity of antibiotic resistance? Nat Rev Microbiol 2006; 4:943-952.
Szknotnicki J. The need for antimicrobial resistance data precedes that for antimicrobial use data. Can Vet J 2004; 45:639-640.
Tenover FC. Development and Spread of Bacterial Resistance to Antimicrobial Agents: An Overview. Clin Infect Dis 2001; 33:S108.

37
The Alliance for the Prudent Use of Antibiotics. Executive Summary: Global Antimicrobial Resistance Alerts and Implications. Clin Infect Dis 2005; 41: S221-S223.
Ungemach FR, Mnller-Bahrdt D, and Abraham G. Guidelines for prudent use of antimicrobials and their implications on antibiotic usage in veterinary medicine: Risk Management for the Limitation of Antibiotic Resistance - Federal Office of Consumer Protection and Food Safety in Co-operation with the Federal Institute for Risk Assessment. Scientific Symposium 14-16 November 2004. Int J Med Microbiol 2006; 296:33-38.
van den Bogaard AE and Stobberingh EE. Antibiotic Usage in Animals: Impact on Bacterial Resistance and Public Health. Drugs 1999; 58:589-607.
van den Bogaard AE and Stobberingh EE. Epidemiology of resistance to antibiotics: Links between animals and humans. Int J Antimicrob Agents 2000; 14:327-335.
Veterinary Drugs Directorate (VDD). http://www.hc-sc.gc.ca/ahc-asc/branch-dirgen/hpfb-dgpsa/vdd-dmv/index-eng.php. Accessed September 10, 2010.
Vlieghe E, Bal AM, and Gould IM. Surveillance of Antibiotic Resistance in Developing Countries: Needs, Constraints and Realities. Antimicrobial Resistance in Developing Countries. Springer: New York, 2010; 463-475.
Wallmann J. Monitoring of antimicrobial resistance in pathogenic bacteria from livestock animals. Int J Med Microbiol 2006; 296:81-86.
Watts JL and Sweeney MT. Antimicrobial resistance in bovine respiratory disease pathogens: measures, trends, and impact on efficacy. Vet Clin North Am Food Anim Pract. 2010; 26:79-88.
Wilson PJ. Haemophilus, Actinobacillus, Pasteurella: Mechanisms of Resistance and Antibiotic Therapy. Can J Vet Res 1990; 54:S73-S77.
Williams RJ. Globalization of Antimicrobial Resistance: Epidemiological Challenges. Clin Infect Dis 2001; 33:S116-S117.
Witte W. Medical Consequences of Antibiotic Use in Agriculture. Science 1998; 279:996-997.
Witte W. Ecological impact of antibiotic use in animals on different complex microflora: environment. Int J Antimicrob Agents 2000; 14:321-325.
World Health Organization (WHO). http://www.who.int/en/. Accessed September 10, 2010.
38
World Organization for Animal Health (OIE). http://www.oie.int/eng/en_index.htm. Accessed September 10, 2010.
Wren G. Feedlot antibiotics and their impact. Bovine Veterinarian 2007; 22-26
39
CHAPTER 2: Metrics for quantifying antimicrobial use in beef
feedlots
K. M. Benedict1, S. P. Gow2, R. J. Reid-Smith3, C. W. Booker4, and P. S. Morley1
1Animal Population Health Institute, Colorado State University, Fort Collins, CO 80523-
1654, USA;
2Laboratory of Foodborne Zoonoses, Public Health Agency of Canada, University of
Saskatchewan, Saskatoon, SK, S7N 5B4, Canada;
3Laboratory of Foodborne Zoonoses, Public Health Agency of Canada, Guelph, ON,
N1G 5B2, Canada;
4Feedlot Health Management Services, Okotoks, AB, T1S 2A2, Canada

40
INTERPRETIVE SUMMARY In the investigation of antimicrobial resistance, antimicrobial use must be
accurately quantified since it is hypothesized to be one of the major forces driving the
development of resistance. Without accurate representation of exposures to
antimicrobials, the association between antimicrobial use and resistance can be falsely
inflated or hidden. The selective pressures which encourage the development,
dissemination, and persistence of antimicrobial resistance vary by a number of factors
including the antimicrobial drug and the degree of exposure in host tissues to
heterogeneous populations of bacteria. Yet, the common metrics (sales value and mass
of active ingredient) currently used to quantify antimicrobial use do not account for the
selective pressures in any manner.
The following project investigates the appropriateness of a series of metrics for
quantifying antimicrobial use in beef feedlots. Individuals knowledgeable and interested
in this particular topic contributed their perceptions about the related issues in a web-
based survey. Participants were prompted to indicate the accuracy of each metric to
describe antimicrobial use as well as the clarity of each metric in reference to how easily
it is understood by user groups. These responses help to validate portions of the
methodologies recommended for analysis and reporting of antimicrobial use information
in surveillance of antimicrobial resistance.
41
ABSTRACT Objectives: In order to further enlighten discussions regarding the impact of antimicrobial
drug use in agriculture, accurate antimicrobial drug use data are needed. The primary
objective of this study was to investigate the preferences of stakeholders for reporting
antimicrobial drug use data that are collected from beef feedlots.
Materials and Methods: Producers, veterinarians, industry representatives, public health
officials, and other knowledgeable beef industry leaders were invited to complete a web-
based survey. Participants were asked to provide demographic information and to
comment on the most appropriate portrayal of antimicrobial drug use data for different
purposes. The survey also explored perceptions and concerns about antimicrobial
resistance.
Results: A total of 156 participants in 33 U.S. states, 4 Canadian provinces, and 8 other
countries completed the online survey. Preference for methods of presenting
antimicrobial drug use data varied and was influenced by participant perceptions
regarding clarity and accuracy of the method to represent antimicrobial drug use in large
cattle populations. Antimicrobial drug use has most commonly been reported as mass of
active compound or sales value; however, participants in this study indicated that these
methods were the least appropriate for reporting data to the general public. Compared to
10 years ago, many participants had greater concern about antimicrobial resistance as a
health issue for both humans and animals.

42
Conclusions: To effectively communicate antimicrobial drug use data, evaluation of the
target audience is critical to presenting the information clearly and accurately. Metrics
that are most accurate need to be carefully and repeatedly explained to the audience.

43
INTRODUCTION
Antimicrobial drugs (AMDs) are used in the feedlot for prevention of disease
(prophylaxis/metaphylaxis), treatment of disease and improvement of production
efficiency (Apley 1997; Apley 2008; Barton 2000). Due to concerns about the potential
impact on public health and the development of antimicrobial resistance (AMR),
antimicrobial drug use (AMU) in cattle and other animals is a controversial subject
(Barbosa et al. 2000; Casewell et al. 2003; Phillips et al. 2004; van den Bogaard et al.
2000; Witte 1998).
Obtaining accurate data about AMU is critical to improving our understanding of
the controversial public health and AMR issues (Caprioli et al. 2000; McEwen and Singer
2006; Phillips 1998; van den Bogaard et al. 1999; FAAIR Scientific Advisory Panel
2002; Livermore et al. 1998). In order to report accurate usage and investigate potential
associations with AMR, we need accurate and practically relevant measures to
objectively quantify AMU (Carson et al. 2008; Filius et al. 2005; Singer et al. 2006).
Metrics which have been and are still being used are defined (Table 1). Each of these
methods of reporting drug usage has both advantages and disadvantages (Chauvin et al.
2001; Jensen et al. 2004; Merlo et al. 1996; Kritsotakis 2006). The goal of this survey
was to identify a method for presenting AMU data that is easily understood by user
groups and that accurately portrays drug use data in a meaningful and relevant way.

44
Table 1: Definitions of antimicrobial drug use (AMU) metrics.
AMU Metric Definition Sales Value cost of the antimicrobial drug in standard
currency Drug Mass in Kilograms kg of active ingredient Number of Animals Treated count of animals treated with antimicrobial drug Treatment Rate the percentage of animals receiving a given
treatment in a given population Animal Defined Daily Dose (ADDD) number of days of treatment for an animal based
on an assumed average maintenance dosage ADDD per 1000 Animals standardized exposure rate based upon the
Animal Defined Daily Dose relative to a fixed number of animals; used to make standardized comparisons in drug exposure among populations or over time

45
MATERIALS AND METHODS
Sampling Procedures The study was conducted as a cross-sectional survey. The targeted study
population consisted of owners and operators of beef production facilities, veterinarians,
beef industry representatives, and public health officials familiar with AMU in the beef
industry. Potential participants were contacted through email listservs managed by
relevant professional associations or agenciesa and by email sent to a list of individuals
compiled through recommendations of beef industry and public health leaders.
Additionally, participants were encouraged to freely distribute the survey to other
knowledgeable and interested colleagues.
For each association or agency that was identified as being interested in this issue,
the association president or another administrative leader was contacted by e-mail to
determine whether their group was willing to participate. If so, an invitation was posted
to the association’s listserv. This same invitation was also sent to people specifically
identified by stakeholders as being knowledgeable and interested in the topic. Direct
access to the web-based survey instrumentb was provided in the email invitation as a
hyperlink. Additionally, this email invitation included a second hyperlink which allowed
the invited participant to specifically decline the opportunity to participate (Appendix 2).
Approximately 2-3 weeks after the initial invitation, a reminder email was sent through
each listserv and to the list of individuals. The web-based survey was available for
completion for a 3-month period between June and August 2009. The survey collection
instrument was set to only allow one response to be submitted per computer.

46
Study participation was voluntary and anonymous. Response information and
participation was confidential. Prior to initiation of the study, the research protocol was
reviewed and approved by the Colorado State University Institutional Review Board.
Survey instrument The survey contained 22 questions characterizing 3 different general topics:
participants’ demographics and activities related to the beef industry, opinions on the
issues of AMU and AMR, and perceptions about how information regarding AMU is best
reported for beef cattle (Appendix 1). Most of the questions required participants to
select from a closed series of responses or Likert scale categories. For all questions,
response options of “Unknown” and “No Preference” were available. Additionally,
open-ended responses were solicited on some questions to allow elaboration if desired by
the participant. The questionnaire was pretested by 9 experts that matched the
demographics of the intended study population.
Demographics. Individual participants were characterized through questions
regarding the number of years of active involvement with the beef industry, the primary
state/province and nation of their professional activities, and their highest level of
education (high school diploma/GED, degree/diploma from a technical school or
community college, bachelor’s degree/BS/BA, advanced degree—specify). Additionally,
participants were characterized by the primary professional role in which they used AMU
information (producer, production consultant, veterinarian, federal government
representative, state government representative, university employee, nutritionist, feed
salesperson, pharmaceutical industry representative, other—specify) and the top three

47
sources from which they obtain information about AMDs (feed or drug companies,
veterinarians, government extension officers, universities, farm magazines and
newsletters, friends/relatives/neighbors, internet/world wide web, peer reviewed journals,
beef specialists, other—specify).
Perceptions about AMR and AMU. Regarding AMR as a health issue,
participants were asked whether their concerns had changed over the 10 years prior to the
study (much greater, somewhat greater, no different, somewhat less, much less) at
different organizational scales (locally/individual operations, regionally, nationally,
globally). Similarly, participants provided their perceptions on the true risk of health
problems as a result of AMR. Participant perceptions regarding the importance of five
uses of AMDs in feedlot cattle were also solicited. This was achieved through providing
categories that specified the necessity of AMDs for each use (feedlots need AMDs for
this specific use, feedlots would be difficult to manage without this specific use, feedlots
could be managed without this specific use, feedlots do not need AMDs for this specific
use). The five uses of AMDs investigated were prophylaxis/metaphylaxis at arrival,
prophylaxis/metaphylaxis after arrival, use in feed or water for treatment of disease,
injectable drugs for treatment of disease, and use in feed to prevent liver abscesses.
AMU Metrics. In order to investigate the appropriateness of different methods of
quantifying AMU for various purposes, participants were asked to select the first and
second most appropriate methods (which are reported cumulatively) of quantifying AMU
relative to hypothetical scenarios. Scenarios included a comparison AMU for 2 AMDs in
a large cattle population (e.g., feedlot), describing AMU data for investigation of AMR in
a scientific paper, and reporting of AMU data to the general public. Participants were

48
also asked to identify the least appropriate quantification method for reporting AMU to
the general public. The scenarios were all structured around hypothetical situations
which summarized the use of 2 AMDs according to label instructions for respiratory
disease in an ‘average’ population of feedlot steers shortly after placement. An average
steer was considered to weigh approximately 250kg. Quantification methods were
presented in tabular form with analogous calculations between the two hypothetical
AMDs. The quantification methods investigated in this survey were number of treated
animals, total mass of active drug, Animal Defined Daily Dose (ADDD), ADDD per
1000 animals, treatment rate, and sales value (Table 1). Definitions of each method were
provided in each relevant section of the survey to ensure that participants were able to
appropriately distinguish the different metrics (Appendix 1).
In the context of summarizing AMU for large cattle populations, participants
specified the clarity and accuracy for two of the investigated metrics, number of animals
treated and ADDD per 1000 animals (clarity categories: very clear, clear, somewhat
clear, not clear, unknown; accuracy categories: very accurate, accurate, somewhat
accurate, not accurate, unknown). In reference to an ongoing prospective surveillance
program, participants were asked to select the best method for summarizing AMU for
different organizational scales (local/individual operations, regional, national, global) and
if a different definition or measurement was more appropriate for surveillance programs
than the ones provided in this survey (unknown, no, yes—specify).
In regards to use of the ADDD method, participants were asked if data should be
1) calculated separately and reported separately for high and low dose exposures of the
same drug, 2) calculated separately for high and low dose exposures, summed and

49
reported as one summary number, or 3) calculated using a common dose regardless of
exposure and reported together. An open-response question asked participants to
interpret “400 ADDD of tetracycline.” The definition of ADDD was available on the
same page as this open-response question.
Since AMD dosages can differ for various intended uses (e.g., prophylaxis,
metaphylaxis, treatment of clinical disease, or improvement of production efficiency),
participants were asked whether it was appropriate to combine these four categories when
summarizing AMU data (yes, no, unknown, it depends—specify). A similar question
asked if combining AMU data across different classes of AMDs would be appropriate
(yes, no, unknown, it depends—specify).
Data analysis Survey responses were downloaded directly from the web-based collection
instrument into a computer spreadsheet and summarized. Odds ratios with associated
95% CIs were calculated for contingency tables and the χ2 test was performed with
statistical software.c For the purposes of analysis, some response categories were
collapsed to facilitate evaluation of simple associations.
Demographic Classification for Categorical Analysis. The responses for the
number of years of active involvement in the beef industry were dichotomized as being <
or ≥ the median of the response distribution. Participant locale was categorized into
North American (U.S. and Canada), and non-North American. Professional role was
categorized as veterinarian, university employee, producer, and other. The preferred

50
sources of AMD information were categorized as peer reviewed journal, veterinarians,
feed or drug companies, and others.
Categorical Analyses of opinions about AMR and AMU Metric Classification. In
order to facilitate analyses, Likert scale responses were dichotomized into categories for
greater (much greater and somewhat greater) and not greater (no difference, somewhat
less, much less, and unknown). Quantification metrics were grouped into three
categories: 1) ADDD or ADDD per 1000 animals, 2) number of animals treated or
treatment rate, and 3) sales value or total mass of active ingredient. Responses of
unknown and no preference about appropriate metrics were excluded from analysis due
to low response frequency for these categories. Responses to questions regarding the
clarity and accuracy of ADDD per 1000 animals and number of animals treated were
dichotomized into clear/accurate (very clear/accurate, clear/accurate) and not
clear/accurate (somewhat clear/accurate, and not clear/accurate). A single evaluator
(KMB) categorized the open-response question for defining “400 ADDD of tetracycline.”
Responses which indicated participant understanding of the definition of ADDD were
considered correct. Other responses were designated as incorrect if an obvious
misunderstanding was described in open-response or as unknown if the participant
volunteered their lack of understanding of this metric.

51
RESULTS
Survey Participants Twenty associations and agencies were identified as having goals or interests that
would be relevant to the issue of AMU in cattle.a Administrative leaders from 10
organizations agreed to post the invitation to their listservs and an additional 6
associations or agencies provided a list of specific individuals to contact directly with an
invitation to participate. The survey was initiated by 250 individuals and 156 of these
participants fully completed the survey. Only responses from completed surveys were
summarized. Ninety-eight individuals specifically declined to take the survey using the
hyperlink that was included for this purpose (Appendix 2).
Respondents resided in 33 U.S. states, 4 Canadian provinces, and 8 other
countries (Belgium, Denmark, Germany, Ireland, Italy, Portugal, South Africa, and
United Kingdom). The majority of respondents were from the U.S. (81%; 124/154) and
Canada (12%; 19/154). The median number of years of reported involvement in the beef
industry was 20 (Q1=10, Q3=34). Veterinarians (51%; 79/156), university professionals
(19%; 29/156), and producers (10%; 16/156) were the professional roles most commonly
represented by the participants. Other participants reported their professional roles as
pharmaceutical industry representatives (8%; 13/156), federal government representatives
(5%; 8/156), feed sales representatives (1%; 2/156), state government representatives
(0.6%; 1/156), production consultants (0.6%; 1/156), or other (4%; 7/156). As their
highest earned degree, 90% (140/156) of participants held advanced degrees (e.g., MS,
PhD, DVM), 6% (10/156) had baccalaureate degrees, 1% (2/156) had degrees from a
technical school or community college, and 3% (4/156) had high school diplomas/GEDs.
52
Sources of Information. Seventy-two percent (112/156) of participants used peer-
reviewed journals as one of the top three sources of information about AMDs, 60%
(93/156) obtained information from veterinarians, 59% (92/156) gained their knowledge
from feed or drug companies, and 37% (58/156) referenced universities. The world wide
web (29%; 46/156) was used more often as one of the top three sources of AMD
information than beef specialists (13%; 20/156), government extension officers (5%;
8/156), and farm magazines or newsletters (5%; 8/156).
Importance of Antimicrobial Drug Resistance The study attempted to differentiate perceptions about differences in awareness or
perceived risk from differences in true risks related to AMR. In general, participants had
greater concern about AMR as either a human health issue or an animal health issue than
they did 10 years prior to the study (Figure 1). Compared to their attitudes 10 years ago,
61% (95/156) of participants indicated that they had a much greater or somewhat greater
concern about AMR as a global health issue for people. Similarly, about half (78/156) of
the participants indicated that they had a greater or somewhat greater concern about
AMR as a global health issue for animals. Participant concerns about AMR as a global
health issue for people were no different than concerns about AMR as a global health
issue for animals (P=0.17). When comparing responses regarding AMR as a global
health issue for people to other scales, no differences were found at the national level
(P=0.77). However, fewer participants had greater concern about AMR as a local (41%;
64/156; P=0.0032) and regional (49%; 76/156; P=0.027) health issue for people than at
the global level. No differences were detected between responses about concern

53
expressed regarding AMR in animals at the global scale when compared to the local
(P=0.76), regional (P=0.88), or national (P=0.81) scales.
Figure 1: Change in participants’ level of concern about antimicrobial resistance (AMR) as a global health issue in people and animals during the previous decade (n=156).*Distributions of participant perception of greater or less true risk of health problems due to AMR in people and in animals compared to their perception of true risk 10 years prior the study were no different than the distribution of concern level for Animals presented here (P>0.05).
Despite the majority of participants having greater concern about AMR as a
global human health issue, fewer participants believed that the true risk of global human
health problems as a result of AMR was greater than 10 years prior to the study (41%;
64/156; P=0.006). The percentage of participants with increased perceptions of true risk
in animal health due to AMR was not statistically different than that for humans (45%;
70/156P=0.33). Compared to the global level, perceptions of true risk of human health
problems due to AMR on the local (P=0.20), regional (P=0.17), and national (P=0.64)
0% 20% 40% 60% 80% 100%
People
Animals
Participants with a Difference in Concern about AMR as a Health Issue
Greater No Difference Less Don't Know

54
scales were not statistically different. Likewise, the true risk of animal health problems
as a result of AMR were not statistically different on the local (P=0.74), regional
(P=0.51), and national (P=0.77) scales when compared to the global level.
Importance of Antimicrobial Drug Use Participants indicated a similar spread of opinions on the necessity of AMDs for
prophylaxis/metaphylaxis at arrival, prophylaxis/metaphylaxis after arrival, use in feed or
water for treatment of disease, and use in feed to prevent liver abscesses (Figure 2). Four
to 11% (6/156 – 17/156) of participants indicated that AMDs are not needed for these
uses. Overall, about 20% of participants (16% - 22%; 25/156 - 34/156) indicated that
AMDs are required for these uses. Whereas about one third of participants indicated that
feedlots could be managed without AMDs (31% - 37%; 48/156 - 58/156) or management
would be difficult without AMDs (30% - 42%; 47/156 - 65/156) for these uses. In
contrast, the majority of participants agreed that injectable AMDs were needed for
treatment of diseases of feedlot cattle (87%; 136/156). The remaining 13% (20/156) of
participants indicated that management would be difficult without injectable AMDs for
treatment of diseases in feedlot cattle.

55

56
AMU Metrics Comparing 2 different classes of AMDs (e.g. macrolides vs. tetracycline). When
comparing amounts of two different classes of AMDs, a similar percentage of
participants indicated that the total mass of active drug (43%; 67/156) and the ADDD per
1000 animals (41%; 64/156) metrics were most useful (Figure 3). The sales value (11%;
17/156) metric was selected least often as an appropriate metric for comparing 2 different
classes of AMDs.
Describing AMU relative to AMR in a scientific paper. When describing AMU
data relative to investigating AMR in a scientific paper, ADDD per 1000 animals was the
metric selected by the 46% of participants as most useful (72/156) (Figure 3). Sales
value (2%; 3/156) and total mass of active drug (31%; 48/156) were selected by even
fewer participants as appropriate metrics for this purpose than in the previous scenario.
Reporting AMU data to the public. More than half of the participants selected
treatment rate (55%; 86/156) as the method which would allow the clearest interpretation
in reporting data regarding AMU to the general public (Figure 3). As with the two
previous scenarios, sales value (8%; 12/156) was selected by the smallest percentage of
participants as an appropriate metric for reporting AMU data to the public. When asked
about the least appropriate metric (as opposed to the most appropriate metric),
respondents indicated that sales value (44%; 69/156) and total mass of active drug (31%;
49/156) were the most inappropriate metrics for reporting AMU data to the general
public. All other metrics for this question were each selected by less than 8% (12/156) of
the participants.

57
Figure 3: Participant selection of the top two antimicrobial drug use (AMU) metrics (cumulatively presented) most appropriate for three separate scenarios; 1) when comparing the amount of two hypothetical drugs in a large cattle population (hatched), 2) when describing AMU data relative to antimicrobial resistance (AMR) in a scientific paper (black), 3) when clearly reporting data regarding AMU to the general public (gray) (n=156).* Categories available for participant selection not displayed in this figure include Unknown, and No Preference.
Summarizing large-scale surveillance. Quantifying AMU as the number of
animals treated was judged as the clearest metric for representing AMU when reporting
this information for large cattle populations. Quantifying AMU by ADDD per 1000
animals was deemed the most accurate metric for representing AMU for large-scale
surveillance of AMU and AMR. The majority (88%; 137/156) of the respondents
specified that number of animals treated was clearly understood, but only 36% (56/156)
specified that it was accurate. Conversely, only 32% (50/156) of respondents specified
that the ADDD per 1000 animals method was clearly understood, while 76% (119/156)
specified that it was accurate.
0%
20%
40%
60%
80%
100%
TOTAL MASSOF ACTIVE
DRUG
ADDD/1000ANIMALS
ADDD TREATMENTRATE
NUMBER OFANIMALSTREATED
SALES VALUE
Par
tici
pan
t S
elec
tion
of
Mos
t A
pp
opri
ate
Met
hod
COMPARE 2 DIFFERENT AMDRELATIVE TO AMRREPORT TO PUBLIC

58
Approximately half of the participants selected ADDD per 1000 animals as the
best method of summarizing AMU for prospective surveillance programs at the
state/provincial (51%; 79/156), national (53%; 83/156), and global (50%; 78/156)
organizational scales. All other metrics were selected by less than 15% (24/156) of
participants for these purposes. Specifically, sales value was selected by less than 3%
(5/156) of participants as the best method for summarizing AMU. For surveillance
programs, most participants (74%; 116/156) were unaware of a more appropriate
definition or measurement than the ones investigated in this survey. Participants who
indicated that a different definition or measurement was more appropriate than the ones
provided in the questionnaire commented on refining specific definitions and stratifying
metric summaries according to different confounders.
Utilizing the ADDD metric. Participants indicated that the usage of the ADDD or
ADDD per 1000 animals requires specific and clear definitions. Most participants (74%;
116/156) recommended the separate calculation of high and low dose exposures of the
same drug and subsequent separate reporting of these amounts. Less than 10% of
participants (14/156) held the opposing views of calculating ADDDs in some variant of
averaging dosages. In a free-response, 64% (98/153) of participants correctly interpreted
“400 ADDD of tetracycline” while 20% (31/153) incorrectly did so and 16% (24/153)
indicated upfront that they did not know how to interpret the phrase.
Summarizing Metrics. In the reporting of any AMU metric, most participants
believed that separately reporting amounts by the intended use of the AMDs and the class
of AMDs is critical to accurately portraying AMU information. Summarizing quantities
for the combined uses of prophylaxis, metaphylaxis, treatment of clinical disease, and

59
improvement of production efficiency was not considered an accurate representation by
67% (105/156) of participants. Only 9% (14/156) considered the combination of these
uses in reporting as an appropriate summarization. Another 22% (34/156) of participants
indicated that the accuracy of such a summary measure would depend on other factors
beyond just these categories such as the purpose of collecting the data, how the data were
collected, and the particular AMD or class of AMD. Combining AMU information
across different classes of AMDs was also considered inappropriate by 60% (94/156) of
participants. Some participants (13%; 21/156) specified that the accuracy of AMU data
which combined different classes of AMDs would depend on the reporting situation.
Response Associations Participants with ≥20 years of beef industry involvement were half as likely
(OR=0.5, 95%CI: 0.2-0.9, P=0.02) to have increased concern about AMR today as a
global human health issue compared to 10 years prior to the study when compared with
participants with <20 years of beef industry involvement. These experienced participants
were also more likely than the participants with <20 years to believe that AMU in feed or
water for treatment of disease was not needed rather than needed in the management of
feedlots (OR=11.3, 95%CI: 2.4-., P=0.01). When comparing two different classes of
AMDs (OR=2.6, 95%CI: 1.2-5.5, P=0.01) or describing AMU data relative to AMR
(OR=2.6, 95%CI: 1.2-5.9, P=0.02), participants with ≥20 years of beef industry
involvement were more likely to select a method other than ADDD and ADDD per 1000
animals than participants with <20 years of involvement.

60
In comparison to North American participants, non-North American participants
had different perspectives on the health risks of AMR, the necessity of AMDs in the
management of feedlots, and appropriate AMU metrics. Participants from non-North
American countries were more likely to believe that the true risk of health problems in
people (OR=5.2, 95%CI: 1.4-19.0, P=0.01) and animals (OR=4.0, 95%CI: 1.1-14.7,
P=0.03) because of AMR as compared to 10 years ago was greater on the global scale.
Non-North American participants were more likely than North American participants to
indicate that AMDs are not needed rather than needed for the typical uses in North
American feedlots of prophylaxis/metaphylaxis at arrival (OR=32.0, 95%CI: 4.0-264.3,
P<0.001) and in feed for prevention of liver abscesses (OR=5.5, 95%CI: 1.0-28.8,
P=0.05). When asked about the best metric, non-North American participants were
more likely than North American participants to select ADDD or ADDD per 1000
animals as appropriate for the scenarios of comparing two different AMDs (P=0.01) and
for reporting data regarding AMU to the public (P=0.01).
Both professional role and highest degree earned influenced participant responses.
Participants with professional roles in universities were more likely than veterinarians to
believe that the true risk of AMR as a health issue to people is greater than 10 years prior
to the study on the regional (OR=5.6, 95%CI: 2.3-13.9, P<0.001), national (OR=3.5,
95%CI: 1.4-8.3, P<0.001), and global (OR=3.2, 95%CI: 1.3-7.5, P=0.01) scales. When
describing AMU data relative to AMR data, producers were more likely than participants
from other professional roles to select metrics considered inappropriate by most survey
respondents (sales value and total mass of active drug) (P=0.03). In a related manner,
participants with advanced degrees were more likely than participants with a bachelors

61
(P=0.05) or high school diploma (P=0.05) to select ADDD or ADDD per 1000 animals
as the most appropriate measure for the same scenario. Additionally, participants with
advanced degrees were more likely to indicate that combining information across
different AMD classes was not appropriate (P=0.02).

62
DISCUSSION
Results of the present study suggested that there is no single, best method to
appropriately represent AMU data related to beef cattle production. To effectively
communicate AMU data, evaluation of the target audience is critical to clearly presenting
the information. Metrics that are most accurate may need to be carefully and repeatedly
explained to the audience. In the past, reports of AMU that focused on sales value or
mass of active ingredient metrics as estimates of AMU have not allowed for appropriate
investigation of associations between AMU and AMR. Theoretically, differences in the
physical characteristics of AMDs, the doses, the dosages, numbers of animals treated, and
the reasons for use all modify the effect that AMU has on AMR. Metrics relying on sales
value or mass of active ingredient do not account for these differences. Incorporating
such selection pressures in AMU metrics is crucial to understanding the development,
persistence, and dissemination of AMR within and between populations of animals and
humans. Quantification of AMU with metrics which does not account for selection
pressures distorts discussion regarding the impact of AMU and cannot be used to
investigate AMR.
Data regarding AMU is presented in a variety of formats depending on the
purpose of reporting and the intended audiences. Some surveillance programs have
quantified specific use of AMDs with a direct focus of investigating the impact of AMU
on AMR. This work can be performed on a small scale, such as within a single facility or
on a grander scale, such as on a national level (Dunowska et al. 2006; Bager 2000;
Bergman 2009; Bunner 2007). With data specifically and accurately gathered,
researchers can evaluate associations or lack of associations between AMU and AMR. In

63
contrast, other reports have summarized various estimates of the quantity of AMDs used
to illustrate discrepancies in use between humans and animals or between reasons for
AMU (Institute of Medicine 1989; Mellon 2001). These latter reports commonly present
AMU information in terms of mass of active ingredient or sales value of the AMDs.
AMU in humans and animals creates a selection pressure that contributes to a
local increase in AMR. In theory, bacteria susceptible to the AMD are eliminated and
resistant bacteria in the previously heterogeneous bacterial population persist (Levy et al.
2004). However, the probability of occurrence of this phenomenon in association with
AMU and the strength of this association is unknown. Additionally, little is understood
about the duration of persistence within populations of animals and humans as well as
about the likelihood of transmission of resistance between populations (Singer et al.
2007). To better elucidate the existence of human and animal health risks as well as the
burden of such risks associated with AMU, a proper quantification and reporting metric is
needed (Menendez Gonzalez et al. 2010; Carson et al. 2008).
Choosing an appropriate metric for reporting data regarding AMU is a
deceptively complex matter. Challenges in the accuracy and clarity of reporting AMU
vary by the AMD of concern and the organizational scale of reporting (e.g., comparisons
between farms vs. comparisons between regions or countries). AMDs are provided by
pharmaceutical companies in different combinations of ingredients and are administered
by different routes and dosing schedules (Ferarro et al. 2001; McEwan et al., 2002;
Bywater 2004; Khachatourians 1998; Parveen et al. 2006; Rifenburg et al. 1996).
Selection pressures against target bacteria are analogous between the formulations of the
same AMD or between similarly structured AMDs (same class of drug) or both (Bywater

64
2004; Wang et al. 2006). However, even the exact same formulation of a drug (e.g.
tetracycline) can apply selection pressures differently. For example, a “High Dose”
situation to treat disease could apply a stronger pressure to a population of bacteria and
eliminate bacteria with marginal susceptibility to the AMD. Yet, a “Low Dose” of the
same AMD to improve production efficiency may lead to the quicker development of
AMR since the marginally susceptible and the resistant bacteria would survive and
comingle resistance traits (Craig 2001, Funk et al. 2006; Ghosh and LaPara 2007;
Guillemot et al.1998; Kohanski et al. 2010).
The web-based format of this study was an easy and quick method to solicit the
opinions of a variety of people that are affected by policy decisions regarding AMU in
cattle. However, there are limitations that must be considered when interpreting these
results. Conducting an extensive survey utilizing probability based sampling strategies
was not possible since the total population (sampling frame) of experts in beef cattle
AMU and AMR was unknown. With no prior knowledge of the sampling frame, a
convenience sample was considered the best method to quickly and easily obtain a
reasonably wide distribution of the questionnaire to individuals that were knowledgeable
and interested in the topic. Therefore, the representativeness of the sampled individuals
to the theoretical target population of experts in beef industry AMU and reporting could
not be validated. However, the associations, agencies, and individuals targeted by
invitation to the questionnaire were all recognized as important stakeholders.
Though this survey may not have included or represented all experts in the beef
industry, stakeholders with advanced degrees were well represented. Likely, holding an
advanced degree would aid an individual in evaluating appropriate AMU metrics since

65
the complexities of the related issues are not directly intuitive. However, the ADDD or
ADDD per 1000 animals metrics were not clearly definable by all of the highly educated
respondents to this survey. The lack of participants’ knowledge about the ADDD metrics
may have contributed to nondifferential misclassification when selecting useful metrics.
These participants might have been drawn towards or away from selecting ADDD
metrics if they were unable to distinguish them from other metrics or if they ignored
metrics they did not understand, respectively. Additionally, stakeholders that were
willing to participate may not have submitted a complete survey (thus, not included in
this report) if they were not comfortable with their grasp on the intricacies of the ADDD
metrics. If stakeholder groups which were not well represented in this study were
included, different distributions of responses might be expected.
This study investigated a finite number of quantification methods which represent
categories of a large number of metrics that have been used. The ones used in the study
were chosen to encompass the metrics most commonly used (sales value and total mass
of active ingredient) and those which more fully account for selection pressure (ADDD
and ADDD per 1000 animals). Since more than one metric may be viewed as appropriate
in a specific situation, we solicited responses which allowed for the top two choices. The
results have been presented here as a cumulative percentage of the top two choices
because the interval perceived by the participant between their two choices can vary.
Depending on the purpose of the research, how the data were collected, the organism
being investigated for AMR, and the AMDs of interest, other metrics could be
appropriate. However, in every case the concepts of clarity and accuracy of reporting
should always be highly regarded.

66
Accuracy and clarity together are hard to come by in quantifying AMU. If we
describe AMU to the absolute detail of what it represents, often we lose the simplicity of
the representation. Participants indicated that though ADDD metrics lack clarity, they
are quite accurate as opposed to the clearly understood metric, number of animals treated,
which lacks accuracy. Participants of this study indicated the superior accuracy of the
ADDD metric, yet not all participants were able to correctly define an ADDD metric.
Therefore, though the details behind this metric may not be wholly understood,
participants were still able to recognize that this metric better represents AMU than the
other metrics. The absence of a complete understanding of ADDD does not invalidate
audience ability to interpret reports.
In designing the questionnaire, AMU in the feedlot setting was the primary focus.
AMU and AMR data in North American feedlots has not been available in the past and
current efforts to develop an appropriate surveillance system in Canada are underway.
Therefore, our research group was specifically interested in the responses of stakeholders
in the feedlot industry. Other animal production industries such as swine, poultry, or
dairy operations may utilize AMDs differently, but types of use are generally similar.
Other animal agribusinesses with scenarios which are not analogous to the feedlot
scenarios presented would need further investigation since we did find that the
appropriate metric depends on the user audience of the information and the research
question. Ideally, a common method or pairing of methods would be used in all animal
agribusinesses as well as within the public health sector for more closely comparable
estimates.

67
FOOTNOTES aAssociations and agencies that were contacted to solicit their participation included the
Academy of Veterinary Consultants, the American Association of Bovine Practitioners,
the American College of Veterinary Clinical Pharmacology, the American College of
Veterinary Preventive Medicine, the American College of Veterinary Internal Medicine,
the American Public Health Association, the Association of State and Territorial Health
Officials, the Association for Veterinary Epidemiology and Preventive Medicine,
Canadian Cattlemen’s Association, the Centers for Disease Control and Prevention, the
Council of State and Territorial Epidemiologists, the EPIVET listserv, the United States
Food and Drug Administration, Feedlot Health Management Services, the International
Conference on the Use of Antimicrobials in Cattle Production, the National Association
of State Public Health Veterinarians, the National Cattlemen’s Beef Association, the
Public Health Agency of Canada, the Texas Cattle Feeders Association, and the United
States Department of Agriculture.
bSurveyMonkey.com. Portland, Oregon USA.
cStataCorp. 2007. Stata Statistical Software: Release 10. College Station, TX: StataCorp
LP

68
REFERENCES Apley M. Antimicrobial therapy of bovine respiratory disease. Vet Clin North Am Food
Anim Pract 1997; 13:549-74.
Apley M. Bovine Respiratory Disease: Pathogenesis, Clinical Signs, and Treatment in Lightweight Calves: Stocker Cattle Management. Vet Clin North Am Food Anim Pract 2006; 22:399-411.
Bager F. DANMAP: monitoring antimicrobial resistance in Denmark. Int J Antimicrob Agents 2000; 14:271-274.
Barbosa TM and Levy SB. The impact of antibiotic use on resistance development and persistence. Drug Resist Updat 2000; 3:303.
Barton MD. Antibiotic use in animal feed and its impact on human health. Nutr Res Rev 2000; 13:279-299.
Bunner CA, Norby B, Bartlett PC, Erskine RJ, Downes FP, and Kaneene JB. Prevalence and pattern of antimicrobial susceptibility in Escherichia coli isolated from pigs reared under antimicrobial-free and conventional production methods. J Am Vet Med Assoc 2007; 231:275-283.
Caprioli A, Busani L, Martel JL, and Helmuth R. Monitoring of antibiotic resistance in bacteria of animal origin: epidemiological and microbiological methodologies. Int J Antimicrob Agents 2000; 14:295-301.
Casewell M, Friis C, Marco E, McMullin P, and Phillips I. The European ban on growth-promoting antibiotics and emerging consequences for human and animal health. J Antimicrob Chemother 2004; 52:159-161.
Chauvin C, Madec F, Guillemot D, and Sanders P. The crucial question of standardisation when measuring drug consumption. Vet Res 2001; 32:533-543.
Craig W. Does the Dose Matter? Clin Infect Dis 2001; 33:S233-S237.
Dunowska M, Morley PS, Traub-Dargatz JL, Hyatt DR, and Dargatz DA. Impact of hospitalization and antimicrobial drug administration on antimicrobial susceptibility patterns of commensal Escherichia coli isolated from the feces of horses. J Am Vet Med Assoc 2006; 228:1909-1917.
FAAIR Scientific Advisory Panel. Policy Recommendations. Clin Infect Dis 2002; 34:S76.

69
Filius PMG, Liem TBY, van der Linden PD, Janknegt R, Natsch S, Vulto AG, and Verbrugh HA. An additional measure for quantifying antibiotic use in hospitals. J Antimicrob Chemother 2005; 55:805-808.
Funk JA, Lejeune JT, Wittum TE, and Rajala-Schultz PJ. The Effect of Subtherapeutic Chlortetracycline on Antimicrobial Resistance in the Fecal Flora of Swine. Microb Drug Resist 2006; 12:210-218.
Ghosh S and LaPara TM. The effects of subtherapeutic antibiotic use in farm animals on the proliferation and persistence of antibiotic resistance among soil bacteria. ISME J 2007; 1:191-203.
Guillemot D, Carbon C, Balkau B, Geslin P, Lecoeur H, Vauzelle-Kervroedan F, Bouvenot G, and Eschwege E. Low Dosage and Long Treatment Duration of {beta}-Lactam: Risk Factors for Carriage of Penicillin-Resistant Streptococcus pneumoniae. JAMA 1998; 279:365-370.
Institute of medicine. Human health risks with the subtherapeutic use of penicillin or tetracyclines in animal feeds. Washington, DC: National Academy Press 1989; 65-7.
Jensen VF, Jacobsen E, and Bager F. Veterinary antimicrobial-usage statistics based on standardized measures of dosage. Prev Vet Med 2004; 64:201-215.
Kohanski MA, DePristo MA, and Collins JJ. Sublethal Antibiotic Treatment Leads to Multidrug Resistance via Radical-Induced Mutagenesis. Mol Cell 2010; 37:311-320.
Kritsotakis EI and Gikas A. Surveillance of antibiotic use in hospitals: methods, trends and targets. Clin Microbiol Infect 2006; 12:701-704.
Levy SB and Marshall B. Antibacterial resistance worldwide: causes, challenges and responses. Nat Med Suppl 2004; 10:S122-S129.
Livermore DM, Macgowan AP, and Wale MCJ. Surveillance of antimicrobial resistance. BMJ 1998; 317:614-615.
McEwen SA and Singer RS. Stakeholder position paper: The need for antimicrobial use data for risk assessment: Animal Antimicrobial Use Data Collection in the United States: Methodological Options. Prev Vet Med 2006; 73:169-176.
Mellon M, Benbrook C, Benbrook KL. Hogging it: estimates of antimicrobial abuse in livestock. Cambridge: Union of Concerned Scientists Publications 2001.
Menendez Gonzalez S, Steiner A, Gassner B, and Regula G. Antimicrobial use in Swiss dairy farms: Quantification and evaluation of data quality. Prev Vet Med 2010;

70
95:50-63.
Merlo J, Wessling A, and Melander A. Comparison of dose standard units for drug utilisation studies. Eur J Clin Pharmacol 1996; 50:27-30.
Phillips I. The 1997 Garrod Lecture. The subtleties of antibiotic resistance. J Antimicrob Chemother 1998; 42:5-12.
Phillips I, Casewell M, Cox T, De Groot B, Friis C, Jones R, Nightingale C, Preston R, and Waddell J. Does the use of antibiotics in food animals pose a risk to human health? A critical review of published data. J Antimicrob Chemother 2004; 53:28-52.
Singer RS, Reid-Smith R, and Sischo WM. Stakeholder position paper: Epidemiological perspectives on antibiotic use in animals: Animal Antimicrobial Use Data Collection in the United States: Methodological Options. Prev Vet Med 2006; 73:153-161.
Singer RS, Ward MP, and Maldonado G. Can landscape ecology untangle the complexity of antibiotic resistance? Nat Rev Microbiol 2007; 4:943-952.
van den Bogaard AE and Stobberingh EE. Antibiotic Usage in Animals: Impact on Bacterial Resistance and Public Health. Drugs 1999; 58:589-607.
van den Bogaard AE and Stobberingh EE. Epidemiology of resistance to antibiotics: Links between animals and humans. Int J Antimicrob Agents 2000; 14:327-335.
Witte W. Medical Consequences of Antibiotic Use in Agriculture. Science 1998; 279:996-997.

71
CHAPTER 3: Evaluation of resistance classification accuracy by latent class analysis of data from disk diffusion and broth
microdilution for Escherichia coli and Mannheimia haemolytica recovered from feedlot cattle.
Katharine M. Benedict1, Sheryl P. Gow2, Richard J. Reid-Smith3,
Calvin W. Booker4, Tim A. McAllister5, and Paul S. Morley1.
1Animal Population Health Institute, Colorado State University, Fort Collins, CO 80523-
1654, USA;
2Laboratory of Foodborne Zoonoses, Public Health Agency of Canada, University of
Saskatchewan, Saskatoon, SK, S7N 5B4, Canada;
3Laboratory of Foodborne Zoonoses, Public Health Agency of Canada, Guelph, ON,
N1G 5B2, Canada;
4Feedlot Health Management Services, Okotoks, AB, T1S 2A2, Canada;
5Lethbridge Research Center, University of Lethbridge, Lethbridge, AB, T1J
4B1, Canada.

72
INTERPRETIVE SUMMARY The resistance status of isolates representing an individual or a population is
determined by susceptibility testing. Surveillance programs must accurately identify and
monitor levels of resistance in order to effectively respond to susceptibility problems or
emerging resistance threats. Yet, the unbiased accuracies of the common susceptibility
testing methods (disk diffusion and broth microdilution) are unknown. Therefore,
resistance information from these tests might provide false impressions of the true status
of resistance. It is unlikely that mitigation strategies that are based on inaccurate
information will be as useful as those based on unbiased estimates.
The following project investigates accuracies of disk diffusion and broth
microdilution using a novel analysis technique. The ability of each test to correctly
identify resistance and non-resistance to different antimicrobial drug and organism
combinations is determined without assuming the superiority of one test over the other.
The dogmatic approach in developing antimicrobial resistance surveillance programs has
been to use broth microdilution susceptibility testing over the disk diffusion method.
However, results of this project show that disk diffusion can be an appropriate choice for
susceptibility testing when conducting surveillance for antimicrobial resistance.

73
ABSTRACT Objective: It is crucial to establish an appropriate understanding of error rates for
antimicrobial susceptibility tests when working to establishing reliable estimates of
antimicrobial drug resistance. A degree of misclassification is expected with all
diagnostic tests and the true state of resistance is ultimately unknown despite rigorous
standardization of susceptibility testing methods. Latent class analysis techniques are
capable of modeling such uncertainty in classification for diagnostic tests. The objective
of this study was to estimate and compare the accuracy of the disk diffusion and broth
microdilution methods for surveillance of antimicrobial drug resistance in feedlot cattle.
Methods and Materials: Isolates of E. coli and M. haemolytica were tested for
susceptibility to panels of antimicrobial drugs by standardized methodology for disk
diffusion and broth microdilution. Latent class analysis was used to determine the
proportions of correctly identified resistant and non-resistant isolates for each
antimicrobial susceptibility testing method. The antimicrobial drugs compared in these
analyses were ampicillin, ceftiofur, streptomycin, sulfisoxazole, tetracycline, and
trimethoprim-sulfamethoxazole.
Results: A total of 2,316 E. coli isolates from individual samples, 885 E. coli isolates
from composite samples, and 783 M. haemolytica isolates were tested by both
antimicrobial susceptibility tests. Models for all organism and antimicrobial drug
combinations indicated that both testing methods correctly classified non-resistance in a

74
high proportion of isolates. However, the ability of the test to correctly classify true
resistance varied among bacteria-drug combinations in the 2 tests.
Conclusions: Non-resistance predicted by either method likely represents the true non-
resistance status in these bacterial populations, but errors can be expected more
frequently when tests classify isolates as resistant. Additionally, misclassification of
resistance to different antimicrobial drugs occurs at different rates in the 2 bacterial
species.

75
INTRODUCTION
As with any diagnostic test, antimicrobial susceptibility testing is subject to errors
which lead to misclassification (Figure 1). Procedural failures (sub-standard laboratory
or sampling procedures), unpredictable responses due to biological variability in bacterial
isolates, or other unrecognized (chance) sources of variability may all lead to diagnostic
test errors (Greenwood 1981, 2000). Optimally, we would always choose to employ a
highly accurate test that minimizes such errors, but other test characteristics such as cost
and availability can also influence our choice in testing methods. For example, a test
method with a lower, yet an acceptable level of accuracy might be chosen for
surveillance monitoring if the cost of testing allowed for evaluation of a substantially
greater number of isolates.
True NegativeFalse Negative
False PositiveTrue Positive
Non-ResistantResistant
True Status
Tes
t R
esu
ltR
esis
tan
tN
on
-Re
sis
tan
t
Figure 1: Misclassification in diagnostic tests.

76
Disk diffusion and broth microdilution are antimicrobial susceptibility testing
techniques which both provide estimates of phenotypic susceptibility to antimicrobial
drugs based on bacterial growth in the presence of varying concentrations of the
antimicrobial drug. Internationally recognized and standardized methods for conducting
these tests have been established by the Clinical and Laboratory Standards Institute
(2008), as have interpretive criteria. These breakpoints for susceptibility classification
(based upon MIC for broth microdilution and zone diameter for disk diffusion) are also
used in epidemiological surveillance, although some have suggested that different, lower
breakpoints may be better suited for early detection of developing resistance in different
ecological settings (Bywater et al. 2006; Simjee et al. 2007).
The potential for errors in antimicrobial susceptibility testing is widely
recognized. In fact, when considering testing by broth microdilution and disk diffusion,
results suspected as incorrect by disk diffusion are often considered to be confirmed or
refuted by comparison to broth microdilution, an assumed “gold standard” test (Citron et
al. 2005; Murray et al. 1982; Sautter and Denys 1987; Hubert et al. 1998; Woolfrey et al.
1983; Shyrock et al.1996; Metzler and DeHann 1974; Klement 2005). The inherent
assumption when we consider a test to be a “gold standard” is that the test is perfectly
accurate and that true classification status (e.g. resistance and non-resistance in
susceptibility testing) is always correctly identified by the test. However, all diagnostic
tests, even highly regarded tests such as broth microdilution, are vulnerable to
classification errors (Enoe 2000). For susceptibility testing, cross-classification of two
fallible tests such as disk diffusion and broth microdilution (Figure 1) without a reliable
understanding of their error rates provides an imperfect understanding of the true

77
resistance and true non-resistance status of a population. This type of reference-based
test evaluation will always yield results that are biased to the extent that the reference test
(“gold-standard”) does not correctly identify the true classification status of individuals,
and the new test can never appear better than the reference test that is being used for
cross-classification.
Obtaining accurate antimicrobial susceptibility information for bacterial isolates is
critical for testing of isolates in clinical settings and also for surveillance programs
evaluating antimicrobial resistance in both commensal and pathogenic bacteria
(Aarestrup 2004; APUA 2005; Levy and Marshall 2004; McEwen and Fedorka-Cray
2002; Wassenaar and Silley 2008; Williams 2001). Identifying important population
trends of reduced susceptibility to available antimicrobial drugs in different populations
and over time is necessary to facilitate an appropriate understanding of the complexities
of antimicrobial resistance (Greenwood 2000; Vieira et al. 2008; Phillips 1998). While it
is possible to reduce the potential for errors through test selection and rigorous
standardization of protocols, it is impossible to eliminate all errors. In order to correctly
interpret results generated for either clinical or surveillance purposes, the potential for
errors in detecting resistant and susceptible isolates must be understood. Further, even
with imperfect susceptibility testing methods the prevalence of true resistance can be
accurately established and monitored if the potential for erroneous classification is
understood and accounted for (Caprioli et al. 2000; Varaldo 2002).
In contrast to reference-based diagnostic test evaluation, newer methods of test
evaluation have been identified which allow estimation of the true, unbiased parameters
related to test accuracy (namely sensitivity and specificity) and prevalence of the

78
condition in question without presuming to know the true classification of individuals.
Because these methods attempt to model classification probabilities that are hidden from
direct observation, they are sometimes called latent class analysis. The objective of this
study was to estimate and compare the accuracy of the disk diffusion and broth
microdilution methods for surveillance of antimicrobial resistance in feedlot cattle.

79
MATERIALS AND METHODS Study Population— All animal handling and sampling procedures were approved prior
to the initiation of the study by the Animal Care Committee of Feedlot Health
Management Services (FHMS) and the Institutional Animal Care and Use Committee of
Colorado State University. Cattle sampled in this study were managed under typical
conditions of feedlot production in North America. Bacterial isolates evaluated in this
study were collected as part of an ongoing project for the purpose of surveillance of
antimicrobial resistance in feedlot cattle. However, the isolates used in this study were
purposefully selected from the entire sample set for the purpose of evaluating test
sensitivity and specificity. As such, results were not intended to provide estimates of
resistance prevalence for the cattle enrolled in the study or for other populations of
feedlot cattle.
Cattle were enrolled from September 17, 2007 to January 16, 2010, and isolates
included in this dataset were a convenience sample of the isolates that had been evaluated
for antimicrobial susceptibility using both disk diffusion and broth microdilution. To
meet an important assumption of the analysis method, this set of isolates was stratified
into 2 sample sets that were likely to have different resistance prevalences. The structure
of the collected data allowed easy classification of isolates into a population recovered
from animals at arrival to the feedlot and a second population that were recovered from
animals that had been managed in the feedlot environment for at least 60 days. The
resistance prevalences of these 2 sample sets were expected to be different since the latter
isolates from established animals were more likely to have been exposed to antimicrobial
drugs than the isolates from animals newly arriving at the feedlot. The resistance

80
prevalences of these isolates were not assumed to be representative of the resistance
prevalence of the population sampled for the surveillance project. It is assumed that test
accuracy (sensitivity and specificity) was constant across different populations and was
not biased by the sampling scheme.
Sampling Procedures— Pens of cattle were usually filled over several days as cattle
arrived at the feedlot on different trucks. Once occupancy of a pen of animals had been
finalized and cattle had been allocated to the study, pen-level composite fecal samples
were collected at three time points: at arrival, at > 60 days on feed (DOF) and at exit (≤
30 days prior to slaughter). In brief, at each sampling time a new plastic spoon was used
to combine feces from 20 fresh pen-floor pats into a new fecal cup (minimum 10 grams
feces) for each composite sample. The sample was mixed thoroughly, and approximately
4 grams of feces from each fecal cup were then transferred into a vial containing
modified Cary Blair transport media (Enteric Transport Medium, 15 ml, Cat#F01W,
Dalynn Biologicals Inc., Calgary, Alberta) (Alexander et al. 2009).
Individual animals enrolled in the trial were sampled twice over the course of the
study: during initial processing shortly after arrival to the feedlot and when cattle were re-
handled as part of standard feedlot protocols. Each individual animal had two samples
collected each time they were sampled: a nasopharyngeal swab sample and a fecal
sample collected per rectum. The nasopharyngeal sample was collected in the deep
pharynx using a commercially available double guarded swab (# J273, Jorgensen
Laboratories, Inc, Loveland, CO, USA). A Cary Blair media tube (BBL CultureSwab™,
CA90001-038, VWR International, Mississauga, Ontario) was used to transport the

81
nasopharyngeal swab. Individual fecal samples were collected per rectum using a new
plastic palpation sleeve. A minimum of 4 grams of feces from the rectum of each animal
was transferred into a vial containing modified Cary Blair transport media (Enteric
Transport Medium,15 ml, Dalynn Biologicals Inc.) (Alexander et al. 2009).
Sample Transport and Data Storage— All samples were labeled with the date and the
pen number (and the animal ID for individual animal samples), refrigerated in a chilled
cooler and transported to the microbiology laboratory (Agriculture and Agri-Food
Canada Lethbridge Research Station, Lethbridge, Alberta) for further processing by
overnight courier.
Laboratory Procedures—Nasopharyngeal swabs were processed immediately after
overnight delivery to the microbiology laboratory. Fecal samples were stored in a 4ºC
cooler while processing of nasal swabs was completed.
Nasopharyngeal Swabs—In a Risk Level II containment laboratory, nasal swabs were
aseptically removed from their transport vial and the tips were vortexed at high speed for
30 seconds and then allowed to settle undisturbed for at least 10 minutes.
One hundred microliters of this suspension were spread onto blood agar
containing 15μg/mL bacitracin (BAC plates) and incubated overnight at 37ºC. BAC
plates were also inoculated with M. haemolytica ATCC strain 33396 and M. glucosida
ATCC strain 38457 as positive controls. Colonies with morphology typical of M.
haemolytica were selected for further analysis, using the BAC plate with M. haemolytica

82
33396 as a reference (round, medium sized, ‘wet’, white-grey colored colonies with some
degree of hemolysis evident). Three to 5 colonies were streaked onto BAC plates and
incubated at 37ºC overnight. Isolated colonies were rechecked to confirm purity and
verify that the morphology was similar to the reference plate. Isolates were then tested
for oxidase (Oxoid) and a catalase reactions (using 3% hydrogen peroxide). Isolates
which were oxidase and catalase positive were prepared for PCR. Positive (M.
haemolytica and M. glucosidal) and negative controls were also prepared for each of the
tests. Isolates that were identified as presumed-M. haemolytica were stored in 20%
glycerol stocks at -80ºC until further phenotypic characterization. Phenotypic tests were
performed using Rosco diagnostic tablets (Diatabs ®) and compared against phenotypic
profiles (Angen et al. 2002). Phenotypic tests performed included alpha-fucosidase, beta-
galactosidase, beta-glucosidase, beta-xylosidase, D-xylose, esculin hydrolysis, indole, L-
arabinose, maltose, mannitol, ornithine decarboxylase, sorbitol, trehalose, and urease. A
multiplex PCR assay was used to confirm the presumed-M. haemolytica isolates as
positive (Alexander et al. 2008). All M. haemolytica isolates confirmed by PCR were
tested for susceptibility.
Composite and Individual fecal samples—Individual fecal samples corresponding to
animals from which M. haemolytica was recovered and all composite fecal samples were
processed by mixing the Cary-Blair transport medium to create a uniform slurry
(Alexander et al. 2009). A sterile cotton swab was used to streak for isolation on
MacConkey Agar (MAC) and plates were incubated for 24 hours at 37ºC. Isolates that
fermented lactose and had appropriate morphology were subcultured on lysogeny broth

83
(LB) plate, incubated at 37ºC overnight and then tested for indole reaction. A
presumptive identification of non-type specific E. coli was based on colony morphology,
lactose fermentation and positive indole reaction. Up to 3 lactose-fermenting (pink)
colonies per individual fecal sample and five colonies per composite manure sample were
selected and archived for susceptibility testing by freezing at -80°C in 30% glycerol.
Antimicrobial Susceptibility Testing—Each isolate included in this analysis was tested for
susceptibility to panels of antimicrobial drugs by disk diffusion (BioMIC) and broth
microdilution (Sensititre). Both procedures were conducted according to protocols of the
Clinical Laboratory Standards Institute (CLSI 2008). The antimicrobial drugs included
on the panels used in this study were designed independently for surveillance purposes,
and as such were not identical. The antimicrobial drugs included on both the disk
diffusion and broth microdilution susceptibility panels were ampicillin, ceftiofur,
sulfisoxazole, streptomycin, tetracycline, and trimethoprim-sulfamethoxazole. Only
isolates which had results for these antimicrobial drugs from both testing methods were
included in these analyses. Disk diffusion information was recorded as zone diameter
and broth microdilution information was recorded as the MIC. Quality control strains
used were Escherichia coli ATCC 25922, Streptococcus pneumoniae ATCC 49619, and
Staphylococcus aureus ATCC 29213.
Interpretive criteria—Susceptible, intermediate, and resistant (SIR) designations of M.
haemolytica were determined using CLSI guidelines for ampicillin (2002) and

84
oxytetracycline (2006). Interpretive criteria for E. coli were also obtained from CLSI
guidelines (2005), except for streptomycin, which were based on those used by the
Canadian Integrated Program for Antimicrobial Resistance Surveillance (CIPARS) and
the National Antimicrobial Resistance Monitoring System (NARMS, CDC 2003).
Data Analysis—Data were evaluated graphically and by calculating descriptive
statistics. For analysis purpose, isolate susceptibility was dichotomized as resistant and
non-resistant (which included both intermediate and susceptible classifications).
Resistance classification obtained from both testing methods was used to cross-classify
isolates (i.e. resistant by both methods, non-resistant by both methods, and both
discordant classifications) (Figure 1). Using counts of these cross-classifications,
stochastic latent class analysis modeling (Markov-Chain Monte Carlo simulation using a
Gibbs sampler)a was used to estimate the proportion of isolates correctly classified for
resistance (sensitivity) and the proportion of isolates correctly classified for non-
resistance (specificity) by each testing method, as previously described (Lunn et al. 2000;
Branscum et al. 2005). Data were stratified into 2 sample sets based on sample collection
timing (samples obtained at feedlot arrival, and those obtained from animals that had
been managed in the feedlot environment for at least 60 days). These models assumed
that the two testing methods were conditionally dependent and the code was adapted
from previously published information
(http://www.epi.ucdavis.edu/diagnostictests/AB2deptests2popns.html; code available
upon request). Convergence of each model was assessed by running six simultaneous
chains with widely different starting values while monitoring history (time series) plots,

85
autocorrelation plots, and Brooks-Gelman-Rubin plots (Gelman and Rubin 1992). For
the final model of each organism (E. coli from individual samples, E. coli from
composite samples, and M. haemolytica) and antimicrobial drug combination, a single
chain was run with the weakly informative prior probability distributions. An initial
burn-in of 5,000 iterations was discarded and the next 50,000 iterations were used to
generate posterior probability distributions of the test sensitivities and specificities (Enoe
et al. 2000; Johnson and Gastwirth 2000). The median estimates and their 95%
probability intervals were determined from these posterior distributions regarding the
proportion of correctly classified isolates for resistance (sensitivity), and for non-
resistance (specificity). Although there is not a formal method for testing whether point
estimates for 2 tests were statistically different, an approximate method was used as a
somewhat objective method for evaluating these comparisons of interest. Specifically,
probability intervals which overlapped with the point estimate (median) of the other
susceptibility test were used as an indication that the antimicrobial susceptibility tests
were not different from one another in their ability to correctly classify true resistance or
true non-resistance. Conversely, probability intervals which did not encompass the point
estimate (median) of the other test were considered to indicate that there was a
statistically detectable difference between the tests (assumed probability of Type I error
<0.05). Positive and negative predictive values were calculated across a range of true
resistance prevalence values and then plotted to allow further assessment of information.
The predictive values of resistance (predictive value of a positive test) and the predictive
values of non-resistance (predictive value of a negative test) were estimated using
standard formulas (Thrusfield 2005). In general, the predictive value of resistance is the

86
proportion of true positives divided by the sum of true positives and false positives, and
the predictive value of non-resistance is the proportion of true negatives divided by the
sum of true negatives and false negatives (Figure 1). These predictive values vary
dramatically with true resistance and therefore must be considered across a range of
relevant prevalences.
Prior probability estimates—Beta distributions of probabilities were created with
softwareb to represent the possible values for the prior antimicrobial resistance
prevalences of sample set 1 and sample set 2 (Table 1). For the disk diffusion (test 1)
susceptibility test, prior probability beta distributions (priors) for sensitivity and
specificity were also established. Due to the assumed dependence between the
susceptibility tests, the priors for the sensitivity and specificity of the broth microdilution
test (test 2) were conditional on the disk diffusion priors. The choice of test order for
conducting the analysis with broth microdilution conditionally dependent on disk
diffusion was arbitrary. All priors were weakly informative with effective sample sizes
(a + b; Table 1) under n=10. Priors for resistance prevalences of E. coli isolates in
sample set 1 and sample set 2 were taken from a previous study (Rao et al. 2009). For M.
haemolytica isolates, relevant priors were only available for the sample set with higher
prevalence of resistance (sample set 2). Therefore, the priors for resistance prevalences
in sample set 2 were taken from a previous study and the estimates for sample set 1 were
extrapolated as 5% lower than these estimates (Watts et al. 1994). Since no sources have
published estimates of the sensitivity and specificity of disk diffusion or of broth
microdilution susceptibility tests, the authors arrived at a consensus opinion for

87
reasonable estimates and a lower limit with 95% confidence. The disk diffusion
sensitivity and specificity priors were assumed to be equivalent and the conditional
sensitivity and specificity priors of the broth microdilution test were assumed to be only
slightly higher, but also equivalent. These prior estimates were the same for all
antimicrobial drugs in the analysis.

88

89
Sensitivity Analysis—The influence of prevalence and sensitivity/specificity priors was
assessed by running the model with highly informative priors based on the same mode as
the weakly informative priors that were used (Georgiadis et al. 2003). Additionally,
widely varying distributions were created to assess the limits of model convergence.
Without varying the original priors, starting values for the models were assessed by
widely varying prevalence as well as sensitivities/specificities separately. The outcomes
of the disk diffusion and the broth microdilution antimicrobial susceptibility tests were
assumed to be dependent. Correlation between tests was monitored by the calculated
correlation value for each model. Additionally, a sensitivity analysis of the dependent
models was run by assuming complete independence between tests in separate models
(Georgiadis et al. 2003).

90
RESULTS Isolates—A total of 2,316 E. coli isolates from individual animal samples were evaluated
for susceptibility by both tests, as were 885 E. coli isolates from composite samples, and
783 M. haemolytica isolates. Isolates in sample set 1 had widely different apparent
prevalences of resistance to tetracycline, sulfisoxazole, and streptomycin than in sample
set 2 (Table 2). However, the apparent prevalences of resistance to ampicillin, ceftiofur,
and trimethoprim-sulfamethoxazole were not as disparate between the 2 sample sets
(Table 2). Between 20% and 30% of E. coli isolates were resistant to a single
antimicrobial drug, while <20% of M. haemolytica isolates were resistant to a single
antimicrobial drug (Table 3).

91

92

93
Test Accuracy—Models for all combinations of organisms and antimicrobial drugs
indicated that both antimicrobial susceptibility testing methods were very good at
correctly classifying non-resistance of isolates (specificity; Table 4). However, the
classification of true resistance (sensitivity) varied. As indicated by extremely wide
probability intervals for classification of true resistance, ceftiofur was not modeled well
in these analyses.

94

95
For E. coli isolates cultured from individual animal samples, disk diffusion was
superior to broth microdilution in correctly classifying non-resistance for 5 of the 6
shared antimicrobial drugs tested (ampicillin, ceftiofur, streptomycin, sulfisoxazole, and
tetracycline; Table 4). Ability to correctly classify true non-resistance to trimethoprim-
sulfamethoxazole was not detectably different between the two susceptibility tests. Disk
diffusion was superior to broth microdilution in terms of correctly classifying tetracycline
resistance. Conversely, broth microdilution was superior to disk diffusion in correctly
classifying ceftiofur and streptomycin resistances. However, the probability intervals for
detection of true resistance for both ceftiofur and streptomycin were relatively wide. No
difference was detected between the two susceptibility tests for correctly classifying
resistance to ampicillin, sulfisoxazole, and trimethoprim-sulfamethoxazole.
Correct classification of resistance and non-resistance in isolates of E. coli from
composite samples was similar to that of E. coli isolates from individual animal samples.
No difference was found between the 2 tests in correctly classifying non-resistance for all
of the 6 antimicrobial drugs tested (ampicillin, ceftiofur, streptomycin, sulfisoxazole,
tetracycline, and trimethoprim-sulfamethoxazole; Table 4). In correctly classifying
resistance, no difference was found between the tests in 4 of the 6 antimicrobial drugs
(ampicillin, streptomycin, sulfisoxazole, and trimethoprim-sulfamethoxazole).
Analogous to that of E. coli isolates from individual samples, disk diffusion was superior
to broth microdilution in correctly classifying tetracycline resistance for E. coli isolates
from composite samples.
Correct classification of true resistance and true non-resistance were not
detectably different between the antimicrobial susceptibility tests for isolates of M.

96
haemolytica in the 2 antimicrobial drugs tested. Other shared antimicrobial drugs in the
panels of disk diffusion and broth microdilution could not be modeled due to the absence
of detected resistance in one or both of the sample sets.
Predictive Value for Resistance and Non-Resistance—Depending on the
antimicrobial drug being evaluated and the expected prevalence of resistance, these
results suggest that there would be substantial differences in the confidence that users
could have regarding how well these susceptibility tests were correctly classifying
resistance and non-resistance (Figure 2). The disk diffusion assay had better ability to
predict true resistance for ampicillin, streptomycin, and sulfisoxazole than did broth
microdilution when resistance prevalence in E. coli isolates was low (Figure 2); a similar
difference was found regarding the predictive value for resistance when evaluating
tetracycline susceptibility in M. haemolytica isolates. Conversely, the ability to have
high confidence in test results indicating non-resistance to these 4 antimicrobial drug and
organism combinations was substantially better for broth microdilution than disk
diffusion when resistance prevalence was high (Figure 2). For example, these estimates
suggest that in a population of E. coli isolates where the true prevalence of resistance to
streptomycin resistance was 5%, a disk diffusion test indicating resistance would
accurately predict true resistance status 92.5% of the time and a broth microdilution test
would only correctly predict true resistance status 68.6% of the time. However, when the
true prevalence of resistance to streptomycin was 70%, a disk diffusion test indicating
non-resistance would correctly predict true non-resistance status 59.2%, while a broth

97
microdilution test indicating non-resistance would accurately predict non-resistance
76.6% of the time (Figure 2).
0%
10%
20%
30%
40%
50%
60%
70%
80%
90%
100%
0% 10% 20% 30% 40% 50% 60% 70% 80% 90% 100%
Disk diffusionBroth microdilution
0%
10%
20%
30%
40%
50%
60%
70%
80%
90%
100%
0% 10% 20% 30% 40% 50% 60% 70% 80% 90% 100%
Resistance
True Streptomycin Resistance Prevalence
Non-Resistance
Pre
dic
tive
Va
lue
s
Figure 2: Predictive values for resistance and non-resistance to streptomycin by disk diffusion and broth microdilution. The vertical lines represent the true prevalence of streptomycin resistance at arbitrary low and high levels to illustrate large differences in predictive values between the 2 antimicrobial susceptibility tests.
In contrast, the susceptibility tests for other antimicrobial drugs had predictive
abilities that were more comparable across a wide range of true prevalence values
(ceftiofur, tetracycline, and trimethoprim-sulfamethoxazole in E. coli isolates and

98
ampicillin in M. haemolytica isolates; Figure 3). Though the predictive abilities of the
two tests were not identical, there are not large, practical differences for these
antimicrobial drugs regarding the confidence that a user could have in positive or
negative tests results (resistant or non-resistant, respectively) for these two assays. For
example, the difference between the predictive abilities of disk diffusion (71.4%) and
broth microdilution (56.8%) when the true prevalence of resistance to tetracycline was
5% is much smaller than this difference for streptomycin (Figures 2 and 3). Similarly,
there is only a small difference in the predictive ability for non-resistant test results when
the true prevalence of resistance to tetracycline was 70% (89.2% for disk diffusion vs.
84.8% for broth microdilution).

99
0%
10%
20%
30%
40%
50%
60%
70%
80%
90%
100%
0% 10% 20% 30% 40% 50% 60% 70% 80% 90% 100%
Disk diffusionBroth microdilution
0%
10%
20%
30%
40%
50%
60%
70%
80%
90%
100%
0% 10% 20% 30% 40% 50% 60% 70% 80% 90% 100%
Pre
dic
tive
Val
ues
True Tetracycline Resistance Prevalence
Resistance
Non-Resistance
Figure 3: Predictive values for resistance and non-resistance to tetracycline by disk diffusion and broth microdilution. The vertical lines represent the true prevalence of tetracycline resistance at arbitrary low and high levels to illustrate small differences in predictive values between the 2 antimicrobial susceptibility tests.
Model Convergence and Sensitivity Analysis — Evidence for model convergence was
provided for each model by the overlapping history (time series) plots for 6 simultaneous
chains, a relatively immediate drop to zero in autocorrelation plots, and overlapping lines
with values of ~1 in Brooks-Gelman-Rubin plots (Gelman and Rubin 1992). Widely
varied prior probability distributions and starting values had little influence on results
obtained from all of the models. Correlation values obtained from the latent class models
for the 2 tests were low (<0.3) for all models suggesting that there was a low or small
amount of conditional dependence between the sensitivities and specificities of the tests.
100
Additionally, this conclusion was supported by the fact that parameter estimates obtained
from models which assumed conditional independence for the classification of true
resistance and true non-resistance between the two susceptibility tests were generally
similar to the estimates obtained from models which included parameters for conditional
dependence (results not shown).
101
DISCUSSION
Results of this study indicate that the ability of disk diffusion and broth
microdilution susceptibility tests to correctly classify true resistance varies by the
antimicrobial drug and organism of interest. In contrast, both testing methods had
consistently strong ability to correctly classify true non-resistance for all antimicrobial
drugs tested and in both E. coli and M. haemolytica. Therefore, non-resistance detected
by either method likely represents the true non-resistance status in these populations, but
more errors in the correct classification of true resistance can be expected. Additionally,
misclassification of resistance to different antimicrobial drugs occurs at different rates in
the 2 organisms.
Hui and Walter used a maximum-likelihood procedure to develop deterministic
estimates of error rates and true prevalences in 2 populations assuming conditional
independence between the tests (1980). More recently, stochastic methods have allowed
incorporation of prior knowledge (Bayesian methods) using Monte Carlo simulation to
estimate posterior probabilities regarding test accuracy and the true prevalence of
conditions in populations (Enoe et al. 2000). Additionally, the methodology has been
extended to account for tests which do not meet the traditional assumption of conditional
independence (Branscum 2005). Therefore, theoretically unbiased estimates of the
accuracies for conditionally dependent tests can be obtained.
The ability of a test to correctly identify resistance or non-resistance dictates our
level of trust in describing the true picture of resistance. Clinically, an accurate
understanding of true resistance and true non-resistance is important for appropriately
selecting antimicrobial drugs to control or prevent disease while also adhering to

102
principles of prudent use. Both broth microdilution and disk diffusion susceptibility tests
have limitations in their methodology for adequately representing in vivo factors which
contribute to therapeutic failures, such as stage of infection or physiologic barriers.
Information obtained from broth microdilution is often considered as more clinically
relevant than that obtained from disk diffusion because the MIC information can aid
therapeutic decision making regarding drug selection, dosing, and route of
administration. However, this study has shown that misclassification of resistance (and
non-resistance) in many of the tested antimicrobial drugs was just as likely in broth
microdilution testing as it was in disk diffusion. In the case of tetracycline, the broth
microdilution test was actually shown to be more prone to errors in resistance
classification than disk diffusion. A limited number of antimicrobial drugs were
analyzed in this study, so similar results in untested antimicrobial drugs may also be
found.
On a broader scale, surveillance for antimicrobial resistance on a regional,
national or even international level requires that large numbers of isolates be evaluated to
help ensure representativeness of results. Therefore, the cost per test becomes a much
larger concern when compared to susceptibility testing for clinical purposes. High
accuracy in surveillance is necessary to confidently and efficiently respond to potential
antimicrobial resistance threats to health on a population level (Livermore et al. 1998).
Given that results for different drugs were largely comparable for disk diffusion and
broth microdilution, we conclude that there are several advantages which make disk
diffusion susceptibility testing a more practical choice for use in large surveillance
programs compared with broth microdilution. The equipment and supplies necessary for

103
testing by disk diffusion is lower in cost than for testing by broth microdilution.
Additionally, disk diffusion testing is more flexible in terms of the ability to easily and
cheaply switch antimicrobial susceptibility discs in the antimicrobial drug panel as
opposed to producing or ordering customized 96-well plates in broth microdilution
testing. The epidemiologic thresholds of emerging resistances are often much lower than
the clinical breakpoints between resistance and non-resistance (Greiner and Gardner
2000a; Greiner and Gardner 2000b; Bywater et al. 2006; Simjee et al. 2008). Since lower
prevalences of resistance need to be detected, large numbers of isolates must be tested for
surveillance purposes and costs can become even more prohibitive. A limitation of this
study was that clinical breakpoints were used to designate resistance and non-resistance,
so it is possible that the tests would perform differently at other breakpoints or
epidemiologic thresholds. However, the breakpoints utilized here were the ones readily
available and might practically be used in the development of a surveillance program.
Beyond the considerations of test accuracy, the predictive values calculated in this
study illustrate that the decision of an appropriate test for a certain population could also
be directed by the expected level of resistance prevalence. In general, at very low
prevalences, the predictive value for resistance will always be low while the predictive
value for non-resistance is high (Thrusfield 2005). Conversely, at very high prevalences,
the predictive value for resistance will always be high while the predictive value for non-
resistance is low. This principle applies generally to all tests and has been previously
noted as well in the performance of disk diffusion susceptibility testing (Lamy et al.
2004). The susceptibility tests in this study had comparable predictive abilities across a
range of resistance prevalence to some antimicrobial drugs indicating that either test

104
would perform well. However, the tests would perform differently dependent on the
prevalence of resistance to antimicrobial drugs such as streptomycin and sulfisoxazole in
E. coli isolates.
Since disk diffusion and broth microdilution are based on similar biological
mechanisms which measure concentration relationships between the organism and the
antimicrobial drug, the two tests were assumed to be dependent. In highly dependent
tests, the proportions of detecting true resistance or true non-resistance by each test are
expected to be the same and correlation values would be high (i.e. >0.7). Correlation
values in this study were low and analogous models assuming independence of test
accuracies produced similar posterior probability distributions to those of the dependence
models. However, we do not believe that this finding universally exempts us from the
necessity of assuming dependence between disk diffusion and broth microdilution since
both tests were highly accurate (Georgiadis et al. 2003). The dependence models used in
this study would be recommended to account for any amount of correlation, no matter
how small (Dendukuri and Joseph 2001).
One of the assumptions of latent class analysis for 2 tests in 2 populations is that
the 2 populations have different prevalences (Branscum 2005). This was a limitation in
our study for ampicillin, ceftiofur, and trimethoprim-sulfamethoxazole resistance since
the prevalences of these antimicrobial drugs in sample set 1 were similar to their
counterparts in sample set 2. Even tetracycline resistance in M. haemolytica isolates and
sulfisoxazole resistance in the E. coli isolates from composite samples was suspect for
this reason as well. Therefore, the estimates for these antimicrobial drugs should not be

105
considered as reliable as the other antimicrobial drugs with smaller probability intervals
(Toft 2005).
The collection of isolates used for this study was a non-representative,
convenience sample. Also, multiple isolates were from the same individual or from
individuals within the same pen and clustering of resistances would be expected in such a
population. Therefore, the posterior probability distributions for prevalence produced by
the models were not reported. It was not an objective of this study to describe true
resistance prevalence in the 2 sample sets nor was it necessary for the evaluation of the
test accuracy by this latent class analysis method. Every isolate was tested by both
systems and the effective comparison of the tests was at the isolate level. Theoretically,
the proportions of correctly classified true resistance and true non-resistance are constant
across populations of different resistance prevalences. Therefore, the estimates produced
in this study would be relevant in all populations of feedlot cattle for the antimicrobial
drug and organisms presented.
The prior probability distributions (priors) used in these models were potentially
biased due to design differences between this study and the studies which documented
resistance prevalence in similar populations. However, the priors were all structured to
be weakly informative to the Bayesian analyses and were not found to influence the
models heavily. The prevalence estimates for antimicrobial drug resistance in E. coli
isolates for arrival and exit populations were highly relevant since the population of
feedlot cattle from Alberta were likely very similar to that of our study (Rao et al. 2009).
The previous study only evaluated resistances by way of composite samples, so the use of
these same priors for the individual E. coli isolates in our models might be different if

106
more appropriate priors were available. The M. haemolytica prevalence priors were even
more biased than the individual E. coli priors. No other studies have been conducted
which estimate the level of resistance in representative populations of feedlot cattle for
M. haemolytica isolates using analogous susceptibility testing approaches. Therefore, the
best estimates were obtained from a study of diagnostic laboratory lung samples for
different respiratory pathogens (Watts et al. 1994). The resistance detected in lung
isolates may differ from that of the nasopharyngeal swab isolates used in our study. The
biased priors as well as the low level of resistance detected in M. haemolytica most likely
account for the wide probability intervals for the proportions of correctly classified
resistance.
FOOTNOTES aWinBUGS 1.4, 1996-2003, Imperial College and Medical Research Council, UK:
http://www.mrc-bsu.cam.ac.uk/bugs/
bBetaBuster 1.0, free software available at
http://www.epi.ucdavis.edu/diagnostictests/home.html
107
REFERENCES Aarestrup FM. Monitoring of Antimicrobial Resistance Among Food Animals: Principles
and Limitations. J Vet Med B Dis Vet Public Health B 2004; 51:380-388.
Alexander TW, Cook SR, Yanke LJ, Booker CW, Morley PS, Read RR, Gow SP, McAllister TA. A multiplex polymerase chain reaction assay for the identification of Mannheimia haemolytica, Mannheimia glucosida, and Mannheimia ruminalis. Vet Microbiol 2008; 130:165-175.
Alexander TW, Booker SW, Gow SP, Read RR, and McAllister TA. Recovery of antimicrobial-resistant Escherichia coli after storage of bovine feces in Cary-Blair medium. Can J Microbiol 2009; 55:1224-1227.
Angen O, Ahrens P, and Bisgaard M. Phenotypic and genotypic characterization of Mannheimia (Pasteurella) haemolytica-like strains isolated from diseased animals in Denmark. Vet Microbiol 2002; 84:103-114.
Branscum AJ, Gardner IA, and Johnson WO. Estimation of diagnostic-test sensitivity and specificity through Bayesian modeling. Prev Vet Med 2005; 68:145-63.
Bywater R, Silley P, and Simjee S. Antimicrobial breakpoints--Definitions and conflicting requirements. Vet Microbiol 2006; 118:158-159.
Caprioli A, Busani L, Martel JL, and Helmuth R. Monitoring of antibiotic resistance in bacteria of animal origin: epidemiological and microbiological methodologies. Int J Antimicrob Agents 2000; 14:295-301.
Centers for Disease Control and Prevention (CDC). National Antimicrobial Resistance Monitoring System for Enteric Bacteria (NARMS): 2001 Annual Report. Atlanta, Georgia: U.S. Department of Health and Human Services, CDC 2003.
Citron DM, Warren YA, Fernandez HT, Goldstein MA, Tyrrell KL, and Goldstein EJC. Broth Microdilution and Disk Diffusion Tests for Susceptibility Testing of Pasteurella Species Isolated from Human Clinical Specimens. J Clin Microbiol 2005; 43:2485-2488.
Clinical and Laboratory Standards Institute (formerly NCCLS). Performance standards for antimicrobial disk and dilution susceptibility tests for bacteria isolated from animals; approved standard-second edition. M31-A2. CLSI, Wayne, PA 2002.
Clinical and Laboratory Standards Institute (formerly NCCLS). Performance standards

108
for antimicrobial susceptibility testing; 15th informational supplement. M100-S15. CLSI, Wayne, PA 2005.
Clinical and Laboratory Standards Institute (formerly NCCLS). Performance Standards for Antimicrobial Disk and Dilution Susceptibility Tests for Bacteria Isolated from Animals—Third Edition: Approved Standard M31-A3 CLSI, Wayne, PA, 2008.
Clinical and Laboratory Standards Institute (formerly NCCLS). Methods for Antimicrobial Dilution and Disk Diffusion Susceptibility Testing of Infrequently Isolated and Fastidious Bacteria; Approved Guideline. M45-A. CLSI, Wayne, PA 2006.
Dendukuri N and Joseph L. Bayesian Approaches to Modeling the Conditional Dependence between Multiple Diagnostic Tests. Biometrics 2001; 57:158-167.
Enoe C, Georgiadis MP, and Johnson WO. Estimation of sensitivity and specificity of diagnostic tests and disease prevalence when the true disease state is unknown. Prev Vet Med 2000; 45:61-81.
Gelman A and Rubin DB. Inference from Iterative Simulation Using Multiple Sequences. Stat Sci 1992; 7:457-511.
Georgiadis MP, Johnson WO, Gardner IA, and Singh R. Correlation Adjusted Estimation of Sensitivity and Specificity of Two Diagnostic Tests. J Royal Stat Soc Ser C Appl Stat 2003; 52:63-76.
Greenwood D. In vitro Veritas? Antimicrobial Susceptibility Tests and Their Clinical Relevance. J Infect Dis 1981; 144:380-385.
Greenwood D. Detection of antibiotic resistance in vitro. Int J Antimicrob Agents 2000; 14:303-306.
Greiner M and Gardner IA. Epidemiologic issues in the validation of veterinary diagnostic tests. Prev Vet Med 2000a; 45:3-22.
Greiner M and Gardner IA. Application of diagnostic tests in veterinary epidemiologic studies. Prev Vet Med 2000b; 45:43-59.
Hubert S, Nguyen P, and Walker R. Evaluation of a computerized antimicrobial susceptibility system with bacteria isolated from animals. J Vet Diagn Invest 1998; 10:164-168.
Hui SL and Walter SD. Estimating the Error Rates of Diagnostic Tests. Biometrics 1980; 36:167-171.

109
Johnson WO and Gastwirth JL. Dual group screening. J Stat Plan Inference 2000; 83:449-473.
Klement E, Chaffer M, Leitner G, Shwimmer A, Friedman S, Saran A, and Shpigel N. Assessment of Accuracy of Disk Diffusion Tests for the Determination of Antimicrobial Susceptibility of Common Bovine Mastitis Pathogens: A Novel Approach. Microb Drug Resist 2005; 11:342-350.
Lamy B, Carret G, Flandrois JP, and Delignette-Muller ML. How does susceptibility prevalence impact on the performance of disk diffusion susceptibility testing? Diagn Microbiol Infect Dis 2004; 49:131-139.
Levy SB and Marshall B. Antibacterial resistance worldwide: causes, challenges and responses. Nat Med Suppl 2004; 10:S122-S129.
Livermore DM, Macgowan AP, and Wale MCJ. Surveillance of antimicrobial resistance. BMJ 1998; 317:614-615.
Lunn DJ, Thomas A, Best N and Spiegelhalter D. WinBUGS - A Bayesian modeling framework: Concepts, structure, and extensibility. Stat Comput 2002; 10:325-337.
McEwen SA and Fedorka-Cray PJ. Antimicrobial Use and Resistance in Animals. Clin Infect Dis 2002; 34:S93.
Metzler CM and DeHaan RM. Susceptibility Tests of Anaerobic Bacteria: Statistical and Clinical Considerations. J Infect Dis 1974; 130:588-594.
Murray PR, Zeitinger JR, and Krogstad DJ. Reliability of Disc Diffusion Susceptibility Testing. Infect Control 1982; 3:230-237.
Phillips I. The 1997 Garrod Lecture. The subtleties of antibiotic resistance. J Antimicrob Chemother 1998; 42:5-12.
Rao S, Donkersgoed JV, Bohaychuk V, Besser T, Song XM, Wagner B, Hancock D, Renter D, Dargatz D, and Morley PS. Antimicrobial Drug Use and Antimicrobial Resistance in Enteric Bacteria Among Cattle from Alberta Feedlots. Foodborne Path Dis 2009; 7:449-457.
Sautter RL and Denys GA. Comparison of BIOGRAM and commercial microdilution antimicrobial susceptibility test systems. J Clin Microbiol 1987; 25:301-304.
Simjee S, Silley P, Werling HO, and Bywater R. Potential confusion regarding the term 'resistance' in epidemiological surveys. J Antimicrob Chemother 2008; 61:228-229.

110
Shyrock TR, White DW, Staples JM, and Werner CS. Minimum inhibitory concentration breakpoints and disk diffusion inhibitory zone interpretive criteria for tilmicosin susceptibility testing against Pasteurella spp. associated with bovine respiratory disease. J Vet Diagn Invest 1996; 8:337-344.
The Alliance for the Prudent Use of Antibiotics (APUA). Executive Summary: Global Antimicrobial Resistance Alerts and Implications. Clin Infect Dis 2005; 41: S221-S223.
Thrusfield M. Veterinary Epidemiology, 3rd ed. Blackwell Science Ltd: Oxford, 2005.
Toft N, Jorgensen E, and Hojsgaard SR. Diagnosing diagnostic tests: evaluating the assumptions underlying the estimation of sensitivity and specificity in the absence of a gold standard. Prev Vet Med 2005; 68:19-33.
Varaldo PE. Antimicrobial resistance and susceptibility testing: an evergreen topic. J Antimicrob Chemother 2002; 50:1-4.
Vieira AR, Wu S, Jensen LB, Dalsgaard A, Houe H, Wegener HC, Lo Fo Wong DM, and Emborg HD. Using data on resistance prevalence per sample in the surveillance of antimicrobial resistance. J Antimicrob Chemother 2008; 62:535-538.
Wassenaar TM and Silley P. Antimicrobial resistance in zoonotic bacteria: lessons learned from host-specific pathogens. Anim Health Res Rev 2008; 9:177-186.
Watts JL, Yancey RJ, Salmon SA, and Case CA. A 4-year survey of antimicrobial susceptibility trends for isolates from cattle with bovine respiratory disease in North America. J Clin Microbiol 1994; 32:725-731.
Welsh R, Dye L, Payton M, and Confer A. Isolation and antimicrobial susceptibilities of bacterial pathogens from bovine pneumonia: 1994--2002. J Vet Diagn Invest 2004; 16:426-431.
Williams RJ. Globalization of Antimicrobial Resistance: Epidemiological Challenges. Clin Infect Dis 2001; 33:S116-S117.
Woolfrey BF, Fox JM, Quall CO, and Lally RT. Error rates associated with the use of recently proposed breakpoints for testing Pseudomonas aeruginosa versus gentamicin, tobramycin, and amikacin by the standardized disk agar diffusion test. Antimicrob Agents Chemother 1983; 24:764-770.

111
CHAPTER 4: Associations between parenteral antimicrobial use and antimicrobial resistance in Escherichia coli sampled
from individual feedlot cattle
Katharine M. Benedict1, Sheryl P. Gow2, Calvin W. Booker3,
Tim A. McAllister4, and Paul S. Morley1.
1Animal Population Health Institute, Colorado State University, Fort Collins, CO 80523-
1654, USA;
2Laboratory of Foodborne Zoonoses, Public Health Agency of Canada, University of
Saskatchewan, Saskatoon, SK, S7N 5B4, Canada;
3Feedlot Health Management Services, Okotoks, AB, T1S 2A2, Canada;
4Lethbridge Research Center, University of Lethbridge, Lethbridge, AB, T1J
4B1, Canada.

112
INTERPRETIVE SUMMARY The veterinary and public health sectors are both interested in the prevalence of
antimicrobial resistance in food producing animals. The former has interests in the
efficacy of antimicrobial drugs in managing these animals as well as the concerns of the
latter. The public health sector hypothesizes that the exposures to antimicrobials in food
producing animals detrimentally affects the susceptibility to antimicrobials in humans.
Tracing the probabilities of persistence and dissemination of resistance from food-
producing animals to humans is beyond the scope of this project. However, this project
does evaluate one of the first steps in this transmission possibility; the development of
resistance. Not only is the prevalence of antimicrobial resistance important, but also the
associations or lack of associations between resistance and exposures to antimicrobial
drugs.
This project directly evaluated these associations in feedlot cattle by tracking all
exposures to parenteral antimicrobial drugs between time points when samples were
collected, cultured, and tested for susceptibility to panels of antimicrobial drugs. Due to
the intensive management of feedlot cattle in groups or pens, the antimicrobial pressures
applied to an individual in one of these pens might logically apply pressure to other
individuals in that pen. Therefore, exposures were tracked for individuals as well as
calculated on a pen-level basis to evaluate an ecological exposure to antimicrobials in this
environment. Accurately evaluating the complex relationships between antimicrobial use
and resistance has always been challenging with the limited techniques that are available
to analyze this type of data. Two different analytical approaches were used in this project

113
to explore options for surveillance programs. One of these two approaches was found to
be appropriate and useful, while the other lacked interpretable results.

114
ABSTRACT Objectives: The objectives of this study were to 1) estimate the prevalence of
antimicrobial resistance in the study population and 2) to investigate the associations
between exposures to parenteral antimicrobial drugs and antimicrobial resistance in fecal
non-type specific E. coli (NTSEC) recovered from individual feedlot cattle.
Materials and Methods: Two-stage random sampling was used to identify cattle for
enrollment at 4 western Canadian feedlots. A fecal sample was collected per rectum
from each individual at arrival and at a second sampling point around mid-feeding period
when cattle were rehandled as part of standard production practices. From samples
collected at this second time point, a total of 2,133 NTSEC isolates were tested for
susceptibility to antimicrobial drugs by disk diffusion. Parenteral exposures to
antimicrobial drugs were recorded for each individual enrolled in the study as well as for
other animals in the same pen. The least square means estimates and 95% confidence
intervals for the prevalence of resistance at each time point were modeled using Poisson
regression. Multivariable logistic regression modeling was used to investigate
associations between antimicrobial resistance and exposure to antimicrobial drugs.
Regression models were adjusted for clustering of observations among individuals and
pens.
Results: The most common resistances identified in arrival samples were sulfisoxazole
(7.5%; 95%CI: 6.1-9.2), streptomycin (7.7%; 95%CI: 6.3-9.5) and tetracycline (20.0%;
95%CI: 17.7-22.6). At the second sampling point, resistance prevalence was 25.6%

115
(95%CI: 23.5-28.0) for sulfisoxazole, 25.0% (95%CI: 22.8-27.3) for streptomycin, and
72.7% (95%CI: 70.5-75.1) for tetracycline. Regression modeling identified an
association between exposures to tetracyclines with antimicrobial resistance to
tetracycline at the second time point. Exposures to other classes of drug were not
associated with increased resistance.
Conclusions: Parenteral exposures to antimicrobial drugs in feedlot cattle did not drive
resistance at mid-feeding period.

116
INTRODUCTION
Though the development mechanisms and factors associated with antimicrobial
resistance are complex and multifactorial, exposure to antimicrobial drugs is considered a
large contributor to the overall burden of resistance (Witte 2000; Levy and Marshall
2004). Specifically, exposures to antimicrobial drugs in agricultural populations and the
associations with resistance dissemination ultimately to human populations are of
particular concern (Phillips et al. 2004; Barton 1998; McGeer 1998; Angulo et al. 2004).
However, associations between exposure to antimicrobial drugs and resistance need to be
characterized accurately before risk assessments of identified associations can be pursued
(McDermott et al. 2002). Surveillance studies of antimicrobial resistance in populations
of swine, poultry, and cattle have described varying levels of resistance, differences in
exposure to antimicrobial drugs and management practices, and associations as well as
lack of associations between resistance and exposures to antimicrobial drugs (Thibodeau
et al. 2008; Akwar et al. 2008; Checkley et al. 2008). Additionally, temporal trends have
been found that show certain antimicrobials may only be associated in a transient fashion
(Platt et al. 2008; Lowrance et al. 2007). Continuous surveillance studies are needed to
monitor changes in resistance prevalence and potential associations with exposures to
antimicrobial drugs for the collective health of humans and animals (Aarestrup 2005).
Challenges in conducting antimicrobial resistance surveillance studies are
numerous (Caprioli 2000). Quantifying exposures to antimicrobial drugs in a manner
that accurately represents selection pressures is deceptively complex (Singer et al. 2006).
Outcome measures of susceptibility testing can be presented in continuous or categorical
representations, but the differences in detection abilities between these measures is

117
unknown. Further, analytic techniques for modeling these measures have inherent
shortcomings. While exploring the possible analytical approaches to these data, the
objectives of this study were to estimate the resistance prevalence and to investigate the
associations between exposures to parenteral antimicrobial drugs and resistance in fecal
non-type specific E. coli (NTSEC) recovered from individual feedlot cattle.
118
MATERIALS AND METHODS Overview—All individual and pen-level exposures to parenteral antimicrobial drugs
were summarized between 2 time points when fecal samples were collected from
individual feedlot cattle. These samples were cultured for isolates of non-type specific E.
coli (NTSEC), which were tested for susceptibility to panels of antimicrobial drugs.
Resistance to each tested antimicrobial was evaluated separately for associations with
exposures to different classes of antimicrobials in regression models.
Study Population— All animal handling and sampling procedures were approved prior
to the initiation of the study by the Animal Care Committee of Feedlot Health
Management Services (FHMS) and the Institutional Animal Care and Use Committee of
Colorado State University.
Cattle (n=5,913) enrolled in this study were managed at 4 western Canadian
feedlots in south central Alberta under production conditions typical of those used at
large commercial cattle feedlots throughout western Canada and the U.S. Feedlots had
one-time capacities between 15,000 and 20,000 animals, with pens capable of housing
50-350 animals. All feedlots had modern cattle handling facilities. Commercial feedlots
were purposively selected for participation based on willingness to participate, and their
ability to collect data about exposures to antimicrobial drugs for individual animals.
Candidate animals utilized in the study were procured through the auction market
system across western Canada. Various cattle types were fed at these feedlots over the 3
years including cattle of various entry weights, age classes (calves and yearlings), frame
sizes, sources (e.g., ranch-direct cattle and back-grounded cattle), and genders (bulls,

119
steers and heifers). Cattle entering these feedlots typically weighed 500-900 pounds,
were managed in the feedlot for 120-250 days, and were slaughtered when body weights
reached 1,250-1,400 pounds.
All animals enrolled in the study were subject to standardized animal health
management and feedlot production procedures as per the protocols developed by health
and production consultants (FHMS). In brief, each animal received a unique
identification ear tag, a growth implant, vaccines to selected bacteria and viruses, and
topical avermectin anthelmintic for internal and external parasite control. In animals
determined to have a higher risk of developing respiratory disease, a parenteral
antimicrobial drug was administered as part of the prevention strategies for bovine
respiratory disease (Table 1). Water and standard feedlot diets were offered ad libitum
throughout the feeding period; rations were formulated to meet or exceed the National
Research Council nutritional requirements for feedlot cattle.
Sampling Procedures—Animals were allocated to the study from September 17, 2007 to
January 16, 2010. A 2-stage random sampling plan was used to determine which pens and
animals within those pens were selected for enrollment. During the enrollment period, 30% of
all new pens of cattle were randomly selected for inclusion in the study using a pen
randomization table. Within each selected pen, 10% of all animals in that pen were then
randomly enrolled in the study at initial processing using an individual animal randomization
table.
Individual animals enrolled in the trial were sampled twice over the course of the
study: during initial processing shortly after arrival to the feedlot and in the middle of the

120
feeding period when cattle were re-handled as part of standard feedlot protocols (e.g. for
replacement of hormonal implants). At each sampling date, all animals had a
nasopharyngeal swab sample and a fecal sample collected per rectum. The
nasopharyngeal sample was collected in the deep pharynx using a commercially available
double guarded swab (# J273, Jorgensen Laboratories, Inc, Loveland, CO, USA). A Cary
Blair media tube (BBL CultureSwab™, CA90001-038, VWR International, Mississauga,
Ontario) was used to transport the nasopharyngeal swab. Individual fecal samples were
collected per rectum using a new plastic palpation sleeve. A minimum of 4 grams of
feces from the rectum of each animal was transferred into a vial containing modified
Cary Blair transport media (Enteric Transport Medium, 15 ml, Dalynn Biologicals Inc.)
(Alexander et al. 2009). All individual animal samples were labeled with the date and a
unique study number linked to that animal. Samples were refrigerated in a chilled cooler
and transported to the microbiology lab (Agriculture and Agri-Food Canada Lethbridge
Research Station, Lethbridge, Alberta) for further processing by overnight courier. Each
sample collected over the course of the trial was assigned a unique identification number
to ensure blinding of the laboratory staff and uniform labeling of samples.
Laboratory Procedures— To optimize study efficiency regarding the relationship
between resistance in NTSEC and M. haemolytica for a separate project, only fecal
samples recovered from animals that also had M. haemolytica isolates recovered from
their nasopharyngeal swabs were cultured for NTSEC. Manure samples were processed
immediately after overnight delivery to the microbiology laboratory. The feces were
mixed with the Cary-Blair transport medium to create a uniform slurry (Alexander et al.

121
2009). A sterile cotton swab was immersed completely into the sample and then streaked
onto a MacConkey Agar (MAC) plate. Plates were incubated overnight at 37ºC. After
24 hours of incubation, the MAC plates were removed from the incubator and examined
for lactose-fermenting (pink) colonies with morphology typical of NTSEC. Using aseptic
technique, up to 3 colonies were selected and streaked onto fresh Lysogeny Broth (LB)
plates and incubated at 37ºC overnight. Using a single colony from each LB plate, an
indole test was performed and isolates determined as presumed-NTSEC (lactose-
fermenting, indole-positive) were stored in 30% glycerol stocks at -80ºC until further
characterization.
Antimicrobial Susceptibility Testing—Each NTSEC isolate included in this analysis was
tested for susceptibility to a standardized panel of antimicrobial drugs by disk diffusion.
The antimicrobial drugs included in this panel were ampicillin, amoxicillin-clavulanate,
ceftazidime, ceftiofur, enrofloxacin, sulfisoxazole, florfenicol, neomycin, streptomycin,
trimethoprim-sulfamethoxazole, and tetracycline. Ceftazidime-clavulanate was also
included in the panel for a separate project investigating occurrence of extended spectrum
beta lactamases. Due to interruptions in the availability of antimicrobial discs for
ceftazidime-clavulanate, not all isolates were tested for susceptibility to this antimicrobial
drug. The antimicrobial testing procedures were conducted according to protocols of the
Clinical Laboratory Standards Institute (CLSI 2008). Quality control strains used were
Escherichia coli ATCC 25922, Streptococcus pneumoniae ATCC 49619, and
Staphylococcus aureus ATCC 29213.

122
Interpretive criteria— Susceptible, intermediate, and resistant (SIR) designations of M.
haemolytica were determined using CLSI guidelines for ampicillin (2002) and
oxytetracycline (2006). Interpretive criteria for E. coli were also obtained from CLSI
guidelines (2005), except for streptomycin, which were based on those used by the
Canadian Integrated Program for Antimicrobial Resistance Surveillance (CIPARS) and
the National Antimicrobial Resistance Monitoring System (NARMS, CDC 2003).
Antimicrobial Use Data—Individual animal exposure data regarding antimicrobial
drugs were recorded at each feedlot over the course of the study using a chute-side
computer system (iFHMS, Okotoks, Alberta). Exposures were also recorded for animals
not enrolled in the study, but housed in the same pen as study animals. These data
included the product used, the dose, and the date of administration. All study data were
subsequently compiled, collated in a computer spreadsheet and verified. In-feed
antimicrobials, ionophores, and coccidiostats were not included in this analysis.
Data Analysis—To facilitate further analysis involving logistic regression, isolate
susceptibility was dichotomized as resistant and non-resistant (which included both
intermediate and susceptible classifications). Dosage information for exposures to
antimicrobial drugs was converted into an Animal Defined Daily Dose (ADD). The
ADD metric represents the number of days of treatment for an animal based on an
assumed average maintenance dosage. Dosage conversion to ADD was based on the
expected length of drug effect as indicated by approved dosages (Table 1). Aggregate
(pen-level) exposures to antimicrobial drugs accounted for the number of animals

123
receiving the drug in a pen as well as the total number of animals in the pen. This density
of exposure in a pen represented the ecological pressure beyond individual exposure to
antimicrobial drugs. All exposures to antimicrobial drugs between arrival and the second
sampling point were summarized for individuals by class of antimicrobial drug and by
exposure context (individual or pen-level).

124

125
Descriptive Analysis— Data were evaluated graphically and by calculating descriptive
statistics (Tables 2-4). The least square means estimates and 95% confidence intervals
for the prevalence of resistance at arrival and >60DOF were modeled using Poisson
regression (Figure 1). Regression analysis using generalized estimating equation
methods was used to correct prevalence estimates for lack of independence associated
with multiple isolates recovered from the same individual and with multiple isolates
recovered from individuals within the same pen. Compound symmetry (exchangeable)
correlation structures nested unique sets of isolates from individuals within each unique
group (pen) of cattle. Sampling point (arrival or >60DOF) was used as the predictor
variable of interest for these analyses, and separate models were developed to estimate
resistance prevalence for 11 of the 12 antimicrobial drugs evaluated. It was not possible
to estimate the prevalence of isolates resistant to ceftazidime-clavulanate, as interpretive
criteria for this drug are not available.
For presentation, individual parenteral exposures to antimicrobial drugs were
further summarized into 3 sub-periods between the arrival and the >60DOF sampling
points. Period 1 included exposures to a class of antimicrobial drugs within the 3 days
prior to the >60DOF sampling point. Period 2 included exposures to a class of
antimicrobial drugs between 4 and 14 days prior to the >60DOF sampling point. Period
3 included exposures to a class of antimicrobial drugs beyond 14 days prior to the
>60DOF sampling point. If exposures exceeding a single day were given just prior to a
period cutoff, the amount of ADDs attributed to each period were summarized separately
and included only in their respective categories (Table 5). Pen-level parenteral exposures

126
were presented as the average ADD exposure per individual and the average ADD
exposure in the risk period based on an average risk period of 101.5 days (Table 6).
Table 2: Number of antimicrobials drugs to which non-type specific E. coli isolates were resistant from individual feedlot cattle sampled at arrival (n=1663) and > 60 days on feed (>60DOF) (n=2133). Estimates were not adjusted for lack of independence between isolates sampled from the same individuals and between individuals from the same pens of cattle.
Resistance Number Arrival Percent Resistance (Frequency)
>60DOF Percent Resistance (Frequency)
Pan-Susceptible 76.5% (1272) 25.4% (541)
1 12.9% (215) 37.9% (808) 2 3.9% (65) 16.7% (357) 3 4.8% (80) 12.8% (273) 4 1.1% (19) 5.1% (108) 5 0.5% (8) 1.8% (38) 6 0.2% (3) 0.2% (5) 7 0.0% (0) 0.1% (1) 8 0.0% (0) 0.1% (2) 9 0.1% (1) 0.0% (0)
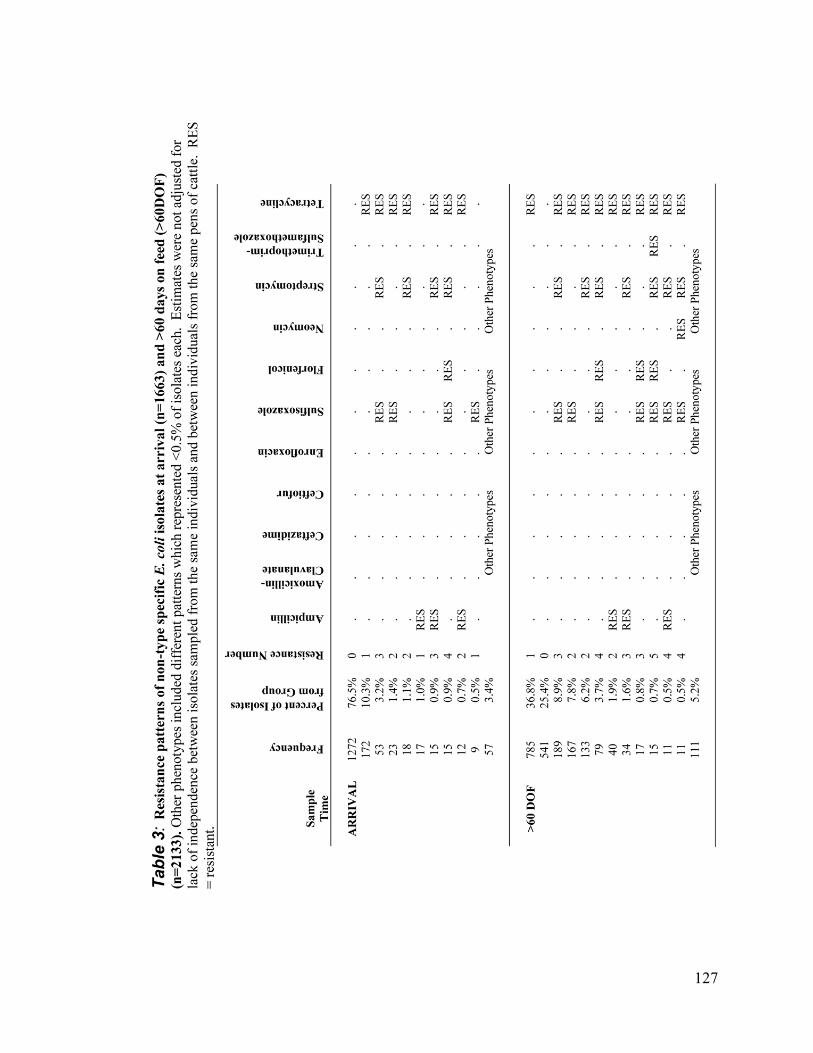
127

128

129
Figure 1: Prevalence of resistance. Adjusted for individual and pen effects, least square means estimates of the prevalence of resistance to various antimicrobial drugs among non-type specific E. coli isolates obtained from individual fecal samples at arrival (n=1663) and at >60 days on feed (>60DOF) (n=2133). Error bars represent 95% confidence intervals *Least square mean prevalences of resistance varied significantly (p<0.05) between arrival and >60DOF adjusted resistance prevalences.
0%
10%
20%
30%
40%
50%
60%
70%
80%
90%
100%
Ampi
cillin
*
Amox
icillin
-cla
vulan
ate
Ceftazid
ime
Ceftiofu
r
Enrof
loxacin
Sulfis
oxaz
ole*
Florfe
nico
l*
Neomyc
in*
Strept
omyc
in*
Trimet
hopr
im-s
ulfam
etho
xazo
le*
Tetra
cycli
ne*
Antimicrobial Drugs
Per
cen
tag
e R
esis
tan
ce
Arrival >60DOF

130
Table 5: Parenteral exposure to antimicrobials in sampled individuals (n=1048). The total amount of antimicrobials administered for each period and for the total risk period is quantified as Animal Defined Daily Dose (ADD). DOF = Days on feed.
Days prior to >60DOF sampling point
Total Risk Period
0-3 4-14 >14 n (pct) n (pct) n (pct) n (pct)
Class of Antimicrobial Sum ADD Sum ADD Sum ADD Sum ADD
Beta lactam 0 (0.0%)0.0
2 (0.2%)6.0
14 (1.3%) 28.0
16 (1.5%)34.0
Macrolide 0 (0.0%)0.0
0 (0.0%)0.0
192 (18.3%) 522.1
192 (18.3%)522.1
Phenicol 0 (0.0%)0.0
1 (0.1%)3.0
14 (1.3%) 42.0
15 (1.4%)45.0
Quinolone 0 (0.0%)0.0
0 (0.0%)0.0
4 (0.4%) 12.0
4 (0.4%)12.0
Sulfonamide 0 (0.0%)0.0
0 (0.0%)0.0
3 (0.3%) 9.0
3 (0.3%)9.0
Tetracycline 0 (0.0%)0.0
0 (0.0%)0.0
271 (25.9%) 778.0
271 (25.9%)778.0
Table 6: Exposure to parenteral antimicrobials in pens. Sampled individuals (n=1048) were housed in pens (n =241) which included a total of 48,216 animals each averaging 101.5 risk days. ADD = Animal Defined Daily Dose.
Class of
Antimicrobial Pens Exposed (pct) Average in Exposed Pens
ADD per Animal ADD Per Animal - day
Beta lactam 155 (64.3%) 0.0561 0.0006 Macrolide 133 (55.2%) 0.7301 0.0072
Phenicol 66 (27.4%) 0.0712 0.0007 Quinolone 77 (32.0%) 0.0429 0.0004
Sulfonamide 117 (48.5%) 0.0342 0.0003 Tetracycline 158 (65.6%) 1.1209 0.0110

131
Multivariable Regression Analysis—Separate logistic multivariable models for each
antimicrobial drug were built using backward elimination and commercially available
softwarea. The associations between exposure to antimicrobial drugs and resistance were
examined through 10 logistic models and 12 linear models. In order to analytically
control for the potential lack of independence associated with grouped housing, group
exposures, etc., unique sets of isolates from individuals were nested within each unique
group (pen) of cattle using generalized estimating equation methods. A compound
symmetry (exchangeable) correlation structure accounted for the lack of independence
with repeated measures from individuals and pens.
The predictor variables for the multivariable logistic were the totals of the
antimicrobial drug exposure summaries. Predictor variables (12 total) for parenteral
exposure to antimicrobial drugs were summarized by drug classes (beta lactams,
macrolides, phenicols, quinolones, tetracyclines, and sulfonamides) for each exposure
context (individual or aggregate). Exposures to in-feed antimicrobial drugs, ionophores
and coccidiostats were not included as potential predictors of antimicrobial resistance.
The outcome for logistic models was the phenotypic resistance or non-resistance
of each NTSEC isolate for each antimicrobial drug tested. Variables were initially
screened in univariable models to determine which ones would be included in
multivariable model building using a critical alpha for inclusion of 0.25. Backward
selection was then used to identify final multivariable models using a critical alpha of
0.05. Final models were assessed for confounding by adding previously eliminated
variables one at a time and evaluating the change in the estimates of the remaining model
variables. If the estimate of a single remaining variable changed by greater than 20%, or

132
if estimates of multiple remaining variables changed by greater than 15%, the
confounding variable was forced into the model. First order interactions of all main
effects were forced into the model based on a critical alpha of 0.05. Any variables
displaying characteristics of instability (extreme estimates or confidence intervals) were
removed from the final model. Odds ratios, 95% confidence intervals (95%CI), and the
associated P-values were reported for logistic regression.

133
RESULTS A total of 3,796 NTSEC isolates originating from 1,855 individuals in 278 pens
were included in this analysis. Of these, 1,663 (43.8%) isolates from 807 individuals in
205 pens were recovered from samples collected at arrival and 2,133 (56.2%) isolates
from 1048 individuals in 241 pens were recovered from samples collected at the second
time point, >60DOF.
Antimicrobial Resistance Most arrival isolates (76.5%, 1272/1663) were pan-susceptible to all antimicrobial
drugs tested (Table 2). Only 12.9% (215/1663) of arrival isolates were resistant to a
single antimicrobial drug, most of which were single resistances to tetracycline (10.3%,
172/1663) (Table 3). The most common multiple resistance (≥ 2 antimicrobial drugs) in
arrival isolates were combinations of sulfisoxazole, streptomycin, and tetracycline.
Fewer (25.4%, 541/2133) isolates collected at >60DOF were pan-susceptible to the panel
of antimicrobial drugs tested (Table 2). A greater proportion (37.9% (808/2133) of
>60DOF isolates were resistant to a single antimicrobial drug, which was also most
commonly resistance to tetracycline (36.8%; 785/2133) (Table 3). The top 4 resistance
patterns in arrival and >60DOF isolates were the same combinations of sulfisoxazole,
streptomycin, and tetracycline. Accounting for a lack of independence between isolates
from the same individual and individuals from the same pen, the adjusted resistance
prevalence in arrival isolates for sulfisoxazole was 7.5% (95%CI: 6.1-9.2), for
streptomycin was 7.7% (95%CI: 6.3-9.5) and for tetracycline was 20.0% (95%CI: 17.7-
22.6) (Figure 1). At the >60DOF sampling point, the adjusted resistance prevalence was

134
25.6% (95%CI: 23.5-28.0) for sulfisoxazole, 25.0% (95%CI: 22.8-27.3) for streptomycin,
and 72.7% (95%CI: 70.5-75.1) for tetracycline. All other antimicrobial drugs tested had
resistance prevalences <10% at both sampling points.
Antimicrobial Drug Use In this population, individual parenteral treatment with beta lactams, phenicols,
quinolones, and sulfonamides was uncommon (Tables 5 and 6). Tetracyclines and
macrolides were the most commonly used classes of drug. Aggregate exposures to
parenteral drugs occurred in many of the pens, but amounted to very few ADD per
animal relative to the individual exposures. Almost all exposures to parenteral
antimicrobial drugs occurred shortly after arrival to the feedlot (i.e. preceded >60DOF
sampling by many days in period 3).
Logistic Regression Ecological (group-level) parenteral exposures were not associated with resistance
in NTSEC isolates of the tested animals (Table 7). For every additional dose (3 ADD) of
tetracycline given parenterally to an individual, the odds of resistance to tetracycline
increased by 3.51 (95% CI: 1.37-8.99). For every additional dose (3 ADD) of beta
lactam given parenterally to an individual, the odds of resistance to streptomycin was
lower (Odds Ratio: 0.17, 95%CI: 0.01-2.96). Parenteral exposure to macrolides,
phenicols, quinolones, and sulfonamides were not associated with differences in the
prevalence of antimicrobial resistance. Complex relationships between exposures to
antimicrobial drugs and resistance were identified. Exposures to tetracyclines on the pen-

135
level confounded the association between individual exposures to tetracyclines and
tetracycline resistance. Additionally, the individual exposure to sulfonamides
confounded the protective association between individual exposure to beta lactams and
streptomycin resistance.
Table 7: Final multivariable logistic models of associations between parenteral drugs and antimicrobial resistance. The odds ratios and 95% confidence intervals are presented in terms of 3 ADD or 1 treatment of parenteral antimicrobials assuming a 3 day treatment period. Italics indicate confounders that were controlled in the analyses.
Outcome Variable
Predictor Variable Odds Ratio
95% Confidence Interval
P-value
Tetracycline Individual Tetracycline 3.51 1.37 8.99 0.01 Pen-level Tetracycline 0.11
Streptomycin Individual Beta lactam 0.17 0.01 2.96 0.02 Individual Sulfonamide 0.19

136
DISCUSSION
Results of this study indicate that parenteral exposures to antimicrobial drugs in
feedlot cattle did not drive resistance at mid-feeding period. Individual and ecological
exposures to these drugs were not associated with increased resistance. The one
exception to this was the individual parenteral exposure to tetracyclines which was
positively associated with resistance to tetracycline in E. coli at mid-feeding period.
Tetracyclines were one of the most common antimicrobial drugs used in this population
which is not necessarily the case in other feedlots. Other studies have found both
transient and temporal trends with tetracycline resistance in feedlot cattle in the absence
of exposure to antimicrobials (Morley et al. 2011). Additionally, confounding factors
unmeasured in this study such as environmental and management pressures likely
contribute to this relationship (Berge et al. 2010; McDermott et al. 2002; Barbosa and
Levy 2000). Even if causality was supported, this finding may lack practical significance
in terms of important resistance among pathogenic bacteria since tetracyclines continue
to be efficacious in feedlot populations for prevention and treatment of bovine respiratory
disease, prevention of histophilosis, and liver abscess control.
Using logistic regression to analyze antimicrobial resistance data is heavily
dependent on interpretive criteria used to classify bacteria as resistant or susceptible, and
thus models may change if more liberal or conservative criteria are suggested. In
surveillance of antimicrobial resistance, epidemiologic cutoffs are often much lower than
clinical interpretive criteria, so a regression technique capable of detecting a more refined
change in resistance might be preferred (Bywater et al. 2006, Simjee et al. 2008). With
this capability, detection of changing trends in resistance prevalence could be detected

137
earlier. Regression of a continuous outcome rather than a categorized one would
theoretically provide more detailed information (Wagner et al. 2003). However, the
assumptions of linear regression could not all be strictly followed in these analyses. The
outcomes modeled in this study had distributions of zone diameters ranging from closely
normal (enrofloxacin) to bimodal (any antimicrobial drugs with resistance), or even a
lack of an identifiable distribution (tetracycline). Linear regression of the zone diameters
would be inappropriate since the distributions are non-Gaussian. Additionally, a 1mm
difference in zone diameter at the top of the scale (35mm vs. 36mm) and a 1 mm
difference at the bottom of the scale (7mm vs. 8mm) are not equivalent. This is to say
that though zone diameter measurements are continuous, they are not interval data. A
log-transformation of the zone diameter did not remedy the relationship between each
zone diameter. Finally, a non-parametric rank analysis provided conservative levels of
significance as well as a reliable estimate indicating the direction of association.
However, the parameter estimates derived from analysis of rank-transformed data are not
interpretable in a biologically relevant manner as there is not a uniform difference in
susceptibility associated with a 1 unit increase in rank. Linear regression may be a more
precise analysis technique than logistic regression, but it did not practically make sense in
this data set to estimate the magnitude of associations.
Not all isolates in this study were pan-susceptible at the arrival sampling point.
Thus, the resistance status at arrival should ideally be controlled as a potential
confounding variable for the association between resistance at the second time point and
exposure to antimicrobial drugs. Isolates collected at the 2 sampling points in this study
were not necessarily from the same individuals. Initially, a subset analysis of only

138
isolates with matching resistance data from the 2 sampling points was used to investigate
the arrival resistance status as a covariate. However, this subset included less than 20%
of the full dataset. Another possible approach to including this covariate information for
the full collection of isolates at the second time point was attempted by categorizing the
arrival resistance status into 3 levels (resistant at arrival, non-resistant at arrival, and
resistance status unknown at arrival). Yet, little information was gained in this dataset
from this approach and no variables accounting for resistance at arrival were included in
the final models.
The lack of independence between isolates from the same individuals and
individuals from the same pen was expected to account for some of the variability in the
associations investigated in this study (Wagner et al. 2003b). Nested effects for
individuals and pens in this analysis allowed for adjustment to account for this lack of
independence between individuals and pens. The authors also expected the baseline
resistance status of each isolate as well as the extent of the association with exposures to
antimicrobial drugs to vary, so analysis with random intercepts and random slopes would
be intuitive. Additional variability due to the sampled individuals and pens would have
been accounted for with this methodology and models would have produced estimates
theoretically closer to the true estimates. The random coefficient models were not
possible with this particular data set because the models would not converge to produce
estimates of association. However, similar analyses to ours in the future should
investigate this possibility in other data sets in attempt to further characterize different
sources of variability.

139
Selection criteria for isolates and feedlots may have biased the conclusions of this
study. In an effort to test isolates efficiently within this surveillance program, fecal
samples were only cultured for NTSEC if M. haemolytica could be cultured from the
corresponding nasopharyngeal swab from the same individual. We do not anticipate that
there is a difference in resistance prevalence in NTSEC isolates between those cultured
from individuals positive for M. haemolytica and those negative for M. haemolytica.
However, this assumption should be investigated to support or refute a similar isolate
selection scheme for future surveillance programs. The 4 feedlots sampled in this study
were purposefully selected since they had existing data collection instruments (iFHMS).
Likely, these feedlots were progressive in more than just their data collection abilities
which would contribute to a selection bias. However, for the purpose of developing a
surveillance program in feedlot cattle, the design and implementation of this study was
valid for evaluating possible sampling, laboratory, and analysis procedures.
FOOTNOTES a SAS version 9.2, SAS Institute Inc, Cary, NC

140
REFERENCES Aarestrup FM. Veterinary Drug Usage and Antimicrobial Resistance in Bacteria of
Animal. Basic Clin Pharmacol Toxicol 2005; 96:271-281.
Akwar HT, Popper C, Wilson J, Reid-Smith RJ, Dyck M, Waddingon J, Shang D, and McEwen SA. Associations of antimicrobial uses with antimicrobial resistance of fecal Escherichia coli from pigs on 47 farrow-to-finish farms in Ontario and British Columbia. Can J Vet Res 2008; 72:202-210.
Alexander TW, Booker CW, Gow SP, Read RR, and McAllister TA. Recovery of antimicrobial-resistant Escherichia coli after storage of bovine feces in Cary-Blair medium. Can J Microbiol 2009; 55:1224-1227.
Angulo FJ, Nargund VN, and Chiller TC. Evidence of an Association Between Use of Anti-microbial Agents in Food Animals and Anti-microbial Resistance Among Bacteria Isolated from Humans and the Human Health Consequences of Such Resistance. J Vet Med B Infect Dis Vet Public Health 2004; 51:374-379.
Barbosa TM, and Levy SB. The impact of antibiotic use on resistance development and persistence. Drug Resist Updat 2000; 3:303.
Barton MD. Does the use of antibiotics in animals affect human health? Aust Vet J 1998; 76:177-180.
Berge AC, Hancock DD, Sischo WM, and Besser TE. Geographic, farm, and animal factors associated with multiple antimicrobial resistance in fecal Escherichia coli isolates from cattle in the western United States. J Am Vet Med Assoc 2010; 236:1338-1344.
Bywater R, Silley P, and Simjee S. Antimicrobial breakpoints--Definitions and conflicting requirements. Vet Microbiol 2006; 118:158-159.
Caprioli A, Busani L, Martel JL, and Helmuth R. Monitoring of antibiotic resistance in bacteria of animal origin: epidemiological and microbiological methodologies. Int J Antimicrob Agents 2000; 14:295-301.
Checkley SL, Campbell JR, Chirino-Trejo M, Janzen ED, and McKinnon JJ. Antimicrobial resistance in generic fecal Escherichia coli obtained from beef cattle on arrival at the feedlot and prior to slaughter, and associations with volume of total individual cattle antimicrobial treatments in one western Canadian feedlot. Can J Vet Res 2008; 72:101-108.

141
Levy SB and Marshall B. Antibacterial resistance worldwide: causes, challenges and responses. Nat Med 2004; 10:S122-S129.
Lowrance TC, Loneragan GH, Kunze DJ, Platt TM, Ives SE, Scott HM, Norby B, Echeverry A, and Brashears MM. Changes in antimicrobial susceptibility in a population of Escherichia coli isolated from feedlot cattle administered ceftiofur crystalline-free acid. Am J Vet Res 2007; 68:501-507.
McDermott P, Zhao S, Wagner D, Simjee S, Walker R, and White D. The food safety perspective of antibiotic resistance. Anim Biotech 2002; 13:71-84.
McGeer AJ. Agricultural antibiotics and resistance in human pathogens: Villain or scapegoat? CMAJ 1998; 159:1119-1120.
Morley PS, Dargatz DA, Hyatt DR, Dewell GA, Patterson G, and Wittum TE. Effects of Restricted Antimicrobial Exposure in Feedlot Cattle on Antimicrobial Resistance in Enteric Bacteria. Foodborne Pathog Dis 2011; 8:1-12.
Phillips I, Casewell M, Cox T, De Groot B, Friis C, Jones R, Nightingale C, Preston R, and Waddell J. Does the use of antibiotics in food animals pose a risk to human health? A critical review of published data. J Antimicrob Chemother 2004; 53:28-52.
Platt TM, Loneragan GH, Scott HM, Norby B, Thomson DU, Brown MS, Ives SE, and Brashears MM. Antimicrobial susceptibility of enteric bacteria recovered from feedlot cattle administered chlortetracycline in-feed. Am J Vet Res 2008; 69:988-996.
Simjee S, Silley P, Werling HO, and Bywater R. Potential confusion regarding the term 'resistance' in epidemiological surveys. J Antimicrob Chemother 2008; 61:228-229.
Singer RS, Reid-Smith RJ, and Sischo WM. Stakeholder position paper: Epidemiological perspectives on antibiotic use in animals: Animal Antimicrobial Use Data Collection in the United States: Methodological Options. Prev Vet Med 2006; 73: 153-161.
Thibodeau A, Quessy S, Guevremont E, Houde A, Topp E, Diarra MS, and Letellier A. Antibiotic resistance in Escherichia coli and Enterococcus spp. isolates from commercial broiler chickens receiving growth-promoting doses of bacitracin or virginiamycin. Can J Vet Res 2008; 72:129-136.
Wagner BA, Dargatz DA, Morley PS, Keefe TJ, and Salman MD. Analysis methods for evaluating bacterial antimicrobial resistance outcomes. Am J Vet Res 2003a; 64:1570-1579.
Witte W. Ecological impact of antibiotic use in animals on different complex microflora: environment. Int J Antimicrob Agents 2000; 14:321-325.

142
CHAPTER 5: Conclusions

143
The collection of the 3 projects presented as part of this dissertation contributes to
a large, pilot surveillance program in Canada for the feedlot sector. Surveillance of
antimicrobial resistance is evolving as we learn more about the prevalence of resistances
to antimicrobial drugs and the many factors involved in the development, dissemination,
and persistence of resistance. Due to the large scale nature of these programs,
methodologies are necessary which are accurate, yet practical to implement. Sampling
and testing strategies must be representative, but not cost-prohibitive. Investigation into
the magnitude of associations between risk factors and resistance to antimicrobial drugs
will help to identify mitigation targets for reducing the burden of antimicrobial resistance.
The specific gaps in knowledge addressed, conclusions, and limitations of each project
are summarized below.

144
Project 1: Metrics for quantifying antimicrobial use in beef feedlots The primary objective of this project was to investigate the preferences of
stakeholders for reporting antimicrobial drug use data that are collected from beef
feedlots. Specifically, the goal of this survey was to identify a method for presenting
antimicrobial use data that is easily understood by user groups and that accurately
portrays drug use data in a meaningful and relevant way. Therefore, the current
knowledge gaps addressed by this project were:
Accurate quantification of antimicrobials
Optimization of methodology and standardization for surveillance programs
Project 1 Inference: Choosing an appropriate metric for reporting data regarding antimicrobial use is
deceptively complex.
Evaluation of the target audience is critical to clearly presenting and effectively
communicating information regarding antimicrobial use.
Metrics that are most accurate may need to be carefully and repeatedly explained to
the audience. Accuracy and clarity together are difficult to encompass in quantifying
antimicrobial use data.
Quantification of antimicrobial use with metrics which do not account for selection
pressures distorts discussion regarding the impact of antimicrobial use and cannot be
used to investigate antimicrobial resistance.

145
Ideally for antimicrobial resistance surveillance programs, a common quantification
metric or pairing of metrics would be used in all animal agribusinesses as well as
within the public health sector for more closely comparable estimates
The Animal Defined Daily Dose (ADDD) or a related metric in the form of a rate
(ADDD per 1000 animals) is recommended for quantifying antimicrobial use in
antimicrobial resistance surveillance programs.
Project 1 Limitations: Surveyed individuals were a convenience sample and the representativeness of the
sampled individuals to the theoretical target population of experts on antimicrobial
use and reporting in beef industry could not be validated.
If stakeholder groups which were not well represented in this study were included,
different distributions of responses might be expected.
Other metrics could be appropriate, depending on the purpose of the research, how
the data were collected, the organism being investigated for resistance to
antimicrobial drugs, and the antimicrobial drugs of interest.

146
Project 2: Evaluation of resistance classification accuracy by latent class analysis of data from disk diffusion and broth microdilution for Escherichia coli and Mannheimia haemolytica recovered from feedlot cattle.
The objective of this project was to compare estimates of the sensitivity and
specificity of disk diffusion and broth microdilution when used for identification of
antimicrobial resistance in non-type-specific E. coli and M. haemolytica recovered from
feedlot cattle. These parameters can be used to better estimate the true prevalence of
resistance for the combinations of organisms and antimicrobial drugs investigated.
Additionally, similarities or differences in accuracy between the 2 tests can aid
investigators in selecting the more practical or superior susceptibility test for surveillance
programs. Therefore, the current knowledge gap addressed by this project was:
Optimization of methodology and standardization for surveillance programs
Project 2 Inference: The ability of disk diffusion and broth microdilution susceptibility tests in correctly
classifying true resistance varies by the antimicrobial drug and organism of interest.
Non-resistance detected by both methods likely represents the true non-resistance
status in these populations, but more errors in the correct classification of true
resistance can be expected.
Misclassification of resistance to different antimicrobial drugs occurs at different
rates in the 2 organisms tested.

147
The predictive values calculated suggest that the expected level of resistance
prevalence may dictate a more or less appropriate test for some antimicrobial drugs.
Susceptibility testing by disk diffusion is recommended for surveillance programs
over broth microdilution since it provides comparable accuracy and is more cost-
effective.
Latent class analysis (no gold standard) techniques are useful for investigating
accuracy of susceptibility tests for surveillance programs.
Reference-based analysis (assuming broth microdilution as the gold standard) tended
to overestimate the proportion of correct resistance classification and underestimate
the proportion of correct non-resistance classification for disk diffusion (results not
shown).
Project 2 Limitations: Clinical breakpoints were used to designate resistance and non-resistance, so it is
possible that the tests would perform differently at other breakpoints or epidemiologic
thresholds.
The few antimicrobial drugs evaluated in this project were selected due to their
overlap between the two test panels and do not represent all drugs or drug classes.
The difference in the prevalence of resistance between the 2 sample sets necessary for
the analysis technique was small for some of the organism and drug combinations.
Therefore, the estimates for these antimicrobial drugs should not be considered
reliable.

148
The prior probability distributions (priors) used in these models were biased due to
design differences between this study and the studies which documented resistance
prevalence in similar populations. However, the priors were all weakly informative
and did not influence the models heavily.

149
Project 3: Associations between parenteral antimicrobial use and antimicrobial resistance in Escherichia coli sampled from individual feedlot cattle
The objectives of this study were to estimate antimicrobial resistance prevalence
and to investigate the associations between exposures to parenteral antimicrobial drugs
and antimicrobial resistance in fecal non-type specific E. coli recovered from individual
feedlot cattle. These estimates and associations can be used to document the prevalence
of antimicrobial resistance in feedlot cattle and the impact that antimicrobial drugs used
has on developing antimicrobial resistance. Therefore, the current knowledge gaps
addressed by this project were:
Prevalence of resistance in food-producing animals
Studies investigating direct associations between antimicrobial use and
resistance
Optimization of methodology and standardization for surveillance programs
Project 3 Inference: Antimicrobial resistance prevalences were relatively low in this population of feedlot
cattle, with the exception of tetracycline resistance at the second time point.
When controlling for lack of independence:
o Individual parenteral exposures to tetracyclines were associated with an
increase in resistance to tetracycline at mid-feeding period.
o Parenteral exposure to macrolides, phenicols, quinolones, and sulfonamides
were not associated with antimicrobial resistance.

150
o Parenteral exposures on the pen-level were not associated with antimicrobial
resistance.
Multivariable logistic regression is an appropriate and useful approach for evaluating
associations between resistance and exposures to antimicrobial drugs in surveillance.
Protective associations and confounding were identified and indicate complex
relationships between antimicrobial use and antimicrobial resistance.
Project 3 Limitations: Logistic regression analyses were based on clinical interpretive criteria. Resistance
estimates and associations with exposure may differ based on other interpretive
criteria.
In feed antimicrobials were administered in this population, but were not summarized
and included in the association models.
Random slopes and random intercepts could not be included in this analysis due to
lack of model convergence in this dataset.
Only non-type specific E. coli isolates sampled from individuals that were positive
for M. haemolytica were cultured and tested for susceptibility.
The resistance status of individuals at arrival could not be included as a covariate
since few arrival isolates could be matched to isolates from the second sampling point
(i.e. individuals sampled and tested at arrival were not the same individuals sampled
and tested at the second time point).
The 4 feedlots sampled in this study were purposefully selected which may contribute
to a selection bias.

151
APPENDIX 1: Survey Instrument

152

153

154

155

156

157
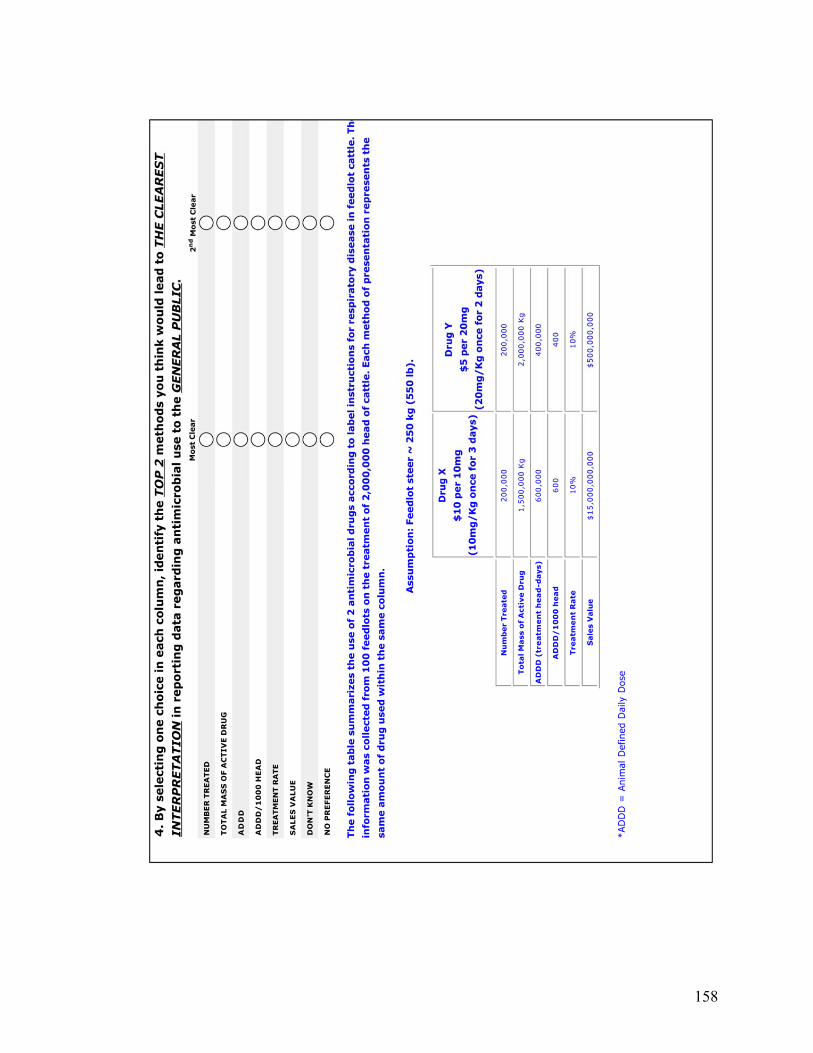
158

159

160

161

162

163

164

165

166
APPENDIX 2: Survey Instrument – Decline

167

168
APPENDIX 3: Nasopharyngeal Swab Sampling Protocol

169
TITLE: Nasopharyngeal Swab Sampling SOP NO.: 001
PROJECT MANAGER: Chelsea Flaig DVM: Dr. Calvin Booker
EFFECTIVE DATE: April 19, 2007 STUDY: FHMS-445
BACKGROUND
The following procedure applies when using the Jorgenson J273 swab for nasopharyngeal sampling.
COLLECTION EQUIPMENT AND SUPPLIES
i. Study label binder with pre printed labels
ii. Nasopharyngeal swabs.
iii. Transport media tubes.
iv. Blood transport carrying boxes
v. Gloves – all sizes.
vi. Eye protection for the collector
PROCEDURES
1. Store all unused swabs and transport media tubes at room temperature.
2. Each swab package consists of one single white nasopharyngeal swab, one clear inner swab sheath, one clear thick outer guard sheath, and two spare white end caps (which will not be used in this procedure).
3. Restrain the animal in the chute and secure the head tightly with the head gate. If the nasal cavity becomes bloody it is advised that you take the second sample through the opposite nostril.
4. Sampling can be performed using a single individual to both restrain the animal’s head and collect the sample. Additional individuals may be utilized if needed.
5. Gauge the approximate length of insertion of the swab by holding the swab against the animal’s head from the tip of the nostril to where the white capped end reaches the back of the jaw, below the ear. This distance will be approximately 10 to 14 inches, depending on the size of the animal. Remove the swab apparatus from the plastic package and grasp it with the free hand as close to the distance on the swab that was just measured.

170
6. Flatten the twist tie allowing it to move freely into the guard sheath. Firmly push the inner swab sheath through the white cap on the guard sheath until it breaks the seal on the end of the cap. Pull the swab sheath back into the guard sheath before insertion.
7. The individual should then face in the same direction as the animal. Using the arm and hand closest to the animal, secure the head by bending the head and neck toward the sample collector. This hand will also be used to guide the swab into the nostril upon insertion. Using your free hand, collect the sample as described below.
8. With the free hand, insert the swab end into the nasal cavity of the nostril to be sampled. Direct the swab ventrally (down) and medially (center of head), maintaining this direction with the hand holding the nostril. The swab should be inserted to the level of the pharynx (approximately 10 to 14 inches as measured above). The swab will move freely and smoothly with only moderate pressure.
9. Caution must be used not to accidentally insert the swab into the false nostril of the animal and obtain the sample from there. The false nostril, which lies medial (central) and dorsal (up) on either side of the septum, is a shallow compartment (6 to 8 inches deep) that could easily be mistaken for the correct collection site. Directing the swab down (rather than up) as it is inserted into the nostril will help to avoid insertion into the false nostril. If the swab only enters a very short distance and will not easily push in further, you are likely in the false nostril. Withdraw the swab and guide it downwards.
10. When the swab reaches the level of the pharynx, you will feel it bump up against the back of the pharynx. Do not force the swab any further. At this point, you should be close to the distance previously measured out on the sheath. Pull the whole swab back approximately one inch. Hold the swab at that level with the hand that is guiding the swab at the nostril. With the other hand, push the swab and inner sheath out of the end of the guard sheath cap. Push the white swab further and rotate the swab with your fingers to collect the nasopharyngeal sample.
11. Pull the swab back into the inner sheath. Pull the inner sheath back into the guard sheath. Remove the whole apparatus from the nasal cavity. Make sure that the swab is held in such a way that it will not slide out of the end of the guard sheath.
12. Remove the inner sheath and the swab from the guard sheath, ensuring the swab remains inside the inner sheath.
13. Insert the swab directly into the transport media tube by pushing it through the inner sheath. Cut off the swab (with the bandage scissors) at a level that will contain the whole length of the swab within the transport media tube.
14. Label the transport media tube with the appropriate label.
15. Place the tube in the transport box and then into the cooler provided.
16. Contact FHMS that the samples are ready for pick up.

171
APPENDIX 4: Composite Fecal Sample Collection Protocol

172
TITLE: Pen Floor Composite Fecal Sample Collection
SOP NO.: 002
PROJECT MANAGER: Chelsea Flaig DVM: Dr. Calvin Booker
EFFECTIVE DATE: September 7, 2007 STUDY: FHMS-445
BACKGROUND
This procedure describes the pen floor fecal sample collection for surveillance of large groups of animals.
Caution should be taken with regards to the reactions and movements of the cattle to ensure worker safety when working in the pens.
You will be notified by the Research Project Manager (RPM) when to sample from the pens. Two people should attend for safety and assistance purposes.
EQUIPMENT
Note: No ice is required in the coolers for collection, only for shipping purposes.
1. Fecal cups (for sampling into)
2. Spoons
3. Apron for each collector
4. Labels - pre made
5. Fecal transport vials
6. Cooler of appropriate size
7. Appropriate sized gloves for the collectors
8. Paper towels
9. Garbage bags - white kitchen
10. An assortment of pens and markers
11. Date stamps
PROCEDURE
1. One composite sample of fecal material will be collected from each pen. Each composite will contain 20 different fecal patties. Try to collect from fresh patties.

173
2. Load up the apron with all equipment needed, plus some extra in case of mishap. Also take a white kitchen trash bag for disposal of dirty gloves and spoons (You can tie this to your apron).
3. Walk through the pen collecting samples as you go. Twenty different samples need to be collected per cup, by scooping one level spoonful from each sample patty from the pen floor with the spoon. If a fecal patty is somewhat old, scrape the top crust off to get to a fresher sample. Avoid collection of any bedding material. A new spoon must be used for each pen.
4. The sampling pattern for each pen is as follows: start at the gate and head towards the back of the pen collecting samples as you go; then turn and walk along the back of the pen, still collecting samples. Once at the far corner, turn and walk diagonally back to the gate, collecting the remainder of the samples.
5. Once a cup is filled, stir the mixture for 1 minute. Transfer approximately 10 grams into a fecal transport tube and then label the tube. Store the tube in the cooler. Proceed to the next pen.

174
APPENDIX 5: Rectal Fecal Sample Collection Protocol

175
TITLE: Allocation Rectal Fecal Sample Collection
SOP NO.: 003
PROJECT MANAGER: Chelsea Flaig DVM: Dr. Calvin Booker
EFFECTIVE DATE: April 19, 2007 STUDY: FHMS-445
BACKGROUND
This procedure describes the duties of the sample collector for allocation fecal rectal sample collection.
1. COLLECTION SUPPLIES AND EQUIPMENT:
a. Study Label Binder - pre printed labels provided by FHMS
b. A good selection of blue ink pens, markers, and date stamp
c. Fecal sample containers
d. OB Sleeves
e. Plastic disposable gloves - all sizes
f. Cooler(s)
g. Frozen ice packs
h. Paper towels
i. Garbage bags
PROCEDURES
1. COLLECTOR
a. Animals will be run into the chute one at a time.
b. Ear tags will be identified.
c. Collector to put on a clean OB sleeve on the hand used for collection for every animal.
d. No sleeve lube can be used.
e. A glove should be worn on the non-collection hand. This hand can be used to lift the tail, or touch inanimate objects. Change it when it becomes excessively

176
contaminated. Do not touch the fecal cup with this hand; otherwise there is a chance of cross contamination between samples.
f. Minimum quantity per fecal sample is 10 grams.
g. Put the fecal sample into the fecal cup. Do not touch the inside of the fecal cup at any time, other than to deposit or wipe the sample into it and only then with the hand that was used to collect the sample.
h. Hand the fecal cup to the Data Recorder who can wipe off the fecal cup, place the lid on it, and attach the label.
i. When sample collection is complete for the day, place in the fridge (if possible) until picked up or delivered to FHMS.
j. Notify FHMS that the samples are ready to be picked up.

177
APPENDIX 6: Sample Labeling and Transport Protocol

178
004 FHMS-445 Sample Submission
* Samples are to be shipped every Sunday evening. The samples will go to the lab in Lethbridge to be processed. * Samples need to be kept cool at all times. The microbes are temperature sensitive and overgrowth will occur if the samples get warm. Please leave the samples in the fridge, or in a cooler with ice packs, until you are ready to record and ship them.
1) Get the samples out of the walk-in fridge in the Field Services Building. They will
either be in a cooler or a box. The cooler/box should say FHMS-445 on the top. If not, look inside, there should be fecal cups and nasal tubes.
2) There are two types of individual animal case #s, arrival and exit. a. Arrival: F05004066; the 0 behind the 2 digit feedlot ID indicates an arrival
sample. b. Exit: F05100106; the 1 behind the 2 digit feedlot ID indicates an exit
sample. 3) Record the fecal sample case #s. eg) F05004066. Place them into a Ziploc bag.
Keep Arrival and Exit samples separate. Write the type of sample on the bags with a marker (Arrival, Exit).
4) Match the nasal sample case #s to the fecal samples. eg) N05004066. Place them into a Ziploc bag (separate from the fecals). Keep the Arrival and Exit samples separate. Write the type of sample on the bags with a marker (Arrival, Exit).
a. For each fecal sample there should be a nasal sample, if there is one but not the other please make a note of this on the Case #s and Sample Submission forms.
5) If there are composite samples eg) C050157, record and bag them separate from the other fecal samples. Some feedlots bag the composite samples separately from the other samples when they are collected. Write composite and the type of sample on the bags (Arrival, >60 DOF, Exit).
a. There are 3 types of composite samples: i. Arrival: C050157; the 0 behind the 2 digit feedlot ID indicates an
arrival sample. The label should might also say Arrival. ii. >60 DOF: C051025; the 1 behind the 2 digit feedlot ID indicates a
>60 DOF sample. The label should also say >60 DOF. iii. Exit: C052007; the 2 behind the 2 digit feedlot ID indicates an exit
sample. The label should also say Exit. b. Record all information from the composite label on a separate piece of
paper. This does not go in the spreadsheet of case #s but is needed for sample tracking. Information that will be on the label: Case # and Date. Info that may be on the label: Pen #, Lot #, Sort Group, type of sample, etc. Please record all information available and leave it on RPM’s desk.
6) Place ice packs above and below the samples in a clean cooler (not the one from the feedlot). The coolers are in a cardboard box for shipping. Use the appropriate sized box depending on the amount of samples.

179
7) Open the excel spreadsheet called Case Numbers for Samples Submitted ‘Date of shipment’; if there is no spreadsheet please make a new one.
a. Record all case #s in the spreadsheet. Save the sheet and print 2 copies – 1 will go with the shipment, the other will be filed (place on RPM’s desk).
b. Place 1 copy on top of the cooler in the box. 8) Open the Sample Submission Form for the date of the shipment. If there isn’t one
please make a new one. a. Update the shipment date, shipped by, # of samples, and how many of
each type of sample (Arrival, Exit). Save and print 2 copies - 1 will go with the shipment, the other will be filed (place on RPM’s desk).
b. Place 1 copy on top of the cooler in the box. Tape the box closed. 9) Fill out the pre-printed waybill. Add the date, No. of Pieces, Wt. The service is
Station to Station, Declared value of 0, packaging is a Box. Sign the waybill. a. Affix the waybill to the top of the box. b. Leave the top copy of the waybill on RPM’s desk along with the copies of
the case #s and sample submission form. 10) The labels for the box are in the same folder. Ensure that there are labels on the
box (From, To, Southbound). 11) Take the box to Greyhound in High River. The Greyhound is in the Grocery Kart
store (601 1st St W) by the Beef and Brew Restaurant. Do not take the box to the Greyhound in Okotoks; the restaurant is not usually open when samples need to be shipped and the bus does not always stop to pick up packages.
a. The bus leaves for Lethbridge at 9:30 pm. The samples need to be there at 9:00 pm at the absolute latest.
b. At Greyhound, place the box on the scale; tell the attendant the package is going to Lethbridge and that it is charged to the account on the waybill.

180
APPENDIX 7: E. coli Isolation Protocol

181

182

183

184
APPENDIX 8: M. haemolytica Isolation Protocol

185

186

187

188

189