
Key Performance Indicator Reporting (KPI) Toolkit for ...
100
JAN 2022 Key Performance Indicator Reporting (KPI) Toolkit for Insurance Supervisors HANDBOOK FOR SUB-SAHARAN AFRICAN INSURANCE SUPERVISORS PILLAR II: MARKET CONDUCT
-
Upload
khangminh22 -
Category
Documents
-
view
0 -
download
0
Transcript of Key Performance Indicator Reporting (KPI) Toolkit for ...
JAN
2022
Key Performance Indicator Reporting (KPI) Toolkit for Insurance SupervisorsHANDBOOK FOR SUB-SAHARAN AFRICAN INSURANCE SUPERVISORS
PILLAR II: MARKET CONDUCT
KEY PERFORMANCE INDICATOR REPORTING (KPI)
TOOLKIT FOR SSA SUPERVISORS
HANDBOOK FOR SUB-SAHARAN AFRICAN INSURANCE SUPERVISORSPILLAR II: MARKET CONDUCT
Published by:Access to Insurance Initiative
Hosted by:Financial Systems Approachesto Insurance
Deutsche Gesellschaft fürInternationale Zusammenarbeit(GIZ) GmbHDag-Hammarskjöld-Weg 1–565760 Eschborn, Germany
Telephone: +49 61 96 79-7511Fax: +49 61 96 79-80 7511E-mail: [email protected]: www.a2ii.org
Responsible:Access to Insurance InitiativeSecretariat
Text and editing:Access to Insurance InitiativeSecretariat
Photo Credit Cover page: under the use of © istock | 1177174799
Eschborn, December 2021
IMPRINT
3
CONTENTS
Contents
LIST OF ACRONYMS . . . . . . . . . . . . . . . . . . . . . . . . . . . . . . . . . . . . . . . . . . . . . . . . . . . . . . 5
ACKNOWLEDGEMENTS . . . . . . . . . . . . . . . . . . . . . . . . . . . . . . . . . . . . . . . . . . . . . . . . . . . 6
INTRODUCTION . . . . . . . . . . . . . . . . . . . . . . . . . . . . . . . . . . . . . . . . . . . . . . . . . . . . . . . . . 7
1. FRAMEWORK FOR ASSESSING PRUDENTIAL RISKS OF INSURERS . . . . . . . . . . . . . . .121 .1 . Conceptual framework for assessment of conduct risks . . . . . . . . . . . . . . . . . . . . . . . .121 .2 . Process for the assessment of conduct risk . . . . . . . . . . . . . . . . . . . . . . . . . . . . . . . . . .15
2. APPROACH TO GATHERING DATA . . . . . . . . . . . . . . . . . . . . . . . . . . . . . . . . . . . . . . . . . .172 .1 . Importance of good-quality data . . . . . . . . . . . . . . . . . . . . . . . . . . . . . . . . . . . . . . . . . .172 .2 . Gathering and using data . . . . . . . . . . . . . . . . . . . . . . . . . . . . . . . . . . . . . . . . . . . . . . . .182 .3 . Sources of data . . . . . . . . . . . . . . . . . . . . . . . . . . . . . . . . . . . . . . . . . . . . . . . . . . . . . . . .21
3. SELECTION AND ANALYSIS OF KPIs . . . . . . . . . . . . . . . . . . . . . . . . . . . . . . . . . . . . . . . .233 .1 . Selection of KPIs . . . . . . . . . . . . . . . . . . . . . . . . . . . . . . . . . . . . . . . . . . . . . . . . . . . . . . .233 .2 . How to approach analysis of KPIs . . . . . . . . . . . . . . . . . . . . . . . . . . . . . . . . . . . . . . . . . .25
4. LIST OF KPIs . . . . . . . . . . . . . . . . . . . . . . . . . . . . . . . . . . . . . . . . . . . . . . . . . . . . . . . . . . . . .284 .1 . Industrywide/big picture analysis . . . . . . . . . . . . . . . . . . . . . . . . . . . . . . . . . . . . . . . . . .284 .2 . Pricing & cost structure - fees, commissions, expenses . . . . . . . . . . . . . . . . . . . . . . . . 384 .3 . Cancellations, lapses, non-renewals, replacements, surrenders and alterations . . . . . .494 .4 . Claims . . . . . . . . . . . . . . . . . . . . . . . . . . . . . . . . . . . . . . . . . . . . . . . . . . . . . . . . . . . . . . 634 .5 . Fraud . . . . . . . . . . . . . . . . . . . . . . . . . . . . . . . . . . . . . . . . . . . . . . . . . . . . . . . . . . . . . . . .774 .6 . Consumer complaints and disputes . . . . . . . . . . . . . . . . . . . . . . . . . . . . . . . . . . . . . . . .794 .7 . Other qualitative information . . . . . . . . . . . . . . . . . . . . . . . . . . . . . . . . . . . . . . . . . . . . 88
5. COMPILATION OF FINDINGS AND INTERVENTION . . . . . . . . . . . . . . . . . . . . . . . . . . . 925 .1 . Compilation of findings . . . . . . . . . . . . . . . . . . . . . . . . . . . . . . . . . . . . . . . . . . . . . . . . 925 .2 . Interventions . . . . . . . . . . . . . . . . . . . . . . . . . . . . . . . . . . . . . . . . . . . . . . . . . . . . . . . . . 92
6. IMPLEMENTATION CONSIDERATIONS FOR SSA . . . . . . . . . . . . . . . . . . . . . . . . . . . . . . .94
ANNEX 1:TOP 5 AREAS OF INVESTIGATION FOR EACH CUSTOMER OUTCOME . . . . . . . . . . . .96
BIBLIOGRAPHY . . . . . . . . . . . . . . . . . . . . . . . . . . . . . . . . . . . . . . . . . . . . . . . . . . . . . . . . . .98

4
CONTENTS
Tables and Figures
Table 1: Mapping ICP 19 .0 .2 principles to customer outcomes . . . . . . . . . . . . . . . . . . . .14Table 2: Overview of indicators by area of investigation . . . . . . . . . . . . . . . . . . . . . . . . .24Table 3: Illustration of claims outcomes dashboard for life insurance . . . . . . . . . . . . . . .71Table 4: Illustration of claims TAT dashboard for various life insurance lines . . . . . . . . . .73
Figure 1: The Supervisory KPI Toolkit . . . . . . . . . . . . . . . . . . . . . . . . . . . . . . . . . . . . . . . . . 7Figure 2: Key aspects of conduct supervision by IAIS members, IAIS Application Paper (2014) . . . . . . . . . . . . . . . . . . . . . . . . . . . . . . . . . . . . . . . . . . . . . . . . . . . . . 8Figure 3: Good customer outcomes throughout the customer journey . . . . . . . . . . . . . .15Figure 4: Overview of the process for assessment of conduct risk of insurers . . . . . . . . .16Figure 5: Drilling down to the root cause in formulating insights . . . . . . . . . . . . . . . . . . .16Figure 6: Sources of conduct data for 5 Steering Group members . . . . . . . . . . . . . . . . . .21Figure 7: Life and general insurance premium growth in Malaysia, 2018-2020 . . . . . . . . 30Figure 8: How policies can be discontinued and altered through the policy term . . . . . 50Figure 9: Possible claims outcomes and sub-outcomes at the end of a reporting period . . . . . . . . . . . . . . . . . . . . . . . . . . . . . . . . . . . . . . . . . . . . . . . . . . . . . . . . .67Figure 10: Possible claims fraud outcomes and sub-outcomes at the end of a reporting period . . . . . . . . . . . . . . . . . . . . . . . . . . . . . . . . . . . . . . . . . . . . . . . . .78Figure 11: Possible complaints outcomes at the end of a reporting period . . . . . . . . . . . .81
5
TABLE OF ACRONYMS
List of acronyms A2ii Access to Insurance Initiative
AFCA Australian Financial Complaints Authority
APRA Australian Prudential Regulation Authority
ASIC Australian Securities and Investments Commission
BNM Bank Negara Malaysia
CBR Conduct of Business Returns
CCIR Canadian Council of Insurance Regulators
CIMA Conférence interafricaine des marchés d'assurance
COB Conduct of Business
DWP Direct Written Premiums
FCA Financial Conduct Authority
FSC Financial Services Commission
FSCA Financial Conduct Sector Authority
FSCA Financial Sector Conduct Authority
FTC Fair Treatment of Consumers
GDP Gross Domestic Product
GWP Gross Written Premiums
IAIS International Association of Insurance Supervisors
ICP Insurance Core Principles
IRA Insurance Regulatory Authority
KPIs Key performance indicators
MCWG Market Conduct Working Group
MFI microfinance institutions
MNO mobile network operator
NAIC National Association of Insurance Commissioners
NEP Net earned premiums
NIC National Insurance Commission
OECD Organisation for Economic Co-operation and Development
PRP Peer Review Process
RBM Reserve Bank of Malawi
SARB South African Reserve Bank
SSA Sub-Saharan African
TAT Turnaround time
TSPs Technical Service Providers
TAT Turnaround time
TSPs Technical Service Providers
6
ACKNOWLEDGEMENTS
ACKNOWLEDGEMENTS
This work was developed under the Sub-Saharan African (SSA) Key Performance Indicator (KPI) Reporting project of the A2ii, Cenfri and the Steering Group of insurance supervisors of Ghana, Kenya, Malawi, Mauritius, Uganda and West Africa (CIMA), and chaired by South Africa.
The market conduct KPI practical guide was developed by Hui Lin Chiew based on the expe-riences of the steering group member jurisdictions and IAIS material. The project was led by Hui Lin Chiew from the A2ii, with research and analysis support from Carolyn Barsulai and in close collaboration with Nichola Beyers, Karien Scribante and Christine Hougaard from Cenfri.
The team is grateful to the Steering Group for their insights, guidance and sharing of expertise. The Steering Group was chaired by Mvelase Peter (SARB, South Africa) and comprise: Abdul Rashid Abdul Rahaman (NIC, Ghana), Deerajen Ramasawmy (FSC, Mauritius), Edwin Mulenga (RBM, Malawi), Fabrice Ablegue (CIMA), Gerald Kago (IRA, Kenya), Ignacio Kanthenga (RBM, Malawi), Ivan Kilameri (IRA, Uganda), Lehlogonolo Chuenyane (FSCA, South Africa) and Seth Eshun (NIC, Ghana).
The team is grateful for the feedback of Janice Angove (author of prudential KPI Handbook)* , Juanita Smit (FSCA, South Africa), Kai Ye Ong (Bank Negara Malaysia) and the collaboration with Farzana Badat at the IAIS Secretariat.
Finally, the team gratefully acknowledges the generous financial support of the German Fed-eral Ministry for Economic Cooperation and Development (BMZ) and The Netherlands’ Minis-try of Foreign Affairs (DGIS), without which the production of this work would not have been possible.
* The project team would like to take this opportunity to honour our colleague Janice Angove,who passed away on 8 January 2022. Janice's contribution to the project was immeasurable
7
INTRODUCTION
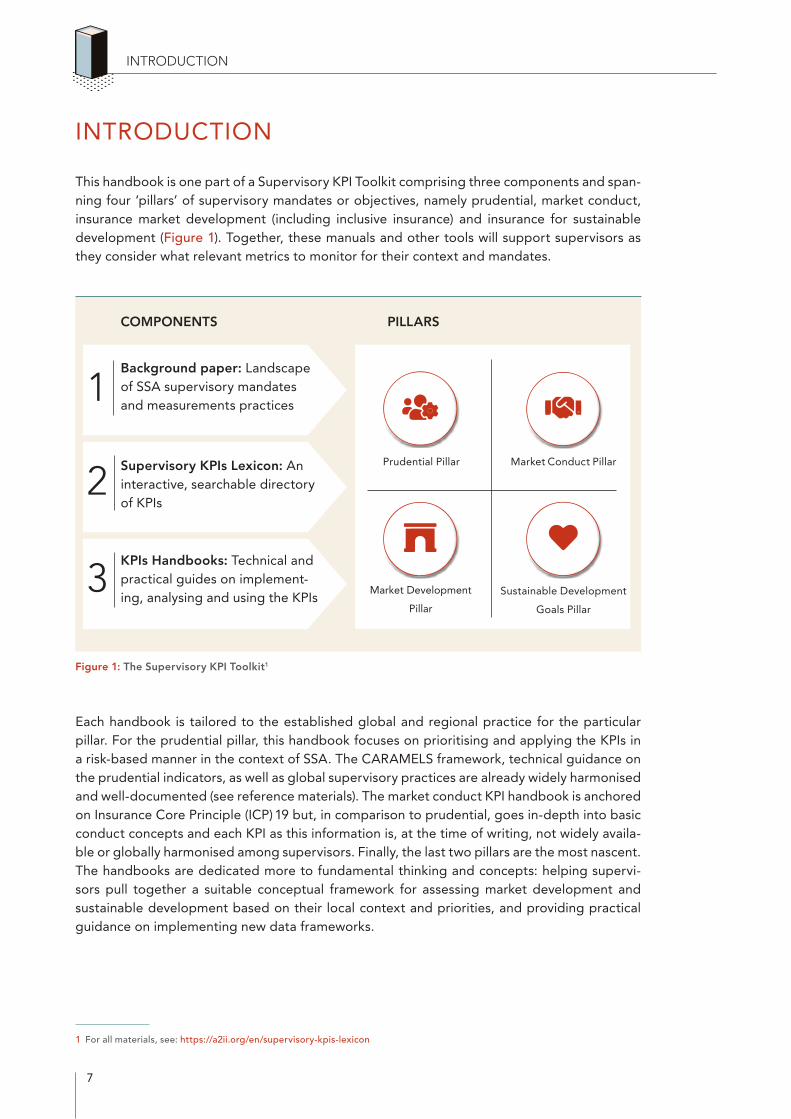
This handbook is one part of a Supervisory KPI Toolkit comprising three components and span-ning four ‘pillars’ of supervisory mandates or objectives, namely prudential, market conduct, insurance market development (including inclusive insurance) and insurance for sustainable development (Figure 1). Together, these manuals and other tools will support supervisors as they consider what relevant metrics to monitor for their context and mandates.
Figure 1: The Supervisory KPI Toolkit1
Each handbook is tailored to the established global and regional practice for the particular pillar. For the prudential pillar, this handbook focuses on prioritising and applying the KPIs in a risk-based manner in the context of SSA. The CARAMELS framework, technical guidance on the prudential indicators, as well as global supervisory practices are already widely harmonised and well-documented (see reference materials). The market conduct KPI handbook is anchored on Insurance Core Principle (ICP) 19 but, in comparison to prudential, goes in-depth into basic conduct concepts and each KPI as this information is, at the time of writing, not widely availa-ble or globally harmonised among supervisors. Finally, the last two pillars are the most nascent. The handbooks are dedicated more to fundamental thinking and concepts: helping supervi-sors pull together a suitable conceptual framework for assessing market development and sustainable development based on their local context and priorities, and providing practical guidance on implementing new data frameworks.
1 For all materials, see: https://a2ii.org/en/supervisory-kpis-lexicon
INTRODUCTION
Market Conduct Pillar
Market Development
Pillar
Prudential Pillar
Sustainable Development
Goals Pillar
Background paper: Landscape of SSA supervisory mandates and measurements practices
1
Supervisory KPIs Lexicon: An interactive, searchable directory of KPIs
KPIs Handbooks: Technical and practical guides on implement-ing, analysing and using the KPIs
3
2
COMPONENTS PILLARS
8
INTRODUCTION
Why assess KPIs on the solvency and performance of insurers?
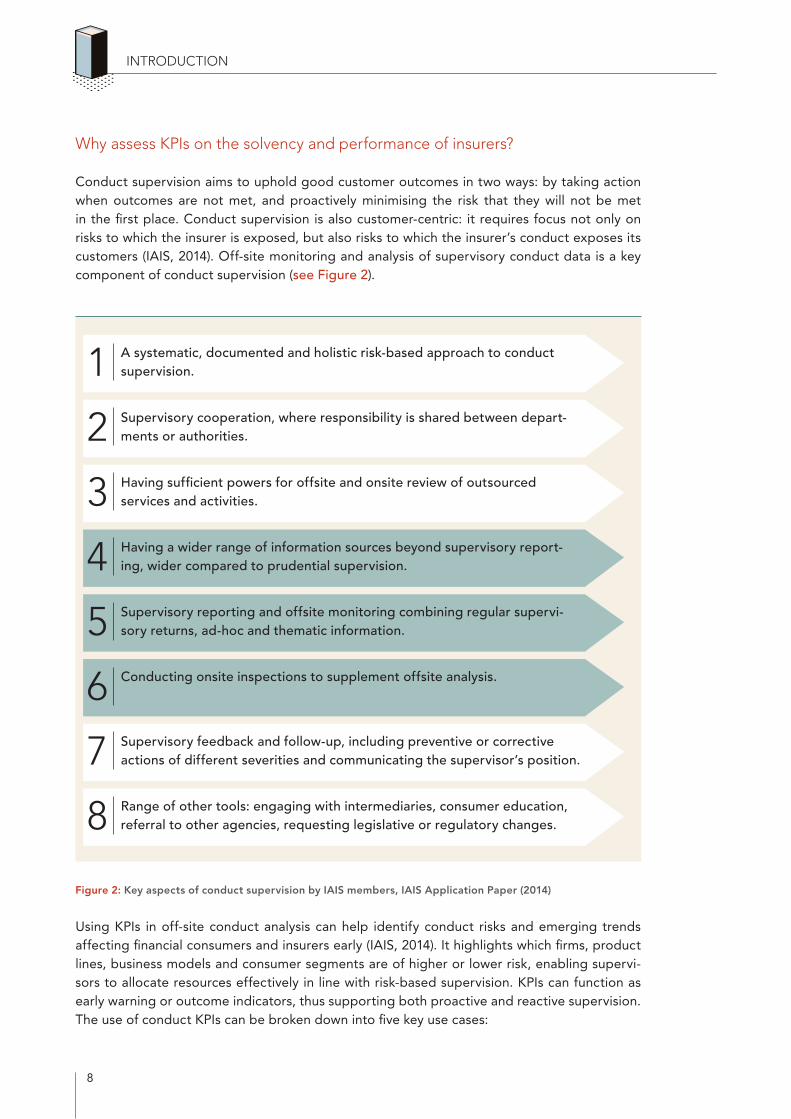
Conduct supervision aims to uphold good customer outcomes in two ways: by taking action when outcomes are not met, and proactively minimising the risk that they will not be met in the first place. Conduct supervision is also customer-centric: it requires focus not only on risks to which the insurer is exposed, but also risks to which the insurer’s conduct exposes its customers (IAIS, 2014). Off-site monitoring and analysis of supervisory conduct data is a key component of conduct supervision (see Figure 2).
Figure 2: Key aspects of conduct supervision by IAIS members, IAIS Application Paper (2014)
Using KPIs in off-site conduct analysis can help identify conduct risks and emerging trends affecting financial consumers and insurers early (IAIS, 2014). It highlights which firms, product lines, business models and consumer segments are of higher or lower risk, enabling supervi-sors to allocate resources effectively in line with risk-based supervision. KPIs can function as early warning or outcome indicators, thus supporting both proactive and reactive supervision. The use of conduct KPIs can be broken down into five key use cases:
A systematic, documented and holistic risk-based approach to conduct supervision.1Supervisory cooperation, where responsibility is shared between depart-ments or authorities.2Having sufficient powers for offsite and onsite review of outsourced services and activities.3Having a wider range of information sources beyond supervisory report-ing, wider compared to prudential supervision.4Supervisory reporting and offsite monitoring combining regular supervi-sory returns, ad-hoc and thematic information.5Conducting onsite inspections to supplement offsite analysis.6Supervisory feedback and follow-up, including preventive or corrective actions of different severities and communicating the supervisor’s position.7Range of other tools: engaging with intermediaries, consumer education, referral to other agencies, requesting legislative or regulatory changes.8
9
INTRODUCTION
Informing the risk analysis and rating of insurers. This means identifying which insurers are at higher risk of not meeting customer outcomes, and therefore need to be supervised more intensely, such as through more frequent engagements and on-site reviews and more detailed data collection. This is essentially risk-based supervision, which enables the supervisor to allo-cate resources more efficiently. It also supplements prudential supervision by minimising the risk of insurers and intermediaries following business models that are unsustainable or pose reputational risk (IAIS, 2014).
Early warning indicators of potential risks in the market. For instance, where new product lines, distribution channels or even technologies emerge, or increasing cancellation or non-re-newal rates are observed, early interventions can be taken to limit or avoid negative customer outcomes. This also informs prudential supervision, as business models that are unsustainable or pose reputational risk can also affect the solvency of the insurer.
Enabling supervisors to verify concerns and undertake evidence-based interventions. For instance, if the claims ratio is low, a deeper assessment of claims outcomes can give a better picture of whether the issue lies with consumer understanding or claims handling issues. This helps supervisors better identify areas that warrant a thematic review. It also enables supervi-sors to have a stronger base when engaging insurers, conducting on-site review or requiring insurers to take action, especially when concerning more subjective or abstract issues such as conflict of interest.
Monitoring ongoing compliance with conduct requirements, be it the requisite policies and processes or the quantitative requirements such as claims turnaround times (TAT), common in inclusive insurance, and commission limits.
Overall market intelligence and development trends. It enables supervisors to gather infor-mation about the insurance industry as a whole and to identify long-term trends. This is key for supervisors with market development and financial inclusion mandates.
How to use this work
This handbook is a reference and a working tool for day-to-day off-site analysis by supervisors in SSA jurisdictions. It is also relevant for any insurance supervisor currently developing their market conduct functions. It covers basic technical concepts in market conduct KPIs, how to interpret KPIs against customer outcomes as well as examples relevant to the SSA context. The content is based on ICP 19 principle (19.0.2)2 and IAIS materials and draws on the ongoing work of the IAIS Market Conduct Working Group (MCWG), IAIS members and KPI Reporting Steering Group members.
It is designed to be suitable for new or junior supervisors who need a broad introduction to using indicators in market conduct supervision, while also serving as a refresher for senior and mid-management supervisors. It is also suitable for supervisors who are involved in planning or implementing enhancements to their conduct data reporting and analytical systems.
2 Except the principle 'Protecting the privacy of information obtained from customers’. This is not covered, as in most jurisdiction data protection regulation is led by a separate data protection agency and the supervisor is often in a supporting role.
10
The remainder of the guide covers the following sections:
• Section 1: Framework for assessing the prudential risk of insurers
• Section 2: Approach to gathering data
• Section 3: Selection and analysis of KPIs
• Section 4: List of KPIs
• Section 5: Compilation of findings and intervention
• Section 6: Implementation considerations for SSA
Other reference materials
The following documents (full links provided in Bibliography) are helpful and can be used together with the information in this guide. Supervisors are encouraged to follow forthcom-ing IAIS guidance and peer supervisors’ practices as the field of market conduct supervision develops.
INTRODUCTION
Document Remarks
Supervisory KPIs Lexicon Full list of KPIs in an online searchable, inter-active table
ICP 19 Conduct of Business The anchor framework and principles for con-sumer protection. Articulates key customer outcomes. Contains many examples of com-mon root causes of conduct risk, supervisory requirements and interventions in line with ICP 19.
IAIS Application Paper on Approaches to Conduct of Business Supervision (2014)
Guidance on the various aspects and approaches that constitute conduct supervi-sion. Also has examples of how supervisors can carry out off-site monitoring and on-site inspection in line with ICP 9.
IAIS Peer Review of Conduct of Business Supervision relative to the standards set out in Insurance Core Principle 19 (June, 2021)
Recent examples and insights on how super-visors implement ICP 19, including summa-ries of useful practices found from the Peer Review Process (PRP). Especially useful in the way it presents the information in a compara-tive manner, highlighting areas of harmonisa-tion vs. variations among IAIS members.
11
INTRODUCTION
Using Key Performance Indicators (KPIs) in Inclusive Insurance Supervision (A2ii, 2019)
For guidance on using conduct KPIs in inclu-sive insurance supervision.
• IAIS Issues Paper on Conduct of Busi-ness in Inclusive Insurance (2015)
• IAIS Application Paper on Product Oversight in Inclusive Insurance (2017)
For guidance and insight on how to apply conduct principles to the supervision of inclu-sive insurance and microinsurance business.
IAIS Core Curriculum Modules 6.1.1 Con-sumer Protection and 6.2.1 Intermediar-ies (updated 2018)
For foundational guidance on consumer pro-tection and supervision of intermediaries.
Forthcoming: IAIS work on conduct indicators
The IAIS MCWG is currently carrying out ongoing work on this topic. Two publications, a report covering the current state of market conduct supervision and overall approach to conduct KPIs, and a members-only imple-mentation guide on the use of key KPIs are currently underway.
12
1. FRAMEWORK FOR ASSESSING THE CONDUCT RISK OF INSURERS
1.1. Conceptual framework for assessment of conduct risks
Insurance supervisors today largely anchor conduct supervision on the principles and customer outcomes set out in the ICP 19.0.2. The scope and depth of the supervisor’s purview may differ by jurisdiction, depending on the exact mandate, legislated supervisory powers and structure and resources of the supervisor3. Most supervisors currently use a spectrum of prin-ciples-based and rules-based provisions, sometimes described as ‘outcomes-based’, with the supervisor determining the most appropriate mix of principles and rules to achieve the desired supervisory outcomes (IAIS, 2014).
If the ICP 19 principles are upheld in the insurance market, it minimises the risk that customer outcomes are not met. KPIs then function as a way for supervisors to monitor and verify if cus-tomer outcomes are being met, and also whether insurers’ policies and processes are in place to ensure they are met. Supervisors should articulate and define good customer outcomes that they wish to see in their local sector to guide the structure of their KPI framework. Examples of outcomes that should arise from ICP 19 include:
• Product is appropriate. The product delivers the reasonably expected benefits for the premium paid and is appropriate for the needs of the consumer. This includes product characteristics such as mandated benefits/policy limits, coverage of specified risks, pro-cedures or conditions and exclusions. For examples of where products did not meet this outcome see the PRP report (IAIS, 2021). See ICP 19.5.5.
• Customer value. This is a closely related outcome to the appropriateness of the prod-uct, and captures whether consumers are getting good value in return for the premi-ums they pay. ‘Value’ can refer to actual claims pay-outs: amounts and frequencies of successful and satisfactory claims or expected claims i.e. how much of the premium paid is attributable to the risk premium used in the pricing of the product. It can also refer to the quality of the product and servicing, in which case it is closely related to the outcome ‘High quality of service’. Jurisdictions currently have varying approaches to defining and measuring value.
• Good customer experience means that the consumer has a good experience through the life cycle of the policy. Poor customer experience includes psychological detriment (e.g. stress, anger or embarrassment), injury or adverse effect on health, compromised personal information or privacy, inconvenience, long times required to address prob-lems, as well as financial detriment (OECD, 2020). Good experience may still mean that the consumer suffers from ‘hidden detriment’ (OECD, 2010), for example where the consumer is unaware that they have made an unsuitable product choice based on poor advice. Similarly, consumers may have poor experience where there are misunder-standings even where the insurer/intermediary is not technically at fault. As such, it is
3 This document does not include outcomes relating to AML/CFT, financial literacy and consumer education, inclusive insurance and competition. The latter three are addressed in the market development pillar of this work.
1. FRAMEWORK FOR ASSESSING THE CONDUCT RISK OF INSURERS
13
1. FRAMEWORK FOR ASSESSING THE CONDUCT RISK OF INSURERS
still important for supervisors to assess outcomes relating to the insurer/intermediary’s activities such as ‘quality of service’, ‘quality of advice’, ‘mis-selling’. See 19.11.1.
• High quality of service: This means that the insurer carries out policy servicing and all policyholder communication in a fair, timely and transparent manner, appropriately through to the point at which all obligations under the policy have been satisfied (19.9). This includes promptly acknowledging and responding to communications. It should also cover how the insurer or intermediary handles claims, complaints, disputes, fraud investigations and any request for information.
• High quality of advice. Advice generally refers to the provision of a personalised rec-ommendation or guidance on an insurance product, vis-à-vis the disclosed needs of the customer. The advice would relate to selection, purchase, alteration, replacement or termination of a policy. It is different from the factual provision of product information. High quality of advice should mean that the advisor not only understands the product but also the outcome the policyholder is looking for (see ICP 19.8.3). The advisor’s knowledge regarding the product should be up-to-date (see ICP 19.8.9).
• Adequacy of information to the customer. This refers to giving appropriate informa-tion about a product in order that the customer can make an informed decision about the arrangements proposed, as well as provision of relevant information to customers throughout the life of the policy. This includes understanding their rights and obliga-tions post-sale. Information should be appropriate for the target market and their socio-economic background. This includes ensuring the policy language is understand-able. See ICP 19.7.1– 2, 19.9.
• No mis-selling. Mis-selling generally refers to deceptive and unfair marketing and sales practices, primarily by mispresenting the cover and services provided or the costs to consumers. This could include exaggerating or making unfair comparisons of benefits, downplaying the true price, omitting hidden costs, contingencies and exclusions as well as other product shortcomings. See ICP 19.5.5.
• Target market is appropriate. Distribution methods and strategies are appropriate for the product. This is different from the appropriateness of product in that the product itself is not the issue, but which segment it is being sold to. For examples of where tar-geting strategy did not meet this outcome see PRP report, paragraph 60 (IAIS, 2021). See ICP 19.5.5.
• No conflict of interest. The interest of the insurer or intermediary does not conflict with the duty of care owed to the customer. The insurer or intermediary is not inherently motivated, through remuneration or other arrangements, to take decisions against the best interest of the consumer. See ICP 19.3.6 and 19.3.8.
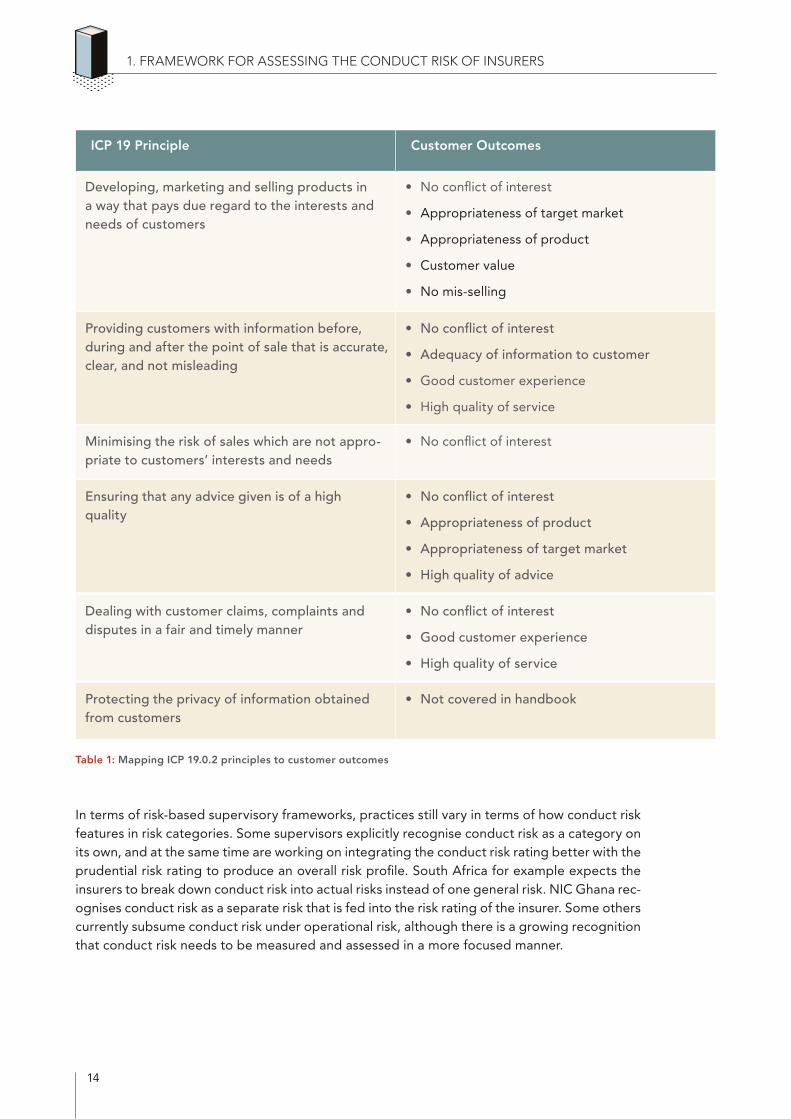
The KPI framework can be structured by mapping each ICP 19 Fair Treatment of Consumers (FTC) principle to customer outcomes (see Table 1). One FTC principle can be linked to multi-ple customer outcomes. Alternatively, customer outcomes can also be structured in an activity- based approach, visualised as the customer journey in Figure 3. Supervisors can then select KPIs to match each of these outcomes.
14
1. FRAMEWORK FOR ASSESSING THE CONDUCT RISK OF INSURERS
Table 1: Mapping ICP 19.0.2 principles to customer outcomes
In terms of risk-based supervisory frameworks, practices still vary in terms of how conduct risk features in risk categories. Some supervisors explicitly recognise conduct risk as a category on its own, and at the same time are working on integrating the conduct risk rating better with the prudential risk rating to produce an overall risk profile. South Africa for example expects the insurers to break down conduct risk into actual risks instead of one general risk. NIC Ghana rec-ognises conduct risk as a separate risk that is fed into the risk rating of the insurer. Some others currently subsume conduct risk under operational risk, although there is a growing recognition that conduct risk needs to be measured and assessed in a more focused manner.
ICP 19 Principle Customer Outcomes
Developing, marketing and selling products in a way that pays due regard to the interests and needs of customers
• No conflict of interest
• Appropriateness of target market
• Appropriateness of product
• Customer value
• No mis-selling
Providing customers with information before, during and after the point of sale that is accurate, clear, and not misleading
• No conflict of interest
• Adequacy of information to customer
• Good customer experience
• High quality of service
Minimising the risk of sales which are not appro-priate to customers’ interests and needs
• No conflict of interest
Ensuring that any advice given is of a high quality
• No conflict of interest
• Appropriateness of product
• Appropriateness of target market
• High quality of advice
Dealing with customer claims, complaints and disputes in a fair and timely manner
• No conflict of interest
• Good customer experience
• High quality of service
Protecting the privacy of information obtained from customers
• Not covered in handbook

15
1. FRAMEWORK FOR ASSESSING THE CONDUCT RISK OF INSURERS
Figure 3: Good customer outcomes throughout the customer journey
1.2. Process for the assessment of conduct risk
Assessment of the conduct of insurers involves a four-step process (see Figure 4):
• gathering information from insurers and other sources,
• analysis of quantitative and qualitative information,
• forming a view of the customer outcomes that are not being met and the conduct risk that the insurer and consumers are exposed to,
• taking appropriate action based on the findings of the assessment.
Marketing Disclosureand advice
Enrolment, purchase and nomina-tion
Pay premiums
Servicing, (changes, cancellations, queries)
Claimsevent
Claims notification, submission, payout
Complaint and dispute
� No conflict of interest
� Good customer experience and service
� No privacy breach and misuse of consumer data
� No conflict of interest
� Appropriateness of product and target market
� No mis-selling
� Adequacy of informa-tion to customer
� High quality of advice

16
Figure 4: Overview of the process for assessment of conduct risk of insurers
In most cases quantitative KPIs are the ‘tip of the iceberg’: they flag where and how customer outcomes are not being met. In formulating insights, supervisors should investigate the root cause before deciding on corrective measures, as this will directly mitigate the risk of such inci-dents repeating in the future. For examples of conduct requirements or the types of policies and processes an insurer should have, supervisors can refer to ICP 19 and its supplementary guidance. As market conduct supervision is evolving, peer exchange is a highly valuable source of information. Supervisors can also refer to regulatory documents published by peer super-visors, as supervisors often publish FTC guidance in the form of examples of good practices.
Figure 5: Drilling down to the root cause in formulating insights
1. FRAMEWORK FOR ASSESSING THE CONDUCT RISK OF INSURERS
Formulate insights
• Identify warning flags
• Ascertain stance on whether customer outcomes are met
• Check root cause
• Follow up meet-ings with insurers if needed
Action
• Feed back to entities
• Corrective measures and sanctions
• Publish findings and supervisory position
Analysis
• Ratio analysis – triangulate multiple KPIs
• Comparisons with industry benchmarks
• Trend analysis
• Qualitative informa-tion assessment
Gather information
• Regulatory returns
• Ad-hoc/thematic data requests
• Prudential supervisor
• Complaints division
• Ombud
• Meetings with insurers
• Media
• Other
What is (are) the root cause(s)?
Which conduct-related out-comes are not being achieved?
Qualitative KPIs –what are the reasons?
‘tip of the iceberg’
Quanti-tative KPIs
A certain hospital cash product has a higher complaints rate than other hospital cash products
More clues: Complaints were mainly about having to withdraw claims lodged and that the claims paid out were less than ex- pected. Consumers complained that the benefits did not cover re- imbursements for hospitalisation and treatment fees. Consumers complained that insurer was slow to respond in processing claims.
Customers might not have received adequate information Potential mis-selling Customer experience seems poor overall Product could be inappropriate for the target market
Poorly designed disclosure and marketing materials? Poor training of intermediaries/outsourced partners? Poor product development approaches? Poor claims handling processes and systems? A combination? Others? Verify via onsite engagements & governance monitoring infor-
mation. Use ICP 19 as guide to look for causes.
17
2. APPROACH TO GATHERING DATA
The section below describes the ideal set-up for data collection. However, many supervisors in SSA are in relatively early stages of building up their conduct supervision capacities. As such, supervisors may need to select the areas that are possible to implement in the short-term given resource and capacity constraints, and build up the capacity over time by carrying out the implementation in phases.
2.1. Importance of good quality data
The supervisory assessment of an insurer depends on the availability of good quality data. Reliable and relevant data allows for credible assessment of an insurer’s risk profile, and subse-quently effective supervisory monitoring and interventions.
TIP
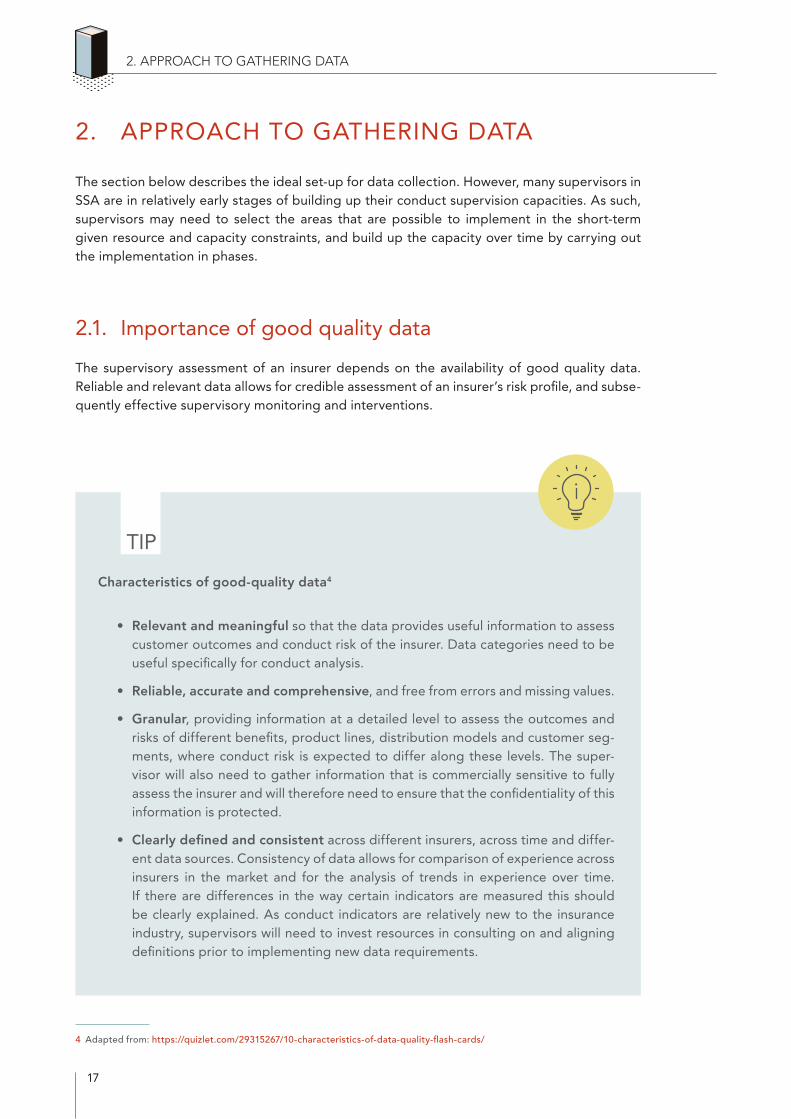
Characteristics of good-quality data4
• Relevant and meaningful so that the data provides useful information to assess customer outcomes and conduct risk of the insurer. Data categories need to be useful specifically for conduct analysis.
• Reliable, accurate and comprehensive, and free from errors and missing values.
• Granular, providing information at a detailed level to assess the outcomes and risks of different benefits, product lines, distribution models and customer seg-ments, where conduct risk is expected to differ along these levels. The super-visor will also need to gather information that is commercially sensitive to fully assess the insurer and will therefore need to ensure that the confidentiality of this information is protected.
• Clearly defined and consistent across different insurers, across time and differ-ent data sources. Consistency of data allows for comparison of experience across insurers in the market and for the analysis of trends in experience over time. If there are differences in the way certain indicators are measured this should be clearly explained. As conduct indicators are relatively new to the insurance industry, supervisors will need to invest resources in consulting on and aligning definitions prior to implementing new data requirements.
4 Adapted from: https://quizlet.com/29315267/10-characteristics-of-data-quality-flash-cards/
2. APPROACH TO GATHERING DATA

18
2. APPROACH TO GATHERING DATA
• Timely and up-to-date sso that the data reflects the recent experience of the firms or consumers allowing for early interventions in the event of negative out-comes. It is important for supervisors to promptly analyse the data received so that the resulting assessment will remain relevant.
• Readily available and easy to use and analyse. It is good to rely on the existing data that is used for prudential supervision and internal monitoring by the insur-ers. This will reduce the costs involved in preparing the data by the insurers. The presentation and format of the data submitted to the supervisors should allow for further analysis: for example, sending in Excel format or sending raw data rather than final ratios.
2.2. Gathering and using data
Quantitative and qualitative data
The supervisor should gather both quantitative and qualitative information. Quantitative infor-mation can be used to calculate key ratios and conduct trend analysis. Qualitative information can be used to assess whether the insurer has implemented key procedures for good gover-nance, best practices and supervisory requirements.
Checking accuracy and reliability
Conduct data, unlike prudential data, is typically unaudited. The senior management should be responsible for the accuracy of the information provided to the supervisor. The supervisor should build automatic checks into the data gathering and analysis process to check the rea-sonability of the information provided and query information that seems to be incorrect or illogical.
Tools for data collection from insurers
Data reporting from the insurers comprise three main components: regular reporting, the-matic reviews and ad-hoc requests. Currently, the gathering of conduct data is less sys- tematised than prudential data in most jurisdictions, and as such will rely more on thematic reviews and ad-hoc requests. Having different data gathering tools enables supervisors to manage resources more flexibly. Regular reporting can contain the absolute minimum data needed for supervisory monitoring, whereas other data can be collected through the-matic reviews and ad-hoc requests. Regular reporting can be expanded gradually, allowing the industry to gain experience and build capacity. It is important that supervisors have the legislated power to obtain information through the different tools.
19
2. APPROACH TO GATHERING DATA
• Regular reporting: This enables the supervisor to gradually build up a picture of insur-ers' circumstances and behaviour over time, by updating the insurer’s risk profile on an ongoing basis. It can be done as frequently as the supervisors deem necessary (e.g monthly, quarterly, annually), with greater levels of detail or more frequent reporting required in higher-risk situations (IAIS, 2014).
Regular reporting is usually done using standardised templates containing quantitative and sometimes qualitative information. These templates support the consistency of information across insurers and across time by using clear definitions of the information that is required. Clear definitions are important and where fixed definitions are not possible, consistent approaches should be clarified. For example, South Africa’s Con-duct of Business Returns (CBR) template requests for insurers to split certain data (e.g policies lapsed within 12 months) into three customer demographic segments accord-ing to their own definition and strategy, rather than a fixed quantitative definition of households/customers earning X-Y income.
Automatic checks can be built into hidden areas of the standardised templates. The checks can cover whether all relevant information has been completed, whether values that should be the same are equal (e.g total number of policies or premiums by distri-bution model vs. product line) and for unreasonable values e.g values that seem to be disclosed in millions instead of thousands. These common ‘tips and tricks’ can be bor-rowed from prudential reporting: For instance, South Africa has automatic validation built into its CBR.5
• Thematic data: The supervisor may request for insurers or a sample of insurers, on a market-wide or sector-specific basis, to provide information on a specific area of inves-tigation such as certain market conduct practices or new developments. This can be done via a survey questionnaire or a review of insurers’ files and submissions via other regulatory processes such as product approvals and intermediary records.
• Ad-hoc: Supervisors may also approach a specific insurer on an ad-hoc basis with spe-cific information requests (‘interrogatory’). This is the most flexible approach and can cover quantitative or qualitative data tailored to a specific request. It can also be a fol-low-up to red flags identified in KPIs from regular reporting, as a lead-up to an on-site inspection.
Frequency, timeliness and granularity
Conduct data should be collected on a regular basis. Supervisors currently collect data at dif-ferent frequencies due to the varying levels of resources and capacity dedicated to conduct supervision. Better-resourced supervisors tend to consolidate conduct data every quarter. Complaints data are collected most frequently with some being collected monthly. The fre-quency should be coordinated with prudential data collection (IAIS, 2014). Supervisors should consider that it would normally be the same resources and staff within the insurer who gather,
5 See (i) the South Africa’s FSCA’s CBR here: https://www.fsca.co.za/Regulated%20Entities/Pages/UI-Insurer-Micro-Insurer-Resources-Documents.aspx (ii) Canadian Council of Insurance Regulators (CCIR)‘s market conduct data submission landing page, including data definitions and preview of templates: https://lautorite.qc.ca/en/professionals/insurers/market-conduct/
20
process and submit all statutory submissions. Supervisors may wish to space out reporting requirements to avoid submission delays, and streamline where similar data is needed for both prudential and conduct analysis.
Data categories should be meaningful specifically for conduct analysis. For instance, in defin-ing intermediaries, ‘corporate agents’ can cover a wide range of intermediary types that might present very different conduct issues. Commercial lines can be excluded. However, supervisors may want to include small businesses.
Conduct data should ideally be more granular than prudential data. For regular reporting, supervisors should aim to have, at minimum, disaggregated data at the insurer, intermedi-ary and product line levels. Product, sub-product or benefit-level data are also key, as some conduct issues are specific to certain benefits within a product. However, when dealing with small numbers of policies in the data set, numbers need to be interpreted in the context of the amount of data used in the different category splits e.g. if the denominator is small, ratios may appear to be volatile.
Optimising cost of data collection
The availability and cost involved in preparing, verifying and analysing the data, for both the insurers and the supervisor, need to be considered when setting up reporting requirements. Increasing the amount of data requested and the frequency of data collection will increase the compliance cost for insurers, as well as the cost for supervisors to process the data. The supervisor may be able to make use of existing information that is meant for other purposes such as market development and prudential supervision, and hence should always check what is available internally before setting new requirements or sending out ad-hoc requests.
Public disclosure
Information transparency is important in instilling market discipline, allowing for effective functioning of the market and encouraging healthy competition between firms. The insurance supervisor can facilitate this process by making certain information publicly available. Some supervisors publicly disclose decisions taken by the regulator, sanctions imposed on particular insurers and when an insurer is placed under statutory management. Making this information available to the public acts as a deterrent to non-compliance.
Some supervisors include conduct data in their annual reports: Malawi publishes complaints data.6 Globally, some are publishing dedicated market conduct reports containing key data as a means of improving market transparency, competition and empowering consumers by providing more information.7
6 See RBM Malawi 2020 annual report: https://www.rbm.mw/Home/GetContentFile/?ContentID=50445
7 Global examples: (i) UK: UK notes that publishing a ‘scorecard’, or a selection of customer value measures, gives consumers a wider breadth of information about product choice without relying on a single KPI. The UK FCA also recently started collec-ting and partly publishing claims data on non-damage BI claims specifically, following the BI test case arising from Covid-19. This is published in part alongside a policy checker: https://www.fca.org.uk/firms/business-interruption-insurance/policy-checker (ii) Canada: Annual Statement on Market Conduct https://www.ccir-ccrra.org/Documents/View/3617 (iii) Hong Kong’s 2020 Conduct in Focus publication: https://www.ia.org.hk/en/infocenter/files/Conduct_In_Focus_English.pdf (iv) Malawi https://www.rbm.mw/ Home/GetContentFile/?ContentID=50445 and (v) Hong Kong’s 2021 Conduct in Focus publication https://www.ia.org.hk/en/ infocenter/files/ENG_CIF_3.pdf
2. APPROACH TO GATHERING DATA
21
2.3. Sources of data
Regular supply-side data should be primarily obtained from insurance firms that are directly supervised by the authority. Intermediary-level data should also be primarily obtained from the insurers as they are ultimately accountable for their distribution strategies and impact on customers. The exception is where there are ad-hoc or thematic questions that can only be addressed by intermediaries directly.
For demand-side data, supervisors may need to tap into multiple sources. For example, com-plaints data may need to be compiled from the insurer, an internal complaints division within the supervisor, and/or the complaints authority or Ombudsperson. Some supervisors also draw on data from standalone demand-side surveys initiated by the regulator, insurance association or international organisations.
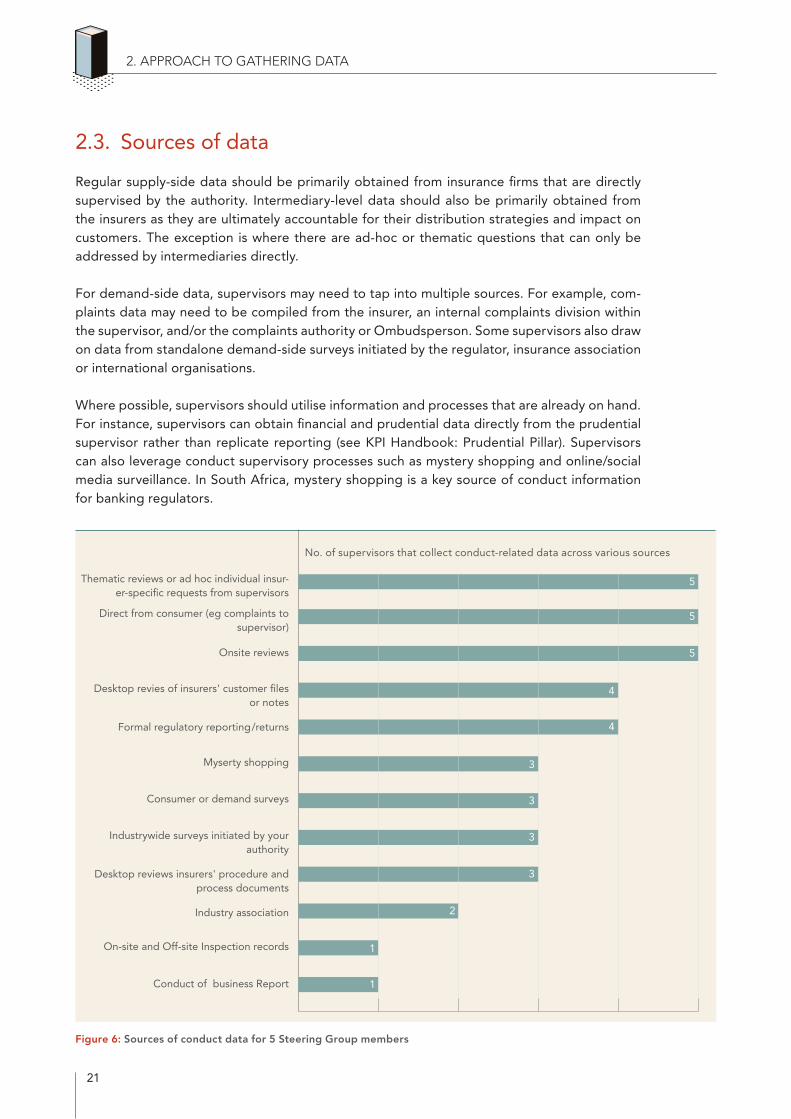
Where possible, supervisors should utilise information and processes that are already on hand. For instance, supervisors can obtain financial and prudential data directly from the prudential supervisor rather than replicate reporting (see KPI Handbook: Prudential Pillar). Supervisors can also leverage conduct supervisory processes such as mystery shopping and online/social media surveillance. In South Africa, mystery shopping is a key source of conduct information for banking regulators.
Figure 6: Sources of conduct data for 5 Steering Group members
2. APPROACH TO GATHERING DATA
Thematic reviews or ad hoc individual insur-er-specific requests from supervisors
Direct from consumer (eg complaints to supervisor)
Onsite reviews
Desktop revies of insurers' customer files or notes
Formal regulatory reporting/returns
Myserty shopping
Consumer or demand surveys
Industrywide surveys initiated by your authority
Desktop reviews insurers' procedure and process documents
Industry association
On-site and Off-site Inspection records
Conduct of business Report
No. of supervisors that collect conduct-related data across various sources
5
5
5
4
4
3
3
3
3
2
1
1
22
2. APPROACH TO GATHERING DATA
Conduct data sources tend to be broader than those in prudential supervision (see IAIS Applica-tion Paper 2014 section 3.4). The IAIS notes sources such as consumer complaints, ombud ser-vices or other alternative dispute resolution structures, consumer bodies, industry associations, industry or consumer media, other consumer protection regulatory or supervisory agencies, intermediaries, whistle-blowers, court cases, and data on general economic and environmen-tal factors impacting on consumer behaviour and expectations. As SupTech and RegTech develop8, some supervisors are finding ways to capture non-traditional data more regularly, such as social media information.
8 See World Bank Report on The Next Wave of Suptech Innovation: Suptech Solutions for Market Conduct Supervision (2021) : https://openknowledge.worldbank.org/handle/10986/35322
23
3. SELECTION AND ANALYSIS OF KPIs
3. SELECTION AND ANALYSIS OF KPIS
3.1. Selection of KPIs
Quantitative and qualitative indicators
This handbook addresses both quantitative and qualitative information. The quantitative ratios listed are based on the financial information of the insurer, such as business volumes (premi-ums and no. of policies), claims, remuneration and expenses of an insurer. Many quantitative indicators need to be supplemented by qualitative information. For instance, complaints rates should be viewed together with the cause of complaint; the product and distribution channel mix should not be assessed separately from judgment-based observations e.g identification of high-risk products and channels.
Standalone qualitative information is also included, and is especially useful where non-quantifi-able, value-based judgements are needed e.g the appropriateness of marketing and disclosure information, policies and processes.
Terminology
There is still some diversity in how supervisors currently select, define and apply conduct ratios. This includes slight variations in how the same terminology is used e.g lapses, surrenders, churn and cancellations. Locally, there might also be differences between the industry and supervisor and between different insurers. In this handbook, where different usages of terminology were found, one definition was selected as a reference for supervisors. Potential variations and grey areas to consider are described in footnotes. Supervisors will need to streamline the terminol-ogy when implementing in the local context.
Process for selecting KPIs for insurance business in SSA
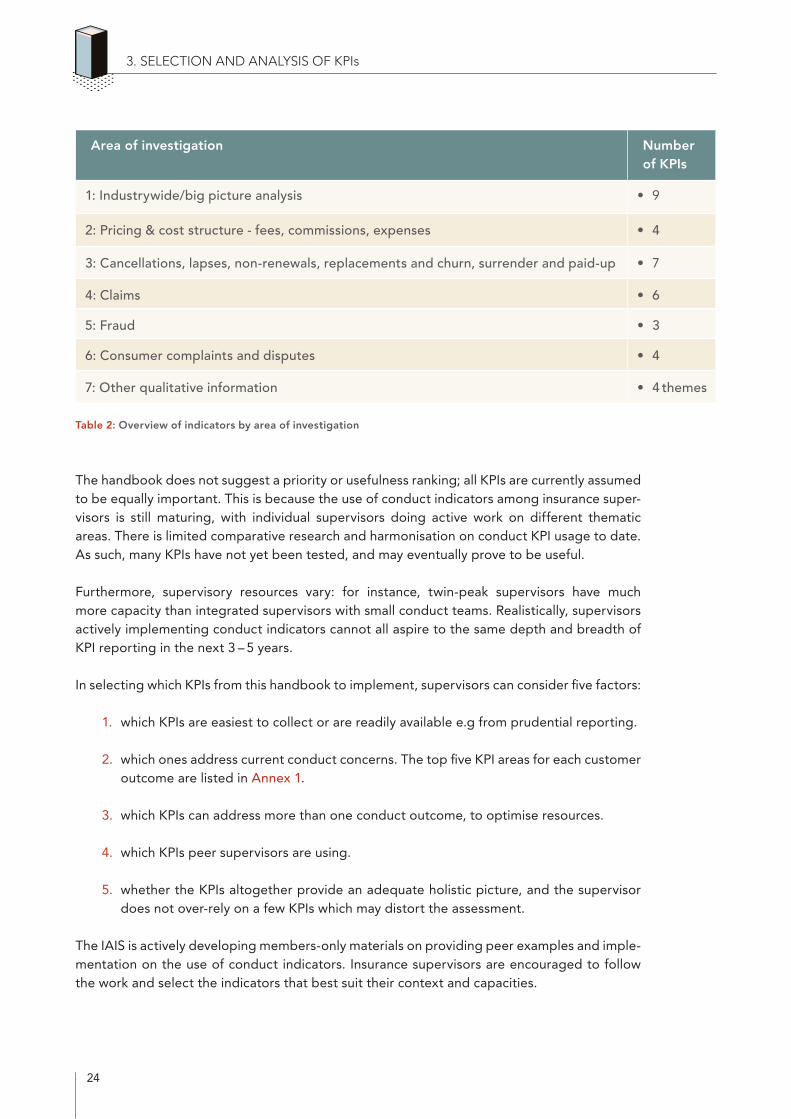
There are 37 indicators in this handbook, compiled from an IAIS member survey covering over 50 supervisors and therefore reflecting current usage by insurance supervisors worldwide. Some are straightforward ratios while others require qualitative elaboration or deep dives. The KPIs are organised by ‘areas of investigation’ (Table 2). Each area of investigation can be mapped to several ICP 19 customer outcomes. Conversely, a single customer outcome can be measured by multiple KPIs.
24
3. SELECTION AND ANALYSIS OF KPIs
Table 2: Overview of indicators by area of investigation
The handbook does not suggest a priority or usefulness ranking; all KPIs are currently assumed to be equally important. This is because the use of conduct indicators among insurance super-visors is still maturing, with individual supervisors doing active work on different thematic areas. There is limited comparative research and harmonisation on conduct KPI usage to date. As such, many KPIs have not yet been tested, and may eventually prove to be useful.
Furthermore, supervisory resources vary: for instance, twin-peak supervisors have much more capacity than integrated supervisors with small conduct teams. Realistically, supervisors actively implementing conduct indicators cannot all aspire to the same depth and breadth of KPI reporting in the next 3 – 5 years.
In selecting which KPIs from this handbook to implement, supervisors can consider five factors:
1. which KPIs are easiest to collect or are readily available e.g from prudential reporting.
2. which ones address current conduct concerns. The top five KPI areas for each customer outcome are listed in Annex 1.
3. which KPIs can address more than one conduct outcome, to optimise resources.
4. which KPIs peer supervisors are using.
5. whether the KPIs altogether provide an adequate holistic picture, and the supervisor does not over-rely on a few KPIs which may distort the assessment.
The IAIS is actively developing members-only materials on providing peer examples and imple-mentation on the use of conduct indicators. Insurance supervisors are encouraged to follow the work and select the indicators that best suit their context and capacities.
Area of investigation Number of KPIs
1: Industrywide/big picture analysis • 9
2: Pricing & cost structure - fees, commissions, expenses • 4
3: Cancellations, lapses, non-renewals, replacements and churn, surrender and paid-up • 7
4: Claims • 6
5: Fraud • 3
6: Consumer complaints and disputes • 4
7: Other qualitative information • 4 themes
25
3. SELECTION AND ANALYSIS OF KPIs
SPECIAL CONSIDERATIONS FOR MICROINSURANCE
Microinsurers will likely be more resource-constrained than traditional insurers. Super-visors may want to consider proportionately lighter reporting requirements for microin-surers, especially at the beginning of roll-out. Lighter requirements mean that the KPIs should still include sufficient KPIs to provide an adequate holistic assessment. Supervi-sors should not lose sight of the ‘big picture’ as over-reliance on too few KPIs can lead to skewed assessments or conceal underlying weaknesses.
However, the KPIs can be scaled down in terms of granularity: e.g. reporting on renew-als and cancellations, without including information on time tranches; reporting by product-lined data rather than benefit-level data as most products are simple; claims TAT but not by multiple time tranches but rather within the required timeline (e.g. 5 days) or not; complaints rates by causes and resolution rates, but not the TAT.
For FSCA South Africa, microinsurers are newly licensed and are not yet subject to reporting via the CBR. As the FSCA is developing a sectoral reporting structure for the CBR, FSCA plans to develop a lighter dedicated set of KPIs for microinsurers.
Where supervisors do not have dedicated microinsurers but have specific microinsur-ance or inclusive insurance lines, supervisors may wish to collect segregated prod-uct-level conduct indicators on inclusive insurance and microinsurance to specifically assess conduct risk arising for these more vulnerable consumer segments. This should be done in a streamlined way such that it avoids duplicates, inconsistency and unnec-essary compliance burden, e.g by adapting and adding additional fields to the base conduct turns rather than a separate template, and also using any useable data that is in the base reporting template rather than repeating fields.
For a detailed discussion on which conduct KPIs are important to inclusive insurance, see A2ii publication Using Key Performance Indicators (KPIs) in Inclusive Insurance Supervision (2019) and the Performance Indicators for Microinsurance: A Handbook for Microinsurance Practitioners published by Appui au Développement Autonome (ADA), the Belgian Raiffeisen Foundation (BRS) and the Microinsurance Network.
3.2. How to approach analysis of KPIs
1) One KPI should never be used in isolation
• To find out root causes, it is important to triangulate multiple KPIs. For example, a low claims ratio does not show if it is due to product design and pricing issues, poor claims handling or inadequate disclosure and awareness. It is also important to check claims withdrawn and rejected ratios, claims frequencies and complaints for meaningful anal-ysis.
26
3. SELECTION AND ANALYSIS OF KPIs
2) Consider what KPIs say about governance and activity monitoring
• KPIs can yield insights on both the insurer’s approach to the activity (governance monitoring), and how the activity was carried out in reality (activity monitoring).9 For example, in monitoring for conflict of interest, commission and other remuneration and expense ratios can yield information on the risk of intermediaries adopting poor selling tactics. On the other hand, complaints, cancellations/lapses and claims can confirm whether intermediaries are indeed conducting poor selling.
3) Trend analysis and reporting
• KPI analysis should include trend analysis over periods of interest to enable the supervi-sor to identify and query noticeable trends, deviations or sharp movements in customer treatment indicators (IAIS, 2014)
• Key trends include emergence or growth of products identified as raising concerns, key areas of growth in different sectors or within insurers, loss ratios across products within or between insurers, average premiums and premium increases, cancellation and rejection rates, complaints.
• It is useful to have an internal dashboard or summary trend analysis for internal man-agement reporting or integrated into supervisory review cycles. This can be structured according to ICP 19 outcomes or specific thematic conduct risks.
4) Benchmarks
• Supervisors can benchmark KPIs on a ‘horizontal’ basis i.e. compare against the indus-try or product average and focus on any outliers. For aggregate industry data, supervi-sors can also benchmark against other jurisdictions.
• Care should be taken to ensure that the benchmark comparisons are valid. For exam-ple, claims ratios should not be compared for two product lines with a different inher-ent risk such as life insurance and agricultural insurance, even within the same target segment such as inclusive insurance.
• For KPIs where there are quantitative threshold requirements such as commission lim-its, supervisors can benchmark the KPIs against these thresholds.
5) Feeding into risk rating
Supervisors can consider setting more frequent or intensive reporting requirements on entities with higher risk ratings e.g. a Latin American jurisdiction requires intermediaries with greater market participation to submit a biannual self-assessment relating to the fair treatment of their customers (IAIS, 2021). When determining risk profiles, supervisors may consider factors such as market size, customer base, insurance lines, ownership structure, and the number of con-
9 (i) Governance monitoring: The governance processes within insurers that supervisors may monitor to determine whether their supervisory requirements are being met (ii) Activity monitoring: Specific insurer activities that supervisors may monitor in determi-ning whether their supervisory requirements are being met. (IAIS, 2014)

27
3. SELECTION AND ANALYSIS OF KPIs
sumer complaints (IAIS, 2014). In setting risk ratings, it is critical for conduct supervisors to coordinate with prudential supervisors and the ombud for a holistic rating. Risk factors include:
• having a large number of customers
• being involved in personal and small business lines as opposed to large commercial lines
• having an unsophisticated or vulnerable customer base (e.g inclusive insurance – low-in-come, elderly, first-time consumers)
• offering complex or high-risk products
• having financial and solvency issues
• having practices that were previously identified as risky (conduct track record)
• distribution strategies, such as reliance on intermediaries and outsourcing agreements,
• organisational culture
28
4. LIST OF KPIs
4. LIST OF KPIS
4.1. Industrywide/big picture analysis
4.1.1. Market growth and solvency
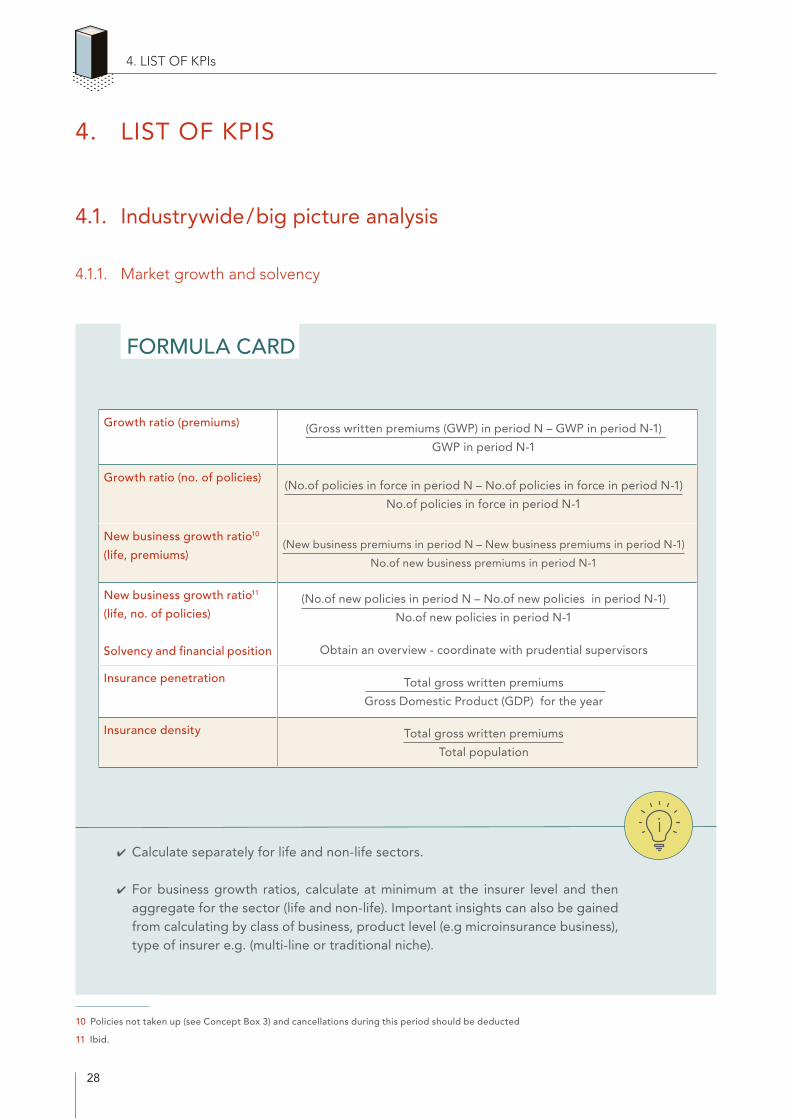
FORMULA CARD
✔ Calculate separately for life and non-life sectors.
✔ For business growth ratios, calculate at minimum at the insurer level and then aggregate for the sector (life and non-life). Important insights can also be gained from calculating by class of business, product level (e.g microinsurance business), type of insurer e.g. (multi-line or traditional niche).
10 Policies not taken up (see Concept Box 3) and cancellations during this period should be deducted
11 Ibid.
Growth ratio (premiums) (Gross written premiums (GWP) in period N – GWP in period N-1)
GWP in period N-1
Growth ratio (no. of policies)(No.of policies in force in period N – No.of policies in force in period N-1)
No.of policies in force in period N-1
New business growth ratio10
(life, premiums)(New business premiums in period N – New business premiums in period N-1)
No.of new business premiums in period N-1
New business growth ratio11
(life, no. of policies)
Solvency and financial position
(No.of new policies in period N – No.of new policies in period N-1)
No.of new policies in period N-1
Obtain an overview - coordinate with prudential supervisors
Insurance penetration Total gross written premiums
Gross Domestic Product (GDP) for the year
Insurance density Total gross written premiums
Total population
29
4. LIST OF KPIs
✔ For insurance penetration and density: Can obtain GDP number from the central bank, statistical bureau or Ministry of Finance statistics. Obtain population num-bers from the latest national population and housing census or statistical bureau.
Information on insurance market growth provides context for the way the industry behaves. Competitive and financial pressures drive business decisions, and therefore customer out-comes. As such, supervisors may wish to understand if the industry is growing and financially healthy overall. When analysed at the product line level, growth data reveals what is popular with customers or intermediaries e.g it may be that the product line is genuinely popular for consumers, or it may be that intermediaries are pushing certain higher-commission products.
Financial soundness information should be readily available from prudential supervisors, and coordinating with the prudential supervisor for an overview of insurer solvency is important. Pressure on earnings will shape product design, intermediary remuneration and selling strat-egies. Capital requirements, actuarial issues and reinsurance will shape the kind of products that the insurer underwrites. There is often a tension between managing prudential risk and treating customers fairly. For example:
• Exclusions help insurers to manage the risk of paying for claims that are not allowed for in the pricing and the risk of moral hazard. On the other hand, exclusions can cause consumer misunderstandings and dissatisfaction when claims are unsuccessful.
• Investing in illiquid assets in an attempt to increase investment returns can result in problems with liquidity and may lead to a delay in claims payment.
• Insurers may delay claim payments to increase investment income and improve profits for the insurer.
On the other hand, market conduct objectives can also support or be aligned with prudential objectives.
• Delays in payment of claims may indicate solvency issues or liquidity issues.
• Market conduct issues can affect the reputational risk of the insurer.
• Poor management of prudential risks can result in increased premiums and poorer cus-tomer value.
Some supervisors compare actual growth to insurers’ initial target or projected growth. Super-visors can also compare penetration rates and growth rates to other similar jurisdictions. For global benchmarking, key sources of data include the Swiss Re Sigma and Organisation for Economic Co-operation and Development (OECD) database (see Bibliography, KPI back-ground paper).
30
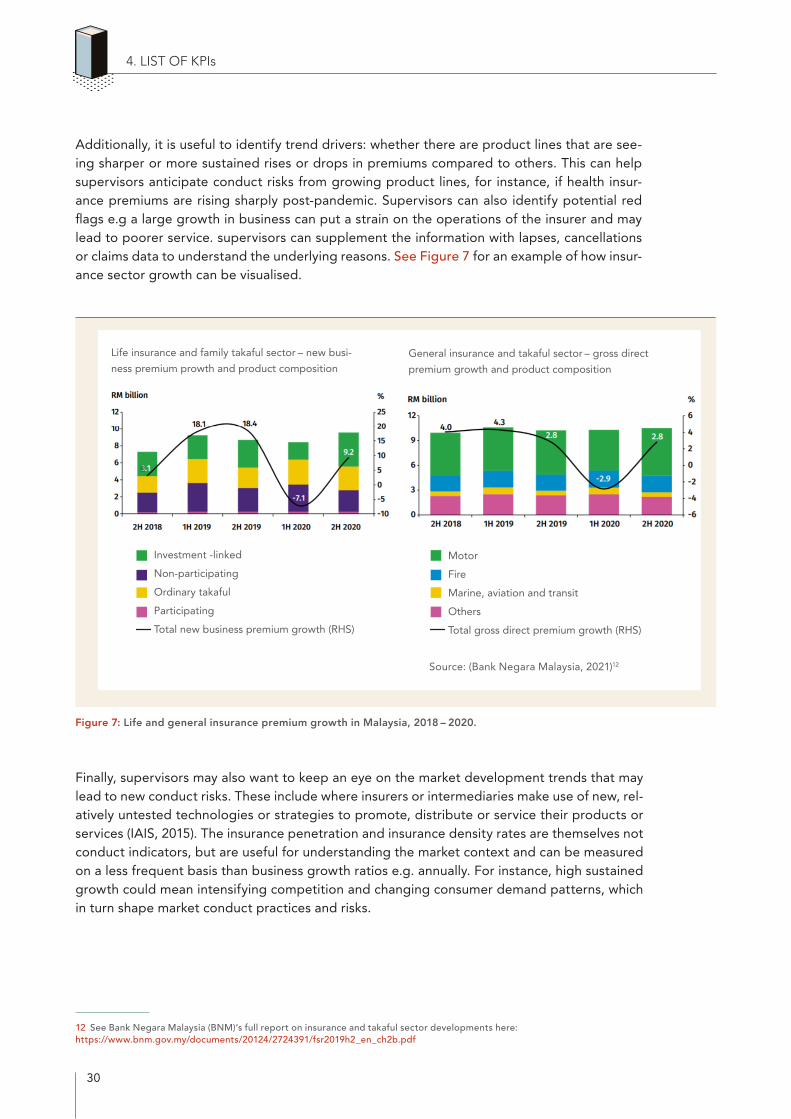
Additionally, it is useful to identify trend drivers: whether there are product lines that are see-ing sharper or more sustained rises or drops in premiums compared to others. This can help supervisors anticipate conduct risks from growing product lines, for instance, if health insur-ance premiums are rising sharply post-pandemic. Supervisors can also identify potential red flags e.g a large growth in business can put a strain on the operations of the insurer and may lead to poorer service. supervisors can supplement the information with lapses, cancellations or claims data to understand the underlying reasons. See Figure 7 for an example of how insur-ance sector growth can be visualised.
Source: (Bank Negara Malaysia, 2021)12
Figure 7: Life and general insurance premium growth in Malaysia, 2018 – 2020.
Finally, supervisors may also want to keep an eye on the market development trends that may lead to new conduct risks. These include where insurers or intermediaries make use of new, rel-atively untested technologies or strategies to promote, distribute or service their products or services (IAIS, 2015). The insurance penetration and insurance density rates are themselves not conduct indicators, but are useful for understanding the market context and can be measured on a less frequent basis than business growth ratios e.g. annually. For instance, high sustained growth could mean intensifying competition and changing consumer demand patterns, which in turn shape market conduct practices and risks.
12 See Bank Negara Malaysia (BNM)‘s full report on insurance and takaful sector developments here: https://www.bnm.gov.my/documents/20124/2724391/fsr2019h2_en_ch2b.pdf
4. LIST OF KPIs
Investment -linked
Non-participating
Ordinary takaful
Participating
Total new business premium growth (RHS)
Life insurance and family takaful sector – new busi-
ness premium prowth and product compositionGeneral insurance and takaful sector – gross direct
premium growth and product composition
Motor
Fire
Marine, aviation and transit
Others
Total gross direct premium growth (RHS)
31
4. LIST OF KPIs
4.1.2. Product landscape and suitability
FORMULA CARD
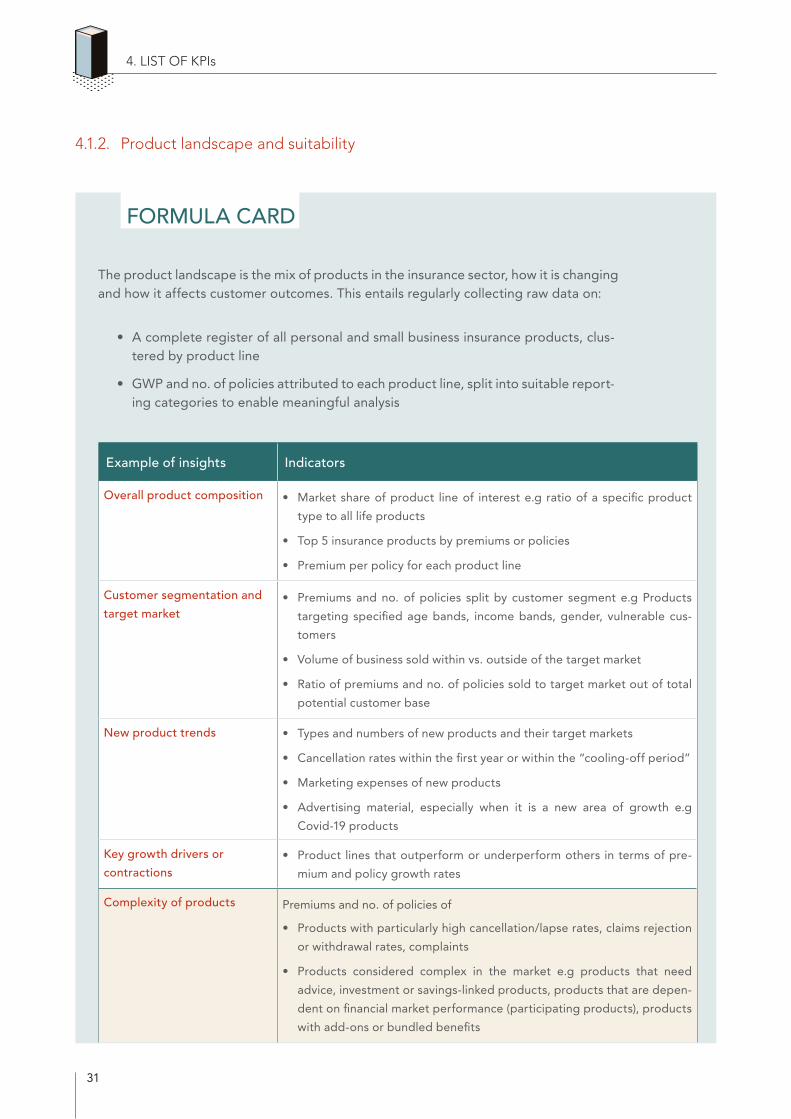
The product landscape is the mix of products in the insurance sector, how it is changing and how it affects customer outcomes. This entails regularly collecting raw data on:
• A complete register of all personal and small business insurance products, clus-tered by product line
• GWP and no. of policies attributed to each product line, split into suitable report-ing categories to enable meaningful analysis
Example of insights Indicators
Overall product composition • Market share of product line of interest e.g ratio of a specific product
type to all life products
• Top 5 insurance products by premiums or policies
• Premium per policy for each product line
Customer segmentation and
target market • Premiums and no. of policies split by customer segment e.g Products
targeting specified age bands, income bands, gender, vulnerable cus-
tomers
• Volume of business sold within vs. outside of the target market
• Ratio of premiums and no. of policies sold to target market out of total
potential customer base
New product trends • Types and numbers of new products and their target markets
• Cancellation rates within the first year or within the “cooling-off period”
• Marketing expenses of new products
• Advertising material, especially when it is a new area of growth e.g
Covid-19 products
Key growth drivers or
contractions• Product lines that outperform or underperform others in terms of pre-
mium and policy growth rates
Complexity of products Premiums and no. of policies of
• Products with particularly high cancellation/lapse rates, claims rejection
or withdrawal rates, complaints
• Products considered complex in the market e.g products that need
advice, investment or savings-linked products, products that are depen-
dent on financial market performance (participating products), products
with add-ons or bundled benefits
32
4. LIST OF KPIs
✔ Best to collect comprehensive raw data that allows the supervisor to generate the KPIs and ratios they need, rather than requiring a few fixed KPIs in statutory returns.
✔ Any categorisations used should be consistent across all product-level KPIs to enable easy triangulation.
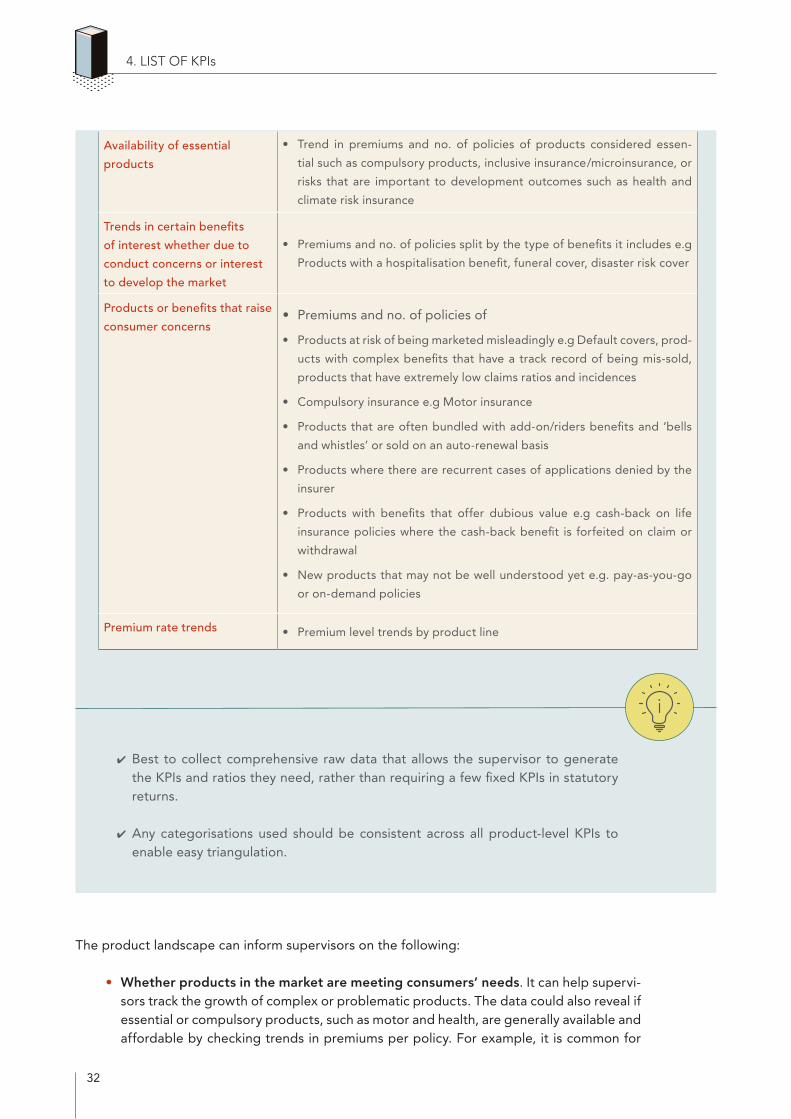
The product landscape can inform supervisors on the following:
• Whether products in the market are meeting consumers’ needs. It can help supervi-sors track the growth of complex or problematic products. The data could also reveal if essential or compulsory products, such as motor and health, are generally available and affordable by checking trends in premiums per policy. For example, it is common for
Availability of essential
products
• Trend in premiums and no. of policies of products considered essen-
tial such as compulsory products, inclusive insurance/microinsurance, or
risks that are important to development outcomes such as health and
climate risk insurance
Trends in certain benefits
of interest whether due to
conduct concerns or interest
to develop the market
• Premiums and no. of policies split by the type of benefits it includes e.g
Products with a hospitalisation benefit, funeral cover, disaster risk cover
Products or benefits that raise
consumer concerns• Premiums and no. of policies of
• Products at risk of being marketed misleadingly e.g Default covers, prod-
ucts with complex benefits that have a track record of being mis-sold,
products that have extremely low claims ratios and incidences
• Compulsory insurance e.g Motor insurance
• Products that are often bundled with add-on/riders benefits and ‘bells
and whistles’ or sold on an auto-renewal basis
• Products where there are recurrent cases of applications denied by the
insurer
• Products with benefits that offer dubious value e.g cash-back on life
insurance policies where the cash-back benefit is forfeited on claim or
withdrawal
• New products that may not be well understood yet e.g. pay-as-you-go
or on-demand policies
Premium rate trends • Premium level trends by product line
33
property insurance to experience a sharp increase in premiums after a natural disaster, which may price vulnerable consumers out of the market13. It could reveal protection gaps – for instance, unaffordability or a lack of certain product lines such as climate risk insurance or insurance for the low-income market.
• What matching competence and qualifications are needed from insurers and inter-mediaries. This helps them to set targeted and proportionate requirements, such as advice requirements for products that are long-term and complex with savings ele-ments, and no advice for shorter-term and simpler products. Prudential supervisors already examine this information from a financial soundness point of view – that is, whether insurers have the financial capability and risk management systems in place to be able to take on the risks from the products they underwrite.
• Anticipate where there might be risks of mis-selling or inadequate disclosure. The more complex a product is relative to the vulnerability or financial literacy of the con-sumer, the higher the conduct risk is. This is clearly illustrated in inclusive insurance seg-ments. Some products are also more likely to be mis-sold due to the current economic environment. In the wake of the initial waves of Covid-19, it was discovered that some insurers were promoting products as covering Covid-19 risks in a more comprehen-sive way than they did in reality. Additionally, compulsory products may see issues of over-pricing and poor disclosure. Where there are red flags such as high lapse rates and complaints, supervisors would have better insights into what the problematic products are.
Product landscape data could be challenging to monitor given it requires extensive raw data as well as supervisory judgement in categorising products and attributing risks. Supervisors can start by utilising existing data. Most supervisors will have some form of a product registry due to insurers having to notify or submit new products for approval before launch. Supervisors can also mine information from product submissions and on-site reviews of product development approaches, such as:
• How customers are segmented and defined by the insurer, including any customer research conducted.
• Underwriting guidelines and approach.
• Notification of changes and modifications made to existing or new products. Some supervisors specifically request information on changes to policies requested by con-sumers.
Prudential supervisors will normally also have premiums split by product line or underwriting portfolios, and often the number of policies. Product line categories may need to be repur-posed for conduct analysis. For example, supervisors will need to internally classify products as high-risk, complex, essential etc., rather than simply categorising by type. Target client seg-ments are subjective and need to be discussed with the insurers to set a workable definition. Not all insurers would segment their customers in a way conduct supervisors expect. Overall, it is important that the regulations allow flexibility for supervisors to update definitions and categorisations, especially as trends emerge or product lines evolve.
13 Some supervisors are also already seeing/expecting that the pandemic will drive up health and funeral insurance premiums.
4. LIST OF KPIs
34
4. LIST OF KPIs
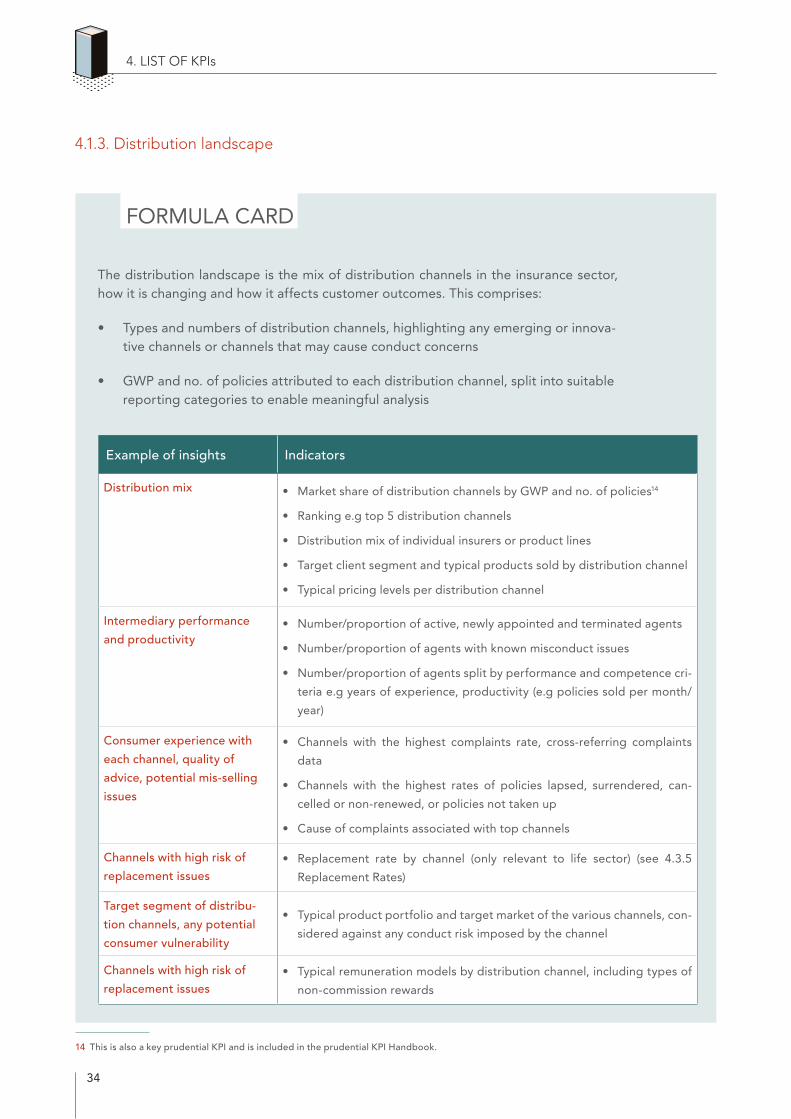
4.1.3. Distribution landscape
FORMULA CARD
The distribution landscape is the mix of distribution channels in the insurance sector, how it is changing and how it affects customer outcomes. This comprises:
• Types and numbers of distribution channels, highlighting any emerging or innova- tive channels or channels that may cause conduct concerns
• GWP and no. of policies attributed to each distribution channel, split into suitable reporting categories to enable meaningful analysis
14 This is also a key prudential KPI and is included in the prudential KPI Handbook.
Example of insights Indicators
Distribution mix • Market share of distribution channels by GWP and no. of policies14
• Ranking e.g top 5 distribution channels
• Distribution mix of individual insurers or product lines
• Target client segment and typical products sold by distribution channel
• Typical pricing levels per distribution channel
Intermediary performance
and productivity• Number/proportion of active, newly appointed and terminated agents
• Number/proportion of agents with known misconduct issues
• Number/proportion of agents split by performance and competence cri-
teria e.g years of experience, productivity (e.g policies sold per month/
year)
Consumer experience with
each channel, quality of
advice, potential mis-selling
issues
• Channels with the highest complaints rate, cross-referring complaints
data
• Channels with the highest rates of policies lapsed, surrendered, can-
celled or non-renewed, or policies not taken up
• Cause of complaints associated with top channels
Channels with high risk of
replacement issues• Replacement rate by channel (only relevant to life sector) (see 4.3.5
Replacement Rates)
Target segment of distribu-
tion channels, any potential
consumer vulnerability
• Typical product portfolio and target market of the various channels, con-
sidered against any conduct risk imposed by the channel
Channels with high risk of
replacement issues• Typical remuneration models by distribution channel, including types of
non-commission rewards
35
4. LIST OF KPIs
✔ Best to collect comprehensive raw data that allows the supervisor to themselves generate the KPIs and ratios they need, rather than requiring a few fixed KPIs in statutory returns.
✔ Any categorisations used should be consistent across all intermediary or distribu-tion channel-level KPIs to enable easy triangulation.
Most supervisors have administrative data based on the number of individual or corporate agents registered. However, in more diverse distribution landscapes, this may not provide enough meaningful conduct information as anything ranging from a funeral home to a vehicle repair shop to a mobile network operator (MNO) could be licensed as a corporate agent, but each may have very different client segments, remuneration models, product types, training and capacity issues, and therefore different conduct issues.
Knowing prevalent distribution channels well can help supervisors better anticipate conduct risks. Each distribution channel has varying services, target markets, incentives and capacity. An insurer’s chosen distribution model could increase or decrease the information asymmetry arising from the complexity of products versus the vulnerability of the customer base (IAIS, 2015). Global experience shows that some channels are prone to mis-selling more than others. Keeping track of the distribution landscape helps supervisors anticipate these risks, while sup-porting supervisory efforts in monitoring or pursuing market development15. Key distinctions between distribution channels that impact how they interact with consumers and sell products include:
• ‘Who they answer to’ i.e. whether it is an independent or tied intermediary:
• A tied agent only sells products from the insurers they represent. As such consum-ers might not be aware of more suitable plans on the market. Some supervisors have taken steps to correct the asymmetry of information by enabling the growth of product comparators, financial needs analysis tools or publishing key KPIs themselves that help consumers compare and shop for products.16 Tied agents tend to be paid by commissions, and so present all the associated conduct issues.
• Independent advisors are meant to act on behalf of the customers and find the best product for the customers. One key issue here is managing conflicts of inter-est.
15 Insurance supervisors in SSA and other emerging markets increasingly take an active role in developing their insurance sectors, such as modernising and digitalising distribution models, closing protection gaps or encouraging healthy competition. It is impor-tant the supervisors take an integrated approach i.e. measure development progress in a certain area (e.g. premiums/number of people covered under new digital insurance models) while concurrently assessing implications on customer outcomes and conduct risk (e.g. complaints, claims KPIs of the relevant product lines).
16 See ASIC’s life insurance claims comparison tool: https://moneysmart.gov.au/how-life-insurance-works/life-insurance-claims-comparison-tool
36
• With direct channels, no commissions are paid and therefore there is less potential for remuneration-caused conflict of interest.
• Digital or in-person: On digital platforms, it is often hard to differentiate between education, advice and marketing. This may mean a need for disclosure and marketing practices are suitable for digital media. Supervisors normally have requirements on ‘distance selling’ or ‘remote selling’, but with the advent of social media and videocon-ferencing technology, the boundaries are changing.
• Whether insurance is the core business of the distribution channel: Where insurance is sold as a secondary service, there might be competing business goals and conflict of interest. Bancassurance was named as a major source of mis-selling (Reifner et al., 2013) due to inadequately trained bank staff and products are designed to suit the bank’s objectives. In mobile insurance, the MNO’s primary interest is to grow their mobile business revenue. In such cases, supervisors may want to observe the insurer’s product development approach and ensure consumer needs are not being sidelined. The inter-mediary may also bundle the insurance alongside their services, which creates the risk of mis-selling or inadequate disclosure on the insurance component.
• How the channel is paid and incentivised: Different channels would have different remuneration models (see Concept Box 2: Expenses and Remuneration).
Understanding the overall composition of channels can yield significant conduct and policy insights17. For instance:
• Market dominance by too few intermediaries or too few types of intermediaries can lead to insurers competing to tie up with these agents, leading to high commissions that affect customer value. Longstanding dominance can also lead to a stagnant mar-ket with little innovation in products and technology.
• Where corporate agents or bancassurance is predominant, it is common that insurers pay partnership fees to enter into exclusive distribution agreements. Where these partnerships are renewed, corporate agents may push for higher fees or remuneration packages, leading to higher expenses, possibly at detriment to customer value.
• If distribution channels are all focused on wealthier segments, insurance will likely still be out of reach for low-income and vulnerable segments regardless of the availability of suitable products. Insurers often develop products based on what they think agents ‘can sell’.
• If there are new, innovative distribution channels emerging, supervisors may want to keep an eye out for new conduct concerns or encourage the channel to develop further if it is good for consumers. If new channels are stagnating, supervisors might also want to understand why. For instance, big data analytics in marketing and distribution may be used to unfairly take advantage of behavioural biases (such as applying less favour-able charges to customers who are identified as less likely to complain or switch prod-ucts). The use of customer data may also lead to information privacy issues (IAIS, 2015).
17 See Bank Negara Malaysia analysis of the life sector here: https://www.bnm.gov.my/documents/20124/856371/cp03_001_box.pdf
4. LIST OF KPIs
37
KPIs on intermediary performance can inform the supervisor which channel types are less likely to deliver on customer outcomes. Intermediary performance can be measured from the per-spective of qualifications, productivity and misconduct track record. For instance, in Malaysia, it was found that in 2016, 60% of agents operate on a part-time basis and there is a high churn rate – 7 out of 10 insurance agents quit after 3 years18. It can also be measured from the perspective of customer experience, namely complaints and consumer-initiated lapses/non-renewals.
Types of intermediaries
• Direct selling: Where insurers sell directly to consumers without an interme-diary. This could be the insurer’s own staff at a branch, or via the insurer’s web portal online. No commissions are paid.
• Tied or linked agent: Can only promote the services of a limited number of insurers. This number is usually limited either through ‘principal-agent limit’ requirements in some jurisdictions (e.g. in Ghana an agent can only represent one insurer) or exclusivity arrangements. Exclusivity arrangements often involve an upfront partnership fee. Often, corporate agents have a core business other than insurance. In life insurance, agents are normally expected to be qualified to give ‘advice’ and recommend products. Non-life agents do not usually provide advice. Tied agents can take countless forms, as individuals and most incorpo-rated entities are allowed to become a tied agent as long as they meet the com-petence, qualification and training requirements.
• Individuals
• Corporate agents
− Mutuals, Cooperatives and other Community-based Organisations (MCCOs): More common in inclusive insurance and community-based con-texts where the MCCO sometimes takes up or ‘distributes’ insurance to benefit their members. They are often the master policyholder of a group insurance policy but may also be an agent in order to be remunerated or where regulations enable it.
− MNOs: Typically enter into insurance to strengthen the loyalty of mobile client base and increase sources of revenue.
− Funeral societies
− Retailers such as car dealers, grocery shops, supermarkets and utility pro-viders
− Bancassurance (a bank or microfinance institution (MFI)), though often reg-ulated under a separate framework
• Independent broker/financial adviser: Not tied or linked and works without having been contracted or remunerated by the insurer. Brokers and financial
18 See BNM Malaysia’s analysis of the life sector intermediaries here: https://www.bnm.gov.my/documents/20124/856371/cp03_001_box.pdf
4. LIST OF KPIs
Concept Box 1
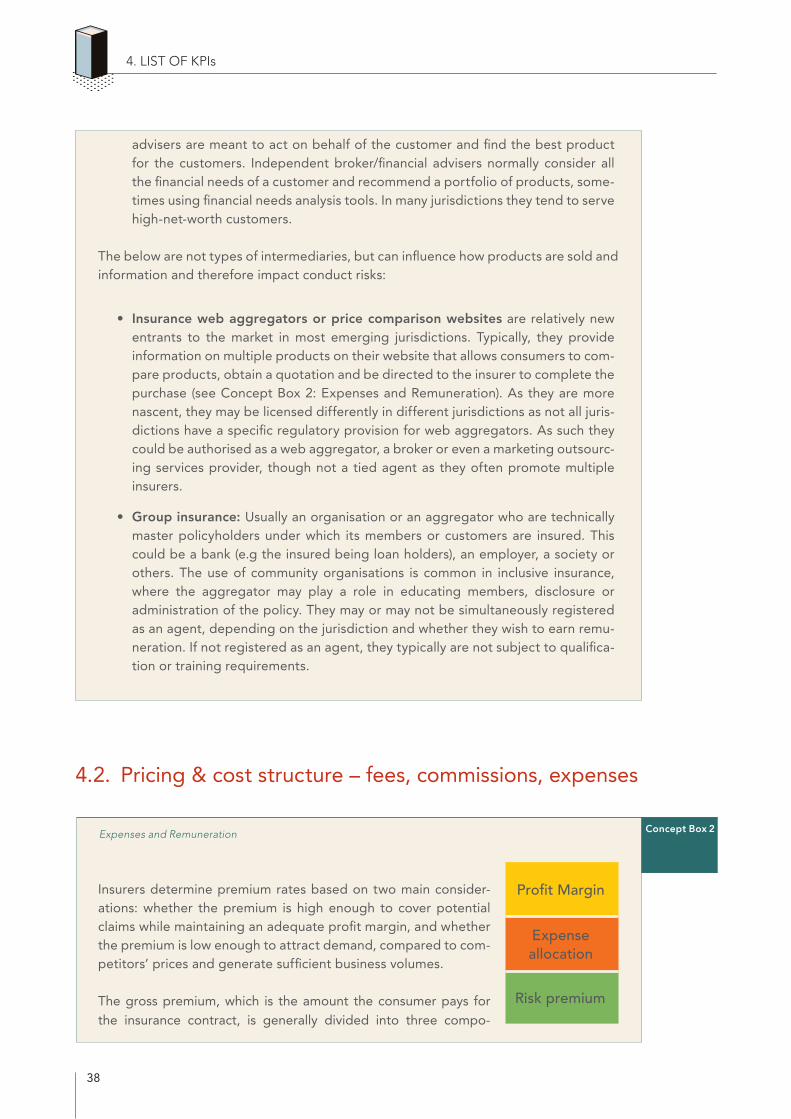
38
4. LIST OF KPIs
Concept Box 2
advisers are meant to act on behalf of the customer and find the best product for the customers. Independent broker/financial advisers normally consider all the financial needs of a customer and recommend a portfolio of products, some-times using financial needs analysis tools. In many jurisdictions they tend to serve high-net-worth customers.
The below are not types of intermediaries, but can influence how products are sold and information and therefore impact conduct risks:
• Insurance web aggregators or price comparison websites are relatively newentrants to the market in most emerging jurisdictions. Typically, they provideinformation on multiple products on their website that allows consumers to com-pare products, obtain a quotation and be directed to the insurer to complete thepurchase (see Concept Box 2: Expenses and Remuneration). As they are morenascent, they may be licensed differently in different jurisdictions as not all juris-dictions have a specific regulatory provision for web aggregators. As such theycould be authorised as a web aggregator, a broker or even a marketing outsourc-ing services provider, though not a tied agent as they often promote multipleinsurers.
• Group insurance: Usually an organisation or an aggregator who are technicallymaster policyholders under which its members or customers are insured. Thiscould be a bank (e.g the insured being loan holders), an employer, a society orothers. The use of community organisations is common in inclusive insurance,where the aggregator may play a role in educating members, disclosure oradministration of the policy. They may or may not be simultaneously registeredas an agent, depending on the jurisdiction and whether they wish to earn remu-neration. If not registered as an agent, they typically are not subject to qualifica-tion or training requirements.
4.2. Pricing & cost structure – fees, commissions, expenses
Expenses and Remuneration
Insurers determine premium rates based on two main consider-ations: whether the premium is high enough to cover potential claims while maintaining an adequate profit margin, and whether the premium is low enough to attract demand, compared to com-petitors’ prices and generate sufficient business volumes.
The gross premium, which is the amount the consumer pays for the insurance contract, is generally divided into three compo-
Profit Margin
Expense allocation
Risk premium
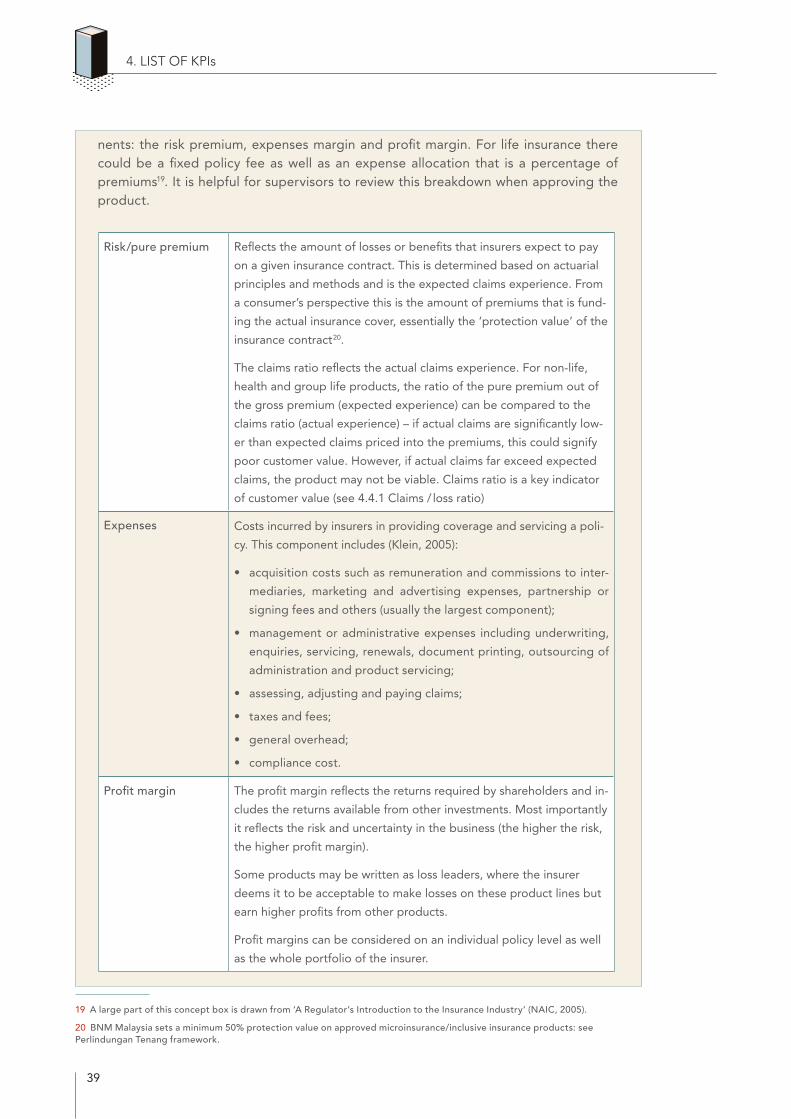
39
nents: the risk premium, expenses margin and profit margin. For life insurance there could be a fixed policy fee as well as an expense allocation that is a percentage of premiums19. It is helpful for supervisors to review this breakdown when approving the product.
19 A large part of this concept box is drawn from ‘A Regulator’s Introduction to the Insurance Industry’ (NAIC, 2005).
20 BNM Malaysia sets a minimum 50% protection value on approved microinsurance/inclusive insurance products: see Perlindungan Tenang framework.
4. LIST OF KPIs
Risk/pure premium Reflects the amount of losses or benefits that insurers expect to pay
on a given insurance contract. This is determined based on actuarial
principles and methods and is the expected claims experience. From
a consumer’s perspective this is the amount of premiums that is fund-
ing the actual insurance cover, essentially the ‘protection value’ of the
insurance contract20.
The claims ratio reflects the actual claims experience. For non-life,
health and group life products, the ratio of the pure premium out of
the gross premium (expected experience) can be compared to the
claims ratio (actual experience) – if actual claims are significantly low-
er than expected claims priced into the premiums, this could signify
poor customer value. However, if actual claims far exceed expected
claims, the product may not be viable. Claims ratio is a key indicator
of customer value (see 4.4.1 Claims / loss ratio)
Expenses Costs incurred by insurers in providing coverage and servicing a poli-
cy. This component includes (Klein, 2005):
• acquisition costs such as remuneration and commissions to inter-
mediaries, marketing and advertising expenses, partnership or
signing fees and others (usually the largest component);
• management or administrative expenses including underwriting,
enquiries, servicing, renewals, document printing, outsourcing of
administration and product servicing;
• assessing, adjusting and paying claims;
• taxes and fees;
• general overhead;
• compliance cost.
Profit margin The profit margin reflects the returns required by shareholders and in-
cludes the returns available from other investments. Most importantly
it reflects the risk and uncertainty in the business (the higher the risk,
the higher profit margin).
Some products may be written as loss leaders, where the insurer
deems it to be acceptable to make losses on these product lines but
earn higher profits from other products.
Profit margins can be considered on an individual policy level as well
as the whole portfolio of the insurer.
40
Prudential supervisors normally use this information to assess the earnings and profit-ability of the insurer. They investigate areas such as the business volumes and growth and the impact of claims and expenses on financial performance. Poor expense man-agement also points to governance issues, which affects both conduct and prudential objectives.
For conduct supervisors it is important to understand the structure of operational expenses of insurers: including amounts of key expense components. This helps super-visors to understand the key cost drivers and trends, which impact an insurer’s sales strategies, which in turn directly influences customer outcomes. It can also help super-visors detect potential conflicts of interests – any remuneration or fee arrangements that go against consumer interest. Not all indications are negative – for example, a sud-den spike in marketing expenses might simply mean a new product has been launched.
Calculating the proportion of premiums allocated to key cost components can also yield insights on customer value and the appropriateness of the product. Combined with other KPIs it supports the assessment of customer outcomes such as customer experience, appropriateness of the target market, conflict of interest and quality of ser-vice and advice. For example, if supervisors find that customers are getting poor value in terms of claims ratios, or if premiums and lapse rates are increasing, signalling that affordability is threatened, supervisors can check expenses data to investigate if this is due to expense management issues. The key expense-related ratios are elaborated in the following sections.
Prudential supervisors usually collect at least insurer-level expense information ratios. Conduct supervisors could coordinate with prudential supervisors and draw on existing data to avoid duplications. A key difference between prudential and conduct super-vision is that conduct supervisors may want to analyse this at a more granular level, meaning at the intermediary, product or even benefit level in addition to insurer-level.
Remuneration of intermediaries (including own sales force)
One key component of expenses is acquisition cost, particularly the amount of remu-neration paid to the intermediaries. There are various forms of remunerations, set out below. It is important to ascertain what is the common practice in the jurisdiction. Most supervisors still primarily focus on commissions, as this is still the predominant form of remuneration. However, some supervisors are increasingly realising that enti-ties are rewarded through non-commission incentives, such as through fees or profit sharing arrangements. Insurers also commonly pay upfront partnership fees to cor-porate agents as a means of securing exclusive distribution rights. In some markets it is also common that agents are offered rewards such as luxurious holidays for sales performance21.
21 Malaysia caps expenditure on such benefits limiting ‘agency-related expenses’ on certain life insurance product lines: https://www.bnm.gov.my/documents/20124/761679/pd_occforlifeandfamilytakafulbusiness_+dec2019.pdf/d1486cfb-63e2-6fd2-7b7d-6c8e30569bf2?t=1578648660074
4. LIST OF KPIs
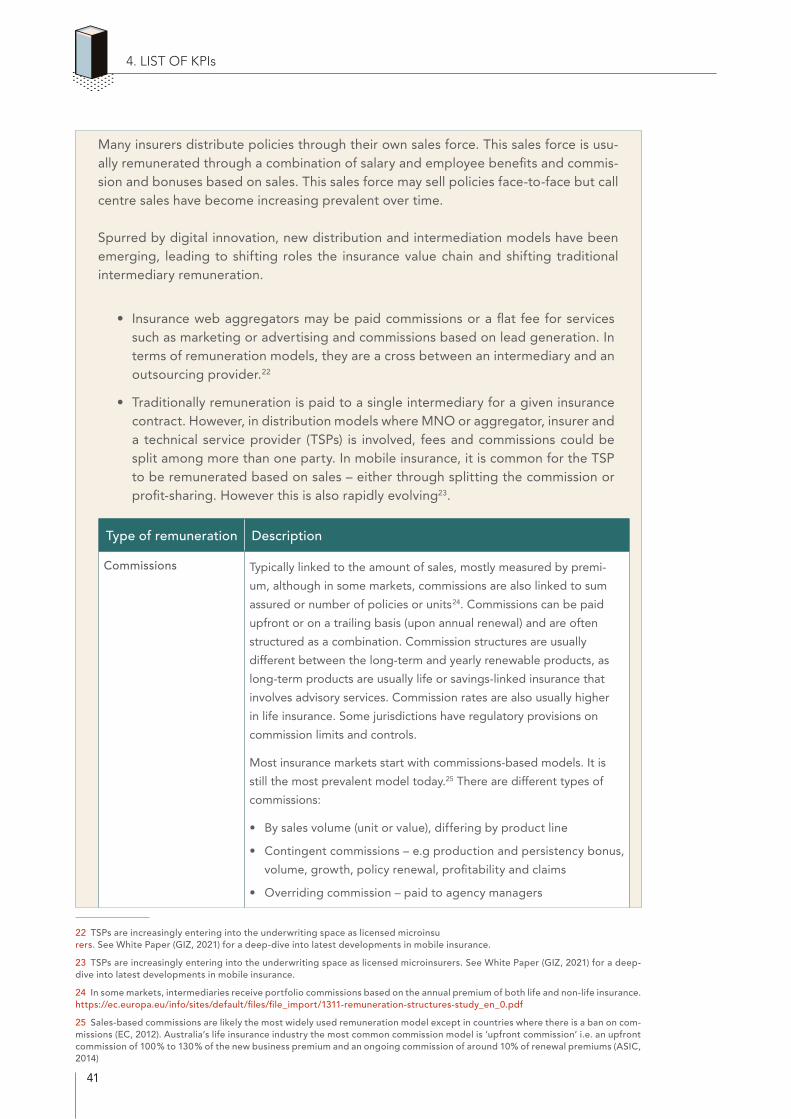
41
Many insurers distribute policies through their own sales force. This sales force is usu-ally remunerated through a combination of salary and employee benefits and commis- sion and bonuses based on sales. This sales force may sell policies face-to-face but call centre sales have become increasing prevalent over time.
Spurred by digital innovation, new distribution and intermediation models have been emerging, leading to shifting roles the insurance value chain and shifting traditional intermediary remuneration.
• Insurance web aggregators may be paid commissions or a flat fee for servicessuch as marketing or advertising and commissions based on lead generation. Interms of remuneration models, they are a cross between an intermediary and anoutsourcing provider.22
• Traditionally remuneration is paid to a single intermediary for a given insurancecontract. However, in distribution models where MNO or aggregator, insurer anda technical service provider (TSPs) is involved, fees and commissions could besplit among more than one party. In mobile insurance, it is common for the TSPto be remunerated based on sales – either through splitting the commission orprofit-sharing. However this is also rapidly evolving23.
22 TSPs are increasingly entering into the underwriting space as licensed microinsurers. See White Paper (GIZ, 2021) for a deep-dive into latest developments in mobile insurance.
23 TSPs are increasingly entering into the underwriting space as licensed microinsurers. See White Paper (GIZ, 2021) for a deep-dive into latest developments in mobile insurance.
24 In some markets, intermediaries receive portfolio commissions based on the annual premium of both life and non-life insurance. https://ec.europa.eu/info/sites/default/files/file_import/1311-remuneration-structures-study_en_0.pdf
25 Sales-based commissions are likely the most widely used remuneration model except in countries where there is a ban on com-missions (EC, 2012). Australia’s life insurance industry the most common commission model is ‘upfront commission’ i.e. an upfront commission of 100% to 130% of the new business premium and an ongoing commission of around 10% of renewal premiums (ASIC, 2014)
4. LIST OF KPIs
Type of remuneration Description
Commissions Typically linked to the amount of sales, mostly measured by premi-
um, although in some markets, commissions are also linked to sum
assured or number of policies or units24. Commissions can be paid
upfront or on a trailing basis (upon annual renewal) and are often
structured as a combination. Commission structures are usually
different between the long-term and yearly renewable products, as
long-term products are usually life or savings-linked insurance that
involves advisory services. Commission rates are also usually higher
in life insurance. Some jurisdictions have regulatory provisions on
commission limits and controls.
Most insurance markets start with commissions-based models. It is
still the most prevalent model today.25 There are different types of
commissions:
• By sales volume (unit or value), differing by product line
• Contingent commissions – e.g production and persistency bonus,
volume, growth, policy renewal, profitability and claims
• Overriding commission – paid to agency managers
42
4.2.1. Amounts of remuneration by category, including outsourcing
FORMULA CARD
Amounts of remuneration by category, including outsourcing
This can include the amount of fees, remunerations and incentives paid to (i) inter-mediaries for distributing and servicing insurance products and (ii) other outsourced services beyond the sales process. This can be categorised by remuneration types and entities that are prevalent in the market. Some supervisors group according to commis-sion and non-commission fees.
As an example: South Africa collects quarterly information on total commissions paid, disaggregated by distribution model; binder fees paid to binder holders, broken down by service rendered; profit share paid to underwriting managers27 ; aggregation fees and outsourcing fees paid to all third parties, including intermediaries and underwriting managers. Botswana also looks at the frequency of commission payments.
Collect at the insurer and intermediary level.
26 Seen as a high-risk model by NIC Ghana
27 See: https://businessinsurance.co.za/news/underwriting-manager/
4. LIST OF KPIs
Fee-based services • Flat fees for a service, e.g used for some insurance web aggrega-
tors or product comparison websites
• Advice-based fees, e.g hourly and fixed fees. In a few jurisdictions,
brokers are only allowed to be paid a fee rather than commissions.
• Binder remuneration. Binder holders are third parties, who per-
form specific functions on behalf of an insurer and a fee may be
charged according to each type of activity e.g entering, varying or
renewing a policy, settling claims, determining wording, claims or
benefits under a policy.
Partnership or signing
fees
• Upfront fees that insurers sometimes pay to distribution partners
upon entering into a distribution arrangement such as bancassur-
ance, MNOs and other corporates.
Salary, commission and
bonuses
• Salary costs also include medical insurance and retirement provi-
sions
• Commission and bonuses may also include contingent commis-
sions
Other rewards and
incentives• Profit share26
• Sponsorship of agents’ participation in seminars/conference
• Rewards in kind such as overseas trips
43
Supervisors can compare actual levels and types of remuneration paid between comparable products and providers. This can help supervisors to understand the prevalent remuneration strategies, which helps supervisors to assess the:
• Sales and product design strategies of the insurer. In a market where it is primarily sales-based commissions, competition is intense and commissions are high, insurers commonly design products based on whatever sells best in the short term, sometimes shaped by intermediaries or through ‘copying and pasting’ from other competitors’ products with add-ons as ‘bells and whistles’, rather than based on consumer needs.
• Effectiveness and potential unintended consequences of regulatory measures. In some markets, the limits on commissions and fees have been circumvented by paying other kinds of fees and incentives.
• Customer value, by understanding what policyholders are paying for, and whether this is fair to either the consumer or the intermediary/insurer. For instance, in Australia an ASIC study found that in the motor insurance market consumers were paying more in commissions than they were receiving in claims overall28. In South Africa, a key principle is that fees and commissions should be reasonable compared to the services provided and the service provider should not be remunerated for the same service twice.
• Incentives for intermediaries and distribution partners that are at play and whether these conflict with consumer interests. Strongly skewed incentives on top of sales pres-sures can lead to problematic selling practices such as churning, twisting, overcharg-ing, inflated products, forced bundling/add-ons, the sale of unsuitable products or the confusion of products, and lack of transparency, pressure-selling tactics (Reifner et al., 2013). Particular focus areas to identify potential conflicts of interest include (IAIS, 2015):
• The extent to which remuneration is based solely on the number of sales and/or premium size, or whether the remuneration is also dependent on measures such as quality of compliance with fair treatment requirements, product retention, etc.
• Whether differentiated incentives or remuneration levels cause any sales biases to higher-earning products, leading intermediaries to push products earning them the highest commission rather than the product that best meets the consumer’s needs.
• The availability and amount of additional volume-based incentives or rewards over and above commissions.
• The extent to which remuneration is paid upfront and presence of measures such as commission clawback upon misconduct/lapse/cancellation, if so, the extent to which this may be influencing policy replacements or churn against the interest of the consumer. It can also create a short-term incentive, where the intermediary
28 See ASIC report on A market that is failing consumers: The sale of addon insurance through car dealers (2016): https://asic.gov.au/regulatory-resources/find-a-document/reports/rep-492-a-market-that-is-failing-consumers-the-sale-of-add-on-insurance-through-car-dealers/
4. LIST OF KPIs
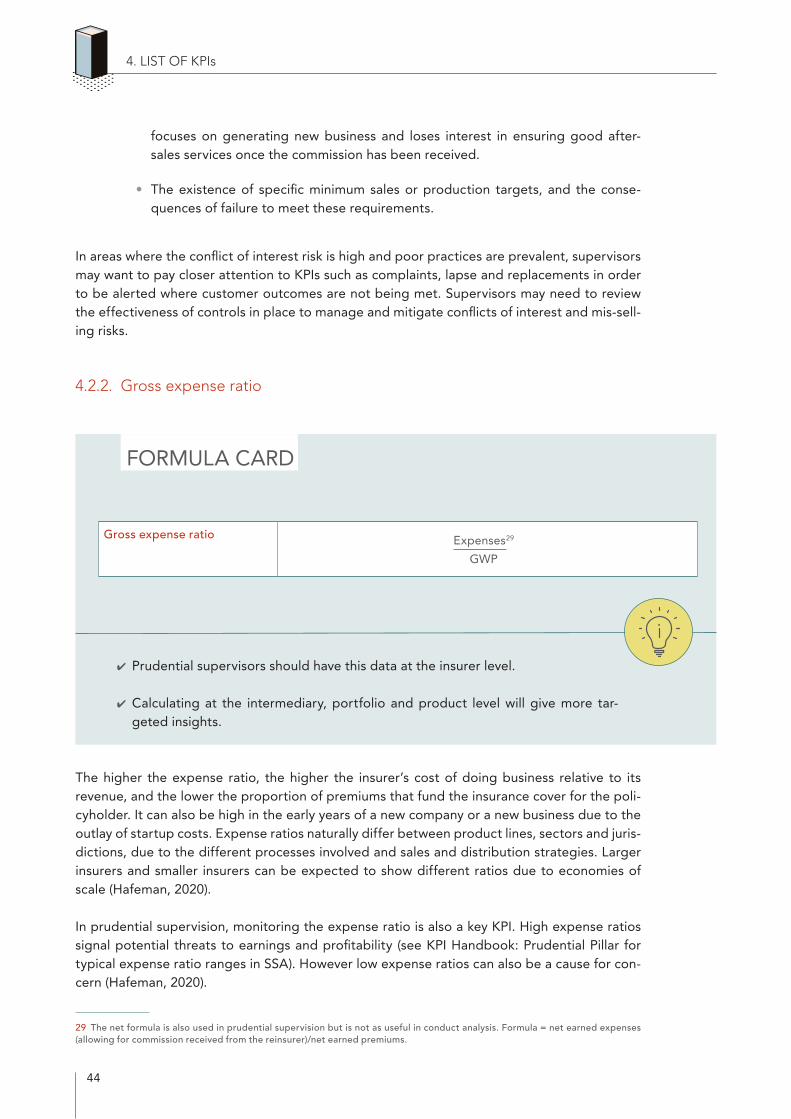
44
focuses on generating new business and loses interest in ensuring good after-sales services once the commission has been received.
• The existence of specific minimum sales or production targets, and the conse-quences of failure to meet these requirements.
In areas where the conflict of interest risk is high and poor practices are prevalent, supervisors may want to pay closer attention to KPIs such as complaints, lapse and replacements in order to be alerted where customer outcomes are not being met. Supervisors may need to review the effectiveness of controls in place to manage and mitigate conflicts of interest and mis-sell-ing risks.
4.2.2. Gross expense ratio
FORMULA CARD
Gross expense ratio Expenses29
GWP
✔ Prudential supervisors should have this data at the insurer level.
✔ Calculating at the intermediary, portfolio and product level will give more tar-geted insights.
The higher the expense ratio, the higher the insurer’s cost of doing business relative to its revenue, and the lower the proportion of premiums that fund the insurance cover for the poli-cyholder. It can also be high in the early years of a new company or a new business due to the outlay of startup costs. Expense ratios naturally differ between product lines, sectors and juris-dictions, due to the different processes involved and sales and distribution strategies. Larger insurers and smaller insurers can be expected to show different ratios due to economies of scale (Hafeman, 2020).
In prudential supervision, monitoring the expense ratio is also a key KPI. High expense ratios signal potential threats to earnings and profitability (see KPI Handbook: Prudential Pillar for typical expense ratio ranges in SSA). However low expense ratios can also be a cause for con-cern (Hafeman, 2020).
29 The net formula is also used in prudential supervision but is not as useful in conduct analysis. Formula = net earned expenses (allowing for commission received from the reinsurer)/net earned premiums.
4. LIST OF KPIs
45
From a conduct perspective, expense ratios support investigations on customer value and appropriateness and affordability of the product. For instance, if claims ratios are low and expense ratios are high, this could signal that the business is inefficient and/or consumers are receiving poor value in return for their premium. If premiums are steadily increasing alongside high expense ratios coupled with high lapse rates or low renewal rates, it could mean that ris-ing expenses are causing products to become unaffordable for consumers.
When comparing the claims ratio to the expense ratio, supervisors should take note that the denominator for the claims ratio is based on earned premiums rather than written premiums. Supervisors may directly compare the claims and expense ratios if earned premiums are not too different from written premiums, which may be the case in monthly policies. Exceptions, where this comparison is less valid, include single-premium policies (e.g. index insurance schemes) where policyholders may pay upfront premiums for seasonal cover in advance.
While a high expense ratio is of concern, an expense ratio that is exceptionally low compared to peers could also be an issue. On one hand, it might be due to the insurer introducing cost-efficient processes such as automation. On the other, it might signal that the insurer is not spending enough to support fair treatment of customers such as on training, systems and staff, leading to poor quality of advice, quality of service and even mis-selling. This can be verified against customer experience KPIs such as renewals, TATs and complaints.
Trend analysis can also be revealing. For instance, South Africa monitors marketing expenses and the number of intermediaries on a quarterly basis, as this could reveal a focus on sales or campaigns to increase sales of specific products. Some insurers also launch products at a cer-tain time in the year and the indicators above might indicate that as well. To support expense analysis supervisors can check for the following:
• Acquisition costs (spend on distribution channels) and ongoing management costs sep-arately. Checking claims costs may also indicate inefficiencies in claims handling.
• Assess expenses by product line to determine customer value and expenses for the business as a whole to assess efficiency.
• Large expenses incurred or large increases. This includes looking for large payments to a certain service provider or a related company. This is supported by an analysis of profit-sharing agreements and rates to investigate potential conflicts of interest.
• Amount spent on outsourced activities e.g. third-party administration services.
When new business models emerge, it is common that expenses are initially high. For exam-ple, in the early stages of mobile insurance growth in a market, expenses are high due to the implementation of new systems and partnerships, commissions being split between more than one party and therefore profit margins are often thin.
Supervisors can check if expense ratios are increasing by tracking changes over time and unreasonably high by comparing expense ratios across peer insurers. Supervisors can also compare the expense ratio between different distribution models or insurers for similar prod-ucts. Acquisition expenses may need to be adjusted for the term of the product to make fair comparisons especially if there is an upfront commission.
4. LIST OF KPIs

46
4.2.3. Gross commission ratio
FORMULA CARD
✔ A subset of the expense ratio as commissions are part of expenses.
✔ Collect at the insurer and intermediary/distribution model level. Some supervi-sors also analyse for certain portfolios or product lines.
✔ Can support with information on non-commission fees on an ad-hoc basis.
The commission ratio reflects the amount of commissions being paid relative to the premiums paid. The higher the commission ratio, the higher the acquisition cost for the insurer vis-a-vis business gained, and the lower the proportion of premiums that is funding the insurance benefit for the policyholder. Commissions are often the largest component of expenses and therefore significantly influences the overall cost-efficiency of the insurer or product.
Focusing on the commission ratio specifically can reveal key insights on intermediary-related issues. A common reason why commissions and other incentives skyrocket is because insurers heavily compete to gain market share. This could be the case with paying insurance agents, as well as where insurers compete to partner with a few dominant intermediaries with very large client bases (such as bancassurance, MNOs, MFIs, retailers, utility providers)31. Competition itself is not bad as long as it translates to better products and quality of servicing.
It also provides a more nuanced analysis of customer value: are consumers paying substantial amounts in commissions compared to how much value they receive out of it in claims payments or the advice and services provided? Commissions can be assessed alongside other key indi-
30 DWP are the total amount of an insurer's written premiums without any allowance for premiums ceded to reinsurers (Internatio-nal Risk Management Institute, 2021). It does not include premiums paid between insurers or reinsurers.
31 See A2ii’s paper on Using Key Performance Indicators (KPIs) in Inclusive Insurance Supervision (2019): https://www.a2ii.org/en/news/using-key-performance-indicators-kpis-in-inclusive-insurance-supervision
4. LIST OF KPIs
Gross commission ratio Commissions paid30
GWP
Other variations /
supplementary ratios• Average maximum commissions = Average of the maximum commission
payable by each of the insurers on each product they offer as a percent-
age of the premium
• Commissions paid to claims paid ratio
• Commission and acquisition expenses as a percentage of Net Premium
Earned (NPE)
47
cators of customer value and quality of service, such as the claims ratio, complaints and TATs. This KPI is also useful for monitoring compliance with regulatory limits on commissions, which are often expressed as a percentage of premiums. Burkina Faso, a member country of CIMA, currently caps the commissions paid by life insurers to banks at 5%.32
EXAMPLE: AUSTRALIA
A 2016 study by the Australian Securities & Investments Commission (ASIC) on the sale of add-on insurance sold alongside motor insurance found that the ratio of com-missions paid to car dealers to the amount of claims policyholders received was 4:1. The three insurers paying out the highest commissions, measured by the average of the maximum commissions paid by each insurer across all products in the sample, sold the most policies. This highlighted issues with conflict of interest and pressure-selling tactics. ASIC ultimately concluded that that add-on insurance sold through this channel represents poor value and is designed and sold in a way that does not meet consumer needs33.
To assess if commission rates are high, supervisors can track changes over time. Supervisors can also compare the commission ratio between different intermediaries or insurers for similar product lines. Supervisors can also compare to global data. The OECD for example regularly compiles and publishes commission ratios of OECD members34.
As noted in the section above, there are other forms of remunerations aside from commis-sions. If other remuneration modes play a significant role, supervisors also need to assess the amounts of other types of remunerations to get an accurate reflection of the distribution/acquisition cost to the insurer/ consumer.
32 Some supervisors counter high commissions by limiting or banning commissions, usually with different rates for different pro-duct lines. Others are pursuing longer-term strategies to improve market transparency and introduce new alternative distribution channels. Limiting commissions is tricky to balance, as it could have unintended consequences – it may lead to products being no longer affordable as fee-based advice is often more expensive, or insurers circumventing by paying other forms of remuneration. In Burkina Faso, it was found that commissions were paid to individual bank staff on top of the commissions paid to banks, leading to effectively higher rates than the regulatory ceiling. Commission limits can also limit the growth of inclusive insurance markets: It is often expressed as a percentage of premiums, and as inclusive insurance premiums are low, the absolute amount of commissions paid is also low. This has caused difficulty in incentivising intermediaries to sell inclusive insurance products. Some jurisdictions e.g. Malaysia have specially exempted inclusive insurance products from commission limits.
33 See ASIC report: REP 492 A market that is failing consumers: The sale of add-on insurance through car dealers | ASIC – Austral-ian Securities and Investments Commission
34 On the basis of OECD statistics, of the total commissions paid by insurance companies, a study by Reifner et al., (2013) found that commissions in the life insurance market reach an average 4.3% of total gross premiums per year in the selected Member States. This ratio is the highest in Ireland (14.7%), which can be explained by brokers’ large market share and the tight oligopoly of three large insurance companies that compete intensively for market share by paying higher commissions. The study found that policies distributed by banks or financial intermediaries had higher commission rates (44% on average with a maximum of 79%) compared to policies distributed by agents (20%). From:https://ec.europa.eu/info/sites/default/files/file_import/1311-remuneration-structures-study_en_0.pdf See OECD’s 2013 Insurance Statistics: https://doi.org/10.1787/ins_stats-2013-en
4. LIST OF KPIs

48
4.2.4. Gross combined ratio
FORMULA CARD
✔ Collect at the insurer level.
✔ Product-level combined ratio can be requested on ad-hoc basis if there is a cause for concern.
✔ The combined ratio is less useful for life insurers.
The combined ratio shows the underwriting profit or loss, or profitability of the business before taking investment income into account. A ratio higher than 100% indicates that the business is loss-making. A ratio consistently above 100% for some years indicates that the business may not be financially viable (see KPI Handbook: Prudential Pillar). Losses from claims normally con-stitute the largest share of the combined ratio. An underwriting loss does not mean an overall loss, or operating loss, as these losses can be compensated through investment income. The profitability ratio in contrast includes all other sources of income beyond underwriting income and therefore measures the overall operating profit or loss of the insurer.
The combined ratio is less useful as a profitability indicator for long-term life insurance, as premiums in a single year will not necessarily reflect the claims expected for that year. For life insurance, it is more useful to compare actual vs. expected experience in the mortality rates and assess surplus and to review pricing assumptions of products.
Good profitability is positive for solvency. However, for the conduct supervisor, it is important to understand the underlying causes of high profit. For example, where high profit margins correlate with a practice of high charges or unusually low claims ratios, this could indicate
4. LIST OF KPIs
Gross combined ratio Gross incurred claims + Gross expenses
Gross earned premiums
Other variations /
supplementary ratios Profitability ratio = Net Profit before Tax
NEP
Net profit = underwriting income, investment and other income less
expenses
The profitability ratio is a prudential KPI for assessing earnings and
operating profitability of non-life insurers. It can only be measured at the
insurer level.

49
Persistency and renewal
conduct of business risk. Comparing the relative profitability of the different lines of business or product types with sales volumes and growth can help reveal a skew towards pushing sales of more profitable products (IAIS, 2015). This can be supported by information on marketing expenses. For instance, South Africa monitors marketing expenses and the number of interme-diaries on a quarterly basis, as this could reveal a focus on sales or campaigns to increase sales of specific products.
Low profitability at the insurer level means more pressure, whether from shareholders or the prudential supervisor, to take steps to improve profitability and financial performance. This could lead to stronger risk management practices, leading to tightening of underwriting cri-teria to target lower-risk groups, premium reviews, adding of exclusions or withdrawal of the product. While this may improve solvency, supervisors may need to balance this against poten-tial affordability and exclusion issues, depending on which product lines are affected35.
Additionally, it could mean additional pressure on staff to increase sales performance while lowering service standards to cut costs and lowering claims paid out. This raises the risk of poor selling practices and customer value. For instance, insurers or their intermediaries may depend on selling profitable add-on or bundled benefits that do not meet customer needs and have very low claims ratios.
Supervisors may also wish to find out from prudential supervisors as to whether there is an over-reliance of insurers on investment income. Where reliance is high, some insurers may man-age this by delay payment of claims to earn sufficient profit. This is one of the ways customer outcomes need to be balanced against profitability and solvency.
4.3. Cancellations, lapses, non-renewals, replacements, surrenders and alterations
Persistency and renewal are important for both prudential and conduct supervision. ‘Persistency’ means that the policyholder keeps up the premium payments over the policy term. Today this more commonly applies to long-term policies where recurring premium payments are made over the years. Shorter-term e.g. yearly renewable poli-cies can also technically lapse or be cancelled if the premiums are structured as monthly premiums, which is sometimes the case in inclusive insurance and microinsurance. In yearly renewable insurance, if a policy is cancelled midway through a policy term, insur-ers should normally pro-rate and refund the premium for the expired portion policy term. ‘Renewal’ is the equivalent concept for policies that are structured to be annually or monthly renewable to continue coverage.
35 See Malaysia’s example of how combined ratios inform conduct issues in health insurance: https://www.bnm.gov.my/documents/20124/4782528/fsr2021h1_en_wb4_medical.pdf
4. LIST OF KPIs
Concept Box 3
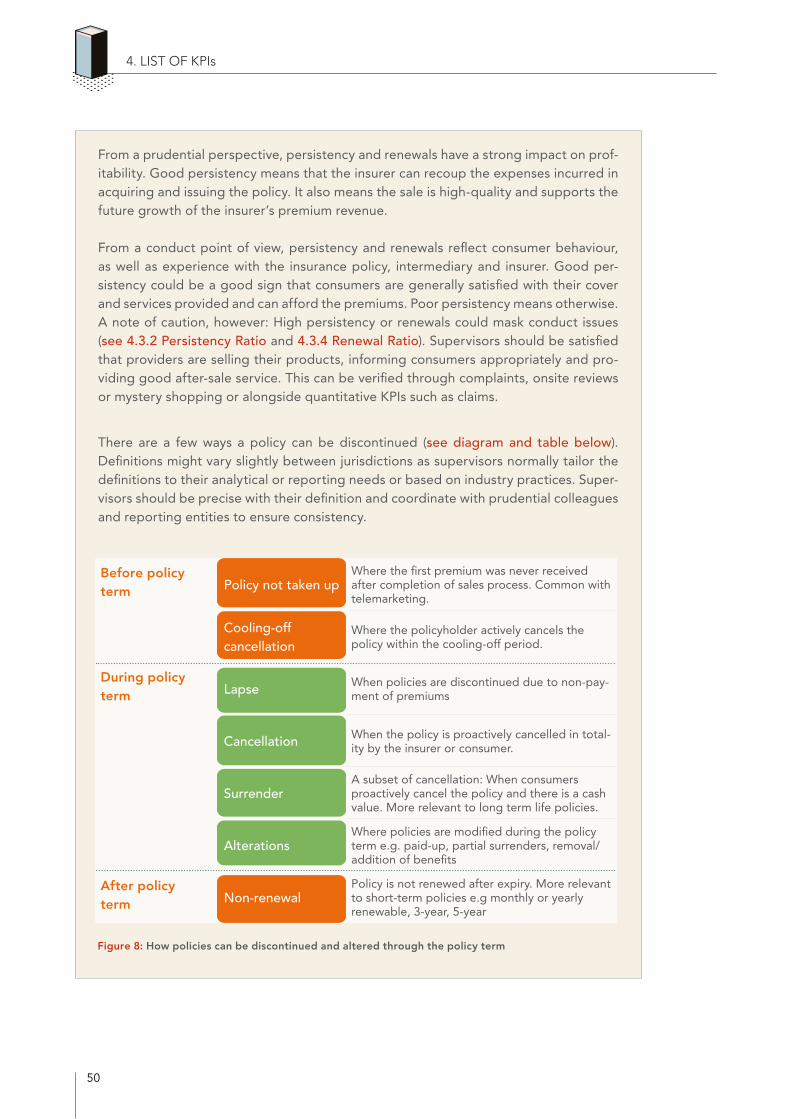
50
From a prudential perspective, persistency and renewals have a strong impact on prof-itability. Good persistency means that the insurer can recoup the expenses incurred in acquiring and issuing the policy. It also means the sale is high-quality and supports the future growth of the insurer’s premium revenue.
From a conduct point of view, persistency and renewals reflect consumer behaviour, as well as experience with the insurance policy, intermediary and insurer. Good per-sistency could be a good sign that consumers are generally satisfied with their cover and services provided and can afford the premiums. Poor persistency means otherwise. A note of caution, however: High persistency or renewals could mask conduct issues (see 4.3.2 Persistency Ratio and 4.3.4 Renewal Ratio). Supervisors should be satisfied that providers are selling their products, informing consumers appropriately and pro-viding good after-sale service. This can be verified through complaints, onsite reviews or mystery shopping or alongside quantitative KPIs such as claims.
There are a few ways a policy can be discontinued (see diagram and table below).Definitions might vary slightly between jurisdictions as supervisors normally tailor the definitions to their analytical or reporting needs or based on industry practices. Super-visors should be precise with their definition and coordinate with prudential colleagues and reporting entities to ensure consistency.
Figure 8: How policies can be discontinued and altered through the policy term
4. LIST OF KPIs
Before policy term Policy not taken up
Where the first premium was never received after completion of sales process. Common with telemarketing.
Cooling-off cancellation
Where the policyholder actively cancels the policy within the cooling-off period.
During policy term Lapse When policies are discontinued due to non-pay-
ment of premiums
Cancellation When the policy is proactively cancelled in total-ity by the insurer or consumer.
SurrenderA subset of cancellation: When consumers proactively cancel the policy and there is a cash value. More relevant to long term life policies.
AlterationsWhere policies are modified during the policy term e.g. paid-up, partial surrenders, removal/addition of benefits
After policy term Non-renewal
Policy is not renewed after expiry. More relevant to short-term policies e.g monthly or yearly renewable, 3-year, 5-year
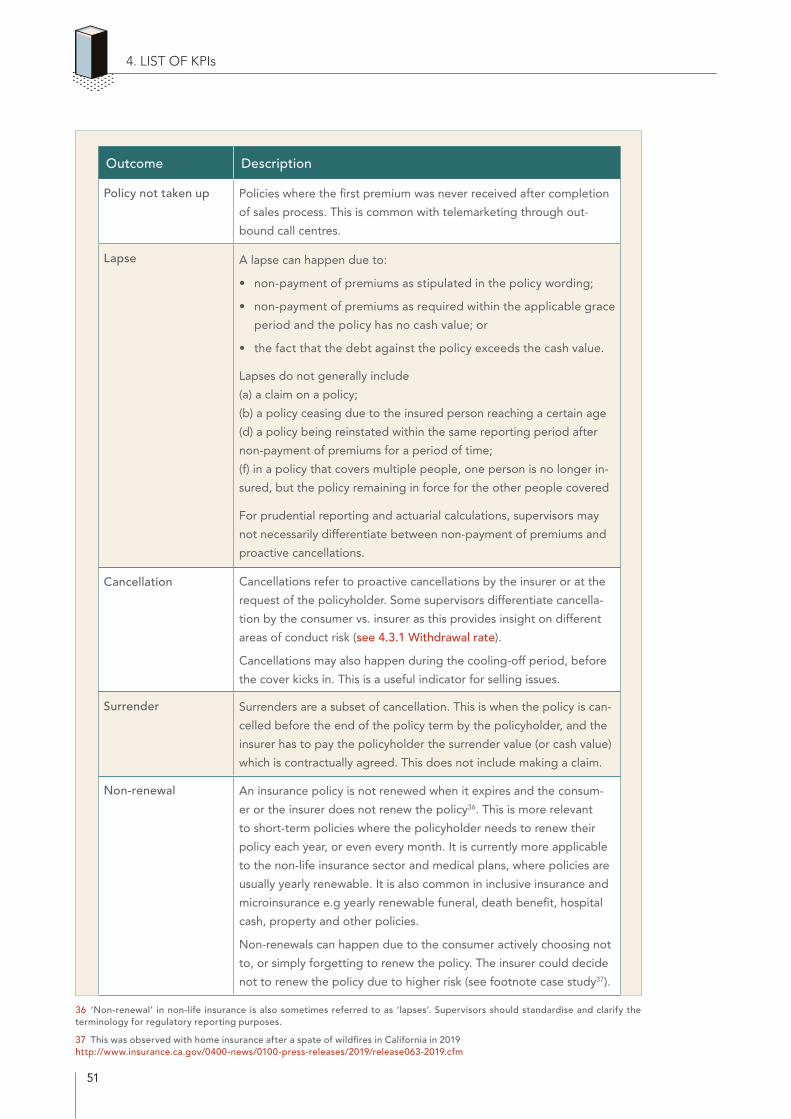
51
37
36 ‘Non-renewal’ in non-life insurance is also sometimes referred to as ‘lapses’. Supervisors should standardise and clarify the terminology for regulatory reporting purposes.
37 This was observed with home insurance after a spate of wildfires in California in 2019 http://www.insurance.ca.gov/0400-news/0100-press-releases/2019/release063-2019.cfm
4. LIST OF KPIs
Outcome Description
Policy not taken up Policies where the first premium was never received after completion
of sales process. This is common with telemarketing through out-
bound call centres.
Lapse A lapse can happen due to:
• non-payment of premiums as stipulated in the policy wording;
• non-payment of premiums as required within the applicable grace
period and the policy has no cash value; or
• the fact that the debt against the policy exceeds the cash value.
Lapses do not generally include
(a) a claim on a policy;
(b) a policy ceasing due to the insured person reaching a certain age
(d) a policy being reinstated within the same reporting period after
non-payment of premiums for a period of time;
(f) in a policy that covers multiple people, one person is no longer in-
sured, but the policy remaining in force for the other people covered
For prudential reporting and actuarial calculations, supervisors may
not necessarily differentiate between non-payment of premiums and
proactive cancellations.
Cancellation Cancellations refer to proactive cancellations by the insurer or at the
request of the policyholder. Some supervisors differentiate cancella-
tion by the consumer vs. insurer as this provides insight on different
areas of conduct risk (see 4.3.1 Withdrawal rate).
Cancellations may also happen during the cooling-off period, before
the cover kicks in. This is a useful indicator for selling issues.
Surrender Surrenders are a subset of cancellation. This is when the policy is can-
celled before the end of the policy term by the policyholder, and the
insurer has to pay the policyholder the surrender value (or cash value)
which is contractually agreed. This does not include making a claim.
Non-renewal An insurance policy is not renewed when it expires and the consum-
er or the insurer does not renew the policy36. This is more relevant
to short-term policies where the policyholder needs to renew their
policy each year, or even every month. It is currently more applicable
to the non-life insurance sector and medical plans, where policies are
usually yearly renewable. It is also common in inclusive insurance and
microinsurance e.g yearly renewable funeral, death benefit, hospital
cash, property and other policies.
Non-renewals can happen due to the consumer actively choosing not
to, or simply forgetting to renew the policy. The insurer could decide
not to renew the policy due to higher risk (see footnote case study37).
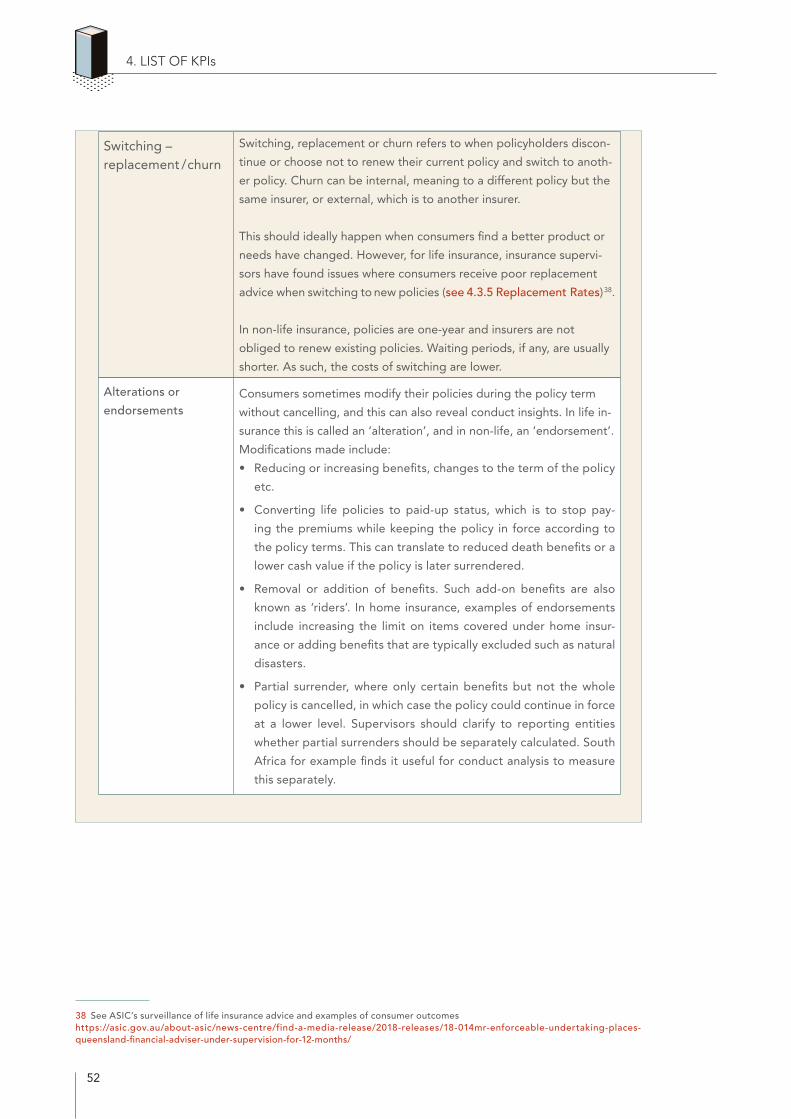
52
38
38 See ASIC’s surveillance of life insurance advice and examples of consumer outcomes https://asic.gov.au/about-asic/news-centre/find-a-media-release/2018-releases/18-014mr-enforceable-undertaking-places- queensland-financial-adviser-under-supervision-for-12-months/
4. LIST OF KPIs
Switching – replacement / churn
Switching, replacement or churn refers to when policyholders discon-
tinue or choose not to renew their current policy and switch to anoth-
er policy. Churn can be internal, meaning to a different policy but the
same insurer, or external, which is to another insurer.
This should ideally happen when consumers find a better product or
needs have changed. However, for life insurance, insurance supervi-
sors have found issues where consumers receive poor replacement
advice when switching to new policies (see 4.3.5 Replacement Rates)38.
In non-life insurance, policies are one-year and insurers are not
obliged to renew existing policies. Waiting periods, if any, are usually
shorter. As such, the costs of switching are lower.
Alterations or
endorsementsConsumers sometimes modify their policies during the policy term
without cancelling, and this can also reveal conduct insights. In life in-
surance this is called an ‘alteration’, and in non-life, an ‘endorsement’.
Modifications made include:
• Reducing or increasing benefits, changes to the term of the policy
etc.
• Converting life policies to paid-up status, which is to stop pay-
ing the premiums while keeping the policy in force according to
the policy terms. This can translate to reduced death benefits or a
lower cash value if the policy is later surrendered.
• Removal or addition of benefits. Such add-on benefits are also
known as ‘riders’. In home insurance, examples of endorsements
include increasing the limit on items covered under home insur-
ance or adding benefits that are typically excluded such as natural
disasters.
• Partial surrender, where only certain benefits but not the whole
policy is cancelled, in which case the policy could continue in force
at a lower level. Supervisors should clarify to reporting entities
whether partial surrenders should be separately calculated. South
Africa for example finds it useful for conduct analysis to measure
this separately.
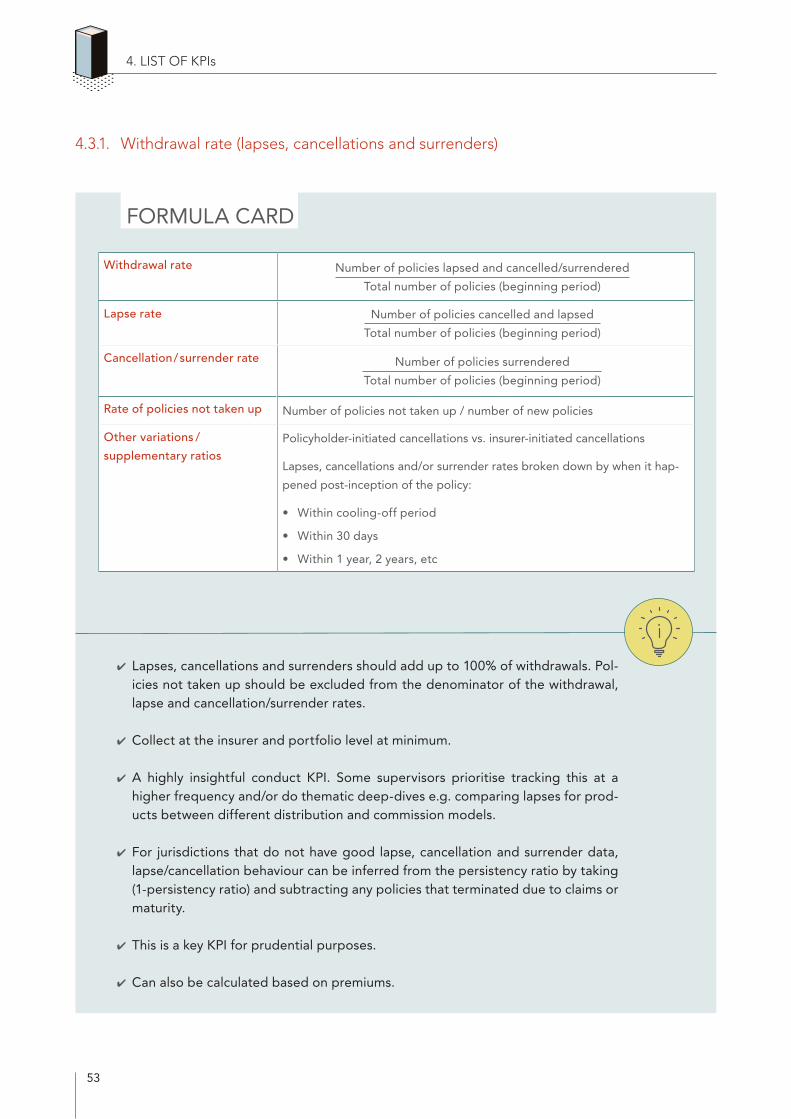
53
4.3.1. Withdrawal rate (lapses, cancellations and surrenders)
FORMULA CARD
✔ Lapses, cancellations and surrenders should add up to 100% of withdrawals. Pol-icies not taken up should be excluded from the denominator of the withdrawal, lapse and cancellation/surrender rates.
✔ Collect at the insurer and portfolio level at minimum.
✔ A highly insightful conduct KPI. Some supervisors prioritise tracking this at a higher frequency and/or do thematic deep-dives e.g. comparing lapses for prod-ucts between different distribution and commission models.
✔ For jurisdictions that do not have good lapse, cancellation and surrender data, lapse/cancellation behaviour can be inferred from the persistency ratio by taking (1-persistency ratio) and subtracting any policies that terminated due to claims or maturity.
✔ This is a key KPI for prudential purposes.
✔ Can also be calculated based on premiums.
4. LIST OF KPIs
Withdrawal rate Number of policies lapsed and cancelled/surrendered
Total number of policies (beginning period)
Lapse rate IINumber of policies cancelled and lapsedII
Total number of policies (beginning period)
Cancellation/ surrender rate IIIIIIIIIINumber of policies surrenderedIIIIIIIIII
Total number of policies (beginning period)
Rate of policies not taken up Number of policies not taken up / number of new policies
Other variations /
supplementary ratiosPolicyholder-initiated cancellations vs. insurer-initiated cancellations
Lapses, cancellations and/or surrender rates broken down by when it hap-
pened post-inception of the policy:
• Within cooling-off period
• Within 30 days
• Within 1 year, 2 years, etc
54
The higher the withdrawals or the lower the persistency, the more consumers are giving up or losing their cover during the policy term. From a prudential perspective, low lapses /can-cellations are positive, as this means insurers are better able to recoup costs associated with the policies and there are better prospects of revenue growth. The logic behind interpreting lapses/cancellations ratios is similar to that of non-renewal ratios, except it is more relevant for long-term products where consumers upkeep monthly or annual premium payments to ensure the continuation of the contract rather than to renew the policy each year.
Some level of lapses/cancellations is acceptable. There are many reasons why this can happen, such as changes in the policyholder’s income, family, health or social security circumstances, that are beyond the control of the insurance industry39. They could also be simply switching and replacing their policies, which could be a positive indication that there is product choice in the market. Supervisors may just wish to assess if consumers are switching based on adequate information (see 4.3.5: Replacements). With surrenders, supervisors may want to assess if sur-render payments are fair.
However, if lapses/cancellations are higher than average or have been increasing, conduct supervisors may wish to investigate further. Two variables are important: what or who initiated the lapse/cancellation, and at what point in the policy term did it occur.
Lapses
Lapses typically happen due to non-payment of premiums. This could be deliberate on the policyholder’s part, not paying premiums is a passive way of cancelling. This could point to affordability issues, which could imply selling and advice issues. It could also mean the product does not meet the policyholder’s needs. It is also possible that the non-payment is uninten-tional, such as where premiums are auto-deducted from a bank account but the bank balance has run out. However, intentionality would be challenging for insurers to verify in practice.
Cancellations by the consumer vs. insurer
Some supervisors collect data differentiating between cancellations by the insurer vs. con-sumer. High customer-initiated cancellations are a red flag that customers are not satisfied with the product, intermediary or insurer, or that consumers find that the products are not meet-ing their needs. It could also point to affordability issues; the consumer would actively cancel rather than passively let the policy lapse.
An insurer might cancel the policy due to concealment or misrepresentation of significant facts during the application process, and/or submission of a fraudulent claim. This could point to deliberate deception by the consumer but also potential gaps in disclosure or consumer understanding.
39 There is a building body of research on reasons for lapses. See literature review here: https://www.researchgate.net/publication/342841475_Trends_in_Life_Insurance_Demand_and_Lapse_Literature
4. LIST OF KPIs
55
Time bands
High rates of policies not taken up, which is calculated separately from lapses, may indicate poor selling practices. For instance, telemarketing sales often show poor persistency due to pressure selling or buy-now-cancel-later tactics.
High lapses/cancellations soon after policy inception, such as during the cooling-off period or within 30 days, may indicate that the consumer did not actually want to buy the product or realised soon after that the product did not meet their needs and thus experienced ‘buyer’s remorse’. This is a potential red flag for poor selling practices, such as pressure-selling or bun-dling without adequate disclosure.
High lapses/cancellations over the medium-term may show that a product is not affordable. This could be because the premiums increased40, or the intermediary may have recommended that the customer obtains a sum insured that is too high in the first place, leading to the con-sumer later realising that they are unable to upkeep the premium payments. A persistent issue with premium increases could signal a wider social security problem if essential product lines such as health insurance are affected. This is common with medical inflation in private health insurance for example.
High lapses/cancellations that coincide with commission time horizons may also indicate a red flag that the lapses are related to intermediary incentives. Some life insurance intermediaries are paid a higher upfront commission plus trailing commissions for a few years e.g 2-5 years. Some insurers also impose a ‘commission clawback’, which enables insurers to take back com-missions paid if policyholders lapse within a defined period. If lapses and replacements spike exactly when trailing commissions or clawback periods end, it may be a sign that intermediaries are ‘churning’ or encouraging consumers to replace policies to earn commissions (see 4.3.5 Replacements).
The overall situation that consumers are buying unsuitable products could mean that they are receiving inappropriate disclosure, advice and recommendations, or that there are issues with how insurers design the products vis-à-vis consumer needs. Some supervisory reviews have revealed that insurers have a lack of formal periodic reviews in place of the information materi-als provided to customers or there is insufficient training related to advice.
Supervisors can compare the ratios to market averages for outliers, or conduct trend analysis to see if there have been significant changes. When compared across the years, it is important to consider that a spike in lapses in the first year after policy inception is common. Prudential supervisors should also be able to advise on what the historically stable lapse rate is in the market. The supervisor can verify using more granular data analysis (e.g by product or chan-nel), complaints, assessing the product design, on-site reviews and engagement, and mystery shopping/demand-side surveys. E.g. supervisors can compare actual vs. expected lapses/can-cellations in business plans and pricing assumptions via on-site inspections.
40 For example, in Australia it was found that - Almost one in five policies (18%) sold from 2012 – 17 were cancelled during the cooling-off period. This varied dramatically by firm: two firms had cooling-off cancellations of less than 10 %, while one firm had a rate of 31%.
4. LIST OF KPIs
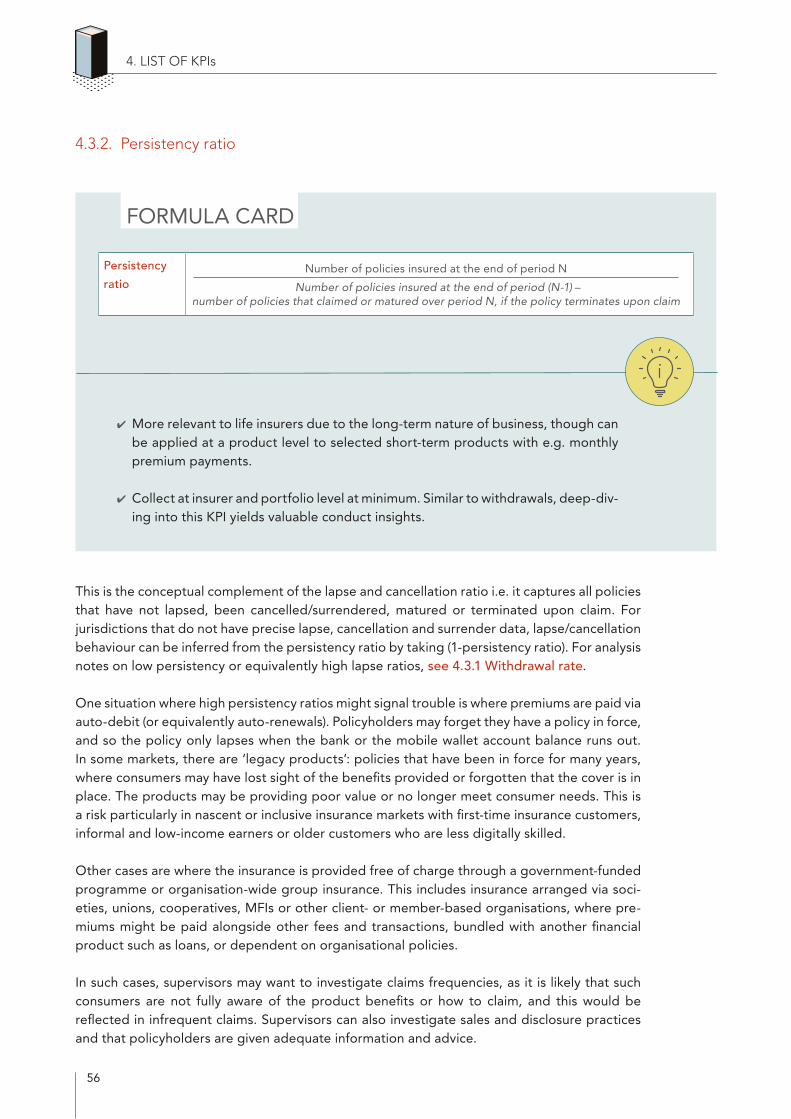
56
Persistency
ratioIIIIIIIIIIIIIIIIIIIIIIIIIIIIIIIIIIIINumber of policies insured at the end of period NIIIIIIIIIIIIIIIIIIIIIIIIIIIIIIIIIIII
█Number of policies insured at the end of period (N-1) – number of policies that claimed or matured over period N, if the policy terminates upon claim
4. LIST OF KPIs
4.3.2. Persistency ratio
FORMULA CARD
✔ More relevant to life insurers due to the long-term nature of business, though can be applied at a product level to selected short-term products with e.g. monthly premium payments.
✔ Collect at insurer and portfolio level at minimum. Similar to withdrawals, deep-div-ing into this KPI yields valuable conduct insights.
This is the conceptual complement of the lapse and cancellation ratio i.e. it captures all policies that have not lapsed, been cancelled/surrendered, matured or terminated upon claim. For jurisdictions that do not have precise lapse, cancellation and surrender data, lapse/cancellation behaviour can be inferred from the persistency ratio by taking (1-persistency ratio). For analysis notes on low persistency or equivalently high lapse ratios, see 4.3.1 Withdrawal rate.
One situation where high persistency ratios might signal trouble is where premiums are paid via auto-debit (or equivalently auto-renewals). Policyholders may forget they have a policy in force, and so the policy only lapses when the bank or the mobile wallet account balance runs out. In some markets, there are ‘legacy products’: policies that have been in force for many years, where consumers may have lost sight of the benefits provided or forgotten that the cover is in place. The products may be providing poor value or no longer meet consumer needs. This is a risk particularly in nascent or inclusive insurance markets with first-time insurance customers, informal and low-income earners or older customers who are less digitally skilled.
Other cases are where the insurance is provided free of charge through a government-funded programme or organisation-wide group insurance. This includes insurance arranged via soci-eties, unions, cooperatives, MFIs or other client- or member-based organisations, where pre-miums might be paid alongside other fees and transactions, bundled with another financial product such as loans, or dependent on organisational policies.
In such cases, supervisors may want to investigate claims frequencies, as it is likely that such consumers are not fully aware of the product benefits or how to claim, and this would be reflected in infrequent claims. Supervisors can also investigate sales and disclosure practices and that policyholders are given adequate information and advice.
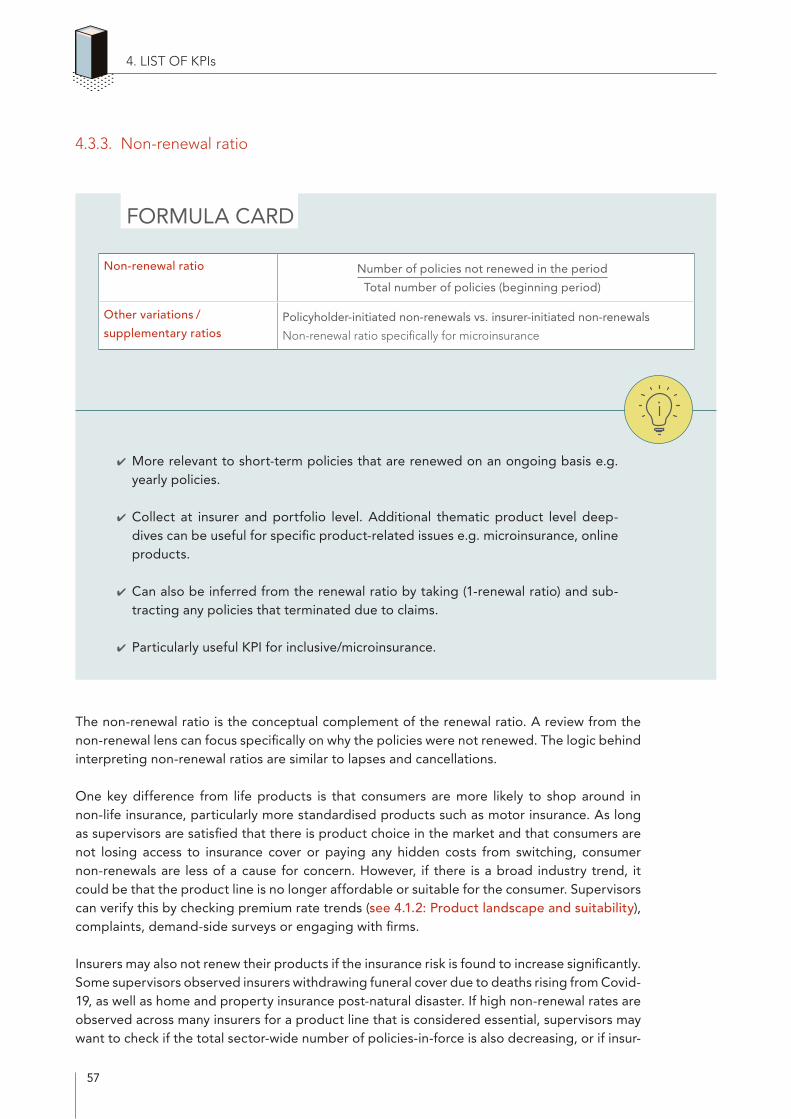
57
4.3.3. Non-renewal ratio
FORMULA CARD
✔ More relevant to short-term policies that are renewed on an ongoing basis e.g. yearly policies.
✔ Collect at insurer and portfolio level. Additional thematic product level deep-dives can be useful for specific product-related issues e.g. microinsurance, online products.
✔ Can also be inferred from the renewal ratio by taking (1-renewal ratio) and sub-tracting any policies that terminated due to claims.
✔ Particularly useful KPI for inclusive/microinsurance.
The non-renewal ratio is the conceptual complement of the renewal ratio. A review from the non-renewal lens can focus specifically on why the policies were not renewed. The logic behind interpreting non-renewal ratios are similar to lapses and cancellations.
One key difference from life products is that consumers are more likely to shop around in non-life insurance, particularly more standardised products such as motor insurance. As long as supervisors are satisfied that there is product choice in the market and that consumers are not losing access to insurance cover or paying any hidden costs from switching, consumer non-renewals are less of a cause for concern. However, if there is a broad industry trend, it could be that the product line is no longer affordable or suitable for the consumer. Supervisors can verify this by checking premium rate trends (see 4.1.2: Product landscape and suitability), complaints, demand-side surveys or engaging with firms.
Insurers may also not renew their products if the insurance risk is found to increase significantly. Some supervisors observed insurers withdrawing funeral cover due to deaths rising from Covid-19, as well as home and property insurance post-natural disaster. If high non-renewal rates are observed across many insurers for a product line that is considered essential, supervisors may want to check if the total sector-wide number of policies-in-force is also decreasing, or if insur-
4. LIST OF KPIs
Non-renewal ratio Number of policies not renewed in the period
Total number of policies (beginning period)
Other variations /
supplementary ratiosPolicyholder-initiated non-renewals vs. insurer-initiated non-renewals
Non-renewal ratio specifically for microinsurance
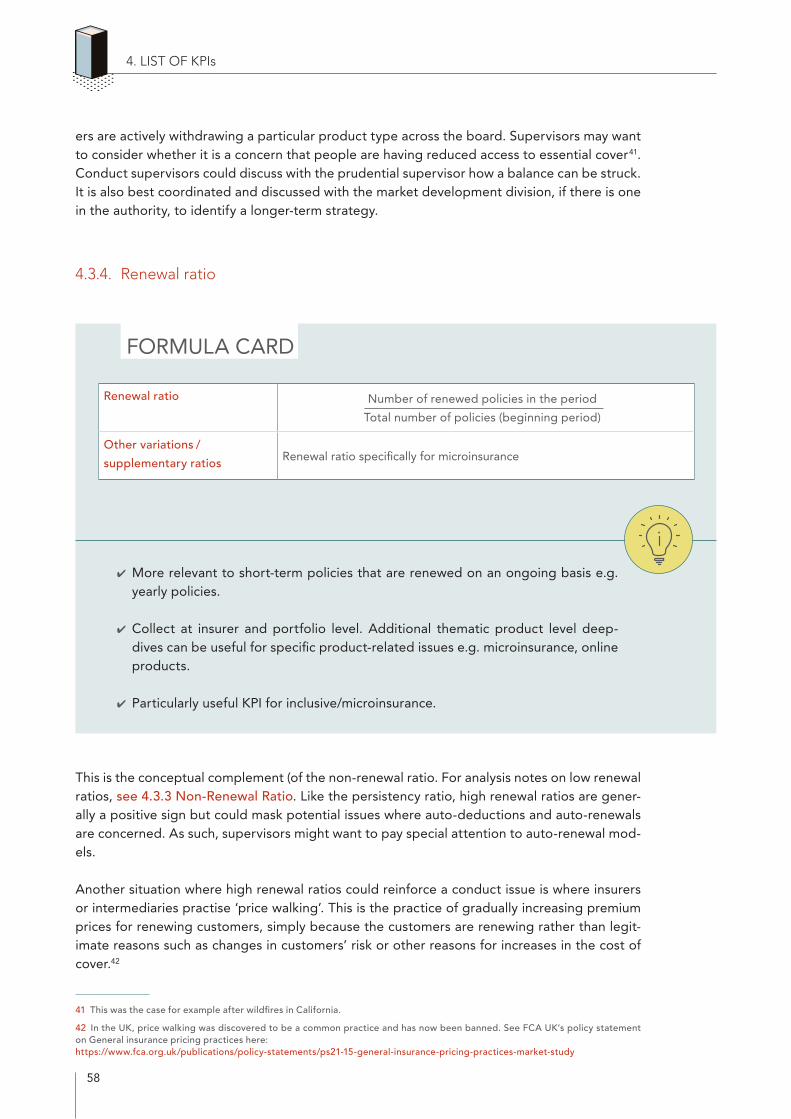
58
Renewal ratio INumber of renewed policies in the periodI
Total number of policies (beginning period)
Other variations /
supplementary ratios Renewal ratio specifically for microinsurance
ers are actively withdrawing a particular product type across the board. Supervisors may want to consider whether it is a concern that people are having reduced access to essential cover41. Conduct supervisors could discuss with the prudential supervisor how a balance can be struck. It is also best coordinated and discussed with the market development division, if there is one in the authority, to identify a longer-term strategy.
4.3.4. Renewal ratio
FORMULA CARD
✔ More relevant to short-term policies that are renewed on an ongoing basis e.g. yearly policies.
✔ Collect at insurer and portfolio level. Additional thematic product level deep-dives can be useful for specific product-related issues e.g. microinsurance, online products.
✔ Particularly useful KPI for inclusive/microinsurance.
This is the conceptual complement (of the non-renewal ratio. For analysis notes on low renewal ratios, see 4.3.3 Non-Renewal Ratio. Like the persistency ratio, high renewal ratios are gener-ally a positive sign but could mask potential issues where auto-deductions and auto-renewals are concerned. As such, supervisors might want to pay special attention to auto-renewal mod-els.
Another situation where high renewal ratios could reinforce a conduct issue is where insurers or intermediaries practise ‘price walking’. This is the practice of gradually increasing premium prices for renewing customers, simply because the customers are renewing rather than legit-imate reasons such as changes in customers’ risk or other reasons for increases in the cost of cover.42
41 This was the case for example after wildfires in California.
42 In the UK, price walking was discovered to be a common practice and has now been banned. See FCA UK’s policy statement on General insurance pricing practices here: https://www.fca.org.uk/publications/policy-statements/ps21-15-general-insurance-pricing-practices-market-study
4. LIST OF KPIs
59
SPECIAL CONSIDERATIONS FOR MICROINSURANCE
Most microinsurance and inclusive insurance policies are short-term policies. As such the renewal ratio is highly relevant (see A2ii paper, 2019). Overall high renewal ratios are more likely to be a good sign in inclusive insurance for two reasons:
1. In many jurisdictions, inclusive insurance products are approved by regulators in line with inclusive principles before launch. Therefore, there is a lower risk that supervisors would consider the product to be poorly designed or have complex processes for the consumer; as the product would not have been approved in the first place. Supervisors may want to check claims and servicing information periodically to verify.
2. In most markets, inclusive insurance markets are in the early stages of develop-ing. Often there is not a wide range of product choices. If policyholders do not renew it is more likely that they are becoming uninsured rather than simply shop-ping around and switching.
Inclusive insurance consumers tend to be financially vulnerable. The supervisor’s prior-ity might thus be to ensure they are continually covered by insurance. The cost-benefit considerations are slightly different in the inclusive insurance sector. For instance, in the debate of opt-in versus opt-out – for traditional consumers, conduct supervisors’ main priority might be to ensure that barriers are not too high for consumers to opt-out of bundled benefits or auto-renewal processes. But should opt-out mechanisms be allowed for auto-renewals in inclusive insurance, knowing that it might be harder to get inclusive insurance consumers to opt-in to continue their cover?
Supervisors may also want to apply scrutiny in areas not typically focused on for the traditional market. Consumers might not know they need to renew a product for the cover to remain in place. Sometimes processes are designed in such a way that does not encourage renewals, or only encourages renewals in the short term. For example, in mobile insurance models where premiums are paid via automatic deductions from airtime, the policyholder might have forgotten to ensure sufficient balance, leading to the insurer terminating the contract when premiums are not paid. Supervisors might thus want to look into whether disclosure on how to renew, in addition to how to exit, can be improved.
4. LIST OF KPIs
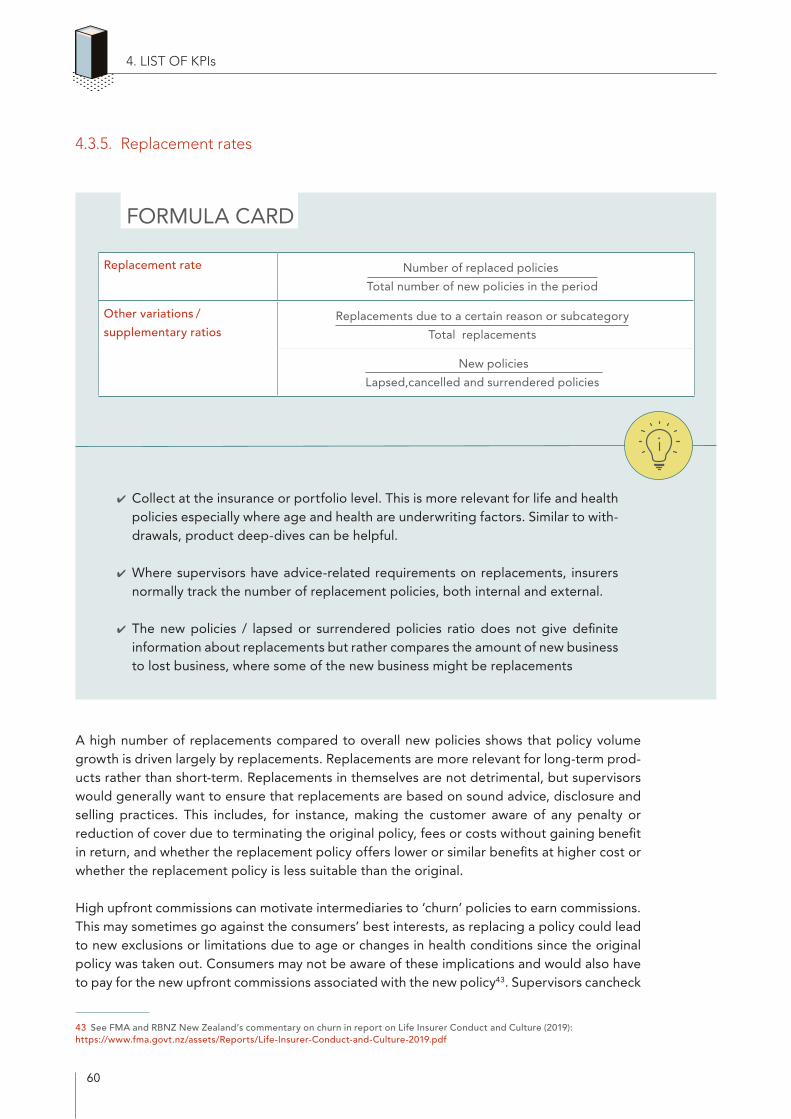
60
Replacement rate IIIIIIIIIIINumber of replaced policiesI IIIIIIIIII
Total number of new policies in the period
Other variations /
supplementary ratiosReplacements due to a certain reason or subcategory
Total replacements
I IIIIIIIIIIIIIIII IIIIIIIIIINew policiesI IIIIIIIIIIIIIIIIIIII
Lapsed,cancelled and surrendered policies
4.3.5. Replacement rates
FORMULA CARD
✔ Collect at the insurance or portfolio level. This is more relevant for life and health policies especially where age and health are underwriting factors. Similar to with-drawals, product deep-dives can be helpful.
✔ Where supervisors have advice-related requirements on replacements, insurers normally track the number of replacement policies, both internal and external.
✔ The new policies / lapsed or surrendered policies ratio does not give definite information about replacements but rather compares the amount of new business to lost business, where some of the new business might be replacements
A high number of replacements compared to overall new policies shows that policy volume growth is driven largely by replacements. Replacements are more relevant for long-term prod-ucts rather than short-term. Replacements in themselves are not detrimental, but supervisors would generally want to ensure that replacements are based on sound advice, disclosure and selling practices. This includes, for instance, making the customer aware of any penalty or reduction of cover due to terminating the original policy, fees or costs without gaining benefit in return, and whether the replacement policy offers lower or similar benefits at higher cost or whether the replacement policy is less suitable than the original.
High upfront commissions can motivate intermediaries to ‘churn’ policies to earn commissions. This may sometimes go against the consumers’ best interests, as replacing a policy could lead to new exclusions or limitations due to age or changes in health conditions since the original policy was taken out. Consumers may not be aware of these implications and would also have to pay for the new upfront commissions associated with the new policy43. Supervisors cancheck
43 See FMA and RBNZ New Zealand’s commentary on churn in report on Life Insurer Conduct and Culture (2019): https://www.fma.govt.nz/assets/Reports/Life-Insurer-Conduct-and-Culture-2019.pdf
4. LIST OF KPIs

61
Policy alterations or
endorsements ratioNumber of policies with alterations or endorsements during the reporting period
Number of policies at the beginning of the reporting period
Other variations /
supplementary ratiosQualitative information on types of changes made and any substantial modifica-
tions
Ratios for specific types of prevalent changes such as ratio for policies made paid-
up.
replacement rates alongside lapse or surrender rates based on time bands to detect if such a practice is taking place – for instance, if lapse rates or surrender rates tend to spike exactly when trailing commissions end, it could be that intermediaries are churning policies to earn upfront commissions. Supervisors can also review if high replacement volumes and new poli-cies coincide at the same intermediary. Supervisors can also corroborate with complaints data.
4.3.6. Policy alterations or endorsements ratio
FORMULA CARD
✔ Collect at the product or insurer level.
✔ More relevant for longer-term life products where policyholders are ‘locked in’ and are less likely to switch products
A high ratio means that many consumers are changing their policy terms and conditions. It is generally important for supervisors to ensure that any policy modifications are made in an informed manner. The risk is high especially for complex products. This is because alterations to the policy can have consequences on the coverage such as reduced benefits paid out or reduced cash value. Supervisors may also wish to analyse policy modification trends at the product line level as the implications differ by the product type and policy terms and condi-tions. For instance, using the policies made paid-up ratio for conduct analysis is not relevant for single-premium life products where the premium is paid upfront for the whole policy term. For whole life policies or policies with regular premium payments, where there is a high ratio of policies made paid-up44, it can be an indicator of mis-selling or affordability issues.
44 Some supervisors have seen intermediaries sell regular premium insurance products as limited premium payment products e.g 20-year premium-paying products as a 10-year premium-paying product by leveraging the paid-up feature.
4. LIST OF KPIs
62
Reasons for poor
persistency/
non-renewals
Top 3 –5 reasons for poor persistency and non-renewals
4.3.7. Reasons for poor persistency/ non-renewals
FORMULA CARD
✔ May be more difficult to capture in standard returns if returns are not highly advanced.
✔ Useful for follow-up where poor persistency ratios are observed or for thematic deep dives.
As outlined in the KPIs above, there can be many reasons for poor persistency/renewals and it is important to find out why. Three main aspects of the KPIs can help inform the reasons:
• Whether initiated by consumer or insurer
• Policy duration, or how long policy is in force before cancellation
• Whether policies are replaced and in what circumstances
To further help narrow down the reasons, supervisors can disaggregate lapse/non-renewal rates. If high lapses and non-renewals are occurring in a particular sub-product, product line, intermediary, distribution model or insurer type, it is likely that the root cause lies somewhere within this particular category.
Potential reasons for poor persistency include:
• Customers are not satisfied with the product, intermediary or insurer
• ‘Buyer’s remorse’ during the cooling-off period
• Forced selling or say-yes-now-cancel-later behaviour, often seen in telemarketing
• Affordability issues e.g in investment-linked products where an increase in the cost of unit-deducting medical riders eventually cause the current premium level to be insuf-ficient
• Intermediaries are ‘churning’ or encouraging consumers to replace policies
• Intermediaries having poor client relationship management with policyholders
4. LIST OF KPIs

63
Gross incurred
claims ratioIIGross incurred claimsII
Gross earned premium
This could point the supervisor to the root cause, which needs to be verified via on-site review and engagement with the insurer:
• Poor selling, advice and disclosure practices e.g Intermediaries not conducting proper needs analysis at inception stage of the policy
• Poorly designed remuneration models that incentivise poor behaviour of intermediaries
• Product design issues
In inclusive insurance, it could also be a demand-side factor, in that customers may be more price-sensitive due to lower incomes or might have lower insurance awareness and skills. In such a case it might also point the supervisor to a need to encourage better product design, simplify processes and improve disclosure.
4.4. Claims
4.4.1. Claims / loss ratio
FORMULA CARD
✔ Prudential supervisors should have this data by insurer level and portfolio/class of business.
✔ To assess customer value, need to analyse at portfolio or product level.
✔ Some supervisors also do sub-product level deep dives, e.g on the add-on com-ponent of products.
✔ Some supervisors assess ‘paid claims ratio’ i.e. dollar amount of claims paid out in the reporting period as a supplementary ratio.
4. LIST OF KPIs
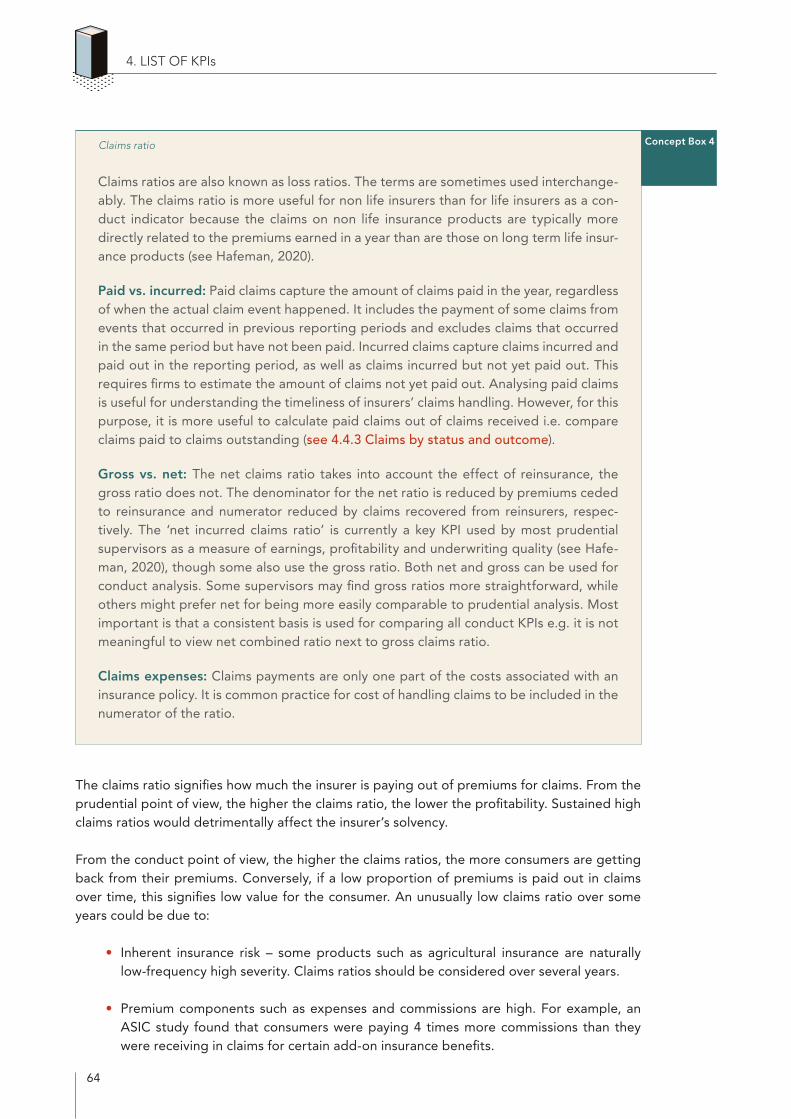
64
Claims ratio Concept Box 4
Claims ratios are also known as loss ratios. The terms are sometimes used interchange-ably. The claims ratio is more useful for non life insurers than for life insurers as a con-duct indicator because the claims on non life insurance products are typically more directly related to the premiums earned in a year than are those on long█term life insur-ance products (see Hafeman, 2020).
Paid vs. incurred: Paid claims capture the amount of claims paid in the year, regardless of when the actual claim event happened. It includes the payment of some claims from events that occurred in previous reporting periods and excludes claims that occurred in the same period but have not been paid. Incurred claims capture claims incurred and paid out in the reporting period, as well as claims incurred but not yet paid out. This requires firms to estimate the amount of claims not yet paid out. Analysing paid claims is useful for understanding the timeliness of insurers’ claims handling. However, for this purpose, it is more useful to calculate paid claims out of claims received i.e. compare claims paid to claims outstanding (see 4.4.3 Claims by status and outcome).
Gross vs. net: The net claims ratio takes into account the effect of reinsurance, the gross ratio does not. The denominator for the net ratio is reduced by premiums ceded to reinsurance and numerator reduced by claims recovered from reinsurers, respec-tively. The ‘net incurred claims ratio’ is currently a key KPI used by most prudential supervisors as a measure of earnings, profitability and underwriting quality (see Hafe-man, 2020), though some also use the gross ratio. Both net and gross can be used for conduct analysis. Some supervisors may find gross ratios more straightforward, while others might prefer net for being more easily comparable to prudential analysis. Most important is that a consistent basis is used for comparing all conduct KPIs e.g. it is not meaningful to view net combined ratio next to gross claims ratio.
Claims expenses: Claims payments are only one part of the costs associated with an insurance policy. It is common practice for cost of handling claims to be included in the numerator of the ratio.
The claims ratio signifies how much the insurer is paying out of premiums for claims. From the prudential point of view, the higher the claims ratio, the lower the profitability. Sustained high claims ratios would detrimentally affect the insurer’s solvency.
From the conduct point of view, the higher the claims ratios, the more consumers are getting back from their premiums. Conversely, if a low proportion of premiums is paid out in claims over time, this signifies low value for the consumer. An unusually low claims ratio over some years could be due to:
• Inherent insurance risk – some products such as agricultural insurance are naturally low-frequency high severity. Claims ratios should be considered over several years.
• Premium components such as expenses and commissions are high. For example, an ASIC study found that consumers were paying 4 times more commissions than they were receiving in claims for certain add-on insurance benefits.
4. LIST OF KPIs
65
• Unfair pricing practices, where profit margins are too high and premiums are excessive. This typically occurs with compulsory products and bundled products such as credit life and add-ons.
• Claims are being rejected due to issues in the sales process, consumer understanding or the claims handling process (see 4.4.6: Reasons for Claims Not Accepted).
• Consumers are not making claims – this could be due to consumer awareness, product complexity, unsuitable product design
For non-life products, supervisors can compare the risk premium ratio (see Concept Box 1: Types of intermediaries) and claims ratio side by side to compare insurer’s estimate vs. actual claims experience. If the actual experience is higher than expected, this presents a pruden-tial risk that needs to be addressed. If actual experience is consistently or much lower than expected, this may be an issue of poor value for money. Supervisors should check if differ-ences are due to normal variations or whether pricing should be adjusted. Conduct supervisors need to work with prudential colleagues to ensure that a balance is struck. Customer value is important for all consumers, but it is particularly important for inclusive insurance consumers who have low disposable incomes.
Comparing actual versus expected claims ratio is not advised for life insurance. For life insur-ance, supervisors can compare actual vs expected experience in the mortality rates and other risk rates. To assess the customer value of a life product, it might be good to compare assump-tions used in the pricing of the product across different insurers for similar products.
The claims ratio needs to be assessed over multiple years, as the claims ratio may fluctuate from year to year. Claims ratios are especially volatile for low frequency/high severity products, such as agriculture insurance or disaster and weather-related risks. An increasing claims ratio does not always mean more consumers are getting paid or consumers are getting more ben-efit. For instance, with reimbursement-based health insurance products and medical inflation, high claims ratios can be due to rising costs of healthcare. This could lead to products being unaffordable and commercially unsustainable in the long run. As such while the claims ratio provides an indication of value, it is important to supplement the analysis with other accompa-nying KPIs.
Monitoring claims ratios at the individual product level or intermediary level can provide more concrete insight. Supervisors can compare between different intermediaries or insurers for a similar product, for example, to identify outliers. However the claims experience, and therefore the claims ratio naturally varies by class of business. Supervisors should avoid comparing across different classes of business, including when comparing between inclusive insurance products. Other factors can affect the claims ratio e.g whether it is individual or group policy.
4. LIST OF KPIs
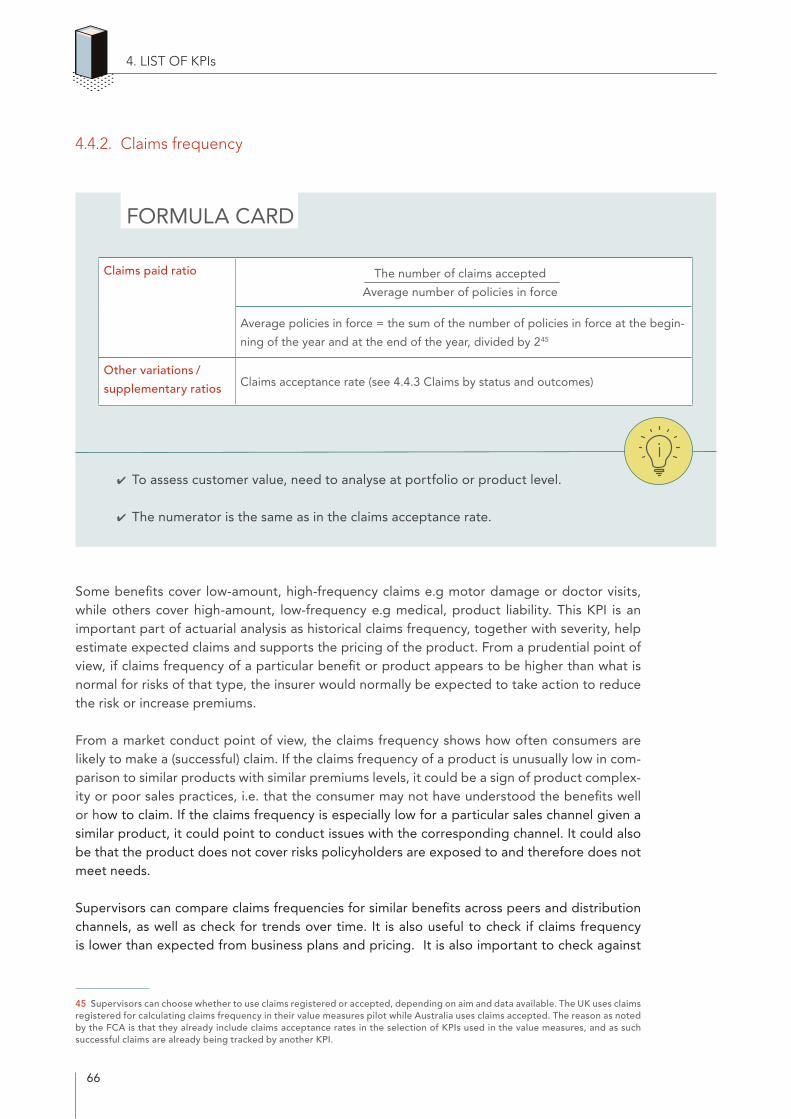
66
Claims paid ratio IIIThe number of claims acceptedIII
Average number of policies in force
Average policies in force = the sum of the number of policies in force at the begin-
ning of the year and at the end of the year, divided by 245
Other variations /
supplementary ratios Claims acceptance rate (see 4.4.3 Claims by status and outcomes)
4. LIST OF KPIs
4.4.2. Claims frequency
FORMULA CARD
✔ To assess customer value, need to analyse at portfolio or product level.
✔ The numerator is the same as in the claims acceptance rate.
Some benefits cover low-amount, high-frequency claims e.g motor damage or doctor visits, while others cover high-amount, low-frequency e.g medical, product liability. This KPI is an important part of actuarial analysis as historical claims frequency, together with severity, help estimate expected claims and supports the pricing of the product. From a prudential point of view, if claims frequency of a particular benefit or product appears to be higher than what is normal for risks of that type, the insurer would normally be expected to take action to reduce the risk or increase premiums.
From a market conduct point of view, the claims frequency shows how often consumers are likely to make a (successful) claim. If the claims frequency of a product is unusually low in com-parison to similar products with similar premiums levels, it could be a sign of product complex-ity or poor sales practices, i.e. that the consumer may not have understood the benefits well or how to claim. If the claims frequency is especially low for a particular sales channel given a similar product, it could point to conduct issues with the corresponding channel. It could also be that the product does not cover risks policyholders are exposed to and therefore does not meet needs.
Supervisors can compare claims frequencies for similar benefits across peers and distribution channels, as well as check for trends over time. It is also useful to check if claims frequency is lower than expected from business plans and pricing. It is also important to check against
45 Supervisors can choose whether to use claims registered or accepted, depending on aim and data available. The UK uses claims registered for calculating claims frequency in their value measures pilot while Australia uses claims accepted. The reason as noted by the FCA is that they already include claims acceptance rates in the selection of KPIs used in the value measures, and as such successful claims are already being tracked by another KPI.
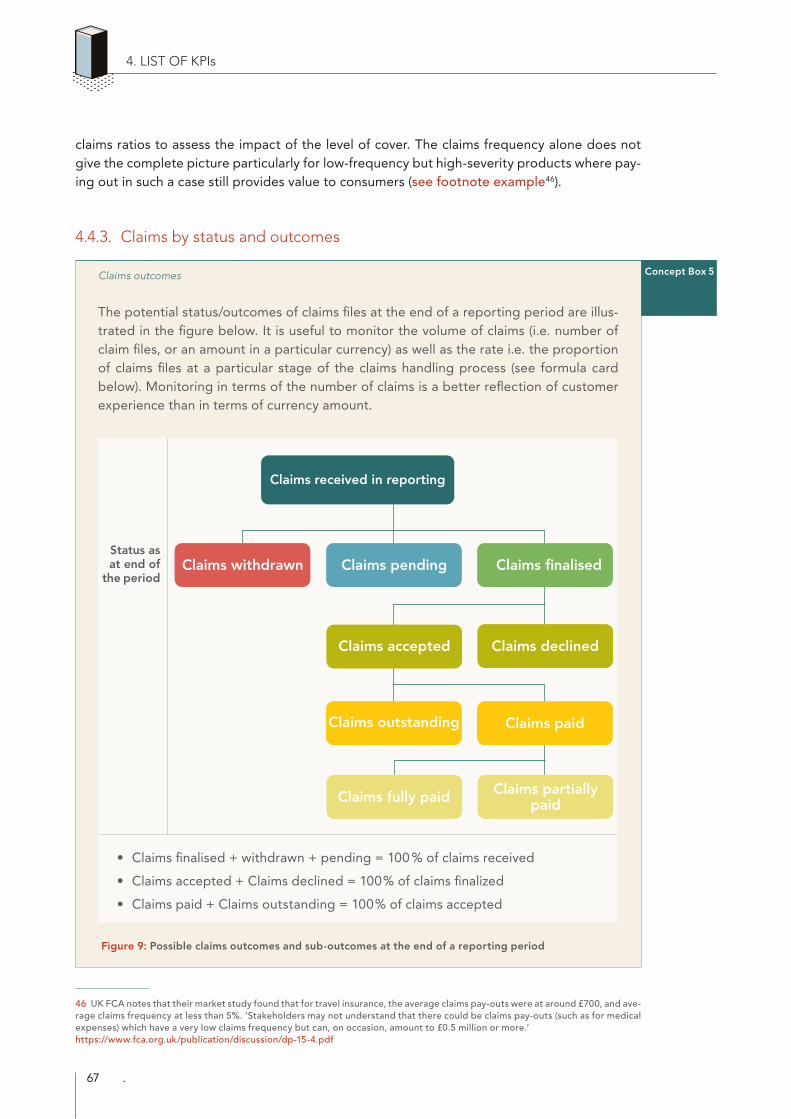
67
Claims outcomes
4. LIST OF KPIs
Concept Box 5
Claims received in reporting
Claims withdrawn Claims finalised
Claims declined
Claims pending
Claims accepted
Claims outstanding Claims paid
Claims partially paidClaims fully paid
Status as at end of
the period
claims ratios to assess the impact of the level of cover. The claims frequency alone does not give the complete picture particularly for low-frequency but high-severity products where pay-ing out in such a case still provides value to consumers (see footnote example46).
4.4.3. Claims by status and outcomes
The potential status/outcomes of claims files at the end of a reporting period are illus-trated in the figure below. It is useful to monitor the volume of claims (i.e. number of claim files, or an amount in a particular currency) as well as the rate i.e. the proportion of claims files at a particular stage of the claims handling process (see formula card below). Monitoring in terms of the number of claims is a better reflection of customer experience than in terms of currency amount.
• Claims finalised + withdrawn + pending = 100 % of claims received
• Claims accepted + Claims declined = 100% of claims finalized
• Claims paid + Claims outstanding = 100% of claims accepted
Figure 9: Possible claims outcomes and sub-outcomes at the end of a reporting period
46 UK FCA notes that their market study found that for travel insurance, the average claims pay-outs were at around £700, and ave-rage claims frequency at less than 5%. ‘Stakeholders may not understand that there could be claims pay-outs (such as for medical expenses) which have a very low claims frequency but can, on occasion, amount to £0.5 million or more.’ https://www.fca.org.uk/publication/discussion/dp-15-4.pdf
68
Each claim outcome/status is described below. Note that there is no single standard definition for the terminology; practice vary among supervisors, and between the supervisor and industry. Supervisors should clarify and streamline definitions in their reporting returns. This is especially important to bear in mind for grey-area cases e.g claims that are withdrawn and then reopened, partial or recurring claims payments. For such cases supervisors can decide on which outcome these cases should be classified under, and most importantly, ensure reporting consistency. A few examples of such grey areas are elaborated in the footnotes.
Claims received/registered47, 48 where received/registered is the point in time when the policyholder notifies the insurer49 of a claim or the claim has been registered in the system.
Claims withdrawn refers to the instance where a received claim is withdrawn and closed before being assessed and finalised50.
Claims pending (or undetermined) are all received claims where a decision has not been made and that remain open for assessment at the end of the reporting period
Claims finalised are claims on which the insurer has made a final decision on the claim (e.g whether to admit or decline the claim) and communicated this decision to the claimant.
Claims accepted (or admitted) are claims where the benefit51 that the claimant was entitled to in terms of the policy contract is payable.
47 Some supervisors define this more precisely as ‘where the first piece of information (not necessarily all information) is received by the insurer to allow it to commence the assessment of a claim’ or the point from which ‘a report or communication is received from a retail customer to raise a claim on their insurance policy, where the insurer has confirmed there is a policy in force that could potentially cover the indicated claim event and has recorded the existence of a claim’. Other granularities to consider: Some supervisors also include the following as claims received - (i) claims that were undetermined at the start of the reporting period (ii) claims that were received during the reporting period (iii) claims that insurers re-opened (subsequent to being withdrawn) during the reporting period
48 Some interpret ‘claims registered or received’ as the point after which the consumer initiates enquiries about claims after the claims event, some see this as the point after which the claim has been formally registered with the insurer, while some focus on the point after which full documentation has been received by the insurer from the consumer. Increasingly supervisors take the ‘consumer-centric’ view, in that they scrutinise the claims process after the point where the claim has been formally registered or notified to the insurer, regardless of whether full documentation has been received by then. This gives better reflects the quality of the customer experience.
49 Claims can also be based on claims notified to intermediaries or outsourced partners. South Africa deems claims received by intermediaries and outsourced partners to be received by the insurer.
50 There are insurers that classify a claim as ‘withdrawn’ if they made the necessary follow-ups for outstanding documents but documents was not received from policyholders by a certain time. They may also classify such a claim as closed, though for unifor-mity, South Africa refers to it as ‘withdrawn’. It is not considered ‘rejected’ as insurers can’t always confirm it in writing and comply with FSCA rules on rejections, as they sometimes have too little information to contact the claimant.It can be reopened at any time and a final decision to pay or repudiate has not been made. In this case Australia reclassifies it as ‘claims received’.
51 Generally this refers to where full benefits are payable. For grey areas: Some supervisors consider claims with partial benefits payable as accepted, while others consider that as rejected. Some supervisors specifically include claims admitted fully on an ex-gratia basis. These are claims that technically do not meet the policy contract definition for a claim, but where the insurer has decided to pay the claim in full. This can be decided by the supervisors as long as the definition is used consistently over time and throughout the industry.
4. LIST OF KPIs
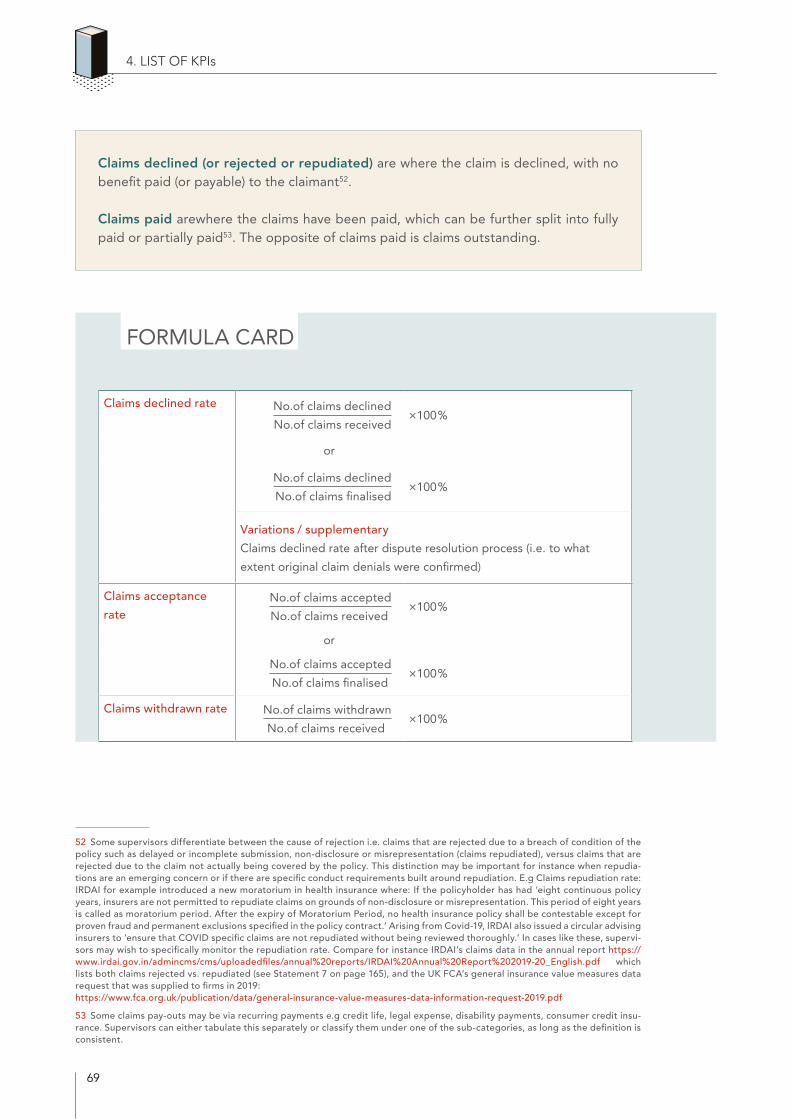
69
Claims declined rate No.of claims declined
No.of claims received×100%
or
No.of claims declined
No.of claims finalised×100%
Variations / supplementary
Claims declined rate after dispute resolution process (i.e. to what
extent original claim denials were confirmed)
Claims acceptance
rateNo.of claims accepted
No.of claims receivedI×100%
or
No.of claims accepted
No.of claims finalised×100%
Claims withdrawn rate No.of claims withdrawn
No.of claims receivedI×100%
Claims declined (or rejected or repudiated) are where the claim is declined, with no benefit paid (or payable) to the claimant52.
Claims paid arewhere the claims have been paid, which can be further split into fully paid or partially paid53. The opposite of claims paid is claims outstanding.
FORMULA CARD
52 Some supervisors differentiate between the cause of rejection i.e. claims that are rejected due to a breach of condition of the policy such as delayed or incomplete submission, non-disclosure or misrepresentation (claims repudiated), versus claims that are rejected due to the claim not actually being covered by the policy. This distinction may be important for instance when repudia-tions are an emerging concern or if there are specific conduct requirements built around repudiation. E.g Claims repudiation rate: IRDAI for example introduced a new moratorium in health insurance where: If the policyholder has had ‘eight continuous policy years, insurers are not permitted to repudiate claims on grounds of non-disclosure or misrepresentation. This period of eight years is called as moratorium period. After the expiry of Moratorium Period, no health insurance policy shall be contestable except for proven fraud and permanent exclusions specified in the policy contract.’ Arising from Covid-19, IRDAI also issued a circular advising insurers to ‘ensure that COVID specific claims are not repudiated without being reviewed thoroughly.’ In cases like these, supervi-sors may wish to specifically monitor the repudiation rate. Compare for instance IRDAI’s claims data in the annual report https://www.irdai.gov.in/admincms/cms/uploadedfiles/annual%20reports/IRDAI%20Annual%20Report%202019-20_English.pdf which lists both claims rejected vs. repudiated (see Statement 7 on page 165), and the UK FCA’s general insurance value measures data request that was supplied to firms in 2019: https://www.fca.org.uk/publication/data/general-insurance-value-measures-data-information-request-2019.pdf
53 Some claims pay-outs may be via recurring payments e.g credit life, legal expense, disability payments, consumer credit insu-rance. Supervisors can either tabulate this separately or classify them under one of the sub-categories, as long as the definition is consistent.
4. LIST OF KPIs
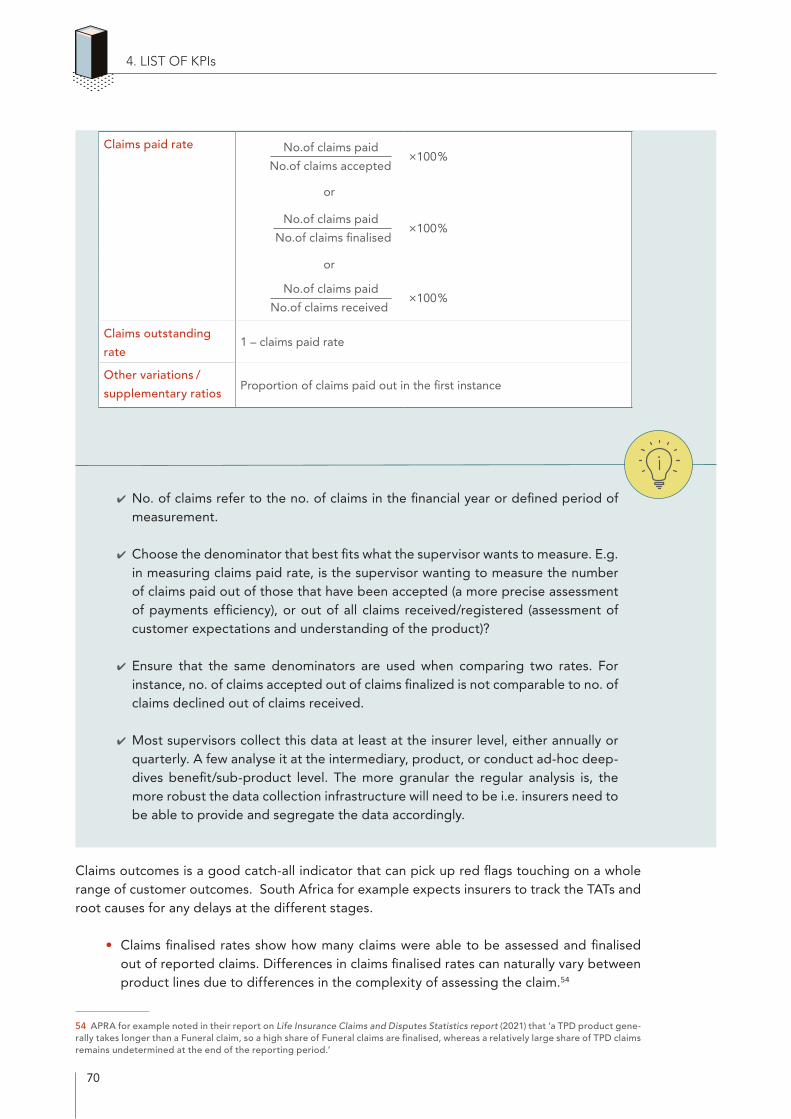
70
✔ No. of claims refer to the no. of claims in the financial year or defined period of measurement.
✔ Choose the denominator that best fits what the supervisor wants to measure. E.g. in measuring claims paid rate, is the supervisor wanting to measure the number of claims paid out of those that have been accepted (a more precise assessment of payments efficiency), or out of all claims received/registered (assessment of customer expectations and understanding of the product)?
✔ Ensure that the same denominators are used when comparing two rates. For instance, no. of claims accepted out of claims finalized is not comparable to no. of claims declined out of claims received.
✔ Most supervisors collect this data at least at the insurer level, either annually or quarterly. A few analyse it at the intermediary, product, or conduct ad-hoc deep-dives benefit/sub-product level. The more granular the regular analysis is, the more robust the data collection infrastructure will need to be i.e. insurers need to be able to provide and segregate the data accordingly.
Claims outcomes is a good catch-all indicator that can pick up red flags touching on a whole range of customer outcomes. South Africa for example expects insurers to track the TATs and root causes for any delays at the different stages.
• Claims finalised rates show how many claims were able to be assessed and finalised out of reported claims. Differences in claims finalised rates can naturally vary between product lines due to differences in the complexity of assessing the claim.54
54 APRA for example noted in their report on Life Insurance Claims and Disputes Statistics report (2021) that ‘a TPD product gene-rally takes longer than a Funeral claim, so a high share of Funeral claims are finalised, whereas a relatively large share of TPD claims remains undetermined at the end of the reporting period.’
4. LIST OF KPIs
Claims paid rate No.of claims paid
No.of claims accepted×100%
or
No.of claims paid
No.of claims finalised×100%
or
No.of claims paid
No.of claims receivedI×100%
Claims outstanding
rate1 – claims paid rate
Other variations /
supplementary ratios Proportion of claims paid out in the first instance
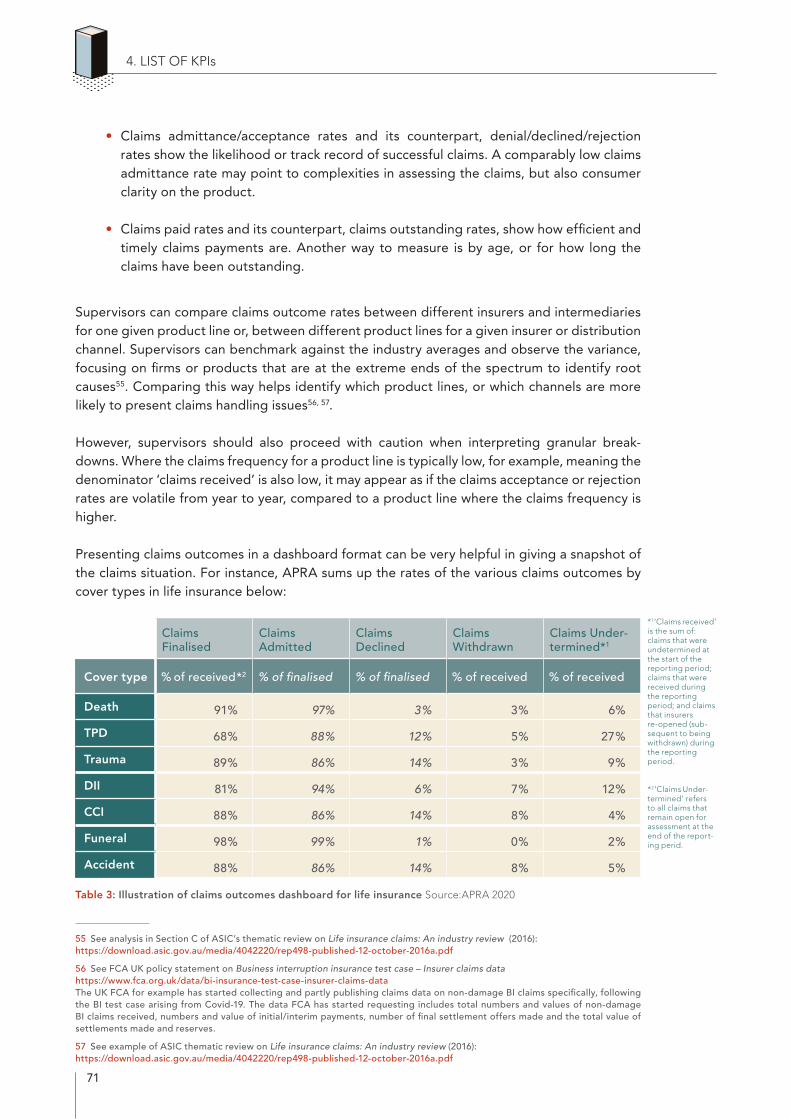
71
• Claims admittance/acceptance rates and its counterpart, denial/declined/rejection rates show the likelihood or track record of successful claims. A comparably low claims admittance rate may point to complexities in assessing the claims, but also consumer clarity on the product.
• Claims paid rates and its counterpart, claims outstanding rates, show how efficient and timely claims payments are. Another way to measure is by age, or for how long the claims have been outstanding.
Supervisors can compare claims outcome rates between different insurers and intermediaries for one given product line or, between different product lines for a given insurer or distribution channel. Supervisors can benchmark against the industry averages and observe the variance, focusing on firms or products that are at the extreme ends of the spectrum to identify root causes55. Comparing this way helps identify which product lines, or which channels are more likely to present claims handling issues56, 57.
However, supervisors should also proceed with caution when interpreting granular break-downs. Where the claims frequency for a product line is typically low, for example, meaning the denominator ‘claims received’ is also low, it may appear as if the claims acceptance or rejection rates are volatile from year to year, compared to a product line where the claims frequency is higher.
Presenting claims outcomes in a dashboard format can be very helpful in giving a snapshot of the claims situation. For instance, APRA sums up the rates of the various claims outcomes by cover types in life insurance below:
Table 3: Illustration of claims outcomes dashboard for life insurance Source:APRA 2020
55 See analysis in Section C of ASIC’s thematic review on Life insurance claims: An industry review (2016): https://download.asic.gov.au/media/4042220/rep498-published-12-october-2016a.pdf
56 See FCA UK policy statement on Business interruption insurance test case – Insurer claims data https://www.fca.org.uk/data/bi-insurance-test-case-insurer-claims-dataThe UK FCA for example has started collecting and partly publishing claims data on non-damage BI claims specifically, following the BI test case arising from Covid-19. The data FCA has started requesting includes total numbers and values of non-damage BI claims received, numbers and value of initial/interim payments, number of final settlement offers made and the total value of settlements made and reserves.
57 See example of ASIC thematic review on Life insurance claims: An industry review (2016): https://download.asic.gov.au/media/4042220/rep498-published-12-october-2016a.pdf
4. LIST OF KPIs
Claims Finalised
Claims Admitted
Claims Declined
Claims Withdrawn
Claims Under-termined*1
Cover type % of received*2 % of finalised % of finalised % of received % of received
Death 91% 97% 3% 3% 6%
TPD 68% 88% 12% 5% 27%
Trauma 89% 86% 14% 3% 9%
DII 81% 94% 6% 7% 12%
CCI 88% 86% 14% 8% 4%
Funeral 98% 99% 1% 0% 2%
Accident 88% 86% 14% 8% 5%
*1 ‘Claims received’ is the sum of: claims that were undetermined at the start of the reporting period; claims that were received during the reporting period; and claims that insurers re-opened (sub-sequent to being withdrawn) during the reporting period.
*2 ‘Claims Under-termined’ refers to all claims that remain open for assessment at the end of the report-ing perid.
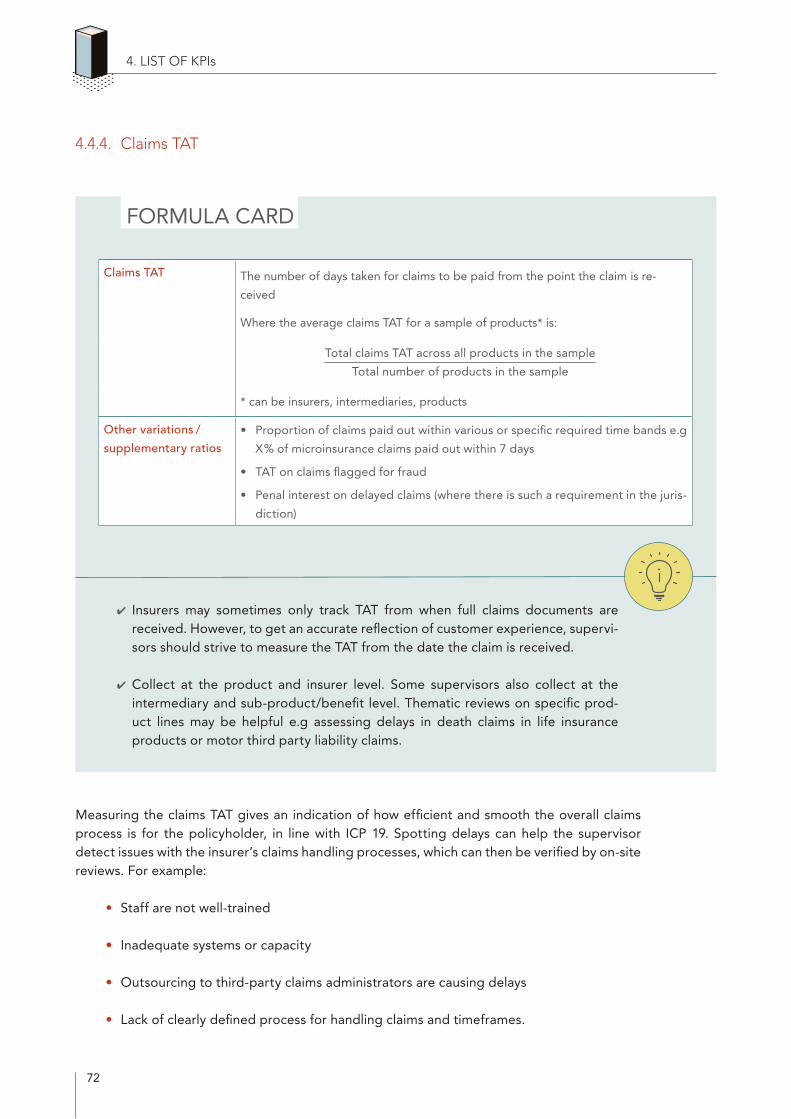
72
4.4.4. Claims TAT
FORMULA CARD
✔ Insurers may sometimes only track TAT from when full claims documents are received. However, to get an accurate reflection of customer experience, supervi-sors should strive to measure the TAT from the date the claim is received.
✔ Collect at the product and insurer level. Some supervisors also collect at the intermediary and sub-product/benefit level. Thematic reviews on specific prod-uct lines may be helpful e.g assessing delays in death claims in life insurance products or motor third party liability claims.
Measuring the claims TAT gives an indication of how efficient and smooth the overall claims process is for the policyholder, in line with ICP 19. Spotting delays can help the supervisor detect issues with the insurer’s claims handling processes, which can then be verified by on-site reviews. For example:
• Staff are not well-trained
• Inadequate systems or capacity
• Outsourcing to third-party claims administrators are causing delays
• Lack of clearly defined process for handling claims and timeframes.
4. LIST OF KPIs
Claims TAT The number of days taken for claims to be paid from the point the claim is re-
ceived
Where the average claims TAT for a sample of products* is:
Total claims TAT across all products in the sample
Total number of products in the sample
* can be insurers, intermediaries, products
Other variations /
supplementary ratios
• Proportion of claims paid out within various or specific required time bands e.g
X% of microinsurance claims paid out within 7 days
• TAT on claims flagged for fraud
• Penal interest on delayed claims (where there is such a requirement in the juris-
diction)
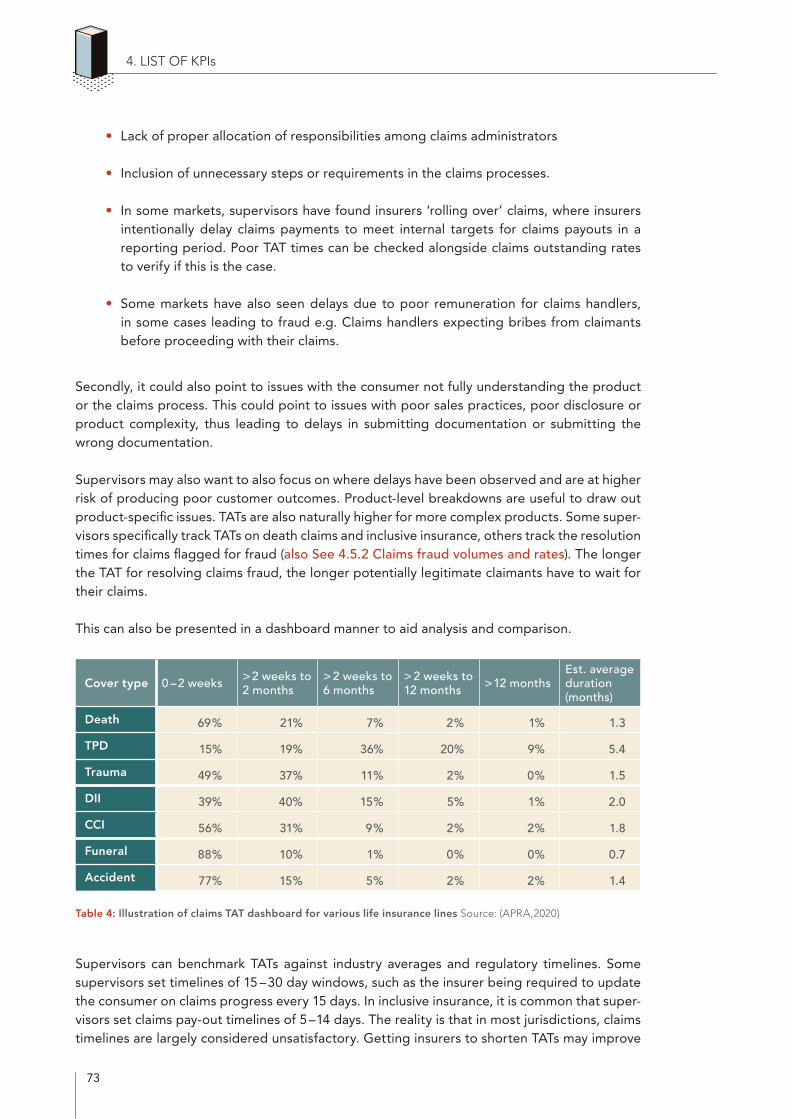
73
• Lack of proper allocation of responsibilities among claims administrators
• Inclusion of unnecessary steps or requirements in the claims processes.
• In some markets, supervisors have found insurers ‘rolling over’ claims, where insurers intentionally delay claims payments to meet internal targets for claims payouts in a reporting period. Poor TAT times can be checked alongside claims outstanding rates to verify if this is the case.
• Some markets have also seen delays due to poor remuneration for claims handlers, in some cases leading to fraud e.g. Claims handlers expecting bribes from claimants before proceeding with their claims.
Secondly, it could also point to issues with the consumer not fully understanding the product or the claims process. This could point to issues with poor sales practices, poor disclosure or product complexity, thus leading to delays in submitting documentation or submitting the wrong documentation.
Supervisors may also want to also focus on where delays have been observed and are at higher risk of producing poor customer outcomes. Product-level breakdowns are useful to draw out product-specific issues. TATs are also naturally higher for more complex products. Some super-visors specifically track TATs on death claims and inclusive insurance, others track the resolution times for claims flagged for fraud (also See 4.5.2 Claims fraud volumes and rates). The longer the TAT for resolving claims fraud, the longer potentially legitimate claimants have to wait for their claims.
This can also be presented in a dashboard manner to aid analysis and comparison.
Table 4: Illustration of claims TAT dashboard for various life insurance lines Source: (APRA,2020)
Supervisors can benchmark TATs against industry averages and regulatory timelines. Some supervisors set timelines of 15 –30 day windows, such as the insurer being required to update the consumer on claims progress every 15 days. In inclusive insurance, it is common that super-visors set claims pay-out timelines of 5–14 days. The reality is that in most jurisdictions, claims timelines are largely considered unsatisfactory. Getting insurers to shorten TATs may improve
4. LIST OF KPIs
Cover type 0 –2 weeks >2 weeks to 2 months
> 2 weeks to 6 months
> 2 weeks to 12 months >12 months
Est. average duration (months)
Death 69% 21% 7% 2% 1% 1.3
TPD 15% 19% 36% 20% 9% 5.4
Trauma 49% 37% 11% 2% 0% 1.5
DII 39% 40% 15% 5% 1% 2.0
CCI 56% 31% 9% 2% 2% 1.8
Funeral 88% 10% 1% 0% 0% 0.7
Accident 77% 15% 5% 2% 2% 1.4
74
customer experience in one sense but could also lead to more claims being rejected. It also has implications on prudential risk. Improvements, therefore, need to be supported by close engagement and on-site reviews.
In some jurisdictions, insurers may be required to pay out ‘penal interest’ on delayed claims beyond a certain timeframe or specified circumstances such as where the consumer is con-sidered to be owed a sum of money under the policy, but the firm has unreasonably withheld payment. For instance, in India, insurers must pay penal interest of 2% above the prevailing Reserve Bank of India Bank Rate to the insured person where health claims are not settled within 30 days from receipt of complete documentation58. In Australia, this is decided on a case-to-case basis by the Australian Financial Complaints Authority (AFCA) based on certain guidelines.59
In such cases, insurers supervisors may be interested to monitor the amount of penal interest being paid out, as an alternative way of measuring the extent to which severe claims delays are happening in the sector, while also measuring the financial cost of delayed claims to insurers.
SPECIAL CONSIDERATIONS FOR MICROINSURANCE
For inclusive insurance and microinsurance products, claims TAT is especially import-ant (see A2ii, 2019). Supervisors who have an inclusive insurance framework typically require microinsurance claims to be paid out within a fixed no. of days, normally 5 –14 days. This is because microinsurance products are usually expected or even required to have a simple design with few exclusions and conditions, therefore enabling fast claims.
Ideally, companies would be able to measure the time from the risk event happening to the final payout, because even a few days’ difference can significantly affect the coping strategy of a low-income household that does not have much financial buffer. A MILK study comparing two life products in the Philippines with differing claims TAT showed that the time taken to pay claims affects how the money is allocated between wake expenses, funeral expenses, and post-funeral needs. It also affects the beneficiary’s recourse to other sources of financing such as informal lending, which can have long-term ramifications for the financial health of the household60 .
58 See IRDAI India’s approach to penal interest in health insurance here: https://www.irdai.gov.in/ADMINCMS/cms/whatsNew_Layout.aspx?page=PageNo4157&flag=1
59 See AFCA Australia’s approach to awarding interest to consumers here: https://www.afca.org.au/media/390/download
60 See "Doing the Math – Funeral Microinsurance and Speedy Claims in the Philippines". Available here: http://www.microinsurancecentre.org/component/edocman/products/life/milk-brief-27-doing-the-math-funeral-insurance-and-speedy-claims-in-the-philippines.html?Itemid=
4. LIST OF KPIs
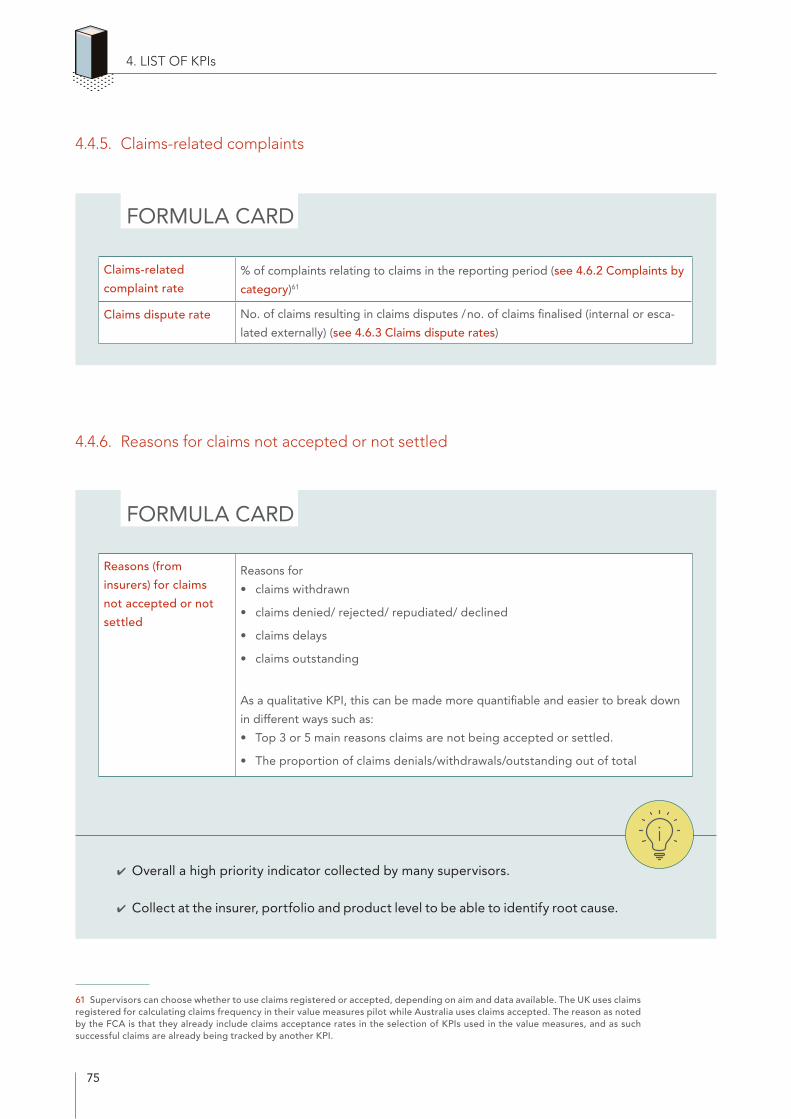
75
Reasons (from
insurers) for claims
not accepted or not
settled
Reasons for
• claims withdrawn
• claims denied/ rejected/ repudiated/ declined
• claims delays
• claims outstanding
As a qualitative KPI, this can be made more quantifiable and easier to break down
in different ways such as:
• Top 3 or 5 main reasons claims are not being accepted or settled.
• The proportion of claims denials/withdrawals/outstanding out of total
Claims-related
complaint rate% of complaints relating to claims in the reporting period (see 4.6.2 Complaints by
category)61
Claims dispute rate No. of claims resulting in claims disputes / no. of claims finalised (internal or esca-
lated externally) (see 4.6.3 Claims dispute rates)
4.4.5. Claims-related complaints
FORMULA CARD
61
4.4.6. Reasons for claims not accepted or not settled
FORMULA CARD
✔ Overall a high priority indicator collected by many supervisors.
✔ Collect at the insurer, portfolio and product level to be able to identify root cause.
61 Supervisors can choose whether to use claims registered or accepted, depending on aim and data available. The UK uses claims registered for calculating claims frequency in their value measures pilot while Australia uses claims accepted. The reason as noted by the FCA is that they already include claims acceptance rates in the selection of KPIs used in the value measures, and as such successful claims are already being tracked by another KPI.
4. LIST OF KPIs
76
While claims rejection, outstanding and withdrawal rates help supervisors detect the existence of a problem, knowing the reasons enables supervisors to concretely identify what the root causes are and therefore target their response accordingly, whether in pre-emptive or ongo-ing supervisory review or in reacting to a complaint. Understanding the reasons also supports risk-based supervision and evidence-based interventions. Potential reasons for unusually high rates of:
Claims withdrawn:
• consumer not understanding the product benefits from the outset due to poor sales, disclosure or product complexity
• Too many requirements compared to the claim (so it is not worth it for the customer to claim);
• Requirements that are not possible for claimants to meet;
• The impact of the claim on their premiums and risk assessment by the insurer;
• Claims within the excess chosen by the policyholder and they therefore rather repair the vehicle or replace the asset themselves; or
• Behaviour of the assessor during the investigation of the claim
Claims denials:
• policy conditions, exclusions and waiting periods
• non-disclosure by policyholders at the point contract was entered into
• mis-selling and inadequate disclosure, consumer understanding
• poor underwriting practices
• unfair claims assessment practices or conflicts of interest, such as incentivising claims assessors to repudiate claims, or making a loss ratio the only indicator to determine profit share with outsourced partners
Claims delays/claims outstanding:
• inefficiency due to competence or resourcing issues
• unfair practices such as claims rollover where insurers withhold large claims to meet internal caps on how much claims should be paid out in a given reporting period, rather than immediately pay out what is due to consumers
• conduct of the policyholder – for instance, where a consumer did not provide the infor-mation requested by the insurer
4. LIST OF KPIs
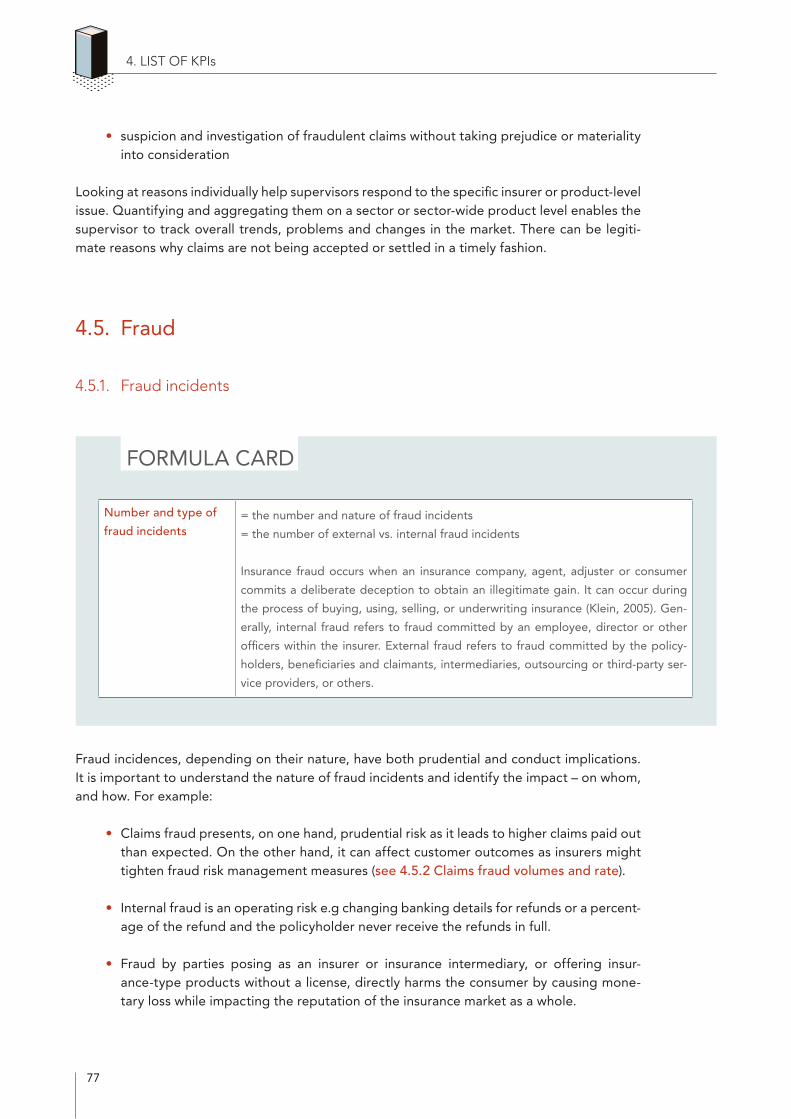
77
• suspicion and investigation of fraudulent claims without taking prejudice or materiality into consideration
Looking at reasons individually help supervisors respond to the specific insurer or product-level issue. Quantifying and aggregating them on a sector or sector-wide product level enables the supervisor to track overall trends, problems and changes in the market. There can be legiti-mate reasons why claims are not being accepted or settled in a timely fashion.
4.5. Fraud
4.5.1. Fraud incidents
FORMULA CARD
Fraud incidences, depending on their nature, have both prudential and conduct implications. It is important to understand the nature of fraud incidents and identify the impact – on whom, and how. For example:
• Claims fraud presents, on one hand, prudential risk as it leads to higher claims paid out than expected. On the other hand, it can affect customer outcomes as insurers might tighten fraud risk management measures (see 4.5.2 Claims fraud volumes and rate).
• Internal fraud is an operating risk e.g changing banking details for refunds or a percent-age of the refund and the policyholder never receive the refunds in full.
• Fraud by parties posing as an insurer or insurance intermediary, or offering insur-ance-type products without a license, directly harms the consumer by causing mone-tary loss while impacting the reputation of the insurance market as a whole.
4. LIST OF KPIs
Number and type of
fraud incidents = the number and nature of fraud incidents
= the number of external vs. internal fraud incidents
Insurance fraud occurs when an insurance company, agent, adjuster or consumer
commits a deliberate deception to obtain an illegitimate gain. It can occur during
the process of buying, using, selling, or underwriting insurance (Klein, 2005). Gen-
erally, internal fraud refers to fraud committed by an employee, director or other
officers within the insurer. External fraud refers to fraud committed by the policy-
holders, beneficiaries and claimants, intermediaries, outsourcing or third-party ser-
vice providers, or others.
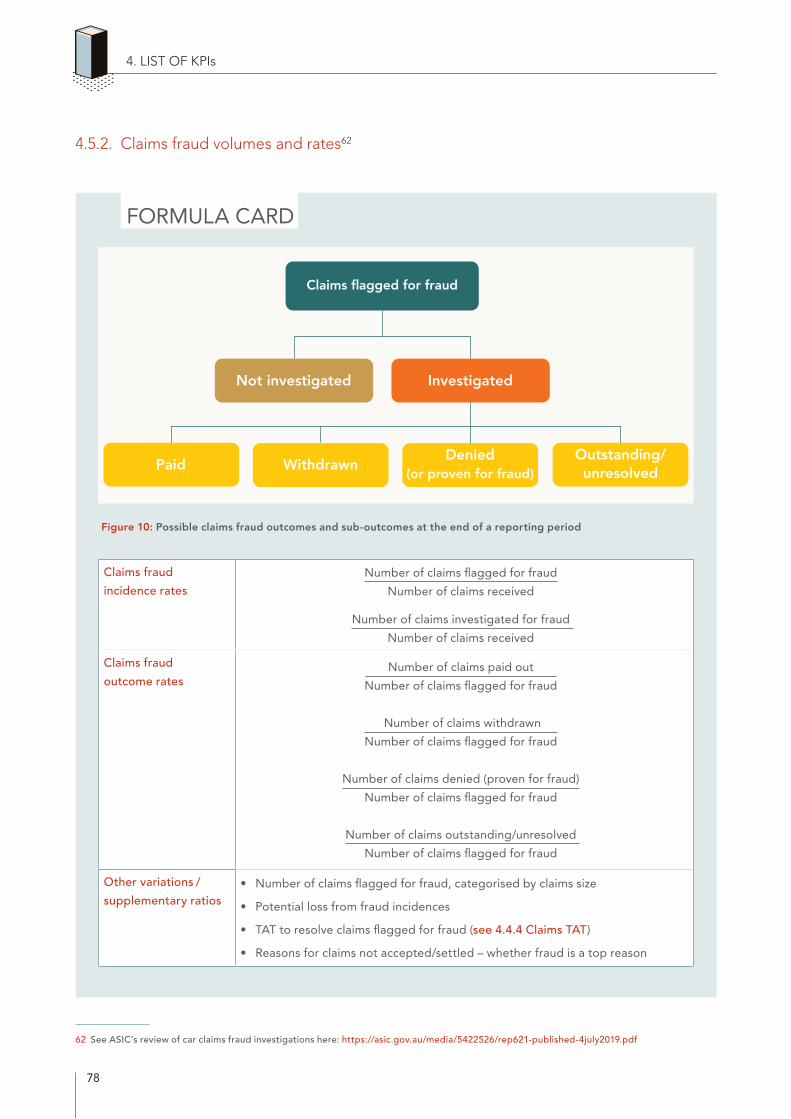
78
4.5.2. Claims fraud volumes and rates62
FORMULA CARD
Figure 10: Possible claims fraud outcomes and sub-outcomes at the end of a reporting period
62 See ASIC’s review of car claims fraud investigations here: https://asic.gov.au/media/5422526/rep621-published-4july2019.pdf
4. LIST OF KPIs
Claims fraud
incidence rates Number of claims flagged for fraud
Number of claims received
Number of claims investigated for fraud
Number of claims received
Claims fraud
outcome ratesNumber of claims paid out
Number of claims flagged for fraud
IIIIIINumber of claims withdrawnIIIII
Number of claims flagged for fraud
Number of claims denied (proven for fraud)
Number of claims flagged for fraud
Number of claims outstanding/unresolved
Number of claims flagged for fraud
Other variations /
supplementary ratios• Number of claims flagged for fraud, categorised by claims size
• Potential loss from fraud incidences
• TAT to resolve claims flagged for fraud (see 4.4.4 Claims TAT)
• Reasons for claims not accepted/settled – whether fraud is a top reason
Denied (or proven for fraud)
Withdrawn
Claims flagged for fraud
InvestigatedNot investigated
PaidOutstanding/ unresolved
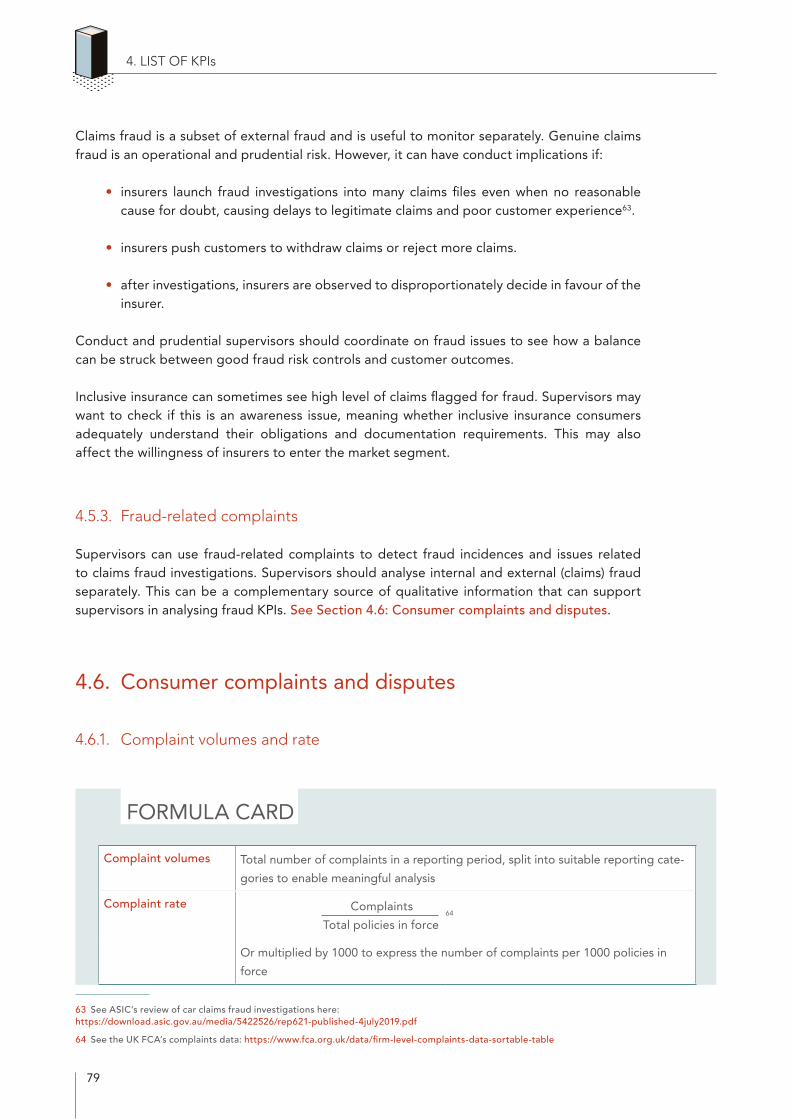
79
Claims fraud is a subset of external fraud and is useful to monitor separately. Genuine claims fraud is an operational and prudential risk. However, it can have conduct implications if:
• insurers launch fraud investigations into many claims files even when no reasonable cause for doubt, causing delays to legitimate claims and poor customer experience63.
• insurers push customers to withdraw claims or reject more claims.
• after investigations, insurers are observed to disproportionately decide in favour of the insurer.
Conduct and prudential supervisors should coordinate on fraud issues to see how a balance can be struck between good fraud risk controls and customer outcomes.
Inclusive insurance can sometimes see high level of claims flagged for fraud. Supervisors may want to check if this is an awareness issue, meaning whether inclusive insurance consumers adequately understand their obligations and documentation requirements. This may also affect the willingness of insurers to enter the market segment.
4.5.3. Fraud-related complaints
Supervisors can use fraud-related complaints to detect fraud incidences and issues related to claims fraud investigations. Supervisors should analyse internal and external (claims) fraud separately. This can be a complementary source of qualitative information that can support supervisors in analysing fraud KPIs. See Section 4.6: Consumer complaints and disputes.
4.6. Consumer complaints and disputes
4.6.1. Complaint volumes and rate
FORMULA CARD
63 See ASIC’s review of car claims fraud investigations here: https://download.asic.gov.au/media/5422526/rep621-published-4july2019.pdf
64 See the UK FCA’s complaints data: https://www.fca.org.uk/data/firm-level-complaints-data-sortable-table
4. LIST OF KPIs
Complaint volumes Total number of complaints in a reporting period, split into suitable reporting cate-
gories to enable meaningful analysis
Complaint rate ComplaintsIIIIIIII
Total policies in force64
Or multiplied by 1000 to express the number of complaints per 1000 policies in
force
80
Complaints data generally are by far the most used KPI by conduct supervisors. It is tracked regularly and deep dives into more granular levels are conducted on an ad-hoc basis. Frequencies range from annual basis, quarterly, bi-annual, monthly to daily/real-time. Supervisors/markets with more sophisticated data collection infrastructure can track complaints more frequently.
A complaint can be defined as an expression of dissatisfaction about the service or product provided by an insurer or intermediary (ICP 19.11.1). This section is focused on complaints by retail consumers, rather than commercial clients or professional investors. Complaints infor-mation is, by far, the most-frequently-used data by conduct supervisors. Complaints are a catch-all market surveillance tool that provides a starting point for further review and provide insight into a wide range of conduct risks. It can help detect issues across the insurance value chain, from product design, advertising, sales and advice, servicing, claims, disputes to general communication and accessibility of the insurer and intermediary.
Complaints are the supervisor’s primary source of direct consumer feedback on the insurance sector’s conduct. However, it is important to not jump to conclusions solely based on com-plaint data. A complaint could be due to poor conduct on the insurer’s part, the result of mis-communication, but also of unrealistic expectations on the part of the consumer (Klein, 2005). It is nevertheless a good indicator of consumer perception and trust of insurers. This is also important as a measure of reputational risk for the insurer, which is a component of prudential risk. It can also highlight areas where consumer education needs to be enhanced.
Complaint numbers and rates are also important risk indicators for risk-based conduct super-vision and risk-scoring of firms. Supervisors can increase the intensity and frequency of super-vision of firms that have high complaint rates, for example, or pay special attention to specific product lines and intermediaries.
The absence of complaints also does not mean there is no cause for concern. To use complaints effectively, consumers need to be aware of their rights and ways to complain. This may not be the case in nascent insurance markets, or if inadequate disclosure is provided. Supervisors need to ensure that initiatives are in place to inform and educate consumers, such as through information on the regulator’s website and materials, and financial education initiatives. This information needs to be accessible especially for inclusive insurance customers.
Supervisors should set out clear internal criteria for supervisory staff to use in identifying which or when complaints should warrant further review. Inquiries or feedback from the industry, consumer associations, the media, social media or other sources about particular business practices may also warrant supervisory concern (Klein, 2005). The FSCA monitors social media as a way of obtaining real-time information.
4. LIST OF KPIs
Other variations /
supplementary ratios
Complaint share relative to market share, where market share is measured by policy
count
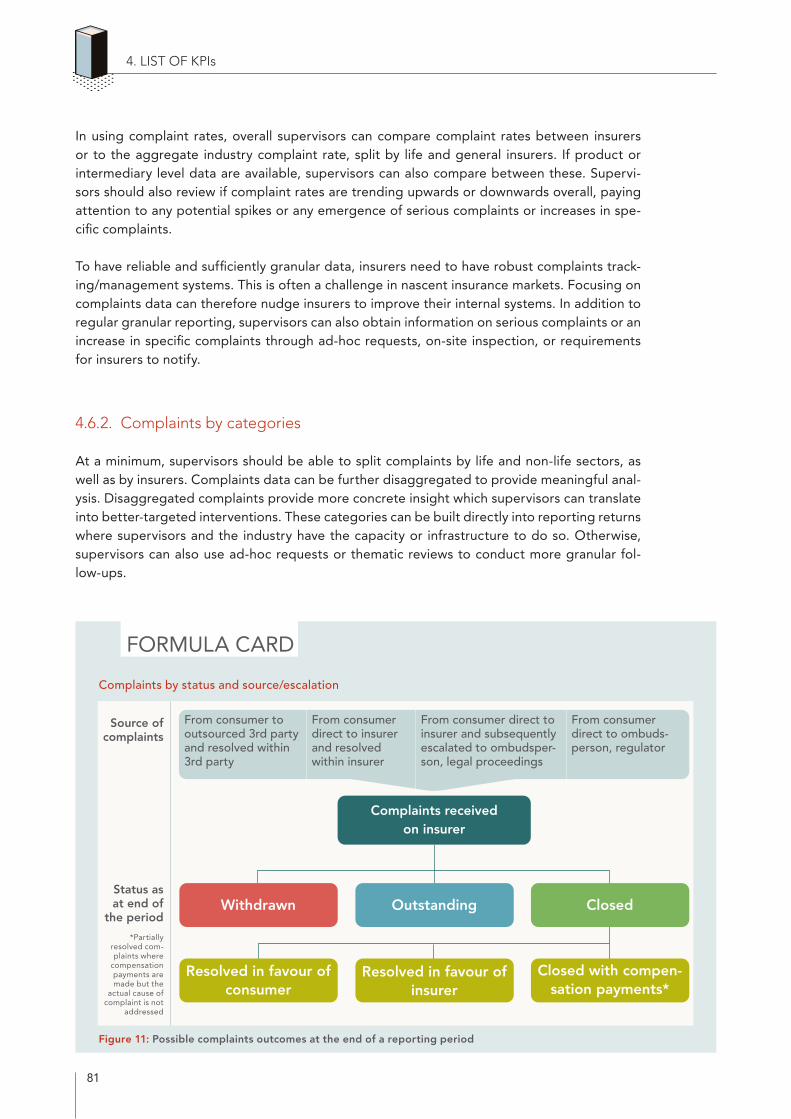
81
4. LIST OF KPIs
Complaints receivedon insurer
Withdrawn ClosedOutstanding
Resolved in favour of consumer
Closed with compen-sation payments*
Resolved in favour of insurer
Status as at end of
the period
*Partially resolved com-plaints where
compensation payments are made but the
actual cause of complaint is not
addressed
Source of complaints
From consumer to outsourced 3rd party and resolved within 3rd party
From consumer direct to insurer and resolved within insurer
From consumer direct to insurer and subsequently escalated to ombudsper-son, legal proceedings
From consumer direct to ombuds-person, regulator
In using complaint rates, overall supervisors can compare complaint rates between insurers or to the aggregate industry complaint rate, split by life and general insurers. If product or intermediary level data are available, supervisors can also compare between these. Supervi-sors should also review if complaint rates are trending upwards or downwards overall, paying attention to any potential spikes or any emergence of serious complaints or increases in spe-cific complaints.
To have reliable and sufficiently granular data, insurers need to have robust complaints track-ing/management systems. This is often a challenge in nascent insurance markets. Focusing on complaints data can therefore nudge insurers to improve their internal systems. In addition to regular granular reporting, supervisors can also obtain information on serious complaints or an increase in specific complaints through ad-hoc requests, on-site inspection, or requirements for insurers to notify.
4.6.2. Complaints by categories
At a minimum, supervisors should be able to split complaints by life and non-life sectors, as well as by insurers. Complaints data can be further disaggregated to provide meaningful anal-ysis. Disaggregated complaints provide more concrete insight which supervisors can translate into better-targeted interventions. These categories can be built directly into reporting returns where supervisors and the industry have the capacity or infrastructure to do so. Otherwise, supervisors can also use ad-hoc requests or thematic reviews to conduct more granular fol-low-ups.
FORMULA CARD
Complaints by status and source/escalation
Figure 11: Possible complaints outcomes at the end of a reporting period
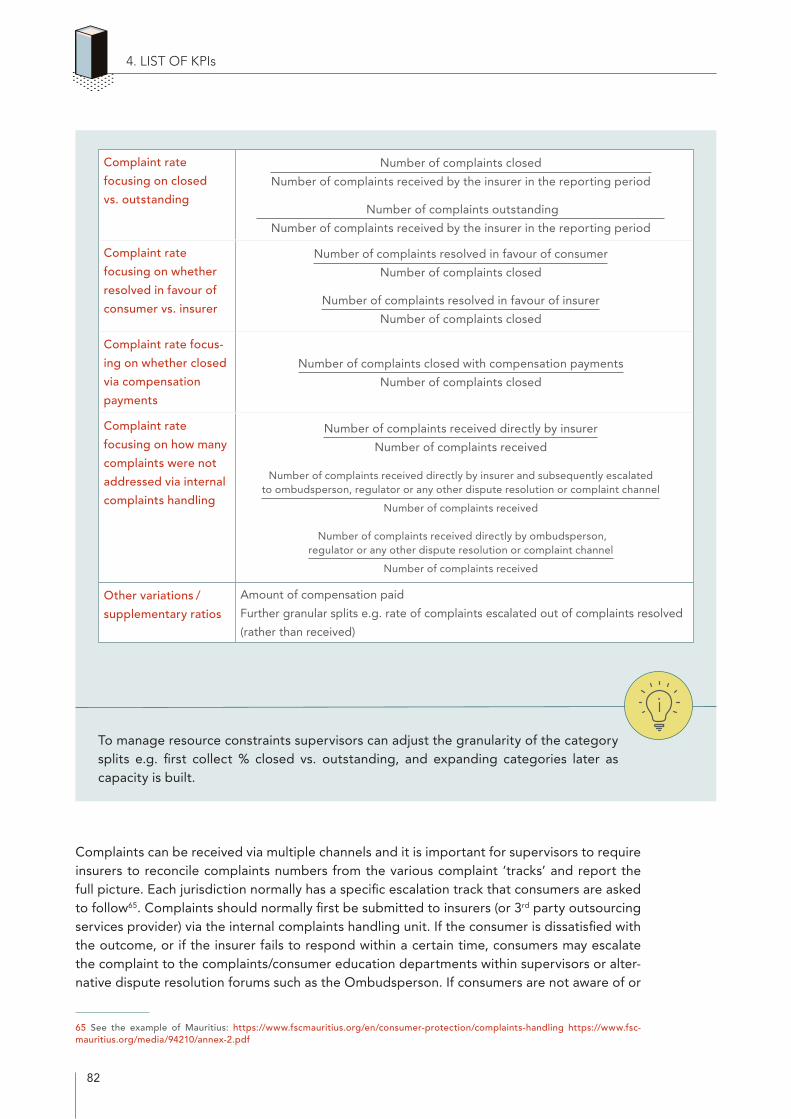
82
To manage resource constraints supervisors can adjust the granularity of the category splits e.g. first collect % closed vs. outstanding, and expanding categories later as capacity is built.
Complaints can be received via multiple channels and it is important for supervisors to require insurers to reconcile complaints numbers from the various complaint ‘tracks’ and report the full picture. Each jurisdiction normally has a specific escalation track that consumers are asked to follow65. Complaints should normally first be submitted to insurers (or 3rd party outsourcing services provider) via the internal complaints handling unit. If the consumer is dissatisfied with the outcome, or if the insurer fails to respond within a certain time, consumers may escalate the complaint to the complaints/consumer education departments within supervisors or alter-native dispute resolution forums such as the Ombudsperson. If consumers are not aware of or
65 See the example of Mauritius: https://www.fscmauritius.org/en/consumer-protection/complaints-handling https://www.fsc-mauritius.org/media/94210/annex-2.pdf
4. LIST OF KPIs
Complaint rate
focusing on closed
vs. outstanding
IIIIIIIIIIIIIIIIIIIIIIIIIIIIIIIIIINumber of complaints closedIIIIIIIIIIIIIIIIIIIIIIIIIIIIIIIIII
Number of complaints received by the insurer in the reporting period
IIIIIIIIIIIIIIIIIIIIIIIIIIIIIIIIIINumber of complaints outstandingIIIIIIIIIIIIIIIIIIIIIIIIIIIIIIIII
Number of complaints received by the insurer in the reporting period
Complaint rate
focusing on whether
resolved in favour of
consumer vs. insurer
Number of complaints resolved in favour of consumer
Number of complaints closed
Number of complaints resolved in favour of insurer
Number of complaints closed
Complaint rate focus-
ing on whether closed
via compensation
payments
Number of complaints closed with compensation payments
Number of complaints closed
Complaint rate
focusing on how many
complaints were not
addressed via internal
complaints handling
Number of complaints received directly by insurer
Number of complaints received
Number of complaints received directly by insurer and subsequently escalated to ombudsperson, regulator or any other dispute resolution or complaint channel
Number of complaints received
█Number of complaints received directly by ombudsperson, regulator or any other dispute resolution or complaint channel
Number of complaints received
Other variations /
supplementary ratios
Amount of compensation paid
Further granular splits e.g. rate of complaints escalated out of complaints resolved
(rather than received)
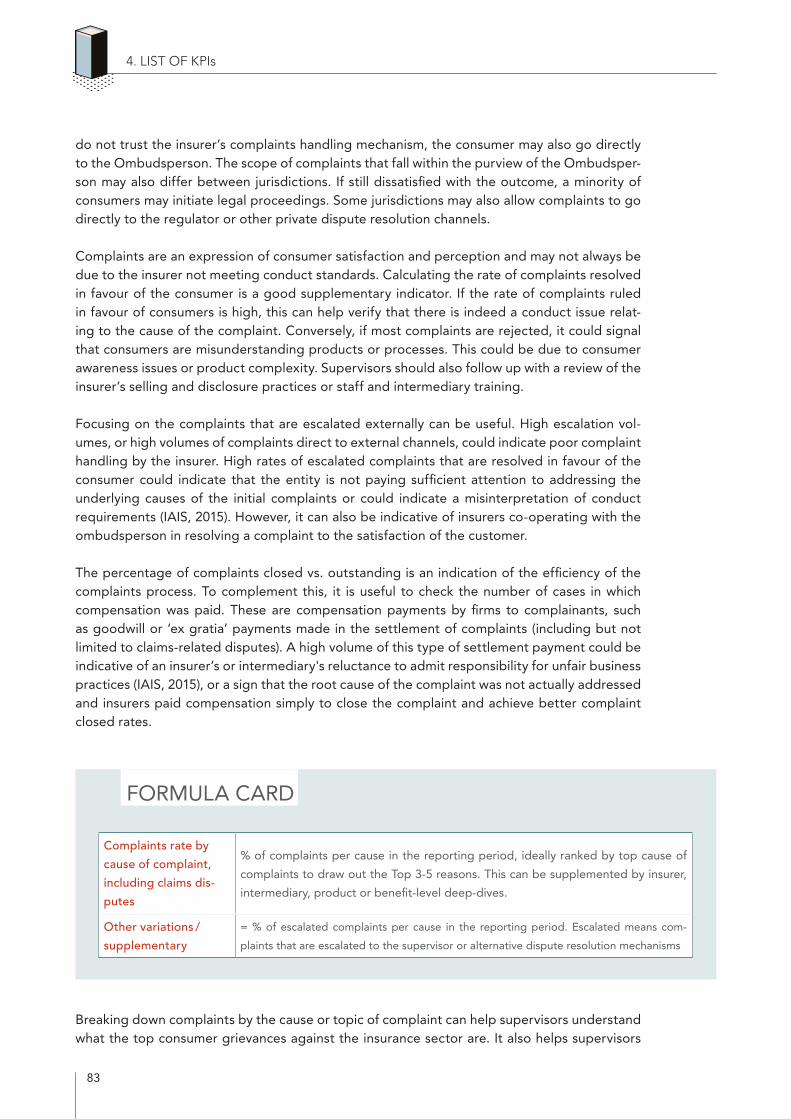
83
do not trust the insurer’s complaints handling mechanism, the consumer may also go directly to the Ombudsperson. The scope of complaints that fall within the purview of the Ombudsper-son may also differ between jurisdictions. If still dissatisfied with the outcome, a minority of consumers may initiate legal proceedings. Some jurisdictions may also allow complaints to go directly to the regulator or other private dispute resolution channels.
Complaints are an expression of consumer satisfaction and perception and may not always be due to the insurer not meeting conduct standards. Calculating the rate of complaints resolved in favour of the consumer is a good supplementary indicator. If the rate of complaints ruled in favour of consumers is high, this can help verify that there is indeed a conduct issue relat-ing to the cause of the complaint. Conversely, if most complaints are rejected, it could signal that consumers are misunderstanding products or processes. This could be due to consumer awareness issues or product complexity. Supervisors should also follow up with a review of the insurer’s selling and disclosure practices or staff and intermediary training.
Focusing on the complaints that are escalated externally can be useful. High escalation vol-umes, or high volumes of complaints direct to external channels, could indicate poor complaint handling by the insurer. High rates of escalated complaints that are resolved in favour of the consumer could indicate that the entity is not paying sufficient attention to addressing the underlying causes of the initial complaints or could indicate a misinterpretation of conduct requirements (IAIS, 2015). However, it can also be indicative of insurers co-operating with the ombudsperson in resolving a complaint to the satisfaction of the customer.
The percentage of complaints closed vs. outstanding is an indication of the efficiency of the complaints process. To complement this, it is useful to check the number of cases in which compensation was paid. These are compensation payments by firms to complainants, such as goodwill or ‘ex gratia’ payments made in the settlement of complaints (including but not limited to claims-related disputes). A high volume of this type of settlement payment could be indicative of an insurer’s or intermediary's reluctance to admit responsibility for unfair business practices (IAIS, 2015), or a sign that the root cause of the complaint was not actually addressed and insurers paid compensation simply to close the complaint and achieve better complaint closed rates.
FORMULA CARD
Breaking down complaints by the cause or topic of complaint can help supervisors understand what the top consumer grievances against the insurance sector are. It also helps supervisors
4. LIST OF KPIs
Complaints rate by
cause of complaint,
including claims dis-
putes
% of complaints per cause in the reporting period, ideally ranked by top cause of
complaints to draw out the Top 3-5 reasons. This can be supplemented by insurer,
intermediary, product or benefit-level deep-dives.
Other variations /
supplementary
= % of escalated complaints per cause in the reporting period. Escalated means com-
plaints that are escalated to the supervisor or alternative dispute resolution mechanisms
84
design more targeted interventions. Key complaint causes should be categorised according to what is most useful for the supervisor. This could include organising according to the ICP 19 standards, customer outcomes, or areas of the insurance value chain or customer journey66.
• Product features and premiums – policy features, amount of premium, bundled, 'add-on' or loyalty benefits, fees and charges, commissions
• Advertising and marketing – material and practices
• Sales quality – advice quality, selling tactics, intermediary competence
• Pre-contractual information and disclosure – misleading or out-of-date information, policy terms and conditions, consumer rights and obligations, documentation e.g pol-icy documents, service letters
• Policy changes and servicing – policy modifications, cancellations and replacements, ongoing information on policy performance
• Overall customer service quality – ease of getting hold of the insurer, responsiveness and communication, ease of processes, delays
• Claims – including disputes, the ease of process, delays and fraud investigations. High volumes of claims related complaints could indicate issues with the claims assessment and settlement itself, or could indicate poor communication regarding claims decisions and poor services at the claim stage.
• Complaints handling and disputes – complaints on the complaint handling itself e.g. ease of process, delays, service and response quality
• Data privacy – if not under the purview of the conduct supervisor, complaints data on data privacy issues is useful information to share with the responsible data protection agency
• Outsourced functions – complaints relating to the conduct of, or that can be traced to outsourced parties e.g. claims administrators, technical service providers, online plat-forms, cloud providers
• Fraud – on actual incidences of fraud or relating to the fraud investigation experience
Identifying the proportion of escalated complaints by cause can inform supervisors on which issues insurers are capable of resolving internally, which is an indicator of the quality of their complaints handling mechanism67. It can also give supervisors a clearer assessment of the impact on consumer detriment, which is an important justification for supervisors to be able to intervene.
66 See example of FSCA’s CBR returns: https://www.fsca.co.za/Regulated%20Entities/Pages/UI-Insurer-Micro-Insurer-Resources-Documents.aspx
67 AFCA notes its view is that “complaints relating to delays or service quality should be able to be resolved by financial firms internally and should not be one of the top issues in complaints we receive. General insurers need to make sure their teams are adequately resourced and have the right skill sets to deal with these sorts of complaints at the internal dispute resolution stage.” See AFCA’s six-month report here: https://www.afca.org.au/news/statistics/six-month-report#_idTextAnchor007
4. LIST OF KPIs
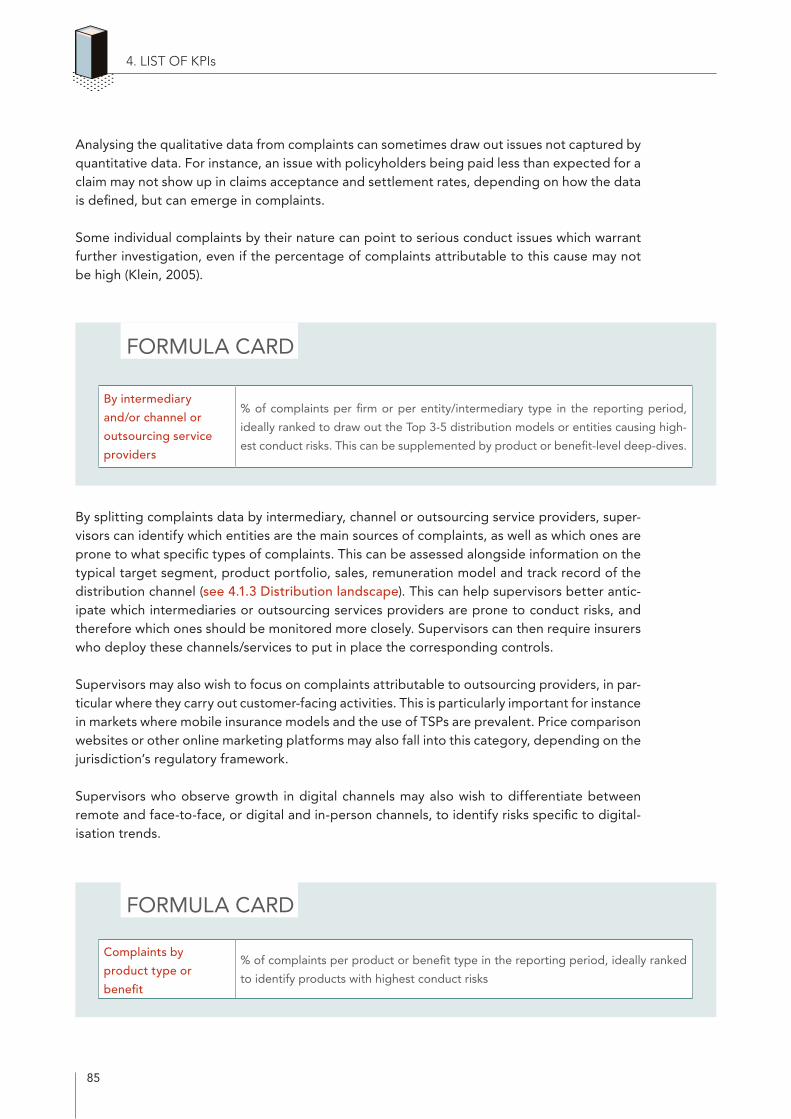
85
Analysing the qualitative data from complaints can sometimes draw out issues not captured by quantitative data. For instance, an issue with policyholders being paid less than expected for a claim may not show up in claims acceptance and settlement rates, depending on how the data is defined, but can emerge in complaints.
Some individual complaints by their nature can point to serious conduct issues which warrant further investigation, even if the percentage of complaints attributable to this cause may not be high (Klein, 2005).
FORMULA CARD
By splitting complaints data by intermediary, channel or outsourcing service providers, super-visors can identify which entities are the main sources of complaints, as well as which ones are prone to what specific types of complaints. This can be assessed alongside information on the typical target segment, product portfolio, sales, remuneration model and track record of the distribution channel (see 4.1.3 Distribution landscape). This can help supervisors better antic-ipate which intermediaries or outsourcing services providers are prone to conduct risks, and therefore which ones should be monitored more closely. Supervisors can then require insurers who deploy these channels/services to put in place the corresponding controls.
Supervisors may also wish to focus on complaints attributable to outsourcing providers, in par-ticular where they carry out customer-facing activities. This is particularly important for instance in markets where mobile insurance models and the use of TSPs are prevalent. Price comparison websites or other online marketing platforms may also fall into this category, depending on the jurisdiction’s regulatory framework.
Supervisors who observe growth in digital channels may also wish to differentiate between remote and face-to-face, or digital and in-person channels, to identify risks specific to digital-isation trends.
FORMULA CARD
4. LIST OF KPIs
By intermediary
and/or channel or
outsourcing service
providers
% of complaints per firm or per entity/intermediary type in the reporting period,
ideally ranked to draw out the Top 3-5 distribution models or entities causing high-
est conduct risks. This can be supplemented by product or benefit-level deep-dives.
Complaints by
product type or
benefit
% of complaints per product or benefit type in the reporting period, ideally ranked
to identify products with highest conduct risks

86
4. LIST OF KPIs
Claims dispute rates No. of claims disputed
No. of claims finalised
or
No. of complaints relating to claims disputes
No. of complaints received
Other variations /
supplementary ratios• Disputes per 100,000 lives insured68
• Internal vs. external dispute rates
• Disputes resolved in favour of the consumer vs. the insurer
• Reasons for disputes
• Product lines or insurers with highest dispute rates69
By monitoring complaints data at the product line or sub-product benefit level, supervisors can identify which product lines are the main sources of complaints, as well as which products are prone to what specific types of complaints. If it emerges that the complaints are due to specific benefits, add-ons or riders within the products, supervisors can also monitor complaints by specific benefit types. This can be assessed alongside information on the product client seg-ment (see 4.1.2 Product landscape) to check if there are product suitability issues. Supervisors can then further engage with insurers and, depending on the root cause, consider requiring insurers to adjust their product development approach, modify products or selling and servic-ing practices accordingly.
Supervisors could also focus on certain high-risk products. These could be new products, com-plex products relative to the market capability, products with observed low claims ratios and incidences or high commission rates or products with bundled / add-on benefits. Complaints can also be more likely in certain lines of business such as health or auto/motor, irrespective of the underlying conduct issue (Klein, 2005). During the pandemic, many jurisdictions observed rising complaints regarding business interruption and other Covid-19 related policies.
4.6.3. Claims dispute rates
FORMULA CARD
68 APRA uses per 100,000 lives insured, noting: ‘The dispute rate per finalised claim could be considered a more appropriate measure of the probability of a claims-related dispute. However, because both the numerator and denominator are very small, the resulting ratio would be very volatile, particularly at the entity level. Assuming that for a fixed number of lives insured the likelihood of a claim is broadly constant over time, using lives insured as the denominator creates a more stable ratio.’ See APRA’s Life Insurance Claims and Disputes Statistics (2020) available here: https://www.apra.gov.au/sites/default/files/2021-04/Life%20Insurance%20Claims%20and%20Disputes%20Statistics%20December%202020.pdf
69 See ASIC’s report on Life insurance claims: An industry review (2016): https://download.asic.gov.au/media/4042220/rep498-published-12-october-2016a.pdf
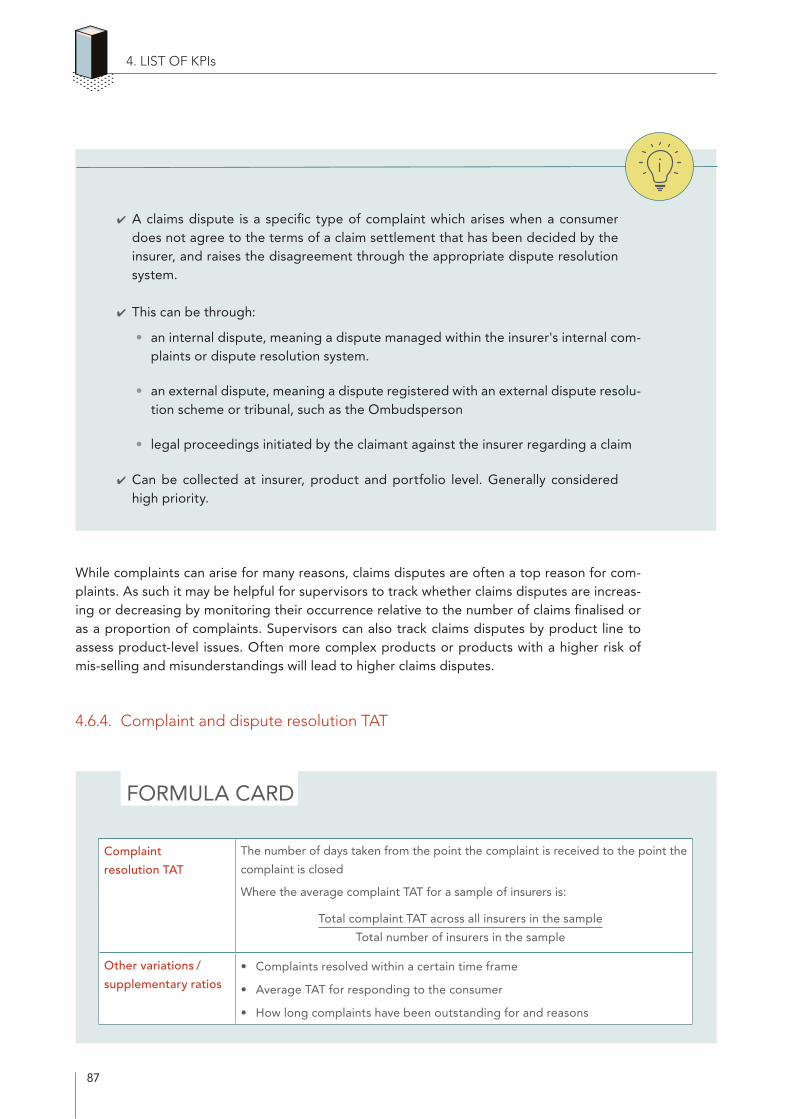
87
✔ A claims dispute is a specific type of complaint which arises when a consumer does not agree to the terms of a claim settlement that has been decided by the insurer, and raises the disagreement through the appropriate dispute resolution system.
✔ This can be through:
• an internal dispute, meaning a dispute managed within the insurer's internal com-plaints or dispute resolution system.
• an external dispute, meaning a dispute registered with an external dispute resolu-tion scheme or tribunal, such as the Ombudsperson
• legal proceedings initiated by the claimant against the insurer regarding a claim
✔ Can be collected at insurer, product and portfolio level. Generally considered high priority.
While complaints can arise for many reasons, claims disputes are often a top reason for com-plaints. As such it may be helpful for supervisors to track whether claims disputes are increas-ing or decreasing by monitoring their occurrence relative to the number of claims finalised or as a proportion of complaints. Supervisors can also track claims disputes by product line to assess product-level issues. Often more complex products or products with a higher risk of mis-selling and misunderstandings will lead to higher claims disputes.
4.6.4. Complaint and dispute resolution TAT
FORMULA CARD
4. LIST OF KPIs
Complaint
resolution TAT
The number of days taken from the point the complaint is received to the point the
complaint is closed
Where the average complaint TAT for a sample of insurers is:
Total complaint TAT across all insurers in the sample
Total number of insurers in the sample
Other variations /
supplementary ratios• Complaints resolved within a certain time frame
• Average TAT for responding to the consumer
• How long complaints have been outstanding for and reasons
88
This can be averaged for the industry as a general measure or calculated for certain firms or product lines, especially where there are known conduct issues.
This information provides insight into customer experience with the complaints handling pro-cess. Customer complaints and disputes can be time-consuming and costly, and often a neg-ative experience for the consumer. Consumers’ loss of confidence may damage an individual insurer or intermediary or ultimately part or the whole of the insurance sector (IAIS, 2015).
4.7. Other qualitative information
Qualitative information is helpful in two ways (IAIS, 2014):
• Governance monitoring: The governance processes within insurers that supervisors may monitor to determine whether their supervisory requirements are being met;
• Activity monitoring: Supplement quantitative KPIs in monitoring specific insurer activ-ities that supervisors may monitor in determining whether their supervisory require-ments are being met. TCF principles and customer outcomes – such as high quality of service and advice, no conflict of interest, appropriateness of products – often require observation and judgement, which are not well captured in a number.
Qualitative information can be collected via regulatory returns or ad-hoc data requests. However, reporting returns will likely be able to accommodate mainly simple qualitative statements. Supervisors need to leverage engagements with the insurer and on-site reviews and observa-tions.
4.7.1. Governance monitoring
This captures whether COB policies and processes are in place and compliant with require-ments or aligned with expected standards. Similar to prudential, this could be in the form of checklists of good business practice that is populated at every supervisory cycle or thematic review. The information can be aggregated sector-wide so that supervisors can identify the insurance industry’s key strengths and weaknesses in conduct risk mitigation. To assess policies and procedures, supervisors will need to review insurers’ document policies, such as internal policies and service level agreements.
Supervisors can use this KPI to inform preventive supervision. In many cases, inadequate pol-icies and processes are a root cause for customer outcomes not being met, which are then reflected in quantitative KPIs. As such, governance processes should be regularly monitored and actively inform the risk rating of the firm. Supervisors can also use this in reactive supervi-sion as a supplementary KPI when investigating quantitative KPIs. For instance, if complaints rates are rising regarding claims for a certain product, supervisors could conduct a thematic review on claims handling policies.
The key aspects of governance monitoring is summarised below, largely drawn from the IAIS Application Paper on Approaches to Conduct of Business Supervision (2014).
4. LIST OF KPIs
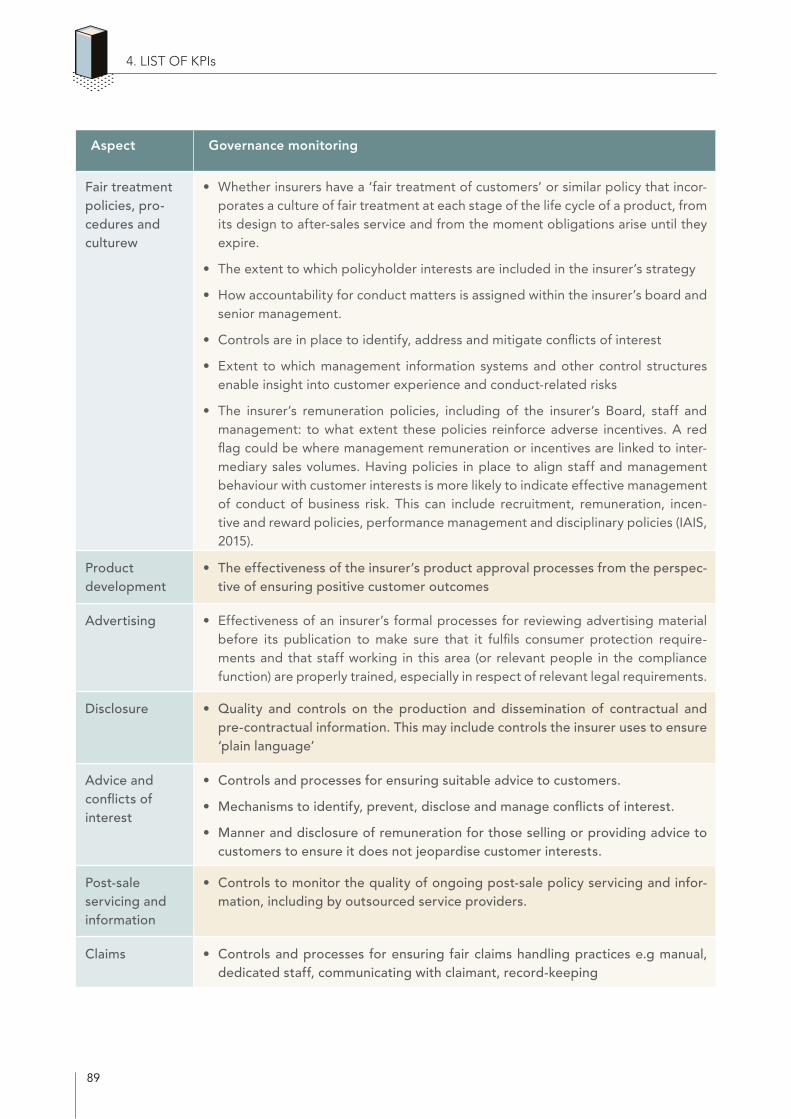
89
4. LIST OF KPIs
Aspect Governance monitoring
Fair treatment policies, pro-cedures and culturew
• Whether insurers have a ‘fair treatment of customers’ or similar policy that incor-porates a culture of fair treatment at each stage of the life cycle of a product, from its design to after-sales service and from the moment obligations arise until they expire.
• The extent to which policyholder interests are included in the insurer’s strategy
• How accountability for conduct matters is assigned within the insurer’s board and senior management.
• Controls are in place to identify, address and mitigate conflicts of interest
• Extent to which management information systems and other control structures enable insight into customer experience and conduct-related risks
• The insurer’s remuneration policies, including of the insurer’s Board, staff and management: to what extent these policies reinforce adverse incentives. A red flag could be where management remuneration or incentives are linked to inter-mediary sales volumes. Having policies in place to align staff and management behaviour with customer interests is more likely to indicate effective management of conduct of business risk. This can include recruitment, remuneration, incen-tive and reward policies, performance management and disciplinary policies (IAIS, 2015).
Product development
• The effectiveness of the insurer’s product approval processes from the perspec-tive of ensuring positive customer outcomes
Advertising • Effectiveness of an insurer’s formal processes for reviewing advertising material before its publication to make sure that it fulfils consumer protection require-ments and that staff working in this area (or relevant people in the compliance function) are properly trained, especially in respect of relevant legal requirements.
Disclosure • Quality and controls on the production and dissemination of contractual and pre-contractual information. This may include controls the insurer uses to ensure ‘plain language’
Advice and conflicts of interest
• Controls and processes for ensuring suitable advice to customers.
• Mechanisms to identify, prevent, disclose and manage conflicts of interest.
• Manner and disclosure of remuneration for those selling or providing advice to customers to ensure it does not jeopardise customer interests.
Post-sale servicing and information
• Controls to monitor the quality of ongoing post-sale policy servicing and infor-mation, including by outsourced service providers.
Claims • Controls and processes for ensuring fair claims handling practices e.g manual, dedicated staff, communicating with claimant, record-keeping
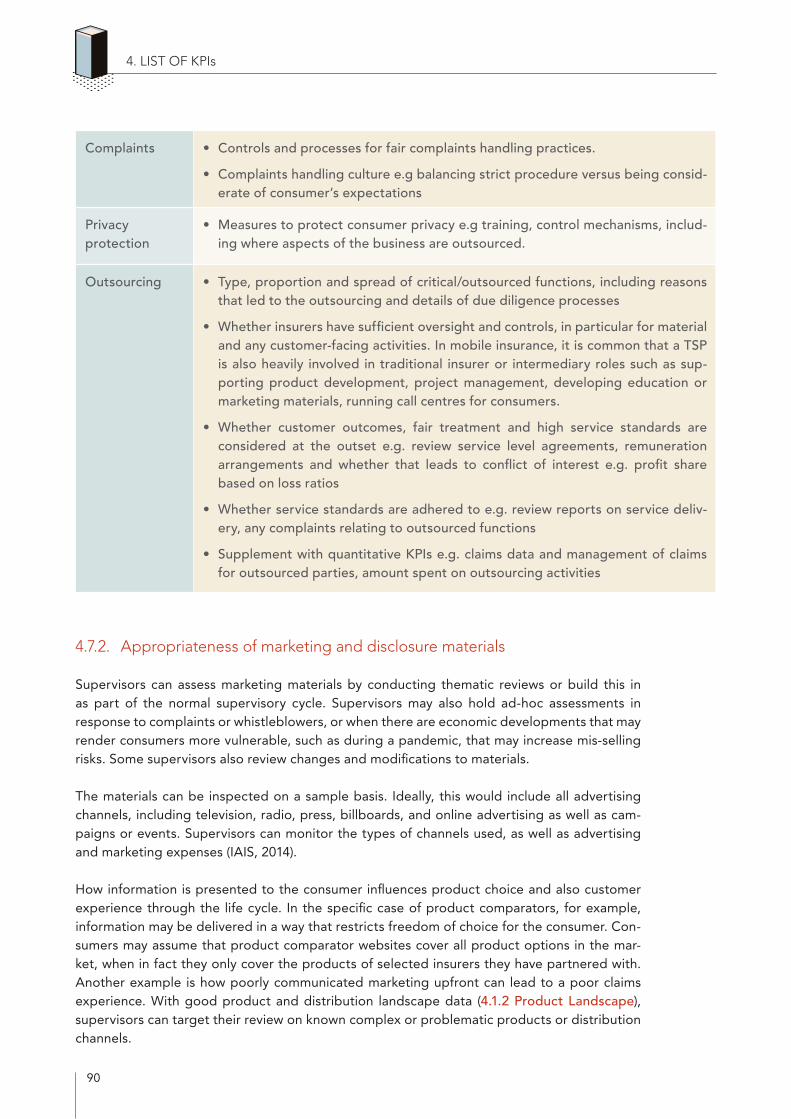
90
4.7.2. Appropriateness of marketing and disclosure materials
Supervisors can assess marketing materials by conducting thematic reviews or build this in as part of the normal supervisory cycle. Supervisors may also hold ad-hoc assessments in response to complaints or whistleblowers, or when there are economic developments that may render consumers more vulnerable, such as during a pandemic, that may increase mis-selling risks. Some supervisors also review changes and modifications to materials.
The materials can be inspected on a sample basis. Ideally, this would include all advertising channels, including television, radio, press, billboards, and online advertising as well as cam-paigns or events. Supervisors can monitor the types of channels used, as well as advertising and marketing expenses (IAIS, 2014).
How information is presented to the consumer influences product choice and also customer experience through the life cycle. In the specific case of product comparators, for example, information may be delivered in a way that restricts freedom of choice for the consumer. Con-sumers may assume that product comparator websites cover all product options in the mar-ket, when in fact they only cover the products of selected insurers they have partnered with. Another example is how poorly communicated marketing upfront can lead to a poor claims experience. With good product and distribution landscape data (4.1.2 Product Landscape), supervisors can target their review on known complex or problematic products or distribution channels.
4. LIST OF KPIs
Complaints • Controls and processes for fair complaints handling practices.
• Complaints handling culture e.g balancing strict procedure versus being consid-erate of consumer’s expectations
Privacy protection
• Measures to protect consumer privacy e.g training, control mechanisms, includ-ing where aspects of the business are outsourced.
Outsourcing • Type, proportion and spread of critical/outsourced functions, including reasons that led to the outsourcing and details of due diligence processes
• Whether insurers have sufficient oversight and controls, in particular for material and any customer-facing activities. In mobile insurance, it is common that a TSP is also heavily involved in traditional insurer or intermediary roles such as sup-porting product development, project management, developing education or marketing materials, running call centres for consumers.
• Whether customer outcomes, fair treatment and high service standards are considered at the outset e.g. review service level agreements, remuneration arrangements and whether that leads to conflict of interest e.g. profit share based on loss ratios
• Whether service standards are adhered to e.g. review reports on service deliv-ery, any complaints relating to outsourced functions
• Supplement with quantitative KPIs e.g. claims data and management of claims for outsourced parties, amount spent on outsourcing activities

91
Supervisors can quantify this by tracking the number of instances where promotional or mar-keting materials were required to be amended, which can then be used to inform the risk rating of firms, business models or product lines.
In jurisdictions where disclosure requirements are not yet well-established and standardised, supervisors may also wish to review disclosure material to ensure they are overall fair, clear, and not misleading, and provide key, understandable information needed for consumers to make informed decisions. Disclosure materials for inclusive insurance customers may need to be particularly simple and understandable compared to traditional products aimed at more sophisticated customers.
4.7.3. Customer satisfaction and experience
This includes indicators that inform supervisors on the quality of service and customer experi-ence. Supervisors can focus on key concrete yes/no indicators supported by descriptions, such as
• whether the policyholders struggle to get hold of the Insurer
• whether the information provided to consumers is easy to understand (notwithstanding compliance)
• whether there are significant complaints from consumers regarding service quality and insurer responsiveness (see 4.6.2 Complaints by Categories)
This can be supplemented by quantitative KPIs such as:
• TATs on complaints, claims, dispute resolution or other communications and whether TATs meet internal targets, regulatory requirements (if any) and expectations
• Renewal ratios. Some supervisors use the renewal ratio as an indicator of customer satisfaction in microinsurance. However, this should be used with caution (see 4.3.4 Renewal ratio).
4.7.4. Incidences of misconduct and non-compliance
It is useful to generally keep track of misconduct incidences and the nature of these incidences, to monitor overall conduct risk in the sector – what top issues and risk areas are and whether new ones are emerging. This helps supervisors understand the key conduct strengths and weaknesses of the sector. Another advantage is that it can capture incidences that fall outside more structured or granular data reporting. This includes KPIs such as data breach incidents, which in many emerging jurisdictions are a relatively new topic and may not be actively mon-itored by any authority. Misconduct incidences can be partly quantitative, i.e. the number of misconduct incidences by firm, or relating to particular product lines, and then aggregated for the sector. Supervisors can track this on a year to year basis and monitor whether misconduct incidents are overall increasing or decreasing. A firm’s misconduct track record should feed into its risk rating.
4. LIST OF KPIs
92
5. COMPILATION OF FINDINGS AND INTERVENTION70
5.1. Compilation of findings
The assessment of the conduct performance and risk of the insurer should be compiled in a report for the insurer and the senior staff of the supervisor. This report should cover risks and weaknesses of the insurer, based on the risk rating and using the KPIs in this guide. Areas of misconduct and the impact on consumers within the regulatory framework should also be highlighted. Ratings should be well-justified and the report should give reasons for the rating allocated to the various risk areas.
The report should also cover recommendations and required remedial actions to address areas of weakness, as well as areas of emerging risk that are not serious yet but may deteriorate, under areas for continued monitoring by the supervisor.
Where the supervisor is combined in a single entity with the prudential supervisor, ideally con-duct reporting should be streamlined with internal reporting on prudential such that the risks are assessed in an integrated manner. If supervisors are gradually building up capacity and supervisory teams, a first step can be to integrate key conduct KPIs into the overall risk profile report of the insurer.
5.2. Interventions
Principles and processes
Interventions by the supervisor should be appropriate, objective, consistent across insurers, proportionate and timely. The required corrective measures should address the areas of con-cern and the intervention’s severity should be appropriate relative to the consumer harm. Timeframes for corrective action should give the insurer sufficient time to address the weak-nesses. It is important for the supervisor to follow up and monitor the insurer’s progress with corrective action, highlight any improvements or deterioration and assess the effectiveness of the interventions.
Levels and types of intervention
The supervisor should use a tiered approach to the level and severity of remedial action: the higher the conduct risk posed and the more severe the harm on consumers as a result of a breach, the more punitive the supervisory enforcements and sanctions. If the entity fails to address issues, the supervisor may increase the risk rating of the insurer and impose more stringent measures.
70 Based on IAIS Core Curriculum (2018) and IAIS Insurance Core Principles (2019)
5. COMPILATION OF FINDINGS AND INTERVENTION
93
Administrative or procedural oversights will generally attract less severe interventions than deliberate fraud, miscommunication of information to the supervisor and intentional disre-gard of the regulatory requirements. Examples of intentional deception include: an insurer knowingly cooperating with unlicensed intermediaries, intermediaries in breach of regulatory requirements, fraud, accepting bribes.
There is a range of interventions available to supervisors. When deciding on the appropriate intervention for risks and weaknesses identified, it is important to ensure that the remedial action addresses the risk. Interventions could include:
• Require the entity to remedy the breach e.g improve policies, processes and practices, amend product or product materials
• Prohibiting or suspending the sale of a product
• In jurisdictions / for product lines where product approval is required e.g inclusive insurance or compulsory insurance, refusing to approve a product
• Issuing penalty or fine on insurers or intermediaries
• Banning entities or individuals from providing financial services
For real-life examples of misconduct cases and actions taken by insurance supervisors concern-ing specific ICPs, supervisors are strongly encouraged to refer to the IAIS report on the ‘Peer Review of Conduct of Business Supervision relative to the standards set out in Insurance Core Principle 19’ (IAIS, 2021).
SPECIAL CONSIDERATIONS FOR MICROINSURANCE BUSINESS
For products that have implications on access to insurance e.g. inclusive insurance, compulsory insurance, essential products that are in short supply, supervisors may have to balance the need and severity of the intervention against the impact on access to the insurance. For instance, in one SSA country, banning the use of direct debits in a specific mobile insurance model caused significant profitability constraints. Such situa-tions could lead the insurer to withdraw a product, with the unintended consequence of consumers no longer being able to access the product. In such cases, supervisors may want to engage the insurer to find alternative solutions e.g. improving disclosure or making ‘check-in’ calls, or allow for transition periods to comply, for instance.
5. COMPILATION OF FINDINGS AND INTERVENTION

94
6. IMPLEMENTATION CONSIDERATIONS FOR SSA
Conduct supervision is still an evolving field and supervisors across the globe currently have diverse approaches and are at varying stages of implementation. SSA supervisors will to a large extent have to ‘find their own way’ in tailoring a conduct indicator framework for their jurisdiction, referencing regional and global peer practices as a guide. Key challenges faced by supervisors globally, including in SSA, are poor data quality, lack of resources and infrastruc-ture costs. Industry implementation is also a challenge as supervisors note poor prioritisation of conduct related issues by insurers as well as poor, or at least a non-harmonised, understand-ing of conduct by insurers.
Supervisors need to establish the following to ensure that they gather the necessary informa-tion for assessing conduct outcomes and risks:
• The extent of the statutory powers of the supervisor to obtain information from the insurer relevant to assessing conduct risk and outcomes It is also important for the supervisor to have the power to impose sanctions if insurers fail to submit information or submit inaccurate or incomplete information.
• Additional powers or necessary information exchange agreements to collect informa-tion from other relevant sources e.g intermediaries, outsourcing providers, third party administrators, ombudsperson or other dispute resolution authority, data protection agency.
• Ease of changing the current reporting template. For example, if reporting templates are defined in the regulations, changes to these regulations may be required to collect additional information. Conduct data reporting templates, especially in the early stages of implementation, should be seen as a ‘living document’ – ideally, legislation allows for updates when new trends emerge e.g. new distribution channels or new product categories. Ad-hoc surveys are a stop-gap measure but not a long-term solution, as multiple ad-hoc surveys are resource-intensive while running the risk of inconsistency.
• Collect data that insurers across the market use for internal monitoring and work with insurers to set up processes to gather additional information. Reporting templates can initially be completed by insurers on a best-effort basis using readily available informa-tion. Insurers can then provide additional information over time. This approach allows the supervisor to get a view of the landscape of data that is currently available and used by insurers. This also helps to identify the gaps and impediments in the availability of data.
• Establish a working group with the industry to evaluate the importance and usefulness of the KPIs, draft the reporting templates and set up the transitional arrangements for submission of data. Consultation with insurers on major changes in reporting require-ments is also important to ensure buy-in and a better understanding of the required data. Collaboration with the industry can be enhanced through regular communication with the industry association as is the case in Mauritius.
6. IMPLEMENTATION CONSIDERATIONS FOR SSA
95
• A clear implementation plan on the data that is required to be provided for each year of the transitional period. Supervisors can start small by piloting and field-testing with basic excel templates before integrating into data collection systems. Insurers should be required to provide full information after the transitional period so that consistent and reliable data is received from insurers in the market.
• Supervisors need to protect the confidentiality of commercially sensitive information to overcome the reluctance of insurers in providing this information.
Standardised templates and automation of processes create efficiency in data collection and analysis:
• Introduce standardised templates for quarterly and annual reporting. Qualitative ques-tions can also be included in these templates.
• Introduce electronic submission of reporting templates from insurers.
• Develop automatic checks on the accuracy of the data and for the calculation of the ratios for the KPIs and trends over time.
Both the supervisor and the industry need to develop additional capacity in the preparation and analysis of additional data:
• Make use of the recommended reading in this guide and stay up-to-date on IAIS guid-ance and global supervisory initiatives. Many individual supervisors publish and com-municate their approaches, indicators and thematic deep-dives on market conduct online.
• Conduct training workshops for supervisory staff on the analysis of the KPIs, rating of the risk of the insurer and implementing of corrective measures. Refine supervisory judgement and internal stance as experience is accumulated within their organisations.
• Conduct training and consultative workshops with the industry on the use of the reporting templates, the analysis process and supervisor expectations from insurers regarding reporting. Malawi notes that many insurers do not make a practice of using data in decision-making: several insurers collect customer data in hard-copy forms, but do not capture it in management information systems and do not apply it in their busi-nesses. Furthermore, consensus on conduct principles and outcomes, as well as data definitions, need to be built with the industry.
Making effective use of the information gathered and insights on the performance and risks of insurers is an essential part of the effective implementation of the KPI framework.
• Summarised data and insights gained about the industry should be shared with insur-ers and the wider public, together with the supervisory position on conduct issues. Supervisory positions can help build consumer trust in insurance.
• Develop benchmarks that are relevant to local conditions as more data from the indus-try becomes available over time.
• Develop guidelines on best practices in certain areas to steer the development (e.g. best-in-class complaints or claims handling) of the market.
6. IMPLEMENTATION CONSIDERATIONS FOR SSA
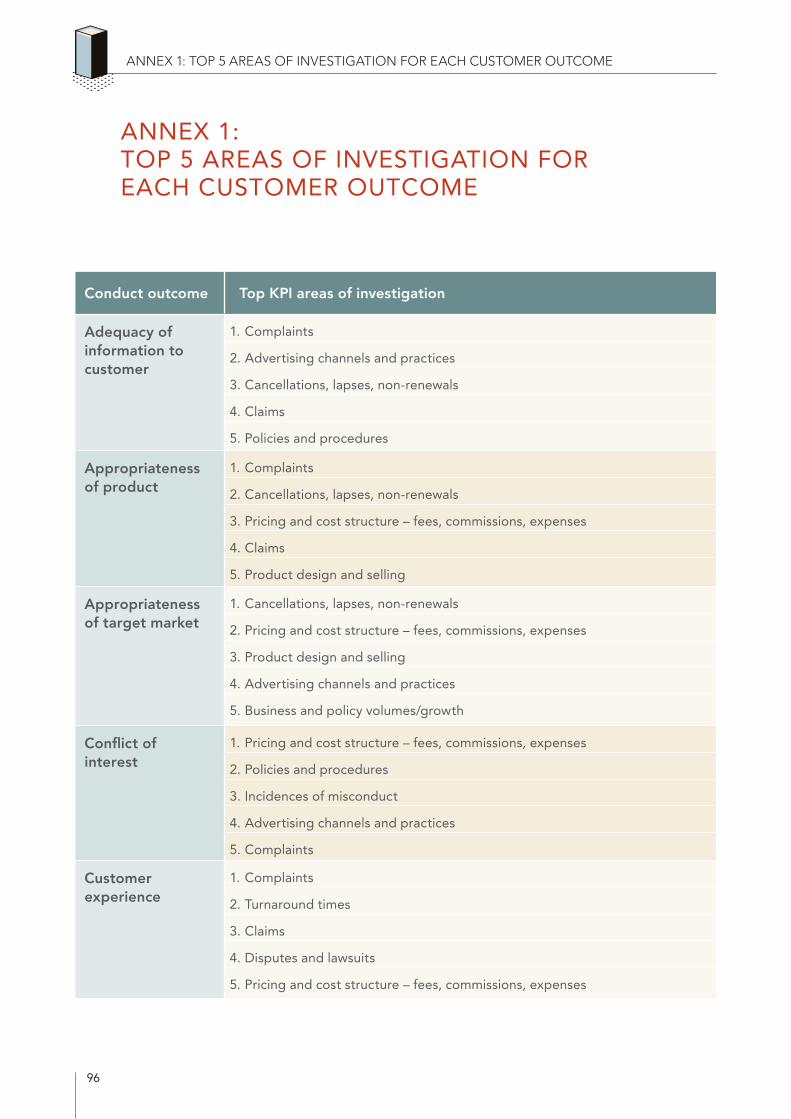
96
ANNEX 1: TOP 5 AREAS OF INVESTIGATION FOR EACH CUSTOMER OUTCOME
ANNEX 1: TOP 5 AREAS OF INVESTIGATION FOR EACH CUSTOMER OUTCOME
Conduct outcome Top KPI areas of investigation
Adequacy of information to customer
1. Complaints
2. Advertising channels and practices
3. Cancellations, lapses, non-renewals
4. Claims
5. Policies and procedures
Appropriateness of product
1. Complaints
2. Cancellations, lapses, non-renewals
3. Pricing and cost structure – fees, commissions, expenses
4. Claims
5. Product design and selling
Appropriateness of target market
1. Cancellations, lapses, non-renewals
2. Pricing and cost structure – fees, commissions, expenses
3. Product design and selling
4. Advertising channels and practices
5. Business and policy volumes/growth
Conflict of interest
1. Pricing and cost structure – fees, commissions, expenses
2. Policies and procedures
3. Incidences of misconduct
4. Advertising channels and practices
5. Complaints
Customer experience
1. Complaints
2. Turnaround times
3. Claims
4. Disputes and lawsuits
5. Pricing and cost structure – fees, commissions, expenses
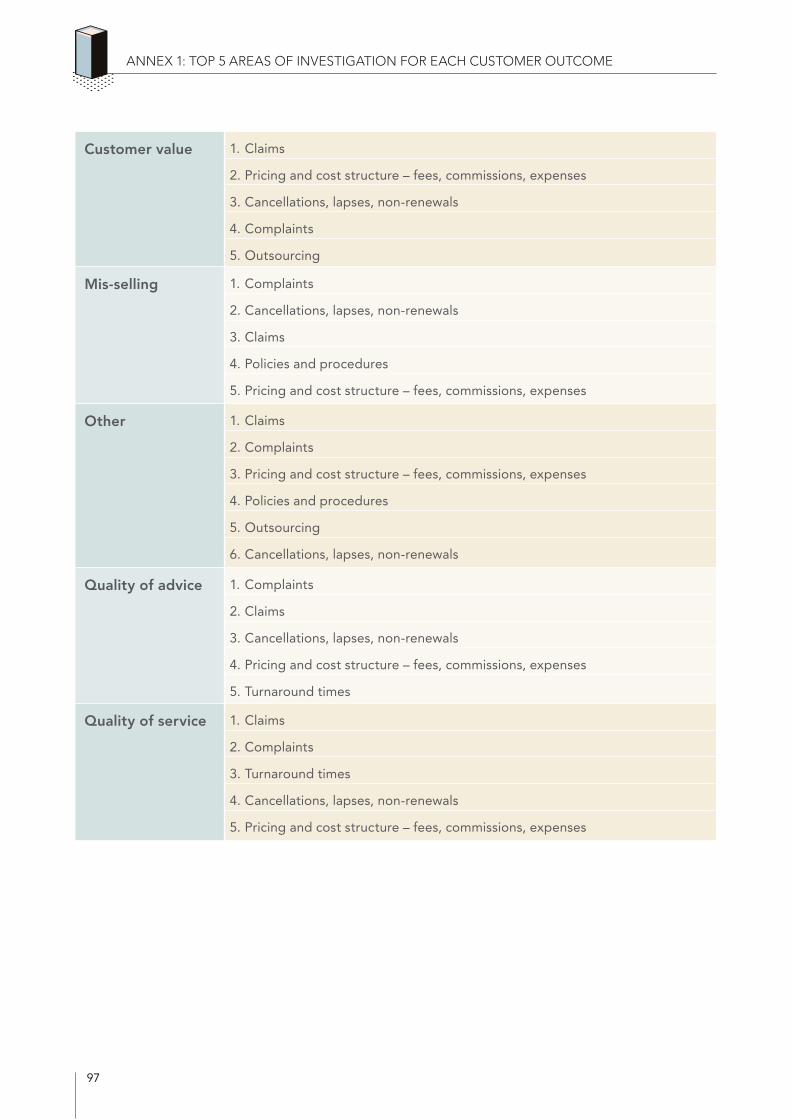
97
ANNEX 1: TOP 5 AREAS OF INVESTIGATION FOR EACH CUSTOMER OUTCOME
Customer value 1. Claims
2. Pricing and cost structure – fees, commissions, expenses
3. Cancellations, lapses, non-renewals
4. Complaints
5. Outsourcing
Mis-selling 1. Complaints
2. Cancellations, lapses, non-renewals
3. Claims
4. Policies and procedures
5. Pricing and cost structure – fees, commissions, expenses
Other 1. Claims
2. Complaints
3. Pricing and cost structure – fees, commissions, expenses
4. Policies and procedures
5. Outsourcing
6. Cancellations, lapses, non-renewals
Quality of advice 1. Complaints
2. Claims
3. Cancellations, lapses, non-renewals
4. Pricing and cost structure – fees, commissions, expenses
5. Turnaround times
Quality of service 1. Claims
2. Complaints
3. Turnaround times
4. Cancellations, lapses, non-renewals
5. Pricing and cost structure – fees, commissions, expenses

98
BIBLIOGRAPHY
BIBLIOGRAPHY
ICP 19 Conduct of Business https://www.iaisweb.org/index.cfm?event=icp:getICPList&nodeId=25227&icpAction=listIcps&icp_id=20
A2ii. Using Key Performance Indicators (KPIs) in Inclusive Insurance Supervision. A2ii, 2019. https://a2ii.org/en/media/734/download
Hafeman, MJ. Developing Insurance Markets: Use of Financial Health and Stability Indicators in Insurance Supervision (English). World Bank Group, 2020. http://documents.worldbank.org/curated/en/298031600662222680/Developing-Insurance-Markets-Use-of-Finan-cial-Health-and-Stability-Indicators-in-Insurance-Supervision
IAIS. Application Paper on Approaches to Conduct of Business Supervision. IAIS, 2014. https://www.iaisweb.org/file/34552/application-paper-on-approaches-to-conduct-of-business-supervision
IAIS. Application Paper on Product Oversight in Inclusive Insurance. IAIS, 2017 https://www.iaisweb.org/file/70163/application-paper-on-product-oversight-in-inclusive-insurance
IAIS. Core Curriculum Modules 6.1.1 Consumer Protection and 6.2.1 Intermediaries. IAIS, 2018. https://www.iaisweb.org/page/supervisory-material/implementation-and-capacity-building/core-curriculum/ insurer-market-conduct/file/75833/611-consumer-protection
IAIS. Issues Paper on Conduct of Business in Inclusive Insurance. IAIS, 2015. https://www.iaisweb.org/page/supervisory-material/issues-papers/file/57850/issues-paper-on-conduct-of- business-in-inclusive-insurance
IAIS. Peer Review of Conduct of Business Supervision relative to the standards set out in Insurance Core Princi-ple 19. IAIS, 2021. https://iaisweb.org/page/supervisory-material/implementation-and-capacity-building/assessments/file/97846/aggregate-report-of-prp-on-icp-19
Klein, R. A regulator's introduction to the insurance industry. 2nd ed. NAIC, 2005. https://www.naic.org/documents/prod_serv_marketreg_rii_zb.pdf
OECD. Measuring consumer detriment and the impact of consumer policy: Feasibility study. OECD Digital Econ-omy Papers, No. 293. OECD 2020. https://doi.org/10.1787/0c2e643b-en
Reifner, U., Neuberger, D., Rissi, R., Riefa, C., Knobloch, M., Clerc-Renaud, S. and Finger, C. Study on remuner-ation structures of financial services intermediaries and conflicts of interest. Institut für Finanzdienstleistungen e.V. (IFF)., 2013. https://ec.europa.eu/info/sites/default/files/file_import/1311-remuneration-structures-study_en_0.pdf
Wipf , J., and Garand D. Performance Indicators for Microinsurance: A Handbook for Microinsurance Practi-tioners. 2nd Edition. ADA absl, 2010. http://www.microinsurancecentre.org/resources/documents/operations/performance-indicators-for- microinsurance-a-handbook-for-microinsurance-practitioners-2nd-edition.html OECD, 2010
Publicly available sources of templates and formulae:
A2ii. Supervisory KPIs Lexicon. https://a2ii.org/en/supervisory-kpis-lexicon
APRA. Life Insurance Claims and Disputes Statistics. APRA, 2018. https://www.apra.gov.au/sites/default/files/life_insurance_claims_and_disputes_statistics_june_2018.pdf
APRA. Life Insurance Claims and Disputes Statistics. APRA, 2020. https://www.apra.gov.au/sites/default/files/202010/Life%20Insurance%20Claims%20and%20Disputes%20Statistics%20-%20June%202020_0.pdf
99
APRA. Life insurance claims and disputes statistics. APRA, 2021. https://www.apra.gov.au/life-insurance-claims-and-disputes-statistics
APRA. Quarterly general insurance statistics. https://www.apra.gov.au/quarterly-general-insurance-statistics
ASIC. Life insurance claims comparison tool. https://moneysmart.gov.au/how-life-insurance-works/life-insurance-claims-comparison-tool
CCIR. Market conduct data submission landing page, including data definitions and preview of template. https://lautorite.qc.ca/en/professionals/insurers/market-conduct/
FCA. General Insurance value measures reporting and publication. Policy Statement PS20/9. FCA, 2020. https://www.fca.org.uk/publication/policy/ps20-9.pdf
FCA. Firm-level complaints data. https://www.fca.org.uk/data/firm-level-complaints-data-sortable-table
FSCA. Conduct of Business Returns. https://www.fsca.co.za/Regulated%20Entities/Pages/UI-Insurer-Micro-Insurer-Resources-Documents.aspx
BIBLIOGRAPHY

Access to Insurance InitiativeHosted by GIZ Sector Project Financial Systems Approaches to Insurance Deutsche Gesellschaft für Internationale Zusammenarbeit (GIZ) GmbHDag-Hammarskjöld-Weg 1-565760 Eschborn, Germany
Telephone: +49 61 96 79-7511Fax: +49 61 96 79-80 7511E-mail: [email protected]: www.a2ii.org
a2ii_org
Promoting access to responsible, inclusive insurance for all.
Hosted by:Implementation Partner: Supported by: