In Vivo Real-Time Multiphoton Imaging of T Lymphocytes in the Mouse Brain After Experimental Stroke
9
ISSN: 1524-4628 Copyright © 2011 American Heart Association. All rights reserved. Print ISSN: 0039-2499. Online Stroke is published by the American Heart Association. 7272 Greenville Avenue, Dallas, TX 72514 DOI: 10.1161/STROKEAHA.110.603704 published online Mar 24, 2011; Stroke Pasquale Maffia and Hilary V. Carswell Bushell, James M. Brewer, Maria-Grazia De Simoni, Gary Dever, Paul Garside, Stefano Fumagalli, Jonathan A. Coles, Patrick Ejlerskov, Fabrizio Ortolano, Trevor J. After Experimental Stroke In Vivo Real-Time Multiphoton Imaging of T Lymphocytes in the Mouse Brain http://stroke.ahajournals.org located on the World Wide Web at: The online version of this article, along with updated information and services, is http://www.lww.com/reprints Reprints: Information about reprints can be found online at [email protected] 410-528-8550. E-mail: Fax: Kluwer Health, 351 West Camden Street, Baltimore, MD 21202-2436. Phone: 410-528-4050. Permissions: Permissions & Rights Desk, Lippincott Williams & Wilkins, a division of Wolters http://stroke.ahajournals.org/subscriptions/ Subscriptions: Information about subscribing to Stroke is online at by on March 25, 2011 stroke.ahajournals.org Downloaded from
-
Upload
independent -
Category
Documents
-
view
0 -
download
0
Transcript of In Vivo Real-Time Multiphoton Imaging of T Lymphocytes in the Mouse Brain After Experimental Stroke
ISSN: 1524-4628 Copyright © 2011 American Heart Association. All rights reserved. Print ISSN: 0039-2499. OnlineStroke is published by the American Heart Association. 7272 Greenville Avenue, Dallas, TX 72514
DOI: 10.1161/STROKEAHA.110.603704 published online Mar 24, 2011; Stroke
Pasquale Maffia and Hilary V. Carswell Bushell, James M. Brewer, Maria-Grazia De Simoni, Gary Dever, Paul Garside,
Stefano Fumagalli, Jonathan A. Coles, Patrick Ejlerskov, Fabrizio Ortolano, Trevor J. After Experimental Stroke
In Vivo Real-Time Multiphoton Imaging of T Lymphocytes in the Mouse Brain
http://stroke.ahajournals.orglocated on the World Wide Web at:
The online version of this article, along with updated information and services, is
http://www.lww.com/reprintsReprints: Information about reprints can be found online at
[email protected]. E-mail:
Fax:Kluwer Health, 351 West Camden Street, Baltimore, MD 21202-2436. Phone: 410-528-4050. Permissions: Permissions & Rights Desk, Lippincott Williams & Wilkins, a division of Wolters
http://stroke.ahajournals.org/subscriptions/Subscriptions: Information about subscribing to Stroke is online at
by on March 25, 2011 stroke.ahajournals.orgDownloaded from
In Vivo Real-Time Multiphoton Imaging of T Lymphocytesin the Mouse Brain After Experimental Stroke
Stefano Fumagalli, MSc*; Jonathan A. Coles, PhD*; Patrick Ejlerskov, MSc; Fabrizio Ortolano, MD;Trevor J. Bushell, PhD; James M. Brewer, PhD; Maria-Grazia De Simoni, PhD; Gary Dever, PhD;
Paul Garside, PhD; Pasquale Maffia, PhD†; Hilary V. Carswell, PhD†
Background and Purpose—To gain a better understanding of T cell behavior after stroke, we have developed real-timein vivo brain imaging of T cells by multiphoton microscopy after middle cerebral artery occlusion.
Methods—Adult male hCD2-GFP transgenic mice that exhibit green fluorescent protein-labeled T cells underwentpermanent left distal middle cerebral artery occlusion by electrocoagulation (n�6) or sham surgery (n�6) and thenmultiphoton laser imaging 72 hours later.
Results—Extravasated T cell number significantly increased after middle cerebral artery occlusion versus sham. Two T cellpopulations existed after middle cerebral artery occlusion, possibly driven by 2 T cell subpopulations; 1 had significantlylower and the other significantly higher track velocity and displacement rate than sham.
Conclusions—The different motilities and behaviors of T cells observed using our imaging approach after stroke couldreveal important mechanisms of immune surveillance for future therapeutic exploitations. (Stroke. 2011;42:00-00.)
Key Words: cerebral infarction � cerebral ischemia � immune system � inflammation
Activation of the immune response is a hallmark of acutestroke and recently T lymphocytes have been revealed
as potential therapeutic targets. Mice deficient in lympho-cytes have been shown to exhibit reduced infarct volume aftertransient occlusion of the middle cerebral artery by anintraluminal filament1,2 and after permanent occlusion byelectrocoagulation (pMCAO).3 Infarct volume after transientmiddle cerebral artery occlusion has also reportedly beenreduced by the immunosuppressant FTY720, which blocks Tcell infiltration into the brain.4 Despite the deleterious effectof T cells on stroke, subpopulations of T cells may beharnessed to reduce tissue damage. Neuroprotective mucosalimmunization is mediated by inducible regulatory lympho-cytes5 and regulatory T cells have indeed been shown to beprotective against delayed infarct expansion after both pMCAOand transient middle cerebral artery occlusion.3
Analysis of immune responses in experimental stroke hasbeen based mainly on immunohistochemistry and, recently,flow cytometry,6 but like with all postmortem techniques,interpretation is limited by disruption and processing of tissueat defined time points. To effectively study the dynamic
processes involved in the immune response, real-time infor-mation is required. However, the in vivo imaging approachesdeveloped so far for imaging immune cells after stroke arerestricted. MRI has been used for tracking macrophagesrecruited to the inflamed brain,7 although this lacks the spatialresolution needed to study individual cells. Epifluorescencevideo microscopy,8–10 an additional in vivo tool, meets therequirements of high resolution but it does not allow real-timeimaging in 3-dimensional space. In addition, it has majorlimitations needing a cranial window that may possiblyinduce brain injury.
The introduction of multiphoton laser scanning microscopy(MPLSM) represents a major qualitative advancement inimmune cell imaging, allowing high-resolution visualizationof cells within a 3-dimensional space over time. This tech-nique can image the movements of single cells at depths ofhundreds of microns into living tissue11 and could providefundamental insight into how T cells and antigen-presentingcells access and behave within the ischemic brain. We havepreviously used MPLSM to image superfused slices ofischemic brain ex vivo and were able to analyze the detailed
Received October 7, 2010; final revision received November 30, 2010; accepted December 21, 2010.From the Strathclyde Institute of Pharmacy & Biomedical Sciences (S.F., J.A.C., P.E., T.J.B., H.V.C.), University of Strathclyde, Glasgow, UK; the
Laboratory of Inflammation and Nervous System Diseases (S.F., F.O., M.-G.D.S.), Mario Negri Institute, Milan, Italy; the Institute for Cellular andMolecular Medicine (P.E.), University of Copenhagen, Copenhagen, Denmark; Fondazione IRCCS Ca Granda (F.O.), Ospedale Maggiore Policlinico,Milan, Italy; the Institute of Infection, Immunity and Inflammation (J.M.B., G.D., P.G., P.M.), University of Glasgow, Glasgow, UK; and the Departmentof Experimental Pharmacology (P.M.), University of Naples Federico II, Naples, Italy.
The online-only Data Supplement is available at http://stroke.ahajournals.org/cgi/content/full/STROKEAHA.110.603704/DC1.*S.F. and J.A.C., and †P.M. and H.V.C. contributed equally to this work.Correspondence to Hilary V. Carswell, PhD, Strathclyde Institute of Pharmacy & Biomedical Sciences, University of Strathclyde, 161 Cathedral Street,
Glasgow G4 0RE, UK. E-mail [email protected]; and Pasquale Maffia, Institute of Infection, Immunity and Inflammation, University ofGlasgow, 120 University Place, Glasgow G12 8TA, UK. E-mail [email protected]
© 2011 American Heart Association, Inc.
Stroke is available at http://stroke.ahajournals.org DOI: 10.1161/STROKEAHA.110.603704
1 by on March 25, 2011 stroke.ahajournals.orgDownloaded from
movements of T cells.12 However, immune cell mobility andactivation are drastically altered in brain slice cultures, wherethe vascular system is not preserved. MPLSM has recentlybeen used to image T cell behavior in vivo in the lower spinalcord in models of cerebral autoimmune disease.13–15 How-ever, considering the difficulties in localizing the ischemicarea of interest and that there are far fewer T cells extrava-sated in stroke compared with autoimmune disease, this in
vivo approach has to date never been applied to image T cellsafter stroke.
We now report real-time in vivo MPLSM imaging andquantitative tracking of endogenous T cell dynamics in thebrain after a focal cerebral ischemic insult using transgenicmice whose T cells express green fluorescent protein (GFP).To study T cells in the pMCAO model, it was necessary toimage in and near the territory of the middle cerebral artery.
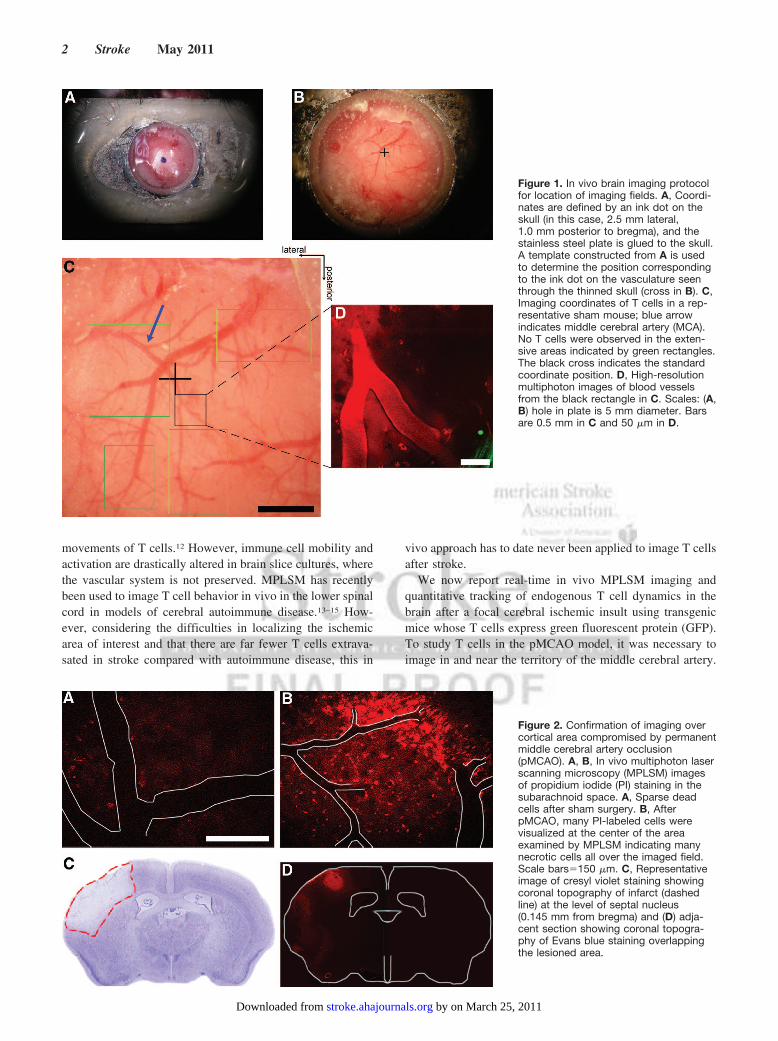
Figure 1. In vivo brain imaging protocolfor location of imaging fields. A, Coordi-nates are defined by an ink dot on theskull (in this case, 2.5 mm lateral,1.0 mm posterior to bregma), and thestainless steel plate is glued to the skull.A template constructed from A is usedto determine the position correspondingto the ink dot on the vasculature seenthrough the thinned skull (cross in B). C,Imaging coordinates of T cells in a rep-resentative sham mouse; blue arrowindicates middle cerebral artery (MCA).No T cells were observed in the exten-sive areas indicated by green rectangles.The black cross indicates the standardcoordinate position. D, High-resolutionmultiphoton images of blood vesselsfrom the black rectangle in C. Scales: (A,B) hole in plate is 5 mm diameter. Barsare 0.5 mm in C and 50 �m in D.
Figure 2. Confirmation of imaging overcortical area compromised by permanentmiddle cerebral artery occlusion(pMCAO). A, B, In vivo multiphoton laserscanning microscopy (MPLSM) imagesof propidium iodide (PI) staining in thesubarachnoid space. A, Sparse deadcells after sham surgery. B, AfterpMCAO, many PI-labeled cells werevisualized at the center of the areaexamined by MPLSM indicating manynecrotic cells all over the imaged field.Scale bars�150 �m. C, Representativeimage of cresyl violet staining showingcoronal topography of infarct (dashedline) at the level of septal nucleus(0.145 mm from bregma) and (D) adja-cent section showing coronal topogra-phy of Evans blue staining overlappingthe lesioned area.
2 Stroke May 2011
by on March 25, 2011 stroke.ahajournals.orgDownloaded from

To avoid performing a craniotomy, which has been shown tohave pathological effects,16 we imaged through the thinnedskull.17 The imaging was performed 72 hours after pMCAO,because the results of Jander18 and Schroeter19 and ourpreliminary data suggested that the population of infiltrated Tcells was near its peak at this time point.
Materials and MethodsAnimalsAdult male CBA/Ca�C57F7BL/10 hCD2-GFP transgenic mice thatexpress GFP under control of the hCD2 promoter (kindly gifted byDr Dimitris Kioussis, National Institute for Medical Research,London, UK) were maintained on a 12/12-hour light/dark cycle withfree access to food and water at the University of Strathclyde, and allthe procedures were performed in accordance with local ethical andUK Home Office regulations. GFP is expressed almost exclusivelyin thymocytes, and virtually all mature thymocytes express it(irrespective of CD4 or CD8 expression); peripheral B cells showapproximately 1% of the GFP fluorescence of T cells.20
Permanent Middle Cerebral Artery OcclusionThe mice underwent left distal pMCAO by electrocoagulation21
(n�6) or sham surgery (n�6) under isoflurane anesthesia (induction:
3% in 100% O2; maintenance, 1.5% to 2.0%) with body temperaturemaintained at 37°C throughout the procedure.
Animal Preparation for MPLSM
Surgical PreparationSeventy-two hours after middle cerebral artery occlusion, blood waslabeled red with either QTracker quantum dots (655 nm, red,Invitrogen; 30 �L mixed with 70 �L phosphate-buffered saline) orrhodamine B isothiocyanate-dextran (RhITC-dextran, 70 kDa,Sigma; 5% in phosphate-buffered saline, 150 �L). Mice wereisoflurane-anesthetized with rectal temperature maintained at 36.2°Cto 37°C. The left parietal skull was exposed and dried; a point near2.5 mm lateral, 1 mm posterior to the bregma was marked. Astainless steel plate 0.4 mm thick with a 5-mm hole was glued to theskull with its center over the mark (Figure 1A). Under a dissectingmicroscope, the skull was thinned using a NSK Vmax Volvere dentaldrill (Wright Cottrell) with a diamond burr (Diama Labcraft). Whenthe pial vasculature could be clearly seen (Figure 1B), the mouse onits base plate was moved to the imaging microscope and the thinnedskull superfused with Ca2� saline, forming a meniscus to theobjective.
Tracking the Coordinates of Recording SitesTo determine the coordinates of each recording site, we tookphotographs through the dissecting microscope. The sites of imaging
Figure 3. Three-dimensional reconstructions showing extravasated T cells normally staying close to blood vessels. A typical imagingvolume includes only 1 T cell after sham (A) and several cells after permanent middle cerebral artery occlusion (pMCAO; B). The cell inA hardly moved (C, time markers indicate minutes:seconds). Successive positions of the cells in B were joined by white lines andimages at 4 time points are shown (D). 1 grid unit�28.47 �m.
Fumagalli et al In Vivo Real-Time Imaging of T Cells After Stroke 3
by on March 25, 2011 stroke.ahajournals.orgDownloaded from

were identified by their relation to blood vessels and the stereotaxiccoordinates (Figure 1C–D). The green autofluorescence of the skullbone was used to determine the underside of the skull, which wedefined as z�0.
Multiphoton ImagingA Ti-sapphire femtosecond laser (Chameleon; Coherent) providedpulsed infrared light through a Radiance 2000 scan head (BioRad) toan upright microscope (Eclipse; Nikon) with a large micrometer-driven stage. A Nikon Fluor 40�, NA 0.80 water immersionobjective was used. The maximum beam power at 830 nm was 49.2mW and at 940 nm 20.5 mW. In naive mice, unintended signs oflaser-induced damage such as rolling of cells along vessel walls werenot observed in our protocol.
To image GFP-expressing T cells, we used the longest availableexcitation wavelength, 940 nm. Both of the blood markers used(Qtracker and RhITC-dextran) absorb more strongly at 830 nm thanat 940 nm; therefore, in few cases, the vasculature was imagedseparately from the T cells.
Image Acquisition and ProcessingTo track extravascular T cells, time series of z-stacks were obtained.Typically, the area imaged was 284 �m�284 �m at 512�512 pixelsand 500 lines per second, the z step was 2.0 �m, with a total depthof 16 to 20 stacks, and the repetition rate for the stacks was 34seconds per stack. Four-dimensional reconstructions were analyzedusing Volocity 5 software (Improvision).
The location (centroid) of each GFP-positive cell within each3-dimensional image stack was determined manually by the opera-tor. Only tracks with at least 3 time points were included in theanalysis. To quantify T cell behaviors, we calculated, for each cell,its mean velocity as it moved along its track, length covered,displacement (straight line distance from the first position in thetrack to the last), displacement rate (total displacement during theperiod of tracking divided by the time it was tracked), and mean-dering index (displacement/length covered, which provides a mea-sure of a track’s deviation from a straight line. A meandering indexof 1 indicates that the track is a perfect straight line; the smaller thevalue of the meandering index, the greater the meandering of thetrack).
Images were processed using Adobe Photoshop CS3 (AdobeSystems Europe Ltd). The velocity of cells in the centers of bloodvessels was measured by line scans.22
Region Compromised by pMCAOTo check that the point on the skull with coordinates 2.5 mm lateraland 1 mm posterior to bregma was within the damaged area,23 welabeled the brain of 1 pMCAO wild-type mice with Evans blue. A29-G needle was inserted at these surface coordinates to a depth of1.5 mm through a craniotomy and 1 �L of Evans blue solution wasinjected. Twenty-micron coronal brain sections were cut and stainedwith cresyl violet (Sigma Aldrich) to detect ischemic lesion aspreviously described.23 Images were acquired by an BX61 micro-scope managed by AnalySIS software (Olympus, Tokyo, Japan).
To further characterize the imaged brain area, 100 �L of asolution of propidium iodide (Sigma-Aldrich; 1 mg/mL), whichlabels dead cells, was injected intravenously in wild-type mice 72hours after pMCAO or sham surgery. The mice were imagedthrough the thinned skull 4 hours after the propidium iodideinjection (z�0 to 200 �m, propidium iodide fluorescence wasexcited at 767 nm).
Immunofluorescence and Confocal AnalysisImmunofluorescence was performed using previously describedprotocols24 as described in the Supplemental Methods(http://stroke.ahajournals.org).
Statistical AnalysisResults are expressed as mean�SEM of 6 mice per experimentalgroup and nonnormal distributions compared using the 2-tailed
Mann-Whitney. One-way analysis of variance and Dunn post hoctest were applied for movement parameters using Prism software(Graph Pad, San Diego, CA). The level of statistical significance was0.05 per test.
ResultsAs expected, a significant area of lesion was observed at 72hours after pMCAO (Figure 2). It was our aim to perform invivo MPLSM imaging through the skull in an area not too farfrom the midline but within the lesioned zone. We confirmedthat the surface coordinates 2.5 mm lateral, 1.0 mm posteriorto bregma met these requirements. Intravenous injection ofpropidium iodide was used to label dead cells25 and producedlittle labeling of cells in sham-operated mice, showing thatthe procedure of thinning the skull caused no cell death or didnot compromise the blood–brain barrier (Figure 2A).26 AfterpMCAO, numerous cells were stained, particularly near thecentral coordinate point (Figure 2B and Supplemental FigureIB–C). These results show that in the areas where T cellswere imaged after pMCAO, propidium iodide could extrav-asate from perfused vessels and cross the membranes of manycells. This indicates opening of the blood–brain barrier and,perhaps, debility of the stained cells.25 In addition, in vivoEvans blue staining at the image site (1 �L of Evans blueinjected at 1 mm posterior, 2.5 mm lateral from bregma and1.5 mm ventral to the skull, 72 hours after pMCAO) wascolocalized with the autofluorescence produced by the in-
Figure 4. Representative 3-dimensional plots of T cell movementin (A) sham mice and (B) in permanent middle cerebral arteryocclusion (pMCAO) mice. The right-hand panels show the tracks inextended focus seen from above and from the posterior andmedial sides of the imaging volumes. The plots in the left-handpanels were generated by putting the starting point of each trackat the origin of the axes. The cells have been labeled with indi-vidual colors. The tracks show that some T cells were highlymotile and some near stationary after pMCAO. Left-hand pan-els: axis lengths are expressed in microns. Scale bars�25 �m, zprojections�40 �m.
4 Stroke May 2011
by on March 25, 2011 stroke.ahajournals.orgDownloaded from

jured tissue providing clear confirmation that our imaging siteis present inside the compromised area (Figure 2C–D andSupplemental Figure ID–F).
Many areas scanned in sham mice revealed no T cells orrarely more than 1 to 2 extravascular T cells per imagingvolume and these were close to the skull (within 20 �m;Figures 3A, C). In contrast, in pMCAO mice, extravascular Tcells were observed in virtually all areas where the bloodmarker was present (Figures 3B, D). The number of extravas-cular T cells observed in each imaging field were normalizedfor the volume of the field and averaged for each mouse. Themean T cell density was significantly (P�0.05) higher inpMCAO mice (5.1�1.2 thousand/mm3, n�6) compared withsham-operated mice (sham; 1.9�0.4 thousand/mm3, n�6).Note that the true ratio of the T cell populations is greater thanthese numbers suggest, because the volumes in shams with noT cells (green areas in Figure 1) were not imaged andtherefore excluded.
With rare exceptions (1 animal in 6 analyzed), the sparseextravascular T cells in sham animals moved slowly andmeandered so that their displacement was small (Figures 3A,C; Video 1, Supplemental Material). After pMCAO, most ofthe numerous T cells (Figures 3B, D) patrolled up and downthe perivascular surfaces of blood vessels (SupplementalFigure IIA), sometimes moving from 1 vessel to another(Video 2, Supplemental Material), and few T cells wereremote from blood vessels.
T cells, detected in the bloodstream, moved with a similarvelocity as erythrocytes (Supplemental Figure IIB–C). AfterpMCAO, some vessels were poorly perfused, as shown by an
absence of fast-moving cells (Supplemental Figure IIC, rightpanel). Very few T cells were observed on the luminal surfaceof the vascular endothelium in perfused vessels.
For each mouse, all available T cell tracks were displayedin a single volume (representatives shown in Figure 4, rightpanels). In the 6 sham-operated mice, the cell movement wasgenerally confined within a radius of �10 �m (Figure 4A),although a few longer displacements were seen (Video 3,Supplemental Material). This behavior is also evident whenthe tracks were plotted so that their origins coincided (left-hand panels in Figure 4). In contrast, T cells that moved over10s of microns were observed in all 6 pMCAO mice(representative in Figure 4B), although a subpopulation ofalmost stationary T cells was also observed.
In sham animals, cells moved with an average velocity of4.78�0.63 �m/min (n�23 T cells) with 39% of themstationary (velocity �2 �m/min27,28). Two main populationswere found in pMCAO animals (Figure 5A); 1 populationwas almost stationary (1.74�0.11 �m/min, n�23 T cells,Population 1) and the other population was quickly moving(8.21�0.10 �m/min, n�25 T cells, Population 2). In additionto exhibiting significantly increased track velocity (Figure5B), Population 2 showed significantly increased displace-ment rate (Figure 5C) compared with Population 1 (P�0.001)and sham (P�0.01) and a higher meandering index (Figure5D) compared with Population 1 (P�0.001) but not sham.Interestingly, Population 1 showed significantly lower(P�0.01) track velocity and displacement rate compared withsham (Figure 5B–C).
Finally, by using conventional postmortem immunohisto-chemistry and confocal microscopy, we confirmed T cell
Figure 5. Quantitative analysis of T celldynamics. Two main populations(arrows) as track velocity (�m/min) werefound in permanent middle cerebralartery occlusion (pMCAO) animals (A), 1near stationary (Population 1) and 1quickly moving (Population 2). B, Popu-lation 1 exhibited significantly lowertrack velocity compared with sham ani-mals and with Population 2. Population 2had significantly higher values comparedwith sham and Population 1. Population1 exhibited significantly lower displace-ment rate (C) and meandering index (D)compared with Population 2. Population1 showed also significantly lower dis-placement rate compared with sham ani-mals (C). Population 2 had significantlyhigher values compared with sham in allassessed parameters. Single data pointand means (bars) are presented.**P�0.01 vs sham; °°°P�0.001 vspMCAO Population 1.
Fumagalli et al In Vivo Real-Time Imaging of T Cells After Stroke 5
by on March 25, 2011 stroke.ahajournals.orgDownloaded from

location in the perivascular space of vessels in contact withcomponents of the neurovascular unit such as astrocytes (glialfibrillary acidic protein-positive) and perivascular macro-phages (IB4�/CD11b�; Figure 6).
DiscussionOur advances in imaging techniques have allowed us, for thefirst time to our knowledge, to visualize, define, and quanti-tatively analyze the movement and behavior of T cells in vivoin real time after stroke. Specifically, we observed a highernumber of extravasated T cells in the subarachnoid spaceafter pMCAO than sham and 2 distinct T cell populations inpMCAO mice, 1 that was almost stationary and the secondshowing higher track velocity and displacement than sham.Infiltrated T cells were observed to patrol along the perivas-cular surfaces of cerebral vessels.
We have built on technology exploited in infection or auto-immune diseases in which there are several MPLSM studiesdescribing the dynamics of T cells participating in the develop-ment of pathology (experimental autoimmune encephalomyeli-tis,13,14,29 toxoplasmic encephalitis,30 acute viral meningitis31).These studies have provided important information on how Tcells access the central nervous system and factors that regulatetheir behavior once in the central nervous system. However,challenges lie ahead for providing insight into neurologicaldiseases such as stroke.
The brain is unique in its development of inflammationbecause it has no lymphatic system and the blood–brainbarrier limits antibody and immune cell entry.32,33 Therefore,T cell access is tightly regulated and rare in the normal brain,and despite an increased expression of adhesion moleculesduring ischemia that facilitates T cell infiltration, there are farfewer T cells in the brain after stroke compared withautoimmune disease.14 To the best of our knowledge, real-time in vivo T cell movements after stroke have never beensuccessfully visualized and analyzed.
We observed a high number of extravascular T cells 72hours after pMCAO and only a few T cells after sham. Wecannot exclude that the sham procedure (anesthesia, skullthinning) may have induced recruitment of these cells. On thecontrary, increased T cell infiltration after stroke is consistentwith postmortem immunohistochemistry or flow cytometrystudies,34,35 although such techniques are limited by theremoval, disruption, and processing of tissue at defined timepoints.
A key observation from our multiphoton microscopy ap-proach is the significant differences in motility, namely trackvelocity, displacement, and meandering, of extravasated Tcells between pMCAO and sham mice. Interestingly, 2 mainpopulations were found in pMCAO mice; both populationsshowed significantly different dynamics compared with Tcells in sham mice. One population showed a mean displace-ment of 0.25�0.06 �m/min, the other population 3.26�
Figure 6. Postmortem confocal images of immunostaining showing T cells in the perivascular space in contact with vascular compo-nents post-permanent middle cerebral artery occlusion (pMCAO). Single plane views with projections of z axis of immunostaining (A, B)of IB4 (red; isolectin), green fluorescent protein (GFP; white; expressed by T cells), glial fibrillary acid protein (GFAP; green) showing Tcells (white) located between the endothelium (red) and astrocytic end feet (green) in the perivascular space of the vessels. C, D, Im-munostaining of IB4, GFP, and CD11b (green) showing a macrophage/microglial cell (yellow) making contact with a T cell (white) in theperivascular space adjacent to vessel (red; arrows; C) and an extravasated T cell (white), distant from vessels (red) interacting with amacrophage/microglial cell (green; arrows; D), which is particularly evident at bottom projection. Scale bars�20 �m.
6 Stroke May 2011
by on March 25, 2011 stroke.ahajournals.orgDownloaded from
0.39 �m/min, and sham 1.4�0.4 �m/min. Cordiglieri andcolleagues defined in the central nervous system motile cellswith displacements �1 �m/min and stationary cells withdisplacements �1 �m/min36; therefore, we consider Popula-tion 1 stationary. On the contrary, Population 2 showed trackvelocity in the range of data already shown in other models ofneuroinflammation.13,31 The reported differences in trackvelocities between Population 1 (1.74 �m/min) and Popula-tion 2 (8.21 �m/min), in our model, are extremely relevant ifcompared with T cell velocity in secondary lymphoid organs.We and others27,28 have shown that naıve CD4 T cells moveat an average velocity 10 �m/min. Both primed and tolerizedT cells show slower velocity of approximately 4 to 5 �m/minand cells with velocities �2 �m/min are essentially station-ary due to factors like centroid movement. Thus, the observeddifferences between Populations 1 and 2 and sham in oursetting could clearly depend on the different activation statusof these cells.
The different motility of the 2 cell populations could reflectthe evolution of T cell response from a naıve population toeffector/memory cells and/or the behavior of T cells that,after antigen encounter, display an altered profile of adhesionmolecules and chemokine receptors. One limitation of ourexperiments is that GFP expression was not restricted to aspecific population of T cells and therefore it is impossible todistinguish which T cell subset was stationary or motile or ifthis was related to their antigen specificity. Interestingly,recent real-time imaging during recall responses in the lymphnode have shown that, in contrast to CD4 T cells, which showslower migration,37 memory CD8 T cells move more rapidlythan naıve cells,38 suggesting that faster migration could be adefining characteristic of CD8 versus CD4 memory T cells.
Also key to our findings are the paths of these cells onceextravasated and we reveal 3 key locations: perivascular,moving from 1 vessel to another, and remote from vessels.The perivascular location of T cells is in line with previousdata by Owens39 who elegantly describes the transmigrationof immune cells into the perivascular space and movement ofextravasated T cells are likely to be in the perivascular spacerather than in the brain parenchyma. We observed T cellspatrolling up and down the perivascular surfaces of bloodvessels. The object of their survey is unclear, but directcontact of T cells with cellular components of the neurovas-cular unit has been shown in other inflammatory centralnervous system conditions13 and the perivascular space seemsto be a location where immune cells could interact withpotential antigen-presenting cells.39 The immunologic syn-apse could be formed with astrocytic end feet or perivascularphagocytes, all of which have the capacity to act as antigen-presenting cells.40,41 We have attempted to shed further lighton these cellular interactions using immunostaining. Al-though this analysis was performed deeper in the parenchymacompared with the imaged area, we could confirm T cells’location between the endothelium and astrocytic end feet inthe perivascular space with a direct contact among astrocytes,macrophages/microglial cells, and T cells. Whether this directcontact is associated with the reported role of the neurovas-cular unit in stimulating inflammatory responses afterstroke42 is yet to be elucidated, but this would explain the
reason for some T cells moving from 1 vessel to another afterpMCAO. Lastly, we observed T cells remote from bloodvessels in our imaging and again using immunohistochemis-try, we observed extravasated T cells quite far from vesselsinteracting with a microglial cell.
Whether T cells’ contribution to cerebral ischemia dependson antigen recognition is still under debate43; therefore, adeeper understanding of the cellular interactions between Tcells to astrocytes and microglia would help to clarify thisissue. By measuring parameters that are likely to influencethe character of immune responses (eg, location of T cellactivation, location of immune cell interactions, duration andnumber of interactions, etc) and relating these to the paralleldetermination of immunologic parameters (eg, cytokine andcostimulatory molecules production), a MPLSM strategycould help to analyze these interactions in vivo and hopefullyhelp to elucidate the role of immune cells in stroke.
ConclusionsIn conclusion, we have provided previously unavailableinformation on the dynamics of T lymphocytes recruited bythe ischemic brain, which could reveal important mechanismsof immune surveillance after stroke. In addition, our imagingapproach represents a major technical advance and an impor-tant research tool for the understanding of the complexinteractions between the brain and immune cells after ische-mia. Combining the development of strategies to depletespecific cell populations/subsets or modify their function andthe application of available fluorescent reporters for antigen-presenting cells should allow a dissection of how the behaviorof immune cells relates to their function in the ischemic brain.It is hoped that these advances in imaging of immune cellsafter stroke could provide important information for thedevelopment and use of specific therapies for a bettermanagement of the immune response in the ischemic brain.
Sources of FundingStrathclyde Institute of Pharmacy & Biomedical Sciences grantsawarded to H.V.C., P.M., and T.B.; S.F. funded by FondazioneMonzino and Banca Popolare di Milano, Milan, Italy; G.D. fundedby a British Heart Foundation project grant (PG/06/083/21198)awarded to P.G.; J.A.C. funded by a Sir David Anderson BequestAward.
DisclosuresNone.
References1. Hurn PD, Subramanian S, Parker SM, Afentoulis ME, Kaler LJ, Van-
denbark AA, Offner H. T- and B-cell deficient mice with experimentalstroke have reduced lesion size and inflammation. J Cereb Blood FlowMetab. 2007;27:1798–1805.
2. Yilmaz G, Arumugam TV, Stokes KY, Granger DN. Role of T lym-phocytes and interferon-gamma in ischemic stroke. Circulation. 2006;113:2105–2112.
3. Liesz A, Suri-Payer E, Veltkamp C, Doerr H, Sommer C, Rivest S, GieseT, Veltkamp R. Regulatory T cells are key cerebroprotective immuno-modulators in acute experimental stroke. Nat Med. 2009;15:192–199.
4. Shichita T, Sugiyama Y, Ooboshi H, Sugimori H, Nakagawa R, TakadaI, Iwaki T, Okada Y, Iida M, Cua DJ, Iwakura Y, Yoshimura A. Pivotalrole of cerebral interleukin-17-producing gammadelta T cells in thedelayed phase of ischemic brain injury. Nat Med. 2009;15:946–950.
Fumagalli et al In Vivo Real-Time Imaging of T Cells After Stroke 7
by on March 25, 2011 stroke.ahajournals.orgDownloaded from
5. Gee JM, Kalil A, Thullbery M, Becker KJ. Induction of immunologictolerance to myelin basic protein prevents central nervous system auto-immunity and improves outcome after stroke. Stroke. 2008;39:1575–1582.
6. Gelderblom M, Leypoldt F, Steinbach K, Behrens D, Choe CU, Siler DA,Arumugam TV, Orthey E, Gerloff C, Tolosa E, Magnus T. Temporal andspatial dynamics of cerebral immune cell accumulation in stroke. Stroke.2009;40:1849–1857.
7. Desestret V, Brisset JC, Moucharrafie S, Devillard E, Nataf S, HonnoratJ, Nighoghossian N, Berthezene Y, Wiart M. Early-stage investigations ofultrasmall superparamagnetic iron oxide-induced signal change after per-manent middle cerebral artery occlusion in mice. Stroke. 2009;40:1834–1841.
8. Constantin G. Analysis of leukocyte recruitment in synovial microcircu-lation by intravital microscopy. Methods Mol Med. 2007;135:333–341.
9. Laudanna C, Constantin G. New models of intravital microscopy foranalysis of chemokine receptor-mediated leukocyte vascular recognition.J Immunol Methods. 2003;273:115–123.
10. Lapi D, Marchiafava PL, Colantuoni A. Geometric characteristics ofarterial network of rat pial microcirculation. J Vasc Res. 2008;45:69–77.
11. Helmchen F, Denk W. Deep tissue two-photon microscopy. Nat Methods.2005;2:932–940.
12. Ortolano F, Maffia P, Dever G, Rodolico G, Millington OR, De SimoniMG, Brewer JM, Bushell TJ, Garside P, Carswell HV. Advances inimaging of new targets for pharmacological intervention in stroke: realtime tracking of T cells in the ischaemic brain. Br J Pharmacol. 2010;159:808–811.
13. Bartholomaus I, Kawakami N, Odoardi F, Schlager C, Miljkovic D,Ellwart JW, Klinkert WE, Flugel-Koch C, Issekutz TB, Wekerle H,Flugel A. Effector T cell interactions with meningeal vascular structuresin nascent autoimmune CNS lesions. Nature. 2009;462:94–98.
14. Flugel A, Odoardi F, Nosov M, Kawakami N. Autoaggressive effector Tcells in the course of experimental autoimmune encephalomyelitis visu-alized in the light of two-photon microscopy. J Neuroimmunol. 2007;191:86–97.
15. Smorodchenko A, Wuerfel J, Pohl EE, Vogt J, Tysiak E, Glumm R,Hendrix S, Nitsch R, Zipp F, Infante-Duarte C. CNS-irrelevant T-cellsenter the brain, cause blood– brain barrier disruption but no glialpathology. Eur J Neurosci. 2007;26:1387–1398.
16. Xu HT, Pan F, Yang G, Gan WB. Choice of cranial window type for invivo imaging affects dendritic spine turnover in the cortex. Nat Neurosci.2007;10:549–551.
17. Yang G, Pan F, Parkhurst CN, Grutzendler J, Gan WB. Thinned-skullcranial window technique for long-term imaging of the cortex in livemice. Nat Protoc. 2010;5:201–208.
18. Jander S, Kraemer M, Schroeter M, Witte OW, Stoll G. Lymphocyticinfiltration and expression of intercellular adhesion molecule-1 in photo-chemically induced ischemia of the rat cortex. J Cereb Blood FlowMetab. 1995;15:42–51.
19. Schroeter M, Jander S, Witte OW, Stoll G. Local immune responses in the ratcerebral cortex after middle cerebral artery occlusion. J Neuroimmunol.1994;55:195–203.
20. de Boer J, Williams A, Skavdis G, Harker N, Coles M, Tolaini M, NortonT, Williams K, Roderick K, Potocnik AJ, Kioussis D. Transgenic micewith hematopoietic and lymphoid specific expression of Cre. EurJ Immunol. 2003;33:314–325.
21. Carswell HV, Dominiczak AF, Garcia-Segura LM, Harada N, HutchisonJB, Macrae IM. Brain aromatase expression after experimental stroke:topography and time course. J Steroid Biochem Mol Biol. 2005;96:89–91.
22. Schaffer CB, Friedman B, Nishimura N, Schroeder LF, Tsai PS, EbnerFF, Lyden PD, Kleinfeld D. Two-photon imaging of cortical surfacemicrovessels reveals a robust redistribution in blood flow after vascularocclusion. PLoS Biol. 2006;4:e22.
23. Capone C, Frigerio S, Fumagalli S, Gelati M, Principato MC, Storini C,Montinaro M, Kraftsik R, De Curtis M, Parati E, De Simoni MG.Neurosphere-derived cells exert a neuroprotective action by changing theischemic microenvironment. PLoS One. 2007;2:e373.
24. Gesuete R, Storini C, Fantin A, Stravalaci M, Zanier ER, Orsini F,Vietsch H, Mannesse ML, Ziere B, Gobbi M, De Simoni MG. Recom-binant C1 inhibitor in brain ischemic injury. Ann Neurol. 2009;66:332–342.
25. Unal Cevik I, Dalkara T. Intravenously administered propidium iodidelabels necrotic cells in the intact mouse brain after injury. Cell DeathDiffer. 2003;10:928–929.
26. Hussain ST, Attilo A, Bigotte L, Cesarini K, Olsson Y. Cytofluorescencelocalization of propidium iodide injected intravenously into the nervoussystem of the mouse. Acta Neuropathol (Berl). 1985;66:62–67.
27. Miller MJ, Wei SH, Parker I, Cahalan MD. Two-photon imaging oflymphocyte motility and antigen response in intact lymph node. Science.2002;296:1869–1873.
28. Zinselmeyer BH, Dempster J, Gurney AM, Wokosin D, Miller M, Ho H,Millington OR, Smith KM, Rush CM, Parker I, Cahalan M, Brewer JM,Garside P. In situ characterization of CD4� T cell behavior in mucosaland systemic lymphoid tissues during the induction of oral priming andtolerance. J Exp Med. 2005;201:1815–1823.
29. Kim JV, Jiang N, Tadokoro CE, Liu L, Ransohoff RM, Lafaille JJ, DustinML. Two-photon laser scanning microscopy imaging of intact spinal cordand cerebral cortex reveals requirement for CXCR6 and neuroinflam-mation in immune cell infiltration of cortical injury sites. J ImmunolMethods. 2010;352:89–100.
30. Wilson EH, Harris TH, Mrass P, John B, Tait ED, Wu GF, Pepper M,Wherry EJ, Dzierzinski F, Roos D, Haydon PG, Laufer TM, Weninger W,Hunter CA. Behavior of parasite-specific effector CD8� T cells in thebrain and visualization of a kinesis-associated system of reticular fibers.Immunity. 2009;30:300–311.
31. Kim JV, Kang SS, Dustin ML, McGavern DB. Myelomonocytic cellrecruitment causes fatal CNS vascular injury during acute viral men-ingitis. Nature. 2009;457:191–195.
32. Wilson EH, Weninger W, Hunter CA. Trafficking of immune cells in thecentral nervous system. J Clin Invest. 2010;120:1368–1379.
33. Cserr HF, Knopf PM. Cervical lymphatics, the blood–brain barrier andthe immunoreactivity of the brain: a new view. Immunol Today. 1992;13:507–512.
34. Stevens SL, Bao J, Hollis J, Lessov NS, Clark WM, Stenzel-Poore MP.The use of flow cytometry to evaluate temporal changes in inflammatorycells following focal cerebral ischemia in mice. Brain Res. 2002;932:110–119.
35. Frenkel D, Huang Z, Maron R, Koldzic DN, Hancock WW, MoskowitzMA, Weiner HL. Nasal vaccination with myelin oligodendrocyte glyco-protein reduces stroke size by inducing IL-10-producing CD4� T cells.J Immunol. 2003;171:6549–6555.
36. Cordiglieri C, Odoardi F, Zhang B, Nebel M, Kawakami N, Klinkert WE,Lodygin D, Luhder F, Breunig E, Schild D, Ulaganathan VK, DornmairK, Dammermann W, Potter BV, Guse AH, Flugel A. Nicotinic acidadenine dinucleotide phosphate-mediated calcium signalling in effector Tcells regulates autoimmunity of the central nervous system. Brain. 2010;133:1930–1943.
37. Rush CM, Millington OR, Hutchison S, Bryson K, Brewer JM, GarsideP. Characterization of CD4� T-cell-dendritic cell interactions duringsecondary antigen exposure in tolerance and priming. Immunology. 2009;128:463–471.
38. Chtanova T, Han SJ, Schaeffer M, van Dooren GG, Herzmark P, StriepenB, Robey EA. Dynamics of T cell, antigen-presenting cell, and pathogeninteractions during recall responses in the lymph node. Immunity. 2009;31:342–355.
39. Owens T, Bechmann I, Engelhardt B. Perivascular spaces and the twosteps to neuroinflammation. J Neuropathol Exp Neurol. 2008;67:1113–1121.
40. Fierz W, Endler B, Reske K, Wekerle H, Fontana A. Astrocytes asantigen-presenting cells. I. Induction of Ia antigen expression onastrocytes by T cells via immune interferon and its effect on antigenpresentation. J Immunol. 1985;134:3785–3793.
41. Kivisakk P, Imitola J, Rasmussen S, Elyaman W, Zhu B, Ransohoff RM,Khoury SJ. Localizing central nervous system immune surveillance: men-ingeal antigen-presenting cells activate T cells during experimental auto-immune encephalomyelitis. Ann Neurol. 2009;65:457–469.
42. del Zoppo GJ. Inflammation and the neurovascular unit in the setting offocal cerebral ischemia. Neuroscience. 2009;158:972–982.
43. Kleinschnitz C, Schwab N, Kraft P, Hagedorn I, Dreykluft A, Schwarz T,Austinat M, Nieswandt B, Wiendl H, Stoll G. Early detrimental T-celleffects in experimental cerebral ischemia are neither related to adaptiveimmunity nor thrombus formation. Blood. 2010;115:3835–3842.
8 Stroke May 2011
by on March 25, 2011 stroke.ahajournals.orgDownloaded from