Heart Disease and Stroke Stat 2013 Updates
242
Subcommittee on behalf of the American Heart Association Statistics Committee and Stroke Statistics Virani, Nathan D. Wong, Daniel Woo and Melanie B. Turner Nina P. Paynter, Pamela J. Schreiner, Paul D. Sorlie, Joel Stein, Tanya N. Turan, Salim S. Darren K. McGuire, Emile R. Mohler, Claudia S. Moy, Michael E. Mussolino, Graham Nichol, Lynda D. Lisabeth, David Magid, Gregory M. Marcus, Ariane Marelli, David B. Matchar, Mark D. Huffman, Brett M. Kissela, Steven J. Kittner, Daniel T. Lackland, Judith H. Lichtman, Heather J. Fullerton, Cathleen Gillespie, Susan M. Hailpern, John A. Heit, Virginia J. Howard, Franco, William B. Borden, Dawn M. Bravata, Shifan Dai, Earl S. Ford, Caroline S. Fox, Sheila Alan S. Go, Dariush Mozaffarian, Véronique L. Roger, Emelia J. Benjamin, Jarett D. Berry, Association 2013 Update: A Report From the American Heart -- Heart Disease and Stroke Statistics Print ISSN: 0009-7322. Online ISSN: 1524-4539 Copyright © 2012 American Heart Association, Inc. All rights reserved. is published by the American Heart Association, 7272 Greenville Avenue, Dallas, TX 75231 Circulation doi: 10.1161/CIR.0b013e31828124ad 2013;127:e6-e245; originally published online December 12, 2012; Circulation. http://circ.ahajournals.org/content/127/1/e6 World Wide Web at: The online version of this article, along with updated information and services, is located on the http://circ.ahajournals.org/content/127/23/e841.full.pdf An erratum has been published regarding this article. Please see the attached page for: http://circ.ahajournals.org//subscriptions/ is online at: Circulation Information about subscribing to Subscriptions: http://www.lww.com/reprints Information about reprints can be found online at: Reprints: document. Permissions and Rights Question and Answer this process is available in the click Request Permissions in the middle column of the Web page under Services. Further information about Office. Once the online version of the published article for which permission is being requested is located, can be obtained via RightsLink, a service of the Copyright Clearance Center, not the Editorial Circulation in Requests for permissions to reproduce figures, tables, or portions of articles originally published Permissions: by guest on December 16, 2013 http://circ.ahajournals.org/ Downloaded from by guest on December 16, 2013 http://circ.ahajournals.org/ Downloaded from by guest on December 16, 2013 http://circ.ahajournals.org/ Downloaded from
-
Upload
independent -
Category
Documents
-
view
0 -
download
0
Transcript of Heart Disease and Stroke Stat 2013 Updates

Subcommitteeon behalf of the American Heart Association Statistics Committee and Stroke Statistics
Virani, Nathan D. Wong, Daniel Woo and Melanie B. TurnerNina P. Paynter, Pamela J. Schreiner, Paul D. Sorlie, Joel Stein, Tanya N. Turan, Salim S.
Darren K. McGuire, Emile R. Mohler, Claudia S. Moy, Michael E. Mussolino, Graham Nichol,Lynda D. Lisabeth, David Magid, Gregory M. Marcus, Ariane Marelli, David B. Matchar,
Mark D. Huffman, Brett M. Kissela, Steven J. Kittner, Daniel T. Lackland, Judith H. Lichtman,Heather J. Fullerton, Cathleen Gillespie, Susan M. Hailpern, John A. Heit, Virginia J. Howard,
Franco,William B. Borden, Dawn M. Bravata, Shifan Dai, Earl S. Ford, Caroline S. Fox, Sheila Alan S. Go, Dariush Mozaffarian, Véronique L. Roger, Emelia J. Benjamin, Jarett D. Berry,
Association2013 Update: A Report From the American Heart−−Heart Disease and Stroke Statistics
Print ISSN: 0009-7322. Online ISSN: 1524-4539 Copyright © 2012 American Heart Association, Inc. All rights reserved.
is published by the American Heart Association, 7272 Greenville Avenue, Dallas, TX 75231Circulation doi: 10.1161/CIR.0b013e31828124ad
2013;127:e6-e245; originally published online December 12, 2012;Circulation.
http://circ.ahajournals.org/content/127/1/e6World Wide Web at:
The online version of this article, along with updated information and services, is located on the
http://circ.ahajournals.org/content/127/23/e841.full.pdfAn erratum has been published regarding this article. Please see the attached page for:
http://circ.ahajournals.org//subscriptions/
is online at: Circulation Information about subscribing to Subscriptions:
http://www.lww.com/reprints Information about reprints can be found online at: Reprints:
document. Permissions and Rights Question and Answer this process is available in the
click Request Permissions in the middle column of the Web page under Services. Further information aboutOffice. Once the online version of the published article for which permission is being requested is located,
can be obtained via RightsLink, a service of the Copyright Clearance Center, not the EditorialCirculationin Requests for permissions to reproduce figures, tables, or portions of articles originally publishedPermissions:
by guest on December 16, 2013http://circ.ahajournals.org/Downloaded from by guest on December 16, 2013http://circ.ahajournals.org/Downloaded from by guest on December 16, 2013http://circ.ahajournals.org/Downloaded from
e6
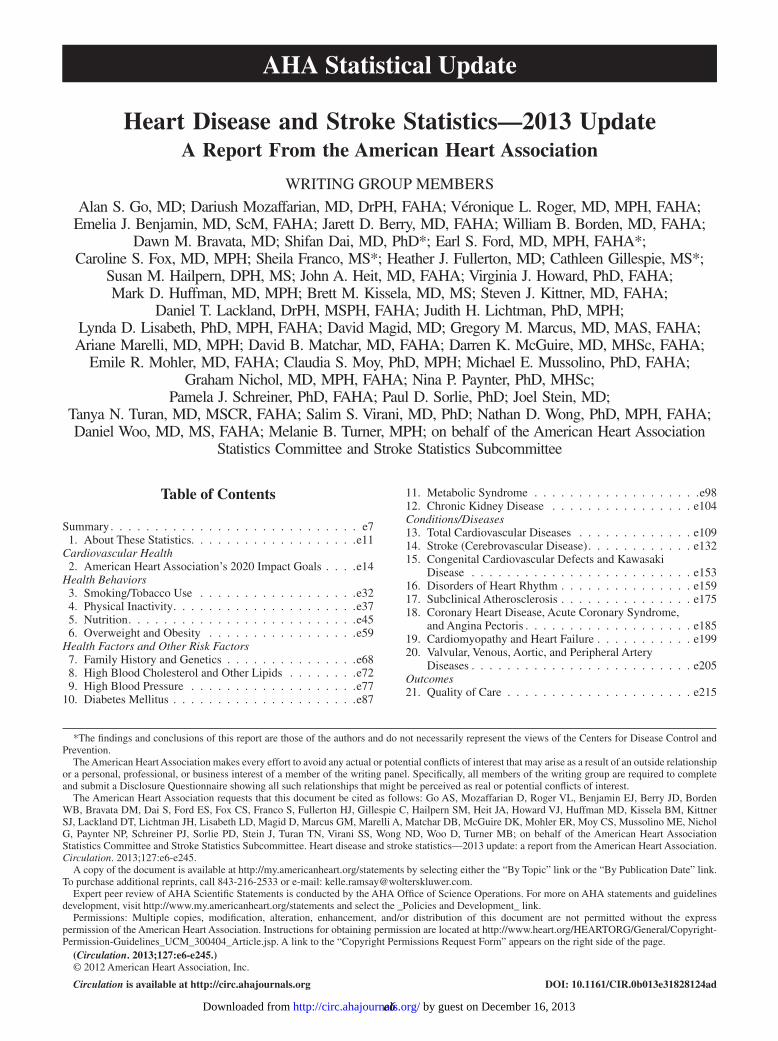
Table of Contents
Summary . . . . . . . . . . . . . . . . . . . . . . . . . . . . e7 1 . About These Statistics . . . . . . . . . . . . . . . . . . .e11Cardiovascular Health 2 . American Heart Association’s 2020 Impact Goals . . . .e14Health Behaviors 3 . Smoking/Tobacco Use . . . . . . . . . . . . . . . . . .e32 4 . Physical Inactivity . . . . . . . . . . . . . . . . . . . . .e37 5 . Nutrition . . . . . . . . . . . . . . . . . . . . . . . . . .e45 6 . Overweight and Obesity . . . . . . . . . . . . . . . . .e59Health Factors and Other Risk Factors 7 . Family History and Genetics . . . . . . . . . . . . . . .e68 8 . High Blood Cholesterol and Other Lipids . . . . . . . .e72 9 . High Blood Pressure . . . . . . . . . . . . . . . . . . .e77 10 . Diabetes Mellitus . . . . . . . . . . . . . . . . . . . . .e87
11 . Metabolic Syndrome . . . . . . . . . . . . . . . . . . .e98 12 . Chronic Kidney Disease . . . . . . . . . . . . . . . . e104Conditions/Diseases 13 . Total Cardiovascular Diseases . . . . . . . . . . . . . e109 14 . Stroke (Cerebrovascular Disease) . . . . . . . . . . . . e132 15 . Congenital Cardiovascular Defects and Kawasaki
Disease . . . . . . . . . . . . . . . . . . . . . . . . . e153 16 . Disorders of Heart Rhythm . . . . . . . . . . . . . . . e159 17 . Subclinical Atherosclerosis . . . . . . . . . . . . . . . e175 18 . Coronary Heart Disease, Acute Coronary Syndrome,
and Angina Pectoris . . . . . . . . . . . . . . . . . . . e185 19 . Cardiomyopathy and Heart Failure . . . . . . . . . . . e199 20 . Valvular, Venous, Aortic, and Peripheral Artery
Diseases . . . . . . . . . . . . . . . . . . . . . . . . . e205Outcomes 21 . Quality of Care . . . . . . . . . . . . . . . . . . . . . e215
(Circulation. 2013;127:e6-e245.)© 2012 American Heart Association, Inc .
Circulation is available at http://circ.ahajournals.org DOI: 10.1161/CIR.0b013e31828124ad
*The findings and conclusions of this report are those of the authors and do not necessarily represent the views of the Centers for Disease Control and Prevention .
The American Heart Association makes every effort to avoid any actual or potential conflicts of interest that may arise as a result of an outside relationship or a personal, professional, or business interest of a member of the writing panel . Specifically, all members of the writing group are required to complete and submit a Disclosure Questionnaire showing all such relationships that might be perceived as real or potential conflicts of interest .
The American Heart Association requests that this document be cited as follows: Go AS, Mozaffarian D, Roger VL, Benjamin EJ, Berry JD, Borden WB, Bravata DM, Dai S, Ford ES, Fox CS, Franco S, Fullerton HJ, Gillespie C, Hailpern SM, Heit JA, Howard VJ, Huffman MD, Kissela BM, Kittner SJ, Lackland DT, Lichtman JH, Lisabeth LD, Magid D, Marcus GM, Marelli A, Matchar DB, McGuire DK, Mohler ER, Moy CS, Mussolino ME, Nichol G, Paynter NP, Schreiner PJ, Sorlie PD, Stein J, Turan TN, Virani SS, Wong ND, Woo D, Turner MB; on behalf of the American Heart Association Statistics Committee and Stroke Statistics Subcommittee . Heart disease and stroke statistics—2013 update: a report from the American Heart Association . Circulation . 2013;127:e6-e245 .
A copy of the document is available at http://my .americanheart .org/statements by selecting either the “By Topic” link or the “By Publication Date” link . To purchase additional reprints, call 843-216-2533 or e-mail: kelle .ramsay@wolterskluwer .com .
Expert peer review of AHA Scientific Statements is conducted by the AHA Office of Science Operations . For more on AHA statements and guidelines development, visit http://www .my .americanheart .org/statements and select the _Policies and Development_ link .
Permissions: Multiple copies, modification, alteration, enhancement, and/or distribution of this document are not permitted without the express permission of the American Heart Association . Instructions for obtaining permission are located at http://www .heart .org/HEARTORG/General/Copyright-Permission-Guidelines_UCM_300404_Article .jsp . A link to the “Copyright Permissions Request Form” appears on the right side of the page .
AQ5
Heart Disease and Stroke Statistics—2013 UpdateA Report From the American Heart Association
WRITING GROUP MEMBERS
Alan S . Go, MD; Dariush Mozaffarian, MD, DrPH, FAHA; Véronique L . Roger, MD, MPH, FAHA; Emelia J . Benjamin, MD, ScM, FAHA; Jarett D . Berry, MD, FAHA; William B . Borden, MD, FAHA;
Dawn M . Bravata, MD; Shifan Dai, MD, PhD*; Earl S . Ford, MD, MPH, FAHA*; Caroline S . Fox, MD, MPH; Sheila Franco, MS*; Heather J . Fullerton, MD; Cathleen Gillespie, MS*;
Susan M . Hailpern, DPH, MS; John A . Heit, MD, FAHA; Virginia J . Howard, PhD, FAHA; Mark D . Huffman, MD, MPH; Brett M . Kissela, MD, MS; Steven J . Kittner, MD, FAHA;
Daniel T . Lackland, DrPH, MSPH, FAHA; Judith H . Lichtman, PhD, MPH; Lynda D . Lisabeth, PhD, MPH, FAHA; David Magid, MD; Gregory M . Marcus, MD, MAS, FAHA; Ariane Marelli, MD, MPH; David B . Matchar, MD, FAHA; Darren K . McGuire, MD, MHSc, FAHA;
Emile R . Mohler, MD, FAHA; Claudia S . Moy, PhD, MPH; Michael E . Mussolino, PhD, FAHA; Graham Nichol, MD, MPH, FAHA; Nina P . Paynter, PhD, MHSc;
Pamela J . Schreiner, PhD, FAHA; Paul D . Sorlie, PhD; Joel Stein, MD; Tanya N . Turan, MD, MSCR, FAHA; Salim S . Virani, MD, PhD; Nathan D . Wong, PhD, MPH, FAHA; Daniel Woo, MD, MS, FAHA; Melanie B . Turner, MPH; on behalf of the American Heart Association
Statistics Committee and Stroke Statistics Subcommittee
AHA Statistical Update
by guest on December 16, 2013http://circ.ahajournals.org/Downloaded from

Heart Disease and Stroke Statistics—2013 Update: Summary e7
22 . Medical Procedures . . . . . . . . . . . . . . . . . . . e229 23 . Economic Cost of Cardiovascular Disease . . . . . . . e234Supplemental Materials 24 . At-a-Glance Summary Tables . . . . . . . . . . . . . . e238 25 . Glossary . . . . . . . . . . . . . . . . . . . . . . . . . e243
SummaryEach year, the American Heart Association (AHA), in con-junction with the Centers for Disease Control and Preven-tion, the National Institutes of Health, and other government agencies, brings together the most up-to-date statistics on heart disease, stroke, other vascular diseases, and their risk factors and presents them in its Heart Disease and Stroke Sta-tistical Update . The Statistical Update is a valuable resource for researchers, clinicians, healthcare policy makers, media professionals, the lay public, and many others who seek the best national data available on heart disease, stroke, and other cardiovascular disease–related morbidity and mortality and the risks, quality of care, medical procedures and operations, and costs associated with the management of these diseases in a single document . Indeed, since 1999, the Statistical Update has been cited >10 500 times in the literature, based on citations of all annual versions . In 2011 alone, the vari-ous Statistical Updates were cited ≈1500 times (data from ISI Web of Science) . In recent years, the Statistical Update has undergone some major changes with the addition of new chapters and major updates across multiple areas, as well as increasing the number of ways to access and use the informa-tion assembled .
For this year’s edition, the Statistics Committee, which pro-duces the document for the AHA, updated all of the current chapters with the most recent nationally representative data and inclusion of relevant articles from the literature over the past year . This year’s edition also implements a new chapter organization to reflect the spectrum of cardiovascular health behaviors and health factors and risks, as well as subsequent complicating conditions, disease states, and outcomes . Also, the 2013 Statistical Update contains new data on the monitoring and benefits of cardiovas-cular health in the population, with additional new focus on evi-dence-based approaches to changing behaviors, implementation strategies, and implications of the AHA’s 2020 Impact Goals . Below are a few highlights from this year’s Update .
The 2013 Update Expands Data Coverage of the Epidemic of Poor Cardiovascular Health Behaviors and Their Antecedents and Consequences
●● Adjusted population attributable fractions for cardiovascular disease (CVD) mortality were as follows1: 40 .6% (95% confi-dence interval [CI], 24 .5–54 .6) for high blood pressure; 13 .7% (95% CI, 4 .8–22 .3) for smoking; 13 .2% (95% CI, 3 .5–29 .2) for poor diet; 11 .9% (95% CI, 1 .3–22 .3) for insufficient physi-cal activity; and 8 .8% (95% CI, 2 .1–15 .4) for abnormal glu-cose levels .
●● Despite 4 decades of progress, in 2011, among Americans ≥18 years of age, 21 .3% of men and 16 .7% of women con-tinued to be cigarette smokers . In 2011, 18 .1% of students in grades 9 through 12 reported current cigarette use .
●● The percentage of the nonsmoking population with detect-able serum cotinine (indicating exposure to secondhand
smoke) declined from 52 .5% in 1999 to 2000 to 40 .1% in 2007 to 2008, with declines higher for those 3 to 11 years of age (–53 .6%) and those 12 to 19 years of age (–46 .5%) than for those 20 years of age and older (–36 .7%) .
●● The proportion of youth (≤18 years of age) who report engag-ing in no regular physical activity is high, and the proportion increases with age . In 2011, among adolescents in grades 9 through 12, 17 .7% of girls and 10 .0% of boys reported that they had not engaged in ≥60 minutes of moderate-to-vigor-ous physical activity, defined as any activity that increased heart rate or breathing rate, even once in the previous 7 days, despite recommendations that children engage in such activity 7 days per week .
●● Thirty two percent of adults reported engaging in no aero-bic leisure-time physical activity .
●● Data from the National Health and Nutrition Examination Survey (NHANES) indicate that between 1971 and 2004, average total energy consumption among US adults increased by 22% in women (from 1542 to 1886 kcal/d) and by 10% in men (from 2450 to 2693 kcal/d) .
●● The increases in calories consumed during this time period are attributable primarily to greater average carbohydrate intake, in particular, of starches, refined grains, and sugars . Other spe-cific changes related to increased caloric intake in the United States include larger portion sizes, greater food quantity and calories per meal, and increased consumption of sugar-sweet-ened beverages, snacks, commercially prepared (especially fast food) meals, and higher energy-density foods .
●● The estimated prevalence of overweight and obesity in US adults (≥20 years of age) is 154 .7 million, which represents 68 .2% of this group in 2010 . Fully 34 .6% of US adults are obese (body mass index ≥30 kg/m2) . Men and women of all race/ethnic groups in the population are affected by the epi-demic of overweight and obesity .
●● Among children 2 to 19 years of age, 31 .8% are over-weight and obese (which represents 23 .9 million children) and 16 .9% are obese (12 .7 million children) . Mexican American boys and girls and African American girls are disproportionately affected . Over the past 3 decades, the prevalence of obesity in children 6 to 11 years of age has increased from ≈4% to >20% .
●● Obesity (body mass index ≥30 kg/m2) is associated with marked excess mortality in the US population . Even more notable is the excess morbidity associated with overweight and obesity in terms of risk factor development and incidence of diabetes mellitus, CVD end points (including coronary heart disease, stroke, and heart failure), and numerous other health conditions, including asthma, cancer, end-stage renal disease, degenerative joint disease, and many others .
Prevalence and Control of Cardiovascular Health Factors and Risks Remains an Issue for Many Americans
●● An estimated 31 .9 million adults ≥20 years of age have total serum cholesterol levels ≥240 mg/dL, with a preva-lence of 13 .8% .
by guest on December 16, 2013http://circ.ahajournals.org/Downloaded from
e8 Circulation January 1/8, 2013
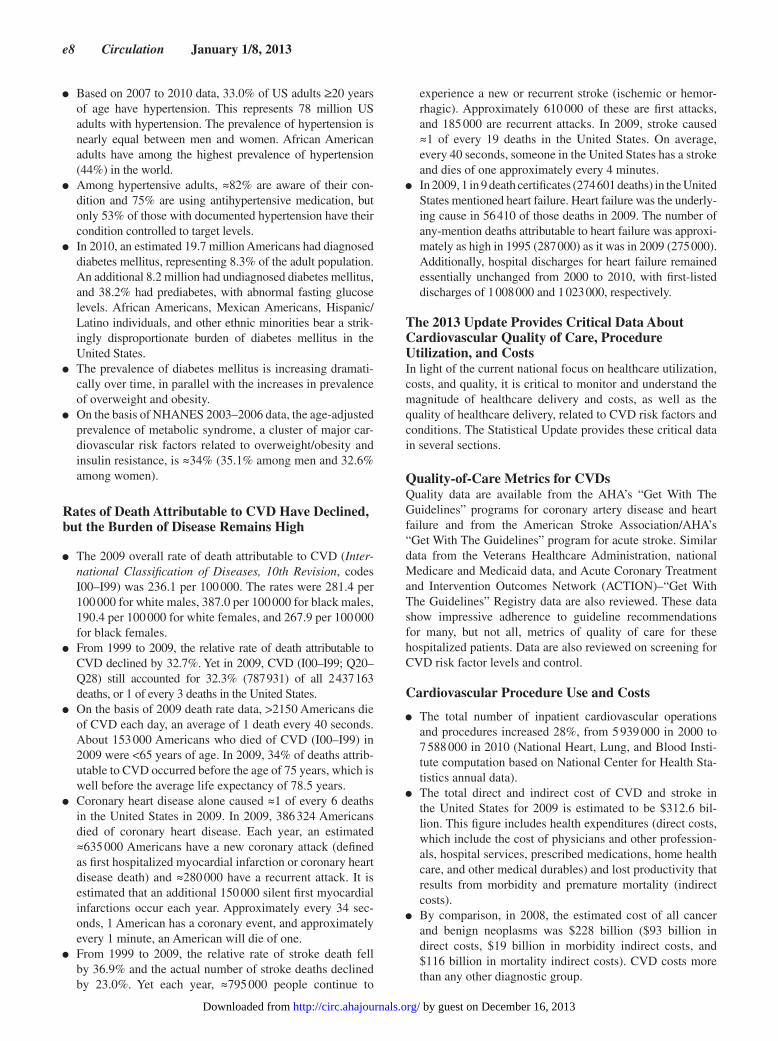
●● Based on 2007 to 2010 data, 33 .0% of US adults ≥20 years of age have hypertension . This represents 78 million US adults with hypertension . The prevalence of hypertension is nearly equal between men and women . African American adults have among the highest prevalence of hypertension (44%) in the world .
●● Among hypertensive adults, ≈82% are aware of their con-dition and 75% are using antihypertensive medication, but only 53% of those with documented hypertension have their condition controlled to target levels .
●● In 2010, an estimated 19 .7 million Americans had diagnosed diabetes mellitus, representing 8 .3% of the adult population . An additional 8 .2 million had undiagnosed diabetes mellitus, and 38 .2% had prediabetes, with abnormal fasting glucose levels . African Americans, Mexican Americans, Hispanic/Latino individuals, and other ethnic minorities bear a strik-ingly disproportionate burden of diabetes mellitus in the United States .
●● The prevalence of diabetes mellitus is increasing dramati-cally over time, in parallel with the increases in prevalence of overweight and obesity .
●● On the basis of NHANES 2003–2006 data, the age-adjusted prevalence of metabolic syndrome, a cluster of major car-diovascular risk factors related to overweight/obesity and insulin resistance, is ≈34% (35 .1% among men and 32 .6% among women) .
Rates of Death Attributable to CVD Have Declined, but the Burden of Disease Remains High
●● The 2009 overall rate of death attributable to CVD (Inter-national Classification of Diseases, 10th Revision, codes I00–I99) was 236 .1 per 100 000 . The rates were 281 .4 per 100 000 for white males, 387 .0 per 100 000 for black males, 190 .4 per 100 000 for white females, and 267 .9 per 100 000 for black females .
●● From 1999 to 2009, the relative rate of death attributable to CVD declined by 32 .7% . Yet in 2009, CVD (I00–I99; Q20–Q28) still accounted for 32 .3% (787 931) of all 2 437 163 deaths, or 1 of every 3 deaths in the United States .
●● On the basis of 2009 death rate data, >2150 Americans die of CVD each day, an average of 1 death every 40 seconds . About 153 000 Americans who died of CVD (I00–I99) in 2009 were <65 years of age . In 2009, 34% of deaths attrib-utable to CVD occurred before the age of 75 years, which is well before the average life expectancy of 78 .5 years .
●● Coronary heart disease alone caused ≈1 of every 6 deaths in the United States in 2009 . In 2009, 386 324 Americans died of coronary heart disease . Each year, an estimated ≈635 000 Americans have a new coronary attack (defined as first hospitalized myocardial infarction or coronary heart disease death) and ≈280 000 have a recurrent attack . It is estimated that an additional 150 000 silent first myocardial infarctions occur each year . Approximately every 34 sec-onds, 1 American has a coronary event, and approximately every 1 minute, an American will die of one .
●● From 1999 to 2009, the relative rate of stroke death fell by 36 .9% and the actual number of stroke deaths declined by 23 .0% . Yet each year, ≈795 000 people continue to
experience a new or recurrent stroke (ischemic or hemor-rhagic) . Approximately 610 000 of these are first attacks, and 185 000 are recurrent attacks . In 2009, stroke caused ≈1 of every 19 deaths in the United States . On average, every 40 seconds, someone in the United States has a stroke and dies of one approximately every 4 minutes .
●● In 2009, 1 in 9 death certificates (274 601 deaths) in the United States mentioned heart failure . Heart failure was the underly-ing cause in 56 410 of those deaths in 2009 . The number of any-mention deaths attributable to heart failure was approxi-mately as high in 1995 (287 000) as it was in 2009 (275 000) . Additionally, hospital discharges for heart failure remained essentially unchanged from 2000 to 2010, with first-listed discharges of 1 008 000 and 1 023 000, respectively .
The 2013 Update Provides Critical Data About Cardiovascular Quality of Care, Procedure Utilization, and CostsIn light of the current national focus on healthcare utilization, costs, and quality, it is critical to monitor and understand the magnitude of healthcare delivery and costs, as well as the quality of healthcare delivery, related to CVD risk factors and conditions . The Statistical Update provides these critical data in several sections .
Quality-of-Care Metrics for CVDsQuality data are available from the AHA’s “Get With The Guidelines” programs for coronary artery disease and heart failure and from the American Stroke Association/AHA’s “Get With The Guidelines” program for acute stroke . Similar data from the Veterans Healthcare Administration, national Medicare and Medicaid data, and Acute Coronary Treatment and Intervention Outcomes Network (ACTION)–“Get With The Guidelines” Registry data are also reviewed . These data show impressive adherence to guideline recommendations for many, but not all, metrics of quality of care for these hospitalized patients . Data are also reviewed on screening for CVD risk factor levels and control .
Cardiovascular Procedure Use and Costs
●● The total number of inpatient cardiovascular operations and procedures increased 28%, from 5 939 000 in 2000 to 7 588 000 in 2010 (National Heart, Lung, and Blood Insti-tute computation based on National Center for Health Sta-tistics annual data) .
●● The total direct and indirect cost of CVD and stroke in the United States for 2009 is estimated to be $312 .6 bil-lion . This figure includes health expenditures (direct costs, which include the cost of physicians and other profession-als, hospital services, prescribed medications, home health care, and other medical durables) and lost productivity that results from morbidity and premature mortality (indirect costs) .
●● By comparison, in 2008, the estimated cost of all cancer and benign neoplasms was $228 billion ($93 billion in direct costs, $19 billion in morbidity indirect costs, and $116 billion in mortality indirect costs) . CVD costs more than any other diagnostic group .
by guest on December 16, 2013http://circ.ahajournals.org/Downloaded from
Heart Disease and Stroke Statistics—2013 Update: Summary e9
The AHA, through its Statistics Committee, continuously monitors and evaluates sources of data on heart disease and stroke in the United States to provide the most current data available in the Statistics Update .
Finally, it must be noted that this annual Statistical Update is the product of an entire year’s worth of effort by dedicated professionals, volunteer physicians and scientists, and out-standing AHA staff members, without whom publication of this valuable resource would be impossible . Their contribu-tions are gratefully acknowledged .
Alan S. Go, MDMelanie B. Turner, MPHOn behalf of the American Heart Association Statistics Committee and Stroke Statistics Subcommittee
Note: Population data used in the compilation of NHANES prevalence estimates are for the latest year of the NHANES survey being used . Extrapolations for NHANES prevalence
estimates are based on the census resident population for 2010 because this is the most recent year of NHANES data used in the Statistical Update .
AcknowledgmentsWe wish to thank Lucy Hsu, Michael Wolz, Sean Coady, and Laurie Whitsel for their valuable comments and contributions . We would like to acknowledge Karen Modesitt and Lauren Rowell for their administrative assistance .
Reference 1 . Yang Q, Cogswell ME, Flanders WD, Hong Y, Zhang Z, Loustalot F,
Gillespie C, Merritt R, Hu FB . Trends in cardiovascular health metrics and associations with all-cause and CVD mortality among US adults . JAMA . 2012;307:1273–1283 .
Key Words: AHA Scientific Statements ■ cardiovascular diseases ■ epidemiology ■ risk factors ■ statistics ■ stroke
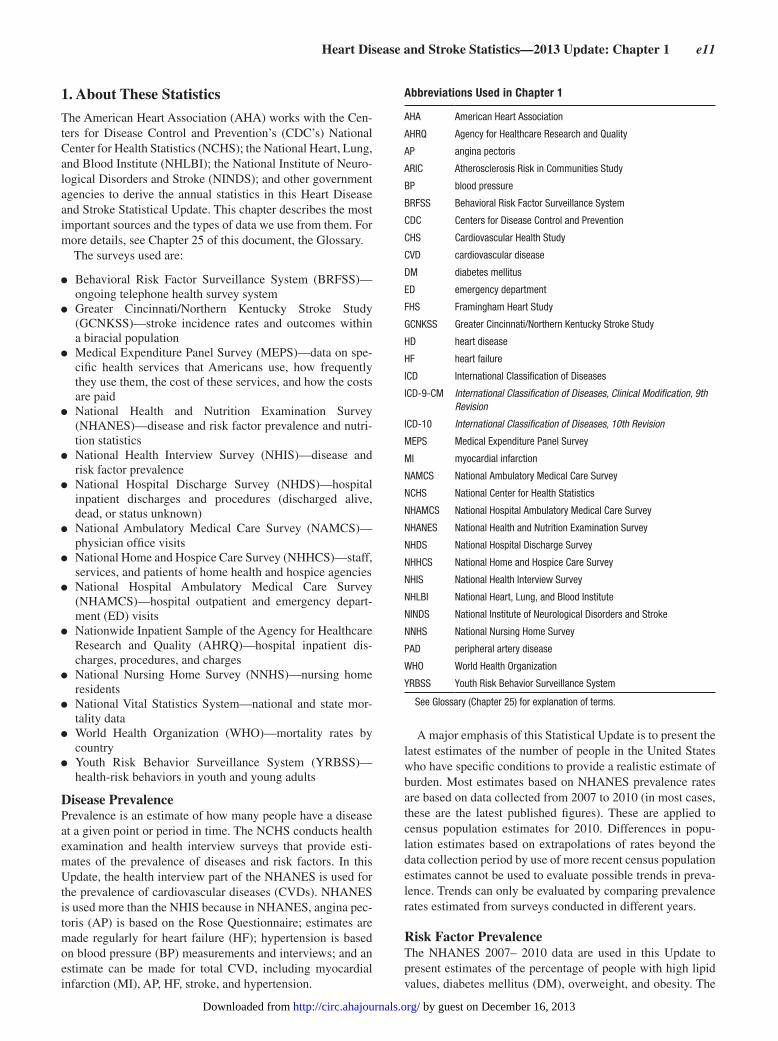
DisclosuresWriting Group Disclosures
Writing Group Member Employment Research Grant
Other Research Support
Speakers’ Bureau/Honoraria Expert Witness Ownership Interest
Consultant/ Advisory Board Other
Alan S. Go Kaiser Permanente None None None None None None None
Emelia J. Benjamin Boston University School of Medicine
NIH† None None None None None Associate Editor of
Circulation
Jarett D. Berry UT Southwestern AHA†; NIH† None Merck† None None None None
William B. Borden Weill Cornell Medical College/U.S. Department of Health
and Human Services
None None None None None None None
Dawn M. Bravata Department of Veteran Affairs NIH/NHLBI† None None None None None None
Shifan Dai Centers for Disease Control and Prevention
None None None None None None None
Earl S. Ford Centers for Disease Control and Prevention
None None None None None None None
Caroline S. Fox National Heart Lung and Blood Institute
None None None None None None None
Sheila Franco Centers for Disease Control and Prevention/National
Center for Health Statistics
None None None None None None None
Heather J. Fullerton University of California, San Francisco
None None None None None None None
Cathleen Gillespie Centers for Disease Control and Prevention
None None None None None None None
Susan M. Hailpern Independent Consultant None None None None None None None
John A. Heit Mayo Clinic None None None None None Daiichi Sankyo*; GTC Biotherapeutics*;
Janssen Pharmaceuticals*
None
Virginia J. Howard University of Alabama at Birmingham
NIH† None None None None None None
Mark D. Huffman Northwestern University Feinberg School of Medicine
NIH/NHLBI†; Scientific Therapeutic Information*
None None None None None None
Brett M. Kissela University of Cincinnati None None None None None None None
Steven J. Kittner University of Maryland School of Medicine
None None None None None None None
Daniel T. Lackland Medical University of South Carolina
None None None None None None None
Judith H. Lichtman Yale University None None None None None None None
Lynda D. Lisabeth University of Michigan NHLBI; NINDS† None None None None None None
David Magid Colorado Permanente Medical Group
None None None None None None None
(Continued)
by guest on December 16, 2013http://circ.ahajournals.org/Downloaded from

e10 Circulation January 1/8, 2013
Writing Group Disclosures, Continued
Writing Group Member Employment Research Grant
Other Research Support
Speakers’ Bureau/Honoraria Expert Witness Ownership Interest
Consultant/ Advisory Board Other
Gregory M. Marcus University of California, San Francisco
Forest Research Institute*; Gilead*; Medtronic*; SentreHeart†; Zoll*
None St. Jude Medical* None None None None
Ariane Marelli McGill University Health Center
None None None None None None None
David B. Matchar Duke University Medical Center/Duke-NUS Graduate
Medical School
None None None None None AstraZeneca*; Boehringer Ingelheim*
None
Darren K. McGuire UT Southwestern Medical Center
Boehringer Ingelheim*; Bristol-Meyers Squibb*;
Daiichi Sankyo*; Eli Lilly*; Merck*; Orexigen†; Roche/
Genentech*; Takeda*
None None Expert Witness for Takeda in class action
suit for Actos*
None Boehringer Ingelheim*; Daiichi Sankyo*;
Genentech*; Janssen Pharmaceuticals†;
Regeneron Pharmaceuticals*;
Sanofi-Aventis*
None
Emile R. Mohler III University of Pennsylvania AHA†; Department of Defense†; NIH†
None None CytoVas*; FloxiMedical* GlaxoSmithKline*; Merck*; Roche*; Takeda*
None None
Claudia S. Moy National Institutes of Health None None None None None None None
Dariush L. Mozaffarian Harvard School of Public Health/Brigham and Women’s
Hospital/Harvard Medical School
NIH†; GlaxoSmithKline†; Pronova†; Sigma Tau†
None Bunge*; International Life
Sciences Institute*; Nutrition Impact*; Pollock Institute*;
Sprim*
None Harvard has filed a provisional patent
application that has been assigned to Harvard,
listing Dr. Mozaffarian as a co-inventor for use of trans-palmitoleic acid
to prevent and treat insulin resistance, type 2 diabetes and related conditions*; Royalties from UpToDate for an
online chapter*
Foodminds*; McKinsey Health Systems
Institute*; Unilever North America*
None
Michael E. Mussolino National Heart, Lung, and Blood Institute
None None None None None None None
Graham Nichol University of Washington None None None None None None None
Nina P. Paynter Brigham and Women’s Hospital
Celera Corp.†; NHLBI†; NIH/NCRR†
None None None None None None
Veronique L. Roger Mayo Clinic None None None None None None None
Pamela J. Schreiner University of Minnesota None None None None None None None
Paul D. Sorlie National Heart, Lung, and Blood Institute, NIH
None None None None None None None
Joel Stein Columbia University Myomo, Inc.*; Tibion, Inc.*; Tyromotion, Inc.*
None QuantiaMF* None None Myomo, Inc.* None
Tanya N. Turan Medical University of South Carolina
NIH/NINDS† None None None None None None
Melanie B. Turner American Heart Association None None None None None None None
Salim S. Virani Department of Veterans Affairs
Merck†; NFL Charities†; NIH†; VA†
None None None None None None
Nathan D. Wong University of California, Irvine Bristol-Myers Squibb†; Merck†
None None None None Abbott Pharmaceuticals*
None
Daniel Woo University of Cincinnati NIH† None None None None None None
This table represents the relationships of writing group members that may be perceived as actual or reasonably perceived conflicts of interest as reported on the Disclosure Questionnaire, which all members of the writing group are required to complete and submit. A relationship is considered to be “significant” if (a) the person receives $10 000 or more during any 12-month period, or 5% or more of the person’s gross income; or (b) the person owns 5% or more of the voting stock or share of the entity, or owns $10 000 or more of the fair market value of the entity. A relationship is considered to be “modest” if it is less than “significant” under the preceding definition.
*Modest.†Significant.
by guest on December 16, 2013http://circ.ahajournals.org/Downloaded from
Heart Disease and Stroke Statistics—2013 Update: Chapter 1 e11
1. About These Statistics
The American Heart Association (AHA) works with the Cen-ters for Disease Control and Prevention’s (CDC’s) National Center for Health Statistics (NCHS); the National Heart, Lung, and Blood Institute (NHLBI); the National Institute of Neuro-logical Disorders and Stroke (NINDS); and other government agencies to derive the annual statistics in this Heart Disease and Stroke Statistical Update . This chapter describes the most important sources and the types of data we use from them . For more details, see Chapter 25 of this document, the Glossary .
The surveys used are:
●● Behavioral Risk Factor Surveillance System (BRFSS)—ongoing telephone health survey system
●● Greater Cincinnati/Northern Kentucky Stroke Study (GCNKSS)—stroke incidence rates and outcomes within a biracial population
●● Medical Expenditure Panel Survey (MEPS)—data on spe-cific health services that Americans use, how frequently they use them, the cost of these services, and how the costs are paid
●● National Health and Nutrition Examination Survey (NHANES)—disease and risk factor prevalence and nutri-tion statistics
●● National Health Interview Survey (NHIS)—disease and risk factor prevalence
●● National Hospital Discharge Survey (NHDS)—hospital inpatient discharges and procedures (discharged alive, dead, or status unknown)
●● National Ambulatory Medical Care Survey (NAMCS)—physician office visits
●● National Home and Hospice Care Survey (NHHCS)—staff, services, and patients of home health and hospice agencies
●● National Hospital Ambulatory Medical Care Survey (NHAMCS)—hospital outpatient and emergency depart-ment (ED) visits
●● Nationwide Inpatient Sample of the Agency for Healthcare Research and Quality (AHRQ)—hospital inpatient dis-charges, procedures, and charges
●● National Nursing Home Survey (NNHS)—nursing home residents
●● National Vital Statistics System—national and state mor-tality data
●● World Health Organization (WHO)—mortality rates by country
●● Youth Risk Behavior Surveillance System (YRBSS)—health-risk behaviors in youth and young adults
Disease PrevalencePrevalence is an estimate of how many people have a disease at a given point or period in time . The NCHS conducts health examination and health interview surveys that provide esti-mates of the prevalence of diseases and risk factors . In this Update, the health interview part of the NHANES is used for the prevalence of cardiovascular diseases (CVDs) . NHANES is used more than the NHIS because in NHANES, angina pec-toris (AP) is based on the Rose Questionnaire; estimates are made regularly for heart failure (HF); hypertension is based on blood pressure (BP) measurements and interviews; and an estimate can be made for total CVD, including myocardial infarction (MI), AP, HF, stroke, and hypertension .
A major emphasis of this Statistical Update is to present the latest estimates of the number of people in the United States who have specific conditions to provide a realistic estimate of burden . Most estimates based on NHANES prevalence rates are based on data collected from 2007 to 2010 (in most cases, these are the latest published figures) . These are applied to census population estimates for 2010 . Differences in popu-lation estimates based on extrapolations of rates beyond the data collection period by use of more recent census population estimates cannot be used to evaluate possible trends in preva-lence . Trends can only be evaluated by comparing prevalence rates estimated from surveys conducted in different years .
Risk Factor PrevalenceThe NHANES 2007– 2010 data are used in this Update to present estimates of the percentage of people with high lipid values, diabetes mellitus (DM), overweight, and obesity . The
Abbreviations Used in Chapter 1
AHA American Heart Association
AHRQ Agency for Healthcare Research and Quality
AP angina pectoris
ARIC Atherosclerosis Risk in Communities Study
BP blood pressure
BRFSS Behavioral Risk Factor Surveillance System
CDC Centers for Disease Control and Prevention
CHS Cardiovascular Health Study
CVD cardiovascular disease
DM diabetes mellitus
ED emergency department
FHS Framingham Heart Study
GCNKSS Greater Cincinnati/Northern Kentucky Stroke Study
HD heart disease
HF heart failure
ICD International Classification of Diseases
ICD-9-CM International Classification of Diseases, Clinical Modification, 9th Revision
ICD-10 International Classification of Diseases, 10th Revision
MEPS Medical Expenditure Panel Survey
MI myocardial infarction
NAMCS National Ambulatory Medical Care Survey
NCHS National Center for Health Statistics
NHAMCS National Hospital Ambulatory Medical Care Survey
NHANES National Health and Nutrition Examination Survey
NHDS National Hospital Discharge Survey
NHHCS National Home and Hospice Care Survey
NHIS National Health Interview Survey
NHLBI National Heart, Lung, and Blood Institute
NINDS National Institute of Neurological Disorders and Stroke
NNHS National Nursing Home Survey
PAD peripheral artery disease
WHO World Health Organization
YRBSS Youth Risk Behavior Surveillance System
See Glossary (Chapter 25) for explanation of terms.
by guest on December 16, 2013http://circ.ahajournals.org/Downloaded from

e12 Circulation January 1/8, 2013
NHIS is used for the prevalence of cigarette smoking and physical inactivity . Data for students in grades 9 through 12 are obtained from the YRBSS .
Incidence and Recurrent AttacksAn incidence rate refers to the number of new cases of a disease that develop in a population per unit of time . The unit of time for incidence is not necessarily 1 year, although we often discuss incidence in terms of 1 year . For some statistics, new and recurrent attacks or cases are combined . Our national incidence estimates for the various types of CVD are extrapolations to the US population from the Framingham Heart Study (FHS), the Atherosclerosis Risk in Communities (ARIC) study, and the Cardiovascular Health Study (CHS), all conducted by the NHLBI, as well as the GCNKSS, which is funded by the NINDS . The rates change only when new data are available; they are not computed annually . Do not compare the incidence or the rates with those in past editions of the Heart Disease and Stroke Statistics Update (also known as the Heart and Stroke Statistical Update for editions before 2005) . Doing so can lead to serious misinterpretation of time trends .
MortalityMortality data are presented according to the underlying cause of death . “Any-mention” mortality means that the condition was nominally selected as the underlying cause or was oth-erwise mentioned on the death certificate . For many deaths classified as attributable to CVD, selection of the single most likely underlying cause can be difficult when several major comorbidities are present, as is often the case in the elderly population . It is useful, therefore, to know the extent of mor-tality attributable to a given cause regardless of whether it is the underlying cause or a contributing cause (ie, its “any-men-tion” status) . The number of deaths in 2009 with any mention of specific causes of death was tabulated by the NHLBI from the NCHS public-use electronic files on mortality .
The first set of statistics for each disease in this Update includes the number of deaths for which the disease is the underlying cause . Two exceptions are Chapter 9 (High Blood Pressure) and Chapter 19 (Cardiomyopathy and Heart Failure) . High BP, or hypertension, increases the mortality risks of CVD and other diseases, and HF should be selected as an underlying cause only when the true underlying cause is not known . In this Update, hypertension and HF death rates are presented in 2 ways: (1) As nominally classified as the underlying cause and (2) as any-mention mortality .
National and state mortality data presented according to the underlying cause of death were computed from the mortality tables of the NCHS World Wide Web site, the Health Data Interactive data system of the NCHS, or the CDC compressed mortality file . Any-mention numbers of deaths were tabulated from the electronic mortality files of the NCHS World Wide Web site and from Health Data Interactive .
Population EstimatesIn this publication, we have used national population esti-mates from the US Census Bureau for 2010 in the computa-tion of morbidity data . NCHS population estimates for 2009 were used in the computation of death rate data . The Census
Bureau World Wide Web site1 contains these data, as well as information on the file layout .
Hospital Discharges and Ambulatory Care VisitsEstimates of the numbers of hospital discharges and numbers of procedures performed are for inpatients discharged from short-stay hospitals . Discharges include those discharged alive, dead, or with unknown status . Unless otherwise speci-fied, discharges are listed according to the first-listed (primary) diagnosis, and procedures are listed according to all listed pro-cedures (primary plus secondary) . These estimates are from the NHDS of the NCHS unless otherwise noted . Ambulatory care visit data include patient visits to physician offices and hospital outpatient departments and EDs . Ambulatory care visit data reflect the first-listed (primary) diagnosis . These estimates are from NAMCS and NHAMCS of the NCHS .
International Classification of DiseasesMorbidity (illness) and mortality (death) data in the United States have a standard classification system: the International Classification of Diseases (ICD) . Approximately every 10 to 20 years, the ICD codes are revised to reflect changes over time in medical technology, diagnosis, or terminology . Where necessary for comparability of mortality trends across the 9th and 10th ICD revisions, comparability ratios computed by the NCHS are applied as noted .2 Effective with mortality data for 1999, we are using the 10th revision (ICD-10) . It will be a few more years before the 10th revision is used for hospital dis-charge data and ambulatory care visit data, which are based on the International Classification of Diseases, Clinical Modifi-cation, 9th Revision (ICD-9-CM) .3
Age AdjustmentPrevalence and mortality estimates for the United States or individual states comparing demographic groups or estimates over time either are age specific or are age adjusted to the 2000 standard population by the direct method .4 International mortality data are age adjusted to the European standard .5 Unless otherwise stated, all death rates in this publication are age adjusted and are deaths per 100 000 population .
Data Years for National EstimatesIn this Update, we estimate the annual number of new (inci-dence) and recurrent cases of a disease in the United States by extrapolating to the US population in 2010 from rates reported in a community- or hospital-based study or multiple studies . Age-adjusted incidence rates by sex and race are also given in this report as observed in the study or studies . For US mortality, most numbers and rates are for 2009 . For disease and risk fac-tor prevalence, most rates in this report are calculated from the 2007–2010 NHANES . Because NHANES is conducted only in the noninstitutionalized population, we extrapolated the rates to the total US population in 2008, recognizing that this prob-ably underestimates the total prevalence, given the relatively high prevalence in the institutionalized population . The num-bers and rates of hospital inpatient discharges for the United States are for 2010 . Numbers of visits to physician offices, hos-pital EDs, and hospital outpatient departments are for 2010 . Except as noted, economic cost estimates are for 2009 .
by guest on December 16, 2013http://circ.ahajournals.org/Downloaded from

Heart Disease and Stroke Statistics—2013 Update: Chapter 1 e13
Cardiovascular DiseaseFor data on hospitalizations, physician office visits, and mortality, CVD is defined according to ICD codes given in Chapter 25 of the present document . This definition includes all diseases of the circulatory system, as well as congenital CVD . Unless so specified, an estimate for total CVD does not include congenital CVD . Prevalence of CVD includes peo-ple with hypertension, heart disease (HD), stroke, peripheral artery disease (PAD), and diseases of the veins .
RaceData published by governmental agencies for some racial groups are considered unreliable because of the small sample size in the studies . Because we try to provide data for as many racial groups as possible, we show these data for informa-tional and comparative purposes .
ContactsIf you have questions about statistics or any points made in this Update, please contact the AHA National Center, Office of Science & Medicine at statistics@heart .org . Direct all
media inquiries to News Media Relations at inquiries@heart .org or 214-706-1173 .
We do our utmost to ensure that this Update is error free . If we discover errors after publication, we will provide correc-tions at our World Wide Web site, http://www .heart .org/statistics, and in the journal Circulation .
References 1 . US Census Bureau population estimates . http://www .census .gov/popest/
data/historical/2000s/index .html . Accessed October 29, 2012 . 2 . National Center for Health Statistics . Health, United States, 2009, With
Special Feature on Medical Technology. Hyattsville, MD: National Center for Health Statistics; 2010 . http://www .cdc .gov/nchs/data/hus/hus09 .pdf . Accessed October 29, 2012 .
3 . National Center for Health Statistics, Centers for Medicare and Medic-aid Services. ICD-9-CM Official Guidelines for Coding and Reporting, 2011 . http://www .cdc .gov/nchs/data/icd9/icd9cm_guidelines_2011 .pdf . Accessed October 29, 2012 .
4 . Anderson RN, Rosenberg HM . Age standardization of death rates: im-plementation of the year 2000 standard . Natl Vital Stat Rep . 1998;47: 1–16, 20 .
5 . World Health Organization . World Health Statistics Annual . Geneva, Switzerland: World Health Organization; 1998 .
by guest on December 16, 2013http://circ.ahajournals.org/Downloaded from

e14 Circulation January 1/8, 2013
2. American Heart Association’s 2020 Impact Goals
See Tables 2-1 through 2-8 and Charts 2-1 through 2-12.
After achieving its major Impact Goals for 2010, the AHA created a new set of Impact Goals for the current decade .1 Specifically, the AHA committed to the following central organizational goals:
By 2020, to improve the cardiovascular health of all Americans by 20%, while reducing deaths from CVDs and stroke by 20%.1
These goals introduce a new concept, cardiovascular health, which is characterized by 7 health metrics . Ideal cardiovas-cular health is defined by the absence of clinically manifest CVD together with the simultaneous presence of optimal lev-els of all 7 metrics, including 4 health behaviors (not smoking and having sufficient physical activity [PA], a healthy diet pat-tern, and appropriate energy balance as represented by normal body weight) and 3 health factors (optimal total cholesterol, BP, and fasting blood glucose, in the absence of drug treat-ment; Table 2-1) . Because a spectrum of cardiovascular health can also be envisioned and the ideal cardiovascular health profile is known to be rare in the US population, a broader spectrum of cardiovascular health can also be represented as being “ideal,” “intermediate,” or “poor” for each of the health behaviors and health factors .1 Table 2-1 provides the specific definitions for ideal, intermediate, and poor cardiovascular health for each of the 7 metrics, both for adults (≥20 years of age) and for children (age ranges for each metric depending on data availability) .
This concept of cardiovascular health represents a new focus for the AHA . Three novel emphases are central to the AHA 2020 Impact Goals:
●● An expanded focus on CVD prevention and promotion of positive “cardiovascular health,” rather than primarily the treatment of established CVD .
●● Efforts to promote healthy behaviors (healthy diet pat-tern, appropriate energy intake, PA, and nonsmoking) and healthy biomarker levels (optimal blood lipids, BP, glucose levels) throughout the lifespan .
●● A population-level health promotion strategy that shifts the majority of the public towards greater cardiovascular health in addition to targeting those individuals at greatest CVD risk, since healthy lifestyles in all domains are uncommon throughout the US population .
Beginning in 2011, and recognizing the time lag in the nation-ally representative US data sets, this chapter in the annual Statistical Update evaluates and publishes metrics and infor-mation to provide insights into both progress toward meeting the 2020 AHA goals and areas that require greater attention to meet these goals .
Cardiovascular Health: Current Prevalence
●● The most up-to-date data on national prevalence of ideal, intermediate, and poor levels of each of the 7 cardiovas-cular health metrics are shown for children (adolescents
and teens 12–19 years of age) in Chart 2-1 and for adults (≥20 years of age) in Chart 2-2 .
●● For most metrics, the prevalence of ideal levels of health behaviors and health factors is much higher in US children than in US adults . The major exceptions are diet and PA, for which the prevalence of ideal levels in children is similar (for PA) or worse (for diet) than in adults .
●● Among children (Chart 2-1), the prevalence (unadjusted) of ideal levels of cardiovascular health behaviors and factors currently varies from 0% for the healthy diet pattern (ie, essentially no children meet at least 4 of the 5 dietary com-ponents) to >80% for the smoking, BP, and fasting glucose metrics . More than 90% of US children meet 0 or only 1 of the 5 healthy dietary components .
●● Among US adults (Chart 2-2), the age-standardized preva-lence of ideal levels of cardiovascular health behaviors and factors currently varies from 0 .3% for having at least 4 of 5 components of the healthy diet pattern to up to 76% for never having smoked or being a former smoker who has quit for >12 months .
Abbreviations Used in Chapter 2
AHA American Heart Association
ARIC Atherosclerosis Risk in Communities Study
BMI body mass index
BP blood pressure
CDC Centers for Disease Control and Prevention
CHD coronary heart disease
CHF congestive heart failure
CI confidence interval
CVD cardiovascular disease
DASH Dietary Approaches to Stop Hypertension
DBP diastolic blood pressure
DM diabetes mellitus
FDA Food and Drug Administration
HbA1c hemoglobin A1c
HBP high blood pressure
HD heart disease
HF heart failure
HR hazard ratio
IMT intima-media thickness
LDL low-density lipoprotein
MI myocardial infarction
NHANES National Health and Nutrition Examination Survey
NOMAS Northern Manhattan Study
OR odds ratio
PA physical activity
PE physical education
SBP systolic blood pressure
SE standard error
UN United Nations
WHO World Health Organization
by guest on December 16, 2013http://circ.ahajournals.org/Downloaded from
Heart Disease and Stroke Statistics—2013 Update: Chapter 2 e15
●● Age-standardized and age-specific prevalence estimates for ideal cardiovascular health and for ideal levels of each of its components for 2007 to 2008 (baseline) and 2009 to 2010 are shown in Table 2-2 .
—In 2009 to 2010, the prevalence of ideal levels across 6 available health factors and health behaviors (ie, exclud-ing diet, for which 2009–2010 data were not available at the time of this analysis) decreases dramatically from younger to older age groups . The same trend was seen in 2007-2008 .
●● Chart 2-3 displays the prevalence estimates for the popula-tion of US children (12–19 years of age) meeting different numbers of criteria for ideal cardiovascular health (out of 7 possible) in 2007 to 2008 .
—Very few US children (<5%) meet only 1 or 2 criteria for ideal cardiovascular health .
—About half of US children meet 3 or 4 fewer criteria for ideal cardiovascular health, and about half meet 5 or 6 criteria .
—Virtually no children meet all 7 criteria for ideal cardio-vascular health .
—Overall distributions were similar in boys and girls .
●● Charts 2-4 and 2-5 display the age-standardized prevalence estimates of US adults meeting different numbers of cri-teria for ideal cardiovascular health (out of 7 possible) in 2007 to 2008, overall and stratified by age, sex, and race .
—Approximately 2 .5% of US adults have 0 of the 7 criteria at ideal levels, and another 15% meet only 1 of 7 crite-ria . This is much worse than among children .
—Most US adults (≈60%) have 2, 3, or 4 criteria at ideal cardiovascular health, with approximately 1 in 5 adults within each of these categories .
—Approximately 12% meet 5 metrics, 4% meet 6 metrics, and 0% meet 7 metrics at ideal levels .
—Presence of ideal cardiovascular health is strongly age related (Chart 2-4) . Younger adults are more likely to meet greater numbers of ideal metrics, and older adults are much less likely . More than 60% of those >60 years of age have only 2 or fewer metrics at ideal levels (Chart 2-4) .
—Women tend to have more metrics at ideal levels than do men (Chart 2-4) .
—Blacks and Mexican Americans tend to have fewer met-rics at ideal levels than whites or other races (Chart 2-5) . Approximately 6 in 10 white adults and 7 in 10 black or Mexican American adults have no more than 3 of 7 metrics at ideal levels (Chart 2-5) .
●● Chart 2-6 displays the age-standardized percentages of US adults and percentages of children who have 5 or more of the metrics (out of 7 possible) at ideal levels .
—Approximately 40% of US children 12 to 19 years of age have 5 or more metrics at ideal levels, with lower levels in boys (36%) than in girls (45%) .
—In comparison, only 16% of US adults have 5 or more metrics with ideal levels, with lower prevalence in men (12%) than in women (21%) .
—Whites had nearly twice the percentage of adults with 5 or more metrics with ideal levels (18%) as Mexican Americans (9 .5%) or blacks (11%) .
●● Chart 2-7 displays the age-standardized percentages of US adults meeting different numbers of criteria for both poor and ideal cardiovascular health . Meeting the AHA 2020 Strategic Impact Goals is predicated on reducing the rela-tive percentage of those with poor levels while increasing the relative percentage of those with ideal levels for each of the 7 metrics .
—Approximately 94% of US adults have at least 1 metric at poor levels .
—Approximately 38% of US adults have at least 3 metrics at poor levels .
—Few US adults (<3%) have 5 or more metrics at poor levels .
—More US adults have 4 to 6 ideal metrics than 4 to 6 poor metrics .
●● The prevalence of poor health behaviors and health factors and their awareness, treatment, and control are displayed in Table 2-3 separately for those with and without self-reported CVD .
—Americans with CVD are much more likely to be current or former smokers than Americans without CVD .
—Approximately 20% of US adults are current smokers or have quit recently (<12 months ago) .
—As measured by self-reported data, Americans with CVD are very likely to have intermediate or poor lev-els of PA (74 .1%), whereas Americans without CVD still commonly have such levels (58 .4%) . Furthermore, 64 .5% of those with CVD and 47 .3% of those without CVD report engaging in no moderate or vigorous activ-ity at all .
—79% of US adults meet 0 or only 1 of the 5 healthy diet metrics .
—Two thirds of US adults are overweight, with little differ-ence by prevalent CVD . Half of all US adults with CVD and one third without CVD are obese .
—Hypertension is present in 28 .5% of US adults without CVD and 51 .0% of US adults with CVD . Of these, nearly all with CVD are aware of their hypertension (98 .6%) and are receiving treatment (97 .4%), but a much smaller proportion of those without CVD are aware (70 .6%) or receiving treatment (61 .4%) .
—Both presence of hypercholesterolemia (total cholesterol ≥240 mg/dL or receiving medication) and DM (fasting glucose ≥125 mg/dL or receiving medications) and awareness and treatment of these conditions are simi-larly higher among those with CVD than among those without CVD .
Cardiovascular Health: Trends Over Time
●● The trends over the last decade in each of the 7 cardio-vascular health metrics (for diet, trends from 2005–2006 to 2007–2008) are shown in Chart 2-8 (for children by guest on December 16, 2013http://circ.ahajournals.org/Downloaded from
e16 Circulation January 1/8, 2013
12–19 years of age) and Chart 2-9 (for adults ≥20 years of age) .
—Among children, there appears to be a negative trend for meeting the body mass index (BMI) metric and posi-tive trends for meeting the smoking and total cholesterol metrics . Other metrics do not show consistent trends .
—Among adults, there appears to be a positive trend for meeting the smoking metric and negative trends for meeting the BMI and glucose metrics . Trends for other metrics appear fairly flat .
●● Huffman et al2 made projections in cardiovascular health metrics to 2020 based on NHANES data from 1988–2008 (Chart 2-10) . If current trends continue, estimated cardio-vascular health will improve by 6%, short of the AHA’s goal of 20% . On the basis of current trends among indi-vidual metrics, anticipated declines in prevalence of smok-ing, high cholesterol, and high BP (in men) would be offset by substantial increases in the prevalence of obesity and DM and small expected changes in ideal dietary patterns or PA .2
Cardiovascular Diseases
●● In 2009, the age-standardized death rate attributable to all CVDs was 237 .1 per 100 000 (Chart 2-11), down 6% from 252 .4 per 100 000 in 2007 (baseline data for the 2020 Impact Goals on CVD and stroke mortality) .
—Death rates in 2009 attributable to stroke, HDs, and other cardiovascular causes were 38 .9, 116 .1, and 81 .0 per 100 000, respectively .
●● Data from NHANES 2009–2010 reveal that overall, 7 .2% of Americans self-reported having some type of CVD (Table 2-3), including 3 .2% with coronary heart disease (CHD), 2 .7% with stroke, and 2 .0% with congestive heart failure (CHF) (some individuals reported more than 1 condition) .
Relevance of Ideal Cardiovascular Health
Since the AHA announced its 2020 Impact Goals, several investigations have confirmed the importance of these metrics of cardiovascular health . Overall, these data demonstrate the relevance of the con cept of cardiovascular health to risk of future risk factors, disease, and mortality, with strong inverse, stepwise association with all-cause, CVD, and ischemic HD mortality .
●● Bambs et al3 and Folsom et al4 both described the low prevalence (<1%) of ideal cardiovascular health, defined as being in the ideal category of all 7 AHA metrics in the Heart Strategies Concentrating on Risk Evaluation and ARIC cohorts, respectively .
●● In ARIC, a stepwise, inverse association was present between the number of ideal health metrics and incident CVD events (including CHD death, nonfatal MI, stroke, and HF) during 20 years of follow-up . For participants with 0, 1, 2, 3, 4, 5, 6, and 7 metrics at ideal levels, the age-, sex-, and race-adjusted rates of incident CVD incidence
were 3 .21, 2 .19, 1 .60, 1 .20, 0 .86, 0 .64, 0 .39, and 0 per 100 person-years, respectively .4
●● Importantly, both ideal health behaviors and ideal health factors were independently associated with lower CVD risk in a stepwise fashion (Chart 2-12) . Thus, across any lev-els of health behaviors, health factors were still associated with incident CVD; and across any levels of health factors, health behaviors were still associated with incident CVD .
●● Dong et al5 demonstrated a similar strong graded, inverse relationship between the number of ideal cardiovascu-lar health metrics and risk of CVD in white, black, and Hispanic participants of the Northern Manhattan Study (NOMAS) after 11 years of follow-up .
●● On the basis of data from NHANES (1988–2010), a similarly low prevalence of ideal cardiovascular health is present across the United States: 2 .0% (95% confidence interval [CI], 1 .5%–2 .5%) in 1988–1994 and 1 .2% (95% CI, 0 .8%–1 .9%) in 2005–2010 .6
●● Furthermore, a stepwise association is present between the number of ideal cardiovascular health metrics and risk of all-cause mortality, CVD mortality, and ischemic HD mor-tality after 14 .5 years of follow-up in the United States .6 The adjusted hazard ratios (HRs) for individuals with 6 or 7 ideal health metrics compared with individuals with 0 ideal health metrics were 0 .49 (95% CI, 0 .33–0 .74) for all-cause mortality, 0 .24 (95% CI, 0 .13–0 .47) for CVD mortality, and 0 .30 (95% CI, 0 .13–0 .68) for ischemic HD mortality .6 Ford et al7 demonstrated similar relationships .
●● Adjusted population attributable fractions for CVD mortal-ity were as follows6:
—40 .6% (95% CI, 24 .5%–54 .6%) for HBP—13 .7% (95% CI, 4 .8%–22 .3%) for smoking—13 .2% (95% CI, 3 .5%–29 .2%) for poor diet—11 .9% (95% CI, 1 .3%–22 .3%) for insufficient PA—8 .8% (95% CI, 2 .1%–15 .4%) for abnormal glucose levels
●● Adjusted population attributable fractions for ischemic HD mortality were as follows6:
—34 .7% (95% CI, 6 .6%–57 .7%) for HBP—16 .7% (95% CI, 6 .4%–26 .6%) for smoking—20 .6% (95% CI, 1 .2%–38 .6%) for poor diet—7 .8% (95% CI, 0%–22 .2%) for insufficient PA—7 .5% (95% CI, 3 .0%–14 .7%) for abnormal glucose levels
●● Interestingly, based on NHANES 1999–2002, only modest intercorrelations are present between different cardiovas-cular health metrics . For example, these ranged from a cor-relation of −0 .12 between PA and hemoglobin A
1c (HbA
1c)
to a correlation of 0 .29 between BMI and HbA1c
. Thus, the 7 AHA cardiovascular health metrics appear interrelated, but only modestly, with substantial independent variation in each .7
●● The AHA cardiovascular health metrics predict future cardiometabolic risk when assessed in youth . In the Young Finns Study, a stepwise, inverse association was found between the number of ideal cardiovascular health metrics in adolescence (12–18 years of age) and risk of developing hypertension, dyslipidemia, or high carotid
by guest on December 16, 2013http://circ.ahajournals.org/Downloaded from

Heart Disease and Stroke Statistics—2013 Update: Chapter 2 e17
intima-media thickness (IMT) in adulthood after 21 years of follow-up (1986–2007) .8 For every 1 additional ideal cardiovascular health metric present in adolescence, com-pared with either poor or intermediate levels, the age- and sex-adjusted odds ratios (ORs) for adult cardiometabolic outcomes were
—Hypertension: OR=0 .66 (95% CI, 0 .54–0 .80)—High low-density lipoprotein (LDL) cholesterol
(>160 mg/dL): OR=0 .66 (95% CI, 0 .52–0 .85)—High-risk IMT (90th percentile or plaque present):
OR=0 .75 (95% CI, 0 .60–0 .94)
Achieving the 2020 Impact Goals
●● Taken together, these data continue to demonstrate both the tremendous relevance of the AHA 2020 Impact Goals for cardiovascular health and the substantial progress that will be needed to achieve these goals over the next decade .
●● A range of complementary strategies and approaches can lead to improvements in cardiovascular health . These include each of the following:
—Individual-focused approaches, which target lifestyle and treatments at the individual level (Table 2-4) .
—Health-care systems approaches, which encourage, facilitate, and reward efforts by providers to improve health behaviors and health factors (Table 2-5) .
—Population approaches, which target lifestyle and treat-ments in schools or workplaces, local communities, and states, as well as throughout the nation (Table 2-6) .
●● Such approaches can focus on both (1) improving cardio-vascular health among those who currently have less than optimal levels and (2) preserving cardiovascular health among those who currently have ideal levels (in particular, children, adolescents, and young adults) as they age .
●● The metrics with the greatest potential for improvement are health behaviors, including diet quality, PA, and body weight . However, each of the cardiovascular health met-rics can be improved and deserves major focus, including smoking, which remains the leading cause of preventable death in the United States .
●● Continued emphasis is also needed on the treatment of acute CVD events and secondary prevention through treat-ment and control of health behaviors and risk factors .
●● For each cardiovascular health metric, modest shifts in the population distribution toward improved health would produce relatively large increases in the proportion of Americans in both ideal and intermediate categories . For example, on the basis of NHANES 2009–2010, the current prevalence of ideal levels of BP among US adults is 44 .3% . To achieve the 2020 goals, a 20% relative improvement would require an increase in this proportion to 53 .1% by 2020 (44 .3% × 1 .20) . On the basis of NHANES data, a reduction in population mean BP of just 2 mm Hg would result in 56 .1% of US adults having ideal levels of BP, which represents a 26 .8% relative improvement in this metric (Table 2-7) . Larger population reductions in BP
would lead to even larger numbers of people with ideal levels . Such small reductions in population BP could result from small health behavior changes at a population level, such as increased PA, increased fruit and vegetable con-sumption, decreased sodium intake, decreased adiposity, or some combination of these and other lifestyle changes, with resulting substantial projected decreases in CVD rates in US adults .9
●● The AHA has a broad range of policy initiatives to improve cardiovascular health and meet the 2020 Strategic Impact Goals (Table 2-8) . Future Statistical Updates will update these initiatives and track progress toward the 2020 Impact Goals .
References 1 . Lloyd-Jones DM, Hong Y, Labarthe D, Mozaffarian D, Appel LJ, Van
Horn L, Greenlund K, Daniels S, Nichol G, Tomaselli GF, Arnett DK, Fonarow GC, Ho PM, Lauer MS, Masoudi FA, Robertson RM, Roger V, Schwamm LH, Sorlie P, Yancy CW, Rosamond WD; American Heart Association Strategic Planning Task Force and Statistics Committee . Defining and setting national goals for cardiovascular health promotion and disease reduction: the American Heart Association’s strategic Impact Goal through 2020 and beyond . Circulation . 2010;121:586–613 .
2 . Huffman MD, Capewell S, Ning H, Shay CM, Ford ES, Lloyd-Jones DM . Cardiovascular health behavior and health factor changes (1988-2008) and projections to 2020: results from the National Health and Nutrition Examination Surveys . Circulation . 2012;125:2595–2602 .
3 . Bambs C, Kip KE, Dinga A, Mulukutla SR, Aiyer AN, Reis SE . Low prev-alence of “ideal cardiovascular health” in a community-based population: the Heart Strategies Concentrating on Risk Evaluation (Heart SCORE) study . Circulation . 2011;123:850–857 .
4 . Folsom AR, Yatsuya H, Nettleton JA, Lutsey PL, Cushman M, Rosa-mond WD; ARIC Study Investigators . Community prevalence of ideal cardiovascular health, by the American Heart Association definition, and relationship with cardiovascular disease incidence . J Am Coll Cardiol . 2011;57:1690–1696 .
5 . Dong C, Rundek T, Wright CB, Anwar Z, Elkind MS, Sacco RL . Ideal cardiovascular health predicts lower risks of myocardial infarction, stroke, and vascular death across whites, blacks, and Hispanics: the Northern Manhattan Study . Circulation . 2012;125:2975–2984 .
6 . Yang Q, Cogswell ME, Flanders WD, Hong Y, Zhang Z, Loustalot F, Gil-lespie C, Merritt R, Hu FB . Trends in cardiovascular health metrics and associations with all-cause and CVD mortality among US adults . JAMA . 2012;307:1273–1283 .
7 . Ford ES, Greenlund KJ, Hong Y . Ideal cardiovascular health and mortality from all causes and diseases of the circulatory system among adults in the United States . Circulation . 2012;125:987–995 .
8 . Laitinen TT, Pahkala K, Magnussen CG, Viikari JS, Oikonen M, Tait-tonen L, Mikkilä V, Jokinen E, Hutri-Kähönen N, Laitinen T, Kähönen M, Lehtimäki T, Raitakari OT, Juonala M . Ideal cardiovascular health in childhood and cardiometabolic outcomes in adulthood: the Cardiovascular Risk in Young Finns Study . Circulation . 2012;125:1971–1978 .
9 . Bibbins-Domingo K, Chertow GM, Coxson PG, Moran A, Lightwood JM, Pletcher MJ, Goldman L . Projected effect of dietary salt reductions on future cardiovascular disease . N Engl J Med . 2010;362:590–599 .
10 . Artinian NT, Fletcher GF, Mozaffarian D, Kris-Etherton P, Van Horn L, Lichtenstein AH, Kumanyika S, Kraus WE, Fleg JL, Redeker NS, Meininger JC, Banks J, Stuart-Shor EM, Fletcher BJ, Miller TD, Hughes S, Braun LT, Kopin LA, Berra K, Hayman LL, Ewing LJ, Ades PA, Durstine JL, Houston-Miller N, Burke LE; on behalf of the American Heart Asso-ciation Prevention Committee of the Council on Cardiovascular Nursing . Interventions to promote physical activity and dietary lifestyle changes for cardiovascular risk factor reduction in adults: a scientific statement from the American Heart Association . Circulation . 2010;122:406–441 .
11 . Mozaffarian D, Afshin A, Benowitz NL, Bittner V, Daniels SR, Franch HA, Jacobs DR Jr, Kraus WE, Kris-Etherton PM, Krummel DA, Popkin BM, Whitsel LP, Zakai NA; on behalf of the American Heart Association Council on Epidemiology and Prevention, Council on Nutrition, Physi-cal Activity and Metabolism, Council on Clinical Cardiology, Council on Cardiovascular Disease in the Young, Council on the Kidney in Cardiovas-cular Disease, Council on Peripheral Vascular Disease, and the Advocacy
by guest on December 16, 2013http://circ.ahajournals.org/Downloaded from

e18 Circulation January 1/8, 2013
Coordinating Committee . Population approaches to improve diet, physi-cal activity, and smoking habits: a scientific statement from the American Heart Association . Circulation . 2012;126:1514–1563 .
12 . Bodenheimer T . Helping patients improve their health-related behaviors: what system changes do we need? Dis Manag . 2005;8:319–330 .
13 . Simpson LA, Cooper J . Paying for obesity: a changing landscape . Pediat-rics . 2009;123(suppl 5):S301–S307 .
14 . Quist-Paulsen P . Cessation in the use of tobacco: pharmacologic and non-pharmacologic routines in patients . Clin Respir J . 2008;2:4–10 .
15 . Davis D, Galbraith R; American College of Chest Physicians Health and Science Policy Committee . Continuing medical education effect on prac-tice performance: effectiveness of continuing medical education: Ameri-can College of Chest Physicians Evidence-Based Educational Guidelines . Chest . 2009;135(suppl):42S–48S .
Table 2-1. Definitions of Poor, Intermediate, and Ideal Cardiovascular Health for Each Metric in the AHA 2020 Goals
Level of Cardiovascular Health for Each Metric
Poor Intermediate Ideal
Current smoking
Adults ≥20 y of age Yes Former ≤12 mo Never or quit >12 mo
Children 12–19 y of age Tried during the prior 30 d … Never tried; never smoked whole cigarette
BMI*
Adults ≥20 y of age ≥30 kg/m2 25–29.9 kg/m2 <25 kg/m2
Children 2–19 y of age >95th percentile 85th-95th percentile <85th percentile
PA
Adults ≥20 y of age None 1–149 min/wk moderate or1–74 min/wk vigorous or1–149 min/wk moderate + 2×vigorous
≥150 min/wk moderate or ≥75 min/wk vigorous or ≥150 min/wk moderate + 2×vigorous
Children 12–19 y of age None >0 and <60 min of moderate or vigorous every day ≥60 min of moderate or vigorous every day
Healthy diet pattern, No. of components†
Adults ≥20 y of age 0–1 2–3 4–5
Children 5–19 y of age 0–1 2–3 4–5
Total cholesterol, mg/dL
Adults ≥20 y of age ≥240 200–239 or treated to goal <200
Children 6–19 y of age ≥200 170–199 <170
Blood pressure
Adults ≥20 y of age SBP ≥140 mm Hg or DBP ≥90 mm Hg
SBP120–139 mm Hg or DBP 80–89 mm Hg or treated to goal
<120 mm Hg/<80 mm Hg
Children 8–19 y of age >95th percentile 90th–95th percentile or SBP ≥120 mm Hg or DBP ≥80 mm Hg
<90th percentile
Fasting plasma glucose, mg/dL
Adults ≥20 y of age ≥126 100–125 or treated to goal <100
Children 12–19 y of age ≥126 100–125 <100
AHA indicates American Heart Association; BMI, body mass index; PA, physical activity; SBP, systolic blood pressure; and DBP, diastolic blood pressure.*Represents appropriate energy balance, ie, appropriate dietary quantity and PA to maintain normal body weight.†In the context of a healthy dietary pattern that is consistent with a Dietary Approaches to Stop Hypertension [DASH]–type eating pattern, to consume ≥4.5 cups/d of
fruits and vegetables, ≥2 servings/wk of fish, and ≥3 servings/d of whole grains and no more than 36 oz/wk of sugar-sweetened beverages and 1500 mg/d of sodium.
by guest on December 16, 2013http://circ.ahajournals.org/Downloaded from

Heart Disease and Stroke Statistics—2013 Update: Chapter 2 e19
Table 2-2. Prevalence of US Population With Ideal Cardiovascular Health and With Components of Ideal Cardiovascular Health, Overall and in Selected Age Strata From NHANES 2007–2008 and 2009–2010
Prevalence, %
Ages 12–19 y Ages ≥20 y* Ages 20–39 y Ages 40–59 y Ages ≥60 y
2007–2008 (baseline)
Ideal CV health profile (composite–all 7) 0.0 0.0 0.0 0.0 0.0
≥6 Ideal CV health composite score 8.2 3.6 7.1 2.1 0.1
≥5 Ideal CV health composite score 39.8 15.8 29.7 9.7 2.9
Ideal health factors index (composite–all 4) 35.5 13.9 27.7 7.3 1.0
Individual components
Total cholesterol <200 mg/dL (untreated) 69.6 46.3 64.1 37.1 29.9
SBP <120 mm Hg and DBP <80 mm Hg (untreated) 82.3 43.8 63.8 36.9 14.6
Not current smoker (never or quit ≥12 mo) 83.7 72.9 66.4 72.9 86.1
Fasting blood glucose <100 mg/dL 76.2 52.0 67.4 45.6 31.9
Ideal health behaviors index (composite–all 4) 0.0 0.1 0.1 0.0 0.0
Individual components
PA at goal 39.0 39.5 45.6 36.4 33.7
Not current smoker (never or quit ≥12 mo) 83.7 72.9 66.4 72.9 86.1
BMI <25 kg/m2 62.5 31.9 39.1 28.0 25.3
4–5 Diet goals met† 0.0 0.3 0.3 0.1 0.5
Fruits and vegetables ≥4.5 cups/d 7.9 12.3 11.7 11.4 15.8
Fish ≥2 3.5-oz servings/wk (preferably oily fish) 9.2 18.3 16.8 19.7 19.4
Sodium <1500 mg/d 0.0 0.6 0.6 0.8 0.3
Sugar-sweetened beverages ≤450 kcal/wk 32.0 51.9 41.0 54.6 71.2
Whole grains (1.1 g fiber/10 g carb) ≥3 1-oz equivalents/d 3.2 7.3 7.0 7.1 8.4
Other dietary measures
Nuts, legumes, seeds ≥4 servings/wk 8.7 21.7 19.6 22.5 24.7
Processed meats ≤2 servings/wk 56.3 57.6 54.0 59.7 61.1
Saturated fat <7% of total energy intake (kcal) 4.5 8.7 9.3 8.0 9.0
2009–2010
Ideal CV health profile (composite–all 6)‡ 17.4 4.4 8.1 2.6 0.6
≥5 Ideal CV health composite score 47.2 17.2 29.8 10.7 5.8
Ideal health factors index (composite–all 4) 48.4 15.9 29.7 9.2 2.4
Individual components
Total cholesterol <200 mg/dL (untreated) 69.1 47.3 67.8 36.8 29.4
SBP <120 mm Hg and DBP <80 mm Hg (untreated) 85.8 44.3 64.3 40.7 15.8
Not current smoker (never or quit ≥12 mo) 85.2 76.2 69.5 75.5 88.3
Fasting blood glucose <100 mg/dL 88.2 57.4 73.5 54.0 35.7
Ideal health behaviors index (composite–all 3)‡ 42.1 17.8 21.4 15.8 14.9
Individual components
PA at goal 36.1 41.1 46.5 40.8 33.3
Not current smoker (never or quit ≥12 mo) 85.2 76.2 69.5 75.5 88.3
BMI <25 kg/m2 64.2 31.3 38.6 27.5 25.4
NHANES indicates National Health and Nutrition Examination Survey; CV, cardiovascular; SBP, systolic blood pressure; DBP, diastolic blood pressure; PA, physical activity; and BMI, body mass index.
*Standardized to the age distribution of the 2000 US Standard population.†Scaled for 2000 kcal/d and in the context of intake with appropriate energy balance and a DASH (Dietary Approaches to Stop Hypertension)–like eating plan.‡Dietary data for the 2009–2010 cycle of NHANES were not available at the time of this analysis.
by guest on December 16, 2013http://circ.ahajournals.org/Downloaded from

e20 Circulation January 1/8, 2013
Table 2-3. Selected Secondary Metrics for Monitoring CVD, NHANES 2009–2010*
In the Presence of CVD In the Absence of CVD
N† % (SE)‡ N† % (SE)‡
Total 16 209 474 7.2 (0.4) 199 590 596 92.8 (0.4)
CHD 6 916 012 3.2 (0.3)
Stroke 5 717 759 2.7 (0.2)
CHF 4 320 227 2.0 (0.3)
Acute MI 6 929 905 3.2 (0.3)
Health behaviors
Smoking
Current smoker or smokers who quit <12 mo ago 3 127 273 37.2 (4.9) 40 760 066 20.1 (0.9)
PA
PA: intermediate or poor§ 11 813 011 74.1 (5.1) 115 561 988 58.4 (1.5)
PA: none 10 598 908 64.5 (5.5) 93 459 556 47.3 (1.2)
Diet, no. of metrics*
Total diet score 0–3 of 5 12 665 860 100.00 (0.00) 161 370 154 99.71 (0.11)
Total diet score 0–1 of 5 9 540 532 70.06 (4.69) 127 156 293 78.84 (1.42)
Overweight/obesity
Overweight or obese (BMI ≥25.0 kg/m2) 12 621 701 69.4 (4.1) 134 879 713 68.1 (1.3)
Obese (BMI ≥30.0 kg/m2) 7 763 611 49.0 (5.2) 68 655 702 34.7 (1.0)
Health factors
Hypertension
Prevalence of BP ≥140/90 mm Hg or taking medications 10 591 170 51.0 (5.0) 53 523 895 28.5 (0.9)
Awareness among those with hypertension 10 071 343 98.6 (0.3) 42 436 782 70.6 (3.2)
Treatment those with hypertension 9 819 244 97.4 (0.4) 39 194 948 61.4 (2.9)
BP control to <140/<90 mm Hg among treated 6 886 176 64.2 (9.5) 27 323 649 72.4 (2.4)
BP control to <140/<90 mm Hg among hypertensive 6 886 176 62.3 (9.4) 27 323 649 43.3 (2.8)
Hypercholesterolemia
Prevalence of total cholesterol ≥240 mg/dL or taking medications 8 201 829 37.1 (4.2) 48 701 198 25.7 (0.7)
Awareness among those with hypercholesterolemia 7 742 127 84.6 (8.0) 35 174 931 59.9 (2.6)
Treatment among those with hypercholesterolemia 7 219 078 79.3 (8.5) 25 405 334 38.7 (2.4)
Cholesterol control to <200 mg/dL among treated 6 659 732 95.0 (1.4) 22 804 724 90.4 (1.2)
Cholesterol control to <200 mg/dL among hypercholesterolemia 6 659 732 75.0 (8.9) 22 804 724 34.7 (2.4)
Diabetes mellitus
Prevalence of fasting glucose ≥125 mg/dL or taking medications 4 769 759 15.2 (2.2) 21 078 443 10.3 (1.1)
Awareness among diabetics 4 006 153 90.4 (2.3) 14 242 760 64.3 (4.6)
Treatment among diabetics 3 935 446 87.1 (3.2) 13 391 291 58.4 (5.3)
Blood glucose control among treated 1 527 151 32.6 (9.9) 5 878 676 45.0 (8.0)
Blood glucose control among diabetics 1 527 151 27.2 (8.7) 5 878 676 25.5 (5.9)
CVD indicates cardiovascular disease; NHANES, National Health and Nutrition Examination Survey; SE, standard error; CHD, coronary heart disease; CHF, congestive heart failure; MI, myocardial infarction; PA, physical activity; BMI, body mass index; and BP, blood pressure.
*Dietary data are based on 2007–2008, the most recent data available at the time of this analysis. †Weighted sample size.‡Standardized to the age distribution of the 2000 US Standard population.§Moderate <150 min/wk AND Vigorous <75 min/wk AND Combined <150 min/wk.
by guest on December 16, 2013http://circ.ahajournals.org/Downloaded from

Heart Disease and Stroke Statistics—2013 Update: Chapter 2 e21
Table 2-5. Evidence-Based Healthcare Systems Approaches to Support and Facilitate Improvements in Health Behaviors and Health Factors11-15
• Electronic systems for scheduling and tracking initial visits and regular follow-up contacts for behavior change and treatments.• Electronic medical records systems to help assess, track, and report on specific health behaviors (diet, PA, tobacco, body weight) and health factors (BP,
cholesterol, glucose), as well as to provide feedback and the latest guidelines to providers.• Practical paper or electronic toolkits for assessment of key health behaviors and health factors, including during, before, and after provider visits.• Electronic systems to facilitate provision of feedback to patients on their progress during behavior change and other treatment efforts.• Education and ongoing training for providers on evidence-based behavior change strategies, as well as the most relevant behavioral targets, including training on
relevant ethnic and cultural issues.• Integrated systems to provide coordinated care by multidisciplinary teams of providers, including physicians, nurse practitioners, dieticians, PA specialists, and
social workers.• Reimbursement guidelines and incentives that reward efforts to change health behaviors and health factors.Restructuring of practice goals and quality
benchmarks to incorporate health behavior (diet, PA, tobacco, body weight) and health factor (BP, cholesterol, glucose) interventions and targets for both primary and secondary prevention.
BP indicates blood pressure; PA, physical activity.
Table 2-4. Evidence-Based Individual Approaches for Improving Health Behaviors and Health Factors in the Clinic Setting
• Set specific goals (Class IA). Set specific, proximal goals with the patient, including a personalized plan to achieve the goals (eg, over the next 3 mo, increase fish by 1 serving/wk, reduce smoking by half a pack per day, or walk 30 min 3 times per week).
• Establish self-monitoring (Class IA). Develop a strategy for self-monitoring, such as a dietary or physical activity diary or Web-based or mobile applications.• Schedule follow-up (Class IA). Schedule regular follow-up (in-person, telephone, written, and/or electronic), with clear frequency and duration of contacts, to
assess success, reinforce progress, and set new goals as necessary.• Provide feedback (Class IA). Provide feedback on progress toward goals, including using in person, telephone, and/or electronic feedback.• Increase self-efficacy (Class IA). Increase the patient’s perception that they can successfully change their behavior.*• Use motivational interviewing† (Class IA). Use motivational interviewing when patients are resistant or ambivalent about behavior change.• Provide long-term support (Class IB). Arrange long-term support from family, friends, or peers for behavior change, such as in other workplace, school, or
community-based programs.• Use a multicomponent approach (Class IA). Combine 2 or more of the above strategies into the behavior change efforts.
*Examples of approaches include mastery experiences (set a reasonable, proximal goal that the person can successfully achieve); vicarious experiences (have the person see someone with similar capabilities performing the behavior, such as walking on a treadmill or preparing a healthy meal); physiological feedback (explain to the patient when a change in their symptoms is related to worse or improved behaviors); and verbal persuasion (persuade the person that you believe in their capability to perform the behavior).
†Motivational interviewing represents use of individual counseling to explore and resolve ambivalence toward changing behavior. Major principles include fostering the person’s own awareness and resolution of their ambivalence, as well as their own self-motivation to change, in a partnership with the counselor or provider.
Table adapted from Artinian et al.10
Table 2-6. Summary of Evidence-Based Population Approaches for Improving Diet, Increasing Physical Activity, and ReducingTobacco Use*
Diet
Media and education Sustained, focused media and educational campaigns, using multiple modes, for increasing consumption of specific healthful foods or reducing consumption of specific less healthful foods or beverages, either alone (IIa B) or as part of multicomponent strategies (I B)†‡§
On-site supermarket and grocery store educational programs to support the purchase of healthier foods (IIa B)†
Labeling and information Mandated nutrition facts panels or front-of-pack labels/icons as a means to influence industry behavior and product formulations (IIa B)†
Economic incentives Subsidy strategies to lower prices of more healthful foods and beverages (I A)†
Tax strategies to increase prices of less healthful foods and beverages (IIa B)†
Changes in both agricultural subsidies and other related policies to create an infrastructure that facilitates production, transportation, and marketing of healthier foods, sustained over several decades (IIa B)†
Schools Multicomponent interventions focused on improving both diet and physical activity, including specialized educational curricula, trained teachers, supportive school policies, a formal PE program, healthy food and beverage options, and a parental/family component (I A)†
School garden programs, including nutrition and gardening education and hands-on gardening experiences (IIa A)† Fresh fruit and vegetable programs that provide free fruits and vegetables to students during the school day (IIa A)†
Workplaces Comprehensive worksite wellness programs with nutrition, physical activity, and tobacco cessation/prevention components (IIa A)†
Increased availability of healthier food/beverage options and/or strong nutrition standards for foods and beverages served, in combination with vending machine prompts, labels, or icons to make healthier choices (IIa B)†
Local environment Increased availability of supermarkets near homes (IIa B)†‡
(Continued ) by guest on December 16, 2013http://circ.ahajournals.org/Downloaded from

e22 Circulation January 1/8, 2013
Table 2-6. (Continued)
Restrictions and mandates Restrictions on television advertisements for less healthful foods or beverages advertised to children (I B)†
Restrictions on advertising and marketing of less healthful foods or beverages near schools and public places frequented by youths (IIa B)†
General nutrition standards for foods and beverages marketed and advertised to children in any fashion, including on-package promotion (IIa B)†
Regulatory policies to reduce specific nutrients in foods (eg, trans fats, salt, certain fats) (I B)†§
Physical activity
Labeling and information Point-of-decision prompts to encourage use of stairs (IIa A)†
Economic incentives Increased gasoline taxes to increase active transport/commuting (IIa B)†
Schools Multicomponent interventions focused on improving both diet and physical activity, including specialized educational curricula, trained teachers, supportive school policies, a formal PE program, serving of healthy food and beverage options, and a parental/family component (IIa A)†
Increased availability and types of school playground spaces and equipment (I B)†
Increased number of PE classes, revised PE curricula to increase time in at least moderate activity, and trained PE teachers at schools (IIa A/IIb A¶)†
Regular classroom physical activity breaks during academic lessons (IIa A)†§
Workplaces Comprehensive worksite wellness programs with nutrition, physical activity, and tobacco cessation/prevention components (IIa A)†
Structured worksite programs that encourage activity and also provide a set time for physical activity during work hours (IIa B)†
Improving stairway access and appeal, potentially in combination with “skip-stop” elevators that skip some floors (IIa B)†
Adding new or updating worksite fitness centers (IIa B)†
Local environment Improved accessibility of recreation and exercise spaces and facilities (eg, building of parks and playgrounds, increasing operating hours, use of school facilities during nonschool hours) (IIa B)†
Improved land-use design (eg, integration and interrelationships of residential, school, work, retail, and public spaces) (IIa B)†
Improved sidewalk and street design to increase active commuting (walking or bicycling) to school by children (IIa B)†
Improved traffic safety (IIa B)†
Improved neighborhood aesthetics (to increase activity in adults) (IIa B)†
Improved walkability, a composite indicator that incorporates aspects of land-use mix, street connectivity, pedestrian infrastructure, aesthetics, traffic safety, and/or crime safety (IIa B)†
Smoking
Media and education Sustained, focused media and educational campaigns to reduce smoking, either alone (IIa B) or as part of larger multicomponent population-level strategies (I A)†
Labeling and information Cigarette package warnings, especially those that are graphic and health related (I B)†‡§
Economic incentives Higher taxes on tobacco products to reduce use and fund tobacco control programs (I A)†‡§
Schools and workplaces Comprehensive worksite wellness programs with nutrition, physical activity, and tobacco cessation/prevention components (IIa A)†
Local environment Reduced density of retail tobacco outlets around homes and schools (I B)†
Development of community telephone lines for cessation counseling and support services (I A)†
Restrictions and mandates Community (city, state, or federal) restrictions on smoking in public places (I A)†
Local workplace-specific restrictions on smoking (I A)†‡§
Stronger enforcement of local school-specific restrictions on smoking (IIa B)†
Local residence-specific restrictions on smoking (IIa B)†§
Partial or complete restrictions on advertising and promotion of tobacco products (I B)†
PE indicates physical education.*The specific population interventions listed here are either a Class I or IIa recommendation with an evidence grade of either A or B. The American Heart Association
evidence grading system for class of recommendation and level of evidence is summarized in Table 2. Because implementation of population-level strategies does not require perfect evidence but rather consideration of risks versus benefits, associated costs, and alternate approaches, the absence of any specific strategy herein does not mean it should not also be considered for implementation. See the more detailed tables and text below for further information on the evidence for each of these interventions, as well as other strategies that were reviewed.
†At least some evidence from studies conducted in high-income Western regions and countries (eg, North America, Europe, Australia, New Zealand).‡At least some evidence from studies conducted in high-income non-Western regions and countries (eg, Japan, Hong Kong, South Korea, Singapore).§At least some evidence from studies conducted in low- or middle-income regions and countries (eg, Africa, China, Pakistan, India).||Based on cross-sectional studies only; only 2 longitudinal studies have been performed, with no significant relations seen.¶Evidence IIa A for improving physical activity; evidence IIb B for reducing adiposity.Reprinted from Mozaffarian et al11 with permission. © 2012 American Heart Association, Inc.
by guest on December 16, 2013http://circ.ahajournals.org/Downloaded from

Heart Disease and Stroke Statistics—2013 Update: Chapter 2 e23
Table 2-7. Reduction in BP Required to Increase Prevalence of Ideal BP Among Adults ≥20 y of Age; NHANES 2009–2010
%
Percent BP ideal among adults, 2009–2010 44.26
20% Relative increase 53.11
Percent of US adults whose BP would be ideal if population mean BP were lowered by*
2 mm Hg 56.13
3 mm Hg 59.49
4 mm Hg 61.59
5 mm Hg 65.31
Standardized to the age distribution of the 2000 US standard population. BP indicates blood pressure; NHANES, National Health and Nutrition
Examination Survey. *Reduction in BP=(observed average systolic−X mm Hg) AND (observed
average diastolic−X mm Hg).
Table 2-8. AHA Advocacy and Policy Strategies Related to the 2020 Impact Goals for Ideal Cardiovascular Health
Measure of Cardiovascular Health Advocacy/Policy Solutions
Smoking Status Ideal for cardiovascular health: Adults: Never smoked or quit
more than a year ago Children: Never tried or never
smoked a whole cigarette
Federal• Support the full, authorized funding level for the FDA’s Center for Tobacco Products and advocate for comprehensive
implementation of FDA regulation of tobacco.• Implement clinical guidance and monitor health claims concerning smokeless tobacco and other “harm reduction” products.• Support the Tobacco Tax Equity Act that closes tax loopholes to ensure that all tobacco products are taxed at levels similar to
the current tax rate for cigarettes.• Continue to advocate for ratification of WHO’s Framework Convention of Tobacco Control as part of the UN Political
Declaration on Non-Communicable Diseases for implementation by all countries who are a party to the treaty.
State• Establish, strengthen, and protect smoke-free air laws in compliance with the Fundamentals of Smokefree Workplace Laws
guidelines.• Support tobacco-free secondary school, college, university, and hospital campuses.• Support significant increases in tobacco excise taxes on all tobacco products.• Establish and protect sustainable funding for tobacco prevention and cessation programs to levels that meet or exceed the
CDC recommendations.• Provide comprehensive tobacco cessation benefits in Medicaid, Medicare, and private health insurance plans.• Eliminate tobacco sales in pharmacies and other health-related institutions.
Physical Activity Ideal for cardiovascular health: Adults: At least 150 min of
moderate or 75 min of vigorous PA each week
Children: >60 min of moderate-vigorous PA per day
Federal• Preserve funding for Safe Routes to School and Complete Streets in Transportation Reauthorization.• Include PA in nutrition education funding for the Farm Bill Supplemental Nutrition Assistance Program.• Incorporate PA into electronic medical records.• Support implementation of the National Physical Activity Plan.• Increase the quality of physical education in schools and advocate for Physical Education for Progress grants to increase
funding to schools to improve their PE programs.• Advocate for regular revision and update of the Physical Activity Guidelines for Americans.
State• Implement shared use of school facilities within the community and support the construction of school fitness facilities.• Increase sports, recreational opportunities, parks, and green spaces in the community.• Support efforts to design workplaces, communities, and schools around active living and integrate PA opportunities throughout
the day.• Provide safe routes to schools and school sites that offer walking/biking options for more students.• Support the creation of complete streets.• Support the use of zoning policy to increase access to safe places for recreation.• Create and maintain comprehensive worksite wellness programs.• Support the creation and implementation, through legislation and regulation (including licensing), of PA standards for
preschool, day care, and other out-of-school care programs.• Require quality, more frequent physical education in schools.• Promote efforts within the school environment that will lead to increased PA.
(Continued)
by guest on December 16, 2013http://circ.ahajournals.org/Downloaded from

e24 Circulation January 1/8, 2013
Table 2-8. Continued
Measure of Cardiovascular Health Advocacy/Policy Solutions
BMI Ideal for cardiovascular health: Adults: between 18.5 and 25 kg/m2
Children: between the 15th and 85th percentile
Go to www.americanheart.org/obesitypolicy for additional policy resources
Federal• Provide obesity counseling and treatment coverage in the healthcare environment.• Provide robust surveillance and monitoring of obesity, diet, PA, and tobacco use.
State• Provide robust coverage for guidelines-based prevention, diagnosis, and treatment of overweight and obesity in the
healthcare environment.• Implement and monitor strong local wellness policies in all schools.• Ensure adequate funding and implementation of coordinated school health programs.• Establish comprehensive obesity prevention strategies in early childhood and day care programs.• Advocate for continued funding for obesity prevention research and work to ensure a strong evaluation component is a part
of implementation of new laws and programs.
Healthy Diet Ideal for cardiovascular health: In the context of a DASH-type
dietary pattern, adults and children should achieve at least 4 of the 5 following key components of a healthy diet:
• Fruits and vegetables: >4.5 cups/d
• Fish: More than two 3.5-oz serv-ings/wk (preferably oily fish)
• Fiber-rich whole grains (>1.1 g of fiber per 10 g of carbohydrates): three 1-oz-equivalent servings per day
Federal• Work to eliminate food deserts and improve access and affordability of healthy foods.• Strengthen nutrition standards in schools for meals and competitive foods and in all government nutrition assistance or feed-
ing programs.• Improve food labeling to make the labels easier to read and convey more accurately the content of added sugars, trans fats,
sodium, and whole grains in foods.• Implement menu labeling in restaurants.• Continue to support and monitor the removal of industrially produced trans fats from the food supply and ensure the use of
healthy replacement oils.• Restrict the marketing and advertising of unhealthy food to children.• Support robust implementation of nutrition education and promotion in schools.• Reduce added sugar and sodium in the food supply.• Support the implementation and dissemination of procurement standards across federal agencies.• Ensure that diet counseling is a covered benefit in Medicare.
• Sodium: <1500 mg/d• Sugar-sweetened beverages:
<450 kcal (36 oz) per week Go to www.americanheart.org/obesitypolicy for more specific policy resources
State• Support the implementation of the reauthorization of the Federal Childhood Nutrition Act and new regulations concerning
competitive foods and beverages and use all available techniques, including legislation, to encourage schools to take advan-tage of opportunities to provide even healthier options for children.
• Support improvements in the school food environment just outside of school property, including corner stores and food trucks
• Support the creation and implementation of nutrition standards, through legislation and regulation (including licensing), for preschool and day care and other out-of-school care program meals.
• Support opportunities for greater nutrition education in schools. Support opportunities to expand the availability of fruits, veg-etables, and water, including policies that support expansion of school gardens and farm-to-school programs.
• Support strategies that reduce sodium in the food supply.• Reduce trans fats in packaged foods, baked goods, restaurant meals, and school meal programs.• Support the elimination of food deserts through policies such as Healthy Food Financing that increase the availability of
fruits, vegetables, and water in underserved neighborhoods.• Support the establishment of food procurement policies that meet the AHA or federal guidelines for government offices.• Support policies identified to reduce children’s exposure to marketing and advertising for unhealthy food.• Support policies that change relative prices of healthy versus unhealthy food items.• Support on a pilot basis the taxation of sugar-sweetened beverages to assess impact on health and consumer behavior,
including 6 minimum criteria (at least a portion of the money is dedicated for HD and stroke prevention and/or obesity pre-vention, the tax is structured so as to result in an increase in price for sugar-sweetened beverages, tax is at least 1 cent/oz, there is money dedicated for evaluation with guidance that ensures rigorous evaluation including health outcomes, there is a standard definition of “sugar-sweetened beverage,” and there is no sunset).
• Support policies designed to encourage retailers to increase access to healthy foods while decreasing access to unhealthy foods.
• Expand state participation in the Department of Defense Fresh Fruit and Vegetable program.
Total Cholesterol Ideal for cardiovas cular health: Adults: Total cholesterol
<200 mg/dL Children: <170 mg/dL
Federal and State• Partner with Department of Health and Human Services to promote the Million Hearts Campaign through increased public
awareness and partnership engagement, science and evaluation, clinical care improvement, patient outreach, and public policy.
• Ensure adequate healthcare coverage for prevention and treatment of dyslipidemia.• Secure and protect dedicated state appropriations aligned with HD and stroke priorities and work to support appropriate pro-
gram implementation. Support other public health initiatives and evaluation targeted at HD, stroke, and related risk factors, as well as the disparities that exist in these areas.
(Continued)
by guest on December 16, 2013http://circ.ahajournals.org/Downloaded from
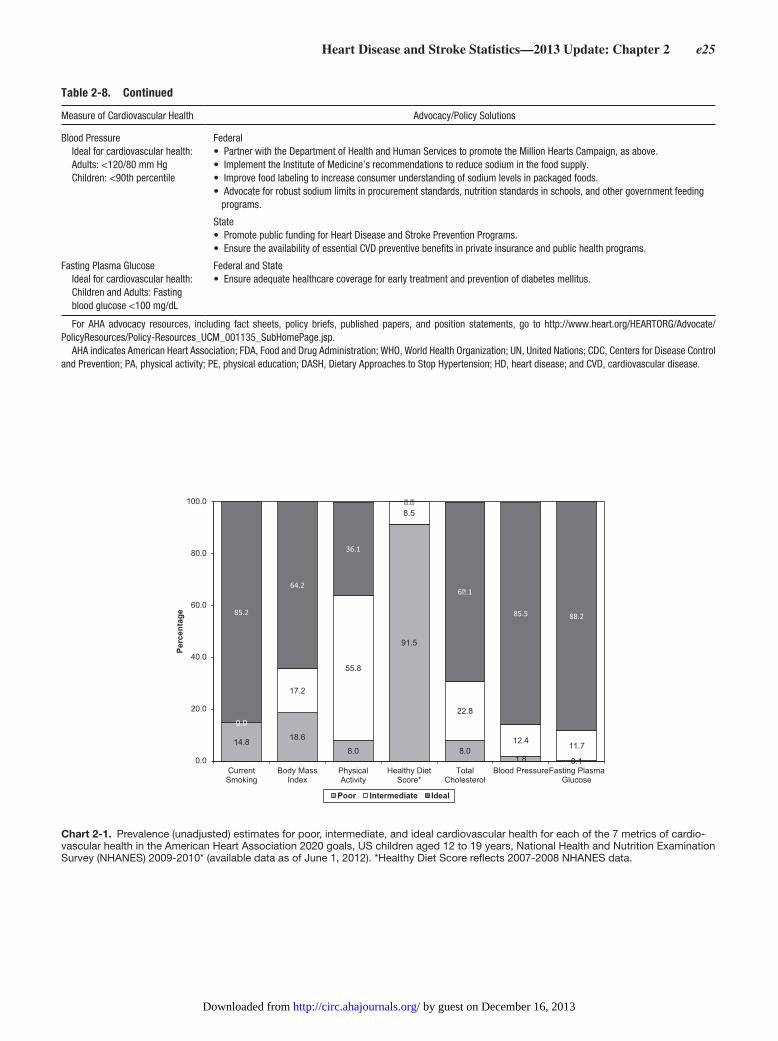
Heart Disease and Stroke Statistics—2013 Update: Chapter 2 e25
Table 2-8. Continued
Measure of Cardiovascular Health Advocacy/Policy Solutions
Blood Pressure Ideal for cardiovas cular health: Adults: <120/80 mm Hg Children: <90th percentile
Federal• Partner with the Department of Health and Human Services to promote the Million Hearts Campaign, as above.• Implement the Institute of Medicine’s recommendations to reduce sodium in the food supply.• Improve food labeling to increase consumer understanding of sodium levels in packaged foods.• Advocate for robust sodium limits in procurement standards, nutrition standards in schools, and other government feeding
programs.
State• Promote public funding for Heart Disease and Stroke Prevention Programs.• Ensure the availability of essential CVD preventive benefits in private insurance and public health programs.
Fasting Plasma Glucose Ideal for cardiovascular health: Children and Adults: Fasting
blood glucose <100 mg/dL
Federal and State• Ensure adequate healthcare coverage for early treatment and prevention of diabetes mellitus.
For AHA advocacy resources, including fact sheets, policy briefs, published papers, and position statements, go to http://www.heart.org/HEARTORG/Advocate/ Poli cyResources/Policy-Resources_UCM_001135_SubHomePage.jsp.
AHA indicates American Heart Association; FDA, Food and Drug Administration; WHO, World Health Organization; UN, United Nations; CDC, Centers for Disease Control and Prevention; PA, physical activity; PE, physical education; DASH, Dietary Approaches to Stop Hypertension; HD, heart disease; and CVD, cardiovascular disease.
14.8 18.6
8.0
91.5
8.01.8 0.1
0.0
17.2
55.8
8.5
22.8
12.4 11.7
85.2
64.2
36.1
�.�
6�.1
85.5 88.2
0.0
20.0
40.0
60.0
80.0
100.0
CurrentSmoking
Body MassIndex
PhysicalActivity
Healthy DietScore*
TotalCholesterol
Blood PressureFasting PlasmaGlucose
Perc
enta
ge
Poor Intermediate Ideal
Chart 2-1. Prevalence (unadjusted) estimates for poor, intermediate, and ideal cardiovascular health for each of the 7 metrics of cardio-vascular health in the American Heart Association 2020 goals, US children aged 12 to 19 years, National Health and Nutrition Examination Survey (NHANES) 2009-2010* (available data as of June 1, 2012). *Healthy Diet Score reflects 2007-2008 NHANES data.
by guest on December 16, 2013http://circ.ahajournals.org/Downloaded from

e26 Circulation January 1/8, 2013
0
5
10
15
20
25
30
35
40
1 2 3 4 5 6
Perc
enta
ge
Number of Criteria MetTotal Male Female
Chart 2-3. Proportion (unadjusted) of US children aged 12 to 19 years meeting different numbers of criteria for Ideal Cardiovascular Health, overall and by sex, National Health and Nutrition Examination Survey (NHANES) 2007-2008 (available data as of June 1, 2012).
20.6
35.7
48.0
79.0
13.0 14.08.1
3.1
33.0 10.9
20.7
39.7 41.8
34.5
76.2
31.341.1
�.3
47.3 44.3
�7.4
0.0
20.0
40.0
60.0
80.0
100.0
CurrentSmoking
Body MassIndex
PhysicalActivity
Healthy DietScore*
TotalCholesterol
Blood Pressure Fasting PlasmaGlucose
Perc
enta
ge
Poor Intermediate Ideal
Chart 2-2. Age-standardized prevalence estimates for poor, intermediate, and ideal cardiovascular health for each of the 7 metrics of cardiovascular health in the American Heart Association 2020 goals, among US adults aged ≥20 years, National Health and Nutrition Examination Survey (NHANES) 2009-2010* (available data as of June 1, 2012). *Healthy Diet Score reflects 2007-2008 NHANES data
by guest on December 16, 2013http://circ.ahajournals.org/Downloaded from

Heart Disease and Stroke Statistics—2013 Update: Chapter 2 e27
0
5
10
15
20
25
30
35
40
0 1 2 3 4 5 6
Perc
enta
ge
Number of Criteria MetTotal Age 20-39 Age 40-59 Age 60+ Male Female
Chart 2-4. Age-standardized prevalence estimates of US adults aged ≥20 years meeting different numbers of criteria for Ideal Cardiovas-cular Health, overall and by age and sex subgroups, National Health and Nutrition Examination Survey (NHANES) 2007-2008 (available data as of June 1, 2012).
0
5
10
15
20
25
30
35
40
0 1 2 3 4 5 6
Perc
enta
ge
Number of Criteria Met
Total Whites Blacks Mexican-Americans Other Races
Chart 2-5. Age-standardized prevalence estimates of US adults aged ≥20 years meeting different numbers of criteria for Ideal Cardiovas-cular Health, overall and in selected race subgroups from National Health and Nutrition Examination Survey (NHANES) 2007-2008 (avail-able data as of June 1, 2012).
by guest on December 16, 2013http://circ.ahajournals.org/Downloaded from
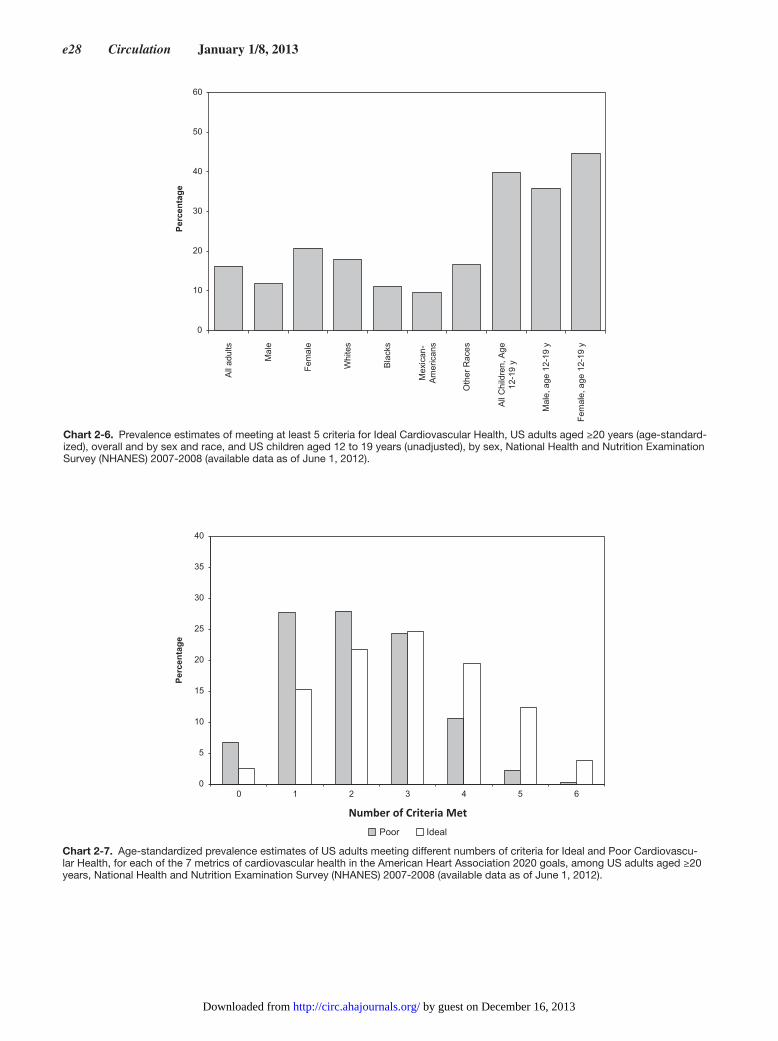
e28 Circulation January 1/8, 2013
0
5
10
15
20
25
30
35
40
0 1 2 3 4 5 6
Perc
enta
ge
Number of Criteria Met
Poor Ideal
Chart 2-7. Age-standardized prevalence estimates of US adults meeting different numbers of criteria for Ideal and Poor Cardiovascu-lar Health, for each of the 7 metrics of cardiovascular health in the American Heart Association 2020 goals, among US adults aged ≥20 years, National Health and Nutrition Examination Survey (NHANES) 2007-2008 (available data as of June 1, 2012).
0
10
20
30
40
50
60
All a
dults
Mal
e
Fem
ale
Whi
tes
Blac
ks
Mex
ican
-Am
eric
ans
Oth
er R
aces
All C
hild
ren,
Age
12-1
9 y
Mal
e, a
ge 1
2-19
y
Fem
ale,
age
12-
19 y
Perc
enta
ge
Chart 2-6. Prevalence estimates of meeting at least 5 criteria for Ideal Cardiovascular Health, US adults aged ≥20 years (age-standard-ized), overall and by sex and race, and US children aged 12 to 19 years (unadjusted), by sex, National Health and Nutrition Examination Survey (NHANES) 2007-2008 (available data as of June 1, 2012).
by guest on December 16, 2013http://circ.ahajournals.org/Downloaded from

Heart Disease and Stroke Statistics—2013 Update: Chapter 2 e29
0
10
20
30
40
50
60
70
80
90
100
1999-2000 2001-2002 2003-2004 2005-2006 2007-2008 2009-2010
SmokingBody Mass IndexHealthy Diet Score† Total CholesterolBlood PressureFas�ng Plasma GlucosePhysical Ac�vity*
Chart 2-8. Trends in prevalence (unadjusted) of meeting criteria for Ideal Cardiovascular Health, for each of the 7 metrics of cardiovas-cular health in the American Heart Association 2020 goals, among US children aged 12 to 19 years, National Health and Nutrition Exami-nation Survey (NHANES) 1999-2000 through 2009-2010*† (available data as of June 1, 2012). *Due to changes in the physical activity questionnaire between different cycles of the NHANES survey, trends over time for this indicator should be interpreted with caution and statistical comparisons should not be attempted. †Data for the Healthy Diet Score, based on a 2-day average intake, was only available for the 2003-2004, 2005-2006, and 2007-2008 NHANES cycles at the time of this analysis.
0
10
20
30
40
50
60
70
80
90
1999-2000 2001-2002 2003-2004 2005-2006 2007-2008 2009-2010
SmokingBody Mass IndexHealthy Diet Score†Total CholesterolBlood PressureFas�ng Plasma GlucosePhysical Ac�vity*
Chart 2-9. Age-standardized trends in prevalence of meeting criteria for Ideal Cardiovascular Health, for each of the 7 metrics of cardio-vascular health in the American Heart Association 2020 goals, among US adults aged ≥20 years, National Health and Nutrition Exami-nation Survey (NHANES) 1999-2000 through 2009-2010 (available data as of June 1, 2012). *Due to changes in the physical activity questionnaire between different cycles of the NHANES survey, trends over time for this indicator should be interpreted with caution and statistical comparisons should not be attempted. †Data for the Healthy Diet Score, based on a 2-day average intake, was only available for the 2003-2004, 2005-2006, and 2007-2008 NHANES cycles at the time of this analysis.
by guest on December 16, 2013http://circ.ahajournals.org/Downloaded from
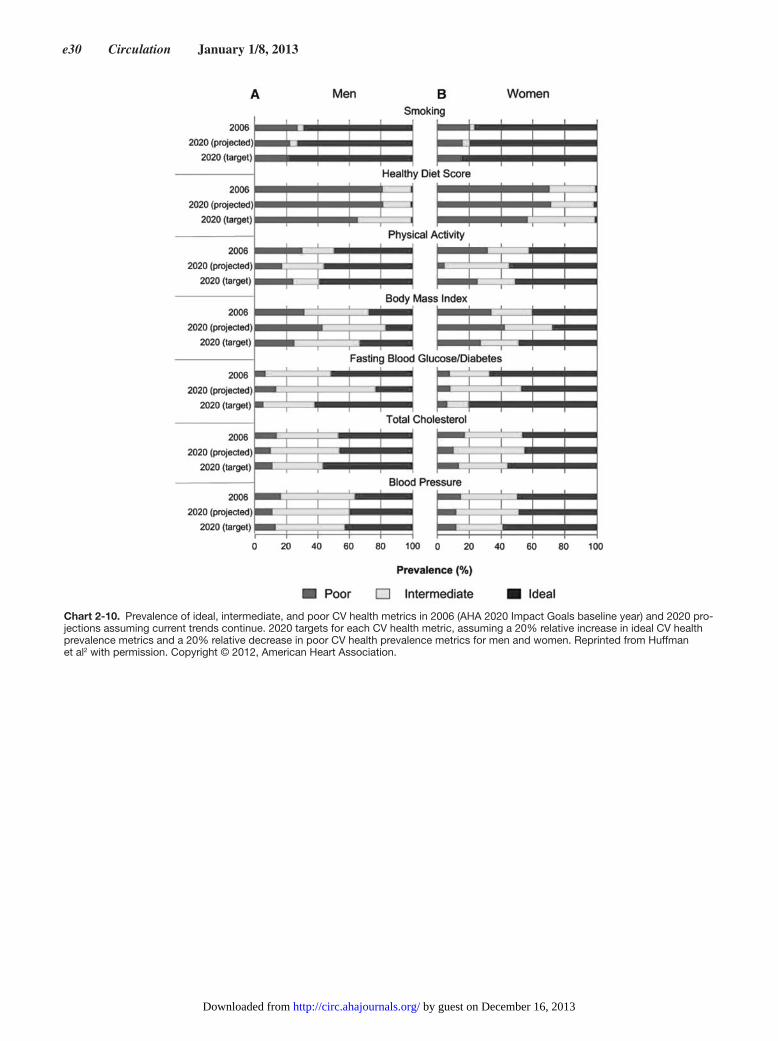
e30 Circulation January 1/8, 2013
Chart 2-10. Prevalence of ideal, intermediate, and poor CV health metrics in 2006 (AHA 2020 Impact Goals baseline year) and 2020 pro-jections assuming current trends continue. 2020 targets for each CV health metric, assuming a 20% relative increase in ideal CV health prevalence metrics and a 20% relative decrease in poor CV health prevalence metrics for men and women. Reprinted from Huffman et al2 with permission. Copyright © 2012, American Heart Association.
by guest on December 16, 2013http://circ.ahajournals.org/Downloaded from
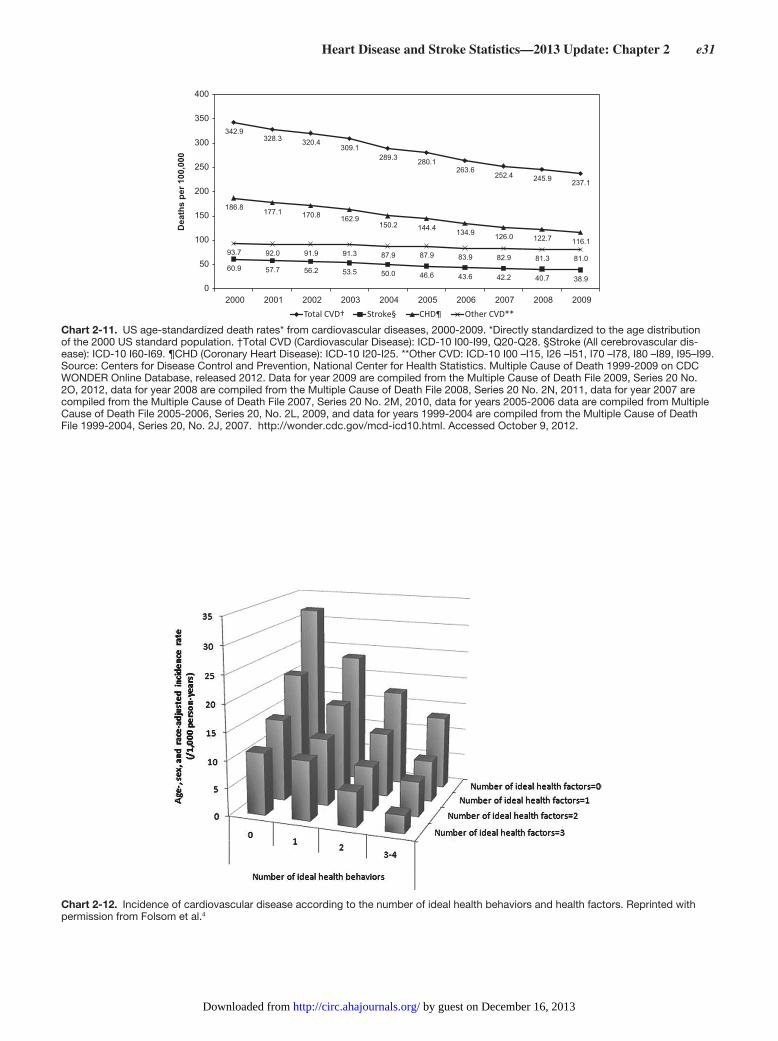
Heart Disease and Stroke Statistics—2013 Update: Chapter 2 e31
Chart 2-12. Incidence of cardiovascular disease according to the number of ideal health behaviors and health factors. Reprinted with permission from Folsom et al.4
342.9328.3 320.4
309.1289.3 280.1
263.6252.4 245.9 237.1
60.9 57.7 56.2 53.5 50.0 46.6 43.6 42.2 40.7 38.9
186.8 177.1 170.8 162.9150.2 144.4 134.9 126.0 122.7 116.1
93.7 92.0 91.9 91.3 87.9 87.9 83.9 82.9 81.3 81.0
0
50
100
150
200
250
300
350
400
2000 2001 2002 2003 2004 2005 2006 2007 2008 2009
Dea
ths
per 1
00,0
00
Total CVD† Stroke§ CHD¶ Other CVD**
Chart 2-11. US age-standardized death rates* from cardiovascular diseases, 2000-2009. *Directly standardized to the age distribution of the 2000 US standard population. †Total CVD (Cardiovascular Disease): ICD-10 I00-I99, Q20-Q28. §Stroke (All cerebrovascular dis-ease): ICD-10 I60-I69. ¶CHD (Coronary Heart Disease): ICD-10 I20-I25. **Other CVD: ICD-10 I00 –I15, I26 –I51, I70 –I78, I80 –I89, I95–I99. Source: Centers for Disease Control and Prevention, National Center for Health Statistics. Multiple Cause of Death 1999-2009 on CDC WONDER Online Database, released 2012. Data for year 2009 are compiled from the Multiple Cause of Death File 2009, Series 20 No. 2O, 2012, data for year 2008 are compiled from the Multiple Cause of Death File 2008, Series 20 No. 2N, 2011, data for year 2007 are compiled from the Multiple Cause of Death File 2007, Series 20 No. 2M, 2010, data for years 2005-2006 data are compiled from Multiple Cause of Death File 2005-2006, Series 20, No. 2L, 2009, and data for years 1999-2004 are compiled from the Multiple Cause of Death File 1999-2004, Series 20, No. 2J, 2007. http://wonder.cdc.gov/mcd-icd10.html. Accessed October 9, 2012.
by guest on December 16, 2013http://circ.ahajournals.org/Downloaded from
e32 Circulation January 1/8, 2013
3. Smoking/Tobacco Use
See Table 3-1 and Charts 3-1 and 3-2.
Prevalence
Youth(See Chart 3-1 .)
●● In 2011, in grades 9 through 12:
● — 18 .1% of students reported current cigarette use (on at least 1 day during the 30 days before the survey), 13 .1% of students reported current cigar use, and 7 .7% of stu-dents reported current smokeless tobacco use . Overall, 23 .4% of students reported any current tobacco use (Youth Risk Behavior Survey [YRBS]; Chart 3-1) .1
● — Male students were more likely than female students to report current cigarette use (19 .9% compared with 16 .1%) . Male students were also more likely than female students to report current cigar use (17 .8% com-pared with 8 .0%) and current smokeless tobacco use (12 .8% compared with 2 .2%; YRBS) .1
● — Non-Hispanic white students were more likely than Hispanic or non-Hispanic black students to report any current tobacco use, which includes cigarettes, cigars, or smokeless tobacco (26 .5% compared with 20 .5% for Hispanic students and 15 .4% for non-Hispanic black students; YRBS) .1
●● Among youths 12 to 17 years of age in 2010, 2 .6 million (10 .7%) used a tobacco product (cigarettes, cigars, or smoke-less tobacco) in the past month, and 2 .0 million (8 .3%) used cigarettes . Cigarette use in the past month in this age group declined significantly from 13 .0% in 2002 to 8 .3% in 2010 (National Survey on Drug Use and Health [NSDUH]) .2
●● Data from the YRBS3 for students in grades 9 to 12 indicated the following:
● — The percentage of students who reported ever trying cigarettes remained stable from 1991 to 1999 and then declined from 70 .4% in 1999 to 44 .7% in 2011 .
● — The percentage who reported current cigarette use (on at least 1 day in the 30 days before the survey) increased between 1991 and 1997 and then declined from 36 .4% in 1997 to 18 .1% in 2011 .
● — The percentage who reported current frequent cigarette use (smoked on ≥20 of the 30 days before the survey) increased from 1991 to 1999 and then declined from 16 .8% in 1999 to 6 .4% in 2011 .
●● In 2011, 49 .9% of students in grades 9 to 12 who currently smoked cigarettes had tried to quit smoking cigarettes dur-ing the previous 12 months . The prevalence of this behav-ior was higher among female student smokers (53 .9%) than among male student smokers (47 .0%) and among white females (54 .0%) and Hispanic females (55 .9%) than among white males (46 .3%) and Hispanic males (44 .7%; YRBS) .1
Adults(See Table 3-1 and Chart 3-2 .)
●● In 2011, among adults ≥18 years of age:
● — 21 .3% of men and 16 .7% of women were current ciga-rette smokers (NHIS) .5
● — The percentage of current cigarette smokers (19 .0%) declined 21% since 1998 (24 .1%) .5–7
● — The states with the highest percentage of current ciga-rette smokers were Kentucky (29 .0%), West Virginia (28 .6%), and Arkansas (27 .0%) . Utah has the lowest percentage of smokers (11 .8%) (BRFSS) .4
●● In 2010, an estimated 69 .6 million Americans ≥12 years of age were current (past month) users of a tobacco product (cig-arettes, cigars, smokeless tobacco, or tobacco in pipes) . The rate of current use of any tobacco product in this age range declined from 2007 to 2010 (from 28 .6% to 27 .4%; NSDUH) .2
●● From 1998 to 2007, cigarette smoking prevalence among adults ≥18 years of age decreased in 44 states and the Dis-trict of Columbia . Six states had no substantial changes in prevalence after controlling for age, sex, and race/ethnicity (BRFSS) .8
●● In 2008 to 2010, among people ≥65 years of age, 9 .4% of men and 9 .1% of women were current smokers . In this age group, men were more likely than women to be former smokers (54 .0% compared with 30 .0%) on the basis of age-adjusted estimates (NHIS) .9
●● In 2008 to 2010, among adults ≥18 years of age, Asian men (15 .2%) and Hispanic men (17 .3%) were less likely to be current cigarette smokers than non-Hispanic black men (23 .7%), non-Hispanic white men (23 .9%), and American Indian or Alaska Native men (24 .6%) on the basis of age-adjusted estimates (NHIS) . Similarly, in 2008 to 2010, Asian women (5 .5%) and Hispanic women (9 .6%) were less likely to be current cigarette smokers than non-Hispanic black women (17 .6%), non-Hispanic white women (20 .9%), and American Indian or Alaska Native women (20 .7%; NHIS) .9
●● In 2004 to 2006 data, adult cigarette smoking varied among Asian subgroups . Most Asian adults had never smoked, with rates ranging from 65% of Korean adults to 84% of Chinese adults . Korean adults (22%) were approximately 2 to 3 times as likely to be current smokers as Japanese (12%), Asian Indian (7%), or Chinese (7%) adults on the basis of age-adjusted estimates (NHIS) .10
●● In 2009 to 2010, among women 15 to 44 years of age, past-month cigarette use was lower for those who were preg-nant (16 .3%) than among those who were not pregnant
Abbreviations Used in Chapter 3
AMI acute myocardial infarction
BRFSS Behavioral Risk Factor Surveillance System
CHD coronary heart disease
CI confidence interval
CVD cardiovascular disease
MEPS Medical Expenditure Panel Survey
NH non-Hispanic
NHANES National Health and Nutrition Examination Survey
NHIS National Health Interview Survey
NSDUH National Survey on Drug Use and Health
RR relative risk
YRBS Youth Risk Behavior Survey
by guest on December 16, 2013http://circ.ahajournals.org/Downloaded from
Heart Disease and Stroke Statistics—2013 Update: Chapter 3 e33
(26 .7%) . This pattern was found for women 18 to 25 years of age (22 .7% versus 31 .2% for pregnant and nonpregnant women, respectively) and for women 26 to 44 years of age (11 .8% versus 27 .0%, respectively) . Among adolescents 15 to 17 years of age, past-month cigarette use was higher for those who were pregnant (22 .7%) than for those who were not pregnant (13 .4%; NSDUH) .2
Incidence
●● In 2010:
● — ≈2 .4 million people ≥12 years of age smoked cigarettes for the first time within the past 12 months, which was similar to the estimate in 2009 (2 .5 million) . The 2010 estimate averages out to ≈6500 new cigarette smokers every day . Most new smokers (58 .8%) in 2010 were <18 years of age when they first smoked cigarettes (NSDUH) . 2
● — The number of new smokers <18 years of age (1 .4 mil-lion) is similar to that in 2002 (1 .3 million); however, new smokers ≥18 years of age increased from ≈600 000 in 2002 to 1 million in 2010 (NSDUH) .2
● — Among people ages 12 to 49 years of age who had started smoking within the past 12 months, the average age of first cigarette use was 17 .3 years, similar to the average in 2009 (17 .5 years) .2
●● Data from 2002 to 2004 suggest that ≈1 in 5 nonsmokers 12 to 17 years of age is likely to start smoking . Youths in the Mexican subpopulations were significantly more susceptible (28 .8%) to start smoking than those in non-Hispanic white (20 .8%), non-Hispanic black (23 .0%), Cuban (16 .4%), Asian Indian (15 .4%), Chinese (15 .3%), and Vietnamese (13 .8%) subpopulations . There was no significant difference in susceptibility to start smoking between boys and girls in any of the major populations or subpopulations (NSDUH) .11
MorbidityA 2010 report of the US Surgeon General on how tobacco causes disease summarizes an extensive body of literature on smoking and CVD and the mechanisms through which smok-ing is thought to cause CVD . Among its conclusions are the following:
●● There is a sharp increase in CVD risk with low levels of exposure to cigarette smoke, including secondhand smoke, and a less rapid further increase in risk as the number of cigarettes per day increases .
●● A meta-analysis comparing pooled data of ≈2 .4 mil-lion smokers and nonsmokers found the relative risk (RR) ratio of smokers to nonsmokers for developing CHD was 25% higher in women than in men (95% CI, 1 .12–1 .39) .12
●● Current smokers have a 2 to 4 times increased risk of stroke compared with nonsmokers or those who have quit for >10 years .13,14
Mortality
●● In 2005, tobacco smoking was the cause of ≈467 000 adult deaths (19 .1%) in the United States . Approximately one third of these deaths were related to CVD .15
●● During 2000 to 2004, ≈49 000 (11 .1%) of cigarette smok-ing–related deaths were attributable to secondhand smoke .16
●● Each year from 2000 to 2004, smoking caused 3 .1 million years of potential life lost for males and 2 .0 million years for females, excluding deaths attributable to smoking-attributable residential fires and adult deaths attributable to secondhand smoke .16
●● From 2000 to 2004, smoking during pregnancy resulted in an estimated 776 infant deaths annually .16
●● During 2000 to 2004, cigarette smoking resulted in an esti-mated 269 655 deaths annually among males and 173 940 deaths annually among females .16
●● On average, male smokers die 13 .2 years earlier than male nonsmokers, and female smokers die 14 .5 years earlier than female nonsmokers .17
Smoking Cessation
●● Smoking cessation reduces the risk of cardiovascular mor-bidity and mortality for smokers with and without CHD .
● — There is no evidence to date that reducing the amount smoked by smoking fewer cigarettes per day reduces the risk of CVD .18
●● In 2008, 64 .5% of adult current smokers ≥18 years of age with a checkup during the preceding year reported that they had been advised to quit, which was not significantly differ-ent from 2002 (63 .1%) . Smokers between 18 and 44 years of age were less likely to be advised to quit than those at older ages . Women were more likely than men to receive advice to quit smoking (MEPS) .19
Secondhand Smoke
●● Data from a 2006 report of the US Surgeon General on the consequences of involuntary exposure to tobacco smoke20 indicate the following:
● — Nonsmokers who are exposed to secondhand smoke at home or at work increase their risk of developing CHD by 25% to 30% .
● — Short exposures to secondhand smoke can cause blood platelets to become stickier, damage the lining of blood vessels, and decrease coronary flow veloc-ity reserves, potentially increasing the risk of an acute MI (AMI) .
●● In 2008, data from 11 states showed that the majority of people surveyed in each state reported having smoke-free home rules, ranging from 68 .8% in West Virginia to 85 .6% in Arizona (BRFSS) .21
●● As of December 31, 2010, 25 states and the District of Columbia had laws that prohibited smoking in indoor areas of worksites, restaurants, and bars; no states had such laws in 2000 . As of December 31, 2010, an additional 10 states had laws that prohibited smoking in 1 or 2 but not all 3 venues .22
by guest on December 16, 2013http://circ.ahajournals.org/Downloaded from

e34 Circulation January 1/8, 2013
●● Pooled data from 17 studies in North America, Europe, and Australasia suggest that smoke-free legislation can reduce the incidence of acute coronary events by 10% .23
●● The percentage of the US nonsmoking population with detectable serum cotinine declined from 52 .5% in 1999 to 2000 to 40 .1% in 2007 to 2008, with declines occurring for children and adults . During 2007 to 2008, the percentage of nonsmokers with detectable serum cotinine was higher for those 3 to 11 years of age (53 .6%) and those 12 to 19 years of age (46 .5%) than for those ≥20 years of age (36 .7%); the percentage was also higher for non-Hispanic blacks (55 .9%) than for non-Hispanic whites (40 .1%) and Mexican Americans (28 .5%; NHANES) .24
Cost
●● Direct medical costs ($96 billion) and lost productivity costs ($97 billion) associated with smoking totaled an esti-mated $193 billion per year between 2000 and 2004 .16
●● In 2008, $9 .94 billion was spent on marketing cigarettes in the United States .25
●● Cigarette prices have increased 283% between the early 1980s and 2011, resulting in decreased sales from ≈30 mil-lion packs sold in 1982 to ≈14 million packs sold in 2011 .25
References 1 . Eaton DK, Kann L, Kinchen S, Shanklin S, Flint KH, Hawkins J, Harris
WA, Lowry R, McManus T, Chyen D, Whittle L, Lim C, Wechsler H; Cen-ters for Disease Control and Prevention . Youth risk behavior surveillance: United States, 2011 . MMWR Surveill Summ . 2012;61:1–162 .
2 . Substance Abuse and Mental Health Services Administration . Results from the 2010 National Survey on Drug Use and Health: National Find-ings, Detailed Tables . http://oas .samhsa .gov/NSDUH/2k10NSDUH/tabs/Cover .pdf . Accessed May 30, 2012 .
3 . Centers for Disease Control and Prevention . Behavioral Risk Factor Sur-veillance System: 2011 prevalence and trends data . http://apps .nccd .cdc .gov/brfss/index .asp . Accessed November 30, 2012 .
4 . Centers for Disease Control and Prevention . Behavioral Risk Factor Sur-veillance System: 2011 prevalence and trends data . http://apps .nccd .cdc .gov/brfss/index .asp . Accessed November 30, 2012 .
5 . Schiller J, Lucas J, Peregoy J . Summary health statistics for U .S . adults: National Health Interview Survey, 2011 . Vital Health Stat 10 . In press .
6 . Centers for Disease Control and Prevention (CDC) . Cigarette smok-ing among adults and trends in smoking cessation: United States, 2008 . MMWR Morb Mortal Wkly Rep . 2009;58:1227–1232 .
7 . Centers for Disease Control and Prevention (CDC) . Vital signs: current cigarette smoking among adults aged ≥18 years: United States, 2005--2010 . MMWR Morb Mortal Wkly Rep . 2011;60:1207–1212 .
8 . Centers for Disease Control and Prevention (CDC) . State-specific preva-lence and trends in adult cigarette smoking: United States, 1998–2007 . MMWR Morb Mortal Wkly Rep . 2009;58:221–226 .
9 . Centers for Disease Control and Prevention, National Center for Health Statistics . Health Data Interactive . http://www .cdc .gov/nchs/hdi .htm . Accessed July 19, 2011 .
10 . Barnes PM, Adams PF, Powell-Griner E . Health Characteristics of the Asian Adult Population: United States, 2004–2006 . Advance Data From Vital and Health Statistics; No . 394 . Hyattsville, Md: National Center for Health Statistics; 2008 .
11 . Centers for Disease Control and Prevention (CDC) . Racial/ethnic dif-ferences among youths in cigarette smoking and susceptibility to start
smoking: United States, 2002–2004 . MMWR Morb Mortal Wkly Rep . 2006;55:1275–1277 .
12 . Huxley RR, Woodward M . Cigarette smoking as a risk factor for coro-nary heart disease in women compared with men: a systematic review and meta-analysis of prospective cohort studies . Lancet . 2011;378:1297–1305 .
13 . Goldstein LB, Bushnell CD, Adams RJ, Appel LJ, Braun LT, Chaturvedi S, Creager MA, Culebras A, Eckel RH, Hart RG, Hinchey JA, Howard VJ, Jauch EC, Levine SR, Meschia JF, Moore WS, Nixon JV, Pearson TA . Guidelines for the primary prevention of stroke: a guideline for healthcare professionals from the American Heart Association/American Stroke As-sociation [published correction appears in Stroke . 2011;42:e26] . Stroke . 2011;42:517–584 .
14 . Shah RS, Cole JW . Smoking and stroke: the more you smoke the more you stroke . Expert Rev Cardiovasc Ther . 2010;8:917–932 .
15 . Danaei G, Ding EL, Mozaffarian D, Taylor B, Rehm J, Murray CJ, Ez-zati M . The preventable causes of death in the United States: com-parative risk assessment of dietary, lifestyle, and metabolic risk factors [published correction appears in PLoS Med . 2011;8(1) . doi:10 .1371/annotation/0ef47acd-9dcc-4296-a897-872d182cde57] . PLoS Med . 2009;6:e1000058 .
16 . Centers for Disease Control and Prevention (CDC) . Smoking-attrib-utable mortality, years of potential life lost, and productivity losses: United States, 2000–2004 . MMWR Morb Mortal Wkly Rep . 2008;57: 1226–1228 .
17 . The 2004 United States Surgeon General’s Report: The Health Conse-quences of Smoking . N S W Public Health Bull . 2004;15:107 .
18 . US Department of Health and Human Services . How Tobacco Smoke Causes Disease: The Biology and Behavioral Basis for Smoking-Attrib-utable Disease: A Report of the Surgeon General. Atlanta, Ga: US De-partment of Health and Human Services, Centers for Disease Control and Prevention, National Center for Chronic Disease Prevention and Health Promotion, Office on Smoking and Health; 2010 .
19 . Agency for Healthcare Research and Quality . 2011 National Healthcare Quality & Disparities Reports. Rockville, Md: US Department of Health and Human Services, Agency for Healthcare Research and Quality; 2012 . http://www .ahrq .gov/qual/qrdr11/9_lifestylemodification/T9_1_1_1 .htm . Accessed May 30, 2012 .
20 . US Department of Health and Human Services . The Health Consequences of Involuntary Exposure to Tobacco Smoke: A Report of the Surgeon Gen-eral. Atlanta, Ga: US Department of Health and Human Services, Cen-ters for Disease Control and Prevention, Coordinating Center for Health Promotion, National Center for Chronic Disease Prevention and Health Promotion, Office on Smoking and Health; 2006 .
21 . Centers for Disease Control and Prevention (CDC) . State-specific second-hand smoke exposure and current cigarette smoking among adults: United States, 2008 . MMWR Morb Mortal Wkly Rep . 2009;58:1232–1235 .
22 . Centers for Disease Control and Prevention (CDC) . State smoke-free laws for worksites, restaurants, and bars: United States, 2000–2010 . MMWR Morb Mortal Wkly Rep . 2011;60:472–475 .
23 . Mackay DF, Irfan MO, Haw S, Pell JP . Meta-analysis of the effect of comprehensive smoke-free legislation on acute coronary events . Heart . 2010;96:1525–1530 .
24 . Centers for Disease Control and Prevention (CDC) . Vital signs: nonsmok-ers’ exposure to secondhand smoke: United States, 1999–2008 . MMWR Morb Mortal Wkly Rep . 2010;59:1141–1146 .
25 . US Department of Health and Human Services . Preventing Tobacco Use Among Youth and Young Adults: A Report of the Surgeon General. Atlanta, GA: US Department of Health and Human Services, Centers for Disease Control and Prevention, National Center for Chronic Disease Prevention and Health Promotion, Office on Smoking and Health; 2012 . http://www .surgeongeneral .gov/library/reports/preventing-youth-tobacco-use/prevent_youth_by_section .html . Accessed May 30, 2012 .
by guest on December 16, 2013http://circ.ahajournals.org/Downloaded from
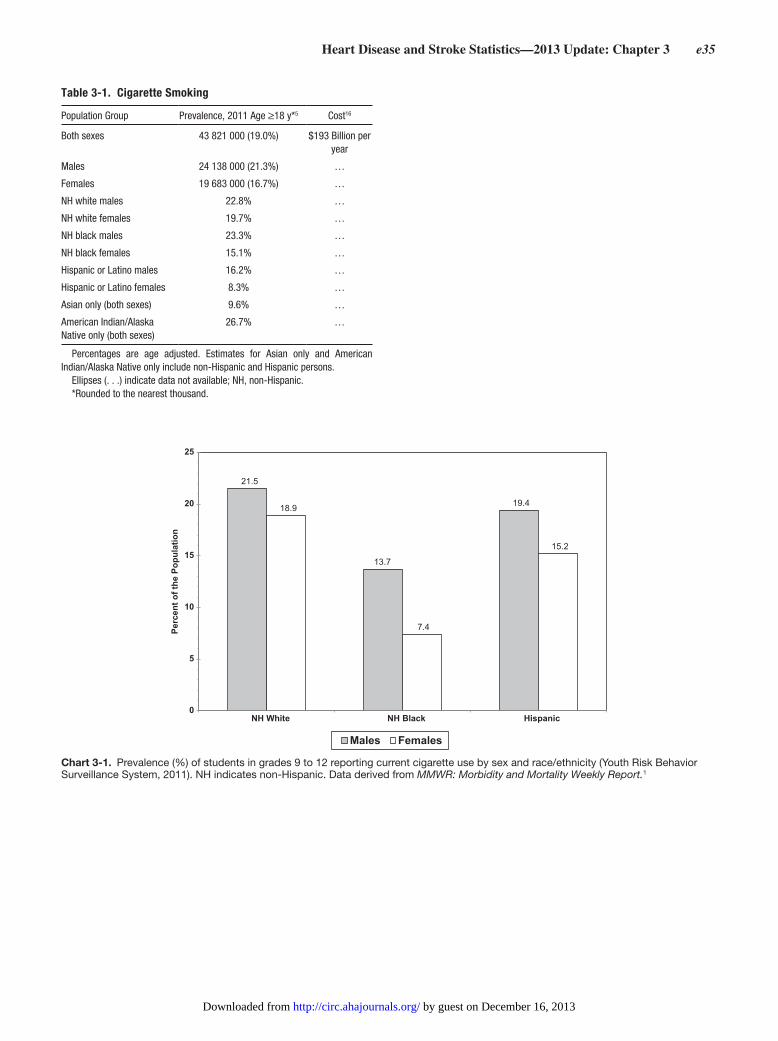
Heart Disease and Stroke Statistics—2013 Update: Chapter 3 e35
Table 3-1. Cigarette Smoking
Population Group Prevalence, 2011 Age ≥18 y*5 Cost16
Both sexes 43 821 000 (19.0%) $193 Billion per year
Males 24 138 000 (21.3%) …
Females 19 683 000 (16.7%) …
NH white males 22.8% …
NH white females 19.7% …
NH black males 23.3% …
NH black females 15.1% …
Hispanic or Latino males 16.2% …
Hispanic or Latino females 8.3% …
Asian only (both sexes) 9.6% …
American Indian/Alaska Native only (both sexes)
26.7% …
Percentages are age adjusted. Estimates for Asian only and American Indian/Alaska Native only include non-Hispanic and Hispanic persons.
Ellipses (. . .) indicate data not available; NH, non-Hispanic.*Rounded to the nearest thousand.
Chart 3-1. Prevalence (%) of students in grades 9 to 12 reporting current cigarette use by sex and race/ethnicity (Youth Risk Behavior Surveillance System, 2011). NH indicates non-Hispanic. Data derived from MMWR: Morbidity and Mortality Weekly Report.1
21.5
13.7
19.418.9
7.4
15.2
0
5
10
15
20
25
NH White NH Black Hispanic
Perc
ent o
f the
Pop
ulat
ion
Males Females
by guest on December 16, 2013http://circ.ahajournals.org/Downloaded from
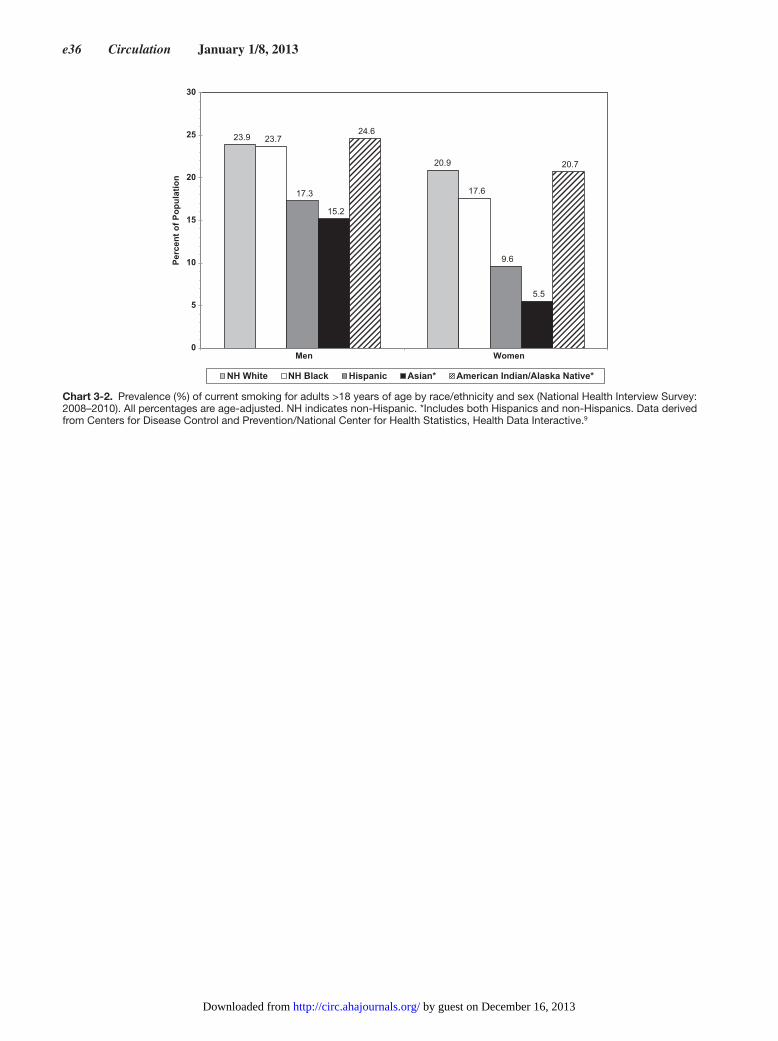
e36 Circulation January 1/8, 2013
Chart 3-2. Prevalence (%) of current smoking for adults >18 years of age by race/ethnicity and sex (National Health Interview Survey: 2008–2010). All percentages are age-adjusted. NH indicates non-Hispanic. *Includes both Hispanics and non-Hispanics. Data derived from Centers for Disease Control and Prevention/National Center for Health Statistics, Health Data Interactive.9
23.9
20.9
23.7
17.617.3
9.6
15.2
5.5
24.6
20.7
0
5
10
15
20
25
30
Men Women
Perc
ent o
f Pop
ulat
ion
NH White NH Black Hispanic Asian* American Indian/Alaska Native*
by guest on December 16, 2013http://circ.ahajournals.org/Downloaded from

Heart Disease and Stroke Statistics—2013 Update: Chapter 4 e37
4. Physical Inactivity
See Table 4-1 and Charts 4-1 through 4-5.
Prevalence
Youth
Inactivity(See Chart 4-1 .)
●● The proportion of adolescents (grades 9–12) who report engaging in no regular PA is high and varies by sex and race .1
●● Nationwide, 13 .8% of adolescents were inactive during the previous 7 days, as indicated by their response that they did not participate in ≥60 minutes of any kind of PA that increased their heart rate and made them breathe hard on any 1 of the previous 7 days .1
●● Girls were more likely than boys to report inactivity (17 .7% versus 10 .0%) .1
●● The prevalence of inactivity was highest among black (26 .7%) and Hispanic (21 .3%) girls, followed by white girls (13 .7%), black boys (12 .3%), Hispanic boys (10 .7%), and white boys (8 .5%) .1
●● A study of 3068 youths between 14 and 24 years of age from 1999 to 2006 found that the prevalence of inactivity went up with age for both boys and girls . Across ages, girls had a higher prevalence of physical inactivity than boys .2
●● In a study of 12 812 youth 9 to 18 years of age, the PA level in boys and girls declined starting at the age of 13, with a significantly greater decline in activity among girls .3
Television/Video/Computers(See Chart 4-2 .)
In 2011:
●● Nationwide, 31 .1% of adolescents used a computer for activities other than school work (eg, videogames or other computer games) for ≥3 hours per day on an average school day .1
●● The prevalence of using computers or watching television ≥3 hours per day was highest among black (41 .1%) and Hispanic boys (36 .3%), followed by white boys (33 .3%), black girls (35 .2%), Hispanic girls (28 .3%), and white girls (22 .6%) .1
●● 32 .4% of adolescents watched television for ≥3 hours per day .1
●● The prevalence of watching television ≥3 hours per day was highest among black girls (54 .9%) and boys (54 .4%), followed by Hispanic boys (38 .4%) and girls (37 .2%) and white boys (27 .3%) and girls (23 .9%) .1
●● Increased television time has significant nutritional associations with weight gain (refer to Chapter 5, Nutrition) .
Activity Recommendations(See Charts 4-3 and 4-4 .)
●● In 2011, the proportion of students who met activity rec-ommendations of at● least●60 minutes of PA on 7 days of the week was 28 .7% nationwide and declined from 9th
(30 .7%) to 12th (25 .1%) grades . At each grade level, the proportion was higher in boys than in girls .1
●● In 2011, more high school boys (38 .3%) than girls (18 .5%) self-reported having been physically active at least 60 min-utes per day on all● 7 days; self-reported rates of activity were higher in white (30 .4%) than in black (26 .0%) or His-panic (26 .5%) adolescents .1
●● The 2010 National Youth Physical Activity and Nutrition Study showed that a total of 15 .3% of high school students met the recommendations for aerobic activity, 51 .0% met the recommendations for muscle-strengthening activity, and 12 .2% met the recommendations for both aerobic and muscle-strengthening activities .4
●● There was a marked discrepancy between the proportion of youth (ages 6–11 years) who reported engaging in ≥60 minutes of moderate-to-vigorous PA on most days of the week and those who actually engaged in moderate-to-vigorous PA for ≥60 minutes when activity was measured objectively with accelerometers (ie, portable motion sen-sors that record and quantify the duration and intensity of movements) in the NHANES 2003–2004 survey .5
●● On the basis of accelerometer counts per minute >2020, 42% of 6- to 11-year-olds accumulated ≥260 minutes of moderate-to-vigorous PA on ≥5 days per week, whereas only 8% of 12-to 15-year-olds and 7 .6% of 16- to 19-year-olds achieved similar counts .5
●● More boys than girls met PA recommendations (≥60 min-utes of moderate-to-vigorous activity on most days of the week) as measured by accelerometry .5
Abbreviations Used in Chapter 4
BP blood pressure
CARDIA Coronary Artery Risk Development in Young Adults
CHD coronary heart disease
CI confidence interval
CVD cardiovascular disease
DBP diastolic blood pressure
DM diabetes mellitus
EF ejection fraction
FMD flow-mediated dilation
HbA1c hemoglobin A1c
HBP high blood pressure
HDL high-density lipoprotein
HF heart failure
HR hazard ratio
MEPS Medical Expenditure Panel Survey
MI myocardial infarction
NH non-Hispanic
NHANES National Health and Nutrition Examination Survey
NHIS National Health Interview Survey
PA physical activity
PAD peripheral artery disease
RR relative risk
SBP systolic blood pressure
WHO World Health Organization
by guest on December 16, 2013http://circ.ahajournals.org/Downloaded from
e38 Circulation January 1/8, 2013
Structured Activity Participation
●● Despite recommendations from the National Associa-tion for Sport and Physical Education that schools should require daily physical education for students in kindergar-ten through 12th grade,6 only 51 .8% of students attended physical education classes in school daily (56 .7% of boys and 46 .7% of girls) .1
●● Physical education class participation declined from the 9th through the 12th grades among boys and girls .1
●● Little more than half (58 .4%) of high school students played on at least 1 school or community sports team in the previous year; however, the prevalence declined with increasing grade level, from 61 .4% in the 9th grade to 52 .5% in the 12th grade .1
Adults
InactivityAccording to 2011 data from the NHIS, in adults ≥18 years of age:
●● Thirty-two percent do not engage in leisure-time PA (“no lei-sure-time PA/inactivity” refers to no sessions of light/moder-ate or vigorous PA of at least 10 minutes duration per day) .7
●● Inactivity was higher among women than men (33 .2% versus 29 .9%, age-adjusted) and increased with age from 26 .1% to 33 .4%, 40 .0%, and 52 .4% among adults 18 to 44, 45 to 64, 65 to 74, and ≥75 years of age, respectively .7
●● Non-Hispanic black and Hispanic adults were more likely to be inactive (41 .1% and 42 .2%, respectively) than were non-Hispanic white adults (27 .7%) on the basis of age-adjusted estimates .7
Activity Recommendations(See Table 4-1 and Chart 4-5 .)
According to 2011 data from the NHIS, in adults ≥18 years of age:
●● 21 .0% met the 2008 federal PA guidelines for both aero-bic and strengthening activity, an important component of overall physical fitness .7
●● The age-adjusted proportion who reported engaging in moderate or vigorous PA that met the 2008 aerobic Physi-cal Activity Guidelines for Americans (at least 150 min-utes of moderate PA or 75 minutes of vigorous PA or an equivalent combination each week) was 48 .9%; 52 .7% of men and 45 .5% of women met the recommendations . Age-adjusted prevalence was 52 .5% for non-Hispanic whites, 41 .2% for non-Hispanic blacks, and 40 .1% for Hispanics .7
●● The proportion of respondents who did not meet the fed-eral PA guidelines increased with age from 44 .1% of 18- to 44-year-olds to 72 .6% of adults ≥75 years of age .7
●● Hispanic/Latino adults (59 .8%) and non-Hispanic black adults (58 .8%) were more likely to not meet the federal PA guidelines than non-Hispanic white (47 .4%) adults, according to age-adjusted estimates .7
●● The percentage of adults ≥25 years of age not meeting the full (aerobic and muscle-strengthening) federal PA guide-lines was inversely associated with education; partici-pants with no high school diploma (68 .4%), a high school diploma (59 .0%), some college (48 .2%), or a bachelor’s degree or higher (34 .0%), respectively, did not meet the full federal PA guidelines .7
●● The proportion of adults ≥25 years of age who met the 2008 federal PA guidelines for aerobic activity was posi-tively associated with education level: 62 .5% of those with a college degree or higher met the PA guidelines compared with 28 .6% of adults with less than a high school diploma .7
●● The proportion of adults reporting levels of PA consistent with the 2008 Physical Activity Guidelines for Americans remains low and decreases with age .8,9 Thirty-three percent of respondents in a study examining awareness of current US PA guidelines had direct knowledge of the recom-mended dosage of PA (ie, frequency/duration) .10
●● The percentage of adults reporting at least 150 minutes of moderate PA or 75 minutes of vigorous PA or an equivalent combination weekly decreased with age from 55 .8% for adults 18 to 44 years of age to 27 .4% for those ≥75 years of age, on the basis of the 2011 NHIS .9
●● The percentage of men who engaged in both leisure-time aerobic and strengthening activities decreased with age, from 39 .8% at age 18 to 24 years to 11 .1% at ≥75 years of age . The percentage of women who engaged in both leisure-time aerobic and strengthening activities also decreased with age, from 20 .7% at age 18 to 24 years to 5 .3% at ≥75 years of age, on the basis of the 2011 NHIS .9
●● Using PA recommendations that existed at the time of the survey, adherence to PA recommendations was much lower when based on PA measured by accelerometer in NHANES 2003–20045:
—Among adults 20 to 59 years of age, 3 .8% of men and 3 .2% of women met recommendations to engage in moderate-to-vigorous PA (accelerometer counts >2020/min) for 30 minutes (in sessions of ≥10 minutes) on ≥5 of 7 days .
—Among those ≥60 years of age, adherence was 2 .5% in men and 2 .3% in women .
●● Accelerometry data from NHANES 2003–2006 showed that men engaged in 35 minutes of moderate activity per day, whereas for women, it was 21 minutes . More than 75% of moderate activity was accumulated in 1-minute bouts . Levels of activity declined sharply after the age of 50 years in all groups .11
●● In a review examining self-reported versus actual measured PA (eg, accelerometers, pedometers, indirect calorimetry, double-labeled water, heart rate monitor), 60% of respon-dents self-reported higher values of activity than what was measured by use of direct methods .12
●● Among men, self-reported PA was 44% greater than actual measured values; among women, self-reported activity was 138% greater than actual measured PA .12
Trends
YouthIn 2011:
●● Among adolescents, there was a significant decrease in the prevalence of watching television ≥3 hours per day, from 42 .8% in 1999 to 32 .4%, although there was no significant decrease from the 2009 prevalence of 32 .8% .1
●● Among students nationwide, there was a significant increase in the prevalence of having participated in muscle-strengthening activities on ≥3 days per week, from 47 .8% in 1991 to 55 .6% .1
by guest on December 16, 2013http://circ.ahajournals.org/Downloaded from
Heart Disease and Stroke Statistics—2013 Update: Chapter 4 e39
●● Nationwide, the prevalence of adolescents using computers ≥3 hours per day increased from 21 .1% in 2005 to 24 .9% in 2009 and 31 .1% .1
●● Among adolescents nationwide, the prevalence of attend-ing physical education classes at least once per week did not increase significantly, from 48 .9% in 1991 to 51 .8% .1
●● The prevalence of adolescents playing at least 1 team sport in the past year increased from 55 .1% in 1999 to 58 .4% .1
Adults
●● Between NHANES III (1988–1994) and NHANES 2001–2006, the non–age-adjusted proportion of adults who engaged in >12 bouts of PA per month declined from 57 .0% to 43 .3% in men and from 49 .0% to 43 .3% in women .13
●● The proportion of US adults who meet criteria for muscle strength has improved between 1998 and 2011 . Annual estimates of the percentage of US adults who met the muscle-strengthening criteria increased from 17 .7% in 1998 to 24 .5% in 2011, and estimates of the percentage who met both the muscle-strengthening and aerobic criteria increased from 14 .4% in 1998 to 21 .0% in 2011 .7,8
●● A 2 .3% decline in physical inactivity between 1980 and 2000 prevented or postponed ≈17 445 deaths (≈5%) attrib-utable to CHD in the United States .14
CVD and Metabolic Risk Factors
Youth
●● More girls (67 .9%) than boys (55 .7%) reported having exercised to lose weight or to keep from gaining weight .1
●● White girls (72 .2%) were more likely than black (54 .2%) and Hispanic (66 .3%) girls to report exercising to lose weight or to keep from gaining weight .1
●● Total and vigorous PA are inversely correlated with body fat and the prevalence of obesity .15
●● Among children 4 to 18 years of age, increased time in moderate-to-vigorous PA was associated with improve-ments in waist circumference, systolic BP (SBP), fasting triglycerides, high-density lipoprotein (HDL) cholesterol, and insulin . These findings were significant regardless of the amount of the children’s sedentary time .16
Adults
●● Participants in the Diabetes Prevention Project randomized trial who met the PA goal of 150 minutes of PA per week were 44% less likely to develop DM after 3 .2 years of fol-low-up, even if they did not meet the weight-loss target .17
●● Exercise for weight loss, without dietary interven-tions, was associated with significant reductions in dia-stolic BP (DBP; –2 mm Hg; 95% CI, –4 to –1 mm Hg), triglycerides (–0 .2 mmol/L; 95% CI, –0 .3 to –0 .1 mmol/L), and fasting glucose (–0 .2 mmol/L; 95% CI, –0 .3 to –0 .1 mmol/L) .18
●● A total of 120 to 150 minutes per week of moderate-inten-sity activity, compared with none, can reduce the risk of developing metabolic syndrome .19
●● In Coronary Artery Risk Development in Young Adults (CARDIA), women who maintained high activity through young adulthood gained 6 .1 fewer kilograms of weight and
3 .8 fewer centimeters in waist circumference in middle age than those with lower activity . Highly active men gained 2 .6 fewer kilograms and 3 .1 fewer centimeters than their lower-activity counterparts .20
●● Self-reported low lifetime recreational activity has been associated with increased PAD .21
●● In 3 US cohort studies, men and women who increased their PA over time gained less weight in the long-term, whereas those who decreased their PA over time gained more weight and those who maintained their current PA had intermediate weight gain .22
●● Among US men and women, every hour per day of increased television watching was associated with 0 .3 pounds of greater weight gain every 4 years, whereas every hour per day of decreased television watching was associ-ated with a similar amount of relative weight loss .22
Morbidity and Mortality
●● Physical inactivity is responsible for 12 .2% of the global burden of MI after accounting for other CVD risk factors such as cigarette smoking, DM, hypertension, abdominal obesity, lipid profile, no alcohol intake, and psychosocial factors .23
●● In a meta-analysis of longitudinal studies among women, RRs of incident CHD were 0 .83 (95% CI, 0 .69–0 .99), 0 .77 (95% CI, 0 .64–0 .92), 0 .72 (95% CI, 0 .59–0 .87), and 0 .57 (95% CI, 0 .41–0 .79) across increasing quintiles of PA com-pared with the lowest quintile .28
●● A 2003 meta-analysis of 23 studies on the association of PA with stroke indicated that compared with low levels of activity, high (RR, 0 .79; 95% CI, 0 .69–0 .91) and moder-ate (RR, 0 .91; 95% CI, 0 .80–1 .05) levels of activity were inversely associated with the likelihood of developing total stroke (ischemic and hemorrhagic) .24
●● With television watching as a sedentary activity, 2 hours of television per day is associated with an RR for type 2 DM of 1 .20 (95% CI, 1 .14–1 .27), an RR for fatal or non-fatal CVD of 1 .15 (95% CI, 1 .06–1 .23), and an RR for all-cause mortality of 1 .13 (95% CI, 1 .07–1 .18) . The risk for all-cause mortality further increases with >3 hours of television daily .25
●● Longitudinal studies commonly report a graded, inverse association of PA amount and duration (ie, dose) with inci-dent CHD and stroke .26
●● The PA guidelines for adults cite evidence that ≈150 min-utes per week of moderate-intensity aerobic activity, com-pared with none, can reduce the risk of CVD .27
●● Adherence to PA guidelines for both aerobic and muscle-strengthening activities is associated with 27% lower all-cause mortality among adults without existing chronic conditions such as DM, cancer, MI, angina, CVD, stroke, or respiratory diseases and with 46% lower mortality among people with chronic comorbidities .28
●● In the Health Professionals Follow-Up Study, for every 3-hour-per-week increase in vigorous-intensity activity, the multivariate RR of MI was 0 .78 (95% CI, 0 .61–0 .98) for men . This 22% reduction of risk can be explained in part by beneficial effects of PA on HDL cholesterol, vitamin D, apolipoprotein B, and HbA
1c .29
●● In a 20-year study of older male veterans, an inverse, graded, and independent association between impaired
by guest on December 16, 2013http://circ.ahajournals.org/Downloaded from
e40 Circulation January 1/8, 2013
exercise capacity and all-cause mortality risk was found . For each increase of 1 metabolic equivalent tasks in exer-cise capacity, mortality risk was 12% lower (HR 0 .88; 95% CI, 0 .86–0 .90) . Unfit individuals who improved their fit-ness status had a 35% lower mortality risk (HR 0 .65; 95% CI, 0 .46–0 .93) than those who remained unfit .30
Secondary Prevention
●● PA improves inflammatory markers in people with exist-ing stable CHD . After a 6-week training session, C-reac-tive protein levels declined by 23 .7% (P<0 .001), and plasma vascular cell adhesion molecule-1 levels declined by 10 .23% (P<0 .05); there was no difference in leukocyte count or levels of intercellular adhesion molecule-1 .31
●● In a randomized trial of patients with PAD, supervised tread-mill exercise training and lower-extremity resistance train-ing were each associated with significant improvements in functional performance and quality of life compared with a usual-care control group . Exercise training was addition-ally associated with improved brachial artery flow-mediated dilation (FMD), whereas resistance training was associated with better stair-climbing ability versus control .32
●● On the basis of a meta-analysis of 34 randomized con-trolled trials, exercise-based cardiac rehabilitation after MI was associated with lower rates of reinfarction, cardiac mortality, and overall mortality .33
●● The benefit of intense exercise training for cardiac rehabili-tation in people with HF was tested in a trial of 27 patients with stable, medically treated HF . Intense activity (an aero-bic interval-training program 3 times per week for 12 weeks) was associated with a significant 35% improvement in left ventricular ejection fraction (EF) and decreases in pro-brain natriuretic peptide (40%), left ventricular end-diastolic vol-ume (18%), and left ventricular end-systolic volume (25%) compared with control and endurance-training groups .34
Costs
●● The economic consequences of physical inactivity are sub-stantial . In a summary of WHO data sources, the economic costs of physical inactivity were estimated to account for 1 .5% to 3 .0% of total direct healthcare expenditures in developed countries such as the United States .35
●● The 1996 MEPS was linked to self-reported activity in the 1995 NHIS . On the basis of a self-reported prevalence of inactivity of 47 .5% and a prevalence of CVD of 21 .5%, direct expenditures for CVD associated with inactivity were estimated to be $23 .7 billion in 2001 .36
References 1 . Eaton DK, Kann L, Kinchen S, Shanklin S, Flint KH, Hawkins J, Harris
WA, Lowry R, McManus T, Chyen D, Whittle L, Lim C, Wechsler H; Centers for Disease Control and Prevention (CDC) . Youth risk behavior surveillance: United States, 2011 . MMWR Surveill Summ . 2012;61:1–162 .
2 . Zimmermann-Sloutskis D, Wanner M, Zimmermann E, Martin BW . Phys-ical activity levels and determinants of change in young adults: a longitu-dinal panel study . Int J Behav Nutr Phys Act . 2010;7:2 .
3 . Kahn JA, Huang B, Gillman MW, Field AE, Austin SB, Colditz GA, Fra-zier AL . Patterns and determinants of physical activity in U .S . adolescents . J Adolesc Health . 2008;42:369–377 .
4 . Centers for Disease Control and Prevention (CDC) . Physical activity lev-els of high school students: United States, 2010 . MMWR Morb Mortal Wkly Rep . 2011;60:773–777 .
5 . Troiano RP, Berrigan D, Dodd KW, Mâsse LC, Tilert T, McDowell M . Physical activity in the United States measured by accelerometer . Med Sci Sports Exerc . 2008;40:181–188 .
6 . National Association for Sport and Physical Education. Moving Into the Future: National Standards for Physical Education . 2nd ed . Reston, VA: National Association for Sport and Physical Education; 2004 .
7 . Schiller J, Lucas J, Peregoy J . Summary health statistics for U .S . adults: National Health Interview Survey, 2011 . Vital Health Stat 10 . In press .
8 . Carlson SA, Fulton JE, Schoenborn CA, Loustalot F . Trend and preva-lence estimates based on the 2008 Physical Activity Guidelines for Ameri-cans . Am J Prev Med . 2010;39:305–313 .
9 . Ward B, Barnes P, Freeman G, Schiller J . Early release of selected es-timates based on data from the 2011 National Health Interview Survey . National Center for Health Statistics . June 2012 . http://www .cdc .gov/nchs/nhis/released201206 .htm . Accessed July 20, 2012 .
10 . Bennett GG, Wolin KY, Puleo EM, Mâsse LC, Atienza AA . Awareness of national physical activity recommendations for health promotion among US adults . Med Sci Sports Exerc . 2009;41:1849–1855 .
11 . Luke A, Dugas LR, Durazo-Arvizu RA, Cao G, Cooper RS . Assessing physical activity and its relationship to cardiovascular risk factors: NHANES 2003-2006 . BMC Public Health . 2011;11:387 .
12 . Prince SA, Adamo KB, Hamel ME, Hardt J, Gorber SC, Tremblay M . A comparison of direct versus self-report measures for assessing physical ac-tivity in adults: a systematic review . Int J Behav Nutr Phys Act . 2008;5:56 .
13 . King DE, Mainous AG 3rd, Carnemolla M, Everett CJ . Adher-ence to healthy lifestyle habits in US adults, 1988-2006 . Am J Med . 2009;122:528–534 .
14 . Ford ES, Ajani UA, Croft JB, Critchley JA, Labarthe DR, Kottke TE, Giles WH, Capewell S . Explaining the decrease in U .S . deaths from coronary disease, 1980-2000 . N Engl J Med . 2007;356:2388–2398 .
15 . Kim Y, Lee S . Physical activity and abdominal obesity in youth . Appl Physiol Nutr Metab . 2009;34:571–581 .
16 . Ekelund U, Luan J, Sherar LB, Esliger DW, Griew P, Cooper A; Interna-tional Children’s Accelerometry Database (ICAD) Collaborators . Moder-ate to vigorous physical activity and sedentary time and cardiometabolic risk factors in children and adolescents [published correction appears in JAMA . 2012;307:1915] . JAMA . 2012;307:704–712 .
17 . Hamman RF, Wing RR, Edelstein SL, Lachin JM, Bray GA, Delahanty L, Hoskin M, Kriska AM, Mayer-Davis EJ, Pi-Sunyer X, Regensteiner J, Venditti B, Wylie-Rosett J . Effect of weight loss with lifestyle intervention on risk of diabetes . Diabetes Care . 2006;29:2102–2107 .
18 . Shaw K, Gennat H, O’Rourke P, Del Mar C . Exercise for overweight or obesity . Cochrane Database Syst Rev . 2006;(4):CD003817 .
19 . Department of Health and Human Services, Centers for Disease Control and Prevention . Physical activity for everyone: physical activity and health: the benefits of physical activity . http://www .cdc .gov/physicalactivity/everyone/health/index .html#ReduceCardiovascularDisease . Accessed August 1, 2011 .
20 . Hankinson AL, Daviglus ML, Bouchard C, Carnethon M, Lewis CE, Schreiner PJ, Liu K, Sidney S . Maintaining a high physical activity level over 20 years and weight gain [published correction appears in JAMA . 2011;305:150] . JAMA . 2010;304:2603–2610 .
21 . Wilson AM, Sadrzadeh-Rafie AH, Myers J, Assimes T, Nead KT, Higgins M, Gabriel A, Olin J, Cooke JP . Low lifetime recreational activity is a risk factor for peripheral arterial disease . J Vasc Surg . 2011;54:427–432, 432 .e1 .
22 . Mozaffarian D, Hao T, Rimm EB, Willett WC, Hu FB . Changes in diet and lifestyle and long-term weight gain in women and men . N Engl J Med . 2011;364:2392–2404 .
23 . Yusuf S, Hawken S, Ounpuu S, Dans T, Avezum A, Lanas F, McQueen M, Budaj A, Pais P, Varigos J, Lisheng L; INTERHEART Study Investigators . Effect of potentially modifiable risk factors associated with myocardial infarction in 52 countries (the INTERHEART study): case-control study . Lancet . 2004;364:937–952 .
24 . Lee CD, Folsom AR, Blair SN . Physical activity and stroke risk: a meta-analysis . Stroke . 2003;34:2475–2481 .
25 . Grøntved A, Hu FB . Television viewing and risk of type 2 diabetes, cardiovascular disease, and all-cause mortality: a meta-analysis . JAMA . 2011;305:2448–2455 .
26 . Carnethon MR . Physical activity and cardiovascular disease: how much is enough? Am J Lifestyle Med . 2009;3(1 Suppl):44S–49S .
27 . Haskell WL, Lee IM, Pate RR, Powell KE, Blair SN, Franklin BA, Macera CA, Heath GW, Thompson PD, Bauman A . Physical activity and public health: updated recommendation for adults from the American
by guest on December 16, 2013http://circ.ahajournals.org/Downloaded from
Heart Disease and Stroke Statistics—2013 Update: Chapter 4 e41
College of Sports Medicine and the American Heart Association . Circula-tion . 2007;116:1081–1093 .
28 . Schoenborn CA, Stommel M . Adherence to the 2008 adult physical ac-tivity guidelines and mortality risk . Am J Prev Med . 2011;40:514–521 .
29 . Chomistek AK, Chiuve SE, Jensen MK, Cook NR, Rimm EB . Vigorous physical activity, mediating biomarkers, and risk of myocardial infarction . Med Sci Sports Exerc . 2011;43:1884–1890 .
30 . Kokkinos P, Myers J, Faselis C, Panagiotakos DB, Doumas M, Pittaras A, Manolis A, Kokkinos JP, Karasik P, Greenberg M, Papademetriou V, Fletcher R . Exercise capacity and mortality in older men: a 20-year fol-low-up study . Circulation . 2010;122:790–797 .
31 . Rankovic G, Milicic B, Savic T, Dindic B, Mancev Z, Pesic G . Effects of physical exercise on inflammatory parameters and risk for repeated acute coronary syndrome in patients with ischemic heart disease . Vojnosanit Pregl . 2009;66:44–48 .
32 . McDermott MM, Ades P, Guralnik JM, Dyer A, Ferrucci L, Liu K, Nel-son M, Lloyd-Jones D, Van Horn L, Garside D, Kibbe M, Domanchuk K, Stein JH, Liao Y, Tao H, Green D, Pearce WH, Schneider JR, McPherson
D, Laing ST, McCarthy WJ, Shroff A, Criqui MH . Treadmill exercise and resistance training in patients with peripheral arterial disease with and without intermittent claudication: a randomized controlled trial [published correction appears in JAMA . 2012;307:1694] . JAMA . 2009;301:165–174 .
33 . Lawler PR, Filion KB, Eisenberg MJ . Efficacy of exercise-based cardiac rehabilitation post-myocardial infarction: a systematic review and meta-analysis of randomized controlled trials . Am Heart J . 2011;162:571–584 .e2 .
34 . Wisløff U, Støylen A, Loennechen JP, Bruvold M, Rognmo Ø, Haram PM, Tjønna AE, Helgerud J, Slørdahl SA, Lee SJ, Videm V, Bye A, Smith GL, Najjar SM, Ellingsen Ø, Skjaerpe T . Superior cardiovascular effect of aerobic interval training versus moderate continuous training in heart failure patients: a randomized study . Circulation . 2007;115:3086–3094 .
35 . Oldridge NB . Economic burden of physical inactivity: healthcare costs associated with cardiovascular disease . Eur J Cardiovasc Prev Rehabil . 2008;15:130–139 .
36 . Wang G, Pratt M, Macera CA, Zheng ZJ, Heath G . Physical activity, car-diovascular disease, and medical expenditures in U .S . adults . Ann Behav Med . 2004;28:88–94 .
by guest on December 16, 2013http://circ.ahajournals.org/Downloaded from
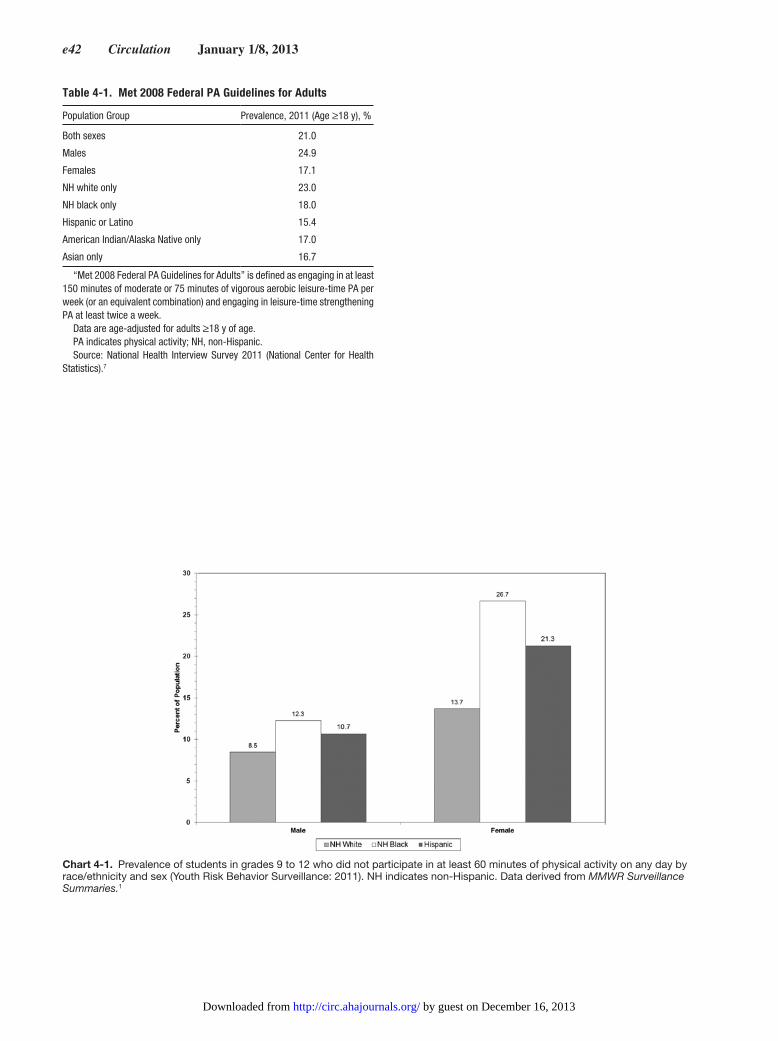
e42 Circulation January 1/8, 2013
Table 4-1. Met 2008 Federal PA Guidelines for Adults
Population Group Prevalence, 2011 (Age ≥18 y), %
Both sexes 21.0
Males 24.9
Females 17.1
NH white only 23.0
NH black only 18.0
Hispanic or Latino 15.4
American Indian/Alaska Native only 17.0
Asian only 16.7
“Met 2008 Federal PA Guidelines for Adults” is defined as engaging in at least 150 minutes of moderate or 75 minutes of vigorous aerobic leisure-time PA per week (or an equivalent combination) and engaging in leisure-time strengthening PA at least twice a week.
Data are age-adjusted for adults ≥18 y of age. PA indicates physical activity; NH, non-Hispanic.Source: National Health Interview Survey 2011 (National Center for Health
Statistics).7
Chart 4-1. Prevalence of students in grades 9 to 12 who did not participate in at least 60 minutes of physical activity on any day by race/ethnicity and sex (Youth Risk Behavior Surveillance: 2011). NH indicates non-Hispanic. Data derived from MMWR Surveillance Summaries.1
by guest on December 16, 2013http://circ.ahajournals.org/Downloaded from

Heart Disease and Stroke Statistics—2013 Update: Chapter 4 e43
Chart 4-2. Percentage of students in grades 9 to 12 who used a computer for ≥3 hours a day by race/ethnicity and sex (Youth Risk Behavior Surveillance: 2011). NH indicates non-Hispanic. Data derived from MMWR Surveillance Summaries.1
33.3
41.1
36.3
22.6
35.2
28.328.1
38.1
32.4
0
5
10
15
20
25
30
35
40
45
NH White NH Black Hispanic
Perc
ent
Male Female Total
Chart 4-3. Prevalence of students in grades 9 to 12 who met currently recommended levels of physical activity during the past 7 days by race/ethnicity and sex (Youth Risk Behavior Surveillance: 2011). “Currently recommended levels” was defined as activity that increased their heart rate and made them breathe hard some of the time for a total of at least 60 minutes per day on 5 of the 7 days preceding the survey. NH indicates non-Hispanic. Data derived from MMWR Surveillance Summaries.1
62.1
42.6
57.1
31.9
57.1
33
0
10
20
30
40
50
60
70
Male Female
Perc
ent o
f Pop
ulat
ion
NH White NH Black Hispanic
by guest on December 16, 2013http://circ.ahajournals.org/Downloaded from

e44 Circulation January 1/8, 2013
Chart 4-5. Prevalence of meeting the 2008 Federal Physical Activity Guidelines among adults ≥18 years of age by race/ethnicity and sex (National Health Interview Survey: 2010). NH indicates non-Hispanic. Percentages are age-adjusted. Meeting the 2008 Federal Physical Activity Guidelines is defined as engaging in moderate leisure-time physical activity for at least 150 minutes per week or vigorous activity at least 75 minutes per week or an equivalent combination. Source: Schiller et al.7
55.3
50.049.0
34.6
44.2
36.2
0
10
20
30
40
50
60
Men Women
Perc
ent o
f Pop
ulat
ion
NH White NH Black Hispanic
Chart 4-4. Prevalence of children 6 to 19 years of age who attained sufficient moderate-to-vigorous physical activity to meet public health recommendations (≥60 minutes per day on 5 or more of the 7 days preceding the survey), by sex and age (National Health and Nutrition Examination Survey: 2003–2004). Source: Troiano et al.5
48.9
34.7
11.9
3.4
10.0
5.4
0
10
20
30
40
50
60
Male Female
Perc
ent o
f Pop
ulat
ion
Age (Years)
6-11 12-15 16-19
by guest on December 16, 2013http://circ.ahajournals.org/Downloaded from

Heart Disease and Stroke Statistics—2013 Update: Chapter 5 e45
e45
5. Nutrition
See Tables 5-1 and 5-2 and Charts 5-1 through 5-3.
This chapter of the update highlights national dietary con-sumption data, focusing on key foods, nutrients, dietary pat-terns, and other dietary factors related to cardiometabolic health . It is intended to examine current intakes, trends and changes in intakes, and estimated effects on disease to support and further stimulate efforts to monitor and improve dietary habits in relation to cardiovascular health .
Prevalence
Foods and Nutrients: AdultsSee Table 5–1; NHANES 2005–2008).
The dietary consumption by US adults of selected foods and nutrients related to cardiometabolic health is detailed in Table 5-1 according to sex and race or ethnic subgroups:
●● Average consumption of whole grains by white and black men and women was between 0 .5 and 0 .8 servings per day, with only between 3% and 5% of white and black adults meeting guidelines of ≥3 servings per day . Average whole grain consumption by Mexican Americans was ≈2 servings per day, with 21% to 27% consuming ≥3 servings per day .
●● Average fruit consumption ranged from 1 .1 to 1 .8 servings per day in these sex and race or ethnic subgroups: 9% to 11% of whites, 6% to 7% of blacks, and 8% to 10% of Mexican Americans met guidelines of ≥2 cups per day . When 100% fruit juices were included, the number of serv-ings consumed and the proportions of adults consuming ≥2 cups per day approximately doubled .
●● Average vegetable consumption ranged from 1 .3 to 2 .2 servings per day; 6% to 7% of whites, 3% of blacks, and 3% of Mexican Americans consumed ≥2 .5 cups per day . The inclusion of vegetable juices and sauces generally pro-duced little change in these consumption patterns .
●● Average consumption of fish and shellfish was lowest among white women (1 .2 servings per week) and highest among black men and women (1 .7 servings per week); ≈75% to 80% of all adults in each sex and race or ethnic subgroup consumed <2 servings per week . Approximately 10% to 13% of whites, 14% to 15% of blacks, and 12% of Mexican Americans consumed ≥250 mg of eicosapentae-noic acid and docosahexaenoic acid per day .
●● Average consumption of nuts, legumes, and seeds was ≈2 to 3 servings per week among white and black men and women and 6 servings per week among Mexican American men and women . Approximately 20% of whites, 15% of blacks, and 40% of Mexican Americans met guidelines of ≥4 servings per week .
●● Average consumption of processed meats was lowest among Mexican American women (1 .8 servings per week) and highest among black men (3 .6 servings per week) . Between 36% (Mexican American women) and 66% (black men) of adults consumed ≥1 serving per week .
●● Average consumption of sugar-sweetened beverages ranged from ≈7 servings per week among white women to 16 servings per week among Mexican American men . Approximately 50% and 33% of white men and women, 73% and 65% of black men and women, and 76% and 62% of Mexican American men and women, respectively, con-sumed >36 oz (4 .5 8-oz servings) per week .
●● Average consumption of sweets and bakery desserts ranged from ≈4 servings per day (Mexican American men) to 7 servings per day (white men) . Approximately two thirds of white and black men and women and half of all Mexican American men and women consumed >2 .5 servings per week .
●● Between 33% and 50% of adults in each sex and race or ethnic subgroup consumed <10% of total calories from saturated fat, and between 58% and 70% consumed <300 mg of dietary cholesterol per day .
●● Only 4% to 7% of whites, 2% to 4% of blacks, and 9% to 11% of Mexican Americans consumed ≥28 g of dietary fiber per day .
●● Only 8% to 11% of whites, 9% to 11% of blacks, and 13% to 19% of Mexican Americans consumed <2 .3 g of sodium per day . In 2005, the US Department of Health and Human Services and US Department of Agriculture rec-ommended that adults in specific groups, including people
Abbreviations Used in Chapter 5
ALA α-linoleic acid
ARIC Atherosclerosis Risk in Communities Study
BMI body mass index
BP blood pressure
BRFSS Behavioral Risk Factor Surveillance System
CHD coronary heart disease
CHF congestive heart failure
CI confidence interval
CVD cardiovascular disease
DASH Dietary Approaches to Stop Hypertension
DBP diastolic blood pressure
DHA docosahexaenoic acid
DM diabetes mellitus
EPA eicosapentaenoic acid
GFR glomerular filtration rate
GISSI Gruppo Italiano per lo Studio della Sopravvivenza nell’Infarto miocardico
HD heart disease
HDL high-density lipoprotein
HEI Healthy Eating Index
LDL low-density lipoprotein
MI myocardial infarction
n-6-PUFA ω-6-polyunsaturated fatty acid
NA not available
NH non-Hispanic
NHANES National Health and Nutrition Examination Survey
OR odds ratio
PA physical activity
PREMIER Prospective Registry Evaluating Myocardial Infarction: Events and Recovery
RR relative risk
SBP systolic blood pressure
SD standard deviation
WHI Women’s Health Initiative
by guest on December 16, 2013http://circ.ahajournals.org/Downloaded from

e46 Circulation January 1/8, 2013
with hypertension, all middle-aged and older adults, and all blacks, should consume ≤1 .5 g of sodium per day . In 2005 to 2006, the majority (69 .2%) of US adults belonged to ≥1 of these specific groups in whom sodium consump-tion should be <1 .5 g/d .1
Foods and Nutrients: Children and TeenagersSee Table 5-2; NHANES 2005–2008).
The dietary consumption by US children and teenagers of selected foods and nutrients related to cardiometabolic health is detailed in Table 5-2:
●● Average whole grain consumption was low, ranging from 0 .4 to 0 .6 servings per day, with <4% of all children in different age and sex subgroups meeting guidelines of ≥3 servings per day .
●● Average fruit consumption was low and decreased with age: ≈1 .5 servings per day in younger boys and girls (5–9 years of age), 1 .3 servings per day in adolescent boys and girls (10–14 years of age), and 0 .9 servings per day in teen-age boys and girls (15–19 years of age) . The proportion meeting guidelines of ≥2 cups per day was also low and decreased with age: ≈8% in those 5 to 9 years of age, 7% to 8% in those 10 to 14 years of age, and 4% in those 15 to 19 years of age . When 100% fruit juices were included, the number of servings consumed approximately doubled or tripled, and proportions consuming ≥2 cups per day were 29% to 36% of those 5 to 9 years of age, 22% to 26% of those 10 to 14 years of age, and 21% to 22% of those 15 to 19 years of age .
●● Average vegetable consumption was low, ranging from 0 .9 to 1 .1 servings per day, with <2% of children in different age and sex subgroups meeting guidelines of ≥2 .5 cups per day .
●● Average consumption of fish and shellfish was low, ranging between 0 .5 and 0 .7 servings per week in all age and sex groups . Among all ages, only 10% to 13% of children and teenagers consumed ≥2 servings per week .
●● Average consumption of nuts, legumes, and seeds ranged from 1 .3 to 1 .4 servings per week among 5- to 9-year-olds, 1 .4 to 2 .1 servings per week among 10- to 14-year-olds, and 0 .8 to 1 .1 servings per week among 15- to 19-year-olds . Only between 7% and 14% of children in different age and sex subgroups consumed ≥4 servings per week .
●● Average consumption of processed meats ranged from 2 .1 to 3 .2 servings per week; was uniformly higher than the average consumption of nuts, legumes, and seeds; and was up to 6 times higher than the average consumption of fish and shellfish . Between 40% and 54% of children consumed ≥2 servings per week .
●● Average consumption of sugar-sweetened beverages was higher in boys than in girls and was ≈8 servings per week in 5- to 9-year-olds, 11 to 13 servings per week in 10- to 14-year-olds, and 14 to 18 servings per week in 15- to 19-year-olds . This was generally considerably higher than the average consumption of whole grains, fruits, vegeta-bles, fish and shellfish, or nuts, legumes, and seeds . Only between 17% (boys 15–19 years of age) and 42% (boys and girls 5–9 years of age) of children consumed <4 .5 serv-ings per week .
●● Average consumption of sweets and bakery desserts was ≈8 to 10 servings per week in 5- to 9-year-olds and 10- to 14-year-olds and 6 to 8 servings per week in 15- to 19-year-olds . From 82% (girls 5–9 years of age) to 58% (boys 15–19 years of age) of youths consumed >2 .5 servings per week .
●● Average consumption of eicosapentaenoic acid and doco-sahexaenoic acid was low, ranging from ≈45 to 75 mg/d in boys and girls at all ages . Only between 3% and 7% of children and teenagers at all ages consumed ≥250 mg/d .
●● Average consumption of saturated fat was between 11% and 12% of calories, and average consumption of dietary cholesterol was ≈230 mg/d . Approximately one fifth to one third of children consumed <10% energy from saturated fat, and ≈80% consumed <300 mg of dietary cholesterol per day .
●● Average consumption of dietary fiber ranged from 12 to 14 g/d . Less than 2% of children in all different age and sex subgroups consumed ≥28 g/d .
●● Average consumption of sodium ranged from 3 .1 to 3 .4 g/d . Between 7% and 12% of children in different age and sex subgroups consumed <2 .3 g/d .
Energy BalanceEnergy balance, or consumption of total calories appropriate for needs, is determined by the balance of average calories consumed versus expended, with this balance depending on multiple factors, including calories consumed, PA, body size, age, sex, and underlying basal metabolic rate . Thus, one indi-vidual may consume relatively high calories but have negative energy balance (as a result of even greater calories expended), whereas another individual may consume relatively few calo-ries but have positive energy balance (because of low calories expended) . Given such variation, the most practical and rea-sonable method to assess energy balance in populations is to assess changes in weight over time (Trends section) .
●● Average daily caloric intake in the United States is ≈2500 calories in adult men and 1800 calories in adult women (Table 5-1) . In children and teenagers, average caloric intake is higher in boys than in girls and increases with age in boys (Table 5-2) . Trends in energy balance are described below . The average US adult gains ≈1 pound per year . In an analysis of >120 000 US men and women in 3 separate US cohorts followed up for up to 20 years, changes in intakes of different foods and beverages were linked to long-term weight gain in different ways .2 Foods and beverages most positively linked to weight gain included poor-quality carbohydrates, such as potatoes, refined grains (eg, white bread, white rice, low-fiber breakfast cereals), sweets/des-serts, sugar-sweetened beverages, and red and processed meats . In contrast, increased consumption of several other foods, including nuts, whole grains, fruits, vegetables, and yogurt, was linked to less weight gain over time .2
●● Other nutritional determinants of positive energy balance (more calories consumed than expended), as determined by adiposity or weight gain, include larger portion sizes3,4 and greater consumption of fast food and commercially prepared meals .5–9
●● Preferences for portion size are associated with BMI, socio-economic status, eating in fast-food restaurants, and televi-sion watching .10,11 Most portion sizes are larger at fast-food restaurants than at home or at other restaurants .12
by guest on December 16, 2013http://circ.ahajournals.org/Downloaded from

Heart Disease and Stroke Statistics—2013 Update: Chapter 5 e47
●● Between 1999 and 2004, 53% of Americans consumed an average of 1 to 3 restaurant meals per week, and 23% consumed ≥4 restaurant meals per week .13 Spending on food away from home, including restaurant meals, catered foods, and food eaten during out-of-town trips, increased from 26% of average annual food expenditures in 1970 to 42% in 2004 .13 Macronutrient composition of the overall diet or of specific foods, such as percent calories from total fat, does not appear to be strongly associated with energy balance as ascertained by weight gain or loss .2,14–16 In con-trast, dietary quality as characterized by higher or lower intakes of specific foods and beverages is associated with weight gain (see above) .2
●● Preliminary evidence suggests that consumption of trans fat may be associated with energy imbalance as assessed by changes in adiposity or weight, as well as more specific adverse effects on visceral adiposity, but such data are still emerging .17–19
●● Other individual factors associated with positive energy balance (weight gain) include greater television watching (with evidence that effects are mediated by diet, rather than physical inactivity, including greater snacking in front of the television and the influence of advertising on poor food choices)2,20–24 and lower average sleep duration .2,25
●● Randomized controlled trials of weight loss in obese indi-viduals generally show modestly greater weight loss with low-carbohydrate (high-fat) diets than with low-fat diets at 6 months, but at 1 year, such differences diminish, and a diet that focuses on dietary quality and whole foods may be most successful in the long-term .26–29
●● On the basis of BRFSS data from 2003, among all American adults who are overweight or obese, a higher proportion are trying to lose weight if also diagnosed with hypertension (58% trying to lose weight), DM (60%), or both diseases (72%) than adults with neither condition (50%) .31
●● A 2007–2008 national survey of 1082 retail stores in 19 US cities found that energy-dense snack foods/beverages were present in 96% of pharmacies, 94% of gas stations, 22% of furniture stores, 16% of apparel stores, and 29% to 65% of other types of stores .32
●● Societal and environmental factors independently asso-ciated with energy imbalance (weight gain), via either increased caloric consumption or decreased expenditure, include education, income, race/ethnicity, and local condi-tions such as availability of grocery stores, types of restau-rants, safety, parks and open spaces, and walking or biking paths .33–35 PA is covered in Chapter 4 of this update .
Dietary PatternsIn addition to individual foods and nutrients, overall dietary patterns can be used to assess more global dietary quality . Different dietary patterns have been defined, including the Healthy Eating Index (HEI), Alternative HEI, Western versus prudent dietary patterns, Mediterranean dietary pattern, and DASH (Dietary Approaches to Stop Hypertension)-type diet . The higher-monounsaturated-fat DASH–type diet is generally similar to a traditional Mediterranean dietary pattern .36
●● In 1999 to 2004, only 19 .4% of hypertensive US adults were following a DASH-type diet (based on intake of fiber, magnesium, calcium, sodium, potassium, protein, total fat,
saturated fat, and cholesterol) . This represented a decrease from 26 .7% of hypertensive US adults in 1988 to 1994 .37
●● Among older US adults (≥60 years of age) in 1999 to 2002, 72% met guidelines for dietary cholesterol intake, but only between 18% and 32% met guidelines for the HEI food groups (meats, dairy, fruits, vegetables, and grains) . On the basis of the HEI score, only 17% of older US adults con-sumed a good-quality diet . Higher HEI scores were seen in white adults and individuals with greater education; lower HEI scores were seen in black adults and smokers .38
Dietary SupplementsUse of dietary supplements is common in the United States among both adults and children:
●● More than half (53%) of US adults in 2003 to 2006 used dietary supplements, with the most common supplement being multivitamins and multiminerals (40% of men and women reporting use) .39 It has been shown that most sup-plements are taken daily and for at least 2 years . Supple-ment use was associated with older age, higher education, greater PA, wine intake, lower BMI, and white race .40
●● One third (32%) of US children (birth to 18 years of age) used dietary supplements in 1999 to 2002, with the highest use (48 .5%) occurring among 4- to 8-year-olds . The most common supplements were multivitamins and multimin-erals (58% of supplement users) . The primary nutrients supplemented (either by multivitamins and/or individual vitamins) included vitamin C (29% of US children), vita-min A (26%), vitamin D (26%), calcium (21%), and iron (19%) . Supplement use was associated with higher fam-ily income, a smoke-free home environment, lower child BMI, and less screen time (television, video games, or computers) .41
●● In a 2005 to 2006 telephone survey of US adults, 41 .3% were making or had made in the past a serious weight-loss attempt . Of these, one third (33 .9%) had used a dietary supplement for weight loss, with such use being more com-mon in women (44 .9%) than in men (19 .8%) and in blacks (48 .7%) or Hispanics (41 .6%) than in whites (31 .2%); in those with high school education or less (38 .4%) than in those with some college or more (31 .1%); and in those with household income less than $40 000 per year (41 .8%) than in those with higher incomes (30 .3%) .42
●● Multiple trials of most dietary supplements, including folate, vitamin C, and vitamin E, have generally shown no significant benefits for CVD risk, and even potential for harm .36 For example, a multicenter randomized trial in patients with diabetic nephropathy found that B vitamin supplementation (folic acid 2 .5 mg/d, vitamin B6 25 mg/d, and vitamin B12 1 mg/d) decreased glomerular filtration rate (GFR) and increased risk of MI and stroke compared with placebo .43 Fish oil supplements at doses of 1 to 2 g/d have shown CVD benefits in 2 large randomized, open-label trials and 1 large randomized, placebo-controlled trial (Gruppo Italiano per lo Studio della Sopravvivenza nell’Infarto miocardico [GISSI]-Prevenzione, Japan Eicos-apentaenoic Acid Lipid Intervention Study, and GISSI-HF),44–46 but other smaller trials of fish oil have not shown significant effects on CVD risk .47 A meta-analysis of pla-cebo-controlled trials (ie, excluding the 2 large open-label
by guest on December 16, 2013http://circ.ahajournals.org/Downloaded from
e48 Circulation January 1/8, 2013
trials) showed a modest benefit for CVD mortality but no statistically significant effects on other CVD end points .48
Trends
Energy Balance(See Chart 5-1)Energy balance, or consumption of total calories appropriate for needs, has been steadily worsening in the United States over the past several decades, as evidenced by the dramatic increases in overweight and obesity among both children and adults across broad cross sections of sex, race/ethnicity, geo-graphic residence, and socioeconomic status .49,50,50a
●● Although trends in total calories consumed are difficult to quantify exactly because of differing methods of serial national dietary surveys over time, multiple lines of evi-dence indicate that average total energy consumption has increased by at least 200 kcal/d per person in the past 3 decades .
●● Data from NHANES indicate that between 1971 and 2004, average total energy consumption among US adults increased by 22% in women (from 1542 to 1886 kcal/d) and by 10% in men (from 2450 to 2693 kcal/d) . These increases are supported by data from the Nationwide Food Consumption Survey (1977–1978) and the Continuing Sur-veys of Food Intake (1989–1998) .12
●● The increases in calories consumed during this time period are attributable primarily to greater average carbohydrate intake, particularly of starches, refined grains, and sug-ars (Foods and Nutrients section) . Other specific changes related to increased caloric intake in the United States include larger portion sizes, greater food quantity and calo-ries per meal, and increased consumption of sugar-sweet-ened beverages, snacks, commercially prepared (especially fast-food) meals, and higher-energy-density foods .6,12,51–55
●● Between 1977 and 1978 and 1994 and 1996, the average portion sizes for nearly all foods increased at fast-food out-lets, other restaurants, and home . These included a 33% increase in the average portion of Mexican food (from 408 to 541 calories), a 34% increase in the average portion of cheeseburgers (from 397 to 533 calories), a 36% increase in the average portion of French fries (from 188 to 256 calo-ries), and a 70% increase in the average portion of salty snacks such as crackers, potato chips, pretzels, puffed rice cakes, and popcorn (from 132 to 225 calories) .12
●● Among US children 2 to 7 years of age, an estimated energy imbalance of only 110 to 165 kcal/d (the equivalent of one 12- to 16-oz bottle of soda/cola) was sufficient to account for the excess weight gain between 1988 and 1994 and 1999 and 2002 .56
●● In a quantitative analysis using various US surveys between 1977 and 2006, the relations of changes in energy density, portion sizes, and number of daily eating/drinking occa-sions to changes in total energy intake were assessed .57 Decreases in energy density were actually linked to lower total energy intake over time, whereas increases in both portion size and number of eating occasions were linked to greater energy intake .
●● Among US children 2 to 18 years of age, increases in energy intake between 1977 and 2006 (179 kcal/d) were entirely attributable to substantial increases in energy eaten
away from home (255 kcal/d) .58 The percentage of energy eaten away from home increased from 23 .4% to 33 .9% dur-ing this time, with a shift toward energy from fast food as the largest contributor to foods away from home for all age groups .
Foods and NutrientsSeveral changes in foods and nutrients have occurred over time . Selected changes are highlighted:
Macronutrients(See Chart 5-1)
●● Starting in 1977 and continuing until the most recent dietary guidelines revision in 2010, a major focus of US dietary guidelines was reduction of dietary fats .58a Dur-ing this time, average total fat consumption declined as a percent of calories from 36 .9% to 33 .4% in men and from 36 .1% to 33 .8% in women .13
●● Dietary guidelines during this time also emphasized carbo-hydrate consumption as the base of one’s dietary pattern,59 and more recently specifies the importance of complex rather than refined carbohydrates58a (eg, as the base of the Food Guide Pyramid) .59 Total carbohydrate intake increased from 42 .4% to 48 .2% of calories in men and from 45 .4% to 50 .6% of calories in women .13 Evaluated as absolute intakes, the increase in total calories consumed during this period was attributable primarily to the greater consumption of carbohydrates, both as foods (starches and grains) and as beverages .60,61
Sugar-Sweetened Beverages(See Chart 5-2)
●● Between 1965 and 2002, the average percentage of total calories consumed from beverages in the United States increased from 11 .8% to 21 .0% of energy, which represents an overall absolute increase of 222 cal/d per person .54 This increase was largely caused by increased consumption of sugar-sweetened beverages and alcohol: Average consump-tion of fruit juices went from 20 to 39 kcal/d; of milk, from 125 to 94 kcal/d; of alcohol, from 26 to 99 kcal/d; of sweet-ened fruit drinks, from 13 to 38 kcal/d; and of soda/cola, from 35 to 143 kcal/d .57
●● In addition to increased overall consumption, the average portion size of a single sugar-sweetened beverage increased by >50% between 1977 and 1996, from 13 .1 to 19 .9 fl oz .12
●● Among children and teenagers (2–19 years of age), the largest increases in consumption of sugar-sweetened bev-erages between 1988 to 1994 and 1999 to 2004 were seen among black and Mexican American youths compared with white youths .55
Fruits and Vegetables
●● Between 1994 and 2005, the average consumption of fruits and vegetables declined slightly, from a total of 3 .4 to 3 .2 servings per day . The proportions of men and women con-suming combined fruits and vegetables ≥5 times per day were low (≈20% and 29%, respectively) and did not change during this period .62
by guest on December 16, 2013http://circ.ahajournals.org/Downloaded from
Heart Disease and Stroke Statistics—2013 Update: Chapter 5 e49
Morbidity and Mortality
Effects on Cardiovascular Risk FactorsDietary habits affect multiple cardiovascular risk factors, including both established risk factors (SBP, DBP, LDL cho-lesterol levels, HDL cholesterol levels, glucose levels, and obesity/weight gain) and novel risk factors (eg, inflammation, cardiac arrhythmias, endothelial cell function, triglyceride lev-els, lipoprotein[a] levels, and heart rate):
●● A DASH dietary pattern with low sodium reduced SBP by 7 .1 mm Hg in adults without hypertension and by 11 .5 mm Hg in adults with hypertension .63
●● Compared with the low-fat DASH diet, DASH-type diets that increased consumption of either protein or unsatu-rated fat had similar or greater beneficial effects on CVD risk factors . Compared with a baseline usual diet, each of the DASH-type diets, which included various percentages (27%–37%) of total fat and focused on whole foods such as fruits, vegetables, whole grains, and fish, as well as potas-sium and other minerals and low sodium, reduced SBP by 8 to 10 mm Hg, DBP by 4 to 5 mm Hg, and LDL choles-terol by 12 to 14 mg/dL . The diets that had higher levels of protein and unsaturated fat also lowered triglyceride levels by 16 and 9 mg/dL, respectively .64 The DASH-type diet higher in unsaturated fat also improved glucose-insulin homeostasis compared with the low-fat/high-carbohydrate DASH diet .65
●● In a meta-analysis of randomized controlled trials, con-sumption of 1% of calories from trans fat in place of saturated fat, monounsaturated fat, or polyunsaturated fat increased the ratio of total to HDL cholesterol by 0 .031, 0 .054, and 0 .67; increased apolipoprotein B levels by 3, 10, and 11 mg/L; decreased apolipoprotein A-1 levels by 7, 5, and 3 mg/L; and increased lipoprotein(a) levels by 3 .8, 1 .4, and 1 .1 mg/L, respectively .66
●● In meta-analyses of randomized controlled trials, consump-tion of eicosapentaenoic acid and docosahexaenoic acid for 212 weeks lowered SBP by 2 .1 mm Hg67 and lowered rest-ing heart rate by 2 .5 beats per minute .68
●● In a pooled analysis of 25 randomized trials totaling 583 men and women both with and without hypercholesterol-emia, nut consumption significantly improved blood lipid levels .69 For a mean consumption of 67 g of nuts per day, total cholesterol was reduced by 10 .9 mg/dL (5 .1%), LDL cholesterol by 10 .2 mg/dL (7 .4%), and the ratio of total cholesterol to HDL cholesterol by 0 .24 (5 .6% change; P<0 .001 for each) . Triglyceride levels were also reduced by 20 .6 mg/dL (10 .2%) in subjects with high triglycerides (2150 mg/dL) . Different types of nuts had similar effects .69 A review of cross-sectional and prospective cohort studies suggests that higher intake of sugar-sweetened beverages is associated with greater visceral fat and higher risk of type 2 DM .70 In the Prospective Registry Evaluating Myocar-dial Infarction: Events and Recovery (PREMIER) study, a prospective analysis of the 810 participants indicated that a reduction in sugar-sweetened beverages of 1 serving per day was associated with a reduction in SBP of 1 .8 mm Hg (95% CI, 1 .2–2 .4 mm Hg) and a reduction in DBP of 1 .1 mm Hg (95% CI, 0 .7–1 .4 mm Hg) .71
●● In a cross-sectional analysis among nearly 3000 adults from the United States and the United Kingdom, higher
consumption of sugar-sweetened beverages was linked to higher BP (1 .6 and 0 .8 mm Hg higher SBP and DBP per serving per day, respectively, and 1 .1 and 0 .4 mm Hg higher SBP and DBP per serving per day after adjustment for weight and weight) .72
●● In a randomized controlled trial, compared with a low-fat diet, 2 Mediterranean dietary patterns that included either virgin olive oil or mixed nuts lowered SBP by 5 .9 and 7 .1 mm Hg, plasma glucose by 7 .0 and 5 .4 mg/dL, fasting insu-lin by 16 .7 and 20 .4 pmol/L, the homeostasis model assess-ment index by 0 .9 and 1 .1, and the ratio of total to HDL cholesterol by 0 .38 and 0 .26 and raised HDL cholesterol by 2 .9 and 1 .6 mg/dL, respectively . The Mediterranean dietary patterns also lowered levels of C-reactive protein, interleu-kin-6, intercellular adhesion molecule-1, and vascular cell adhesion molecule-1 .73
Effects on Cardiovascular OutcomesBecause dietary habits affect a broad range of established and novel risk factors, estimation of the impact of nutritional factors on cardiovascular health by considering only a limited number of pathways (eg, only effects on lipids, BP, and obesity) will systematically underestimate or even misconstrue the actual total impact on cardiovascular health . Randomized controlled trials and prospective observational studies have been used to quantify the total effects of dietary habits on clinical outcomes:
Fats and Carbohydrates
●● In the Women’s Health Initiative (WHI) randomized clini-cal trial (n=48 835), reduction of total fat consumption from 37 .8% energy (baseline) to 24 .3% energy (at 1 year) and 28 .8% energy (at 6 years) had no effect on incidence of CHD (RR, 0 .98; 95% CI, 0 .88–1 .09), stroke (RR, 1 .02; 95% CI, 0 .90–1 .15), or total CVD (RR, 0 .98; 95% CI, 0 .92–1 .05) over a mean of 8 .1 years .74 This was consistent with null results of 4 prior randomized clinical trials and multiple large prospective cohort studies that indicated lit-tle effect of total fat consumption on CVD risk .75
●● In 3 separate meta-analyses of prospective cohort stud-ies, the largest of which included 21 studies with up to 2 decades of follow-up, saturated fat consumption over-all had no significant association with incidence of CHD, stroke, or total CVD .76–78 In comparison, in a pooled individual-level analysis of 11 prospective cohort studies, the specific exchange of polyunsaturated fat consumption in place of saturated fat was associated with lower CHD risk, with 13% lower risk for each 5% energy exchange (RR, 0 .87; 95% CI, 0 .70–0 .97) .79 These findings are con-sistent with a meta-analysis of randomized controlled tri-als in which increased polyunsaturated fat consumption in place of saturated fat reduced CHD events, with 10% lower risk for each 5% energy exchange (RR, 0 .90; 95% CI, 0 .83–0 .97) .80
●● In a pooled analysis of individual-level data from 11 pro-spective cohort studies in the United States, Europe, and Israel that included 344 696 participants, each 5% higher energy consumption of carbohydrate in place of saturated fat was associated with a 7% higher risk of CHD (RR, 1 .07; 95% CI, 1 .01–1 .14) .79 Each 5% higher energy consumption of monounsaturated fat in place of saturated fat was not significantly associated with CHD risk .79
by guest on December 16, 2013http://circ.ahajournals.org/Downloaded from

e50 Circulation January 1/8, 2013
●● Together these findings suggest that reducing saturated fat without specifying the replacement may have minimal effects on CHD risk, whereas increasing polyunsaturated fats from vegetable oils will reduce CHD .36
●● In a meta-analysis of prospective cohort studies, each 2% of calories from trans fat was associated with a 23% higher risk of CHD (RR, 1 .23; 95% CI, 1 .11–1 .37) .81
●● In meta-analyses of prospective cohort studies, greater con-sumption of refined complex carbohydrates, starches, and sugars, as assessed by glycemic index or load, was associ-ated with significantly higher risk of CHD and DM . When the highest category was compared with the lowest cate-gory, risk of CHD was 36% greater (glycemic load: RR, 1 .36; 95% CI, 1 .13–1 .63), and risk of DM was 40% greater (glycemic index: RR, 1 .40; 95% CI, 1 .23–1 .59) .82,83
Foods and Beverages
●● In meta-analyses of prospective cohort studies, each daily serving of fruits or vegetables was associated with a 4% lower risk of CHD (RR, 0 .96; 95% CI, 0 .93–0 .99) and a 5% lower risk of stroke (RR, 0 .95; 95% CI, 0 .92–0 .97) .84,85
●● In a meta-analysis of prospective cohort studies, greater whole grain intake (2 .5 compared with 0 .2 servings per day) was associated with a 21% lower risk of CVD events (RR, 0 .79; 95% CI, 0 .73–0 .85), with similar estimates in men and women and for various outcomes (CHD, stroke, and fatal CVD) . In contrast, refined grain intake was not associated with lower risk of CVD (RR, 1 .07; 95% CI, 0 .94–1 .22) .86
●● In a meta-analysis of 16 prospective cohort studies that included 326 572 generally healthy individuals in Europe, the United States, China, and Japan, fish consumption was associated with significantly lower risk of CHD mortality .87 Compared with no consumption, an estimated 250 mg of long-chain omega-3 fatty acids per day was associated with 35% lower risk of CHD death (P<0 .001) .
●● In a meta-analysis of prospective cohort and case-control studies from multiple countries, consumption of unpro-cessed red meat was not significantly associated with inci-dence of CHD . In contrast, each 50-g serving per day of processed meats (eg, sausage, bacon, hot dogs, deli meats) was associated with a higher incidence of CHD (RR, 1 .42; 95% CI, 1 .07–1 .89) .88
●● In a meta-analysis of prospective cohort studies that included 442 101 participants and 28 228 DM cases, unpro-cessed red meat consumption was associated with a higher risk of DM (RR, 1 .19; 95% CI, 1 .04–1 .37, per 100 g/d) . On a per g/d basis, risk of DM was nearly 7-fold higher for pro-cessed meat consumption (RR, 1 .51; 95% CI, 1 .25–1 .83, per 50 g/d) .89
●● In a meta-analysis of 6 prospective observational studies, nut consumption was associated with significantly lower incidence of CHD (comparing higher to low intake: RR, 0 .70; 95% CI, 0 .57–0 .82) .77
●● Higher consumption of dairy or milk products is associated with lower incidence of DM and trends toward lower risk of stroke .77,90,91 Some limited evidence suggests that these associations are stronger for low-fat dairy or milk than for other dairy products . Dairy consumption is not significantly associated with higher or lower risk of CHD .77,91
●● Among 88 520 generally healthy women in the Nurses’ Health Study who were 34 to 59 years of age in 1980 and were followed up from 1980–2004, regular consumption of sugar-sweetened beverages was independently associated with higher incidence of CHD, with 23% and 35% higher risk with 1 and ≥2 servings per day, respectively, compared with <1 per month .92 Among the 15 745 participants in the ARIC study, the OR for developing CHD was 2 .59 for par-ticipants who had a serum uric acid level >9 .0 mg/dL and who drank >1 sugar-sweetened soda per day .93
Sodium and Potassium
●● Lower estimated consumption of dietary sodium was not associated with lower CVD mortality in NHANES,94 although such findings may be limited by changes in behaviors that result from underlying risk (reverse causa-tion) . In a post hoc analysis of the Trials of Hypertension Prevention, participants randomized to low-sodium inter-ventions had a 25% lower risk of CVD (RR, 0 .75; 95% CI, 0 .57–0 .99) after 10 to 15 years of follow-up after the original trials .95
●● In a meta-analysis of small randomized trials of sodium reduction of ≥6 months’ duration, nonsignificant trends were seen toward fewer CVD events in subjects with nor-mal BP (RR, 0 .71; 95% CI, 0 .42–1 .20; n=200 events) or hypertension (RR, 0 .84; 95% CI, 0 .57–1 .23; n=93 events), but the findings were not statistically significant, with rela-tively low statistical power because of the small numbers of events . Sodium restriction increased total mortality in trials of patients with CHF (RR, 2 .59; 95% CI, 1 .04–6 .44), but these data were based on very few events (n=21 deaths) .96
●● In a meta-analysis of 13 prospective cohorts that included 177 025 participants and >11 000 vascular events, higher sodium consumption was associated with greater risk of stroke (pooled RR, 1 .23; 95% CI, 1 .06–1 .43; P=0 .007) and a trend toward higher risk of CVD (1 .14, 0 .99–1 .32; P=0 .07) . These associations were greater with larger differ-ences in sodium intake and longer follow-up .97
●● In a meta-analysis of 15 prospective cohort samples that included 247 510 participants and 7066 strokes, 3058 CHD events, and 2497 total CVD events, each 1 .64-g/d (42 mmol/d) higher potassium intake was associated with a 21% lower risk of stroke (RR, 0 .79; 95% CI, 0 .68–0 .90) and trends toward lower risk of CHD and total CVD .98
Dietary Patterns
●● In a cohort of 380 296 US men and women, greater versus lower adherence to a Mediterranean dietary pattern, char-acterized by higher intakes of vegetables, legumes, nuts, fruits, whole grains, fish, and unsaturated fat and lower intakes of red and processed meat, was associated with a 22% lower cardiovascular mortality (RR, 0 .78; 95% CI, 0 .69–0 .87) .99 Similar findings have been seen for the Medi-terranean dietary pattern and risk of incident CHD and stroke100 and for the DASH-type dietary pattern .101
●● In a cohort of 72 113 US female nurses, a dietary pat-tern characterized by higher intakes of vegetables, fruits, legumes, fish, poultry, and whole grains was associated with a 28% lower cardiovascular mortality (RR, 0 .72; 95% CI, 0 .60–0 .87), whereas a dietary pattern characterized by
by guest on December 16, 2013http://circ.ahajournals.org/Downloaded from

Heart Disease and Stroke Statistics—2013 Update: Chapter 5 e51
higher intakes of processed meat, red meat, refined grains, French fries, and sweets/desserts was associated with a 22% higher cardiovascular mortality (RR, 1 .22; 95% CI, 1 .01–1 .48) .102 Similar findings have been seen in other cohorts and for other outcomes, including development of DM and metabolic syndrome .103–109
Impact on US Mortality
●● In one report that used consistent and comparable risk assessment methods and nationally representative data, the mortality effects in the United States of 12 modifiable dietary, lifestyle, and metabolic risk factors were assessed . High dietary salt consumption was estimated to be respon-sible for 102 000 annual deaths, low dietary omega-3 fatty acids for 84 000 annual deaths, high dietary trans fatty acids for 82 000 annual deaths, and low consumption of fruits and vegetables for 55 000 annual deaths .110
Cost(See Chart 5-3)The US Department of Agriculture forecast that the Consumer Price Index for all food would increase 3 .0% to 4 .0% in 2013 as retailers continued to pass on higher commodity and energy costs to consumers in the form of higher retail prices . The Con-sumer Price Index for food increased 3 .7% in 2011 . Prices for foods eaten at home increased 4 .8% in 2011, whereas prices for foods eaten away from home increased by 1 .9% .111
●● The proportion of total US food expenditures for meals out-side the home, as a share of total food dollars, increased from 27% in 1961 to 40% in 1981 to 49% in 2011 .59
●● The proportion of sales of meals and snacks from fast-food restaurants compared with total meals and snacks away from home increased from 5% in 1958 to 29% in 1982 to 36% in 2011 .111
●● As a proportion of income, food has become less expensive over time in the United States . As a share of personal dis-posable income, average (mean) total food expenditures by families and individuals have decreased from 22 .3% (1949) to 18 .1% (1961) to 14 .9% (1981) to 11 .3% (2011) . For any given year, the share of disposable income spent on food is inversely proportional to absolute income . The share increases as absolute income levels decline .111
●● Among 153 forms of fruits and vegetables priced with 2008 Nielsen Homescan data, price and calorie per portion of 20 fruits and vegetables were compared with 20 common snack foods such as cookies, chips, pastries, and crackers . Aver-age price per portion of fruits and vegetables was 31 cents with an average of 57 calories per portion, compared with 33 cents and 183 calories per portion for snack foods .111
●● An overview of the costs of various strategies for primary prevention of CVD determined that the estimated costs per year of life gained were between $9800 and $18 000 for statin therapy, ≥$1500 for nurse screening and lifestyle advice, $500 to $1250 for smoking cessation, and $20 to $900 for population-based healthy eating .112
●● Each year, >$33 billion in medical costs and $9 billion in lost productivity resulting from HD, cancer, stroke, and DM are attributed to poor nutrition .113–117
●● Two separate cost-effectiveness analyses estimated that population reductions in dietary salt would not only be
cost-effective but actually cost-saving .118,119 In 1 analysis, a 1 .2 g/d reduction in dietary sodium was projected to reduce US annual cases of incident CHD by 60 000 to 120 000, stroke by 32 000 to 66 000, and total mortality by 44 000 to 92 000 .119 If accomplished through a regulatory interven-tion, estimated savings in healthcare costs would be $10 to $24 billion annually .119 Such an intervention would be more cost-effective than using medications to lower BP in all people with hypertension .
References 1 . Ayala C, Kuklina E, Peralez J, Keenan N, Labarthe D; Centers for Disease
Control and Prevention (CDC) . Application of lower sodium intake rec-ommendations to adults: United States, 1999–2006 . MMWR Morb Mortal Wkly Rep . 2009;58:281–283 .
2 . Mozaffarian D, Hao T, Rimm EB, Willett WC, Hu FB . Changes in diet and lifestyle and long-term weight gain in women and men . N Engl J Med . 2011;364:2392–2404 .
3 . Ello-Martin JA, Ledikwe JH, Rolls BJ . The influence of food portion size and energy density on energy intake: implications for weight manage-ment . Am J Clin Nutr . 2005;82(suppl):236S–241S .
4 . Fisher JO, Kral TV . Super-size me: portion size effects on young chil-dren’s eating . Physiol Behav . 2008;94:39–47 .
5 . Bowman SA, Vinyard BT . Fast food consumption of U .S . adults: impact on energy and nutrient intakes and overweight status . J Am Coll Nutr . 2004;23:163–168 .
6 . Kant AK, Graubard BI . Eating out in America, 1987–2000: trends and nutritional correlates . Prev Med . 2004;38:243–249 .
7 . Duerksen SC, Elder JP, Arredondo EM, Ayala GX, Slymen DJ, Campbell NR, Baquero B . Family restaurant choices are associated with child and adult overweight status in Mexican-American families . J Am Diet Assoc . 2007;107:849–853 .
8 . Duffey KJ, Gordon-Larsen P, Jacobs DR Jr, Williams OD, Popkin BM . Differential associations of fast food and restaurant food consumption with 3-y change in body mass index: the Coronary Artery Risk Development in Young Adults Study . Am J Clin Nutr . 2007;85:201–208 .
9 . Rosenheck R . Fast food consumption and increased caloric intake: a sys-tematic review of a trajectory towards weight gain and obesity risk . Obes Rev . 2008;9:535–547 .
10 . Burger KS, Kern M, Coleman KJ . Characteristics of self-selected portion size in young adults . J Am Diet Assoc . 2007;107:611–618 .
11 . Colapinto CK, Fitzgerald A, Taper LJ, Veugelers PJ . Children’s preference for large portions: prevalence, determinants, and consequences . J Am Diet Assoc . 2007;107:1183–1190 .
12 . Nielsen SJ, Popkin BM . Patterns and trends in food portion sizes, 1977-1998 . JAMA . 2003;289:450–453 .
13 . National Center for Health Statistics . Health, United States, 2007: With Chartbook on Trends in the Health of Americans. Hyattsville, MD: National Center for Health Statistics; 2007 . http://www .cdc .gov/nchs/data/hus/hus07 .pdf . Accessed July 20, 2011 .
14 . Willett WC, Leibel RL . Dietary fat is not a major determinant of body fat . Am J Med . 2002;113(suppl 9B):47S–59S .
15 . Brehm BJ, D’Alessio DA . Weight loss and metabolic benefits with diets of varying fat and carbohydrate content: separating the wheat from the chaff . Nat Clin Pract Endocrinol Metab . 2008;4:140–146 .
16 . van Dam RM, Seidell JC . Carbohydrate intake and obesity . Eur J Clin Nutr . 2007;61(suppl 1):S75–S99 .
17 . Koh-Banerjee P, Chu NF, Spiegelman D, Rosner B, Colditz G, Willett W, Rimm E . Prospective study of the association of changes in dietary intake, physical activity, alcohol consumption, and smoking with 9-y gain in waist circumference among 16 587 US men . Am J Clin Nutr . 2003;78:719–727 .
18 . Field AE, Willett WC, Lissner L, Colditz GA . Dietary fat and weight gain among women in the Nurses’ Health Study . Obesity (Silver Spring) . 2007;15:967–976 .
19 . Kavanagh K, Jones KL, Sawyer J, Kelley K, Carr JJ, Wagner JD, Rudel LL . Trans fat diet induces abdominal obesity and changes in insulin sensi-tivity in monkeys . Obesity (Silver Spring) . 2007;15:1675–1684 .
20 . Robinson TN . Reducing children’s television viewing to prevent obesity: a randomized controlled trial . JAMA . 1999;282:1561–1567 .
21 . Gable S, Chang Y, Krull JL . Television watching and frequency of family meals are predictive of overweight onset and persistence in a
by guest on December 16, 2013http://circ.ahajournals.org/Downloaded from

e52 Circulation January 1/8, 2013
national sample of school-aged children . J Am Diet Assoc . 2007;107: 53–61 .
22 . Temple JL, Giacomelli AM, Kent KM, Roemmich JN, Epstein LH . Television watching increases motivated responding for food and energy intake in children . Am J Clin Nutr . 2007;85:355–361 .
23 . Dubois L, Farmer A, Girard M, Peterson K . Social factors and television use during meals and snacks is associated with higher BMI among pre-school children . Public Health Nutr . 2008;11:1267–1279 .
24 . Epstein LH, Roemmich JN, Robinson JL, Paluch RA, Winiewicz DD, Fuerch JH, Robinson TN . A randomized trial of the effects of reducing television viewing and computer use on body mass index in young chil-dren . Arch Pediatr Adolesc Med . 2008;162:239–245 .
25 . Patel SR, Hu FB . Short sleep duration and weight gain: a systematic review . Obesity (Silver Spring) . 2008;16:643–653 .
26 . Nordmann AJ, Nordmann A, Briel M, Keller U, Yancy WS Jr, Brehm BJ, Bucher HC . Effects of low-carbohydrate vs low-fat diets on weight loss and cardiovascular risk factors: a meta-analysis of randomized controlled trials . Arch Intern Med . 2006;166:285–293 .
27 . Gardner CD, Kiazand A, Alhassan S, Kim S, Stafford RS, Balise RR, Kraemer HC, King AC . Comparison of the Atkins, Zone, Ornish, and LEARN diets for change in weight and related risk factors among over-weight premenopausal women: the A TO Z Weight Loss Study: a random-ized trial [published correction appears in JAMA . 2007;298:178] . JAMA . 2007;297:969–977 .
28 . Shai I, Schwarzfuchs D, Henkin Y, Shahar DR, Witkow S, Greenberg I, Golan R, Fraser D, Bolotin A, Vardi H, Tangi-Rozental O, Zuk-Ramot R, Sarusi B, Brickner D, Schwartz Z, Sheiner E, Marko R, Katorza E, Thiery J, Fiedler GM, Bluher M, Stumvoll M, Stampfer MJ . Dietary Intervention Randomized Controlled Trial G . Weight loss with a low-carbohydrate, Mediterranean, or low-fat diet . N Engl J Med . 2008;359:229-241 .
29 . Sacks FM, Bray GA, Carey VJ, Smith SR, Ryan DH, Anton SD, McManus K, Champagne CM, Bishop LM, Laranjo N, Leboff MS, Rood JC, de Jonge L, Greenway FL, Loria CM, Obarzanek E, Williamson DA . Comparison of weight-loss diets with different compositions of fat, pro-tein, and carbohydrates . N Engl J Med . 2009;360:859–873 .
30 . Deleted in proof . 31 . Zhao G, Ford ES, Li C, Mokdad AH . Weight control behaviors in over-
weight/obese U .S . adults with diagnosed hypertension and diabetes . Cardiovasc Diabetol . 2009;8:13 .
32 . Farley TA, Baker ET, Futrell L, Rice JC . The ubiquity of energy-dense snack foods: a national multicity study . Am J Public Health . 2010;100:306–311 .
33 . Kumanyika S, Grier S . Targeting interventions for ethnic minority and low-income populations . Future Child . 2006;16:187–207 .
34 . Sallis JF, Glanz K . The role of built environments in physical activity, eat-ing, and obesity in childhood . Future Child . 2006;16:89–108 .
35 . Li F, Harmer PA, Cardinal BJ, Bosworth M, Acock A, Johnson-Shelton D, Moore JM . Built environment, adiposity, and physical activity in adults aged 50-75 . Am J Prev Med . 2008;35:38–46 .
36 . Mozaffarian D, Appel LJ, Van Horn L . Components of a cardioprotective diet: new insights . Circulation . 2011;123:2870–2891 .
37 . Mellen PB, Gao SK, Vitolins MZ, Goff DC Jr . Deteriorating dietary habits among adults with hypertension: DASH dietary accordance, NHANES 1988–1994 and 1999–2004 . Arch Intern Med . 2008;168:308–314 .
38 . Ervin RB . Healthy Eating Index scores among adults, 60 years of age and over, by sociodemographic and health characteristics: United States, 1999–2002 . Adv Data . 2008;(395):1–16 .
39 . Gahche J, Bailey R, Burt V, Hughes J, Yetley EA, Dwyer JT, Picciano MF, McDowell M, Sempos C . Dietary supplement use among U .S . adults has increased since NHANES III (1988–1994) . NCHS Data Brief. 2011;(61):1–8 .
40 . Radimer K, Bindewald B, Hughes J, Ervin B, Swanson C, Picciano MF . Dietary supplement use by US adults: data from the National Health and Nutrition Examination Survey, 1999-2000 . Am J Epidemiol . 2004;160:339–349 .
41 . Picciano MF, Dwyer JT, Radimer KL, Wilson DH, Fisher KD, Thomas PR, Yetley EA, Moshfegh AJ, Levy PS, Nielsen SJ . Dietary supplement use among infants, children, and adolescents in the United States, 1999–2002 . Arch Pediatr Adolesc Med . 2007;161:978–985 .
42 . Pillitteri JL, Shiffman S, Rohay JM, Harkins AM, Burton SL, Wadden TA . Use of dietary supplements for weight loss in the United States: results of a national survey . Obesity (Silver Spring) . 2008;16:790–796 .
43 . House AA, Eliasziw M, Cattran DC, Churchill DN, Oliver MJ, Fine A, Dresser GK, Spence JD . Effect of B-vitamin therapy on progres-sion of diabetic nephropathy: a randomized controlled trial . JAMA . 2010;303:1603–1609 .
44 . Gruppo Italiano per lo Studio della Sopravvivenza nell’Infarto miocar-dico . Dietary supplementation with n-3 polyunsaturated fatty acids and vitamin E after myocardial infarction: results of the GISSI-Prevenzione trial [published corrections appear in Lancet . 2001;357:642 and Lancet . 2007;369:106] . Lancet . 1999;354:447–455 .
45 . Yokoyama M, Origasa H, Matsuzaki M, Matsuzawa Y, Saito Y, Ishikawa Y, Oikawa S, Sasaki J, Hishida H, Itakura H, Kita T, Kitabatake A, Nakaya N, Sakata T, Shimada K, Shirato K; Japan EPA Lipid Intervention Study (JELIS) Investigators . Effects of eicosapentaenoic acid on major coronary events in hypercholesterolaemic patients (JELIS): a randomised open-label, blinded endpoint analysis [published correction appears in Lancet . 2007;370:220] . Lancet . 2007;369:1090–1098 .
46 . Tavazzi L, Maggioni AP, Marchioli R, Barlera S, Franzosi MG, Latini R, Lucci D, Nicolosi GL, Porcu M, Tognoni G; GISSI-HF Investigators . Effect of n-3 polyunsaturated fatty acids in patients with chronic heart fail-ure (the GISSI-HF trial): a randomised, double-blind, placebo-controlled trial . Lancet . 2008;372:1223–1230 .
47 . Mozaffarian D, Wu JH . Omega-3 fatty acids and cardiovascular disease: effects on risk factors, molecular pathways, and clinical events . J Am Coll Cardiol . 2011;58:2047–2067 .
48 . Kwak SM, Myung SK, Lee YJ, Seo HG; Korean Meta-analysis Study Group . Efficacy of omega-3 fatty acid supplements (eicosapentaenoic acid and docosahexaenoic acid) in the secondary prevention of cardiovascular disease: a meta-analysis of randomized, double-blind, placebo-controlled trials . Arch Intern Med . 2012;172:686–694 .
49 . Ford ES, Li C, Zhao G, Tsai J . Trends in obesity and abdominal obesity among adults in the United States from 1999–2008 . Int J Obes (Lond) . 2011;35:736–743 .
50 . Flegal KM, Carroll MD, Kit BK, Ogden CL . Prevalence of obesity and trends in the distribution of body mass index among US adults, 1999-2010 . JAMA . 2012;307:491-497 .
50a . Ogden CL, Carroll MD, Kit BK, Flegal KM . Prevalence of obesity and trends in body mass index among US children and adolescents, 1999-2010 . JAMA . 2012;307:483-490 .
51 . Briefel RR, Johnson CL . Secular trends in dietary intake in the United States . Annu Rev Nutr . 2004;24:401–431 .
52 . Kant AK, Graubard BI . Secular trends in patterns of self-reported food consumption of adult Americans: NHANES 1971–1975 to NHANES 1999–2002 . Am J Clin Nutr . 2006;84:1215–1223 .
53 . Popkin BM, Armstrong LE, Bray GM, Caballero B, Frei B, Willett WC . A new proposed guidance system for beverage consumption in the United States [published correction appears in Am J Clin Nutr . 2007;86:525] . Am J Clin Nutr . 2006;83:529 .
54 . Duffey KJ, Popkin BM . Shifts in patterns and consumption of beverages between 1965 and 2002 . Obesity (Silver Spring) . 2007;15:2739–2747 .
55 . Wang YC, Bleich SN, Gortmaker SL . Increasing caloric contribution from sugar-sweetened beverages and 100% fruit juices among US children and adolescents, 1988–2004 . Pediatrics . 2008;121:e1604–e1614 .
56 . Wang YC, Gortmaker SL, Sobol AM, Kuntz KM . Estimating the energy gap among US children: a counterfactual approach . Pediatrics . 2006;118:e1721–e1733 .
57 . Duffey KJ, Popkin BM . Energy density, portion size, and eating occa-sions: contributions to increased energy intake in the United States, 1977–2006 . PLoS Med . 2011;8:e1001050 .
58 . Poti JM, Popkin BM . Trends in energy intake among US children by eating location and food source, 1977–2006 . J Am Diet Assoc . 2011;111:1156–1164 .
58a . US Department of Health & Human Services . Dietary Guidelines for Americans, 2010 . http://health .gov/dietaryguidelines/2010 .asp . Accessed November 29, 2012 .
59 . Davis C, Saltos E . Dietary recommendations and how they have changed over time . In: Frazao E, ed . America’s Eating Habits: Changes and Consequences . Washington, DC: US Department of Agriculture; 1999:33–50 . Agriculture Information Bulletin No . 750 .
60 . Centers for Disease Control and Prevention (CDC) . Trends in intake of energy and macronutrients--United States, 1971–2000 . MMWR Morb Mortal Wkly Rep . 2004;53:80–82 .
61 . Egan SK, Bolger PM, Carrington CD . Update of US FDA’s Total Diet Study food list and diets . J Expo Sci Environ Epidemiol . 2007;17:573–582 .
62 . Blanck HM, Gillespie C, Kimmons JE, Seymour JD, Serdula MK . Trends in fruit and vegetable consumption among U .S . men and women, 1994-2005 . Prev Chronic Dis . 2008;5:A35 .
63 . Sacks FM, Svetkey LP, Vollmer WM, Appel LJ, Bray GA, Harsha D, Obarzanek E, Conlin PR, Miller ER 3rd, Simons-Morton DG, Karanja N, Lin PH; DASH-Sodium Collaborative Research Group . Effects on blood
by guest on December 16, 2013http://circ.ahajournals.org/Downloaded from

Heart Disease and Stroke Statistics—2013 Update: Chapter 5 e53
pressure of reduced dietary sodium and the Dietary Approaches to Stop Hypertension (DASH) diet . N Engl J Med . 2001;344:3–10 .
64 . Appel LJ, Sacks FM, Carey VJ, Obarzanek E, Swain JF, Miller ER 3rd, Conlin PR, Erlinger TP, Rosner BA, Laranjo NM, Charleston J, McCarron P, Bishop LM; OmniHeart Collaborative Research Group . Effects of protein, monoun-saturated fat, and carbohydrate intake on blood pressure and serum lipids: results of the OmniHeart randomized trial . JAMA . 2005;294:2455–2464 .
65 . Gadgil M, Anderson C, Sacks F, Yeung E, Appel L, Miller E . Effect of car-bohydrate, unsaturated fats and protein intake on measures of insulin sen-sitivity: results from the OmniHeart Trial . Circulation 2011;124:A15253 . Abstract .
66 . Mozaffarian D, Aro A, Willett WC . Health effects of trans-fatty acids: experimental and observational evidence . Eur J Clin Nutr . 2009;63(suppl 2):S5–S21 .
67 . Geleijnse JM, Giltay EJ, Grobbee DE, Donders AR, Kok FJ . Blood pres-sure response to fish oil supplementation: metaregression analysis of ran-domized trials . J Hypertens . 2002;20:1493–1499 .
68 . Mozaffarian D, Geelen A, Brouwer IA, Geleijnse JM, Zock PL, Katan MB . Effect of fish oil on heart rate in humans: a meta-analysis of random-ized controlled trials . Circulation . 2005;112:1945–1952 .
69 . Sabaté J, Oda K, Ros E . Nut consumption and blood lipid levels: a pooled analysis of 25 intervention trials . Arch Intern Med . 2010;170:821–827 .
70 . Hu FB, Malik VS . Sugar-sweetened beverages and risk of obesity and type 2 diabetes: epidemiologic evidence . Physiol Behav . 2010;100:47–54 .
71 . Chen L, Caballero B, Mitchell DC, Loria C, Lin PH, Champagne CM, Elmer PJ, Ard JD, Batch BC, Anderson CA, Appel LJ . Reducing con-sumption of sugar-sweetened beverages is associated with reduced blood pressure: a prospective study among United States adults [pub-lished correction appears in Circulation . 2010;122:e408] . Circulation . 2010;121:2398–2406 .
72 . Brown IJ, Stamler J, Van Horn L, Robertson CE, Chan Q, Dyer AR, Huang CC, Rodriguez BL, Zhao L, Daviglus ML, Ueshima H, Elliott P; International Study of Macro/Micronutrients and Blood Pressure Research Group . Sugar-sweetened beverage, sugar intake of individuals, and their blood pressure: international study of macro/micronutrients and blood pressure . Hypertension . 2011;57:695–701 .
73 . Estruch R, Martínez-González MA, Corella D, Salas-Salvadó J, Ruiz-Gutiérrez V, Covas MI, Fiol M, Gómez-Gracia E, López-Sabater MC, Vinyoles E, Arós F, Conde M, Lahoz C, Lapetra J, Sáez G, Ros E; PREDIMED Study Investigators . Effects of a Mediterranean-style diet on cardiovascular risk factors: a randomized trial . Ann Intern Med . 2006;145:1–11 .
74 . Howard BV, Van Horn L, Hsia J, Manson JE, Stefanick ML, Wassertheil-Smoller S, Kuller LH, LaCroix AZ, Langer RD, Lasser NL, Lewis CE, Limacher MC, Margolis KL, Mysiw WJ, Ockene JK, Parker LM, Perri MG, Phillips L, Prentice RL, Robbins J, Rossouw JE, Sarto GE, Schatz IJ, Snetselaar LG, Stevens VJ, Tinker LF, Trevisan M, Vitolins MZ, Anderson GL, Assaf AR, Bassford T, Beresford SA, Black HR, Brunner RL, Brzyski RG, Caan B, Chlebowski RT, Gass M, Granek I, Greenland P, Hays J, Heber D, Heiss G, Hendrix SL, Hubbell FA, Johnson KC, Kotchen JM . Low-fat dietary pattern and risk of cardiovascular disease: the Women’s Health Initiative Randomized Controlled Dietary Modification Trial . JAMA . 2006;295:655–666 .
75 . World Health Organization, Food and Agriculture Organization of the United Nations . Diet, Nutrition and the Prevention of Chronic Diseases: Report of a Joint WHO/FAO Expert Consultation (WHO Technical Report Series 916). Geneva, Switzerland: World Health Organization; 2003 .
76 . Skeaff CM, Miller J . Dietary fat and coronary heart disease: summary of evidence from prospective cohort and randomised controlled trials . Ann Nutr Metab . 2009;55:173–201 .
77 . Mente A, de Koning L, Shannon HS, Anand SS . A systematic review of the evidence supporting a causal link between dietary factors and coronary heart disease . Arch Intern Med . 2009;169:659–669 .
78 . Siri-Tarino PW, Sun Q, Hu FB, Krauss RM . Meta-analysis of prospective cohort studies evaluating the association of saturated fat with cardiovascu-lar disease . Am J Clin Nutr . 2010;91:535–546 .
79 . Jakobsen MU, O’Reilly EJ, Heitmann BL, Pereira MA, Bälter K, Fraser GE, Goldbourt U, Hallmans G, Knekt P, Liu S, Pietinen P, Spiegelman D, Stevens J, Virtamo J, Willett WC, Ascherio A . Major types of dietary fat and risk of coronary heart disease: a pooled analysis of 11 cohort studies . Am J Clin Nutr . 2009;89:1425–1432 .
80 . Mozaffarian D, Micha R, Wallace S . Effects on coronary heart disease of increasing polyunsaturated fat in place of saturated fat: a systematic review and meta-analysis of randomized controlled trials . PLoS Med . 2010;7:e1000252 .
81 . Mozaffarian D, Katan MB, Ascherio A, Stampfer MJ, Willett WC . Trans fatty acids and cardiovascular disease . N Engl J Med . 2006;354: 1601–1613 .
82 . Barclay AW, Petocz P, McMillan-Price J, Flood VM, Prvan T, Mitchell P, Brand-Miller JC . Glycemic index, glycemic load, and chronic dis-ease risk: a meta-analysis of observational studies . Am J Clin Nutr . 2008;87:627–637 .
83 . Dong JY, Zhang YH, Wang P, Qin LQ . Meta-analysis of dietary glyce-mic load and glycemic index in relation to risk of coronary heart disease . Am J Cardiol . 2012;109:1608–1613 .
84 . Dauchet L, Amouyel P, Hercberg S, Dallongeville J . Fruit and vegeta-ble consumption and risk of coronary heart disease: a meta-analysis of cohort studies . J Nutr . 2006;136:2588–2593 .
85 . Dauchet L, Amouyel P, Dallongeville J . Fruit and vegetable consump-tion and risk of stroke: a meta-analysis of cohort studies . Neurology . 2005;65:1193–1197 .
86 . Mellen PB, Walsh TF, Herrington DM . Whole grain intake and car-diovascular disease: a meta-analysis . Nutr Metab Cardiovasc Dis . 2008;18:283–290 .
87 . Harris WS, Mozaffarian D, Lefevre M, Toner CD, Colombo J, Cunnane SC, Holden JM, Klurfeld DM, Morris MC, Whelan J . Towards estab-lishing dietary reference intakes for eicosapentaenoic and docosahexae-noic acids . J Nutr . 2009;139:804S–819S .
88 . Micha R, Wallace SK, Mozaffarian D . Red and processed meat con-sumption and risk of incident coronary heart disease, stroke, and dia-betes mellitus: a systematic review and meta-analysis . Circulation . 2010;121:2271–2283 .
89 . Pan A, Sun Q, Bernstein AM, Schulze MB, Manson JE, Willett WC, Hu FB . Red meat consumption and risk of type 2 diabetes: 3 cohorts of US adults and an updated meta-analysis . Am J Clin Nutr . 2011;94:1088–1096 .
90 . Tong X, Dong JY, Wu ZW, Li W, Qin LQ . Dairy consumption and risk of type 2 diabetes mellitus: a meta-analysis of cohort studies . Eur J Clin Nutr . 2011;65:1027–1031 .
91 . Soedamah-Muthu SS, Ding EL, Al-Delaimy WK, Hu FB, Engberink MF, Willett WC, Geleijnse JM . Milk and dairy consumption and incidence of cardiovascular diseases and all-cause mortality: dose-response meta-analysis of prospective cohort studies . Am J Clin Nutr . 2011;93:158–171 .
92 . Fung TT, Malik V, Rexrode KM, Manson JE, Willett WC, Hu FB . Sweetened beverage consumption and risk of coronary heart disease in women . Am J Clin Nutr . 2009;89:1037–1042 .
93 . Bomback AS, Derebail VK, Shoham DA, Anderson CA, Steffen LM, Rosamond WD, Kshirsagar AV . Sugar-sweetened soda consumption, hyperuricemia, and kidney disease . Kidney Int . 2010;77:609–616 .
94 . Cohen HW, Hailpern SM, Alderman MH . Sodium intake and mortal-ity follow-up in the Third National Health and Nutrition Examination Survey (NHANES III) . J Gen Intern Med . 2008;23:1297–1302 .
95 . Cook NR, Cutler JA, Obarzanek E, Buring JE, Rexrode KM, Kumanyika SK, Appel LJ, Whelton PK . Long term effects of dietary sodium reduc-tion on cardiovascular disease outcomes: observational follow-up of the Trials Of Hypertension Prevention (TOHP) . BMJ . 2007;334:885–888 .
96 . Taylor RS, Ashton KE, Moxham T, Hooper L, Ebrahim S . Reduced dietary salt for the prevention of cardiovascular disease: a meta-analysis of randomized controlled trials (Cochrane review) . Am J Hypertens . 2011;24:843–853 .
97 . Strazzullo P, D’Elia L, Kandala NB, Cappuccio FP . Salt intake, stroke, and cardiovascular disease: meta-analysis of prospective studies . BMJ . 2009;339:b4567 .
98 . D’Elia L, Barba G, Cappuccio FP, Strazzullo P . Potassium intake, stroke, and cardiovascular disease: a meta-analysis of prospective studies . J Am Coll Cardiol . 2011;57:1210–1219 .
99 . Mitrou PN, Kipnis V, Thiébaut AC, Reedy J, Subar AF, Wirfält E, Flood A, Mouw T, Hollenbeck AR, Leitzmann MF, Schatzkin A . Mediterranean dietary pattern and prediction of all-cause mortality in a US population: results from the NIH-AARP Diet and Health Study . Arch Intern Med . 2007;167:2461–2468 .
100 . Fung TT, Rexrode KM, Mantzoros CS, Manson JE, Willett WC, Hu FB . Mediterranean diet and incidence of and mortality from coronary heart disease and stroke in women [published correction appears in Circulation . 2009;119:e379] . Circulation . 2009;119:1093–1100 .
101 . Fung TT, Chiuve SE, McCullough ML, Rexrode KM, Logroscino G, Hu FB . Adherence to a DASH-style diet and risk of coronary heart disease and stroke in women [published correction appears in Arch Intern Med . 2008;168:1276] . Arch Intern Med . 2008;168:713–720 .
by guest on December 16, 2013http://circ.ahajournals.org/Downloaded from
e54 Circulation January 1/8, 2013
102 . Heidemann C, Schulze MB, Franco OH, van Dam RM, Mantzoros CS, Hu FB . Dietary patterns and risk of mortality from cardiovascu-lar disease, cancer, and all causes in a prospective cohort of women . Circulation . 2008;118:230–237 .
103 . Osler M, Heitmann BL, Gerdes LU, Jørgensen LM, Schroll M . Dietary patterns and mortality in Danish men and women: a prospective obser-vational study . Br J Nutr . 2001;85:219–225 .
104 . van Dam RM, Rimm EB, Willett WC, Stampfer MJ, Hu FB . Dietary pat-terns and risk for type 2 diabetes mellitus in U .S . men . Ann Intern Med . 2002;136:201–209 .
105 . Heidemann C, Hoffmann K, Spranger J, Klipstein-Grobusch K, Möhlig M, Pfeiffer AF, Boeing H; European Prospective Investigation into Cancer and Nutrition (EPIC)–Potsdam Study Cohort . A dietary pat-tern protective against type 2 diabetes in the European Prospective Investigation into Cancer and Nutrition (EPIC)–Potsdam Study cohort . Diabetologia . 2005;48:1126–1134 .
106 . Brunner EJ, Mosdøl A, Witte DR, Martikainen P, Stafford M, Shipley MJ, Marmot MG . Dietary patterns and 15-y risks of major coronary events, diabetes, and mortality . Am J Clin Nutr . 2008;87:1414–1421 .
107 . Lutsey PL, Steffen LM, Stevens J . Dietary intake and the development of the metabolic syndrome: the Atherosclerosis Risk in Communities study . Circulation . 2008;117:754–761 .
108 . Fitzgerald KC, Chiuve SE, Buring JE, Ridker PM, Glynn RJ . Comparison of associations of adherence to a Dietary Approaches to Stop Hypertension (DASH)-style diet with risks of cardiovas-cular disease and venous thromboembolism . J Thromb Haemost . 2012;10:189–198 .
109 . Joosten MM, Grobbee DE, van der A DL, Verschuren WM, Hendriks HF, Beulens JW . Combined effect of alcohol consumption and lifestyle behaviors on risk of type 2 diabetes . Am J Clin Nutr . 2010;91:1777–1783 .
110 . Danaei G, Ding EL, Mozaffarian D, Taylor B, Rehm J, Murray CJ, Ezzati M . The preventable causes of death in the United States: com-parative risk assessment of dietary, lifestyle, and metabolic risk factors [published correction appears in PLoS Med . 2011;8(1)] . PLoS Med . 2009;6:e1000058 .
111 . US Department of Agriculture . Food expenditures . http://www .ers .usda .gov/Briefing/CPIFoodAndExpenditures/Data/ . Accessed October 31, 2012 .
112 . Brunner E, Cohen D, Toon L . Cost effectiveness of cardiovascular disease prevention strategies: a perspective on EU food based dietary guidelines . Public Health Nutr . 2001;4(2B):711–715 .
113 . Centers for Disease Control and Prevention . Preventing Chronic Diseases: Investing Wisely in Health: Preventing Obesity and Chronic Diseases Through Good Nutrition and Physical Activity . Atlanta, Ga: Centers for Disease Control and Prevention; Revised 2008 . http://www .cdc .gov/nccdphp/publications/factsheets/prevention/pdf/obesity .pdf . Accessed July 21, 2011 .
114 . Lichtenstein AH, Appel LJ, Brands M, Carnethon M, Daniels S, Franch HA, Franklin B, Kris-Etherton P, Harris WS, Howard B, Karanja N, Lefevre M, Rudel L, Sacks F, Van Horn L, Winston M, Wylie-Rosett J . Diet and lifestyle recommendations revision 2006: a scientific state-ment from the American Heart Association Nutrition Committee [pub-lished corrections appear in Circulation . 2006;114:e27 and Circulation . 2006;114:e629] . Circulation . 2006;114:82–96 .
115 . Deleted in proof . 116 . International Society for the Study of Fatty Acids and Lipids .
Recommendations for Intake of Polyunsaturated Fatty Acids in Healthy Adults . Devon, UK: International Society for the Study of Fatty Acids and Lipids; 2004 .
117 . Food and Nutrition Board, Institute of Medicine . Dietary Reference Intakes for Energy, Carbohydrate, Fiber, Fat, Fatty Acids, Cholesterol, Protein, and Amino Acids (Macronutrients) . Washington, DC: National Academies Press; 2005 .
118 . Smith-Spangler CM, Juusola JL, Enns EA, Owens DK, Garber AM . Population strategies to decrease sodium intake and the burden of cardiovascular disease: a cost-effectiveness analysis . Ann Intern Med . 2010;152:481–487, W170–W173 .
119 . Bibbins-Domingo K, Chertow GM, Coxson PG, Moran A, Lightwood JM, Pletcher MJ, Goldman L . Projected effect of dietary salt reductions on future cardiovascular disease . N Engl J Med . 2010;362:590–599 .
120 . Joint FAO/WHO Expert Consultation on Fats and Fatty Acids in Human Nutrition, 2008 . http://www .who .int/nutrition/topics/FFA_summary_rec_conclusion .pdf . Accessed November 17, 2010 .
by guest on December 16, 2013http://circ.ahajournals.org/Downloaded from
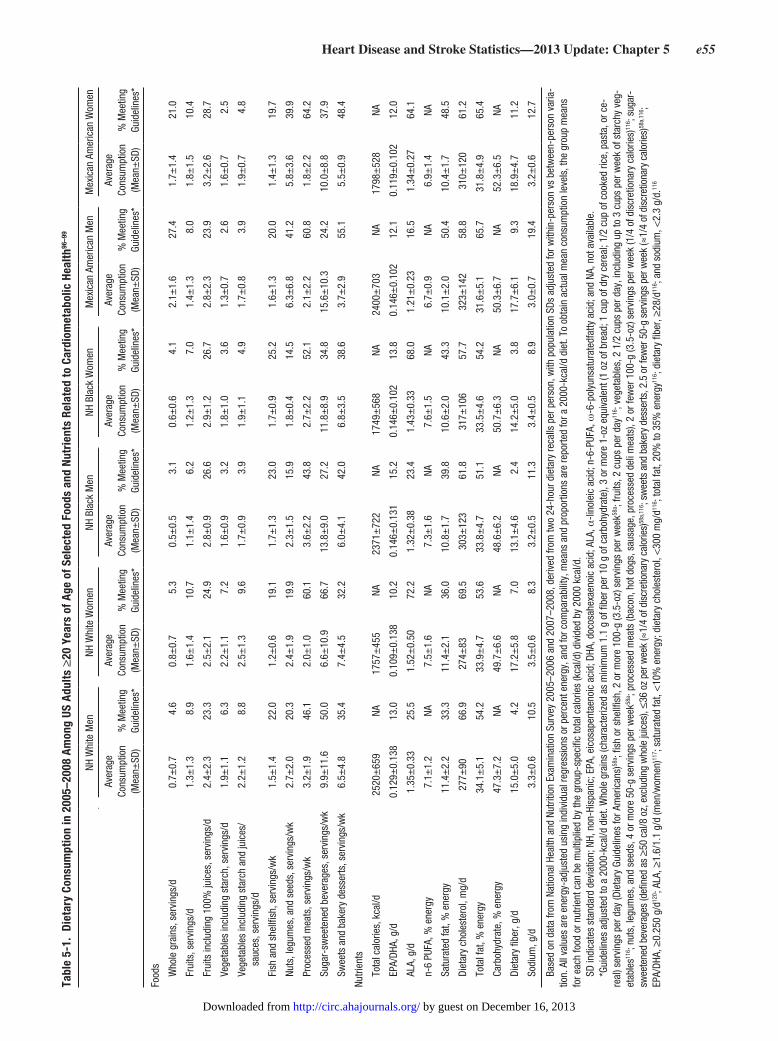
Heart Disease and Stroke Statistics—2013 Update: Chapter 5 e55Ta
ble
5-1.
Die
tary
Con
sum
ptio
n in
200
5–20
08 A
mon
g US
Adu
lts ≥
20 Y
ears
of A
ge o
f Sel
ecte
d Fo
ods
and
Nutr
ient
s Re
late
d to
Car
diom
etab
olic
Hea
lth96
–99
NH W
hite
Men
NH W
hite
Wom
enNH
Bla
ck M
enNH
Bla
ck W
omen
Mex
ican
Am
eric
an M
enM
exic
an A
mer
ican
Wom
en
Aver
age
Cons
umpt
ion
(Mea
n±SD
) %
Mee
ting
Guid
elin
es*
Aver
age
Cons
umpt
ion
(Mea
n±SD
) %
Mee
ting
Guid
elin
es*
Aver
age
Cons
umpt
ion
(Mea
n±SD
) %
Mee
ting
Guid
elin
es*
Aver
age
Cons
umpt
ion
(Mea
n±SD
) %
Mee
ting
Guid
elin
es*
Aver
age
Cons
umpt
ion
(Mea
n±SD
) %
Mee
ting
Guid
elin
es*
Aver
age
Cons
umpt
ion
(Mea
n±SD
) %
Mee
ting
Guid
elin
es*
Food
s
W
hole
gra
ins,
ser
ving
s/d
0.7±
0.7
4.6
0.8±
0.7
5.3
0.5±
0.5
3.1
0.6±
0.6
4.1
2.1±
1.6
27.4
1.7±
1.4
21.0
Fr
uits
, ser
ving
s/d
1.3±
1.3
8.9
1.6±
1.4
10.7
1.1±
1.4
6.2
1.2±
1.3
7.0
1.4±
1.3
8.0
1.8±
1.5
10.4
Fr
uits
incl
udin
g 10
0% ju
ices
, ser
ving
s/d
2.4±
2.3
23.3
2.5±
2.1
24.9
2.8±
0.9
26.6
2.9±
1.2
26.7
2.8±
2.3
23.9
3.2±
2.6
28.7
Ve
geta
bles
incl
udin
g st
arch
, ser
ving
s/d
1.9±
1.1
6.3
2.2±
1.1
7.2
1.6±
0.9
3.2
1.8±
1.0
3.6
1.3±
0.7
2.6
1.6±
0.7
2.5
Ve
geta
bles
incl
udin
g st
arch
and
juic
es/
sauc
es, s
ervi
ngs/
d2.
2±1.
28.
82.
5±1.
39.
61.
7±0.
93.
91.
9±1.
14.
91.
7±0.
83.
91.
9±0.
74.
8
Fi
sh a
nd s
hellfi
sh, s
ervi
ngs/
wk
1.5±
1.4
22.0
1.2±
0.6
19.1
1.7±
1.3
23.0
1.7±
0.9
25.2
1.6±
1.3
20.0
1.4±
1.3
19.7
Nu
ts, l
egum
es, a
nd s
eeds
, ser
ving
s/w
k2.
7±2.
020
.32.
4±1.
919
.92.
3±1.
515
.91.
8±0.
414
.56.
3±6.
841
.25.
8±3.
639
.9
Pr
oces
sed
mea
ts, s
ervi
ngs/
wk
3.2±
1.9
46.1
2.0±
1.0
60.1
3.6±
2.2
43.8
2.7±
2.2
52.1
2.1±
2.2
60.8
1.8±
2.2
64.2
Su
gar-
swee
tene
d be
vera
ges,
ser
ving
s/w
k9.
9±11
.650
.06.
6±10
.966
.713
.8±
9.0
27.2
11.8
±8.
934
.815
.6±
10.3
24.2
10.0
±8.
837
.9
Sw
eets
and
bak
ery
dess
erts
, ser
ving
s/w
k6.
5±4.
835
.47.
4±4.
532
.26.
0±4.
142
.06.
8±3.
538
.63.
7±2.
955
.15.
5±0.
948
.4
Nutri
ents
To
tal c
alor
ies,
kca
l/d25
20±
659
NA17
57±
455
NA23
71±
722
NA17
49±
568
NA24
00±
703
NA17
98±
528
NA
EP
A/DH
A, g
/d0.
129±
0.13
813
.00.
109±
0.13
810
.20.
146±
0.13
115
.20.
146±
0.10
213
.80.
146±
0.10
212
.10.
119±
0.10
212
.0
AL
A, g
/d1.
35±
0.33
25.5
1.52
±0.
5072
.21.
32±
0.38
23.4
1.43
±0.
3368
.01.
21±
0.23
16.5
1.34
±0.
2764
.1
n-
6 PU
FA, %
ene
rgy
7.1±
1.2
NA7.
5±1.
6NA
7.3±
1.6
NA7.
6±1.
5NA
6.7±
0.9
NA6.
9±1.
4NA
Sa
tura
ted
fat,
% e
nerg
y11
.4±
2.2
33.3
11.4
±2.
136
.010
.8±
1.7
39.8
10.6
±2.
043
.310
.1±
2.0
50.4
10.4
±1.
748
.5
Di
etar
y ch
oles
tero
l, m
g/d
277±
9066
.927
4±83
69.5
303±
123
61.8
317±
106
57.7
323±
142
58.8
310±
120
61.2
To
tal f
at, %
ene
rgy
34.1
±5.
154
.233
.9±
4.7
53.6
33.8
±4.
751
.133
.5±
4.6
54.2
31.6
±5.
165
.731
.8±
4.9
65.4
Ca
rboh
ydra
te, %
ene
rgy
47.3
±7.
2NA
49.7
±6.
6NA
48.6
±6.
2NA
50.7
±6.
3NA
50.3
±6.
7NA
52.3
±6.
5NA
Di
etar
y fib
er, g
/d15
.0±
5.0
4.2
17.2
±5.
87.
013
.1±
4.6
2.4
14.2
±5.
03.
817
.7±
6.1
9.3
18.9
±4.
711
.2
So
dium
, g/d
3.3±
0.6
10.5
3.5±
0.6
8.3
3.2±
0.5
11.3
3.4±
0.5
8.9
3.0±
0.7
19.4
3.2±
0.6
12.7
Base
d on
dat
a fro
m N
atio
nal H
ealth
and
Nut
ritio
n Ex
amin
atio
n Su
rvey
200
5–20
06 a
nd 2
007–
2008
, der
ived
from
two
24-h
our d
ieta
ry re
calls
per
per
son,
with
pop
ulat
ion
SDs
adju
sted
for w
ithin
-per
son
vs b
etw
een-
pers
on v
aria
-tio
n. A
ll va
lues
are
ene
rgy-
adju
sted
usi
ng in
divi
dual
regr
essi
ons
or p
erce
nt e
nerg
y, a
nd fo
r com
para
bilit
y, m
eans
and
pro
porti
ons
are
repo
rted
for a
200
0-kc
al/d
die
t. To
obt
ain
actu
al m
ean
cons
umpt
ion
leve
ls, t
he g
roup
mea
ns
for e
ach
food
or n
utrie
nt c
an b
e m
ultip
lied
by th
e gr
oup-
spec
ific
tota
l cal
orie
s (k
cal/d
) div
ided
by
2000
kca
l/d.
SD in
dica
tes
stan
dard
dev
iatio
n; N
H, n
on-H
ispa
nic;
EPA
, eic
osap
enta
enoi
c ac
id; D
HA, d
ocos
ahex
aeno
ic a
cid;
ALA
, α-li
nole
ic a
cid;
n-6
-PUF
A, ω
-6-p
olyu
nsat
urat
edfa
tty a
cid;
and
NA,
not
ava
ilabl
e.*G
uide
lines
adj
uste
d to
a 2
000-
kcal
/d d
iet.
Who
le g
rain
s (c
hara
cter
ized
as
min
imum
1.1
g o
f fibe
r per
10
g of
car
bohy
drat
e), 3
or m
ore
1-oz
equ
ival
ent (
1 oz
of b
read
; 1 c
up o
f dry
cer
eal;
1/2
cup
of c
ooke
d ric
e, p
asta
, or c
e-re
al) s
ervi
ngs
per d
ay (D
ieta
ry G
uide
lines
for A
mer
ican
s)58
a ; fis
h or
she
llfish
, 2 o
r mor
e 10
0-g
(3.5
-oz)
ser
ving
s pe
r wee
k58a ;
fruits
, 2 c
ups
per d
ay11
6 ; ve
geta
bles
, 2 1
/2 c
ups
per d
ay, i
nclu
ding
up
to 3
cup
s pe
r wee
k of
sta
rchy
veg
-et
able
s116 ;
nuts
, leg
umes
, and
see
ds, 4
or m
ore
50-g
ser
ving
s pe
r wee
k58a ;
proc
esse
d m
eats
(bac
on, h
ot d
ogs,
sau
sage
, pro
cess
ed d
eli m
eats
), 2
or fe
wer
100
-g (3
.5-o
z) s
ervi
ngs
per w
eek
(1/4
of d
iscr
etio
nary
cal
orie
s)11
6 ; su
gar-
swee
tene
d be
vera
ges
(defi
ned
as ≥
50 c
al/8
oz,
exc
ludi
ng w
hole
juic
es),
≤36
oz p
er w
eek
(≈1/
4 of
dis
cret
iona
ry c
alor
ies)
58a,
116 ;
swee
ts a
nd b
aker
y de
sser
ts, 2
.5 o
r few
er 5
0-g
serv
ings
per
wee
k (≈
1/4
of d
iscr
etio
nary
cal
orie
s)58
a,11
6 ;
EPA/
DHA,
≥0.
250
g/d12
0 ; AL
A, ≥
1.6/
1.1
g/d
(men
/wom
en)11
7 ; sa
tura
ted
fat,
<10
% e
nerg
y; d
ieta
ry c
hole
ster
ol, <
300
mg/
d116 ;
tota
l fat
, 20%
to 3
5% e
nerg
y116 ;
diet
ary
fiber
, ≥28
/d11
6 ; an
d so
dium
, <2.
3 g/
d.11
6
by guest on December 16, 2013http://circ.ahajournals.org/Downloaded from

e56 Circulation January 1/8, 2013Ta
ble
5-2.
Die
tary
Con
sum
ptio
n in
200
5–20
08 A
mon
g US
Chi
ldre
n an
d Te
enag
ers
of S
elec
ted
Food
s an
d Nu
trie
nts
Rela
ted
to C
ardi
omet
abol
ic H
ealth
Boys
(5–9
y)
Girls
(5–9
y)
Boys
(10
–14
y)Gi
rls (1
0 –1
4 y)
Boys
(15–
19 y
)Gi
rls (1
5–19
y)
Aver
age
Cons
umpt
ion
(Mea
n±SD
) %
Mee
ting
Guid
elin
es*
Aver
age
Cons
umpt
ion
(Mea
n±SD
) %
Mee
ting
Guid
elin
es*
Aver
age
Cons
umpt
ion
(Mea
n±SD
) %
Mee
ting
Guid
elin
es*
Aver
age
Cons
umpt
ion
(Mea
n±SD
) %
Mee
ting
Guid
elin
es*
Aver
age
Cons
umpt
ion
(Mea
n±SD
) %
Mee
ting
Guid
elin
es*
Aver
age
Cons
umpt
ion
(Mea
n±SD
) %
Mee
ting
Guid
elin
es*
Food
s
W
hole
gra
ins,
ser
ving
s/d
0.5±
0.5
2.7
0.5±
0.3
1.1
0.6±
0.6
4.0
0.5±
0.4
1.8
0.4±
0.4
1.6
0.5±
0.5
2.6
Fr
uits
, ser
ving
s/d
1.5±
1.1
8.3
1.5±
0.8
8.5
1.2±
1.0
6.9
1.4±
1.1
8.4
0.9±
0.8
3.9
0.9±
0.8
4.6
Fr
uits
incl
udin
g 10
0% ju
ices
, ser
ving
s/d
3.3±
1.7
35.7
3.1±
1.4
28.5
2.4±
1.7
21.7
2.8±
1.9
26.0
2.2±
1.7
21.1
2.4±
1.7
21.7
Ve
geta
bles
incl
udin
g st
arch
, ser
ving
s/d
0.9±
0.4
0.5
1.0±
0.5
0.9
1.0±
0.6
1.1
1.1±
0.6
1.6
1.0±
0.1
1.1
1.1±
0.2
1.1
Ve
geta
bles
incl
udin
g st
arch
and
juic
es/
sauc
es, s
ervi
ngs/
d1.
1±0.
40.
81.
1±0.
61.
31.
1±0.
61.
21.
3±0.
61.
91.
3±0.
91.
51.
3±0.
42.
4
Fi
sh a
nd s
hellfi
sh, s
ervi
ngs/
wk
0.5±
0.7
9.9
0.7±
0.7
11.7
0.9±
0.7
13.5
0.6±
0.7
10.3
0.7±
0.9
11.0
0.7±
0.9
12.2
Nu
ts, l
egum
es, a
nd s
eeds
, ser
ving
s/w
k1.
4±0.
412
.51.
3±2.
59.
62.
1±2.
814
.11.
4±1.
010
.11.
1±1.
09.
40.
8±1.
06.
8
Pr
oces
sed
mea
ts, s
ervi
ngs/
wk
2.3±
1.1
55.5
2.1±
1.0
60.0
2.6±
1.0
54.9
2.3±
1.0
52.1
3.2±
1.5
45.6
2.4±
1.0
55.8
Su
gar-
swee
tene
d be
vera
ges,
ser
ving
s/w
k8.
5±5.
938
.68.
3±5.
137
.913
.3±
7.0
23.5
10.9
±7.
331
.618
.2±
11.1
16.7
13.9
±10
.132
.4
Sw
eets
and
bak
ery
dess
erts
, ser
ving
s/w
k10
.1±
2.1
19.5
9.3±
2.1
18.3
9.0±
2.1
23.5
8.1±
2.0
30.2
6.0±
5.2
41.9
8.2±
5.2
31.5
Nutri
ents
To
tal c
alor
ies,
kca
l/d19
46±
328
NA17
43±
330
NA21
39±
403
NA18
49±
432
NA26
70±
903
NA18
45±
453
NA
EP
A/DH
A, g
/d0.
045±
0.02
53.
10.
056±
0.02
55.
90.
074±
0.03
07.
30.
052±
0.03
04.
70.
071±
0.02
25.
20.
065±
0.02
15.
7
AL
A, g
/d1.
12±
0.15
9.5
1.15
±0.
2046
.31.
11±
0.20
9.7
1.19
±0.
2849
.11.
14±
0.18
13.2
1.34
±0.
1859
.2
n-
6 PU
FA, %
ene
rgy
6.4±
1.1
NA6.
5±1.
0NA
6.5±
1.0
NA6.
7±0.
9NA
6.4±
0.6
NA7.
1±1.
3NA
Sa
tura
ted
fat,
% e
nerg
y11
.7±
1.4
24.9
11.8
±0.
821
.311
.6±
0.7
27.8
11.5
±1.
828
.611
.8±
1.4
24.8
11.3
±1.
734
.1
Di
etar
y ch
oles
tero
l, m
g/d
225±
6981
.623
9±57
78.4
245±
5776
.622
6±11
481
.624
4±11
476
.924
0±11
477
.7
To
tal f
at, %
ene
rgy
33.0
±3.
367
.633
.3±
3.0
66.6
33.1
±2.
665
.633
.1±
4.2
61.6
33.6
±3.
158
.933
.3±
4.9
57.0
Ca
rboh
ydra
te, %
ene
rgy
54.5
±4.
1NA
53.8
±3.
7NA
53.1
±3.
6NA
53.8
±4.
9NA
51.4
±4.
1NA
52.9
±6.
3NA
Di
etar
y fib
er, g
/d13
.6±
2.3
0.2
13.9
±2.
20.
713
.3±
3.4
1.1
13.9
±3.
31.
811
.9±
2.4
0.6
13.3
±2.
91.
9
So
dium
, g/d
3.1±
0.3
8.2
3.2±
0.4
8.7
3.2±
0.2
9.8
3.3±
0.2
7.4
3.2±
0.4
11.9
3.4±
0.5
9.1
Base
d on
dat
a fro
m N
atio
nal H
ealth
and
Nut
ritio
n Ex
amin
atio
n Su
rvey
200
5–20
06 a
nd 2
007–
2008
, der
ived
from
two
24-h
our d
ieta
ry re
calls
per
per
son,
with
pop
ulat
ion
SDs
adju
sted
for w
ithin
-per
son
vs b
etw
een-
pers
on v
aria
-tio
n. A
ll va
lues
are
ene
rgy-
adju
sted
usi
ng in
divi
dual
regr
essi
ons
or p
erce
nt e
nerg
y, a
nd fo
r com
para
bilit
y, m
eans
and
pro
porti
ons
are
repo
rted
for a
200
0-kc
al/d
die
t. To
obt
ain
actu
al m
ean
cons
umpt
ion
leve
ls, t
he g
roup
mea
ns
for e
ach
food
or n
utrie
nt c
an b
e m
ultip
lied
by th
e gr
oup-
spec
ific
tota
l cal
orie
s (k
cal/d
) div
ided
by
2000
kca
l/d.
SD in
dica
tes
stan
dard
dev
iatio
n; N
A, n
ot a
vaila
ble;
EPA
, eic
osap
enta
enoi
c ac
id; D
HA, d
ocos
ahex
aeno
ic a
cid;
ALA
, α-li
nole
ic a
cid;
and
n-6
-PUF
A, ω
-6-p
olyu
nsat
urat
ed fa
tty a
cid.
*See
Tab
le 5
-1 fo
r foo
d gr
oup,
ser
ving
siz
e, a
nd g
uide
line
defin
ition
s. F
or d
iffer
ent a
ge a
nd s
ex s
ubgr
oups
her
e, th
e gu
idel
ine
cutp
oint
s ar
e st
anda
rdiz
ed to
a 2
000-
kcal
/d d
iet t
o ac
coun
t for
diff
eren
ces
in c
alor
ic in
take
in th
ese
grou
ps.
by guest on December 16, 2013http://circ.ahajournals.org/Downloaded from

Heart Disease and Stroke Statistics—2013 Update: Chapter 5 e57
0
500
1000
1500
2000
2500
0
10
20
30
40
50
1971-1974 2001-2004 1971-1974 2001-2004
Ttoa
l cal
orie
s (k
cal p
er d
ay)
Perc
ent e
nerg
y fr
om p
rote
in, f
at, o
r car
bohy
drat
e
Protein Fat Carbohydrate Total Calories
Men Women
Chart 5-1. Age-adjusted trends in macronutrients and total calories consumed by US adults (20–74 years of age), 1971–2004. Data derived from National Center for Health Statistics. Health, United States 2007, With Chartbook on Trends in the Health of Americans.13
0
20
40
60
80
100
120
140
1965 1977 1988 2002
Per c
apita
cal
orie
s pe
r day
Whole-fat milk Low-fat milk Coffee
Tea Sweetened fruit drinks 100% Fruit juice
Alcohol Regular soda/cola
Chart 5-2. Per-capita calories consumed from different beverages by US adults (≥19 years of age), 1965–2002. Data derived from Nationwide Food Consumption Surveys (1965, 1977–1978), National Health and Nutrition Examination Survey (1988–1994, 1999–2002), and Duffey and Popkin.57
by guest on December 16, 2013http://circ.ahajournals.org/Downloaded from
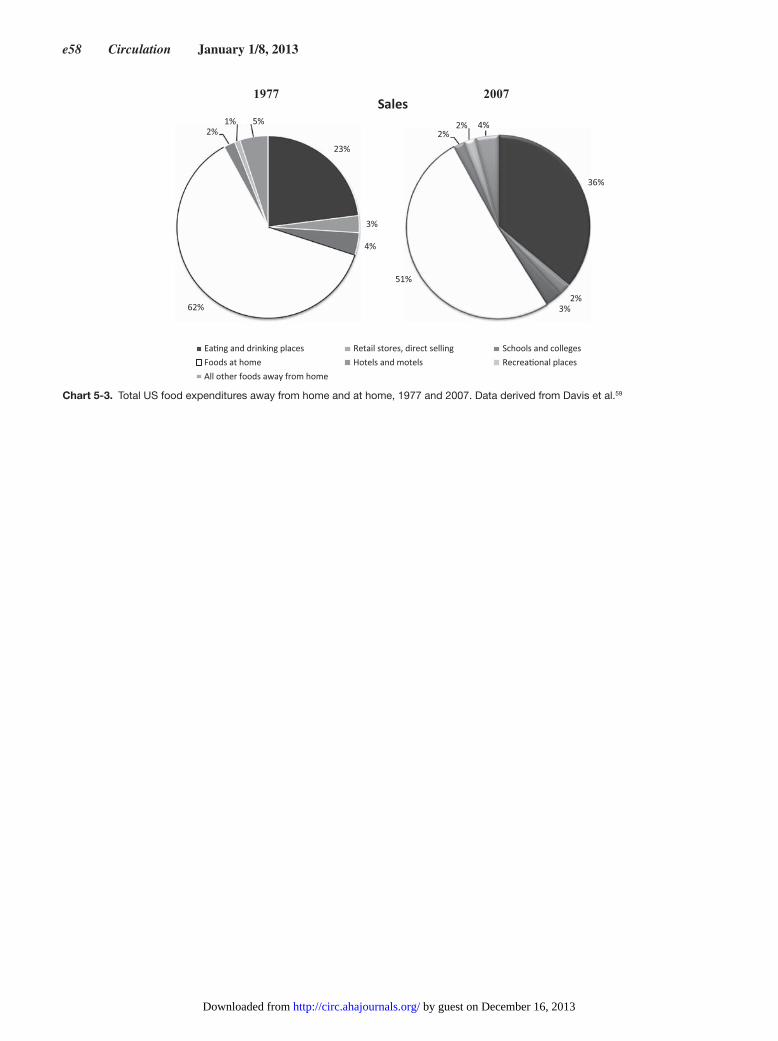
e58 Circulation January 1/8, 2013
23%
3%
4%
62%
2%1% 5%
Sales1977 2007
36%
2%3%
51%
2%2% 4%
Chart 5-3. Total US food expenditures away from home and at home, 1977 and 2007. Data derived from Davis et al.59
by guest on December 16, 2013http://circ.ahajournals.org/Downloaded from

Heart Disease and Stroke Statistics—2013 Update: Chapter 6 e59
e59
6. Overweight and Obesity
See Table 6-1 and Charts 6-1 through 6-3
Prevalence
Youth(See Table 6-1 and Chart 6-1)
●● The prevalence of overweight and obesity in children 2 to 5 years of age, based on a BMI-for-age value ≥85th percentile of the 2000 CDC growth charts, was 26% for non-Hispanic white boys and 21% for non-Hispanic white girls, 31% for non-Hispanic black boys and 27% for non-Hispanic black girls, and 32% for Mexican American boys and 33% for Mexican American girls according to 2009–2010 data from NHANES (NCHS) . In children 6 to 11 years of age, the prevalence was 30% for non-Hispanic white boys and 25% for non-Hispanic white girls, 41% for non-Hispanic black boys and 44% for non-Hispanic black girls, and 39% for
Mexican American boys and 40% for Mexican American girls . In children 12 to 19 years of age, the prevalence was 32% for non-Hispanic white boys and 28% for non-His-panic white girls, 37% for non-Hispanic black boys and 45% for non-Hispanic black girls, and 46% for Mexican American boys and 41% for Mexican American girls .2
●● The prevalence of obesity in children 2 to 5 years of age, based on BMI-for-age values ≥95th percentile of the 2000 CDC growth charts, was 12% for non-Hispanic white boys and 6% for non-Hispanic white girls, 21% for non-Hispanic black boys and 17% for non-Hispanic black girls, and 19% for Mexican American boys and 12% for Mexican Ameri-can girls according to 2009–2010 data from NHANES (NCHS) . In children 6 to 11 years of age, the prevalence was 17% for non-Hispanic white boys and 11% for non-Hispanic white girls, 30% for non-Hispanic black boys and 28% for non-Hispanic black girls, and 22% for Mexican American boys and 22% for Mexican American girls . In children 12 to 19 years of age, the prevalence was 18% for non-Hispanic white boys and 15% for non-Hispanic white girls, 23% for non-Hispanic black boys and 25% for non-Hispanic black girls, and 29% for Mexican American boys and 19% for Mexican American girls .2
●● Overall, 18% of US children and adolescents 6 to 19 years of age have BMI-for-age values ≥95th percentile of the 2000 CDC growth charts for the United States (NHANES [2009–2010], NCHS) .2
●● NHANES 2009–2010 found that 16 .9% (15 .4%–18 .4%) of youth aged 2 to 19 years were obese, which was unchanged from 2007–2008 . Rates of overweight and obesity (≥85th BMI percentile) were 39 .1% for Hispanics, 39 .4% for Mexican Americans, 27 .9% for non-Hispanic whites, and 39 .1% for non-Hispanic blacks .2
●● A study of >8500 4-year-olds in the Early Childhood Lon-gitudinal Study, Birth Cohort (National Center for Educa-tion Statistics) found that 1 in 5 were obese . Almost 13% of Asian children, 16% of white children, nearly 21% of black children, 22% of Hispanic children, and 31% of Ameri-can Indian children were obese . Children were considered obese if their BMI was ≥95th percentile on the basis of CDC BMI growth charts . For 4-year-olds, that would be a BMI of ≈18 kg/m2 .3
●● Childhood sociodemographic factors may contribute to sex disparities in obesity prevalence . A study of data from the National Longitudinal Study of Adolescent Health found that parental education consistently modified sex disparity in blacks . The sex gap was largest in those with low parental education (16 .7% of men compared with 45 .4% of women were obese) and smallest in those with high parental educa-tion (28 .5% of men compared with 31 .4% of women were obese) . In whites, there was little overall sex difference in obesity prevalence .4
●● The obesity epidemic is disproportionally more rampant among children living in low-income, low-education, and higher-unemployment households, according to data from the National Survey of Children’s Health .5
●● Data from 2011 show that American Indian/Alaskan Native youth have an obesity rate of 17 .7%, whereas rates are 14 .7% for Hispanics, 10 .6% for non-Hispanic blacks, 10 .3% for non-Hispanic whites, and 9 .3% for Asian/Pacific Islanders .6
●● According to 1999–2008 NHANES survey data, lowest-income girls had an obesity prevalence of 17 .9% compared
Abbreviations Used in Chapter 6
AF atrial fibrillation
AFFIRM Atrial Fibrillation Follow-up Investigation of Rhythm Management
BMI body mass index
BP blood pressure
BRFSS Behavioral Risk Factor Surveillance System
CAD coronary artery disease
CARDIA Coronary Artery Risk Development in Young Adults
CDC Centers for Disease Control and Prevention
CHF congestive heart failure
CI confidence interval
CVD cardiovascular disease
DM diabetes mellitus
FHS Framingham Heart Study
HbA1c hemoglobin A1c
HDL high-density lipoprotein
HR hazard ratio
HUNT 2 Nord-Trøndelag Health Study
IMT intima-media thickness
MEPS Medical Expenditure Panel Survey
MESA Multi-Ethnic Study of Atherosclerosis
MI myocardial infarction
NCHS National Center for Health Statistics
NH non-Hispanic
NHANES National Health and Nutrition Examination Survey
NHDS National Hospital Discharge Survey
NHIS National Health Interview Survey
NHLBI National Heart, Lung, and Blood Institute
OR odds ratio
PA physical activity
RR relative risk
SBP systolic blood pressure
SD standard deviation
STEMI ST-segment–elevation myocardial infarction
WHO World Health Organization
by guest on December 16, 2013http://circ.ahajournals.org/Downloaded from

e60 Circulation January 1/8, 2013
with 13 .1% among those with higher income; similar observations were observed for boys (20 .6% versus 15 .6%, respectively) .7
●● According to the US National Longitudinal Study of Adolescent Health, 1 .0% of adolescents were severely obese in 1996 (defined as age <20 years and BMI ≥95th sex-specific BMI-for-age growth chart or BMI ≥30 kg/m2); the majority (70 .5%) maintained this weight sta-tus into adulthood . Obese adolescents had a 16-fold increased risk of becoming severely obese adults com-pared with those with normal weight or those who were overweight .8
●● NHANES 2003–2004 and 2005–2006 data were used to determine overweight and obesity prevalence in rural ver-sus urban youth; the results showed that 39% of rural ver-sus 32% of urban children had BMI >85th percentile .9
Adults(See Table 6-1 and Chart 6-2)
●● According to NHANES 2007-2010 (unpublished NHLBI tabulations):
—●Overall, 68% of US adults were overweight or obese (73% of men and 64% of women) .
—●Among men, Mexican-Americans (81%) and non-His-panic whites (73%) were more likely to be overweight or obese than non-Hispanic blacks (69%) .
—●Among women, non-Hispanic blacks (80%) and Mexi-can-Americans (78%) were more likely to be overweight or obese than non-Hispanic whites (60%) .
—●Among US adults, 35% were obese (35% of men and 36% of women) .
—●Among men, non-Hispanic blacks (38%) and Mexican-Americans (36%) were more likely to be obese than non-Hispanic whites (34%) .
—●Among women, non-Hispanic blacks (54%) and Mexi-can-Americans (45%) were more likely to be obese than non-Hispanic whites (33%) .
●● When estimates were based on self-reported height and weight in the BRFSS/CDC survey in 2011, the prevalence of obesity ranged from 20 .7% in Colorado to 34 .9% in Mississippi . The median percentage by state was 27 .8% .10 Additionally, no state met the Healthy People 2010 goal of reducing obesity to 15% of adults .11
●● On the basis of 2011 data on self-reported weights and heights from the 2011 NHIS12:
—●Blacks ≥18 years of age (26 .4%), American Indians or Alaska Natives (27 .6%), and whites (36 .6%) were less likely than Asians (56 .7%) to be at a healthy weight .12
—●Blacks ≥18 years of age (38 .9%) and American Indians or Alaska Natives (40 .8%) were more likely to be obese than were whites (27 .2%) and Asians (9 .3%) .12
●● Most adults in Asian subgroups were in the healthy weight range, with rates ranging from 51% for Filipino adults to 68% for Chinese adults . Although the prevalence of obesity is low within the Asian adult population, Filipino adults (14%) were more than twice as likely to be obese (BMI ≥30 kg/m2) as Asian Indian (6%), Vietnamese (5%), or Chinese (4%) adults .13
●● According to the 2008 National Healthcare Disparities Report (on the basis of NHANES 2003–2006)14:
—●Approximately 64 .8% of obese adults were told by a doctor or health professional that they were overweight .
—●The proportion of obese adults told that they were over-weight was significantly lower for non-Hispanic blacks (60 .5%) and Mexican Americans (57 .1%) than for non-Hispanic whites (66 .4%), for middle-income people than for high-income people (62 .4% versus 70 .6%), and for adults with less than a high school education than for those with any college education (59 .2% versus 70 .3%) .14
●● As judged by an analysis of data from the Multi-Ethnic Study of Atherosclerosis (MESA), a large proportion of white, black, and Hispanic participants were overweight (60%–85%) or obese (30%–50%), whereas fewer Chinese American participants were overweight (33%) or obese (5%) .15
●● In a cross-sectional study of 7000 elderly subjects at high cardiovascular risk, adherence to a Mediterranean diet, moderate alcohol consumption, the expenditure of ≥200 kcal/d in PA, and nonsmoking were associated with a 1 .3-kg/m2 (0 .9–1 .7) lower BMI and a 4 .3-cm (3 .1–5 .4) lower waist circumference than having ≤1 healthy lifestyle factor .16
●● Among severely obese (class II or III) patients, a 1-year intensive lifestyle intervention of diet and PA achieved clinically significant weight loss and improvement in car-diometabolic factors in addition to reduction in visceral and hepatic fat content .17
Trends
Youth(See Chart 6-3)
●● Among infants and children between 6 and 23 months of age, the prevalence of high weight for recumbent length was 7% in 1976–1980 and 12% in 2003–2006 (NHANES, NCHS) .18
●● The obesity epidemic in children continues to grow on the basis of recent data from the Bogalusa Heart Study . Com-pared with 1973 to 1974, the proportion of children 5 to 17 years of age who were obese was 5 times higher in 2008 to 2009 .19
●● A comparison of NHANES 2009–2010 data with 1999–2000 data demonstrates an increase in obesity prevalence in male youth of 5% (OR, 1 .05; 95% CI, 1 .01–1 .10) but not in female youth (OR, 1 .02; 95% CI, 0 .98–1 .07) .2
Adults
●● On the basis of 2009 self-reported BRFSS data, overall obe-sity prevalence was 26 .7% in the United States, with rates of 27 .4% in men and 26 .0% in women . By race/ethnicity, the prevalence of obesity among non-Hispanic whites was 25 .2%, whereas it was 36 .8% among non-Hispanic blacks and 30 .7% among Hispanics . There was an inverse asso-ciation by education level: College graduates had a 20 .8% rate of obesity, whereas those who attained less than a high school education had an obesity prevalence of 32 .9% .20
●● The prevalence of obesity increased by 5 .6% or ≈2 .7 million people from 1997 to 2002 among Medicare beneficiaries .
by guest on December 16, 2013http://circ.ahajournals.org/Downloaded from

Heart Disease and Stroke Statistics—2013 Update: Chapter 6 e61
By 2002, 21 .4% of beneficiaries and 39 .3% of disabled beneficiaries were obese compared with 16 .4% and 32 .5%, respectively, in 1997 .21
●● The population attributable fraction for CHD associated with reducing current population mean BMI to 21 kg/m2 in the Asia-Pacific region ranged from 2% in India to 58% in American Samoa; the population attributable fraction for ischemic stroke ranged from 3% in India to 64% in American Samoa . These data from 15 countries show the proportion of CVD that would be prevented if the popula-tion mean BMI were reduced below the current overweight cut point .22a
●● The CARDIA study showed that young adults who were overweight or obese had lower health-related quality of life than normal-weight participants 20 years later . On the basis of data from the Medical Outcomes Study 12-item short-form health survey, overweight and obese participants had lower multivariable-adjusted scores on the physical com-ponent summary score but not on the mental component summary score .22
●● Forecasts through 2030 using the BRFSS 1990–2008 data set suggest that by 2030, 51% of the population will be obese, with 11% with severe obesity, an increase of 33% for obesity and 130% for severe obesity .23
Morbidity
●● Overweight children and adolescents are at increased risk for future adverse health effects, including the following24:
—Increased prevalence of traditional cardiovascular risk factors such as hypertension, hyperlipidemia, and DM .
—Poor school performance, tobacco use, alcohol use, pre-mature sexual behavior, and poor diet .
—Other associated health conditions, such as asthma, hepatic steatosis, sleep apnea, stroke, some cancers (breast, colon, and kidney), musculoskeletal disorders, and gallbladder disease .
●● According to data from the Bogalusa Heart Study and the Young Finns study, adolescents with high BMI in the over-weight or obese range are at a 2 .5-fold increased risk of developing metabolic syndrome, a 2 .2-fold increased risk of high carotid IMT, and a 3 .4-fold increased risk of DM in adulthood .25
●● The increasing prevalence of obesity is driving an increased incidence of type 2 DM . Data from the FHS indicate a dou-bling in the incidence of DM over the past 30 years, most dramatically during the 1990s and primarily among indi-viduals with a BMI >30 kg/m2 .26
●● Obesity was the most powerful predictor of DM in the Nurses’ Health Study . Women with a BMI of ≥35 kg/m2 had an RR for DM of 38 .8 compared with women with a BMI of <23 kg/m2 .27
●● Obesity is also a strong predictor of sleep-disordered breathing, itself strongly associated with the development of CVD, as well as with myriad other health conditions, including numerous cancers, nonalcoholic fatty liver dis-ease, gallbladder disease, musculoskeletal disorders, and reproductive abnormalities .28
●● A recent meta-analysis of 15 prospective studies demon-strated the increased risk for Alzheimer disease or vas-cular dementia and any dementia was 1 .35 and 1 .26 for
overweight, respectively, and 2 .04 and 1 .64 for obesity, respectively .29
●● A randomized clinical trial of 130 severely obese adult individuals randomized to either 12 months of diet and PA or only 6 months of PA resulted in 12 .1 and 9 .9 kg, respec-tively, of weight loss at 1 year, with improvements in waist circumference, visceral fat, BP, and insulin resistance .17
●● Data from 4 Finnish cohort studies examining childhood and adult BMI with a mean follow-up of 23 years found that overweight or obese children who remained obese in adulthood had increased risks of type 2 DM, hypertension, dyslipidemia, and carotid atherosclerosis . However, those who became normal weight by adulthood had risks compa-rable to individuals who were never obese .30
●● In a meta-analysis from 58 cohorts, representing 221 934 people in 17 developed countries with 14 297 incident CVD outcomes, BMI, waist circumference, and waist-to-hip ratio were only minimally associated with cardiovascular outcomes after controlling for baseline SBP, DM, and total and HDL cholesterol in addition to age, sex, and smoking status . Measures of adiposity also did not improve risk dis-crimination or reclassification when risk factor data were included .31
●● Ten-year follow-up data from the Swedish Obese Subjects intervention study indicated that to maintain a favorable effect on cardiovascular risk factors, more than the short-term goal of 5% weight loss is needed to overcome secular trends and aging effects .32
●● An obesity paradox has been reported, with obese patients demonstrating favorable outcomes in CHF, hypertension, peripheral vascular disease, and coronary artery disease (CAD) . In the Atrial Fibrillation Follow-up Investigation of Rhythm Management (AFFIRM) study, a multicenter trial of atrial fibrillation (AF), obese patients had lower all-cause mortality (HR=0 .77, P=0 .01) than normal-weight patients after multivariable adjustment over a 3-year fol-low-up period .33
●● A systematic review of prospective studies examining overweight and obesity as predictors of major stroke subtypes in >2 million participants over ≥4 years found an adjusted RR for ischemic stroke of 1 .22 (1 .05–1 .41) in overweight individuals and an RR of 1 .64 (1 .36–1 .99) for obese individuals relative to normal-weight individuals . RRs for hemorrhagic stroke were 1 .01 (0 .88–1 .17) and 1 .24 (0 .99–1 .54) for overweight and obese individuals, respectively . These risks were graded with increasing BMI and were independent of age, lifestyle, and other cardiovascular risk factors .34
Mortality
●● Elevated childhood BMIs in the highest quartile were asso-ciated with premature death as an adult in a cohort of 4857 American Indian children during a median follow-up of 23 .9 years .35
●● Among adults, obesity was associated with nearly 112 000 excess deaths (95% CI, 53 754–170 064) relative to normal weight in 2000 . Grade I obesity (BMI 30 to <35 kg/m2) was associated with almost 30 000 of these excess deaths (95% CI, 8534–68 220) and grade II to III obesity (BMI ≥35 kg/m2) with >82 000 (95% CI, 44 843–119 289) . Underweight was associated with nearly 34 000 excess deaths (95% CI,
by guest on December 16, 2013http://circ.ahajournals.org/Downloaded from

e62 Circulation January 1/8, 2013
15 726–51 766) . As other studies have found,36 overweight (BMI 25 to <30 kg/m2) was not associated with excess deaths .37
●● Overweight was associated with significantly increased mortality resulting from DM or kidney disease and was not associated with increased mortality resulting from cancer or CVD in an analysis of 2004 data from NHANES . Obe-sity was associated with significantly increased mortality caused by CVD, some cancers, and DM or kidney disease . Obesity was associated with 13% of CVD deaths in 2004 .38
●● In a collaborative analysis of data from almost 900 000 adults in 57 prospective studies, mostly in western Europe and North America, overall mortality was lowest at a BMI of ≈22 .5 to 25 kg/m2 in both sexes and at all ages, after exclusion of early follow-up and adjustment for smoking status . Above this range, each 5-kg/m2-higher BMI was associated with ≈30% higher all-cause mortality, and no specific cause of death was inversely associated with BMI . Below 22 .5 to 25 kg/m2, the overall inverse association with BMI was predominantly related to strong inverse associa-tions for smoking-related respiratory disease, and the only clearly positive association was for ischemic heart disease .39
●● In a meta-analysis of 1 .46 million white adults, over a mean follow-up period of 10 years, all-cause mortality was low-est at BMI levels of 20 .0 to 24 .9 kg/m2 . Among women, compared with a BMI of 22 .5 to 24 .9 kg/m2, the HRs for death were as follows: BMI 15 .0 to 18 .4 kg/m2, 1 .47; 18 .5 to 19 .9 kg/m2, 1 .14; 20 .0 to 22 .4 kg/m2, 1 .0; 25 .0 to 29 .9 kg/m2, 1 .13; 30 .0 to 34 .9 kg/m2, 1 .44; 35 .0 to 39 .9 kg/m2, 1 .88; and 40 .0 to 49 .9 kg/m2, 2 .51 . Similar estimates were observed in men .40
●● Calculations based on NHANES data from 1978–2006 suggest that the gains in life expectancy from smoking ces-sation are beginning to be outweighed by the loss of life expectancy related to obesity .41
●● Because of the increasing prevalence of obesity, the num-ber of quality-adjusted life-years lost as a result of obesity is similar to or greater than that lost as a result of smoking, according to data from the BRFSS .42
●● Recent estimates suggest that reductions in smoking, cho-lesterol, BP, and PA levels resulted in a gain of 2 770 500 life-years; however, these gains were reduced by a loss of 715 000 life-years caused by the increased prevalence of obesity and DM .43
●● Using self-reported NHIS data with linked mortality files through 2006, the HR for all-cause mortality was 1 .07 (95% CI, 0 .91–1 .26) for overweight individuals, 1 .41 (95% CI, 1 .16–1 .73) for obese individuals, and 2 .46 for extremely obese individuals (95% CI, 1 .91–3 .16) .44
●● In a comparison of 5 different anthropometric variables (BMI, waist circumference, hip circumference, waist-to-hip ratio, and waist-to-height ratio) in 62 223 individuals from Norway with 12 years of follow-up from the HUNT 2 study (Nord-Trøndelag Health Study), the risk of death per SD increase in each measure was 1 .02 (95% CI, 0 .99–1 .06) for BMI, 1 .10 (95% CI, 1 .06–1 .14) for waist circumfer-ence, 1 .01 (95% CI, 0 .97–1 .05) for hip circumference, 1 .15 (95% CI, 1 .11–1 .19) for waist-to-hip ratio, and 1 .12 (95% CI, 1 .08–1 .16) for waist-to-height ratio . For CVD mortal-ity, the risk of death per SD increase was 1 .12 (95% 1 .06–1 .20) for BMI, 1 .19 (1 .12–1 .26) for waist circumference,
1 .06 (1 .00–1 .13) for hip circumference, 1 .23 (95% CI, 1 .16–1 .30) for waist-to-hip ratio, and 1 .24 (95% CI, 1 .16–1 .31) for waist-to-height ratio .45
●● According to data from the National Cardiovascular Data Registry, among patients presenting with ST-segment–elevation myocardial infarction (STEMI) and a BMI of at least 40 kg/m2, in-hospital mortality rates were higher for patients with class III obesity (OR, 1 .64; 95% CI, 1 .32–2 .03) when class I obesity was used as the referent .46
●● The Canadian Heart Health Surveys from 1986 to 1995 demonstrated an increased risk of cancer across BMI cat-egories, with an HR of 1 .34 (95% CI, 1 .01–1 .78) for those with BMI 30 to 34 .9 kg/m2 and an HR of 1 .82 (95% CI, 1 .22–2 .71) for those with BMI ≥35 kg/m2 .47
●● In a study of 22 203 women and men from England and Scotland, metabolically unhealthy obese individuals were at an increased risk of all-cause mortality compared with metabolically healthy obese individuals (HR, 1 .72; 95% CI, 1 .23–2 .41) .48
Cost
●● Among children and adolescents, annual hospital costs related to obesity were $127 million between 1997 and 1999 .49
●● According to 1 study, overall estimates show that the annual medical burden of obesity has increased to almost 10% of all medical spending and could amount to $147 billion per year in 2008 (in 2008 dollars) .50
●● If current trends in the growth of obesity continue, total healthcare costs attributable to obesity could reach $861 to $957 billion by 2030, which would account for 16% to 18% of US health expenditures .51
●● According to NHANES I data linked to Medicare and mortal-ity records, obese 45-year-olds had lifetime Medicare costs of $163 000 compared with $117 000 among those with normal weight by the time they reached 65 years of age .52
●● The total excess cost related to the current prevalence of adolescent overweight and obesity is estimated to be $254 billion ($208 billion in lost productivity secondary to premature morbidity and mortality and $46 billion in direct medical costs) .53
●● According to 2006 MEPS and 2006 BRFSS data, annual medical expenditures would be 6 .7% to 10 .7% lower in the absence of obesity .54
●● According to data from the Medicare Current Beneficiary Survey from 1997–2006, in 1997, expenditures for a Part A and Part B services beneficiary were $6832 for a normal-weight individual, which was more than for overweight ($5473) or obese ($5790) individuals . However, over time, expenses increased more rapidly for overweight and obese individuals .55
●● The costs of obesity are high: Obese people pay on average $1429 (42%) more for healthcare costs than normal-weight individuals . For obese beneficiaries, Medicare pays $1723 more, Medicaid pays $1021 more, and private insurances pay $1140 more than for beneficiaries who are at normal weight . Similarly, obese people have 46% higher inpatient costs and 27% more outpatient visits and spend 80% more on prescription drugs .50
by guest on December 16, 2013http://circ.ahajournals.org/Downloaded from

Heart Disease and Stroke Statistics—2013 Update: Chapter 6 e63
Bariatric Surgery
●● Patients with BMI >40 kg/m2 or >35 kg/m2 with an obesity-related comorbidity are eligible for gastric bypass surgery, which is typically performed as either a Roux-en-Y gastric bypass or a biliopancreatic diversion .
●● According to the 2006 NHDS, the incidence of bariatric surgery was estimated at 113 000 cases per year, with costs of ≈1 .5 billion dollars annually .56
●● Among obese Swedish patients undergoing bariatric sur-gery and followed up for up to 15 years, maximum weight loss was 32% . The risk of death was 0 .76 among those who underwent bariatric surgery compared with matched con-trol subjects .57 More recent data examining MI and stroke showed that bariatric surgery was associated with fewer CVD deaths (HR, 0 .47; 95% CI, 0 .29–0 .76) and fewer strokes (HR, 0 .67; 95% CI, 0 .54–0 .83) than in the control group .58
●● Among 641 patients followed up for 10 years compared with 627 matched control subjects, after 2 years of follow-up, 72% of the surgically treated patients versus 21% of the control patients had remission of their DM; at 10 years of follow-up, results were 36% and 13%, respectively . Similar results have been observed for hypertension, elevated tri-glycerides, and low HDL cholesterol .59
●● According to retrospective data from the United States, among 9949 patients who underwent gastric bypass sur-gery, after a mean of 7 years, long-term mortality was 40% lower among the surgically treated patients than among obese control subjects . Specifically, cancer mortality was reduced by 60%, DM mortality by 92%, and CAD mortal-ity by 56% . Non-disease death rates (eg, accidents, suicide) were 58% higher in the surgery group .60
●● A recent retrospective cohort from the Veterans Affairs medical system showed that in a propensity-matched analy-sis, bariatric surgery was not associated with reduced mor-tality compared with obese control subjects (time-adjusted HR, 0 .94; 95% CI, 0 .64–1 .39) .61
●● Two recent randomized controlled trials were performed that randomized bariatric surgery compared with intensive medical treatment among patients with type 2 DM . The first study randomized 150 patients and conducted 12-month fol-low-up; this study showed that glycemic control improved (6 .4%) and weight loss was greater (29 .4 versus 5 .4 kg) in the surgical arm .62 The second trial randomized 60 patients to bariatric surgery versus medical therapy and conducted follow-up for 24 months . The results showed that DM remis-sion occurred in 75% of the group that underwent gastric bypass surgery compared with 0% of those in the medical treatment arm, with HbA
1c values of 6 .35% in the surgical
arm compared with 7 .69% in the medical treatment arm .63
●● A recent cost-effectiveness study of laparoscopic adjustable gastric banding showed that after 5 years, $4970 was saved in medical expenses; if indirect costs were included (absen-teeism and presenteeism), savings increased to $6180 and $10 960, respectively .64
References 1 . Deleted in proof 2 . Ogden CL, Carroll MD, Kit BK, Flegal KM . Prevalence of obesity and
trends in body mass index among US children and adolescents, 1999-2010 . JAMA . 2012;307:483–490 .
3 . Anderson SE, Whitaker RC . Prevalence of obesity among US preschool children in different racial and ethnic groups . Arch Pediatr Adolesc Med . 2009;163:344–348 .
4 . Robinson WR, Gordon-Larsen P, Kaufman JS, Suchindran CM, Stevens J . The female-male disparity in obesity prevalence among black American young adults: contributions of sociodemographic characteristics of the childhood family . Am J Clin Nutr . 2009;89:1204–1212 .
5 . Singh GK, Siahpush M, Kogan MD . Rising social inequalities in US child-hood obesity, 2003-2007 [published correction appears in Ann Epidemiol . 2010;20:250] . Ann Epidemiol . 2010;20:40–52 .
6 . Centers for Disease Control and Prevention . Pediatric and Pregnancy Surveillance System . 2011 Pediatric Data Tables, Table 16 . http://www .cdc .gov/pednss/pednss_tables/tables_analysis .htm . Accessed November 30, 2012 .
7 . Ali MK, Bullard KM, Beckles GL, Stevens MR, Barker L, Narayan KM, Imperatore G . Household income and cardiovascular disease risks in U .S . children and young adults: analyses from NHANES 1999-2008 . Diabetes Care . 2011;34:1998–2004 .
8 . The NS, Suchindran C, North KE, Popkin BM, Gordon-Larsen P . Association of adolescent obesity with risk of severe obesity in adulthood . JAMA . 2010;304:2042–2047 .
9 . Davis AM, Bennett KJ, Befort C, Nollen N . Obesity and related health behaviors among urban and rural children in the United States: data from the National Health And Nutrition Examination Survey 2003-2004 and 2005-2006 . J Pediatr Psychol . 2011;36:669–676 .
10 . Centers for Disease Control and Prevention . Behavioral Risk Factor Surveillance System: 2011 prevalence and trends data . Centers for Disease Control and Prevention Web site . http://apps .nccd .cdc .gov/brfss/index .asp . Accessed November 30, 2012 .
11 . Centers for Disease Control and Prevention (CDC) . State-specific choles-terol screening trends: United States, 1991–1999 . MMWR Morb Mortal Wkly Rep . 2000;49:750–755 .
12 . Schiller J, Lucas J, Peregoy J . Summary health statistics for U .S . adults: National Health Interview Survey, 2011 . Vital Health Stat 10. In press .
13 . Barnes PM, Adams PF, Powell-Griner E . Health Characteristics of the Asian Adult Population: United States, 2004–2006. Advance Data From Vital and Health Statistics; No . 394 . Hyattsville, MD: National Center for Health Statistics; 2008 .
14 . Agency for Healthcare Research and Quality . 2008 National Healthcare Disparities Report. Rockville, MD: US Department of Health and Human Services, Agency for Healthcare Research and Quality; 2009 . AHRQ pub-lication No . 09-0002 .
14 . Burke GL, Bertoni AG, Shea S, Tracy R, Watson KE, Blumenthal RS, Chung H, Carnethon MR . The impact of obesity on cardiovascular disease risk factors and subclinical vascular disease: the Multi-Ethnic Study of Atherosclerosis . Arch Intern Med . 2008;168:928–935 .
16 . Bulló M, Garcia-Aloy M, Martínez-González MA, Corella D, Fernández-Ballart JD, Fiol M, Gómez-Gracia E, Estruch R, Ortega-Calvo M, Francisco S, Flores-Mateo G, Serra-Majem L, Pintó X, Covas MI, Ros E, Lamuela-Raventós R, Salas-Salvadó J . Association between a healthy lifestyle and general obesity and abdominal obesity in an elderly popula-tion at high cardiovascular risk . Prev Med . 2011;53:155–161 .
17 . Goodpaster BH, Delany JP, Otto AD, Kuller L, Vockley J, South-Paul JE, Thomas SB, Brown J, McTigue K, Hames KC, Lang W, Jakicic JM . Effects of diet and physical activity interventions on weight loss and car-diometabolic risk factors in severely obese adults: a randomized trial . JAMA . 2010;304:1795–1802 .
18 . NCHS Health E-Stat . Prevalence of overweight, infants and children less than 2 years of age: United States, 2003–2004 . Centers for Disease Control and Prevention Web site . http://www .cdc .gov/nchs/data/hestat/overweight/overweight_child_under02 .htm . Accessed September 28, 2010 .
19 . Broyles S, Katzmarzyk PT, Srinivasan SR, Chen W, Bouchard C, Freedman DS, Berenson GS . The pediatric obesity epidemic continues unabated in Bogalusa, Louisiana . Pediatrics . 2010;125:900–905 .
20 . Centers for Disease Control and Prevention (CDC) . Vital signs: state-spe-cific obesity prevalence among adults: United States, 2009 . MMWR Morb Mortal Wkly Rep . 2010;59:951–955 .
21 . Doshi JA, Polsky D, Chang VW . Prevalence and trends in obesity among aged and disabled U .S . Medicare beneficiaries, 1997-2002 . Health Aff (Millwood) . 2007;26:1111–1117 .
22 . Lee CM, Colagiuri S, Ezzati M, Woodward M . The burden of cardiovas-cular disease associated with high body mass index in the Asia-Pacific region . Obes Rev . 2011;12:e454–e459 .
by guest on December 16, 2013http://circ.ahajournals.org/Downloaded from

e64 Circulation January 1/8, 2013
23 . Finkelstein EA, Khavjou OA, Thompson H, Trogdon JG, Pan L, Sherry B, Dietz W . Obesity and severe obesity forecasts through 2030 . Am J Prev Med . 2012;42:563–570 .
24 . Daniels SR, Jacobson MS, McCrindle BW, Eckel RH, Sanner BM . American Heart Association Childhood Obesity Research Summit: execu-tive summary . Circulation . 2009;119:2114–2123 .
25 . Magnussen CG, Koskinen J, Chen W, Thomson R, Schmidt MD, Srinivasan SR, Kivimäki M, Mattsson N, Kähönen M, Laitinen T, Taittonen L, Rönnemaa T, Viikari JS, Berenson GS, Juonala M, Raitakari OT . Pediatric metabolic syndrome predicts adulthood metabolic syndrome, subclinical atherosclerosis, and type 2 diabetes mellitus but is no better than body mass index alone: the Bogalusa Heart Study and the Cardiovascular Risk in Young Finns Study . Circulation . 2010;122:1604–1611 .
26 . Fox CS, Pencina MJ, Meigs JB, Vasan RS, Levitzky YS, D’Agostino RB Sr . Trends in the incidence of type 2 diabetes mellitus from the 1970s to the 1990s: the Framingham Heart Study . Circulation . 2006;113: 2914–2918 .
27 . Hu FB, Manson JE, Stampfer MJ, Colditz G, Liu S, Solomon CG, Willett WC . Diet, lifestyle, and the risk of type 2 diabetes mellitus in women . N Engl J Med . 2001;345:790–797 .
28 . Brown WV, Fujioka K, Wilson PW, Woodworth KA . Obesity: why be con-cerned? Am J Med . 2009;122(suppl 1):S4–S11 .
29 . Anstey KJ, Cherbuin N, Budge M, Young J . Body mass index in midlife and late-life as a risk factor for dementia: a meta-analysis of prospective studies . Obes Rev . 2011;12:e426–e437 .
30 . Juonala M, Magnussen CG, Berenson GS, Venn A, Burns TL, Sabin MA, Srinivasan SR, Daniels SR, Davis PH, Chen W, Sun C, Cheung M, Viikari JS, Dwyer T, Raitakari OT . Childhood adiposity, adult adiposity, and car-diovascular risk factors . N Engl J Med . 2011;365:1876–1885 .
31 . Wormser D, Kaptoge S, Di Angelantonio E, Wood AM, Pennells L, Thompson A, Sarwar N, Kizer JR, Lawlor DA, Nordestgaard BG, Ridker P, Salomaa V, Stevens J, Woodward M, Sattar N, Collins R, Thompson SG, Whitlock G, Danesh J; Emerging Risk Factors Collaboration . Separate and combined associations of body-mass index and abdominal adiposity with cardiovascular disease: collaborative analysis of 58 prospective stud-ies . Lancet . 2011;377:1085–1095 .
32 . Sjöström CD, Lystig T, Lindroos AK . Impact of weight change, secular trends and ageing on cardiovascular risk factors: 10-year experiences from the SOS study . Int J Obes (Lond) . 2011;35:1413–1420 .
33 . Badheka AO, Rathod A, Kizilbash MA, Garg N, Mohamad T, Afonso L, Jacob S . Influence of obesity on outcomes in atrial fibrillation: yet another obesity paradox . Am J Med . 2010;123:646–651 .
34 . Czernichow S, Ninomiya T, Huxley R, Kengne AP, Batty GD, Grobbee DE, Woodward M, Neal B, Chalmers J . Impact of blood pressure lowering on cardiovascular outcomes in normal weight, overweight, and obese indi-viduals: the Perindopril Protection Against Recurrent Stroke Study trial . Hypertension . 2010;55:1193–1198 .
35 . Franks PW, Hanson RL, Knowler WC, Sievers ML, Bennett PH, Looker HC . Childhood obesity, other cardiovascular risk factors, and premature death . N Engl J Med . 2010;362:485–493 .
36 . McGee DL; Diverse Populations Collaboration . Body mass index and mortality: a meta-analysis based on person-level data from twenty-six observational studies . Ann Epidemiol . 2005;15:87–97 .
37 . Flegal KM, Graubard BI, Williamson DF, Gail MH . Excess deaths associated with underweight, overweight, and obesity . JAMA . 2005;293:1861–1867 .
38 . Flegal KM, Graubard BI, Williamson DF, Gail MH . Cause-specific excess deaths associated with underweight, overweight, and obesity . JAMA . 2007;298:2028–2037 .
39 . Whitlock G, Lewington S, Sherliker P, Clarke R, Emberson J, Halsey J, Qizilbash N, Collins R, Peto R; Prospective Studies Collaboration . Body-mass index and cause-specific mortality in 900 000 adults: collaborative analyses of 57 prospective studies . Lancet . 2009;373:1083–1096 .
40 . Berrington de Gonzalez A, Hartge P, Cerhan JR, Flint AJ, Hannan L, MacInnis RJ, Moore SC, Tobias GS, Anton-Culver H, Freeman LB, Beeson WL, Clipp SL, English DR, Folsom AR, Freedman DM, Giles G, Hakansson N, Henderson KD, Hoffman-Bolton J, Hoppin JA, Koenig KL, Lee IM, Linet MS, Park Y, Pocobelli G, Schatzkin A, Sesso HD, Weiderpass E, Willcox BJ, Wolk A, Zeleniuch-Jacquotte A, Willett WC, Thun MJ . Body-mass index and mortality among 1 .46 million white adults [published correction appears in N Engl J Med . 2011;365:869] . N Engl J Med . 2010;363:2211–2219 .
41 . Stewart ST, Cutler DM, Rosen AB . Forecasting the effects of obesity and smoking on U .S . life expectancy . N Engl J Med . 2009;361:2252–2260 .
42 . Jia H, Lubetkin EI . Trends in quality-adjusted life-years lost contributed by smoking and obesity . Am J Prev Med . 2010;38:138–144 .
43 . Capewell S, Hayes DK, Ford ES, Critchley JA, Croft JB, Greenlund KJ, Labarthe DR . Life-years gained among US adults from modern treatments and changes in the prevalence of 6 coronary heart disease risk factors between 1980 and 2000 . Am J Epidemiol . 2009;170:229–236 .
44 . Ma J, Flanders WD, Ward EM, Jemal A . Body mass index in young adulthood and premature death: analyses of the US National Health Interview Survey linked mortality files . Am J Epidemiol . 2011;174: 934–944 .
45 . Petursson H, Sigurdsson JA, Bengtsson C, Nilsen TI, Getz L . Body con-figuration as a predictor of mortality: comparison of five anthropometric measures in a 12 year follow-up of the Norwegian HUNT 2 study . PLoS ONE . 2011;6:e26621 .
46 . Das SR, Alexander KP, Chen AY, Powell-Wiley TM, Diercks DB, Peterson ED, Roe MT, de Lemos JA . Impact of body weight and extreme obesity on the presentation, treatment, and in-hospital outcomes of 50,149 patients with ST-Segment elevation myocardial infarction results from the NCDR (National Cardiovascular Data Registry) . J Am Coll Cardiol . 2011;58:2642–2650 .
47 . Katzmarzyk PT, Reeder BA, Elliott S, Joffres MR, Pahwa P, Raine KD, Kirkland SA, Paradis G . Body mass index and risk of cardiovascular disease, cancer and all-cause mortality . Can J Public Health . 2012;103:147–151 .
48 . Hamer M, Stamatakis E . Metabolically healthy obesity and risk of all-cause and cardiovascular disease mortality . J Clin Endocrinol Metab . 2012;97:2482–2488 .
49 . Centers for Disease Control and Prevention . Preventing Chronic Diseases: Investing Wisely in Health: Preventing Obesity and Chronic Diseases Through Good Nutrition and Physical Activity. Atlanta, GA: Centers for Disease Control and Prevention; 2008 . http://www .cdc .gov/nccdphp/pub-lications/factsheets/prevention/pdf/obesity .pdf . Accessed July 21, 2011 .
50 . Finkelstein EA, Trogdon JG, Cohen JW, Dietz W . Annual medical spend-ing attributable to obesity: payer- and service-specific estimates . Health Aff (Millwood) . 2009;28:w822–w831 .
51 . Wang Y, Beydoun MA, Liang L, Caballero B, Kumanyika SK . Will all Americans become overweight or obese? Estimating the progres-sion and cost of the US obesity epidemic . Obesity (Silver Spring) . 2008;16:2323–2330 .
52 . Cai L, Lubitz J, Flegal KM, Pamuk ER . The predicted effects of chronic obesity in middle age on Medicare costs and mortality . Med Care . 2010;48:510–517 .
53 . Lightwood J, Bibbins-Domingo K, Coxson P, Wang YC, Williams L, Goldman L . Forecasting the future economic burden of current adolescent overweight: an estimate of the coronary heart disease policy model . Am J Public Health . 2009;99:2230–2237 .
54 . Trogdon JG, Finkelstein EA, Feagan CW, Cohen JW . State- and payer-specific estimates of annual medical expenditures attributable to obesity . Obesity (Silver Spring) . 2012;20:214–220 .
55 . Alley D, Lloyd J, Shaffer T, Stuart B . Changes in the association between body mass index and Medicare costs, 1997-2006 . Arch Intern Med . 2012;172:277–278 .
56 . Livingston EH . The incidence of bariatric surgery has plateaued in the U .S . Am J Surg . 2010;200:378–385 .
57 . Sjöström L, Narbro K, Sjöström CD, Karason K, Larsson B, Wedel H, Lystig T, Sullivan M, Bouchard C, Carlsson B, Bengtsson C, Dahlgren S, Gummesson A, Jacobson P, Karlsson J, Lindroos AK, Lönroth H, Näslund I, Olbers T, Stenlöf K, Torgerson J, Agren G, Carlsson LM; Swedish Obese Subjects Study . Effects of bariatric surgery on mortality in Swedish obese subjects . N Engl J Med . 2007;357:741–752 .
58 . Sjöström L, Peltonen M, Jacobson P, Sjöström CD, Karason K, Wedel H, Ahlin S, Anveden Å, Bengtsson C, Bergmark G, Bouchard C, Carlsson B, Dahlgren S, Karlsson J, Lindroos AK, Lönroth H, Narbro K, Näslund I, Olbers T, Svensson PA, Carlsson LM . Bariatric surgery and long-term cardiovascular events . JAMA . 2012;307:56–65 .
59 . Sjöström L, Lindroos AK, Peltonen M, Torgerson J, Bouchard C, Carlsson B, Dahlgren S, Larsson B, Narbro K, Sjöström CD, Sullivan M, Wedel H; Swedish Obese Subjects Study Scientific Group . Lifestyle, diabetes, and cardiovascular risk factors 10 years after bariatric surgery . N Engl J Med . 2004;351:2683–2693 .
60 . Adams TD, Gress RE, Smith SC, Halverson RC, Simper SC, Rosamond WD, Lamonte MJ, Stroup AM, Hunt SC . Long-term mortality after gastric bypass surgery . N Engl J Med . 2007;357:753–761 .
61 . Maciejewski ML, Livingston EH, Smith VA, Kavee AL, Kahwati LC, Henderson WG, Arterburn DE . Survival among high-risk patients after bariatric surgery . JAMA . 2011;305:2419–2426 .
62 . Schauer PR, Kashyap SR, Wolski K, Brethauer SA, Kirwan JP, Pothier CE, Thomas S, Abood B, Nissen SE, Bhatt DL . Bariatric surgery versus
by guest on December 16, 2013http://circ.ahajournals.org/Downloaded from
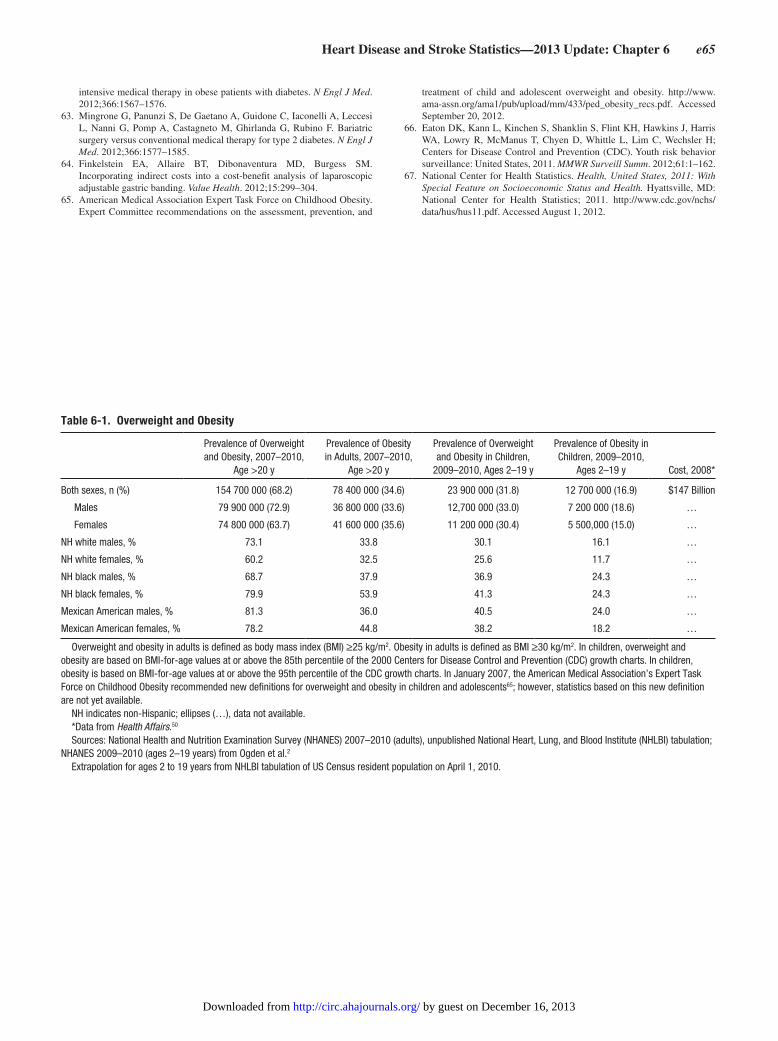
Heart Disease and Stroke Statistics—2013 Update: Chapter 6 e65
intensive medical therapy in obese patients with diabetes . N Engl J Med . 2012;366:1567–1576 .
63 . Mingrone G, Panunzi S, De Gaetano A, Guidone C, Iaconelli A, Leccesi L, Nanni G, Pomp A, Castagneto M, Ghirlanda G, Rubino F . Bariatric surgery versus conventional medical therapy for type 2 diabetes . N Engl J Med . 2012;366:1577–1585 .
64 . Finkelstein EA, Allaire BT, Dibonaventura MD, Burgess SM . Incorporating indirect costs into a cost-benefit analysis of laparoscopic adjustable gastric banding . Value Health . 2012;15:299–304 .
65 . American Medical Association Expert Task Force on Childhood Obesity . Expert Committee recommendations on the assessment, prevention, and
treatment of child and adolescent overweight and obesity . http://www .ama-assn .org/ama1/pub/upload/mm/433/ped_obesity_recs .pdf . Accessed September 20, 2012 .
66 . Eaton DK, Kann L, Kinchen S, Shanklin S, Flint KH, Hawkins J, Harris WA, Lowry R, McManus T, Chyen D, Whittle L, Lim C, Wechsler H; Centers for Disease Control and Prevention (CDC) . Youth risk behavior surveillance: United States, 2011 . MMWR Surveill Summ . 2012;61:1–162 .
67 . National Center for Health Statistics . Health, United States, 2011: With Special Feature on Socioeconomic Status and Health. Hyattsville, MD: National Center for Health Statistics; 2011 . http://www .cdc .gov/nchs/data/hus/hus11 .pdf . Accessed August 1, 2012 .
Table 6-1. Overweight and Obesity
Prevalence of Overweight and Obesity, 2007–2010,
Age >20 y
Prevalence of Obesity in Adults, 2007–2010,
Age >20 y
Prevalence of Overweight and Obesity in Children,
2009–2010, Ages 2–19 y
Prevalence of Obesity in Children, 2009–2010,
Ages 2–19 y Cost, 2008*
Both sexes, n (%) 154 700 000 (68.2) 78 400 000 (34.6) 23 900 000 (31.8) 12 700 000 (16.9) $147 Billion
Males 79 900 000 (72.9) 36 800 000 (33.6) 12,700 000 (33.0) 7 200 000 (18.6) …
Females 74 800 000 (63.7) 41 600 000 (35.6) 11 200 000 (30.4) 5 500,000 (15.0) …
NH white males, % 73.1 33.8 30.1 16.1 …
NH white females, % 60.2 32.5 25.6 11.7 …
NH black males, % 68.7 37.9 36.9 24.3 …
NH black females, % 79.9 53.9 41.3 24.3 …
Mexican American males, % 81.3 36.0 40.5 24.0 …
Mexican American females, % 78.2 44.8 38.2 18.2 …
Overweight and obesity in adults is defined as body mass index (BMI) ≥25 kg/m2. Obesity in adults is defined as BMI ≥30 kg/m2. In children, overweight and obesity are based on BMI-for-age values at or above the 85th percentile of the 2000 Centers for Disease Control and Prevention (CDC) growth charts. In children, obesity is based on BMI-for-age values at or above the 95th percentile of the CDC growth charts. In January 2007, the American Medical Association’s Expert Task Force on Childhood Obesity recommended new definitions for overweight and obesity in children and adolescents65; however, statistics based on this new definition are not yet available.
NH indicates non-Hispanic; ellipses (…), data not available.*Data from Health Affairs.50 Sources: National Health and Nutrition Examination Survey (NHANES) 2007–2010 (adults), unpublished National Heart, Lung, and Blood Institute (NHLBI) tabulation;
NHANES 2009–2010 (ages 2–19 years) from Ogden et al.2
Extrapolation for ages 2 to 19 years from NHLBI tabulation of US Census resident population on April 1, 2010.
by guest on December 16, 2013http://circ.ahajournals.org/Downloaded from

e66 Circulation January 1/8, 2013
10.7
15.7
12.2
16.8
12.8
17.1
20.6
26.0
28.1
34.034.436.1
0
5
10
15
20
25
30
35
40
Men Women
Perc
ent o
f Pop
ulat
ion
1960-62 1971-74 1976-80 1988-94 1999-2002 2007-2010
Chart 6-2. Age-adjusted prevalence of obesity in adults 20 to 74 years of age by sex and survey year (National Health Examination Survey: 1960–1962; National Health and Nutrition Examination Survey: 1971–1974, 1976–1980, 1988–1994, 1999–2002, and 2007–2010). Obesity is defined as body mass index of 30.0 kg/m2. Data derived from Health, United States, 2011 (National Center for Health Statistics).67
14.713.8
12.8
19.6
16.9
18
15.0
7.7
17.718.6
19.2
8.6
0
5
10
15
20
25
NH White Males NH White Females NH Black Males NH Black Females Hispanic Males Hispanic Females
Perc
ent o
f Pop
ulat
ion
Overweight Obese
Chart 6-1. Prevalence of overweight and obesity among students in grades 9 through 12 by sex and race/ethnicity. NH indicates non-Hispanic. Data derived from Youth Risk Behavior Surveillance—United States, 2011, Table 101.66
by guest on December 16, 2013http://circ.ahajournals.org/Downloaded from

Heart Disease and Stroke Statistics—2013 Update: Chapter 6 e67
4.0
6.16.5
5.0
11.310.5
15.9 16.0
1717.6
18.818.2
0
2
4
6
8
10
12
14
16
18
20
6-11 12-19
Perc
ent o
f Pop
ulat
ion
1971-1974 1976-1980 1988-1994 1999-2002 2003-2006 2007-2010
Chart 6–3. Trends in the prevalence of obesity among US children and adolescents by age and survey year (National Health and Nutri-tion Examination Survey: 1971–1974, 1976–1980, 1988–1994, 1999–2002 , 2003–2006 and 2007–2010). Data derived from Health, United States, 2011 (National Center for Health Statistics).67
by guest on December 16, 2013http://circ.ahajournals.org/Downloaded from

e68 Circulation January 1/8, 2013
7. Family History and Genetics
See Tables 7-1 through 7-3.Biologically related first-degree relatives (siblings, offspring and parents) share roughly 50% of their genetic variation with one another . This constitutes much greater sharing of genetic variation than with a randomly selected person from the population, and thus, when a trait aggregates within a family, this lends evidence for a genetic risk factor for the trait . Similarly, racial/ethnic minorities are more likely to share their genetic variation within their demographic than with other demographics . Familial aggregation of CVD may be related to aggregation of specific behaviors (eg, smoking, alcohol use) or risk factors (eg, hypertension, DM, obesity) that may themselves have environmental and genetic contrib-utors . Unlike classic mendelian genetic risk factors, whereby usually 1 mutation directly causes 1 disease, a complex trait’s genetic contributors may increase risk without necessarily always causing the condition . The effect size of any specific contributor to risk may be small but widespread throughout a population, or may be large but affect only a small popula-tion, or may have an enhanced risk when an environmental contributor is present . Although the breadth of all genetic research into CVD is beyond the scope of this chapter, we present a summary of evidence that a genetic risk for CVD is likely, as well as a summary of evidence on the most consistently replicated genetic markers for HD and stroke identified to date .
Family History
Prevalence
●● Among adults ≥20 years of age, 12 .6% reported having a parent or sibling with a heart attack or angina before the age of 50 years . The racial/ethnic breakdown is as follows (NHANES 2007–2010, unpublished NHLBI tabulation):
— For non-Hispanic whites, 12 .4% for men, 14 .9% for women
— For non-Hispanic blacks, 8 .1% for men, 13 .0% for women
— For Mexican Americans, 8 .1% for men, 10 .0% for women— For other Hispanics, 8 .8% for men, 12 .0% for women— For other races, 8 .7% for men, 10 .7% for women
●● HD occurs as people age, and those without a family history of HD may survive longer, so the prevalence of family his-tory will vary depending on the age at which it is assessed . The breakdown of reported family history of heart attack by age in the US population as measured by NHANES is as follows (NHANES 2007–2010, unpublished NHLBI tabulation):
— Age 20 to 39 years, 8 .4% for men, 10 .3% for women— Age 40 to 59 years, 12 .8% for men, 15 .3% for women— Age 60 to 79 years, 13 .7% for men, 17 .5% for women— Age ≥80 years, 9 .8% for men, 13 .7% for women
●● In the multigenerational FHS, only 75% of participants with a documented parental history of a heart attack before age 55 years reported that history when asked .1
Impact of Family History
●● Premature paternal history of a heart attack has been shown to approximately double the risk of a heart attack in men and increase the risk in women by ≈70% .2,3
●● History of a heart attack in both parents increases the risk of heart attack, especially when 1 parent had a premature heart attack4 (Table 7-1) .
●● Sibling history of HD has been shown to increase the odds of HD in men and women by ≈50% .5
●● Premature family history of angina, MI, angioplasty, or bypass surgery increased the lifetime risk by ≈50% for both HD (from 8 .9% to 13 .7%) and CVD mortality (from 14 .1% to 21%) .6
●● Similarly, parental history of AF is associated with ≈80% increased odds of AF in men and women,7 and a history of stroke in a first-degree relative increased the odds of stroke in men and women by ≈50% .8
Genetics
Heart Disease
●● Genome-wide association is a robust technique to identify associations between genotypes and phenotypes . Table 7-2 presents results from the CARDIoGRAM (Coronary ARteryDIsease Genome-wide Replication And Meta- analysis) consortium, which represents the largest genetic study of MI to date, with 22 233 MI case subjects and 64 762 control subjects and with independent validation in an additional 56 682 individuals .9 Altogether, there are 23
Abbreviations Used in Chapter 7
AAA abdominal aortic aneurysmABI ankle-brachial index
AF atrial fibrillation
BMI body mass index
CAC coronary artery calcification
CARDIoGRAM Coronary Artery Disease Genome-wide Replication and Meta-Analysis Consortium
CI confidence interval
CVD cardiovascular disease
DBP diastolic blood pressure
DM diabetes mellitus
FHS Framingham Heart Study
GFR glomerular filtration rate
HbA1c glycosylated hemoglobin
HD heart disease
HDL high-density lipoprotein
HF heart failure
LDL low-density lipoprotein
MI myocardial infarction
NHANES National Health and Nutrition Examination Survey
OR odds ratio
SBP systolic blood pressure
SNP single-nucleotide polymorphism
by guest on December 16, 2013http://circ.ahajournals.org/Downloaded from

Heart Disease and Stroke Statistics—2013 Update: Chapter 7 e69
well-replicated loci for MI . The ORs are modest, ranging from 1 .06 to 1 .51 per copy of the risk allele (individuals may harbor up to 2 copies of a risk allele) . However, these are common alleles, which suggests that the attributable risk may be substantial .
●● Genetic markers discovered thus far have not been shown to add to cardiovascular risk prediction tools beyond current models that incorporate family history .10 Genetic markers have also not been shown to improve prediction of subclini-cal atherosclerosis beyond traditional risk factors .11
●● The most consistently replicated genetic marker for HD in European-derived populations is located at 9p21 .3 . At this single-nucleotide polymorphism, ≈27% of the white popu-lation is estimated to have 0 risk alleles, 50% is estimated to have 1 risk allele, and the remaining 23% is estimated to have 2 risk alleles .12
●● The 10-year HD risk for a 65-year-old man with 2 risk alleles at 9p21 .3 and no other traditional risk factors is ≈13 .2%, whereas a similar man with 0 alleles would have a 10-year risk of ≈9 .2% . The 10-year HD risk for a 40-year-old woman with 2 alleles and no other traditional risk factors is ≈2 .4%, whereas a similar woman with 0 alleles would have a 10-year risk of ≈1 .7% .12
●● Variation at the 9p21 .3 region also increases the risk of HF13 and sudden death .14 Associations have also been observed between the 9p21 .3 region and coronary artery calcification (CAC) .15,16 Additionally, stronger associations have been found between variation at 9p21 .3 and earlier17,18 and more severe19 heart attacks . The biological mechanism underpin-ning the association of genetic variation in the 9p21 region with disease outcomes is still under investigation .
Stroke
●● The same 9p21 .3 region has also been associated with intra-cranial aneurysm, abdominal aortic aneurysm (AAA),20 and ischemic stroke .21
●● For large-vessel ischemic stroke, a new association for large-vessel stroke with histone deacetylase 9 on chromo-some 7p21 .1 has been identified (>9000 subjects) and rep-licated (>12 000 subjects) .21
CVD Risk Factors
●● Heritability is the ratio of genetically caused variation to the total variation of a trait or measure . Table 7-3 presents heritability estimates for standard CVD risk factors using data generated from the FHS . These data suggest that most CVD risk factors have at least moderate heritability .
References 1 . Murabito JM, Nam BH, D’Agostino RB Sr, Lloyd-Jones DM, O’Donnell
CJ, Wilson PW . Accuracy of offspring reports of parental cardiovascu-lar disease history: the Framingham Offspring Study . Ann Intern Med . 2004;140:434–440 .
2 . Lloyd-Jones DM, Nam BH, D’Agostino RB Sr, Levy D, Murabito JM, Wang TJ, Wilson PW, O’Donnell CJ . Parental cardiovascular disease as a risk factor for cardiovascular disease in middle-aged adults: a prospective study of parents and offspring . JAMA . 2004;291:2204–2211 .
3 . Sesso HD, Lee IM, Gaziano JM, Rexrode KM, Glynn RJ, Buring JE . Maternal and paternal history of myocardial infarction and risk of cardio-vascular disease in men and women . Circulation . 2001;104:393–398 .
4 . Chow CK, Islam S, Bautista L, Rumboldt Z, Yusufali A, Xie C, Anand SS, Engert JC, Rangarajan S, Yusuf S . Parental history and myocardial infarc-tion risk across the world: the INTERHEART Study . J Am Coll Cardiol . 2011;57:619–627 .
5 . Murabito JM, Pencina MJ, Nam BH, D’Agostino RB Sr, Wang TJ, Lloyd-Jones D, Wilson PW, O’Donnell CJ . Sibling cardiovascular disease as a risk factor for cardiovascular disease in middle-aged adults . JAMA . 2005;294:3117–3123 .
6 . Bachmann JM, Willis BL, Ayers CR, Khera A, Berry JD . Association between family history and coronary heart disease death across long-term follow-up in men: the Cooper Center Longitudinal Study . Circulation . 2012;125:3092–3098 .
7 . Fox CS, Parise H, D’Agostino RB Sr, Lloyd-Jones DM, Vasan RS, Wang TJ, Levy D, Wolf PA, Benjamin EJ . Parental atrial fibrillation as a risk factor for atrial fibrillation in offspring . JAMA . 2004;291:2851–2855 .
8 . Liao D, Myers R, Hunt S, Shahar E, Paton C, Burke G, Province M, Heiss G . Familial history of stroke and stroke risk: the Family Heart Study . Stroke . 1997;28:1908–1912 .
9 . Schunkert H, König IR, Kathiresan S, Reilly MP, Assimes TL, Holm H, Preuss M, Stewart AF, Barbalic M, Gieger C, Absher D, Aherrahrou Z, Allayee H, Altshuler D, Anand SS, Andersen K, Anderson JL, Ardissino D, Ball SG, Balmforth AJ, Barnes TA, Becker DM, Becker LC, Berger K, Bis JC, Boekholdt SM, Boerwinkle E, Braund PS, Brown MJ, Burnett MS, Buysschaert I, Carlquist JF, Chen L, Cichon S, Codd V, Davies RW, Dedoussis G, Dehghan A, Demissie S, Devaney JM, Diemert P, Do R, Doering A, Eifert S, Mokhtari NE, Ellis SG, Elosua R, Engert JC, Epstein SE, de Faire U, Fischer M, Folsom AR, Freyer J, Gigante B, Girelli D, Gretarsdottir S, Gudnason V, Gulcher JR, Halperin E, Hammond N, Hazen SL, Hofman A, Horne BD, Illig T, Iribarren C, Jones GT, Jukema JW, Kaiser MA, Kaplan LM, Kastelein JJ, Khaw KT, Knowles JW, Kolovou G, Kong A, Laaksonen R, Lambrechts D, Leander K, Lettre G, Li M, Lieb W, Loley C, Lotery AJ, Mannucci PM, Maouche S, Martinelli N, McKeown PP, Meisinger C, Meitinger T, Melander O, Merlini PA, Mooser V, Morgan T, Mühleisen TW, Muhlestein JB, Münzel T, Musunuru K, Nahrstaedt J, Nelson CP, Nöthen MM, Olivieri O, Patel RS, Patterson CC, Peters A, Peyvandi F, Qu L, Quyyumi AA, Rader DJ, Rallidis LS, Rice C, Rosendaal FR, Rubin D, Salomaa V, Sampietro ML, Sandhu MS, Schadt E, Schäfer A, Schillert A, Schreiber S, Schrezenmeir J, Schwartz SM, Siscovick DS, Sivananthan M, Sivapalaratnam S, Smith A, Smith TB, Snoep JD, Soranzo N, Spertus JA, Stark K, Stirrups K, Stoll M, Tang WH, Tennstedt S, Thorgeirsson G, Thorleifsson G, Tomaszewski M, Uitterlinden AG, van Rij AM, Voight BF, Wareham NJ, Wells GA, Wichmann HE, Wild PS, Willenborg C, Witteman JC, Wright BJ, Ye S, Zeller T, Ziegler A, Cambien F, Goodall AH, Cupples LA, Quertermous T, März W, Hengstenberg C, Blankenberg S, Ouwehand WH, Hall AS, Deloukas P, Thompson JR, Stefansson K, Roberts R, Thorsteinsdottir U, O’Donnell CJ, McPherson R, Erdmann J, Samani NJ; Cardiogenics; CARDIoGRAM Consortium . Large-scale association analysis identifies 13 new susceptibility loci for coronary artery disease . Nat Genet . 2011;43:333–338 .
10 . Holmes MV, Harrison S, Talmud PJ, Hingorani AD, Humphries SE . Util-ity of genetic determinants of lipids and cardiovascular events in assessing risk . Nat Rev Cardiol . 2011;8:207–221 .
11 . Hernesniemi JA, Seppälä I, Lyytikäinen LP, Mononen N, Oksala N, Hutri-Kähönen N, Juonala M, Taittonen L, Smith EN, Schork NJ, Chen W, Srinivasan SR, Berenson GS, Murray SS, Laitinen T, Jula A, Kettunen J, Ripatti S, Laaksonen R, Viikari J, Kähönen M, Raitakari OT, Lehtimäki T . Genetic profiling using genome-wide significant coronary artery disease risk variants does not improve the prediction of subclinical atheroscle-rosis: the Cardiovascular Risk in Young Finns Study, the Bogalusa Heart Study and the Health 2000 Survey: a meta-analysis of three independent studies . PLoS ONE . 2012;7:e28931 .
12 . Palomaki GE, Melillo S, Bradley LA . Association between 9p21 genomic markers and heart disease: a meta-analysis . JAMA . 2010;303:648–656 .
13 . Yamagishi K, Folsom AR, Rosamond WD, Boerwinkle E; ARIC Investi-gators . A genetic variant on chromosome 9p21 and incident heart failure in the ARIC study . Eur Heart J . 2009;30:1222–1228 .
14 . Newton-Cheh C, Cook NR, VanDenburgh M, Rimm EB, Ridker PM, Albert CM . A common variant at 9p21 is associated with sudden and arrhythmic cardiac death . Circulation . 2009;120:2062–2068 .
15 . Assimes TL, Knowles JW, Basu A, Iribarren C, Southwick A, Tang H, Absher D, Li J, Fair JM, Rubin GD, Sidney S, Fortmann SP, Go AS, Hlatky MA, Myers RM, Risch N, Quertermous T . Susceptibility locus for clinical and subclinical coronary artery disease at chromosome 9p21 in the multi-ethnic ADVANCE study . Hum Mol Genet . 2008;17:2320–2328 .
by guest on December 16, 2013http://circ.ahajournals.org/Downloaded from

e70 Circulation January 1/8, 2013
16 . O’Donnell CJ, Cupples LA, D’Agostino RB, Fox CS, Hoffmann U, Hwang SJ, Ingellson E, Liu C, Murabito JM, Polak JF, Wolf PA, Demissie S . Genome-wide association study for subclinical atherosclerosis in major arterial territories in the NHLBI’s Framingham Heart Study . BMC Med Genet . 2007;8(suppl 1):S4 .
17 . Abdullah KG, Li L, Shen GQ, Hu Y, Yang Y, MacKinlay KG, Topol EJ, Wang QK . Four SNPS on chromosome 9p21 confer risk to premature, familial CAD and MI in an American Caucasian population (GeneQuest) . Ann Hum Genet . 2008;72(pt 5):654–657 .
18 . Ellis KL, Pilbrow AP, Frampton CM, Doughty RN, Whalley GA, Ellis CJ, Palmer BR, Skelton L, Yandle TG, Palmer SC, Troughton RW, Richards AM, Cameron VA . A common variant at chromosome 9P21 .3 is associ-ated with age of onset of coronary disease but not subsequent mortality . Circ Cardiovasc Genet . 2010;3:286–293 .
19 . Dandona S, Stewart AF, Chen L, Williams K, So D, O’Brien E, Glover C, Lemay M, Assogba O, Vo L, Wang YQ, Labinaz M, Wells GA, McPherson R, Roberts R . Gene dosage of the common variant 9p21 predicts severity of coronary artery disease . J Am Coll Cardiol . 2010;56:479–486 .
20 . Helgadottir A, Thorleifsson G, Magnusson KP, Grétarsdottir S, Steinthorsdottir V, Manolescu A, Jones GT, Rinkel GJ, Blankensteijn JD, Ronkainen A, Jääskeläinen JE, Kyo Y, Lenk GM, Sakalihasan N, Kostulas K, Gottsäter A, Flex A, Stefansson H, Hansen T, Andersen G, Weinsheimer S, Borch-Johnsen K, Jorgensen T, Shah SH, Quyyumi AA, Granger CB, Reilly MP, Austin H, Levey AI, Vaccarino V, Palsdottir E, Walters GB, Jonsdottir T, Snorradottir S, Magnusdottir D, Gudmundsson G, Ferrell RE, Sveinbjornsdottir S, Hernesniemi J, Niemelä M, Limet R, Andersen K, Sigurdsson G, Benediktsson R, Verhoeven EL, Teijink JA, Grobbee DE, Rader DJ, Collier DA, Pedersen O, Pola R, Hillert J, Lindblad B, Valdimarsson EM, Magnadottir HB, Wijmenga C, Tromp G, Baas AF, Ruigrok YM, van Rij AM, Kuivaniemi H, Powell JT, Matthiasson SE, Gulcher JR, Thorgeirsson G, Kong A, Thorsteinsdottir U, Stefansson K . The same sequence variant on 9p21 associates with myocardial infarction, abdominal aortic aneurysm and intracranial aneurysm . Nat Genet . 2008;40:217–224 .
21 . Bellenguez C, Bevan S, Gschwendtner A, Spencer CC, Burgess AI, Pirinen M, Jackson CA, Traylor M, Strange A, Su Z, Band G, Syme PD, Malik R, Pera J, Norrving B, Lemmens R, Freeman C, Schanz R, James T, Poole D, Murphy L, Segal H, Cortellini L, Cheng YC, Woo D, Nalls MA, Muller-Myhsok B, Meisinger C, Seedorf U, Ross-Adams H, Boonen S, Wloch-Kopec D, Valant V, Slark J, Furie K, Delavaran H, Langford C, Deloukas P, Edkins S, Hunt S, Gray E, Dronov S, Peltonen L, Gretarsdot-tir S, Thorleifsson G, Thorsteinsdottir U, Stefansson K, Boncoraglio GB, Parati EA, Attia J, Holliday E, Levi C, Franzosi MG, Goel A, Helgadottir A, Blackwell JM, Bramon E, Brown MA, Casas JP, Corvin A, Duncanson A, Jankowski J, Mathew CG, Palmer CN, Plomin R, Rautanen A, Sawcer
SJ, Trembath RC, Viswanathan AC, Wood NW, Worrall BB, Kittner SJ, Mitchell BD, Kissela B, Meschia JF, Thijs V, Lindgren A, Macleod MJ, Slowik A, Walters M, Rosand J, Sharma P, Farrall M, Sudlow CL, Rothwell PM, Dichgans M, Donnelly P, Markus HS; llab International Stroke Genetics Consortium, Wellcome Trust Case Control Consor-tium 2 (WTCCC2) . Genome-wide association study identifies a vari-ant in HDAC9 associated with large vessel ischemic stroke . Nat Genet . 2012;44:328–333 .
22 . Murabito JM, Guo CY, Fox CS, D’Agostino RB . Heritability of the ankle-brachial index: the Framingham Offspring study . Am J Epidemiol . 2006;164:963–968 .
23 . Levy D, DeStefano AL, Larson MG, O’Donnell CJ, Lifton RP, Gavras H, Cupples LA, Myers RH . Evidence for a gene influencing blood pres-sure on chromosome 17: genome scan linkage results for longitudinal blood pressure phenotypes in subjects from the Framingham Heart Study . Hypertension . 2000;36:477–483 .
24 . Post WS, Larson MG, Myers RH, Galderisi M, Levy D . Heritability of left ventricular mass: the Framingham Heart Study . Hypertension . 1997;30:1025–1028 .
25 . Atwood LD, Heard-Costa NL, Cupples LA, Jaquish CE, Wilson PW, D’Agostino RB . Genomewide linkage analysis of body mass index across 28 years of the Framingham Heart Study . Am J Hum Genet . 2002;71:1044–1050 .
26 . Fox CS, Heard-Costa NL, Wilson PW, Levy D, D’Agostino RB Sr, Atwood LD . Genome-wide linkage to chromosome 6 for waist circum-ference in the Framingham Heart Study . Diabetes . 2004;53:1399–1402 .
27 . Fox CS, Massaro JM, Hoffmann U, Pou KM, Maurovich-Horvat P, Liu CY, Vasan RS, Murabito JM, Meigs JB, Cupples LA, D’Agostino RB Sr, O’Donnell CJ . Abdominal visceral and subcutaneous adipose tissue compartments: association with metabolic risk factors in the Framingham Heart Study . Circulation . 2007;116:39–48 .
28 . Meigs JB, Panhuysen CI, Myers RH, Wilson PW, Cupples LA . A genome-wide scan for loci linked to plasma levels of glucose and HbA(1c) in a community-based sample of Caucasian pedigrees: the Framingham Off-spring Study . Diabetes . 2002;51:833–840 .
29 . Kathiresan S, Manning AK, Demissie S, D’Agostino RB, Surti A, Gui-ducci C, Gianniny L, Burtt NP, Melander O, Orho-Melander M, Arnett DK, Peloso GM, Ordovas JM, Cupples LA . A genome-wide association study for blood lipid phenotypes in the Framingham Heart Study . BMC Med Genet . 2007;8(suppl 1):S17 .
30 . Fox CS, Yang Q, Cupples LA, Guo CY, Larson MG, Leip EP, Wilson PW, Levy D . Genomewide linkage analysis to serum creatinine, GFR, and creatinine clearance in a community-based population: the Framingham Heart Study . J Am Soc Nephrol . 2004;15:2457–2461 .
Table 7-1. Odds Ratio for Combinations of Parental Heart Attack History
OR (95% CI)
No family history 1.00
One parent with heart attack ≥50 y of age 1.67 (1.55–1.81)
One parent with heart attack <50 y of age 2.36 (1.89–2.95)
Both parents with heart attack ≥50 y of age 2.90 (2.30–3.66)
Both parents with heart attack, one <50 y of age 3.26 (1.72–6.18)
Both parents with heart attack, both <50 y of age 6.56 (1.39–30.95)
OR indicates odds ratio; CI, confidence interval.Data derived from Chow et al.4
by guest on December 16, 2013http://circ.ahajournals.org/Downloaded from

Heart Disease and Stroke Statistics—2013 Update: Chapter 7 e71
Table 7-2. Validated SNPs for MI, the Nearest Gene, and the OR From the CARDIoGRAM Consortium
SNP Chromosomal Region Gene Effect Size (OR) Minor Allele Frequency
rs599839 1p13.3 SORT1 1.11 0.22
rs17465637 1q41 MIA3 1.14 0.26
rs17114036 1p32.2 PPAP2B 1.17 0.09
rs11206510 1p32.3 PCSK9 1.08 0.18
rs6725887 2q33 WDR12 1.14 0.15
rs2306374 3q22.3 MRAS 1.12 0.18
rs17609940 6p21.31 ANKS1A 1.07 0.25
rs12526453 6p24.1 PHACTR1 1.10 0.33
rs12190287 6q23.2 TCF21 1.08 0.38
rs798220 6q25 LPA 1.51 0.02
rs11556924 7q32.2 ZC3HC1 1.09 0.38
rs4977574 9p21.3 CDKN2A, CDKN2B 1.29 0.46
rs579459 9q34.2 ABO 1.10 0.21
rs1746048 10q11 CXCL12 1.09 0.13
rs12413409 10q24.32 CYP17A1-CNNM2-NT5C2 1.12 0.11
rs964184 11q23.3 ZNF259-APOA5-A4-C3-A1 1.13 0.13
rs3184504 12q24 Sh2b3 1.07 0.44
rs4773144 13q34 COL4A1-COL4A2 1.07 0.44
rs2895811 14q32.2 HHIPL1 1.08 0.43
rs3825807 15q25.1 ADAMTS7 1.07 0.43
rs216172 17p13.3 SMG6-SRR 1.07 0.37
rs12936587 17p11.2 RASD1-SMCR3-PEMT 1.07 0.44
rs46522 17q21.32 UBE2Z-GIP-ATP5G1-SNF8 1.06 0.47
rs1122608 19q13.2 LDLR 1.14 0.23
rs9982601 21q22.11 MRPS6 1.18 0.15
SNPs indicates single-nucleotide polymorphisms; MI, myocardial infarction; OR, odds ratio; and CARDIoGRAM, Coronary Artery DIsease Genome-wide Replication And Meta-analysis Consortium.
Data derived from Schunkert et al.9
Table 7-3. Heritability of CVD Risk Factors From the FHS
Trait Heritability
ABI 0.2122
SBP 0.4223
DBP 0.3923
Left ventricular mass 0.24 to 0.3224
BMI 0.37 (mean age 40 y) to 0.52 (mean age 60 y)25
Waist circumference 0.4126
Visceral abdominal fat 0.3627
Subcutaneous abdominal fat 0.5727
Fasting glucose 0.3428
HbA1c 0.2728
Triglycerides 0.4829
HDL cholesterol 0.5229
Total cholesterol 0.5729
LDL cholesterol 0.5929
Estimated GFR 0.3330
CVD indicates cardiovascular disease; FHS, Framingham Heart Study; ABI, ankle-brachial index; SBP, systolic blood pressure; DBP, diastolic blood pres-sure; BMI, body mass index; HbA1c, glycosylated hemoglobin; HDL, high-densi-ty lipoprotein; LDL, low-density lipoprotein; and GFR, glomerular filtration rate.
by guest on December 16, 2013http://circ.ahajournals.org/Downloaded from
e72 Circulation January 1/8, 2013
8. High Blood Cholesterol and Other Lipids
See Table 8-1 and Charts 8-1 through 8-3 .
PrevalenceFor information on dietary cholesterol, total fat, saturated fat, and other factors that affect blood cholesterol levels, see Chapter 5 (Nutrition) .
Youth(See Chart 8-1 .)
●● Among children 4 to 11 years of age, the mean total blood cholesterol level is 161 .9 mg/dL . For boys, it is 162 .3 mg/dL; for girls, it is 161 .5 mg/dL . The racial/ethnic break-down is as follows (NHANES 2007–2010, unpublished NHLBI tabulation):
— For non-Hispanic whites, 160 .9 mg/dL for boys and 161 .6 mg/dL for girls
— For non-Hispanic blacks, 165 .2 mg/dL for boys and 157 .9 mg/dL for girls
— For Mexican Americans, 159 .6 mg/dL for boys and 160 .7 mg/dL for girls
●● Among adolescents 12 to 19 years of age, the mean total blood cholesterol level is 158 .2 mg/dL . For boys, it is 156 .1 mg/dL; for girls, it is 160 .3 mg/dL . The racial/ethnic break-down is as follows (NHANES 2007–2010, unpublished NHLBI tabulation):
— For non-Hispanic whites, 156 .8 mg/dL for boys and 161 .1 mg/dL for girls
— For non-Hispanic blacks, 154 .1 mg/dL for boys and 160 .6 mg/dL for girls
— For Mexican Americans, 157 .8 mg/dL for boys and 158 .0 mg/dL for girls
●● The prevalence of abnormal lipid levels among youths 12 to 19 years of age is 20 .3%; 14 .2% of normal-weight youths, 22 .3% of overweight youths, and 42 .9% of obese youths have at least 1 abnormal lipid level (NHANES 1999–2006, NCHS) .1
●● Approximately 7 .8% of adolescents 12 to 19 years of age have total cholesterol levels ≥200 mg/dL (NHANES 2007–2010, unpublished NHLBI tabulation) .
●● Fewer than 1% of adolescents are potentially eligible for pharmacological treatment on the basis of guidelines from the American Academy of Pediatrics .1,2
Adults(See Table 8-1 and Charts 8-2 and 8-3 .)
●● An estimated 31 .9 million adults ≥20 years of age have total serum cholesterol levels ≥240 mg/dL (extrapolated to 2010 by use of NCHS/NHANES 2007–2010 data), with a prevalence of 13 .8% (Table 8-1; unpublished NHLBI tabulation) .
●● Approximately 5 .6% of adults ≥20 years of age have undi-agnosed hypercholesterolemia3 (NHANES 2007–2010, unpublished NHLBI tabulation) .
●● Between the periods 1988–1994 and 1999–2002 (NHANES/NCHS), the age-adjusted mean total serum cholesterol level of adults ≥20 years of age decreased from 206 to 203 mg/dL, and LDL cholesterol levels decreased from 129 to 123 mg/dL .4
●● Data from NHANES 2003–2008 (NCHS) showed the serum total crude mean cholesterol level in adults ≥20 years of age was 195 mg/dL for men and 201 mg/dL for women .5
●● Data from the Minnesota Heart Survey (1980–1982 to 2000–2002) showed a decline in age-adjusted mean total cholesterol concentrations from 5 .49 and 5 .38 mmol/L for men and women, respectively, in 1980–1982 to 5 .16 and 5 .09 mmol/L, respectively, in 2000–2002; however, the decline was not uniform across all age groups . Middle-aged to older people have shown substantial decreases, but younger people have shown little overall change and recently had increased total cholesterol values . Lipid-lowering drug use rose significantly for both sexes among those 35 to 74 years of age . Awareness, treatment, and control of hypercholesterolemia have increased; however, more than half of those at borderline-high risk remain unaware of their condition .6
●● According to data from NHANES 2005–2006, between the periods 1999 to 2000 and 2005 to 2006, mean serum total cholesterol levels in adults ≥20 years of age declined from 204 to 199 mg/dL . This decline was observed for men ≥40 years of age and for women ≥60 years of age . There was little change over this time period for other sex/age groups . In 2005 to 2006, ≈65% of men and 70% of women had been screened for high cholesterol in the past 5 years, and 16% of adults had serum total cholesterol levels ≥240 mg/dL .7
●● According to data from NHANES, from 1999 to 2006, the prevalence of elevated LDL cholesterol levels (as defined by levels higher than the specified Adult Treatment Panel III risk category) in adults ≥20 years of age has decreased by ≈33% .8
●● During the period from 1999 to 2006, 26 .0% of adults had hypercholesterolemia, 9% of adults had both hypercholes-terolemia and hypertension, 1 .5% of adults had DM and hypercholesterolemia, and 3% of adults had all 3 conditions .3
Screening
●● Data from the BRFSS study of the CDC in 2011 showed that the percentage of adults who had been screened for high blood cholesterol in the preceding 5 years ranged from 66 .3% in Utah to 83 .7% in Massachusetts . The median per-centage among all 50 states was 75 .5% .9
Abbreviations Used in Chapter 8
BRFSS Behavioral Risk Factor Surveillance System
CDC Centers for Disease Control and Prevention
CHD coronary heart disease
CVD cardiovascular diseases
DM diabetes mellitus
HD heart disease
HDL high-density lipoprotein
LDL low-density lipoprotein
Mex. Am. Mexican American
NCHS National Center for Health Statistics
NH non-Hispanic
NHANES National Health and Nutrition Examination Survey
NHLBI National Heart, Lung, and Blood Institute
by guest on December 16, 2013http://circ.ahajournals.org/Downloaded from

Heart Disease and Stroke Statistics—2013 Update: Chapter 8 e73
●● The percentage of adults who reported having had a choles-terol check increased from 68 .6% during 1999 to 2000 to 74 .8% during 2005 to 2006 .10
Awareness
●● Data from the BRFSS (CDC) survey in 2011 showed that among adults screened for high blood cholesterol, the per-centage who had been told that they had high blood choles-terol ranged from 33 .5% in Colorado to 42 .3% in Mississippi . The median percentage among states was 38 .4% .9
●● Among adults with hypercholesterolemia, the percentage who had been told that they had high cholesterol increased from 42 .0% during 1999 to 2000 to 50 .4% during 2005 to 2006 .10
Treatment
●● NHANES data on the treatment of high LDL cholesterol showed an increase from 28 .4% of individuals during 1999 to 2002 to 48 .1% during 2005 to 2008 .11
●● Self-reported use of cholesterol-lowering medications increased from 8 .2% during 1999 to 2000 to 14 .0% during 2005 to 2006 .10
Adherence
YouthThe American Academy of Pediatrics recommends screening for dyslipidemia in children and adolescents who have a fam-ily history of dyslipidemia or premature CVD, those whose family history is unknown, and those youths with risk factors for CVD, such as being overweight or obese, having hyperten-sion or DM, or being a smoker .1
Analysis of data from NHANES 1999–2006 showed that the overall prevalence of abnormal lipid levels among youths 12 to 19 years of age was 20 .3% .1
Adults
●● On the basis of data from the Third Report of the Expert Panel on Detection, Evaluation, and Treatment of High Blood Cholesterol in Adults12:
— Fewer than half of all people who qualify for any kind of lipid-modifying treatment for CHD risk reduction are receiving it .
— Fewer than half of even the highest-risk people (those with symptomatic CHD) are receiving lipid-lowering treatment .
— Only approximately one third of treated patients are achieving their LDL goal; <20% of patients with CHD are at their LDL goal .
●● Data from NHANES 2005–2006 indicate that among those with elevated LDL cholesterol levels, 35 .5% had not been screened previously, 24 .9% were screened but not told they had elevated cholesterol, and 39 .6% were treated inadequately .8
●● There were 33 .2% of adults overall during 2005–2008 in NHANES who achieved LDL cholesterol goals . Among adults without health insurance, only 22 .6% achieved LDL cholesterol goals; however, 82 .8% of those adults with
uncontrolled LDL cholesterol did have some form of health insurance .11
Lipid Levels
LDL (Bad) Cholesterol
Youth
●● There are limited data available on LDL cholesterol for children 4 to 11 years of age .
●● Among adolescents 12 to 19 years of age, the mean LDL cholesterol level is 89 .5 mg/dL . For boys, it is 88 .6 mg/dL, and for girls, it is 90 .5 mg/dL . The racial/ethnic breakdown is as follows (NHANES 2007–2010, unpublished NHLBI tabulation):
— Among non-Hispanic whites, 90 .4 mg/dL for boys and 90 .9 mg/dL for girls
— Among non-Hispanic blacks, 85 .8 mg/dL for boys and 91 .8 mg/dL for girls
— Among Mexican Americans, 90 .6 mg/dL for boys and 87 .1 mg/dL for girls
●● High levels of LDL cholesterol occurred in 7 .3% of male adolescents and 7 .6% of female adolescents during 2007 to 2010 .1
Adults
●● The mean level of LDL cholesterol for American adults ≥20 years of age was 115 .8 mg/dL in 2007 to 2010 .8 Levels of 130 to 159 mg/dL are considered borderline high, levels of 160 to 189 mg/dL are classified as high, and levels of ≥190 mg/dL are considered very high according to Adult Treatment Panel III .
●● According to NHANES 2007–2010 (unpublished NHLBI tabulation):
— Among non-Hispanic whites, mean LDL cholesterol levels were 115 .1 mg/dL for men and 115 .7 mg/dL for women .
— Among non-Hispanic blacks, mean LDL cholesterol levels were 115 .9 mg/dL for men and 114 .2 mg/dL for women .
— Among Mexican Americans, mean LDL cholesterol levels were 119 .7 mg/dL for men and 115 .0 mg/dL for women .
●● The age-adjusted prevalence of high LDL cholesterol in US adults was 26 .6% in 1988 to 1994 and 25 .3% in 1999 to 2004 (NHANES/NCHS) . Between 1988 to 1994 and 1999 to 2004, awareness increased from 39 .2% to 63 .0%, and use of pharmacological lipid-lowering treatment increased from 11 .7% to 40 .8% . LDL cholesterol control increased from 4 .0% to 25 .1% among those with high LDL choles-terol . In 1999 to 2004, rates of LDL cholesterol control were lower among adults 20 to 49 years of age than among those ≥65 years of age (13 .9% versus 30 .3%, respectively), among non-Hispanic blacks and Mexican Americans than among non-Hispanic whites (17 .2% and 16 .5% versus 26 .9%, respectively), and among men than among women (22 .6% versus 26 .9%, respectively) .13
by guest on December 16, 2013http://circ.ahajournals.org/Downloaded from

e74 Circulation January 1/8, 2013
●● Mean levels of LDL cholesterol decreased from 126 .1 mg/dL during 1999 to 2000 to 116 .1 mg/dL during 2009 to 2010 . The prevalence of high LDL cholesterol decreased from 31 .5% during 1999 to 2000 to 28 .2% during 2009 to 20108 (unpublished NHLBI tabulation) .
HDL (Good) Cholesterol
Youth
●● Among children 4 to 11 years of age, the mean HDL cho-lesterol level is 53 .6 mg/dL . For boys, it is 55 .1 mg/dL, and for girls, it is 51 .9 mg/dL . The racial/ethnic breakdown is as follows (NHANES 2007–2010, unpublished NHLBI tabulation):
— Among non-Hispanic whites, 53 .9 mg/dL for boys and 51 .4 mg/dL for girls
— Among non-Hispanic blacks, 59 .9 mg/dL for boys and 55 .3 mg/dL for girls
— Among Mexican Americans, 53 .5 mg/dL for boys and 50 .5 mg/dL for girls
●● Among adolescents 12 to 19 years of age, the mean HDL cholesterol level is 51 .4 mg/dL . For boys, it is 49 .2 mg/dL, and for girls, it is 53 .6 mg/dL . The racial/ethnic breakdown is as follows (NHANES 2007–2010, unpublished NHLBI tabulation):
— Among non-Hispanic whites, 48 .4 mg/dL for boys and 53 .0 mg/dL for girls
— Among non-Hispanic blacks, 53 .9 mg/dL for boys and 55 .4 mg/dL for girls
— Among Mexican Americans, 47 .5 mg/dL for boys and 53 .3 mg/dL for girls
●● Low levels of HDL cholesterol occurred in 21 .7% of male adolescents and 10 .7% of female adolescents during 2007 to 20101 (NHANES 2007–2010, unpublished NHLBI tabulation) .
Adults
●● An HDL cholesterol level <40 mg/dL in adult males and <50 mg/dL in adult females is considered low and is a risk factor for HD and stroke . The mean level of HDL cholesterol for American adults ≥20 years of age is 52 .5 mg/dL (NHANES 2007–2010, unpublished NHLBI tabulation) .
●● According to NHANES 2007–2010 (unpublished NHLBI tabulation):
— Among non-Hispanic whites, mean HDL cholesterol lev-els were 46 .7 mg/dL for men and 58 .1 mg/dL for women
— Among non-Hispanic blacks, mean HDL cholesterol lev-els were 52 .6 mg/dL for men and 58 .7 mg/dL for women
— Among Mexican Americans, mean HDL cholesterol lev-els were 45 .4 mg/dL for men and 53 .7 mg/dL for women
Triglycerides
Youth
●● There are limited data available on triglycerides for chil-dren 4 to 11 years of age .
●● Among adolescents 12 to 19 years of age, the mean tri-glyceride level is 82 .9 mg/dL . For boys, it is 85 .6 mg/dL,
and for girls, it is 80 .1 mg/dL . The racial/ethnic breakdown is as follows (NHANES 2007–2010, unpublished NHLBI tabulation):
— Among non-Hispanic whites, 89 .6 mg/dL for boys and 83 .5 mg/dL for girls
— Among non-Hispanic blacks, 66 .7 mg/dL for boys and 58 .6 mg/dL for girls
— Among Mexican Americans, 97 .1 mg/dL for boys and 83 .5 mg/dL for girls
●● High levels of triglycerides occurred in 9 .4% of male ado-lescents and 6 .7% of female adolescents during 2007 to 2010 .1
Adults
●● A fasting triglyceride level ≥150 mg/dL in adults is con-sidered elevated and is a risk factor for HD and stroke . The mean level of triglycerides for American adults ≥20 years of age is 130 .3 mg/dL (NHANES 2007–2010, unpublished NHLBI tabulation) .
—Among men, the mean triglyceride level is 141 .7 mg/dL (NHANES 2007–2010, unpublished NHLBI tabula-tion) . The racial/ethnic breakdown is as follows:
○ 140 .0 mg/dL for non-Hispanic white men○ 111 .3 mg/dL for non-Hispanic black men○ 161 .4 mg/dL for Mexican American men
— Among women, the mean triglyceride level is 119 .1 mg/dL, with the following racial/ethnic breakdown:
○ 121 .5 mg/dL for non-Hispanic white women○ 94 .4 mg/dL for non-Hispanic black women○ 134 .1 mg/dL for Mexican American women
●● Approximately 27% of adults ≥20 years of age had a triglyc-eride level ≥150 mg/dL during 2007 to 201014 (NHANES 2007–2010, unpublished NHLBI tabulation) .
●● Fewer than 3% of adults with a triglyceride level ≥150 mg/dL received pharmacological treatment during 1999 to 2004 .14
References 1 . Centers for Disease Control and Prevention (CDC) . Prevalence of abnor-
mal lipid levels among youths: United States, 1999–2006 [published cor-rection appears in MMWR Morb Mortal Wkly Rep . 2010;59:78] . MMWR Morb Mortal Wkly Rep . 2010;59:29–33 .
2 . Ford ES, Li C, Zhao G, Mokdad AH . Concentrations of low-density lipo-protein cholesterol and total cholesterol among children and adolescents in the United States . Circulation . 2009;119:1108–1115 .
3 . Fryar CD, Hirsch R, Eberhardt MS, Yoon SS, Wright JD . Hyperten-sion, high serum total cholesterol, and diabetes: racial and ethnic prevalence differences in U .S . adults, 1999–2006 . NCHS Data Brief . 2010;(36):1–8 .
4 . Carroll MD, Lacher DA, Sorlie PD, Cleeman JI, Gordon DJ, Wolz M, Grundy SM, Johnson CL . Trends in serum lipids and lipoproteins of adults, 1960-2002 . JAMA . 2005;294:1773–1781 .
5 . National Center for Health Statistics . Health, United States, 2010: With Special Feature on Death and Dying. Hyattsville, MD: National Center for Health Statistics; 2011 . http://www .cdc .gov/nchs/data/hus/hus10 .pdf . Accessed July 5, 2011 .
6 . Arnett DK, Jacobs DR Jr, Luepker RV, Blackburn H, Armstrong C, Claas SA . Twenty-year trends in serum cholesterol, hypercholesterolemia, and cholesterol medication use: the Minnesota Heart Survey, 1980-1982 to 2000-2002 . Circulation . 2005;112:3884–3891 .
by guest on December 16, 2013http://circ.ahajournals.org/Downloaded from
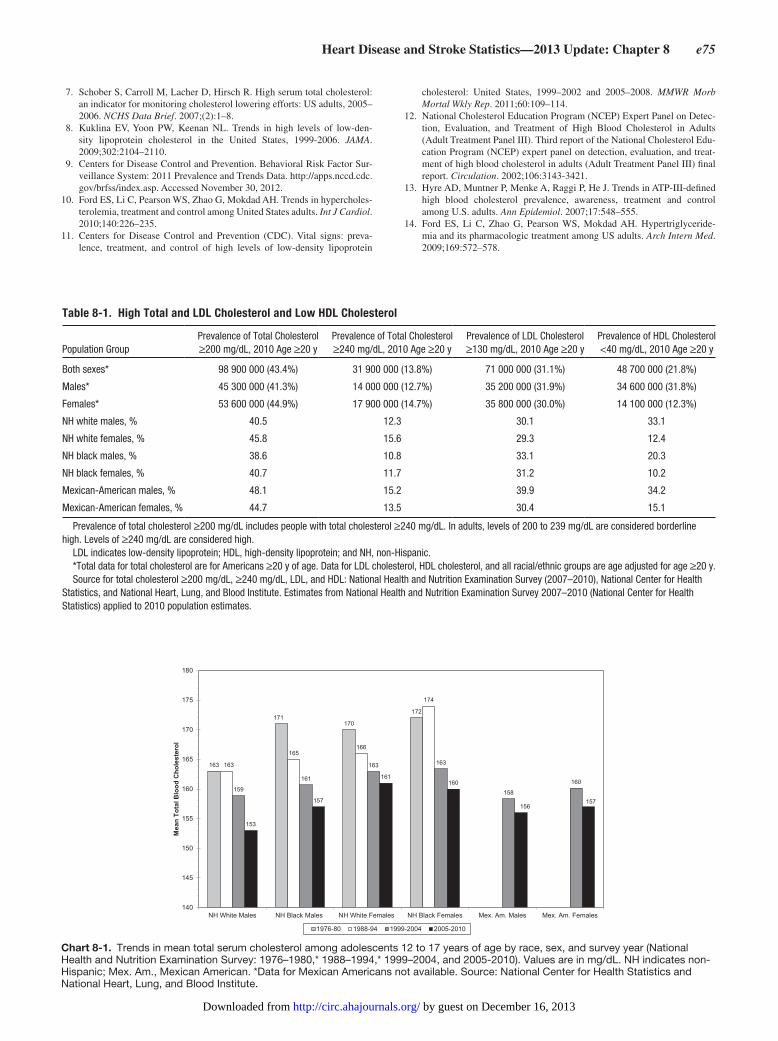
Heart Disease and Stroke Statistics—2013 Update: Chapter 8 e75
7. Schober S, Carroll M, Lacher D, Hirsch R. High serum total cholesterol: an indicator for monitoring cholesterol lowering efforts: US adults, 2005–2006. NCHS Data Brief. 2007;(2):1–8.
8. Kuklina EV, Yoon PW, Keenan NL. Trends in high levels of low-den-sity lipoprotein cholesterol in the United States, 1999-2006. JAMA. 2009;302:2104–2110.
9. Centers for Disease Control and Prevention. Behavioral Risk Factor Sur-veillance System: 2011 Prevalence and Trends Data. http://apps.nccd.cdc.gov/brfss/index.asp. Accessed November 30, 2012.
10. Ford ES, Li C, Pearson WS, Zhao G, Mokdad AH. Trends in hypercholes-terolemia, treatment and control among United States adults. Int J Cardiol. 2010;140:226–235.
11. Centers for Disease Control and Prevention (CDC). Vital signs: preva-lence, treatment, and control of high levels of low-density lipoprotein
cholesterol: United States, 1999–2002 and 2005–2008. MMWR Morb Mortal Wkly Rep. 2011;60:109–114.
12. National Cholesterol Education Program (NCEP) Expert Panel on Detec-tion, Evaluation, and Treatment of High Blood Cholesterol in Adults (Adult Treatment Panel III). Third report of the National Cholesterol Edu-cation Program (NCEP) expert panel on detection, evaluation, and treat-ment of high blood cholesterol in adults (Adult Treatment Panel III) final report. Circulation. 2002;106:3143-3421.
13. Hyre AD, Muntner P, Menke A, Raggi P, He J. Trends in ATP-III-defined high blood cholesterol prevalence, awareness, treatment and control among U.S. adults. Ann Epidemiol. 2007;17:548–555.
14. Ford ES, Li C, Zhao G, Pearson WS, Mokdad AH. Hypertriglyceride-mia and its pharmacologic treatment among US adults. Arch Intern Med. 2009;169:572–578.
Table 8-1. High Total and LDL Cholesterol and Low HDL Cholesterol
Population GroupPrevalence of Total Cholesterol ≥200 mg/dL, 2010 Age ≥20 y
Prevalence of Total Cholesterol ≥240 mg/dL, 2010 Age ≥20 y
Prevalence of LDL Cholesterol ≥130 mg/dL, 2010 Age ≥20 y
Prevalence of HDL Cholesterol <40 mg/dL, 2010 Age ≥20 y
Both sexes* 98 900 000 (43.4%) 31 900 000 (13.8%) 71 000 000 (31.1%) 48 700 000 (21.8%)
Males* 45 300 000 (41.3%) 14 000 000 (12.7%) 35 200 000 (31.9%) 34 600 000 (31.8%)
Females* 53 600 000 (44.9%) 17 900 000 (14.7%) 35 800 000 (30.0%) 14 100 000 (12.3%)
NH white males, % 40.5 12.3 30.1 33.1
NH white females, % 45.8 15.6 29.3 12.4
NH black males, % 38.6 10.8 33.1 20.3
NH black females, % 40.7 11.7 31.2 10.2
Mexican-American males, % 48.1 15.2 39.9 34.2
Mexican-American females, % 44.7 13.5 30.4 15.1
Prevalence of total cholesterol ≥200 mg/dL includes people with total cholesterol ≥240 mg/dL. In adults, levels of 200 to 239 mg/dL are considered borderline high. Levels of ≥240 mg/dL are considered high.
LDL indicates low-density lipoprotein; HDL, high-density lipoprotein; and NH, non-Hispanic.*Total data for total cholesterol are for Americans ≥20 y of age. Data for LDL cholesterol, HDL cholesterol, and all racial/ethnic groups are age adjusted for age ≥20 y.Source for total cholesterol ≥200 mg/dL, ≥240 mg/dL, LDL, and HDL: National Health and Nutrition Examination Survey (2007–2010), National Center for Health
Statistics, and National Heart, Lung, and Blood Institute. Estimates from National Health and Nutrition Examination Survey 2007–2010 (National Center for Health Statistics) applied to 2010 population estimates.
163
171170
172
163
165166
174
159
161
163 163
158
160
153
157
161160
156157
140
145
150
155
160
165
170
175
180
NH White Males NH Black Males NH White Females NH Black Females Mex. Am. Males Mex. Am. Females
Mea
n To
tal B
lood
Cho
lest
erol
1976-80 1988-94 1999-2004 2005-2010
Chart 8-1. Trends in mean total serum cholesterol among adolescents 12 to 17 years of age by race, sex, and survey year (National Health and Nutrition Examination Survey: 1976–1980,* 1988–1994,* 1999–2004, and 2005-2010). Values are in mg/dL. NH indicates non-Hispanic; Mex. Am., Mexican American. *Data for Mexican Americans not available. Source: National Center for Health Statistics and National Heart, Lung, and Blood Institute.
by guest on December 16, 2013http://circ.ahajournals.org/Downloaded from

e76 Circulation January 1/8, 2013
206
204205
204
199
202201
194
201
197
192
199
185
190
195
200
205
210
NH White NH Black Mexican American
Mea
n Se
rum
Tot
al C
hole
ster
ol
1988-94 1999-2002 2003-2006 2007-2010
Chart 8-2. Trends in mean total serum cholesterol among adults ages ≥20 years old by race and survey year (National Health and Nutri-tion Examination Survey: 1988–1994, 1999–2002, 2003-2006, and 2007–2010). Values are in mg/dL. NH indicates non-Hispanic. Source: National Center for Health Statistics and National Heart, Lung, and Blood Institute.
42.1
47.7
35.7
41.4
52.2
48.0
40.3
46.4
38.441.0
48.3
45.3
40.6
45.2
38.840.4
48.3
44.1
0
10
20
30
40
50
60
NH White Males NH White Females NH Black Males NH Black Females Mex. Am. Males Mex. Am. Females
Perc
ent o
f Pop
ulat
ion
2005-2006 2007-2008 2009-2010
Chart 8-3. Age-adjusted trends in the prevalence of total serum cholesterol ≥200 mg/dL in adults ≥20 years of age by sex, race/ethnicity, and survey year (National Health and Nutrition Examination Survey 2005–2006, 2007–2008, and 2009–2010). NH indicates non-Hispanic; Mex. Am., Mexican American.
by guest on December 16, 2013http://circ.ahajournals.org/Downloaded from
Heart Disease and Stroke Statistics—2013 Update: Chapter 9 e77
9. High Blood Pressure
ICD-9 401 to 404, ICD-10 I10 to I15. See Tables 9-1 and 9-2 and Charts 9-1 through 9-5.
Prevalence
(See Table 9-1 and Chart 9-1 .)
●● HBP is defined as:
— SBP ≥140 mm Hg or DBP ≥90 mm Hg or taking antihy-pertensive medicine, or
— Having been told at least twice by a physician or other health professional that one has HBP .
●● One in 3 US adults has HBP (unpublished NHLBI tabulation) .
●● Data from NHANES 2007–2010 found that ≈6% of US adults have undiagnosed hypertension . Data from the 2007–2008 BRFSS, NHIS, and NHANES surveys found 27 .8%, 28 .5%, and 30 .7% US adults were told they had hypertension, respectively .1
●● An estimated 77 .9 million adults ≥20 years of age have HBP, extrapolated to 2010 with NHANES 2007–2010 data (Table 9-1) .
●● NHANES data show that a higher percentage of men than women have hypertension until 45 years of age . From 45 to 54 and from 55 to 64 years of age, the percentages of men and women with hypertension are similar . After that, a higher percentage of women have hypertension than men (Chart 9-1) .
●● HBP is 2 to 3 times more common in women taking oral contraceptives, especially among obese and older women, than in women not taking them .2
●● Data from NHANES 2005–2006 found that 29% of US adults ≥18 years of age were hypertensive . The preva-lence of hypertension was nearly equal between men and women; 7% of adults had HBP but had never been told that they had hypertension . Among hypertensive adults, 78% were aware of their condition, 68% were using antihy-pertensive medication, and 64% of those treated had their hypertensioncontrolled .3
●● Data from the 2011 BRFSS/CDC indicate that the percent-age of adults ≥18 years of age who had been told that they had HBP ranged from 22 .9% in Utah to 40 .1% in Alabama . The median percentage was 30 .8% .4
— According to NHANES data 2003–2008, among US adults with hypertension, 8 .9% met the criteria for resis-tant hypertension (BP was ≥140/90 mm Hg, and they reported using antihypertensive medications from 3 dif-ferent drug classes or drugs from ≥4 antihypertensive drug classes regardless of BP) . This represents 12 .8% of the population taking antihypertensive medication .5
●● According to data from NHANES 1988–1994 and 2007–2008, HBP control rates improved from 27 .3% to 50 .1%, treatment improved from 54 .0% to 73 .5%, and the control/treated rates improved from 50 .6% to 72 .3% .6
●● Projections show that by 2030, prevalence of hypertension will increase 7 .2% from 2013 estimates (unpublished AHA computation, based on methodology described by Heiden-reich et al) .7
Older Adults
●● In 2009 to 2010, hypertension was among the diagnosed chronic conditions that were more prevalent among older (≥65 years of age) women than older men (57% for women, 54% for men) . Ever-diagnosed conditions that were more prevalent among older men than older women included HD (37% for men, 26% for women) and DM (24% for men, 18% for women), on the basis of data from NHIS/NCHS .8
●● The age-adjusted prevalence of hypertension (both diag-nosed and undiagnosed) in 2003 to 2006 was 75% for older women and 65% for older men on the basis of data from NHANES/NCHS .9
Abbreviations Used in Chapter 9
AHA American Heart Association
ARIC Atherosclerosis Risk in Communities Study
BP blood pressure
BRFSS Behavioral Risk Factor Surveillance System
CDC Centers for Disease Control and Prevention
CHD coronary heart disease
CHF congestive heart failure
CHS Cardiovascular Health Study
CVD cardiovascular disease
DBP diastolic blood pressure
DM diabetes mellitus
ED emergency department
FHS Framingham Heart Study
HBP high blood pressure
HD heart disease
ICD-9 International Classification of Diseases, 9th Revision
ICD-9-CM International Classification of Diseases, Clinical Modification, 9th Revision
ICD-10 International Classification of Diseases, 10th Revision
LDL low-density lipoprotein
MEPS Medical Expenditure Panel Survey
MESA Multi-Ethnic Study of Atherosclerosis
NAMCS National Ambulatory Medical Care Survey
NCHS National Center for Health Statistics
NH non-Hispanic
NHAMCS National Hospital Ambulatory Medical Care Survey
NHANES National Health and Nutrition Examination Survey
NHDS National Hospital Discharge Survey
NHES National Health Examination Survey
NHIS National Health Interview Survey
NHLBI National Heart, Lung, and Blood Institute
NINDS National Institute of Neurological Disorders and Stroke
NNHS National Nursing Home Survey
PA physical activity
REGARDS REasons for Geographic And Racial Differences in Stroke study
SBP systolic blood pressure
SEARCH Search for Diabetes in Youth Study
WHI Women’s Health Initiative
by guest on December 16, 2013http://circ.ahajournals.org/Downloaded from
e78 Circulation January 1/8, 2013
●● Data from the 2004 NNHS revealed the most frequent chronic medical condition among this nationally represen-tative sample of long-term stay residents aged ≥65 years was hypertension (53% of men and 56% of women) . In men, prevalence of hypertension decreased with increas-ing age .10
●● Among US adults ≥65 years of age (NHANES 1999–2004), prevalence of hypertension was 70 .8%, awareness of hypertension was 75 .9%, treatment for hypertension was 69 .3%, and control of hypertension was 48 .8% . Women had a slightly higher prevalence than men and a signifi-cantly lower rate of hypertension control .11
Children and Adolescents
●● Analysis of the National Health Examination Survey (NHES), the Hispanic Health and Nutrition Examination Survey, and the NHANES/NCHS surveys of the NCHS (1963–2002) found that the BP, pre-HBP, and HBP trends in children and adolescents 8 to 17 years of age moved downward from 1963 to 1988 and upward thereafter . Pre-HBP and HBP increased 2 .3% and 1%, respectively, between 1988 and 1999 . Increased obesity (abdominal obe-sity more so than general obesity) partially explained the HBP and pre-HBP rise from 1988 to 1999 . BP and HBP reversed their downward trends 10 years after the increase in the prevalence of obesity . In addition, an ethnic and sex gap appeared in 1988 for pre-HBP and in 1999 for HBP: Non-Hispanic blacks and Mexican Americans had a greater prevalence of HBP and pre-HBP than non-Hispanic whites, and the prevalence was greater in boys than in girls . In that study, HBP in children and adolescents was defined as SBP or DBP that was, on repeated measurement, ≥95th percentile .12
●● A study in Ohio of >14 000 children and adolescents 3 to 18 years of age who were observed at least 3 times between 1999 and 2006 found that 3 .6% had hypertension .13 Of these, 26% had been diagnosed and 74% were undiag-nosed . In addition, 3% of those with hypertension had stage 2 hypertension, and 41% of those with stage 2 hyperten-sion were undiagnosed . Criteria for prehypertension were met by 485 children . Of these, 11% were diagnosed . In this study, HBP in children and adolescents was defined as SBP or DBP that was, on repeated measurement, ≥95th percentile .13
●● A study from 1988–1994 through 1999–2000 of children and adolescents 8 to 17 years of age showed that among non-Hispanic blacks, mean SBP levels increased by 1 .6 mm Hg among girls and by 2 .9 mm Hg among boys compared with non-Hispanic whites . Among Mexican Americans, girls’ SBP increased 1 .0 mm Hg and boys’ SBP increased 2 .7 mm Hg compared with non-Hispanic whites .14
●● Analysis of data from the Search for Diabetes in Youth Study (SEARCH), which included children 3 to 17 years of age with type 1 and type 2 DM, found the prevalence of elevated BP to be 5 .9% among those with type 1 DM and 23 .7% among those with type 2 DM .15
●● A study of high school students in Houston, TX (mean age 15 .4 years; 45 .2% male, 49 .3% Hispanic, 25 .2% Cauca-sian, and 16 .1% African American) found ≈30% of the stu-dents had at least 1 elevated BP measurement; elevated BP was significantly influenced by obesity .16
●● Longitudinal BP outcomes from the National Childhood Blood Pressure database (ages 13–15 years) were examined after a single BP measurement . Among those determined to have prehypertension, 14% of boys and 12% of girls had hypertension 2 years later; the overall rate of progression from prehypertension to hypertension was ≈7% .17
Race/Ethnicity and HBP
(See Table 9-1 and Chart 9-2 .)
●● The prevalence of hypertension in blacks in the United States is among the highest in the world, and it is increas-ing . From 1988 to 1994 through 1999 to 2002, the prev-alence of HBP in adults increased from 35 .8% to 41 .4% among blacks, and it was particularly high among black women at 44 .0% . Prevalence among whites also increased, from 24 .3% to 28 .1% .18
●● Compared with whites, blacks develop HBP earlier in life, and their average BPs are much higher . As a result, com-pared with whites, blacks have a 1 .3-times greater rate of nonfatal stroke, a 1 .8-times greater rate of fatal stroke, a 1 .5-times greater rate of death attributable to HD, and a 4 .2-times greater rate of end-stage kidney disease (fifth and sixth reports of the Joint National Committee on Preven-tion, Detection, Evaluation, and Treatment of High Blood Pressure) .
●● Within the black community, rates of hypertension vary substantially .18,19
— Those with the highest rates are more likely to be mid-dle-aged or older, less educated, overweight or obese, and physically inactive and are more likely to have DM .
— Those with the lowest rates are more likely to be younger but also overweight or obese .
— Those with uncontrolled HBP who are not taking anti-hypertensive medication tend to be male, to be younger, and to have infrequent contact with a physician .
●● Analysis from the REasons for Geographic And Racial Differences in Stroke study (REGARDS) study of the NINDS suggests that efforts to raise awareness of preva-lent hypertension among blacks apparently have been suc-cessful (31% greater odds in blacks relative to whites), and efforts to communicate the importance of receiving treat-ment for hypertension have been successful (69% greater odds among blacks relative to whites); however, substantial racial disparities remain with regard to the control of BP (SBP <140 mm Hg, DBP <90 mm Hg), with the odds of control being 27% lower in blacks than in whites . In con-trast, geographic disparities in hypertension awareness, treatment, and control were minimal .20
●● Data from the 2011 NHIS showed that black adults ≥18 years of age were more likely (33 .4%) to have been told on ≥2 occasions that they had hypertension than white adults (23 .3%), American Indian/Alaska Native adults (25 .8%), or Asian adults (18 .7%) .21
●● The CDC analyzed death certificate data from 1995 to 2002 (any-mention mortality; ICD-9 codes 401–404 and ICD-10 codes I10–I13) . The results indicated that Puerto Rican Americans had a consistently higher hypertension-related death rate than all other Hispanic subpopulations and non-Hispanic whites . The age-standardized hypertension-related
by guest on December 16, 2013http://circ.ahajournals.org/Downloaded from
Heart Disease and Stroke Statistics—2013 Update: Chapter 9 e79
mortality rate was 127 .2 per 100 000 population for all His-panics, similar to that of non-Hispanic whites (135 .9) . The age-standardized rate for Hispanic females (118 .3) was substantially lower than that observed for Hispanic males (135 .9) . Hypertension-related mortality rates for males were higher than rates for females for all Hispanic subpopu-lations . Puerto Rican Americans had the highest hyperten-sion-related death rate among all Hispanic subpopulations (154 .0); Cuban Americans had the lowest (82 .5) .22
●● Some studies suggest that Hispanic Americans have rates of HBP similar to or lower than those of non-Hispanic white Americans . Findings from a new analysis of combined data from the NHIS of 2000–2002 point to a health disparity between black and white adults of Hispanic descent . Black Hispanics were at slightly greater risk than white Hispan-ics, although non-Hispanic black adults had by far the highest rate of HBP . The racial disparity among Hispanics also was evident in the fact that higher-income, better-edu-cated black Hispanics still had a higher rate of HBP than lower-income, less-educated white Hispanics .23 Data from the NHLBI’s ARIC study found that hypertension was a particularly powerful risk factor for CHD in black people, especially black women .24
●● Data from MESA found that being born outside the United States, speaking a language other than English at home, and living fewer years in the United States were each associated with a decreased prevalence of hypertension .25
●● Filipino (27%) and Japanese (25%) adults were more likely than Chinese (17%) or Korean (17%) adults to have ever been told that they had hypertension .26
Mortality
(See Table 9-1 .)
HBP mortality in 2009 was 61 762 . Any-mention mortality in 2009 was 348 102 . The 2009 death rate was 18 .5 .27
●● From 1999 to 2009, the death rate caused by HBP increased 17 .1%, and the actual number of deaths rose 43 .6% (AHA tabulation) .27
●● The 2009 overall death rate resulting from HBP was 18 .5 . Death rates were 17 .0 for white males, 51 .6 for black males, 14 .4 for white females, and 38 .3 for black females . When any-mention mortality for 2009 was used, the overall death rate was 104 .9 . Death rates were 108 .5 for white males, 219 .7 for black males, 86 .1 for white females, and 163 .7 for black females .
●● Analysis of NHANES I and II comparing hypertensive and nonhypertensive individuals found a reduction in age-adjusted mortality rate of 4 .6/1000 person-years among people with hypertension compared with a reduction of 4 .2/1000 person-years among those without hypertension .28
●● Assessment of 30-year follow-up of the Hypertension Detection and Follow-up Program identified the long-term benefit of stepped care, as well as the increased survival for hypertensive African Americans .29
●● Assessment of the Charleston Heart Study and Evans County Heart Study identified the excess burden of ele-vated BP for African Americans and its effect on long-term health outcomes .30
●● Data from the Harvard Alumni Health Study found that higher BP in early adulthood was associated several
decades later with higher risk for all-cause mortality, CVD mortality, and CHD mortality but not stroke mortality .31
Risk Factors
●● Numerous risk factors and markers for development of hypertension, including age, ethnicity, family history of hypertension and genetic factors, lower education and socioeconomic status, greater weight, lower PA, tobacco use, psychosocial stressors, sleep apnea, and dietary fac-tors (including dietary fats, higher sodium intake, lower potassium intake, and excessive alcohol intake), have been identified .
●● A study of related individuals in the NHLBI’s FHS sug-gested that different sets of genes regulate BP at different ages .32
●● Recent data from the Nurses’ Health Study suggest that a large proportion of incident hypertension in women can be prevented by controlling dietary and lifestyle risk factors .33
●● A meta-analysis identified the benefit of a goal BP of 130/80 mm Hg for individuals with hypertension and type 2 DM but less evidence for treatment below this value .34
Aftermath
●● Approximately 69% of people who have a first heart attack, 77% of those who have a first stroke, and 74% of those who have CHF have BP >140/90 mm Hg (NHLBI unpublished estimates from ARIC, CHS, and FHS Cohort and Offspring studies) .
●● Data from FHS/NHLBI indicate that recent (within the past 10 years) and remote antecedent BP levels may be an important determinant of risk over and above the current BP level .35
●● Data from the FHS/NHLBI indicate that hypertension is associated with shorter overall life expectancy, shorter life expectancy free of CVD, and more years lived with CVD .36
—Total life expectancy was 5 .1 years longer for normoten-sive men and 4 .9 years longer for normotensive women than for hypertensive people of the same sex at 50 years of age .
—Compared with hypertensive men at 50 years of age, men with untreated BP <140/90 mm Hg survived on aver-age 7 .2 years longer without CVD and spent 2 .1 fewer years of life with CVD . Similar results were observed for women .
Hospital Discharges/Ambulatory Care Visits
(See Table 9-1 .)
●● From 2000 to 2010, the number of inpatient discharges from short-stay hospitals with HBP as the first-listed diag-nosis increased from 457 000 to 488 000 (no significant difference; NCHS, NHDS) . The number of all-listed dis-charges increased from 8 034 000 to 11 282 000 (NHLBI, unpublished data from the NHDS, 2010; diagnoses in 2010 were truncated at 7 diagnoses for comparability with earlier year) .
●● Data from the Nationwide Inpatient Sample from the years 2000 to 2007 found the frequency of hospitalizations for
by guest on December 16, 2013http://circ.ahajournals.org/Downloaded from

e80 Circulation January 1/8, 2013
adults aged ≥18 years of age with a hypertensive emer-gency increased from 101 to 111 per 100 000 in 2007 (aver-age increase of 1 .11%) . In contrast to the increased number of hospitalizations, the all-cause in-hospital mortality rate decreased during the same period from 2 .8% to 2 .6% .37
●● Data from ambulatory medical care utilization estimates for 2009 showed that the number of visits for essential hypertension was 55 148 000 . Of these, 49 966 000 were physician office visits, 1 000 000 were ED visits, and 4 182 000 were outpatient department visits (NAMCS and NHAMCS, NHLBI tabulation) .
●● In 2010, there were 280 000 hospitalizations with a first-listed diagnosis of essential hypertension (ICD-9-CM code 401), but essential hypertension was listed as either a primary or a secondary diagnosis 11 048 000 times for hospitalized inpatients (unpublished data from the NHDS, NHLBI tabulation) .
Awareness, Treatment, and Control
(See Table 9-2 and Charts 9-3 through 9-5 .)
●● Data from NHANES 2007–2010 showed that of those with hypertension who were ≥20 years of age, 81 .5% were aware of their condition, 74 .9% were under current treat-ment, 52 .5% had their hypertension under control, and 47 .5% did not have it controlled (NHLBI tabulation) .
●● Data from NHANES 1999–2006 showed that 11 .2% of adults ≥20 years of age had treated and controlled BP levels .38
●● Analysis of NHANES data from 1999–2004 through 2005–2006 found that there were substantial increases in awareness and treatment rates of hypertension . The control rates increased in both sexes, in non-Hispanic blacks, and in Mexican Americans . Among the group ≥60 years of age, awareness, treatment, and control rates of hypertension increased significantly .3,39
●● In NHANES 2007–2010, rates of control were lower in Mexican Americans (39 .3%) than in non-Hispanic whites (54 .9%) and non-Hispanic blacks (47 .6%; unpublished NHLBI tabulation) .
●● The awareness, treatment, and control of HBP among those ≥65 years of age in the CHS/NHLBI improved during the 1990s . The percentages of those aware of and treated for HBP were higher among blacks than among whites . Preva-lence rates with HBP under control were similar . For both groups combined, the control of BP to <140/90 mm Hg increased from 37% in 1990 to 49% in 1999 . Improved control was achieved by an increase in antihypertensive medications per person and by an increase in the propor-tion of the CHS population treated for hypertension from 34 .5% to 51 .1% .40
●● Data from the FHS of the NHLBI show that among those ≥80 years of age, only 38% of men and 23% of women had BPs that met targets set forth in the National High Blood Pressure Education Program’s clinical guidelines . Control rates in men <60, 60 to 79, and ≥80 years of age were 38%, 36%, and 38%, respectively; for women in the same age groups, they were 38%, 28%, and 23%, respectively .41
●● Data from the WHI observational study of nearly 100 000 postmenopausal women across the country enrolled between 1994 and 1998 indicate that although prevalence
rates ranged from 27% of women 50 to 59 years of age to 41% of women 60 to 69 years of age to 53% of women 70 to 79 years of age, treatment rates were similar across age groups: 64%, 65%, and 63%, respectively . Despite similar treatment rates, hypertension control is especially poor in older women, with only 29% of hypertensive women 70 to 79 years of age having clinic BPs <140/90 mm Hg com-pared with 41% and 37% of those 50 to 59 and 60 to 69 years of age, respectively .42
●● Among a cohort of postmenopausal women taking hor-mone replacement, hypertension was the most common comorbidity, with a prevalence of 34% .43
●● A study of >300 women in Wisconsin showed a need for significant improvement in BP and LDL levels . Of the screened participants, 35% were not at BP goal, 32 .4% were not at LDL goal, and 53 .5% were not at both goals .44
●● In 2005, a survey of people in 20 states conducted by the BRFSS of the CDC found that 19 .4% of respondents had been told on ≥2 visits to a health professional that they had HBP . Of these, 70 .9% reported changing their eating habits; 79 .5% reduced the use of or were not using salt; 79 .2% reduced the use of or eliminated alcohol; 68 .8% were exercising; and 73 .4% were taking antihypertensive medication .45
●● On the basis of NHANES 2003–2004 data, it was found that nearly three fourths of adults with CVD comorbidities have hypertension . Poor control rates of systolic hyperten-sion remain a principal problem that further compromises their already high CVD risk .46
●● According to data from NHANES 2001–2006, non-Hispanic blacks had 90% higher odds of poorly controlled BP than non-Hispanic whites . Among those who were hyperten-sive, non-Hispanic blacks and Mexican Americans had 40% higher odds of uncontrolled BP than non-Hispanic whites .47
●● According to data from NHANES 1998–2008 for adults with DM, prevalence of hypertension increased, whereas awareness, treatment, and control improved during these time periods; however, for adults 20 to 44 years of age, there was no evidence of improvement .48
●● “Resistant hypertension” is a treatment and control issue for nearly 1 in 10 hypertensive adults . This category of HBP represents individuals with uncontrolled HBP despite the use of ≥3 antihypertensive medications or with BP con-trolled with the use of ≥4 medications .49,50
Cost
(See Table 9-1 .)
●● The estimated direct and indirect cost of HBP for 2009 is $51 .0 billion (MEPS, NHLBI tabulation) .
●● Projections show that by 2030, total cost of HBP will increase to an estimated $343 billion (unpublished AHA computation, based on methodology described in Heiden-reich et al7) .
Prehypertension
●● Prehypertension is untreated SBP of 120 to 139 mm Hg or untreated DBP of 80 to 89 mm Hg and not having been told on 2 occasions by a physician or other health professional that one has hypertension .
by guest on December 16, 2013http://circ.ahajournals.org/Downloaded from

Heart Disease and Stroke Statistics—2013 Update: Chapter 9 e81
●● Data from NHANES 1999–2006 estimate that 29 .7% of adults ≥20 years of age have prehypertension .38
●● Follow-up of 9845 men and women in the FHS/NHLBI who attended examinations from 1978 to 1994 revealed that at 35 to 64 years of age, the 4-year incidence of hyperten-sion was 5 .3% for those with baseline BP <120/80 mm Hg, 17 .6% for those with SBP of 120 to 129 mm Hg or DBP of 80 to 84 mm Hg, and 37 .3% for those with SBP of 130 to 139 mm Hg or DBP of 85 to 89 mm Hg . At 65 to 94 years of age, the 4-year incidences of hypertension were 16 .0%, 25 .5%, and 49 .5% for these BP categories, respectively .51
●● Data from FHS/NHLBI also reveal that prehypertension is associated with elevated relative and absolute risks for CVD outcomes across the age spectrum . Compared with normal BP (<120/80 mm Hg), prehypertension was asso-ciated with a 1 .5- to 2-fold increased risk for major CVD events in those <60, 60 to 79, and ≥80 years of age . Abso-lute risks for major CVD associated with prehypertension increased markedly with age: 6-year event rates for major CVD were 1 .5% in prehypertensive people <60 years of age, 4 .9% in those 60 to 79 years of age, and 19 .8% in those ≥80 years of age .41
●● In a study of NHANES 1999–2000 (NCHS), people with prehypertension were more likely than those with nor-mal BP levels to have above-normal cholesterol levels (≥200 mg/dL) and to be overweight or obese, whereas the probability of current smoking was lower . People with prehypertension were 1 .65 times more likely to have 1 or more of these adverse risk factors than were those with normal BP .52
●● Assessment of the REGARDS data identified high risk of prehypertension to be associated with increased age and black race .53
●● A meta-analysis of 12 prospective cohort studies (includ-ing 518 520 participants) found prehypertension was asso-ciated with incident stroke . The risk was particularly noted in nonelderly persons and for those with BP values in the higher prehypertension range .54
●● Prehypertension was found to be significantly associated with stroke .54
●● Prehypertension was highest in blacks with other risk fac-tors, including DM and elevated C-reactive protein .53
References 1 . Li C, Balluz LS, Ford ES, Okoro CA, Zhao G, Pierannunzi C . A compar-
ison of prevalence estimates for selected health indicators and chronic diseases or conditions from the Behavioral Risk Factor Surveillance System, the National Health Interview Survey, and the National Health and Nutrition Examination Survey, 2007-2008 . Prev Med . 2012;54:381–387 .
2 . Chobanian AV, Bakris GL, Black HR, Cushman WC, Green LA, Izzo JL Jr, Jones DW, Materson BJ, Oparil S, Wright JT Jr, Roccella EJ; Joint National Committee on Prevention, Detection, Evaluation, and Treatment of High Blood Pressure . National Heart, Lung, and Blood Institute; National High Blood Pressure Education Program Coordinating Committee . Seventh report of the Joint National Committee on Prevention, Detection, Evaluation, and Treatment of High Blood Pressure . Hypertension . 2003;42:1206–1252 .
3 . Ostchega Y, Yoon S, Hughes J, Louis T . Hypertension awareness, treat-ment, and control: continued disparities in adults: United States, 2005–2006 . NCHS Data Brief 3 . 2008;(3):1–8 .
4 . Centers for Disease Control and Prevention . Behavioral Risk Factor Surveillance System: 2011 prevalence and trends data . http://apps .nccd .cdc .gov/brfss/index .asp . Accessed November 30, 2012 .
5 . Persell SD . Prevalence of resistant hypertension in the United States, 2003-2008 . Hypertension . 2011;57:1076–1080 .
6 . Egan BM, Zhao Y, Axon RN . US trends in prevalence, awareness, treatment, and control of hypertension, 1988-2008 . JAMA . 2010;303:2043–2050 .
7 . Heidenreich PA, Trogdon JG, Khavjou OA, Butler J, Dracup K, Ezekowitz MD, Finkelstein EA, Hong Y, Johnston SC, Khera A, Lloyd-Jones DM, Nelson SA, Nichol G, Orenstein D, Wilson PW, Woo YJ; American Heart Association Advocacy Coordinating Committee; Stroke Council; Council on Cardiovascular Radiology and Intervention; Council on Clinical Cardiology; Council on Epidemiology and Prevention; Council on Arteriosclerosis; Thrombosis and Vascular Biology; Council on Cardiopulmonary; Critical Care; Perioperative and Resuscitation; Council on Cardiovascular Nursing; Council on the Kidney in Cardiovascular Disease; Council on Cardiovascular Surgery and Anesthesia, and Interdisciplinary Council on Quality of Care and Outcomes Research . Forecasting the future of cardiovascular disease in the United States: a policy statement from the American Heart Association . Circulation . 2011;123:933–944 .
8 . Federal Interagency Forum on Aging-Related Statistics . Older Americans 2010: Key Indicators of Well-Being. Washington, DC: US Government Printing Office; 2010 .
9 . Crescioni M, Gorina Y, Bilheimer L, Gillum RF . Trends in Health Status and Health Care Use Among Older Men. Hyattsville, MD: National Center for Health Statistics; 2010 . National Health Statistics Report No . 24 . http://www .cdc .gov/nchs/data/nhsr/nhsr024 .pdf . Accessed July 20, 2011 .
10 . Moore KL, Boscardin WJ, Steinman MA, Schwartz JB . Age and sex varia-tion in prevalence of chronic medical conditions in older residents of U .S . nursing homes . J Am Geriatr Soc . 2012;60:756–764 .
11 . McDonald M, Hertz RP, Unger AN, Lustik MB . Prevalence, awareness, and management of hypertension, dyslipidemia, and diabetes among United States adults aged 65 and older . J Gerontol A Biol Sci Med Sci . 2009;64:256–263 .
12 . Din-Dzietham R, Liu Y, Bielo MV, Shamsa F . High blood pressure trends in children and adolescents in national surveys, 1963 to 2002 . Circulation . 2007;116:1488–1496 .
13 . Hansen ML, Gunn PW, Kaelber DC . Underdiagnosis of hypertension in children and adolescents . JAMA . 2007;298:874–879 .
14 . Muntner P, He J, Cutler JA, Wildman RP, Whelton PK . Trends in blood pressure among children and adolescents . JAMA . 2004;291:2107–2113 .
15 . Rodriguez BL, Dabelea D, Liese AD, Fujimoto W, Waitzfelder B, Liu L, Bell R, Talton J, Snively BM, Kershnar A, Urbina E, Daniels S, Imperatore G; SEARCH Study Group . Prevalence and correlates of elevated blood pressure in youth with diabetes mellitus: the SEARCH for diabetes in youth study . J Pediatr . 2010;157:245–251 .e1 .
16 . Acosta AA, Samuels JA, Portman RJ, Redwine KM . Prevalence of persis-tent prehypertension in adolescents . J Pediatr . 2012;160:757–761 .
17 . Falkner B, Gidding SS, Portman R, Rosner B . Blood pressure variability and classification of prehypertension and hypertension in adolescence . Pediatrics . 2008;122:238–242 .
18 . Hertz RP, Unger AN, Cornell JA, Saunders E . Racial disparities in hypertension prevalence, awareness, and management . Arch Intern Med . 2005;165:2098–2104 .
19 . Collins R, Winkleby MA . African American women and men at high and low risk for hypertension: a signal detection analysis of NHANES III, 1988-1994 . Prev Med . 2002;35:303–312 .
20 . Howard G, Prineas R, Moy C, Cushman M, Kellum M, Temple E, Graham A, Howard V . Racial and geographic differences in awareness, treatment, and control of hypertension: the REasons for Geographic And Racial Differences in Stroke study . Stroke . 2006;37:1171–1178 .
21 . Schiller JS, Lucas JW, Ward BW, Peregoy JA . Summary health statistics for U .S . adults: National Health Interview Survey, 2010 . Vital Health Stat 10 . 2012;(252):1–207 .
22 . Centers for Disease Control and Prevention (CDC) . Hypertension-related mortality among Hispanic subpopulations: United States, 1995–2002 . MMWR Morb Mortal Wkly Rep . 2006;55:177–180 .
23 . Borrell LN . Self-reported hypertension and race among Hispanics in the National Health Interview Survey . Ethn Dis . 2006;16:71–77 .
24 . Jones DW, Chambless LE, Folsom AR, Heiss G, Hutchinson RG, Sharrett AR, Szklo M, Taylor HA Jr . Risk factors for coronary heart disease in African Americans: the Atherosclerosis Risk in Communities Study, 1987-1997 . Arch Intern Med . 2002;162:2565–2571 .
25 . Moran A, Diez Roux AV, Jackson SA, Kramer H, Manolio TA, Shrager S, Shea S . Acculturation is associated with hypertension in a multiethnic sample . Am J Hypertens . 2007;20:354–363 .
26 . Barnes PM, Adams PF, Powell-Griner E . Health Characteristics of the Asian Adult Population: United States, 2004–2006 . Advance Data From Vital and Health Statistics; No . 394 . Hyattsville, MD: National Center for Health Statistics; 2008 .
by guest on December 16, 2013http://circ.ahajournals.org/Downloaded from
e82 Circulation January 1/8, 2013
27 . Centers for Disease Control and Prevention, National Center for Health Statistics . Compressed Mortality File 1999-2009 . CDC WONDER Online Database, compiled for Compressed Mortality File 1999–2009 Series 20, No . 20, 2012 . Underlying cause-of-death 1999–2009 . http://wonder .cdc .gov/mortSQl .html . Accessed August 20, 2012 .
28 . Ford ES . Trends in mortality from all causes and cardiovascular disease among hypertensive and nonhypertensive adults in the United States . Circulation . 2011;123:1737–1744 .
29 . Lackland DT, Egan BM, Mountford WK, Boan AD, Evans DA, Gilbert G, McGee DL . Thirty-year survival for black and white hypertensive indi-viduals in the Evans County Heart Study and the Hypertension Detection and Follow-up Program . J Am Soc Hypertens . 2008;2:448–454 .
30 . Gazes PC, Lackland DT, Mountford WK, Gilbert GE, Harley RA . Comparison of cardiovascular risk factors for high brachial pulse pressure in blacks versus whites (Charleston Heart Study, Evans County Study, NHANES I and II Studies) . Am J Cardiol . 2008;102:1514–1517 .
31 . Gray L, Lee IM, Sesso HD, Batty GD . Blood pressure in early adult-hood, hypertension in middle age, and future cardiovascular disease mortality: HAHS (Harvard Alumni Health Study) . J Am Coll Cardiol . 2011;58:2396–2403 .
32 . Kraft P, Bauman L, Yuan JY, Horvath S; Framingham Heart Study . Multivariate variance-components analysis of longitudinal blood pres-sure measurements from the Framingham Heart Study . BMC Genet . 2003;4(suppl 1):S55 .
33 . Forman JP, Stampfer MJ, Curhan GC . Diet and lifestyle risk factors asso-ciated with incident hypertension in women . JAMA . 2009;302:401–411 .
34 . Bangalore S, Kumar S, Lobach I, Messerli FH . Blood pressure targets in subjects with type 2 diabetes mellitus/impaired fasting glucose: observa-tions from traditional and bayesian random-effects meta-analyses of ran-domized trials . Circulation . 2011;123:2799–2810 .
35 . Vasan RS, Massaro JM, Wilson PW, Seshadri S, Wolf PA, Levy D, D’Agostino RB; Framingham Heart Study . Antecedent blood pressure and risk of cardiovascular disease: the Framingham Heart Study . Circulation . 2002;105:48–53 .
36 . Franco OH, Peeters A, Bonneux L, de Laet C . Blood pressure in adulthood and life expectancy with cardiovascular disease in men and women: life course analysis . Hypertension . 2005;46:280–286 .
37 . Deshmukh A, Kumar G, Kumar N, Nanchal R, Gobal F, Sakhuja A, Mehta JL . Effect of Joint National Committee VII report on hospitaliza-tions for hypertensive emergencies in the United States . Am J Cardiol . 2011;108:1277–1282 .
38 . Ogunniyi MO, Croft JB, Greenlund KJ, Giles WH, Mensah GA . Racial/ethnic differences in microalbuminuria among adults with prehyperten-sion and hypertension: National Health and Nutrition Examination Survey (NHANES), 1999-2006 . Am J Hypertens . 2010;23:859–864 .
39 . Ong KL, Cheung BM, Man YB, Lau CP, Lam KS . Prevalence, awareness, treatment, and control of hypertension among United States adults 1999-2004 . Hypertension . 2007;49:69–75 .
40 . Psaty BM, Manolio TA, Smith NL, Heckbert SR, Gottdiener JS, Burke GL, Weissfeld J, Enright P, Lumley T, Powe N, Furberg CD; Cardiovascular
Health Study . Time trends in high blood pressure control and the use of antihypertensive medications in older adults: the Cardiovascular Health Study . Arch Intern Med . 2002;162:2325–2332 .
41 . Lloyd-Jones DM, Evans JC, Levy D . Hypertension in adults across the age spectrum: current outcomes and control in the community . JAMA . 2005;294:466–472 .
42 . Wassertheil-Smoller S, Anderson G, Psaty BM, Black HR, Manson J, Wong N, Francis J, Grimm R, Kotchen T, Langer R, Lasser N . Hypertension and its treatment in postmenopausal women: baseline data from the Women’s Health Initiative . Hypertension . 2000;36:780–789 .
43 . Hawkins K, Mittapally R, Chang J, Nahum GG, Gricar J . Burden of illness of hypertension among women using menopausal hormone therapy: a US perspective . Curr Med Res Opin . 2010;26:2823–2832 .
44 . Sanchez RJ, Khalil L . Badger Heart Program: health screenings targeted to increase cardiovascular awareness in women at four northern sites in Wisconsin . WMJ . 2005;104:24–29 .
45 . Centers for Disease Control and Prevention (CDC) . Prevalence of actions to control high blood pressure: 20 states, 2005 . MMWR Morb Mortal Wkly Rep . 2007;56:420–423 .
46 . Wong ND, Lopez VA, L’Italien G, Chen R, Kline SE, Franklin SS . Inadequate control of hypertension in US adults with cardiovascu-lar disease comorbidities in 2003-2004 . Arch Intern Med . 2007;167: 2431–2436 .
47 . Redmond N, Baer HJ, Hicks LS . Health behaviors and racial disparity in blood pressure control in the National Health and Nutrition Examination Survey . Hypertension . 2011;57:383–389 .
48 . Wang J, Geiss LS, Cheng YJ, Imperatore G, Saydah SH, James C, Gregg EW . Long-term and recent progress in blood pressure levels among U .S . adults with diagnosed diabetes, 1988-2008 . Diabetes Care . 2011;34:1579–1581 .
49 . Sarafidis PA . Epidemiology of resistant hypertension . J Clin Hypertens (Greenwich) . 2011;13:523–528 .
50 . Egan BM, Zhao Y, Axon RN, Brzezinski WA, Ferdinand KC . Uncontrolled and apparent treatment resistant hypertension in the United States, 1988 to 2008 . Circulation . 2011;124:1046–1058 .
51 . Vasan RS, Larson MG, Leip EP, Kannel WB, Levy D . Assessment of frequency of progression to hypertension in non-hypertensive par-ticipants in the Framingham Heart Study: a cohort study . Lancet . 2001;358:1682–1686 .
52 . Greenlund KJ, Croft JB, Mensah GA . Prevalence of heart disease and stroke risk factors in persons with prehypertension in the United States, 1999-2000 . Arch Intern Med . 2004;164:2113–2118 .
53 . Glasser SP, Judd S, Basile J, Lackland D, Halanych J, Cushman M, Prineas R, Howard V, Howard G . Prehypertension, racial prevalence and its association with risk factors: analysis of the REasons for Geographic And Racial Differences in Stroke (REGARDS) study . Am J Hypertens . 2011;24:194–199 .
54 . Lee M, Saver JL, Chang B, Chang KH, Hao Q, Ovbiagele B . Presence of baseline prehypertension and risk of incident stroke: a meta-analysis . Neurology . 2011;77:1330–1337 .
by guest on December 16, 2013http://circ.ahajournals.org/Downloaded from

Heart Disease and Stroke Statistics—2013 Update: Chapter 9 e83
Table 9-1. High Blood Pressure
Population Group Prevalence, 2010, Age ≥20 y Mortality,* 2009, All Ages Hospital Discharges, 2010, All Ages Estimated Cost, 2009
Both sexes 77 895 000 (33.0%) 61 762 488 000 $51.0 Billion
Males 37 195 000 (33.6%) 27 668 (44.8%)† 216 000 …
Females 40 700 000 (32.2%) 34 094 (55.2%)† 272 000 …
NH white males 33.4% 20 286 … …
NH white females 30.7% 26 201 … …
NH black males 42.6% 6574 … …
NH black females 47.0% 6951 … …
Mexican American males 30.1% … … …
Mexican American females 28.8% … … …
Hispanic or Latino 22.2%‡ 3733 … …
Asian 18.7%‡ 1471 … …
American Indian/Alaska Native 25.8%‡ 279 … …
Hypertension is defined in terms of National Health and Nutrition Examination Survey blood pressure measurements and health interviews. A subject was consid-ered hypertensive if systolic blood pressure was ≥140 mm Hg or diastolic blood pressure was ≥90 mm Hg, if the subject said “yes” to taking antihypertensive medi-cation, or if the subject was told on 2 occasions that he or she had hypertension. Ellipses (. . .) indicate data not available; NH, non-Hispanic.
*Mortality data for the white, black, Asian or Pacific Islander, and American Indian/Alaska Native populations include deaths among persons of Hispanic and non-Hispanic origin. Numbers of deaths for the American Indian/Alaska Native and Asian or Pacific Islander populations are known to be underestimated.
†These percentages represent the portion of total high blood pressure mortality that is for males vs females.‡National Health Interview Survey (2010), National Center for Health Statistics; data are weighted percentages for Americans ≥18 years of age. Source: Schiller et al.21
Sources: Prevalence: National Health and Nutrition Examination Survey (2007–2010), National Center for Health Statistics) and National Heart, Lung, and Blood Institute. Percentages for racial/ethnic groups are age adjusted for Americans ≥20 y of age. Age-specific percentages are extrapolated to the 2010 US population esti-mates. Mortality: CDC/National Center for Health Statistics, 2009 Mortality Multiple Cause–US, version July 19, 2012. These data represent underlying cause of death only. Hospital discharges: National Hospital Discharge Survey, National Center for Health Statistics; data include those discharged alive, dead, or status unknown. Cost: Medical Expenditure Panel Survey data include estimated direct costs for 2009; indirect costs calculated by National Heart, Lung, and Blood Institute for 2009.
Table 9-2. Hypertension Awareness, Treatment, and Control: NHANES 1999–2004 and 2005–2010, by Race/Ethnicity and Sex
Awareness, % Treatment, % Control, %
1999–2004 2005–2010 1999–2004 2005–2010 1999–2004 2005–2010
NH white males 71.2 77.5 61.2 69.4 41.0 50.1
NH white females 74.4 84.0 65.3 78.2 37.2 53.9
NH black male 69.1 77.5 58.1 66.9 32.3 39.7
NH black females 83.5 88.5 73.9 81.5 40.4 52.8
Mexican American males 57.0 64.8 41.8 54.0 23.3 35.1
Mexican American females 67.9 75.5 56.3 68.1 29.6 41.6
NHANES indicates National Health and Nutrition Examination Survey; NH, non-Hispanic.Sources: NHANES (1999–2004, 2005–2010) and National Heart, Lung, and Blood Institute.
by guest on December 16, 2013http://circ.ahajournals.org/Downloaded from

e84 Circulation January 1/8, 2013
9.1
24.4
37.7
52.0
63.9
72.1
6.7
17.6
34.0
52.0
70.8
80.1
0
10
20
30
40
50
60
70
80
90
20-34 35-44 45-54 55-64 65-74 ≥75
Perc
ent o
f Pop
ulat
ion
Age (Years)
Male Female
Chart 9-1. Prevalence of high blood pressure in adults ≥20 years of age by age and sex (National Health and Nutrition Examination Survey: 2007–2010). Hypertension is defined as systolic blood pressure ≥140 mm Hg or diastolic blood pressure ≥90 mm Hg, if the sub-ject said “yes” to taking antihypertensive medication, or if the subject was told on 2 occasions that he or she had hypertension. Source: National Center for Health Statistics and National Heart, Lung, and Blood Institute.
25.6
22.9
37.5 38.2
26.9
25.0
28.3 28.2
38.641.5
25.726.8
30.3
27.4
39.942.7
25.5 26.0
0
5
10
15
20
25
30
35
40
45
NH White Men NH White Women NH Black Men NH Black Women Mexican AmericanMen
Mexican AmericanWomen
Perc
ent o
f Pop
ulat
ion
1988-1994 1999-2004 2005-2010
Chart 9-2. Age-adjusted prevalence trends for high blood pressure in adults ≥20 years of age by race/ethnicity, sex, and survey (National Health and Nutrition Examination Survey: 1988–1994, 1999–2004, and 2005–2010). NH indicates non-Hispanic. Source: National Center for Health Statics and National Heart, Lung and Blood Institute.
by guest on December 16, 2013http://circ.ahajournals.org/Downloaded from
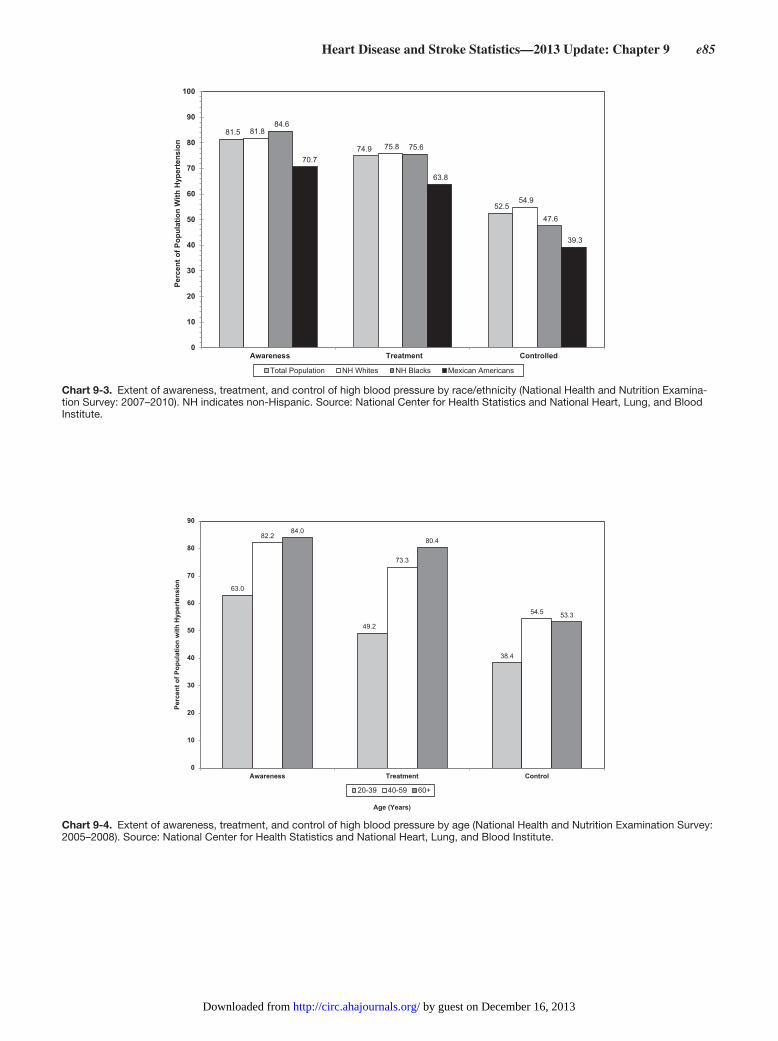
Heart Disease and Stroke Statistics—2013 Update: Chapter 9 e85
81.5
74.9
52.5
81.8
75.8
54.9
84.6
75.6
47.6
70.7
63.8
39.3
0
10
20
30
40
50
60
70
80
90
100
Awareness Treatment Controlled
Perc
ent o
f Pop
ulat
ion
With
Hyp
erte
nsio
n
Total Population NH Whites NH Blacks Mexican Americans
Chart 9-3. Extent of awareness, treatment, and control of high blood pressure by race/ethnicity (National Health and Nutrition Examina-tion Survey: 2007–2010). NH indicates non-Hispanic. Source: National Center for Health Statistics and National Heart, Lung, and Blood Institute.
63.0
49.2
38.4
82.2
73.3
54.5
84.080.4
53.3
0
10
20
30
40
50
60
70
80
90
Awareness Treatment Control
Perc
ent o
f Pop
ulat
ion
with
Hyp
erte
nsio
n
20-39 40-59 60+
Age (Years)
Chart 9-4. Extent of awareness, treatment, and control of high blood pressure by age (National Health and Nutrition Examination Survey: 2005–2008). Source: National Center for Health Statistics and National Heart, Lung, and Blood Institute.
by guest on December 16, 2013http://circ.ahajournals.org/Downloaded from

e86 Circulation January 1/8, 2013
79.4
72.3
53.0
84.0
79.1
56.8
80.0
68.8
40.3
87.8
80.4
52.7
66.4
58.2
36.2
75.5
70.2
42.8
0
10
20
30
40
50
60
70
80
90
100
Awareness Treatment Controlled
Perc
ent o
f Pop
ulat
ion
With
Hyp
erte
nsio
n
NH White Males NH White Females NH Black MalesNH Black Females Mexican-American Males Mexican-American Females
Chart 9-5. Extent of awareness, treatment, and control of high blood pressure by race/ethnicity and sex (National Health and Nutrition Examination Survey: 2007–2010). NH indicates non-Hispanic. Source: National Center for Health Statistics and National Heart, Lung, and Blood Institute.
by guest on December 16, 2013http://circ.ahajournals.org/Downloaded from

Heart Disease and Stroke Statistics—2013 Update: Chapter 10 e87
10. Diabetes Mellitus
ICD-9 250; ICD-10 E10 to E14. See Table 10-1 and Charts 10-1 through 10-4.
Prevalence
Youths
●● In SEARCH, the prevalence of DM in youths <20 years of age in 2001 in the United States was 1 .82 cases per 1000 youths (0 .79 per 1000 among youths 0–9 years of age and 2 .80 per 1000 among youths 10–19 years of age) . Non-Hispanic white youths had the highest prevalence (1 .06 per 1000) in the younger group . Among youths 10 to 19 years of age, black youths (3 .22 per 1000) and non-His-panic white youths (3 .18 per 1000) had the highest rates, followed by American Indian youths (2 .28 per 1000), His-panic youths (2 .18 per 1000), and Asian/Pacific Islander youths (1 .34 per 1000) . Among younger children, type 1 DM accounted for ≥80% of DM; among older youths, the proportion of type 2 DM ranged from 6% (0 .19 per 1000 for non-Hispanic white youths) to 76% (1 .74 per 1000 for American Indian youths) . This translates to 154 369 youths with physician-diagnosed DM in 2001 in the United States, for an overall prevalence estimate for DM in children and adolescents of ≈0 .18% .1
●● Approximately 186 000 people <20 years of age have DM . Each year, ≈15 000 people <20 years of age are diagnosed with type 1 DM . Healthcare providers are finding more and more children with type 2 DM, a disease usually diagnosed in adults ≥40 years of age . Children who develop type 2
DM are typically overweight or obese and have a family history of the disease . Most are American Indian, black, Asian, or Hispanic/Latino .2
●● During the period from 2002 to 2005, 3600 youth (age <20 years) were diagnosed with type 2 DM annually .3
●● Among adolescents 10 to 19 years of age diagnosed with DM, 57 .8% of blacks were diagnosed with type 2 versus type 1 DM compared with 46 .1% of Hispanic and 14 .9% of white youths .4
●● According to the Bogalusa Heart Study, a long-term fol-low-up study of youths aging into adulthood, youths who were prediabetic or who had DM were more likely to have a constellation of metabolic disorders in young adulthood (19–44 years of age), including obesity, hypertension, dys-lipidemia, and metabolic syndrome, all of which predis-pose to CHD .5
●● Among youths with type 2 DM, 10 .4% are overweight and 79 .4% are obese .6
●● According to NHANES data from 1999–2007, among US adolescents aged 12 to 19 years, the prevalence of predia-betes and DM increased from 9% to 23% .7
●● The TODAY (Treatment Options for Type 2 Diabetes in Adolescents and Youth) cohort comprised youths aged 10 to 17 years (41 .1% Hispanic and 31 .5% non-Hispanic black) participating in a randomized controlled study of new-onset type 2 DM; 41 .5% of participants had household income <$25 000 .8 The results of the clinical trial demonstrated that only half of the children maintained durable glycemic control with monotherapy,9 a higher rate of treatment failure than observed in adult cohorts .
Abbreviations Used in Chapter 10
ACCORD Action to Control Cardiovascular Risk in Diabetes IDDM insulin-dependent diabetes mellitus
ACS acute coronary syndrome LDL low-density lipoprotein
ADVANCE Action in Diabetes and Vascular Disease: Preterax and Diamicron Modified Release Controlled Evaluation
MEPS Medical Expenditure Panel Survey
AMI acute myocardial infarction MESA Multi-Ethnic Study of Atherosclerosis
ARIC Atherosclerosis Risk in Communities study MI myocardial infarction
BMI body mass index NAMCS National Ambulatory Medical Care Survey
BP blood pressure NCHS National Center for Health Statistics
BRFSS Behavioral Risk Factor Surveillance System NH non-Hispanic
CDC Centers for Disease Control and Prevention NHAMCS National Hospital Ambulatory Medical Care Survey
CHD coronary heart disease NHANES National Health and Nutrition Examination Survey
CHS Cardiovascular Health Study NHDS National Hospital Discharge Survey
CI confidence interval NHIS National Health Interview Survey
CVD cardiovascular disease NHLBI National Heart, Lung, and Blood Institute
DM diabetes mellitus NSTEMI non–ST-segment–elevation myocardial infarction
ED emergency department OR odds ratio
ESRD end-stage renal disease PA physical activity
FHS Framingham Heart Study PAR population-attributable risk
HbA1c hemoglobin A1c RR relative risk
HD heart disease SBP systolic blood pressure
HDL high-density lipoprotein SEARCH Search for Diabetes in Youth Study
HR hazard ratio STEMI ST-segment–elevation myocardial infarction
ICD-9 International Classification of Diseases, 9th Revision TODAY Treatment Options for Type 2 Diabetes in Adolescents and Youth
ICD-10 International Classification of Diseases, 10th Revision UA unstable angina
by guest on December 16, 2013http://circ.ahajournals.org/Downloaded from
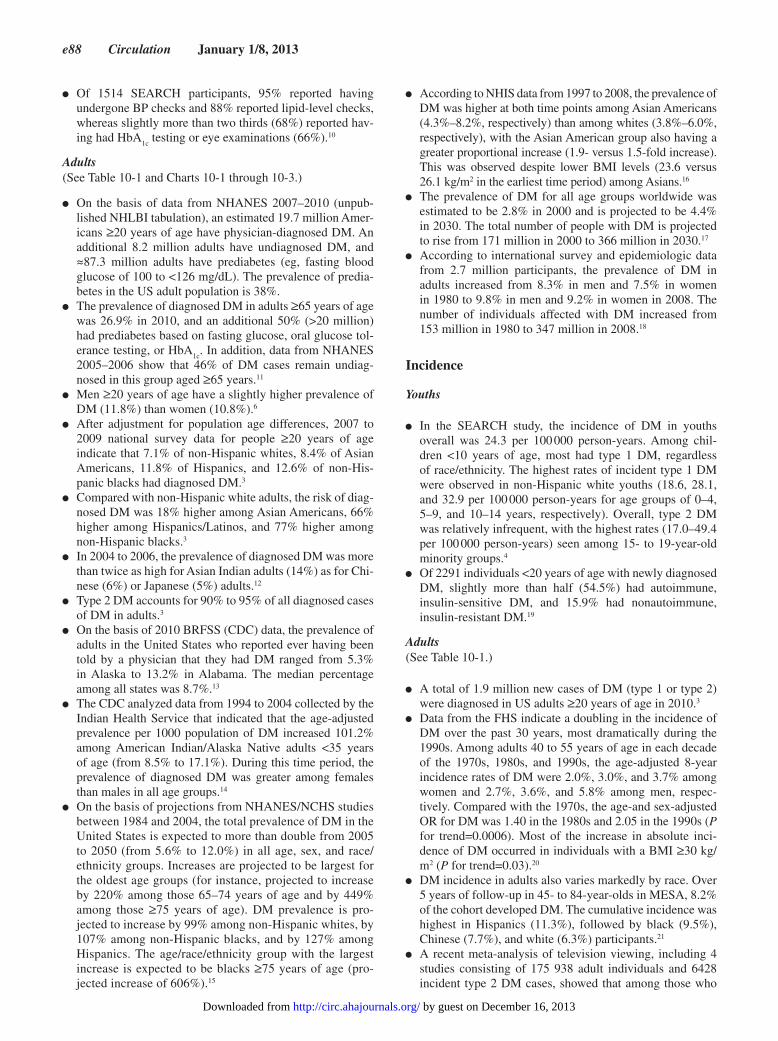
e88 Circulation January 1/8, 2013
●● Of 1514 SEARCH participants, 95% reported having undergone BP checks and 88% reported lipid-level checks, whereas slightly more than two thirds (68%) reported hav-ing had HbA
1c testing or eye examinations (66%) .10
Adults(See Table 10-1 and Charts 10-1 through 10-3 .)
●● On the basis of data from NHANES 2007–2010 (unpub-lished NHLBI tabulation), an estimated 19 .7 million Amer-icans ≥20 years of age have physician-diagnosed DM . An additional 8 .2 million adults have undiagnosed DM, and ≈87 .3 million adults have prediabetes (eg, fasting blood glucose of 100 to <126 mg/dL) . The prevalence of predia-betes in the US adult population is 38% .
●● The prevalence of diagnosed DM in adults ≥65 years of age was 26 .9% in 2010, and an additional 50% (>20 million) had prediabetes based on fasting glucose, oral glucose tol-erance testing, or HbA
1c . In addition, data from NHANES
2005–2006 show that 46% of DM cases remain undiag-nosed in this group aged ≥65 years .11
●● Men ≥20 years of age have a slightly higher prevalence of DM (11 .8%) than women (10 .8%) .6
●● After adjustment for population age differences, 2007 to 2009 national survey data for people ≥20 years of age indicate that 7 .1% of non-Hispanic whites, 8 .4% of Asian Americans, 11 .8% of Hispanics, and 12 .6% of non-His-panic blacks had diagnosed DM .3
●● Compared with non-Hispanic white adults, the risk of diag-nosed DM was 18% higher among Asian Americans, 66% higher among Hispanics/Latinos, and 77% higher among non-Hispanic blacks .3
●● In 2004 to 2006, the prevalence of diagnosed DM was more than twice as high for Asian Indian adults (14%) as for Chi-nese (6%) or Japanese (5%) adults .12
●● Type 2 DM accounts for 90% to 95% of all diagnosed cases of DM in adults .3
●● On the basis of 2010 BRFSS (CDC) data, the prevalence of adults in the United States who reported ever having been told by a physician that they had DM ranged from 5 .3% in Alaska to 13 .2% in Alabama . The median percentage among all states was 8 .7% .13
●● The CDC analyzed data from 1994 to 2004 collected by the Indian Health Service that indicated that the age-adjusted prevalence per 1000 population of DM increased 101 .2% among American Indian/Alaska Native adults <35 years of age (from 8 .5% to 17 .1%) . During this time period, the prevalence of diagnosed DM was greater among females than males in all age groups .14
●● On the basis of projections from NHANES/NCHS studies between 1984 and 2004, the total prevalence of DM in the United States is expected to more than double from 2005 to 2050 (from 5 .6% to 12 .0%) in all age, sex, and race/ethnicity groups . Increases are projected to be largest for the oldest age groups (for instance, projected to increase by 220% among those 65–74 years of age and by 449% among those ≥75 years of age) . DM prevalence is pro-jected to increase by 99% among non-Hispanic whites, by 107% among non-Hispanic blacks, and by 127% among Hispanics . The age/race/ethnicity group with the largest increase is expected to be blacks ≥75 years of age (pro-jected increase of 606%) .15
●● According to NHIS data from 1997 to 2008, the prevalence of DM was higher at both time points among Asian Americans (4 .3%–8 .2%, respectively) than among whites (3 .8%–6 .0%, respectively), with the Asian American group also having a greater proportional increase (1 .9- versus 1 .5-fold increase) . This was observed despite lower BMI levels (23 .6 versus 26 .1 kg/m2 in the earliest time period) among Asians .16
●● The prevalence of DM for all age groups worldwide was estimated to be 2 .8% in 2000 and is projected to be 4 .4% in 2030 . The total number of people with DM is projected to rise from 171 million in 2000 to 366 million in 2030 .17
●● According to international survey and epidemiologic data from 2 .7 million participants, the prevalence of DM in adults increased from 8 .3% in men and 7 .5% in women in 1980 to 9 .8% in men and 9 .2% in women in 2008 . The number of individuals affected with DM increased from 153 million in 1980 to 347 million in 2008 .18
Incidence
Youths
●● In the SEARCH study, the incidence of DM in youths overall was 24 .3 per 100 000 person-years . Among chil-dren <10 years of age, most had type 1 DM, regardless of race/ethnicity . The highest rates of incident type 1 DM were observed in non-Hispanic white youths (18 .6, 28 .1, and 32 .9 per 100 000 person-years for age groups of 0–4, 5–9, and 10–14 years, respectively) . Overall, type 2 DM was relatively infrequent, with the highest rates (17 .0–49 .4 per 100 000 person-years) seen among 15- to 19-year-old minority groups .4
●● Of 2291 individuals <20 years of age with newly diagnosed DM, slightly more than half (54 .5%) had autoimmune, insulin-sensitive DM, and 15 .9% had nonautoimmune, insulin-resistant DM .19
Adults(See Table 10-1 .)
●● A total of 1 .9 million new cases of DM (type 1 or type 2) were diagnosed in US adults ≥20 years of age in 2010 .3
●● Data from the FHS indicate a doubling in the incidence of DM over the past 30 years, most dramatically during the 1990s . Among adults 40 to 55 years of age in each decade of the 1970s, 1980s, and 1990s, the age-adjusted 8-year incidence rates of DM were 2 .0%, 3 .0%, and 3 .7% among women and 2 .7%, 3 .6%, and 5 .8% among men, respec-tively . Compared with the 1970s, the age-and sex-adjusted OR for DM was 1 .40 in the 1980s and 2 .05 in the 1990s (P for trend=0 .0006) . Most of the increase in absolute inci-dence of DM occurred in individuals with a BMI ≥30 kg/m2 (P for trend=0 .03) .20
●● DM incidence in adults also varies markedly by race . Over 5 years of follow-up in 45- to 84-year-olds in MESA, 8 .2% of the cohort developed DM . The cumulative incidence was highest in Hispanics (11 .3%), followed by black (9 .5%), Chinese (7 .7%), and white (6 .3%) participants .21
●● A recent meta-analysis of television viewing, including 4 studies consisting of 175 938 adult individuals and 6428 incident type 2 DM cases, showed that among those who
by guest on December 16, 2013http://circ.ahajournals.org/Downloaded from

Heart Disease and Stroke Statistics—2013 Update: Chapter 10 e89
watched 2 hours of television per day, the RR of DM was 20% higher (HR, 1 .20; 95% CI, 1 .14–1 .27) .22
●● Gestational diabetes complicates 2% to 10% of pregnan-cies and increases the risk of developing type 2 DM by 35% to 60% .3
Mortality(See Table 10-1 .)
DM mortality in 2009 was 68 705 . Any-mention mortality in 2009 was 230 642 .23
●● The 2009 overall underlying-cause death rate attributable to DM was 20 .9 . Death rates per 100 000 people were 23 .3 for white males, 44 .2 for black males, 15 .7 for white females, and 35 .9 for black females .23
●● According to data from the National Diabetes Informa-tion Clearinghouse, the National Institute of Diabetes and Digestive and Kidney Diseases, and the National Institutes of Health
—At least 68% of people >65 years of age with DM die of some form of HD; 16% die of stroke .
—HD death rates among adults with DM are 2 to 4 times higher than the rates for adults without DM .3
●● In a collaborative meta-analysis of 820 900 individuals from 97 prospective studies, DM was associated with the following risks: all-cause mortality, HR 1 .80 (95% CI, 1 .71–1 .90); cancer death, HR 1 .25 (95% CI, 1 .19–1 .31); and vascular death, HR 2 .32 (95% CI, 2 .11–2 .56) . In par-ticular, DM was associated with death attributable to the following cancers: liver, pancreas, ovary, colorectal, lung, bladder, and breast . A 50-year-old with DM died on aver-age 6 years earlier than an individual without DM .24
●● FHS/NHLBI data show that having DM significantly increased the risk of developing CVD (HR 2 .5 for women and 2 .4 for men) and of dying when CVD was present (HR 2 .2 for women and 1 .7 for men) . Diabetic men and women ≥50 years of age lived an average of 7 .5 and 8 .2 years less than their nondiabetic equivalents . The differences in life expec-tancy free of CVD were 7 .8 and 8 .4 years, respectively .25
●● Analysis of data from NHANES 1971–2000 found that men with DM experienced a 43% relative reduction in the age-adjusted mortality rate, which was similar to that of nondiabetic men . Among women with DM, however, mor-tality rates did not decrease, and the difference in mortality rates between diabetic and nondiabetic women doubled .26
●● During 1979 to 2004, DM death rates for black youths 1 to 19 years of age were approximately twice those for white youths . During 2003 to 2004, the annual average DM death rate per 1 million youths was 2 .46 for black youths and 0 .91 for white youths .27
●● Analysis of data from the FHS from 1950 to 2005 found reductions in all-cause and CVD mortality among men and women with and without DM . However, all-cause and CVD mortality rates among individuals with DM remain ≈2-fold higher than for individuals without DM .28
●● According to NHIS data from 1997 to 2006, the rate of CVD death among adults with DM decreased by 40% (95% CI, 23%–54%) . Similarly, all-cause mortality decreased by
23% (95% CI, 10%–35%) . Compared with adults without DM, the CVD mortality rate decreased by 60% and the all-cause mortality rate decreased by 44% .29
●● Among 11 927 participants with DM who were part of the Translating Research into Action for Diabetes study, DM was recorded on 41% of the death certificates as the under-lying cause of death for slightly more than one tenth (13%) . It was noted that DM was more likely to be reported as a cause of death among individuals who died of CVD . These findings underscore that underreporting of DM exists on death certificates .30
Awareness(See Chart 10-4 .)
●● Analysis of NHANES/NCHS data from 1988–1994 to 2005–2006 in adults ≥20 years of age showed that 40% of those with DM did not know they had it .11 Although the prevalence of diagnosed DM has increased significantly over the past decade, the prevalence of undiagnosed DM and impaired fasting glucose has remained relatively sta-ble . Minority groups remain disproportionately affected .31
●● Analysis of NHANES/NCHS data collected during 2005–2008 indicated that the prevalence of DM was 8 .2% among people ≥20 years of age . Prevalence of DM was defined as people who were told by a physician or other health professional that they have DM . Of the estimated 18 .3 million adults with DM, 73 .3% were told they had DM or were undergoing treatment, and 26 .7% (5 .7 mil-lion) were unaware of the diagnosis . Of 7 .9 million people being treated (37 .3% of the diabetic population), one third (2 .6 million) had their DM under control (ie, they were undergoing treatment and had fasting plasma glucose <126 mg/dL), and 25 .0% (5 .3 million) were being treated but did not have their DM under control (fasting plasma glucose ≥126 mg/dL) . An estimated 13 .3 million individuals with DM are not treated . The untreated and unaware popula-tion (5 .6 million) was 26 .7% of the diabetic population (NHANES 2003–2006, NHLBI tabulation) .
Aftermath
●● Although the exact date of DM onset can be difficult to determine, increasing duration of DM diagnosis is asso-ciated with increasing CVD risk . Longitudinal data from FHS suggest that the risk factor–adjusted RR of CHD is 1 .38 (95% CI, 0 .99–1 .92) times higher and the risk for CHD death is 1 .86 (95% CI, 1 .17–2 .93) times higher for each 10-year increase in duration of DM .32
●● On the basis of data from the NCHS/NHIS, 1997–200533
—The estimated number of people ≥35 years of age with DM with a self-reported cardiovascular condition increased 36%, from 4 .2 million in 1997 to 5 .7 million in 2005; however, the age-adjusted prevalence of self-reported CVD conditions among people with diagnosed DM who were ≥35 years of age decreased 11 .2%, from 36 .6% in 1997 to 32 .5% in 2005 .
—Age-adjusted CVD prevalence was higher among men than women, among whites than blacks, and among non-Hispanics than Hispanics . Among women, the age-adjusted prevalence decreased by 11 .2%; among men, it
by guest on December 16, 2013http://circ.ahajournals.org/Downloaded from

e90 Circulation January 1/8, 2013
did not decrease significantly . Among blacks, the age-adjusted prevalence of self-reported CVD decreased by 25 .3%; among whites, no significant decrease occurred; among non-Hispanics, the rate decreased by 12% . No clear trends were detected among Hispanics . If the total number of people with DM and self-reported CVD increased over this period but proportions with self-reported CVD declined, the data suggest that the mean age at which people have been diagnosed is decreasing, or the higher CVD mortality rate among older diabetic individuals is removing them from ability to self-report CVD . These and other data show a consistent increase over time in the United States of the number of people with DM and CVD .
●● Data from FHS show that despite improvements in CVD morbidity and mortality, DM continues to be associated with incremental CVD risk . Participants 45 to 64 years of age from the FHS original and offspring cohorts who attended examinations in 1950 to 1966 (“earlier” time period) and 1977 to 1995 (“later” time period) were followed up for incident MI, CHD death, and stroke . Among participants with DM, the age- and sex-adjusted CVD incidence rate was 286 .4 per 10 000 person-years in the earlier period and 146 .9 per 10 000 person-years in the later period, a 35 .4% decline . HRs for DM as a predictor of incident CVD were not significantly different in the earlier (risk factor–adjusted HR, 2 .68; 95% CI, 1 .88–3 .82) versus later (HR, 1 .96; 95% CI, 1 .44–2 .66) period .34 Thus, although there was a 50% reduction in the rate of incident CVD events among adults with DM, the absolute risk of CVD remained 2-fold greater than among people without DM .34
—Data from these earlier and later time periods in FHS also suggest that the increasing prevalence of DM is leading to an increasing rate of CVD, resulting in part from CVD risk factors that commonly accompany DM . The age- and sex-adjusted HR for DM as a CVD risk factor was 3 .0 in the earlier time period and 2 .5 in the later time period . Because the prevalence of DM has increased over time, the population attributable risk (PAR) for DM as a CVD risk factor increased from 5 .4% in the earlier time period to 8 .7% in the later time period (attributable risk ratio, 1 .62; P=0 .04) . Adjustment for CVD risk factors (age, sex, hypertension, current smok-ing, high cholesterol, and obesity) weakened this attrib-utable risk ratio to 1 .5 (P=0 .12) .35
—Other data from FHS show that over a 30-year period, CVD among women with DM was 54 .8% among nor-mal-weight women but 78 .8% among obese women . Among normal-weight men with DM, the lifetime risk of CVD was 78 .6%, whereas it was 86 .9% among obese men .36
●● DM increases the risk of stroke, with the RR ranging from 1 .8- to 6-fold increased risk .32,37
—DM is associated with increased ischemic stroke inci-dence at all ages, with the incremental risk associated
with DM being most prominent before 55 years of age in blacks and before 65 years of age in whites .37
—Ischemic stroke patients with DM are younger, more likely to be black, and more likely to have hyperten-sion, prior MI, and high cholesterol than nondiabetic patients .37
●● Data from the ARIC study of the NHLBI found that the magnitude of incremental CHD risk associated with DM was smaller in blacks than in whites .38
●● A subgroup analysis was conducted of patients with DM enrolled in randomized clinical trials that evaluated acute coronary syndrome (ACS) therapies . The data included 62 036 patients from Thrombolysis in Myocardial Infarc-tion studies (46 577 with STEMI and 15 459 with unsta-ble angina [UA]/non–ST-segment–elevation myocardial infarction [NSTEMI]) . Of these, 17 .1% had DM . Modeling showed that mortality at 30 days was significantly higher among patients with DM than among those without DM who presented with UA/NSTEMI (2 .1% versus 1 .1%; P≤0 .001) and STEMI (8 .5% versus 5 .4%; P=0 .001), with adjusted risks for 30-day mortality in DM versus no DM of 1 .78 for UA/NSTEMI (95% CI, 1 .24–2 .56) and 1 .40 (95% CI, 1 .24–1 .57) for STEMI . DM was also associated with significantly higher mortality 1 year after UA/NSTEMI or STEMI . By 1 year after ACS, patients with DM present-ing with UA/NSTEMI had a risk of death that approached that of patients without DM presenting with STEMI (7 .2% versus 8 .1%) .39
●● Other studies show that the increased prevalence of DM is being followed by an increasing prevalence of CVD mor-bidity and mortality . New York City death certificate data for 1989 to 1991 and 1999 to 2001 and hospital discharge data for 1988 to 2002 show increases in all-cause and cause-specific mortality between 1990 and 2000, as well as in annual hospitalization rates for DM and its complications among patients hospitalized with AMI and/or DM . During this decade, all-cause and cause-specific mortality rates declined, although not for patients with DM; rates increased 61% and 52% for diabetic men and women, respectively, as did hospitalization rates for DM and its complications . The percentage of all AMIs occurring in patients with DM increased from 21% to 36%, and the absolute number more than doubled, from 2951 to 6048 . Although hospital days for AMI fell overall, for those with DM, they increased 51% (from 34 188 to 51 566) . These data suggest that increases in DM rates threaten the long-established nationwide trend toward reduced coronary artery events .40
●● In an analysis of provincial health claims data for adults living in Ontario, Canada, between 1992 and 2000, the rate of patients admitted for AMI and stroke decreased to a greater extent in the diabetic than the nondiabetic population (AMI, −15 .1% versus −9 .1%, P=0 .0001; stroke, −24 .2% versus −19 .4%, P=0 .0001) . Diabetic patients experienced reductions in case fatality rates related to AMI and stroke similar to those without DM (−44 .1% versus −33 .2%, P=0 .1; −17 .1% versus −16 .6%, P=0 .9, respectively) and similarly comparable decreases in all-cause mortality . Over the same period, the number of DM cases increased by 165%, which translates to a marked increase in the proportion of CVD events occurring among patients with
by guest on December 16, 2013http://circ.ahajournals.org/Downloaded from

Heart Disease and Stroke Statistics—2013 Update: Chapter 10 e91
DM: AMI, 44 .6%; stroke, 26 .1%; AMI deaths, 17 .2%; and stroke deaths, 13 .2% .41
●● In the same data set, the transition to a high-risk category (an event rate equivalent to a 10-year risk of 20% or an event rate equivalent to that associated with previous MI) occurred at a younger age for men and women with DM than for those without DM (mean difference 14 .6 years) . For the outcome of AMI, stroke, or death resulting from any cause, diabetic men and women entered the high-risk category at 47 .9 and 54 .3 years of age, respectively . The data suggest that DM confers a risk equivalent to aging 15 years . In North America, diverse data show lower rates of CVD among diabetic people, but as the prevalence of DM has increased, so has the absolute burden of CVD, espe-cially among middle-aged and older individuals .42
●● DM accounted for 44% of the new cases of end-stage renal disease (ESRD) in 2007 . According to data from the US Renal Data System and BRFSS from 1996 to 2007, the incidence rate of ESRD attributed to DM decreased from 304 .5 per 100 000 to 199 .1 per 100 000 .43
●● According to NHANES data, the prevalence of diabetic kidney disease has increased from 2 .2% in NHANES III to 3 .3% in NHANES 2005–2008 . These increases were observed in direct proportion to increases in DM .44
●● HbA1c
levels ≥6 .5% can be used to diagnose DM .45 In the population-based ARIC study, HbA
1c levels ≥6 .5% had a
14-year follow-up, multivariable-adjusted HR of 16 .5 (95% CI, 14 .2–19 .1) for diagnosed DM and 1 .95 (95% CI, 1 .53–2 .48) for CHD relative to those with HbA
1c <5 .0% .46
●● According to data from the ARIC study and NHANES III, the sensitivity and specificity for diagnosing DM (com-pared with a single fasting glucose measurement of ≥126 mg/dL) were 47% and 98%, respectively .
Risk Factors
●● DM, especially type 2 DM, is associated with clustered risk factors for CHD, with a prevalence of 75% to 85% for hypertension among adults with DM, 70% to 80% for elevated LDL, and 60% to 70% for obesity .47
●● Aggressive treatment of hypertension is recommended for adults with DM to prevent cardiovascular complications . Between NHANES III (1984–1992) and NHANES 1999–2004, the proportion of patients with DM whose BP was treated increased from 76 .5% to 87 .8%, and the proportion whose BP was controlled nearly doubled (15 .9% to 29 .6%) .48
●● Aggressive treatment of hypercholesterolemia is recom-mended for adults with DM, with the cornerstone of treat-ment being statin therapy, which is recommended for all patients with DM >40 years of age independent of baseline cholesterol, with targeted LDL cholesterol <100 mg/dL and optimally <70 mg/dL .49
●● CHD risk factors among patients with DM remain subopti-mally treated, although improvements have been observed over the past decade . Between 1999 and 2008, in up to 2623 adult participants with DM, data from NHANES showed that improvements were observed for the achieved targets for control of HbA
1c (from 37 .0% to 55 .2%), BP
(from 35 .2% to 51 .0%), and LDL cholesterol (from 32 .5% to 52 .9%) .50
●● Data from the 2004 National Healthcare Disparities Report (Agency for Healthcare Research and Quality, US
Department of Health and Human Services) found that only approximately one third of adults with DM received all 5 interventions to reduce risk factors recommended for comprehensive DM care in 2001 . The proportion receiving all 5 interventions was lower among blacks than whites and among Hispanics than non-Hispanic whites .51
—In multivariable models that controlled for age, sex, income, education, insurance, and residence location, blacks were 38% less likely and Hispanics were 33% less likely than their respective comparison groups to receive all recommended risk factor interventions in 2001 .51
●● In 1 large academic medical center, outpatients with type 2 DM were observed during an 18-month period for propor-tions of patients who had HbA
1c levels, BP, or total choles-
terol levels measured; who had been prescribed any drug therapy if HbA
1c levels, SBP, or LDL cholesterol levels
exceeded recommended treatment goals; and who had been prescribed greater-than-starting-dose therapy if these values were above treatment goals . Patients were less likely to have cholesterol levels measured (76%) than HbA
1c levels (92%)
or BP (99%; P<0 .0001 for either comparison) . The propor-tion of patients who received any drug therapy was greater for above-goal HbA
1c (92%) than for above-goal SBP (78%)
or LDL cholesterol (38%; P<0 .0001 for each comparison) . Similarly, patients whose HbA
1c levels were above the treat-
ment goal (80%) were more likely to receive greater-than-starting-dose therapy than were those who had above-goal SBP (62%) and LDL cholesterol levels (13%; P<0 .0001) .52
—Data from the same academic medical center also showed that CVD risk factors among women with DM were managed less aggressively than among men with DM . Women were less likely than men to have HbA
1c
<7% (without CHD: adjusted OR for women ver-sus men 0 .84, P=0 .005; with CHD: 0 .63, P<0 .0001) . Women without CHD were less likely than men to be treated with lipid-lowering medication (0 .82; P=0 .01) or, when treated, to have LDL cholesterol levels <100 mg/dL (0 .75; P=0 .004) and were less likely than men to be prescribed aspirin (0 .63; P<0 .0001) . Women with DM and CHD were less likely than men to be prescribed aspirin (0 .70, P<0 .0001) and, when treated for hyper-tension or hyperlipidemia, were less likely to have BP levels <130/80 mm Hg (0 .75; P<0 .0001) or LDL choles-terol levels <100 mg/dL (0 .80; P=0 .006) .53
●● Analysis of data from the CHS of the NHLBI found that lifestyle risk factors, including PA level, dietary hab-its, smoking habits, alcohol use, and adiposity measures, assessed late in life, were each independently associated with risk of new-onset DM . Participants whose PA level and dietary, smoking, and alcohol habits were all in the low-risk group had an 82% lower incidence of DM than all other participants . When absence of adiposity was added to the other 4 low-risk lifestyle factors, incidence of DM was 89% lower .54
●● According to 2007 data from the BRFSS, only 25% of adults with DM achieved recommended levels of total PA based on the 2007 American Diabetes Association guidelines .55
by guest on December 16, 2013http://circ.ahajournals.org/Downloaded from
e92 Circulation January 1/8, 2013
Hospitalizations(See Table 10-1 .)
Youths
●● Nationwide Inpatient Sample data from 1993 to 2004 were analyzed for individuals 0 to 29 years of age with a diag-nosis of DM . Rates of hospitalizations increased by 38% . Hospitalization rates were higher for females (42%) than for males (29%) . Inflation-adjusted total charges for DM hospitalizations increased 130%, from $1 .05 billion in 1993 to $2 .42 billion in 2004 .56
Adults
●● According to NHDS data reported by the CDC in an analy-sis of data from 2009, DM was a listed diagnosis in ≈15% of US adult hospital discharges, among which circula-tory diseases was the most common first-listed diagnosis (26 .2%; 1 .4 million discharges) and DM the second most common (12 .0%; 655 000 discharges) .57
Hypoglycemia
●● Hypoglycemia is a common side effect of DM treatment, typically defined as a blood glucose level <50 mg/dL; severe hypoglycemia is additionally defined as patients needing assistance to treat themselves .
●● In the ADVANCE (Action in Diabetes and Vascular Dis-ease: Preterax and Diamicron Modified Release Controlled Evaluation) trial, 2 .1% of patients had an episode of severe hypoglycemia . Severe hypoglycemia was associated with an increased risk of major macrovascular events (HR, 2 .88; 95% CI, 2 .01–4 .12), cardiovascular death (HR, 2 .68; 95% CI, 1 .72–4 .19), and all-cause death (HR, 2 .69; 95% CI, 1 .97–3 .67), including nonvascular outcomes . The lack of specificity of hypoglycemia with vascular outcomes sug-gests that it might be a marker for susceptibility . Risk fac-tors for hypoglycemia included older age, DM duration, worse renal function, lower BMI, lower cognitive function, multiple glucose-lowering medications, and randomization to the intensive glucose control arm .58
●● According to data from the 2004 to 2008 MarketScan data-base of type 2 DM, which consisted of 536 581 individuals, the incidence rate of hypoglycemia was 153 .8 per 10 000 person-years and was highest in adults aged 18 to 34 years (218 .8 per 10 000 person-years) .59
●● According to data from 2956 adults ≥55 years of age from the ACCORD (Action to Control Cardiovascular Risk in Diabetes) trial, poor cognitive function, defined as a 5-point poorer baseline score on the Digit Symbol Substitution Test, was associated with a 13% increased risk of severe hypoglycemia that required medical assistance .60
Cost(See Table 10-1 .)
●● In 2007, the direct ($116 billion) and indirect ($58 billion) cost attributable to DM was $174 billion .3 These estimates include not just DM as a primary diagnosis but also long-term complications that are attributed to DM .61
●● After adjustment for age and sex, medical costs for patients with DM were 2 .3 times higher than for people without DM .3
●● A study of data from NHANES 2003–2006, Ingenix Research Data Mart, 2003–2005 NAMCS, the 2003–2005 NHAMCS, the 2004–2005 Nationwide Inpatient Sample, and the 2003–2005 MEPS found that the estimated eco-nomic cost of undiagnosed DM in 2007 was $18 billion, including medical costs of $11 billion and indirect costs of $7 billion .62
●● According to 2003–2005 MEPS data (household compo-nent data), reductions in DM and hypertension of 5% could save ≈9 billion dollars annually in the short-term . Longer term, savings could total nearly $25 billion .63
●● When the 2007 MarketScan database was used to assess costs associated with youths who have DM, mean annual costs per person with DM were $9061 compared with $1468 for those without DM; 43% of this cost was for pre-scription drugs . For type 1 compared with type 2 DM, costs were $9333 versus $5683, respectively .64
●● Using the insurance claims and MarketScan data from 7556 youths <19 years of age with insulin-treated DM, costs for youths with hypoglycemia were $12 850 compared with $8970 for youths without hypoglycemia . For diabetic keto-acidosis, costs were $14 236 for youths with versus $8398 for youths without diabetic ketoacidosis .65
●● The cost of hypoglycemia, according to data from 536 581 individuals with type 2 DM from the 2004–2008 Mar-ketScan database, was $52 223 675, which accounted for 1 .0% of inpatient costs, 2 .7% of ED costs, and 0 .3% of out-patient costs . This resulted in a mean cost of $17 564 for an inpatient admission, $1387 for an ED visit, and $394 for an outpatient visit .59
Type 1 DM
●● Type 1 DM constitutes 5% to 10% of DM in the United States .66
●● The Colorado IDDM (insulin-dependent DM) Study Reg-istry (1978-1988) and SEARCH for Diabetes in Youth (2002-2004) demonstrated an increasing incidence of type 1 DM among Colorado youths ≤17 years of age, with a 2 .3% (95% CI, 1 .6%–3 .1%) increase per year over the past 26 years .67
●● Among youths with type 1 DM, the prevalence of over-weight is 22 .1% and the prevalence of obesity is 12 .6% .6
●● A long-term study of patients with type 1 DM that began in 1966 showed that over 30 years of follow-up, overall risk of mortality associated with type 1 DM was 7 times greater than that of the general population . Females had a 13 .2-fold incremental mortality risk compared with a 5 .0-fold increased risk in males . During the course of study, the incremental mortality risk associated with type 1 DM declined from 9 .3 to 5 .6 times that of nondiabetic control subjects .68
●● According to 30-year mortality data from Allegheny County, PA, those with type 1 DM have a mortality rate 5 .6 times higher than the general population .69
●● The leading cause of death among patients with type 1 DM is CVD, which accounted for 22% of deaths among those in the Allegheny County, PA, type 1 DM registry, followed by renal (20%) and infectious (18%) causes .70
by guest on December 16, 2013http://circ.ahajournals.org/Downloaded from
Heart Disease and Stroke Statistics—2013 Update: Chapter 10 e93
●● Long-term follow-up data from the Diabetes Control and Complications Trial/Epidemiology of Diabetes Interventions and Complications Study Research Group showed that intensive versus conventional treatment in the Diabetes Control and Complications Trial was associated with a 42% reduced risk of CVD (P=0 .02) and a 57% reduced risk of the composite end point (P=0 .02; included nonfatal MI, stroke, and CVD death) .71
●● Observational data from the Swedish National Diabetes Register showed that most CVD risk factors were more adverse among patients with HbA
1c between 8 .0% and
11 .9% than among those with HbA1c
between 5 .0% and 7 .9% . Per 1% unit increase in HbA
1c, the HR of fatal and
nonfatal CHD was 1 .30 in multivariable adjusted models and 1 .27 for fatal and nonfatal CVD . Among patients with HbA
1c 8 .0% to 11 .9% compared with those with HbA
1c
5 .0% to 7 .9%, the HR of fatal/nonfatal CHD was 1 .71 and the risk of fatal/nonfatal CVD was 1 .59 .72
●● Among 2787 patients from the EURODIAB Prospective Complications Study, age, waist-hip ratio, pulse pressure, non-HDL cholesterol, microalbuminuria, and peripheral and autonomic neuropathy were risk factors for all-cause, CVD, and non-CVD mortality .61
●● Among 3610 older patients (>60 years of age) with type 1 DM, the risk of severe hypoglycemia was twice as high as for those <60 years of age (40 .1 versus 24 .3 per 100 patient-years) .73
References 1 . Liese AD, D’Agostino RB Jr, Hamman RF, Kilgo PD, Lawrence JM, Liu
LL, Loots B, Linder B, Marcovina S, Rodriguez B, Standiford D, Wil-liams DE; SEARCH for Diabetes in Youth Study Group . The burden of di-abetes mellitus among US youth: prevalence estimates from the SEARCH for Diabetes in Youth Study . Pediatrics . 2006;118:1510–1518 .
2 . Liu LL, Yi JP, Beyer J, Mayer-Davis EJ, Dolan LM, Dabelea DM, Law-rence JM, Rodriguez BL, Marcovina SM, Waitzfelder BE, Fujimoto WY; SEARCH for Diabetes in Youth Study Group . Type 1 and type 2 diabetes in Asian and Pacific Islander U .S . youth: the SEARCH for Diabetes in Youth Study . Diabetes Care . 2009;32(suppl 2):S133–S140 .
3 . Centers for Disease Control and Prevention . National Diabetes Fact Sheet: National Estimates and General Information on Diabetes and Prediabetes in the United States, 2011. Atlanta, GA: US Department of Health and Human Services, Centers for Disease Control and Prevention; 2011 .
4 . Dabelea D, Bell RA, D’Agostino RB Jr, Imperatore G, Johansen JM, Linder B, Liu LL, Loots B, Marcovina S, Mayer-Davis EJ, Pettitt DJ, Wait-zfelder B; Writing Group for the SEARCH for Diabetes in Youth Study Group . Incidence of diabetes in youth in the United States [published cor-rection appears in JAMA . 2007;298:627] . JAMA . 2007;297:2716–2724 .
5 . Nguyen QM, Srinivasan SR, Xu JH, Chen W, Berenson GS . Changes in risk variables of metabolic syndrome since childhood in pre-diabetic and type 2 diabetic subjects: the Bogalusa Heart Study . Diabetes Care . 2008;31:2044–2049 .
6 . Liu LL, Lawrence JM, Davis C, Liese AD, Pettitt DJ, Pihoker C, Dabelea D, Hamman R, Waitzfelder B, Kahn HS; SEARCH for Diabetes in Youth Study Group . Prevalence of overweight and obesity in youth with diabe-tes in USA: the SEARCH for Diabetes in Youth study . Pediatr Diabetes . 2010;11:4–11 .
7 . May AL, Kuklina EV, Yoon PW . Prevalence of cardiovascular dis-ease risk factors among US adolescents, 1999-2008 . Pediatrics . 2012;129:1035–1041 .
8 . Copeland KC, Zeitler P, Geffner M, Guandalini C, Higgins J, Hirst K, Kaufman FR, Linder B, Marcovina S, McGuigan P, Pyle L, Tamborlane W, Willi S; TODAY Study Group . Characteristics of adolescents and youth with recent-onset type 2 diabetes: the TODAY cohort at baseline . J Clin Endocrinol Metab . 2011;96:159–167 .
9 . Zeitler P, Hirst K, Pyle L, Linder B, Copeland K, Arslanian S, Cuttler L, Nathan DM, Tollefsen S, Wilfley D, Kaufman F; TODAY Study Group . A
clinical trial to maintain glycemic control in youth with type 2 diabetes . N Engl J Med . 2012;366:2247–2256 .
10 . Waitzfelder B, Pihoker C, Klingensmith G, Case D, Anderson A, Bell RA, Lawrence JM, Mayer-Davis EJ, Imperatore G, Standiford D, Rodriguez BL, Dabelea D, Seid M; SEARCH for Diabetes in Youth Study Group . Adherence to guidelines for youths with diabetes mellitus . Pediatrics . 2011;128:531–538 .
11 . Cowie CC, Rust KF, Ford ES, Eberhardt MS, Byrd-Holt DD, Li C, Williams DE, Gregg EW, Bainbridge KE, Saydah SH, Geiss LS . Full accounting of diabetes and pre-diabetes in the U .S . population in 1988-1994 and 2005-2006 [published correction appears in Diabetes Care . 2011;34:2338] . Diabetes Care . 2009;32:287–294 .
12 . Barnes PM, Adams PF, Powell-Griner E . Health Characteristics of the Asian Adult Population: United States, 2004–2006. Advance Data From Vital and Health Statistics; No . 394 . Hyattsville, MD: National Center for Health Statistics; 2008 .
13 . Centers for Disease Control and Prevention . Behavioral Risk Factor Sur-veillance System: 2010 prevalence and trends data . Centers for Disease Control and Prevention Web site . http://apps .nccd .cdc .gov/brfss/index .asp . Accessed September 21, 2012 .
14 . Centers for Disease Control and Prevention (CDC) . Diagnosed diabetes among American Indians and Alaska Natives aged <35 years: United States, 1994–2004 . MMWR Morb Mortal Wkly Rep . 2006;55:1201–1203 .
15 . Narayan KM, Boyle JP, Geiss LS, Saaddine JB, Thompson TJ . Impact of recent increase in incidence on future diabetes burden: U .S ., 2005-2050 . Diabetes Care . 2006;29:2114–2116 .
16 . Lee JW, Brancati FL, Yeh HC . Trends in the prevalence of type 2 diabetes in Asians versus whites: results from the United States National Health Interview Survey, 1997-2008 . Diabetes Care . 2011;34:353–357 .
17 . Wild S, Roglic G, Green A, Sicree R, King H . Global prevalence of diabe-tes: estimates for the year 2000 and projections for 2030 . Diabetes Care . 2004;27:1047–1053 .
18 . Danaei G, Finucane MM, Lu Y, Singh GM, Cowan MJ, Paciorek CJ, Lin JK, Farzadfar F, Khang YH, Stevens GA, Rao M, Ali MK, Riley LM, Rob-inson CA, Ezzati M; Global Burden of Metabolic Risk Factors of Chronic Diseases Collaborating Group (Blood Glucose) . National, regional, and global trends in fasting plasma glucose and diabetes prevalence since 1980: systematic analysis of health examination surveys and epidemiolog-ical studies with 370 country-years and 2·7 million participants . Lancet . 2011;378:31–40 .
19 . Dabelea D, Pihoker C, Talton JW, D’Agostino RB Jr, Fujimoto W, Klin-gensmith GJ, Lawrence JM, Linder B, Marcovina SM, Mayer-Davis EJ, Imperatore G, Dolan LM; SEARCH for Diabetes in Youth Study . Etio-logical approach to characterization of diabetes type: the SEARCH for Diabetes in Youth Study . Diabetes Care . 2011;34:1628–1633 .
20 . Fox CS, Pencina MJ, Meigs JB, Vasan RS, Levitzky YS, D’Agostino RB Sr . Trends in the incidence of type 2 diabetes mellitus from the 1970s to the 1990s: the Framingham Heart Study . Circulation . 2006;113:2914–2918 .
21 . Nettleton JA, Steffen LM, Ni H, Liu K, Jacobs DR Jr . Dietary patterns and risk of incident type 2 diabetes in the Multi-Ethnic Study of Atherosclero-sis (MESA) . Diabetes Care . 2008;31:1777–1782 .
22 . Grøntved A, Hu FB . Television viewing and risk of type 2 diabetes, cardiovascular disease, and all-cause mortality: a meta-analysis . JAMA . 2011;305:2448–2455 .
23 . Centers for Disease Control and Prevention, National Center for Health Statistics . Compressed Mortality File 1999-2009 . CDC WONDER Online Database, compiled for Compressed Mortality File 1999–2009 Series 20, No . 20, 2012 . Underlying cause-of-death 1999–2009 . http://wonder .cdc .gov/mortSQl .html . Accessed August 20, 2012 .
24 . Seshasai SR, Kaptoge S, Thompson A, Di Angelantonio E, Gao P, Sarwar N, Whincup PH, Mukamal KJ, Gillum RF, Holme I, Njølstad I, Fletcher A, Nilsson P, Lewington S, Collins R, Gudnason V, Thompson SG, Sat-tar N, Selvin E, Hu FB, Danesh J; Emerging Risk Factors Collaboration . Diabetes mellitus, fasting glucose, and risk of cause-specific death [pub-lished correction appears in N Engl J Med . 2011;364:1281] . N Engl J Med . 2011;364:829–841 .
25 . Franco OH, Steyerberg EW, Hu FB, Mackenbach J, Nusselder W . As-sociations of diabetes mellitus with total life expectancy and life ex-pectancy with and without cardiovascular disease . Arch Intern Med . 2007;167:1145–1151 .
26 . Gregg EW, Gu Q, Cheng YJ, Narayan KM, Cowie CC . Mortality trends in men and women with diabetes, 1971 to 2000 . Ann Intern Med . 2007;147:149–155 .
by guest on December 16, 2013http://circ.ahajournals.org/Downloaded from

e94 Circulation January 1/8, 2013
27 . Centers for Disease Control and Prevention (CDC) . Racial disparities in diabetes mortality among persons aged 1–19 years--United States, 1979–2004 . MMWR Morb Mortal Wkly Rep . 2007;56:1184–1187 .
28 . Preis SR, Hwang SJ, Coady S, Pencina MJ, D’Agostino RB Sr, Savage PJ, Levy D, Fox CS . Trends in all-cause and cardiovascular disease mortality among women and men with and without diabetes mellitus in the Framingham Heart Study, 1950 to 2005 . Circulation . 2009;119:1728–1735 .
29 . Gregg EW, Cheng YJ, Saydah S, Cowie C, Garfield S, Geiss L, Barker L . Trends in death rates among U .S . adults with and without diabetes be-tween 1997 and 2006: findings from the National Health Interview Survey . Diabetes Care . 2012;35:1252–1257 .
30 . McEwen LN, Karter AJ, Curb JD, Marrero DG, Crosson JC, Herman WH . Temporal trends in recording of diabetes on death certificates: results from Translating Research Into Action for Diabetes (TRIAD) . Diabetes Care . 2011;34:1529–1533 .
31 . Cowie CC, Rust KF, Byrd-Holt DD, Eberhardt MS, Flegal KM, Engel-gau MM, Saydah SH, Williams DE, Geiss LS, Gregg EW . Prevalence of diabetes and impaired fasting glucose in adults in the U .S . population: National Health And Nutrition Examination Survey 1999-2002 . Diabetes Care . 2006;29:1263–1268 .
32 . Goldstein LB, Bushnell CD, Adams RJ, Appel LJ, Braun LT, Chaturvedi S, Creager MA, Culebras A, Eckel RH, Hart RG, Hinchey JA, Howard VJ, Jauch EC, Levine SR, Meschia JF, Moore WS, Nixon JV, Pearson TA; on behalf of the American Heart Association Stroke Council, Council on Cardiovascular Nursing, Council on Epidemiology and Prevention, Coun-cil for High Blood Pressure Research, Council on Peripheral Vascular Disease, and Interdisciplinary Council on Quality of Care and Outcomes Research . Guidelines for the primary prevention of stroke: a guideline for healthcare professionals from the American Heart Association/American Stroke Association [published correction appears in Stroke . 2011;42:e26] . Stroke . 2011;42:517–584 .
33 . Centers for Disease Control and Prevention (CDC) . Prevalence of self-reported cardiovascular disease among persons aged > or =35 years with diabetes: United States, 1997–2005 . MMWR Morb Mortal Wkly Rep . 2007;56:1129–1132 .
34 . Fox CS, Coady S, Sorlie PD, Levy D, Meigs JB, D’Agostino RB Sr, Wil-son PW, Savage PJ . Trends in cardiovascular complications of diabetes . JAMA . 2004;292:2495–2499 .
35 . Fox CS, Coady S, Sorlie PD, D’Agostino RB Sr, Pencina MJ, Vasan RS, Meigs JB, Levy D, Savage PJ . Increasing cardiovascular disease bur-den due to diabetes mellitus: the Framingham Heart Study . Circulation . 2007;115:1544–1550 .
36 . Fox CS, Pencina MJ, Wilson PW, Paynter NP, Vasan RS, D’Agostino RB Sr . Lifetime risk of cardiovascular disease among individuals with and without diabetes stratified by obesity status in the Framingham Heart Study . Diabetes Care . 2008;31:1582–1584 .
37 . Kissela BM, Khoury J, Kleindorfer D, Woo D, Schneider A, Alwell K, Miller R, Ewing I, Moomaw CJ, Szaflarski JP, Gebel J, Shukla R, Broderick JP . Epidemiology of ischemic stroke in patients with diabetes: the Greater Cincinnati/Northern Kentucky Stroke Study . Diabetes Care . 2005;28:355–359 .
38 . Jones DW, Chambless LE, Folsom AR, Heiss G, Hutchinson RG, Shar-rett AR, Szklo M, Taylor HA Jr . Risk factors for coronary heart disease in African Americans: the Atherosclerosis Risk in Communities Study, 1987-1997 . Arch Intern Med . 2002;162:2565–2571 .
39 . Donahoe SM, Stewart GC, McCabe CH, Mohanavelu S, Murphy SA, Cannon CP, Antman EM . Diabetes and mortality following acute coronary syndromes . JAMA . 2007;298:765–775 .
40 . Fang J, Alderman MH . Impact of the increasing burden of diabetes on acute myocardial infarction in New York City: 1990-2000 . Diabetes . 2006;55:768–773 .
41 . Booth GL, Kapral MK, Fung K, Tu JV . Recent trends in cardiovascular complications among men and women with and without diabetes . Diabe-tes Care . 2006;29:32–37 .
42 . Booth GL, Kapral MK, Fung K, Tu JV . Relation between age and cardio-vascular disease in men and women with diabetes compared with non-diabetic people: a population-based retrospective cohort study . Lancet . 2006;368:29–36 .
43 . Centers for Disease Control and Prevention (CDC) . Incidence of end-stage renal disease attributed to diabetes among persons with diagnosed diabetes: United States and Puerto Rico, 1996–2007 . MMWR Morb Mor-tal Wkly Rep. 2010;59:1361–1366 .
44 . de Boer IH, Rue TC, Hall YN, Heagerty PJ, Weiss NS, Himmelfarb J . Temporal trends in the prevalence of diabetic kidney disease in the United States . JAMA . 2011;305:2532–2539 .
45 . American Diabetes Association . Diagnosis and classification of diabetes mellitus [published correction appears in Diabetes Care . 2010;33:e57] . Diabetes Care . 2010;33(suppl 1):S62–S69 .
46 . Selvin E, Steffes MW, Zhu H, Matsushita K, Wagenknecht L, Pankow J, Coresh J, Brancati FL . Glycated hemoglobin, diabetes, and cardiovascular risk in nondiabetic adults . N Engl J Med . 2010;362:800–811 .
47 . Preis SR, Pencina MJ, Hwang SJ, D’Agostino RB Sr, Savage PJ, Levy D, Fox CS . Trends in cardiovascular disease risk factors in individuals with and without diabetes mellitus in the Framingham Heart Study . Circula-tion . 2009;120:212–220 .
48 . Suh DC, Kim CM, Choi IS, Plauschinat CA, Barone JA . Trends in blood pressure control and treatment among type 2 diabetes with comorbid hyper-tension in the United States: 1988-2004 . J Hypertens . 2009;27:1908–1916 .
49 . Grundy SM, Cleeman JI, Merz CN, Brewer HB Jr, Clark LT, Hunninghake DB, Pasternak RC, Smith SC Jr, Stone NJ; National Heart, Lung, and Blood Institute; American College of Cardiology Foundation; American Heart As-sociation . Implications of recent clinical trials for the National Cholesterol Education Program Adult Treatment Panel III guidelines [published correc-tion appears in Circulation . 2004;110:763] . Circulation . 2004;110:227–239 .
50 . Ford ES . Trends in the control of risk factors for cardiovascular disease among adults with diagnosed diabetes: findings from the National Health and Nutrition Examination Survey 1999-2008* . J Diabetes . 2011;3:337–347 .
51 . US Department of Health and Human Services, Agency for Healthcare Research and Quality . National Healthcare Disparities Report, 2004. Rockville, MD: Agency for Healthcare Research and Quality; 2004 . AHRQ publication No . 05- 0014 . http://www .ahrq .gov/qual/nhdr04/nhdr04 .htm . Accessed July 13, 2011 .
52 . Grant RW, Cagliero E, Murphy-Sheehy P, Singer DE, Nathan DM, Meigs JB . Comparison of hyperglycemia, hypertension, and hypercholesterolemia management in patients with type 2 diabetes . Am J Med . 2002;112:603–609 .
53 . Wexler DJ, Grant RW, Meigs JB, Nathan DM, Cagliero E . Sex disparities in treatment of cardiac risk factors in patients with type 2 diabetes . Diabe-tes Care . 2005;28:514–520 .
54 . Mozaffarian D, Kamineni A, Carnethon M, Djoussé L, Mukamal KJ, Sisco-vick D . Lifestyle risk factors and new-onset diabetes mellitus in older adults: the Cardiovascular Health Study . Arch Intern Med . 2009;169:798–807 .
55 . Zhao G, Ford ES, Li C, Balluz LS . Physical activity in U .S . older adults with diabetes mellitus: prevalence and correlates of meeting physical ac-tivity recommendations . J Am Geriatr Soc . 2011;59:132–137 .
56 . Lee JM, Okumura MJ, Freed GL, Menon RK, Davis MM . Trends in hos-pitalizations for diabetes among children and young adults: United States, 1993–2004 . Diabetes Care . 2007;30:3035–3039 .
57 . Centers for Disease Control and Prevention (CDC), National Center for Chronic Disease Prevention and Health Promotion, Division of Diabetes Translation . Distribution of first-listed diagnoses among hospital discharg-es with diabetes as any listed diagnosis, adults aged 18 years and older, United States, 2009 . http://www .cdc .gov/diabetes/statistics/hosp/adult-table1 .htm . Accessed July 18, 2012 .
58 . Zoungas S, Patel A, Chalmers J, de Galan BE, Li Q, Billot L, Woodward M, Ninomiya T, Neal B, MacMahon S, Grobbee DE, Kengne AP, Marre M, Heller S; ADVANCE Collaborative Group . Severe hypoglycemia and risks of vascular events and death . N Engl J Med . 2010;363:1410–1418 .
59 . Quilliam BJ, Simeone JC, Ozbay AB, Kogut SJ . The incidence and costs of hypoglycemia in type 2 diabetes . Am J Manag Care . 2011;17:673–680 .
60 . Punthakee Z, Miller ME, Launer LJ, Williamson JD, Lazar RM, Cuki-erman-Yaffee T, Seaquist ER, Ismail-Beigi F, Sullivan MD, Lovato LC, Bergenstal RM, Gerstein HC; ACCORD Group of Investigators; AC-CORD-MIND Investigators . Poor cognitive function and risk of severe hypoglycemia in type 2 diabetes: post hoc epidemiologic analysis of the ACCORD trial . Diabetes Care . 2012;35:787–793 .
61 . American Diabetes Association . Economic costs of diabetes in the U .S . in 2007 [published correction appears in Diabetes Care . 2008;31:1271] . Diabetes Care . 2008;31:596–615 .
62 . Zhang Y, Dall TM, Mann SE, Chen Y, Martin J, Moore V, Baldwin A, Re-idel VA, Quick WW . The economic costs of undiagnosed diabetes . Popul Health Manag . 2009;12:95–101 .
63 . Ormond BA, Spillman BC, Waidmann TA, Caswell KJ, Tereshchenko B . Potential national and state medical care savings from primary disease prevention . Am J Public Health . 2011;101:157–164 .
64 . Shrestha SS, Zhang P, Albright A, Imperatore G . Medical expenditures associated with diabetes among privately insured U .S . youth in 2007 . Dia-betes Care . 2011;34:1097–1101 .
65 . Shrestha SS, Zhang P, Barker L, Imperatore G . Medical expenditures as-sociated with diabetes acute complications in privately insured U .S . youth . Diabetes Care . 2010;33:2617–2622 .
by guest on December 16, 2013http://circ.ahajournals.org/Downloaded from

Heart Disease and Stroke Statistics—2013 Update: Chapter 10 e95
66 . Redberg RF, Greenland P, Fuster V, Pyörälä K, Blair SN, Folsom AR, Newman AB, O’Leary DH, Orchard TJ, Psaty B, Schwartz JS, Starke R, Wilson PW . Prevention Conference VI: Diabetes and Cardiovascular Dis-ease: Writing Group III: risk assessment in persons with diabetes . Circula-tion . 2002;105:e144–e152 .
67 . Vehik K, Hamman RF, Lezotte D, Norris JM, Klingensmith G, Bloch C, Rewers M, Dabelea D . Increasing incidence of type 1 diabetes in 0- to 17-year-old Colorado youth . Diabetes Care . 2007;30:503–509 .
68 . Dorman JS, Laporte RE, Kuller LH, Cruickshanks KJ, Orchard TJ, Wa-gener DK, Becker DJ, Cavender DE, Drash AL . The Pittsburgh insulin-dependent diabetes mellitus (IDDM) morbidity and mortality study: mortality results . Diabetes . 1984;33:271–276 .
69 . Secrest AM, Becker DJ, Kelsey SF, LaPorte RE, Orchard TJ . All-cause mortality trends in a large population-based cohort with long-standing childhood-onset type 1 diabetes: the Allegheny County type 1 diabetes registry . Diabetes Care . 2010;33:2573–2579 .
70 . Secrest AM, Becker DJ, Kelsey SF, Laporte RE, Orchard TJ . Cause-spe-cific mortality trends in a large population-based cohort with long-stand-ing childhood-onset type 1 diabetes . Diabetes . 2010;59:3216–3222 .
71 . Nathan DM, Cleary PA, Backlund JY, Genuth SM, Lachin JM, Orchard TJ, Raskin P, Zinman B; Diabetes Control and Complications Trial/Epidemi-ology of Diabetes Interventions and Complications (DCCT/EDIC) Study Research Group . Intensive diabetes treatment and cardiovascular disease in patients with type 1 diabetes . N Engl J Med . 2005;353:2643–2653 .
72 . Eeg-Olofsson K, Cederholm J, Nilsson PM, Zethelius B, Svensson AM, Gudbjörnsdóttir S, Eliasson B . Glycemic control and cardiovascular disease in 7,454 patients with type 1 diabetes: an observational study from the Swed-ish National Diabetes Register (NDR) . Diabetes Care . 2010;33:1640–1646 .
73 . Schütt M, Fach EM, Seufert J, Kerner W, Lang W, Zeyfang A, Welp R, Holl RW; DPV Initiative and the German BMBF Competence Network Diabetes Mellitus . Multiple complications and frequent severe hypogly-caemia in “elderly” and “old” patients with type 1 diabetes . Diabet Med . 2012;29:e176–e179 .
Table 10-1. Diabetes Mellitus
Population Group
Prevalence of Physician-Diagnosed DM, 2010: Age ≥20 y
Prevalence of Undiagnosed DM, 2010: Age ≥20 y
Prevalence of Prediabetes, 2010:
Age ≥20 y
Incidence of Diagnosed DM:
Age ≥20 y†Mortality (DM), 2009: All Ages‡
Hospital Discharges, 2010:
All Ages Cost, 2007†
Both sexes* 19 700 000 (8.3%) 8 200 000 (3.5%) 87 300 000 (38.2%) 1 900 000 68 705 630 000 $174 Billion
Males* 9 600 000 (8.7%) 5 300 000 (4.7%) 50 700 000 (46.0%) … 35 054 311 000 …
Females* 10 100 000 (7.9%) 2 900 000 (2.3%) 33 600 000 (30.5%) … 33 651 319 000 …
NH white males, % 7.7 4.5 47.7 … 28 205 … …
NH white females, % 6.2 1.8 30.0 … 25 908 … …
NH black males, % 13.5 4.8 35.7 … 5488 … …
NH black females, % 15.4 2.9 29.0 … 6472 … …
Mexican-American males, % 11.4 6.6 47.0 … … … …
Mexican-American females, % 12.0 4.7 31.9 … … … …
Asian … … … … 1846 … …
American Indian/Alaska Native … … … … 786 … …
DM indicates diabetes mellitus; NH, non-Hispanic. Ellipses (…) indicate data not available.Undiagnosed DM is defined as those whose fasting glucose is ≥126 mg/dL but who did not report being told by a healthcare provider that they had DM.
Prediabetes is a fasting blood glucose of 100 to <126 mg/dL (impaired fasting glucose); prediabetes includes impaired glucose tolerance.*These percentages represent the portion of total DM mortality that is for males vs females.†Centers for Disease Control and Prevention, National Diabetes Fact Sheet, 2011.3
‡Mortality data include Hispanics.Sources: Prevalence: Prevalence of diagnosed and undiagnosed diabetes: National Health and Nutrition Examination Survey 2007–2010, National Center for Health
Statistics (NCHS), and National Heart, Lung, and Blood Institute. Percentages for racial/ethnic groups are age-adjusted for Americans ≥20 years of age. Age-specific percentages are extrapolations to the 2010 US population estimates. Mortality: Centers for Disease Control and Prevention/NCHS, 2009 Mortality Multiple Cause–US, Version July 19, 2012. These data represent underlying cause of death only. Hospital discharges: National Hospital Discharge Survey, NCHS; data include those inpatients discharged alive, dead, or status unknown.
by guest on December 16, 2013http://circ.ahajournals.org/Downloaded from

e96 Circulation January 1/8, 2013
7.7
6.2
13.5
15.4
11.412.0
0
2
4
6
8
10
12
14
16
18
Male Female
Per
cen
t o
f P
op
ula
tio
n
NH White NH Black Mexican American
Chart 10-1. Age-adjusted prevalence of physician-diagnosed diabetes mellitus in adults ≥20 years of age by race/ethnicity and sex (National Health and Nutrition Examination Survey: 2007–2010). NH indicates non-Hispanic. Source: National Center for Health Statistics and National Heart, Lung, and Blood Institute.
10.2
16.1
13.2
7.0
14.2
8.8
5.9
13.9
10.3
0
2
4
6
8
10
12
14
16
18
NH Whites NH Blacks Mexican Americans
Per
cen
t o
f P
op
ula
tio
n
Less than high school High school More than high school
Chart 10-2. Age-adjusted prevalence of physician-diagnosed type 2 diabetes mellitus in adults ≥20 years of age by race/ethnicity and years of education (National Health and Nutrition Examination Survey: 2007–2010). NH indicates non-Hispanic. Source: National Center for Health Statistics and National Heart, Lung, and Blood Institute.
by guest on December 16, 2013http://circ.ahajournals.org/Downloaded from
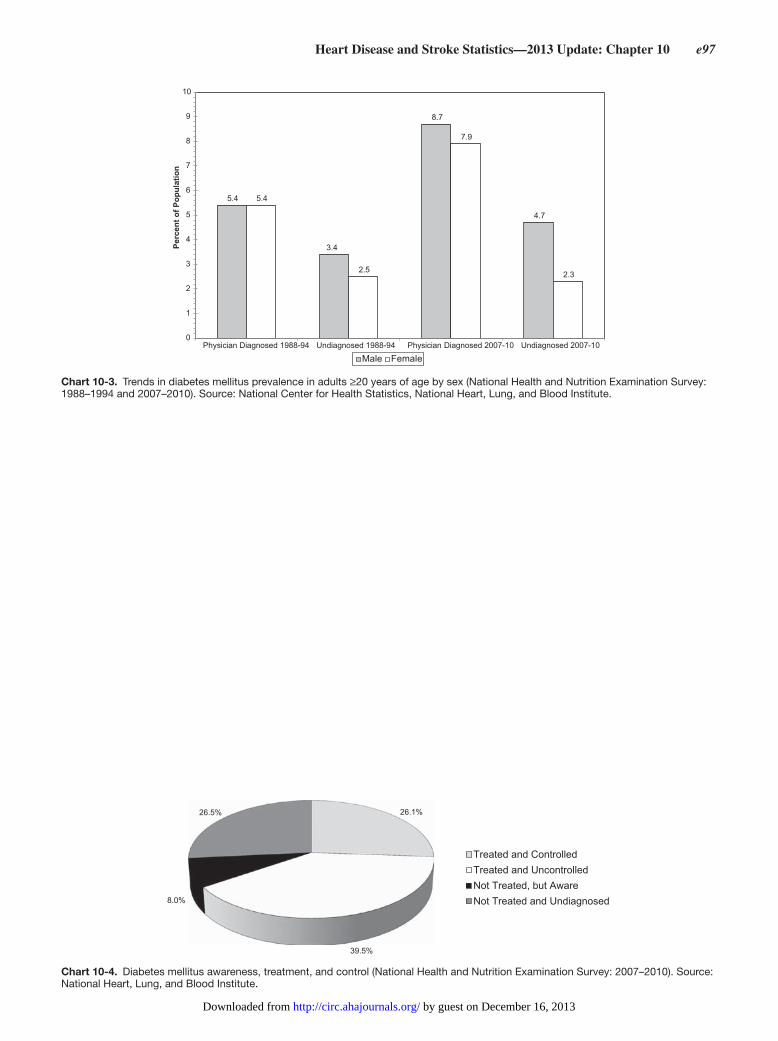
Heart Disease and Stroke Statistics—2013 Update: Chapter 10 e97
5.4
3.4
8.7
4.7
5.4
2.5
7.9
2.3
0
1
2
3
4
5
6
7
8
9
10
Physician Diagnosed 1988-94 Undiagnosed 1988-94 Physician Diagnosed 2007-10 Undiagnosed 2007-10
Perc
ent o
f Pop
ulat
ion
Male Female
Chart 10-3. Trends in diabetes mellitus prevalence in adults ≥20 years of age by sex (National Health and Nutrition Examination Survey: 1988–1994 and 2007–2010). Source: National Center for Health Statistics, National Heart, Lung, and Blood Institute.
26.1%
39.5%
8.0%
26.5%
Treated and ControlledTreated and UncontrolledNot Treated, but AwareNot Treated and Undiagnosed
Chart 10-4. Diabetes mellitus awareness, treatment, and control (National Health and Nutrition Examination Survey: 2007–2010). Source: National Heart, Lung, and Blood Institute.
by guest on December 16, 2013http://circ.ahajournals.org/Downloaded from

e98 Circulation January 1/8, 2013
11. Metabolic Syndrome
●● Metabolic syndrome refers to a cluster of risk factors for CVD and type 2 DM . Although several different defini-tions for metabolic syndrome have been proposed, the International Diabetes Federation, NHLBI, AHA, and oth-ers recently proposed a harmonized definition for meta-bolic syndrome .1 By this definition, metabolic syndrome is diagnosed when ≥3 of the following 5 risk factors are present (most but not all people with DM will be classified as having metabolic syndrome by this definition because they will have at least 2 other factors besides the glucose criterion; many will prefer to separate those with DM into a separate group for risk stratification or treatment purposes):
—Fasting plasma glucose ≥100 mg/dL or undergoing drug treatment for elevated glucose
—HDL cholesterol <40 mg/dL in men or <50 mg/dL in women or undergoing drug treatment for reduced HDL cholesterol .
—Triglycerides ≥150 mg/dL or undergoing drug treatment for elevated triglycerides
—Waist circumference ≥102 cm in men or ≥88 cm in women in the United States .
—BP ≥130 mm Hg systolic or ≥85 mm Hg diastolic or undergoing drug treatment for hypertension or antihy-pertensive drug treatment in a patient with a history of hypertension .
●● Identification of metabolic syndrome represents a call to action for the healthcare provider and patient to address the underlying lifestyle-related risk factors, including abdomi-nal obesity, physical inactivity, and atherogenic diet, as well as clinical management to address the characteristic atherogenic dyslipidemia, elevated BP, elevated glucose, and prothrombotic state that are common to people with metabolic syndrome . A multidisciplinary team of health-care professionals is desirable to adequately address these multiple issues in patients with the metabolic syndrome .2
AdultsThe following estimates include many of those who have DM, in addition to those with metabolic syndrome without DM .
●● Prevalence of metabolic syndrome varies by the definition used, with definitions such as that from the International Diabetes Federation that suggest lower thresholds for defining central obesity in European whites, Asians, and Hispanics resulting in higher prevalence estimates .3
●● On the basis of NHANES 2003–2006 data and National Cholesterol Education Program/Adult Treatment Panel III guidelines, ≈34% of adults ≥20 years of age met the criteria for metabolic syndrome .4
●● Also based on NHANES 2003–2006 data4
—The age-adjusted prevalence was 35 .1% for men and 32 .6% for women .
—Among men, the age-specific prevalence ranged from 20 .3% among people 20 to 39 years of age to 40 .8% for people 40 to 59 years of age and 51 .5% for people ≥60 years of age . Among women, the age-specific preva-lence ranged from 15 .6% among people 20 to 39 years of age to 37 .2% for people 40 to 59 years of age and 54 .4% for those ≥60 years of age .
—The age-adjusted prevalences of people with metabolic syndrome were 37 .2%, 25 .3%, and 33 .2% for non-His-panic white, non-Hispanic black, and Mexican Ameri-can men, respectively . Among women, the percentages were 31 .5%, 38 .8%, and 40 .6%, respectively .
—The age-adjusted prevalence was ≈53% higher among non-Hispanic black women than among non-Hispanic black men and ≈22% higher among Mexican American women than among Mexican American men .
●● The prevalence of metabolic syndrome is also high among immigrant Asian Indians, ranging between 26 .8% and 38 .2% depending on the definition used .5
●● The prevalence of metabolic syndrome among pregnant women increased to 26 .5% during 1999 to 2004 from 17 .8% during 1988 to 1994 .6
●● Despite its prevalence, the public’s recognition of metabolic syndrome is limited .7 The above estimates include many of those who have DM in addition to those with metabolic syndrome without DM .
Abbreviations Used in Chapter 11
AF atrial fibrillation
AHA American Heart Association
ARIC Atherosclerosis Risk in Communities
BMI body mass index
BP blood pressure
CAC coronary artery calcification
CAD coronary artery disease
CHD coronary heart disease
CI confidence interval
COURAGE Clinical Outcomes Utilizing Revascularization and Aggressive Drug Evaluation
CVD cardiovascular disease
DM diabetes mellitus
FRS Framingham Risk Score
HDL high-density lipoprotein
HF heart failure
HR hazard ratio
MESA Multi-Ethnic Study of Atherosclerosis
MI myocardial infarction
NCHS National Center for Health Statistics
NHANES National Health and Nutrition Examination Survey
NHLBI National Heart, Lung, and Blood Institute
OR odds ratio
PA physical activity
PAR population attributable risk
PCI percutaneous coronary intervention
RR relative risk
WHO World Health Organization
by guest on December 16, 2013http://circ.ahajournals.org/Downloaded from
Heart Disease and Stroke Statistics—2013 Update: Chapter 11 e99
Children/Adolescents
●● According to the 2009 AHA scientific statement about met-abolic syndrome in children and adolescents, metabolic syn-drome should be diagnosed with caution in this age group because metabolic syndrome categorization in adolescents is not stable .8 Approximately half of the 1098 adolescent participants in the Princeton School District Study diag-nosed with pediatric Adult Treatment Panel III metabolic syndrome lost the diagnosis over 3 years of follow-up .9
●● Additional evidence of the instability of the diagnosis of metabolic syndrome in children exists . In children 6 to 17 years of age participating in research studies in a single clinical research hospital, the diagnosis of metabolic syn-drome was unstable in 46% of cases after a mean of 5 .6 years of follow-up .10
●● On the basis of NHANES 1999–2002 data, the prevalence of metabolic syndrome in adolescents 12 to 19 years of age was 9 .4%, which represents ≈2 .9 million people . It was 13 .2% in boys, 5 .3% in girls, 10 .7% in whites, 5 .2% in blacks, and 11 .1% in Mexican Americans .11
●● In 1999 to 2004, ≈4 .5% of US adolescents 12 to 17 years of age had metabolic syndrome according to the definition developed by the International Diabetes Federation .12 In 2006, this prevalence would have represented ≈1 .1 million adolescents 12 to 17 years of age with metabolic syndrome . It increased from 1 .2% among those 12 to 13 years of age to 7 .1% among those 14 to 15 years of age and was higher among boys (6 .7%) than girls (2 .1%) . Furthermore, 4 .5% of white adolescents, 3 .0% of black adolescents, and 7 .1% of Mexican American adolescents had metabolic syndrome . The prevalence of metabolic syndrome remained relatively stable during successive 2-year periods: 4 .5% for 1999 to 2000, 4 .4% to 4 .5% for 2001 to 2002, and 3 .7% to 3 .9% for 2003 to 2004 .
●● In 1999 to 2002, among overweight or obese adolescents, 44% had metabolic syndrome .11 In 1988 to 1994, two thirds of all adolescents had at least 1 metabolic abnormality .13
●● Of 31 participants in the NHLBI Lipid Research Clinics Princeton Prevalence Study and the Princeton Follow-Up Study who had metabolic syndrome at baseline, 21 (68%) had metabolic syndrome 25 years later .14 After adjustment for age, sex, and race, the baseline status of metabolic syn-drome was significantly associated with an increased risk of having metabolic syndrome during adulthood (OR, 6 .2; 95% CI, 2 .8–13 .8) .
●● In the Bogalusa Heart Study, 4 variables (BMI, homeo-stasis model assessment of insulin resistance, ratio of tri-glycerides to HDL cholesterol, and mean arterial pressure) considered to be part of the metabolic syndrome clustered together in blacks and whites and in children and adults .15 The degree of clustering was stronger among adults than among children . The clustering of rates of change in the components of the metabolic syndrome in blacks exceeded that in whites . Cardiovascular abnormalities are associated with metabolic syndrome in children and adolescents .16,17
Risk
Adults
●● Consistent with 2 earlier meta-analyses, a recent meta-analysis of prospective studies concluded that metabolic syndrome increased the risk of developing CVD (summary
RR, 1 .78; 95% CI, 1 .58–2 .00) .18 The risk of CVD tended to be higher in women (summary RR, 2 .63) than in men (summary RR, 1 .98; P=0 .09) . On the basis of results from 3 studies, metabolic syndrome remained a predictor of cardiovascular events after adjustment for the individual components of the syndrome (summary RR, 1 .54; 95% CI, 1 .32–1 .79) . A more recent meta-analysis among 87 studies comprising 951 083 subjects showed an even higher risk of CVD associated with metabolic syndrome (summary RR, 2 .35; 95% CI, 2 .02–2 .73), with significant increased risks (RRs ranging from 1 .6 to 2 .9) for all-cause mortality, CVD mortality, MI, and stroke, as well as for those with meta-bolic syndrome without DM .19
●● In one of the earlier studies among US adults, mortality follow-up of the second NHANES showed a stepwise increase in risk of CHD, CVD, and total mortality across the spectrum of no disease, metabolic syndrome (without DM), DM, prior CVD, and those with CVD and DM, with an HR for CHD mortality of 2 .02 (95% CI, 1 .42–2 .89) associated with metabolic syndrome . Increased risk was seen with increased numbers of metabolic syndrome risk factors .20
●● Several studies suggest that the Framingham Risk Score (FRS) is a better predictor of incident CVD than metabolic syndrome .21–23 In the San Antonio Heart Study, the area under the receiver-operating characteristic curve was 0 .816 for the FRS and 0 .811 for the FRS plus the metabolic syn-drome .21 Furthermore, the sensitivity for CVD at a fixed specificity was significantly higher for the FRS than for the metabolic syndrome . In ARIC, inclusion of the metabolic syndrome did not improve the risk prediction achieved by the FRS .22 In the British Regional Heart Study, the area under the receiver-operating characteristic curve for the FRS was 0 .73 for incident CHD during 10 years of follow-up, and the area under the receiver-operating characteristic curve for the number of metabolic syndrome components was 0 .63 .23 For CHD events during 20 years of follow-up, the areas under the receiver-operating characteristic curves were 0 .68 for the FRS and 0 .59 for the number of metabolic syndrome components .
●● Estimates of RR for CVD generally increase as the number of components of metabolic syndrome increases .23 Com-pared with men without an abnormal component in the Framingham Offspring Study, the HRs for CVD were 1 .48 (95% CI, 0 .69–3 .16) for men with 1 or 2 components and 3 .99 (95% CI, 1 .89–8 .41) for men with ≥3 components .24 Among women, the HRs were 3 .39 (95% CI, 1 .31–8 .81) for 1 or 2 components and 5 .95 (95% CI, 2 .20–16 .11) for ≥3 components . Compared with men without a metabolic abnormality in the British Regional Heart Study, the HRs were 1 .74 (95% CI, 1 .22–2 .39) for 1 component, 2 .34 (95% CI, 1 .65–3 .32) for 2 components, 2 .88 (95% CI, 2 .02–4 .11) for 3 components, and 3 .44 (95% CI, 2 .35–5 .03) for 4 or 5 components .23
●● The cardiovascular risk associated with the metabolic syn-drome varies on the basis of the combination of metabolic syndrome components present . Of all possible ways to have 3 metabolic syndrome components, the combination of central obesity, elevated BP, and hyperglycemia conferred the greatest risk for CVD (HR, 2 .36; 95% CI, 1 .54–3 .61) and mortality (HR, 3 .09; 95% CI, 1 .93–4 .94) in the Fram-ingham Offspring Study .25
by guest on December 16, 2013http://circ.ahajournals.org/Downloaded from

e100 Circulation January 1/8, 2013
●● Data from the Aerobics Center Longitudinal Study indicate that risk for CVD mortality is increased in men without DM who have metabolic syndrome (HR, 1 .8; 95% CI, 1 .5–2 .0); however, among those with metabolic syndrome, the presence of DM is associated with even greater risk for CVD mortality (HR, 2 .1; 95% CI, 1 .7–2 .6) .26 Analysis of data from NCHS was used to determine the number of disease-specific deaths attributable to all nonoptimal levels of each risk factor exposure by age and sex . The results of the analysis of dietary, lifestyle, and metabolic risk fac-tors show that targeting a handful of risk factors has large potential to reduce mortality in the United States .27
●● Among stable CAD patients in the COURAGE trial (Clini-cal Outcomes Utilizing Revascularization and Aggressive Drug Evaluation), the presence of metabolic syndrome was associated with an increased risk of death or MI (unad-justed HR, 1 .41; 95% CI, 1 .15–1 .73; P=0 .001); however, after adjustment for its individual components, metabolic syndrome was no longer significantly associated with out-come (HR, 1 .15; 95% CI, 0 .79–1 .68; P=0 .46) . Early percu-taneous coronary intervention (PCI) in addition to medical therapy did not significantly reduce the risk of death or MI regardless of metabolic syndrome or DM status .28
●● In the INTERHEART case-control study of 26 903 subjects from 52 countries, metabolic syndrome was associated with an increased risk of MI, both according to the WHO (OR, 2 .69; 95% CI, 2 .45–2 .95) and International Diabetes Federation (OR, 2 .20; 95% CI, 2 .03–2 .38) definitions, with a PAR of 14 .5% (95% CI, 12 .7%–16 .3%) and 16 .8% (95% CI, 14 .8%–18 .8%), respectively, and associations that were similar across all regions and ethnic groups . In addition, the presence of ≥3 risk factors with subthreshold values was associated with increased risk of MI (OR, 1 .50; 95% CI, 1 .24–1 .81) compared with having “normal” values . Similar results were observed when the International Diabetes Federation definition was used .29
●● In MESA, among 6603 people aged 45 to 84 years (1686 [25%] with metabolic syndrome without DM and 881 [13%] with DM), subclinical atherosclerosis assessed by CAC was more severe in people with metabolic syndrome and DM than in those without these conditions, and the extent of CAC was a strong predictor of CHD and CVD events in these groups .30 Furthermore, the progression of CAC was greater in people with metabolic syndrome and DM than in those without .31
●● In addition to CVD, the metabolic syndrome has been asso-ciated with incident AF32 and HF .33
●● The metabolic syndrome is associated with increased healthcare use and healthcare-related costs among indi-viduals with and without DM . Overall, healthcare costs increase by ≈24% for each additional metabolic syndrome component present .34
Children
●● Few prospective pediatric studies have examined the future risk for CVD or DM according to baseline metabolic syn-drome status . Data from 771 participants 6 to 19 years of age from the NHLBI’s Lipid Research Clinics Princ-eton Prevalence Study and the Princeton Follow-Up Study showed that the risk of developing CVD was substantially higher among those with metabolic syndrome than among
those without this syndrome (OR, 14 .6; 95% CI, 4 .8–45 .3) who were followed up for 25 years .14
●● Another analysis of 814 participants of this cohort showed that those 5 to 19 years of age who had metabolic syndrome at baseline had an increased risk of having DM 25 to 30 years later compared with those who did not have the syn-drome at baseline (OR, 11 .5; 95% CI, 2 .1–63 .7) .35
●● Additional data from the Princeton Follow-Up Study, the Fels Longitudinal Study, and the Muscatine Study suggest that the absence of components of the metabolic syndrome in childhood had a high negative predictive value for the development of metabolic syndrome or DM in adulthood .36
Risk Factors
●● In prospective or retrospective cohort studies, the following factors have been reported as being directly associated with incident metabolic syndrome, defined by one of the major definitions: age,35,37–39 low educational attainment,37,40 low socioeconomic status,41 smoking,40–43 low levels of PA,40–46 low levels of physical fitness,44,47–49 intake of soft drinks,50 intake of diet soda,51 magnesium intake,52 energy intake,46 carbohydrate intake,37,42,53 total fat intake,37,53 Western dietary pattern,51 meat intake,51 intake of fried foods,51 heavy alcohol consumption,54 abstention from alcohol use,37 parental history of DM,35 long-term stress at work,55 pediatric metabolicsyndrome,35 obesity or BMI,37,38,42,46,56 childhood obesity,57 waist circumference,39,53,58–61 intra-abdominal fat,62 gain in weight or BMI,37,63 change in weight or BMI,39,42,64 weight fluctuation,65 BP,39,53,60,66 heart rate,67 homeostasis model assessment,58,68 fasting insulin,58 2-hour insulin,58 proinsulin,58 fasting glucose or hypergly-cemia,39,58,60 2-hour glucose,58 impaired glucose tolerance,58 triglycerides,39,53,56,58–60 low HDL cholesterol,39,53,57,58,60 oxidized LDL,68 uric acid,64,69 γ-glutamyltransferase,64,70,71 alanine transaminase,64,70,72,73 plasminogen activator inhibi-tor-1,74 aldosterone,74 leptin,75 C-reactive protein,76,77 adi-pocyte–fatty acid binding protein,78 and free testosterone index .79
●● The following factors have been reported as being inversely associated with incident metabolic syndrome, defined by one of the major definitions, in prospective or retrospec-tive cohort studies: muscular strength,80 change in PA or physical fitness,42,47 alcohol intake,40,46 Mediterranean diet,81 dairy consumption,51 insulin sensitivity,58 ratio of aspartate aminotransferase to alanine transaminase,72 total testosterone,79,82,83 sex hormone–binding globulin,79,82,83 and Δ5-desaturase activity .84
●● Furthermore, men were more likely than women to develop metabolic syndrome,37,39 and blacks were shown to be less likely to develop metabolic syndrome than whites .37
●● In >6 years of follow-up in the ARIC Study, 1970 individu-als (25%) developed metabolic syndrome, and compared with the normal-weight group (BMI <25 kg/m2), the ORs of developing metabolic syndrome were 2 .81 (95% CI, 2 .50–3 .17) and 5 .24 (95% CI, 4 .50–6 .12) for the over-weight (BMI 25–30 kg/m2) and obese (BMI ≥30 kg/m2) groups, respectively . Compared with the lowest quartile of leisure-time PA, the ORs of developing metabolic syn-drome were 0 .80 (95% CI, 0 .71–0 .91) and 0 .92 (95% CI, 0 .81–1 .04) for people in the highest and middle quartiles, respectively .85
by guest on December 16, 2013http://circ.ahajournals.org/Downloaded from

Heart Disease and Stroke Statistics—2013 Update: Chapter 11 e101
References 1 . Alberti KG, Eckel RH, Grundy SM, Zimmet PZ, Cleeman JI, Donato KA,
Fruchart JC, James WP, Loria CM, Smith SC Jr . Harmonizing the meta-bolic syndrome: a joint interim statement of the International Diabetes Federation Task Force on Epidemiology and Prevention; National Heart, Lung, and Blood Institute; American Heart Association; World Heart Fed-eration; International Atherosclerosis Society; and International Associa-tion for the Study of Obesity . Circulation . 2009;120:1640–1645 .
2 . Bagge E, Bjelle A, Edén S, Svanborg A . A longitudinal study of the occur-rence of joint complaints in elderly people . Age Ageing . 1992;21:160–167 .
3 . Brown TM, Voeks JH, Bittner V, Safford MM . Variations in prevalent cardiovascular disease and future risk by metabolic syndrome classifica-tion in the REasons for Geographic and Racial Differences in Stroke (RE-GARDS) study . Am Heart J . 2010;159:385–391 .
4 . Ervin RB . Prevalence of metabolic syndrome among adults 20 years of age and over, by sex, age, race and ethnicity, and body mass index: United States, 2003–2006 . Natl Health Stat Report . 2009;(13):1–7 .
5 . Misra R, Patel T, Kotha P, Raji A, Ganda O, Banerji M, Shah V, Vijay K, Mudaliar S, Iyer D, Balasubramanyam A . Prevalence of diabetes, meta-bolic syndrome, and cardiovascular risk factors in US Asian Indians: re-sults from a national study . J Diabetes Complications . 2010;24:145–153 .
6 . Ramos RG, Olden K . The prevalence of metabolic syndrome among US women of childbearing age . Am J Public Health . 2008;98:1122–1127 .
7 . Lewis SJ, Rodbard HW, Fox KM, Grandy S; SHIELD Study Group . Self-reported prevalence and awareness of metabolic syndrome: findings from SHIELD . Int J Clin Pract . 2008;62:1168–1176 .
8 . Steinberger J, Daniels SR, Eckel RH, Hayman L, Lustig RH, McCrindle B, Mietus-Snyder ML . Progress and challenges in metabolic syndrome in children and adolescents: a scientific statement from the American Heart Association Atherosclerosis, Hypertension, and Obesity in the Young Committee of the Council on Cardiovascular Disease in the Young; Council on Cardiovascular Nursing; and Council on Nutrition, Physical Activity, and Metabolism . Circulation . 2009;119:628–647 .
9 . Goodman E, Daniels SR, Meigs JB, Dolan LM . Instability in the diagnosis of metabolic syndrome in adolescents . Circulation . 2007;115:2316–2322 .
10 . Gustafson JK, Yanoff LB, Easter BD, Brady SM, Keil MF, Roberts MD, Sebring NG, Han JC, Yanovski SZ, Hubbard VS, Yanovski JA . The stabil-ity of metabolic syndrome in children and adolescents . J Clin Endocrinol Metab . 2009;94:4828–4834 .
11 . Cook S, Auinger P, Li C, Ford ES . Metabolic syndrome rates in United States adolescents, from the National Health and Nutrition Examination Survey, 1999-2002 . J Pediatr . 2008;152:165–170 .
12 . Ford ES, Li C, Zhao G, Pearson WS, Mokdad AH . Prevalence of the meta-bolic syndrome among U .S . adolescents using the definition from the In-ternational Diabetes Federation . Diabetes Care . 2008;31:587–589 .
13 . de Ferranti SD, Gauvreau K, Ludwig DS, Neufeld EJ, Newburger JW, Rifai N . Prevalence of the metabolic syndrome in American adolescents: findings from the Third National Health and Nutrition Examination Sur-vey . Circulation . 2004;110:2494–2497 .
14 . Morrison JA, Friedman LA, Gray-McGuire C . Metabolic syndrome in childhood predicts adult cardiovascular disease 25 years later: the Princeton Lipid Research Clinics Follow-up Study . Pediatrics . 2007;120:340–345 .
15 . Chen W, Srinivasan SR, Li S, Xu J, Berenson GS . Clustering of long-term trends in metabolic syndrome variables from childhood to adult-hood in Blacks and Whites: the Bogalusa Heart Study . Am J Epidemiol . 2007;166:527–533 .
16 . Chinali M, de Simone G, Roman MJ, Best LG, Lee ET, Russell M, How-ard BV, Devereux RB . Cardiac markers of pre-clinical disease in adoles-cents with the metabolic syndrome: the Strong Heart Study . J Am Coll Cardiol . 2008;52:932–938 .
17 . Toledo-Corral CM, Ventura EE, Hodis HN, Weigensberg MJ, Lane CJ, Li Y, Goran MI . Persistence of the metabolic syndrome and its influence on carotid artery intima media thickness in overweight Latino children . Atherosclerosis . 2009;206:594–598 .
18 . Gami AS, Witt BJ, Howard DE, Erwin PJ, Gami LA, Somers VK, Montori VM . Metabolic syndrome and risk of incident cardiovascular events and death: a systematic review and meta-analysis of longitudinal studies . J Am Coll Cardiol . 2007;49:403–414 .
19 . Mottillo S, Filion KB, Genest J, Joseph L, Pilote L, Poirier P, Rinfret S, Schiffrin EL, Eisenberg MJ . The metabolic syndrome and cardiovas-cular risk: a systematic review and meta-analysis . J Am Coll Cardiol . 2010;56:1113–1132 .
20 . Malik S, Wong ND, Franklin SS, Kamath TV, L’Italien GJ, Pio JR, Wil-liams GR . Impact of the metabolic syndrome on mortality from coronary
heart disease, cardiovascular disease, and all causes in United States adults . Circulation . 2004;110:1245–1250 .
21 . Stern MP, Williams K, González-Villalpando C, Hunt KJ, Haffner SM . Does the metabolic syndrome improve identification of individuals at risk of type 2 diabetes and/or cardiovascular disease? [published correction ap-pears in Diabetes Care . 2005;28:238] Diabetes Care . 2004;27:2676–2681 .
22 . McNeill AM, Rosamond WD, Girman CJ, Golden SH, Schmidt MI, East HE, Ballantyne CM, Heiss G . The metabolic syndrome and 11-year risk of incident cardiovascular disease in the Atherosclerosis Risk in Communi-ties Study . Diabetes Care . 2005;28:385–390 .
23 . Wannamethee SG, Shaper AG, Lennon L, Morris RW . Metabolic syndrome vs Framingham Risk Score for prediction of coronary heart disease, stroke, and type 2 diabetes mellitus . Arch Intern Med . 2005;165:2644–2650 .
24 . Wilson PW, D’Agostino RB, Parise H, Sullivan L, Meigs JB . Metabolic syndrome as a precursor of cardiovascular disease and type 2 diabetes mellitus . Circulation . 2005;112:3066–3072 .
25 . Franco OH, Massaro JM, Civil J, Cobain MR, O’Malley B, D’Agostino RB Sr . Trajectories of entering the metabolic syndrome: the Framingham Heart Study . Circulation . 2009;120:1943–1950 .
26 . Church TS, Thompson AM, Katzmarzyk PT, Sui X, Johannsen N, Earnest CP, Blair SN . Metabolic syndrome and diabetes, alone and in combina-tion, as predictors of cardiovascular disease mortality among men . Diabe-tes Care . 2009;32:1289–1294 .
27 . Danaei G, Ding EL, Mozaffarian D, Taylor B, Rehm J, Murray CJ, Ezzati M . The preventable causes of death in the United States: comparative risk assessment of dietary, lifestyle, and metabolic risk factors [published cor-rection appears in PLoS Med . 2011;8(1)] . PLoS Med . 2009;6:e1000058 .
28 . Maron DJ, Boden WE, Spertus JA, Hartigan PM, Mancini GB, Sedlis SP, Kostuk WJ, Chaitman BR, Shaw LJ, Berman DS, Dada M, Teo KK, Wein-traub WS, O’Rourke RA; COURAGE Trial Research Group . Impact of metabolic syndrome and diabetes on prognosis and outcomes with early percutaneous coronary intervention in the COURAGE (Clinical Outcomes Utilizing Revascularization and Aggressive Drug Evaluation) trial . J Am Coll Cardiol . 2011;58:131–137 .
29 . Mente A, Yusuf S, Islam S, McQueen MJ, Tanomsup S, Onen CL, Ranga-rajan S, Gerstein HC, Anand SS; INTERHEART Investigators . Metabolic syndrome and risk of acute myocardial infarction: a case-control study of 26,903 subjects from 52 countries . J Am Coll Cardiol . 2010;55:2390–2398 .
30 . Malik S, Budoff MJ, Katz R, Blumenthal RS, Bertoni AG, Nasir K, Szklo M, Barr RG, Wong ND . Impact of subclinical atherosclerosis on cardiovascular disease events in individuals with metabolic syndrome and diabetes: the Multi-Ethnic Study of Atherosclerosis . Diabetes Care . 2011;34:2285–2290 .
31 . Wong ND, Nelson JC, Granston T, Bertoni AG, Blumenthal RS, Carr JJ, Guerci A, Jacobs DR Jr, Kronmal R, Liu K, Saad M, Selvin E, Tracy R, Detrano R . Metabolic syndrome, diabetes, and incidence and progres-sion of coronary calcium: the Multiethnic Study of Atherosclerosis study . JACC Cardiovasc Imaging . 2012;5:358–366 .
32 . Chamberlain AM, Agarwal SK, Ambrose M, Folsom AR, Soliman EZ, Alonso A . Metabolic syndrome and incidence of atrial fibrillation among blacks and whites in the Atherosclerosis Risk in Communities (ARIC) Study . Am Heart J . 2010;159:850–856 .
33 . Horwich TB, Fonarow GC . Glucose, obesity, metabolic syndrome, and diabetes: relevance to incidence of heart failure . J Am Coll Cardiol . 2010;55:283–293 .
34 . Boudreau DM, Malone DC, Raebel MA, Fishman PA, Nichols GA, Feld-stein AC, Boscoe AN, Ben-Joseph RH, Magid DJ, Okamoto LJ . Health care utilization and costs by metabolic syndrome risk factors . Metab Syndr Relat Disord . 2009;7:305–314 .
35 . Morrison JA, Friedman LA, Wang P, Glueck CJ . Metabolic syndrome in childhood predicts adult metabolic syndrome and type 2 diabetes mellitus 25 to 30 years later . J Pediatr . 2008;152:201–206 .
36 . Schubert CM, Sun SS, Burns TL, Morrison JA, Huang TT . Predictive abil-ity of childhood metabolic components for adult metabolic syndrome and type 2 diabetes . J Pediatr . 2009;155:S6 .e1–S6 .e7 .
37 . Carnethon MR, Loria CM, Hill JO, Sidney S, Savage PJ, Liu K; Coronary Artery Risk Development in Young Adults study . Risk factors for the met-abolic syndrome: the Coronary Artery Risk Development in Young Adults (CARDIA) study, 1985-2001 . Diabetes Care . 2004;27:2707–2715 .
38 . Albareda M, Caballero A, Badell G, Rodríguez-Espinosa J, Ordóñez-Lla-nos J, de Leiva A, Corcoy R . Metabolic syndrome at follow-up in women with and without gestational diabetes mellitus in index pregnancy . Metab Clin Exp . 2005;54:1115–1121 .
39 . Cheung BM, Wat NM, Tam S, Thomas GN, Leung GM, Cheng CH, Woo J, Janus ED, Lau CP, Lam TH, Lam KS . Components of the metabolic
by guest on December 16, 2013http://circ.ahajournals.org/Downloaded from

e102 Circulation January 1/8, 2013
syndrome predictive of its development: a 6-year longitudinal study in Hong Kong Chinese . Clin Endocrinol (Oxf) . 2008;68:730–737 .
40 . Wilsgaard T, Jacobsen BK . Lifestyle factors and incident metabolic syndrome: the Tromsø Study 1979-2001 . Diabetes Res Clin Pract . 2007;78:217–224 .
41 . Chichlowska KL, Rose KM, Diez-Roux AV, Golden SH, McNeill AM, Heiss G . Life course socioeconomic conditions and metabolic syndrome in adults: the Atherosclerosis Risk in Communities (ARIC) Study . Ann Epidemiol . 2009;19:875–883 .
42 . Wannamethee SG, Shaper AG, Whincup PH . Modifiable lifestyle factors and the metabolic syndrome in older men: effects of lifestyle changes . J Am Geriatr Soc . 2006;54:1909–1914 .
43 . Holme I, Tonstad S, Sogaard AJ, Larsen PG, Haheim LL . Leisure time physical activity in middle age predicts the metabolic syndrome in old age: results of a 28-year follow-up of men in the Oslo study . BMC Public Health . 2007;7:154 .
44 . Laaksonen DE, Lakka HM, Salonen JT, Niskanen LK, Rauramaa R, Lak-ka TA . Low levels of leisure-time physical activity and cardiorespiratory fitness predict development of the metabolic syndrome . Diabetes Care . 2002;25:1612–1618 .
45 . Ekelund U, Brage S, Franks PW, Hennings S, Emms S, Wareham NJ . Physical activity energy expenditure predicts progression toward the metabolic syndrome independently of aerobic fitness in middle-aged healthy Caucasians: the Medical Research Council Ely Study . Diabetes Care . 2005;28:1195–1200 .
46 . Ferreira I, Twisk JW, van Mechelen W, Kemper HC, Stehouwer CD . Development of fatness, fitness, and lifestyle from adolescence to the age of 36 years: determinants of the metabolic syndrome in young adults: the Amsterdam Growth and Health Longitudinal Study . Arch Intern Med . 2005;165:42–48 .
47 . Carnethon MR, Gidding SS, Nehgme R, Sidney S, Jacobs DR Jr, Liu K . Cardiorespiratory fitness in young adulthood and the development of car-diovascular disease risk factors . JAMA . 2003;290:3092–3100 .
48 . LaMonte MJ, Barlow CE, Jurca R, Kampert JB, Church TS, Blair SN . Cardiorespiratory fitness is inversely associated with the incidence of metabolic syndrome: a prospective study of men and women . Circulation . 2005;112:505–512 .
49 . Ferreira I, Henry RM, Twisk JW, van Mechelen W, Kemper HC, Stehou-wer CD; Amsterdam Growth and Health Longitudinal Study . The meta-bolic syndrome, cardiopulmonary fitness, and subcutaneous trunk fat as independent determinants of arterial stiffness: the Amsterdam Growth and Health Longitudinal Study . Arch Intern Med . 2005;165:875–882 .
50 . Dhingra R, Sullivan L, Jacques PF, Wang TJ, Fox CS, Meigs JB, D’Agostino RB, Gaziano JM, Vasan RS . Soft drink consumption and risk of developing cardiometabolic risk factors and the metabolic syndrome in middle-aged adults in the community [published correction appears in Circulation . 2007;116:e557] . Circulation . 2007;116:480–488 .
51 . Lutsey PL, Steffen LM, Stevens J . Dietary intake and the development of the metabolic syndrome: the Atherosclerosis Risk in Communities study . Circulation . 2008;117:754–761 .
52 . He K, Liu K, Daviglus ML, Morris SJ, Loria CM, Van Horn L, Jacobs DR Jr, Savage PJ . Magnesium intake and incidence of metabolic syndrome among young adults . Circulation . 2006;113:1675–1682 .
53 . Mirmiran P, Noori N, Azizi F . A prospective study of determinants of the metabolic syndrome in adults . Nutr Metab Cardiovasc Dis . 2008;18:567–573 .
54 . Baik I, Shin C . Prospective study of alcohol consumption and metabolic syndrome . Am J Clin Nutr . 2008;87:1455–1463 .
55 . Chandola T, Brunner E, Marmot M . Chronic stress at work and the meta-bolic syndrome: prospective study . BMJ . 2006;332:521–525 .
56 . Lim HS, Lip GY, Beevers DG, Blann AD . Factors predicting the develop-ment of metabolic syndrome and type II diabetes against a background of hypertension . Eur J Clin Invest . 2005;35:324–329 .
57 . Sun SS, Liang R, Huang TT, Daniels SR, Arslanian S, Liu K, Grave GD, Siervogel RM . Childhood obesity predicts adult metabolic syndrome: the Fels Longitudinal Study . J Pediatr . 2008;152:191–200 .
58 . Palaniappan L, Carnethon MR, Wang Y, Hanley AJ, Fortmann SP, Haffner SM, Wagenknecht L; Insulin Resistance Atherosclerosis Study . Predictors of the incident metabolic syndrome in adults: the Insulin Resistance Ath-erosclerosis Study . Diabetes Care . 2004;27:788–793 .
59 . Morrison JA, Friedman LA, Harlan WR, Harlan LC, Barton BA, Sch-reiber GB, Klein DJ . Development of the metabolic syndrome in black and white adolescent girls: a longitudinal assessment . Pediatrics . 2005;116:1178–1182 .
60 . Sheu WH, Chuang SY, Lee WJ, Tsai ST, Chou P, Chen CH . Predic-tors of incident diabetes, metabolic syndrome in middle-aged adults: a
10-year follow-up study from Kinmen, Taiwan . Diabetes Res Clin Pract . 2006;74:162–168 .
61 . Onat A, Uyarel H, Hergenç G, Karabulut A, Albayrak S, Can G . Deter-minants and definition of abdominal obesity as related to risk of diabetes, metabolic syndrome and coronary disease in Turkish men: a prospective cohort study . Atherosclerosis . 2007;191:182–190 .
62 . Tong J, Boyko EJ, Utzschneider KM, McNeely MJ, Hayashi T, Carr DB, Wallace TM, Zraika S, Gerchman F, Leonetti DL, Fujimoto WY, Kahn SE . Intra-abdominal fat accumulation predicts the development of the metabolic syndrome in non-diabetic Japanese-Americans . Diabetologia . 2007;50:1156–1160 .
63 . Lloyd-Jones DM, Liu K, Colangelo LA, Yan LL, Klein L, Loria CM, Lewis CE, Savage P . Consistently stable or decreased body mass index in young adulthood and longitudinal changes in metabolic syndrome com-ponents: the Coronary Artery Risk Development in Young Adults Study . Circulation . 2007;115:1004–1011 .
64 . Ryu S, Song J, Choi BY, Lee SJ, Kim WS, Chang Y, Kim DI, Suh BS, Sung KC . Incidence and risk factors for metabolic syndrome in Korean male workers, ages 30 to 39 . Ann Epidemiol . 2007;17:245–252 .
65 . Vergnaud AC, Bertrais S, Oppert JM, Maillard-Teyssier L, Galan P, Her-cberg S, Czernichow S . Weight fluctuations and risk for metabolic syn-drome in an adult cohort . Int J Obes (Lond) . 2008;32:315–321 .
66 . Sun SS, Grave GD, Siervogel RM, Pickoff AA, Arslanian SS, Daniels SR . Systolic blood pressure in childhood predicts hypertension and metabolic syndrome later in life . Pediatrics . 2007;119:237–246 .
67 . Tomiyama H, Yamada J, Koji Y, Yambe M, Motobe K, Shiina K, Yama-moto Y, Yamashina A . Heart rate elevation precedes the development of metabolic syndrome in Japanese men: a prospective study . Hypertens Res . 2007;30:417–426 .
68 . Holvoet P, Lee DH, Steffes M, Gross M, Jacobs DR Jr . Association be-tween circulating oxidized low-density lipoprotein and incidence of the metabolic syndrome . JAMA . 2008;299:2287–2293 .
69 . Sui X, Church TS, Meriwether RA, Lobelo F, Blair SN . Uric acid and the development of metabolic syndrome in women and men . Metab Clin Exp . 2008;57:845–852 .
70 . André P, Balkau B, Vol S, Charles MA, Eschwège E; DESIR Study Group . Gamma-glutamyltransferase activity and development of the metabolic syndrome (International Diabetes Federation Definition) in middle-aged men and women: Data from the Epidemiological Study on the Insulin Resistance Syndrome (DESIR) cohort . Diabetes Care . 2007;30:2355–2361 .
71 . Lee DS, Evans JC, Robins SJ, Wilson PW, Albano I, Fox CS, Wang TJ, Benjamin EJ, D’Agostino RB, Vasan RS . Gamma glutamyl trans-ferase and metabolic syndrome, cardiovascular disease, and mortal-ity risk: the Framingham Heart Study . Arterioscler Thromb Vasc Biol . 2007;27:127–133 .
72 . Hanley AJ, Williams K, Festa A, Wagenknecht LE, D’Agostino RB Jr, Haff-ner SM . Liver markers and development of the metabolic syndrome: the Insulin Resistance Atherosclerosis Study . Diabetes . 2005;54:3140–3147 .
73 . Schindhelm RK, Dekker JM, Nijpels G, Stehouwer CD, Bouter LM, He-ine RJ, Diamant M . Alanine aminotransferase and the 6-year risk of the metabolic syndrome in Caucasian men and women: the Hoorn Study . Dia-bet Med . 2007;24:430–435 .
74 . Ingelsson E, Pencina MJ, Tofler GH, Benjamin EJ, Lanier KJ, Jacques PF, Fox CS, Meigs JB, Levy D, Larson MG, Selhub J, D’Agostino RB Sr, Wang TJ, Vasan RS . Multimarker approach to evaluate the incidence of the metabolic syndrome and longitudinal changes in metabolic risk factors: the Framingham Offspring Study . Circulation . 2007;116:984–992 .
75 . Galletti F, Barbato A, Versiero M, Iacone R, Russo O, Barba G, Siani A, Cappuccio FP, Farinaro E, della Valle E, Strazzullo P . Circulating leptin levels predict the development of metabolic syndrome in middle-aged men: an 8-year follow-up study . J Hypertens . 2007;25:1671–1677 .
76 . Laaksonen DE, Niskanen L, Nyyssönen K, Punnonen K, Tuomainen TP, Valkonen VP, Salonen R, Salonen JT . C-reactive protein and the develop-ment of the metabolic syndrome and diabetes in middle-aged men . Diabe-tologia . 2004;47:1403–1410 .
77 . Hassinen M, Lakka TA, Komulainen P, Gylling H, Nissinen A, Rauramaa R . C-reactive protein and metabolic syndrome in elderly women: a 12-year follow-up study . Diabetes Care . 2006;29:931–932 .
78 . Xu A, Tso AW, Cheung BM, Wang Y, Wat NM, Fong CH, Yeung DC, Ja-nus ED, Sham PC, Lam KS . Circulating adipocyte-fatty acid binding pro-tein levels predict the development of the metabolic syndrome: a 5-year prospective study . Circulation . 2007;115:1537–1543 .
79 . Rodriguez A, Muller DC, Metter EJ, Maggio M, Harman SM, Blackman MR, Andres R . Aging, androgens, and the metabolic syndrome in a longi-tudinal study of aging . J Clin Endocrinol Metab . 2007;92:3568–3572 .
by guest on December 16, 2013http://circ.ahajournals.org/Downloaded from

Heart Disease and Stroke Statistics—2013 Update: Chapter 11 e103
80 . Jurca R, Lamonte MJ, Barlow CE, Kampert JB, Church TS, Blair SN . Association of muscular strength with incidence of metabolic syndrome in men . Med Sci Sports Exerc . 2005;37:1849–1855 .
81 . Tortosa A, Bes-Rastrollo M, Sanchez-Villegas A, Basterra-Gortari FJ, Nu-ñez-Cordoba JM, Martinez-Gonzalez MA . Mediterranean diet inversely associated with the incidence of metabolic syndrome: the SUN prospec-tive cohort . Diabetes Care . 2007;30:2957–2959 .
82 . Laaksonen DE, Niskanen L, Punnonen K, Nyyssönen K, Tuomainen TP, Valkonen VP, Salonen R, Salonen JT . Testosterone and sex hormone-bind-ing globulin predict the metabolic syndrome and diabetes in middle-aged men . Diabetes Care . 2004;27:1036–1041 .
83 . Kupelian V, Page ST, Araujo AB, Travison TG, Bremner WJ, McKinlay JB . Low sex hormone-binding globulin, total testosterone, and symptom-atic androgen deficiency are associated with development of the metabolic syndrome in nonobese men . J Clin Endocrinol Metab . 2006;91:843–850 .
84 . Warensjö E, Risérus U, Vessby B . Fatty acid composition of serum lipids predicts the development of the metabolic syndrome in men . Diabetolo-gia . 2005;48:1999–2005 .
85 . Cheriyath P, Duan Y, Qian Z, Nambiar L, Liao D . Obesity, physi-cal activity and the development of metabolic syndrome: the Athero-sclerosis Risk in Communities study . Eur J Cardiovasc Prev Rehabil . 2010;17:309–313 .
by guest on December 16, 2013http://circ.ahajournals.org/Downloaded from

e104 Circulation January 1/8, 2013
12. Chronic Kidney Disease
ICD-10 N18.0. See Tables 12-1 through 12-3.
End-Stage Renal Disease
Prevalence, Incidence, and Risk(See Tables 12-1 and 12-2 .)
ESRD is a condition that is most commonly associated with DM or HBP, occurs when the kidneys are functioning at a very low level, and is currently defined as the receipt of chronic renal replacement treatment such as hemodialysis, peritoneal dialysis, or kidney transplantation . The ESRD population is increasing in size and cost as those with chronic kidney dis-ease (CKD) transition to ESRD and as a result of changing practice patterns in the United States .
●● Data from the 2012 annual report of the US Renal Data System showed that in 2010:
—●The prevalence of ESRD was 593 086, with 65% of these prevalent cases being treated with hemodialysis .1
—●114 083 new cases of ESRD were reported .1
—●16 843 kidney transplants were performed .1
●● Data from a large cohort of insured patients found that in addition to established risk factors for ESRD, lower hemo-globin levels, higher serum uric acid levels, self-reported history of nocturia, and family history of kidney disease are independent risk factors for ESRD .2
●● Data from a large insured population revealed that among adults with a GFR >60 mL·min−1·1 .73 m−2 and no evidence of proteinuria or hematuria at baseline, risks for ESRD increased dramatically with higher baseline BP level, and in this same patient population, BP-associated risks were greater in men than in women and in blacks than in whites .3
●● Compared with white patients with similar levels of kidney function, black patients are much more likely to progress to ESRD and are on average 10 years younger when they reach ESRD .4,5
●● Results from a large community-based population showed that higher BMI also independently increased the risk of ESRD . The higher risk of ESRD with overweight and obesity was consistent across age, sex, and race and in the presence or absence of DM, hypertension, or known baseline kidney disease .6
Age, Sex, Race, and Ethnicity
●● The median age of the population with ESRD in 2010 varied across different racial/ethnic groups: 57 .9 years for Native Americans, 58 .1 years for blacks, 59 .7 years for Asians, and 61 .2 years for whites .1
●● Treatment of ESRD is more common in men than in women .1
●● Blacks, Hispanics, Asian Americans, and Native Ameri-cans have higher rates of ESRD than do whites . However, since 2000 new ESRD rates have increased 6 .1% for whites and 2 .5 percent among Asians, while rates have decreased 7 .0% for blacks .1
Chronic Kidney Disease
Prevalence
●● CKD, defined as reduced GFR, excess urinary protein excretion, or both, is a serious health condition and a worldwide public health problem . The incidence and prev-alence of CKD are increasing in the United States and are associated with poor outcomes and a high cost to the US healthcare system . Controversy exists about whether CKD itself independently causes incident CVD, but it is clear that people with CKD, as well as those with ESRD, repre-sent a population at very high risk for CVD events . In fact, individuals with CKD are more likely to die of CVD than to transition to ESRD . The US Renal Data System esti-mates that by 2020, >700 000 Americans will have ESRD, with >500 000 requiring dialysis and >250 000 receiving a transplant .
●● The National Kidney Foundation Kidney Disease Out-come Quality Initiative developed guidelines in 2002 that provided a standardized definition for CKD . Preva-lence estimates may differ depending on assumptions used in obtaining estimates, including which equation is used to estimate GFR and methods for measuring proteinuria .7
●● The most recent US prevalence estimates of CKD come from NHANES 1988–1994 and 1999–2004 (NCHS) in adults ≥20 years of age8:
—The prevalence of CKD in 1999–2004 (stages I to V)9 is 13 .1% . This represents an increase from the 10 .0% prev-alence estimate from NHANES 1988–1994 (NCHS) .
Abbreviations Used in Chapter 12
ACTION Acute Coronary Treatment and Intervention Outcomes Network
AF atrial fibrillation
AMI acute myocardial infarction
BMI body mass index
BP blood pressure
CHD coronary heart disease
CHF congestive heart failure
CKD chronic kidney disease
CI confidence interval
CVD cardiovascular disease
DM diabetes mellitus
eGFR estimated glomerular filtration rate
ESRD end-stage renal disease
GFR glomerular filtration rate
HBP high blood pressure
HF heart failure
ICD-10 International Classification of Diseases, 10th Revision
JNC V fifth report of the Joint National Committee on Prevention, Detec-tion, Evaluation, and Treatment of High Blood Pressure
MI myocardial infarction
NCHS National Center for Health Statistics
NHANES National Health and Nutrition Examination Survey
PAD peripheral arterial disease
RR relative risk
by guest on December 16, 2013http://circ.ahajournals.org/Downloaded from
Heart Disease and Stroke Statistics—2013 Update: Chapter 12 e105
—The prevalence of stage I CKD (estimated GFR [eGFR] ≥90 mL·min−1·1 .73 m−2 with kidney damage, ie, pres-ence of albuminuria) is 1 .8% .
—The prevalence of stage II CKD (eGFR 60–89 mL·min−1·1 .73 m−2 with kidney damage) is 3 .2% .
—The prevalence of stage III CKD (eGFR 30–59 mL·min−1·1 .73 m−2) is 7 .7% .
—The prevalence of stages IV and V CKD (eGFR<29 mL·min−1·1 .73 m−2) is 0 .4% .
●● More than 26 million people (13%) in the United States have CKD, and most are undiagnosed .8 Another 20 million are at increased risk for CKD .10
Demographics
●● According to current definitions, the prevalence of CKD is higher with older age1:
—5 .7% for those 20 to 39 years of age—9 .1% for those 40 to 59 years of age—35 .0% for those ≥60 years of age
●● CKD prevalence was greater among those with DM (40 .1%) and hypertension (23 .2%) than among those with-out these chronic conditions .1
●● The prevalence of CKD was slightly higher among Mexican Americans (18 .7%) and non-Hispanic blacks (19 .9%) than among non-Hispanic whites (16 .1%) . This disparity was most evident for those with stage I CKD; non-Hispanic whites had a CKD prevalence of 4 .2% compared with prevalences among Mexican Americans and non-Hispanic blacks of 10 .2% and 9 .4%, respectively .11
Risk Factors
●● Many traditional CVD risk factors are also risk factors for CKD, including older age, male sex, hypertension, DM, smoking, and family history of CVD .
●● Recent evidence suggests that BMI is associated with wors-ening CKD .
—In a cohort of 652 African American individuals with hypertensive nephrosclerosis, BMI was indepen-dently associated with urine total protein and albumin excretion .12
●● In addition, both the degree of CKD (ie, eGFR) and urine albumin are strongly associated with the progression from CKD to ESRD . Furthermore, urine albumin level is associ-ated with progression to CKD across all levels of reduced eGFR .13
●● Other risk factors include systemic conditions such as auto-immune diseases, systemic infections, and drug exposure, as well as anatomically local conditions such as urinary tract infections, urinary stones, lower urinary tract obstruc-tion, and neoplasia . Even after adjustment for these risk factors, excess CVD risk remains .14
ESRD/CKD and CVD(See Table 12-3 .)
●● CVD is the leading cause of death among those with ESRD, although the specific cardiovascular cause of death may be more likely to be arrhythmic than an AMI, end-stage HF, or stroke . CVD mortality is 5 to 30 times higher in dialysis patients than in subjects from the general population of the same age, sex, and race .15,16
—Individuals with less severe forms of kidney disease are also at significantly increased CVD risk independent of typical CVD risk factors .17
—CKD is a risk factor for recurrent CVD events .18
—CKD is also a risk factor for AF .19
●● Studies from a broad range of cohorts demonstrate an asso-ciation between reduced eGFR and elevated risk of CVD, CVD outcomes, and all-cause death17,20–25 that appears to be largely independent of other known major CVD risk factors .
●● Although clinical practice guidelines recommend manage-ment of mineral and bone disorders secondary to CKD, a recent meta-analysis suggests that there is no consistent association between calcium and parathyroid hormone and the risk of death or cardiovascular events .26
●● Any degree of albuminuria, starting below the microalbu-minuria cutpoint, has been shown to be an independent risk factor for cardiovascular events, CHF hospitalization, PAD, and all-cause death in a wide variety of cohorts .27–32
●● A recent meta-analysis of 21 published studies of albumin-uria involving 105 872 participants (730 577 person-years) from 14 studies with urine albumin/creatinine ratio mea-surements and 1 .1 million participants (4 .7 million person-years) from 7 studies with urine dipstick measurements showed that excess albuminuria or proteinuria is indepen-dently associated with a higher risk of CVD and all-cause mortality .33
—People with both albuminuria/proteinuria and reduced eGFR are at particularly high risk for CVD, CVD out-comes, and death .34
—The exact reasons why CKD and ESRD increase the risk of CVD have not been completely delineated but are clearly multifactorial and likely involve pathological alterations in multiple organ systems and pathways .
●● One potential explanation for the higher CVD event rate in patients with CKD is the low uptake of standard therapies for patients presenting with MI . In a recent analysis from the Acute Coronary Treatment and Intervention Outcomes Network (ACTION) registry, patients presenting with CKD had a substantially higher mortality rate . In addition, patients with CKD were less likely to receive standard ther-apies for the treatment of MI .35
Cost: ESRD
●● The total annual cost of treating ESRD in the United States was $26 .8 billion in 2008, which represents nearly 6% of the total Medicare budget .1
●● The total annual cost associated with CKD has not been determined accurately to date .
by guest on December 16, 2013http://circ.ahajournals.org/Downloaded from

e106 Circulation January 1/8, 2013
Cystatin C: Kidney Function and CVDSerum cystatin C, another marker of kidney function, has been proposed to be a more sensitive indicator of kidney function than serum creatinine and creatinine-based estimating for-mulas at higher levels of GFR . It is a low-molecular-weight protein produced at a constant rate by all nucleated cells and appears not to be affected significantly across age, sex, and levels of muscle mass . Cystatin C is excreted by the kidneys, filtered through the glomerulus, and nearly completely reab-sorbed by proximal tubular cells .36 Several equations have been proposed using cystatin C alone and in combination with serum creatinine to estimate kidney function .37,38
All-Cause MortalityElevated levels of cystatin C have been shown to be associated with increased risk for all-cause mortality in studies from a broad range of cohorts .39–41
●● In addition to GFR and urine albumin-to-creatinine ratio, cystatin C provides incremental information for the predic-tion of ESRD and mortality .
— In a recent analysis of 26 643 US adults, the addition of cystatin C to the combination of creatinine and albumin-to-creatinine ratio resulted in a significant improvement in the prediction of both all-cause mortality and the development of ESRD .42
Cardiovascular Disease
●● Data from a large national cohort found higher values of cystatin C to be associated with prevalent stroke, angina, and MI,43 as well as higher BMI .44
●● Elevated cystatin C was an independent risk factor for HF,45,46 PAD events,47 clinical atherosclerosis, and subclini-cal measures of CVD in older adults,48 as well as for cardio-vascular events among those with CHD .39,49
●● In several diverse cohorts, elevated cystatin C has been found to be associated with CVD-related mortality,41,50,51 including sudden cardiac death .52
●● In a recent clinical trial of 9270 patients with CKD, the effect of lipid-lowering therapy with simvastatin/ezetimibe was associated with a lower risk for major atherosclerotic events compared with placebo .53
References 1 . US Renal Data System . USRDS 2012 Annual Data Report: Atlas of
Chronic Kidney Disease and End-Stage Renal Disease. Bethesda, MD: National Institutes of Health, National Institute of Diabetes and Digestive and Kidney Diseases; 2012 . http://www .usrds .org/atlas .aspx . Accessed November 12, 2012 .
2 . Hsu CY, Iribarren C, McCulloch CE, Darbinian J, Go AS . Risk fac-tors for end-stage renal disease: 25-year follow-up . Arch Intern Med . 2009;169:342–350 .
3 . Hsu CY, McCulloch CE, Darbinian J, Go AS, Iribarren C . Elevated blood pressure and risk of end-stage renal disease in subjects without baseline kidney disease . Arch Intern Med . 2005;165:923–928 .
4 . Hsu CY, Lin F, Vittinghoff E, Shlipak MG . Racial differences in the pro-gression from chronic renal insufficiency to end-stage renal disease in the United States . J Am Soc Nephrol . 2003;14:2902–2907 .
5 . Choi AI, Rodriguez RA, Bacchetti P, Bertenthal D, Hernandez GT, O’Hare AM . White/black racial differences in risk of end-stage renal disease and death . Am J Med . 2009;122:672–678 .
6 . Hsu CY, McCulloch CE, Iribarren C, Darbinian J, Go AS . Body mass in-dex and risk for end-stage renal disease . Ann Intern Med . 2006;144:21–28 .
7 . Snyder JJ, Foley RN, Collins AJ . Prevalence of CKD in the United States: a sensitivity analysis using the National Health and Nutrition Examination Survey (NHANES) 1999-2004 . Am J Kidney Dis . 2009;53:218–228 .
8 . Coresh J, Selvin E, Stevens LA, Manzi J, Kusek JW, Eggers P, Van Lente F, Levey AS . Prevalence of chronic kidney disease in the United States . JAMA . 2007;298:2038–2047 .
9 . Levey AS, Coresh J, Balk E, Kausz AT, Levin A, Steffes MW, Hogg RJ, Perrone RD, Lau J, Eknoyan G; National Kidney Foundation . National Kidney Foundation practice guidelines for chronic kidney disease: evalua-tion, classification, and stratification [published correction appears in Ann Intern Med . 2003;139:605] . Ann Intern Med . 2003;139:137–147 .
10 . Centers for Disease Control and Prevention (CDC) . Hospitalization dis-charge diagnoses for kidney disease: United States, 1980–2005 . MMWR Morb Mortal Wkly Rep . 2008;57:309–312 .
11 . Centers for Disease Control and Prevention (CDC) . Prevalence of chronic kidney disease and associated risk factors: United States, 1999–2004 . MMWR Morb Mortal Wkly Rep . 2007;56:161–165 .
12 . Toto RD, Greene T, Hebert LA, Hiremath L, Lea JP, Lewis JB, Pogue V, Sika M, Wang X; AASK Collaborative Research Group . Relationship between body mass index and proteinuria in hypertensive nephrosclerosis: results from the African American Study of Kidney Disease and Hyperten-sion (AASK) cohort . Am J Kidney Dis . 2010;56:896–906 .
13 . Hallan SI, Ritz E, Lydersen S, Romundstad S, Kvenild K, Orth SR . Com-bining GFR and albuminuria to classify CKD improves prediction of ESRD . J Am Soc Nephrol . 2009;20:1069–1077 .
14 . Coresh J, Astor B, Sarnak MJ . Evidence for increased cardiovascular dis-ease risk in patients with chronic kidney disease . Curr Opin Nephrol Hy-pertens . 2004;13:73–81 .
15 . Sarnak MJ, Coronado BE, Greene T, Wang SR, Kusek JW, Beck GJ, Levey AS . Cardiovascular disease risk factors in chronic renal insufficiency . Clin Nephrol . 2002;57:327–335 .
16 . Weiner DE, Tabatabai S, Tighiouart H, Elsayed E, Bansal N, Griffith J, Salem DN, Levey AS, Sarnak MJ . Cardiovascular outcomes and all-cause mortality: exploring the interaction between CKD and cardiovascular dis-ease . Am J Kidney Dis . 2006;48:392–401 .
17 . Go AS, Chertow GM, Fan D, McCulloch CE, Hsu CY . Chronic kidney disease and the risks of death, cardiovascular events, and hospitalization [published correction appears in N Engl J Med . 2008;18:4] . N Engl J Med . 2004;351:1296–1305 .
18 . Weiner DE, Tighiouart H, Stark PC, Amin MG, MacLeod B, Griffith JL, Salem DN, Levey AS, Sarnak MJ . Kidney disease as a risk fac-tor for recurrent cardiovascular disease and mortality . Am J Kidney Dis . 2004;44:198–206 .
19 . Alonso A, Lopez FL, Matsushita K, Loehr LR, Agarwal SK, Chen LY, Soliman EZ, Astor BC, Coresh J . Chronic kidney disease is associated with the incidence of atrial fibrillation: the Atherosclerosis Risk in Com-munities (ARIC) study . Circulation . 2011;123:2946–2953 .
20 . Mann JF, Gerstein HC, Pogue J, Bosch J, Yusuf S . Renal insufficiency as a predictor of cardiovascular outcomes and the impact of ramipril: the HOPE randomized trial . Ann Intern Med . 2001;134:629–636 .
21 . Fried LF, Shlipak MG, Crump C, Bleyer AJ, Gottdiener JS, Kronmal RA, Kuller LH, Newman AB . Renal insufficiency as a predictor of cardiovas-cular outcomes and mortality in elderly individuals . J Am Coll Cardiol . 2003;41:1364–1372 .
22 . Shlipak MG, Fried LF, Cushman M, Manolio TA, Peterson D, Stehman-Breen C, Bleyer A, Newman A, Siscovick D, Psaty B . Cardiovascular mortality risk in chronic kidney disease: comparison of traditional and novel risk factors . JAMA . 2005;293:1737–1745 .
23 . Ruilope LM, Salvetti A, Jamerson K, Hansson L, Warnold I, Wedel H, Zanchetti A . Renal function and intensive lowering of blood pressure in hypertensive participants of the Hypertension Optimal Treatment (HOT) study . J Am Soc Nephrol . 2001;12:218–225 .
24 . Manjunath G, Tighiouart H, Ibrahim H, MacLeod B, Salem DN, Griffith JL, Coresh J, Levey AS, Sarnak MJ . Level of kidney function as a risk factor for atherosclerotic cardiovascular outcomes in the community . J Am Coll Cardiol . 2003;41:47–55 .
25 . Hailpern SM, Cohen HW, Alderman MH . Renal dysfunction and isch-emic heart disease mortality in a hypertensive population . J Hypertens . 2005;23:1809–1816 .
26 . Palmer SC, Hayen A, Macaskill P, Pellegrini F, Craig JC, Elder GJ, Strip-poli GF . Serum levels of phosphorus, parathyroid hormone, and cal-cium and risks of death and cardiovascular disease in individuals with
by guest on December 16, 2013http://circ.ahajournals.org/Downloaded from
Heart Disease and Stroke Statistics—2013 Update: Chapter 12 e107
chronic kidney disease: a systematic review and meta-analysis . JAMA . 2011;305:1119–1127 .
27 . Arnlöv J, Evans JC, Meigs JB, Wang TJ, Fox CS, Levy D, Benjamin EJ, D’Agostino RB, Vasan RS . Low-grade albuminuria and incidence of car-diovascular disease events in nonhypertensive and nondiabetic individu-als: the Framingham Heart Study . Circulation . 2005;112:969–975 .
28 . Klausen K, Borch-Johnsen K, Feldt-Rasmussen B, Jensen G, Clausen P, Scharling H, Appleyard M, Jensen JS . Very low levels of microalbumin-uria are associated with increased risk of coronary heart disease and death independently of renal function, hypertension, and diabetes . Circulation . 2004;110:32–35 .
29 . Gerstein HC, Mann JF, Yi Q, Zinman B, Dinneen SF, Hoogwerf B, Hallé JP, Young J, Rashkow A, Joyce C, Nawaz S, Yusuf S; HOPE Study Inves-tigators . Albuminuria and risk of cardiovascular events, death, and heart failure in diabetic and nondiabetic individuals . JAMA . 2001;286:421–426 .
30 . Yuyun MF, Adler AI, Wareham NJ . What is the evidence that microal-buminuria is a predictor of cardiovascular disease events? Curr Opin Nephrol Hypertens . 2005;14:271–276 .
31 . Wattanakit K, Folsom AR, Criqui MH, Kramer HJ, Cushman M, Shea S, Hirsch AT . Albuminuria and peripheral arterial disease: results from the Multi-Ethnic Study of Atherosclerosis (MESA) . Atherosclerosis . 2008;201:212–216 .
32 . Brantsma AH, Bakker SJ, Hillege HL, de Zeeuw D, de Jong PE, Gan-sevoort RT; PREVEND Study Group . Cardiovascular and renal outcome in subjects with K/DOQI stage 1-3 chronic kidney disease: the importance of urinary albumin excretion . Nephrol Dial Transplant . 2008;23:3851–3858 .
33 . Matsushita K, van der Velde M, Astor BC, Woodward M, Levey AS, de Jong PE, Coresh J, Gansevoort RT; Chronic Kidney Disease Prognosis Consortium . Association of estimated glomerular filtra-tion rate and albuminuria with all-cause and cardiovascular mortality in general population cohorts: a collaborative meta-analysis . Lancet . 2010;375:2073–2081 .
34 . Hemmelgarn BR, Manns BJ, Lloyd A, James MT, Klarenbach S, Quinn RR, Wiebe N, Tonelli M; Alberta Kidney Disease Network . Relation between kidney function, proteinuria, and adverse outcomes . JAMA . 2010;303:423–429 .
35 . Fox CS, Muntner P, Chen AY, Alexander KP, Roe MT, Cannon CP, Sauce-do JF, Kontos MC, Wiviott SD; Acute Coronary Treatment and Interven-tion Outcomes Network Registry . Use of evidence-based therapies in short-term outcomes of ST-segment elevation myocardial infarction and non–ST-segment elevation myocardial infarction in patients with chronic kidney disease: a report from the National Cardiovascular Data Acute Coronary Treatment and Intervention Outcomes Network registry . Circu-lation . 2010;121:357–365 .
36 . Filler G, Bökenkamp A, Hofmann W, Le Bricon T, Martínez-Brú C, Grubb A . Cystatin C as a marker of GFR: history, indications, and future research . Clin Biochem . 2005;38:1–8 .
37 . Stevens LA, Coresh J, Schmid CH, Feldman HI, Froissart M, Kusek J, Rossert J, Van Lente F, Bruce RD 3rd, Zhang YL, Greene T, Levey AS . Estimating GFR using serum cystatin C alone and in combination with serum creatinine: a pooled analysis of 3,418 individuals with CKD . Am J Kidney Dis . 2008;51:395–406 .
38 . Schwartz GJ, Muñoz A, Schneider MF, Mak RH, Kaskel F, Warady BA, Furth SL . New equations to estimate GFR in children with CKD . J Am Soc Nephrol . 2009;20:629–637 .
39 . Ix JH, Shlipak MG, Chertow GM, Whooley MA . Association of cystatin C with mortality, cardiovascular events, and incident heart failure among persons with coronary heart disease: data from the Heart and Soul Study . Circulation . 2007;115:173–179 .
40 . Fried LF, Katz R, Sarnak MJ, Shlipak MG, Chaves PH, Jenny NS, Stehm-an-Breen C, Gillen D, Bleyer AJ, Hirsch C, Siscovick D, Newman AB . Kidney function as a predictor of noncardiovascular mortality . J Am Soc Nephrol . 2005;16:3728–3735 .
41 . Shlipak MG, Wassel Fyr CL, Chertow GM, Harris TB, Kritchevsky SB, Tylavsky FA, Satterfield S, Cummings SR, Newman AB, Fried LF . Cys-tatin C and mortality risk in the elderly: the Health, Aging, and Body Composition study . J Am Soc Nephrol . 2006;17:254–261 .
42 . Peralta CA, Shlipak MG, Judd S, Cushman M, McClellan W, Zakai NA, Safford MM, Zhang X, Muntner P, Warnock D . Detection of chronic kid-ney disease with creatinine, cystatin C, and urine albumin-to-creatinine ratio and association with progression to end-stage renal disease and mor-tality . JAMA . 2011;305:1545–1552 .
43 . Muntner P, Mann D, Winston J, Bansilal S, Farkouh ME . Serum cystatin C and increased coronary heart disease prevalence in US adults without chronic kidney disease . Am J Cardiol . 2008;102:54–57 .
44 . Muntner P, Winston J, Uribarri J, Mann D, Fox CS . Overweight, obesity, and elevated serum cystatin C levels in adults in the United States . Am J Med . 2008;121:341–348 .
45 . Djoussé L, Kurth T, Gaziano JM . Cystatin C and risk of heart failure in the Physicians’ Health Study (PHS) . Am Heart J . 2008;155:82–86 .
46 . Sarnak MJ, Katz R, Stehman-Breen CO, Fried LF, Jenny NS, Psaty BM, Newman AB, Siscovick D, Shlipak MG; Cardiovascular Health Study . Cystatin C concentration as a risk factor for heart failure in older adults . Ann Intern Med . 2005;142:497–505 .
47 . O’Hare AM, Newman AB, Katz R, Fried LF, Stehman-Breen CO, Seliger SL, Siscovick DS, Shlipak MG . Cystatin C and incident peripheral arte-rial disease events in the elderly: results from the Cardiovascular Health Study . Arch Intern Med . 2005;165:2666–2670 .
48 . Shlipak MG, Katz R, Kestenbaum B, Fried LF, Siscovick D, Sarnak MJ . Clinical and subclinical cardiovascular disease and kidney function de-cline in the elderly . Atherosclerosis . 2009;204:298–303 .
49 . Koenig W, Twardella D, Brenner H, Rothenbacher D . Plasma concentra-tions of cystatin C in patients with coronary heart disease and risk for secondary cardiovascular events: more than simply a marker of glomerular filtration rate . Clin Chem . 2005;51:321–327 .
50 . Keller T, Messow CM, Lubos E, Nicaud V, Wild PS, Rupprecht HJ, Bickel C, Tzikas S, Peetz D, Lackner KJ, Tiret L, Münzel TF, Blankenberg S, Schnabel RB . Cystatin C and cardiovascular mortality in patients with coronary artery disease and normal or mildly reduced kidney function: results from the AtheroGene study . Eur Heart J . 2009;30:314–320 .
51 . Deo R, Fyr CL, Fried LF, Newman AB, Harris TB, Angleman S, Green C, Kritchevsky SB, Chertow GM, Cummings SR, Shlipak MG; Health ABC study . Kidney dysfunction and fatal cardiovascular disease: an associa-tion independent of atherosclerotic events: results from the Health, Ag-ing, and Body Composition (Health ABC) study . Am Heart J . 2008;155: 62–68 .
52 . Deo R, Sotoodehnia N, Katz R, Sarnak MJ, Fried LF, Chonchol M, Kes-tenbaum B, Psaty BM, Siscovick DS, Shlipak MG . Cystatin C and sud-den cardiac death risk in the elderly . Circ Cardiovasc Qual Outcomes . 2010;3:159–164 .
53 . Baigent C, Landray MJ, Reith C, Emberson J, Wheeler DC, Tomson C, Wanner C, Krane V, Cass A, Craig J, Neal B, Jiang L, Hooi LS, Levin A, Agodoa L, Gaziano M, Kasiske B, Walker R, Massy ZA, Feldt-Rasmussen B, Krairittichai U, Ophascharoensuk V, Fellström B, Holdaas H, Tesar V, Wiecek A, Grobbee D, de Zeeuw D, Grönhagen-Riska C, Dasgupta T, Lewis D, Herrington W, Mafham M, Majoni W, Wallendszus K, Grimm R, Pedersen T, Tobert J, Armitage J, Baxter A, Bray C, Chen Y, Chen Z, Hill M, Knott C, Parish S, Simpson D, Sleight P, Young A, Collins R; SHARP
by guest on December 16, 2013http://circ.ahajournals.org/Downloaded from

e108 Circulation January 1/8, 2013
Investigators . The effects of lowering LDL cholesterol with simvastatin plus ezetimibe in patients with chronic kidney disease (Study of Heart and Renal Protection): a randomised placebo-controlled trial . Lancet . 2011;377:2181–2192 .
Table 12-3. Adjusted HR (95% CI) for Death of Any Cause, Cardiovascular Events, and Hospitalization Among 1 120 295 Ambulatory Adults, According to eGFR*
eGFR, mL·min−1·1.73 m−2
Death of Any Cause
Any Cardiovascular Event
Any Hospitalization
≥60† 1.00 1.00 1.00
45–59 1.2 (1.1–1.2) 1.4 (1.4–1.5) 1.1 (1.1–1.1)
30–44 1.8 (1.7–1.9) 2.0 (1.9–2.1) 1.5 (1.5–1.5)
15–29 3.2 (3.1–3.4) 2.8 (2.6–2.9) 2.1 (2.0–2.2)
<15 5.9 (5.4–6.5) 3.4 (3.1–3.8) 3.1 (3.0–3.3)
HR indicates hazard ratio; CI, confidence interval; and eGFR, estimated glomerular filtration rate.
*The analyses were adjusted for age, sex, income, education, use or nonuse of dialysis, and presence or absence of prior coronary heart disease, prior chronic heart failure, prior ischemic stroke or transient ischemic attack, prior peripheral arterial disease, diabetes mellitus, hypertension, dyslipidemia, a serum albumin level ≤3.5 g/dL, dementia, cirrhosis or chronic liver disease, chronic lung disease, documented proteinuria, and prior hospitalizations.
†This group served as the reference group.
Table 12-1. BP and the Adjusted Risk of ESRD Among 316 675 Adults Without Evidence of Baseline Kidney Disease
JNC V BP Category Adjusted RR (95% CI)
Optimal 1.00 (Reference)
Normal, not optimal 1.62 (1.27–2.07)
High normal 1.98 (1.55–2.52)
Hypertension
Stage 1 2.59 (2.07–3.25)
Stage 2 3.86 (3.00–4.96)
Stage 3 3.88 (2.82–5.34)
Stage 4 4.25 (2.63–6.86)
BP indicates blood pressure; ESRD, end-stage renal disease; JNC V, fifth report of the Joint National Committee on Prevention, Detection, Evaluation, and Treatment of High Blood Pressure; RR, relative risk; and CI, confidence interval.
Table 12-2. Multivariable Association Between BMI and Risk of ESRD Among 320 252 Adults
BMI, kg/m2 Adjusted RR (95% CI)
18.5–24.9 (Normal weight) 1.00 (Reference)
25.0–29.9 (Overweight) 1.87 (1.64–2.14)
30.0–34.9 (Class I obesity) 3.57 (3.05–4.18)
35.0–39.9 (Class II obesity) 6.12 (4.97–7.54)
≥40.0 (Extreme obesity) 7.07 (5.37–9.31)
BMI indicates body mass index; ESRD, end-stage renal disease; RR, relative risk; and CI, confidence interval.
by guest on December 16, 2013http://circ.ahajournals.org/Downloaded from
Heart Disease and Stroke Statistics—2013 Update: Chapter 13 e109
13. Total Cardiovascular Diseases
ICD-9 390 to 459, 745 to 747; ICD-10 I00 to I99, Q20 to Q28; see Glossary (Chapter 25) for details and definitions.
See Tables 13-1 through 13-4 and Charts 13-1 through 13-21.
Prevalence(See Table 13-1 and Chart 13-1 .)
An estimated 83 .6 million American adults (>1 in 3) have 1 or more types of CVD . Of these, 42 .2 million are estimated to be ≥60 years of age . Total CVD includes diseases listed in the bullet points below, with the exception of congenital CVD . Because of overlap across conditions, it is not possible to add these conditions to arrive at a total of unique individuals .
●● HBP—77 .9 million (defined as systolic pressure ≥140 mm Hg and/or diastolic pressure ≥90 mm Hg, use of antihyperten-sive medication, or being told at least twice by a physician or other health professional that one has HBP) .
●● CHD—15 .4 million
—MI (heart attack)—7 .6 million—AP (chest pain)—7 .8 million—HF—5 .1 million—Stroke (all types)—6 .8 million—Congenital cardiovascular defects— 650 000 to 1 .3 million
●● The following age-adjusted prevalence estimates from the NHIS, NCHS are for diagnosed conditions for people ≥18 years of age in 20111:
—Among whites only, 11 .1% have HD, 6 .3% have CHD, 23 .3% have hypertension, and 2 .3% have had a stroke .
—Among blacks or African Americans, 10 .7% have HD, 6 .9% have CHD, 33 .4% have hypertension, and 4 .5% have had a stroke .
—Among Hispanics or Latinos, 8 .6% have HD, 5 .9% have CHD, 22 .2% have hypertension, and 2 .8% have had a stroke .
—Among Asians, 7 .4% have HD, 4 .3% have CHD, 18 .7% have hypertension, and 2 .7% have had a stroke .
—Among American Indians or Alaska Natives, 12 .7% have HD, 7 .2% have CHD, 25 .8% have hypertension, and 4 .6% have had a stroke .
—Among Native Hawaiians or other Pacific Islanders, 21 .8% have hypertension . Statistics for the other condi-tions for this group are not shown because of unreliability .
●● Asian Indian adults (9%) are ≈2-fold more likely than Korean adults (4%) to have ever been told they have HD, based on data for 2004 to 2006 .2
●● By 2030, 40 .8% of the US population is projected to have some form of CVD (unpublished AHA computation, based on methodology described in Heidenreich et al3) .
Incidence(See Chart 13-2 .)
●● On the basis of the NHLBI’s FHS original and offspring cohort data from 1980 to 20034
—The average annual rates of first cardiovascular events rise from 3 per 1000 men at 35 to 44 years of age to 74 per 1000 men at 85 to 94 years of age . For women, comparable rates occur 10 years later in life . The gap narrows with advancing age .
—Before 75 years of age, a higher proportion of CVD events attributable to CHD occur in men than in women, and a higher proportion of events attributable to stroke occur in women than in men .
Abbreviations Used in Chapter 13
AHA American Heart Association
AMI acute myocardial infarction
AP angina pectoris
ARIC Atherosclerosis Risk in Communities study
BMI body mass index
BP blood pressure
BRFSS Behavioral Risk Factor Surveillance System
CABG cardiac revascularization (coronary artery bypass graft)
CAD coronary artery disease
CARDIA Coronary Artery Risk Development in Young Adults
CDC Centers for Disease Control and Prevention
CHD coronary heart disease
CHF congestive heart failure
CLRD chronic lower respiratory disease
CVD cardiovascular disease
DM diabetes mellitus
ED emergency department
FHS Framingham Heart Study
HBP high blood pressure
HCM hypertrophic cardiomyopathy
HD heart disease
HDL high-density lipoprotein
HF heart failure
ICD-9 International Classification of Diseases, 9th Revision
ICD-10 International Classification of Diseases, 10th Revision
LDL low-density lipoprotein
MEPS Medical Expenditure Panel Survey
MESA Multi-Ethnic Study of Atherosclerosis
MI myocardial infarction
NAMCS National Ambulatory Medical Care Survey
NCHS National Center for Health Statistics
NH non-Hispanic
NHAMCS National Hospital Ambulatory Medical Care Survey
NHANES National Health and Nutrition Examination Survey
NHDS National Hospital Discharge Survey
NHIS National Health Interview Survey
NHHCS National Home and Hospice Care Survey
NHLBI National Heart, Lung, and Blood Institute
NNHS National Nursing Home Survey
PA physical activity
PCI percutaneous coronary intervention
RR relative risk
SBP systolic blood pressure
UA unstable angina
AHA Statistical Update by guest on December 16, 2013http://circ.ahajournals.org/Downloaded from

e110 Circulation January 1/8, 2013
●● Among American Indian men 45 to 74 years of age, the incidence of CVD ranges from 15 to 28 per 1000 popula-tion . Among women, it ranges from 9 to 15 per 1000 .5
●● Data from the FHS indicate that the subsequent lifetime risk for all CVD in recipients starting free of known disease is almost 2 in 3 for men and >1 in 2 for women at 45 years of age (Table 13-4) .5a
●● Analysis of FHS data among participants free of CVD at 50 years of age showed the lifetime risk for developing CVD was 51 .7% for men and 39 .2% for women . Median overall survival was 30 years for men and 36 years for women .6
Mortality(See Tables 13-1 through 13-3 and Charts 13-3 through 13-18 .)
ICD-10 I00 to I99, Q20 to Q28 for CVD (CVD mortality includes congenital cardiovascular defects); C00 to C97 for cancer; C33 to C34 for lung cancer; C50 for breast cancer; J40 to J47 for chronic lower respiratory disease (CLRD); G30 for Alzheimer disease; E10 to E14 for DM; and V01 to X59, Y85 to Y86 for accidents.
●● Mortality data show that CVD (I00–I99, Q20–Q28) as the listed underlying cause of death (including congenital car-diovascular defects) accounted for 32 .3% (787 931) of all 2 437 163 deaths in 2009, or ≈1 of every 3 deaths in the United States . CVD any-mentions (1 330 137 deaths in 2009) constituted 54 .6% of all deaths that year (NHLBI; NCHS public use data files) .7
●● In every year since 1900 except 1918, CVD accounted for more deaths than any other major cause of death in the United States .8,9
●● On average, >2150 Americans die of CVD each day, an average of 1 death every 40 seconds . CVD currently claims more lives each year than cancer and CLRD combined .7
●● The 2009 death rate attributable to CVD (I00–I99) was 236 .1 (excluding congenital cardiovascular defects) (NCHS) .7 The rates were 281 .4 for white males, 387 .0 for black males, 190 .4 for white females, and 267 .9 for black females . From 1999 to 2009, death rates attributable to CVD (ICD-10 I00–I99) declined 32 .7% . In the same 10-year period, the actual number of CVD deaths per year declined by 17 .8% (AHA computation) .7
●● Among other causes of death in 2009, cancer caused 567 628 deaths; CLRD, 137 353; accidents, 118 021; and Alzheimer disease, 79 003 .7
●● The 2009 CVD (I00–I99) death rates were 287 .2 for males and 196 .1 for females . There were 40 678 deaths attrib-utable to breast cancer in females in 2009; lung cancer claimed 70 389 females . Death rates for females were 22 .3 for breast cancer and 38 .5 for lung cancer . One in 30 deaths of females was attributable to breast cancer, whereas 1 in 6 .9 was attributable to CHD . For comparison, 1 in 4 .5 females died of cancer, whereas 1 in 3 .0 died of CVD (I0–I99, Q20–Q28) . On the basis of 2009 mortality data, CVD caused ≈1 death per minute among females, or 401 495 deaths . That represents approximately the same number of female lives that were claimed by cancer, CLRD, and Alzheimer disease combined (unpublished AHA tabulation) .7
●● Approximately 150 000 Americans died of CVD (I00–I99) in 2009 who were <65 years of age, and 34% of deaths
attributed to CVD occurred before the age of 75 years,7 which is well below the average life expectancy of 78 .5 years .8
●● According to the NCHS, if all forms of major CVD were eliminated, life expectancy could rise by almost 7 years . If all forms of cancer were eliminated, the estimated gain could be 3 years . According to the same study, the probabil-ity at birth of eventually dying of major CVD (I00–I78) is 47%, and the chance of dying of cancer is 22% . Additional probabilities are 3% for accidents, 2% for DM (unrelated to CVD), and 0 .7% for HIV .10
●● In 2009, the leading causes of death in women ≥65 years of age were diseases of the heart (No . 1), cancer (No . 2), stroke (No . 3), and CLRD (No . 4) . In older men, they were diseases of the heart (No . 1), cancer (No . 2), CLRD (No . 3), and stroke (No . 4) .7
●● A study of the decrease in US deaths attributable to CHD from 1980 to 2000 suggests that ≈47% of the decrease was attributable to increased use of evidence-based medical therapies and 44% to changes in risk factors in the popu-lation attributable to lifestyle and environmental changes .9
●● Analysis of data from NCHS was used to determine the number of disease-specific deaths attributable to all non-optimal levels of each risk factor exposure, by age and sex . In 2005, tobacco smoking and HBP were estimated to be responsible for 467 000 deaths, accounting for ≈1 in 5 or 6 deaths among US adults . Overweight/obesity and physical inactivity were each estimated to be responsible for nearly 1 in 10 deaths . High dietary salt, low dietary omega-3 fatty acids, and high dietary trans fatty acids were the dietary risks with the largest estimated excess mortality effects .10
Aftermath
●● Among an estimated 45 million people with functional dis-abilities in the United States, HD, stroke, and hypertension are among the 15 leading conditions that caused those dis-abilities . Disabilities were defined as difficulty with activi-ties of daily living or instrumental activities of daily living, specific functional limitations (except vision, hearing, or speech), and limitation in ability to do housework or work at a job or business .11
Awareness of Warning Signs and Risk Factors for CVD
●● Surveys conducted by the AHA in 1997, 2000, 2003, 2006, and 2009 to evaluate trends in women’s awareness, knowl-edge, and perceptions related to CVD found that in 2009, awareness of HD as the leading cause of death among women was 54%, significantly higher than in 1997 .12 Awareness was 66% lower among black and Hispanic women than among white women,13 and the racial/ethnic difference has not changed appreciably over time . Aware-ness of HD as the leading cause of death among women has approximately doubled among white and Hispanic women and tripled among black women between the first survey in 1997 and the current 2009 survey . However, after adjust-ment for age and education level, African American, His-panic, and Asian women were significantly less likely to be aware that HD/heart attack is the leading cause of death than white women .12 Awareness of heart attack signs was low for all racial/ethnic and age groups surveyed .13
by guest on December 16, 2013http://circ.ahajournals.org/Downloaded from

Heart Disease and Stroke Statistics—2013 Update: Chapter 13 e111
●● A total of 875 students in 4 Michigan high schools were given a survey to obtain data on the perception of risk factors and other knowledge-based assessment questions about CVD . Accidents were rated as the greatest perceived lifetime health risk (39%) . Nearly 17% selected CVD as the greatest lifetime risk, which made it the third most popular choice after accidents and cancer . When asked to identify the greatest cause of death for each sex, 42% cor-rectly recognized CVD for men, and 14% correctly recog-nized CVD for women; 40% incorrectly chose abuse/use behavior with a substance other than cigarettes as the most important CVD risk behavior .14
Awareness of Cardiopulmonary Resuscitation
●● Seventy-nine percent of the lay public are confident that they know what actions to take in a medical emergency; 98% recognize an automated external defibrillator as some-thing that administers an electric shock to restore a normal heart beat among victims of sudden cardiac arrest; and 60% are familiar with cardiopulmonary resuscitation (Harris Interactive survey conducted on behalf of the AHA among 1132 US residents >18 years of age, January 8, 2008, through January 21, 2008) .
Disparities in CVD Risk Factors(See Chart 13-19 .)
●● Data from the 2003 CDC BRFSS survey of adults ≥18 years of age showed the prevalence of respondents who reported having ≥2 risk factors for HD and stroke was suc-cessively higher at higher age groups . The prevalence of having ≥2 risk factors was highest among blacks (48 .7%) and American Indian/Alaska Natives (46 .7%) and lowest among Asians (25 .9%); prevalence was similar in women (36 .4%) and men (37 .8%) . The prevalence of multiple risk factors ranged from 25 .9% among college graduates to 52 .5% among those with less than a high school diploma (or its equivalent) . People reporting household income of ≥$50 000 had the lowest prevalence (28 .8%), and those reporting household income of <$10 000 had the highest prevalence (52 .5%) . Adults who reported being unable to work had the highest prevalence (69 .3%) of ≥2 risk fac-tors, followed by retired people (45 .1%), unemployed adults (43 .4%), homemakers (34 .3%), and employed peo-ple (34 .0%) . Prevalence of ≥2 risk factors varied by state/territory and ranged from 27 .0% (Hawaii) to 46 .2% (Ken-tucky) . Twelve states and 2 territories had a multiple risk factor prevalence of ≥40%: Alabama, Arkansas, Georgia, Indiana, Kentucky, Louisiana, Mississippi, North Carolina, Ohio, Oklahoma, Tennessee, West Virginia, Guam, and Puerto Rico .15
●● Analysis of several data sets by the CDC showed that in adults ≥18 years of age, disparities were common in all risk factors examined . In men, the highest prevalence of obesity (29 .7%) was found in Mexican Americans who had com-pleted a high school education . Black women with or with-out a high school education had a high prevalence of obesity (48 .4%) . Hypertension prevalence was high among blacks (41 .2%) regardless of sex or educational status . Hypercho-lesterolemia was high among white and Mexican American men and white women regardless of educational status . CHD
and stroke were inversely related to education, income, and poverty status . Hospitalization for total HD and AMI was greater among men, but hospitalization for CHF and stroke was greater among women . Among Medicare enrollees, CHF hospitalization was higher among blacks, Hispanics, and American Indian/Alaska Natives than among whites, and stroke hospitalization was highest among blacks . Hospi-talizations for CHF and stroke were highest in the southeast-ern United States . Life expectancy remains higher in women than in men and in whites than in blacks by ≈5 years . CVD mortality at all ages tended to be highest in blacks .16
●● Analysis of >14 000 middle-aged subjects between 1987 and 2002 in the ARIC study sponsored by the NHLBI showed that >90% of CVD events in black subjects, compared with ≈70% in white subjects, appeared to be explained by ele-vated or borderline risk factors . Furthermore, the prevalence of participants with elevated risk factors was higher in black subjects; after accounting for education and known CVD risk factors, the incidence of CVD was identical in black and white subjects . Thus, the observed higher CVD inci-dence rate in black subjects appears to be largely attribut-able to a greater prevalence of elevated risk factors . These results suggest that the primary prevention of elevated risk factors might substantially impact the future incidence of CVD, and these beneficial effects would likely be applicable not only for white but also for black subjects .17
●● Data from the MEPS 2004 Full-Year Data File showed that nearly 26 million US adults ≥18 years of age were told by a doctor that they had HD, stroke, or any other heart-related disease18:
—38 .6% maintained a healthy weight . Among those told that they had HD, 33 .9% had a healthy weight compared with 39 .3% who had never been told they had HD .
—78 .8% did not currently smoke . Among those ever told that they had indicators of HD, 18 .3% continued to smoke .
—More than 93% engaged in at least 1 recommended behavior for prevention of HD: 75 .5% engaged in 1 or 2; 18% engaged in all 3; and 6 .5% did not engage in any of the recommended behaviors .
—Age-based variations:
○ Moderate to vigorous PA ≥3 times per week varied according to age . Younger people (18–44 years of age) were more likely (59 .9%) than those who were older (45–64 and ≥65 years of age, 55 .3% and 48 .5%, respectively) to engage in regular PA .
○ A greater percentage of those 18 to 44 years of age had a healthy weight (43 .7%) than did those 45 to 64 years of age and ≥65 years of age (31 .4% and 37 .3%, respectively) .
○ People ≥65 years of age were more likely to be cur-rent nonsmokers (89 .7%) than were people 18 to 44 years of age and 45 to 64 years of age (76 .1% and 77 .7%, respectively) .
—Race/ethnicity-based variations:
○● Non-Hispanic whites were more likely than Hispan-ics or non-Hispanic blacks to engage in moderate to vigorous PA (58 .5% versus 51 .4% and 52 .5%, respectively) .
by guest on December 16, 2013http://circ.ahajournals.org/Downloaded from
e112 Circulation January 1/8, 2013
○ Non-Hispanic whites were more likely to have main-tained a healthy weight than were Hispanics or non-Hispanic blacks (39 .8% versus 32 .1% and 29 .7%, respectively) .
○ Hispanics were more likely to be nonsmokers (84 .2%) than were non-Hispanic whites and non-Hispanic blacks (77 .8% and 76 .3%, respectively) .
—Sex-based variations:
○ Men were more likely to have engaged in moderate to vigorous PA ≥3 times per week than women (60 .3% versus 53 .1%, respectively) .
○ Women were more likely than men to have maintained a healthy weight (45 .1% versus 31 .7%, respectively) .
○ 81 .7% of women did not currently smoke, compared with 75 .7% of men .
—Variations based on education level:
○ A greater percentage of adults with at least some col-lege education engaged in moderate to vigorous PA ≥3 times per week (60 .8%) than did those with a high school education or less than a high school education (55 .3% and 48 .3%, respectively) .
○ A greater percentage of adults with at least some col-lege education had a healthy weight (41 .2%) than did those with a high school or less than high school edu-cation (36 .2% and 36 .1%, respectively) .
○ There was a greater percentage of nonsmokers among those with a college education (85 .5%) than among those with a high school or less than high school edu-cation (73 .8% and 69 .9%, respectively) .
●● A study of nearly 1500 participants in the MESA study found that Hispanics with hypertension, hypercholesterol-emia, and/or DM who speak Spanish at home and/or have spent less than half a year in the United States have higher SBP, LDL cholesterol, and fasting blood glucose, respec-tively, than Hispanics who speak English and who have lived a longer period of time in the United States .19
Family History of CVD
●● A family history of CVD increases risk of CVD, with the largest increase in risk if the family member’s CVD was premature .20
●● There is consistent evidence from multiple large-scale pro-spective epidemiology studies for a strong and significant association of a reported family history of premature paren-tal CHD with incident MI or CHD in offspring . In the FHS, the occurrence of a validated premature atherosclerotic CVD event in either a parent21 or a sibling22 was associ-ated with an ≈2-fold elevated risk for CVD, independent of other traditional risk factors .
●● Addition of family history of premature CVD to a model that contained traditional risk factors provided modestly improved prognostic value in the FHS .21 Family history of premature MI is also an independent risk factor in other multivariable risk models that contain traditional risk fac-tors in large cohorts of women23 and men .24
●● Parental history of premature CHD is associated with increased burden of subclinical atherosclerosis in the coro-nary arteries and the abdominal aorta .25,26
●● In the FHS, a parental history of validated HF was associ-ated with a 1 .7-fold higher risk of HF in offspring, after multivariable adjustment .27
●● A family history of early-onset sudden cardiac death in a first-degree relative is associated with a >2-fold higher risk for sudden cardiac death in offspring on the basis of avail-able case-control studies .28
●● The 2004 HealthStyles survey of 4345 people in the United States indicated that most respondents believe that knowing their family history is important for their own health, but few are aware of the specific health information from rela-tives necessary to develop a family history .29
●● An accurate and complete family history may identify rare mendelian conditions such as hypertrophic cardiomyopa-thy (HCM), long-QT syndrome, or familial hypercholes-terolemia . However, in the majority of people with a family history of a CVD event, a known rare mendelian condition is not identified .
●● Studies are under way to determine genetic variants that may help identify individuals at increased risk of CVD .
Outcomes Associated With Healthy Lifestyle and Low Risk Factor LevelsMuch of the literature on CVD has focused on factors associ-ated with increasing risk for CVD and on factors associated with poorer outcomes in the presence of CVD; however, in recent years, a number of studies have defined the potential beneficial effects of healthy lifestyle factors and lower CVD risk factor burden on CVD outcomes and longevity . These studies suggest that prevention of risk factor development at younger ages may be the key to “successful aging,” and they highlight the need for evaluation of the potential benefits of intensive prevention efforts at younger and middle ages once risk factors develop to increase the likelihood of healthy longevity .
●● Data from the Cardiovascular Lifetime Risk Pooling Proj-ect, which involved 18 cohort studies and combined data on 257 384 black men and women and white men and women, indicate that at 45 years of age, participants with an optimal risk factor profile had a substantially lower lifetime risk of CVD events than those with 1 major risk factor (1 .4% ver-sus 39 .6% among men, 4 .1% versus 20 .2% among women) . The presence of ≥2 major risk factors further increased life-time risk to 49 .5% in men and 30 .7% in women .30
●● A recent study examined the association between low lifetime predicted risk for CVD (ie, having all optimal or near-optimal risk factor levels) and burden of subclini-cal atherosclerosis in younger adults in the CARDIA and MESA studies of the NHLBI . Among participants <50 years of age, nearly half had low and half had high predicted lifetime risks for CVD . Those with low predicted lifetime risk had lower prevalence and less severe amounts of coro-nary calcification and less carotid intima-media thickening, even at these younger ages, than those with high predicted lifetime risk . During follow-up, those with low predicted lifetime risk also had less progression of coronary calcium .31
●● Among >7900 men and women from the FHS followed up for 111 000 person-years, median survival was highly associated with risk factor presence and burden at 50 years of age . Men and women with optimal risk factors had a
by guest on December 16, 2013http://circ.ahajournals.org/Downloaded from

Heart Disease and Stroke Statistics—2013 Update: Chapter 13 e113
median life expectancy ≥10 years longer than those with ≥2 major risk factors at age 50 years .6
●● In another study, FHS investigators followed up 2531 men and women who were examined between the ages of 40 and 50 years and observed their overall rates of survival and survival free of CVD to 85 years of age and beyond . Low levels of the major risk factors in middle age were associated with overall survival and morbidity-free survival to ≥85 years of age .32
—Overall, 35 .7% survived to the age of 85 years, and 22% survived to that age free of major morbidities .
—Factors associated with survival to the age of 85 years included female sex, lower SBP, lower total cholesterol, better glucose tolerance, absence of current smoking, and higher level of education attained . Factors associ-ated with survival to the age of 85 years free of MI, UA, HF, stroke, dementia, and cancer were nearly identical .
—When adverse levels of 4 of these factors were present in middle age, <5% of men and ≈15% of women survived to 85 years of age .
●● Data from the Chicago Heart Association Detection Proj-ect (1967–1973, with an average follow-up of 31 years) showed the following:
—In younger women (18–39 years of age) with favorable levels for all 5 major risk factors (BP, serum cholesterol, BMI, DM, and smoking), future incidence of CHD and CVD is rare, and long-term and all-cause mortality are much lower than for those who have unfavorable or ele-vated risk factor levels at young ages . Similar findings applied to men in this study .33
—Participants (18–64 years of age at baseline) without a history of MI were investigated to determine whether traditional CVD risk factors were similarly associated with CVD mortality in black and white men and women . In general, the magnitude and direction of associations were similar by race . Most traditional risk factors dem-onstrated similar associations with mortality in black and white adults of the same sex . Small differences were primarily in the strength and not the direction of the association .34
—Remaining lifetime risks for CVD death were noted to increase substantially and in a graded fashion according to the number of risk factors present in middle age (40–59 years of age) . However, remaining lifetime risks for non-CVD death also increased dramatically with increasing CVD risk factor burden . These data help to explain the markedly greater longevity experienced by those who reach middle age free of major CVD risk factors .35
—Presence of a greater number of risk factors in middle age is associated with lower scores at older ages on assessment of social functioning, mental health, walk-ing, and health perception in women, with similar find-ings in men .36
—Risk factor burden in middle age is associated with bet-ter quality of life at follow-up in older age (≈25 years later) and lower average annual Medicare costs at older ages .36,37 Similarly, the existence of a greater number of risk factors in middle age is associated with higher aver-age annual CVD-related and total Medicare costs (once Medicare eligibility is attained) .37
●● A study of 84 129 women enrolled in the Nurses’ Health Study identified 5 healthy lifestyle factors, including absence of current smoking, drinking half a glass or more of wine per day (or equivalent alcohol consump-tion), half an hour or more per day of moderate or vigor-ous PA, BMI <25 kg/m2, and dietary score in the top 40% (which included diets with lower amounts of trans fats, lower glycemic load, higher cereal fiber, higher marine omega-3 fatty acids, higher folate, and higher polyunsatu-rated to saturated fat ratio) . When 3 of the 5 healthy life-style factors were present, the RR for CHD over a 14-year period was 57% lower; when 4 were present, RR was 66% lower; and when all 5 factors were present, RR was 83% lower .38 However, data from NHANES 1999–2002 showed that only approximately one third of adults com-plied with ≥6 of the recommended heart-healthy behav-iors . Dietary recommendations, in general, and daily fruit intake recommendations, in particular, were least likely to be followed .39
●● Among individuals 70 to 90 years of age, adherence to a Mediterranean-style diet and greater PA are associated with 65% to 73% relatively lower rates of all-cause mortality, as well as lower mortality rates attributable to CHD, CVD, and cancer .40
●● Seventeen-year mortality data from the NHANES II Mor-tality Follow-Up Study indicated that the RR for fatal CHD was 51% lower for men and 71% lower for women with none of 3 major risk factors (hypertension, current smok-ing, and elevated total cholesterol [≥240 mg/dL]) than for those with ≥1 risk factor . Had all 3 major risk factors not occurred, it is hypothesized that 64% of all CHD deaths among women and 45% of CHD deaths in men could theo-retically have been avoided .41
Hospital Discharges, Ambulatory Care Visits, Home Healthcare Patients, Nursing Home Residents, and Hospice Care Discharges(See Table 13-1 and Charts 13-20 through 13-21 .)
●● From 2000 to 2010, the number of inpatient discharges from short-stay hospitals with CVD as the first-listed diagnosis decreased from 6 294 000 to 5 802 000 (NHDS, NHLBI tabulation) . In 2010, CVD ranked highest among all disease categories in hospital discharges (NHDS, NHLBI tabulation) .
●● In 2010, there were 94 871 000 physician office visits with a primary diagnosis of CVD (NCHS, NAMCS, NHLBI tabu-lation) . In 2009, there were 4 761 000 ED visits and 7 261 000 hospital outpatient department visits with a primary diagno-sis of CVD (NHAMCS, NHLBI tabulation) .
●● In 2009, ≈1 of every 6 hospital stays, or 6 million, resulted from CVD (Agency for Healthcare Research and Quality, Nationwide Inpatient Sample) . The total inpatient hospital cost for CVD was $71 .2 billion, approximately one fourth of the total cost of inpatient hospital care in the United States . The average cost per hospitalization was ≈41% higher than the average cost for all stays . Hospital admis-sions that originated in the ED accounted for 60 .7% of all hospital stays for CVD . This was 41% higher than the rate of 43 .1% for all types of hospital stays; 3 .3% of patients admitted to the hospital for CVD died in the hospital, which
by guest on December 16, 2013http://circ.ahajournals.org/Downloaded from
e114 Circulation January 1/8, 2013
was significantly higher than the average in-hospital death rate of 2 .1% for all hospitalized patients .42
●● In 2004, CAD was estimated to be responsible for 1 .2 mil-lion hospital stays and was the most expensive condition treated . This condition resulted in >$44 billion in expenses . More than half of the hospital stays for CAD were among patients who also received PCI or coronary artery bypass graft (CABG) during their stay . AMI resulted in $31 billion of inpatient hospital charges for 695 000 hospital stays . The 1 .1 million hospitalizations for CHF amounted to nearly $29 billion in hospital charges .43
●● In 2003, ≈48 .3% of inpatient hospital stays for CVD were for women, who accounted for 42 .8% of the national cost ($187 billion) associated with these conditions . Although only 40% of hospital stays for AMI and CAD were for women, more than half of all stays for nonspecific chest pain, CHF, and stroke were for women . There was no dif-ference between men and women in hospitalizations for cardiac dysrhythmias .44
●● Circulatory disorders were the most frequent reason for admission to the hospital through the ED, accounting for 26 .3% of all admissions through the ED . After pneumonia, the most common heart-related conditions (in descending order) were CHF, chest pain, hardening of the arteries, and heart attack, which together accounted for >15% of all admissions through the ED . Stroke and irregular heartbeat ranked seventh and eighth, respectively .45
●● Among the 1 .5 million nursing home residents each day in 2004, CVD was the leading primary diagnosis; approxi-mately one fourth of nursing home residents had a pri-mary diagnosis of CVD at admission (23 .7% or 353 100 residents) or at the time of interview (25% or 373 000 resi-dents) (NCHS, NNHS) .46
●● Among the 1 .5 million home healthcare patients each day in 2007, CVD was the leading primary diagnosis; almost one fifth of home healthcare patients had a primary diagno-sis of CVD at admission (18 .3% or 267 300 residents) or at the time of interview (18 .9% or 275 700 residents) (NCHS, NHHCS) . The majority (62 .9% or 918 900 patients) of home healthcare patients each day in 2007 had diagnosis of some type of CVD at the time of interview .47
●● Among the 1 .0 million patients discharged from hospice in 2007, CVD was the primary diagnosis for 15 .8% (or 165 100 discharges) at admission and 15 .9% (or 165 700 dis-charges) at discharge . Half (50% or 523 000) of all hospice discharges had a diagnosis of some type of CVD at the time of discharge .47
Operations and Procedures
●● In 2010, an estimated 7 588 000 inpatient cardiovascu-lar operations and procedures were performed in the United States; 4 .4 million were performed on males, and 3 .2 million were performed on females (NHDS, NHLBI tabulation) .
Cost
●● The estimated direct and indirect cost of CVD for 2009 is $312 .6 billion (MEPS, NHLBI tabulation) .
●● By 2030, real (2010$) total direct medical costs of CVD are projected to increase to ≈$1 .48 trillion (AHA computation, based on methodology described by Heidenreich et al3) .
References 1 . Schiller J, Lucas J, Peregoy J . Summary health statistics for U .S . adults:
National Health Interview Survey, 2011 . Vital Health Stat 10 . In press . 2 . Barnes PM, Adams PF, Powell-Griner E . Health Characteristics of the
Asian Adult Population: United States, 2004–2006. Advance Data From Vital and Health Statistics; No . 394 . Hyattsville, MD: National Center for Health Statistics; 2008 .
3 . Heidenreich PA, Trogdon JG, Khavjou OA, Butler J, Dracup K, Ezekowitz MD, Finkelstein EA, Hong Y, Johnston SC, Khera A, Lloyd-Jones DM, Nelson SA, Nichol G, Orenstein D, Wilson PW, Woo YJ; on behalf of the American Heart Association Advocacy Coordinating Committee, Stroke Council, Council on Cardiovascular Radiology and Intervention, Council on Clinical Cardiology, Council on Epidemiology and Prevention, Council on Arteriosclerosis, Thrombosis and Vascular Biology, Council on Cardiopulmonary, Critical Care, Perioperative and Resuscitation, Council on Cardiovascular Nursing, Council on the Kidney in Cardiovascular Disease, Council on Cardiovascular Surgery and Anesthesia, and Interdisciplinary Council on Quality of Care and Outcomes Research . Forecasting the future of cardiovascular disease in the United States: a policy statement from the American Heart Association . Circulation . 2011;123:933–944 .
4 . Incidence and Prevalence: 2006 Chart Book on Cardiovascular and Lung Diseases . Bethesda, MD: National Heart, Lung, and Blood Institute; 2006 .
5 . Ali T, Jarvis B, O’Leary M . Strong Heart Study Data Book: A Report to American Indian Communities . Rockville, MD: National Institutes of Health, National Heart, Lung, and Blood Institute; 2001 .
5a . Wilkins JT, Ning H, Berry J Zhao L, Dyer AR, Lloyd-Jones DM . Lifetime risk and years lived free of total cardiovascular disease . JAMA . 2012;308:1795–1801 .
6 . Lloyd-Jones DM, Leip EP, Larson MG, D’Agostino RB, Beiser A, Wilson PW, Wolf PA, Levy D . Prediction of lifetime risk for cardiovascular disease by risk factor burden at 50 years of age . Circulation . 2006;113:791–798 .
7 . Centers for Disease Control and Prevention, National Center for Health Statistics . Compressed Mortality File 1999-2009 . CDC WONDER Online Database, compiled for Compressed Mortality File 1999–2009 Series 20, No . 20, 2012 . Underlying cause-of-death 1999–2009 . http://wonder .cdc .gov/mortSQl .html . Accessed August 20, 2012 .
8 . Kochanek K, Xu J, Murphy S, Minino A, Kung H . Deaths: Final Data for 2009 . National Vital Statistics Reports . Vol . 60; No . 3 . Hyattsville, MD: National Center for Health Statistics; 2012 .
9 . Ford ES, Ajani UA, Croft JB, Critchley JA, Labarthe DR, Kottke TE, Giles WH, Capewell S . Explaining the decrease in U .S . deaths from coronary disease, 1980-2000 . N Engl J Med . 2007;356:2388–2398 .
10 . Danaei G, Ding EL, Mozaffarian D, Taylor B, Rehm J, Murray CJ, Ezzati M . The preventable causes of death in the United States: comparative risk assessment of dietary, lifestyle, and metabolic risk factors [published cor-rection appears in PLoS Med . 2011;8(1) . doi: 10 .1371/annotation/0ef47acd-9dcc-4296-a897-872d182cde57] . PLoS Med . 2009;6:e1000058 .
11 . Centers for Disease Control and Prevention (CDC) . Prevalence and most common causes of disability among adults: United States, 2005 . MMWR Morb Mortal Wkly Rep . 2009;58:421–426 .
12 . Mosca L, Mochari-Greenberger H, Dolor RJ, Newby LK, Robb KJ . Twelve-year follow-up of American women’s awareness of cardiovascular disease risk and barriers to heart health . Circ Cardiovasc Qual Outcomes . 2010;3:120–127 .
13 . Mochari-Greenberger H, Miller KL, Mosca L . Racial/ethnic and age differences in women’s awareness of heart disease . J Womens Health (Larchmt) . 2012;21:476–480 .
14 . Vanhecke TE, Miller WM, Franklin BA, Weber JE, McCullough PA . Awareness, knowledge, and perception of heart disease among adoles-cents . Eur J Cardiovasc Prev Rehabil . 2006;13:718–723 .
15 . Centers for Disease Control and Prevention (CDC) . Racial/ethnic and socioeconomic disparities in multiple risk factors for heart dis-ease and stroke: United States, 2003 . MMWR Morb Mortal Wkly Rep . 2005;54:113–117 .
16 . Mensah GA, Mokdad AH, Ford ES, Greenlund KJ, Croft JB . State of disparities in cardiovascular health in the United States . Circulation . 2005;111:1233–1241 .
17 . Hozawa A, Folsom AR, Sharrett AR, Chambless LE . Absolute and attrib-utable risks of cardiovascular disease incidence in relation to optimal and borderline risk factors: comparison of African American with white subjects: Atherosclerosis Risk in Communities Study . Arch Intern Med . 2007;167:573–579 .
18 . Soni A . Personal Health Behaviors for Heart Disease Prevention Among the U.S. Adult Civilian Noninstitutionalized Population, 2004. MEPS Sta-tistical Brief No . 165 . Rockville, MD: Agency for Healthcare Research
by guest on December 16, 2013http://circ.ahajournals.org/Downloaded from

Heart Disease and Stroke Statistics—2013 Update: Chapter 13 e115
and Quality; 2007 . http://meps .ahrq .gov/mepsweb/data_files/publica-tions/st165/stat165 .pdf . August 3, 2011 .
19 . Eamranond PP, Legedza AT, Diez-Roux AV, Kandula NR, Palmas W, Siscovick DS, Mukamal KJ . Association between language and risk factor levels among Hispanic adults with hypertension, hypercholesterolemia, or diabetes . Am Heart J . 2009;157:53–59 .
20 . Chow CK, Islam S, Bautista L, Rumboldt Z, Yusufali A, Xie C, Anand SS, Engert JC, Rangarajan S, Yusuf S . Parental history and myocardial infarc-tion risk across the world: the INTERHEART Study . J Am Coll Cardiol . 2011;57:619–627 .
21 . Lloyd-Jones DM, Nam BH, D’Agostino RB Sr, Levy D, Murabito JM, Wang TJ, Wilson PW, O’Donnell CJ . Parental cardiovascular disease as a risk factor for cardiovascular disease in middle-aged adults: a prospective study of parents and offspring . JAMA . 2004;291:2204–2211 .
22 . Murabito JM, Pencina MJ, Nam BH, D’Agostino RB Sr, Wang TJ, Lloyd-Jones D, Wilson PW, O’Donnell CJ . Sibling cardiovascular disease as a risk factor for cardiovascular disease in middle-aged adults . JAMA . 2005;294:3117–3123 .
23 . Ridker PM, Buring JE, Rifai N, Cook NR . Development and validation of improved algorithms for the assessment of global cardiovascular risk in women: the Reynolds Risk Score [published correction appears in JAMA . 2007;297:1433] . JAMA . 2007;297:611–619 .
24 . Assmann G, Cullen P, Schulte H . Simple scoring scheme for calculating the risk of acute coronary events based on the 10-year follow-up of the Prospective Cardiovascular Münster (PROCAM) study [published correction appears in Circulation . 2002;105:900] . Circulation . 2002;105:310–315 .
25 . Parikh NI, Hwang SJ, Larson MG, Cupples LA, Fox CS, Manders ES, Murabito JM, Massaro JM, Hoffmann U, O’Donnell CJ . Parental occur-rence of premature cardiovascular disease predicts increased coronary artery and abdominal aortic calcification in the Framingham Offspring and Third Generation cohorts . Circulation . 2007;116:1473–1481 .
26 . Nasir K, Budoff MJ, Wong ND, Scheuner M, Herrington D, Arnett DK, Szklo M, Greenland P, Blumenthal RS . Family history of premature coro-nary heart disease and coronary artery calcification: Multi-Ethnic Study of Atherosclerosis (MESA) . Circulation . 2007;116:619–626 .
27 . Lee DS, Pencina MJ, Benjamin EJ, Wang TJ, Levy D, O’Donnell CJ, Nam BH, Larson MG, D’Agostino RB, Vasan RS . Association of parental heart fail-ure with risk of heart failure in offspring . N Engl J Med . 2006;355:138–147 .
28 . Friedlander Y, Siscovick DS, Arbogast P, Psaty BM, Weinmann S, Lemaitre RN, Raghunathan TE, Cobb LA . Sudden death and myocardial infarction in first degree relatives as predictors of primary cardiac arrest . Atherosclerosis . 2002;162:211–216 .
29 . Centers for Disease Control and Prevention (CDC) . Awareness of family health history as a risk factor for disease: United States, 2004 . MMWR Morb Mortal Wkly Rep . 2004;53:1044–1047 .
30 . Berry JD, Dyer A, Cai X, Garside DB, Ning H, Thomas A, Greenland P, Van Horn L, Tracy RP, Lloyd-Jones DM . Lifetime risks of cardiovascular disease . N Engl J Med . 2012;366:321–329 .
31 . Berry JD, Liu K, Folsom AR, Lewis CE, Carr JJ, Polak JF, Shea S, Sidney S, O’Leary DH, Chan C, Lloyd-Jones DM . Prevalence and progression of subclinical atherosclerosis in younger adults with low short-term but high lifetime estimated risk for cardiovascular disease: the Coronary Artery Risk Development in Young Adults study and Multi-Ethnic Study of Ath-erosclerosis . Circulation . 2009;119:382–389 .
32 . Terry DF, Pencina MJ, Vasan RS, Murabito JM, Wolf PA, Hayes MK, Levy D, D’Agostino RB, Benjamin EJ . Cardiovascular risk factors predic-tive for survival and morbidity-free survival in the oldest-old Framingham Heart Study participants . J Am Geriatr Soc . 2005;53:1944–1950 .
33 . Daviglus ML, Stamler J, Pirzada A, Yan LL, Garside DB, Liu K, Wang R, Dyer AR, Lloyd-Jones DM, Greenland P . Favorable cardiovascular risk profile in young women and long-term risk of cardiovascular and all-cause mortality . JAMA . 2004;292:1588–1592 .
34 . Carnethon MR, Lynch EB, Dyer AR, Lloyd-Jones DM, Wang R, Garside DB, Greenland P . Comparison of risk factors for cardiovascular mortality in black and white adults . Arch Intern Med . 2006;166:1196–1202 .
35 . Lloyd-Jones DM, Dyer AR, Wang R, Daviglus ML, Greenland P . Risk factor burden in middle age and lifetime risks for cardiovascular and non-cardiovascular death (Chicago Heart Association Detection Project in Industry) . Am J Cardiol . 2007;99:535–540 .
36 . Daviglus ML, Liu K, Pirzada A, Yan LL, Garside DB, Feinglass J, Gural-nik JM, Greenland P, Stamler J . Favorable cardiovascular risk profile in middle age and health-related quality of life in older age . Arch Intern Med . 2003;163:2460–2468 .
37 . Daviglus ML, Liu K, Greenland P, Dyer AR, Garside DB, Manheim L, Lowe LP, Rodin M, Lubitz J, Stamler J . Benefit of a favorable cardiovas-cular risk-factor profile in middle age with respect to Medicare costs . N Engl J Med . 1998;339:1122–1129 .
38 . Stampfer MJ, Hu FB, Manson JE, Rimm EB, Willett WC . Primary preven-tion of coronary heart disease in women through diet and lifestyle . N Engl J Med . 2000;343:16–22 .
39 . Wright JD, Hirsch R, Wang CY . One-third of U .S adults embraced most heart healthy behaviors in 1999–2002 . NCHS Data Brief . 2009;(17):1–8 .
40 . Knoops KT, de Groot LC, Kromhout D, Perrin AE, Moreiras-Varela O, Menotti A, van Staveren WA . Mediterranean diet, lifestyle factors, and 10-year mortality in elderly European men and women: the HALE project . JAMA . 2004;292:1433–1439 .
41 . Mensah GA, Brown DW, Croft JB, Greenlund KJ . Major coronary risk factors and death from coronary heart disease: baseline and follow-up mortality data from the Second National Health and Nutrition Examina-tion Survey (NHANES II) . Am J Prev Med . 2005;29(suppl 1):68–74 .
42 . Russo CA, Ho K, Elixhauser A . Hospital Stays for Circulatory Diseases, 2004 . HCUP Statistical Brief 26 . Rockville, MD: Agency for Healthcare Research and Quality; 2007 . http://www .hcup-us .ahrq .gov/reports/stat-briefs/sb26 .pdf . Accessed August 3, 2011 .
43 . Russo CA, Andrews RM . The National Hospital Bill: The Most Expensive Conditions, by Payer, 2004 . HCUP Statistical Brief No . 13 . Rockville, MD: Agency for Healthcare Research and Quality; 2006 . http://www .hcup-us .ahrq .gov/reports/statbriefs/sb13 .pdf . Accessed August 3, 2011 .
44 . Elixhauser A, Jiang HJ . Hospitalizations for Women With Circulatory Disease, 2003. HCUP Statistical Brief No . 5 . Rockville, MD: Agency for Healthcare Research and Quality; 2006 . http://www .hcup-us .ahrq .gov/reports/statbriefs/sb5 .pdf . Accessed August 3, 2011 .
45 . Elixhauser A, Owens P . Reasons for Being Admitted to the Hospital Through the Emergency Department, 2003 . HCUP Statistical Brief No . 2 . Rockville, MD: Agency for Health Care Research and Quality; 2006 . http://www .hcup-us .ahrq .gov/reports/statbriefs/sb2 .pdf . Accessed June 27, 2011 .
46 . Jones AL, Dwyer LL, Bercovitz AR, Strahan GW . The National Nurs-ing Home Survey: 2004 Overview. Hyattsville, MD: National Center for Health Statistics; 2009 . Vital and Health Statistics, Series 13, No . 167 .
47 . Caffrey C, Sengupta M, Moss A, Harris-Kojetin L, Valverde R . Home health care and discharged hospice care patients: United States, 2000 and 2007 . Hyattsville, MD: National Center for Health Statistics; 2011 . National Health Statistics Reports, No . 38 .
48 . D’Agostino RB Sr, Vasan RS, Pencina MJ, Wolf PA, Cobain M, Massaro JM, Kannel WB . General cardiovascular risk profile for use in primary care: the Framingham Heart Study . Circulation . 2008;117:743–753 .
49 . 2007 State snapshots . Agency for Healthcare Research and Quality Web site . http://statesnapshots .ahrq .gov/snaps07/index .jsp . Accessed November 12, 2012 .
50 . Brett KM, Hayes SG . Women’s Health and Mortality Chartbook. Wash-ington, DC: DHHS Office on Women’s Health; 2004 . DHHS publication No . 04-1032 . http://www .cdc .gov/nchs/data/healthywomen/womenschart-book_aug2004 .pdf . Accessed November 12, 2012 .
51 . SMART: BRFSS city and county data: selected metropolitan/micropoli-tan area risk trends . Centers for Disease Control and Prevention Web site . http://apps .nccd .cdc .gov/BRFSS-SMART/ Accessed November 12, 2012 .
52 . Behavioral Risk Factor Surveillance System . Centers for Disease Con-trol and Prevention Web site . http://www .cdc .gov/brfss/ . Accessed November 12, 2012 .
53 . Geographic Information Systems (GIS) at CDC . Centers for Disease Control and Prevention Web site . http://www .cdc .gov/gis/ . Accessed November 12, 2012 .
54 . Casper ML, Nwaise IA, Croft JB, Nilasena DS . Atlas of Stroke Hospi-talizations Among Medicare Beneficiaries. Atlanta, GA: US Department of Health and Human Services, Centers for Disease Control and Preven-tion; 2008 . http://www .cdc .gov/dhdsp/atlas/2008_stroke_atlas/index .htm . Accessed November 12, 2012 .
by guest on December 16, 2013http://circ.ahajournals.org/Downloaded from

e116 Circulation January 1/8, 2013
Table 13-2. Age-Adjusted Death Rates per 100 000 Population for CVD, CHD, and Stroke by State, 2007–2009
State
CVD* CHD† Stroke‡
Rank§ Death Rate% Change, 1999–2001
to 2007–2009 Rank§ Death Rate% Change, 1999–2001
to 2007–2009 Rank§ Death Rate% Change, 1999–2001
to 2007–2009
Alabama 51 308.3 −20.9 24 108.5 −33.7 52 54.0 −22.4
Alaska 7 203.7 −28.6 6 87.2 −31.8 33 42.5 −34.2
Arizona 4 193.8 −32.3 21 106.3 −34.4 2 30.6 −41.3
Arkansas 47 293.0 −23.5 46 148.6 −20.5 51 53.4 −30.6
California 23 229.7 −30.0 31 119.5 −37.1 23 40.0 −36.7
Colorado 6 195.7 −29.1 5 87.0 −32.0 13 37.0 −34.5
Connecticut 18 218.8 −27.0 12 99.9 −37.5 5 33.7 −33.0
Delaware 27 237.6 −28.9 35 124.1 −37.2 19 39.1 −24.8
District of Columbia
45 284.2 −24.9 51 159.3 −21.2 10 35.6 −25.8
Florida 9 205.6 −33.5 26 110.8 −41.2 3 32.3 −34.3
Georgia 39 263.3 −30.0 9 92.7 −42.5 43 47.3 −33.8
Hawaii 5 195.3 −27.9 3 77.5 −31.8 21 39.4 −36.1
Idaho 14 213.9 −28.1 11 96.8 −34.2 27 41.5 −35.8
Illinois 32 247.8 −28.8 32 120.5 −36.9 30 41.8 −31.9
Indiana 40 263.4 −27.4 34 123.1 −34.1 38 44.8 −34.2
Iowa 28 237.9 −24.9 40 134.0 −28.0 32 42.0 −29.6
Kansas 30 239.7 −25.1 14 101.5 −34.2 39 45.6 −25.0
Kentucky 44 281.2 −28.3 43 135.7 −32.2 40 46.3 −31.4
Louisiana 48 294.6 −22.4 37 127.1 −32.5 45 47.6 −27.3
Maine 21 219.9 −29.0 18 103.7 −36.6 22 39.7 −31.1
Maryland 36 255.8 −25.0 41 134.6 −28.9 28 41.5 −33.2
Massachusetts 13 212.2 −26.8 16 102.0 −30.3 8 34.7 −30.7
Michigan 43 278.6 −24.9 45 146.6 −30.5 34 42.6 −30.5
Table 13-1. Cardiovascular Diseases
Population Group Prevalence, 2010: Age ≥20 y Mortality, 2009: All Ages* Hospital Discharges, 2010: All Ages Cost, 2009
Both sexes 83 600 000 (35.3%) 787 931 5 802 000 $312.6 Billion
Males 40 700 000 (36.7%) 386 436 (49.0%)† 3 021 000
Females 42 900 000 (34.0%) 401 495 (51.0%)† 2 781 000 …
NH white males 36.6% 329 565 … …
NH white females 32.4% 343 955 … …
NH black males 44.4% 46 334 … …
NH black females 48.9% 48 070 … …
Mexican American males 33.4% … … …
Mexican American females 30.7% … … …
Asian … 16 419‡ … …
American Indian/Alaska Native … 3588 … …
Ellipses (…) indicate data not available; NH, non-Hispanic.*Mortality data are for whites and blacks and include Hispanics.†These percentages represent the portion of total cardiovascular disease mortality that is attributable to males vs females.‡Includes Chinese, Filipino, Hawaiian, Japanese, and other Asian or Pacific Islander.Sources: Prevalence: National Health and Nutrition Examination Survey 2007–2010, National Center for Health Statistics (NCHS) and National Heart, Lung, and
Blood Institute (NHLBI). Percentages for racial/ethnic groups are age-adjusted for Americans ≥20 y of age. Age-specific percentages are extrapolated to the 2010 US population estimates. Mortality: Centers for Disease Control and Prevention/NCHS, 2009 Mortality Multiple Cause–US, version July 19, 2012. These data represent underlying cause of death only. Data include congenital cardiovascular disease mortality. Hospital discharges: National Hospital Discharge Survey, NCHS. Data include those inpatients discharged alive, dead, or of unknown status. Cost: NHLBI. Data include estimated direct and indirect costs for 2009.
(Continued)
by guest on December 16, 2013http://circ.ahajournals.org/Downloaded from
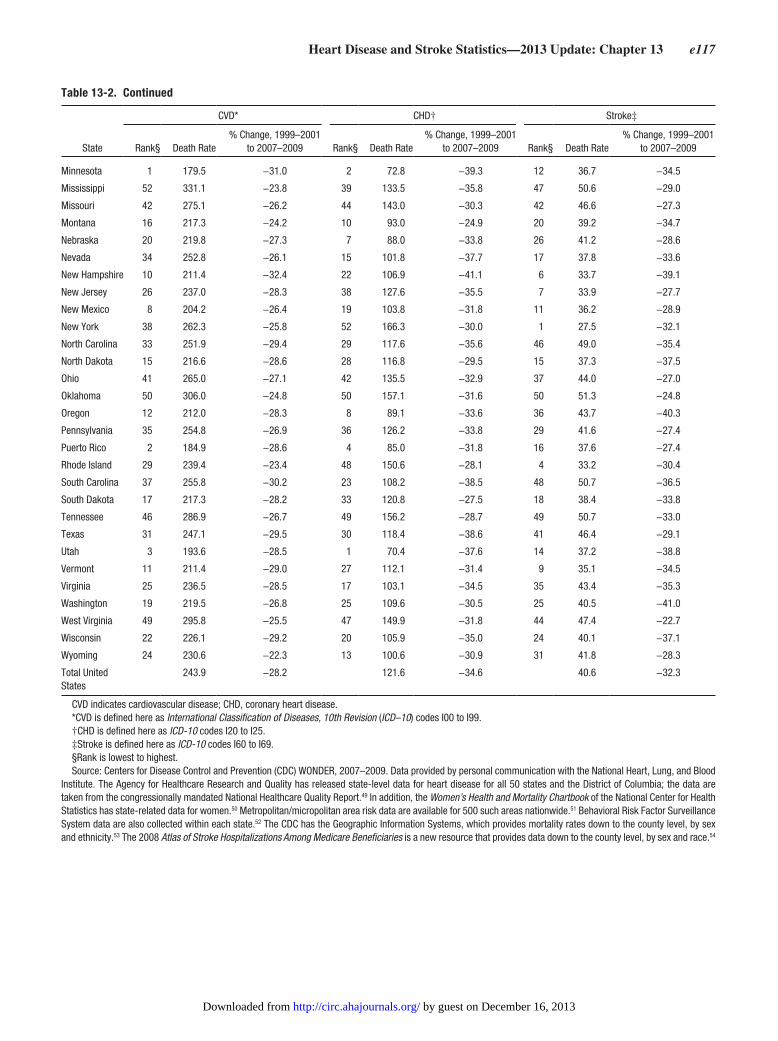
Heart Disease and Stroke Statistics—2013 Update: Chapter 13 e117
Minnesota 1 179.5 −31.0 2 72.8 −39.3 12 36.7 −34.5
Mississippi 52 331.1 −23.8 39 133.5 −35.8 47 50.6 −29.0
Missouri 42 275.1 −26.2 44 143.0 −30.3 42 46.6 −27.3
Montana 16 217.3 −24.2 10 93.0 −24.9 20 39.2 −34.7
Nebraska 20 219.8 −27.3 7 88.0 −33.8 26 41.2 −28.6
Nevada 34 252.8 −26.1 15 101.8 −37.7 17 37.8 −33.6
New Hampshire 10 211.4 −32.4 22 106.9 −41.1 6 33.7 −39.1
New Jersey 26 237.0 −28.3 38 127.6 −35.5 7 33.9 −27.7
New Mexico 8 204.2 −26.4 19 103.8 −31.8 11 36.2 −28.9
New York 38 262.3 −25.8 52 166.3 −30.0 1 27.5 −32.1
North Carolina 33 251.9 −29.4 29 117.6 −35.6 46 49.0 −35.4
North Dakota 15 216.6 −28.6 28 116.8 −29.5 15 37.3 −37.5
Ohio 41 265.0 −27.1 42 135.5 −32.9 37 44.0 −27.0
Oklahoma 50 306.0 −24.8 50 157.1 −31.6 50 51.3 −24.8
Oregon 12 212.0 −28.3 8 89.1 −33.6 36 43.7 −40.3
Pennsylvania 35 254.8 −26.9 36 126.2 −33.8 29 41.6 −27.4
Puerto Rico 2 184.9 −28.6 4 85.0 −31.8 16 37.6 −27.4
Rhode Island 29 239.4 −23.4 48 150.6 −28.1 4 33.2 −30.4
South Carolina 37 255.8 −30.2 23 108.2 −38.5 48 50.7 −36.5
South Dakota 17 217.3 −28.2 33 120.8 −27.5 18 38.4 −33.8
Tennessee 46 286.9 −26.7 49 156.2 −28.7 49 50.7 −33.0
Texas 31 247.1 −29.5 30 118.4 −38.6 41 46.4 −29.1
Utah 3 193.6 −28.5 1 70.4 −37.6 14 37.2 −38.8
Vermont 11 211.4 −29.0 27 112.1 −31.4 9 35.1 −34.5
Virginia 25 236.5 −28.5 17 103.1 −34.5 35 43.4 −35.3
Washington 19 219.5 −26.8 25 109.6 −30.5 25 40.5 −41.0
West Virginia 49 295.8 −25.5 47 149.9 −31.8 44 47.4 −22.7
Wisconsin 22 226.1 −29.2 20 105.9 −35.0 24 40.1 −37.1
Wyoming 24 230.6 −22.3 13 100.6 −30.9 31 41.8 −28.3
Total United States
243.9 −28.2 121.6 −34.6 40.6 −32.3
CVD indicates cardiovascular disease; CHD, coronary heart disease.*CVD is defined here as International Classification of Diseases, 10th Revision (ICD–10) codes I00 to I99.†CHD is defined here as ICD-10 codes I20 to I25.‡Stroke is defined here as ICD-10 codes I60 to I69.§Rank is lowest to highest.Source: Centers for Disease Control and Prevention (CDC) WONDER, 2007–2009. Data provided by personal communication with the National Heart, Lung, and Blood
Institute. The Agency for Healthcare Research and Quality has released state-level data for heart disease for all 50 states and the District of Columbia; the data are taken from the congressionally mandated National Healthcare Quality Report.49 In addition, the Women’s Health and Mortality Chartbook of the National Center for Health Statistics has state-related data for women.50 Metropolitan/micropolitan area risk data are available for 500 such areas nationwide.51 Behavioral Risk Factor Surveillance System data are also collected within each state.52 The CDC has the Geographic Information Systems, which provides mortality rates down to the county level, by sex and ethnicity.53 The 2008 Atlas of Stroke Hospitalizations Among Medicare Beneficiaries is a new resource that provides data down to the county level, by sex and race.54
Table 13-2. Continued
State
CVD* CHD† Stroke‡
Rank§ Death Rate% Change, 1999–2001
to 2007–2009 Rank§ Death Rate% Change, 1999–2001
to 2007–2009 Rank§ Death Rate% Change, 1999–2001
to 2007–2009
by guest on December 16, 2013http://circ.ahajournals.org/Downloaded from

e118 Circulation January 1/8, 2013
Table 13-3. International Death Rates (Revised February 2012): Death Rates (Per 100 000 Population) for Total CVD, CHD, Stroke, and Total Deaths in Selected Countries (Most Recent Year Available)
CVD Deaths CHD Deaths Stroke Deaths Total Deaths
Men ages 35–74 y
Russian Federation (2009) 1185.4 658.5 307.5 2438.3
Bulgaria (2008) 803.7 219.4 218.2 1554.3
Lithuania (2009) 734.7 444.6 138.3 1842.3
Romania (2010) 657.9 268.2 195.9 1548.4
Hungary (2009) 605.6 319.1 121.1 1652.3
Slovakia (2009) 553.2 318.3 117.1 1390.5
Poland (2009) 492.7 166.1 95.4 1389.7
Croatia (2009) 419.3 202.2 113.6 1184.7
Czech Republic (2009) 386.6 198.6 64.4 1080.8
Kuwait (2009) 319.6 187.0 62.1 563.9
Finland (2009) 284.4 170.0 43.8 833.2
United States (2009) 249.8 143.1 29.5 847.5
Greece (2009) 251.6 136.7 50.8 721.6
Germany (2010) 211.5 105.1 29.3 748.8
Ireland (2009) 210.0 140.6 29.2 701.3
Belgium (2005) 209.6 99.5 35.9 821.7
Denmark (2006) 206.6 84.8 45.6 865.6
New Zealand (2007) 204.2 135.6 29.1 635.7
United Kingdom (2009) 202.0 125.8 29.9 687.6
Canada (2004) 198.3 130.8 24.2 705.3
Austria (2010) 189.5 114.2 23.3 724.9
Portugal (2009) 168.7 61.3 62.1 825.3
Spain (2008) 168.2 77.6 33.7 714.0
Sweden (2010) 165.2 93.1 26.3 556.1
Italy (2008) 157.7 74.6 30.4 613.0
Norway (2009) 154.4 84.6 29.0 607.0
Switzerland (2007) 150.4 78.2 16.6 587.5
Netherlands (2010) 147.6 57.1 25.1 619.5
Japan (2009) 145.2 46.5 52.2 605.0
Australia (2006) 141.3 88.9 22.0 553.4
France (2008) 140.1 54.0 25.7 765.8
Korea, South (2009) 138.4 41.0 65.9 783.6
Israel (2008) 133.1 71.7 24.2 621.2
Women ages 35–74 y
Russian Federation (2009) 463.0 221.2 157.5 918.5
Bulgaria (2008) 368.6 70.9 120.6 699.3
Romania (2010) 312.2 105.7 111.4 692.4
Lithuania (2009) 253.9 127.5 73.8 648.6
Kuwait (2009) 246.1 94.8 56.1 568.1
Hungary (2009) 239.2 113.7 56.0 719.4
Slovakia (2009) 228.5 120.7 57.5 590.7
Croatia (2009) 190.8 71.9 68.7 520.1
Poland (2009) 180.6 48.0 48.1 564.5
Czech Republic (2009) 164.3 69.9 34.8 506.6
United States (2009) 123.7 55.5 22.3 535.6
Denmark (2006) 100.0 32.4 32.1 557.8
Greece (2009) 97.1 33.3 29.3 319.0
Belgium (2005) 94.4 30.8 24.8 436.3
(Continued) by guest on December 16, 2013http://circ.ahajournals.org/Downloaded from
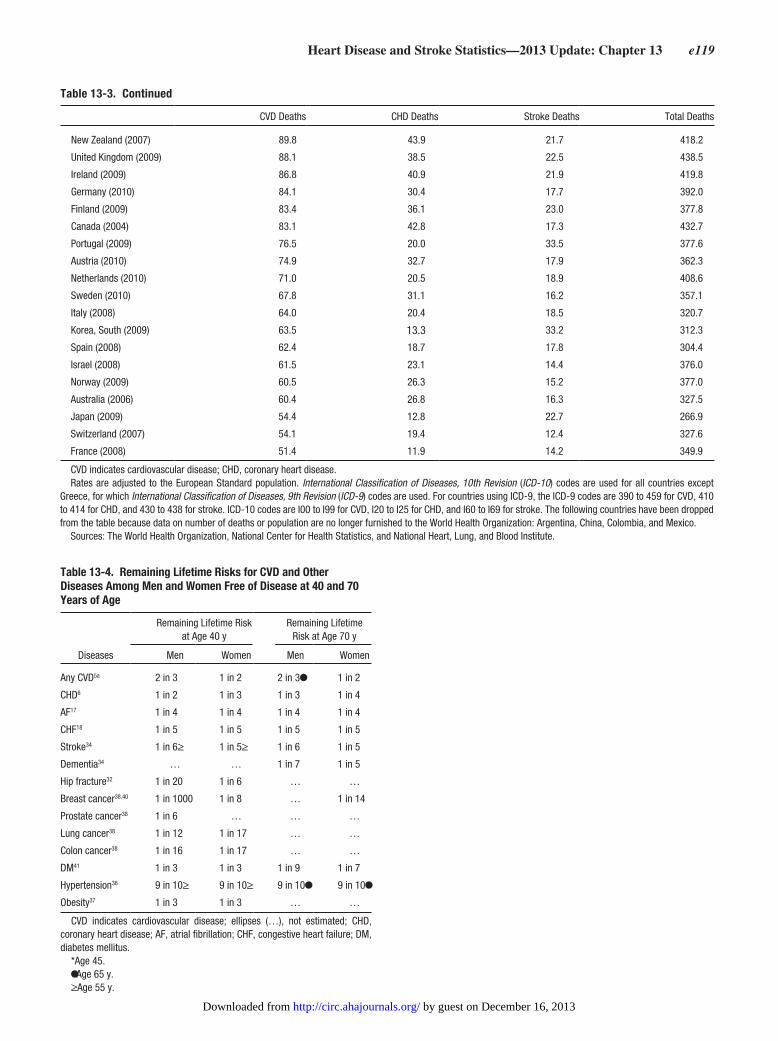
Heart Disease and Stroke Statistics—2013 Update: Chapter 13 e119
New Zealand (2007) 89.8 43.9 21.7 418.2
United Kingdom (2009) 88.1 38.5 22.5 438.5
Ireland (2009) 86.8 40.9 21.9 419.8
Germany (2010) 84.1 30.4 17.7 392.0
Finland (2009) 83.4 36.1 23.0 377.8
Canada (2004) 83.1 42.8 17.3 432.7
Portugal (2009) 76.5 20.0 33.5 377.6
Austria (2010) 74.9 32.7 17.9 362.3
Netherlands (2010) 71.0 20.5 18.9 408.6
Sweden (2010) 67.8 31.1 16.2 357.1
Italy (2008) 64.0 20.4 18.5 320.7
Korea, South (2009) 63.5 41.0 33.2 312.3
Spain (2008) 62.4 18.7 17.8 304.4
Israel (2008) 61.5 23.1 14.4 376.0
Norway (2009) 60.5 26.3 15.2 377.0
Australia (2006) 60.4 26.8 16.3 327.5
Japan (2009) 54.4 12.8 22.7 266.9
Switzerland (2007) 54.1 19.4 12.4 327.6
France (2008) 51.4 11.9 14.2 349.9
CVD indicates cardiovascular disease; CHD, coronary heart disease.Rates are adjusted to the European Standard population. International Classification of Diseases, 10th Revision (ICD-10) codes are used for all countries except
Greece, for which International Classification of Diseases, 9th Revision (ICD-9) codes are used. For countries using ICD-9, the ICD-9 codes are 390 to 459 for CVD, 410 to 414 for CHD, and 430 to 438 for stroke. ICD-10 codes are I00 to I99 for CVD, I20 to I25 for CHD, and I60 to I69 for stroke. The following countries have been dropped from the table because data on number of deaths or population are no longer furnished to the World Health Organization: Argentina, China, Colombia, and Mexico.
Sources: The World Health Organization, National Center for Health Statistics, and National Heart, Lung, and Blood Institute.
Table 13-4. Remaining Lifetime Risks for CVD and Other Diseases Among Men and Women Free of Disease at 40 and 70 Years of Age
Diseases
Remaining Lifetime Risk at Age 40 y
Remaining Lifetime Risk at Age 70 y
Men Women Men Women
Any CVD5a 2 in 3● 1 in 2● 2 in 3● 1 in 2
CHD6 1 in 2 1 in 3 1 in 3 1 in 4
AF17 1 in 4 1 in 4 1 in 4 1 in 4
CHF18 1 in 5 1 in 5 1 in 5 1 in 5
Stroke34 1 in 6≥ 1 in 5≥ 1 in 6 1 in 5
Dementia34 … … 1 in 7 1 in 5
Hip fracture32 1 in 20 1 in 6 … …
Breast cancer38,40 1 in 1000 1 in 8 … 1 in 14
Prostate cancer38 1 in 6 … … …
Lung cancer38 1 in 12 1 in 17 … …
Colon cancer38 1 in 16 1 in 17 … …
DM41 1 in 3 1 in 3 1 in 9 1 in 7
Hypertension36 9 in 10≥ 9 in 10≥ 9 in 10● 9 in 10●
Obesity37 1 in 3 1 in 3 … …
CVD indicates cardiovascular disease; ellipses (…), not estimated; CHD, coronary heart disease; AF, atrial fibrillation; CHF, congestive heart failure; DM, diabetes mellitus.
*Age 45.●Age 65 y.≥Age 55 y.
Table 13-3. Continued
CVD Deaths CHD Deaths Stroke Deaths Total Deaths
13.3
by guest on December 16, 2013http://circ.ahajournals.org/Downloaded from

e120 Circulation January 1/8, 2013
12.8
40.0
70.2
83.0
10.1
34.4
70.9
87.1
0
10
20
30
40
50
60
70
80
90
100
20-39 40-59 60-79 80+
Perc
ent o
f Pop
ulat
ion
Age (Years)
Men Women
Chart 13-1. Prevalence of cardiovascular disease in adults ≥20 years of age by age and sex (National Health and Nutrition Examination Survey: 2007–2010). Source: National Center for Health Statistics and National Heart, Lung, and Blood Institute. These data include coro-nary heart disease, heart failure, stroke, and hypertension.
10.1
21.4
34.6
59.2
74.4
4.2
8.9
20.0
40.2
65.2
0
10
20
30
40
50
60
70
80
45-54 55-64 65-74 75-84 85-94
Per 1
000
Pers
on Y
ears
Age (Years)
Men Women
Chart 13-2. Incidence of cardiovascular disease* by age and sex (Framingham Heart Study, 1980–2003). *Coronary heart disease, heart failure, stroke, or intermittent claudication. Does not include hypertension alone. Source: National Heart, Lung, and Blood Institute.4
by guest on December 16, 2013http://circ.ahajournals.org/Downloaded from

Heart Disease and Stroke Statistics—2013 Update: Chapter 13 e121
0
200
400
600
800
1,000
1900 1910 1920 1930 1940 1950 1960 1970 1980 1990 2000 2009
Dea
ths
in T
hous
ands
Years
Chart 13-3. Deaths attributable to diseases of the heart (United States: 1900–2009). See Glossary (Chapter 25) for an explanation of “diseases of the heart.” Note: In the years 1900–1920, the International Classification of Diseases codes were 77 to 80; for 1925, 87 to 90; for 1930–1945, 90 to 95; for 1950–1960, 402 to 404 and 410 to 443; for 1965, 402 to 404 and 410 to 443; for 1970–1975, 390 to 398 and 404 to 429; for 1980–1995, 390 to 398, 402, and 404 to 429; for 2000–2009, I00 to I09, I11, I13, and I20 to I51. Before 1933, data are for a death registration area and not the entire United States. In 1900, only 10 states were in the death registration area, and this increased over the years, so part of the increase in numbers of deaths is attributable to an increase in the number of states. Source: National Center for Health Statistics.
0
200
400
600
800
1,000
1,200
1900 1910 1920 1930 1940 1950 1960 1970 1980 1990 2000 2005 2009
Dea
ths
in T
hous
ands
Year
Chart 13-4. Deaths attributable to cardiovascular disease (United States: 1900–2009). Cardiovascular disease (International Classifica-tion of Diseases, 10th Revision codes I00–I99) does not include congenital. Before 1933, data are for a death registration area and not the entire United States. Source: National Center for Health Statistics.
by guest on December 16, 2013http://circ.ahajournals.org/Downloaded from
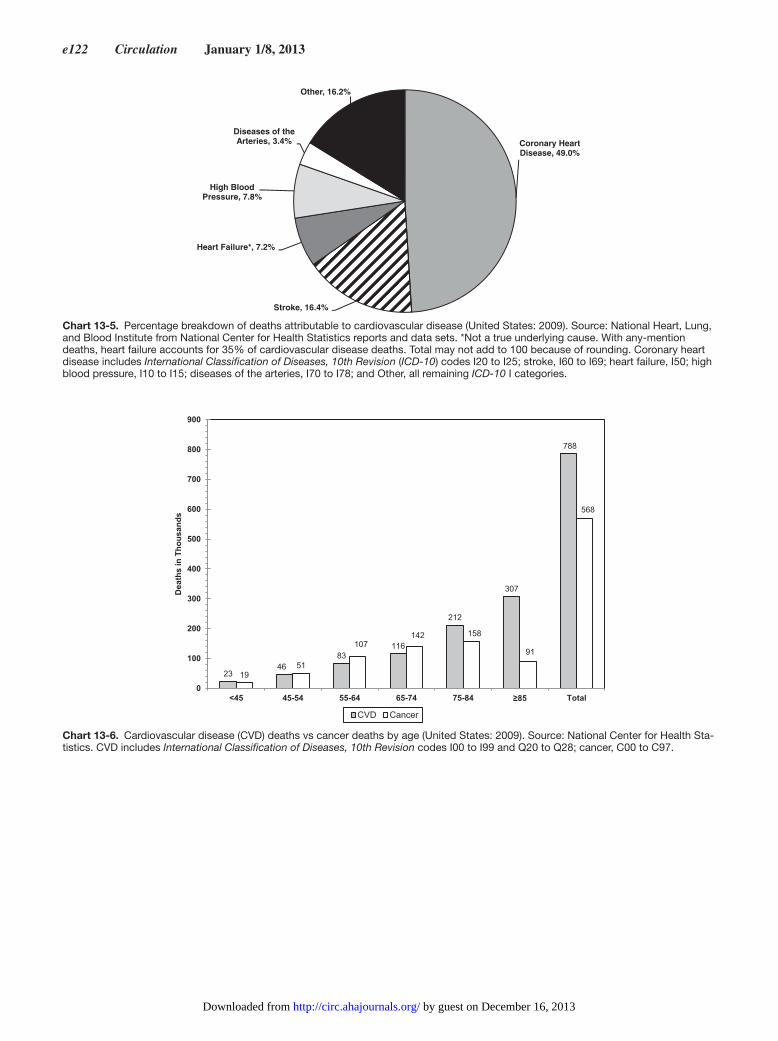
e122 Circulation January 1/8, 2013
2346
83116
212
307
788
1951
107142 158
91
568
0
100
200
300
400
500
600
700
800
900
<45 45-54 55-64 65-74 75-84 ≥85 Total
Dea
ths
in T
hous
ands
CVD Cancer
Chart 13-6. Cardiovascular disease (CVD) deaths vs cancer deaths by age (United States: 2009). Source: National Center for Health Sta-tistics. CVD includes International Classification of Diseases, 10th Revision codes I00 to I99 and Q20 to Q28; cancer, C00 to C97.
Chart 13-5. Percentage breakdown of deaths attributable to cardiovascular disease (United States: 2009). Source: National Heart, Lung, and Blood Institute from National Center for Health Statistics reports and data sets. *Not a true underlying cause. With any-mention deaths, heart failure accounts for 35% of cardiovascular disease deaths. Total may not add to 100 because of rounding. Coronary heart disease includes International Classification of Diseases, 10th Revision (ICD-10) codes I20 to I25; stroke, I60 to I69; heart failure, I50; high blood pressure, I10 to I15; diseases of the arteries, I70 to I78; and Other, all remaining ICD-10 I categories.
Coronary Heart Disease, 49.0%
Stroke, 16.4%
Heart Failure*, 7.2%
High Blood Pressure, 7.8%
Diseases of the Arteries, 3.4%
Other, 16.2%
by guest on December 16, 2013http://circ.ahajournals.org/Downloaded from

Heart Disease and Stroke Statistics—2013 Update: Chapter 13 e123
0
100,000
200,000
300,000
400,000
500,000
600,000
700,000
800,000
900,000
Dea
ths
Accidents
Alzheimer's Disease
CLRD
Cancer
All Other CVD
Stroke
Heart Disease
All Ages <85 ≥85
Chart 13-7. Cardiovascular disease (CVD) and other major causes of death: total, <85 years of age, and ≥85 years of age. Deaths among both sexes, United States, 2009. CLRD indicates chronic lower respiratory disease. Heart disease includes International Classification of Diseases, 10th Revision codes I00 to I09, I11, I13, and I20 to I51; stroke, I60 to I69; all other CVD, I10, I12, I15, and I70 to I99; cancer, C00 to C97; CLRD, J40 to J47; Alzheimer disease, G30; and accidents, V01 to X59 and Y85 to Y86. Source: National Center for Health Statistics and National Heart, Lung, and Blood Institute.
0
50,000
100,000
150,000
200,000
250,000
300,000
350,000
400,000
450,000
Dea
ths
Accidents
CLRD
Cancer
All Other CVD
Stroke
Heart Disease
All Ages <85 ≥85
Chart 13-8. Cardiovascular disease (CVD) and other major causes of death in males: total, <85 years of age, and ≥85 years of age. Deaths among males, United States, 2009. CLRD indicates chronic lower respiratory disease. Heart disease includes International Clas-sification of Diseases, 10th Revision codes I00 to I09, I11, I13, and I20 to I51; stroke, I60 to I69; all other CVD, I10, I12, I15, and I70 to I99; cancer, C00 to C97; CLRD, J40 to J47; and accidents, V01 to X59 and Y85 to Y86. Source: National Center for Health Statistics and National Heart, Lung, and Blood Institute.
by guest on December 16, 2013http://circ.ahajournals.org/Downloaded from

e124 Circulation January 1/8, 2013
0
50,000
100,000
150,000
200,000
250,000
300,000
350,000
400,000
450,000
Dea
ths
Alzheimer's Disease
CLRD
Cancer
All Other CVD
Stroke
Heart Disease
All Ages <85 ≥85
Chart 13-9. Cardiovascular disease (CVD) and other major causes of death in females: total, <85 years of age, and ≥85 years of age. Deaths among females, United States, 2009. CLRD indicates chronic lower respiratory disease. Heart disease includes International Clas-sification of Diseases, 10th Revision codes I00 to I09, I11, I13, and I20 to I51; stroke, I60 to I69; all other CVD, I10, I12, I15, and I70 to I99; cancer, C00 to C97; CLRD, J40 to J47; and Alzheimer disease, G30. Source: National Center for Health Statistics and National Heart, Lung, and Blood Institute.
Chart 13-10. Cardiovascular disease and other major causes of death for all males and females (United States: 2009). A indicates cardio-vascular disease plus congenital cardiovascular disease (International Classification of Diseases, 10th Revision codes I00–I99, Q20–Q28); B, cancer (C00–C97 ); C, accidents (V01–X59, Y85–Y86); D, chronic lower respiratory disease (J40–J47); E, diabetes mellitus (E10–E14); and F, Alzheimer disease (G30). Source: National Center for Health Statistics and National Heart, Lung, and Blood Institute.
386,436
296,763
75,02265,119
35,05423,900
401,495
270,865
72,23455,103
42,99933,651
0
50,000
100,000
150,000
200,000
250,000
300,000
350,000
400,000
450,000
A B C D E F A B D F C E
Dea
ths
Males Females
by guest on December 16, 2013http://circ.ahajournals.org/Downloaded from
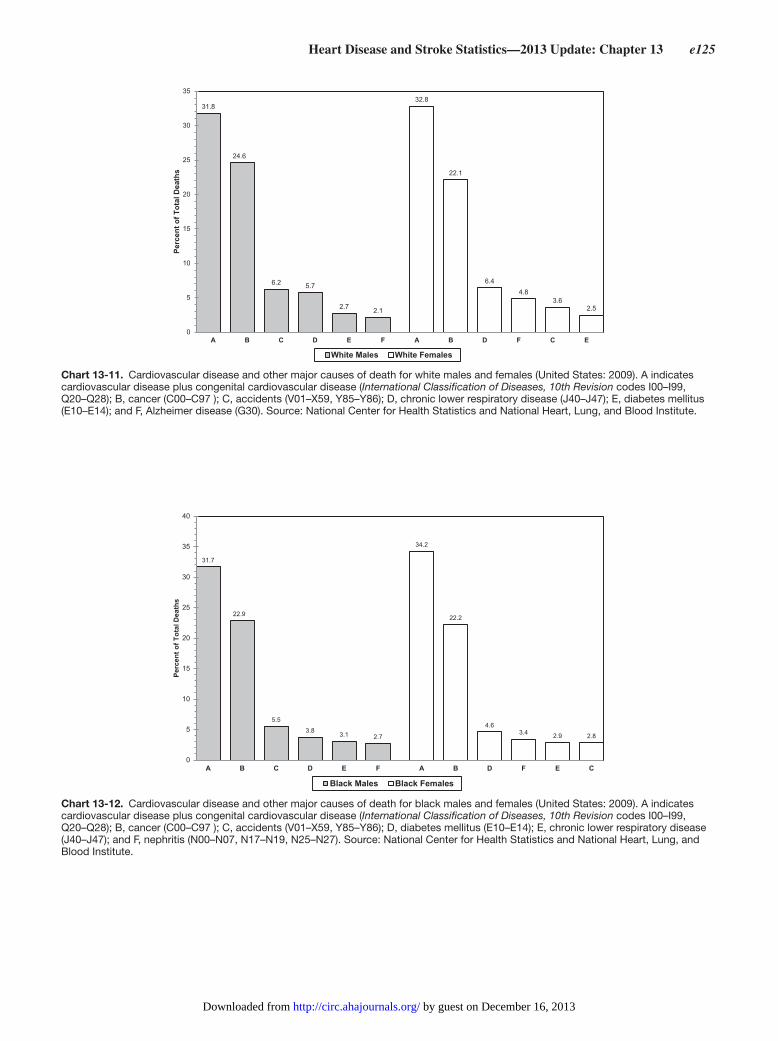
Heart Disease and Stroke Statistics—2013 Update: Chapter 13 e125
31.8
24.6
6.2 5.7
2.7 2.1
32.8
22.1
6.44.8
3.62.5
0
5
10
15
20
25
30
35
A B C D E F A B D F C E
Perc
ent o
f Tot
al D
eath
s
White Males White Females
Chart 13-11. Cardiovascular disease and other major causes of death for white males and females (United States: 2009). A indicates cardiovascular disease plus congenital cardiovascular disease (International Classification of Diseases, 10th Revision codes I00–I99, Q20–Q28); B, cancer (C00–C97 ); C, accidents (V01–X59, Y85–Y86); D, chronic lower respiratory disease (J40–J47); E, diabetes mellitus (E10–E14); and F, Alzheimer disease (G30). Source: National Center for Health Statistics and National Heart, Lung, and Blood Institute.
31.7
22.9
5.5
3.8 3.1 2.7
34.2
22.2
4.63.4 2.9 2.8
0
5
10
15
20
25
30
35
40
A B C D E F A B D F E C
Perc
ent o
f Tot
al D
eath
s
Black Males Black Females
Chart 13-12. Cardiovascular disease and other major causes of death for black males and females (United States: 2009). A indicates cardiovascular disease plus congenital cardiovascular disease (International Classification of Diseases, 10th Revision codes I00–I99, Q20–Q28); B, cancer (C00–C97 ); C, accidents (V01–X59, Y85–Y86); D, diabetes mellitus (E10–E14); E, chronic lower respiratory disease (J40–J47); and F, nephritis (N00–N07, N17–N19, N25–N27). Source: National Center for Health Statistics and National Heart, Lung, and Blood Institute.
by guest on December 16, 2013http://circ.ahajournals.org/Downloaded from
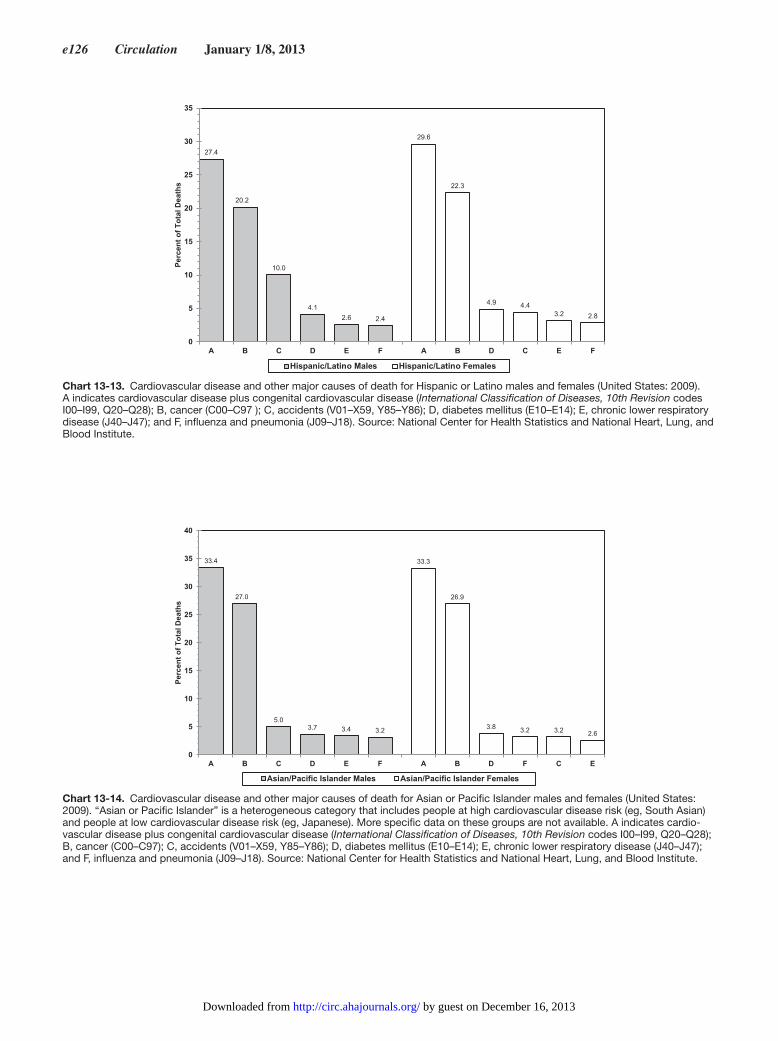
e126 Circulation January 1/8, 2013
27.4
20.2
10.0
4.12.6 2.4
29.6
22.3
4.9 4.43.2 2.8
0
5
10
15
20
25
30
35
A B C D E F A B D C E F
Perc
ent o
f Tot
al D
eath
s
Hispanic/Latino Males Hispanic/Latino Females
Chart 13-13. Cardiovascular disease and other major causes of death for Hispanic or Latino males and females (United States: 2009). A indicates cardiovascular disease plus congenital cardiovascular disease (International Classification of Diseases, 10th Revision codes I00–I99, Q20–Q28); B, cancer (C00–C97 ); C, accidents (V01–X59, Y85–Y86); D, diabetes mellitus (E10–E14); E, chronic lower respiratory disease (J40–J47); and F, influenza and pneumonia (J09–J18). Source: National Center for Health Statistics and National Heart, Lung, and Blood Institute.
33.4
27.0
5.03.7 3.4 3.2
33.3
26.9
3.8 3.2 3.2 2.6
0
5
10
15
20
25
30
35
40
A B C D E F A B D F C E
Perc
ent o
f Tot
al D
eath
s
Asian/Pacific Islander Males Asian/Pacific Islander Females
Chart 13-14. Cardiovascular disease and other major causes of death for Asian or Pacific Islander males and females (United States: 2009). “Asian or Pacific Islander” is a heterogeneous category that includes people at high cardiovascular disease risk (eg, South Asian) and people at low cardiovascular disease risk (eg, Japanese). More specific data on these groups are not available. A indicates cardio-vascular disease plus congenital cardiovascular disease (International Classification of Diseases, 10th Revision codes I00–I99, Q20–Q28); B, cancer (C00–C97); C, accidents (V01–X59, Y85–Y86); D, diabetes mellitus (E10–E14); E, chronic lower respiratory disease (J40–J47); and F, influenza and pneumonia (J09–J18). Source: National Center for Health Statistics and National Heart, Lung, and Blood Institute.
by guest on December 16, 2013http://circ.ahajournals.org/Downloaded from

Heart Disease and Stroke Statistics—2013 Update: Chapter 13 e127
24.7
17.0
14.2
5.2 4.73.5
23.2
19.4
8.5
5.4 4.9 4.7
0
5
10
15
20
25
30
A B C D E F A B C D E F
Perc
ent o
f Tot
al D
eath
s
American Indian/Alaska Natives Males American Indian/Alaska Natives Females
Chart 13-15. Cardiovascular disease and other major causes of death for American Indian or Alaska Native males and females (United States: 2009). A indicates cardiovascular disease plus congenital cardiovascular disease (International Classification of Diseases, 10th Revision codes I00–I99, Q20–Q28); B, cancer (C00–C97 ); C, accidents (V01–X59, Y85–Y86); D, diabetes mellitus (E10–E14); E, chronic liver disease (K70, K73–K74); and F, chronic lower respiratory disease (J40–J47). Source: National Center for Health Statistics.
84.9
36.639.8
21.7
110.3
50.2
35.930.5
0
20
40
60
80
100
120
CHD (I20-I25) Stroke (I60-I69) Lung Cancer (C33-C34) Breast Cancer (C50)
Per 1
00 0
00 P
opul
atio
n
White Females Black Females
Chart 13-16. Age-adjusted death rates for coronary heart disease (CHD), stroke, and lung and breast cancer for white and black females (United States: 2009). CHD includes International Classification of Diseases, 10th Revision codes I20 to I25; stroke, I60 to I69; lung can-cer, C33 to C34; and breast cancer, C50. Source: National Center for Health Statistics.
by guest on December 16, 2013http://circ.ahajournals.org/Downloaded from
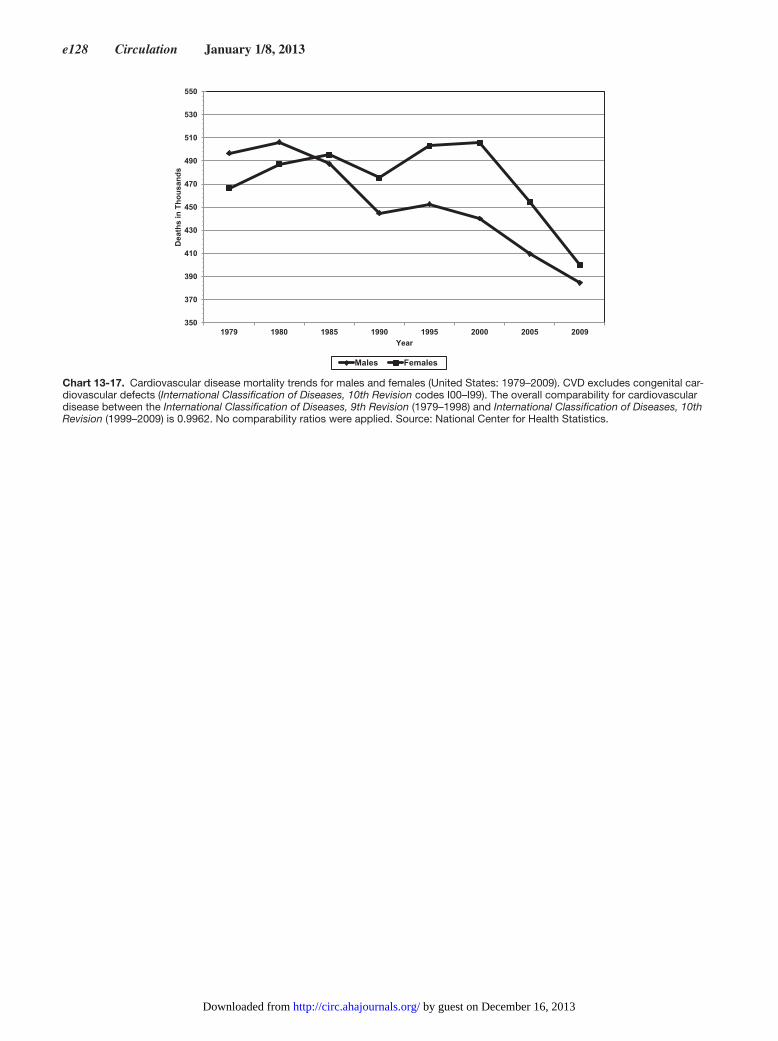
e128 Circulation January 1/8, 2013
350
370
390
410
430
450
470
490
510
530
550
1979 1980 1985 1990 1995 2000 2005 2009
Dea
ths
in T
hous
ands
Year
Males Females
Chart 13-17. Cardiovascular disease mortality trends for males and females (United States: 1979–2009). CVD excludes congenital car-diovascular defects (International Classification of Diseases, 10th Revision codes I00–I99). The overall comparability for cardiovascular disease between the International Classification of Diseases, 9th Revision (1979–1998) and International Classification of Diseases, 10th Revision (1999–2009) is 0.9962. No comparability ratios were applied. Source: National Center for Health Statistics.
by guest on December 16, 2013http://circ.ahajournals.org/Downloaded from
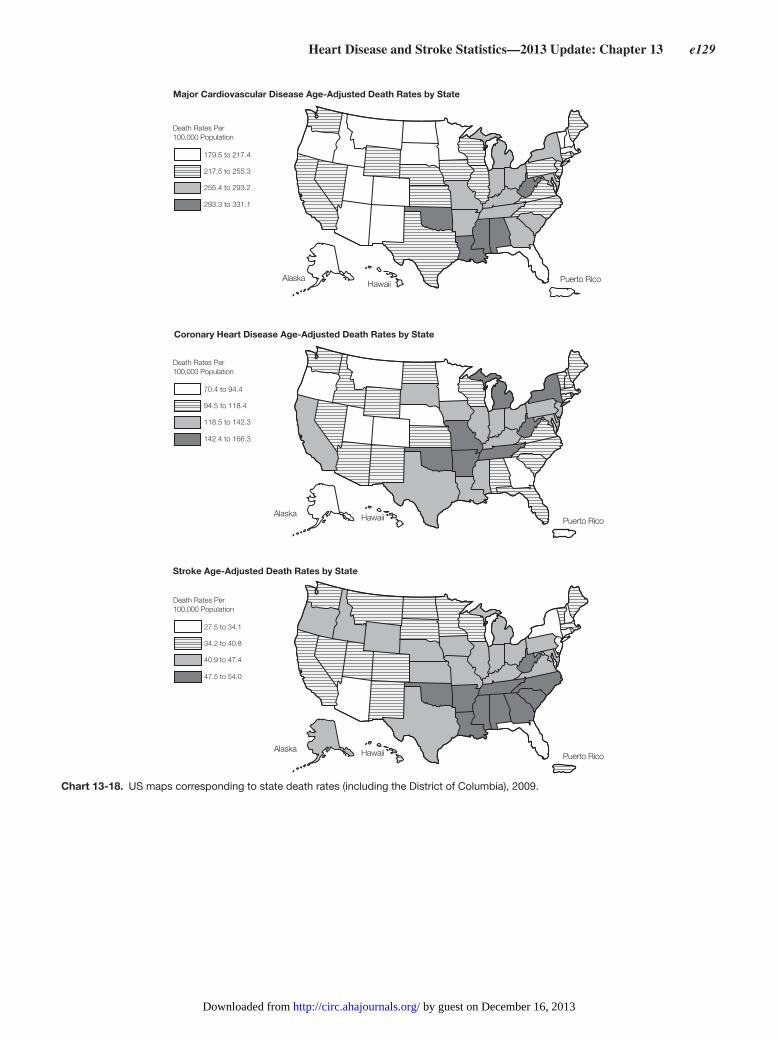
Heart Disease and Stroke Statistics—2013 Update: Chapter 13 e129
Death Rates Per100,000 Population
Stroke Age-Adjusted Death Rates by State
27.5 to 34.1
34.2 to 40.8
40.9 to 47.4
47.5 to 54.0
Death Rates Per100,000 Population
AlaskaHawaii
Major Cardiovascular Disease Age-Adjusted Death Rates by State
179.5 to 217.4
217.5 to 255.3
255.4 to 293.2
293.3 to 331.1
Puerto Rico
Death Rates Per100,000 Population
Alaska Hawaii Puerto Rico
Coronary Heart Disease Age-Adjusted Death Rates by State
70.4 to 94.4
94.5 to 118.4
118.5 to 142.3
142.4 to 166.3
Alaska Hawaii Puerto Rico
Chart 13-18. US maps corresponding to state death rates (including the District of Columbia), 2009.
by guest on December 16, 2013http://circ.ahajournals.org/Downloaded from

e130 Circulation January 1/8, 2013
7.9
11.2
21.6
30
4.5
7.3
15.9
24.8
0
5
10
15
20
25
30
35
A B C D
Estim
ated
10-
Year
Rat
e%
Men Women
A B C D Age 50-54 50-54 50-54 50-54HDL Cholesterol, mg/dL 45-49 45-49 35-44 35-44Total Cholesterol, mg/dL 160-199 200-239 200-239 200-239Systolic BP mm/Hg, no treatment 120-129 130-139 130-139 130-139Smoker No No No YesDiabetes No No Yes Yes
Chart 13-19. Estimated average 10-year cardiovascular disease risk in adults 50 to 54 years of age according to levels of various risk factors (Framingham Heart Study). HDL indicates high-density lipoprotein; BP, blood pressure. Data derived from D’Agostino et al48 with permission of the publisher. Copyright © 2008, American Heart Association.
0
1
2
3
4
5
6
7
1970 1975 1980 1985 1990 1995 2000 2005 2010
Dis
char
ges
in M
illio
ns
Year
Chart 13-20. Hospital discharges for cardiovascular disease (United States: 1970–2010). Hospital discharges include people discharged alive, dead, and “status unknown.” Source: National Center for Health Statistics and National Heart, Lung, and Blood Institute.
by guest on December 16, 2013http://circ.ahajournals.org/Downloaded from
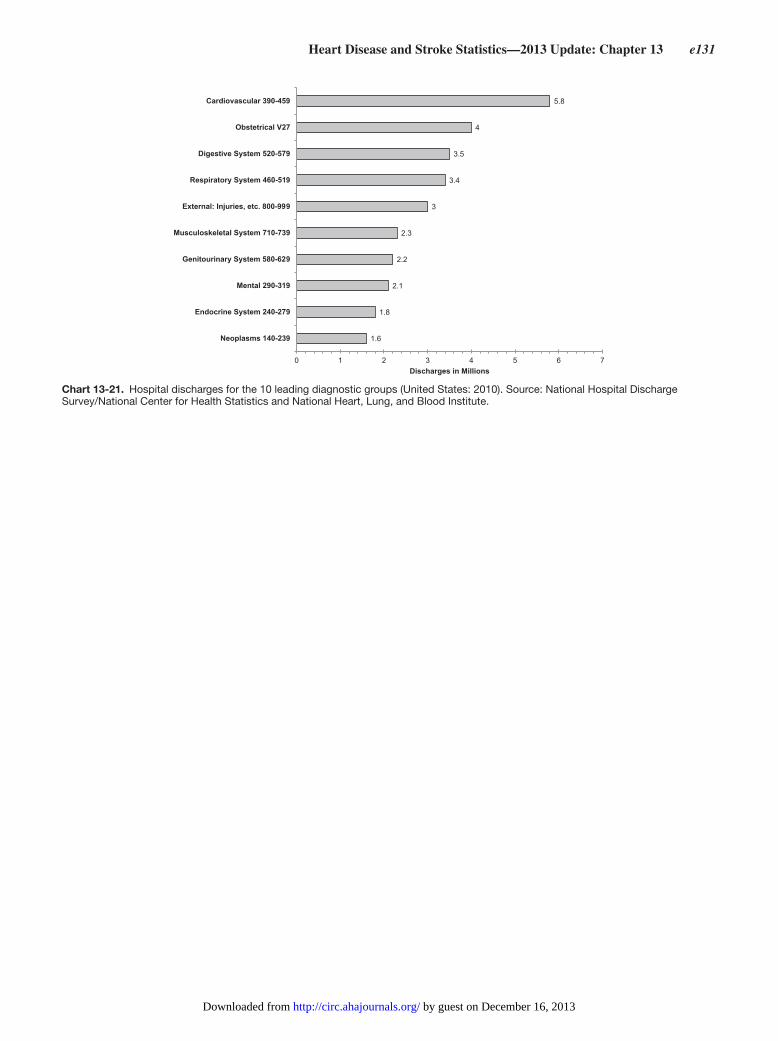
Heart Disease and Stroke Statistics—2013 Update: Chapter 13 e131
1.6
1.8
2.1
2.2
2.3
3
3.4
3.5
4
5.8
0 1 2 3 4 5 6 7
Neoplasms 140-239
Endocrine System 240-279
Mental 290-319
Genitourinary System 580-629
Musculoskeletal System 710-739
External: Injuries, etc. 800-999
Respiratory System 460-519
Digestive System 520-579
Obstetrical V27
Cardiovascular 390-459
Discharges in Millions
Chart 13-21. Hospital discharges for the 10 leading diagnostic groups (United States: 2010). Source: National Hospital Discharge Survey/National Center for Health Statistics and National Heart, Lung, and Blood Institute.
by guest on December 16, 2013http://circ.ahajournals.org/Downloaded from
e132 Circulation January 1/8, 2013
14. Stroke (Cerebrovascular Disease)
ICD-9 430 to 438; ICD-10 I60 to I69. See Tables 14-1 and 14-2 and Charts 14-1 through 14-13.
Stroke Prevalence(See Table 14-1 and Chart 14-1 .)
●● An estimated 6 .8 million Americans ≥20 years of age have had a stroke (extrapolated to 2010 using NHANES 2007–2010 data) . Overall stroke prevalence during this period is an estimated 2 .8% .
●● According to data from the 2010 BRFSS (CDC), 2 .7% of men and 2 .6% of women ≥18 years of age had a his-tory of stroke; 2 .4% of non-Hispanic whites, 3 .9% of non-Hispanic blacks, 1 .5% of Asian/Pacific Islanders, 2 .5% of Hispanics (of any race), 5 .9% of American Indian/Alaska Natives, and 4 .1% of other races or multiracial people had a history of stroke .1
●● Over the time period 2006–2010, data from BRFSS show that the overall self-reported stroke prevalence did not change .1
●● Older adults, blacks, people with lower levels of education, and people living in the southeastern United States had higher stroke prevalence .1
●● The prevalence of silent cerebral infarction is estimated to range from 6% to 28%, with higher prevalence with increas-ing age .2–4 The prevalence estimates also vary depending on the population studied (eg, ethnicity, sex, risk factor pro-file), definition of silent cerebral infarction, and imaging technique . It has been estimated that 13 million people had prevalent silent stroke in the 1998 US population .5,6
●● The prevalence of stroke-related symptoms was found to be relatively high in a general population free of a prior diag-nosis of stroke or transient ischemic attack (TIA) . On the basis of data from 18 462 participants enrolled in a national cohort study, 17 .8% of the population >45 years of age reported at least 1 symptom . Stroke symptoms were more likely among blacks than whites, among those with lower income and lower educational attainment, and among those with fair to poor perceived health status . Symptoms also were more likely in participants with higher Framingham stroke risk score (REGARDS, NINDS) .7
●● Projections show that by 2030, an additional 4 million people will have had a stroke, a 21 .9% increase in preva-lence from 2013 (AHA computation based on methodology described in Heidenreich et al8) .
Stroke Incidence(See Table 14-1 and Charts 14-2 through 14-5 .)
●● Each year, ≈795 000 people experience a new or recurrent stroke . Approximately 610 000 of these are first attacks, and 185 000 are recurrent attacks (GCNKSS, NINDS, and NHLBI; GCNKSS and NINDS data for 1999 provided July 9, 2008; estimates compiled by NHLBI) .
●● Of all strokes, 87% are ischemic and 10% are intracerebral hemorrhagic strokes, whereas 3% are subarachnoid hemor-rhage strokes (GCNKSS, NINDS, 1999) .
●● On average, every 40 seconds, someone in the United States has a stroke (AHA computation based on the latest available data) .
Abbreviations Used in Chapter 14
AF atrial fibrillation
AHA American Heart Association
ARIC Atherosclerosis Risk in Communities study
BASIC Brain Attack Surveillance in Corpus Christi
BP blood pressure
BRFSS Behavioral Risk Factor Surveillance System
CAS carotid artery stenting
CDC Centers for Disease Control and Prevention
CEA carotid endarterectomy
CHD coronary heart disease
CHS Cardiovascular Health Study
CI confidence interval
CLRD chronic lower respiratory disease
CREST Carotid Revascularization Endarterectomy versus Stenting Trial
CVD cardiovascular disease
DM diabetes mellitus
ED emergency department
eGFR estimated glomerular filtration rate
EMS emergency medical services
FHS Framingham Heart Study
FRS Framingham Risk Score
GCNKSS Greater Cincinnati/Northern Kentucky Stroke Study
GFR glomerular filtration rate
HD heart disease
HDL high-density lipoprotein
HR hazard ratio
ICD-9 International Classification of Diseases, 9th Revision
ICD-10 International Classification of Diseases, 10th Revision
ICH intracerebral hemorrhage
MCBE Medicare beneficiaries
MEPS Medical Expenditure Panel Survey
MI myocardial infarction
NCHS National Center for Health Statistics
NH non-Hispanic
NHAMCS National Hospital Ambulatory Medical Care Survey
NHANES National Health and Nutrition Examination Survey
NHDS National Hospital Discharge Survey
NHIS National Health Interview Survey
NHLBI National Heart, Lung, and Blood Institute
NINDS National Institutes of Neurological Disorders and Stroke
NOMAS Northern Manhattan Study
OR odds ratio
PA physical activity
PAR population attributable risk
REGARDS Reasons for Geographic and Racial Differences in Stroke study
RR relative risk
SAH subarachnoid hemorrhage
STOP Stroke Prevention Trial in Sickle Cell Anemia
SWiTCH Stroke With Transfusions Changing to Hydroxyurea
TIA transient ischemic attack
by guest on December 16, 2013http://circ.ahajournals.org/Downloaded from
Heart Disease and Stroke Statistics—2013 Update: Chapter 14 e133
●● Each year, ≈55 000 more women than men have a stroke (GCNKSS, NINDS) .9
●● Women have a higher lifetime risk of stroke than men . In the FHS, lifetime risk of stroke among those 55 to75 years of age was 1 in 5 for women (20% to 21%) and ≈1 in 6 for men (14% to 17%) .10
●● Women have lower age-adjusted stroke incidence than men; however, sex differences in stroke risk may be modi-fied by age .11 Data from FHS demonstrate that compared with white men, white women 45 to 84 years of age have lower stroke risk than men, but this association is reversed in older ages such that women >85 years of age have ele-vated risk compared with men .12 Similarly, a population-based study in Sweden found stroke incidence to be lower for women than for men at ages 55 to 64 years, but at 75 to 85 years of age, this association reversed, and women had a higher incidence than men .13 Other studies report an excess risk of stroke in men compared with women that persists throughout the life course or that diminishes but does not reverse with age .14–18
●● In the national REGARDS cohort, in 27 744 participants followed up for 4 .4 years (2003–2010), the overall age- and sex-adjusted black/white incidence rate ratio was 1 .51, but for ages 45 to 54 years, it was 4 .02, whereas for those ≥85 years of age, it was 0 .86 .19 Similar trends for decreasing black/white incidence rate ratio with age were seen in the GCNKSS .20
●● Analysis of data from the FHS suggests that stroke inci-dence is declining over time in this largely white cohort . Data from 1950 to 1977, 1978 to 1989, and 1990 to 2004 showed that the age-adjusted incidence of first stroke per 1000 person-years in each of the 3 periods was 7 .6, 6 .2, and 5 .3 in men and 6 .2, 5 .8, and 5 .1 in women, respec-tively . Lifetime risk for incident stroke at 65 years of age decreased significantly in the latest data period compared with the first, from 19 .5% to 14 .5% in men and from 18 .0% to 16 .1% in women .21
●● In a similar fashion, data from the most recent GCNKSS show that compared with the 1990s, when incidence rates of stroke were stable, stroke incidence in 2005 was decreased for whites . A similar decline was not seen in blacks . These changes for whites were driven by a decline in ischemic strokes . There were no changes in incidence of ischemic stroke for blacks or of hemorrhagic strokes in blacks or whites .9
●● The BASIC (Brain Attack Surveillance in Corpus Christi) project (NINDS) demonstrated an increased incidence of stroke among Mexican Americans compared with non-Hispanic whites in a community in southeast Texas . The crude 3-year cumulative incidence (2000–2002) was 16 .8 per 1000 in Mexican Americans and 13 .6 per 1000 in non-Hispanic whites . Specifically, Mexican Americans had a higher cumulative incidence for ischemic stroke at younger ages (45–59 years of age: RR, 2 .04; 95% CI, 1 .55–2 .69; 60–74 years of age: RR, 1 .58; 95% CI, 1 .31–1 .91) but not at older ages (≥75 years of age: RR, 1 .12; 95% CI, 0 .94–1 .32) . Mexican Americans also had a higher incidence of intracerebral hemorrhage and subarachnoid hemorrhage than non-Hispanic whites, adjusted for age .22
●● The age-adjusted incidence of first ischemic stroke per 1000 was 0 .88 in whites, 1 .91 in blacks, and 1 .49 in
Hispanics according to data from the Northern Manhattan Study (NOMAS; NINDS) for 1993 to 1997 . Among blacks, compared with whites, the relative rate of intracranial ath-erosclerotic stroke was 5 .85; of extracranial atherosclerotic stroke, 3 .18; of lacunar stroke, 3 .09; and of cardioembolic stroke, 1 .58 . Among Hispanics (primarily Cuban and Puerto Rican), compared with whites, the relative rate of intracranial atherosclerotic stroke was 5 .00; of extracranial atherosclerotic stroke, 1 .71; of lacunar stroke, 2 .32; and of cardioembolic stroke, 1 .42 .23
●● Among 4507 American Indian participants without a prior stroke in the Strong Heart Study in 1989 to 1992, the age- and sex-adjusted incidence of stroke through 2004was 6 .79 per 100 person-years, with 86% of incident strokes being ischemic .24
●● In the GCNKSS, the annual incidence of anticoagulant-associated intracerebral hemorrhage per 100 000 people increased from 0 .8 (95% CI, 0 .3–1 .3) in 1988 to 1 .9 (95% CI, 1 .1–2 .7) in 1993/1994 and 4 .4 (95% CI, 3 .2–5 .5) in 1999 (P<0 .001 for trend) . Among people ≥80 years of age, the rate of anticoagulant-associated intracerebral hemor-rhage increased from 2 .5 (95% CI, 0–7 .4) in 1988 to 45 .9 (95% CI, 25 .6–66 .2) in 1999 (P<0 .001 for trend) .25
TIA: Prevalence, Incidence, and Prognosis
●● In a nationwide survey of US adults, the estimated preva-lence of self-reported physician-diagnosed TIA was 2 .3%, which translates into ≈5 million people . The true preva-lence of TIA is greater, because many patients who experi-ence neurological symptoms consistent with a TIA fail to report it to their healthcare provider .26
●● In the GCNKS, using data from 1993 and 1994, the age-, sex-, and race-adjusted incidence rates for TIA were 0 .83 per 10 000 .27 Age- and sex- adjusted incidence rates for TIA in Rochester, MN, were estimated at 0 .68 per 1000 for the years 1985 through 1989 .28 In a more recent Italian community-based registry conducted in 2007 to 2009, the crude TIA incidence rate was 0 .52 per 1000 .29
●● The prevalence of physician-diagnosed TIA increases with age .26 Incidence of TIA increases with age and varies by sex and race/ethnicity . Men, blacks, and Mexican Ameri-cans have higher rates of TIA than their female and non-Hispanic white counterparts .22,27,29
●● Approximately 15% of all strokes are heralded by a TIA .30
●● TIAs confer a substantial short-term risk of stroke, hospi-talization for CVD events, and death . Of 1707 TIA patients evaluated in the ED of Kaiser Permanente Northern Cali-fornia, a large, integrated healthcare delivery system, 180 (11%) experienced a stroke within 90 days . Ninety-one patients (5%) had a stroke within 2 days . Predictors of stroke included age >60 years, DM, focal symptoms of weakness or speech impairment, and TIA that lasted >10 minutes .31
●● Meta-analyses of cohorts of patients with TIA have shown the short-term risk of stroke after TIA to be ≈3% to 10% at 2 days and 9% to 17% at 90 days .32,33
●● Individuals who have a TIA and survive the initial high-risk period have a 10-year stroke risk of roughly 19% and a combined 10-year stroke, MI, or vascular death risk of 43% (4% per year) .34
by guest on December 16, 2013http://circ.ahajournals.org/Downloaded from

e134 Circulation January 1/8, 2013
●● Within 1 year of TIA, ≈12% of patients will die .27
●● It is estimated that one third of episodes characterized as TIA according to the classic definition (ie, focal neu-rological deficits that resolve within 24 hours) would be considered infarctions on the basis of diffusion-weighted magnetic resonance imaging findings .35
Stroke Mortality(See Table 14-1 and Charts 14-6 through 14-7 .)
●● On average, every 4 minutes, someone dies of a stroke (NCHS, NHLBI) .36
●● Stroke accounted for ≈1 of every 19 deaths in the United States in 2009 .36
●● When considered separately from other CVDs, stroke ranks No . 4 among all causes of death, behind diseases of the heart, cancer, and CLRD (NCHS mortality data) . Stroke mortality as an underlying cause of death in 2009 was 128 824; any-mention mortality in 2009 was 215 864, and the death rate was 38 .9 per 100 000 .36
●● From 1999 to 2009, the annual stroke death rate decreased 36 .9%, and the actual number of stroke deaths declined 22 .9% (AHA computation) .36
●● Conclusions about changes in stroke death rates from 1980 to 2005 are as follows:
—There was a greater decline in stroke death rates in men than in women, with a male-to-female ratio decreasing from 1 .11 to 1 .03 (age adjusted) .
—There were greater declines in stroke death rates in men than in women and among people ≥65 years of age than among younger ages .37
●● In examining trends in stroke mortality by census divisions between 1999 and 2007 for people ≥45 years of age, the rate of decline varied by geographic region and race-ethnic group . Among black and white women and white men, rates declined by at least 2% annually in every census divi-sion, but among black men, rates declined little in the East and West South Central divisions .38
●● Approximately 56% of stroke deaths in 2009 occurred out of the hospital (unpublished tabulation of NCHS 2009 Mortality Data Set) .
●● More women than men die of stroke each year because of the larger number of elderly women . Women accounted for almost 60% of US stroke deaths in 2009 (AHA tabulation) .36
●● From 1995 to 1998, age-standardized mortality rates for ischemic stroke, subarachnoid hemorrhage, and intrace-rebral hemorrhage were higher among blacks than whites . Death rates attributable to intracerebral hemorrhage also were higher among Asians/Pacific Islanders than among whites . All minority populations had higher death rates attributable to subarachnoid hemorrhage than did whites . Among adults 25 to 44 years of age, blacks and Ameri-can Indian/Alaska Natives had higher risk ratios for stroke mortality than did whites for all 3 stroke subtypes . Age-standardized mortality rates for ischemic stroke and intra-cerebral hemorrhage were lower for Hispanics than for whites .39
●● In 2002, death certificate data showed that the mean age at stroke death was 79 .6 years; however, males had a younger mean age at stroke death than females . Blacks,
American Indian/Alaska Natives, and Asian/Pacific Island-ers had younger mean ages than whites, and the mean age at stroke death was also younger among Hispanics than non-Hispanics .40
●● A report released by the CDC in collaboration with the Centers for Medicare & Medicaid Services, the Atlas of Stroke Hospitalizations Among Medicare Beneficiaries, found that in Medicare beneficiaries over the time period 1995 to 2002, 30-day mortality rate varied by age: 9% in patients 65 to 74 years of age, 13 .1% in those 74 to 84 years of age, and 23% in those ≥85 years of age .41
●● There are substantial geographic disparities in stroke mor-tality, with higher rates in the southeastern United States, known as the “stroke belt .” This area is usually defined to include the 8 southern states of North Carolina, South Caro-lina, Georgia, Tennessee, Mississippi, Alabama, Louisiana, and Arkansas . These geographic differences have existed since at least 1940,42 and despite some minor shifts,43 they persist .41,44,45 Within the stroke belt, a “buckle” region along the coastal plain of North Carolina, South Carolina, and Georgia has been identified with an even higher stroke mor-tality rate than the remainder of the stroke belt .46 The over-all average stroke mortality is ≈20% higher in the stroke belt than in the rest of the nation and ≈40% higher in the stroke buckle .
Stroke Risk Factors(See Table 14-2 and Chart 14-8 .)For prevalence and other information on any of these specific risk factors, refer to the specific risk factor chapters .
High Blood Pressure(See Chapter 9 for more information .)
●● BP is a powerful determinant of risk for both ischemic stroke and intracranial hemorrhage .
—Approximately 77% of those who have a first stroke have BP >140/90 mm Hg (NHLBI unpublished esti-mates from ARIC, CHS, and FHS Cohort and Offspring studies) .
—Diabetic subjects with BP <120/80 mm Hg have approx-imately half the lifetime risk of stroke of subjects with hypertension . The treatment and lowering of BP among diabetic hypertensive individuals was associated with a significant reduction in stroke risk .47
●● A meta-analysis of 12 prospective cohort studies (including 518 520 participants) found that prehypertension is asso-ciated with incident stroke . The risk is particularly noted in nonelderly people and for those with BP values in the higher prehypertension range .48
●● Prehypertension was found to be highest in blacks with other risk factors, including DM and elevated C-reactive protein .49
●● In REGARDS (NINDS), black participants were more aware than whites of their hypertension and more likely to be undergoing treatment if aware of their diagnosis, but among those treated for hypertension, they were less likely than whites to have their BP controlled .50
●● REGARDS (NINDS) also showed no evidence of a differ-ence between the stroke belt and other regions in awareness of hypertension, but there was a trend for better treatment
by guest on December 16, 2013http://circ.ahajournals.org/Downloaded from

Heart Disease and Stroke Statistics—2013 Update: Chapter 14 e135
and BP control in the stroke belt region . The lack of sub-stantial geographic differences in hypertension awareness and the trend toward better treatment and control in the stroke belt suggest that differences in hypertension man-agement may not be a major contributor to the geographic disparity in stroke mortality .50
Diabetes Mellitus(See Chapter 10 for more information .)
●● Age-specific incidence rates and rate ratios show that DM increases ischemic stroke incidence at all ages, but this risk is most prominent before 55 years of age in blacks and before 65 years of age in whites . Ischemic stroke patients with DM are younger, more likely to be black, and more likely to have hypertension, MI, and high cholesterol than nondiabetic patients .51
●● In people with history of TIA or minor stroke, impaired glucose tolerance nearly doubled the stroke risk compared with those with normal glucose levels and tripled the risks for those with DM .52
Disorders of Heart Rhythm(See Chapter 16 for more information .)
●● AF is a powerful risk factor for stroke, independently increasing risk ≈5-fold throughout all ages . The percentage of strokes attributable to AF increases steeply from 1 .5% at 50 to 59 years of age to 23 .5% at 80 to 89 years of age .53,54
●● Because AF is often asymptomatic55,56 and likely frequently clinically undetected,57 the stroke risk attributed to AF may be substantially underestimated .58
●● Among 2580 participants ≥65 years of age with hyper-tension in whom a cardiac rhythm device that included an atrial lead was implanted, 35% developed subclini-cal tachyarrhythmias (defined as an atrial rate ≥190 beats per minute that lasted at least 6 minutes) . These subclini-cal events were independently associated with a 2 .5-fold increased risk of ischemic stroke or systemic embolism .59
High Blood Cholesterol and Other Lipids(See Chapter 8 for more information .)
●● Data from the Honolulu Heart Program//NHLBI found that in Japanese men 71 to 93 years of age, low concentrations of HDL cholesterol were more likely to be associated with a future risk of thromboembolic stroke than were high con-centrations .60 However, a meta-analysis of 23 studies per-formed in the Asia-Pacific Region showed no significant association between low HDL and stroke risk .61
Smoking(See Chapter 3 for more information .)
●● Current smokers have a 2 to 4 times increased risk of stroke compared with nonsmokers or those who have quit for >10 years .62,63
●● Cigarette smoking is a risk factor for ischemic stroke and subarachnoid hemorrhage, but the data for intracerebral hemorrhage are less consistent .62,63
●● Smoking is perhaps the most important modifiable risk fac-tor in preventing subarachnoid hemorrhage, with the high-est PAR of any subarachnoid hemorrhage risk factor .64
●● Data also support a dose-response relationship across old and young age groups .62,65
●● Discontinuation of smoking has been shown to reduce stroke risk across sex, race, and age groups .65
●● Exposure to secondhand smoke (also termed passive smok-ing or environmental tobacco smoke) is a risk factor for stroke . Meta-analyses have estimated a pooled RR of 1 .25 for exposure to spousal smoking (or nearest equivalent) and risk of stroke . A dose-response relationship between expo-sure to secondhand smoke and stroke risk has also been reported .66,67
Physical Inactivity(See Chapter 4 for more information .)
●● In NOMAS, a prospective cohort that included white, black, and Hispanic adults in an urban setting followed up for a median of 9 years, moderate to vigorous PA was asso-ciated with an overall 35% reduction in risk of ischemic stroke compared with no PA .68 In this cohort, it was also found that only moderate- to vigorous-intensity exercise was associated with reduced stroke incidence, whereas light exercise (such as walking) showed no benefit .69
●● In NOMAS, higher levels of PA were associated with lower risk of silent brain infarcts on magnetic resonance imaging, even after adjustment for other risk factors potentially in the pathway of action for PA .70
●● Timing of PA in relation to stroke onset has also been exam-ined in several studies . In a hospital-based case-control study from Heidelberg, Germany, recent activity (within the prior months) was associated with reduced odds of hav-ing a stroke or TIA, whereas sports activity during young adulthood that was not continued showed no benefit .71 In a Danish case-control study, ischemic stroke patients were less physically active in the week preceding the stroke than age- and sex-matched control subjects, with the highest activity scores associated with the greatest reduction in odds of stroke .72
Family History and Genetics(See Chapter 7 for more information .)
●● In the FHS, a documented parental ischemic stroke by the age of 65 years was associated with a 3-fold increase in ischemic stroke risk in offspring, even after adjustment for other known stroke risk factors . The absolute magnitude of the increased risk was greatest in those in the highest quin-tile of the FRS . By age 65 years, people in the highest FRS quintile with an early parental ischemic stroke had a 25% risk of stroke compared with a 7 .5% risk of ischemic stroke for those without such a history .73
Chronic Kidney Disease(See Chapter 12 for more information .)
●● The CHS (NHLBI) showed that people with creatinine ≥1 .5 mg/dL were at increased risk for stroke, with an adjusted HR of 1 .77 (95% CI, 1 .08–2 .91) .74 Participants in REGARDS with a reduced eGFR were also shown to have increased risk of stroke symptoms,75 and a meta-analysis of >280 000 patients showed a 43% increased incident stroke risk among patients with a GFR <60 mL·min−1·1 .73 m−2 .76
by guest on December 16, 2013http://circ.ahajournals.org/Downloaded from
e136 Circulation January 1/8, 2013
Risk Factor Issues Specific to Women
●● On average, women are older at stroke onset than men (≈75 years compared with 71 years) .12
●● Analysis of data from the FHS found that women with nat-ural menopause before 42 years of age had twice the isch-emic stroke risk of women with natural menopause after 42 years of age .77 Investigators from the Nurse’s Health Study, however, did not find an association between age at natural menopause and risk of ischemic or hemorrhagic stroke .78
●● Overall, randomized clinical trial data indicate that the use of estrogen plus progestin, as well as estrogen alone, increases stroke risk in postmenopausal, generally healthy women and provides no protection for postmenopausal women with established CHD79–82 and recent stroke or TIA .83
●● In a nested case-control study of the United Kingdom’s General Practice Research Database, the rate of stroke was not elevated when current users of transdermal estrogens, with or without progestins, were compared with nonus-ers (RR, 0 .95; 95% CI, 0 .75–1 .20) . This association was modified by dose such that stroke risk was not increased for users of low-dose (≤50 μg) estrogen patches (RR, 0 .81; 95% CI, 0 .62–1 .05) but was increased for users of high-dose (>50 μg) patches (RR, 1 .89; 95% CI, 1 .15–3 .11) com-pared with nonusers .84
●● The risk of ischemic stroke or intracerebral hemorrhage during pregnancy and the first 6 weeks after giving birth was 2 .4 times greater than for nonpregnant women of simi-lar age and race, according to the Baltimore-Washington Cooperative Young Stroke Study . The risk of ischemic stroke during pregnancy was not increased during preg-nancy per se but was increased 8 .7-fold during the first 6 postpartum weeks . Intracerebral hemorrhage showed a small RR of 2 .5 during pregnancy that increased dramati-cally to an RR of 28 .3 in the first 6 postpartum weeks . The excess risk of stroke (all types except subarachnoid hem-orrhage) attributable to the combined pregnancy/postpreg-nancy period was 8 .1 per 100 000 pregnancies .85
●● In the US Nationwide Inpatient Sample from 2000 to 2001, the rate of events per 100 000 pregnancies was 9 .2 for ischemic stroke, 8 .5 for intracerebral hemorrhage, 0 .6 for cerebral venous thrombosis, and 15 .9 for the ill-defined category of pregnancy-related cerebrovascular events, for a total rate of 34 .2 per 100 000, not including subarachnoid hemorrhage . The risk was increased in blacks and among older women . Death occurred during hospitalization in 4 .1% of women with these events and in 22% of survivors after discharge to a facility other than home .86
●● Analyses of the US Nationwide Inpatient Sample from 1994 to 1995 and from 2006 to 2007 show a temporal increase in the proportion of pregnancy hospitalizations that were associated with a stroke, with a 47% increase for antenatal hospitalizations and an 83% increase for postpartum hospitalizations, but no increase for delivery hospitalizations . Increases in the prevalence of HD and hypertensive disorders accounted for almost all the increase in postpartum stroke hospitalizations but not the antenatal stroke hospitalizations .88
●● Preeclampsia is a risk factor for ischemic stroke remote from pregnancy .89 The subsequent stroke risk of preeclamp-sia maybe mediated by a 3 .6- to 6 .1-fold higher later risk
of hypertension and a 3 .1- to 3 .7-fold higher later risk of DM, depending on whether the preeclampsia was mild or severe .90
Sleep Apnea
●● Sleep apnea is an independent risk factor for stroke, increas-ing the risk of stroke or death 2-fold .91–94
●● Increasing sleep apnea severity is associated with greater stroke risk; patients with severe sleep apnea have 3-to 4-fold increased odds of stroke .91,93,94
●● Sleep apnea is common after stroke, occurring in two thirds to three quarters of poststroke patients . 95–106
●● Continuous positive airway pressure improves a variety of outcomes after stroke .96,107–109 For example, continuous pos-itive airway pressure reduces the risk of recurrent vascular events among patients with stroke (relative risk reduction, 81 .4%; number needed to treat, 3 .4) .108
Awareness of Stroke Warning Signs and Risk Factors
●● Correct knowledge of at least 1 stroke warning sign increased from 48% in 1995 to 68% in 2000, with no significant improvement to 2005 (68%) on the basis of a telephone survey conducted in a biracial population in the greater Cincinnati/Northern Kentucky region . Knowledge of 3 correct warning signs was low but increased over time: 5 .4% in 1995, 12 .0% in 2000, and 15 .7% in 2005 . Knowl-edge of at least 1 stroke risk factor increased from 59% in 1995 to 71% in 2000, but there was no improvement to 2005 (71%) . Only 3 .6% of those surveyed were able to independently identify tissue-type plasminogen activator as an available drug therapy, and only 9% of these were able to identify a window of <3 hours for treatment .110
●● In the 2009 NHIS, 51 .2% of subjects were aware of 5 stroke warning symptoms and would first call 911 if they thought that someone was having a stroke . Awareness of all 5 stroke warning symptoms and calling 911 was higher among whites than blacks and Hispanics (55 .9%, 47 .1%, and 36 .5%, respectively), women than men (53 .6% versus 48 .6%), and people with higher versus lower educational attainment (59 .0% for people with a bachelor’s degree or more compared with 51 .4% for people with a high school diploma or some college and 36 .7% for those who had not received a high school diploma; unpublished NHLBI tabulation) .
●● A study was conducted of patients admitted to an ED with possible stroke to determine their knowledge of the signs, symptoms, and risk factors of stroke . Of the 163 patients able to respond, 39% did not know a single sign or symp-tom . Patients ≥65 years of age were less likely than those <65 years old to know a sign or symptom of stroke (28% versus 47%), and 43% did not know a single risk factor . Overall, almost 40% of patients did not know the signs, symptoms, and risk factors for stroke .111
●● In 2004, 800 adults ≥45 years of age were surveyed to assess their perceived risk for stroke and their history of stroke risk factors . Overall, 39% perceived themselves to be at risk . Younger age, current smoking, a history of DM, high BP, high cholesterol, HD, and stroke/TIA were independently associated with perceived risk for stroke .
by guest on December 16, 2013http://circ.ahajournals.org/Downloaded from
Heart Disease and Stroke Statistics—2013 Update: Chapter 14 e137
Respondents with AF were no more likely to report being at risk than were respondents without AF . Perceived risk for stroke increased as the number of risk factors increased; however, 46% of those with ≥3 risk factors did not perceive themselves to be at risk .112
●● A study of patients who had experienced a stroke found that only 60 .5% were able to accurately identify 1 stroke risk factor and that 55 .3% were able to identify 1 stroke symptom . Patients’ median delay time from onset of symptoms to admission in the ED was 16 hours, and only 31 .6% accessed the ED in <2 hours . Analysis showed that the appearance of nonmotor symptoms as the primary symptom and nonuse of the 911 system were significant predictors of delay >2 hours . Someone other than the patient made the decision to seek treatment in 66% of the cases .113
●● Spanish-speaking Hispanics are less likely to know all stroke symptoms than English-speaking Hispanics, non-Hispanic blacks, and non-Hispanic whites . Lack of Eng-lish proficiency is strongly associated with lack of stroke knowledge among Hispanics .114
Aftermath(See Charts 14-9 through 14-12 .)
●● Stroke is a leading cause of serious long-term disability in the United States (Survey of Income and Program Partici-pation, a survey of the US Bureau of the Census) .115
●● Among Medicare patients discharged from the hospital after stroke, ≈45% return directly home, 24% are dis-charged to inpatient rehabilitation facilities, and 31% are discharged to skilled nursing facilities . Of stroke patients returning directly home, 32% use home healthcare ser-vices .116 For Medicare patients (including, but not limited to, stroke survivors), the likelihood of receiving inpatient rehabilitation facility care versus skilled nursing facility care is substantially influenced by the distance to and avail-ability of inpatient rehabilitation facility beds .117
●● Approximately one third of stroke survivors experience poststroke depression .118
●● In the NHLBI’s FHS, among ischemic stroke survivors who were ≥65 years of age, the following disabilities were observed at 6 months after stroke119:
— 50% had some hemiparesis— 30% were unable to walk without some assistance— 46% had cognitive deficits— 35% had depressive symptoms— 19% had aphasia— 26% were dependent in activities of daily living— 26% were institutionalized in a nursing home
●● Data from the BRFSS (CDC) 2005 survey on stroke sur-vivors in 21 states and the District of Columbia found that 30 .7% of stroke survivors received outpatient rehabilita-tion . The findings indicated that the prevalence of stroke survivors receiving outpatient stroke rehabilitation was lower than would be expected if clinical practice guide-line recommendations for all stroke patients had been followed .120
●● After stroke, women have greater disability than men . A cross-sectional analysis of 5888 community-living elderly
people (>65 years of age) in the CHS who were ambula-tory at baseline found that women were half as likely to be independent in activities of daily living after stroke, even after controlling for age, race, education, and marital sta-tus .121 A prospective study from a Michigan-based stroke registry found that women had a 63% lower probability of achieving independence in activities of daily living 3 months after discharge, even after controlling for age, race, subtype, prestroke ambulatory status, and other patient characteristics .122
●● Black stroke survivors had greater limitations in ambula-tion than did white stroke survivors, after adjustment for age, sex, and educational attainment but not stroke subtype, according to data from the NHIS (2000–2001, NCHS) as analyzed by the CDC .123 A national study of inpatient reha-bilitation after first stroke found that blacks were younger, had a higher proportion of hemorrhagic stroke, and were more disabled on admission . Compared with non-Hispanic whites, blacks and Hispanics also had a poorer functional status at discharge but were more likely to be discharged to home rather than to another institution, even after adjust-ment for age and stroke subtype . After adjustment for the same covariates, compared with non-Hispanic whites, blacks also had less improvement in functional status per inpatient day .124
Hospital Discharges/Ambulatory Care Visits(See Table 14-1 .)
●● From 2000 to 2010, the number of inpatient discharges from short-stay hospitals with stroke as the first-listed diagnosis remained about the same, with discharges of 981 000 and 1 015 000, respectively (NHDS, NHLBI tabulation) .
●● Data from 2010 from the NHDS of the NCHS showed that the average length of stay for discharges with stroke as the first-listed diagnosis was 6 .1 days compared with 9 .5 days in 1990 .
●● In 2010, men and women accounted for roughly the same number of hospital stays for stroke in the 18- to 44-year-old age group . Among people 45 to 64 years of age, 57 .1% of stroke patients were men . After 65 years of age, women were the majority . Among people 65 to 84 years of age, 53 .4% of stroke patients were women, whereas among those ≥85 years of age, women constituted 66 .2% of all stroke patients .125
●● A first-ever county-level Atlas of Stroke Hospitalizations Among Medicare Beneficiaries was released in 2008 by the CDC in collaboration with the Centers for Medicare & Medicaid Services . It found that the stroke hospital-ization rate for blacks was 27% higher than for the US population in general, 30% higher than for whites, and 36% higher than for Hispanics . In contrast to whites and Hispanics, the highest percentage of strokes in blacks (42 .3%) occurred in the youngest Medicare age group (65–74 years of age) .41
●● In 2009, there were 768 000 ED visits and 127 000 out-patient department visits with stroke as the first-listed diagnosis . In 2010, physician office visits for a first-listed diagnosis of stroke totaled 2 207 000 (NHAMCS, unpublished NHLBI tabulation) .126
by guest on December 16, 2013http://circ.ahajournals.org/Downloaded from

e138 Circulation January 1/8, 2013
Stroke in Children
●● On the basis of pathogenic differences, pediatric strokes are typically classified as either perinatal (occurring at ≤28 days of life and including in utero strokes) or (later) childhood .
●● Estimates of the overall annual incidence of stroke in US children are 6 .4 per 100 000 children (0 to 15 years) in 1999 in the GCNKSS127 and 4 .6 per 100 000 children (0 to 19 years) in 1997 to 2003 according to data from Kai-ser Permanente of Northern California, a large, integrated healthcare delivery system .128 Approximately half of all incident childhood strokes are hemorrhagic .127–129
●● The prevalence of perinatal strokes is 29 per 100 000 live births, or 1 per 3500 live births in the 1997–2003 Kaiser Permanente of Northern California population .128
●● A history of infertility, preeclampsia, prolonged rupture of membranes, and chorioamnionitis are independent mater-nal risk factors for perinatal arterial ischemic stroke .130 However, maternal health and pregnancies are normal in most cases .131
●● The most common cause of arterial ischemic stroke in chil-dren is a cerebral arteriopathy, found in more than half of all cases .132,133
●● Children with cardiac disease are at 16-fold increased risk of arterial ischemic stroke compared with children in the general population; those with single-ventricle physiology are at highest risk .134
●● Thrombophilias (genetic and acquired) are risk factors for childhood stroke, with summary ORs ranging from 1 .6 to 8 .8 in a meta-analysis .135
●● In a prospective Swiss registry, 136 atherosclerotic risk fac-tors were less common in children with arterial ischemic stroke than in young adults; the most common of these factors in children was hyperlipidemia (15%) . However, an analysis of the Nationwide Inpatient Sample suggests a low but rising prevalence of these factors among US ado-lescents and young adults hospitalized for ischemic stroke (1995 versus 2008) .137
●● From 1979 to 1998 in the United States, childhood mor-tality resulting from stroke declined by 58% overall, with reductions in all major subtypes .138
●● The incidence of stroke in children has been stable over the past 10 years, whereas 30-day case fatality rates declined from 18% in 1988–1989 to 9% in 1993–1994 and 9% in 1999 in the GCNKSS population .127
●● Compared with girls, boys have a 1 .28-fold higher risk of stroke .139 Compared with white children, black children have a 2-fold risk of both incident stroke and death attribut-able to stroke .138,139 The increased risk among blacks is not fully explained by the presence of sickle cell disease, nor is the excess risk among boys fully explained by trauma .139
●● At a mean follow-up time of 2 .1 years, 37% of 123 child-hood ischemic stroke survivors had full recovery, 20% had mild deficits, 26% had moderate deficits, and 16% had severe deficits .140 Concomitant involvement of the basal ganglia, cerebral cortex, and posterior limb of the internal capsule predicts a persistent hemiparesis .141
●● Despite current treatment, 1 of 10 children with ischemic or hemorrhagic stroke will have a recurrence within 5 years .142,143 The 5-year recurrence risk is as high as 60%
among children with cerebral arteriopathy . The recurrence risk after perinatal stroke, however, is negligible .144
●● More than 25% of survivors of perinatal ischemic strokes develop delayed seizures within 3 years; children with larger strokes are at higher risk .145
●● Sickle cell disease is the most important cause of ischemic stroke among black children . The Stroke Prevention Trial in Sickle Cell Anemia (STOP) demonstrated the efficacy of blood transfusions for primary stroke prevention in children with sickle cell disease identified as high-risk by transcranial Doppler; STOP II demonstrated that stopping transfusions after 30 months of treatment was associated with a high risk of stroke .146
●● The Stroke With Transfusions Changing to Hydroxyurea (SWiTCH) trial recently reported that chronic blood trans-fusion therapy remains the superior option (over hydroxy-urea) for secondary stroke prevention in children with sickle cell disease .147 A similar trial of hydroxyurea as an alternative for primary stroke prevention is under way .
Stroke in the Very Elderly
●● Stroke patients >85 years of age make up 17% of all stroke patients .148
●● Very elderly patients have a higher risk-adjusted mortal-ity,148,149 have longer hospitalizations,149 receive less evi-denced-based care,150,151 and are less likely to be discharged to their original place of residence .149,152
Barriers to Stroke Care
●● On the basis of NHIS data, the inability to afford medica-tions among stroke survivors increased significantly from 8 .1% to 12 .7% between 1997 and 2004, totaling 76 000 US stroke survivors in 2004 . Compared with stroke survi-vors able to afford medications, those unable to afford them more frequently reported lack of transportation, no health insurance, no usual place of care, income <$20 000, and out-of-pocket medical expenses ≥$2000 .153
●● In 2002, ≈21% of US counties did not have a hospital, 31% lacked a hospital with an ED, and 77% did not have a hos-pital with neurological services .154
●● Of patients with ischemic stroke in the California Acute Stroke Pilot Registry, 23 .5% arrived at the ED within 3 hours of symptom onset, and 4 .3% received thrombolysis . If all patients had called 911 immediately, the expected overall rate of thrombolytic treatment within 3 hours would have increased to 28 .6% . If all patients with known onset had arrived within 1 hour and had been treated optimally, 57% could have received thrombolytic treatment .155
●● Data from the Paul Coverdell National Acute Stroke Regis-try were analyzed from the 142 hospitals that participated in the 4 registry states . More patients were transported by ambulance than by other means (43 .6%) . Time of stroke symptom onset was recorded for 44 .8% of the patients . Among these patients, 48% arrived at the ED within 2 hours of symptom onset . Significantly fewer blacks (42 .4%) arrived within 2 hours of symptom onset than did whites (49 .5%), and significantly fewer nonambulance patients (36 .2%) arrived within 2 hours of symptom onset than did patients transported by ambulance (58 .6%) .156
by guest on December 16, 2013http://circ.ahajournals.org/Downloaded from
Heart Disease and Stroke Statistics—2013 Update: Chapter 14 e139
●● NHIS data from 1998–2002 found that younger stroke sur-vivors (45–64 years) self-reported worse access to physi-cian care and medication affordability than older stroke survivors . Compared with older patients, younger stroke survivors were more likely to be male (52% versus 47%), to be black (19% versus 10%), and to lack health insurance (11% versus 0 .4%) . Lack of health insurance was associ-ated with reduced access to care .157
●● Results from the BASIC project found that women were less likely to arrive at the ED within 3 hours of stroke symptom onset than men (OR, 0 .7; 95% CI, 0 .5–0 .9) . Mexican Americans were 40% less likely to arrive by emer-gency medical services (EMS) than non-Hispanic whites, even after adjustment for age, National Institutes of Health Stroke Scale score, education, history of stroke, and insur-ance status . Language fluency was not associated with time to hospital arrival or use of EMS . The receipt of tissue-type plasminogen activator was low (1 .5%) but did not differ by sex or race .158
●● A national study of academic medical centers found no change in the proportion of patients with stroke arriving at hospitals within 2 hours of symptom onset between 2001 and 2004 (37% versus 38%); however, the rate of intrave-nous tissue-type plasminogen activator use increased over this time period (14% to 38%), which suggests system-level improvements in the organization of in-hospital care . In risk-adjusted analyses, black patients were 45% less likely to arrive within 2 hours than white patients .159
Operations and Procedures(See Chart 14-13 .)
●● In 2010, an estimated 100 000 inpatient endarterectomy procedures were performed in the United States . Carotid endarterectomy is the most frequently performed surgical procedure to prevent stroke (NHDS, NHLBI tabulation) .
●● Although rates of carotid endarterectomy in the Medicare population decreased slightly between 1998 and 2004, the use of carotid artery stenting increased dramatically .160
●● The practice of carotid stenting in the United States is expanding, from <3% of all carotid artery revascularization procedures in 1998 to 13% in 2008 .161
●● The randomized Carotid Revascularization Endarterec-tomy versus Stenting Trial (CREST) compared carotid endarterectomy and stenting for symptomatic and asymp-tomatic carotid stenosis . There was no overall difference in the primary end point of stroke, MI, or death; however, carotid endarterectomy showed superiority with increas-ing age, with the crossover point at approximately age 70, and was associated with fewer strokes, which had a greater impact on quality of life than MI .162,163
Cost(See Table 14-1 .)The direct and indirect cost of stroke in 2009 was $38 .6 billion (MEPS, NHLBI tabulation) .
●● The estimated direct medical cost of stroke for 2009 is $22 .8 billion . This includes hospital outpatient or office-based provider visits, hospital inpatient stays, ED visits, prescribed medicines, and home health care .164
●● The mean expense per person for stroke care in the United States in 2009 was estimated at $6018 .164 The mean lifetime cost of ischemic stroke in the United States is estimated at $140 048 . This includes inpatient care, rehabilitation, and follow-up care necessary for lasting deficits . (All numbers were converted to 1999 dollars by use of the medical com-ponent of the Consumer Price Index .)165
●● The estimated cost of acute pediatric stroke in the United States was $42 million in 2003 . The mean cost of short-term hospital care was $20 927 per discharge .166
●● After adjustment for routine healthcare costs, the average 5-year cost of a neonatal stroke was $51 719 and that of a childhood stroke was $135 161 . Costs among children with stroke continued to exceed those in age-matched control children even in the fifth year by an average of $2016 .167
●● In a study of stroke costs within 30 days of an acute event between 1987 and 1989 in the Rochester Stroke Study, the average cost was $13 019 for mild ischemic strokes and $20 346 for severe ischemic strokes (4 or 5 on the Rankin Disability Scale) .168
●● Inpatient hospital costs for an acute stroke event account for 70% of first-year poststroke costs .128
●● The largest components of short-term care costs were room charges (50%), medical management (21%), and diagnos-tic costs (19%) .169
●● Death within 7 days, subarachnoid hemorrhage, and stroke while hospitalized for another condition are associated with higher costs in the first year . Lower costs are associated with mild cerebral infarctions or residence in a nursing home before the stroke .168
●● Demographic variables (age, sex, and insurance status) are not associated with stroke cost . Severe strokes (National Institutes of Health Stroke Scale score >20) cost twice as much as mild strokes, despite similar diagnostic testing . Comorbidities such as ischemic HD and AF predict higher costs .169,170
●● The total cost of stroke from 2005 to 2050, in 2005 dollars, is projected to be $1 .52 trillion for non-Hispanic whites, $313 billion for Hispanics, and $379 billion for blacks . The per capita cost of stroke estimate is highest in blacks ($25 782), followed by Hispanics ($17 201) and non-Hispanic whites ($15 597) . Loss of earnings is expected to be the highest cost contributor in each race/ethnic group .171
●● In adjusted models that controlled for relevant covariates, the attributable 1-year cost of poststroke aphasia was esti-mated at $1703 in 2004 dollars .172
●● Average cost for outpatient stroke rehabilitation services and medications the first year after inpatient rehabilitation discharge was $11 145 . The corresponding average yearly cost of medication was $3376, whereas the average cost of yearly rehabilitation service utilization was $7318 .173
References 1 . Centers for Disease Control and Prevention . Prevalence of stroke: United
States, 2006–2010 . MMWR Morb Mortal Wkly Rep . 2012;61:379–382 . 2 . Vermeer SE, Longstreth WT Jr, Koudstaal PJ . Silent brain infarcts: a sys-
tematic review . Lancet Neurol . 2007;6:611–619 . 3 . Prabhakaran S, Wright CB, Yoshita M, Delapaz R, Brown T, DeCarli C,
Sacco RL . Prevalence and determinants of subclinical brain infarction: the Northern Manhattan Study . Neurology . 2008;70:425–430 .
4 . Das RR, Seshadri S, Beiser AS, Kelly-Hayes M, Au R, Himali JJ, Kase CS, Benjamin EJ, Polak JF, O’Donnell CJ, Yoshita M, D’Agostino RB Sr,
by guest on December 16, 2013http://circ.ahajournals.org/Downloaded from

e140 Circulation January 1/8, 2013
DeCarli C, Wolf PA . Prevalence and correlates of silent cerebral infarcts in the Framingham offspring study . Stroke . 2008;39:2929–2935 .
5 . Howard G, Wagenknecht LE, Cai J, Cooper L, Kraut MA, Toole JF . Ciga-rette smoking and other risk factors for silent cerebral infarction in the general population . Stroke . 1998;29:913–917 .
6 . Bryan RN, Wells SW, Miller TJ, Elster AD, Jungreis CA, Poirier VC, Lind BK, Manolio TA . Infarctlike lesions in the brain: prevalence and anatomic characteristics at MR imaging of the elderly: data from the Cardiovascular Health Study . Radiology . 1997;202:47–54 .
7 . Howard VJ, McClure LA, Meschia JF, Pulley L, Orr SC, Friday GH . High prevalence of stroke symptoms among persons without a diagnosis of stroke or transient ischemic attack in a general population: the REasons for Geographic And Racial Differences in Stroke (REGARDS) study . Arch Intern Med . 2006;166:1952–1958 .
8 . Heidenreich PA, Trogdon JG, Khavjou OA, Butler J, Dracup K, Ezekowitz MD, Finkelstein EA, Hong Y, Johnston SC, Khera A, Lloyd-Jones DM, Nelson SA, Nichol G, Orenstein D, Wilson PW, Woo YJ; American Heart Association Advocacy Coordinating Committee; Stroke Council; Council on Cardiovascular Radiology and Intervention; Council on Clinical Cardi-ology; Council on Epidemiology and Prevention; Council on Arterioscle-rosis; Thrombosis and Vascular Biology; Council on Cardiopulmonary; Critical Care; Perioperative and Resuscitation; Council on Cardiovascular Nursing; Council on the Kidney in Cardiovascular Disease; Council on Cardiovascular Surgery and Anesthesia, and Interdisciplinary Council on Quality of Care and Outcomes Research . Forecasting the future of cardio-vascular disease in the United States: a policy statement from the Ameri-can Heart Association . Circulation . 2011;123:933–944 .
9 . Kleindorfer DO, Khoury J, Moomaw CJ, Alwell K, Woo D, Flaherty ML, Khatri P, Adeoye O, Ferioli S, Broderick JP, Kissela BM . Stroke incidence is decreasing in whites but not in blacks: a population-based estimate of temporal trends in stroke incidence from the Greater Cincinnati/Northern Kentucky Stroke Study . Stroke . 2010;41:1326–1331 .
10 . Seshadri S, Beiser A, Kelly-Hayes M, Kase CS, Au R, Kannel WB, Wolf PA . The lifetime risk of stroke: estimates from the Framingham Study . Stroke . 2006;37:345–350 .
11 . Reeves MJ, Bushnell CD, Howard G, Gargano JW, Duncan PW, Lynch G, Khatiwoda A, Lisabeth L . Sex differences in stroke: epidemiol-ogy, clinical presentation, medical care, and outcomes . Lancet Neurol . 2008;7:915–926 .
12 . Petrea RE, Beiser AS, Seshadri S, Kelly-Hayes M, Kase CS, Wolf PA . Gender differences in stroke incidence and poststroke disability in the Framingham heart study . Stroke . 2009;40:1032–1037 .
13 . Löfmark U, Hammarström A . Evidence for age-dependent education-related differences in men and women with first-ever stroke: results from a community-based incidence study in northern Sweden . Neuroepidemiol-ogy . 2007;28:135–141 .
14 . Rothwell PM, Coull AJ, Silver LE, Fairhead JF, Giles MF, Lovelock CE, Redgrave JN, Bull LM, Welch SJ, Cuthbertson FC, Binney LE, Gutnikov SA, Anslow P, Banning AP, Mant D, Mehta Z; Oxford Vascular Study . Population-based study of event-rate, incidence, case fatality, and mortal-ity for all acute vascular events in all arterial territories (Oxford Vascular Study) . Lancet . 2005;366:1773–1783 .
15 . Hollander M, Koudstaal PJ, Bots ML, Grobbee DE, Hofman A, Bre-teler MM . Incidence, risk, and case fatality of first ever stroke in the elderly population: the Rotterdam Study . J Neurol Neurosurg Psychiatr . 2003;74:317–321 .
16 . Vega T, Zurriaga O, Ramos JM, Gil M, Alamo R, Lozano JE, López A, Miralles MT, Vaca P, Alvarez Mdelven-namesM; Group of research for the RECENT project . Stroke in Spain: epidemiologic incidence and patterns; a health sentinel network study . J Stroke Cerebrovasc Dis . 2009;18:11–16 .
17 . Sealy-Jefferson S, Wing JJ, Sánchez BN, Brown DL, Meurer WJ, Smith MA, Morgenstern LB, Lisabeth LD . Age- and ethnic-specific sex differ-ences in stroke risk . Gend Med . 2012;9:121–128 .
18 . Lewsey JD, Gillies M, Jhund PS, Chalmers JW, Redpath A, Briggs A, Walters M, Langhorne P, Capewell S, McMurray JJ, Macintyre K . Sex differences in incidence, mortality, and survival in individuals with stroke in Scotland, 1986 to 2005 . Stroke . 2009;40:1038–1043 .
19 . Howard VJ, Kleindorfer DO, Judd SE, McClure LA, Safford MM, Rhodes JD, Cushman M, Moy CS, Soliman EZ, Kissela BM, Howard G . Dispari-ties in stroke incidence contributing to disparities in stroke mortality . Ann Neurol . 2011;69:619–627 .
20 . Kleindorfer D, Broderick J, Khoury J, Flaherty M, Woo D, Alwell K, Moomaw CJ, Schneider A, Miller R, Shukla R, Kissela B . The unchang-ing incidence and case-fatality of stroke in the 1990s: a population-based study . Stroke . 2006;37:2473–2478 .
21 . Carandang R, Seshadri S, Beiser A, Kelly-Hayes M, Kase CS, Kannel WB, Wolf PA . Trends in incidence, lifetime risk, severity, and 30-day mor-tality of stroke over the past 50 years . JAMA . 2006;296:2939–2946 .
22 . Morgenstern LB, Smith MA, Lisabeth LD, Risser JM, Uchino K, Garcia N, Longwell PJ, McFarling DA, Akuwumi O, Al-Wabil A, Al-Senani F, Brown DL, Moyé LA . Excess stroke in Mexican Americans compared with non-Hispanic Whites: the Brain Attack Surveillance in Corpus Chris-ti Project . Am J Epidemiol . 2004;160:376–383 .
23 . White H, Boden-Albala B, Wang C, Elkind MS, Rundek T, Wright CB, Sacco RL . Ischemic stroke subtype incidence among whites, blacks, and Hispanics: the Northern Manhattan Study . Circulation . 2005;111:1327–1331 .
24 . Zhang Y, Galloway JM, Welty TK, Wiebers DO, Whisnant JP, Devereux RB, Kizer JR, Howard BV, Cowan LD, Yeh J, Howard WJ, Wang W, Best L, Lee ET . Incidence and risk factors for stroke in American Indians: the Strong Heart Study . Circulation . 2008;118:1577–1584 .
25 . Flaherty ML, Kissela B, Woo D, Kleindorfer D, Alwell K, Sekar P, Moomaw CJ, Haverbusch M, Broderick JP . The increasing incidence of anticoagulant-associated intracerebral hemorrhage . Neurology . 2007;68:116–121 .
26 . Johnston SC, Fayad PB, Gorelick PB, Hanley DF, Shwayder P, van Husen D, Weiskopf T . Prevalence and knowledge of transient ischemic attack among US adults . Neurology . 2003;60:1429–1434 .
27 . Kleindorfer D, Panagos P, Pancioli A, Khoury J, Kissela B, Woo D, Schneider A, Alwell K, Jauch E, Miller R, Moomaw C, Shukla R, Broder-ick JP . Incidence and short-term prognosis of transient ischemic attack in a population-based study . Stroke . 2005;36:720–723 .
28 . Brown RD Jr, Petty GW, O’Fallon WM, Wiebers DO, Whisnant JP . Inci-dence of transient ischemic attack in Rochester, Minnesota, 1985-1989 . Stroke . 1998;29:2109–2113 .
29 . Cancelli I, Janes F, Gigli GL, Perelli A, Zanchettin B, Canal G, D’Anna L, Russo V, Barbone F, Valente M . Incidence of transient ischemic attack and early stroke risk: validation of the ABCD2 score in an Italian population-based study . Stroke . 2011;42:2751–2757 .
30 . Hankey G . Impact of treatment of people with transient ischaemic attack on stroke incidence and public health . Cerebrovasc Dis . 1996;6(suppl 1):26–33 .
31 . Johnston SC, Gress DR, Browner WS, Sidney S . Short-term prognosis af-ter emergency department diagnosis of TIA . JAMA . 2000;284:2901–2906 .
32 . Wu CM, McLaughlin K, Lorenzetti DL, Hill MD, Manns BJ, Ghali WA . Early risk of stroke after transient ischemic attack: a systematic review and meta-analysis . Arch Intern Med . 2007;167:2417–2422 .
33 . Giles MF, Rothwell PM . Risk of stroke early after transient isch-aemic attack: a systematic review and meta-analysis . Lancet Neurol . 2007;6:1063–1072 .
34 . Clark TG, Murphy MF, Rothwell PM . Long term risks of stroke, myo-cardial infarction, and vascular death in “low risk” patients with a non-recent transient ischaemic attack . J Neurol Neurosurg Psychiatr . 2003;74:577–580 .
35 . Ovbiagele B, Kidwell CS, Saver JL . Epidemiological impact in the United States of a tissue-based definition of transient ischemic attack . Stroke . 2003;34:919–924 .
36 . Centers for Disease Control and Prevention, National Center for Health Statistics . Compressed Mortality File 1999-2009 . CDC WONDER Online Database, compiled for Compressed Mortality File 1999–2009 Series 20, No . 20, 2012 . Underlying cause-of-death 1999–2009 . http://wonder .cdc .gov/mortSQl .html . Accessed August 20, 2012 .
37 . Centers for Disease Control and Prevention, National Center for Health Statistics . Health Data Interactive . http://www .cdc .gov/nchs/hdi .htm . Accessed July 19, 2011 .
38 . Gillum RF, Kwagyan J, Obisesan TO . Ethnic and geographic variation in stroke mortality trends . Stroke . 2011;42:3294–3296 .
39 . Ayala C, Greenlund KJ, Croft JB, Keenan NL, Donehoo RS, Giles WH, Kittner SJ, Marks JS . Racial/ethnic disparities in mortal-ity by stroke subtype in the United States, 1995-1998 . Am J Epidemiol . 2001;154:1057–1063 .
40 . Centers for Disease Control and Prevention (CDC) . Disparities in deaths from stroke among persons aged <75 years: United States, 2002 . MMWR Morb Mortal Wkly Rep . 2005;54:477–481 .
41 . Casper ML, Nwaise IA, Croft JB, Nilasena DS . Atlas of Stroke Hospital-izations among Medicare Beneficiaries. Atlanta, GA: US Department of Health and Human Services, Centers for Disease Control and Prevention; 2008 .
42 . Lanska DJ . Geographic distribution of stroke mortality in the United States: 1939-1941 to 1979-1981 . Neurology . 1993;43:1839–1851 .
by guest on December 16, 2013http://circ.ahajournals.org/Downloaded from
Heart Disease and Stroke Statistics—2013 Update: Chapter 14 e141
43 . Casper ML, Wing S, Anda RF, Knowles M, Pollard RA . The shifting stroke belt: changes in the geographic pattern of stroke mortality in the United States, 1962 to 1988 . Stroke . 1995;26:755–760 .
44 . Howard G, Evans GW, Pearce K, Howard VJ, Bell RA, Mayer EJ, Burke GL . Is the stroke belt disappearing? An analysis of racial, temporal, and age effects . Stroke . 1995;26:1153–1158 .
45 . Perry HM, Roccella EJ . Conference report on stroke mortality in the southeastern United States . Hypertension . 1998;31:1206–1215 .
46 . Howard G, Anderson R, Johnson NJ, Sorlie P, Russell G, Howard VJ . Evaluation of social status as a contributing factor to the stroke belt region of the United States . Stroke . 1997;28:936–940 .
47 . Cushman WC, Evans GW, Byington RP, Goff DC Jr, Grimm RH Jr, Cutler JA, Simons-Morton DG, Basile JN, Corson MA, Probstfield JL, Katz L, Peterson KA, Friedewald WT, Buse JB, Bigger JT, Gerstein HC, Ismail-Beigi F; ACCORD Study Group . Effects of intensive blood-pressure con-trol in type 2 diabetes mellitus . N Engl J Med . 2010;362:1575–1585 .
48 . Lee M, Saver JL, Chang B, Chang KH, Hao Q, Ovbiagele B . Presence of baseline prehypertension and risk of incident stroke: a meta-analysis . Neurology . 2011;77:1330–1337 .
49 . Glasser SP, Judd S, Basile J, Lackland D, Halanych J, Cushman M, Prineas R, Howard V, Howard G . Prehypertension, racial prevalence and its association with risk factors: analysis of the REasons for Geographic And Racial Differences in Stroke (REGARDS) study . Am J Hypertens . 2011;24:194–199 .
50 . Howard G, Prineas R, Moy C, Cushman M, Kellum M, Temple E, Graham A, Howard V . Racial and geographic differences in awareness, treatment, and control of hypertension: the REasons for Geographic And Racial Dif-ferences in Stroke study . Stroke . 2006;37:1171–1178 .
51 . Kissela BM, Khoury J, Kleindorfer D, Woo D, Schneider A, Alwell K, Miller R, Ewing I, Moomaw CJ, Szaflarski JP, Gebel J, Shukla R, Broderick JP . Epidemiology of ischemic stroke in patients with diabetes: the greater Cincinnati/Northern Kentucky Stroke Study . Diabetes Care . 2005;28:355–359 .
52 . Vermeer SE, Sandee W, Algra A, Koudstaal PJ, Kappelle LJ, Dippel DW; Dutch TIA Trial Study Group . Impaired glucose tolerance increases stroke risk in nondiabetic patients with transient ischemic attack or minor isch-emic stroke . Stroke . 2006;37:1413–1417 .
53 . Wolf PA, Abbott RD, Kannel WB . Atrial fibrillation as an independent risk factor for stroke: the Framingham Study . Stroke . 1991;22:983–988 .
54 . Wang TJ, Massaro JM, Levy D, Vasan RS, Wolf PA, D’Agostino RB, Lar-son MG, Kannel WB, Benjamin EJ . A risk score for predicting stroke or death in individuals with new-onset atrial fibrillation in the community: the Framingham Heart Study . JAMA . 2003;290:1049–1056 .
55 . Page RL, Wilkinson WE, Clair WK, McCarthy EA, Pritchett EL . Asymptomatic arrhythmias in patients with symptomatic paroxysmal atri-al fibrillation and paroxysmal supraventricular tachycardia . Circulation . 1994;89:224–227 .
56 . Strickberger SA, Ip J, Saksena S, Curry K, Bahnson TD, Ziegler PD . Relationship between atrial tachyarrhythmias and symptoms . Heart Rhythm . 2005;2:125–131 .
57 . Tayal AH, Tian M, Kelly KM, Jones SC, Wright DG, Singh D, Jarouse J, Brillman J, Murali S, Gupta R . Atrial fibrillation detected by mobile cardiac outpatient telemetry in cryptogenic TIA or stroke . Neurology . 2008;71:1696–1701 .
58 . Elijovich L, Josephson SA, Fung GL, Smith WS . Intermittent atrial fibrillation may account for a large proportion of otherwise cryptogenic stroke: a study of 30-day cardiac event monitors . J Stroke Cerebrovasc Dis . 2009;18:185–189 .
59 . Healey JS, Connolly SJ, Gold MR, Israel CW, Van Gelder IC, Capucci A, Lau CP, Fain E, Yang S, Bailleul C, Morillo CA, Carlson M, Themeles E, Kaufman ES, Hohnloser SH; ASSERT Investigators . Subclinical atrial fibrillation and the risk of stroke . N Engl J Med . 2012;366:120–129 .
60 . Curb JD, Abbott RD, Rodriguez BL, Masaki KH, Chen R, Popper JS, Petrovitch H, Ross GW, Schatz IJ, Belleau GC, Yano K . High density lipoprotein cholesterol and the risk of stroke in elderly men: the Honolulu Heart Program . Am J Epidemiol . 2004;160:150–157 .
61 . Huxley RR, Barzi F, Lam TH, Czernichow S, Fang X, Welborn T, Shaw J, Ueshima H, Zimmet P, Jee SH, Patel JV, Caterson I, Perkovic V, Wood-ward M; Asia Pacific Cohort Studies Collaboration and the Obesity in Asia Collaboration . Isolated low levels of high-density lipoprotein cholesterol are associated with an increased risk of coronary heart disease: an individ-ual participant data meta-analysis of 23 studies in the Asia-Pacific region . Circulation . 2011;124:2056–2064 .
62 . Goldstein LB, Bushnell CD, Adams RJ, Appel LJ, Braun LT, Chaturvedi S, Creager MA, Culebras A, Eckel RH, Hart RG, Hinchey JA, Howard
VJ, Jauch EC, Levine SR, Meschia JF, Moore WS, Nixon JV, Pearson TA; American Heart Association Stroke Council; Council on Cardiovascular Nursing; Council on Epidemiology and Prevention; Council for High Blood Pressure Research, Council on Peripheral Vascular Disease, and Interdisci-plinary Council on Quality of Care and Outcomes Research . Guidelines for the primary prevention of stroke: a guideline for healthcare professionals from the American Heart Association/American Stroke Association [pub-lished correction appears in Stroke . 2011;42:e26] . Stroke . 2011;42:517–584 .
63 . Shah RS, Cole JW . Smoking and stroke: the more you smoke the more you stroke . Expert Rev Cardiovasc Ther . 2010;8:917–932 .
64 . Kissela BM, Sauerbeck L, Woo D, Khoury J, Carrozzella J, Pancioli A, Jauch E, Moomaw CJ, Shukla R, Gebel J, Fontaine R, Broderick J . Sub-arachnoid hemorrhage: a preventable disease with a heritable component . Stroke . 2002;33:1321–1326 .
65 . Bhat VM, Cole JW, Sorkin JD, Wozniak MA, Malarcher AM, Giles WH, Stern BJ, Kittner SJ . Dose-response relationship between cigarette smoking and risk of ischemic stroke in young women . Stroke . 2008;39:2439–2443 .
66 . Lee PN, Forey BA . Environmental tobacco smoke exposure and risk of stroke in nonsmokers: a review with meta-analysis . J Stroke Cerebrovasc Dis . 2006;15:190–201 .
67 . Oono IP, Mackay DF, Pell JP . Meta-analysis of the association between secondhand smoke exposure and stroke . J Public Health (Oxf) . 2011;33:496–502 .
68 . Willey JZ, Moon YP, Paik MC, Boden-Albala B, Sacco RL, Elkind MS . Physical activity and risk of ischemic stroke in the Northern Manhattan Study . Neurology . 2009;73:1774–1779 .
69 . Willey JZ, Xu Q, Boden-Albala B, Paik MC, Moon YP, Sacco RL, Elkind MS . Lipid profile components and risk of ischemic stroke: the Northern Manhattan Study (NOMAS) . Arch Neurol . 2009;66:1400–1406 .
70 . Willey JZ, Moon YP, Paik MC, Yoshita M, Decarli C, Sacco RL, Elkind MS, Wright CB . Lower prevalence of silent brain infarcts in the physically active: the Northern Manhattan Study . Neurology . 2011;76:2112–2118 .
71 . Grau AJ, Barth C, Geletneky B, Ling P, Palm F, Lichy C, Becher H, Bug-gle F . Association between recent sports activity, sports activity in young adulthood, and stroke . Stroke . 2009;40:426–431 .
72 . Krarup LH, Truelsen T, Pedersen A, Lerke H, Lindahl M, Hansen L, Schnohr P, Boysen G . Level of physical activity in the week preceding an ischemic stroke . Cerebrovasc Dis . 2007;24:296–300 .
73 . Seshadri S, Beiser A, Pikula A, Himali JJ, Kelly-Hayes M, Debette S, DeStefano AL, Romero JR, Kase CS, Wolf PA . Parental occurrence of stroke and risk of stroke in their children: the Framingham study . Circula-tion . 2010;121:1304–1312 .
74 . Manolio TA, Kronmal RA, Burke GL, O’Leary DH, Price TR . Short-term predictors of incident stroke in older adults: the Cardiovascular Health Study . Stroke . 1996;27:1479–1486 .
75 . Muntner P, Judd SE, McClellan W, Meschia JF, Warnock DG, Howard VJ . Incidence of stroke symptoms among adults with chronic kidney disease: results from the REasons for Geographic And Racial Differences in Stroke (REGARDS) study . Nephrol Dial Transplant . 2012;27:166–173 .
76 . Lee M, Saver JL, Chang KH, Liao HW, Chang SC, Ovbiagele B . Low glomerular filtration rate and risk of stroke: meta-analysis . BMJ . 2010;341:c4249 .
77 . Lisabeth LD, Beiser AS, Brown DL, Murabito JM, Kelly-Hayes M, Wolf PA . Age at natural menopause and risk of ischemic stroke: the Framing-ham Heart Study . Stroke . 2009;40:1044–1049 .
78 . Hu FB, Grodstein F, Hennekens CH, Colditz GA, Johnson M, Manson JE, Rosner B, Stampfer MJ . Age at natural menopause and risk of cardiovas-cular disease . Arch Intern Med . 1999;159:1061–1066 .
79 . Wassertheil-Smoller S, Hendrix SL, Limacher M, Heiss G, Kooperberg C, Baird A, Kotchen T, Curb JD, Black H, Rossouw JE, Aragaki A, Safford M, Stein E, Laowattana S, Mysiw WJ; WHI Investigators . Effect of es-trogen plus progestin on stroke in postmenopausal women: the Women’s Health Initiative: a randomized trial . JAMA . 2003;289:2673–2684 .
80 . Rossouw JE, Anderson GL, Prentice RL, LaCroix AZ, Kooperberg C, Stefanick ML, Jackson RD, Beresford SA, Howard BV, Johnson KC, Kotchen JM, Ockene J; Writing Group for the Women’s Health Initia-tive Investigators . Risks and benefits of estrogen plus progestin in healthy postmenopausal women: principal results from the Women’s Health Initia-tive randomized controlled trial . JAMA . 2002;288:321–333 .
81 . Hendrix SL, Wassertheil-Smoller S, Johnson KC, Howard BV, Kooperberg C, Rossouw JE, Trevisan M, Aragaki A, Baird AE, Bray PF, Buring JE, Criqui MH, Herrington D, Lynch JK, Rapp SR, Torner J; WHI Investi-gators . Effects of conjugated equine estrogen on stroke in the Women’s Health Initiative . Circulation . 2006;113:2425–2434 .
by guest on December 16, 2013http://circ.ahajournals.org/Downloaded from

e142 Circulation January 1/8, 2013
82 . Simon JA, Hsia J, Cauley JA, Richards C, Harris F, Fong J, Barrett-Con-nor E, Hulley SB . Postmenopausal hormone therapy and risk of stroke: the Heart and Estrogen-progestin Replacement Study (HERS) . Circula-tion . 2001;103:638–642 .
83 . Viscoli CM, Brass LM, Kernan WN, Sarrel PM, Suissa S, Horwitz RI . A clinical trial of estrogen-replacement therapy after ischemic stroke . N Engl J Med . 2001;345:1243–1249 .
84 . Renoux C, Dell’aniello S, Garbe E, Suissa S . Transdermal and oral hor-mone replacement therapy and the risk of stroke: a nested case-control study . BMJ . 2010;340:c2519 .
85 . Kittner SJ, Stern BJ, Feeser BR, Hebel R, Nagey DA, Buchholz DW, Earley CJ, Johnson CJ, Macko RF, Sloan MA, Wityk RJ, Wozniak MA . Pregnancy and the risk of stroke . N Engl J Med . 1996;335:768–774 .
86 . James AH, Bushnell CD, Jamison MG, Myers ER . Incidence and risk factors for stroke in pregnancy and the puerperium . Obstet Gynecol . 2005;106:509–516 .
87 . Deleted in proof . 88 . Kuklina EV, Tong X, Bansil P, George MG, Callaghan WM .
Trends in pregnancy hospitalizations that included a stroke in the United States from 1994 to 2007: reasons for concern? Stroke . 2011;42:2564–2570 .
89 . Brown DW, Dueker N, Jamieson DJ, Cole JW, Wozniak MA, Stern BJ, Giles WH, Kittner SJ . Preeclampsia and the risk of ischemic stroke among young women: results from the Stroke Prevention in Young Wom-en Study [published correction appears in Stroke . 2006;37:2862] . Stroke . 2006;37:1055–1059 .
90 . Lykke JA, Langhoff-Roos J, Sibai BM, Funai EF, Triche EW, Paidas MJ . Hypertensive pregnancy disorders and subsequent cardiovascular morbidity and type 2 diabetes mellitus in the mother . Hypertension . 2009;53:944–951 .
91 . Yaggi HK, Concato J, Kernan WN, Lichtman JH, Brass LM, Mohsenin V . Obstructive sleep apnea as a risk factor for stroke and death . N Engl J Med . 2005;353:2034–2041 .
92 . American Thoracic Society . Indications and standards for use of nasal continuous positive airway pressure (CPAP) in sleep apnea syndromes: American Thoracic Society: official statement adopted March 1994 . Am J Respir Crit Care Med . 1994;150:1738–1745 .
93 . Redline S, Yenokyan G, Gottlieb DJ, Shahar E, O’Connor GT, Resn-ick HE, Diener-West M, Sanders MH, Wolf PA, Geraghty EM, Ali T, Lebowitz M, Punjabi NM . Obstructive sleep apnea-hypopnea and inci-dent stroke: the Sleep Heart Health Study . Am J Respir Crit Care Med . 2010;182:269–277 .
94 . Arzt M, Young T, Finn L, Skatrud JB, Bradley TD . Association of sleep-disordered breathing and the occurrence of stroke . Am J Respir Crit Care Med . 2005;172:1447–1451 .
95 . Bravata DM, Concato J, Fried T, Ranjbar N, Sadarangani T, McClain V, Struve F, Zygmunt L, Knight HJ, Lo A, Richerson GB, Gorman M, Williams LS, Brass LM, Agostini J, Mohsenin V, Roux F, Yaggi HK . Continuous positive airway pressure: evaluation of a novel therapy for patients with acute ischemic stroke . Sleep . 2011;34:1271–1277 .
96 . Parra O, Sánchez-Armengol A, Bonnin M, Arboix A, Campos-Rodríguez F, Pérez-Ronchel J, Durán-Cantolla J, de la Torre G, González Marcos JR, de la Peña M, Carmen Jiménez M, Masa F, Casado I, Luz Alonso M, Macarrón JL . Early treatment of obstructive apnoea and stroke outcome: a randomised controlled trial . Eur Respir J . 2011;37:1128–1136 .
97 . Sandberg O, Franklin KA, Bucht G, Gustafson Y . Sleep apnea, delirium, depressed mood, cognition, and ADL ability after stroke . J Am Geriatr Soc . 2001;49:391–397 .
98 . Mohsenin V, Valor R . Sleep apnea in patients with hemispheric stroke . Arch Phys Med Rehabil . 1995;76:71–76 .
99 . Turkington PM, Bamford J, Wanklyn P, Elliott MW . Prevalence and pre-dictors of upper airway obstruction in the first 24 hours after acute stroke . Stroke . 2002;33:2037–2042 .
100 . Harbison J, Ford GA, James OF, Gibson GJ . Sleep-disordered breathing following acute stroke . QJM . 2002;95:741–747 .
101 . Iranzo A, Santamaría J, Berenguer J, Sánchez M, Chamorro A . Preva-lence and clinical importance of sleep apnea in the first night after cere-bral infarction . Neurology . 2002;58:911–916 .
102 . Dyken ME, Somers VK, Yamada T, Ren ZY, Zimmerman MB . Inves-tigating the relationship between stroke and obstructive sleep apnea . Stroke . 1996;27:401–407 .
103 . Parra O, Arboix A, Bechich S, García-Eroles L, Montserrat JM, López JA, Ballester E, Guerra JM, Sopeña JJ . Time course of sleep-related breathing disorders in first-ever stroke or transient ischemic attack . Am J Respir Crit Care Med . 2000;161(pt 1):375–380 .
104 . Kapen S, Goldberg J, Wynter J . The incidence and severity of ob-structive sleep apnea in ischemic cerebrovascular disease . Neurology . 1991;41(Suppl 1):125 .
105 . Bassetti C, Aldrich MS . Sleep apnea in acute cerebrovascular diseases: final report on 128 patients . Sleep . 1999;22:217–223 .
106 . Wessendorf TE, Teschler H, Wang YM, Konietzko N, Thilmann AF . Sleep-disordered breathing among patients with first-ever stroke . J Neu-rol . 2000;247:41–47 .
107 . Sandberg O, Franklin KA, Bucht G, Eriksson S, Gustafson Y . Nasal con-tinuous positive airway pressure in stroke patients with sleep apnoea: a randomized treatment study . Eur Respir J . 2001;18:630–634 .
108 . Martínez-García MA, Galiano-Blancart R, Román-Sánchez P, Soler- Cataluña JJ, Cabero-Salt L, Salcedo-Maiques E . Continuous positive airway pressure treatment in sleep apnea prevents new vascular events after ischemic stroke . Chest . 2005;128:2123–2129 .
109 . Wessendorf TE, Wang YM, Thilmann AF, Sorgenfrei U, Konietzko N, Teschler H . Treatment of obstructive sleep apnoea with nasal continuous positive airway pressure in stroke . Eur Respir J . 2001;18:623–629 .
110 . Kleindorfer D, Khoury J, Broderick JP, Rademacher E, Woo D, Flaherty ML, Alwell K, Moomaw CJ, Schneider A, Pancioli A, Miller R, Kissela BM . Temporal trends in public awareness of stroke: warning signs, risk factors, and treatment . Stroke . 2009;40:2502–2506 .
111 . Kothari R, Sauerbeck L, Jauch E, Broderick J, Brott T, Khoury J, Liu T . Patients’ awareness of stroke signs, symptoms, and risk factors . Stroke . 1997;28:1871–1875 .
112 . Harwell TS, Blades LL, Oser CS, Dietrich DW, Okon NJ, Rodriguez DV, Burnett AM, Russell JA, Allen MJ, Fogle CC, Helgerson SD, Gohdes D . Perceived risk for developing stroke among older adults . Prev Med . 2005;41:791–794 .
113 . Zerwic J, Hwang SY, Tucco L . Interpretation of symptoms and delay in seeking treatment by patients who have had a stroke: exploratory study . Heart Lung . 2007;36:25–34 .
114 . DuBard CA, Garrett J, Gizlice Z . Effect of language on heart at-tack and stroke awareness among U .S . Hispanics . Am J Prev Med . 2006;30:189–196 .
115 . Centers for Disease Control and Prevention (CDC) . Prevalence and most common causes of disability among adults: United States, 2005 . MMWR Morb Mortal Wkly Rep . 2009;58:421–426 .
116 . Buntin MB, Colla CH, Deb P, Sood N, Escarce JJ . Medicare spending and outcomes after postacute care for stroke and hip fracture . Med Care . 2010;48:776–784 .
117 . Buntin MB, Garten AD, Paddock S, Saliba D, Totten M, Escarce JJ . How much is postacute care use affected by its availability? Health Serv Res . 2005;40:413–434 .
118 . Hackett ML, Yapa C, Parag V, Anderson CS . Frequency of depres-sion after stroke: a systematic review of observational studies . Stroke . 2005;36:1330–1340 .
119 . Kelly-Hayes M, Beiser A, Kase CS, Scaramucci A, D’Agostino RB, Wolf PA . The influence of gender and age on disability following ischemic stroke: the Framingham study . J Stroke Cerebrovasc Dis . 2003;12:119–126 .
120 . Centers for Disease Control and Prevention (CDC) . Outpatient rehabili-tation among stroke survivors: 21 States and the District of Columbia, 2005 . MMWR Morb Mortal Wkly Rep . 2007;56:504–507 .
121 . Whitson HE, Landerman LR, Newman AB, Fried LP, Pieper CF, Co-hen HJ . Chronic medical conditions and the sex-based disparity in dis-ability: the Cardiovascular Health Study . J Gerontol A Biol Sci Med Sci . 2010;65:1325–1331 .
122 . Gargano JW, Reeves MJ; Paul Coverdell National Acute Stroke Registry Michigan Prototype Investigators . Sex differences in stroke recovery and stroke-specific quality of life: results from a statewide stroke registry . Stroke . 2007;38:2541–2548 .
123 . McGruder H, Greenlund K, Croft J, Zheng Z . Centers for Disease Con-trol and Prevention (CDC) . Differences in disability among black and white stroke survivors: United States, 2000–2001 . MMWR Morb Mortal Wkly Rep . 2005;54:3–6 .
124 . Ottenbacher KJ, Campbell J, Kuo YF, Deutsch A, Ostir GV, Granger CV . Racial and ethnic differences in postacute rehabilitation outcomes after stroke in the United States . Stroke . 2008;39:1514–1519 .
125 . Elixhauser A, Jiang HJ . Hospitalizations for Women With Circulatory Disease, 2003. HCUP Statistical Brief No . 5 . Rockville, MD: Agency for Healthcare Research and Quality; 2006 . http://www .hcup-us .ahrq .gov/reports/statbriefs/sb5 .pdf . Accessed August 3, 2011 .
126 . Centers for Disease Control and Prevention, National Center for Health Statistics . 2009 National Ambulatory Medical Care Survey and 2009
by guest on December 16, 2013http://circ.ahajournals.org/Downloaded from

Heart Disease and Stroke Statistics—2013 Update: Chapter 14 e143
National Hospital Ambulatory Medical Care Survey . Ambulatory health care data: questionnaires, datasets, and related documentation . Unpub-lished data . For methodology, see National Center for Health Statistics, Public Use Data File Documentation: 2009 National Ambulatory Medi-cal Care Survey and Public Use Data File Documentation: 2009 National Hospital Ambulatory Medical Care Survey . http://www .cdc .gov/nchs/ahcd/ahcd_questionnaires .htm . Accessed August 12, 2011 .
127 . Kleindorfer D, Khoury J, Kissela B, Alwell K, Woo D, Miller R, Schnei-der A, Moomaw C, Broderick JP . Temporal trends in the incidence and case fatality of stroke in children and adolescents . J Child Neurol . 2006;21:415–418 .
128 . Agrawal N, Johnston SC, Wu YW, Sidney S, Fullerton HJ . Imaging data reveal a higher pediatric stroke incidence than prior US estimates . Stroke . 2009;40:3415–3421 .
129 . Broderick J, Brott T, Kothari R, Miller R, Khoury J, Pancioli A, Gebel J, Mills D, Minneci L, Shukla R . The Greater Cincinnati/Northern Ken-tucky Stroke Study: preliminary first-ever and total incidence rates of stroke among blacks . Stroke . 1998;29:415–421 .
130 . Lee J, Croen LA, Backstrand KH, Yoshida CK, Henning LH, Lindan C, Ferriero DM, Fullerton HJ, Barkovich AJ, Wu YW . Maternal and in-fant characteristics associated with perinatal arterial stroke in the infant . JAMA . 2005;293:723–729 .
131 . Kirton A, Armstrong-Wells J, Chang T, Deveber G, Rivkin MJ, Her-nandez M, Carpenter J, Yager JY, Lynch JK, Ferriero DM; International Pediatric Stroke Study Investigators . Symptomatic neonatal arterial ischemic stroke: the International Pediatric Stroke Study . Pediatrics . 2011;128:e1402–e1410 .
132 . Ganesan V, Prengler M, McShane MA, Wade AM, Kirkham FJ . Investi-gation of risk factors in children with arterial ischemic stroke . Ann Neu-rol . 2003;53:167–173 .
133 . Mackay MT, Wiznitzer M, Benedict SL, Lee KJ, Deveber GA, Gane-san V; International Pediatric Stroke Study Group . Arterial ischemic stroke risk factors: the International Pediatric Stroke Study . Ann Neurol . 2011;69:130–140 .
134 . Hoffman JL, Mack GK, Minich LL, Benedict SL, Heywood M, Stoddard GJ, Saarel EV . Failure to impact prevalence of arterial ischemic stroke in pediatric cardiac patients over three decades . Congenit Heart Dis . 2011;6:211–218 .
135 . Kenet G, Lütkhoff LK, Albisetti M, Bernard T, Bonduel M, Brandao L, Chabrier S, Chan A, deVeber G, Fiedler B, Fullerton HJ, Goldenberg NA, Grabowski E, Günther G, Heller C, Holzhauer S, Iorio A, Journeycake J, Junker R, Kirkham FJ, Kurnik K, Lynch JK, Male C, Manco-Johnson M, Mesters R, Monagle P, van Ommen CH, Raffini L, Rostásy K, Simioni P, Sträter RD, Young G, Nowak-Göttl U . Impact of thrombophilia on risk of arterial ischemic stroke or cerebral sinovenous thrombosis in neonates and children: a systematic review and meta-analysis of observational studies . Circulation . 2010;121:1838–1847 .
136 . Bigi S, Fischer U, Wehrli E, Mattle HP, Boltshauser E, Bürki S, Jeannet PY, Fluss J, Weber P, Nedeltchev K, El-Koussy M, Steinlin M, Arnold M . Acute ischemic stroke in children versus young adults . Ann Neurol . 2011;70:245–254 .
137 . George MG, Tong X, Kuklina EV, Labarthe DR . Trends in stroke hospi-talizations and associated risk factors among children and young adults, 1995-2008 . Ann Neurol . 2011;70:713–721 .
138 . Fullerton HJ, Chetkovich DM, Wu YW, Smith WS, Johnston SC . Deaths from stroke in US children, 1979 to 1998 . Neurology . 2002;59:34–39 .
139 . Fullerton HJ, Wu YW, Zhao S, Johnston SC . Risk of stroke in children: ethnic and gender disparities . Neurology . 2003;61:189–194 .
140 . deVeber GA, MacGregor D, Curtis R, Mayank S . Neurologic outcome in survivors of childhood arterial ischemic stroke and sinovenous thrombo-sis . J Child Neurol . 2000;15:316–324 .
141 . Boardman JP, Ganesan V, Rutherford MA, Saunders DE, Mercuri E, Cowan F . Magnetic resonance image correlates of hemiparesis af-ter neonatal and childhood middle cerebral artery stroke . Pediatrics . 2005;115:321–326 .
142 . Sträter R, Becker S, von Eckardstein A, Heinecke A, Gutsche S, Junker R, Kurnik K, Schobess R, Nowak-Göttl U . Prospective assessment of risk factors for recurrent stroke during childhood–a 5-year follow-up study . Lancet . 2002;360:1540–1545 .
143 . Fullerton HJ, Wu YW, Sidney S, Johnston SC . Recurrent hemor-rhagic stroke in children: a population-based cohort study . Stroke . 2007;38:2658–2662 .
144 . Fullerton HJ, Wu YW, Sidney S, Johnston SC . Risk of recurrent child-hood arterial ischemic stroke in a population-based cohort: the impor-tance of cerebrovascular imaging . Pediatrics . 2007;119:495–501 .
145 . Wusthoff CJ, Kessler SK, Vossough A, Ichord R, Zelonis S, Halperin A, Gordon D, Vargas G, Licht DJ, Smith SE . Risk of later seizure after perinatal arterial ischemic stroke: a prospective cohort study . Pediatrics . 2011;127:e1550–e1557 .
146 . Adams RJ, Brambilla D; Optimizing Primary Stroke Prevention in Sickle Cell Anemia (STOP 2) Trial Investigators . Discontinuing prophylactic transfusions used to prevent stroke in sickle cell disease . N Engl J Med . 2005;353:2769–2778 .
147 . Ware RE, Helms RW; SWiTCH Investigators . Stroke With Transfusions Changing to Hydroxyurea (SWiTCH) . Blood . 2012;119:3925–3932 .
148 . Russo T, Felzani G, Marini C . Stroke in the very old: a systematic review of studies on incidence, outcome, and resource use . J Aging Res . 2011;2011:108785 .
149 . Saposnik G, Black S; Stroke Outcome Research Canada (SORCan) Working Group . Stroke in the very elderly: hospital care, case fatality and disposition . Cerebrovasc Dis . 2009;27:537–543 .
150 . Palnum KD, Petersen P, Sørensen HT, Ingeman A, Mainz J, Bartels P, Johnsen SP . Older patients with acute stroke in Denmark: quality of care and short-term mortality: a nationwide follow-up study . Age Ageing . 2008;37:90–95 .
151 . Lichtman JH, Naert L, Allen NB, Watanabe E, Jones SB, Barry LC, Bravata DM, Goldstein LB . Use of antithrombotic medications among elderly ischemic stroke patients . Circ Cardiovasc Qual Outcomes . 2011;4:30–38 .
152 . Kammersgaard LP, Jørgensen HS, Reith J, Nakayama H, Pedersen PM, Olsen TS; Copenhagen Stroke Study . Short- and long-term prognosis for very old stroke patients: the Copenhagen Stroke Study . Age Ageing . 2004;33:149–154 .
153 . Levine DA, Kiefe CI, Howard G, Howard VJ, Williams OD, Allison JJ . Reduced medication access: a marker for vulnerability in US stroke sur-vivors . Stroke . 2007;38:1557–1564 .
154 . First-ever county level report on stroke hospitalizations [press release] . Atlan-ta, GA: Centers for Disease Control and Prevention; March 28, 2008 . http://www .cdc .gov/media/pressrel/2008/r080328 .htm . Accessed July 19, 2011 .
155 . California Acute Stroke Pilot Registry (CASPR) Investigators . Prioritiz-ing interventions to improve rates of thrombolysis for ischemic stroke . Neurology. 2005;64:654–659 .
156 . Centers for Disease Control and Prevention (CDC) . Prehospital and hos-pital delays after stroke onset: United States, 2005–2006 . MMWR Morb Mortal Wkly Rep . 2007;56:474–478 .
157 . Levine DA, Kiefe CI, Houston TK, Allison JJ, McCarthy EP, Ayanian JZ . Younger stroke survivors have reduced access to physician care and medications: National Health Interview Survey from years 1998 to 2002 . Arch Neurol . 2007;64:37–42 .
158 . Smith MA, Lisabeth LD, Bonikowski F, Morgenstern LB . The role of ethnicity, sex, and language on delay to hospital arrival for acute isch-emic stroke . Stroke . 2010;41:905–909 .
159 . Lichtman JH, Watanabe E, Allen NB, Jones SB, Dostal J, Goldstein LB . Hospital arrival time and intravenous t-PA use in US Academic Medical Centers, 2001-2004 . Stroke . 2009;40:3845–3850 .
160 . Goodney PP, Lucas FL, Travis LL, Likosky DS, Malenka DJ, Fisher ES . Changes in the use of carotid revascularization among the Medicare population [published correction appears in Arch Surg . 2009;144:769] . Arch Surg . 2008;143:170–173 .
161 . Dumont TM, Rughani AI . National trends in carotid artery revasculariza-tion surgery . J Neurosurg . 2012;116:1251–1257 .
162 . Brott TG, Hobson RW 2nd, Howard G, Roubin GS, Clark WM, Brooks W, Mackey A, Hill MD, Leimgruber PP, Sheffet AJ, Howard VJ, Moore WS, Voeks JH, Hopkins LN, Cutlip DE, Cohen DJ, Popma JJ, Ferguson RD, Co-hen SN, Blackshear JL, Silver FL, Mohr JP, Lal BK, Meschia JF; CREST Investigators . Stenting versus endarterectomy for treatment of carotid-ar-tery stenosis [published corrections appear in N Engl J Med . 2010;363:498 and N Engl J Med . 2010;363:198] . N Engl J Med . 2010;363:11–23 .
163 . Voeks JH, Howard G, Roubin GS, Malas MB, Cohen DJ, Sternbergh WC 3rd, Aronow HD, Eskandari MK, Sheffet AJ, Lal BK, Meschia JF, Brott TG; CREST Investigators . Age and outcomes after carotid stenting and endarterectomy: the Carotid Revascularization Endarterectomy Versus Stenting Trial . Stroke . 2011;42:3484–3490 .
164 . Medical Expenditure Panel Survey (MEPS) of the Agency for Healthcare Research and Quality (AHRQ) . Household component summary data table . Table 4: Total Expenses and Percent Distribution for Selected Conditions by Source of Payment: United States, 2008 . http://meps .ahrq .gov/mepsweb/data_stats/tables_compendia_hh_interactive .jsp?_SERVICE=MEPSSocket0&_PROGRAM=MEPSPGM .TC .SAS&File=HCFY2009&Table=HCFY2009%5FCNDXP%5FC&_Debug= . Accessed November 12, 2012 .
by guest on December 16, 2013http://circ.ahajournals.org/Downloaded from
e144 Circulation January 1/8, 2013
165 . Taylor TN, Davis PH, Torner JC, Holmes J, Meyer JW, Jacobson MF . Lifetime cost of stroke in the United States . Stroke . 1996;27:1459–1466 .
166 . Perkins E, Stephens J, Xiang H, Lo W . The cost of pediatric stroke acute care in the United States [published correction appears in Stroke . 2010;41:e600] . Stroke . 2009;41:e600 .
167 . Gardner MA, Hills NK, Sidney S, Johnston SC, Fullerton HJ . The 5-year direct medical cost of neonatal and childhood stroke in a population-based cohort . Neurology . 2010;74:372–378 .
168 . Leibson CL, Hu T, Brown RD, Hass SL, O’Fallon WM, Whisnant JP . Utilization of acute care services in the year before and after first stroke: a population-based study . Neurology . 1996;46:861–869 .
169 . Diringer MN, Edwards DF, Mattson DT, Akins PT, Sheedy CW, Hsu CY, Dromerick AW . Predictors of acute hospital costs for treatment of ischemic stroke in an academic center . Stroke . 1999;30:724–728 .
170 . Matz R . Cost-effective, risk-free, evidence-based medicine . Arch Intern Med . 2003;163:2795 .
171 . Brown DL, Boden-Albala B, Langa KM, Lisabeth LD, Fair M, Smith MA, Sacco RL, Morgenstern LB . Projected costs of ischemic stroke in the United States . Neurology . 2006;67:1390–1395 .
172 . Ellis C, Simpson AN, Bonilha H, Mauldin PD, Simpson KN . The one-year attributable cost of poststroke aphasia . Stroke . 2012;43:1429–1431 .
173 . Godwin KM, Wasserman J, Ostwald SK . Cost associated with stroke: outpatient rehabilitative services and medication . Top Stroke Rehabil . 2011;18(suppl 1):676–684 .
174 . Schiller J, Lucas J, Peregoy J . Summary health statistics for U .S . adults: National Health Interview Survey, 2011 . Vital Health Stat 10 . In press .
175 . Incidence and Prevalence: 2006 Chart Book on Cardiovascular and Lung Diseases . Bethesda, MD: National Heart, Lung, and Blood Insti-tute; 2006 .
176 . Wolf PA, D’Agostino RB, Belanger AJ, Kannel WB . Probability of stroke: a risk profile from the Framingham Study . Stroke . 1991;22:312–318 .
by guest on December 16, 2013http://circ.ahajournals.org/Downloaded from

Heart Disease and Stroke Statistics—2013 Update: Chapter 14 e145
Table 14-1. Stroke
Population GroupPrevalence, 2010: Age
≥20 yNew and Recurrent Attacks, All Ages Mortality, 2009: All Ages*
Hospital Discharges, 2010: All Ages Cost, 2009
Both sexes 6 800 000 (2.8%) 795 000 128 842 1 015 000 $38.6 Billion
Males 3 000 000 (2.6%) 370 000 (46.5%)† 52 073 (40.4%)† 485 000 …
Females 3 800 000 (3.0%) 425 000 (53.5%)† 76 769 (59.6%)† 530 000 …
NH white males 2.4% 325 000‡ 43 190 … …
NH white females 2.9% 365 000‡ 65 574 … …
NH black males 4.3% 45 000‡ 6962 … …
NH black females 4.7% 60 000‡ 8916 … …
Mexican-American males 2.3% … … … …
Mexican-American females 1.4% … … … …
Hispanic or Latino 2.8%§ … 7065 … …
Asian 2.7%§ … 3639|| … …
Native Hawaiian and other Pacific Islander
§¶ … … … …
American Indian/ Alaska Native
4.6%§ … 561 … …
NH indicates non-Hispanic. Ellipses (…) indicate data not available.*Mortality data for the white, black, Asian or Pacific Islander, and American Indian/Alaska Native populations include deaths of persons of Hispanic and
non-Hispanic origin. Numbers of deaths for the American Indian/Alaska Native and Asian or Pacific Islander populations are known to be underestimated.†These percentages represent the portion of total stroke incidence or mortality that applies to males vs females.‡Estimates include Hispanics and non-Hispanics. Estimates for whites include other nonblack races.§National Health Interview Survey (2011), National Center for Health Statistics; data are weighted percentages for Americans >18 years of age.174
||Includes Chinese, Filipino, Hawaiian, Japanese, and other Asian or Pacific Islander.¶Estimate considered unreliable or does not meet standards of reliability or precision.Sources: Prevalence: National Health and Nutrition Examination Survey 2007–2010, National Center for Health Statistics and National Heart, Lung, and Blood In-
stitute. Percentages for racial/ethnic groups are age adjusted for Americans ≥20 years of age. Age-specific percentages are extrapolated to the 2010 US population. Incidence: Greater Cincinnati/Northern Kentucky Stroke Study/National Institutes of Neurological Disorders and Stroke data for 1999 provided on August 1, 2007. US estimates compiled by National Heart, Lung, and Blood Institute. See also Kissela et al.142 Data include children. Mortality: Centers for Disease Control and Preven-tion/National Center for Health Statistics, 2009 Mortality Multiple Cause–United States, version July 19, 2012. These data represent underlying cause of death only. Mortality data for white and black males and females include Hispanics. Hospital discharges: National Hospital Discharge Survey, National Center for Health Statistics. Data include those inpatients discharged alive, dead, or status unknown. Cost: National Heart, Lung, and Blood Institute. Data include estimated direct and indirect costs for 2009.
Table 14-2. Modifiable Stroke Risk Factors
Factor Prevalence, % PAR, %* RR
Cigarette smoking
Overall 19.8 12–14† 1.9
Men 22.3
Women 17.4
Hypertension ‡ 8
Ages 20–34 y
Men 13.4 99
Women 6.2 98
Ages 35–44 y
Men 23.2 99
Women 16.5 106
Ages 45–54 y
Men 36.2 100
Women 35.9 103
Ages 55–64 y
Men 53.7 100
Women 55.8 102
(Continued)
by guest on December 16, 2013http://circ.ahajournals.org/Downloaded from
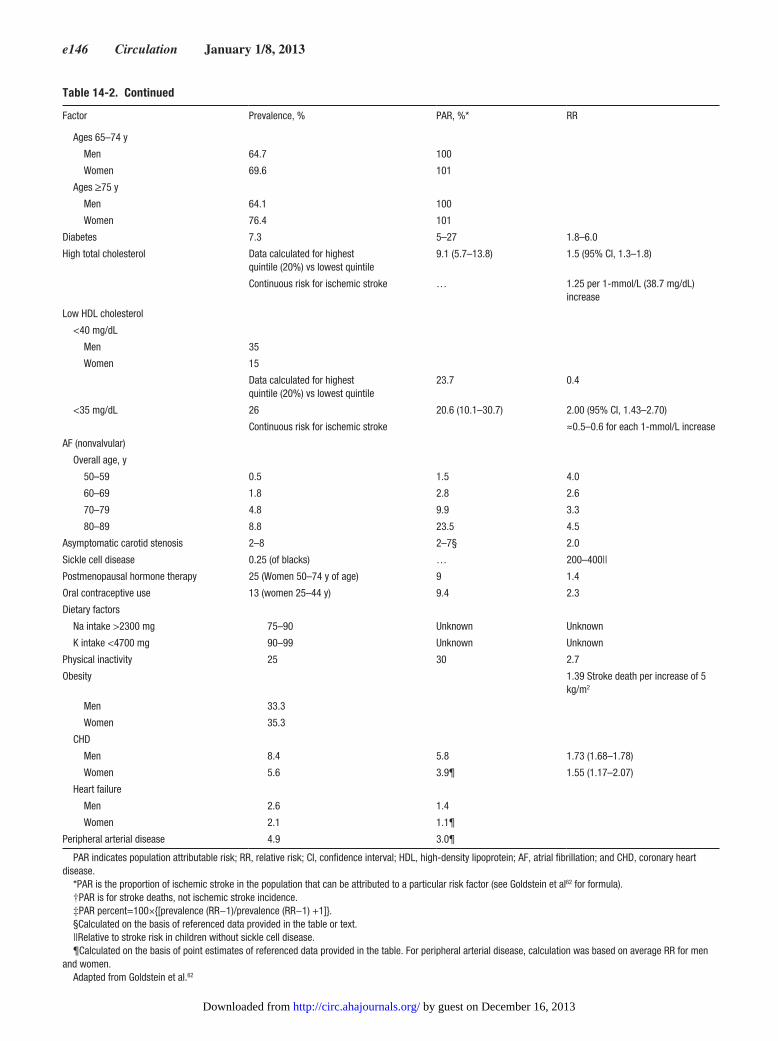
e146 Circulation January 1/8, 2013
Table 14-2. Continued
Factor Prevalence, % PAR, %* RR
Ages 65–74 y
Men 64.7 100
Women 69.6 101
Ages ≥75 y
Men 64.1 100
Women 76.4 101
Diabetes 7.3 5–27 1.8–6.0
High total cholesterol Data calculated for highest quintile (20%) vs lowest quintile
9.1 (5.7–13.8) 1.5 (95% CI, 1.3–1.8)
Continuous risk for ischemic stroke … 1.25 per 1-mmol/L (38.7 mg/dL) increase
Low HDL cholesterol
<40 mg/dL
Men 35
Women 15
Data calculated for highest quintile (20%) vs lowest quintile
23.7 0.4
<35 mg/dL 26 20.6 (10.1–30.7) 2.00 (95% CI, 1.43–2.70)
Continuous risk for ischemic stroke ≈0.5–0.6 for each 1-mmol/L increase
AF (nonvalvular)
Overall age, y
50–59 0.5 1.5 4.0
60–69 1.8 2.8 2.6
70–79 4.8 9.9 3.3
80–89 8.8 23.5 4.5
Asymptomatic carotid stenosis 2–8 2–7§ 2.0
Sickle cell disease 0.25 (of blacks) … 200–400||
Postmenopausal hormone therapy 25 (Women 50–74 y of age) 9 1.4
Oral contraceptive use 13 (women 25–44 y) 9.4 2.3
Dietary factors
Na intake >2300 mg 75–90 Unknown Unknown
K intake <4700 mg 90–99 Unknown Unknown
Physical inactivity 25 30 2.7
Obesity 1.39 Stroke death per increase of 5 kg/m2
Men 33.3
Women 35.3
CHD
Men 8.4 5.8 1.73 (1.68–1.78)
Women 5.6 3.9¶ 1.55 (1.17–2.07)
Heart failure
Men 2.6 1.4
Women 2.1 1.1¶
Peripheral arterial disease 4.9 3.0¶
PAR indicates population attributable risk; RR, relative risk; CI, confidence interval; HDL, high-density lipoprotein; AF, atrial fibrillation; and CHD, coronary heart disease.
*PAR is the proportion of ischemic stroke in the population that can be attributed to a particular risk factor (see Goldstein et al62 for formula).†PAR is for stroke deaths, not ischemic stroke incidence.‡PAR percent=100×{[prevalence (RR−1)/prevalence (RR−1) +1]}.§Calculated on the basis of referenced data provided in the table or text.||Relative to stroke risk in children without sickle cell disease.¶Calculated on the basis of point estimates of referenced data provided in the table. For peripheral arterial disease, calculation was based on average RR for men
and women.Adapted from Goldstein et al.62
by guest on December 16, 2013http://circ.ahajournals.org/Downloaded from
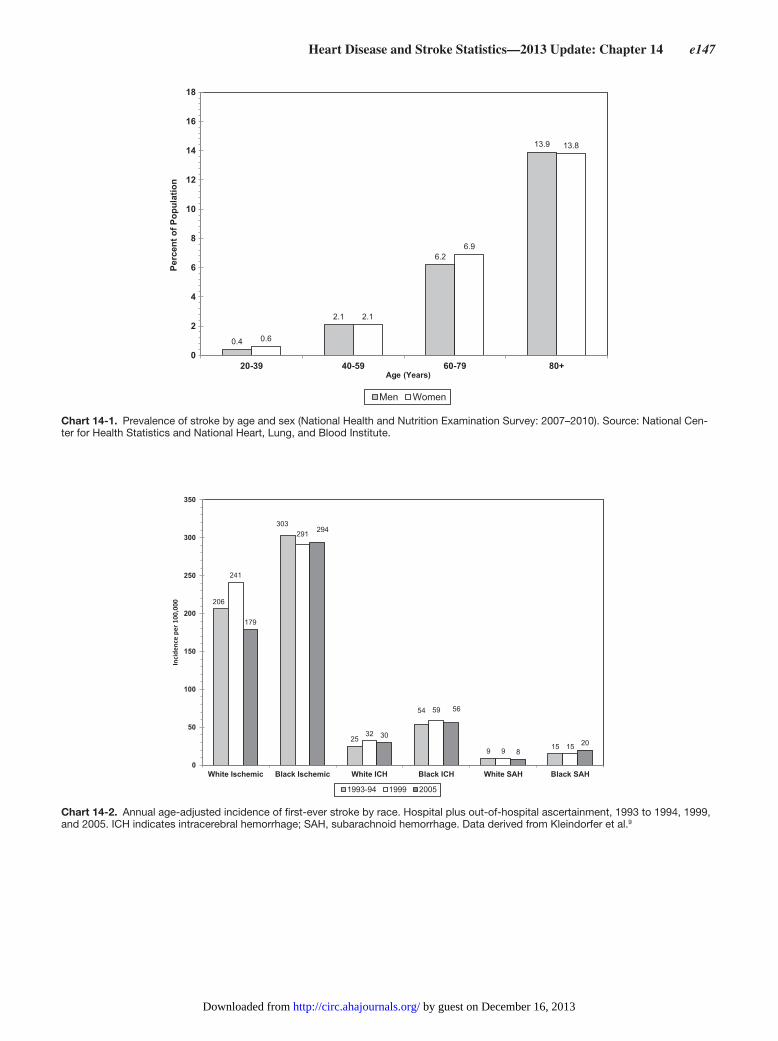
Heart Disease and Stroke Statistics—2013 Update: Chapter 14 e147
0.4
2.1
6.2
13.9
0.6
2.1
6.9
13.8
0
2
4
6
8
10
12
14
16
18
20-39 40-59 60-79 80+
Perc
ent o
f Pop
ulat
ion
Age (Years)
Men Women
Chart 14-1. Prevalence of stroke by age and sex (National Health and Nutrition Examination Survey: 2007–2010). Source: National Cen-ter for Health Statistics and National Heart, Lung, and Blood Institute.
206
303
25
54
9 15
241
291
32
59
9 15
179
294
30
56
820
0
50
100
150
200
250
300
350
White Ischemic Black Ischemic White ICH Black ICH Black SAHWhite SAH
1993-94 1999 2005
Chart 14-2. Annual age-adjusted incidence of first-ever stroke by race. Hospital plus out-of-hospital ascertainment, 1993 to 1994, 1999, and 2005. ICH indicates intracerebral hemorrhage; SAH, subarachnoid hemorrhage. Data derived from Kleindorfer et al.9
by guest on December 16, 2013http://circ.ahajournals.org/Downloaded from

e148 Circulation January 1/8, 2013
1.12.7
7.6
12.5
32.1
0.71.9
5.6
12.4
19.6
2.7
5.77.2
8.4
14.7
2.2
4.15.6
12.5
20.2
0
5
10
15
20
25
30
35
45-54 55-64 65-74 75-84
Per 1
,000
Per
sons
Age (Years)
White Men White Women Black Men Black Women
Chart 14-3. Annual rate of first cerebral infarction by age, sex, and race (Greater Cincinnati/Northern Kentucky Stroke Study: 1999). Rates for black men and women 45 to 54 years of age and for black men ≥75 years of age are considered unreliable. Source: Unpub-lished data from the Greater Cincinnati/Northern Kentucky Stroke Study.
1.42.9
7.7
13.5
32.1
1.02.2
6.6
13.8
19.5
3.5
5.3
8.08.9
14.7
2.9
4.96.6
13.6
20.9
0
5
10
15
20
25
30
35
45-54 55-64 65-74 75-84
Per 1
,000
Per
sons
Age (Years)
White Men White Women Black Men Black Women
Chart 14-4. Annual rate of all first-ever strokes by age, sex, and race (Greater Cincinnati/Northern Kentucky Stroke Study: 1999). Rates for black men and women 45 to 54 years of age and for black men ≥75 years of age are considered unreliable.
2.4
6.1
12.2
2.4
4.8
9.99.7
13.1
16.2
7.2
10.0
15.0
0
2
4
6
8
10
12
14
16
18
45 to 54 55 to 64 65 to 74
Per 1
000
Pers
on Y
ears
White Men White Women Black Men Black Women
Chart 14-5. Age-adjusted incidence of stroke/transient ischemic attack* by race and sex, ages 45 to 74 years, Atherosclerosis Risk in Commu-nities study cohort, 1987–2001. Data derived from the National Heart, Lung, and Blood Institute, Incidence and Prevalence: 2006 Chart Book.175
by guest on December 16, 2013http://circ.ahajournals.org/Downloaded from

Heart Disease and Stroke Statistics—2013 Update: Chapter 14 e149
37.8
60.1
34.1
29.230.9
36.6
50.2
29.6
24.628.0
0
10
20
30
40
50
60
70
White Black Asian/Pacific Islander AmericanIndian/Alaska Native
Hispanic
Dea
th R
ate
per 1
00 0
00
Males Females
Chart 14-6. Age-adjusted death rates for stroke by sex and race/ethnicity, 2009. Death rates for the American Indian/Alaska Native and Asian or Pacific Islander populations are known to be underestimated. Stroke includes International Classification of Diseases, 10th Revision codes I60 to I69 (cerebrovascular disease). Source: National Center for Health Statistics and National Heart, Lung, and Blood Institute.
New York City
35 - 96 97 - 105106 - 114115 - 125126 - 198Insufficient Data
Number ofCounties
3544615676624679
HawaiiAlaska
Age-AdjustedAverage Annual Deaths per 100,000
Rates are spatially smoothed to enhance the stability of rates in counties with small populations.
ICD-10 codes for stroke: I60-I69
Data Source: National Vital Statistics System and the U.S. Census
Chart 14-7. Stroke death rates, 2000 through 2006. Adults ≥35 years of age, by county. Rates are spatially smoothed to enhance the stability of rates in counties with small populations. International Classification of Diseases, 10th Revision codes for stroke: I60–I69. Data source: National Vital Statistics System and the US Census Bureau.
by guest on December 16, 2013http://circ.ahajournals.org/Downloaded from

e150 Circulation January 1/8, 2013
2.64.0
5.4
8.4
14.8
22.4
1.12.0
3.5
6.3
19.1
27.0
0
5
10
15
20
25
30
ECBA D F
Estim
ated
10-
Year
Rat
e (%
)
Men Women
A ED FCBBlood Pressure* 95-105 138-148 138-148 138-148 138-148 138-148Diabetes No
NoNoNoCigarette Smoking Yes Yes
YesYesYesYesYes
Prior AF NoNo
NoNo
NoNo
NoNoNoNoYes Yes
YesPrior CVD
* - Closest ranges for women are : 95-104 and 115-124.
Chart 14-8. Estimated 10-year stroke risk in adults 55 to 84 years of age according to levels of various risk factors (Framingham Heart Study). AF indicates atrial fibrillation; CVD, cardiovascular disease. Data derived from Wolf et al176 with permission of the publisher. Copy-right © 1991, American Heart Association.
14
18 1819
25
28
2423
0
5
10
15
20
25
30
White Men White Women Black Men Black Women
Per
cen
t o
f P
atie
nts
45-64 years of age ≥65 years of age
Chart 14-9. Proportion of patients dead 1 year after first stroke. Source: Pooled data from the Framingham Heart Study, Atherosclerosis Risk in Communities study, and Cardiovascular Health Study of the National Heart, Lung, and Blood Institute.
by guest on December 16, 2013http://circ.ahajournals.org/Downloaded from
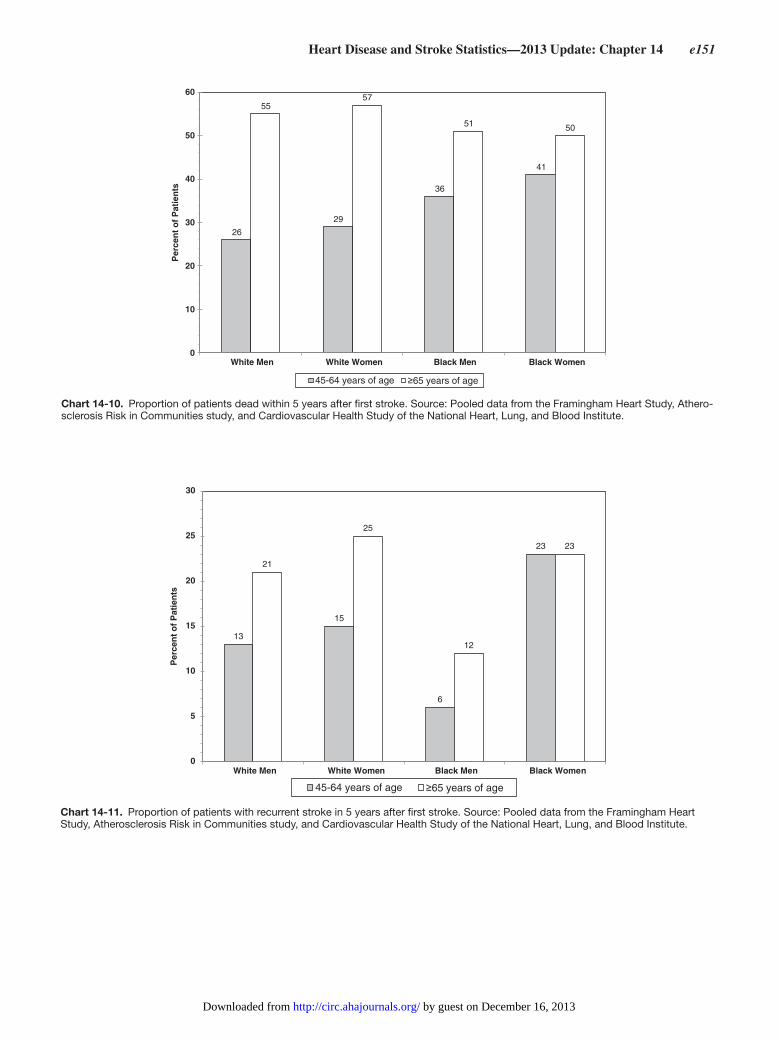
Heart Disease and Stroke Statistics—2013 Update: Chapter 14 e151
26
29
36
41
5557
51 50
0
10
20
30
40
50
60
White Men White Women Black Men Black Women
Per
cen
t o
f P
atie
nts
45-64 years of age ≥65 years of age
Chart 14-10. Proportion of patients dead within 5 years after first stroke. Source: Pooled data from the Framingham Heart Study, Athero-sclerosis Risk in Communities study, and Cardiovascular Health Study of the National Heart, Lung, and Blood Institute.
13
15
6
23
21
25
12
23
0
5
10
15
20
25
30
White Men White Women Black Men Black Women
Per
cen
t o
f P
atie
nts
45-64 years of age ≥65 years of age
Chart 14-11. Proportion of patients with recurrent stroke in 5 years after first stroke. Source: Pooled data from the Framingham Heart Study, Atherosclerosis Risk in Communities study, and Cardiovascular Health Study of the National Heart, Lung, and Blood Institute.
by guest on December 16, 2013http://circ.ahajournals.org/Downloaded from

e152 Circulation January 1/8, 2013
0
20
40
60
80
100
120
140
1980 1985 1990 1995 2000 2005 2010
Pro
ced
ure
s in
Th
ou
san
ds
Year
Chart 14-12. Trends in carotid endarterectomy procedures (United States: 1980–2010). Source: National Hospital Discharge Survey/National Center for Health Statistics and National Heart, Lung, and Blood Institute.
Chart 14-13. Trends in carotid revascularization procedures. MCBE indicates Medicare beneficiaries; CEA, carotid endarterectomy; and CAS, carotid artery stenting. Reproduced with permission from Goodney et al.160 Copyright © 2008, American Medical Association. All rights reserved.
by guest on December 16, 2013http://circ.ahajournals.org/Downloaded from
Heart Disease and Stroke Statistics—2013 Update: Chapter 15 e153
15. Congenital Cardiovascular Defects and Kawasaki Disease
ICD-9 745 to 747, ICD-10 Q20 to Q28. See Tables 15-1 through 15-4.Congenital cardiovascular defects, also known as congenital heart defects, are structural problems that arise from abnormal formation of the heart or major blood vessels . ICD-9 lists 25 congenital heart defects codes, of which 21 designate specific anatomic or hemodynamic lesions .
Defects range in severity from tiny pinholes between cham-bers that may resolve spontaneously to major malformations that can require multiple surgical procedures before school age and may result in death in utero, in infancy, or in child-hood . The common complex defects include the following:
●● Tetralogy of Fallot (TOF)●● Transposition of the great arteries (TGA)●● Atrioventricular (AV) septal defects●● Coarctation of the aorta●● Hypoplastic left heart syndrome (HPLHS)
Congenital heart defects are serious and common condi-tions that have a significant impact on morbidity, mortality, and healthcare costs in children and in adults .1–4 As health outcomes improve and survival increases for children living with congenital HD, the burden of care is shifting toward adult populations .5
IncidenceThe most commonly reported incidence of congenital heart defects in the United States is between 4 and 10 per 1000, clustering around 8 per 1000 live births .6,7 Continental vari-ations in birth prevalence have been reported, from 6 .9 per 1000 births in Europe to 9 .3 per 1000 in Asia .8 Variations in reported number of incident cases are largely accounted for by the age at detection and the method of diagnosis . Major
defects may be apparent in the prenatal or neonatal period, but minor defects may not be detected until adulthood . Detection rates have increased since the advent of cardiac ultrasound .4 Thus, true measures of the incidence of congenital HD would need to record new cases of defects that present from fetal life onward . Because most estimates are available for new cases detected between birth and the first year of life, birth preva-lence is the best proxy for incident congenital heart defects . These are typically reported as cases per 1000 live births per year and do not distinguish between tiny defects that resolve without treatment and major malformations . To distinguish more serious defects, some studies also report new cases of sufficient severity to require an invasive procedure or that result in death within the first year of life . Despite the absence of true incidence figures, some data are available and are pro-vided in Table 15-2 .
●● Using population-based data from the Metropolitan Atlanta Congenital Defects Program (MACDP) in metropolitan Atlanta, GA, congenital heart defects occurred in 1 of every 111 to 125 births (live, still, or >20 weeks’ gestation) from 1995 to 1997 and from 1998 to 2005, with variations in sex and racial distribution of some lesions .4,6
●● Data collected in Alberta, Canada, found the total preva-lence of CHD to be 12 .42 per 1000 total births (live, still, or >20 weeks’ gestation) .9
●● The National Birth Defects Prevention Network for 13 states from 2004 to 2006 showed the average prevalence of 21 selected major birth defects . These data indicated that there are >6100 estimated annual cases of 5 cardiovas-cular defects: truncus arteriosus (0 .7/10 000 births), TGA (3 .0/10 000 births), TOF (4 .0/10 000 births), AV septal defect (4 .7/10 000 births), and HPLHS (2 .3/10 000 births) .10
●● Analysis of contemporary birth cohorts with MACDP data revealed that the most common defects at birth were ven-tricular septal defect (VSD; 4 .2/1000 births), atrial septal defect (ASD; 1 .3/1000 births), valvar pulmonic stenosis (0 .6/1000 births); TOF (0 .5/1000 births), aortic coarctation (0 .4/1000 births), AV septal defect (0 .4/1000 births), and TGA (0 .2/1000 births) .6,11
●● An estimated minimum of 32 000 infants are expected to be affected with congenital HD each year in the United States . Of these, an approximate 25%, or 2 .4 per 1000 live births, require invasive treatment in the first year of life .1
●● Estimates also are available for bicuspid aortic valves, which occur in 13 .7 per 1000 people; these defects may not require treatment in infancy but can cause problems later in adulthood .12
Prevalence(See Tables 15-1 through 15-3 .)
The 32nd Bethesda Conference estimated that the total number of adults living with congenital HD in the United States in 2000 was 800 000 .2,3 In the United States, 1 in 150 adults are expected to have some form of congenital HD .3 In population data from Canada, the measured prevalence of congenital cardiac defects in the general population was 11 .89 per 1000 children and 4 .09 per 1000 adults in the year 2000 .13 Extrapolated to the US population in the same
Abbreviations Used in Chapter 15
ASD atrial septal defect
AV atrioventricular
CDC Centers for Disease Control and Prevention
CHD coronary heart disease
CI confidence interval
DM diabetes mellitus
HD heart disease
HPLHS hypoplastic left heart syndrome
ICD-9 International Classification of Diseases, 9th Revision
ICD-10 International Classification of Diseases, 10th Revision
MACDP Metropolitan Atlanta Congenital Defects Program
NCHS National Center for Health Statistics
NH non-Hispanic
NHLBI National Heart, Lung, and Blood Institute
RR relative risk
TGA transposition of the great arteries
TOF tetralogy of Fallot
VSD ventricular septal defect
AQ1
by guest on December 16, 2013http://circ.ahajournals.org/Downloaded from
e154 Circulation January 1/8, 2013
year, this yields published estimates of 859 000 children and 850 000 adults for the year 2000 .11 The expected growth rates of the congenital heart defects population vary from 1% to 5% per year depending on the age and distribution of lesions .2,13
Estimates of the distribution of lesions in the congeni-tal heart defects population using available data vary with assumptions made . If all those born with lesions between 1940 and 2002 were treated, there would be 750 000 survivors with simple lesions, 400 000 with moderate lesions, and 180 000 with complex lesions; in addition, there would be 3 .0 million subjects alive with bicuspid aortic valves .14 Without treatment, the number of survivors in each group would be 400 000, 220 000, and 30 000, respectively . The actual numbers surviv-ing are projected to be between these 2 sets of estimates as of 1 decade ago .14 Using measurements from population data in Canada, the prevalence of severe forms of congenital heart defects increased 85% in adults and 22% in children from 1985 to 2000 .13 The most common types of defects in children are (at a minimum) VSD, 620 000 people; ASD, 235 000 peo-ple; valvular pulmonary stenosis, 185 000 people; and patent ductus arteriosus, 173 000 people .14 The most common lesions seen in adults are ASD and TOF .2
Risk Factors
●● Numerous intrinsic and extrinsic nongenetic risk factors contribute to CHD .15
●● Attributable risks or fractions have been shown to include paternal anesthesia in TOF (3 .6%), sympathomimetic med-ication for coarctation of the aorta (5 .8%), pesticides for VSD (5 .5%), and solvents for HPLHS (4 .6%) .16
●● A study of infants born with heart defects unrelated to genetic syndromes who were included in the National Birth Defects Prevention Study found that women who reported smoking in the month before becoming pregnant or in the first trimester were more likely to give birth to a child with a septal defect . Compared with the infants of mothers who did not smoke during pregnancy, infants of mothers who were heavy smokers (≥25 cigarettes daily) were twice as likely to have a septal defect .17
●● Data from the Baltimore-Washington Infant Study reported that maternal smoking during the first trimester of preg-nancy was associated with at least a 30% increased risk of the following lesions in the fetus: ASD, pulmonary valvar stenosis, truncus arteriosus, and TGA .18
●● Associations between exposure to air pollutants during first-trimester pregnancy and risks of congenital heart defects were documented from 1986 to 2003 by the MACDP that related carbon monoxide, nitrogen dioxide, and sulfur dioxide measurements to the risk of ASD, VSD, TGA, and TOF .19
●● The results of a population-based study examining preg-nancy obesity found a weak to moderate positive associa-tion of maternal obesity with 7 of 16 categories of birth defects, including heart defects .20
●● Although folic acid supplementation is recommended dur-ing pregnancy to potentially reduce the risk of congenital heart defects,15 there has been only 1 US population-based case-control study, performed with the Baltimore-Wash-ington Infant Study between 1981 and 1989, that showed an inverse relationship between folic acid use and the risk
of TGA .21 A study from Quebec, Canada, that analyzed 1 .3 million births from 1990 to 2005 found a significant 6% per year reduction in severe congenital heart defects using a time-trend analysis before and after public health mea-sures were instituted that mandated folic acid fortification of grain and flour products in Canada .22
●● Pregestational DM was significantly associated with car-diac defects, both isolated and multiple . Gestational DM was associated with a limited group of birth defects .23
●● Paternal risk of occupational exposure was addressed in a study published in 2012 documenting a higher incidence of congenital HD with paternal exposure to phthalates .24
Mortality(See Table 15-1 .)
Mortality related to congenital cardiovascular defects in 2009 was 3189 deaths . Any-mention mortality related to congenital cardiovascular defects in 2009 was 5051 deaths .21
●● In 2009, congenital cardiovascular defects were the most common cause of infant death resulting from birth defects; 26 .6% of infants who died of a birth defect had a heart defect .25
●● The death rate attributable to congenital heart defects in the United States has continued to decline from 1979 to 1997 and from 1999 to 2006 . Age-adjusted death rates attribut-able to all congenital heart defects declined 21% to 39%, and deaths tended to occur at progressively older ages . Nevertheless, mortality in infants <1 year of age continues to account for nearly half of the deaths .18, 26
●● When CDC data on multiple causes of death were used to examine mortality in cyanotic and acyanotic lesions between 1979 and 2005, all-age death rates had declined by 60% for VSD and 40% for TOF .27
●● In population-based data from Canada, 8123 deaths occurred in 71 686 congenital HD patients followed up for nearly 1 million patient-years . Overall mortality decreased by 31%, and the median age of death increased from 2 to 23 years between 1987 and 2005 .28
●● The 2009 age-adjusted death rate (deaths/100 000 people) attributable to congenital cardiovascular defects was 1 .0 . Death rates were 1 .1 for white males, 1 .4 for black males, 0 .9 for white females, and 1 .2 for black females . Crude infant mortality rates (<1 year of age) were 31 .4 for white infants and 42 .2 for black infants .25
●● Mortality after congenital heart surgery also differs between races/ethnicities after adjustment for access to care . The risk of in-hospital mortality for minority patients compared with white patients is 1 .22 (95% CI, 1 .05–1 .41) for Hispan-ics, 1 .27 (95% CI, 1 .09–1 .47) for non-Hispanic blacks, and 1 .56 (95% CI, 1 .37–1 .78) for other non-Hispanics .29
●● According to CDC multiple-cause death data, from 1999 to 2006, sex differences in mortality over time varied with age . Between the ages of 18 and 34 years, mortality over time decreased significantly in females but not in males .30
●● On the basis of data from the Healthcare Cost and Utilization Project’s Kids’ Inpatient Database from 2000, 2003, and 2006, male children had more congenital heart defect surgeries in infancy, more high-risk surgeries, and more procedures to correct multiple congenital heart
by guest on December 16, 2013http://circ.ahajournals.org/Downloaded from

Heart Disease and Stroke Statistics—2013 Update: Chapter 15 e155
defects . Female infants with high-risk congenital heart defects had a 39% higher adjusted mortality .26
●● In 2007, 189 000 life-years were lost before 55 years of age because of deaths attributable to congenital cardiovascu-lar defects . This is almost as many life-years as were lost from leukemia and asthma combined (NHLBI tabulation of NCHS mortality data) .
●● Data from the Pediatric Heart Network conducted in 15 North American centers revealed that even in lesions associated with the highest mortality among congenital lesions, such as HPLHS, aggressive palliation can lead to an increase in the 12-month survival rate, from 64% to 74% .31
●● Data analysis for the Society of Thoracic Surgeons’ Con-genital Heart Surgery Database, a voluntary registry with self-reported data for a 4-year cycle (2007–2010) from 103 centers performing congenital heart surgery (98 from the United States, 3 from Canada, and 1 from Japan),32 showed that of 95 357 total operations, the overall aggregate hos-pital discharge mortality rate was 3 .5% .33 Specifically, the mortality rate was 10 .1% for neonates (0–30 days of age),34 2 .9% for infants (31 days to 1 year of age),35 1 .1% for chil-dren (>1 year to 18 years of age),36 and 1 .9% for adults (>18 years of age) .37
●● Using the Nationwide Inpatient Sample 1988–2003, mor-tality was examined for 12 congenital heart defect proce-dures . A total of 30 250 operations were identified, which yielded a national estimate of 152 277±7875 operations . Of these, 27% were performed in patients ≥18 years of age . The overall in-hospital mortality rate for adult patients with congenital heart defects was 4 .71% (95% CI, 4 .19%–5 .23%), with a significant reduction in mortal-ity observed when surgery was performed on such adult patients by pediatric versus nonpediatric heart surgeons (1 .87% versus 4 .84%; P<0 .0001) .38
Hospitalizations(See Table 15-1 .)
In 2004, birth defects accounted for >139 000 hospitaliza-tions, representing 47 .4 stays per 100 000 people . Cardiac and circulatory congenital anomalies accounted for 34% of all hospital stays for birth defects . Although the most common congenital lesions were shunts, including pat-ent ductus arteriosus, VSDs, and ASDs, TOF accounted for a higher proportion of in-hospital death than any other birth defect . Between 1997 and 2004, hospitalization rates increased by 28 .5% for cardiac and circulatory congenital anomalies .39
Cost
●● From data from the Healthcare Cost and Utilization Proj-ect 2003 Kids’ Inpatient Database and 2003 information on birth defects in the Congenital Malformations Surveillance Report, it was found that the most expensive average neo-natal hospital charges were for 2 congenital heart defects: HPLHS ($199 597) and common truncus arteriosus ($192 781) . Two other cardiac defects, coarctation of the aorta and TGA, were associated with average hospital charges
in excess of $150 000 . For the 11 selected cardiovascular congenital defects (of 35 birth defects considered), there were 11 578 hospitalizations in 2003 and 1550 in-hospital deaths (13 .4%) . Estimated total hospital charges for these 11 conditions were $1 .4 billion .40
●● In 2004, hospital costs for congenital cardiovascular defect conditions totaled $2 .6 billion . The highest aggregate costs were for stays related to cardiac and circulatory congenital anomalies, which accounted for ≈$1 .4 billion, more than half of all hospital costs for birth defects .39
●● Data from 1941 neonates with HPLHS showed a median cost of $99 070 for stage 1 palliation (Norwood or Sano procedure), $35 674 for stage 2 palliation (Glenn proce-dure), $36 928 for stage 3 palliation (Fontan procedure), and $289 292 for transplantation .41
●● In 2124 patients undergoing congenital heart operations between 2001 and 2007, total costs for the surgeries were $12 761 (ASD repair), $18 834 (VSD repair), $28 223 (TOF repair), and $55 430 (arterial switch operation) .42
Kawasaki DiseaseICD-9 446.1; ICD-10 M30.3.Mortality—5 . Any-mention mortality—7 .
●● The incidence of Kawasaki disease is rising worldwide, including in the United States, where the hospitalization rate rose from 17 .5/100 000 children aged <5 years to 20 .8/100 000 children <5 years in 2006 .43 In 2010, Japan experienced its highest-ever incidence rate of 239 .6 cases per 100 000 children aged <4 years .44
●● US states with higher Asian American populations have higher rates of Kawasaki disease; for example, rates are 2 .5-fold higher in Hawaii than in the continental United States .45
●● Boys have a 1 .5-fold higher incidence of Kawasaki disease than girls .45
●● An estimated 5523 hospitalizations for Kawasaki disease occurred in the United States in 2006, with a mean patient age of 3 years . Race-specific incidence rates indicate that Kawasaki disease is most common among Americans of Asian and Pacific Island descent (30 .3/100 000 children <5 years of age), occurs with intermediate frequency in non-His-panic blacks (17 .5/100 000 children <5 years of age) and His-panics (15 .7/100 000 children <5 years of age), and is least common in whites (12 .0/100 000 children <5 years of age) .46
●● Kawasaki disease is more common during the winter and early spring months, except in Hawaii, where no clear sea-sonal trend is seen47; it occurs more often in boys than girls at a ratio of ≈1 .5:1, and 76 .8% of children with Kawasaki disease are <5 years of age .43,45,46
●● Data from the Kids’ Inpatient Database45 show a hospital-ization rate for Kawasaki disease for children <5 years of
—19 per 100 000 in 2009—20 .8 per 100 000 in 2006—17 .3 per 100 000 in 2003—17 .5 per 100 000 in 2000
●● Addition of prednisolone to the standard regimen of intravenous immunoglobulin for patients with severe Kawasaki disease appears to result in a substantial reduction in the incidence of coronary artery anomalies (RR, 0 .20; 95% CI, 0 .12–0 .28) .48
by guest on December 16, 2013http://circ.ahajournals.org/Downloaded from

e156 Circulation January 1/8, 2013
References 1 . Moller J . Prevalence and incidence of cardiac malformation . Perspectives
in Pediatric Cardiology: Surgery of Congenital Heart Disease: Pediatric Cardiac Care Consortium, 1984 -1995. Armonk, NY: Futura; 1998:19–26 .
2 . Warnes CA, Liberthson R, Danielson GK, Dore A, Harris L, Hoffman JI, Somerville J, Williams RG, Webb GD . Task force 1: the chang-ing profile of congenital heart disease in adult life . J Am Coll Cardiol . 2001;37:1170–1175 .
3 . Warnes CA, Williams RG, Bashore TM, Child JS, Connolly HM, Dea-rani JA, del Nido P, Fasules JW, Graham TP Jr, Hijazi ZM, Hunt SA, King ME, Landzberg MJ, Miner PD, Radford MJ, Walsh EP, Webb GD . ACC/AHA 2008 guidelines for the management of adults with congenital heart disease: a report of the American College of Cardiology/American Heart Association Task Force on Practice Guidelines (writing committee to develop guidelines on the management of adults with congenital heart disease) . Circulation . 2008;118:e714–e833 .
4 . Botto LD, Correa A, Erickson JD . Racial and temporal variations in the prevalence of heart defects . Pediatrics . 2001;107:E32 .
5 . Sable C, Foster E, Uzark K, Bjornsen K, Canobbio MM, Connolly HM, Graham TP, Gurvitz MZ, Kovacs A, Meadows AK, Reid GJ, Reiss JG, Rosenbaum KN, Sagerman PJ, Saidi A, Schonberg R, Shah S, Tong E, Williams RG; on behalf of the American Heart Association Congenital Heart Defects Committee of the Council on Cardiovascular Disease in the Young, Council on Cardiovascular Nursing, Council on Clinical Car-diology, and Council on Peripheral Vascular Disease . Best practices in managing transition to adulthood for adolescents with congenital heart disease: the transition process and medical and psychosocial issues: a scientific statement from the American Heart Association . Circulation . 2011;123:1454–1485 .
6 . Reller MD, Strickland MJ, Riehle-Colarusso T, Mahle WT, Correa A . Prevalence of congenital heart defects in metropolitan Atlanta, 1998-2005 . J Pediatr . 2008;153:807–813 .
7 . Roguin N, Du ZD, Barak M, Nasser N, Hershkowitz S, Milgram E . High prevalence of muscular ventricular septal defect in neonates . J Am Coll Cardiol . 1995;26:1545–1548 .
8 . van der Linde D, Konings EE, Slager MA, Witsenburg M, Helbing WA, Takkenberg JJ, Roos-Hesselink JW . Birth prevalence of congenital heart disease worldwide: a systematic review and meta-analysis . J Am Coll Car-diol . 2011;58:2241–2247 .
9 . Bedard T, Lowry RB, Sibbald B, Harder JR, Trevenen C, Horobec V, Dyck JD . Congenital heart defect case ascertainment by the Alberta Congenital Anomalies Surveillance System . Birth Defects Res Part A Clin Mol Tera-tol . 2012;94:449–458 .
10 . Parker SE, Mai CT, Canfield MA, Rickard R, Wang Y, Meyer RE, Ander-son P, Mason CA, Collins JS, Kirby RS, Correa A; National Birth Defects Prevention Network . Updated National Birth Prevalence estimates for se-lected birth defects in the United States, 2004-2006 . Birth Defects Res Part A Clin Mol Teratol . 2010;88:1008–1016 .
11 . Marelli AJ, Therrien J, Mackie AS, Ionescu-Ittu R, Pilote L . Planning the specialized care of adult congenital heart disease patients: from numbers to guidelines: an epidemiologic approach . Am Heart J . 2009;157:1–8 .
12 . Hoffman JI, Kaplan S . The incidence of congenital heart disease . J Am Coll Cardiol . 2002;39:1890–1900 .
13 . Marelli AJ, Mackie AS, Ionescu-Ittu R, Rahme E, Pilote L . Congenital heart disease in the general population: changing prevalence and age dis-tribution . Circulation . 2007;115:163–172 .
14 . Hoffman JI, Kaplan S, Liberthson RR . Prevalence of congenital heart dis-ease . Am Heart J . 2004;147:425–439 .
15 . Jenkins KJ, Correa A, Feinstein JA, Botto L, Britt AE, Daniels SR, Elix-son M, Warnes CA, Webb CL . Noninherited risk factors and congenital cardiovascular defects: current knowledge: a scientific statement from the American Heart Association Council on Cardiovascular Disease in the Young . Circulation . 2007;115:2995–3014 .
16 . Wilson PD, Loffredo CA, Correa-Villaseñor A, Ferencz C . Attributable fraction for cardiac malformations . Am J Epidemiol . 1998;148:414–423 .
17 . Malik S, Cleves MA, Honein MA, Romitti PA, Botto LD, Yang S, Hobbs CA; National Birth Defects Prevention Study . Maternal smoking and con-genital heart defects . Pediatrics . 2008;121:e810–e816 .
18 . Alverson CJ, Strickland MJ, Gilboa SM, Correa A . Maternal smoking and congenital heart defects in the Baltimore-Washington Infant Study . Pedi-atrics . 2011;127:e647–e653 .
19 . Strickland MJ, Klein M, Correa A, Reller MD, Mahle WT, Riehle- Colarusso TJ, Botto LD, Flanders WD, Mulholland JA, Siffel C, Marcus M, Tolbert PE . Ambient air pollution and cardiovascular malformations in At-lanta, Georgia, 1986-2003 . Am J Epidemiol . 2009;169:1004–1014 .
20 . Waller DK, Shaw GM, Rasmussen SA, Hobbs CA, Canfield MA, Siega-Riz AM, Gallaway MS, Correa A; National Birth Defects Preven-tion Study . Prepregnancy obesity as a risk factor for structural birth de-fects . Arch Pediatr Adolesc Med . 2007;161:745–750 .
21 . Scanlon KS, Ferencz C, Loffredo CA, Wilson PD, Correa-Villaseñor A, Khoury MJ, Willett WC . Preconceptional folate intake and malformations of the cardiac outflow tract: Baltimore-Washington Infant Study Group . Epidemiology . 1998;9:95–98 .
22 . Ionescu-Ittu R, Marelli AJ, Mackie AS, Pilote L . Prevalence of severe con-genital heart disease after folic acid fortification of grain products: time trend analysis in Quebec, Canada . BMJ . 2009;338:b1673 .
23 . Correa A, Gilboa SM, Besser LM, Botto LD, Moore CA, Hobbs CA, Clev-es MA, Riehle-Colarusso TJ, Waller DK, Reece EA . Diabetes mellitus and birth defects . Am J Obstet Gynecol . 2008;199:237 .e1–237 .e9 .
24 . Snijder CA, Vlot IJ, Burdorf A, Obermann-Borst SA, Helbing WA, Wildhagen MF, Steegers EA, Steegers-Theunissen RP . Congenital heart defects and parental occupational exposure to chemicals . Hum Reprod . 2012;27:1510–1517 .
25 . Centers for Disease Control and Prevention, National Center for Health Statistics . Compressed Mortality File 1999-2009 . CDC WONDER Online Database, compiled for Compressed Mortality File 1999–2009 Series 20, No . 20, 2012 . Underlying cause-of-death 1999–2009 . http://wonder .cdc .gov/mortSQl .html . Accessed July 18, 2012 .
26 . Boneva RS, Botto LD, Moore CA, Yang Q, Correa A, Erickson JD . Mor-tality associated with congenital heart defects in the United States: trends and racial disparities, 1979-1997 . Circulation . 2001;103:2376–2381 .
27 . Pillutla P, Shetty KD, Foster E . Mortality associated with adult congenital heart disease: trends in the US population from 1979 to 2005 . Am Heart J . 2009;158:874–879 .
28 . Khairy P, Ionescu-Ittu R, Mackie AS, Abrahamowicz M, Pilote L, Marelli AJ . Changing mortality in congenital heart disease . J Am Coll Cardiol . 2010;56:1149–1157 .
29 . Oster ME, Strickland MJ, Mahle WT . Racial and ethnic disparities in post-operative mortality following congenital heart surgery . J Pediatr . 2011;159:222–226 .
30 . Gilboa SM, Salemi JL, Nembhard WN, Fixler DE, Correa A . Mortality resulting from congenital heart disease among children and adults in the United States, 1999 to 2006 . Circulation . 2010;122:2254–2263 .
31 . Ohye RG, Sleeper LA, Mahony L, Newburger JW, Pearson GD, Lu M, Goldberg CS, Tabbutt S, Frommelt PC, Ghanayem NS, Laussen PC, Rhodes JF, Lewis AB, Mital S, Ravishankar C, Williams IA, Dunbar-Mas-terson C, Atz AM, Colan S, Minich LL, Pizarro C, Kanter KR, Jaggers J, Jacobs JP, Krawczeski CD, Pike N, McCrindle BW, Virzi L, Gaynor JW; Pediatric Heart Network Investigators . Comparison of shunt types in the Norwood procedure for single-ventricle lesions . N Engl J Med . 2010;362:1980–1992 .
32 . The Society of Thoracic Surgeons (STS) National Database, Congenital Heart Surgery Database Participants . http://www .sts .org/sites/default/files/documents/DatabaseMap%20-%20CONGENITAL%2012 .31 .pdf . Accessed July 30, 2012 .
33 . The Society of Thoracic Surgeons . STS Congenital Heart Surgery Data Summary, July 2006 - June 2010 Procedures, All Patients . http://www .sts .org/sites/default/files/documents/STSCONG-AllPatientsSummary_Fall2010 .pdf . Accessed July 18, 2011 .
34 . The Society of Thoracic Surgeons . STS Congenital Heart Surgery Data Summary, July 2006 - June 2010 Procedures, Neonates (0 - 30 days) . http://www .sts .org/sites/default/files/documents/STSCONG-Neonates-Summary_Fall2010 .pdf . Accessed July 18, 2011 .
35 . The Society of Thoracic Surgeons . STS Congenital Heart Surgery Data Summary, July 2006 - June 2010 Procedures, Infants (31 days - 1 year) . http://www .sts .org/sites/default/files/documents/STSCONG-InfantsSum-mary_Fall2010 .pdf . Accessed July 18, 2011 .
36 . The Society of Thoracic Surgeons . STS Congenital Heart Surgery Data Summary, July 2006 - June 2010 Procedures, Children (>1 year to < 18 years) . http://www .sts .org/sites/default/files/documents/STSCONG-Chil-drenSummary_Fall2010 .pdf . Accessed July 18, 2011 .
37 . The Society of Thoracic Surgeons . STS Congenital Heart Surgery Data Summary, July 2006 - June 2010 Procedures, Adult (18 Years+) . http://www .sts .org/sites/default/files/documents/STSCONG-AdultsSummary_Fall2010 .pdf . Accessed July 18, 2011 .
38 . Karamlou T, Diggs BS, Person T, Ungerleider RM, Welke KF . National practice patterns for management of adult congenital heart disease: opera-tion by pediatric heart surgeons decreases in-hospital death . Circulation . 2008;118:2345–2352 .
39 . Russo C, Elixhauser A . Hospitalizations for Birth Defects, 2004. HCUP Statistical Brief No . 24 . Rockville, MD: US Agency for Healthcare
by guest on December 16, 2013http://circ.ahajournals.org/Downloaded from

Heart Disease and Stroke Statistics—2013 Update: Chapter 15 e157
Research and Quality; 2007 . http://www .hcup-us .ahrq .gov/reports/stat-briefs/sb24 .pdf . Accessed July 18, 2011 .
40 . Centers for Disease Control and Prevention (CDC) . Hospital stays, hospital charges, and in-hospital deaths among infants with selected birth defects: United States, 2003 . MMWR Morb Mortal Wkly Rep . 2007;56:25–29 .
41 . Dean PN, Hillman DG, McHugh KE, Gutgesell HP . Inpatient costs and charges for surgical treatment of hypoplastic left heart syndrome . Pediat-rics . 2011;128:e1181–e1186 .
42 . Pasquali SK, Sun JL, d’Almada P, Jaquiss RD, Lodge AJ, Miller N, Kem-per AR, Lannon CM, Li JS . Center variation in hospital costs for patients undergoing congenital heart surgery . Circ Cardiovasc Qual Outcomes . 2011;4:306–312 .
43 . Luca NJ, Yeung RS . Epidemiology and management of Kawasaki disease . Drugs . 2012;72:1029–1038 .
44 . Nakamura Y, Yashiro M, Uehara R, Sadakane A, Tsuboi S, Aoyama Y, Kotani K, Tsogzolbaatar EO, Yanagawa H . Epidemiologic features of Ka-wasaki disease in Japan: results of the 2009-2010 nationwide survey . J Epidemiol . 2012;22:216–221 .
45 . Uehara R, Belay ED . Epidemiology of Kawasaki disease in Asia, Europe, and the United States . J Epidemiol . 2012;22:79–85 .
46 . Holman RC, Belay ED, Christensen KY, Folkema AM, Steiner CA, Schonberger LB . Hospitalizations for Kawasaki syndrome among chil-dren in the United States, 1997-2007 . Pediatr Infect Dis J . 2010;29: 483–488 .
47 . Holman RC, Christensen KY, Belay ED, Steiner CA, Effler PV, Miyamura J, Forbes S, Schonberger LB, Melish M . Racial/ethnic differences in the incidence of Kawasaki syndrome among children in Hawaii . Hawaii Med J . 2010;69:194–197 .
48 . Kobayashi T, Saji T, Otani T, Takeuchi K, Nakamura T, Arakawa H, Kato T, Hara T, Hamaoka K, Ogawa S, Miura M, Nomura Y, Fuse S, Ichida F, Seki M, Fukazawa R, Ogawa C, Furuno K, Tokunaga H, Takatsuki S, Hara S, Morikawa A; RAISE Study Group Investigators . Efficacy of immuno-globulin plus prednisolone for prevention of coronary artery abnormali-ties in severe Kawasaki disease (RAISE study): a randomised, open-label, blinded-endpoints trial . Lancet . 2012;379:1613–1620 .
49 . Sands AJ, Casey FA, Craig BG, Dornan JC, Rogers J, Mulholland HC . Incidence and risk factors for ventricular septal defect in “low risk” neo-nates . Arch Dis Child Fetal Neonatal Ed . 1999;81:F61–F63 .
50 . Larson EW, Edwards WD . Risk factors for aortic dissection: a necropsy study of 161 cases . Am J Cardiol . 1984;53:849–855 .
Table 15.1. Congenital Cardiovascular Defects
Population Group Estimated Prevalence, 2002, All Ages Mortality, 2009, All Ages Hospital Discharges, 2009, All Ages
Both sexes 650 000 to 1.3 million14 3189 52 000
Males … 1754 (55.0%)* 25 000
Females … 1435 (45.0%)* 27 000
NH white males … 1370 …
NH white females … 1086 …
NH black males … 304 …
NH black females … 268 …
Asian … 126 …
American Indian/Alaska Native … 35 …
Ellipses (…) indicate data not available; NH, non-Hispanic.*These percentages represent the portion of total congenital cardiovascular mortality that is for males vs females.Sources: Mortality: Centers for Disease Control and Prevention/National Center for Health Statistics, 2009 Mortality Multiple Cause—United States, version July
19, 2012. These data represent underlying cause of death only; data include Hispanics. Hospital discharges: National Hospital Discharge Survey, National Center for Health Statistics; data include those inpatients discharged alive, dead, or status unknown.
Table 15.2. Annual Birth Prevalence of Congenital Cardiovascular Defects in the United States1,4,7,12,49,50
Type of Presentation Rate per 1000 Live BirthsEstimated Number (Variable With
Yearly Birth Rate
Fetal loss Unknown Unknown
Invasive procedure during the first year 2.4 9200
Detected during first year* 8 36 000
Bicuspid aortic valve 13.7 54 800
*Includes stillbirths and pregnancy termination at <20 weeks’ gestation; includes some defects that resolve spontaneously or do not require treatment.
by guest on December 16, 2013http://circ.ahajournals.org/Downloaded from

e158 Circulation January 1/8, 2013
Table 15.4. Surgery for Congenital Heart Disease
Sample Population, Weighted
Surgery for congenital heart disease 14 888 25 831
Deaths 736 1253
Mortality rate, % 4.9 4.8
By sex (81 missing in sample)
Male 8127 14 109
Deaths 420 714
Mortality rate, % 5.2 5.1
Female 6680 11 592
Deaths 315 539
Mortality rate, % 4.7 4.6
By type of surgery
ASD secundum surgery 834 1448
Deaths 3 6
Mortality rate, % 0.4 0.4
Norwood procedure for HPLHS 161 286
Deaths 42 72
Mortality rate, % 26.1 25.2
ASD indicates atrial septal defect; HPLHS, hypoplastic left heart syndrome.In 2003, 25 000 cardiovascular operations for congenital cardiovascular defects were performed on
children <20 years of age. Inpatient mortality rate after all types of cardiac surgery was 4.8%. Neverthe-less, mortality risk varies substantially for different defect types, from 0.4% for ASD repair to 25.2% for first-stage palliation for HPLHS. Fifty-five percent of operations were performed in males. In unadjusted analysis, mortality after cardiac surgery was somewhat higher for males than for females (5.1% vs 4.6%).
Source: Analysis of 2003 Kids’ Inpatient Database38 and personal communication with Kathy Jenkins, MD, Children’s Hospital of Boston, MA, October 1, 2006.
Table 15.3. Estimated Prevalence of Congenital Cardiovascular Defects and Percent Distribution by Type, United States, 2002* (in Thousands)
Prevalence, n Percent of Total
Type Total Children Adults Total Children Adults
Total 994 463 526 100 100 100
VSD† 199 93 106 20.1 20.1 20.1
ASD 187 78 109 18.8 16.8 20.6
Patent ductus arteriosus 144 58 86 14.2 12.4 16.3
Valvular pulmonic stenosis 134 58 76 13.5 12.6 14.4
Coarctation of aorta 76 31 44 7.6 6.8 8.4
Valvular aortic stenosis 54 25 28 5.4 5.5 5.2
TOF 61 32 28 6.1 7 5.4
AV septal defect 31 18 13 3.1 3.9 2.5
TGA 26 17 9 2.6 3.6 1.8
Hypoplastic right heart syndrome 22 12 10 2.2 2.5 1.9
Double-outlet right ventricle 9 9 0 0.9 1.9 0.1
Single ventricle 8 6 2 0.8 1.4 0.3
Anomalous pulmonary venous connection 9 5 3 0.9 1.2 0.6
Truncus arteriosus 9 6 2 0.7 1.3 0.5
HPLHS 3 3 0 0.3 0.7 0
Other 22 12 10 2.1 2.6 1.9
VSD indicates ventricular septal defect; ASD, atrial septal defect; TOF, tetralogy of Fallot; AV, atrioventricular; TGA, transposition of the great arteries; and HPLHS, hypoplastic left heart syndrome.
*Excludes an estimated 3 million bicuspid aortic valve prevalence (2 million in adults and 1 million in children).†Small VSD, 117 000 (65 000 adults and 52 000 children); large VSD, 82 000 (41 000 adults and 41 000 children).Source: Reprinted from Hoffman et al,14 with permission from Elsevier. Average of the low and high estimates, two thirds from low estimate.14
by guest on December 16, 2013http://circ.ahajournals.org/Downloaded from
Heart Disease and Stroke Statistics—2013 Update: Chapter 16 e159
16. Disorders of Heart Rhythm
See Table 16-1.
BradyarrhythmiasICD-9 426.0, 426.1, 427.81; ICD-10 I44.0 to I44.3, I49.5.Mortality—791 . Any-mention mortality—4678 . Hospital dis-charges—110 000 .
AV Block
Prevalence and Incidence
●● The prevalence of first-degree AV block in NHANES III is 3 .7% (313 of 8434 participants with electrocardiographic data readable for PR interval) .1
●● In a healthy sample of subjects from the ARIC study (mean age 53 years), the prevalence of first-degree AV block was 7 .8% in black men, 3 .0% in black women, 2 .1% in white men, and 1 .3% in white women .2 Lower prevalence estimates were noted in the relatively younger population (mean age 45 years) of the CARDIA study at its year 20 follow-up examination: 2 .6% in black men, 1 .9% in black women, 1 .2% in white men, and 0 .1% in white women .2
●● Mobitz II second-degree AV block is rare in healthy indi-viduals (≈0 .003%), whereas Mobitz I (Wenckebach) is observed in 1% to 2% of healthy young people, especially during sleep .3
●● The prevalence of third-degree AV block in the general adult population is ≈0 .02% to 0 .04% .4,5
●● Third-degree AV block is very rare in apparently healthy individuals . Johnson et al6 found only 1 case among >67 000 symptom-free individuals; Rose et al,7 in their study of
>18 000 civil servants, did not find any cases . On the other hand, among 293 124 patients with DM and 552 624 with hypertension enrolled with Veterans Health Administration hospitals, third-degree AV block was present in 1 .1% and 0 .6% of those patients, respectively .8
●● Congenital complete AV block is estimated to occur in 1 of 15 000 to 25 000 live births .3
Risk Factors
●● Although first-degree AV block and Mobitz type I second-degree AV block can occur in apparently healthy individu-als, presence of Mobitz II second-degree or third-degree AV block usually indicates underlying HD, including CHD and HF .3
●● Reversible causes of AV block include electrolyte abnor-malities, drug-induced AV block, perioperative AV block attributable to hypothermia, or inflammation near the AV conduction system after surgery in this region . Some con-ditions may warrant pacemaker implantation because of the possibility of disease progression even if the AV block reverses transiently (eg, sarcoidosis, amyloidosis, and neu-romuscular diseases) .9
●● Long sinus pauses and AV block can occur during sleep apnea . In the absence of symptoms, these abnormalities are reversible and do not require pacing .10
Prevention
●● Detection and correction of reversible causes of acquired AV block could be of potential importance in preventing symptomatic bradycardia and other complications of AV block .9
Abbreviations Used in Chapter 16
AED automated external defibrillator HCM hypertrophic cardiomyopathy
AHA American Heart Association HD heart disease
AF atrial fibrillation HF heart failure
AMI acute myocardial infarction HR hazard ratio
ARIC Atherosclerosis Risk in Communities study ICD-9 International Classification of Diseases, 9th Revision
AV atrioventricular ICD-10 International Classification of Diseases, 10th Revision
BMI body mass index MI myocardial infarction
BP blood pressure NCHS National Center for Health Statistics
CABG cardiac revascularization (coronary artery bypass graft) NHANES National Health and Nutrition Examination Survey
CAD coronary artery disease NHDS National Hospital Discharge Survey
CARDIA Coronary Artery Risk Development in Young Adults NHLBI National Heart, Lung, and Blood Institute
CHD coronary heart disease OR odds ratio
CHS Cardiovascular Health Study PA physical activity
CI confidence interval PAR population attributable risk
CKD chronic kidney disease PVT polymorphic ventricular tachycardia
CVD cardiovascular disease RR relative risk
DM diabetes mellitus SBP systolic blood pressure
ECG electrocardiogram SNP single nucleotide polymorphism
ED emergency department SVT supraventricular tachycardia
EMS emergency medical services TdP torsade de pointes
FHS Framingham Heart Study VF ventricular fibrillation
GWTG Get With The Guidelines VT ventricular tachycardia
by guest on December 16, 2013http://circ.ahajournals.org/Downloaded from

e160 Circulation January 1/8, 2013
●● In utero detection of congenital AV block is possible by echocardiography .11
Aftermath
●● In the FHS, PR interval prolongation (>200 ms) was associ-ated with an increased risk of AF (HR, 2 .06; 95% CI, 1 .36–3 .12),12,13 pacemaker implantation (HR, 2 .89; 95% CI, 1 .83–4 .57),13 and all-cause mortality (HR, 1 .44; 95% CI, 1 .09–1 .91) .13 Compared with individuals with a PR ≤200 ms, individuals with PR interval >200 ms had an absolute increased risk per year of 1 .04% for AF, 0 .55% for pace-maker implantation, and 2 .05% for death .
●● Patients with abnormalities of AV conduction may be asymptomatic or may experience serious symptoms related to bradycardia, ventricular arrhythmias, or both .
●● Decisions about the need for a pacemaker are influenced by the presence or absence of symptoms directly attribut-able to bradycardia . Permanent pacing improves survival in patients with third-degree AV block, especially if syncope has occurred .9 Nevertheless, the overall prognosis depends to a large extent on the underlying HD .
●● Although there is little evidence to suggest that pacemak-ers improve survival in patients with isolated first-degree AV block,14 it is now recognized that marked first-degree AV block (PR >300 ms) can lead to symptoms even in the absence of higher degrees of AV block .15
Prognosis
●● Investigators at Northwestern University compared older adult (age >60 years) outpatients with (n=470) and without (n=2090) asymptomatic bradycardia . Over a mean follow-up of 7 .2 years, patients with asymptomatic bradycardia had a higher adjusted incidence of pacemaker insertion (HR, 2 .14; 95% CI, 1 .30–3 .51; P=0 .003), which appeared after a lag time of 4 years . However, the absolute rate of pacemaker implantation was low (<1% per year), and asymptomatic bradycardia was not associated with a higher risk of death .16
Sinus Node Dysfunction
Prevalence and Incidence
●● The prevalence of sinus node dysfunction has been esti-mated to be between 403 and 666 per million, with an inci-dence rate of 63 per million per year requiring pacemaker therapy .17
●● Sinus node dysfunction occurs in 1 of every 600 cardiac patients >65 years of age and accounts for ≈50% of implan-tations of pacemakers in the United States .18,19
●● Sinus node dysfunction is commonly present with other causes of bradyarrhythmias (carotid sinus hypersensitivity in 33% of patients and advanced AV conduction abnormali-ties in 17%) .20,21
Risk Factors
●● The causes of sinus node dysfunction can be classified as intrinsic (secondary to pathological conditions involving the sinus node) or extrinsic (caused by depression of sinus node function by external factors such as drugs or auto-nomic influences) .22
●● Sinus node dysfunction may occur at any age but is pri-marily a disease of the elderly, with the average being ≈68 years of age .18
●● Idiopathic degenerative disease is probably the most com-mon cause of sinus node dysfunction .23
●● Collected data from 28 different studies on atrial pacing for sinus node dysfunction showed a median annual incidence of complete AV block of 0 .6% (range, 0%–4 .5%) with a total prevalence of 2 .1% (range, 0%–11 .9%) . This suggests that the degenerative process also affects the specialized conduction system, although the rate of progression is slow and does not dominate the clinical course of disease .24
●● Ischemic HD can be responsible for one third of cases of sinus node dysfunction . Transient sinus node dysfunction can complicate MI, which is common during inferior MI, and is caused by autonomic influences . Cardiomyopathy, long-standing hypertension, infiltrative disorders (eg, amy-loidosis and sarcoidosis), collagen vascular disease, and surgical trauma can also result in sinus node dysfunction .25,26
Aftermath
●● The course of sinus node dysfunction is typically progres-sive, with 57% of patients experiencing symptoms over a 4-year period if untreated, and a 23% prevalence of syn-cope over the same time frame .27
●● Approximately 50% of patients with sinus node dysfunc-tion develop tachy-brady syndrome over a lifetime; such patients have a higher risk of stroke and death . The survival of patients with sinus node dysfunction appears to depend primarily on the severity of underlying cardiac disease and is not significantly changed by pacemaker therapy .28–30
●● In a retrospective study,31 patients with sinus node dys-function who had pacemaker therapy were followed up for 12 years; at 8 years, mortality among those with ven-tricular pacing was 59% compared with 29% among those with atrial pacing . This discrepancy may be attributed to selection bias . For instance, the physiological or anatomic disorder (eg, fibrosis of conductive tissue) that led to the requirement for the particular pacemaker may have influ-enced prognosis, rather than the type of pacemaker used .
●● The incidence of sudden death is extremely low, and sinus node dysfunction does not appear to affect survival whether untreated or treated with pacemaker therapy .9
●● Supraventricular tachycardia (SVT) including AF occurs in 47% to 53% of patients with sinus node dysfunction .30,32
●● On the basis of records from the NHDS, age-adjusted pace-maker implantation rates increased progressively from 370 per million in 1990 to 612 per million in 2002 . This escalat-ing implantation rate is attributable to increasing implan-tation for isolated sinus node dysfunction; implantation for sinus node dysfunction increased by 102%, whereas implantation for all other indications did not increase .33
SVT (Excluding AF and Atrial Flutter)ICD-9 427.0; ICD-10 I47.1.Mortality—130 . Any-mention mortality—1220 . Hospital dis-charges—23 000 .
Prevalence and Incidence
●● Data from the Marshfield Epidemiologic Study Area in Wis-consin suggested the incidence of documented paroxysmal
by guest on December 16, 2013http://circ.ahajournals.org/Downloaded from

Heart Disease and Stroke Statistics—2013 Update: Chapter 16 e161
SVT is 35 per 100 000 person-years . The mean age at SVT onset was 57 years, and both female sex and age >65 years were significant risk factors .34
●● A review of ED visits from 1993 to 2003 revealed that 550 000 visits were for SVT (0 .05% of all visits; 95% CI, 0 .04%–0 .06%), or ≈50 000 visits per year . Of these patients, 24% (95% CI, 15%–34%) were admitted to the hospital, and 44% (95% CI, 32%–56%) were discharged without specific follow-up .35
●● The prevalence of SVT that is clinically undetected is likely much greater than the estimates from ED visits and elec-trophysiology procedures would suggest . For example, among a random sample of 604 participants in Finland, 7 (1 .2%) fulfilled the diagnostic criteria for inappropriate sinus tachycardia .36
●● Of 1383 participants in the Baltimore Longitudinal Study of Aging undergoing maximal exercise testing, 6% exhib-ited SVT during the test; increasing age was a significant risk factor . Only 16% exhibited >10 beats of SVT, only 4% were symptomatic, and the SVT participants were more likely to develop spontaneous SVT or AF .37
●● From the surface ECG, the prevalence of atrial tachycar-dia is estimated to be 0 .34% in asymptomatic patients and 0 .46% in symptomatic patients .38
Aftermath
●● The primary consequence of SVT for the majority of patients is a decline in quality of life .39 However, rare cases of incessant SVT can lead to a tachycardia-induced cardio-myopathy,40 and rare cases of sudden death attributed to SVT as a trigger have been described .41
Specific Types
●● Among those presenting for invasive electrophysiologi-cal study and ablation, AV nodal reentrant tachycardia (a circuit that requires 2 AV nodal pathways) is the most common mechanism of SVT42,43 and usually represents the majority of cases (56% of 1 series of 1754 cases from Loyola University Medical Center) .43
●● AV reentrant tachycardia (an arrhythmia that requires the presence of an extranodal connection between the atria and ventricles or specialized conduction tissue) is the second most common42,43 (27% in the Loyola series43), and atrial tachycardia is the third most common (17% in the Loyola series43) .
●● In the pediatric population, AV reentrant tachycardia is the most common SVT mechanism, followed by AV nodal reentrant tachycardia and then atrial tachycardia .44
●● AV reentrant tachycardia prevalence decreases with age, whereas AV nodal reentrant tachycardia and atrial tachy-cardia prevalences increase with advancing age .43
●● The majority of AV reentrant tachycardia patients in the Loyola series were men (55%), whereas the majority of patients with AV nodal reentrant tachycardia (70%) or atrial tachycardia (62%) were women .43
●● Multifocal atrial tachycardia is an arrhythmia that is com-monly confused with AF and is characterized by 3 distinct P-wave morphologies, irregular R-R intervals, and a rate >100 beats per minute . It is uncommon in both children45 and adults,46 with a prevalence in hospitalized adults esti-mated at 0 .05% to 0 .32% .46,47 The average age in adults is
70 to 72 years . Adults with multifocal atrial tachycardia have a mortality rate that is high, with estimates around 45%, but this is generally ascribed to the underlying condition(s) .46,47
Wolff-Parkinson-White Syndrome
●● Wolff-Parkinson-White syndrome, a diagnosis reserved for those with both ventricular preexcitation (evidence of an anterograde conducting AV accessory pathway on a 12-lead ECG) and tachyarrhythmias,39 deserves special attention because of the associated risk of sudden death . Sudden death is generally attributed to rapid heart rates in AF conducting down an accessory pathway and leading to ventricular fibrillation (VF) .48,49 Of note, AF is common in Wolff-Parkinson-White patients, and surgical or catheter ablation of the accessory pathway often results in elimina-tion of the AF .50
●● Ventricular preexcitation with or without tachyarrhythmia was observed in 0 .11% of 47 358 ECGs in adults partici-pating in 4 large Belgian epidemiological studies51 and in 0 .17% of 32 837 Japanese high school students in ECGs obtained by law before the students entered school .52
●● Asymptomatic adults with ventricular preexcitation appear to be at no increased risk of sudden death compared with the general population,53–56 although certain characteristics found during invasive electrophysiological study (including inducibility of AV reentrant tachycardia or AF, accessory pathway refractory period, and the shortest R-R interval during AF) can help risk stratify these patients .49,57
●● In a meta-analysis of 20 studies involving 1869 asymp-tomatic patients with a Wolff-Parkinson-White ECG pat-tern followed up for a total of 11 722 person-years, the risk of sudden death in a random effects model that was used because of heterogeneity across studies was estimated to be 1 .25 (95% CI, 0 .57–2 .19) per 1000 person-years . Risk factors for sudden death included male sex, inclusion in a study of children (<18 years of age), and inclusion in an Italian study .58
●● Symptomatic adult patients with the Wolff-Parkinson-White syndrome are at a higher risk of sudden death . In a study of 60 symptomatic patients in Olmsted County, Min-nesota, including some who underwent curative surgery, 2 (3 .3%) experienced sudden death over a 13-year period . Of 690 Wolff-Parkinson-White syndrome patients referred to a single hospital in the Netherlands, 15 (2 .2%) had aborted sudden death, and VF was the first manifestation of the dis-ease in 8 patients .59
●● Of 379 Wolff-Parkinson-White patients with induced AV reentrant tachycardia during electrophysiology study who did not undergo ablation, 29 (8%) exhibited a “malignant presentation” over a mean 3 .6 years of follow-up: syncope/presyncope in 25 patients, rapid preexcited AF causing hemodynamic collapse in 3 patients, and VF in 1 patient .60 Those with such a presentation were more often male, had a shorter accessory pathway effective refractory period during electrophysiology study, more often had AV reentrant tachycardia that triggered AF during electrophysiology study, and more often had >1 accessory pathway .
●● Although some studies in asymptomatic children with ven-tricular preexcitation suggest a benign prognosis,55,61 oth-ers suggest that electrophysiological testing can identify a
by guest on December 16, 2013http://circ.ahajournals.org/Downloaded from

e162 Circulation January 1/8, 2013
group of asymptomatic children with a risk of sudden death or VF as high as 11% over 19 months of follow-up .62
Subclinical Atrial TachyarrhythmiasPacemakers and defibrillators have increased clinician aware-ness of the frequency of subclinical AF and atrial high-rate episodes in individuals without a documented history of AF . Several studies have suggested that device-detected high-rate atrial tachyarrhythmias are surprisingly frequent and are asso-ciated with an increased risk of AF,63 thromboembolism,63,64 and total mortality .63
●● Investigators in the ASSERT study (Asymptomatic Atrial Fibrillation and Stroke Evaluation in Pacemaker Patients and the Atrial Fibrillation Reduction Atrial Pacing Trial) prospectively enrolled 2580 patients with a recent pace-maker or defibrillator implantation who were ≥65 years of age, had a history of hypertension, and had no history of AF . They classified individuals by presence versus absence of subclinical atrial tachyarrhythmias (defined as atrial rate >190 beats per minute for >6 minutes in the first 3 months) and conducted follow-up for 2 .5 years .65 Subclinical atrial tachyarrhythmias in the first 3 months occurred in 10 .1% of the patients and were associated with the following:
●― An almost 6-fold higher risk of clinical AF (HR, 5 .56; 95% CI, 3 .78–8 .17; P<0 .001)
●― A more than doubling in the adjusted risk of the primary end point, ischemic stroke or systemic embolism (HR, 2 .50; 95% CI, 1 .28–4 .89; P<0 .008)
●― An annual ischemic stroke or systemic embolism rate of 1 .69% (versus 0 .69% in those without)
●― A 13% PAR for ischemic stroke or systemic embolism
●● Over the subsequent 2 .5 years of follow-up, an additional 34 .7% of the patients had subclinical atrial tachyarrhyth-mias, which were 8-fold more frequent than clinical AF episodes .
●● The appropriate therapy of subclinical atrial tachyarrhyth-mias has not been rigorously studied .
AF and Atrial FlutterICD-9 427.3; ICD-10 I48.
Prevalence
●● Estimates of the prevalence of AF in the United States ranged from ≈2 .7 to 6 .1 million in 2010, and AF preva-lence is expected to rise to between ≈5 .6 and 12 million in 2050 .66,67
●● Data from a California health plan suggest that compared with whites, blacks (OR, 0 .49; 95% CI, 0 .47–0 .52), Asians (OR, 0 .68; 95% CI, 0 .64–0 .72), and Hispanics (OR, 0 .58; 95% CI, 0 .55–0 .61) have significantly lower adjusted prev-alences of AF .68
●● Data from the NHDS/NCHS (1996–2001) on cases that included AF as a primary discharge diagnosis found the following:
●― Approximately 44 .8% of patients were men .●― The mean age for men was 66 .8 years versus 74 .6 years for women .
●― The racial breakdown for admissions was 71 .2% white, 5 .6% black, and 2 .0% other races (20 .8% were not specified) .
●― Black patients were much younger than patients of other races .
●● Among Medicare patients aged ≥65 years, diagnosed from 1993 to 2007, the prevalence of AF increased ≈5% per year, from ≈41 .1 per 1000 beneficiaries to 85 .5 per 1000 beneficiaries .69
Incidence
●● Data from the NHDS/NCHS (1996–2001) on cases that included AF as a primary discharge diagnosis found the following:
●― The incidence in men ranged from 20 .6 per 100 000 people per year for patients between 15 and 44 years of age to 1077 .4 per 100 000 people per year for patients ≥85 years of age .
●― In women, the incidence ranged from 6 .6 per 100 000 people per year for patients between 15 and 44 years of age to 1203 .7 per 100 000 people per year for those ≥85 years of age .
●● In Olmsted County, Minnesota:
●― The age-adjusted incidence of clinically recognized AF in a white population increased by 12 .6% between 1980 and 2000 .67,70
●― The incidence of AF was greater in men (incidence ratio for men over women 1 .86) and increased markedly with older age .67
●● In a Medicare sample, the incidence of AF was ≈28 per 1000 person-years and did not change substantively between 1993 and 2007 . Of individuals with incident AF in 2007, ≈55% were women, 91% were white, 84% had hypertension, 36% had HF, and 30% had cerebrovascular disease .69
Mortality
●● In 2009, AF was mentioned on 100 196 US death cer-tificates and was the underlying cause in 15 434 of those deaths (NCHS, NHLBI) .
●● In adjusted analyses from the FHS, AF was associated with an increased risk of death in both men (OR, 1 .5; 95% CI, 1 .2–1 .8) and women (OR, 1 .9; 95% CI, 1 .5–2 .2) .71 Furthermore, there was an interaction with sex, such that AF appeared to diminish the survival advantage typically observed in women .
●● In Medicare beneficiaries ≥65 years of age with new-onset AF, mortality decreased modestly but significantly between 1993 and 2007 . In 2007, the age- and sex-adjusted mortality at 30 days was 11%, and at 1 year, it was 25% .69
●● A study of >4600 patients diagnosed with first AF showed that risk of death within the first 4 months after the AF diag-nosis was high . The most common causes of CVD death were CAD, HF, and ischemic stroke, which accounted for 22%, 14%, and 10%, respectively, of the early deaths (within the first 4 months) and 15%, 16%, and 7%, respec-tively, of the late deaths .70
by guest on December 16, 2013http://circ.ahajournals.org/Downloaded from
Heart Disease and Stroke Statistics—2013 Update: Chapter 16 e163
●● AF is also associated with mortality in individuals with other cardiovascular conditions and procedures, includ-ing HF,72,73 MI,74,75 CABG,76,77 and stroke,78 and with non-cardiovascular conditions such as sepsis79 and noncardiac surgery .80
Lifetime Risk and Cumulative Risk
●● Participants in the NHLBI-sponsored FHS study were fol-lowed up from 1968 to 1999 . At 40 years of age, remain-ing lifetime risks for AF were 26 .0% for men and 23 .0% for women . At 80 years of age, lifetime risks for AF were 22 .7% for men and 21 .6% for women . In further analysis, counting only those who had development of AF without prior or concurrent HF or MI, lifetime risk for AF was ≈16% .81
●● By 80 years of age, investigators from the NHLBI-spon-sored ARIC study observed that the cumulative risk of AF was 21% in white men, 17% in white women, and 11% in African Americans of both sexes .82
Risk Factors
●● Standard risk factors
●― Both ARIC83 and FHS (http://www .framinghamheart study .org/risk/atrial .html)12,84 have developed risk pre-diction models to predict new-onset AF . Predictors of increased risk of new-onset AF include advancing age, European ancestry, body size (greater height and BMI), electrocardiography features (left ventricular hypertro-phy, left atrial enlargement), DM, BP (SBP and hyper-tension treatment), and presence of CVD (CHD, HF, valvular HD) .
●― Other consistently reported risk factors for AF include clinical and subclinical hyperthyroidism,85,86 CKD,87 and heavy alcohol consumption .88
●● Family history
●― Although unusual, early-onset familial lone AF has long been recognized as a risk factor .89,90
●― In the past decade, the heritability of AF in the com-munity has been appreciated . In studies from the FHS:
●◯ Adjusted for coexistent risk factors, having at least 1 parent with AF was associated with a 1 .85-fold increased risk of AF in the adult offspring (multivari-able-adjusted 95% CI, 1 .12–3 .06; P=0 .02) .91
●◯ A history of a first-degree relative with AF also was associated with an increased risk of AF (HR, 1 .40; 95% CI, 1 .13–1 .74) .76 The risk was greater if the first-degree relative’s age of onset was ≤65 years (HR, 2 .01; 95% CI, 1 .49–2 .71) and with each additional affected first-degree relative (HR, 1 .24; 95% CI, 1 .05–1 .46) .92
●● Genetics
●― Mutations in genes coding channels (sodium and potas-sium), gap junction proteins, and signaling have been described, often in lone AF or familial AF series, but they are responsible for few cases of AF in the community .93
●― Meta-analyses of genome-wide association studies have revealed SNPs on chromosomes 4q25 (upstream of
PITX2),94–96 16q22 (ZFHX3),95,97 and 1q21 (KCNN3),96 as well as 6 other novel susceptibility loci (near PRRX1, CAV1, C9orf3, SYNPO2L, SYNE2, and HCN4) .98 Although an area of intensive inquiry, the causative SNPs and the functional basis of the associations have not been revealed .
Awareness
●● In a US national biracial study of individuals with AF, com-pared with whites, blacks had approximately one third the likelihood (OR, 0 .32; 95% CI, 0 .20–0 .52) of being aware that they had AF .99
Prevention
●● Data from the ARIC study indicated that having at least 1 elevated risk factor explained 50% and having at least 1 borderline risk factor explained 6 .5% of incident AF cases . The estimated overall incidence rate per 1000 person-years at a mean age of 54 .2 years was 2 .19 for those with optimal risk, 3 .68 for those with borderline risk, and 6 .59 for those with elevated risk factors .100
●● Hypertension accounted for ≈14%101 to 22%100 of AF cases .●● Observational data from the CHS suggested that moderate-
intensity exercise (such as regular walking) was associated with a lower risk of AF (HR, 0 .72) .102 However, data from many studies suggested that vigorous-intensity exercise 5 to 7 days a week was associated with a slightly increased risk of AF (HR, 1 .20; P=0 .04) .103
●● Meta-analyses have suggested that renin-angiotensin sys-tem blockers may be useful in primary and secondary (recurrences) prevention of AF in trials of hypertension, after MI, in HF, and after cardioversion .104,105 However, the studies were primarily secondary or post hoc analyses, and the results were fairly heterogeneous . Recently, in an analysis of the EMPHASIS-HF trial (Eplerenone in Mild Patients Hospitalization And SurvIval Study in Heart Fail-ure), in one of many secondary outcomes, eplerenone was nominally observed to reduce the incidence of new-onset AF .106
●● Although heterogeneous in their findings, modest-sized short-term studies suggested that the use of statins might prevent AF; however, larger longer-term studies do not pro-vide support that statins are effective in AF prevention .107
●● The NHLBI sponsored a workshop highlighting important research areas to advance the prevention of AF .108
Aftermath
●● Hospitalization
●― Hospital discharges—479 000
●◯ From 1996 to 2001, hospitalizations with AF as the first-listed diagnosis increased by 34% .109
●◯ On the basis of Medicare and MarketScan databases, annually, individuals with AF (37 .5%) are approxi-mately twice as likely to be hospitalized as age- and sex-matched control subjects (17 .5%) .110
●● Stroke
●― Stroke rates per 1000 patient-years declined in AF patients taking anticoagulants, from 46 .7 in 1992 to 19 .5
by guest on December 16, 2013http://circ.ahajournals.org/Downloaded from

e164 Circulation January 1/8, 2013
in 2002, for ischemic stroke but remained fairly steady for hemorrhagic stroke (1 .6–2 .9) .111
●― When standard stroke risk factors were accounted for, AF was associated with a 4- to 5-fold increased risk of ischemic stroke .112
●― Although the RR of stroke associated with AF did not vary (≈3–5-fold increased risk) substantively with advancing age, the proportion of strokes attributable to AF increased significantly . In FHS, AF accounted for ≈1 .5% of strokes in individuals 50 to 59 years of age and ≈23 .5% in those 80 to 89 years of age .112
●― Paroxysmal, persistent, and permanent AF all appeared to increase the risk of ischemic stroke to a similar degree .113
●― AF was also an independent risk factor for ischemic stroke severity, recurrence, and mortality .78 In one study, people who had AF and were not treated with anticoagulants had a 2 .1-fold increase in risk for recurrent stroke and a 2 .4-fold increase in risk for recurrent severe stroke .114
●― Studies have demonstrated an underutilization of war-farin therapy . In a recent meta-analysis, men and indi-viduals with prior stroke were more likely to receive warfarin, whereas factors associated with lower use included alcohol and drug abuse, noncompliance, war-farin contraindications, dementia, falls, both gastroin-testinal and intracranial hemorrhage, renal impairment, and advancing age .115
●● Cognition
●― Individuals with AF have an adjusted 2-fold increased risk of dementia .116
●― A meta-analysis suggested that the risk was consistently high in the 7 studies of patients with recent stroke and a history of AF (OR, 2 .4; 95% CI, 1 .7–3 .5; P<0 .001; I2=87%) . There was significant heterogeneity in the 7 studies of individuals without a history of stroke (OR, 1 .6; 95% CI, 1 .0–2 .7; P=0 .05; I2=87%) .117
●― In individuals with AF in Olmsted County, Minnesota, the cumulative rate of dementia at 1 and 5 years was 2 .7% and 10 .5%, respectively .97
●● Heart failure
●― AF and HF share many antecedent risk factors, and ≈40% of individuals with either AF or HF will develop the other condition .72
●― In the community, estimates of the incidence of HF in individuals with AF ranged from ≈3 .372 to 4 .4118 per 100 person-years of follow-up .
CostInvestigators examined Medicare and MarketScan databases (2004–2006) to estimate costs attributed to AF in 2008 US dollars:
●● Annual total direct costs for AF patients were ≈$20 670 versus ≈$11 965 in the control group, for an incremental per-patient cost of $8705 .110
●● Extrapolating to the US population, it is estimated that the incremental cost of AF was ≈$26 billion, of which $6 bil-lion was attributed to AF, $9 .9 billion to other cardiovascular expenses, and $10 .1 billion to noncardiovascular expenses .110
TachycardiaICD-9 427.0, 1, 2; ICD-10 I47.0, I47.1, I47.2, I47.9.Mortality—607 . Any-mention mortality—5902 . Hospital dis-charges—78 000 .
Monomorphic Ventricular Tachycardia
Prevalence and Incidence
●● Of 150 consecutive patients with wide-complex tachycar-dia subsequently studied by invasive electrophysiologi-cal study, 122 (81%) had ventricular tachycardia (VT; the remainder had SVT) .119
●● Of patients with ventricular arrhythmias presenting for invasive electrophysiological studies, 11% to 21% had no structural HD, and the majority of those with structural HD had CAD .120,121
●● In 634 patients with implantable cardioverter-defibrillators who had structural HD (including both primary and sec-ondary prevention patients) followed up for a mean 11±3 months, ≈80% of potentially clinically relevant ventricu-lar tachyarrhythmias were attributable to VT amenable to antitachycardia pacing (implying a stable circuit and therefore monomorphic VT) .122 Because therapy may have been delivered before spontaneous resolution occurred, the proportion of these VT episodes with definite clinical rel-evance is not known .
●● Of those with VT in the absence of structural HD, right ventricular outflow tract VT is the most common form .123
Aftermath
●● Although the prognosis of those with VT or frequent pre-mature ventricular contractions in the absence of structural HD is good,120,123 a potentially reversible cardiomyopathy may develop in patients with very frequent premature ven-tricular contractions,124,125 and some cases of sudden death attributable to short-coupled premature ventricular contrac-tions have been described .126,127
Polymorphic VT
Prevalence and Incidence
●● The true prevalence and incidence of polymorphic VT (PVT) in the US general population is not known .
●● During ambulatory cardiac monitoring, PVT prevalence ranged from 0 .01% to 0 .15%128,129; however, among patients who developed sudden cardiac death during ambulatory cardiac monitoring, PVT was detected in 30% to 43% .129–131
●● A prevalence range of 15% to 19% was reported during electrophysiological study in patients resuscitated from cardiac arrest .131–133
●● In the setting of AMI, the prevalence of PVT ranged from 1 .2% to 2% .134,135
●● Out-of-hospital PVT is estimated to be present in ≈25% of all cardiac arrest cases involving VT .136,137
Risk Factors
●● PVT in the setting of a normal QT interval is most fre-quently seen in the context of acute ischemia or MI .135,138
●● Less frequently, PVT with a normal QT interval can occur in patients without apparent structural HD . Catecholaminergic
by guest on December 16, 2013http://circ.ahajournals.org/Downloaded from

Heart Disease and Stroke Statistics—2013 Update: Chapter 16 e165
PVT, which is discussed under inherited arrhythmic syn-dromes, is one such disorder .
●● A prolonged QT, whether acquired (drug induced) or con-genital, is a common cause of PVT . Drug-induced prolon-gation of QT causing PVT is discussed under torsade de pointes (TdP), whereas congenital prolonged QT is dis-cussed under inherited arrhythmic syndromes .
Aftermath
●● The presentation of PVT can range from a brief, asymp-tomatic, self-terminating episode to recurrent syncope or sudden cardiac death .139
●● The overall hospital discharge rate (survival) of PVT has been estimated to be ≈28% .140
Prevention
●● Prompt detection and correction of myocardial ischemia would potentially minimize the risk of PVT with normal QT in the setting of AMI .
Torsade de Pointes
Prevalence and Incidence
●● The true incidence and prevalence of drug-induced TdP in the US general population is largely unknown .
●● By extrapolating data from non-US registries,141 it has been estimated that 12 000 cases of drug-induced TdP occur annually in the United States .142
●● The prevalence of drug-induced prolongation of QT and TdP is 2 to 3 times higher in women than in men .143
●● With the majority of QT-prolonging drugs, drug-induced TdP may occur in 3% to 15% of patients .124
●● Antiarrhythmic drugs with QT-interval–prolonging poten-tial carry a 1% to 3% risk of TdP over 1 to 2 years of exposure .144
Risk Factors
●● TdP is usually related to administration of QT-prolonging drugs .145 An up-to-date list of drugs with the potential to cause TdP may be found at http://www .azcert .org/medical-pros/drug-lists/drug-lists .cfm, a Web site maintained by the University of Arizona Center for Education and Research on Therapeutics .
●● Specific risk factors for drug-induced TdP include pro-longed QT, female sex, advanced age, bradycardia, hypokalemia, hypomagnesemia, left ventricular systolic dysfunction, and conditions that lead to elevated plasma concentrations of causative drugs, such as kidney disease, liver disease, drug interactions, or some combination of these .142,146,147
●● Predisposition was also noted in patients who had a history of ventricular arrhythmia and who experienced a recent symptomatic increase in the frequency and complexity of ectopy .148
●● Drug-induced TdP rarely occurs in patients without con-comitant risk factors . An analysis of 144 published articles describing TdP associated with noncardiac drugs revealed that 100% of the patients had at least 1 risk factor, and 71% had at least 2 risk factors .149
Aftermath
●● Drug-induced TdP may result in morbidity that requires hospitalization and in mortality attributable to sudden car-diac death in up to 31% of patients .142,150
●● Patients with advanced HF with a history of drug-induced TdP had a significantly higher risk of sudden cardiac death during therapy with amiodarone than amiodarone-treated patients with no history of drug-induced TdP (55% versus 15%) .151 Current use of antipsychotic drugs was associated with a significant increase in the risk of sudden cardiac death attributable to TdP (OR, 3 .3; 95% CI, 1 .8–6 .2) .152
●● Hospitalization was required in 47% and death occurred in 8% of patients with QT prolongation and TdP caused by administration of methadone .153
Prevention
●● Keys to reducing the incidence of drug-induced cardiac arrhythmias include increased awareness among the medi-cal, pharmaceutical, and nursing professions of the poten-tial problems associated with the use of certain agents .
●● Appropriate monitoring when a QT-prolonging drug is administered is essential . Also, prompt withdrawal of the offending agent should be initiated .154
VF and Ventricular FlutterICD-9 427.4; ICD-10 I49.0.Mortality—1037 . Any-mention mortality—9154 .
Out-of-Hospital Cardiac Arrest: AdultsOut-of-hospital cardiac arrest is defined as a sudden and unex-pected pulseless condition attributable to cessation of car-diac mechanical activity .155 There are wide variations in the reported incidence of and outcomes for out-of-hospital car-diac arrest . These differences are caused in part by differences in definition and ascertainment of cardiac arrest data, as well as differences in treatment after the onset of cardiac arrest .
For additional details on out-of-hospital cardiac arrest treat-ment, please refer to Chapter 21, Quality of Care .
Incidence(See Table 16-1 .)
●● The incidence of nontraumatic EMS-assessed, EMS-treated cardiac arrest and bystander-witnessed VF among individuals of any age during 2011 in the United States is best characterized by an ongoing registry from the Resusci-tation Outcomes Consortium .
●● The total resident population of the United States is 313 794 637 individuals (www .census .gov, accessed on June 22, 2012) . Extrapolation of the incidence and case-fatality rate of EMS-assessed out-of-hospital cardiac arrest reported by the Resuscitation Outcomes Consortium (Resuscitation Outcomes Consortium Investigators, unpublished data, June 20, 2012) to the total population of the United States suggests that each year, 359 400 (quasi CI, 350 200–368 200) people experience EMS-assessed out-of-hospital car-diac arrests in the United States .
●● Approximately 60% of out-of-hospital cardiac arrests are treated by EMS personnel .156
by guest on December 16, 2013http://circ.ahajournals.org/Downloaded from

e166 Circulation January 1/8, 2013
●● 25% of those with EMS-treated out-of-hospital cardiac arrest have no symptoms before the onset of arrest.157
●● Among EMS-treated out-of-hospital cardiac arrests, 23% have an initial rhythm of VF or VT or are shockable by an automated external defibrillator.158
●● The incidence of cardiac arrest with an initial rhythm of VF is decreasing over time; however, the incidence of cardiac arrest with any initial rhythm is not decreasing.159
Risk Factors
●● A study conducted in New York City found the age-adjusted incidence of out-of-hospital cardiac arrest per 10 000 adults was 10.1 among blacks, 6.5 among Hispanics, and 5.8 among whites.160
●● Prior HD is a major risk factor for cardiac arrest. A study of 1275 health maintenance organization enrollees 50 to 79 years of age who had cardiac arrest showed that the inci-dence of out-of-hospital cardiac arrest was 6.0 per 1000 person-years in subjects with any clinically recognized HD compared with 0.8 per 1000 person-years in subjects without HD. In subgroups with HD, incidence was 13.6 per 1000 person-years in subjects with prior MI and 21.9 per 1000 person-years in subjects with HF.161
●● A family history of cardiac arrest in a first-degree relative is associated with an ≥2-fold increase in risk of cardiac arrest.162,163
●● In a study of 81 722 women in the Nurses’ Health Study, the PAR of sudden death associated with 4 lifestyle fac-tors (smoking, PA, diet, and weight) was 81% (95% CI, 52%–93%).164
Aftermath
●● Survival to hospital discharge in 2010, after EMS-treated nontraumatic cardiac arrest with any first recorded rhythm was 9.5% (95% CI, 8.8%–10.2%) for patients of any age, 9.8% (95% CI, 9.0%–10.6%) for adults, and 7.8% (4.2%–11.5%) for children (Resuscitation Outcomes Consortium Investigators, unpublished data, June 20, 2012). Survival after bystander-witnessed VF was 28.4% (95% CI, 25.1%–31.8%) for patients of any age, 28.4% (95% CI, 25.1%–31.8%) for adults, and 57.1% (95% CI, 20.4%–93.8%) for children (Resuscitation Outcomes Consortium Investiga-tors, unpublished data, June 20, 2012).
●● A study conducted in New York City found the age-adjusted survival to 30 days after discharge was more than twice as poor for blacks as for whites, and survival among Hispanics was also lower than among whites.160
●● Seventy-nine percent of the lay public are confident that they know what actions to take in a medical emergency; 98% recognize an automated external defibrillator as some-thing that administers an electric shock to restore a normal heartbeat among victims of sudden cardiac arrest; and 60% are familiar with cardiopulmonary resuscitation (Harris Interactive survey conducted on behalf of the AHA among 1132 US residents ○18 years of age, January 8, 2008–Janu-ary 21, 2008).
Out-of-Hospital Cardiac Arrest: Athletics
●● Among 10.9 million registered participants in 40 marathons and 19 half marathons, the overall incidence of cardiac arrest
was 0.54 per 100 000 participants (95% CI, 0.41–0.70).165 Those with cardiac arrest were more often male and were running a marathon versus a half marathon. Seventy-one percent of those with cardiac arrest died; those who died were younger (mean 39±9 years of age) than those who did not die (mean 49±10 years of age), were more often male, and were more often running a full marathon.
Out-of-Hospital Cardiac Arrest: Children(See Table 16-1.)
●● The incidence of nontraumatic EMS-treated cardiac arrest and bystander-witnessed VF among individuals <18 years of age in the United States is best characterized by an ongo-ing registry. Survival to hospital discharge among children with EMS-treated, nontraumatic cardiac arrest is 7.8% (95% CI, 4.2%–11.5%; Resuscitation Outcomes Con-sortium Investigators, unpublished data, June 20, 2012) and that of bystander-witnessed VF is 57.1% (95% CI, 20.4%–93.8%).
●● Most sudden deaths in athletes were attributable to CVD (56%). Of the cardiovascular deaths that occurred, 29% occurred in blacks, 54% in high school students, and 82% with physical exertion during competition/training; only 11% occurred in females, although this proportion has increased over time.166
●● A longitudinal study of students 17 to 24 years of age par-ticipating in National Collegiate Athletic Association sports showed that the incidence of nontraumatic out-of-hospital cardiac arrest was 1 per 22 903 athlete participant-years. The incidence of cardiac arrest tended to be higher among blacks than among whites and among men than among women.167
In-Hospital Cardiac Arrest
●● Extrapolation of the incidence of in-hospital cardiac arrest reported by Get With The Guidelines (GWTG)–Resuscitation to the total population of hospitalized patients in the United States suggests that each year, 209 000 (quasi CI, 192 000–211 000) people are treated for in-hospital cardiac arrest.168
●● According to the GWTG-Resuscitation Investigators (unpublished data, June 22, 2012), 24.2% (95% CI, 23.5%–24.9%) of patients of any age or 23.9% (95% CI, 23.2%–24.6%) of adults and 40.2% (95% CI, 34.2%–46.2%) of children (excluding neonates who experienced in-hospital cardiac arrest with any first recorded rhythm) in 2011 sur-vived to discharge.
●● In 2011, 17.6% (95% CI, 17.0%–18.3%) of patients of any age or 17.7% (95% CI, 17.1%–18.4%) of adults and 14.1% (95% CI, 9.8%–18.3%) of children (excluding neonates) had in-hospital cardiac arrest with VF or pulse-less VT as the first recorded rhythm. Of these, 43.0% (95% CI, 41.0%–45.0%) of adults and 52.8% (95% CI, 36.5%–69.1%) of children (excluding neonates) survived to discharge (GWTG-Resuscitation Investigators unpub-lished data, June 22, 2012). For additional details on in-hospital arrest treatment, please refer to Chapter 21, Quality of Care.
by guest on December 16, 2013http://circ.ahajournals.org/Downloaded from
Heart Disease and Stroke Statistics—2013 Update: Chapter 16 e167
Monogenic Inherited Syndromes Associated With Sudden Cardiac Death
Long-QT Syndrome
●● The hereditary long-QT syndrome is a genetic chan-nelopathy characterized by prolongation of the QT inter-val (typically >460 ms) and susceptibility to ventricular tachyarrhythmias that lead to syncope and sudden car-diac death . Investigators have identified mutations in 13 genes leading to this phenotype (LQT1 through LQT13) . LQT1 (KCNQ1), LQT2 (KCNH2), and LQT3 (SCN5A) mutations account for the majority (≈80%) of the typed mutations .169,170
●● Prevalence of long-QT syndrome is estimated at 1 per 2000 live births from ECG-guided molecular screening of ≈44 000 mostly white infants born in Italy .171 A similar prevalence was found among nearly 8000 Japanese school children screened by use of an ECG-guided molecular screening approach .172
●● Long-QT syndrome has been reported among those of Afri-can descent, but its prevalence is not well assessed .173
●● There is variable penetrance and a sex-time interaction for long-QT syndrome symptoms . Risk of cardiac events is higher among boys than girls (21% among boys and 14% among girls by age 12 years) . Risk of events during adolescence is equivalent between sexes (≈25% for both sexes from ages 12–18 years) . Conversely, risk of cardiac events in young adulthood is higher among women than men (39% among women from ages 18 to 40 years and 16% among men) .170
●● In addition to age and sex, the clinical course is influenced by prior syncope or aborted cardiac arrest, family history, QT-interval duration, genotype, number of mutations, and congenital deafness .169,170,174
●● Risk of cardiac events is decreased during pregnancy but increased during the 9-month postpartum period .175
●● The mainstay of therapy and prevention is β-blockade treatment .170,174 Implantable defibrillators are considered for high-risk individuals .176
Short-QT Syndrome
●● Short-QT syndrome is a recently described inherited men-delian condition characterized by shortening of the QT interval (typically QT <320 ms) and predisposition to AF and ventricular tachyarrhythmias and sudden death . Mutations in 5 ion channel genes have been described (SQT1–SQT5) .177
●● In a population of 41 767 young predominantly male Swiss transcripts, 0 .02% of the population had a QT interval shorter than 320 ms .178
●● Among 53 patients from the European Short QT Syn-drome Registry (75% males, median age 26 years), a familial or personal history of cardiac arrest was present in 89% . Twenty-four patients received an implantable cardioverter-defibrillator, and 12 received long-term pro-phylaxis with hydroquinidine . During a median follow-up of 64 months, 2 patients received an appropriate implant-able cardioverter-defibrillator shock, and 1 patient expe-rienced syncope . Nonsustained PVT was recorded in 3 patients .179
The Brugada Syndrome
●● The Brugada syndrome is an inherited channelopathy characterized by persistent ST-segment elevation in the precordial leads (V
1–V
3), right bundle-branch block, and
susceptibility to ventricular arrhythmias and sudden car-diac death .180
●● Mutations in several ion channel–related genes have been identified that lead to Brugada syndrome .180
●● Prevalence is estimated at 1 to 5 per 10 000 individuals . Prevalence is higher in Southeast Asian countries, includ-ing Thailand and the Philippines . There is a strong male predominance (80% male) .180–185
●● Cardiac event rates for Brugada syndrome patients followed up prospectively in northern Europe (31 .9 months) and Japan (48 .7 months) were similar: 8% to 10% in patients with prior aborted sudden death, 1% to 2% in those with history of syncope, and 0 .5% in asymptomatic patients .186,187 Predictors of poor outcome included family history of sud-den death and early repolarization pattern on ECG .186,187
Catecholaminergic PVT
●● Catecholaminergic PVT is a familial condition character-ized by adrenergically induced ventricular arrhythmias associated with syncope and sudden death . It is associated with frequent ectopy, bidirectional VT, and PVT with exer-cise or catecholaminergic stimulation (such as emotion, or medicines such as isoproterenol) .
●● Mutations in genes encoding the ryanodine type 2 recep-tor (RYR2)188,189 are found in the majority, and mutations in genes encoding calsequestrin 2 (CASQ2)190,191 are found in a small minority .192 However, a substantial proportion of individuals with catecholaminergic PVT do not have an identified mutation .
●● Statistics regarding catecholaminergic PVT are primarily from case series . Of 101 patients with catecholaminergic PVT, the majority had experienced symptoms before 21 years of age .192
●● In small series (n=27 to n=101) of patients followed up over a mean of 6 .8 to 7 .9 years, 27% to 62% experienced cardiac symptoms, and fatal or near-fatal events occurred in 13% to 31% .192–194
●● Risk factors for cardiac events included younger age of diagnosis and absence of β-blocker therapy . A history of aborted cardiac arrest and absence of β-blocker therapy were risk factors for fatal or near-fatal events .192
Arrhythmogenic Right Ventricular Cardiomyopathy
●● Arrhythmogenic right ventricular cardiomyopathy is a form of genetically inherited structural HD that presents with fibrofatty replacement of the myocardium, with clinical presentation of palpitations, syncope, and sudden death .195
●● Twelve arrhythmogenic right ventricular cardiomyopathy loci have been described (ARVC1–ARVC12) . Disease-causing genes for 8 of these loci have been identified, the majority of which are in desmosomally related proteins .195
●● Prevalence is estimated at 2 to 10 per 10 000 individu-als .195,196 Of 100 patients reported on from the Johns Hop-kins Arrhythmogenic Right Ventricular Dysplasia Registry, 51 were men, and 95 were white, with the rest being of
by guest on December 16, 2013http://circ.ahajournals.org/Downloaded from

e168 Circulation January 1/8, 2013
black, Hispanic, or Middle Eastern origin . Twenty-two per-cent of index cases had evidence of the familial form of arrhythmogenic right ventricular cardiomyopathy .197
●● The most common presenting symptoms were palpitations (27%), syncope (26%), and sudden cardiac death (23%) .197
●● During a median follow-up of 6 years, 47 patients received an implantable cardioverter-defibrillator, 29 of whom received appropriate implantable cardioverter-defibrillator shocks . At the end of follow-up, 66 patients were alive . Twenty-three patients died at study entry, and 11 died dur-ing follow-up (91% of deaths were attributable to sudden cardiac arrest) .197 Similarly, the annual mortality rate was 2 .3% for 130 patients with arrhythmogenic right ventricu-lar cardiomyopathy from Paris, France, who were followed up for a mean of 8 .1 years .198
Hypertrophic Cardiomyopathy(Please refer to Chapter 19, Cardiomyopathy and Heart Failure, for statistics regarding the general epidemiology of HCM .)
●● Over a mean follow-up of 8±7 years, 6% of HCM patients experienced sudden cardiac death .199
●● Among 1866 sudden deaths in athletes between 1980 and 2006, HCM was the most common cause of cardiovascular sudden death (in 251 cases, or 36% of the 690 deaths that could be reliably attributed to a cardiovascular cause) .166
●● The risk of sudden death increases with increasing maxi-mum left ventricular wall thickness,200,201 and the risk for those with wall thickness ≥30 mm is 18 .2 per 1000 patient-years (95% CI, 7 .3–37 .6),200 or approximately twice that of those with maximal wall thickness <30 mm .200,201 Of note, an association between maximum wall thickness and sud-den death has not been found in every HCM population .202
●● Nonsustained VT is a risk factor for sudden death,203,204 particularly in younger patients . Nonsustained VT in those ≤30 years of age is associated with a 4 .35-greater odds of sudden death (95% CI, 1 .5–12 .3) .203
●● A history of syncope is also a risk factor for sudden death in these patients,205 particularly if the syncope was recent before the initial evaluation and not attributable to a neu-rally mediated event .206
●● The presence of left ventricular outflow tract obstruction ≥30 mm Hg appears to increase the risk of sudden death by ≈2-fold .207,208 The presence of left ventricular outflow tract obstruction has a low positive predictive value (7%–8%) but a high negative predictive value (92%–95%) for pre-dicting sudden death .207,209
●● The rate of malignant ventricular arrhythmias detected by implantable cardioverter-defibrillators appears to be similar between those with a family history of sudden death in ≥1 first-degree relatives and those with at least 1 of the risk factors described above .210
●● The risk of sudden death increases with the number of risk factors .211,212
References 1 . NHANES III electrocardiography data file documentation . Third Na-
tional Health and Nutrition Examination Survey (NHANES III), 1988–94 . Series 11, No . 2A . Aprilar1998 . ftp://ftp .cdc .gov/pub/Health_Statistics/NCHS/nhanes/nhanes3/2A/NH3ECG-acc .pdf . Ac-cessed July 6, 2011 .
2 . Walsh JA 3rd, Prineas R, Daviglus ML, Ning H, Liu K, Lewis CE, Sidney S, Schreiner PJ, Iribarren C, Lloyd-Jones DM . Prevalence of electrocar-diographic abnormalities in a middle-aged, biracial population: Coro-nary Artery Risk Development in Young Adults study . J Electrocardiol . 2010;43:385 .e1–385 .e9 .
3 . Wolbrette DL, Naccarelli GV . Bradycardias: sinus nodal dysfunction and atrioventricular conduction disturbances . In: Topol EJ, ed . Textbook of Cardiovascular Medicine, Third Edition: Philadelphia, PA: Lippincott Williams & Wilkins; 2007:1038–1049 .
4 . Kojic EM, Hardarson T, Sigfusson N, Sigvaldason H . The prevalence and prognosis of third-degree atrioventricular conduction block: the Reykjavik study . J Intern Med . 1999;246:81–86 .
5 . Quin EM, Wharton JM, Gold MR . Bradyarrhythmias . In: Yan G-X, Kowey PR, eds . Management of Cardiac Arrhythmias . New York, NY: Springer Humana Press; 2010:305–322 .
6 . Johnson RL, Averill KH, Lamb LE . Electrocardiographic findings in 67,375 asymptomatic subjects, VII: atrioventricular block . Am J Cardiol . 1960;6:153–177 .
7 . Rose G, Baxter PJ, Reid DD, McCartney P . Prevalence and progno-sis of electrocardiographic findings in middle-aged men . Br Heart J . 1978;40:636–643 .
8 . Movahed MR, Hashemzadeh M, Jamal MM . Increased prevalence of third-degree atrioventricular block in patients with type II diabetes mel-litus . Chest . 2005;128:2611–2614 .
9 . Epstein AE, DiMarco JP, Ellenbogen KA, Estes NA 3rd, Freedman RA, Gettes LS, Gillinov AM, Gregoratos G, Hammill SC, Hayes DL, Hlatky MA, Newby LK, Page RL, Schoenfeld MH, Silka MJ, Stevenson LW, Sweeney MO, Smith SC Jr, Jacobs AK, Adams CD, Anderson JL, Buller CE, Creager MA, Ettinger SM, Faxon DP, Halperin JL, Hiratzka LF, Hunt SA, Krumholz HM, Kushner FG, Lytle BW, Nishimura RA, Ornato JP, Page RL, Riegel B, Tarkington LG, Yancy CW . ACC/AHA/HRS 2008 guidelines for device-based therapy of cardiac rhythm abnormalities: a report of the American College of Cardiology/American Heart Associa-tion Task Force on Practice Guidelines (Writing Committee to Revise the ACC/AHA/NASPE 2002 Guideline Update for Implantation of Cardiac Pacemakers and Antiarrhythmia Devices): [published correction appears in Circulation . 2009;120:e34–e35] . Circulation . 2008;117:e350–e408 .
10 . Grimm W, Koehler U, Fus E, Hoffmann J, Menz V, Funck R, Peter JH, Maisch B . Outcome of patients with sleep apnea-associated severe brady-arrhythmias after continuous positive airway pressure therapy . Am J Car-diol . 2000;86:688–692, A9 .
11 . Glickstein JS, Buyon J, Friedman D . Pulsed Doppler echocardiographic assessment of the fetal PR interval . Am J Cardiol . 2000;86:236–239 .
12 . Schnabel RB, Sullivan LM, Levy D, Pencina MJ, Massaro JM, D’Agostino RB Sr, Newton-Cheh C, Yamamoto JF, Magnani JW, Tadros TM, Kannel WB, Wang TJ, Ellinor PT, Wolf PA, Vasan RS, Benjamin EJ . Develop-ment of a risk score for atrial fibrillation (Framingham Heart Study): a community-based cohort study . Lancet . 2009;373:739–745 .
13 . Cheng S, Keyes MJ, Larson MG, McCabe EL, Newton-Cheh C, Levy D, Benjamin EJ, Vasan RS, Wang TJ . Long-term outcomes in individuals with prolonged PR interval or first-degree atrioventricular block . JAMA . 2009;301:2571–2577 .
14 . Mymin D, Mathewson FA, Tate RB, Manfreda J . The natural his-tory of primary first-degree atrioventricular heart block . N Engl J Med . 1986;315:1183–1187 .
15 . Barold SS . Indications for permanent cardiac pacing in first-degree AV block: class I, II, or III? Pacing Clin Electrophysiol . 1996;19:747–751 .
16 . Goldberger JJ, Johnson NP, Gidea C . Significance of asymptomatic bra-dycardia for subsequent pacemaker implantation and mortality in patients >60 years of age . Am J Cardiol . 2011;108:857–861 .
17 . Brignole M, Menozzi C, Lolli G, Oddone D, Gianfranchi L, Bertulla A . Pacing for carotid sinus syndrome and sick sinus syndrome . Pacing Clin Electrophysiol . 1990;13(pt 2):2071–2075 .
18 . Adán V, Crown LA . Diagnosis and treatment of sick sinus syndrome . Am Fam Physician . 2003;67:1725–1732 .
19 . Rodriguez RD, Schocken DD . Update on sick sinus syndrome, a cardiac disorder of aging . Geriatrics . 1990;45:26–30, 33 .
20 . Sutton R, Kenny RA . The natural history of sick sinus syndrome . Pacing Clin Electrophysiol . 1986;9(pt 2):1110–1114 .
21 . Brignole M . Sick sinus syndrome . Clin Geriatr Med . 2002;18:211–227 . 22 . Issa Z, Miller JM, Zipes DP . Clinical Arrhythmology and Electrophysi-
ology: A Companion to Braunwald’s Heart Disease . Philadelphia, PA: Saunders Elsevier; 2008 .
23 . Dobrzynski H, Boyett MR, Anderson RH . New insights into pacemaker activity: promoting understanding of sick sinus syndrome . Circulation . 2007;115:1921–1932 .
by guest on December 16, 2013http://circ.ahajournals.org/Downloaded from

Heart Disease and Stroke Statistics—2013 Update: Chapter 16 e169
24 . Rosenqvist M, Obel IW . Atrial pacing and the risk for AV block: is there a time for change in attitude? Pacing Clin Electrophysiol . 1989; 12(pt 1):97–101 .
25 . Kistler PM, Sanders P, Fynn SP, Stevenson IH, Spence SJ, Vohra JK, Sparks PB, Kalman JM . Electrophysiologic and electroanatomic changes in the human atrium associated with age . J Am Coll Cardiol . 2004;44:109–116 .
26 . Sanders P, Kistler PM, Morton JB, Spence SJ, Kalman JM . Remodeling of sinus node function in patients with congestive heart failure: reduction in sinus node reserve . Circulation . 2004;110:897–903 .
27 . Menozzi C, Brignole M, Alboni P, Boni L, Paparella N, Gaggioli G, Lolli G . The natural course of untreated sick sinus syndrome and identifica-tion of the variables predictive of unfavorable outcome . Am J Cardiol . 1998;82:1205–1209 .
28 . Simon AB, Janz N . Symptomatic bradyarrhythmias in the adult: natural history following ventricular pacemaker implantation . Pacing Clin Elec-trophysiol . 1982;5:372–383 .
29 . Alt E, Völker R, Wirtzfeld A, Ulm K . Survival and follow-up after pace-maker implantation: a comparison of patients with sick sinus syndrome, complete heart block, and atrial fibrillation . Pacing Clin Electrophysiol . 1985;8:849–855 .
30 . Lamas GA, Lee KL, Sweeney MO, Silverman R, Leon A, Yee R, Marin-chak RA, Flaker G, Schron E, Orav EJ, Hellkamp AS, Greer S, McAnulty J, Ellenbogen K, Ehlert F, Freedman RA, Estes NA 3rd, Greenspon A, Goldman L; Mode Selection Trial in Sinus-Node Dysfunction . Ventricular pacing or dual-chamber pacing for sinus-node dysfunction . N Engl J Med . 2002;346:1854–1862 .
31 . McComb JM, Gribbin GM . Effect of pacing mode on morbid-ity and mortality: update of clinical pacing trials . Am J Cardiol . 1999;83(5B):211D–213D .
32 . Lamas GA, Lee K, Sweeney M, Leon A, Yee R, Ellenbogen K, Greer S, Wilber D, Silverman R, Marinchak R, Bernstein R, Mittleman RS, Lieberman EH, Sullivan C, Zorn L, Flaker G, Schron E, Orav EJ, Goldman L . The Mode Selection Trial (MOST) in sinus node dysfunction: design, rationale, and baseline characteristics of the first 1000 patients . Am Heart J . 2000;140:541–551 .
33 . Birnie D, Williams K, Guo A, Mielniczuk L, Davis D, Lemery R, Green M, Gollob M, Tang A . Reasons for escalating pacemaker implants . Am J Car-diol . 2006;98:93–97 .
34 . Orejarena LA, Vidaillet H Jr, DeStefano F, Nordstrom DL, Vierkant RA, Smith PN, Hayes JJ . Paroxysmal supraventricular tachycardia in the gen-eral population . J Am Coll Cardiol . 1998;31:150–157 .
35 . Murman DH, McDonald AJ, Pelletier AJ, Camargo CA Jr . U .S . emergen-cy department visits for supraventricular tachycardia, 1993-2003 . Acad Emerg Med . 2007;14:578–581 .
36 . Still AM, Raatikainen P, Ylitalo A, Kauma H, Ikäheimo M, Antero Kesäniemi Y, Huikuri HV . Prevalence, characteristics and natural course of inappropriate sinus tachycardia . Europace . 2005;7:104–112 .
37 . Maurer MS, Shefrin EA, Fleg JL . Prevalence and prognostic significance of exercise-induced supraventricular tachycardia in apparently healthy volunteers . Am J Cardiol . 1995;75:788–792 .
38 . Poutiainen AM, Koistinen MJ, Airaksinen KE, Hartikainen EK, Kettunen RV, Karjalainen JE, Huikuri HV . Prevalence and natural course of ectopic atrial tachycardia . Eur Heart J . 1999;20:694–700 .
39 . Blomström-Lundqvist C, Scheinman MM, Aliot EM, Alpert JS, Calkins H, Camm AJ, Campbell WB, Haines DE, Kuck KH, Lerman BB, Miller DD, Shaeffer CW Jr, Stevenson WG, Tomaselli GF, Antman EM, Smith SC Jr, Alpert JS, Faxon DP, Fuster V, Gibbons RJ, Gregoratos G, Hiratzka LF, Hunt SA, Jacobs AK, Russell RO Jr, Priori SG, Blanc JJ, Budaj A, Burgos EF, Cowie M, Deckers JW, Garcia MA, Klein WW, Lekakis J, Lindahl B, Mazzotta G, Morais JC, Oto A, Smiseth O, Trappe HJ . ACC/AHA/ESC guidelines for the management of patients with supraven-tricular arrhythmias: executive summary: a report of the American Col-lege of Cardiology/American Heart Association Task Force on Practice Guidelines and the European Society of Cardiology Committee for Prac-tice Guidelines (Writing Committee to Develop Guidelines for the Man-agement of Patients With Supraventricular Arrhythmias) . Circulation . 2003;108:1871–1909 .
40 . Wu EB, Chia HM, Gill JS . Reversible cardiomyopathy after radiofrequen-cy ablation of lateral free-wall pathway-mediated incessant supraventricu-lar tachycardia . Pacing Clin Electrophysiol . 2000;23:1308–1310 .
41 . Wang YS, Scheinman MM, Chien WW, Cohen TJ, Lesh MD, Griffin JC . Patients with supraventricular tachycardia presenting with aborted sudden death: incidence, mechanism and long-term follow-up . J Am Coll Cardiol . 1991;18:1711–1719 .
42 . Brembilla-Perrot B, Houriez P, Beurrier D, Claudon O, Burger G, Van-çon AC, Mock L . Influence of age on the electrophysiological mecha-nism of paroxysmal supraventricular tachycardias . Int J Cardiol . 2001;78:293–298 .
43 . Porter MJ, Morton JB, Denman R, Lin AC, Tierney S, Santucci PA, Cai JJ, Madsen N, Wilber DJ . Influence of age and gender on the mechanism of supraventricular tachycardia . Heart Rhythm . 2004;1:393–396 .
44 . Anand RG, Rosenthal GL, Van Hare GF, Snyder CS . Is the mechanism of supraventricular tachycardia in pediatrics influenced by age, gender or ethnicity? Congenit Heart Dis . 2009;4:464–468 .
45 . Bradley DJ, Fischbach PS, Law IH, Serwer GA, Dick M 2nd . The clinical course of multifocal atrial tachycardia in infants and children . J Am Coll Cardiol . 2001;38:401–408 .
46 . Kastor JA . Multifocal atrial tachycardia . N Engl J Med . 1990;322: 1713–1717 .
47 . McCord J, Borzak S . Multifocal atrial tachycardia . Chest . 1998;113: 203–209 .
48 . Dreifus LS, Haiat R, Watanabe Y, Arriaga J, Reitman N . Ventricular fi-brillation: a possible mechanism of sudden death in patients and Wolff-Parkinson-White syndrome . Circulation . 1971;43:520–527 .
49 . Klein GJ, Bashore TM, Sellers TD, Pritchett EL, Smith WM, Gallagher JJ . Ventricular fibrillation in the Wolff-Parkinson-White syndrome . N Engl J Med . 1979;301:1080–1085 .
50 . Dagres N, Clague JR, Lottkamp H, Hindricks G, Breithardt G, Borggrefe M . Impact of radiofrequency catheter ablation of accessory pathways on the frequency of atrial fibrillation during long-term follow-up: high re-currence rate of atrial fibrillation in patients older than 50 years of age . Eur Heart J . 2001;22:423–427 .
51 . De Bacquer D, De Backer G, Kornitzer M . Prevalences of ECG find-ings in large population based samples of men and women . Heart . 2000;84:625–633 .
52 . Sano S, Komori S, Amano T, Kohno I, Ishihara T, Sawanobori T, Ijiri H, Tamura K . Prevalence of ventricular preexcitation in Japanese schoolchil-dren . Heart . 1998;79:374–378 .
53 . Munger TM, Packer DL, Hammill SC, Feldman BJ, Bailey KR, Ballard DJ, Holmes DR Jr, Gersh BJ . A population study of the natural history of Wolff-Parkinson-White syndrome in Olmsted County, Minnesota, 1953-1989 . Circulation . 1993;87:866–873 .
54 . Leitch JW, Klein GJ, Yee R, Murdock C . Prognostic value of electro-physiology testing in asymptomatic patients with Wolff-Parkinson-White pattern [published correction appears in Circulation . 1991;83:1124] . Circulation . 1990;82:1718–1723 .
55 . Goudevenos JA, Katsouras CS, Graekas G, Argiri O, Giogiakas V, Sideris DA . Ventricular pre-excitation in the general population: a study on the mode of presentation and clinical course . Heart . 2000;83:29–34 .
56 . Krahn AD, Manfreda J, Tate RB, Mathewson FA, Cuddy TE . The natu-ral history of electrocardiographic preexcitation in men: the Manitoba Follow-up Study . Ann Intern Med . 1992;116:456–460 .
57 . Santinelli V, Radinovic A, Manguso F, Vicedomini G, Ciconte G, Gulletta S, Paglino G, Sacchi S, Sala S, Ciaccio C, Pappone C . Asymptomatic ven-tricular preexcitation: a long-term prospective follow-up study of 293 adult patients . Circ Arrhythm Electrophysiol . 2009;2:102–107 .
58 . Obeyesekere MN, Leong-Sit P, Massel D, Manlucu J, Modi S, Krahn AD, Skanes AC, Yee R, Gula LJ, Klein GJ . Risk of arrhythmia and sudden death in patients with asymptomatic preexcitation: a meta-analysis . Circu-lation . 2012;125:2308–2315 .
59 . Timmermans C, Smeets JL, Rodriguez LM, Vrouchos G, van den Dool A, Wellens HJ . Aborted sudden death in the Wolff-Parkinson-White syn-drome . Am J Cardiol . 1995;76:492–494 .
60 . Pappone C, Vicedomini G, Manguso F, Baldi M, Pappone A, Petretta A, Vitale R, Saviano M, Ciaccio C, Giannelli L, Calovic Z, Tavazzi L, Santinelli V . Risk of malignant arrhythmias in initially symptomatic pa-tients with Wolff-Parkinson-White syndrome: results of a prospective long-term electrophysiological follow-up study . Circulation . 2012;125:661–668 .
61 . Inoue K, Igarashi H, Fukushige J, Ohno T, Joh K, Hara T . Long-term prospective study on the natural history of Wolff-Parkinson-White syn-drome detected during a heart screening program at school . Acta Paediatr . 2000;89:542–545 .
62 . Pappone C, Manguso F, Santinelli R, Vicedomini G, Sala S, Paglino G, Mazzone P, Lang CC, Gulletta S, Augello G, Santinelli O, Santinelli V . Radiofrequency ablation in children with asymptomatic Wolff-Parkinson-White syndrome . N Engl J Med . 2004;351:1197–1205 .
63 . Glotzer TV, Hellkamp AS, Zimmerman J, Sweeney MO, Yee R, Marinchak R, Cook J, Paraschos A, Love J, Radoslovich G, Lee KL, Lamas GA; MOST Investigators . Atrial high rate episodes detected by
by guest on December 16, 2013http://circ.ahajournals.org/Downloaded from

e170 Circulation January 1/8, 2013
pacemaker diagnostics predict death and stroke: report of the Atrial Diag-nostics Ancillary Study of the MOde Selection Trial (MOST) . Circulation . 2003;107:1614–1619 .
64 . Glotzer TV, Daoud EG, Wyse DG, Singer DE, Ezekowitz MD, Hilker C, Miller C, Qi D, Ziegler PD . The relationship between daily atrial tachyarrhythmia burden from implantable device diagnostics and stroke risk: the TRENDS study . Circ Arrhythm Electrophysiol . 2009;2:474–480 .
65 . Healey JS, Connolly SJ, Gold MR, Israel CW, Van Gelder IC, Capucci A, Lau CP, Fain E, Yang S, Bailleul C, Morillo CA, Carlson M, Themeles E, Kaufman ES, Hohnloser SH; ASSERT Investigators . Subclinical atrial fibrillation and the risk of stroke . N Engl J Med . 2012;366:120–129 .
66 . Go AS, Hylek EM, Phillips KA, Chang Y, Henault LE, Selby JV, Singer DE . Prevalence of diagnosed atrial fibrillation in adults: national im-plications for rhythm management and stroke prevention: the AnTico-agulation and Risk Factors in Atrial Fibrillation (ATRIA) Study . JAMA . 2001;285:2370–2375 .
67 . Miyasaka Y, Barnes ME, Gersh BJ, Cha SS, Bailey KR, Abhayaratna WP, Seward JB, Tsang TS . Secular trends in incidence of atrial fibrillation in Olmsted County, Minnesota, 1980 to 2000, and implications on the pro-jections for future prevalence [published correction appears in Circula-tion . 2006;114:e498] . Circulation . 2006;114:119–125 .
68 . Shen AY, Contreras R, Sobnosky S, Shah AI, Ichiuji AM, Jorgensen MB, Brar SS, Chen W . Racial/ethnic differences in the prevalence of atrial fibrillation among older adults: a cross-sectional study . J Natl Med Assoc . 2010;102:906–913 .
69 . Piccini JP, Hammill BG, Sinner MF, Jensen PN, Hernandez AF, Heckbert SR, Benjamin EJ, Curtis LH . Incidence and prevalence of atrial fibrillation and associated mortality among Medicare beneficiaries, 1993-2007 . Circ Cardiovasc Qual Outcomes . 2012;5:85–93 .
70 . Miyasaka Y, Barnes ME, Bailey KR, Cha SS, Gersh BJ, Seward JB, Tsang TS . Mortality trends in patients diagnosed with first atrial fibrillation: a 21-year community-based study . J Am Coll Cardiol . 2007;49:986–992 .
71 . Benjamin EJ, Wolf PA, D’Agostino RB, Silbershatz H, Kannel WB, Levy D . Impact of atrial fibrillation on the risk of death: the Framingham Heart Study . Circulation . 1998;98:946–952 .
72 . Wang TJ, Larson MG, Levy D, Vasan RS, Leip EP, Wolf PA, D’Agostino RB, Murabito JM, Kannel WB, Benjamin EJ . Temporal relations of atrial fibrillation and congestive heart failure and their joint influence on mortal-ity: the Framingham Heart Study . Circulation . 2003;107:2920–2925 .
73 . Mamas MA, Caldwell JC, Chacko S, Garratt CJ, Fath-Ordoubadi F, Neyses L . A meta-analysis of the prognostic significance of atrial fibrilla-tion in chronic heart failure . Eur J Heart Fail . 2009;11:676–683 .
74 . Jabre P, Roger VL, Murad MH, Chamberlain AM, Prokop L, Adnet F, Jouven X . Mortality associated with atrial fibrillation in patients with myocardial infarction: a systematic review and meta-analysis . Circulation . 2011;123:1587–1593 .
75 . Jabre P, Jouven X, Adnet F, Thabut G, Bielinski SJ, Weston SA, Roger VL . Atrial fibrillation and death after myocardial infarction: a community study . Circulation . 2011;123:2094–2100 .
76 . Kaw R, Hernandez AV, Masood I, Gillinov AM, Saliba W, Blackstone EH . Short- and long-term mortality associated with new-onset atrial fibrilla-tion after coronary artery bypass grafting: a systematic review and meta-analysis . J Thorac Cardiovasc Surg . 2011;141:1305–1312 .
77 . El-Chami MF, Kilgo P, Thourani V, Lattouf OM, Delurgio DB, Guyton RA, Leon AR, Puskas JD . New-onset atrial fibrillation predicts long-term mortality after coronary artery bypass graft . J Am Coll Cardiol . 2010;55:1370–1376 .
78 . Lin HJ, Wolf PA, Kelly-Hayes M, Beiser AS, Kase CS, Benjamin EJ, D’Agostino RB . Stroke severity in atrial fibrillation: the Framingham Study . Stroke . 1996;27:1760–1764 .
79 . Walkey AJ, Wiener RS, Ghobrial JM, Curtis LH, Benjamin EJ . Incident stroke and mortality associated with new-onset atrial fibrillation in pa-tients hospitalized with severe sepsis . JAMA . 2011;306:2248–2254 .
80 . van Diepen S, Bakal JA, McAlister FA, Ezekowitz JA . Mortality and read-mission of patients with heart failure, atrial fibrillation, or coronary artery disease undergoing noncardiac surgery: an analysis of 38 047 patients . Circulation . 2011;124:289–296 .
81 . Lloyd-Jones DM, Wang TJ, Leip EP, Larson MG, Levy D, Vasan RS, D’Agostino RB, Massaro JM, Beiser A, Wolf PA, Benjamin EJ . Lifetime risk for development of atrial fibrillation: the Framingham Heart Study . Circulation . 2004;110:1042–1046 .
82 . Alonso A, Agarwal SK, Soliman EZ, Ambrose M, Chamberlain AM, Pri-neas RJ, Folsom AR . Incidence of atrial fibrillation in whites and African-Americans: the Atherosclerosis Risk in Communities (ARIC) study . Am Heart J . 2009;158:111–117 .
83 . Chamberlain AM, Agarwal SK, Folsom AR, Soliman EZ, Chambless LE, Crow R, Ambrose M, Alonso A . A clinical risk score for atrial fibrillation in a biracial prospective cohort (from the Atherosclerosis Risk in Com-munities [ARIC] study) . Am J Cardiol . 2011;107:85–91 .
84 . Schnabel RB, Aspelund T, Li G, Sullivan LM, Suchy-Dicey A, Harris TB, Pencina MJ, D’Agostino RB Sr, Levy D, Kannel WB, Wang TJ, Kronmal RA, Wolf PA, Burke GL, Launer LJ, Vasan RS, Psaty BM, Benjamin EJ, Gudnason V, Heckbert SR . Validation of an atrial fibrillation risk al-gorithm in whites and African Americans . Arch Intern Med . 2010;170: 1909–1917 .
85 . Sawin CT, Geller A, Wolf PA, Belanger AJ, Baker E, Bacharach P, Wilson PW, Benjamin EJ, D’Agostino RB . Low serum thyrotropin concentra-tions as a risk factor for atrial fibrillation in older persons . N Engl J Med . 1994;331:1249–1252 .
86 . Cappola AR, Fried LP, Arnold AM, Danese MD, Kuller LH, Burke GL, Tracy RP, Ladenson PW . Thyroid status, cardiovascular risk, and mortality in older adults . JAMA . 2006;295:1033–1041 .
87 . Alonso A, Lopez FL, Matsushita K, Loehr LR, Agarwal SK, Chen LY, Soliman EZ, Astor BC, Coresh J . Chronic kidney disease is associated with the incidence of atrial fibrillation: the Atherosclerosis Risk in Com-munities (ARIC) study . Circulation . 2011;123:2946–2953 .
88 . Kodama S, Saito K, Tanaka S, Horikawa C, Saito A, Heianza Y, Anasako Y, Nishigaki Y, Yachi Y, Iida KT, Ohashi Y, Yamada N, Sone H . Alcohol con-sumption and risk of atrial fibrillation: a meta-analysis . J Am Coll Cardiol . 2011;57:427–436 .
89 . Wolff L . Familial auricular fibrillation . N Engl J Med . 1943;229:396–398 . 90 . Ellinor PT, Yoerger DM, Ruskin JN, MacRae CA . Familial aggregation in
lone atrial fibrillation . Hum Genet . 2005;118:179–184 . 91 . Fox CS, Parise H, D’Agostino RB Sr, Lloyd-Jones DM, Vasan RS, Wang
TJ, Levy D, Wolf PA, Benjamin EJ . Parental atrial fibrillation as a risk factor for atrial fibrillation in offspring . JAMA . 2004;291:2851–2855 .
92 . Lubitz SA, Yin X, Fontes JD, Magnani JW, Rienstra M, Pai M, Villalon ML, Vasan RS, Pencina MJ, Levy D, Larson MG, Ellinor PT, Benjamin EJ . Association between familial atrial fibrillation and risk of new-onset atrial fibrillation . JAMA . 2010;304:2263–2269 .
93 . Ellinor PT, MacRae CA . Ion channel mutations in AF: signal or noise? Heart Rhythm . 2008;5:436–437 .
94 . Gudbjartsson DF, Arnar DO, Helgadottir A, Gretarsdottir S, Holm H, Sigurdsson A, Jonasdottir A, Baker A, Thorleifsson G, Kristjansson K, Palsson A, Blondal T, Sulem P, Backman VM, Hardarson GA, Palsdottir E, Helgason A, Sigurjonsdottir R, Sverrisson JT, Kostulas K, Ng MC, Baum L, So WY, Wong KS, Chan JC, Furie KL, Greenberg SM, Sale M, Kelly P, MacRae CA, Smith EE, Rosand J, Hillert J, Ma RC, Ellinor PT, Thorgeirsson G, Gulcher JR, Kong A, Thorsteinsdottir U, Stefansson K . Variants conferring risk of atrial fibrillation on chromosome 4q25 . Nature . 2007;448:353–357 .
95 . Benjamin EJ, Rice KM, Arking DE, Pfeufer A, van Noord C, Smith AV, Schnabel RB, Bis JC, Boerwinkle E, Sinner MF, Dehghan A, Lubitz SA, D’Agostino RB Sr, Lumley T, Ehret GB, Heeringa J, Aspelund T, Newton-Cheh C, Larson MG, Marciante KD, Soliman EZ, Rivadeneira F, Wang TJ, Eiríksdottir G, Levy D, Psaty BM, Li M, Chamberlain AM, Hofman A, Vasan RS, Harris TB, Rotter JI, Kao WH, Agarwal SK, Stricker BH, Wang K, Launer LJ, Smith NL, Chakravarti A, Uitterlinden AG, Wolf PA, Sotoodehnia N, Köttgen A, van Duijn CM, Meitinger T, Mueller M, Perz S, Steinbeck G, Wichmann HE, Lunetta KL, Heckbert SR, Gudnason V, Alonso A, Kääb S, Ellinor PT, Witteman JC . Variants in ZFHX3 are associated with atrial fibrillation in individuals of European ancestry . Nat Genet . 2009;41:879–881 .
96 . Ellinor PT, Lunetta KL, Glazer NL, Pfeufer A, Alonso A, Chung MK, Sinner MF, de Bakker PI, Mueller M, Lubitz SA, Fox E, Darbar D, Smith NL, Smith JD, Schnabel RB, Soliman EZ, Rice KM, Van Wagoner DR, Beckmann BM, van Noord C, Wang K, Ehret GB, Rotter JI, Hazen SL, Steinbeck G, Smith AV, Launer LJ, Harris TB, Makino S, Nelis M, Milan DJ, Perz S, Esko T, Köttgen A, Moebus S, Newton-Cheh C, Li M, Möhlenkamp S, Wang TJ, Kao WH, Vasan RS, Nöthen MM, MacRae CA, Stricker BH, Hofman A, Uitterlinden AG, Levy D, Boerwinkle E, Metspalu A, Topol EJ, Chakravarti A, Gudnason V, Psaty BM, Roden DM, Meitinger T, Wichmann HE, Witteman JC, Barnard J, Arking DE, Benja-min EJ, Heckbert SR, Kääb S . Common variants in KCNN3 are associated with lone atrial fibrillation . Nat Genet . 2010;42:240–244 .
97 . Gudbjartsson DF, Holm H, Gretarsdottir S, Thorleifsson G, Walters GB, Thorgeirsson G, Gulcher J, Mathiesen EB, Njølstad I, Nyrnes A, Wilsgaard T, Hald EM, Hveem K, Stoltenberg C, Kucera G, Stubblefield T, Carter S, Roden D, Ng MC, Baum L, So WY, Wong KS, Chan JC, Gieger C, Wichmann HE, Gschwendtner A, Dichgans M, Kuhlenbäumer G,
by guest on December 16, 2013http://circ.ahajournals.org/Downloaded from

Heart Disease and Stroke Statistics—2013 Update: Chapter 16 e171
Berger K, Ringelstein EB, Bevan S, Markus HS, Kostulas K, Hillert J, Sveinbjörnsdóttir S, Valdimarsson EM, Løchen ML, Ma RC, Darbar D, Kong A, Arnar DO, Thorsteinsdottir U, Stefansson K . A sequence vari-ant in ZFHX3 on 16q22 associates with atrial fibrillation and ischemic stroke . Nat Genet . 2009;41:876–878 .
98 . Ellinor PT, Lunetta KL, Albert CM, Glazer NL, Ritchie MD, Smith AV, Arking DE, Müller-Nurasyid M, Krijthe BP, Lubitz SA, Bis JC, Chung MK, Dörr M, Ozaki K, Roberts JD, Smith JG, Pfeufer A, Sinner MF, Lohman K, Ding J, Smith NL, Smith JD, Rienstra M, Rice KM, Van Wagoner DR, Magnani JW, Wakili R, Clauss S, Rotter JI, Steinbeck G, Launer LJ, Davies RW, Borkovich M, Harris TB, Lin H, Völker U, Völzke H, Milan DJ, Hofman A, Boerwinkle E, Chen LY, Soliman EZ, Voight BF, Li G, Chakravarti A, Kubo M, Tedrow UB, Rose LM, Ridker PM, Conen D, Tsunoda T, Furukawa T, Sotoodehnia N, Xu S, Kamatani N, Levy D, Nakamura Y, Parvez B, Mahida S, Furie KL, Rosand J, Muhammad R, Psaty BM, Meitinger T, Perz S, Wichmann HE, Witteman JC, Kao WH, Kathiresan S, Roden DM, Uitterlinden AG, Rivadeneira F, McKnight B, Sjögren M, Newman AB, Liu Y, Gollob MH, Melander O, Tanaka T, Stricker BH, Felix SB, Alonso A, Darbar D, Barnard J, Chasman DI, Heckbert SR, Benjamin EJ, Gudnason V, Kääb S . Meta-analysis iden-tifies six new susceptibility loci for atrial fibrillation . Nat Genet . 2012;44:670–675 .
99 . Meschia JF, Merrill P, Soliman EZ, Howard VJ, Barrett KM, Zakai NA, Kleindorfer D, Safford M, Howard G . Racial disparities in awareness and treatment of atrial fibrillation: the REasons for Geographic and Racial Differences in Stroke (REGARDS) study . Stroke . 2010;41:581–587 .
100 . Huxley RR, Lopez FL, Folsom AR, Agarwal SK, Loehr LR, Soliman EZ, Maclehose R, Konety S, Alonso A . Absolute and attributable risks of atrial fibrillation in relation to optimal and borderline risk factors: the Atherosclerosis Risk in Communities (ARIC) study . Circulation . 2011;123:1501–1508 .
101 . Benjamin EJ, Levy D, Vaziri SM, D’Agostino RB, Belanger AJ, Wolf PA . Independent risk factors for atrial fibrillation in a population-based cohort: the Framingham Heart Study . JAMA . 1994;271:840–844 .
102 . Mozaffarian D, Furberg CD, Psaty BM, Siscovick D . Physical activity and incidence of atrial fibrillation in older adults: the Cardiovascular Health Study . Circulation . 2008;118:800–807 .
103 . Aizer A, Gaziano JM, Cook NR, Manson JE, Buring JE, Albert CM . Relation of vigorous exercise to risk of atrial fibrillation . Am J Cardiol . 2009;103:1572–1577 .
104 . Huang G, Xu JB, Liu JX, He Y, Nie XL, Li Q, Hu YM, Zhao SQ, Wang M, Zhang WY, Liu XR, Wu T, Arkin A, Zhang TJ . Angiotensin-con-verting enzyme inhibitors and angiotensin receptor blockers decrease the incidence of atrial fibrillation: a meta-analysis . Eur J Clin Invest . 2011;41:719–733 .
105 . Schneider MP, Hua TA, Böhm M, Wachtell K, Kjeldsen SE, Schmieder RE . Prevention of atrial fibrillation by renin-angiotensin system inhibi-tion a meta-analysis . J Am Coll Cardiol . 2010;55:2299–2307 .
106 . Swedberg K, Zannad F, McMurray JJ, Krum H, van Veldhuisen DJ, Shi H, Vincent J, Pitt B; EMPHASIS-HF Study Investigators . Eplere-none and atrial fibrillation in mild systolic heart failure: results from the EMPHASIS-HF (Eplerenone in Mild Patients Hospitalization And SurvIval Study in Heart Failure) study . J Am Coll Cardiol . 2012;59: 1598–1603 .
107 . Rahimi K, Emberson J, McGale P, Majoni W, Merhi A, Asselbergs FW, Krane V, Macfarlane PW; PROSPER Executive . Effect of statins on atrial fibrillation: collaborative meta-analysis of published and unpublished evidence from randomised controlled trials . BMJ . 2011;342:d1250 .
108 . Benjamin EJ, Chen PS, Bild DE, Mascette AM, Albert CM, Alonso A, Calkins H, Connolly SJ, Curtis AB, Darbar D, Ellinor PT, Go AS, Goldschlager NF, Heckbert SR, Jalife J, Kerr CR, Levy D, Lloyd-Jones DM, Massie BM, Nattel S, Olgin JE, Packer DL, Po SS, Tsang TS, Van Wagoner DR, Waldo AL, Wyse DG . Prevention of atri-al fibrillation: report from a National Heart, Lung, and Blood Institute workshop . Circulation . 2009;119:606–618 .
109 . Khairallah F, Ezzedine R, Ganz LI, London B, Saba S . Epidemiology and determinants of outcome of admissions for atrial fibrillation in the United States from 1996 to 2001 . Am J Cardiol . 2004;94:500–504 .
110 . Kim MH, Johnston SS, Chu BC, Dalal MR, Schulman KL . Estimation of total incremental health care costs in patients with atrial fibrillation in the United States . Circ Cardiovasc Qual Outcomes . 2011;4:313–320 .
111 . Lakshminarayan K, Solid CA, Collins AJ, Anderson DC, Herzog CA . Atrial fibrillation and stroke in the general Medicare population: a 10-year perspective (1992 to 2002) . Stroke . 2006;37:1969–1974 .
112 . Wolf PA, Abbott RD, Kannel WB . Atrial fibrillation as an independent risk factor for stroke: the Framingham Study . Stroke . 1991;22:983–988 .
113 . Hart RG, Pearce LA, Rothbart RM, McAnulty JH, Asinger RW, Halperin JL; Stroke Prevention in Atrial Fibrillation Investigators . Stroke with intermittent atrial fibrillation: incidence and predictors during aspirin therapy . J Am Coll Cardiol . 2000;35:183–187 .
114 . Penado S, Cano M, Acha O, Hernández JL, Riancho JA . Atrial fibrilla-tion as a risk factor for stroke recurrence . Am J Med . 2003;114:206–210 .
115 . Baczek VL, Chen WT, Kluger J, Coleman CI . Predictors of warfarin use in atrial fibrillation in the United States: a systematic review and meta-analysis . BMC Fam Pract . 2012;13:5 .
116 . Ott A, Breteler MM, de Bruyne MC, van Harskamp F, Grobbee DE, Hofman A . Atrial fibrillation and dementia in a population-based study: the Rotterdam Study . Stroke . 1997;28:316–321 .
117 . Kwok CS, Loke YK, Hale R, Potter JF, Myint PK . Atrial fibrillation and incidence of dementia: a systematic review and meta-analysis . Neurol-ogy . 2011;76:914–922 .
118 . Miyasaka Y, Barnes ME, Gersh BJ, Cha SS, Bailey KR, Abhayaratna W, Seward JB, Iwasaka T, Tsang TS . Incidence and mortality risk of conges-tive heart failure in atrial fibrillation patients: a community-based study over two decades . Eur Heart J . 2006;27:936–941 .
119 . Akhtar M, Shenasa M, Jazayeri M, Caceres J, Tchou PJ . Wide QRS com-plex tachycardia: reappraisal of a common clinical problem . Ann Intern Med . 1988;109:905–912 .
120 . Sacher F, Tedrow UB, Field ME, Raymond JM, Koplan BA, Epstein LM, Stevenson WG . Ventricular tachycardia ablation: evolution of patients and procedures over 8 years . Circ Arrhythm Electrophysiol . 2008;1:153–161 .
121 . Swerdlow CD, Winkle RA, Mason JW . Determinants of surviv-al in patients with ventricular tachyarrhythmias . N Engl J Med . 1983;308:1436–1442 .
122 . Wathen MS, DeGroot PJ, Sweeney MO, Stark AJ, Otterness MF, Adkisson WO, Canby RC, Khalighi K, Machado C, Rubenstein DS, Volosin KJ; PainFREE Rx II Investigators . Prospective randomized multicenter trial of empirical antitachycardia pacing versus shocks for spontaneous rapid ventricular tachycardia in patients with implantable cardioverter-defibrillators: Pacing Fast Ventricular Tachycardia Reduces Shock Therapies (PainFREE Rx II) trial results . Circulation . 2004;110: 2591–2596 .
123 . Lemery R, Brugada P, Bella PD, Dugernier T, van den Dool A, Wellens HJ . Nonischemic ventricular tachycardia: clinical course and long-term follow-up in patients without clinically overt heart disease . Circulation . 1989;79:990–999 .
124 . Yarlagadda RK, Iwai S, Stein KM, Markowitz SM, Shah BK, Cheung JW, Tan V, Lerman BB, Mittal S . Reversal of cardiomyopathy in patients with repetitive monomorphic ventricular ectopy originating from the right ventricular outflow tract . Circulation . 2005;112:1092–1097 .
125 . Baman TS, Lange DC, Ilg KJ, Gupta SK, Liu TY, Alguire C, Armstrong W, Good E, Chugh A, Jongnarangsin K, Pelosi F Jr, Crawford T, Ebinger M, Oral H, Morady F, Bogun F . Relationship be-tween burden of premature ventricular complexes and left ventricular function . Heart Rhythm . 2010;7:865–869 .
126 . Viskin S, Rosso R, Rogowski O, Belhassen B . The “short-coupled” vari-ant of right ventricular outflow ventricular tachycardia: a not-so-benign form of benign ventricular tachycardia? J Cardiovasc Electrophysiol . 2005;16:912–916 .
127 . Noda T, Shimizu W, Taguchi A, Aiba T, Satomi K, Suyama K, Kurita T, Aihara N, Kamakura S . Malignant entity of idiopathic ventricular fibril-lation and polymorphic ventricular tachycardia initiated by premature extrasystoles originating from the right ventricular outflow tract . J Am Coll Cardiol . 2005;46:1288–1294 .
128 . Denes P, Gabster A, Huang SK . Clinical, electrocardiographic and follow-up observations in patients having ventricular fibrillation during Holter monitoring: role of quinidine therapy . Am J Cardiol . 1981;48:9–16 .
129 . Panidis IP, Morganroth J . Sudden death in hospitalized patients: cardiac rhythm disturbances detected by ambulatory electrocardiographic moni-toring . J Am Coll Cardiol . 1983;2:798–805 .
130 . Kempf FC Jr, Josephson ME . Cardiac arrest recorded on ambulatory electrocardiograms . Am J Cardiol . 1984;53:1577–1582 .
131 . DiMarco JP, Haines DE . Sudden cardiac death . Curr Probl Cardiol . 1990;15:183–232 .
132 . Roy D, Waxman HL, Kienzle MG, Buxton AE, Marchlinski FE, Josephson ME . Clinical characteristics and long-term follow-up in 119 survivors of cardiac arrest: relation to inducibility at electrophysiologic testing . Am J Cardiol . 1983;52:969–974 .
133 . Stevenson WG, Brugada P, Waldecker B, Zehender M, Wellens HJ . Clinical, angiographic, and electrophysiologic findings in patients with aborted
by guest on December 16, 2013http://circ.ahajournals.org/Downloaded from

e172 Circulation January 1/8, 2013
sudden death as compared with patients with sustained ventricular tachy-cardia after myocardial infarction . Circulation . 1985;71:1146–1152 .
134 . Grenadier E, Alpan G, Maor N, Keidar S, Binenboim C, Margulies T, Palant A . Polymorphous ventricular tachycardia in acute myocardial in-farction . Am J Cardiol . 1984;53:1280–1283 .
135 Wolfe CL, Nibley C, Bhandari A, Chatterjee K, Scheinman M . Polymor-phous ventricular tachycardia associated with acute myocardial infarc-tion . Circulation . 1991;84:1543–1551 .
136 . White RD, Wood DL . Out-of-hospital pleomorphic ventricular tachycar-dia and resuscitation: association with acute myocardial ischemia and infarction . Ann Emerg Med . 1992;21:1282–1287 .
137 . Brady W, Meldon S, DeBehnke D . Comparison of prehospital monomor-phic and polymorphic ventricular tachycardia: prevalence, response to therapy, and outcome . Ann Emerg Med . 1995;25:64–70 .
138 . Pellegrini CN, Scheinman MM . Clinical management of ventricular tachycardia . Curr Probl Cardiol . 2010;35:453–504 .
139 . Passman R, Kadish A . Polymorphic ventricular tachycardia, long Q-T syn-drome, and torsades de pointes . Med Clin North Am . 2001;85:321–341 .
140 . Brady WJ, DeBehnke DJ, Laundrie D . Prevalence, therapeutic response, and outcome of ventricular tachycardia in the out-of-hospital setting: a comparison of monomorphic ventricular tachycardia, polymorphic ventricular tachycardia, and torsades de pointes . Acad Emerg Med . 1999;6:609–617 .
141 . Darpö B . Spectrum of drugs prolonging QT interval and the incidence of torsades de pointes . Eur Heart J Suppl . 2001;3(suppl K):K70–K80 .
142 . Tisdale JE, Miler DA . Drug-Induced Diseases: Prevention, Detection and Management, Second Edition. Bethesda, MD: American Society of Health System Pharmacists; 2010 .
143 . Lehmann MH, Timothy KW, Frankovich D, Fromm BS, Keating M, Locati EH, Taggart RT, Towbin JA, Moss AJ, Schwartz PJ, Vincent GM . Age-gender influence on the rate-corrected QT interval and the QT-heart rate relation in families with genotypically characterized long QT syn-drome . J Am Coll Cardiol . 1997;29:93–99 .
144 . Kannankeril P, Roden DM, Darbar D . Drug-induced long QT syndrome . Pharmacol Rev . 2010;62:760–781 .
145 . Camm AJ, Janse MJ, Roden DM, Rosen MR, Cinca J, Cobbe SM . Congen-ital and acquired long QT syndrome . Eur Heart J . 2000;21:1232–1237 .
146 . Gupta A, Lawrence AT, Krishnan K, Kavinsky CJ, Trohman RG . Cur-rent concepts in the mechanisms and management of drug-induced QT prolongation and torsade de pointes . Am Heart J . 2007;153:891–899 .
147 . Kannankeril PJ, Roden DM . Drug-induced long QT and torsade de pointes: recent advances . Curr Opin Cardiol . 2007;22:39–43 .
148 . Lewis BH, Antman EM, Graboys TB . Detailed analysis of 24 hour ambu-latory electrocardiographic recordings during ventricular fibrillation or torsade de pointes . J Am Coll Cardiol . 1983;2:426–436 .
149 . Zeltser D, Justo D, Halkin A, Prokhorov V, Heller K, Viskin S . Torsade de pointes due to noncardiac drugs: most patients have easily identifiable risk factors . Medicine (Baltimore) . 2003;82:282–290 .
150 . Faber TS, Zehender M, Just H . Drug-induced torsade de pointes: inci-dence, management and prevention . Drug Saf . 1994;11:463–476 .
151 . Middlekauff HR, Stevenson WG, Saxon LA, Stevenson LW . Amiodarone and torsades de pointes in patients with advanced heart failure . Am J Cardiol . 1995;76:499–502 .
152 . Straus SM, Bleumink GS, Dieleman JP, van der Lei J, ‘t Jong GW, Kingma JH, Sturkenboom MC, Stricker BH . Antipsychotics and the risk of sudden cardiac death [published correction appears in Arch Intern Med . 2004;164:1839] . Arch Intern Med . 2004;164:1293–1297 .
153 . Pearson EC, Woosley RL . QT prolongation and torsades de pointes among methadone users: reports to the FDA spontaneous reporting sys-tem . Pharmacoepidemiol Drug Saf . 2005;14:747–753 .
154 . Doig JC . Drug-induced cardiac arrhythmias: incidence, prevention and management . Drug Saf . 1997;17:265–275 .
155 . Jacobs I, Nadkarni V, Bahr J, Berg RA, Billi JE, Bossaert L, Cassan P, Coovadia A, D’Este K, Finn J, Halperin H, Handley A, Herlitz J, Hickey R, Idris A, Kloeck W, Larkin GL, Mancini ME, Mason P, Mears G, Monsieurs K, Montgomery W, Morley P, Nichol G, Nolan J, Okada K, Perlman J, Shuster M, Steen PA, Sterz F, Tibballs J, Timerman S, Truitt T, Zideman D; ILCOR Task Force on Cardiac Arrest and Cardiopulmo-nary Resuscitation Outcomes . Cardiac arrest and cardiopulmonary re-suscitation outcome reports: update and simplification of the Utstein templates for resuscitation registries: a statement for healthcare pro-fessionals from a task force of the International Liaison Committee on Resuscitation (American Heart Association, European Resuscitation Council, Australian Resuscitation Council, New Zealand Resuscitation Council, Heart and Stroke Foundation of Canada, InterAmerican Heart
Foundation, Resuscitation Councils of Southern Africa) . Circulation . 2004;110:3385–3397 .
156 . Chugh SS, Jui J, Gunson K, Stecker EC, John BT, Thompson B, Ilias N, Vickers C, Dogra V, Daya M, Kron J, Zheng ZJ, Mensah G, McAnulty J . Current burden of sudden cardiac death: multiple source surveillance versus retrospective death certificate-based review in a large U .S . com-munity . J Am Coll Cardiol . 2004;44:1268–1275 .
157 . Müller D, Agrawal R, Arntz HR . How sudden is sudden cardiac death? Circulation . 2006;114:1146–1150 .
158 . Nichol G, Thomas E, Callaway CW, Hedges J, Powell JL, Aufder-heide TP, Rea T, Lowe R, Brown T, Dreyer J, Davis D, Idris A, Sti-ell I; Resuscitation Outcomes Consortium Investigators . Regional variation in out-of-hospital cardiac arrest incidence and outcome . JAMA . 2008;300:1423–1431 .
159 . Cobb LA, Fahrenbruch CE, Olsufka M, Copass MK . Changing inci-dence of out-of-hospital ventricular fibrillation, 1980-2000 . JAMA . 2002;288:3008–3013 .
160 . Galea S, Blaney S, Nandi A, Silverman R, Vlahov D, Foltin G, Kusick M, Tunik M, Richmond N . Explaining racial disparities in incidence of and survival from out-of-hospital cardiac arrest . Am J Epidemiol . 2007;166:534–543 .
161 . Rea TD, Pearce RM, Raghunathan TE, Lemaitre RN, Sotoodehnia N, Jouven X, Siscovick DS . Incidence of out-of-hospital cardiac arrest . Am J Cardiol . 2004;93:1455–1460 .
162 . Friedlander Y, Siscovick DS, Weinmann S, Austin MA, Psaty BM, Lemaitre RN, Arbogast P, Raghunathan TE, Cobb LA . Family his-tory as a risk factor for primary cardiac arrest . Circulation . 1998;97: 155–160 .
163 . Jouven X, Desnos M, Guerot C, Ducimetière P . Predicting sudden death in the population: the Paris Prospective Study I . Circulation . 1999;99:1978–1983 .
164 . Chiuve SE, Fung TT, Rexrode KM, Spiegelman D, Manson JE, Stampfer MJ, Albert CM . Adherence to a low-risk, healthy lifestyle and risk of sudden cardiac death among women . JAMA . 2011;306:62–69 .
165 . Kim JH, Malhotra R, Chiampas G, d’Hemecourt P, Troyanos C, Cianca J, Smith RN, Wang TJ, Roberts WO, Thompson PD, Baggish AL; Race As-sociated Cardiac Arrest Event Registry (RACER) Study Group . Cardiac ar-rest during long-distance running races . N Engl J Med . 2012;366:130–140 .
166 . Maron BJ, Doerer JJ, Haas TS, Tierney DM, Mueller FO . Sudden deaths in young competitive athletes: analysis of 1866 deaths in the United States, 1980-2006 . Circulation . 2009;119:1085–1092 .
167 . Harmon KG, Asif IM, Klossner D, Drezner JA . Incidence of sudden car-diac death in National Collegiate Athletic Association athletes . Circula-tion . 2011;123:1594–1600 .
168 . Merchant RM, Yang L, Becker LB, Berg RA, Nadkarni V, Nichol G, Carr BG, Mitra N, Bradley SM, Abella BS, Groeneveld PW; American Heart Association Get With The Guidelines-Resuscitation Investigators . Incidence of treated cardiac arrest in hospitalized patients in the United States . Crit Care Med . 2011;39:2401–2406 .
169 . Wedekind H, Burde D, Zumhagen S, Debus V, Burkhardtsmaier G, Mönnig G, Breithardt G, Schulze-Bahr E . QT interval prolongation and risk for cardiac events in genotyped LQTS-index children . Eur J Pediatr . 2009;168:1107–1115 .
170 . Goldenberg I, Zareba W, Moss AJ . Long QT syndrome . Curr Probl Cardiol . 2008;33:629–694 .
171 . Schwartz PJ, Stramba-Badiale M, Crotti L, Pedrazzini M, Besana A, Bosi G, Gabbarini F, Goulene K, Insolia R, Mannarino S, Mosca F, Nespoli L, Rimini A, Rosati E, Salice P, Spazzolini C . Prevalence of the congenital long-QT syndrome . Circulation . 2009;120:1761–1767 .
172 . Hayashi K, Fujino N, Uchiyama K, Ino H, Sakata K, Konno T, Masuta E, Funada A, Sakamoto Y, Tsubokawa T, Nakashima K, Liu L, Higashida H, Hiramaru Y, Shimizu M, Yamagishi M . Long QT syndrome and asso-ciated gene mutation carriers in Japanese children: results from ECG screening examinations . Clin Sci . 2009;117:415–424 .
173 . Fugate T 2nd, Moss AJ, Jons C, McNitt S, Mullally J, Ouellet G, Goldenberg I, Zareba W, Robinson JL; U .S . portion of International Long QT Syndrome Registry Investigators . Long QT syndrome in Afri-can-Americans . Ann Noninvasive Electrocardiol . 2010;15:73–76 .
174 . Goldenberg I, Bradley J, Moss A, McNitt S, Polonsky S, Robinson JL, Andrews M, Zareba W; International LQTS Registry Investigators . Beta-blocker efficacy in high-risk patients with the congenital long-QT syn-drome types 1 and 2: implications for patient management . J Cardiovasc Electrophysiol . 2010;21:893–901 .
175 . Seth R, Moss AJ, McNitt S, Zareba W, Andrews ML, Qi M, Robinson JL, Goldenberg I, Ackerman MJ, Benhorin J, Kaufman ES, Locati EH,
by guest on December 16, 2013http://circ.ahajournals.org/Downloaded from

Heart Disease and Stroke Statistics—2013 Update: Chapter 16 e173
Napolitano C, Priori SG, Schwartz PJ, Towbin JA, Vincent GM, Zhang L . Long QT syndrome and pregnancy . J Am Coll Cardiol . 2007;49:1092–1098 .
176 . Zareba W, Moss AJ, Daubert JP, Hall WJ, Robinson JL, Andrews M . Implantable cardioverter defibrillator in high-risk long QT syndrome pa-tients . J Cardiovasc Electrophysiol . 2003;14:337–341 .
177 . Cross B, Homoud M, Link M, Foote C, Garlitski AC, Weinstock J, Estes NA 3rd . The short QT syndrome . J Interv Card Electrophysiol . 2011;31:25–31 .
178 . Kobza R, Roos M, Niggli B, Abächerli R, Lupi GA, Frey F, Schmid JJ, Erne P . Prevalence of long and short QT in a young population of 41,767 predominantly male Swiss conscripts . Heart Rhythm . 2009;6:652–657 .
179 . Giustetto C, Schimpf R, Mazzanti A, Scrocco C, Maury P, Anttonen O, Probst V, Blanc JJ, Sbragia P, Dalmasso P, Borggrefe M, Gaita F . Long-term follow-up of patients with short QT syndrome . J Am Coll Cardiol . 2011;58:587–595 .
180 . Benito B, Brugada J, Brugada R, Brugada P . Brugada syndrome [pub-lished correction appears in Rev Esp Cardiol . 2010;63:620] . Rev Esp Cardiol . 2009;62:1297–1315 .
181 . Miyasaka Y, Tsuji H, Yamada K, Tokunaga S, Saito D, Imuro Y, Matsumoto N, Iwasaka T . Prevalence and mortality of the Bruga-da-type electrocardiogram in one city in Japan . J Am Coll Cardiol . 2001;38:771–774 .
182 . Baron RC, Thacker SB, Gorelkin L, Vernon AA, Taylor WR, Choi K . Sudden death among Southeast Asian refugees: an unexplained nocturnal phenomenon . JAMA . 1983;250:2947–2951 .
183 . Nademanee K, Veerakul G, Nimmannit S, Chaowakul V, Bhuripanyo K, Likittanasombat K, Tunsanga K, Kuasirikul S, Malasit P, Tansupasawa-dikul S, Tatsanavivat P . Arrhythmogenic marker for the sudden unex-plained death syndrome in Thai men . Circulation . 1997;96:2595–2600 .
184 . Gilbert J, Gold RL, Haffajee CI, Alpert JS . Sudden cardiac death in a southeast Asian immigrant: clinical, electrophysiologic, and biopsy char-acteristics . Pacing Clin Electrophysiol . 1986;9(pt 1):912–914 .
185 . Hermida JS, Lemoine JL, Aoun FB, Jarry G, Rey JL, Quiret JC . Preva-lence of the Brugada syndrome in an apparently healthy population . Am J Cardiol . 2000;86:91–94 .
186 . Probst V, Veltmann C, Eckardt L, Meregalli PG, Gaita F, Tan HL, Babuty D, Sacher F, Giustetto C, Schulze-Bahr E, Borggrefe M, Haissaguerre M, Mabo P, Le Marec H, Wolpert C, Wilde AA . Long-term prognosis of patients diagnosed with Brugada syndrome: results from the FINGER Brugada Syndrome Registry . Circulation . 2010;121:635–643 .
187 . Kamakura S, Ohe T, Nakazawa K, Aizawa Y, Shimizu A, Horie M, Ogawa S, Okumura K, Tsuchihashi K, Sugi K, Makita N, Hagiwara N, Inoue H, Atarashi H, Aihara N, Shimizu W, Kurita T, Suyama K, Noda T, Satomi K, Okamura H, Tomoike H; Brugada Syndrome Investigators in Japan . Long-term prognosis of probands with Brugada-pattern ST-eleva-tion in leads V1-V3 . Circ Arrhythm Electrophysiol . 2009;2:495–503 .
188 . Laitinen PJ, Brown KM, Piippo K, Swan H, Devaney JM, Brahmbhatt B, Donarum EA, Marino M, Tiso N, Viitasalo M, Toivonen L, Stephan DA, Kontula K . Mutations of the cardiac ryanodine receptor (RyR2) gene in familial polymorphic ventricular tachycardia . Circulation . 2001;103:485–490 .
189 . Priori SG, Napolitano C, Tiso N, Memmi M, Vignati G, Bloise R, Sor-rentino V, Danieli GA . Mutations in the cardiac ryanodine receptor gene (hRyR2) underlie catecholaminergic polymorphic ventricular tachycar-dia . Circulation . 2001;103:196–200 .
190 . Lahat H, Pras E, Olender T, Avidan N, Ben-Asher E, Man O, Levy-Nissenbaum E, Khoury A, Lorber A, Goldman B, Lancet D, Eldar M . A missense mutation in a highly conserved region of CASQ2 is associated with autosomal recessive catecholamine-induced polymor-phic ventricular tachycardia in Bedouin families from Israel . Am J Hum Genet . 2001;69:1378–1384 .
191 . Postma AV, Denjoy I, Hoorntje TM, Lupoglazoff JM, Da Costa A, Sebillon P, Mannens MM, Wilde AA, Guicheney P . Absence of calse-questrin 2 causes severe forms of catecholaminergic polymorphic ven-tricular tachycardia . Circ Res . 2002;91:e21–e26 .
192 . Hayashi M, Denjoy I, Extramiana F, Maltret A, Buisson NR, Lupoglazoff JM, Klug D, Hayashi M, Takatsuki S, Villain E, Kamblock J, Messali A, Guicheney P, Lunardi J, Leenhardt A . Incidence and risk factors of arrhythmic events in catecholaminergic polymorphic ventricular tachy-cardia . Circulation . 2009;119:2426–2434 .
193 . Sumitomo N, Harada K, Nagashima M, Yasuda T, Nakamura Y, Aragaki Y, Saito A, Kurosaki K, Jouo K, Koujiro M, Konishi S, Matsuoka S, Oono T, Hayakawa S, Miura M, Ushinohama H, Shibata T, Niimura I . Catechol-aminergic polymorphic ventricular tachycardia: electrocardiographic
characteristics and optimal therapeutic strategies to prevent sudden death . Heart . 2003;89:66–70 .
194 . Sy RW, Gollob MH, Klein GJ, Yee R, Skanes AC, Gula LJ, Leong-Sit P, Gow RM, Green MS, Birnie DH, Krahn AD . Arrhythmia characteriza-tion and long-term outcomes in catecholaminergic polymorphic ventric-ular tachycardia . Heart Rhythm . 2011;8:864–871 .
195 . Hamilton RM . Arrhythmogenic right ventricular cardiomyopathy . Pac-ing Clin Electrophysiol . 2009;32(suppl 2):S44–S51 .
196 . Peters S, Trümmel M, Meyners W . Prevalence of right ventricular dysplasia-cardiomyopathy in a non-referral hospital . Int J Cardiol . 2004;97:499–501 .
197 . Dalal D, Nasir K, Bomma C, Prakasa K, Tandri H, Piccini J, Roguin A, Tichnell C, James C, Russell SD, Judge DP, Abraham T, Spevak PJ, Bluemke DA, Calkins H . Arrhythmogenic right ventricular dysplasia: a United States experience . Circulation . 2005;112:3823–3832 .
198 . Hulot JS, Jouven X, Empana JP, Frank R, Fontaine G . Natural history and risk stratification of arrhythmogenic right ventricular dysplasia/car-diomyopathy . Circulation . 2004;110:1879–1884 .
199 . Maron BJ, Olivotto I, Spirito P, Casey SA, Bellone P, Gohman TE, Graham KJ, Burton DA, Cecchi F . Epidemiology of hypertrophic cardio-myopathy-related death: revisited in a large non-referral-based patient population . Circulation . 2000;102:858–864 .
200 . Spirito P, Bellone P, Harris KM, Bernabo P, Bruzzi P, Maron BJ . Magni-tude of left ventricular hypertrophy and risk of sudden death in hypertro-phic cardiomyopathy . N Engl J Med . 2000;342:1778–1785 .
201 . Elliott PM, Gimeno Blanes JR, Mahon NG, Poloniecki JD, McKenna WJ . Relation between severity of left-ventricular hypertrophy and prognosis in patients with hypertrophic cardiomyopathy . Lancet . 2001;357:420–424 .
202 . Olivotto I, Gistri R, Petrone P, Pedemonte E, Vargiu D, Cecchi F . Maxi-mum left ventricular thickness and risk of sudden death in patients with hypertrophic cardiomyopathy . J Am Coll Cardiol . 2003;41:315–321 .
203 . Monserrat L, Elliott PM, Gimeno JR, Sharma S, Penas-Lado M, McKenna WJ . Non-sustained ventricular tachycardia in hypertrophic cardiomyopathy: an independent marker of sudden death risk in young patients . J Am Coll Cardiol . 2003;42:873–879 .
204 . Adabag AS, Casey SA, Kuskowski MA, Zenovich AG, Maron BJ . Spec-trum and prognostic significance of arrhythmias on ambulatory Holter electrocardiogram in hypertrophic cardiomyopathy . J Am Coll Cardiol . 2005;45:697–704 .
205 . Kofflard MJ, Ten Cate FJ, van der Lee C, van Domburg RT . Hypertro-phic cardiomyopathy in a large community-based population: clinical outcome and identification of risk factors for sudden cardiac death and clinical deterioration . J Am Coll Cardiol . 2003;41:987–993 .
206 . Spirito P, Autore C, Rapezzi C, Bernabò P, Badagliacca R, Maron MS, Bongioanni S, Coccolo F, Estes NA, Barillà CS, Biagini E, Quarta G, Conte MR, Bruzzi P, Maron BJ . Syncope and risk of sudden death in hypertrophic cardiomyopathy . Circulation . 2009;119:1703–1710 .
207 . Maron MS, Olivotto I, Betocchi S, Casey SA, Lesser JR, Losi MA, Cecchi F, Maron BJ . Effect of left ventricular outflow tract obstruction on clinical outcome in hypertrophic cardiomyopathy . N Engl J Med . 2003;348:295–303 .
208 . Elliott PM, Gimeno JR, Tomé MT, Shah J, Ward D, Thaman R, Mogensen J, McKenna WJ . Left ventricular outflow tract obstruction and sudden death risk in patients with hypertrophic cardiomyopathy . Eur Heart J . 2006;27:1933–1941 .
209 . Efthimiadis GK, Parcharidou DG, Giannakoulas G, Pagourelias ED, Charalampidis P, Savvopoulos G, Ziakas A, Karvounis H, Styliadis IH, Parcharidis GE . Left ventricular outflow tract obstruction as a risk factor for sudden cardiac death in hypertrophic cardiomyopathy . Am J Cardiol . 2009;104:695–699 .
210 . Bos JM, Maron BJ, Ackerman MJ, Haas TS, Sorajja P, Nishimura RA, Gersh BJ, Ommen SR . Role of family history of sudden death in risk strat-ification and prevention of sudden death with implantable defibrillators in hypertrophic cardiomyopathy . Am J Cardiol . 2010;106:1481–1486 .
211 . Elliott PM, Poloniecki J, Dickie S, Sharma S, Monserrat L, Varnava A, Mahon NG, McKenna WJ . Sudden death in hypertrophic cardiomyopathy: identification of high risk patients . J Am Coll Cardiol . 2000;36:2212–2218 .
212 . Maron BJ, Spirito P, Shen WK, Haas TS, Formisano F, Link MS, Epstein AE, Almquist AK, Daubert JP, Lawrenz T, Boriani G, Estes NA 3rd, Favale S, Piccininno M, Winters SL, Santini M, Betocchi S, Arribas F, Sherrid MV, Buja G, Semsarian C, Bruzzi P . Implantable cardioverter-defibrillators and prevention of sudden cardiac death in hypertrophic cardiomyopathy [published correction appears in JAMA . 2007;298:1516] . JAMA . 2007;298:405–412 .
by guest on December 16, 2013http://circ.ahajournals.org/Downloaded from

e174 Circulation January 1/8, 2013
Table 16-1. Incidence and Outcome of Out-of-Hospital Cardiac Arrest in the United States
Overall (95% CI) Adults (95% CI) Children (95% CI)
Incidence (per 100 000)
EMS assessed 126.4 (124.0–128.8) 147.7 (144.8–150.7) 11.0 (9.6–12.4)
EMS treated 63.8 (62.1–65.4) 80.1 (77.9–82.2) 8.8 (7.6–10.1)
Bystander-witnessed shockable rhythm (including VT, VF, shockable by AED)
10.0 (9.4–10.6) 9.8 (9.0–10.6) 0.3 (0.1–0.5)
Survival to discharge, %
EMS assessed 4.8 (4.4–5.2) 5.3 (4.9–5.7) 6.3 (3.3–9.3)
EMS treated 9.5 (8.8–10.2) 9.8 (9.0–10.6) 7.8 (4.2–11.5)
Bystander-witnessed shockable rhythm 28.4 (25.1–31.8) 28.4 (25.1–31.8) 57.1 (20.4–93.8)
CI indicates confidence interval; EMS, emergency medical services; VT, ventricular tachycardia; VF, ventricular fibrillation; and AED, automated external defibrillator.Source: Resuscitation Outcomes Consortium Investigators, unpublished data, June 20, 2012.
by guest on December 16, 2013http://circ.ahajournals.org/Downloaded from
Heart Disease and Stroke Statistics—2013 Update: Chapter 17 e175
17. Subclinical Atherosclerosis
(See Table 17-1 and Chart 17-1 through 17-6.)
Atherosclerosis, a systemic disease process in which fatty deposits, inflammation, cells, and scar tissue build up within the walls of arteries, is the underlying cause of the majority of clinical cardiovascular events . Individuals who develop atherosclerosis tend to develop it in a number of different types of arteries (large and small arteries and those feeding the heart, brain, kidneys, and extremities), although they may have much more in some parts of the body than others . In recent decades, advances in imaging technology have allowed for improved ability to detect and quantify atherosclerosis at all stages and in multiple different vascular beds . Two modali-ties, computed tomography (CT) of the chest for evaluation of CAC and B-mode ultrasound of the neck for evaluation of carotid artery IMT, have been used in large studies with outcomes data and may help define the burden of atheroscle-rosis in individuals before they develop clinical events such as heart attack or stroke . Another commonly used method for
detecting and quantifying atherosclerosis in the peripheral arteries is the ankle-brachial index (ABI), which is discussed in Chapter 20 . Data on cardiovascular outcomes are starting to emerge for additional modalities that measure anatomic and functional measures of subclinical disease, including brachial artery reactivity testing, aortic and carotid magnetic resonance imaging, and tonometric methods of measuring vascular com-pliance or microvascular reactivity . Further research may help to define the role of these techniques in cardiovascular risk assessment . Some guidelines have recommended screening for subclinical atherosclerosis, especially by CAC, or IMT may be appropriate in people at intermediate risk for HD (eg, 10-year estimated risk of 10% to 20%) but not for lower-risk general population screening or for people with preexisting HD or most other high-risk conditions .1,2 However, a recent guideline notes those with DM who are ≥40 years of age may be suitable for screening of risk by coronary calcium . There are still limited data demonstrating whether screening with these and other imaging modalities can improve patient out-comes or whether it only increases downstream medical care costs . A recently published report in a large cohort randomly assigned to coronary calcium screening or not showed such screening to result in an improved risk factor profile without increasing downstream medical costs .3
Coronary Artery Calcification
Background
●● CAC is a measure of the burden of atherosclerosis in the heart arteries and is measured by CT . Other components of the atherosclerotic plaque, including fatty (eg, cholesterol-rich components) and fibrotic components, often accom-pany CAC and may be present even in the absence of CAC .
●● The presence of any CAC, which indicates that at least some atherosclerotic plaque is present, is defined by an Agatston score >0 . Clinically significant plaque, frequently an indication for more aggressive risk factor management, is often defined by an Agatston score ≥100 or a score ≥75th percentile for one’s age and sex . An Agatston score ≥400 has been noted to be an indication for further diagnostic evaluation (eg, exercise testing or myocardial perfusion imaging) for CAD .
●● Current guidelines provide for a modest Class IIa, Level of Evidence B recommendation for screening for coro-nary calcium in people at intermediate risk (eg, 10%–20% 10-year CHD risk) or with DM; a Class IIb, Level of Evi-dence B recommendation for those at low intermediate risk (6%–10% 10-year CHD risk); but a contraindication (Class III, Level of Evidence B) for screening those at lower risk .2
Prevalence(See Table 17-1 and Charts 17-1 and Chart 17-2.)
●● The NHLBI’s FHS reported CAC measured in 3238 white adults in age groups ranging from <45 years of age to ≥75 years of age .4
—Overall, 32 .0% of women and 52 .9% of men had preva-lent CAC .
—Among participants at intermediate risk according to FRS, 58% of women and 67% of men had prevalent CAC .
Abbreviations Used in Chapter 17
AAC aortic artery calcification
ABI ankle-brachial index
ACS acute coronary syndrome
ARIC Atherosclerosis Risk in Communities study
BMI body mass index
BP blood pressure
CAC coronary artery calcification
CAD coronary artery disease
CARDIA Coronary Artery Risk Development in Young Adults
CHD coronary heart disease
CHS Cardiovascular Health Study
CONFIRM Coronary CT Angiography Evaluation for Clinical Outcomes: An International Multicenter Registry
CT computed tomography
CVD cardiovascular disease
DBP diastolic blood pressure
DM diabetes mellitus
EISNER Early Identification of Subclinical Atherosclerosis by Noninvasive Imaging Research
FHS Framingham Heart Study
FMD flow-mediated dilation
FRS Framingham Risk Score
HBP high blood pressure
HDL high-density lipoprotein
HD heart disease
HR hazard ratio
IMT intima-media thickness
LDL low-density lipoprotein
MESA Multi-Ethnic Study of Atherosclerosis
NHLBI National Heart, Lung, and Blood Institute
RR relative risk
SBP systolic blood pressure
by guest on December 16, 2013http://circ.ahajournals.org/Downloaded from
e176 Circulation January 1/8, 2013
●● The NHLBI’s CARDIA study measured CAC in 3043 black and white adults 33 to 45 years of age (at the CARDIA year 15 examination) .5
—Overall, 15 .0% of men and 5 .1% of women, 5 .5% of those 33 to 39 years of age and 13 .3% of those 40 to 45 years of age, had prevalent CAC . Overall, 1 .6% of participants had an Agatston score that exceeded 100 .
—The prevalence of CAC was lower in black men than in white men but was similar in black and white women at these ages .
●● The NHLBI’s MESA measured CAC in 6814 participants 45 to 84 years of age, including white (n=2619), black (n=1898), Hispanic (n=1494), and Chinese (n=803) men and women .6
—The prevalence and 75th percentile levels of CAC were highest in white men and lowest in black and Hispanic women . Significant ethnic differences persisted after adjustment for risk factors, with the RR of coronary cal-cium being 22% less in blacks, 15% less in Hispanics, and 8% less in Chinese than in whites .
—Table 17-1 shows the 75th percentile levels of CAC by sex and race at selected ages . These might be considered cut points above which more aggressive efforts to con-trol risk factors (eg, elevated cholesterol or BP) could be implemented and/or at which treatment goals might be more aggressive (eg, LDL cholesterol <100 mg/dL instead of <130 mg/dL) .
●● The prevalence of CAC varies widely according to FRS . In a report from MESA,7 the prevalence of CAC among individuals with very low FRS (10-year risk <5%) was low . These findings may have important implications for popu-lation screening for subclinical atherosclerosis .
●● Investigators from the NHLBI’s CARDIA study exam-ined the association between neighborhood attributes and subclinical atherosclerosis in younger adult populations . Using 2000 US Census block-group–level data, among women, higher odds of CAC were associated with higher neighborhood deprivation and lower neighborhood cohe-sion . Among all men, neither neighborhood deprivation nor neighborhood cohesion was associated with CAC, whereas among men in deprived neighborhoods, low cohesion was associated with higher odds of CAC .8
CAC and Incidence of Coronary Events(See Chart 17-3 and 17-4.)
●● The NHLBI’s MESA recently reported on the association of CAC scores with first CHD events over a median follow-up of 3 .9 years among a population-based sample of 6722 men and women (39% white, 27% black, 22% Hispanic, and 12% Chinese) .9
—People with CAC scores of 1 to 100 had ≈4 times greater risk and those with CAC scores >100 were 7 to 10 times more likely to experience a coronary event than those without CAC .
—CAC provided similar predictive value for coronary events in whites, Chinese, blacks, and Hispanics (HRs ranging from 1 .15–1 .39 for each doubling of coronary calcium) .
●● In another report of a community-based sample, not referred for clinical reasons, the South Bay Heart Watch examined
CAC in 1461 adults (average age 66 years) with coronary risk factors, with a median of 7 .0 years of follow-up .10
●● In a study of healthy adults 60 to 72 years of age who were free of clinical CAD, predictors of the progression of CAC were assessed . Predictors tested included age, sex, race/ethnicity, smoking status, BMI, family history of CAD, C-reactive protein, several measures of DM, insu-lin levels, BP, and lipids . Insulin resistance, in addition to the traditional cardiac risk factors, independently predicts progression of CAC .11 Clinically, however, it is not yet rec-ommended to conduct serial scanning of CAC to measure effects of therapeutic interventions .
●● A recent publication from MESA also used CAC, in particular, and carotid IMT to stratify CHD and CVD event risk in people with metabolic syndrome and DM; those with low levels of CAC or carotid IMT have CHD and CVD event rates as low as many people without metabolic syndrome and DM . Those with DM who have CAC scores <100 have annual CHD event rates of <1% .12
●● It is noteworthy, as recently demonstrated in MESA in 5878 participants with a median of 5 .8 years of follow-up, that the addition of CAC to standard risk factors resulted in significant improvement of classification of risk for inci-dent CHD events, placing 77% of people in the highest or lowest risk categories compared with 69% based on risk factors alone . An additional 23% of those who experienced events were reclassified as high risk, and 13% with events were reclassified as low risk .13
●● The contribution of CAC to risk prediction has also been observed in other cohorts, including both the Heinz Nix-dorf Recall study14 and the Rotterdam study .15
●● In MESA, among 6603 people aged 45 to 84 years (1686 or 25% with metabolic syndrome without DM and 881 or 13% with DM), subclinical atherosclerosis assessed by CAC was more severe in people with metabolic syndrome and DM than in those without these conditions, and the extent of CAC was a strong predictor of CHD and CVD events in these groups, with CAC increasing the C statistic significantly (P<0 .001) over other risk factors in each of these groups .12
CAC Progression and Risk
●● A recent report in 4609 individuals who had baseline and repeat cardiac CT found that progression of CAC in pre-dicting future all-cause mortality provided only incremen-tal information over baseline score, demographics, and cardiovascular risk factors .16
●● Furthermore, in MESA, among 5662 subjects aged 45 to 84 years who received baseline and follow-up CT scans, the progression of CAC was greater in people with metabolic syndrome and DM than in those without, and greater pro-gression of CAC in these groups was also associated with greater risk for CHD events .17
Abdominal Aortic Calcification and Multisite Atherosclerosis
●● Abdominal aortic calcification (AAC) can be measured by CT and at most age groups is at a higher prevalence than CAC . In MESA, AAC prevalence ranged from 34%
by guest on December 16, 2013http://circ.ahajournals.org/Downloaded from
Heart Disease and Stroke Statistics—2013 Update: Chapter 17 e177
in those aged 45 to 54 years to 94% in those aged 75 to 84 years . Prevalence was significantly higher in Caucasians (79%) and lowest in blacks (62%) . The prevalence of CAC, increased carotid IMT, and abnormal ABI was also greater in those with versus without AAC, and by age 65 years, 97% of men and 91% of women had either AAC, CAC, increased carotid IMT, or low ABI . Three or more of these conditions (“multisite atherosclerosis”) were present in 20% of women and 30% of men .18
●● In addition, AAC was significantly associated with cigarette smoking and dyslipidemia, whereas CAC showed much weaker associations; age and hypertension were associated similarly and significantly with AAC and CAC . AAC was more strongly correlated with most CVD risk factors than was CAC .19
●● At present, however, no recommendations exist for screen-ing of AAC for assessment of cardiovascular risk because of the limited data available .
Carotid IMT
Background
●● Carotid IMT measures the thickness of 2 layers (the intima and media) of the wall of the carotid arteries, the largest conduits of blood going to the brain . Carotid IMT is thought to be an even earlier manifestation of atherosclerosis than CAC, because thickening precedes the development of frank atherosclerotic plaque . Carotid IMT methods are still being refined, so it is important to know which part of the artery was measured (common carotid, internal carotid, or bulb) and whether near and far walls were both measured . This information can affect the average-thickness measure-ment that is usually reported .
●● Unlike CAC, everyone has some thickness to the layers of their arteries, but people who develop atherosclerosis have greater thickness . Ultrasound of the carotid arteries can also detect plaques and determine the degree of narrowing of the artery they may cause . Epidemiological data, includ-ing the data discussed below, have indicated that high-risk levels of thickening might be considered as those in the highest quartile or quintile for one’s age and sex, or ≥1 mm .
●● Although ultrasound is commonly used to diagnose plaque in the carotid arteries in people who have had strokes or who have bruits (sounds of turbulence in the artery), guide-lines are limited as to screening of asymptomatic people with carotid IMT to quantify atherosclerosis or predict risk . However, some organizations have recognized that carotid IMT measurement by B-mode ultrasonography may pro-vide an independent assessment of coronary risk .20 For those at intermediate CHD risk (eg, 10%–20% 10-year CHD risk), a Class IIa, Level of Evidence B recommenda-tion has been noted for the use of carotid IMT in screening asymptomatic people .2
Prevalence and Association With Incident Cardiovascular Events(See Chart 17-5 and 17-6.)
●● The Bogalusa Heart Study measured carotid IMT in 518 black and white men and women at a mean age of 32±3 years . These men and women were healthy but overweight .21
—Men had significantly higher carotid IMT in all segments than women, and blacks had higher common carotid and carotid bulb IMTs than whites .
—Even at this young age, after adjustment for age, race, and sex, carotid IMT was associated significantly and positively with waist circumference, SBP, DBP, and LDL cholesterol . Carotid IMT was inversely correlated with HDL cholesterol levels . Participants with greater numbers of adverse risk factors (0, 1, 2, 3, or more) had stepwise increases in mean carotid IMT levels .
●● In a subsequent analysis, the Bogalusa investigators examined the association of risk factors measured since childhood with carotid IMT measured in these young adults .22 Higher BMI and LDL cholesterol levels measured at 4 to 7 years of age were associated with increased risk for being >75th percentile for carotid IMT in young adulthood . Higher SBP and LDL cholesterol and lower HDL cholesterol in young adulthood were also associated with having high carotid IMT . These data highlight the importance of adverse risk factor levels in early childhood and young adulthood in the early development of atherosclerosis .
●● Among both women and men in MESA, blacks had the highest common carotid IMT, but they were similar to whites and Hispanics in internal carotid IMT . Chinese par-ticipants had the lowest carotid IMT, in particular in the internal carotid, of the 4 ethnic groups .23
●● The NHLBI’s CHS reported follow-up of 4476 men and women ≥65years of age (mean age 72 years) who were free of CVD at baseline .24
—Mean maximal common carotid IMT was 1 .03±0 .20 mm, and mean internal carotid IMT was 1 .37±0 .55 mm .
—After a mean follow-up of 6 .2 years, those with maximal combined carotid IMT in the highest quintile had a 4-to 5-fold greater risk for incident heart attack or stroke than those in the bottom quintile . After adjustment for other risk factors, there was still a 2- to 3-fold greater risk for the top versus the bottom quintile .
●● A study of 441 individuals ≤65 years of age without a his-tory of CAD, DM, or hyperlipidemia who were examined for carotid IMT found 42% had high-risk carotid ultrasound findings (carotid IMT ≥75th percentile adjusted for age, sex, and race or presence of plaque) . Among those with an FRS ≤5%, 38% had high-risk carotid ultrasound findings .25
●● Conflicting data have been reported on the contribution of carotid IMT to risk prediction . In 13 145 participants in the NHLBI’s ARIC study, the addition of carotid IMT combined with identification of plaque presence or absence to traditional risk factors reclassified risk in 23% of indi-viduals overall, with a net reclassification improvement of 9 .9% . There was a modest but statistically significant improvement in the area under the receiver operating char-acteristic curve, from 0 .742 to 0 .755 .26 In contrast, data reported recently from the Carotid Atherosclerosis Progres-sion Study observed a net reclassification improvement of −1 .4% that was not statistically significant .27
CAC and Carotid IMT
●● In the NHLBI’s MESA, a study of white, black, Chinese, and Hispanic adults 45 to 84 years of age, carotid IMT and
by guest on December 16, 2013http://circ.ahajournals.org/Downloaded from

e178 Circulation January 1/8, 2013
CAC were found to be commonly associated, but patterns of association differed somewhat by sex and race .23
—Common and internal carotid IMT were greater in women and men who had CAC than in those who did not, regardless of ethnicity .
—Overall, CAC prevalence and scores were associated with carotid IMT, but associations were somewhat weaker in blacks than in other ethnic groups .
—In general, blacks had the thickest carotid IMT of all 4 ethnic groups, regardless of the presence of CAC .
—Common carotid IMT differed little by race/ethnicity in women with any CAC, but among women with no CAC, IMT was higher among blacks (0 .86 mm) than in the other 3 groups (0 .76–0 .80 mm) .
●● In a more recent analysis from the NHLBI’s MESA, the investigators reported on follow-up of 6698 men and women in 4 ethnic groups over 5 .3 years and compared the predictive utility of carotid IMT and CAC .28
—CAC was associated more strongly than carotid IMT with the risk of incident CVD .
—After adjustment for each other (CAC score and IMT) and for traditional CVD risk factors, the HR for CVD increased 2 .1-fold for each 1-standard deviation incre-ment of log-transformed CAC score versus 1 .3-fold for each 1-standard deviation increment of the maximum carotid IMT .
—For CHD events, the HRs per 1-standard deviation incre-ment increased 2 .5-fold for CAC score and 1 .2-fold for IMT .
—A receiver operating characteristic curve analysis also suggested that CAC score was a better predictor of inci-dent CVD than was IMT, with areas under the curve of 0 .81 versus 0 .78, respectively .
—Investigators from the NHLBI’s CARDIA and MESA studies examined the burden and progression of sub-clinical atherosclerosis among adults <50 years of age . Ten-year and lifetime risks for CVD were estimated for each participant, and the participants were stratified into 3 groups: (1) those with low 10-year (<10%) and low lifetime (<39%) predicted risk for CVD; (2) those with low 10-year (<10%) but high lifetime (≥39%) predicted risk; and (3) those with high 10-year risk (>10%) . The latter group had the highest burden and greatest pro-gression of subclinical atherosclerosis . Given the young age of those studied, ≈90% of participants were at low 10-year risk, but of these, half had high predicted lifetime risk . Compared with those with low short-term/low life-time predicted risks, those with low short-term/high life-time predicted risk had significantly greater burden and progression of CAC and significantly greater burden of carotid IMT, even at these younger ages . These data con-firm the importance of early exposure to risk factors for the onset and progression of subclinical atherosclerosis .29
CT AngiographyCT angiography is widely used by cardiologists to aid in the diagnosis of CAD, particularly when other test results may be equivocal . It is also of interest because of its ability to detect and possibly quantitate overall plaque burden and certain
characteristics of plaques that may make them prone to rup-ture, such as positive remodeling or low attenuation .
●● In a study of 1059 subjects undergoing CT angiography, those who exhibited both positive remodeling and low-attenuation plaques <30 Hounsfield units on CT had the greatest risk of developing future ACS .30
However, because of the limited outcome data in asymptomatic people, as well as the associated expense and risk of CT angiography (including generally higher radiation levels than CT scanning to detect CAC), current guidelines do not recommend its use as a screening tool for assessment of cardiovascular risk in asymptomatic people (Class III, Level of Evidence C) .2
●● In symptomatic individuals, however, the CONFIRM reg-istry (Coronary CT Angiography Evaluation for Clinical Outcomes: An International Multicenter Registry) showed that even if the CAC score was 0, obstructive CAD was possible and was associated with an increased risk of car-diovascular events (HR of 5 .7 in those with ≥50% stenosis versus no obstructive CAD when the CAC score was 0) .31
●● In addition, a recent meta-analysis of 11 studies that included 7335 people with suspected CAD showed those with at least 1 significant coronary stenosis from CT angi-ography had an annualized event rate of 11 .9% and an HR of 10 .7 for incident cardiovascular events, which was not attenuated by adjustment for coronary calcium .32
Measures of Vascular Function and Incident CVD Events
Background
●● Measures of arterial tonometry (stiffness) are based on the concept that pulse pressure has been shown to be an impor-tant risk factor for CVD . Arterial tonometry offers the ability to directly and noninvasively measure central pulse wave velocity in the thoracic and abdominal aorta .
●● Brachial FMD is a marker for nitric oxide release from the endothelium that can be measured by ultrasound . Impaired FMD is an early marker of CVD .
●● Recommendations have not been specific, however, as to which, if any, measures of vascular function may be useful for CVD risk stratification in selected patient subgroups . Because of the absence of significant prospective data relating these measures to outcomes, latest guidelines do not currently recommend measuring either FMD (Class III, Level of Evidence B) or arterial stiffness (Class III, Level of Evidence C) for cardiovascular risk assessment in asymptomatic adults .2
Arterial Tonometry and CVD
●● The Rotterdam Study measured arterial stiffness in 2835 elderly participants (mean age 71 years) .33 They found that as aortic pulse wave velocity increased, the hazard risk of CHD was 1 .72 (second versus first tertile) and 2 .45 (third versus first tertile) . Results remained robust even after accounting for carotid IMT, ABI, and pulse pressure .
by guest on December 16, 2013http://circ.ahajournals.org/Downloaded from

Heart Disease and Stroke Statistics—2013 Update: Chapter 17 e179
●● A study from Denmark of 1678 individuals 40 to 70 years of age found that each 1–standard deviation increment in aortic pulse wave velocity increased CVD risk by 16% to 20% .34
●● The FHS measured several indices of arterial stiffness, including pulse wave velocity, wave reflection, and cen-tral pulse pressure .35 They found that not only was higher pulse wave velocity associated with a 48% increased risk of incident CVD events, but pulse wave velocity additionally improved CVD risk prediction (integrated discrimination improvement of 0 .7%, P<0 .05) .
FMD and CVDMESA measured FMD in 3026 participants (mean age 61 years) who were free of CVD . As FMD increased (ie, improved brachial function), the risk of CVD was 16% lower .36 FMD also improved CVD risk prediction compared with the FRS by improving net reclassification by 29% .
Impact of Subclinical Disease Screening on Behavior and RiskThere are limited observational and clinical trial data to show whether screening for subclinical disease can result in initia-tion of beneficial lifestyle or preventive therapies .
●● In a 1996 study of 703 men and women who underwent coronary calcium scanning, after adjustment for age, sex, preexisting high cholesterol, HBP, cigarette smoking, and a positive family history of CAD, the natural log of total calcium score remained associated with new aspirin usage, new cholesterol medication usage, consultation with a phy-sician, weight loss, and decreases in dietary fat .37
●● More recently, among 980 people referred for coronary calcium scanning, in multivariable analysis, greater base-line CAC score was strongly associated with initiation of aspirin therapy, dietary changes, and increased exercise .38
●● A recent study examining the effects of an office-based ultrasound screening intervention in 355 subjects aged ≥40 years with at least 1 risk factor showed that the presence of an abnormal carotid ultrasound significantly altered physi-cians’ prescription of aspirin and cholesterol medicine and subjects’ awareness of CVD risk and intentions to make exercise and diet changes and quit smoking; an abnormal carotid ultrasound also predicted reduced dietary sodium and increased fiber intake .39
●● In the only large-scale randomized clinical trial to date involving CAC scanning, the EISNER study (Early Iden-tification of Subclinical Atherosclerosis by Noninvasive Imaging Research), among 2137 adults randomized 2:1 to scanning versus no scanning, those scanned showed a net favorable change in SBP, LDL cholesterol, and waist cir-cumference among those with abnormal waist girth and no change in FRS compared with an increase in FRS in those who were not scanned . In addition, the higher the baseline CAC score, the greater the improvement in BP, total and LDL cholesterol, triglycerides, weight, and FRS . Impor-tantly, downstream medical testing and costs were compa-rable between groups .3
References 1 . Budoff MJ, Achenbach S, Blumenthal RS, Carr JJ, Goldin JG, Greenland
P, Guerci AD, Lima JA, Rader DJ, Rubin GD, Shaw LJ, Wiegers SE .
Assessment of coronary artery disease by cardiac computed tomography: a scientific statement from the American Heart Association Committee on Cardiovascular Imaging and Intervention, Council on Cardiovascular Radiology and Intervention, and Committee on Cardiac Imaging, Council on Clinical Cardiology . Circulation . 2006;114:1761–1791 .
2 . Greenland P, Alpert JS, Beller GA, Benjamin EJ, Budoff MJ, Fayad ZA, Foster E, Hlatky MA, Hodgson JM, Kushner FG, Lauer MS, Shaw LJ, Smith SC Jr, Taylor AJ, Weintraub WS, Wenger NK, Jacobs AK, Smith SC Jr, Anderson JL, Albert N, Buller CE, Creager MA, Ettinger SM, Guy-ton RA, Halperin JL, Hochman JS, Kushner FG, Nishimura R, Ohman EM, Page RL, Stevenson WG, Tarkington LG, Yancy CW . 2010 ACCF/AHA guideline for assessment of cardiovascular risk in asymptomatic adults: a report of the American College of Cardiology Foundation/Amer-ican Heart Association Task Force on Practice Guidelines . Circulation . 2010;122:e584–e636 .
3 . Rozanski A, Gransar H, Shaw LJ, Kim J, Miranda-Peats L, Wong ND, Rana JS, Orakzai R, Hayes SW, Friedman JD, Thomson LE, Polk D, Min J, Budoff MJ, Berman DS . Impact of coronary artery calcium scanning on coronary risk factors and downstream testing: the EISNER (Early Identi-fication of Subclinical Atherosclerosis by Noninvasive Imaging Research) prospective randomized trial . J Am Coll Cardiol . 2011;57:1622–1632 .
4 . Hoffmann U, Massaro JM, Fox CS, Manders E, O’Donnell CJ . Defin-ing normal distributions of coronary artery calcium in women and men (from the Framingham Heart Study) . Am J Cardiol . 2008;102:1136–1141, 1141 .e1 .
5 . Loria CM, Liu K, Lewis CE, Hulley SB, Sidney S, Schreiner PJ, Williams OD, Bild DE, Detrano R . Early adult risk factor levels and subsequent coronary artery calcification: the CARDIA Study . J Am Coll Cardiol . 2007;49:2013–2020 .
6 . Bild DE, Detrano R, Peterson D, Guerci A, Liu K, Shahar E, Ouy-ang P, Jackson S, Saad MF . Ethnic differences in coronary calcifica-tion: the Multi-Ethnic Study of Atherosclerosis (MESA) . Circulation . 2005;111:1313–1320 .
7 . Okwuosa TM, Greenland P, Ning H, Liu K, Bild DE, Burke GL, Eng J, Lloyd-Jones DM . Distribution of coronary artery calcium scores by Fram-ingham 10-year risk strata in the MESA (Multi-Ethnic Study of Athero-sclerosis): potential implications for coronary risk assessment . J Am Coll Cardiol . 2011;57:1838–1845 .
8 . Kim D, Diez Roux AV, Kiefe CI, Kawachi I, Liu K . Do neighborhood socioeconomic deprivation and low social cohesion predict coronary cal-cification? The CARDIA study . Am J Epidemiol . 2010;172:288–298 .
9 . Detrano R, Guerci AD, Carr JJ, Bild DE, Burke G, Folsom AR, Liu K, Shea S, Szklo M, Bluemke DA, O’Leary DH, Tracy R, Watson K, Wong ND, Kronmal RA . Coronary calcium as a predictor of coronary events in four racial or ethnic groups . N Engl J Med . 2008;358:1336–1345 .
10 . Greenland P, LaBree L, Azen SP, Doherty TM, Detrano RC . Coronary artery calcium score combined with Framingham score for risk predic-tion in asymptomatic individuals [published correction appears in JAMA . 2004;291:563] . JAMA . 2004;291:210–215 .
11 . Lee KK, Fortmann SP, Fair JM, Iribarren C, Rubin GD, Varady A, Go AS, Quertermous T, Hlatky MA . Insulin resistance independently pre-dicts the progression of coronary artery calcification . Am Heart J . 2009;157:939–945 .
12 . Malik S, Budoff MJ, Katz R, Blumenthal RS, Bertoni AG, Nasir K, Szklo M, Barr RG, Wong ND . Impact of subclinical atherosclerosis on cardiovascular disease events in individuals with metabolic syndrome and diabetes: the Multi-Ethnic Study of Atherosclerosis . Diabetes Care . 2011;34:2285–2290 .
13 . Polonsky TS, McClelland RL, Jorgensen NW, Bild DE, Burke GL, Guerci AD, Greenland P . Coronary artery calcium score and risk classification for coronary heart disease prediction . JAMA . 2010;303:1610–1616 .
14 . Erbel R, Möhlenkamp S, Moebus S, Schmermund A, Lehmann N, Stang A, Dragano N, Grönemeyer D, Seibel R, Kälsch H, Bröcker-Preuss M, Mann K, Siegrist J, Jöckel KH; Heinz Nixdorf Recall Study Investigative Group . Coronary risk stratification, discrimination, and reclassification improve-ment based on quantification of subclinical coronary atherosclerosis: the Heinz Nixdorf Recall study . J Am Coll Cardiol . 2010;56:1397–1406 .
15 . Elias-Smale SE, Proença RV, Koller MT, Kavousi M, van Rooij FJ, Hunink MG, Steyerberg EW, Hofman A, Oudkerk M, Witteman JC . Coronary calcium score improves classification of coronary heart dis-ease risk in the elderly: the Rotterdam study . J Am Coll Cardiol . 2010;56: 1407–1414 .
16 . Budoff MJ, Hokanson JE, Nasir K, Shaw LJ, Kinney GL, Chow D, Demoss D, Nuguri V, Nabavi V, Ratakonda R, Berman DS, Raggi P .
by guest on December 16, 2013http://circ.ahajournals.org/Downloaded from

e180 Circulation January 1/8, 2013
Progression of coronary artery calcium predicts all-cause mortality . JACC Cardiovasc Imaging . 2010;3:1229–1236 .
17 . Wong ND, Nelson JC, Granston T, Bertoni AG, Blumenthal RS, Carr JJ, Guerci A, Jacobs DR Jr, Kronmal R, Liu K, Saad M, Selvin E, Tracy R, Detrano R . Metabolic syndrome, diabetes, and incidence and progres-sion of coronary calcium: the Multiethnic Study of Atherosclerosis study . JACC Cardiovasc Imaging . 2012;5:358–366 .
18 . Wong ND, Lopez VA, Allison M, Detrano RC, Blumenthal RS, Folsom AR, Ouyang P, Criqui MH . Abdominal aortic calcium and multi-site ath-erosclerosis: the Multiethnic Study of Atherosclerosis . Atherosclerosis . 2011;214:436–441 .
19 . Criqui MH, Kamineni A, Allison MA, Ix JH, Carr JJ, Cushman M, De-trano R, Post W, Wong ND . Risk factor differences for aortic versus coro-nary calcified atherosclerosis: the Multiethnic Study of Atherosclerosis . Arterioscler Thromb Vasc Biol . 2010;30:2289–2296 .
20 . Smith SC Jr, Greenland P, Grundy SM . AHA Conference Proceedings . Prevention Conference V: Beyond Secondary Prevention: Identifying the High-Risk Patient for Primary Prevention: executive summary . Circula-tion . 2000;101:111–116 .
21 . Urbina EM, Srinivasan SR, Tang R, Bond MG, Kieltyka L, Berenson GS; Bogalusa Heart Study . Impact of multiple coronary risk factors on the intima-media thickness of different segments of carotid artery in healthy young adults (the Bogalusa Heart Study) . Am J Cardiol . 2002;90:953–958 .
22 . Li S, Chen W, Srinivasan SR, Bond MG, Tang R, Urbina EM, Berenson GS . Childhood cardiovascular risk factors and carotid vascular changes in adulthood: the Bogalusa Heart Study [published correction appears in JAMA . 2003;290:2943] . JAMA . 2003;290:2271–2276 .
23 . Manolio TA, Arnold AM, Post W, Bertoni AG, Schreiner PJ, Sacco RL, Saad MF, Detrano RL, Szklo M . Ethnic differences in the relationship of carotid atherosclerosis to coronary calcification: the Multi-Ethnic Study of Atherosclerosis . Atherosclerosis . 2008;197:132–138 .
24 . O’Leary DH, Polak JF, Kronmal RA, Manolio TA, Burke GL, Wolfson SK Jr; Cardiovascular Health Study Collaborative Research Group . Carotid-artery intima and media thickness as a risk factor for myocardial infarction and stroke in older adults . N Engl J Med . 1999;340:14–22 .
25 . Eleid MF, Lester SJ, Wiedenbeck TL, Patel SD, Appleton CP, Nelson MR, Humphries J, Hurst RT . Carotid ultrasound identifies high risk subclini-cal atherosclerosis in adults with low Framingham risk scores . J Am Soc Echocardiogr . 2010;23:802–808 .
26 . Nambi V, Chambless L, Folsom AR, He M, Hu Y, Mosley T, Volcik K, Boerwinkle E, Ballantyne CM . Carotid intima-media thickness and presence or absence of plaque improves prediction of coronary heart disease risk: the ARIC (Atherosclerosis Risk In Communities) study . J Am Coll Cardiol . 2010;55:1600–1607 .
27 . Lorenz MW, Schaefer C, Steinmetz H, Sitzer M . Is carotid intima media thickness useful for individual prediction of cardiovascular risk? Ten-year results from the Carotid Atherosclerosis Progression Study (CAPS) . Eur Heart J . 2010;31:2041–2048 .
28 . Folsom AR, Kronmal RA, Detrano RC, O’Leary DH, Bild DE, Bluemke DA, Budoff MJ, Liu K, Shea S, Szklo M, Tracy RP, Watson KE, Burke GL . Coronary artery calcification compared with carotid intima-media thickness in the prediction of cardiovascular disease incidence: the Multi-Ethnic Study of Atherosclerosis (MESA) [published correc-tion appears in Arch Intern Med . 2008;168:1782] . Arch Intern Med . 2008;168:1333–1339 .
29 . Berry JD, Liu K, Folsom AR, Lewis CE, Carr JJ, Polak JF, Shea S, Sidney S, O’Leary DH, Chan C, Lloyd-Jones DM . Prevalence and progression of subclinical atherosclerosis in younger adults with low short-term but high lifetime estimated risk for cardiovascular disease: the Coronary Ar-tery Risk Development in Young Adults Study and Multi-Ethnic Study of Atherosclerosis . Circulation . 2009;119:382–389 .
30 . Motoyama S, Sarai M, Harigaya H, Anno H, Inoue K, Hara T, Naruse H, Ishii J, Hishida H, Wong ND, Virmani R, Kondo T, Ozaki Y, Narula J . Computed tomographic angiography characteristics of atherosclerotic plaques subsequently resulting in acute coronary syndrome . J Am Coll Cardiol . 2009;54:49–57 .
31 . Villines TC, Hulten EA, Shaw LJ, Goyal M, Dunning A, Achenbach S, Al-Mallah M, Berman DS, Budoff MJ, Cademartiri F, Callister TQ, Chang HJ, Cheng VY, Chinnaiyan K, Chow BJ, Delago A, Hadamitzky M, Haus-leiter J, Kaufmann P, Lin FY, Maffei E, Raff GL, Min JK; CONFIRM Registry Investigators . Prevalence and severity of coronary artery disease and adverse events among symptomatic patients with coronary artery calcification scores of zero undergoing coronary computed tomography angiography: results from the CONFIRM (Coronary CT Angiography Evaluation for Clinical Outcomes: An International Multicenter) registry . J Am Coll Cardiol . 2011;58:2533–2540 .
32 . Bamberg F, Sommer WH, Hoffmann V, Achenbach S, Nikolaou K, Conen D, Reiser MF, Hoffmann U, Becker CR . Meta-analysis and systematic review of the long-term predictive value of assessment of coronary athero-sclerosis by contrast-enhanced coronary computed tomography angiogra-phy . J Am Coll Cardiol . 2011;57:2426–2436 .
33 . Mattace-Raso FU, van der Cammen TJ, Hofman A, van Popele NM, Bos ML, Schalekamp MA, Asmar R, Reneman RS, Hoeks AP, Breteler MM, Witteman JC . Arterial stiffness and risk of coronary heart disease and stroke: the Rotterdam Study . Circulation . 2006;113:657–663 .
34 . Willum-Hansen T, Staessen JA, Torp-Pedersen C, Rasmussen S, Thijs L, Ibsen H, Jeppesen J . Prognostic value of aortic pulse wave velocity as index of arterial stiffness in the general population . Circulation . 2006;113:664–670 .
35 . Mitchell GF, Hwang SJ, Vasan RS, Larson MG, Pencina MJ, Hamburg NM, Vita JA, Levy D, Benjamin EJ . Arterial stiffness and cardiovascular events: the Framingham Heart Study . Circulation . 2010;121:505–511 .
36 . Yeboah J, Folsom AR, Burke GL, Johnson C, Polak JF, Post W, Lima JA, Crouse JR, Herrington DM . Predictive value of brachial flow-mediated dilation for incident cardiovascular events in a population-based study: the Multi-Ethnic Study of Atherosclerosis . Circulation . 2009;120:502–509 .
37 . Wong ND, Detrano RC, Diamond G, Rezayat C, Mahmoudi R, Chong EC, Tang W, Puentes G, Kang X, Abrahamson D . Does coronary artery screening by electron beam computed tomography motivate potentially beneficial lifestyle behaviors? Am J Cardiol . 1996;78:1220–1223 .
38 . Orakzai RH, Nasir K, Orakzai SH, Kalia N, Gopal A, Musunuru K, Blu-menthal RS, Budoff MJ . Effect of patient visualization of coronary cal-cium by electron beam computed tomography on changes in beneficial lifestyle behaviors . Am J Cardiol . 2008;101:999–1002 .
39 . Johnson HM, Turke TL, Grossklaus M, Dall T, Carimi S, Koenig LM, Aeschlimann SE, Korcarz CE, Stein JH . Effects of an office-based ca-rotid ultrasound screening intervention . J Am Soc Echocardiogr . 2011;24:738–747 .
40 . MESA CAC score reference values . MESA CAC Tools Web site . http://www .mesa-nhlbi .org/Calcium/input .aspx . Accessed November 27, 2012 .
by guest on December 16, 2013http://circ.ahajournals.org/Downloaded from
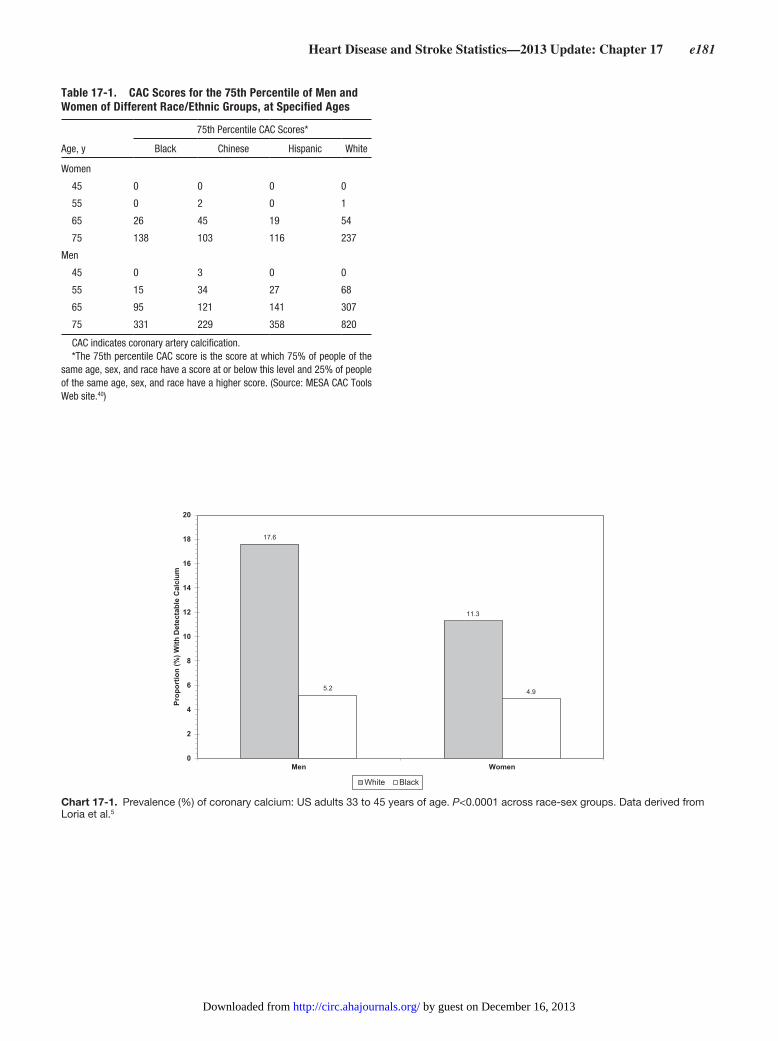
Heart Disease and Stroke Statistics—2013 Update: Chapter 17 e181
17.6
11.3
5.2 4.9
0
2
4
6
8
10
12
14
16
18
20
Men Women
Prop
ortio
n (%
) With
Det
ecta
ble
Cal
cium
White Black
Chart 17-1. Prevalence (%) of coronary calcium: US adults 33 to 45 years of age. P<0.0001 across race-sex groups. Data derived from Loria et al.5
Table 17-1. CAC Scores for the 75th Percentile of Men and Women of Different Race/Ethnic Groups, at Specified Ages
Age, y
75th Percentile CAC Scores*
Black Chinese Hispanic White
Women
45 0 0 0 0
55 0 2 0 1
65 26 45 19 54
75 138 103 116 237
Men
45 0 3 0 0
55 15 34 27 68
65 95 121 141 307
75 331 229 358 820
CAC indicates coronary artery calcification.*The 75th percentile CAC score is the score at which 75% of people of the
same age, sex, and race have a score at or below this level and 25% of people of the same age, sex, and race have a higher score. (Source: MESA CAC Tools Web site.40)
by guest on December 16, 2013http://circ.ahajournals.org/Downloaded from
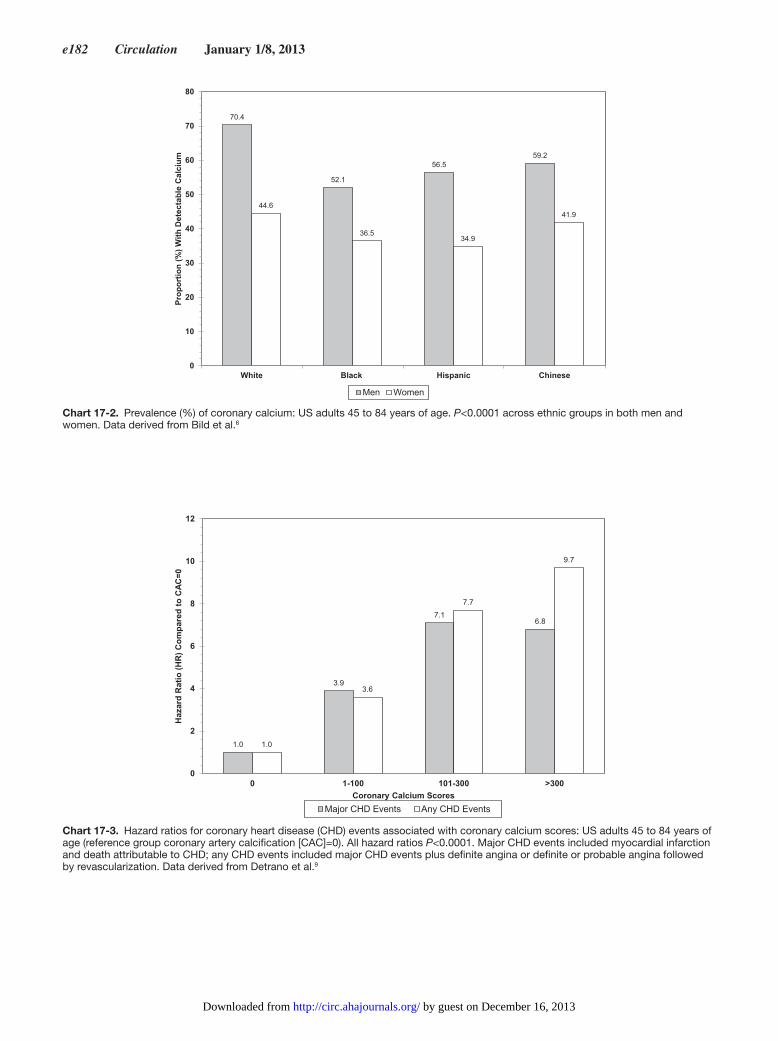
e182 Circulation January 1/8, 2013
1.0
3.9
7.16.8
1.0
3.6
7.7
9.7
0
2
4
6
8
10
12
0 1-100 101-300 >300
Haz
ard
Rat
io (H
R) C
ompa
red
to C
AC=0
Coronary Calcium ScoresMajor CHD Events Any CHD Events
Chart 17-3. Hazard ratios for coronary heart disease (CHD) events associated with coronary calcium scores: US adults 45 to 84 years of age (reference group coronary artery calcification [CAC]=0). All hazard ratios P<0.0001. Major CHD events included myocardial infarction and death attributable to CHD; any CHD events included major CHD events plus definite angina or definite or probable angina followed by revascularization. Data derived from Detrano et al.9
70.4
52.1
56.559.2
44.6
36.534.9
41.9
0
10
20
30
40
50
60
70
80
White Black Hispanic Chinese
Prop
ortio
n (%
) With
Det
ecta
ble
Cal
cium
Men Women
Chart 17-2. Prevalence (%) of coronary calcium: US adults 45 to 84 years of age. P<0.0001 across ethnic groups in both men and women. Data derived from Bild et al.6
by guest on December 16, 2013http://circ.ahajournals.org/Downloaded from

Heart Disease and Stroke Statistics—2013 Update: Chapter 17 e183
1 1
3.4
7.2
1
3.2
5.3
9
1
6.2 6.2
12.5
4.6
17.6
8.9
19.1
0
5
10
15
20
25
<10% 10-15% 16-20% >20%
Haz
ard
Rat
io (H
R) C
ompa
red
to C
AC=0
Projected Framingham Risk Score
CAC = 0 CAC 1-100 CAC 101-300 CAC >300
Chart 17-4. Hazard ratios for coronary heart disease events associated with coronary calcium scores: US adults (reference group coronary artery calcification [CAC]=0 and Framingham Risk Score <10%). Coronary heart disease events included nonfatal myocardial infarction and death attributable to coronary heart disease. Data derived from Greenland et al.10
0.65
0.81
0.660.69
0.89
0.690.67
0.89
0.700.71
0.89
0.71
0.0
0.1
0.2
0.3
0.4
0.5
0.6
0.7
0.8
0.9
1.0
Common Carotid Carotid Bulb Internal Carotid
Mea
n C
arot
id IM
T (m
m)
White Women Black Women White Men Black Men
Chart 17-5. Mean values of carotid intima-media thickness (IMT) for different carotid artery segments in younger adults by race and sex (Bogalusa Heart Study). Data derived from Urbina et al.21
by guest on December 16, 2013http://circ.ahajournals.org/Downloaded from

e184 Circulation January 1/8, 2013
0.87
1.13
0.91
1.11
0.86
1.04
0.830.87
0.0
0.2
0.4
0.6
0.8
1.0
1.2
Common Carotid Internal Carotid
Mea
n C
arot
id IM
T (m
m)
White Black Hispanic Chinese
Chart 17-6. Mean values of carotid intima-media thickness (IMT) for different carotid artery segments in older adults, by race. Data derived from Manolio et al.23
by guest on December 16, 2013http://circ.ahajournals.org/Downloaded from

Heart Disease and Stroke Statistics—2013 Update: Chapter 18 e185
18. Coronary Heart Disease, Acute Coronary Syndrome, and Angina Pectoris
Coronary Heart DiseaseICD-9 410 to 414, 429.2; ICD-10 I20 to I25; see Glossary (Chapter 25) for details and definitions. See Tables 18-1 and 18-2. See Charts 18-1 through 18-10.
Prevalence(See Table 18-1 and Charts 18-1 and 18-2.)
●● On the basis of data from NHANES 2007–2010 (NHLBI tabulation), an estimated 15 .4 million Americans ≥20 years of age have CHD .
—Total CHD prevalence is 6 .4% in US adults ≥20 years of age . CHD prevalence is 7 .9% for men and 5 .1% for women .
—Among non-Hispanic whites, CHD prevalence is 8 .2% for men and 4 .6% for women .
—Among non-Hispanic blacks, CHD prevalence is 6 .8% for men and 7 .1% for women .
—Among Mexican Americans, CHD prevalence is 6 .7% for men and 5 .3% for women .
●● On the basis of data from the 2011 NHIS:
—Among Hispanic or Latino individuals ≥18 years of age, CHD prevalence is 5 .9% .1
—Among American Indian/Alaska Natives ≥18 years of age, it is estimated that 7 .2% have CHD, and among Asians ≥18 years of age, the estimate is 4 .3% .1
●● According to data from NHANES 2007–2010 (NHLBI tabulation), the overall prevalence for MI is 2 .9% in US adults ≥20 years of age . MI prevalence is 4 .2% for men and 1 .7% for women .
—Among non-Hispanic whites, MI prevalence is 4 .4% for men and 1 .5% for women .
—Among non-Hispanic blacks, MI prevalence is 3 .9% for men and 2 .3% for women .
—Among Mexican Americans, MI prevalence is 3 .6% for men and 1 .7% for women .
●● Data from the BRFSS 2011 survey indicated that 4 .3% of respondents had been told that they had had an MI . The highest prevalence was in Arkansas (6 .4%) and West Vir-ginia (6 .2%) . The lowest prevalence was in Colorado (2 .7%) and Utah (3 .0%) . In the same survey, 4 .2% of respondents were told that they had angina or CHD . The highest prevalence was in West Virginia (6 .6%), and the lowest was in Colorado (2 .4%) .2
●● Projections show that by 2030, prevalence of CHD will increase ≈18% from 2013 estimates (AHA computation, based on methodology described in Heidenreich et al3) .
Incidence(See Table 18-1 and Charts 18-3 through 18-5.)
●● Approximately every 44 seconds, an American will have an MI (AHA computation) .
●● On the basis of data from the ARIC study4 of the NHLBI:
Abbreviations Used in Chapter 18
AP angina pectoris HDL-C high-density lipoprotein cholesterol
ARIC Atherosclerosis Risk in Communities study HF heart failure
BMI body mass index ICD-9 International Classification of Diseases, 9th Revision
BP blood pressure ICD-10 International Classification of Diseases, 10th Revision
BRFSS Behavioral Risk Factor Surveillance System MEPS Medical Expenditure Panel Survey
CABG coronary artery bypass graft MI myocardial infarction
CAD coronary artery disease NAMCS National Ambulatory Medical Care Survey
CHD coronary heart disease NCHS National Center for Health Statistics
CHS Cardiovascular Health Study NH non-Hispanic
CI confidence interval NHAMCS National Hospital Ambulatory Medical Care Survey
CRUSADE Can Rapid Risk Stratification of Unstable Angina Patients Suppress Adverse Outcomes With Early Implementation of the ACC/AHA Guidelines
NHANES
NHDS
NHIS
NHLBI
NRMI
NSTEMI
OR
PCI
SBP
STEMI
UA
WISE
National Health and Nutrition Examination Survey
National Hospital Discharge Survey
National Health Interview Study
National Heart, Lung, and Blood Institute
National Registry of Myocardial Infarction
non–ST-segment–elevation myocardial infarction
odds ratio
percutaneous coronary intervention
systolic blood pressure
ST-segment–elevation myocardial infarction
unstable angina
Women’s Ischemia Syndrome Evaluation
CVD cardiovascular disease
DM diabetes mellitus
ECG electrocardiogram
ED emergency department
EHS-ACS-II Second Euro Heart Survey on Acute Coronary Syndromes
EMS emergency medical services
FHS Framingham Heart Study
GRACE Global Registry of Acute Coronary Events
GWTG Get With The Guidelines
HD heart disease
by guest on December 16, 2013http://circ.ahajournals.org/Downloaded from

e186 Circulation January 1/8, 2013
—This year, ≈635 000 Americans will have a new coronary attack (defined as first hospitalized MI or CHD death), and ≈280 000 will have a recurrent attack . It is estimated that an additional 150 000 silent MIs occur each year . That assumes that ≈21% of the 715 000 first and recur-rent MIs are silent .5,6
—The estimated annual incidence of MI is 525 000 new attacks and 190 000 recurrent attacks .
—Average age at first MI is 64 .7 years for men and 72 .2 years for women .
●● On the basis of the NHLBI-sponsored FHS:
—CHD makes up more than half of all cardiovascular events in men and women <75 years of age .5
—The lifetime risk of developing CHD after 40 years of age is 49% for men and 32% for women .7
—The incidence of CHD in women lags behind men by 10 years for total CHD and by 20 years for more serious clinical events such as MI and sudden death .5
●● In the NHLBI-sponsored ARIC study, in participants 35 to 74 years of age, the average age-adjusted first MI or fatal CHD rates per 1000 population were as follows: white men, 3 .9; black men, 5 .5; white women, 1 .7; and black women, 3 .4 (unpublished data from ARIC Surveillance 1987–2009, NHLBI) .
●● Incidence rates for MI in the NHLBI-sponsored ARIC study are displayed in Charts 18-3 and 18-4, stratified by age, race, and sex . The annual age-adjusted rates per 1000 population of first MI (1987–2009) in ARIC Surveillance (NHLBI) were 5 .0 in black men, 3 .0 in white men, 2 .0 in black women, and 1 .6 in white women (unpublished data from ARIC Surveillance 1987–2009, NHLBI) .
●● Analysis of more than 40 years of physician-validated AMI data in the FHS study of the NHLBI found that AMI rates diagnosed by electrocardiographic criteria declined ≈50%, with a concomitant 2-fold increase in rates of AMI diagnosed by blood markers . These findings may explain the paradoxical stability of AMI rates in the United States despite concomitant improvements in CHD risk factors .8
●● Among American Indians 65 to 74 years of age, the annual rates per 1000 population of new and recurrent MIs were 7 .6 for men and 4 .9 for women .9 Analysis of data from NHANES III (1988–1994) and NHANES 1999–2002 (NCHS) showed that in adults 20 to 74 years of age, the overall distribution of 10-year risk of developing CHD changed little during this time . Among the 3 racial/ethnic groups, blacks had the highest proportion of participants in the high-risk group .10
●● On the basis of data from the NHDS, since the mid-1990s, the rate of hospitalization for MI and in-hospital case fatality rates have decreased .11
●● From 2002 to 2007, the rates of hospitalization for MI decreased among Medicare beneficiaries; however, the degree of reduction was more significant in whites than African Americans .12
Trends in Incidence
●● In the FHS, incidence rates of AMI diagnosed by electro-cardiographic criteria decreased significantly in men 50 to 59 years of age and 70 to 79 years of age and in women
70 to 79 years of age from the period 1960–1969 to 1990–1999 . In contrast, incidence rates of AMI diagnosed by serum biomarkers increased significantly in men 50 to 59 years of age and 70 to 79 years of age and in women 70 to 79 years of age .13
●● Data from the Worcester Heart Attack Study showed that incidence rates for AMI were 277 per 100 000 person-years in 1975 and 209 per 100 000 person-years in 2005 (P=0 .42 for overall trend) .The incidence rate rose from 1975 to 1981, decreased from 1981 to 1988, increased from 1981 to 2001, and decreased from 2001 to 2005 .14
●● In Olmsted County, Minnesota, no significant change in the overall age- and sex-adjusted incidence rate for hospital-ized MI was noted (186 per 100 000 person-years in 1987 and 180 per 100 000 person-years in 2006; P=0 .171), but a significant decline in the age- and sex-adjusted incidence rate for hospitalized MI based on creatine kinase/creatine kinase-MB markers, to 141 per 100 000 person-years (P=0 .020), was observed in 2006, which represents a 20% decrease during the study period .15
●● Data from Kaiser Permanente Northern California showed that the age- and sex-adjusted incidence rate of hospital-izations for MI changed from 274 per 100 000 person-years in 1999 to 208 per 100 000 person-years in 2008 . Furthermore, the age- and sex-adjusted incidence rate of hospitalizations for STEMI changed from 133 per 100 000 person-years in 1999 to 50 per 100 000 person-years in 2008 (P linear trend <0 .001) . The trajectory of the age- and sex-adjusted incidence rate of hospitalizations for NSTEMI did not change significantly .16
●● From 1987 to 2008, the age- and biomarker-adjusted incidence rates of hospitalization for AMI or fatal CHD decreased by 4 .9% per year (95% CI, 5 .3%–4 .5%) among white men, 3 .9% per year (95% CI, 4 .5%–3 .4%) among white women, 1 .8% per year (95% CI, 2 .6%–1 .0%) among black men, and 3 .5% per year (95% CI, 4 .4%–2 .6%) among black women in the ARIC study .17
Mortality
●● CHD caused ≈1 of every 6 deaths in the United States in 2009 . CHD mortality was 386 324 .18
●● CHD any-mention mortality was 549 233 . MI mortality (ICD-10 I21 to I22) was 125 464 . MI any-mention mortality was 162 443 (NCHS, NHLBI tabulation) .18
●● In 2009, the overall CHD death rate was 116 .1 . From 1999 to 2009, the annual death rate attributable to CHD declined 40 .3% and the actual number of deaths declined 27 .1% (AHA computation) .19 The death rates were 155 .9 for white males and 181 .1 for black males; for white females, the rate was 84 .9, and for black females, it was 110 .3 .19
●● Approximately every 34 seconds, an American will expe-rience a coronary event, and approximately every minute, someone will die of one (AHA computation) .
●● Approximately 34% of the people who experience a coronary attack in a given year will die of it, and ≈15% who experience a heart attack (MI) will die of it (AHA computation) .
●● The percentage of CHD deaths that occurred out of the hos-pital in 2009 was 73% . According to NCHS mortality data, 281 000 CHD deaths occur out of the hospital or in hospital
by guest on December 16, 2013http://circ.ahajournals.org/Downloaded from

Heart Disease and Stroke Statistics—2013 Update: Chapter 18 e187
EDs annually (2009, ICD-10 codes I20 to I25; NCHS, AHA tabulation) .
●● A study of 1275 health maintenance organization enrollees 50 to 79 years of age who had cardiac arrest showed that the incidence of out-of-hospital cardiac arrest was 6 .0/1000 subject-years in subjects with any clinically recognized HD compared with 0 .8/1000 subject-years in subjects without HD . In subgroups with HD, incidence was 13 .6/1000 sub-ject-years in subjects with prior MI and 21 .9/1000 subject-years in subjects with HF .20
●● Approximately 80% of people who die of CHD are ≥65 years of age (NCHS; AHA computation) .
●● The estimated average number of years of life lost because of an MI is 16 .6 (NCHS, NHLBI tabulation) .
●● On the basis of data from the FHS of the NHLBI5:
—Fifty percent of men and 64% of women who die sud-denly of CHD have no previous symptoms of this dis-ease . Between 70% and 89% of sudden cardiac deaths occur in men, and the annual incidence is 3 to 4 times higher in men than in women; however, this disparity decreases with advancing age .
—People who have had an MI have a sudden death rate 4 to 6 times that of the general population .
●● Researchers investigating variation in hospital-specific 30-day risk-stratified mortality rates for patients with AMI found teaching status, number of hospital beds, AMI volume, cardiac facilities available, urban/rural location, geographic region, hospital ownership type, and socioeco-nomic status profile of the patients were all significantly associated with mortality rates . However, a substantial proportion of variation in outcomes for patients with AMI between hospitals remains unexplained by measures of hospital characteristics .21
Temporal Trends in CHD Mortality
●● The decline in CHD mortality rates in part reflects the shift in the pattern of clinical presentations of AMI . In the past decade, there has been a marked decline in STEMI (from 133 to 50 cases per 100 000 person-years) .16
●● According to data from the National Registry of Myocar-dial Infarction22:
—From 1990 to 1999, in-hospital AMI mortality declined from 11 .2% to 9 .4% .
—Mortality rate increases for every 30 minutes that elapses before a patient with ST-segment elevation is recognized and treated .
●● Other studies also reported declining case fatality rates after MI:
—In Olmsted County, Minnesota, the age- and sex-adjusted 30-day case-fatality rate decreased by 56% from 1987 to 2006 .15
—In Worcester, MA, the hospital case fatality rates, 30-day postadmission case fatality rates, and 1-year postdis-charge case fatality rates for STEMI were 11 .1%, 13 .2%, and 10 .6%, respectively, in 1997 and 9 .7%, 11 .4%, and 8 .4%, respectively, in 2005 . The hospital case fatal-ity rates, 30-day postadmission case fatality rates, and
1-year postdischarge case fatality rates for NSTEMI were 12 .9%, 16 .0%, and 23 .1%, respectively, in 1997 and 9 .5%, 14 .0%, and 18 .7%, respectively, in 2005 .23
—Among enrollees of the Kaiser Permanente Northern California healthcare delivery system, the age- and sex-adjusted 30-day mortality rate for MI dropped from 10 .5% in 1999 to 7 .8% in 2008, and the 30-day mortal-ity rate for NSTEMI dropped from 10 .0% in 1999 to 7 .6% in 2008 .16
●● CHD death rates have fallen from 1968 to the present . Analysis of NHANES (NCHS) data compared CHD death rates between 1980 and 2000 to determine how much of the decline in deaths attributable to CHD over that period could be explained by the use of medical and surgical treatments versus changes in CVD risk factors (resulting from life-style/behavior) . After 1980 and 2000 data were compared, it was estimated that ≈47% of the decrease in CHD deaths was attributable to treatments, including the following24:
—Secondary preventive therapies after MI or revascular-ization (11%)
—Initial treatments for AMI or UA (10%)—Treatments for HF (9%)—Revascularization for chronic angina (5%)—Other therapies (12%), including antihypertensive and
lipid-lowering primary prevention therapies
●● It was also estimated that a similar amount of the reduction in CHD deaths, ≈44%, was attributable to changes in risk factors, including the following24:
—Lower total cholesterol (24%)—Lower SBP (20%)—Lower smoking prevalence (12%)—Decreased physical inactivity (5%)—Nevertheless, these favorable improvements in risk fac-
tors were offset in part by increases in BMI and in DM prevalence, which accounted for an increased number of deaths (8% and 10%, respectively) .
●● Between 1980 and 2002, death rates attributable to CHD among men and women ≥65 years of age fell by 52% in men and 49% in women . Among men, the death rate declined on average by 2 .9% per year in the 1980s, 2 .6% per year during the 1990s, and 4 .4% per year from 2000 to 2002 . Among women, death rates fell by 2 .6%, 2 .4%, and 4 .4%, respectively . However, when stratified by age, among men 35 to 54 years of age, the average annual rate of death fell by 6 .2%, 2 .3%, and 0 .5%, respectively . Among women 35 to 54 years of age, the average annual rate of death fell by 5 .4% and 1 .2% and then increased by 1 .5%, respectively . This increase was not statistically significant; however, in even younger women (35–44 years of age), the rate of death has been increasing by an average of 1 .3% annually between 1997 and 2002, which is statistically significant .25
●● An analysis of 28 studies published from 1977 to 2007 found that revascularization by CABG or PCI in conjunc-tion with medical therapy in patients with nonacute CAD is associated with significantly improved survival compared with medical therapy alone .26
●● A recent analysis of Centers for Medicare & Medicaid Ser-vices data suggests that between 1995 and 2006, the 30-day
by guest on December 16, 2013http://circ.ahajournals.org/Downloaded from
e188 Circulation January 1/8, 2013
mortality rate attributable to MI decreased, as did hospital variation in mortality attributable to MI .27
●● Data from the Nationwide Inpatient Sample database sug-gest that mortality attributable to MI has decreased since 1988 .28
Risk Factors
●● Risk factors for CHD act synergistically to increase CHD risk, as shown in the example in Charts 18-6 and 18-7 .
Awareness of Warning Signs and Risk Factors for HD
●● Data from the Women Veterans Cohort showed that 42% of women ≥35 years of age were concerned about HD . Only 8% to 20% were aware that CAD is the major cause of death for women .29
●● Among people in 14 states and Washington, DC, participat-ing in the 2005 BRFSS, only 27% were aware of 5 heart attack warning signs and symptoms (1, pain in jaw, neck, or back; 2, weak, lightheaded, or faint; 3, chest pain or dis-comfort; 4, pain or discomfort in arms or shoulder; and 5, shortness of breath) and indicated that they would first call 911 if they thought someone was having a heart attack or stroke . Awareness of all 5 heart attack warning signs and symptoms and the need to call 911 was higher among non-Hispanic whites (30 .2%), women (30 .8%), and those with a college education or more (33 .4%) than among non-Hispanic blacks and Hispanics (16 .2% and 14 .3%, respec-tively), men (22 .5%), and those with less than a high school education (15 .7%), respectively . By state, awareness was highest in West Virginia (35 .5%) and lowest in Washington, DC (16 .0%) .30
●● A 2004 national study of physician awareness and adherence to CVD prevention guidelines showed that fewer than 1 in 5 physicians knew that more women than men die each year of CVD .31 Women’s awareness that CVD is their leading cause of death increased from 30% in 1997 to 54% in 2009 . The percentages of women identifying warning signs for a heart attack were as follows: pain in the chest, neck, shoulder, and arm—56%; shortness of breath—29%, chest tightness—17%, nausea—15%; and fatigue—7% . Compared with 1997, however, little change in knowledge of warning signs was noted . The 3 most commonly cited HD prevention strategies were getting adequate sleep (94%), consuming fish oil/omega 3 fatty acids (82%), and taking aspirin regularly (78%) . The most common preventive actions taken by women during the preceding year were having BP checked (84%), trying to manage stress better (74%), seeing a doctor or other healthcare provider (73%), decreasing consumption of unhealthy foods (71%), and having cholesterol checked (66%) .32
Delays Between Symptom Onset and Arrival at Hospital
●● A recent community surveillance study in 4 US com-munities reported that in 2000, the overall proportion of people with delays of ≥4 hours from onset of AMI symp-toms to hospital arrival was 49 .5% . The study also reported that from 1987 to 2000, there was no statistically signifi-cant change in the proportion of patients whose delays were ≥4 hours, which indicates that there has been little
improvement in the speed at which patients with MI symp-toms arrive at the hospital after symptom onset . Although the proportion of patients with MI who arrived at the hos-pital by EMS increased over this period, from 37% in 1987 to 55% in 2000, the total time between onset and hospital arrival did not change appreciably .33
●● Data from CRUSADE (Can Rapid Risk Stratification of Unstable Angina Patients Suppress Adverse Outcomes With Early Implementation of the ACC/AHA Guidelines) and the National Cardiovascular Data Registry ACTION Registry–GWTG showed a longer median time to hospi-tal presentation in men (3 hours) than women (2 .8 hours; P<0 .001) . From 2002 to 2007, presentation time did not change significantly in men or women .13
●● Individuals with documented CHD have 5 to 7 times the risk of having a heart attack or dying as the general popula-tion . Survival rates improve after a heart attack if treatment begins within 1 hour; however, most patients are admit-ted to the hospital 2 .5 to 3 hours after symptoms begin . More than 3500 patients surveyed with a history of CHD were asked to identify possible symptoms of heart attack . Despite their history of CHD, 44% had low knowledge lev-els . In this group, who were all at high risk of future AMI, 43% assessed their risk as less than or the same as others their age . More men than women perceived themselves as being at low risk, at 47% versus 36%, respectively .34
●● Data from Worcester, MA, indicate that the average time from symptom onset to hospital arrival has not improved and that delays in hospital arrival are associated with less receipt of guidelines-based care . Mean and median prehos-pital delay times from symptom onset to arrival at the hos-pital were 4 .1 and 2 .0 hours in 1986 and 4 .6 and 2 .0 hours in 2005, respectively . Compared with those arriving within 2 hours of symptom onset, those with prolonged prehospi-tal delay were less likely to receive thrombolytic therapy and PCI within 90 minutes of hospital arrival .35
●● In an analysis from ARIC, low neighborhood household income (OR, 1 .46; 95% CI, 1 .09–1 .96) and being a Medic-aid recipient (OR, 1 .87; 95% CI, 1 .10–3 .19) were associated with increased odds of having prolonged prehospital delays from symptom onset to hospital arrival for AMI compared with individuals with higher neighborhood household income and other insurance providers, respectively .36
Aftermath
●● Depending on their sex and clinical outcome, people who survive the acute stage of an MI have a chance of illness and death 1 .5 to 15 times higher than that of the general popula-tion . Among these people, the risk of another MI, sudden death, AP, HF, and stroke—for both men and women—is substantial (FHS, NHLBI) .5
●● On the basis of pooled data from the FHS, ARIC, and CHS studies of the NHLBI, within 1 year after a first MI:
—At ≥45 years of age, 19% of men and 26% of women will die .
—At 45 to 64 years of age, 5% of white men, 8% of white women, 14% of black men, and 9% of black women will die .
by guest on December 16, 2013http://circ.ahajournals.org/Downloaded from

Heart Disease and Stroke Statistics—2013 Update: Chapter 18 e189
—At ≥65 years of age, 25% of white men, 30% of white women, 25% of black men, and 30% of black women will die .
—In part because women have MIs at older ages than men, they are more likely to die of MIs within a few weeks .
●● Within 5 years after a first MI:
—At ≥45 years of age, 36% of men and 47% of women will die .
—At 45 to 64 years of age, 11% of white men, 18% of white women, 22% of black men, and 28% of black women will die .
—At ≥65 years of age, 46% of white men, 53% of white women, 54% of black men, and 58% of black women will die .
●● Of those who have a first MI, the percentage with a recurrent MI or fatal CHD within 5 years is:
—At 45 to 64 years of age, 15% of men and 22 of women—At ≥65 years of age, 22% of men and women—At 45 to 64 years of age, 14% of white men, 18% of
white women, 22% of black men, and 28% of black women
—At ≥65 years of age, 21% of white men and women, 33% of black men, and 26% of black women
●● The percentage of people with a first MI who will have HF in 5 years is:
—At 45 to 64 years of age, 8% of men and 18% of women—At ≥65 years of age, 20% of men and 23% of women—At 45 to 64 years of age, 7% of white men, 15% of white
women, 13% of black men, and 25% of black women—At ≥65 years of age, 19% of white men, 23% of white
women, 31% of black men, and 24% of black women
●● The percentage of people with a first MI who will have a stroke within 5 years is:
—At 45 to 64 years of age, 2% of men and 6% of women—At ≥65 years of age, 5% of men and 8% of women—At 45 to 64 years of age, 2% of white men, 4% of
white women, 3% of black men, and 10% of black women
—At ≥65 years of age, 5% of white men, 8% of white women, 9% of black men, and 10% of black women
●● The median survival time (in years) after a first MI is:
—At 55 to 64 years of age, 17 .0 for men and 13 .3 for women
—At 65 to 74 years of age, 9 .3 for men and 8 .8 for women
—At ≥75 years of age, 3 .2 for men and 3 .2 for women
●● A Mayo Clinic study found that cardiac rehabilitation after an MI is underused, particularly in women and the elderly . Women were 55% less likely than men to par-ticipate in cardiac rehabilitation, and older study patients were less likely to participate than younger participants . Only 32% of men and women ≥70 years of age partici-pated in cardiac rehabilitation compared with 66% of those 60 to 69 years of age and 81% of those <60 years of age .37
●● Among survivors of an MI, in 2005, 34 .7% of BRFSS respondents participated in outpatient cardiac rehabilita-tion . The prevalence of cardiac rehabilitation was higher among older age groups (≥50 years of age), among men versus women, among Hispanics, among those who were married, among those with higher education, and among those with higher levels of household income .38
●● A recent analysis of Medicare claims data revealed that only 13 .9% of Medicare beneficiaries enroll in cardiac rehabilitation after an AMI, and only 31% enroll after CABG . Older people, women, nonwhites, and individu-als with comorbidities were less likely to enroll in cardiac rehabilitation programs .39
Hospital Discharges and Ambulatory Care Visits(See Table 18-1 and Chart 18-8.)
●● From 2000 to 2010, the number of inpatient discharges from short-stay hospitals with CHD as the first-listed diagnosis decreased from 2 165 000 to 1 346 000 (NHDS, NHLBI tabulation) .
●● In 2009, there were 14 044 000 ambulatory care visits with CHD as the first-listed diagnosis (NCHS, NAMCS, NHAMCS) . There were 12 816 000 physician office visits, 639 000 ED visits, and 589 000 outpatient department vis-its with a primary diagnosis of CHD (NHAMCS, NHLBI tabulation) . The majority of these visits (77 .7%) were for coronary atherosclerosis .40
●● The age-adjusted hospitalization rate for MI was 215 per 100 000 people in 1979 to 1981, increased to 342 in 1985 to 1987, stabilized for the next decade, and then declined after 1996 to 242 during the period from 2003 to 2005 . Rates for men were almost twice those of women . Trends were similar for men and women . Hospitalization rates increased with age and were the highest among those ≥85 years of age .11
●● Most hospitalized patients >65 years of age are women . For MI, 28 .4% of hospital stays for people 45 to 64 years of age were for women, but 63 .7% of stays for those ≥85 years of age were for women . Similarly, for coronary ath-erosclerosis, 32 .7% of stays among people 45 to 64 years of age were for women; this figure increased to 60 .7% of stays among those ≥85 years of age . For nonspecific chest pain, women were more numerous than men among patients <65 years of age . Approximately 54 .4% of hos-pital stays among people 45 to 64 years of age were for women . Women constituted 73 .9% of hospital stays for nonspecific chest pain among patients ≥85 years of age, higher than for any other condition examined . For AMI, one third more women than men died in the hospital: 9 .3% of women died in the hospital compared with 6 .2% of men .41
Operations and Procedures
●● In 2010, an estimated 954 000 inpatient PCI procedures, 397 000 inpatient bypass procedures, 1 029 000 inpa-tient diagnostic cardiac catheterizations, 97 000 inpatient implantable defibrillator procedures, and 370 000 pace-maker procedures were performed for inpatients in the United States . (NHLBI tabulation) .
by guest on December 16, 2013http://circ.ahajournals.org/Downloaded from
e190 Circulation January 1/8, 2013
Cost(See Table 18-1.)
●● The estimated direct and indirect cost of CHD in 2009 is $195 .2 billion (MEPS, NHLBI tabulation) .
●● In 2006, $11 .7 billion was paid to Medicare beneficiaries for in-hospital costs when CHD was the principal diagno-sis ($14 009 per discharge for AMI, $12 977 per discharge for coronary atherosclerosis, and $10 630 per discharge for other ischemic HD) .34,42
●● Between 2013 and 2030, medical costs of CHD (real 2010$) are projected to increase by ≈100%:
—Indirect costs for all CVD (real 2010$) are projected to increase 52% (from $202 .5 billion to $308 .2 billion) between 2013 and 2030 . Of these indirect costs, CHD is projected to account for ≈43% and has the largest indi-rect costs (AHA computation, based on methodology described in Heidenreich et al3) .
Acute Coronary SyndromeICD-9 codes 410, 411; ICD-10 I20.0, I21, I22The term ACS is increasingly used to describe patients who present with either AMI or UA . (UA is chest pain or discom-fort that is accelerating in frequency or severity and may occur while at rest but does not result in myocardial necrosis .) The discomfort may be more severe and prolonged than typical AP or may be the first time a person has AP . UA, NSTEMI, and STEMI share common pathophysiological origins related to coronary plaque progression, instability, or rupture with or without luminal thrombosis and vasospasm .
●● A conservative estimate for the number of discharges with ACS from hospitals in 2010 is 625 000 . Of these, an esti-mated 363 000 are males and 262 000 are females . This estimate is derived by adding the first-listed inpatient hos-pital discharges for MI (595 000) to those for UA (30 000; NHDS, NHLBI) .
●● When secondary discharge diagnoses in 2010 were included, the corresponding number of inpatient hospital discharges was 1 141 000 unique hospitalizations for ACS; 653 000 were males, and 488 000 were females . Of the total, 813 000 were for MI alone, 322 000 were for UA alone, and 6000 hospitalizations received both diagnoses (NHDS, NHLBI) .
Decisions about medical and interventional treatments are based on specific findings noted when a patient presents with ACS . Such patients are classified clinically into 1 of 3 categories according to the presence or absence of ST-segment elevation on the presenting ECG and abnormal (“positive”) elevations of myocardial biomarkers, such as troponins, as follows:
●● STEMI●● NSTEMI●● UA
The percentage of ACS or MI cases with ST-segment eleva-tion varies in different registries/databases and depends heav-ily on the age of patients included and the type of surveillance used . According to the National Registry of Myocardial Infarction 4 (NRMI-4), ≈29% of patients with MI are patients
with STEMI .43 The AHA GWTG project found that 32% of the patients with MI in the CAD module are patients with STEMI (personal communication from AHA GWTG staff, October 1, 2007) . The Global Registry of Acute Coronary Events (GRACE) study, which includes US patient popula-tions, found that 38% of ACS patients have STEMI, whereas the second Euro Heart Survey on ACS (EHS-ACS-II) reported that ≈47% of patients with ACS have STEMI .44
In addition, the percentage of ACS or MI cases with ST-segment elevation appears to be declining . In an analysis of 46 086 hospitalizations for ACS in the Kaiser Permanente Northern California study, the percentage of MI cases with ST-segment elevation decreased from 48 .5% to 24% between 1999 and 2008 .16
●● Analysis of data from the GRACE multinational observa-tional cohort study of patients with ACS found evidence of a change in practice for both pharmacological and interventional treatments in patients with either STEMI or non–ST-segment–elevation ACS . These changes have been accompanied by significant decreases in the rates of in-hospital death, cardiogenic shock, and new MI among patients with non–ST-segment–elevation ACS . The use of evidence-based therapies and PCI interventions increased in the STEMI population . This increase was matched by a statistically significant decrease in the rates of death, car-diogenic shock, and HF or pulmonary edema .45
●● A study of patients with non–ST-segment–elevation ACS treated at 350 US hospitals found that up to 25% of oppor-tunities to provide American College of Cardiology (ACC)/AHA guideline–recommended care were missed in current practice . The composite guideline adherence rate was sig-nificantly associated with in-hospital mortality .45
●● A study of hospital process performance in 350 centers of nearly 65 000 patients enrolled in the CRUSADE National Quality Improvement Initiative found that ACC/AHA guideline–recommended treatments were adhered to in 74% of eligible instances .46
●● After adjustment for clinical differences and the severity of CAD by angiogram, 30-day mortality after ACS is similar in men and women .47
Angina PectorisICD-9 413; ICD-10 I20.1 to I20.9.
Prevalence(See Table 18-2 and Chart 18-9.)
●● A study of 4 national cross-sectional health examina-tion studies found that among Americans 40 to 74 years of age, the age-adjusted prevalence of AP was higher among women than men . Increases in the prevalence of AP occurred for Mexican American men and women and Afri-can American women but were not statistically significant for the latter .48
Incidence(See Table 18-2 and Chart 18-10.)
●● Only 18% of coronary attacks are preceded by long-standing AP (NHLBI computation of FHS follow-up since 1986) .
by guest on December 16, 2013http://circ.ahajournals.org/Downloaded from
Heart Disease and Stroke Statistics—2013 Update: Chapter 18 e191
●● The annual rates per 1000 population of new episodes of AP for nonblack men are 28 .3 for those 65 to 74 years of age, 36 .3 for those 75 to 84 years of age, and 33 .0 for those ≥85 years of age . For nonblack women in the same age groups, the rates are 14 .1, 20 .0, and 22 .9, respectively . For black men, the rates are 22 .4, 33 .8, and 39 .5, and for black women, the rates are 15 .3, 23 .6, and 35 .9, respectively (CHS, NHLBI) .49
●● On the basis of 1987 to 2001 data from the ARIC study of the NHLBI, the annual rates per 1000 population of new episodes of AP for nonblack men are 8 .5 for those 45 to 54 years of age, 11 .9 for those 55 to 64 years of age, and 13 .7 for those 65 to 74 years of age . For nonblack women in the same age groups, the rates are 10 .6, 11 .2, and 13 .1, respectively . For black men, the rates are 11 .8, 10 .6, and 8 .8, and for black women, the rates are 20 .8, 19 .3, and 10 .0, respectively .49
Mortality
●● A small number of deaths resulting from CHD are coded as being attributable to AP . These are included as a portion of total deaths attributable to CHD .
Cost
●● For women with nonobstructive CHD enrolled in the Women’s Ischemia Syndrome Evaluation (WISE) study of the NHLBI, the average lifetime cost estimate was ≈$770 000 and ranged from $1 .0 to $1 .1 million for women with 1-vessel to 3-vessel CHD .50
References 1 . Schiller JS, Lucas JW, Ward BW, Peregoy JA . Summary health statistics
for U .S . adults: National Health Interview Survey, 2010 . Vital Health Stat 10 . 2012;(252):1–207 .
2 . Centers for Disease Control and Prevention (CDC) . Prevalence and trends data, tobacco use . In: Behavioral Risk Factor Surveillance System Survey Data . Atlanta, GA: US Department of Health and Human Services, Cen-ters for Disease Control and Prevention; 2011 . http://www .cdc .gov/brfss . Accessed September 21, 2012 .
3 . Heidenreich PA, Trogdon JG, Khavjou OA, Butler J, Dracup K, Ezekow-itz MD, Finkelstein EA, Hong Y, Johnston SC, Khera A, Lloyd-Jones DM, Nelson SA, Nichol G, Orenstein D, Wilson PW, Woo YJ; on behalf of the American Heart Association Advocacy Coordinating Committee; Stroke Council; Council on Cardiovascular Radiology and Intervention; Council on Clinical Cardiology; Council on Epidemiology and Preven-tion; Council on Arteriosclerosis; Thrombosis and Vascular Biology; Council on Cardiopulmonary; Critical Care; Perioperative and Resus-citation; Council on Cardiovascular Nursing; Council on the Kidney in Cardiovascular Disease; Council on Cardiovascular Surgery and Anes-thesia, and Interdisciplinary Council on Quality of Care and Outcomes Research . Forecasting the future of cardiovascular disease in the United States: a policy statement from the American Heart Association . Circula-tion . 2011;123:933–944 .
4 . Atherosclerosis Risk in Communities (ARIC) Study Web site . Commu-nity surveillance event rates . http://www .cscc .unc .edu/aric/displaydata .php?pg_id=37 . Accessed August 30, 2012 .
5 . Thom TJ, Kannel WB, Silbershatz H, D’Agostino RB Sr . Cardiovascular diseases in the United States and prevention approaches . In: Fuster V, Al-exander RW, O’Rourke RA, eds . Hurst’s the Heart. 10th ed. New York, NY: McGraw-Hill; 2001:3–7 .
6 . Boland LL, Folsom AR, Sorlie PD, Taylor HA, Rosamond WD, Chamb-less LE, Cooper LS . Occurrence of unrecognized myocardial infarc-tion in subjects aged 45 to 65 years (the ARIC study) . Am J Cardiol . 2002;90:927–931 .
7 . Lloyd-Jones DM, Larson MG, Beiser A, Levy D . Lifetime risk of develop-ing coronary heart disease . Lancet . 1999;353:89–92 .
8 . Parikh NI, Gona P, Larson MG, Fox CS, Benjamin EJ, Murabito JM, O’Donnell CJ, Vasan RS, Levy D . Long-term trends in myocardial infarc-tion incidence and case fatality in the National Heart, Lung, and Blood Institute’s Framingham Heart study . Circulation . 2009;119:1203–1210 .
9 . Ali T, Jarvis B, O’Leary M . Strong Heart Study Data Book: A Report to American Indian Communities . Rockville, MD: National Institutes of Health, National Heart, Lung, and Blood Institute; 2001 . NIH publication No . 01-3285 .
10 . Ajani UA, Ford ES . Has the risk for coronary heart disease changed among U .S . adults? J Am Coll Cardiol . 2006;48:1177–1182 .
11 . Fang J, Alderman MH, Keenan NL, Ayala C . Acute myocardial in-farction hospitalization in the United States, 1979 to 2005 . Am J Med . 2010;123:259–266 .
12 . Chen J, Normand SL, Wang Y, Drye EE, Schreiner GC, Krumholz HM . Recent declines in hospitalizations for acute myocardial infarction for Medicare fee-for-service beneficiaries: progress and continuing challeng-es . Circulation . 2010;121:1322–1328 .
13 . Diercks DB, Owen KP, Kontos MC, Blomkalns A, Chen AY, Miller C, Wiviott S, Peterson ED . Gender differences in time to presentation for myocardial infarction before and after a national women’s cardiovascular awareness campaign: a temporal analysis from the Can Rapid Risk Strati-fication of Unstable Angina Patients Suppress ADverse Outcomes with Early Implementation (CRUSADE) and the National Cardiovascular Data Registry Acute Coronary Treatment and Intervention Outcomes Network-Get with the Guidelines (NCDR ACTION Registry-GWTG) . Am Heart J . 2010;160:80–87 .e3 .
14 . Floyd KC, Yarzebski J, Spencer FA, Lessard D, Dalen JE, Alpert JS, Gore JM, Goldberg RJ . A 30-year perspective (1975-2005) into the changing landscape of patients hospitalized with initial acute myocardial infarc-tion: Worcester Heart Attack Study . Circ Cardiovasc Qual Outcomes . 2009;2:88–95 .
15 . Roger VL, Weston SA, Gerber Y, Killian JM, Dunlay SM, Jaffe AS, Bell MR, Kors J, Yawn BP, Jacobsen SJ . Trends in incidence, sever-ity, and outcome of hospitalized myocardial infarction . Circulation . 2010;121:863–869 .
16 . Yeh RW, Sidney S, Chandra M, Sorel M, Selby JV, Go AS . Population trends in the incidence and outcomes of acute myocardial infarction . N Engl J Med . 2010;362:2155–2165 .
17 . Rosamond WD, Chambless LE, Heiss G, Mosley TH, Coresh J, Whitsel E, Wagenknecht L, Ni H, Folsom AR . Twenty-two-year trends in incidence of myocardial infarction, coronary heart disease mortality, and case fatal-ity in 4 US communities, 1987-2008 . Circulation . 2012;125:1848–1857 .
18 . Xu J, Kochanek K, Murphy S, Tejada-Vera B . Deaths: Final Data for 2007 . National Vital Statistics Reports . Vol . 58; No . 19 . Hyattsville, MD: Na-tional Center for Health Statistics; 2010 .
19 . Centers for Disease Control and Prevention, National Center for Health Statistics . Compressed Mortality File 1999-2009 . CDC WONDER Online Database, compiled for Compressed Mortality File 1999–2009 Series 20, No . 20, 2012 . Underlying cause-of-death 1999–2009 . http://wonder .cdc .gov/mortSQl .html . Accessed August 20, 2012 .
20 . Rea TD, Pearce RM, Raghunathan TE, Lemaitre RN, Sotoodehnia N, Jou-ven X, Siscovick DS . Incidence of out-of-hospital cardiac arrest . Am J Cardiol . 2004;93:1455–1460 .
21 . Bradley EH, Herrin J, Curry L, Cherlin EJ, Wang Y, Webster TR, Drye EE, Normand SL, Krumholz HM . Variation in hospital mortal-ity rates for patients with acute myocardial infarction . Am J Cardiol . 2010;106:1108–1112 .
22 . Rogers WJ, Canto JG, Lambrew CT, Tiefenbrunn AJ, Kinkaid B, Shoultz DA, Frederick PD, Every N, for the Investigators in the National Registry of Myocardial Infarction 1, 2 and 3 . Temporal Trends in the Treatment of Over 1 .5 Million Patients With Myocardial Infarction in the U .S . from 1990 Through 1999: The National Registry of Myocardial Infarction 1, 2 and 3 . J Am Coll Cardiol . 2000;36:2056–2063 .
23 . McManus DD, Gore J, Yarzebski J, Spencer F, Lessard D, Goldberg RJ . Recent trends in the incidence, treatment, and outcomes of patients with STEMI and NSTEMI . Am J Med . 2011;124:40–47 .
24 . Ford ES, Ajani UA, Croft JB, Critchley JA, Labarthe DR, Kottke TE, Giles WH, Capewell S . Explaining the decrease in U .S . deaths from coronary disease, 1980-2000 . N Engl J Med . 2007;356:2388–2398 .
25 . Ford ES, Capewell S . Coronary heart disease mortality among young adults in the U .S . from 1980 through 2002: concealed leveling of mortal-ity rates . J Am Coll Cardiol . 2007;50:2128–2132 .
26 . Jeremias A, Kaul S, Rosengart TK, Gruberg L, Brown DL . The impact of revascularization on mortality in patients with nonacute coronary artery disease . Am J Med . 2009;122:152–161 .
by guest on December 16, 2013http://circ.ahajournals.org/Downloaded from

e192 Circulation January 1/8, 2013
27 . Krumholz HM, Wang Y, Chen J, Drye EE, Spertus JA, Ross JS, Curtis JP, Nallamothu BK, Lichtman JH, Havranek EP, Masoudi FA, Radford MJ, Han LF, Rapp MT, Straube BM, Normand SL . Reduction in acute myocar-dial infarction mortality in the United States: risk-standardized mortality rates from 1995-2006 . JAMA . 2009;302:767–773 .
28 . Movahed MR, John J, Hashemzadeh M, Jamal MM, Hashemzadeh M . Trends in the age adjusted mortality from acute ST segment elevation myo-cardial infarction in the United States (1988-2004) based on race, gender, infarct location and comorbidities . Am J Cardiol . 2009;104:1030–1034 .
29 . Biswas MS, Calhoun PS, Bosworth HB, Bastian LA . Are women worry-ing about heart disease? Womens Health Issues . 2002;12:204–211 .
30 . Centers for Disease Control and Prevention (CDC) . Disparities in adult awareness of heart attack warning signs and symptoms: 14 states, 2005 . MMWR Morb Mortal Wkly Rep . 2008;57:175–179 .
31 . Mosca L, Linfante AH, Benjamin EJ, Berra K, Hayes SN, Walsh BW, Fabunmi RP, Kwan J, Mills T, Simpson SL . National study of physician awareness and adherence to cardiovascular disease prevention guidelines . Circulation . 2005;111:499–510 .
32 . Mosca L, Mochari-Greenberger H, Dolor RJ, Newby LK, Robb KJ . Twelve-year follow-up of American women’s awareness of cardiovascular disease risk and barriers to heart health . Circ Cardiovasc Qual Outcomes . 2010;3:120–127 .
33 . McGinn AP, Rosamond WD, Goff DC Jr, Taylor HA, Miles JS, Chambless L . Trends in prehospital delay time and use of emergency medical services for acute myocardial infarction: experience in 4 US communities from 1987-2000 . Am Heart J . 2005;150:392–400 .
34 . Dracup K, McKinley S, Doering LV, Riegel B, Meischke H, Moser DK, Pelter M, Carlson B, Aitken L, Marshall A, Cross R, Paul SM . Acute coronary syndrome: what do patients know? Arch Intern Med . 2008;168:1049–1054 .
35 . Saczynski JS, Yarzebski J, Lessard D, Spencer FA, Gurwitz JH, Gore JM, Goldberg RJ . Trends in prehospital delay in patients with acute myocar-dial infarction (from the Worcester Heart Attack Study) . Am J Cardiol . 2008;102:1589–1594 .
36 . Foraker RE, Rose KM, McGinn AP, Suchindran CM, Goff DC Jr, Whitsel EA, Wood JL, Rosamond WD . Neighborhood income, health insurance, and prehospital delay for myocardial infarction: the Atherosclerosis Risk in Communities study . Arch Intern Med . 2008;168:1874–1879 .
37 . Witt BJ, Jacobsen SJ, Weston SA, Killian JM, Meverden RA, Allison TG, Reeder GS, Roger VL . Cardiac rehabilitation after myocardial infarction in the community . J Am Coll Cardiol . 2004;44:988–996 .
38 . Centers for Disease Control and Prevention (CDC) . Receipt of outpatient cardiac rehabilitation among heart attack survivors: United States, 2005 . MMWR Morb Mortal Wkly Rep . 2008;57:89–94 .
39 . Suaya JA, Shepard DS, Normand SL, Ades PA, Prottas J, Stason WB . Use of cardiac rehabilitation by Medicare beneficiaries after myocardial infarction or coronary bypass surgery . Circulation . 2007;116:1653–1662 .
40 . Centers for Disease Control and Prevention, National Center for Health Statistics . 2009 National Ambulatory Medical Care Survey and 2009 Na-tional Hospital Ambulatory Medical Care Survey . Ambulatory health care data: questionnaires, datasets, and related documentation . Unpublished data . For methodology, see National Center for Health Statistics, Public Use Data File Documentation: 2009 National Ambulatory Medical Care Survey and Public Use Data File Documentation: 2009 National Hospital
Ambulatory Medical Care Survey . http://www .cdc .gov/nchs/ahcd/ahcd_questionnaires .htm . Accessed August 12, 2011 .
41 . Elixhauser A, Jiang H . Hospitalizations for Women With Circulatory Dis-ease, 2003. HCUP Statistical Brief No. 5 . Rockville, MD: Agency for Healthcare Research and Quality; 2006 . http://www .hcup-us .ahrq .gov/reports/statbriefs/sb5 .pdf . Accessed August 3, 2011 .
42 . Centers for Medicare & Medicaid Services . Medicare & Medicaid Sta-tistical Supplement . Table 5 .5b: Discharges, Total Days of Care, and Pro-gram Payments for Medicare Beneficiaries Discharged from Short-Stay Hospitals, by Principal Diagnoses Within Major Diagnostic Classifica-tions (MDCs): Calendar Year 2006 . Baltimore, MD: Centers for Medicare & Medicaid Services; 2007 . http://www .cms .gov/Research-Statistics-Data-and-Systems/Statistics-Trends-and-Reports/MedicareMedicaidStat-Supp/2007 .html . Accessed November 21, 2012 .
43 . Roe MT, Parsons LS, Pollack CV Jr, Canto JG, Barron HV, Every NR, Rogers WJ, Peterson ED; National Registry of Myocardial Infarction Investigators . Quality of care by classification of myocardial infarction: treatment patterns for ST-segment elevation vs non-ST-segment elevation myocardial infarction . Arch Intern Med . 2005;165:1630–1636 .
44 . Mandelzweig L, Battler A, Boyko V, Bueno H, Danchin N, Filippatos G, Gitt A, Hasdai D, Hasin Y, Marrugat J, Van de Werf F, Wallentin L, Behar S; Euro Heart Survey Investigators . The second Euro Heart Survey on acute coronary syndromes: characteristics, treatment, and outcome of patients with ACS in Europe and the Mediterranean Basin in 2004 . Eur Heart J . 2006;27:2285–2293 .
45 . Fox KA, Steg PG, Eagle KA, Goodman SG, Anderson FA Jr, Granger CB, Flather MD, Budaj A, Quill A, Gore JM; GRACE Investigators . Decline in rates of death and heart failure in acute coronary syndromes, 1999-2006 . JAMA . 2007;297:1892–1900 .
46 . Peterson ED, Roe MT, Mulgund J, DeLong ER, Lytle BL, Brindis RG, Smith SC Jr, Pollack CV Jr, Newby LK, Harrington RA, Gibler WB, Ohman EM . Association between hospital process performance and outcomes among patients with acute coronary syndromes . JAMA . 2006;295:1912–1920 .
47 . Berger JS, Elliott L, Gallup D, Roe M, Granger CB, Armstrong PW, Simes RJ, White HD, Van de Werf F, Topol EJ, Hochman JS, Newby LK, Harrington RA, Califf RM, Becker RC, Douglas PS . Sex dif-ferences in mortality following acute coronary syndromes . JAMA . 2009;302:874–882 .
48 . Ford ES, Giles WH . Changes in prevalence of nonfatal coronary heart dis-ease in the United States from 1971-1994 . Ethn Dis . 2003;13:85–93 .
49 . Incidence and Prevalence: 2006 Chart Book on Cardiovascular and Lung Diseases . Bethesda, MD: National Heart, Lung, and Blood Insti-tute; 2006 .
50 . Shaw LJ, Merz CN, Pepine CJ, Reis SE, Bittner V, Kip KE, Kelsey SF, Olson M, Johnson BD, Mankad S, Sharaf BL, Rogers WJ, Pohost GM, Sopko G; Women’s Ischemia Syndrome Evaluation (WISE) Investigators . The economic burden of angina in women with suspected ischemic heart disease: results from the National Institutes of Health–National Heart, Lung, and Blood Institute–sponsored Women’s Ischemia Syndrome Eval-uation . Circulation . 2006;114:894–904 .
51 . Wilson PW, D’Agostino RB, Levy D, Belanger AM, Silbershatz H, Kannel WB . Prediction of coronary heart disease using risk factor catego-ries . Circulation . 1998;97:1837–1847 .
by guest on December 16, 2013http://circ.ahajournals.org/Downloaded from

Heart Disease and Stroke Statistics—2013 Update: Chapter 18 e193
Table 18-2. Angina Pectoris
Population GroupPrevalence, 2010,
Age ≥20 yIncidence of Stable
AP, Age ≥45 yHospital Discharges,
2010, All Ages
Both sexes 7 800 000 (3.2%) 500 000 22 000
Males 3 700 000 (3.3%) 320 000 12 000
Females 4 100 000 (3.2%) 180 000 10 000
NH white males 3.3% … …
NH white females 2.8% … …
NH black males 2.4% … …
NH black females 5.4% … …
Mexican-American males 3.4% … …
Mexican-American females 3.3% … …
AP is chest pain or discomfort that results from insufficient blood flow to the heart muscle. Stable AP is predictable chest pain on exertion or under mental or emotional stress. The incidence estimate is for AP without myocardial infarction.
AP indicates angina pectoris; NH, non-Hispanic; and ellipses, data not available.*There were 56 000 days of care for discharges of patients with AP from short-stay hospitals in 2010.Sources: Prevalence: National Health and Nutrition Examination Survey 2007–2010 (National Center for Health Statistics) and National Heart, Lung, and Blood
Institute; percentages for racial/ethnic groups are age-adjusted for US adults ≥20 years of age. AP includes persons who either answered “yes” to the question of ever having angina or AP or who were diagnosed with Rose angina (the Rose questionnaire is only administered to survey participants >40 years of age). Estimates from National Health and Nutrition Examination Survey 2007–2010 (National Center for Health Statistics) were applied to 2010 population estimates (≥20 years of age). Incidence: AP uncomplicated by a myocardial infarction or with no myocardial infarction (Framingham Heart Study 1980 to 2001–2003 of the original cohort and 1980 to 1998–2001 of the Offspring Cohort, National Heart, Lung, and Blood Institute). Hospital discharges: National Hospital Discharge Survey, National Center for Health Statistics; data include those inpatients discharged alive, dead, or status unknown.
Table 18-1. Coronary Heart Disease
Population GroupPrevalence, CHD, 2010 Age ≥20 y
Prevalence, MI, 2010 Age ≥20 y
New and Recurrent MI
and Fatal CHD, Age ≥35 y
New and Recurrent MI,
Age ≥35 y
Mortality,* CHD, 2009
All AgesMortality,* MI, 2009 All Ages
Hospital Discharges CHD, 2010 All Ages
Both sexes 15 400 000 (6.4%) 7 600 000 (2.9%) 915 000 715 000 386 324 125 464 1 346 000
Males 8 800 000 (7.9%) 5 000 000 (4.2%) 535 000 410 000 210 069 (54.4%)†
68 814 (54.8%)†
828 000
Females 6 600 000 (5.1%) 2 600 000 (1.7%) 380 000 305 000 176 255 (45.6%)†
56 650 (45.2%)†
518 000
NH white males 8.2% 4.4% 465 000‡ … 183 453 60 316 …
NH white females 4.6% 1.5% 325 000‡ … 152 785 48 802 …
NH black males 6.8% 3.9% 65 000‡ … 21 051 6717 …
NH black females 7.1% 2.3% 60 000‡ … 19 470 6567 …
Mexican-American males 6.7% 3.6% … … … … …
Mexican-American females 5.3% 1.7% … … … … …
Hispanic or Latino 5.9%§ … … … … … …
Asian 4.3%§ … … … 7752|| 2462|| …
Native Hawaiian and other Pacific Islander
§¶ … … … … … …
American Indian/ Alaska Native 7.2%§ … … … 1813 600 …
CHD includes people who responded “yes” to at least 1 of the questions in “Has a doctor or other health professional ever told you that you had coronary heart disease, angina or angina pectoris, heart attack, or myocardial infarction?” Those who answered “no” but were diagnosed with Rose angina are also included (the Rose questionnaire is only administered to survey participants >40 years of age).
CHD indicates coronary heart disease; MI, myocardial infarction; NH, non-Hispanic; and ellipses (...), data not available.*Mortality data for the white, black, Asian or Pacific Islander, and American Indian/Alaska Native populations include deaths of persons of Hispanic and non-Hispanic
origin. Numbers of deaths for the American Indian/Alaska Native and Asian or Pacific Islander populations are known to be underestimated.†These percentages represent the portion of total CHD and MI mortality that is for males versus females.‡Estimates include Hispanics and non-Hispanics. Estimates for whites include other nonblack races.§National Health Interview Survey, National Center for Health Statistics 2010; data are weighted percentages for Americans ≥18 years of age.1
||Includes Chinese, Filipino, Hawaiian, Japanese, and Other Asian or Pacific Islander.¶Estimate considered unreliable or does not meet standards of reliability or precision.Sources: Prevalence: National Health and Nutrition Examination Survey 2007–2010 (National Center for Health Statistics) and National Heart, Lung, and Blood
Institute. Percentages for racial/ethnic groups are age-adjusted for Americans ≥20 years of age. Age-specific percentages are extrapolated to the 2010 US population estimates. These data are based on self-reports. Incidence: Atherosclerosis Risk in Communities study (2004–2009), National Heart, Lung, and Blood Institute. Mortality: Centers for Disease Control and Prevention/National Center for Health Statistics, 2009 Mortality Multiple Cause–US, version July 19, 2012. Hospital discharges: National Hospital Discharge Survey, National Center for Health Statistics (data include those inpatients discharged alive, dead, or status unknown).
by guest on December 16, 2013http://circ.ahajournals.org/Downloaded from

e194 Circulation January 1/8, 2013
0.8
6.0
21.1
34.6
0.6
5.5
10.6
18.6
0
5
10
15
20
25
30
35
40
20 - 39 40 - 59 60 - 79 80+
Perc
ent o
f Pop
ulat
ion
Age (years)
Men Women
Chart 18-1. Prevalence of coronary heart disease by age and sex (National Health and Nutrition Examination Survey: 2007–2010). Source: National Center for Health Statistics and National Heart, Lung, and Blood Institute.
0.5
3.3
12
19.5
0.4
1.8
3.8
9.9
0
5
10
15
20
25
20 - 39 40 - 59 60 - 79 80+
Perc
ent o
f Pop
ulat
ion
Age (years)
Men Women
Chart 18-2. Prevalence of myocardial infarction by age and sex (National Health and Nutrition Examination Survey: 2007–2010). Myo-cardial infarction includes people who answered "yes" to the question of ever having had a heart attack or myocardial infarction. Source: National Center for Health Statistics and National Heart, Lung, and Blood Institute.
by guest on December 16, 2013http://circ.ahajournals.org/Downloaded from

Heart Disease and Stroke Statistics—2013 Update: Chapter 18 e195
Chart 18-3. Annual number of adults having diagnosed heart attack or fatal coronary heart disease (CHD) by age and sex (Atherosclerosis Risk in Communities Surveillance: 2004–2009 and Cardiovascular Health Study). These data include myocardial infarction (MI) and fatal CHD but not silent MI. Source: National Heart, Lung, and Blood Institute.
* 2005-2009 for ages 75-84 years
0
2
4
6
8
10
12
14
16
18
20
35-44 45-54 55-64 65-74 75-84
Per 1
,000
Per
sons
Age (Years)
White Men Black Men White Women Black Women
Chart 18-4. Incidence of heart attack or fatal coronary heart disease by age, sex, and race (Atherosclerosis Risk in Communities Surveil-lance: 2004–2009*). Source: National Heart, Lung, and Blood Institute. *2005–2009 for ages 75–84 years.
by guest on December 16, 2013http://circ.ahajournals.org/Downloaded from

e196 Circulation January 1/8, 2013
* 2005-2009 for ages 75-84 years
0.6
1.8
5.3
6.9
8.6
1.4
3.3
6.6
11.4
14.7
0.2 0.8
2.5
3.5
8.0
0.7
2.0
4.3
8.9
11.0
0
2
4
6
8
10
12
14
16
35-44 45-54 55-64 65-74 75-84
Per 1
,000
Per
son
Year
s
Age (Years)
White Men Black Men White Women Black Women
Chart 18-5. Incidence of myocardial infarction* by age, sex, and race (Atherosclerosis Risk in Communities Surveillance: 2004-2009*). Source: Unpublished data from Atherosclerosis Risk in Communities study, National Heart, Lung, and Blood Institute. *2005–2009 for ages 75–84 years.
5
13
25
37
5
8
20
27
0
5
10
15
20
25
30
35
40
A B C D
Estim
ated
10-
Year
Rat
e (%
)
Men Women
A B C DBlood Pressure 120/80 140/90 140/90 140/90Cholesterol 200 240 240 240HDL-C 50 50 40 40Diabetes No No Yes YesCigarettes No No No Yes
Chart 18-6. Estimated 10-year coronary heart disease risk in adults 55 years of age according to levels of various risk factors (Framingham Heart Study). HDL-C indicates high density lipoprotein-cholesterol. Data derived from Wilson et al.51
by guest on December 16, 2013http://circ.ahajournals.org/Downloaded from

Heart Disease and Stroke Statistics—2013 Update: Chapter 18 e197
5.1
7.9
2.2
6.2
8.6
3.6
10.4
15.1
5.6
7.6
10.4
4.8
0
2
4
6
8
10
12
14
16
All Women Men
Prev
alen
ce (%
)
1971-75 1976-1980 1988-1994 1999-2006
Chart 18-7. Prevalence of low coronary heart disease risk, overall and by sex (National Health and Nutrition Examination Survey: 1971–2006). Low risk is defined as systolic blood pressure <120 mm Hg and diastolic blood pressure <80 mm Hg; cholesterol <200 mg/dL; body mass index <25 kg/m2; currently not smoking cigarettes; and no prior myocardial infarction or diabetes mellitus. Source: Personal communication with the National Heart, Lung, and Blood Institute, June 28, 2007.
0
200
400
600
800
1000
1200
1400
1970 1975 1980 1985 1990 1995 2000 2005 2010
Dis
char
ges
in T
hous
ands
Years
Males Females
Chart 18-8. Hospital discharges for coronary heart disease by sex (United States: 1970–2010). Hospital discharges include people discharged alive, dead, and “status unknown.” Source: National Hospital Discharge Survey/National Center for Health Statistics and National Heart, Lung, and Blood Institute.
by guest on December 16, 2013http://circ.ahajournals.org/Downloaded from

e198 Circulation January 1/8, 2013
0.3
2.9
8.7
11.9
0.2
4.3
6.0
9.2
0
2
4
6
8
10
12
14
20 - 39 40 - 59 60 - 79 80+
Perc
ent o
f Pop
ulat
ion
Age (years)Men Women
Chart 18-9. Prevalence of angina pectoris by age and sex (National Health and Nutrition Examination Survey: 2007–2010). Angina pec-toris includes people who either answered “yes” to the question of ever having angina or angina pectoris or were diagnosed with Rose Angina. Source: National Center for Health Statistics and National Heart, Lung, and Blood Institute.
4.0
5.6
10.110.5
7.6
0.9
3.1
5.35.0
4.2
0
2
4
6
8
10
12
45-54 55-64 65-74 75-84 85-94
Per 1
,000
Per
son
Year
s
Age (Years)
Men Women
Chart 18-10. Incidence of angina pectoris* by age and sex (Framingham Heart Study 1980–2002/2003). *Angina pectoris deemed uncomplicated on the basis of physician interview of patient. (Rate for women 45–54 years of age considered unreliable.) Data derived from National Heart, Lung, and Blood Institute.8
by guest on December 16, 2013http://circ.ahajournals.org/Downloaded from
Heart Disease and Stroke Statistics—2013 Update: Chapter 19 e199
19. Cardiomyopathy and Heart Failure
See Table 19-1 and Charts 19-1 through 19-3.
CardiomyopathyICD-9 425; ICD-10 I42 .
Mortality—23 831 . Any-mention mortality—47 323 .Hospital discharges—34 000 .
●● Since 1996, the NHLBI-sponsored Pediatric Cardiomyopa-thy Registry has collected data on all children with newly diagnosed cardiomyopathy in New England and the Cen-tral Southwest (Texas, Oklahoma, and Arkansas) .1
—The overall incidence of cardiomyopathy is 1 .13 cases per 100 000 among children <18 years of age .
—Among children <1 year of age, the incidence is 8 .34, and among children 1 to 18 years of age, it is 0 .70 per 100 000 .
—The annual incidence is lower in white than in black chil-dren, higher in boys than in girls, and higher in New England (1 .44 per 100 000) than in the Central South-west (0 .98 per 100 000) .
●● HCM is the most common inherited heart defect, occur-ring in 1 of 500 individuals . In the United States, ≈500 000 people have HCM, yet most are unaware of it .2 See Chapter
16, Disorders of Heart Rhythm, for statistics regarding sud-den death in HCM .
●● In a recent report of the Pediatric Cardiomyopathy Regis-try, the overall annual incidence of HCM in children was 4 .7 per 1 million children . There was a higher incidence in the New England than in the Central Southwest region, in boys than in girls, and in children diagnosed at <1 year of age than in older children .3
●● Dilated cardiomyopathy is the most common form of cardiomyopathy . The Pediatric Cardiomyopathy Reg-istry recently reported an annual incidence of dilated cardiomyopathy in children <18 years of age of 0 .57 per 100 000 overall . The annual incidence was higher in boys than in girls (0 .66 versus 0 .47 cases per 100 000), in blacks than in whites (0 .98 versus 0 .46 cases per 100 000), and in infants (<1 year of age) than in children (4 .40 versus 0 .34 cases per 100 000) . The majority of children (66%) had idiopathic disease . The most com-mon known causes were myocarditis (46%) and neuro-muscular disease (26%) .4
●● Risk factors for death and transplantation in children varied by cause of dilated cardiomyopathy . For idiopathic dilated cardiomyopathy, increased left ventricular end-diastolic dimension was associated with increased transplantation risk but not mortality . Short stature was significantly related to death but not transplantation .5
●● The 5-year incidence rate of sudden cardiac death among children with dilated cardiomyopathy is 3% .6
●● Tachycardia-induced cardiomyopathy develops slowly and appears reversible, but recurrent tachycardia causes rapid decline in left ventricular function and development of HF . Sudden death is possible .7
●● Data from Kaiser Permanente indicate that the incidence of peripartum cardiomyopathy is 4 .84 per 10 000 live births (95% CI, 3 .98–5 .83) and is associated with higher maternal and neonatal death rates and worse neonatal outcomes .8
Heart FailureICD-9 428; ICD-10 I50 .
Prevalence(See Table 19-1 and Chart 19-1 .)
●● On the basis of data from NHANES 2007–2010, an esti-mated 5 .1 million Americans ≥20 years of age have HF (NHLBI tabulation) .
●● Projections show that by 2030, the prevalence of HF will increase 25% from 2013 estimates (AHA computation based on methodology described in Heidenreich et al9) .
Incidence(See Table 19-1 and Chart 19-2 .)
●● Data from the NHLBI-sponsored FHS10 indicate the following:
—HF incidence approaches 10 per 1000 population after 65 years of age .
—Seventy-five percent of HF cases have antecedent hypertension .
—At 40 years of age, the lifetime risk of developing HF for both men and women is 1 in 5 . At 80 years of age, remaining lifetime risk for development of new HF
Abbreviations Used in Chapter 19
ABC Aging, Body and Composition
AHA American Heart Association
ARIC Atherosclerosis Risk in Communities Study
BP blood pressure
CAD coronary artery disease
CARDIA Coronary Artery Risk Development in Young Adults Study
CHS Cardiovascular Health Study
CI confidence interval
CVD cardiovascular disease
DM diabetes mellitus
EF ejection fraction
FHS Framingham Heart Study
HbA1c hemoglobin A1c
HCM hypertrophic cardiomyopathy
HF heart failure
HR hazard ratio
ICD-9 International Classification of Diseases, 9th Revision
ICD-10 International Classification of Diseases, 10th Revision
MESA Multi-Ethnic Study of Atherosclerosis
MI myocardial infarction
NCHS National Center for Health Statistics
NH non-Hispanic
NHAMCS National Hospital Ambulatory Medical Care Survey
NHANES National Health and Nutrition Examination Survey
NHDS National Hospital Discharge Survey
NHLBI National Heart, Lung, and Blood Institute
PAR population attributable risk
by guest on December 16, 2013http://circ.ahajournals.org/Downloaded from

e200 Circulation January 1/8, 2013
remains at 20% for men and women, even in the face of a much shorter life expectancy .
—At 40 years of age, the lifetime risk of HF occurring without antecedent MI is 1 in 9 for men and 1 in 6 for women .
—The lifetime risk for people with BP >160/90 mm Hg is double that of those with BP <140/90 mm Hg .
●● The annual rates per 1000 population of new HF events for white men are 15 .2 for those 65 to 74 years of age, 31 .7 for those 75 to 84 years of age, and 65 .2 for those ≥85 years of age . For white women in the same age groups, the rates are 8 .2, 19 .8, and 45 .6, respectively . For black men, the rates are 16 .9, 25 .5, and 50 .6,* and for black women, the estimated rates are 14 .2, 25 .5, and 44 .0,* respectively (CHS, NHLBI) .11
●● In MESA, African Americans had the highest risk of developing HF, followed by Hispanic, white, and Chinese Americans (4 .6, 3 .5, 2 .4, and 1 .0 per 1000 person-years, respectively) . This higher risk reflected differences in the prevalence of hypertension, DM, and socioeconomic sta-tus . African Americans had the highest proportion of inci-dent HF not preceded by clinical MI (75%) .12
●● In Olmsted County, Minnesota, the incidence of HF did not decline between 1979 and 2000 .13
●● In the ARIC study of the NHLBI, the age-adjusted inci-dence rate per 1000 person-years was 3 .4 for white women, less than for all other groups, that is, white men (6 .0), black women (8 .1), and black men (9 .1) . The 30-day, 1-year, and 5-year case fatality rates after hospi-talization for HF were 10 .4%, 22%, and 42 .3%, respec-tively . Blacks had a greater 5-year case fatality rate than whites (P<0 .05) . HF incidence rates in black women were more similar to those of men than of white women . The greater HF incidence in blacks than in whites is explained largely by blacks’ greater levels of atherosclerotic risk factors .14
●● Data from Kaiser Permanente indicated an increase in the incidence of HF among the elderly, with the effect being greater in men .15
●● Data from hospitals in Worcester, MA, indicate that during 2000, the incidence and attack rates for HF were 219 per 100 000 and 897 per 100 000, respectively . HF was more frequent in women and the elderly . The hospital fatality rate was 5 .1% .16
●● In the CARDIA study, HF before 50 years of age was more common among blacks than whites . Hypertension, obesity, and systolic dysfunction are important risk factors that may be targets for prevention .17
Mortality(See Table 19-1 .)
●● In 2009, HF any-mention mortality was 274 601 (123 661 males and 150 940 females) . HF was the underlying cause in 56 410 of those deaths in 2009 (NCHS, NHLBI) . Table 19-1 shows the numbers of these deaths that are coded for HF as the underlying cause .
●● The 2009 overall any-mention death rate for HF was 82 .3 . Any-mention death rates were 98 .3 for white males, 104 .5
for black males, 72 .2 for white females, and 79 .7 for black females (NCHS, NHLBI) .
●● One in 9 deaths has HF mentioned on the death certificate (NCHS, NHLBI) .
●● The number of any-mention deaths attributable to HF was approximately as high in 1995 (287 000) as it was in 2009 (275 000; NCHS, NHLBI) .
●● Survival after HF diagnosis has improved over time, as shown by data from the FHS18 and the Olmsted County Study .13 However, the death rate remains high: ≈50% of people diagnosed with HF will die within 5 years .13,19
●● In the elderly, data from Kaiser Permanente indicate that survival after the onset of HF has also improved .15
●● In the CHS, depression and amino-terminal pro-B-type natriuretic peptide were independent risk factors for CVD-related and all-cause mortality .20
●● Among Medicare beneficiaries, the overall 1-year mortal-ity rate declined slightly over the past decade but remains high .21 Changes were uneven across states .
Risk Factors
●● In the NHLBI-sponsored FHS, hypertension is a common risk factor for HF, followed closely by antecedent MI .18 B-type natriuretic peptide, urinary albumin-to-creatinine ratio, and elevated serum γ-glutamyl transferase were also identified as risk factors for HF .22,23
●● In the Framingham Offspring Study, among 2739 par-ticipants, increased circulating concentrations of resistin were associated with incident HF independent of preva-lent coronary disease, obesity, insulin resistance, and inflammation .24
●● Among 20 900 male physicians in the Physicians Health Study, the lifetime risk of HF was higher in men with hypertension; healthy lifestyle factors (normal weight, not smoking, regular exercise, moderate alcohol intake, con-sumption of breakfast cereals, and consumption of fruits and vegetables) were related to lower risk of HF .25
●● Among 2934 participants in the Health Aging, Body and Composition (ABC) study, the incidence of HF was 13 .6 per 1000 person-years . Men and black participants were more likely to develop HF . Coronary disease (PAR 23 .9% for white participants, 29 .5% for black partici-pants) and uncontrolled BP (PAR 21 .3% for white par-ticipants, 30 .1% for black participants) had the highest PARs in both races . There was a higher overall proportion of HF attributable to modifiable risk factors in black par-ticipants than in white participants (67 .8% versus 48 .9%) . Hospitalizations were higher among black participants .26 Inflammatory markers (interleukin-6 and tumor necrosis factor-α) and serum albumin levels were also associated with HF risk .27,28
●● In the CHS, baseline cardiac troponin and changes in car-diac troponin levels measured by a sensitive assay were significantly associated with incident HF .29 Circulating individual and total omega-3 fatty acid concentrations were associated with lower incidence of HF .30
●● In the ARIC study, white blood cell count, C-reactive protein, albuminuria, HbA
1c among individuals without
DM, cardiac troponin measured with a sensitive assay, *Unreliable estimate .
by guest on December 16, 2013http://circ.ahajournals.org/Downloaded from

Heart Disease and Stroke Statistics—2013 Update: Chapter 19 e201
ventricular premature complexes, and socioeconomic posi-tion over the life course were all identified as risk factors for HF .18,31–35
Left Ventricular Function
●● Data from Olmsted County, Minnesota, indicate that:
—Among asymptomatic individuals, the prevalence of left ventricular diastolic dysfunction was 21% for mild diastolic dysfunction and 7% for moderate or severe diastolic dysfunction . The prevalence of systolic dys-function was 6% . The presence of any left ventricular dysfunction (systolic or diastolic) was associated with an increased risk of developing overt HF, and dia-stolic dysfunction was predictive of all-cause death .36 After 4 years of follow-up, the prevalence of diastolic dysfunction increased to 39 .2% . Diastolic dysfunc-tion was associated with development of HF during 6 years of subsequent follow-up after adjustment for age, hypertension, DM, and CAD (HR, 1 .81; 95% CI, 1 .01–3 .48) .37
—Among individuals with symptomatic HF, the preva-lence of left ventricular diastolic dysfunction was 6% for mild diastolic dysfunction and 75% for moderate or severe diastolic dysfunction .38 The proportion of people with HF and preserved EF increased over time . Survival improved over time among individuals with reduced EF but not among those with preserved EF .39
Hospital Discharges/Ambulatory Care Visits(See Table 19-1 and Chart 19-3 .)
●● Hospital discharges for HF were essentially unchanged from 2000 to 2010, with first-listed discharges of 1 .008 million and 1 .023 million, respectively (NHDS, NHLBI tabulation) .
●● In 2010, there were 1 .801 million physician office visits with a primary diagnosis of HF . In 2009, there were 668 000 ED visits and 293 000 outpatient department visits for HF (NHAMCS, NHLBI tabulation) .
●● Among 1077 patients with HF in Olmsted County, Min-nesota, hospitalizations were common after HF diagnosis, with 83% patients hospitalized at least once and 43% hos-pitalized at least 4 times . More than one half of all hospital-izations were related to noncardiovascular causes .40
●● Among Medicare beneficiaries, the overall HF hospitaliza-tion rate declined substantially from 1998 to 2008 but at a lower rate for black men .21 Changes were uneven across states .
Cost
●● Projections show that by 2030, the total cost of HF will increase almost 120% to $70 billion from the 2013 esti-mated total cost of $32 billion (unpublished AHA com-putation based on methodology described in Heidenreich et al9) .
References 1 . Lipshultz SE, Sleeper LA, Towbin JA, Lowe AM, Orav EJ, Cox GF, Lurie
PR, McCoy KL, McDonald MA, Messere JE, Colan SD . The incidence
of pediatric cardiomyopathy in two regions of the United States . N Engl J Med . 2003;348:1647–1655 .
2 . Maron BJ, McKenna WJ, Danielson GK, Kappenberger LJ, Kuhn HJ, Se-idman CE, Shah PM, Spencer WH 3rd, Spirito P, Ten Cate FJ, Wigle ED; Task Force on Clinical Expert Consensus Documents . American College of Cardiology; Committee for Practice Guidelines . European Society of Cardiology . American College of Cardiology/European Society of Car-diology clinical expert consensus document on hypertrophic cardiomy-opathy: a report of the American College of Cardiology Foundation Task Force on Clinical Expert Consensus Documents and the European Soci-ety of Cardiology Committee for Practice Guidelines . J Am Coll Cardiol . 2003;42:1687–1713 .
3 . Colan SD, Lipshultz SE, Lowe AM, Sleeper LA, Messere J, Cox GF, Lu-rie PR, Orav EJ, Towbin JA . Epidemiology and cause-specific outcome of hypertrophic cardiomyopathy in children: findings from the Pediatric Cardiomyopathy Registry . Circulation . 2007;115:773–781 .
4 . Towbin JA, Lowe AM, Colan SD, Sleeper LA, Orav EJ, Clunie S, Messere J, Cox GF, Lurie PR, Hsu D, Canter C, Wilkinson JD, Lipshultz SE . In-cidence, causes, and outcomes of dilated cardiomyopathy in children . JAMA . 2006;296:1867–1876 .
5 . Alvarez JA, Orav EJ, Wilkinson JD, Fleming LE, Lee DJ, Sleeper LA, Rusconi PG, Colan SD, Hsu DT, Canter CE, Webber SA, Cox GF, Jef-feries JL, Towbin JA, Lipshultz SE; Pediatric Cardiomyopathy Registry Investigators . Competing risks for death and cardiac transplantation in children with dilated cardiomyopathy: results from the Pediatric Cardio-myopathy Registry . Circulation . 2011;124:814–823 .
6 . Pahl E, Sleeper LA, Canter CE, Hsu DT, Lu M, Webber SA, Colan SD, Kantor PF, Everitt MD, Towbin JA, Jefferies JL, Kaufman BD, Wilkinson JD, Lipshultz SE; Pediatric Cardiomyopathy Registry Investigators . Incidence of and risk factors for sudden cardiac death in children with dilated cardiomyopathy: a report from the Pediatric Cardiomyopathy Registry . J Am Coll Cardiol . 2012;59:607–615 .
7 . Nerheim P, Birger-Botkin S, Piracha L, Olshansky B . Heart failure and sudden death in patients with tachycardia-induced cardiomyopathy and recurrent tachycardia . Circulation . 2004;110:247–252 .
8 . Gunderson EP, Croen LA, Chiang V, Yoshida CK, Walton D, Go AS . Epi-demiology of peripartum cardiomyopathy: incidence, predictors, and out-comes . Obstet Gynecol . 2011;118:583–591 .
9 . Heidenreich PA, Trogdon JG, Khavjou OA, Butler J, Dracup K, Ezekow-itz MD, Finkelstein EA, Hong Y, Johnston SC, Khera A, Lloyd-Jones DM, Nelson SA, Nichol G, Orenstein D, Wilson PW, Woo YJ; on behalf of the American Heart Association Advocacy Coordinating Committee; Stroke Council; Council on Cardiovascular Radiology and Intervention; Council on Clinical Cardiology; Council on Epidemiology and Preven-tion; Council on Arteriosclerosis; Thrombosis and Vascular Biology; Council on Cardiopulmonary; Critical Care; Perioperative and Resus-citation; Council on Cardiovascular Nursing; Council on the Kidney in Cardiovascular Disease; Council on Cardiovascular Surgery and Anes-thesia, and Interdisciplinary Council on Quality of Care and Outcomes Research . Forecasting the future of cardiovascular disease in the United States: a policy statement from the American Heart Association . Circula-tion . 2011;123:933–944 .
10 . Lloyd-Jones DM, Larson MG, Leip EP, Beiser A, D’Agostino RB, Kannel WB, Murabito JM, Vasan RS, Benjamin EJ, Levy D; Framingham Heart Study . Lifetime risk for developing congestive heart failure: the Framing-ham Heart Study . Circulation . 2002;106:3068–3072 .
11 . Incidence and Prevalence: 2006 Chart Book on Cardiovascular and Lung Diseases . Bethesda, MD: National Heart, Lung, and Blood Institute; 2006 .
12 . Bahrami H, Kronmal R, Bluemke DA, Olson J, Shea S, Liu K, Burke GL, Lima JA . Differences in the incidence of congestive heart failure by ethnicity: the Multi-Ethnic Study of Atherosclerosis . Arch Intern Med . 2008;168:2138–2145 .
13 . Roger VL, Weston SA, Redfield MM, Hellermann-Homan JP, Killian J, Yawn BP, Jacobsen SJ . Trends in heart failure incidence and survival in a community-based population . JAMA . 2004;292:344–350 .
14 . Loehr LR, Rosamond WD, Chang PP, Folsom AR, Chambless LE . Heart failure incidence and survival (from the Atherosclerosis Risk in Commu-nities study) . Am J Cardiol . 2008;101:1016–1022 .
15 . Barker WH, Mullooly JP, Getchell W . Changing incidence and survival for heart failure in a well-defined older population, 1970-1974 and 1990-1994 . Circulation . 2006;113:799–805 .
16 . Goldberg RJ, Spencer FA, Farmer C, Meyer TE, Pezzella S . Incidence and hospital death rates associated with heart failure: a community-wide perspective . Am J Med . 2005;118:728–734 .
by guest on December 16, 2013http://circ.ahajournals.org/Downloaded from

e202 Circulation January 1/8, 2013
17 . Bibbins-Domingo K, Pletcher MJ, Lin F, Vittinghoff E, Gardin JM, Arynchyn A, Lewis CE, Williams OD, Hulley SB . Racial differences in inci-dent heart failure among young adults . N Engl J Med . 2009;360:1179–1190 .
18 . Matsushita K, Blecker S, Pazin-Filho A, Bertoni A, Chang PP, Coresh J, Selvin E . The association of hemoglobin A1c with incident heart failure among people without diabetes: the Atherosclerosis Risk in Communities study . Diabetes . 2010;59:2020–2026 .
19 . Levy D, Kenchaiah S, Larson MG, Benjamin EJ, Kupka MJ, Ho KK, Mu-rabito JM, Vasan RS . Long-term trends in the incidence of and survival with heart failure . N Engl J Med . 2002;347:1397–1402 .
20 . van den Broek KC, Defilippi CR, Christenson RH, Seliger SL, Gottdiener JS, Kop WJ . Predictive value of depressive symptoms and B-type natri-uretic peptide for new-onset heart failure and mortality . Am J Cardiol . 2011;107:723–729 .
21 . Chen J, Normand SL, Wang Y, Krumholz HM . National and regional trends in heart failure hospitalization and mortality rates for Medicare beneficiaries, 1998-2008 . JAMA . 2011;306:1669–1678 .
22 . Velagaleti RS, Gona P, Larson MG, Wang TJ, Levy D, Benjamin EJ, Selhub J, Jacques PF, Meigs JB, Tofler GH, Vasan RS . Multimarker approach for the prediction of heart failure incidence in the community . Circulation . 2010;122:1700–1706 .
23 . Dhingra R, Gona P, Wang TJ, Fox CS, D’Agostino RB Sr, Vasan RS . Se-rum gamma-glutamyl transferase and risk of heart failure in the commu-nity . Arterioscler Thromb Vasc Biol . 2010;30:1855–1860 .
24 . Frankel DS, Vasan RS, D’Agostino RB Sr, Benjamin EJ, Levy D, Wang TJ, Meigs JB . Resistin, adiponectin, and risk of heart failure: the Framing-ham offspring study . J Am Coll Cardiol . 2009;53:754–762 .
25 . Djoussé L, Driver JA, Gaziano JM . Relation between modifiable lifestyle factors and lifetime risk of heart failure . JAMA . 2009;302:394–400 .
26 . Kalogeropoulos A, Georgiopoulou V, Kritchevsky SB, Psaty BM, Smith NL, Newman AB, Rodondi N, Satterfield S, Bauer DC, Bibbins-Domingo K, Smith AL, Wilson PW, Vasan RS, Harris TB, Butler J . Epidemiology of incident heart failure in a contemporary elderly cohort: the Health, Aging, and Body Composition study . Arch Intern Med . 2009;169:708–715 .
27 . Kalogeropoulos A, Georgiopoulou V, Psaty BM, Rodondi N, Smith AL, Harrison DG, Liu Y, Hoffmann U, Bauer DC, Newman AB, Kritchevsky SB, Harris TB, Butler J; Health ABC Study Investigators . Inflamma-tory markers and incident heart failure risk in older adults: the Health ABC (Health, Aging, and Body Composition) study . J Am Coll Cardiol . 2010;55:2129–2137 .
28 . Gopal DM, Kalogeropoulos AP, Georgiopoulou VV, Tang WW, Methvin A, Smith AL, Bauer DC, Newman AB, Kim L, Harris TB, Kritchevsky SB, Butler J; Health ABC Study . Serum albumin concentration and heart failure risk: the Health, Aging, and Body Composition Study . Am Heart J . 2010;160:279–285 .
29 . deFilippi CR, de Lemos JA, Christenson RH, Gottdiener JS, Kop WJ, Zhan M, Seliger SL . Association of serial measures of cardiac troponin T using a sensitive assay with incident heart failure and cardiovascular mortality in older adults . JAMA . 2010;304:2494–2502 .
30 . Mozaffarian D, Lemaitre RN, King IB, Song X, Spiegelman D, Sacks FM, Rimm EB, Siscovick DS . Circulating long-chain ω-3 fatty acids and inci-dence of congestive heart failure in older adults: the Cardiovascular Health Study: a cohort study . Ann Intern Med . 2011;155:160–170 .
31 . Blecker S, Matsushita K, Köttgen A, Loehr LR, Bertoni AG, Boulware LE, Coresh J . High-normal albuminuria and risk of heart failure in the community . Am J Kidney Dis . 2011;58:47–55 .
32 . Saunders JT, Nambi V, de Lemos JA, Chambless LE, Virani SS, Boerwinkle E, Hoogeveen RC, Liu X, Astor BC, Mosley TH, Folsom AR, Heiss G, Coresh J, Ballantyne CM . Cardiac troponin T measured by a highly sensitive assay predicts coronary heart disease, heart failure, and mortality in the Atherosclerosis Risk in Communities Study . Circulation . 2011;123:1367–1376 .
33 . Roberts CB, Couper DJ, Chang PP, James SA, Rosamond WD, Heiss G . Influence of life-course socioeconomic position on incident heart failure in blacks and whites: the Atherosclerosis Risk in Communities Study . Am J Epidemiol . 2010;172:717–727 .
34 . Bekwelem W, Lutsey PL, Loehr LR, Agarwal SK, Astor BC, Guild C, Bal-lantyne CM, Folsom AR . White blood cell count, C-reactive protein, and incident heart failure in the Atherosclerosis Risk in Communities (ARIC) Study . Ann Epidemiol . 2011;21:739–748 .
35 . Agarwal SK, Simpson RJ Jr, Rautaharju P, Alonso A, Shahar E, Massing M, Saba S, Heiss G . Relation of ventricular premature complexes to heart failure (from the Atherosclerosis Risk In Communities [ARIC] Study) . Am J Cardiol . 2012;109:105–109 .
36 . Redfield MM, Jacobsen SJ, Burnett JC Jr, Mahoney DW, Bailey KR, Ro-deheffer RJ . Burden of systolic and diastolic ventricular dysfunction in the community: appreciating the scope of the heart failure epidemic . JAMA . 2003;289:194–202 .
37 . Kane GC, Karon BL, Mahoney DW, Redfield MM, Roger VL, Burnett JC Jr, Jacobsen SJ, Rodeheffer RJ . Progression of left ventricular diastolic dysfunction and risk of heart failure . JAMA . 2011;306:856–863 .
38 . Bursi F, Weston SA, Redfield MM, Jacobsen SJ, Pakhomov S, Nkomo VT, Meverden RA, Roger VL . Systolic and diastolic heart failure in the com-munity . JAMA . 2006;296:2209–2216 .
39 . Owan TE, Hodge DO, Herges RM, Jacobsen SJ, Roger VL, Redfield MM . Trends in prevalence and outcome of heart failure with preserved ejection fraction . N Engl J Med . 2006;355:251–259 .
40 . Dunlay SM, Redfield MM, Weston SA, Therneau TM, Hall Long K, Shah ND, Roger VL . Hospitalizations after heart failure diagnosis: a commu-nity perspective . J Am Coll Cardiol . 2009;54:1695–1702 .
Table 19-1. Heart Failure
Population Group Prevalence, 2010, Age ≥20 yIncidence (New Cases),
Age ≥45 y Mortality, 2009, All Ages*Hospital Discharges,
2010, All Ages
Both sexes 5 100 000 (2.1%) 670 000 56 410 1 023 000
Males 2 700 000 (2.5%) 350 000 23 563 (41.8%)† 501 000
Females 2 400 000 (1.8%) 320 000 32 847 (58.2%)† 522 000
NH white males 2.2% … 20 815 …
NH white females 1.7% … 29 372 …
NH black males 4.1% … 2341 …
NH black females 3.0% … 2987 …
Mexican American males 1.9% … … …
Mexican American females 1.1% … … …
Asian … … 660 …
American Indian/Alaska Native … … 235 …
Heart failure includes persons who answered “yes” to the question of ever having congestive heart failure.NH indicates non-Hispanic; and ellipses (. . .), data not available.*Mortality data are based on underlying cause and include Hispanics.†These percentages represent the portion of total mortality attributable to heart failure that is for males vs females.Sources: Prevalence: National Health and Nutrition Examination Survey 2007–2010 (National Center for Health Statistics) and National Heart, Lung, and Blood
Institute. Percentages are age adjusted for Americans ≥20 years of age. Age-specific percentages are extrapolated to the 2010 US population estimates. These data are based on self-reports. Incidence: Framingham Heart Study, 1980–2003 from National Heart, Lung, and Blood Institute Incidence and Prevalence Chart Book, 2006. Mortality: Centers for Disease Control and Prevention/National Center for Health Statistics, 2009 Mortality Multiple Cause–US, version July 19, 2012.
by guest on December 16, 2013http://circ.ahajournals.org/Downloaded from

Heart Disease and Stroke Statistics—2013 Update: Chapter 19 e203
0.2
1.5
7.8
8.6
0.40.7
4.5
11.5
0
2
4
6
8
10
12
14
20-39 40-59 60-79 80+
Per
cen
t o
f P
op
ula
tio
n
Age
Male Female
Chart 19-1. Prevalence of heart failure by sex and age (National Health and Nutrition Examination Survey: 2007–2010). Source: National Center for Health Statistics and National Heart, Lung, and Blood Institute.
9.2
22.3
41.9
4.7
14.8
32.7
0
5
10
15
20
25
30
35
40
45
50
65-74 75-84 85+
Per 1
000
Pers
on Y
ears
Age (Years)
Men Women
Chart 19-2. Incidence of heart failure (heart failure based on physician review of medical records and strict diagnostic criteria) by age and sex (Framingham Heart Study: 1980–2003). Source: National Heart, Lung, and Blood Institute.
by guest on December 16, 2013http://circ.ahajournals.org/Downloaded from
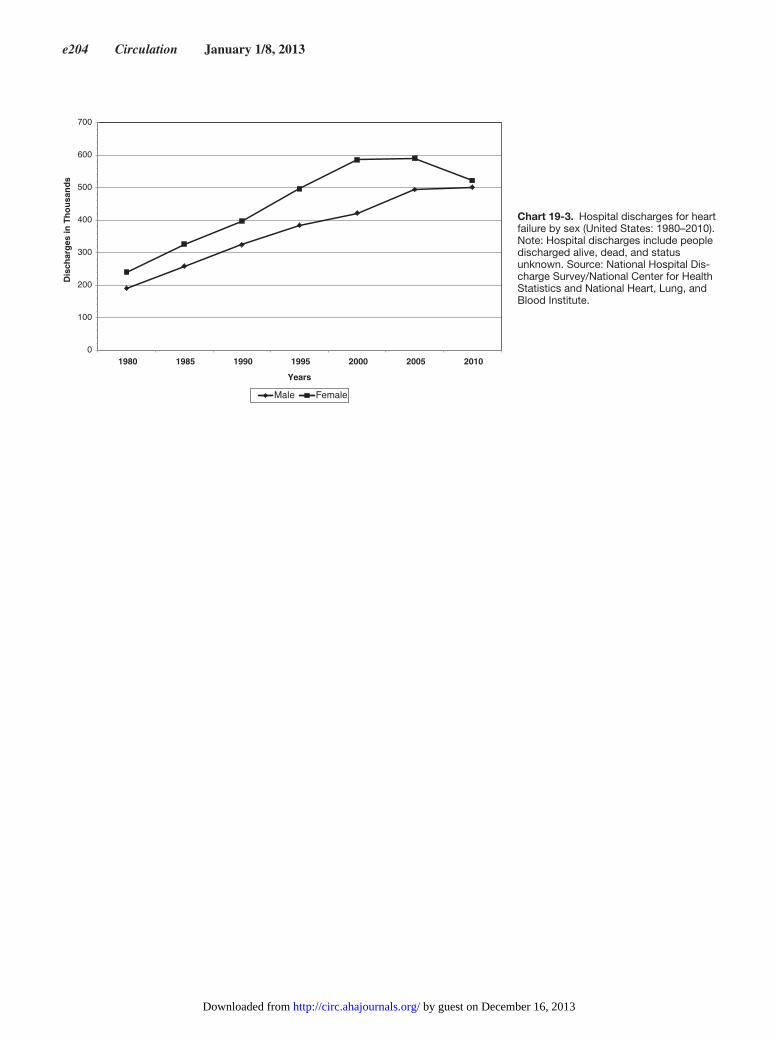
e204 Circulation January 1/8, 2013
0
100
200
300
400
500
600
700
1980 1985 1990 1995 2000 2005 2010
Dis
char
ges
in T
ho
usa
nd
s
Years
Male Female
Chart 19-3. Hospital discharges for heart failure by sex (United States: 1980–2010). Note: Hospital discharges include people discharged alive, dead, and status unknown. Source: National Hospital Dis-charge Survey/National Center for Health Statistics and National Heart, Lung, and Blood Institute.
by guest on December 16, 2013http://circ.ahajournals.org/Downloaded from

Heart Disease and Stroke Statistics—2013 Update: Chapter 20 e205
20. Valvular, Venous, Aortic, and Peripheral Artery Diseases
See Tables 20-1 and 20-2 and Charts 20-1 through 20-3.
Mortality and any-mention mortality in this section are for 2009 . “Mortality” is the number of deaths in 2009 for the given underlying cause based on ICD-10 . Prevalence data are for 2006 . Hospital discharge data are from the NHDS/NCHS; data include inpatients discharged alive, dead, or sta-tus unknown . Hospital discharge data for 2009 are based on ICD-9 codes .
Valvular Heart Disease(See Table 20-1 .)
ICD-9 424; ICD-10 I34 to I38.
Mortality—22 144 . Any-mention mortality—45 285 . Hospital discharges—85 000 .
Two important factors have contributed to the changing epidemiology of valvular heart disease in the United States over the past few decades: aging of the population and the increased ability to diagnose valvular heart disease by echocardiography .
●● A large population-based epidemiological study with sys-tematic use of echocardiography on 16 501participants from Olmsted County, Minnesota, showed an overall age-adjusted prevalence of clinically diagnosed (moderate or greater) valvular heart disease of 1 .8% .1
●● Prevalence of any valve disease increased with age1:
— 18 to 44 years: 0 .3% (95% CI, 0 .2%–0 .3%)— 45 to 54 years: 0 .7% (95% CI, 0 .6%–0 .9%)— 55 to 64 years: 1 .6% (95% CI, 1 .4%–1 .9%)— 65 to 75 years: 4 .4% (95% CI, 3 .9%–4 .9%)— ≥75 years: 11 .7% (95% CI, 11 .0%–12 .5%)
●● Pooled echocardiographic data from 11 911 participants from CARDIA (4351), ARIC (2435), and CHS (5125) demonstrated a similar increase in prevalence with age (Table 20-1)1:
— 18 to 44 years: 0 .7% (95% CI, 0 .5%–1 .0%)— 45 to 54 years: 0 .4% (95% CI, 0 .1%–1 .3%)— 55 to 64 years: 1 .9% (95% CI, 1 .2%–2 .8%)— 65 to 75 years: 8 .5% (95% CI, 7 .6%–9 .4%)— ≥75 years: 13 .3% (95% CI, 11 .7%–15 .0%)
●● Adjusted to the entire US population, these data suggest that the prevalence of any valve disease is 2 .5% (95% CI, 2 .2%–2 .7%), with no difference between men (2 .4% [95% CI, 2 .1%–2 .8%]) and women (2 .5% [95% CI, 2 .1%–2 .9%]) . Within this sample, 0 .4% had aortic stenosis, 0 .5% had aortic regurgitation, 0 .1% had mitral stenosis, and 1 .7% had mitral regurgitation .1
●● In CARDIA, ARIC, and CHS, survival of participants with valve disease was 79% (standard error 2%) at 5 years and 68%
Abbreviations Used in Chapter 20
AAA abdominal aortic aneurysm
ABI ankle brachial index
AHA American Heart Association
ARIC Atherosclerosis Risk in Communities study
BMI body mass index
CARDIA Coronary Artery Risk Development in Young Adults
CDC Centers for Disease Control and Prevention
CHD coronary heart disease
CHS Cardiovascular Health Study
CI confidence interval
CKD chronic kidney disease
CT computed tomography
CVD cardiovascular disease
DM diabetes mellitus
DVT deep vein thrombosis
ECG electrocardiogram
FHS Framingham Heart Study
HD heart disease
HR hazard ratio
ICD International Classification of Diseases
ICD-9 International Classification of Diseases, 9th Revision
ICD-10 International Classification of Diseases, 10th Revision
IE infective endocarditis
IRAD International Registry of Acute Aortic Dissection
MESA Multi-Ethnic Study of Atherosclerosis
MI myocardial infarction
NCHS National Center for Health Statistics
NH non-Hispanic
NHANES National Health and Nutrition Examination Survey
NHDS National Hospital Discharge Survey
NHLBI National Heart, Lung, and Blood Institute
OR odds ratio
PA physical activity
PAD peripheral artery disease
PE pulmonary embolism
REACH Reduction of Atherothrombosis for Continued Health
RR relative risk
SOURCE United Kingdom SAPIEN Aortic Bioprosthesis Euro-pean Outcome registry
TAVI United Kingdom Transcatheter Aortic Valve Implanta-tion registry
TAVR transcatheter aortic valve replacement
TIA transient ischemic attack
VTE venous thromboembolism
VSS venous stasis syndrome
WHO World Health Organization
WONDER Wide-ranging Online Data for Epidemiologic Re-search
by guest on December 16, 2013http://circ.ahajournals.org/Downloaded from

e206 Circulation January 1/8, 2013
(1 .9%) at 8 years, compared with 93% (0 .2%) and 86% (0 .4%) in participants without valve disease . In Olmsted County, valve disease was associated with a 75% increased risk of death through 8 years of follow-up (95% CI, 1 .61–1 .90) .
●● Echocardiography data from FHS of 1696 men and 1893 women (mean [standard deviation] age 54 [10] years) were used to assess the prevalence of valvular regurgitation . Mitral regurgitation or tricuspid regurgitation of more than or equal to mild severity was seen in 19 .0% and 14 .8% of men and 19 .1% and 18 .4% of women, respectively . Aortic regurgitation of more than or equal to trace severity was present in 13 .0% of men and 8 .5% of women .3
Aortic Valve DisordersICD-9 424.1; ICD-10 I35.
Mortality—14 703 Any-mention mortality—29 730 . Hospital discharges—55 000 .
●● The prevalence of moderate or severe aortic stenosis in patients ≥75 years old is 2 .8% (95% CI, 2 .1%–3 .7%), and the prevalence of moderate or severe aortic regurgitation in patients ≥75 years is 2 .0% (95% CI, 1 .4%–2 .7%) .1
●● Congenitally malformed bicuspid or unicuspid valve appeared to be at least as common (56%) as so-called degenerative tricuspid aortic valve disease (45%; 1% unde-termined) in a large (n=932 patients aged 26–91 years) single-center experience of patients who presented with isolated aortic valve replacement .4
●● Aortic regurgitation prevalence in patients presenting for aortic valve replacement suggests that cusp prolapse (type II aortic regurgitation) is a common cause of aortic regurgi-tation, on the basis of data from a large study from a single center in Belgium (n=163 patients; mean [standard devia-tion] age 58 [14] years)5:
— Type I: enlargement of the aortic root with normal cusps (25 .2%)
— Type II: cusp prolapse or fenestration (38 .0%)— Type III: poor cusp tissue quality or quantity (36 .8%)
●● In MESA participants aged 45 to 84 years (n=5880), aortic valve calcium was quantified with serial CT images . Dur-ing a mean follow-up of 2 .4 years, 210 (4 .1%) of the 5142 participants with no aortic valve calcium had a mean inci-dence rate of progression of 1 .7% per year, which increased with age . Incident aortic valve calcium was associated with several conventional cardiovascular risk factors, including age, male sex, BMI, and smoking .6
●● Approximately 50% of patients with severe aortic stenosis are referred for cardiothoracic surgery, and ≈40% undergo aor-tic valve replacement according to data from 10 US centers of various sizes and geographic distribution . Reasons for not undergoing aortic valve replacement included high periopera-tive risk, age, lack of symptoms, and patient/family refusal .7
Aortic Valve Interventions
●● Lipid-lowering therapy does not appear to reduce aortic stenosis progression on the basis of any echocardiographic measures of aortic stenosis, as reported by a meta-analysis of 4 randomized controlled trials by Teo and colleagues .8
●● Transcatheter aortic valve replacement (TAVR) has emerged as an innovative technology for treatment of aortic stenosis in patients at high risk for perioperative complications .
— Data from the UK Transcatheter Aortic Valve Implanta-tion (TAVI) Registry on 877 patients (through Decem-ber 2009) with 100% follow-up demonstrate survival rates of 92 .9% at 30 days, 78 .6% at 1 year, and 73 .7% at 2 years .9
— Safety of TAVR appeared to be improving from 2008–2009 to 2009–2010 in the United Kingdom SAPIEN Aortic Bioprosthesis European Outcome (SOURCE) Registry, with lower rates of >2+ aortic regurgita-tion (4 .5% versus 2 .1%, P=0 .01) and conversion to open surgery (3 .7% versus 1 .5%, P=0 .03) between the respective study periods . Pacemaker implantation (7 .7% versus 6 .7%), stroke (2 .4% versus 2 .6%), and 30-day mortality rates (10 .8% versus 10 .7%) did not change .10
— Thirty-day stroke/TIA rates appear higher with TAVR than with surgical aortic valve replacement (5 .5% ver-sus 2 .4%, P=0 .04) .11
Mitral Valve DisordersICD-9 424.0; ICD-10 I34.
Mortality—2280 . Any-mention mortality—5250 . Hospital discharges—22 000 .
Prevalence(See Table 20-1 .)
●● In pooled data from CARDIA, ARIC, and CHS, mitral valve disease was the most common valvular lesion . At least moderate mitral regurgitation occurred at a frequency of 1 .7% as adjusted to the US adult population of 2000, increasing from 0 .5% in participants aged 18 to 44 years to 9 .3% in participants aged ≥75 years .1
●● A systematic review by de Marchena and colleagues12 found that in the US population, the prevalence of mitral regurgitation according to Carpentier’s functional classifi-cation system was as follows:
— Type I (congenital mitral regurgitation and endocardi-tis): <20 per 1 million
— Type II (myxomatous mitral regurgitation): 15 000 per 1 million
— Type IIIa (rheumatic HD, systemic lupus erythemato-sus, antiphospholipid syndrome): 10 520 per 1 million
— Type IIIb (ischemic mitral regurgitation, left ventricu-lar dysfunction, dilated cardiomyopathy): 23 250 per 1 million
●● Data from the Framingham Offspring Study demonstrated that the prevalence of classic (1 .3%) and nonclassic (1 .1%) mitral valve prolapse was similar . The average degree of mitral regurgitation in both types of mitral valve prolapse was trace or mild . The frequencies of chest pain, dyspnea, and ECG abnormalities were similar among participants with and without prolapse .13
by guest on December 16, 2013http://circ.ahajournals.org/Downloaded from

Heart Disease and Stroke Statistics—2013 Update: Chapter 20 e207
Pulmonary Valve DisordersICD-9 424.3; ICD-10 I37.
Mortality—14 . Any-mention mortality—35 .
Tricuspid Valve DisordersICD-9 424.2; ICD-10 I36.
Mortality—12 . Any-mention mortality—95 .
Rheumatic Fever/Rheumatic HD(See Table 20-2 and Chart 20-1 .)
ICD-9 390 to 398; ICD-10 I00 to I09.
Mortality—3234 . Any-mention mortality—6085 . Hospital discharges—20 000 .
●● Rheumatic HD is uncommon in high-income countries such as the United States but remains endemic in Africa, Asia, and the Pacific, affecting >15 million individuals and causing 233 000 deaths annually .14
●● The reported prevalence of rheumatic HD is increasing in all regions of the world except Europe .15
●● Recent echocardiography-based screening studies in schoolchildren have demonstrated rheumatic HD preva-lence rates ranging from 14 .8 (95% CI, 7 .3–22 .3) per 1000 (Uganda)16 to 20 .4 (95% CI, 16 .9–23 .9) per 1000 in northern India17 to 21 .5 (95% CI, 16 .8–26 .2) per 1000 in Cambodia and 30 .4 (95% CI, 23 .2–37 .6) per 1000 (Mozambique) .18
— Echocardiography reveals a 3- to 10-fold higher preva-lence of rheumatic HD than clinical examination16,18
●● Acute rheumatic fever incidence is decreasing in all WHO regions except for the Americas, where it appears to be increasing slightly, and the Western Pacific, where it appears to be increasing steadily .15
●● In 1950, ≈15 000 Americans (adjusted for changes in ICD codes) died of rheumatic fever/rheumatic HD compared with ≈3100 annually in the present era (NCHS/NHLBI) .
●● The 2009 overall death rate for rheumatic fever/rheu-matic HD was 1 .1 per 100 000 . Death rates varied across race/ethnic groups but were generally low: white, 1 .2 per 100 000; black or African American, 0 .7 per 100 000; Asian or Pacific Islander, 0 .6 per 100 000; American Indian or Alaska Native, 0 .6 per 100 000; and Hispanic or Latino ori-gin individuals, 0 .4 per 100 000 .19
Bacterial EndocarditisICD-9 421.0; ICD-10 I33.0.
Mortality—1119 . Any-mention mortality—2289 . Hospital discharges—34 000, primary plus secondary diagnoses .
●● The 2007 AHA guidelines on prevention of infective endo-carditis (IE)15 state that IE is thought to result from the fol-lowing sequence of events: (1) Formation of nonbacterial thrombotic endocarditis on the surface of a cardiac valve or elsewhere that endothelial damage occurs; (2) bactere-mia; and (3) adherence of the bacteria in the bloodstream to nonbacterial thrombotic endocarditis and proliferation of bacteria within a vegetation . Viridans group streptococci
are part of the normal skin, oral, respiratory, and gastro-intestinal tract flora, and they cause ≥50% of cases of community-acquired native valve IE not associated with intravenous drug use .20
●● Although the absolute risk for acquiring IE from a dental procedure is impossible to measure precisely, the best available estimates are as follows: If dental treatment causes 1% of all cases of viridans group streptococcal IE annually in the United States, the overall risk in the general population is estimated to be as low as 1 case of IE per 14 million dental procedures . The estimated absolute risk rates for acquiring IE from a dental procedure in patients with underlying cardiac conditions are as follows21:
—Mitral valve prolapse: 1 per 1 .1 million procedures—CHD: 1 per 475 000—Rheumatic HD: 1 per 142 000—Presence of a prosthetic cardiac valve: 1 per 114 000—Previous IE: 1 per 95 000 dental procedures
●● Cessation of antibiotic prophylaxis for IE before dental pro-cedures has not led to a change in pediatric cases of endo-carditis . Using 2003 to 2010 data from 37 centers in the Pediatric Health Information Systems Database, Pasquali and colleagues22 did not demonstrate a significant differ-ence in the number of IE hospitalizations after the guide-lines were implemented in 2007 (1 .6% difference after versus before guideline implementation; 95% CI, −6 .4% to 10 .3%; P=0 .7) .
●● Cardiac device IE appears to be present in 6 .4% (95% CI, 5 .5%–7 .4%) of patients with definite IE, according to data from the International Collaboration on Endocarditis–Pro-spective Cohort Study (2000–2006) . Nearly half (45 .8%; 95% CI, 38 .3%–53 .4%) of such cases are associated with healthcare-associated infection . In-hospital and 1-year mortality rates for these patients were 14 .7% (26/177; 95% CI, 9 .8%–20 .8%) and 23 .2% (41/177; 95% CI, 17 .2%–30 .1%), respectively .23
Endocarditis, Valve UnspecifiedICD-9 424.9; ICD-10 I38.
Mortality—5135 . Any-mention mortality—10 414 .
Venous Thromboembolism Epidemiology (Including Deep Vein Thrombosis and Pulmonary Embolism)24
Pulmonary Embolism
ICD-9 415.1; ICD-10 I26.Mortality—7040 . Any-mention mortality—28 404 . Hospital discharges—186 000 .
Deep Vein Thrombosis
ICD-9 451.1; ICD-10 I80.2.
Mortality—2452 . Any-mention mortality—12 439 .
Incidence
●● Venous thromboembolism (VTE) consists of deep vein thrombosis (DVT; typically involving deep veins of the leg or pelvis) and its complication, pulmonary embolism (PE) .
by guest on December 16, 2013http://circ.ahajournals.org/Downloaded from

e208 Circulation January 1/8, 2013
●● The average annual incidence of VTE among whites is 108 per 100 000 person-years, with ≈250 000 incident cases occurring annually among US whites .
●● VTE incidence appears to be similar or higher among Afri-can Americans and lower among Asian Americans and Native Americans than among whites .
●● After adjustment for the different age and sex distribution of African Americans, VTE incidence is ≈78 per 100 000, which suggests that 27 000 incident VTE cases occur annu-ally among US blacks .
●● VTE incidence has not changed significantly over the past 25 years .
●● Incidence rates increase exponentially with age for both men and women and for both DVT and PE .
●● Incidence rates are higher in women during childbearing years, whereas incidence rates after age 45 years are higher in men .
●● PE accounts for an increasing proportion of VTE with increasing age in both sexes .
●● VTE event type (DVT versus PE) has a common familial background and shared genetic susceptibility .25
Survival
●● Observed survival after VTE is significantly worse than expected survival for age and sex, and survival after PE is much worse than after DVT alone .
●● For almost one quarter of PE patients, the initial clinical presentation is sudden death .
●● Thirty-day VTE survival is 74 .8% (DVT alone, 96 .2%; PE with or without DVT, 59 .1%) .26
●● PE is an independent predictor of reduced survival for up to 3 months .
●● Because most PE deaths are sudden and usually attributed to underlying disease (eg, cancer, other chronic heart, lung, or renal disease), secular trends in VTE survival are con-founded by autopsy rates .
Recurrence
●● VTE is a chronic disease with episodic recurrence; ≈30% of patients develop recurrence within the next 10 years .
●● The hazard of recurrence varies with the time since the inci-dent event and is highest within the first 6 to 12 months .
●● Independent predictors of early (within 180 days) recur-rence include active cancer, proportion of time spent taking heparin with a heparin level ≥0 .2 anti-Xa U/mL, and pro-portion of time spent taking warfarin with an international normalized ratio ≥2 . Two-week case fatality for recurrent DVT alone and recurrent PE with or without DVT is 2% and 11%, respectively .27
●● Independent predictors of long-term recurrence include age, BMI, neurological disease with leg paresis, active cancer, lupus anticoagulant or antiphospholipid antibody, antithrombin, protein C or protein S deficiency, and persis-tently increased plasma fibrin D-dimer .
●● Idiopathic incident VTE, incident PE, and male sex may predict a higher risk of recurrence, but reports are conflicting .28–30
●● Oncology patients with incidentally discovered PE have similarly high rates of recurrence and reduced survival compared with oncology patients with symptomatic PE .31
Complications
●● VTE complications include venous stasis syndrome (also called postthrombotic syndrome) and venous ulcer, as well as chronic thromboembolic pulmonary hypertension .
●● The 20-year cumulative incidence of venous stasis syndrome and venous ulcer after proximal DVT is ≈40% and 3 .7%, respectively .
●● The incidence of chronic thromboembolic pulmonary hypertension is 6 .5 per million person-years; ≈1400 inci-dent cases occur annually among US whites .
Risk Factors
●● Independent VTE risk factors include increasing patient age, surgery, trauma/fracture, hospital or nursing home confinement, active cancer, central vein catheterization or transvenous pacemaker, prior superficial vein thrombosis, infection, varicose veins, and neurological disease with leg paresis, and among women, use of oral contraceptives, pregnancy/postpartum period, and hormone therapy .32
●● Together, these risk factors account for >75% of all inci-dent VTE that occurs in the community .
●● Compared with residents in the community, hospitalized residents have a >130-fold higher VTE incidence (71 ver-sus 9605 per 100 000 person-years) .33
●● Hospitalization and nursing home residence together account for almost 60% of incident VTE events that occur in the community .
●● Among patients hospitalized for acute medical illness, independent risk factors for VTE include prior VTE, thrombophilia, cancer, age >60 years, leg paralysis, immo-bilization ≥7 days, and admission to an intensive care unit or coronary care unit .34
●● Among cancer patients beginning chemotherapy, tumor site, BMI, hemoglobin, platelet and white blood cell count, and plasma D-dimer and soluble P-selectin levels are pre-dictors of VTE in the next 6 months .35
●● Pregnancy-associated VTE incidence is 200 per 100 000 woman-years; compared with nonpregnant women of childbearing age, the RR is increased ≈4-fold .
●● VTE risk during the postpartum period is ≈5-fold higher than during pregnancy .
●● VTE is highly heritable and follows a complex mode of inheritance that involves environmental interaction .
●● Inherited thrombophilias (eg, inherited antithrombin, pro-tein C, or protein S deficiency; factor V Leiden; prothrom-bin G20210A; ABO blood type non-O) interact with such clinical risk factors (ie, environmental “exposures”) as oral contraceptives, pregnancy, hormone therapy, and surgery to compound VTE risk .
●● Similarly, genetic interaction compounds the risk of inci-dent and recurrent VTE .
Arteries, Diseases ofICD-9 440 to 448; ICD-10 I70 to I78. Includes PAD.
by guest on December 16, 2013http://circ.ahajournals.org/Downloaded from
Heart Disease and Stroke Statistics—2013 Update: Chapter 20 e209
Penetrating Aortic Ulcers
●● A single-center evaluation of 388 penetrating aortic ulcers found on CT angiography (2003–2009) demonstrated pen-etrating aortic ulcers in the aortic arch (6 .8%), descend-ing thoracic aorta (61 .2%), and abdominal aorta (29 .7%) . Nearly 2 of every 3 penetrating aortic ulcers (57 .7%) did not have a saccular aneurysm or intramural hematoma, whereas ≈1 in 4 (27 .8%) had associated saccular aneu-rysms, and ≈1 in 7 (14 .4%) had an associated intramural hematoma . Rupture was present in ≈1 in 25 (4 .1%) pen-etrating aortic ulcers .36
Aortic AneurysmICD-9 441; ICD-10 I71.
Mortality—10 597 . Any-mention mortality—17 215 . Hospital discharges—64 000 .
●● Although the definition varies somewhat by age and body surface area, generally an AAA is considered to be pres-ent when the anteroposterior diameter of the aorta reaches 3 .0 cm .37
●● The prevalence of AAAs that are 2 .9 to 4 .9 cm in diameter ranges from 1 .3% in men 45 to 54 years of age to 12 .5% in men 75 to 84 years of age . For women, the prevalence ranges from 0% in the youngest to 5 .2% in the oldest age groups .37
●● Between 1997 and 2009, age-adjusted mortality attribut-able to AAA declined from 40 .4 to 25 .7 per 100 000 in England and Wales and from 30 .1 to 20 .8 per 100 000 pop-ulation in Scotland .38
●● A meta-analysis of 15 475 individuals from 18 studies on small AAAs (3 .0–5 .4 cm) demonstrated that mean aneurysm growth rate was 2 .21 mm per year and was independent of age and sex . Growth rates were higher in smokers (by 0 .35 mm/y) and lower in patients with DM (by 0 .51 mm/y) .39
●● Rupture rates range from 0 .71 to 11 .03 per 1000 person-years, with higher rupture rates in smokers (pooled HR, 2 .02; 95% CI, 1 .33–3 .06) and women (pooled HR, 3 .76; 95% CI, 2 .58–5 .47) .39
●● Data from the International Registry of Acute Aortic Dis-section (IRAD) suggest that patients with acute type B aortic dissection have heterogenous in-hospital outcomes . In-hospital mortality in patients with and without compli-cations (such as mesenteric ischemia, renal failure, limb ischemia, or refractory pain) was 20 .0% and 6 .1%, respec-tively . In complicated patients, in-hospital mortality associ-ated with surgical and endovascular repair was 28 .6% and 10 .1% (P=0 .006), respectively .40
AAA Treatment
●● After multivariable adjustment, Medicare patients who underwent open AAA repair had higher risk of all-cause mortality (HR, 1 .24; 95% CI, 1 .05–1 .47) and AAA-related mortality (HR, 4 .37; 95% CI, 2 .51–7 .66) at 1 year than patients who underwent endovascular repair .41
Peripheral Artery Disease(See Charts 20-2 and 20-3 .)
ICD-9: 440.20 to 440.24, 440.30 to 440.32, 440.4, 440.9, 443.9, 445.02; ICD-10: I70.2, I70.9, I73.9, I74.3, I74.4.
Mortality—13 893 . Any-mention mortality—64 469 . Hospital discharges—146 000 .
●● PAD affects ≈8 .5 million Americans aged ≥40 years and is associated with significant morbidity and mortality .42 PAD prevalence is higher in older individuals and appears to dis-proportionately affect African Americans .42
●● The age- and sex-standardized prevalence (standard error) of PAD in the United States is 4 .6% (0 .3%) based on data from NHANES 1999–2004 . The highest prevalence of PAD was observed among elderly people, non-Hispanic blacks, and women . In a multivariable age-, sex-, and race/ethnicity-adjusted regression model, hypertension, DM, CKD, and smoking were associated with incident PAD (P≤0 .05 for each) .43
●● In the general population, only ≈10% of people with PAD have the classic symptom of intermittent claudication . Approximately 40% do not complain of leg pain, whereas the remaining 50% have a variety of leg symptoms dif-ferent from classic claudication .44,45 Data from NHANES 1999–2002 suggest that up to two thirds of US adults with PAD who are ≥40 years old are asymptomatic, with one fourth having severe PAD (ABI <0 .7) .46 In an older, dis-abled population of women, as many as two thirds of indi-viduals with PAD had no exertional leg symptoms .47
●● The risk factors for PAD are similar but not identical to those for CHD . DM and cigarette smoking are stronger risk factors for PAD than for CHD .37 ORs for associations of DM and smoking with symptomatic PAD are ≈3 .0 to 4 .0 . Most studies suggest that the prevalence of PAD is similar in men and women .48
●● Pooled data from 11 studies in 6 countries found that PAD (defined by ABI <0 .9) is a marker for systemic atheroscle-rotic disease . The pooled age-, sex-, risk factor–, and CVD-adjusted RR for all-cause death was 1 .60 (95% CI, 1 .32–1 .95), the RR for cardiovascular mortality was 1 .96 (95% CI, 1 .46–2 .64), the RR for CHD was 1 .45 (95% CI, 1 .08–1 .93), and the RR for stroke was 1 .35 (95% CI, 1 .10–1 .65) .49
●● A 2008 meta-analysis of 24 955 men and 23 339 women demonstrated that the association of the ABI with mortal-ity has a reverse J-shaped distribution in which participants with an ABI of 1 .11 to 1 .40 are at lowest risk for mortal-ity .50 Low ABI (≤0 .9) carried a 3-fold (RR, 3 .33; 95% CI, 2 .74–4 .06) risk of all-cause death compared with men with normal ABI (1 .11–1 .40) and a similar risk in women (RR, 2 .71; 95% CI, 2 .03–3 .62) .50
●● Among 508 patients (449 men) identified from 2 vascular laboratories in San Diego, CA, a decline in ABI of >0 .15 within a 10-year period was associated with a subsequent increased risk of all-cause mortality (RR, 2 .4; 95% CI, 1 .2–4 .8) and CVD mortality (RR, 2 .8; 95% CI, 1 .3–6 .0) at 3 years’ follow-up .51
●● Among 440 patients with PAD, male sex and smoking were more associated with aortoiliac (proximal) disease than with infrailiac (distal) disease . In addition, aortoiliac disease was associated with an increased risk of mortality or cardiovascular events compared with infrailiac disease (adjusted HR, 3 .28; 95% CI, 1 .87–5 .75) .52
●● People with PAD have impaired function and quality of life . This is true even for people who do not report leg symp-toms . Furthermore, patients with PAD, including those
by guest on December 16, 2013http://circ.ahajournals.org/Downloaded from

e210 Circulation January 1/8, 2013
who are asymptomatic, experience a significant decline in lower-extremity functioning over time .53–55
●● Among patients with established PAD, higher PA levels during daily life are associated with better overall survival rate, a lower risk of death because of CVD, and slower rates of functional decline .56,57 In addition, better 6-minute walk performance and faster walking speed are associated with lower rates of all-cause mortality, cardiovascular mortality, and mobility loss .58,59
●● A cross-sectional, population-based telephone survey of >2500 adults ≥50 years of age, with oversampling of blacks and Hispanics, found that 26% expressed familiarity with PAD . Of these, half were not aware that DM and smoking increase the risk of PAD . One in 4 knew that PAD is associ-ated with increased risk of MI and stroke, and only 14% were aware that PAD could lead to amputation . All knowl-edge domains were lower in individuals with lower income and education levels .60
Interventions
●● Data from the Reduction of Atherothrombosis for Contin-ued Health (REACH) Registry of 8273 PAD participants suggest that only 70% of PAD patients receive lipid-low-ering therapy and only 82% receive antiplatelet therapy for secondary CVD prevention .61
●● A 2011 systematic review evaluated lower-extremity aero-bic exercise against usual care and demonstrated a range of benefits, including the following62:
—Increased claudication time by 71 seconds (79%) to 918 seconds (422%) .
—Increased claudication distance by 15 m (5 .6%) to 232 m (200%) .
—Increased walking distance/time by 67% to 101% after 40 minutes of walking 2 to 3 times per week .
References 1 . Nkomo VT, Gardin JM, Skelton TN, Gottdiener JS, Scott CG, Enriquez-
Sarano M . Burden of valvular heart diseases: a population-based study . Lancet . 2006;368:1005–1011 .
2 . Deleted in proof . 3 . Singh JP, Evans JC, Levy D, Larson MG, Freed LA, Fuller DL, Lehman B,
Benjamin EJ . Prevalence and clinical determinants of mitral, tricuspid, and aortic regurgitation (the Framingham Heart Study) [published correction appears in Am J Cardiol . 1999;84:1143] . Am J Cardiol . 1999;83:897–902 .
4 . Roberts WC, Ko JM . Frequency by decades of unicuspid, bicuspid, and tricuspid aortic valves in adults having isolated aortic valve replacement for aortic stenosis, with or without associated aortic regurgitation . Circu-lation . 2005;111:920–925 .
5 . le Polain de Waroux JB, Pouleur AC, Goffinet C, Vancraeynest D, Van Dyck M, Robert A, Gerber BL, Pasquet A, El Khoury G, Vanoverschelde JL . Functional anatomy of aortic regurgitation: accuracy, prediction of surgical repairability, and outcome implications of transesophageal echo-cardiography . Circulation . 2007;116(suppl):I264–I269 .
6 . Owens DS, Katz R, Takasu J, Kronmal R, Budoff MJ, O’Brien KD . Inci-dence and progression of aortic valve calcium in the Multi-Ethnic Study of Atherosclerosis (MESA) . Am J Cardiol . 2010;105:701–708 .
7 . Bach DS . Prevalence and characteristics of unoperated patients with se-vere aortic stenosis . J Heart Valve Dis . 2011;20:284–291 .
8 . Teo KK, Corsi DJ, Tam JW, Dumesnil JG, Chan KL . Lipid lowering on progression of mild to moderate aortic stenosis: meta-analysis of the randomized placebo-controlled clinical trials on 2344 patients . Can J Cardiol . 2011;27:800–808 .
9 . Moat NE, Ludman P, de Belder MA, Bridgewater B, Cunningham AD, Young CP, Thomas M, Kovac J, Spyt T, MacCarthy PA, Wendler O,
Hildick-Smith D, Davies SW, Trivedi U, Blackman DJ, Levy RD, Brecker SJ, Baumbach A, Daniel T, Gray H, Mullen MJ . Long-term outcomes after transcatheter aortic valve implantation in high-risk patients with severe aortic stenosis: the U .K . TAVI (United Kingdom Transcatheter Aortic Valve Implantation) Registry . J Am Coll Cardiol . 2011;58:2130–2138 .
10 . Wendler O, Walther T, Schroefel H, Lange R, Treede H, Fusari M, Ru-bino P, Thomas M . The SOURCE Registry: what is the learning curve in trans-apical aortic valve implantation? Eur J Cardiothorac Surg . 2011;39:853–859 .
11 . Daneault B, Kirtane AJ, Kodali SK, Williams MR, Genereux P, Reiss GR, Smith CR, Moses JW, Leon MB . Stroke associated with surgical and transcatheter treatment of aortic stenosis: a comprehensive review . J Am Coll Cardiol . 2011;58:2143–2150 .
12 . de Marchena E, Badiye A, Robalino G, Junttila J, Atapattu S, Nakamura M, De Canniere D, Salerno T . Respective prevalence of the different Car-pentier classes of mitral regurgitation: a stepping stone for future thera-peutic research and development . J Card Surg . 2011;26:385–392 .
13 . Freed LA, Levy D, Levine RA, Larson MG, Evans JC, Fuller DL, Lehman B, Benjamin EJ . Prevalence and clinical outcome of mitral-valve prolapse . N Engl J Med . 1999;341:1–7 .
14 . Carapetis JR, McDonald M, Wilson NJ . Acute rheumatic fever . Lancet . 2005;366:155–168 .
15 . Seckeler MD, Hoke TR . The worldwide epidemiology of acute rheumatic fever and rheumatic heart disease . Clin Epidemiol . 2011;3:67–84 .
16 . Beaton A, Okello E, Lwabi P, Mondo C, McCarter R, Sable C . Echocar-diography screening for rheumatic heart disease in Ugandan schoolchil-dren . Circulation . 2012;125:3127–3132 .
17 . Saxena A, Ramakrishnan S, Roy A, Seth S, Krishnan A, Misra P, Kalaivani M, Bhargava B, Flather MD, Poole-Wilson PP . Prevalence and outcome of subclinical rheumatic heart disease in India: the RHEUMATIC (Rheu-matic Heart Echo Utilisation and Monitoring Actuarial Trends in Indian Children) study . Heart . 2011;97:2018–2022 .
18 . Marijon E, Ou P, Celermajer DS, Ferreira B, Mocumbi AO, Jani D, Paquet C, Jacob S, Sidi D, Jouven X . Prevalence of rheumatic heart disease detected by echocardiographic screening . N Engl J Med . 2007;357:470–476 .
19 . Centers for Disease Control and Prevention, National Center for Health Statistics . Compressed Mortality File 1999-2009 . CDC WONDER Online Database, compiled for Compressed Mortality File 1999–2009 Series 20, No . 20, 2012 . Underlying cause-of-death 1999–2009 . http://wonder .cdc .gov/mortSQl .html . Accessed July 18, 2012 .
20 . Fowler V, Scheld W, Bayer A . Endocarditis and intravascular infections . In: Mandell GL, Bennett JE, Dolin R, eds . Principles and Practices of Infectious Diseases. 6th ed . New York, NY: Elsevier; 2005:975–1021 .
21 . Wilson W, Taubert KA, Gewitz M, Lockhart PB, Baddour LM, Levison M, Bolger A, Cabell CH, Takahashi M, Baltimore RS, Newburger JW, Strom BL, Tani LY, Gerber M, Bonow RO, Pallasch T, Shulman ST, Row-ley AH, Burns JC, Ferrieri P, Gardner T, Goff D, Durack DT . Prevention of infective endocarditis: guidelines from the American Heart Associa-tion: a guideline from the American Heart Association Rheumatic Fever, Endocarditis, and Kawasaki Disease Committee, Council on Cardio-vascular Disease in the Young, and the Council on Clinical Cardiology, Council on Cardiovascular Surgery and Anesthesia, and the Quality of Care and Outcomes Research Interdisciplinary Working Group [published correction appears in Circulation . 2007;116:e376–e377] . Circulation . 2007;116:1736–1754 .
22 . Pasquali SK, He X, Mohamad Z, McCrindle BW, Newburger JW, Li JS, Shah SS . Trends in endocarditis hospitalizations at US children’s hospi-tals: impact of the 2007 American Heart Association Antibiotic Prophy-laxis Guidelines . Am Heart J . 2012;163:894–899 .
23 . Athan E, Chu VH, Tattevin P, Selton-Suty C, Jones P, Naber C, Miró JM, Ninot S, Fernández-Hidalgo N, Durante-Mangoni E, Spelman D, Hoen B, Lejko-Zupanc T, Cecchi E, Thuny F, Hannan MM, Pappas P, Henry M, Fowler VG Jr, Crowley AL, Wang A; ICE-PCS Investigators . Clinical characteristics and outcome of infective endocarditis involving implant-able cardiac devices . JAMA . 2012;307:1727–1735 .
24 . Heit JA . The epidemiology of venous thromboembolism in the commu-nity . Arterioscler Thromb Vasc Biol . 2008;28:370–372 .
25 . Zöller B, Li X, Sundquist J, Sundquist K . Shared familial aggregation of susceptibility to different manifestations of venous thromboembolism: a nationwide family study in Sweden . Br J Haematol . 2011;157:146–148 .
26 . Heit JA, Silverstein MD, Mohr DN, Petterson TM, O’Fallon WM, Melton LJ 3rd . Predictors of survival after deep vein thrombosis and
by guest on December 16, 2013http://circ.ahajournals.org/Downloaded from

Heart Disease and Stroke Statistics—2013 Update: Chapter 20 e211
pulmonary embolism: a population-based, cohort study . Arch Intern Med . 1999;159:445–453 .
27 . Heit JA, Lahr BD, Petterson TM, Bailey KR, Ashrani AA, Melton LJ 3rd . Heparin and warfarin anticoagulation intensity as predictors of recurrence after deep vein thrombosis or pulmonary embolism: a population-based cohort study . Blood . 2011;118:4992–4999 .
28 . Boutitie F, Pinede L, Schulman S, Agnelli G, Raskob G, Julian J, Hirsh J, Kearon C . Influence of preceding length of anticoagulant treatment and initial presentation of venous thromboembolism on risk of recurrence after stopping treatment: analysis of individual participants’ data from seven trials . BMJ . 2011;342:d3036 .
29 . Lijfering WM, Veeger NJ, Middeldorp S, Hamulyák K, Prins MH, Büller HR, van der Meer J . A lower risk of recurrent venous thrombosis in women compared with men is explained by sex-specific risk factors at time of first venous thrombosis in thrombophilic families . Blood . 2009;114:2031–2036 .
30 . Douketis J, Tosetto A, Marcucci M, Baglin T, Cosmi B, Cushman M, Kyrle P, Poli D, Tait RC, Iorio A . Risk of recurrence after venous thromboembolism in men and women: patient level meta-analysis . BMJ . 2011;342:d813 .
31 . den Exter PL, Hooijer J, Dekkers OM, Huisman MV . Risk of recurrent ve-nous thromboembolism and mortality in patients with cancer incidentally diagnosed with pulmonary embolism: a comparison with symptomatic patients . J Clin Oncol . 2011;29:2405–2409 .
32 . Parkin L, Sweetland S, Balkwill A, Green J, Reeves G, Beral V; Million Women Study Collaborators . Body mass index, surgery, and risk of ve-nous thromboembolism in middle-aged women: a cohort study . Circula-tion . 2012;125:1897–1904 .
33 . Heit JA, Melton LJ 3rd, Lohse CM, Petterson TM, Silverstein MD, Mohr DN, O’Fallon WM . Incidence of venous thromboembolism in hospitalized patients vs community residents . Mayo Clin Proc . 2001;76:1102–1110 .
34 . Spyropoulos AC, Anderson FA Jr, Fitzgerald G, Decousus H, Pini M, Chong BH, Zotz RB, Bergmann JF, Tapson V, Froehlich JB, Monreal M, Merli GJ, Pavanello R, Turpie AG, Nakamura M, Piovella F, Kakkar AK, Spencer FA; IMPROVE Investigators . Predictive and associative models to identify hospitalized medical patients at risk for VTE . Chest . 2011;140:706–714 .
35 . Ay C, Dunkler D, Marosi C, Chiriac AL, Vormittag R, Simanek R, Que-henberger P, Zielinski C, Pabinger I . Prediction of venous thromboembo-lism in cancer patients . Blood . 2010;116:5377–5382 .
36 . Nathan DP, Boonn W, Lai E, Wang GJ, Desai N, Woo EY, Fairman RM, Jackson BM . Presentation, complications, and natural history of penetrat-ing atherosclerotic ulcer disease . J Vasc Surg . 2012;55:10–15 .
37 . Hirsch AT, Haskal ZJ, Hertzer NR, Bakal CW, Creager MA, Halperin JL, Hiratzka LF, Murphy WR, Olin JW, Puschett JB, Rosenfield KA, Sacks D, Stanley JC, Taylor LM Jr, White CJ, White J, White RA, Antman EM, Smith SC Jr, Adams CD, Anderson JL, Faxon DP, Fuster V, Gibbons RJ, Hunt SA, Jacobs AK, Nishimura R, Ornato JP, Page RL, Riegel B . ACC/AHA 2005 practice guidelines for the management of patients with peripheral arterial disease (lower extremity, renal, mesenteric, and abdominal aortic): a collaborative report from the American Association for Vascular Surgery/Society for Vascular Surgery, Society for Cardiovascular Angiography and Interventions, Society for Vascular Medicine and Biology, Society of Interventional Radiology, and the ACC/AHA Task Force on Practice Guidelines (Writing Committee to Develop Guidelines for the Management of Patients With Peripheral Arterial Disease) . Circulation . 2006;113:e463–e654 .
38 . Anjum A, Powell JT . Is the incidence of abdominal aortic aneurysm de-clining in the 21st century? Mortality and hospital admissions for England & Wales and Scotland . Eur J Vasc Endovasc Surg . 2012;43:161–166 .
39 . Sweeting MJ, Thompson SG, Brown LC, Powell JT; RESCAN collabora-tors . Meta-analysis of individual patient data to examine factors affect-ing growth and rupture of small abdominal aortic aneurysms . Br J Surg . 2012;99:655–665 .
40 . Trimarchi S, Tolenaar JL, Tsai TT, Froehlich J, Pegorer M, Upchurch GR, Fattori R, Sundt TM 3rd, Isselbacher EM, Nienaber CA, Rampoldi V, Eagle KA . Influence of clinical presentation on the outcome of acute B aortic dissection: evidences from IRAD . J Cardiovasc Surg (Torino) . 2012;53:161–168 .
41 . Jackson RS, Chang DC, Freischlag JA . Comparison of long-term survival after open vs endovascular repair of intact abdominal aortic aneurysm among Medicare beneficiaries . JAMA . 2012;307:1621–1628 .
42 . Allison MA, Ho E, Denenberg JO, Langer RD, Newman AB, Fabsitz RR, Criqui MH . Ethnic-specific prevalence of peripheral arterial disease in the United States . Am J Prev Med . 2007;32:328–333 .
43 . Eraso LH, Fukaya E, Mohler ER 3rd, Xie D, Sha D, Berger JS . Periph-eral arterial disease, prevalence and cumulative risk factor profile analysis . Eur J Prev Cardiol . 2012 . Published online before print June 27, 2012 . doi:10 .1177/2047487312452968 . Accessed June 25, 2012 .
44 . Hirsch AT, Criqui MH, Treat-Jacobson D, Regensteiner JG, Creager MA, Olin JW, Krook SH, Hunninghake DB, Comerota AJ, Walsh ME, McDer-mott MM, Hiatt WR . Peripheral arterial disease detection, awareness, and treatment in primary care . JAMA . 2001;286:1317–1324 .
45 . McDermott MM, Greenland P, Liu K, Guralnik JM, Criqui MH, Dolan NC, Chan C, Celic L, Pearce WH, Schneider JR, Sharma L, Clark E, Gibson D, Martin GJ . Leg symptoms in peripheral arterial disease: associated clinical characteristics and functional impairment . JAMA . 2001;286:1599–1606 .
46 . Centers for Disease Control and Prevention (CDC) . Lower extremity dis-ease among persons aged > or =40 years with and without diabetes: United States, 1999–2002 . MMWR Morb Mortal Wkly Rep . 2005;54:1158–1160 .
47 . McDermott MM, Fried L, Simonsick E, Ling S, Guralnik JM . Asymp-tomatic peripheral arterial disease is independently associated with im-paired lower extremity functioning: the Women’s Health and Aging Study [published correction appears in Circulation . 2001;104:504] . Circulation . 2000;101:1007–1012 .
48 . Norgren L, Hiatt WR, Dormandy JA, Nehler MR, Harris KA, Fowkes FG; TASC II Working Group . Inter-Society Consensus for the Manage-ment of Peripheral Arterial Disease (TASC II) . J Vasc Surg . 2007;45(suppl S):S5–S67 .
49 . Heald CL, Fowkes FG, Murray GD, Price JF; Ankle Brachial Index Col-laboration . Risk of mortality and cardiovascular disease associated with the ankle-brachial index: systematic review . Atherosclerosis . 2006;189:61–69 .
50 . Fowkes FG, Murray GD, Butcher I, Heald CL, Lee RJ, Chambless LE, Folsom AR, Hirsch AT, Dramaix M, deBacker G, Wautrecht JC, Kornitzer M, Newman AB, Cushman M, Sutton-Tyrrell K, Fowkes FG, Lee AJ, Price JF, d’Agostino RB, Murabito JM, Norman PE, Jamrozik K, Curb JD, Masaki KH, Rodríguez BL, Dekker JM, Bouter LM, Heine RJ, Nijpels G, Stehouwer CD, Ferrucci L, McDermott MM, Stoffers HE, Hooi JD, Knottnerus JA, Ogren M, Hedblad B, Witteman JC, Breteler MM, Hunink MG, Hofman A, Criqui MH, Langer RD, Fronek A, Hiatt WR, Hamman R, Resnick HE, Guralnik J, McDermott MM; Ankle Brachial Index Col-laboration . Ankle brachial index combined with Framingham Risk Score to predict cardiovascular events and mortality: a meta-analysis . JAMA . 2008;300:197–208 .
51 . Criqui MH, Ninomiya JK, Wingard DL, Ji M, Fronek A . Progression of peripheral arterial disease predicts cardiovascular disease morbidity and mortality . J Am Coll Cardiol . 2008;52:1736–1742 .
52 . Aboyans V, Desormais I, Lacroix P, Salazar J, Criqui MH, Laskar M . The general prognosis of patients with peripheral arterial disease differs ac-cording to the disease localization . J Am Coll Cardiol . 2010;55:898–903 .
53 . McDermott MM, Greenland P, Liu K, Guralnik JM, Celic L, Criqui MH, Chan C, Martin GJ, Schneider J, Pearce WH, Taylor LM, Clark E . The ankle brachial index is associated with leg function and physical activity: the Walking and Leg Circulation Study [published correction appears in Ann Intern Med . 2003;139:306] . Ann Intern Med . 2002;136:873–883 .
54 . McDermott MM, Liu K, Greenland P, Guralnik JM, Criqui MH, Chan C, Pearce WH, Schneider JR, Ferrucci L, Celic L, Taylor LM, Vonesh E, Martin GJ, Clark E . Functional decline in peripheral arterial disease: associations with the ankle brachial index and leg symptoms . JAMA . 2004;292:453–461 .
55 . McDermott MM, Guralnik JM, Tian L, Liu K, Ferrucci L, Liao Y, Sharma L, Criqui MH . Associations of borderline and low normal an-kle-brachial index values with functional decline at 5-year follow-up: the WALCS (Walking and Leg Circulation Study) . J Am Coll Cardiol . 2009;53:1056–1062 .
56 . Garg PK, Tian L, Criqui MH, Liu K, Ferrucci L, Guralnik JM, Tan J, McDermott MM . Physical activity during daily life and mortality in pa-tients with peripheral arterial disease . Circulation . 2006;114:242–248 .
57 . Garg PK, Liu K, Tian L, Guralnik JM, Ferrucci L, Criqui MH, Tan J, Mc-Dermott MM . Physical activity during daily life and functional decline in peripheral arterial disease . Circulation . 2009;119:251–260 .
58 . McDermott MM, Guralnik JM, Tian L, Ferrucci L, Liu K, Liao Y, Criqui MH . Baseline functional performance predicts the rate of mobil-ity loss in persons with peripheral arterial disease . J Am Coll Cardiol . 2007;50:974–982 .
59 . McDermott MM, Tian L, Liu K, Guralnik JM, Ferrucci L, Tan J, Pearce WH, Schneider JR, Criqui MH . Prognostic value of functional perfor-mance for mortality in patients with peripheral artery disease . J Am Coll Cardiol . 2008;51:1482–1489 .
by guest on December 16, 2013http://circ.ahajournals.org/Downloaded from

e212 Circulation January 1/8, 2013
60 . Hirsch AT, Murphy TP, Lovell MB, Twillman G, Treat-Jacobson D, Harwood EM, Mohler ER 3rd, Creager MA, Hobson RW 2nd, Robertson RM, Howard WJ, Schroeder P, Criqui MH; Peripheral Arterial Disease Coalition . Gaps in public knowledge of peripheral arterial disease: the first national PAD public awareness survey . Circulation . 2007;116:2086–2094 .
61 . Bhatt DL, Steg PG, Ohman EM, Hirsch AT, Ikeda Y, Mas JL, Goto S, Liau CS, Richard AJ, Röther J, Wilson PW; REACH Registry
Investigators . International prevalence, recognition, and treatment of cardiovascular risk factors in outpatients with atherothrombosis . JAMA . 2006;295:180–189 .
62 . Parmenter BJ, Raymond J, Dinnen P, Singh MA . A systematic review of randomized controlled trials: walking versus alternative exercise pre-scription as treatment for intermittent claudication . Atherosclerosis . 2011;218:1–12 .
Table 20-1. Pooled Prevalence of Valvular Heart Disease From CARDIA, ARIC, and CHS Cohorts
Age, y
18–44 45–54 55–64 65–74 ≥75P Value for
TrendFrequency Adjusted to 2000 US
Adult Population
Participants, n 4351 696 1240 3879 1745 … 209 128 094
Male, n (%) 1959 (45) 258 (37) 415 (33) 1586 (41) 826 (47) … 100 994 367 (48)
Mitral regurgitation (n=449), n (%) 23 (0.5) 1 (0.1) 12 (1.0) 250 (6.4) 163 (9.3) <0.0001 1.7% (95% CI, 1.5%–1.9%)
Mitral stenosis (n=15), n (%) 0 (0) 1 (0.1) 3 (0.2) 7 (0.2) 4 (0.2) 0.006 0.1% (95% CI, 0.02%–0.2%)
Aortic regurgitation (n=90), n (%) 10 (0.2) 1 (0.1) 8 (0.7) 37 (1.0) 34 (2.0) <0.0001 0.5% (95% CI, 0.3%–0.6%)
Aortic stenosis (n=102), n (%) 1 (0.02) 1 (0.1) 2 (0.2) 50 (1.3) 48 (2.8) <0.0001 0.4% (95% CI, 0.3%–0.5%)
Any valve disease, n (%)
Overall (n=615) 31 (0.7) 3 (0.4) 23 (1.9) 328 (8.5) 230 (13.2) <0.0001 2.5% (95% CI, 2.2%–2.7%)
Women (n=356) 19 (0.8) 1 (0.2) 13 (1.6) 208 (9.1) 115 (12.6) <0.0001 2.4% (95% CI, 2.1%–2.8%)
Men (n=259) 12 (0.6) 2 (0.8) 10 (2.4) 120 (7.6) 115 (14.0) <0.0001 2.5% (95% CI, 2.1%–2.9%)
CARDIA indicates Coronary Artery Risk Development in Young Adults; ARIC, Atherosclerosis Risk in Communities study; CHS, Cardiovascular Health Study; and CI, confidence interval.
Source: Reprinted from Nkomo et al1 with permission of the publisher.
Table 20-2. Rheumatic Fever/Rheumatic Heart Disease
Population GroupMortality, 2009:
All Ages*Hospital Discharges,
2010: All Ages
Both sexes 3234 20 000
Males 1071 (33.1%)† 5000
Females 2163 (66.9%)† 15 000
NH white males 946 …
NH white females 1903 …
NH black males 89 …
NH black females 178 …
Asian 98 …
American Indian/ Alaska Native
20 …
NH indicates non-Hispanic; ellipses (…), data not available.*Mortality data include Hispanics.†These percentages represent the portion of total mortality that is for males
vs females.Sources: Mortality: Centers for Disease Control and Prevention/National
Center for Health Statistics, 2009 Mortality Multiple Cause–US, version July 19, 2012; data represent underlying cause of death only. Hospital discharges: National Hospital Discharge Survey, National Center for Health Statistics, and National Heart, Lung, and Blood Institute; data include those inpatients discharged alive, dead, or of unknown status.
by guest on December 16, 2013http://circ.ahajournals.org/Downloaded from
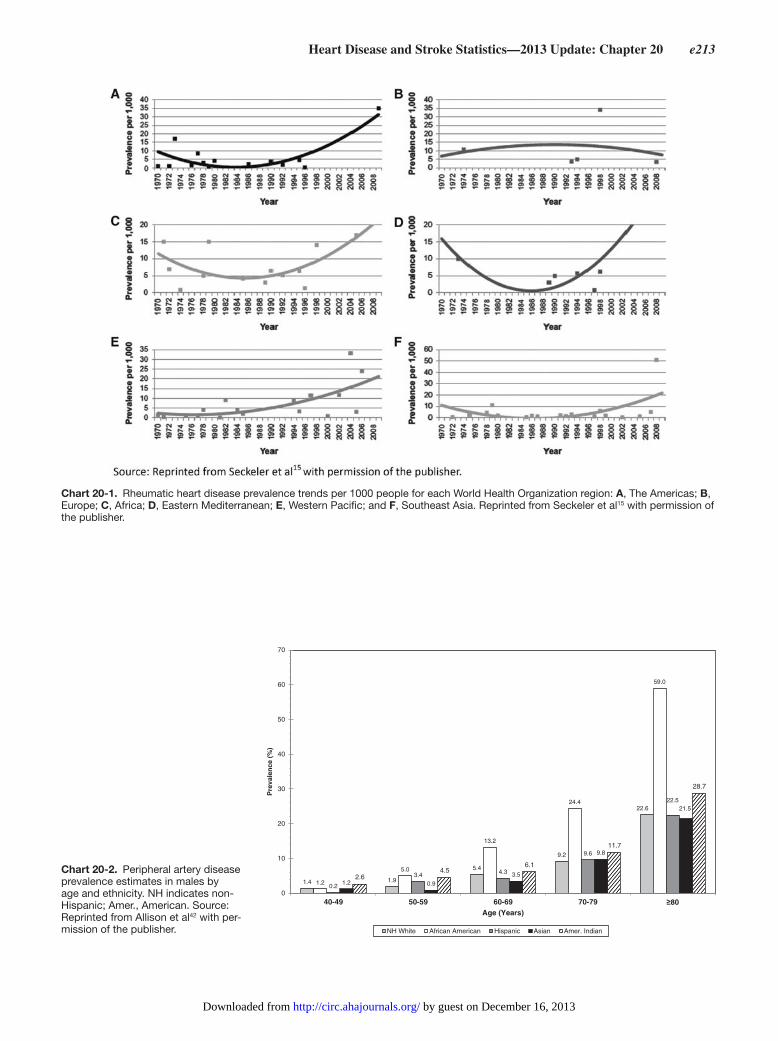
Heart Disease and Stroke Statistics—2013 Update: Chapter 20 e213
Chart 20-1. Rheumatic heart disease prevalence trends per 1000 people for each World Health Organization region: A, The Americas; B, Europe; C, Africa; D, Eastern Mediterranean; E, Western Pacific; and F, Southeast Asia. Reprinted from Seckeler et al15 with permission of the publisher.
1.4 1.9
5.4
9.2
22.6
1.2
5.0
13.2
24.4
59.0
0.2
3.4 4.3
9.6
22.5
1.2 0.9
3.5
9.8
21.5
2.6 4.5
6.1
11.7
28.7
0
10
20
30
40
50
60
70
40-49 50-59 60-69 70-79 ≥80
Pre
vale
nce
(%
)
Age (Years)
NH White African American Hispanic Asian Amer. Indian
Chart 20-2. Peripheral artery disease prevalence estimates in males by age and ethnicity. NH indicates non-Hispanic; Amer., American. Source: Reprinted from Allison et al42 with per-mission of the publisher.
by guest on December 16, 2013http://circ.ahajournals.org/Downloaded from

e214 Circulation January 1/8, 2013
1.9
4.35.1
7.9
18.2
3.0 3.4
8.9
20.0
35.1
0.3 0.4
3.1
6.9
18.2
0.0
1.40.7
7.9
18.2
3.2 3.9
8.6
14.7
33.8
0
5
10
15
20
25
30
35
40
40-49 50-59 60-69 70-79 ≥80
Pre
vale
nce
(%
)
Age (Years)
NH White African American Hispanic Asian Amer. Indian
Chart 20-3. Peripheral artery disease prevalence estimates in females by age and ethnicity. NH indicates non-Hispanic; Amer., American. Source: Reprinted from Allison et al42 with per-mission of the publisher.
by guest on December 16, 2013http://circ.ahajournals.org/Downloaded from

Heart Disease and Stroke Statistics—2013 Update: Chapter 21 e215
21. Quality of Care
See Tables 21-1 through 21-13.
The Institute of Medicine defines quality of care as “the degree to which health services for individuals and popula-tions increase the likelihood of desired health outcomes and are consistent with current professional knowledge .”1 The Institute of Medicine has defined 6 specific domains for improving health care, including care that is safe, effective, patient-centered, timely, efficient, and equitable .
In the following sections, data on quality of care will be presented based on the 6 domains of quality as defined by the Institute of Medicine . This is intended to highlight current care and to stimulate efforts to improve the quality of cardiovas-cular care nationally . Where possible, data are reported from recently published literature or standardized quality indicators
from quality-improvement registries (ie, those consistent with the methods for quality performance measures endorsed by the ACC and the AHA) .2 Additional data on aspects of qual-ity of care, such as adherence to ACC/AHA clinical practice guidelines, are also included to provide a spectrum of quality-of-care data . The data selected are meant to provide examples of the current quality of care as reflected by the Institute of Medicine domains and are not meant to be comprehensive given the sheer number of publications yearly .
●● The safety domain has been defined as avoiding injuries to patients from the care that is intended to help them . The fol-lowing are several publications that have focused on safety issues:
— In a small, single-center study conducted over a 2-month period in the cardiac care unit of a tertiary center, Rahim et al3 demonstrated that iatrogenic adverse events were
Abbreviations Used in Chapter 21
ACC American College of Cardiology HF heart failure
ACEI angiotensin-converting enzyme inhibitor HIQR Hospital Inpatient Quality Reporting
ACS acute coronary syndrome HR hazard ratio
ACTION Acute Coronary Treatment and Intervention Outcomes Network
IV intravenous
ACS acute coronary syndrome LDL low-density lipoprotein
AED automated external defibrillator LV left ventricular
AF atrial fibrillation LVEF left ventricular ejection fraction
AHA American Heart Association LVSD left ventricular systolic dysfunction
AMA-PCPI American Medical Association–Physician Consortium for Performance Improvement
MI myocardial infarction
AMI acute myocardial infarction N/A not available or not applicable
ARB angiotensin receptor blocker NCDR National Cardiovascular Data Registry
BMI body mass index NHANES National Health and Nutrition Examination Survey
BP blood pressure NM not measured
CABG coronary artery bypass grafting NSTEMI non–ST-elevation myocardial infarction
CAD coronary artery disease OR odds ratio
CHF congestive heart failure PAD peripheral artery disease
CI confidence interval PCI percutaneous coronary intervention
COURAGE Clinical Outcomes Utilizing Revascularization and AGgressive drug Evaluation trial
PINNACLE Practice Innovation and Clinical Excellence
CPR cardiopulmonary resuscitation RR relative risk
CRUSADE Can Rapid Risk Stratification of Unstable Angina Patients Suppress Adverse Outcomes With Early Implementation of the ACC/AHA Guidelines
SBP systolic blood pressure
D2B Door-to-Balloon Alliance SCD-HeFT Sudden Cardiac Death in Heart Failure Trial
DM diabetes mellitus SD standard deviation
DVT deep vein thrombosis STEMI ST-elevation myocardial infarction
TAVR transcatheter aortic valve replacement
ED emergency department tPA tissue-type plasminogen activator
EF ejection fraction UFH unfractionated heparin
EMS emergency medical services VF ventricular fibrillation
GWTG Get With The Guidelines VHA Veterans Health Administration
GWTG-HF Get With The Guidelines–Heart Failure VT ventricular tachycardia
HbA1c hemoglobin A1c
by guest on December 16, 2013http://circ.ahajournals.org/Downloaded from
e216 Circulation January 1/8, 2013
common (99 of 194 patients), of which bleeding (27%) was the most common preventable iatrogenic adverse event .
— Using the NCDR (National Cardiovascular Data Regis-try) CathPCI Registry, Tsai et al4 found that almost one fourth of dialysis patients undergoing PCI (n=22 778) received a contraindicated antithrombotic agent, spe-cifically enoxaparin, eptifibatide, or both . Patients who received a contraindicated antithrombotic agent had an increased risk of in-hospital bleeding (OR, 1 .63; 95% CI, 1 .35–1 .98) and a trend toward increased mortality (OR, 1 .15; 95% CI, 0 .97–1 .36) .4
— Using data from the ACTION Registry-GWTG, Mathews and colleagues developed a contemporary model to stratify in-hospital bleeding risk for patients after STEMI and NSTEMI .5 The 12 factors associated with major bleeding in the model were heart rate, base-line hemoglobin, female sex, baseline serum creatinine, age, electrocardiographic changes, HF or shock, DM, PAD, body weight, SBP, and home warfarin use . The risk model discriminated well in the derivation (C sta-tistic=0 .73) and validation (C statistic=0 .71) cohorts, and the risk score for major bleeding corresponded well with observed bleeding .5
— In a random sample of medical and surgical long-term care adult patients in Massachusetts hospitals, López et al6 assessed the association between disclosure of an adverse event and patients’ perception of quality of care . Overall, only 40% of adverse events were disclosed . Higher quality ratings were associated with disclosure of an adverse event . Conversely, lower patient perception of quality of care was associated with events that were preventable and with events that caused discomfort .6
— Using prospective propensity-matched cohort analysis of 7 newly introduced cardiovascular devices, Resnic et al7 showed the feasibility of automated prospective surveillance to identify low-frequency safety signals in a cardiovascular registry . In this study, 3 of the 21 safety alerts triggered sustained alerts in 2 implantable devices .7
●● Effective care has been defined as providing services based on scientific knowledge to all who could benefit and refrain-ing from providing services to those not likely to benefit . It also encompasses monitoring results of the care provided and using them to improve care for all patients .1 There are many quality-improvement registries that have been devel-oped for inpatient cardiovascular/stroke care, and the data on these are provided in subsequent tables . Similar efforts are under way for quality-of-care registries in the outpatient setting . In 2011, the AHA published a policy statement for expanding the applications of existing and future clinical registries .8 This statement discusses recommendations on ensuring high-quality data, linking clinical registries with supplemental data, integrating registries with electronic health records, safeguarding privacy, securing adequate funding, and developing a business model to initiate and sustain these registries .
— In the CRUSADE registry, 1 in 10 patients (10 .3%) had a documented contraindication to reperfusion . Pri-mary reasons for contraindications were identified as
absence of an ischemic indication (53 .8%), bleeding risk (16 .7%), patient-related reasons (25 .3%), and other (4 .2%) . Conversely, 7 .2% of patients with STEMI with-out a reperfusion contraindication did not have reperfu-sion therapy administered, and this was associated with greater in-hospital mortality .9
— According to data from NHANES 1988–1994 and 1999–2008, rates of hypertension have increased from 23 .9% in 1988–1994 to 29 .0% in 2007–2008, and hyper-tension control has increased from 27 .3% in 1988–1994 to 50 .1% in 2007–2008 . In addition, among patients with hypertension, BP has decreased from 143 .0/80 .4 to 135 .2/74 .1 mm Hg .10
— Weintraub et al11 reported results from a comparative effectiveness study of PCI versus CABG using obser-vational data among patients ≥65 years of age with 2- or 3-vessel CAD without AMI . Their results showed that at 1 year, there was no significant difference in adjusted mortality between groups (6 .24% in the CABG group versus 6 .55% in the PCI group) . At 4 years, there was lower mortality in the CABG group than in the PCI group (16 .4% versus 20 .8%; RR, 0 .79; 95% CI, 0 .76–0 .82) .11
— Appel et al12 reported results of a randomized controlled trial comparing the effectiveness of 2 behavioral weight loss interventions with controls . The interventions included either remote weight loss intervention (deliv-ered through the telephone, a study-specific Web site, and e-mail) or in-person support (individual and group sessions along with the 3 means of remote support) . At 24 months, the mean change in weight from baseline was −0 .8 kg in the control group, −4 .6 kg in the group with remote support only (P<0 .001 for comparison with the control group), and −5 .1 kg in the group receiving in-person support (P<0 .001 for comparison with the control group) . The change in weight from baseline did not differ significantly between the 2 intervention groups at the end of the trial .
— Choudhry et al13 reported results of a cluster randomized trial that evaluated the impact of eliminating out-of-pocket costs (full prescription coverage) on medication adherence and cardiovascular outcomes in patients dis-charged after MI . Compared with the usual prescrip-tion coverage, rates of adherence to statins, β-blockers, angiotensin-converting enzyme inhibitors, and angio-tensin receptor blockers were on average 4% to 6% higher in the full-coverage group . There was no signifi-cant difference in the primary outcome (first major vas-cular event or revascularization) between the 2 groups (17 .6 per 100 person years in the full-coverage group versus 18 .8 in the usual-coverage group; HR, 0 .93; 95% CI, 0 .82–1 .04) . The rates of secondary outcomes of total major vascular events or revascularization were signifi-cantly reduced in the full-coverage group (21 .5 versus 23 .3; HR, 0 .89; 95% CI, 0 .90–0 .99), as was the rate of first major vascular event (11 versus 12 .8; HR, 0 .86; 95% CI, 0 .74–0 .99) . The elimination of copayments did not increase total spending, although patient costs were reduced for drugs and other services .
— Data from the ACC PINNACLE (Practice Innovation and Clinical Excellence) outpatient registry14 of patients with CAD (n=38 775) showed that 77 .8% of the patients
by guest on December 16, 2013http://circ.ahajournals.org/Downloaded from

Heart Disease and Stroke Statistics—2013 Update: Chapter 21 e217
(30 160) were prescribed statins, 2042 (5 .3%) were treated only with nonstatin lipid-lowering medications, and 6573 (17%) were not taking any lipid-lowering medication . Lack of medical insurance (RR, 0 .94; 95% CI, 0 .89–1 .00) was associated with a lower likelihood of statin treatment, whereas male sex (RR, 1 .10; 95% CI, 1 .07–1 .13), coexisting hypertension (RR, 1 .07; 95% CI, 1 .02–1 .12), prior CABG (RR, 1 .09; 95% CI, 1 .05–1 .14), and prior PCI (RR, 1 .11; 95% CI, 1 .06–1 .16) were asso-ciated with a higher likelihood of statin treatment .
— In patients recently hospitalized with HF, a randomized clinical trial did not show improvement in the primary end point (readmission for any reason or death of any cause within 180 days after enrollment) or the second-ary end points (hospitalization for HF, number of days in the hospital, and number of hospitalizations) with the use of telemonitoring .15 Similar results were seen in a randomized clinical trial of remote telemedical manage-ment in patients with chronic HF .16
— Heisler et al17 reported results of a prospective, multisite, cluster randomized trial that evaluated the effectiveness of a pharmacist-led intervention that targeted medica-tion management and adherence counseling to improve BP control in patients with DM in 2 high-performing integrated healthcare systems . Although the mean SBP of patients in the intervention arm was 2 .4-mm Hg lower (95% CI, –3 .4 to –1 .5; P<0 .001) immediately after the intervention than that of patients in the control arm, the mean SBP decrease from 6 months before to 6 months after the intervention (primary outcome) was similar in magnitude (≈9 mm Hg) in both arms .17
— Outcome measures of 30-day mortality and 30-day read-mission after hospitalization for AMI or HF have been developed that adjust for patient mix (eg, comorbidities) so that comparisons can be made across hospitals .18–21 Using national Medicare data from July 2006 through June 2009, the median (10th, 90th percentile) hospi-tal risk-standardized mortality rate was 16% (13 .9%, 17 .8%) for AMI and 10 .8% (8 .9%, 12 .7%) for HF . The median risk-standardized readmission rate was 19 .9% (18 .5%, 21 .2%) for AMI and 24 .5% (22 .2%, 27 .1%) for HF . Distinct regional patterns were seen for both mea-sures and both conditions .18
— A study of 30 947 patients admitted with ischemic strokes showed that admission to a designated stroke center compared with admission to a nondesignated hospital was associated with more frequent use of thrombolytic therapy (4 .8% versus 1 .7%, P<0 .001), and lower 30-day all-cause mortality (10 .1% versus 12 .5%, P<0 .001) .22
— A study of 458 hospitals participating in the Society of Thoracic Surgeons National Cardiac Database showed that an intervention of receiving quality-improvement educational material designed to influence the prescrip-tion rates of 4 medication classes (aspirin, β-blockers, lipid-lowering therapy, and angiotensin-converting enzyme inhibitors) after CABG discharge in addition to site-specific feedback reports led to a significant improvement in adherence for all 4 secondary preven-tion medications at the intervention sites compared with the control sites .23
— In 2011, the ACC Foundation/AHA/American Medi-cal Association–Physician Consortium for Performance Improvement (AMA-PCPI) published a joint report on performance measures for CAD and hypertension .24 The 9 performance measures for CAD care included BP control, lipid control, symptom and activity assessment, symptom management, tobacco use (screening, cessa-tion, and intervention), antiplatelet therapy, β-blocker therapy, angiotensin-converting enzyme inhibitor/angiotensin receptor blocker therapy, and cardiac reha-bilitation patient referral from an outpatient setting . For hypertension care, the performance measures included BP control . This set was an update to the 2005 ACC Foundation/AHA performance measures for CAD and hypertension and included modifications to 7 of the 2005 performance measures . Screening for DM was retired from the CAD set published in 2005, whereas symptom management and cardiac rehabilitation refer-ral were added to the 2011 CAD set . Similarly, the ACC Foundation/AHA/AMA-PCPI published a report on performance measures for HF,25 which was an update to the 2005 report .26 Eight measures from the 2005 report were retired, β-blocker use in patients with HF was expanded as a performance measure for the inpatient setting, symptom management and counseling about implantable cardioverter-defibrillators were added as new quality metrics, and patient education was changed from a performance measure to a quality metric .
— Inpatient ACS, HF, and stroke quality-of-care measures data, including trends in care data, where available from national registries, are given in Tables 21-1 through 21-6 .
— Selected outpatient quality-of-care measures from the National Committee for Quality Assurance for 2010 appear in Table 21-7 .
— Quality-of-care measures for patients who had out-of hospital cardiac arrest and were enrolled in the Resus-citation Outcomes Consortium cardiac arrest registry in 2010 (Resuscitation Outcomes Consortium Investi-gators, unpublished data, June 20, 2012) are given in Table 21-8 .
— Quality-of-care measures for patients who had in-hospital cardiac arrest and were enrolled in the AHA’s GWTG-Resuscitation quality-improvement project in 2011 (GWTG-Resuscitation Investigators, unpublished data, June 20, 2012) are given in Table 21-9 .
●● Patient-centered care has been defined as the provision of care that is respectful of and responsive to individual patient preferences, needs, and values and that ensures that patient values guide all clinical decisions . Dimensions of patient-centered care include the following: (1) Respect for patients’ values, preferences, and expressed needs; (2) coordination and integration of care; (3) information, com-munication, and education; (4) physical comfort; (5) emo-tional support; and (6) involvement of family and friends . Studies that focused on some of these aspects of patient-centered care are highlighted below .
— The COURAGE trial,27 which investigated a strat-egy of PCI plus optimal medical therapy versus opti-mal medical therapy alone, demonstrated that both groups had significant improvement in health status
by guest on December 16, 2013http://circ.ahajournals.org/Downloaded from
e218 Circulation January 1/8, 2013
during follow-up . By 3 months, health status scores had increased in the PCI group compared with the medical therapy group, to 76±24 versus 72±23 for physical limi-tation (P=0 .004), 77±28 versus 73±27 for angina stabil-ity (P=0 .002), 85±22 versus 80±23 for angina frequency (P<0 .001), 92±12 versus 90±14 for treatment satisfac-tion (P<0 .001), and 73±22 versus 68±23 for quality of life (P<0 .001) . The PCI plus optimal medical therapy group had a small but significant incremental benefit compared with the optimal medical therapy group early on, but this benefit disappeared by 36 months .
— In the Sudden Cardiac Death in Heart Failure Trial (SCD-HeFT)28 of single-lead implantable cardio-verter-defibrillator versus amiodarone for moderately symptomatic HF, patients with implantable cardio-verter-defibrillators had improvement in quality of life compared with medical therapy patients at 3 and 12 months but not at 30 months . Implantable cardio-verter-defibrillator shocks in the month preceding a scheduled assessment were associated with a decrease in quality of life in multiple domains . The authors con-cluded that the presence of a single-lead implantable cardioverter-defibrillator was not associated with any detectably adverse quality of life during 30 months of follow-up .
— Peikes et al29 reported on 15 care-coordination programs as part of a Medicare demonstration project for patients with CHF, CAD, DM, and other conditions . Thirteen of the 15 programs did not show a difference in hospital-ization rates, and none of the programs demonstrated net savings . The interventions tested varied signifi-cantly, but the majority of the interventions included patient education to improve adherence to medication, diet, exercise, and self-care regimens and improving care coordination through various approaches . These programs overall had favorable effects on none of the adherence measures and only a few of the many quality-of-care indicators examined . The authors concluded that programs with substantial in-person contact that target moderately to severely ill patients can be cost-neutral and improve some aspects of care .
— Hernandez et al30 showed that patients with outpatient follow-up within 7 days of discharge for an HF hospi-talization were less likely to be readmitted within 30 days in the GWTG-HF registry of patients who were ≥65 years of age . The median length of stay was 4 days (interquartile range, 2–6 days), and 21 .3% of patients were readmitted within 30 days . At the hospital level, the median percentage of patients who had early follow-up after discharge from the index hospitalization was 38 .3% (interquartile range, 32 .4%–44 .5%) .
— Smolderen et al31 assessed whether health insurance sta-tus affects decisions to seek care for AMI . Uninsured and insured patients with financial concerns were more likely to delay seeking care during AMI and had prehos-pital delays of >6 hours (48 .6% of uninsured patients and 44 .6% of insured patients with financial concerns compared with 39 .3% of insured patients without finan-cial concerns) . Lack of health insurance and financial concerns about accessing care among those with health
insurance were each associated with delays in seeking emergency care for AMI .
— Using a cohort (n=192) nested within a randomized trial at a university-affiliated ambulatory practice, Murray et al32 demonstrated that refill adherence of <40% was associated with a 3-fold higher incidence of HF hospi-talization than refill adherence of ≥80% (P=0 .002) . In multivariable analysis, prescription label–reading skills were associated with a lower incidence of HF-specific emergency care (incidence rate ratio, 0 .76; 95% CI, 0 .19–0 .69), and participants with adequate health lit-eracy had a lower risk of HF hospitalization (incidence rate ratio, 0 .34; 95% CI, 0 .15–0 .76) .
— Reynolds et al33 reported results on health-related qual-ity of life after TAVR in inoperable patients with severe aortic stenosis compared with those receiving standard therapy . Health-related quality of life was assessed at baseline and at 1, 6, and 12 months with the Kansas City Cardiomyopathy Questionnaire and the 12-item Short Form-12 General Health Survey . Although the Kansas City Cardiomyopathy Questionnaire summary scores improved in both groups, the extent of improvement was greater in the TAVR group than in the standard-care group at 1 month (mean between-group difference, 13 points; 95% CI, 8–19), with larger benefits at 6 months (mean difference, 21 points; 95% CI, 15–27 points) and 12 months (mean difference, 26 points; 95% CI, 19–33) . At 12 months, TAVR patients also reported higher physical and mental health scores on the 12-item Short Form-12 General Health Survey, with a mean difference of 5 .7 and 6 .4 points, respectively (P<0 .001 for both comparisons) compared with standard care .33
— In 2012, the AHA published a scientific statement on decision making in advanced HF . This statement dis-cusses the clinical trajectory of HF, importance and pro-cess of shared decision making in advanced HF, timing of discussion, discussion on outcomes beyond survival (ie, major adverse events, symptom burden, functional limitations, loss of independence, quality of life, and obligations for caregivers), discussions regarding end-of-life issues, and assessment and integration of emotional readiness of the patient and family in these discussions .34
— In 2012, the ACC Foundation published a policy state-ment on patient-centered care in cardiovascular medi-cine . This policy statement discusses and provides recommendations on topics such as enhanced clinician-patient communication, health literacy, clinician-directed patient education, assessment of patient-centered out-comes, process of shared decision making, collaborative care planning and goal setting, and patient empowerment and self-management . The policy statement also dis-cusses newer paradigms and challenges in patient-cen-tered care, such as the impact of technology, complexity of care strategies with self-care, a systemic approach to episodic care, and barriers to patient-centered care .35
●● The timely care domain relates to reducing waits and some-times harmful delays for both those who receive and those who give care . Timeliness is an important characteristic of any service and is a legitimate and valued focus of improve-ment in health care and other industries .
by guest on December 16, 2013http://circ.ahajournals.org/Downloaded from
Heart Disease and Stroke Statistics—2013 Update: Chapter 21 e219
— Data from the CRUSADE national quality-improve-ment initiative showed that median delay from onset of symptoms to hospital presentation for patients present-ing with NSTEMI was 2 .6 hours and was significantly associated with in-hospital mortality but did not change over time from 2001 to 2006 .36
— Bradley et al37 demonstrated that participation in the Door-to-Balloon (D2B) Alliance led to a reduction in door-to-balloon time to within 90 minutes for patients with STEMI . By March 2008, >75% of patients had door-to-balloon times of ≤90 minutes compared with only approximately one fourth of patients in April 2005 .
— Using data between 2005 and 2007 from the NCDR CathPCI Registry, Wang et al38 demonstrated that among STEMI patients, only 10% of the transfer patients received PCI within 90 minutes (versus 63% for direct-arrival patients; P<0 .0001) .
— Glickman et al39 showed that a year-long implemen-tation of standardized protocols as part of a statewide regionalization program was associated with a signifi-cant improvement in median door-in–door-out times among 436 STEMI patients who presented at non-PCI hospitals who required transfer (before intervention: 97 minutes, interquartile range 56–160 minutes; after inter-vention: 58 minutes, interquartile range 35–90 minutes; P<0 .0001) .
— Data on time to reperfusion for STEMI or ischemic stroke are provided from national registries in Table 21-10 .
●● Efficiency has been defined as avoiding waste, in particular waste of equipment, supplies, ideas, and energy . In an effi-cient healthcare system, resources are used to get the best value for the money spent .
— The AHA and ACC have jointly developed a scientific statement that outlines standards for measures to be used for public reporting of efficiency in health care . The group identified 4 standards important to the devel-opment of any efficiency performance measure, includ-ing (1) integration of quality and cost, (2) valid cost measurement and analysis, (3) no or minimal incen-tive to provide poor-quality care, and (4) no or proper attribution of the measure . In the statement, 4 examples were provided of hospital-based efficiency measures, as well as information on how each of the measures fared within the 4 domains recommended . The examples were length of stay, 30-day readmission, hospitalization costs, and nonrecommended imaging tests .40
— At an urban, tertiary care, academic medical center ED, elements of departmental work flow were redesigned to streamline patient throughput before implementation of a fully integrated ED information system with patient tracking, computerized charting and order entry, and direct access to patient historical data from the hospital data repository . Increasing the clinical information avail-able at the bedside and improving departmental work flow through ED information system implementation and process redesign led to decreased patient through-put times and improved ED efficiency (eg, the length of stay for all patients [from arrival to time patient left the ED] decreased by 1 .94 hours, from 6 .69 [n=508] before
the intervention to 4 .75 [n=691] hours after the interven-tion; P<0 .001) .41
— Himmelstein et al42 analyzed whether more-computer-ized hospitals had lower costs of care or administration or better quality, to address a common belief that com-puterization improves healthcare quality, reduces costs, and increases administrative efficiency . They found that hospitals that increased computerization faster had more rapid administrative cost increases (P=0 .0001); however, higher overall computerization scores corre-lated weakly with better quality scores for AMI (r=0 .07, P=0 .003) but not for HF, pneumonia, or the 3 conditions combined . In multivariate analyses, more-computerized hospitals had slightly better quality . The authors con-cluded that hospital computing might modestly improve process measures of quality but does not reduce admin-istrative or overall costs .
— In a retrospective cohort study of cases (111 707) sub-mitted to the NCDR ICD [implantable cardioverter-defibrillator] Registry between January 1, 2006, and June 30, 2009, 25 145 (22 .5%) received non–evidence-based implantable cardioverter-defibrillator therapy . Patients who received non–evidence-based implantable cardioverter-defibrillator therapy compared with those who received evidence-based implantable cardioverter-defibrillator therapy had a significantly higher risk of in-hospital death (0 .57% versus 0 .18%, P<0 .001) and any postprocedure complication (3 .23% versus 2 .41%, P<0 .001) .43
— In a multicenter study of patients within the NCDR undergoing PCI, Chan et al44 reported results of the appropriateness of PCI for both acute and nonacute indications . Among patients undergoing PCI for acute indications (71 .1% of the cohort), 98 .5% of the proce-dures were classified as appropriate, 0 .3% as uncertain, and 1 .1% as inappropriate . Among patients undergo-ing PCI for nonacute indications (28 .9% of the cohort), 50 .4% of the procedures were classified as appropriate, 38% as uncertain, and 11 .6% as inappropriate . There was also substantial variation for inappropriate non-acute PCI across hospitals (median hospital rate 10 .8%; interquartile range 6 .0%–16 .7%) .
●● Equitable care means the provision of care that does not vary in quality because of personal characteristics such as sex, ethnicity, geographic location, and socioeconomic status . The aim of equity is to secure the benefits of qual-ity health care for all the people of the United States . With regard to equity in caregiving, all individuals rightly expect to be treated fairly by local institutions, including health-care organizations .
— Chan et al45 demonstrated that rates of survival to dis-charge were lower for black patients (25 .2%) than for white patients (37 .4%) after in-hospital cardiac arrest . Lower rates of survival to discharge for blacks reflected lower rates of both successful resuscitation (55 .8% versus 67 .4%) and postresuscitation survival (45 .2% versus 55 .5%) . Adjustment for the hospital site at which patients received care explained a substantial portion of the racial differences in successful resuscita-tion (adjusted RR, 0 .92; 95% CI, 0 .88–0 .96; P<0 .001)
by guest on December 16, 2013http://circ.ahajournals.org/Downloaded from

e220 Circulation January 1/8, 2013
and eliminated the racial differences in postresuscita-tion survival (adjusted RR, 0 .99; 95% CI, 0 .92–1 .06; P=0 .68) . The authors concluded that much of the racial difference was associated with the hospital center in which black patients received care .
— Kapoor et al46 evaluated 99 058 HF admissions from 244 sites between January 2005 and September 2009 . Patients were grouped on the basis of payer status (pri-vate/health maintenance organization, no insurance, Medicare, or Medicaid) . Compared with private/health maintenance organization group, the other 3 groups were less likely to receive evidence-based therapies (β-blockers, implantable cardioverter-defibrillators, anticoagulation for AF, angiotensin-converting enzyme inhibitors, or angiotensin receptor blockers) and had lon-ger hospital stays . Higher adjusted rates of in-hospital mortality were also seen in patients with Medicaid (OR, 1 .22; 95% CI, 1 .06–1 .41) and in patients with reduced EF and no insurance (OR, 1 .61; 95% CI, 1 .15–2 .25) .
— Cohen et al47 demonstrated that among hospitals engaged in a national quality monitoring and improve-ment program, evidence-based care for AMI appeared to improve over time for patients irrespective of race/ethnicity, and differences in care by race/ethnicity care were reduced or eliminated . They analyzed 142 593 patients with AMI (121 528 whites, 10 882 blacks, and 10 183 Hispanics) at 443 hospitals participating in the GWTG-CAD program . Overall, defect-free care was 80 .9% for whites, 79 .5% for Hispanics (adjusted OR versus whites, 1 .00; 95% CI, 0 .94–1 .06; P=0 .94), and 77 .7% for blacks (adjusted OR versus whites, 0 .93; 95% CI, 0 .87–0 .98; P=0 .01) . A significant gap in defect-free care was observed for blacks during the first half of the study but was no longer present during the remainder of the study . Overall, progressive improvements in defect-free care were observed regardless of race/ethnic groups .
— Thomas et al48 analyzed data among hospitals that vol-untarily participated in the AHA’s GWTG-HF program from January 2005 through December 2008 . Relative to white patients, Hispanic and black patients hospital-ized with HF were significantly younger (median age 78, 63, and 64 years, respectively) but had lower EFs (mean EF 41 .1%, 38 .8%, and 35 .7%, respectively) with a higher prevalence of DM (40 .2%, 55 .7%, and 43 .8%, respectively) and hypertension (70 .6%, 78 .4%, and 82 .8%, respectively) . The provision of guideline-based care was comparable for white, black, and Hispanic patients . Black (1 .7%) and Hispanic (2 .4%) patients had lower in-hospital mortality than white patients (3 .5%) . Improvement in adherence to all-or-none HF measures increased annually from year 1 to year 3 for all 3 racial/ethnic groups .48
— Al-Khatib et al49 analyzed implantable cardioverter-defibrillator use for primary prevention among 11 880 patients with a history of HF, left ventricular EF<35%, and age >65 years enrolled in the GWTG-HF registry from January 2005 through December 2009 . From 2005 to 2007, overall implantable cardioverter-defibrillator use increased from 30 .2% to 42 .4% and then remained unchanged in 2008 to 2009 . After adjustment for con-founders, implantable cardioverter-defibrillator use
increased significantly in the overall study population during 2005 to 2007 (OR, 1 .28; 95% CI, 1 .11–1 .48 per year; P=0 .0008) and in black women (OR, 1 .82; 95% CI, 1 .28–2 .58 per year; P=0 .0008), white women (OR, 1 .30; 95% CI, 1 .06–1 .59 per year; P=0 .010), black men (OR, 1 .54; 95% CI, 1 .19–1 .99 per year; P=0 .0009), and white men (OR, 1 .25; 95% CI, 1 .06–1 .48 per year; P=0 .0072) . The increase in implantable cardioverter-defibrillator use was greatest among blacks . They concluded that although previously described racial dis-parities in the use of implantable cardioverter-defibrilla-tors were no longer present in their study by the end of the study period, a sex difference in their use persisted .49
— GWTG data by race, sex, and ethnicity are provided in Tables 21-11 through 21-13 .
References 1 . Committee on Quality of Health Care in America, Institute of Medicine .
Crossing the Quality Chasm: A New Health System for the 21st Century. Washington, DC: National Academies Press; 2001 .
2 . Spertus JA, Eagle KA, Krumholz HM, Mitchell KR, Normand SL; Ameri-can College of Cardiology; American Heart Association Task Force on Performance Measures . American College of Cardiology and American Heart Association methodology for the selection and creation of perfor-mance measures for quantifying the quality of cardiovascular care . Circu-lation . 2005;111:1703–1712 .
3 . Rahim SA, Mody A, Pickering J, Devereaux PJ, Yusuf S . Iatrogenic adverse events in the coronary care unit . Circ Cardiovasc Qual Outcomes . 2009;2:437–442 .
4 . Tsai TT, Maddox TM, Roe MT, Dai D, Alexander KP, Ho PM, Messenger JC, Nallamothu BK, Peterson ED, Rumsfeld JS; National Cardiovascular Data Registry . Contraindicated medication use in dialysis patients under-going percutaneous coronary intervention . JAMA . 2009;302:2458–2464 .
5 . Mathews R, Peterson ED, Chen AY, Wang TY, Chin CT, Fonarow GC, Cannon CP, Rumsfeld JS, Roe MT, Alexander KP . In-hospital major bleeding during ST-elevation and non-ST-elevation myocardial infarction care: derivation and validation of a model from the ACTION Registry-GWTG . Am J Cardiol . 2011;107:1136–1143 .
6 . López L, Weissman JS, Schneider EC, Weingart SN, Cohen AP, Epstein AM . Disclosure of hospital adverse events and its association with patients’ ratings of the quality of care . Arch Intern Med . 2009;169:1888–1894 .
7 . Resnic FS, Gross TP, Marinac-Dabic D, Loyo-Berrios N, Donnelly S, Normand SL, Matheny ME . Automated surveillance to detect post-procedure safety signals of approved cardiovascular devices . JAMA . 2010;304:2019–2027 .
8 . Bufalino VJ, Masoudi FA, Stranne SK, Horton K, Albert NM, Beam C, Bonow RO, Davenport RL, Girgus M, Fonarow GC, Krumholz HM, Leg-nini MW, Lewis WR, Nichol G, Peterson ED, Rumsfeld JS, Schwamm LH, Shahian DM, Spertus JA, Woodard PK, Yancy CW; American Heart Association Advocacy Coordinating Committee . The American Heart As-sociation’s recommendations for expanding the applications of existing and future clinical registries: a policy statement from the American Heart Association . Circulation . 2011;123:2167–2179 .
9 . Gharacholou SM, Alexander KP, Chen AY, Wang TY, Melloni C, Gibler WB, Pollack CV Jr, Ohman EM, Peterson ED, Roe MT . Implications and reasons for the lack of use of reperfusion therapy in patients with ST-segment elevation myocardial infarction: findings from the CRUSADE initiative . Am Heart J . 2010;159:757–763 .
10 . Egan BM, Zhao Y, Axon RN . US trends in prevalence, awareness, treatment, and control of hypertension, 1988-2008 . JAMA . 2010;303:2043–2050 .
11 . Weintraub WS, Grau-Sepulveda MV, Weiss JM, O’Brien SM, Peterson ED, Kolm P, Zhang Z, Klein LW, Shaw RE, McKay C, Ritzenthaler LL, Popma JJ, Messenger JC, Shahian DM, Grover FL, Mayer JE, Shewan CM, Garratt KN, Moussa ID, Dangas GD, Edwards FH . Comparative effective-ness of revascularization strategies . N Engl J Med . 2012;366:1467–1476 .
12 . Appel LJ, Clark JM, Yeh HC, Wang NY, Coughlin JW, Daumit G, Miller ER 3rd, Dalcin A, Jerome GJ, Geller S, Noronha G, Pozefsky T, Charles-ton J, Reynolds JB, Durkin N, Rubin RR, Louis TA, Brancati FL . Com-parative effectiveness of weight-loss interventions in clinical practice . N Engl J Med . 2011;365:1959–1968 .
by guest on December 16, 2013http://circ.ahajournals.org/Downloaded from
Heart Disease and Stroke Statistics—2013 Update: Chapter 21 e221
13 . Choudhry NK, Avorn J, Glynn RJ, Antman EM, Schneeweiss S, Tosca-no M, Reisman L, Fernandes J, Spettell C, Lee JL, Levin R, Brennan T, Shrank WH; Post-Myocardial Infarction Free Rx Event and Economic Evaluation (MI FREEE) Trial . Full coverage for preventive medications after myocardial infarction . N Engl J Med . 2011;365:2088–2097 .
14 . Arnold SV, Spertus JA, Tang F, Krumholz HM, Borden WB, Farmer SA, Ting HH, Chan PS . Statin use in outpatients with obstructive coronary artery disease . Circulation . 2011;124:2405–2410 .
15 . Chaudhry SI, Mattera JA, Curtis JP, Spertus JA, Herrin J, Lin Z, Phil-lips CO, Hodshon BV, Cooper LS, Krumholz HM . Telemonitoring in pa-tients with heart failure [published correction appears in N Engl J Med . 2011;364:490] . N Engl J Med . 2010;363:2301–2309 .
16 . Koehler F, Winkler S, Schieber M, Sechtem U, Stangl K, Böhm M, Boll H, Baumann G, Honold M, Koehler K, Gelbrich G, Kirwan BA, Anker SD; Telemedical Interventional Monitoring in Heart Failure In-vestigators . Impact of remote telemedical management on mortality and hospitalizations in ambulatory patients with chronic heart failure: the Telemedical Interventional Monitoring in Heart Failure study . Circulation . 2011;123:1873–1880 .
17 . Heisler M, Hofer TP, Schmittdiel JA, Selby JV, Klamerus ML, Bosworth HB, Bermann M, Kerr EA . Improving blood pressure control through a clinical pharmacist outreach program in patients with diabetes mellitus in 2 high-performing health systems: the Adherence and Intensification of Medications cluster randomized, controlled pragmatic trial . Circulation . 2012;125:2863–2872 .
18 . Bernheim SM, Grady JN, Lin Z, Wang Y, Wang Y, Savage SV, Bhat KR, Ross JS, Desai MM, Merrill AR, Han LF, Rapp MT, Drye EE, Normand SL, Krumholz HM . National patterns of risk-standardized mortality and readmission for acute myocardial infarction and heart failure: update on publicly reported outcomes measures based on the 2010 release . Circ Car-diovasc Qual Outcomes . 2010;3:459–467 .
19 . Krumholz HM, Normand SL, Spertus JA, Shahian DM, Bradley EH . Mea-suring performance for treating heart attacks and heart failure: the case for outcomes measurement . Health Aff (Millwood) . 2007;26:75–85 .
20 . US Department of Health & Human Services . Hospital Compare . www .hospitalcompare .hhs .gov . Accessed June 6, 2011 .
21 . Johnson MA, Normand SL, Krumholz HM . Cardiology patient pages: how are our hospitals measuring up? “Hospital Compare”: a resource for hospital quality of care . Circulation . 2008;118:e498–e500 .
22 . Xian Y, Holloway RG, Chan PS, Noyes K, Shah MN, Ting HH, Chappel AR, Peterson ED, Friedman B . Association between stroke center hospital-ization for acute ischemic stroke and mortality . JAMA . 2011;305:373–380 .
23 . Williams JB, Delong ER, Peterson ED, Dokholyan RS, Ou FS, Ferguson TB Jr; Society of Thoracic Surgeons and the National Cardiac Database . Secondary prevention after coronary artery bypass graft surgery: findings of a national randomized controlled trial and sustained society-led incor-poration into practice . Circulation . 2011;123:39–45 .
24 . Drozda J Jr, Messer JV, Spertus J, Abramowitz B, Alexander K, Beam CT, Bonow RO, Burkiewicz JS, Crouch M, Goff DC Jr, Hellman R, James T 3rd, King ML, Machado EA Jr, Ortiz E, O’Toole M, Persell SD, Pines JM, Rybicki FJ, Sadwin LB, Sikkema JD, Smith PK, Torcson PJ, Wong JB . ACCF/AHA/AMA-PCPI 2011 performance measures for adults with coronary artery disease and hypertension: a report of the American Col-lege of Cardiology Foundation/American Heart Association Task Force on Performance Measures and the American Medical Association–Physician Consortium for Performance Improvement [published correction appears in Circulation . 2011;124:e39] . Circulation . 2011;124:248–270 .
25 . Bonow RO, Ganiats TG, Beam CT, Blake K, Casey DE Jr, Goodlin SJ, Grady KL, Hundley RF, Jessup M, Lynn TE, Masoudi FA, Nilasena D, Piña IL, Rockswold PD, Sadwin LB, Sikkema JD, Sincak CA, Spertus J, Torcson PJ, Torres E, Williams MV, Wong JB . ACCF/AHA/AMA-PCPI 2011 performance measures for adults with heart failure: a report of the American College of Cardiology Foundation/American Heart Association Task Force on Performance Measures and the American Medical Associ-ation–Physician Consortium for Performance Improvement . Circulation . 2012;125:2382–2401 .
26 . Bonow RO, Bennett S, Casey DE Jr, Ganiats TG, Hlatky MA, Konstam MA, Lambrew CT, Normand SL, Pina IL, Radford MJ, Smith AL, Ste-venson LW, Burke G, Eagle KA, Krumholz HM, Linderbaum J, Masoudi FA, Ritchie JL, Rumsfeld JS, Spertus JA . ACC/AHA clinical performance measures for adults with chronic heart failure: a report of the American College of Cardiology/American Heart Association Task Force on Perfor-mance Measures (Writing Committee to Develop Heart Failure Clinical Performance Measures) . Circulation . 2005;112:1853–1887 .
27 . Weintraub WS, Spertus JA, Kolm P, Maron DJ, Zhang Z, Jurkovitz C, Zhang W, Hartigan PM, Lewis C, Veledar E, Bowen J, Dunbar SB, Deaton
C, Kaufman S, O’Rourke RA, Goeree R, Barnett PG, Teo KK, Boden WE; COURAGE Trial Research Group . Effect of PCI on quality of life in patients with stable coronary disease . N Engl J Med . 2008;359:677–687 .
28 . Mark DB, Anstrom KJ, Sun JL, Clapp-Channing NE, Tsiatis AA, David-son-Ray L, Lee KL, Bardy GH; Sudden Cardiac Death in Heart Failure Trial Investigators . Quality of life with defibrillator therapy or amiodarone in heart failure . N Engl J Med . 2008;359:999–1008 .
29 . Peikes D, Chen A, Schore J, Brown R . Effects of care coordination on hos-pitalization, quality of care, and health care expenditures among Medicare beneficiaries: 15 randomized trials . JAMA . 2009;301:603–618 .
30 . Hernandez AF, Greiner MA, Fonarow GC, Hammill BG, Heidenreich PA, Yancy CW, Peterson ED, Curtis LH . Relationship between early physician follow-up and 30-day readmission among Medicare beneficiaries hospital-ized for heart failure . JAMA . 2010;303:1716–1722 .
31 . Smolderen KG, Spertus JA, Nallamothu BK, Krumholz HM, Tang F, Ross JS, Ting HH, Alexander KP, Rathore SS, Chan PS . Health care insurance, financial concerns in accessing care, and delays to hospital presentation in acute myocardial infarction . JAMA . 2010;303:1392–1400 .
32 . Murray MD, Tu W, Wu J, Morrow D, Smith F, Brater DC . Factors associ-ated with exacerbation of heart failure include treatment adherence and health literacy skills . Clin Pharmacol Ther . 2009;85:651–658 .
33 . Reynolds MR, Magnuson EA, Lei Y, Leon MB, Smith CR, Svensson LG, Webb JG, Babaliaros VC, Bowers BS, Fearon WF, Herrmann HC, Kapa-dia S, Kodali SK, Makkar RR, Pichard AD, Cohen DJ; Placement of Aor-tic Transcatheter Valves (PARTNER) Investigators . Health-related quality of life after transcatheter aortic valve replacement in inoperable patients with severe aortic stenosis . Circulation . 2011;124:1964–1972 .
34 . Allen LA, Stevenson LW, Grady KL, Goldstein NE, Matlock DD, Arnold RM, Cook NR, Felker GM, Francis GS, Hauptman PJ, Havranek EP, Krumholz HM, Mancini D, Riegel B, Spertus JA; on behalf of American Heart Association; Council on Quality of Care and Outcomes Research; Council on Cardiovascular Nursing; Council on Clinical Cardiology; Council on Cardiovascular Radiology and Intervention; Council on Car-diovascular Surgery and Anesthesia . Decision making in advanced heart failure: a scientific statement from the American Heart Association . Circu-lation . 2012;125:1928–1952 .
35 . Walsh MN, Bove AA, Cross RR, Ferdinand KC, Forman DE, Freeman AM, Hughes S, Klodas E, Koplan M, Lewis WR, MacDonnell B, May DC, Messer JV, Pressler SJ, Sanz ML, Spertus JA, Spinler SA, Teichholz LE, Wong JB, Byrd KD; American College of Cardiology Foundation . ACCF 2012 health policy statement on patient-centered care in cardiovas-cular medicine: a report of the American College of Cardiology Founda-tion Clinical Quality Committee . J Am Coll Cardiol . 2012;59:2125–2143 .
36 . Ting HH, Chen AY, Roe MT, Chan PS, Spertus JA, Nallamothu BK, Sullivan MD, DeLong ER, Bradley EH, Krumholz HM, Peterson ED . Delay from symptom onset to hospital presentation for patients with non-ST-segment elevation myocardial infarction . Arch Intern Med . 2010;170:1834–1841 .
37 . Bradley EH, Nallamothu BK, Herrin J, Ting HH, Stern AF, Nembhard IM, Yuan CT, Green JC, Kline-Rogers E, Wang Y, Curtis JP, Webster TR, Masoudi FA, Fonarow GC, Brush JE Jr, Krumholz HM . National efforts to improve door-to-balloon time: results from the Door-to-Balloon Alliance . J Am Coll Cardiol . 2009;54:2423–2429 .
38 . Wang TY, Peterson ED, Ou FS, Nallamothu BK, Rumsfeld JS, Roe MT . Door-to-balloon times for patients with ST-segment elevation myocardial infarction requiring interhospital transfer for primary percutaneous coro-nary intervention: a report from the National Cardiovascular Data Regis-try . Am Heart J . 2011;161:76–83 .e1 .
39 . Glickman SW, Lytle BL, Ou FS, Mears G, O’Brien S, Cairns CB, Garvey JL, Bohle DJ, Peterson ED, Jollis JG, Granger CB . Care pro-cesses associated with quicker door-in–door-out times for patients with ST-elevation–myocardial infarction requiring transfer: results from a statewide regionalization program . Circ Cardiovasc Qual Outcomes . 2011;4:382–388 .
40 . Krumholz HM, Keenan PS, Brush JE Jr, Bufalino VJ, Chernew ME, Ep-stein AJ, Heidenreich PA, Ho V, Masoudi FA, Matchar DB, Normand SL, Rumsfeld JS, Schuur JD, Smith SC Jr, Spertus JA, Walsh MN . Standards for measures used for public reporting of efficiency in health care: a sci-entific statement from the American Heart Association Interdisciplinary Council on Quality of Care and Outcomes Research and the American College of Cardiology Foundation . Circulation . 2008;118:1885–1893 .
41 . Baumlin KM, Shapiro JS, Weiner C, Gottlieb B, Chawla N, Richardson LD . Clinical information system and process redesign improves emergen-cy department efficiency . Jt Comm J Qual Patient Saf . 2010;36:179–185 .
42 . Himmelstein DU, Wright A, Woolhandler S . Hospital computing and the costs and quality of care: a national study . Am J Med . 2010;123:40–46 .
by guest on December 16, 2013http://circ.ahajournals.org/Downloaded from
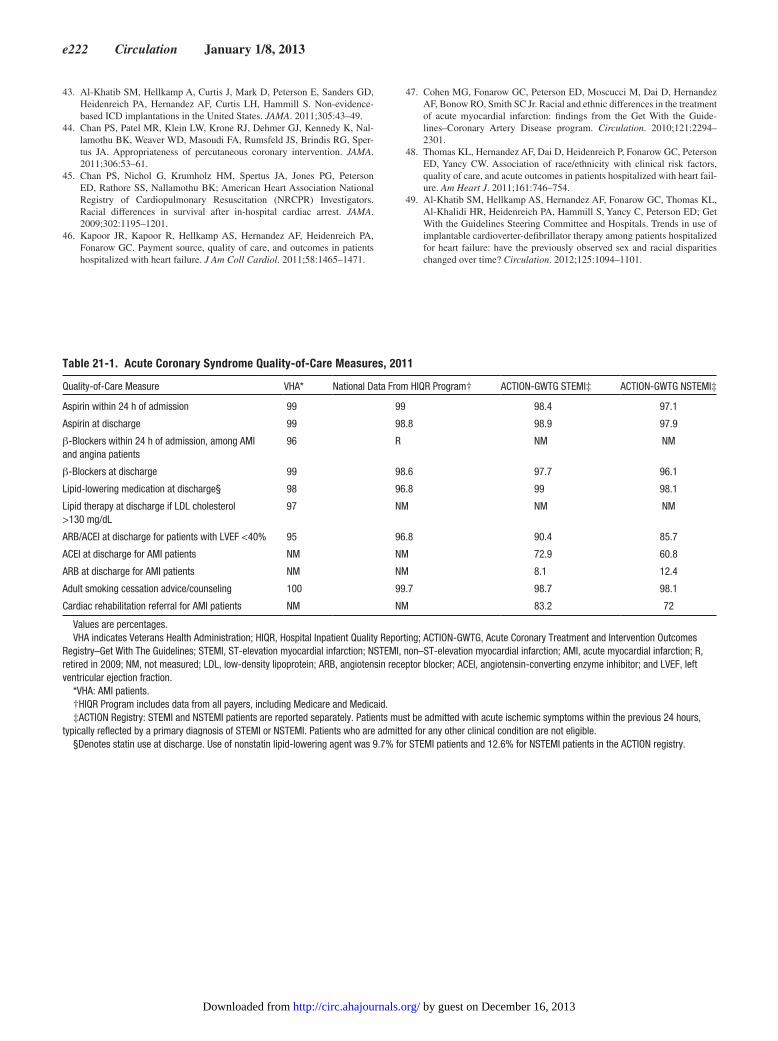
e222 Circulation January 1/8, 2013
43 . Al-Khatib SM, Hellkamp A, Curtis J, Mark D, Peterson E, Sanders GD, Heidenreich PA, Hernandez AF, Curtis LH, Hammill S . Non-evidence-based ICD implantations in the United States . JAMA . 2011;305:43–49 .
44 . Chan PS, Patel MR, Klein LW, Krone RJ, Dehmer GJ, Kennedy K, Nal-lamothu BK, Weaver WD, Masoudi FA, Rumsfeld JS, Brindis RG, Sper-tus JA . Appropriateness of percutaneous coronary intervention . JAMA . 2011;306:53–61 .
45 . Chan PS, Nichol G, Krumholz HM, Spertus JA, Jones PG, Peterson ED, Rathore SS, Nallamothu BK; American Heart Association National Registry of Cardiopulmonary Resuscitation (NRCPR) Investigators . Racial differences in survival after in-hospital cardiac arrest . JAMA . 2009;302:1195–1201 .
46 . Kapoor JR, Kapoor R, Hellkamp AS, Hernandez AF, Heidenreich PA, Fonarow GC . Payment source, quality of care, and outcomes in patients hospitalized with heart failure . J Am Coll Cardiol . 2011;58:1465–1471 .
47 . Cohen MG, Fonarow GC, Peterson ED, Moscucci M, Dai D, Hernandez AF, Bonow RO, Smith SC Jr . Racial and ethnic differences in the treatment of acute myocardial infarction: findings from the Get With the Guide-lines–Coronary Artery Disease program . Circulation . 2010;121:2294– 2301 .
48 . Thomas KL, Hernandez AF, Dai D, Heidenreich P, Fonarow GC, Peterson ED, Yancy CW . Association of race/ethnicity with clinical risk factors, quality of care, and acute outcomes in patients hospitalized with heart fail-ure . Am Heart J . 2011;161:746–754 .
49 . Al-Khatib SM, Hellkamp AS, Hernandez AF, Fonarow GC, Thomas KL, Al-Khalidi HR, Heidenreich PA, Hammill S, Yancy C, Peterson ED; Get With the Guidelines Steering Committee and Hospitals . Trends in use of implantable cardioverter-defibrillator therapy among patients hospitalized for heart failure: have the previously observed sex and racial disparities changed over time? Circulation . 2012;125:1094–1101 .
Table 21-1. Acute Coronary Syndrome Quality-of-Care Measures, 2011
Quality-of-Care Measure VHA* National Data From HIQR Program† ACTION-GWTG STEMI‡ ACTION-GWTG NSTEMI‡
Aspirin within 24 h of admission 99 99 98.4 97.1
Aspirin at discharge 99 98.8 98.9 97.9
β-Blockers within 24 h of admission, among AMI and angina patients
96 R NM NM
β-Blockers at discharge 99 98.6 97.7 96.1
Lipid-lowering medication at discharge§ 98 96.8 99 98.1
Lipid therapy at discharge if LDL cholesterol >130 mg/dL
97 NM NM NM
ARB/ACEI at discharge for patients with LVEF <40% 95 96.8 90.4 85.7
ACEI at discharge for AMI patients NM NM 72.9 60.8
ARB at discharge for AMI patients NM NM 8.1 12.4
Adult smoking cessation advice/counseling 100 99.7 98.7 98.1
Cardiac rehabilitation referral for AMI patients NM NM 83.2 72
Values are percentages.VHA indicates Veterans Health Administration; HIQR, Hospital Inpatient Quality Reporting; ACTION-GWTG, Acute Coronary Treatment and Intervention Outcomes
Registry–Get With The Guidelines; STEMI, ST-elevation myocardial infarction; NSTEMI, non–ST-elevation myocardial infarction; AMI, acute myocardial infarction; R, retired in 2009; NM, not measured; LDL, low-density lipoprotein; ARB, angiotensin receptor blocker; ACEI, angiotensin-converting enzyme inhibitor; and LVEF, left ventricular ejection fraction.
*VHA: AMI patients.†HIQR Program includes data from all payers, including Medicare and Medicaid.‡ACTION Registry: STEMI and NSTEMI patients are reported separately. Patients must be admitted with acute ischemic symptoms within the previous 24 hours,
typically reflected by a primary diagnosis of STEMI or NSTEMI. Patients who are admitted for any other clinical condition are not eligible.§Denotes statin use at discharge. Use of nonstatin lipid-lowering agent was 9.7% for STEMI patients and 12.6% for NSTEMI patients in the ACTION registry.
by guest on December 16, 2013http://circ.ahajournals.org/Downloaded from

Heart Disease and Stroke Statistics—2013 Update: Chapter 21 e223
Table 21-2. HF Quality-of-Care Measures, 2011
Quality-of-Care MeasureNational Data From
HIQR Program*AHA GWTG-
HF VHA
LVEF assessment 98.3 99.2 100
ARB/ACEI at discharge for patients with LVSD
95.3 95.4 96
Complete discharge instructions 91 93.5 97
Adult smoking cessation advice/counseling
98.9 99.2 99
β-Blockers at discharge for patients with LVSD, no contraindications
NM 96.2 NM
Anticoagulation for atrial fibrillation or atrial flutter, no contraindications
NM 75.4 95
Values are percentages.In the GWTG registry, mechanical ventilation was required in 1.1% of
patients. In-hospital mortality rate was 3.4%, and mean length of hospital stay was 5.7 days (median 4.0 days).
HF indicates heart failure; HIQR, Hospital Inpatient Quality Reporting; AHA GWTG-HF, American Heart Association’s Get With The Guidelines–Heart Failure; VHA, Veterans Health Administration; LVEF, left ventricular ejection fraction; ARB/ACEI, angiotensin receptor blocker/angiotensin-converting enzyme inhibitor; LVSD, left ventricular systolic dysfunction; and NM, not measured.
*HIQR Program includes data from all payers, including Medicare and Medicaid.
Table 21-3. Time Trends in GWTG-ACS Quality-of-Care Measures, 2006–2011
Quality-of-Care Measure 2006 2007 2008 2009 2010* 2011*
Aspirin within 24 h of admission 94.7 92.8 91.2 90.9 97 97.6
Aspirin at discharge 94.4 95.8 94.9 95.5 98 98.3
β-Blockers at discharge 92.8 94.6 94.5 94.9 96 96.7
Lipid-lowering medication at discharge 84.5 85.6 81.6 86.8 92† 98.4†
Lipid therapy at discharge if LDL cholesterol >100 mg/dL 89.1 90.7 91.9 92.5 NM NM
ARB/ACEI at discharge for patients with LVEF <40% 87.3 91.1 91.9 91.9 86 87.8
Adult smoking cessation advice/counseling 94.3 97.4 98.4 98.4 98 98.4
Cardiac rehabilitation referral for AMI patients 71.1 63.6 52.0 49.1 75 76.5
Values are percentages.In the ACTION registry (Acute Coronary Treatment and Intervention Outcomes Registry), the unadjusted in-hospital mortality rate for 2011 was 4.6% (95%
confidence interval, 4.4%–4.7%); excludes transfer-out patients). The American Heart Association’s (AHA’s) GWTG-CAD has now merged into the ACTION registry.GWTG-ACS indicates Get With The Guidelines–Acute Coronary Syndrome; LDL, low-density lipoprotein; NM, not measured; ARB/ACEI, angiotensin receptor blocker/
angiotensin-converting enzyme inhibitor; LVEF, left ventricular ejection fraction; and AMI, acute myocardial infarction.*Measures from 2006–2009 are from the AHA’s GWTG-CAD (Coronary Artery Disease) registry. 2010/2011 measures are from the AHA’s ACTION registry (Acute
Coronary Treatment and Intervention Outcomes Registry.†Represents statin use.
by guest on December 16, 2013http://circ.ahajournals.org/Downloaded from
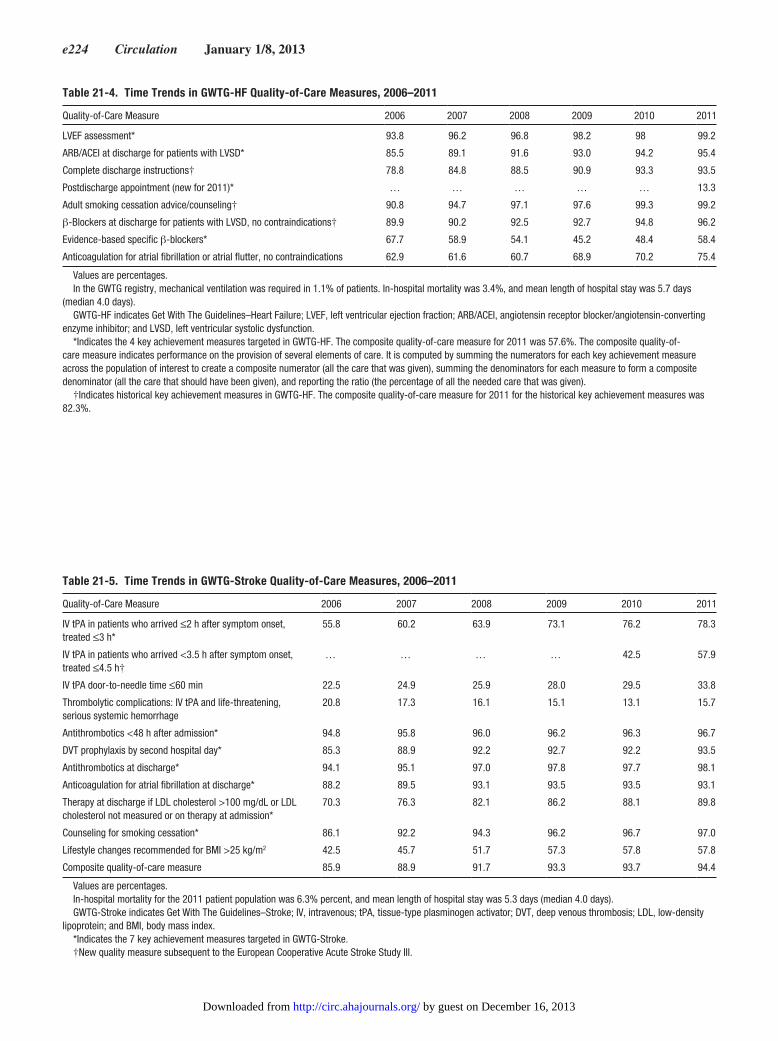
e224 Circulation January 1/8, 2013
Table 21-4. Time Trends in GWTG-HF Quality-of-Care Measures, 2006–2011
Quality-of-Care Measure 2006 2007 2008 2009 2010 2011
LVEF assessment* 93.8 96.2 96.8 98.2 98 99.2
ARB/ACEI at discharge for patients with LVSD* 85.5 89.1 91.6 93.0 94.2 95.4
Complete discharge instructions† 78.8 84.8 88.5 90.9 93.3 93.5
Postdischarge appointment (new for 2011)* … … … … … 13.3
Adult smoking cessation advice/counseling† 90.8 94.7 97.1 97.6 99.3 99.2
β-Blockers at discharge for patients with LVSD, no contraindications† 89.9 90.2 92.5 92.7 94.8 96.2
Evidence-based specific β-blockers* 67.7 58.9 54.1 45.2 48.4 58.4
Anticoagulation for atrial fibrillation or atrial flutter, no contraindications 62.9 61.6 60.7 68.9 70.2 75.4
Values are percentages.In the GWTG registry, mechanical ventilation was required in 1.1% of patients. In-hospital mortality was 3.4%, and mean length of hospital stay was 5.7 days
(median 4.0 days).GWTG-HF indicates Get With The Guidelines–Heart Failure; LVEF, left ventricular ejection fraction; ARB/ACEI, angiotensin receptor blocker/angiotensin-converting
enzyme inhibitor; and LVSD, left ventricular systolic dysfunction.*Indicates the 4 key achievement measures targeted in GWTG-HF. The composite quality-of-care measure for 2011 was 57.6%. The composite quality-of-
care measure indicates performance on the provision of several elements of care. It is computed by summing the numerators for each key achievement measure across the population of interest to create a composite numerator (all the care that was given), summing the denominators for each measure to form a composite denominator (all the care that should have been given), and reporting the ratio (the percentage of all the needed care that was given).
†Indicates historical key achievement measures in GWTG-HF. The composite quality-of-care measure for 2011 for the historical key achievement measures was 82.3%.
Table 21-5. Time Trends in GWTG-Stroke Quality-of-Care Measures, 2006–2011
Quality-of-Care Measure 2006 2007 2008 2009 2010 2011
IV tPA in patients who arrived ≤2 h after symptom onset, treated ≤3 h*
55.8 60.2 63.9 73.1 76.2 78.3
IV tPA in patients who arrived <3.5 h after symptom onset, treated ≤4.5 h†
… … … … 42.5 57.9
IV tPA door-to-needle time ≤60 min 22.5 24.9 25.9 28.0 29.5 33.8
Thrombolytic complications: IV tPA and life-threatening, serious systemic hemorrhage
20.8 17.3 16.1 15.1 13.1 15.7
Antithrombotics <48 h after admission* 94.8 95.8 96.0 96.2 96.3 96.7
DVT prophylaxis by second hospital day* 85.3 88.9 92.2 92.7 92.2 93.5
Antithrombotics at discharge* 94.1 95.1 97.0 97.8 97.7 98.1
Anticoagulation for atrial fibrillation at discharge* 88.2 89.5 93.1 93.5 93.5 93.1
Therapy at discharge if LDL cholesterol >100 mg/dL or LDL cholesterol not measured or on therapy at admission*
70.3 76.3 82.1 86.2 88.1 89.8
Counseling for smoking cessation* 86.1 92.2 94.3 96.2 96.7 97.0
Lifestyle changes recommended for BMI >25 kg/m2 42.5 45.7 51.7 57.3 57.8 57.8
Composite quality-of-care measure 85.9 88.9 91.7 93.3 93.7 94.4
Values are percentages.In-hospital mortality for the 2011 patient population was 6.3% percent, and mean length of hospital stay was 5.3 days (median 4.0 days).GWTG-Stroke indicates Get With The Guidelines–Stroke; IV, intravenous; tPA, tissue-type plasminogen activator; DVT, deep venous thrombosis; LDL, low-density
lipoprotein; and BMI, body mass index.*Indicates the 7 key achievement measures targeted in GWTG-Stroke.†New quality measure subsequent to the European Cooperative Acute Stroke Study III.
by guest on December 16, 2013http://circ.ahajournals.org/Downloaded from

Heart Disease and Stroke Statistics—2013 Update: Chapter 21 e225
Table 21-7. National Committee for Quality Assurance Health Plan Employer Data and Information Set Measures of Care, 2010
Commercial, %
Medicare, %
Medicaid, %
AMI
β-Blocker persistence* 75.5 83.1 76.3
Cholesterol management for patients with cardiovascular disease
Cholesterol screening 88.9 88.5 82.0
LDL cholesterol control (<100 mg/dL)
59.9 56.7 42.8
Hypertension
BP <140/90 mm Hg 63.4 61.9 55.6
DM
HbA1c testing 89.9 90.4 82.0
HbA1c >9.0% 27.3 25.9 44.0
Eye examination performed 57.7 64.6 53.1
LDL cholesterol screening 85.6 87.8 74.7
LDL cholesterol <100 mg/dL 47.7 52.1 34.6
Monitoring nephropathy 83.6 89.2 77.7
BP <140/90 mm Hg 65.7 62.3 60.4
Advising smokers and tobacco users to quit
76.7 77.9 73.6
BMI percentile assessment in children and adolescents
35.2 N/A 37.3
Nutrition counseling (children and adolescents)
37.4 N/A 45.6
Counseling for physical activity (children and adolescents)
35.3 N/A 36.7
BMI assessment for adults 40.7 50.4 42.2
Physical activity discussion in older adults (65 and older)
N/A 52.3 N/A
Values are percentages.AMI indicates acute myocardial infarction; LDL, low-density lipoprotein; BP,
blood pressure; DM, diabetes mellitus; HbA1c, hemoglobin A1c; BMI, body mass index; and N/A, not available or not applicable.
*β-Blocker persistence: Received persistent β-blocker treatment for 6 months after AMI hospital discharge.
Table 21-6. Additional ACTION-GWTG Quality-of-Care Metrics for ACS Care, 2011
Quality Metrics Overall STEMI NSTEMI
ECG within 10 min of arrival 62.4 74.2 57.1
Aspirin within 24 h of arrival 97.6 98.4 97.1
Any anticoagulant use* 93.2 95.4 91.7
Dosing error
UFH dose 48.6 47.5 49.4
Enoxaparin dose 11.8 10.6 11.9
Glycoprotein IIb/IIIa inhibitor dose 7.2 7.4 7.0
Aspirin at discharge 98.3 98.9 97.9
Prescribed statins on discharge 98.4 99 98.1
Adult smoking cessation advice/counseling
98.4 98.7 98.1
Cardiac rehabilitation referral 76.5 83.2 72
In-hospital mortality† (95% CI) 4.6 (4.4–4.7) 5.9 (5.7–6.2) 3.7(3.5–3.8)
Values are percentages.ACTION-GWTG indicates Acute Coronary Treatment and Intervention
Outcomes Registry–Get With The Guidelines; ACS, acute coronary syndrome; STEMI, ST-segment elevation myocardial infarction; NSTEMI, non–ST-segment elevation myocardial infarction; ECG, electrocardiogram; UFH, unfractionated heparin; and CI, confidence interval.
*Includes UFH, low-molecular-weight heparin, or direct thrombin inhibitor use.
†Excludes transfer-out patients.
by guest on December 16, 2013http://circ.ahajournals.org/Downloaded from

e226 Circulation January 1/8, 2013
Table 21-9. Quality of Care for In-Hospital Cardiac Arrest
Overall
Time to first shock within 3 min* 92.1% (91.0%–93.2%)
Hypothermia after resuscitation maintained between 32°C and 34°C
35.6% (30.5%–40.7%)
*Among those with a first recorded rhythm of ventricular fibrillation, pulseless ventricular tachycardia, or shockable by automated external defibrillator.
Table 21-10. Timely Reperfusion for ACS and Stroke, 2011
Quality-of-Care Measure VHA* (for STEMI) or GWTG-Stroke (for Stroke) National Data From HIQR Program† ACTION-GWTG STEMI‡
STEMI
tPA within 30 min 50§ 58.1 46.8§
PCI within 90 min 69 92.5 94.2
Stroke
IV tPA in patients who arrived <2 h after symptom onset, treated ≤3 h
78.3 N/A N/A
IV tPA in patients who arrived <3.5 h after symptom onset, treated ≤4.5 h
57.9 N/A N/A
IV tPA door-to-needle time ≤60 min 33.8 N/A N/A
Values are percentages.ACS indicates acute coronary syndrome; VHA, Veterans Health Administration; STEMI, ST-segment–elevation myocardial infarction; GWTG-Stroke, Get With The
Guidelines–Stroke; HIQR, Hospital Inpatient Quality Reporting; ACTION-GWTG, Acute Coronary Treatment and Intervention Outcomes Registry–Get With The Guidelines; tPA, tissue-type plasminogen activator; PCI, percutaneous coronary intervention; IV, intravenous; and N/A, not applicable.
*VHA: acute myocardial infarction patients.†HIQR Program includes data from all payers, including Medicare and Medicaid.‡ACTION Registry: STEMI and NSTEMI patients are reported separately. Patients must be admitted with acute ischemic symptoms within the previous 24 hours,
typically reflected by a primary diagnosis of STEMI or NSTEMI. Patients who are admitted for any other clinical condition are not eligible.§Indicates low number.
Table 21-8. Quality of Care for EMS-Treated Out-of-Hospital Cardiac Arrest
Overall Adults Children
Bystander CPR, mean (95% CI), % 40.1 (38.9–41.3) 40.1 (38.9–41.4) 55.9 (49.1–62.7)
Shocked by AED before EMS, mean (95% CI), % 1.8 (1.5–2.2) 1.9 (1.5–2.2) 1.0 (0–2.3)
Chest compression fraction during first 5 min of EMS CPR, mean (SD)* 0.79 (0.22) 0.79 (0.22) 0.80 (0.19)
Compression depth, mean (SD)* 39.2 (14.9) 39.3 (14.9) 31.9 (14.2)
Preshock pause duration, mean (SD)† 15.4 (24.3) 15.4 (24.4) 13 (N/A)
Time to first EMS defibrillator applied, mean (SD), min 7.4 (9.0) 7.4 (9.2) 6.7 (3.2)
EMS indicates emergency medical services; CPR, cardiopulmonary resuscitation; CI, confidence interval; AED, automated external defibrillator; and SD, standard deviation.
*During first 10 minutes of resuscitation.†Up to and including first 6 shocks.
by guest on December 16, 2013http://circ.ahajournals.org/Downloaded from
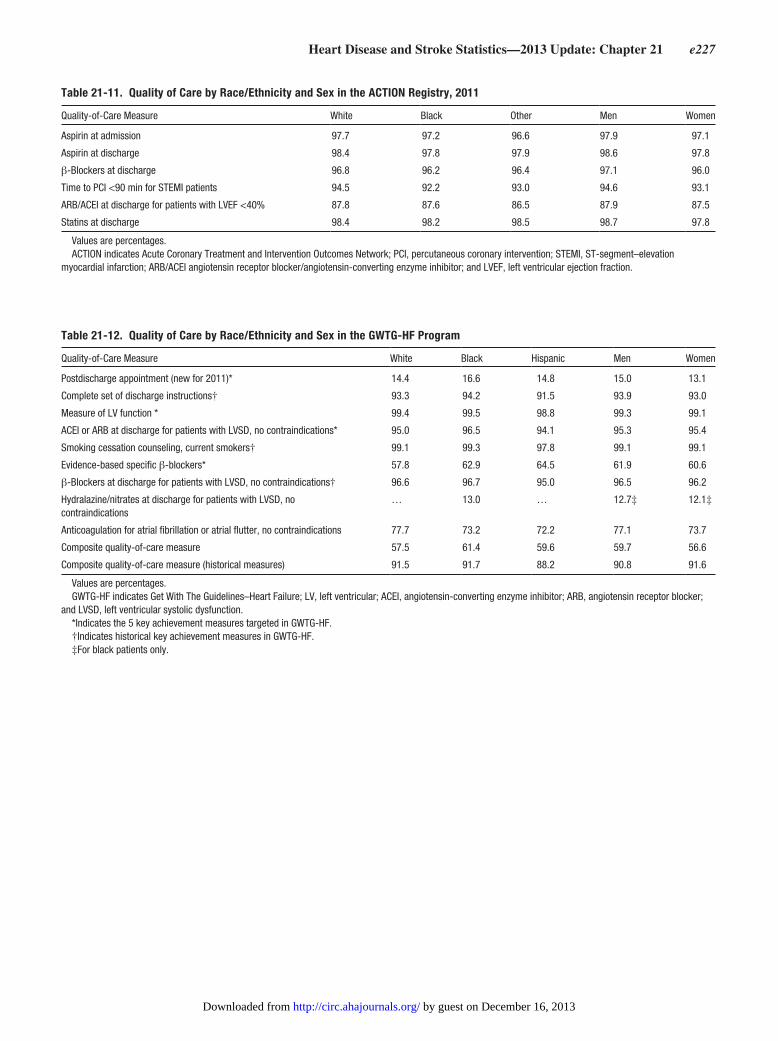
Heart Disease and Stroke Statistics—2013 Update: Chapter 21 e227
Table 21-12. Quality of Care by Race/Ethnicity and Sex in the GWTG-HF Program
Quality-of-Care Measure White Black Hispanic Men Women
Postdischarge appointment (new for 2011)* 14.4 16.6 14.8 15.0 13.1
Complete set of discharge instructions† 93.3 94.2 91.5 93.9 93.0
Measure of LV function * 99.4 99.5 98.8 99.3 99.1
ACEI or ARB at discharge for patients with LVSD, no contraindications* 95.0 96.5 94.1 95.3 95.4
Smoking cessation counseling, current smokers† 99.1 99.3 97.8 99.1 99.1
Evidence-based specific β-blockers* 57.8 62.9 64.5 61.9 60.6
β-Blockers at discharge for patients with LVSD, no contraindications† 96.6 96.7 95.0 96.5 96.2
Hydralazine/nitrates at discharge for patients with LVSD, no contraindications
… 13.0 … 12.7‡ 12.1‡
Anticoagulation for atrial fibrillation or atrial flutter, no contraindications 77.7 73.2 72.2 77.1 73.7
Composite quality-of-care measure 57.5 61.4 59.6 59.7 56.6
Composite quality-of-care measure (historical measures) 91.5 91.7 88.2 90.8 91.6
Values are percentages.GWTG-HF indicates Get With The Guidelines–Heart Failure; LV, left ventricular; ACEI, angiotensin-converting enzyme inhibitor; ARB, angiotensin receptor blocker;
and LVSD, left ventricular systolic dysfunction.*Indicates the 5 key achievement measures targeted in GWTG-HF.†Indicates historical key achievement measures in GWTG-HF.‡For black patients only.
Table 21-11. Quality of Care by Race/Ethnicity and Sex in the ACTION Registry, 2011
Quality-of-Care Measure White Black Other Men Women
Aspirin at admission 97.7 97.2 96.6 97.9 97.1
Aspirin at discharge 98.4 97.8 97.9 98.6 97.8
β-Blockers at discharge 96.8 96.2 96.4 97.1 96.0
Time to PCI <90 min for STEMI patients 94.5 92.2 93.0 94.6 93.1
ARB/ACEI at discharge for patients with LVEF <40% 87.8 87.6 86.5 87.9 87.5
Statins at discharge 98.4 98.2 98.5 98.7 97.8
Values are percentages.ACTION indicates Acute Coronary Treatment and Intervention Outcomes Network; PCI, percutaneous coronary intervention; STEMI, ST-segment–elevation
myocardial infarction; ARB/ACEI angiotensin receptor blocker/angiotensin-converting enzyme inhibitor; and LVEF, left ventricular ejection fraction.
by guest on December 16, 2013http://circ.ahajournals.org/Downloaded from
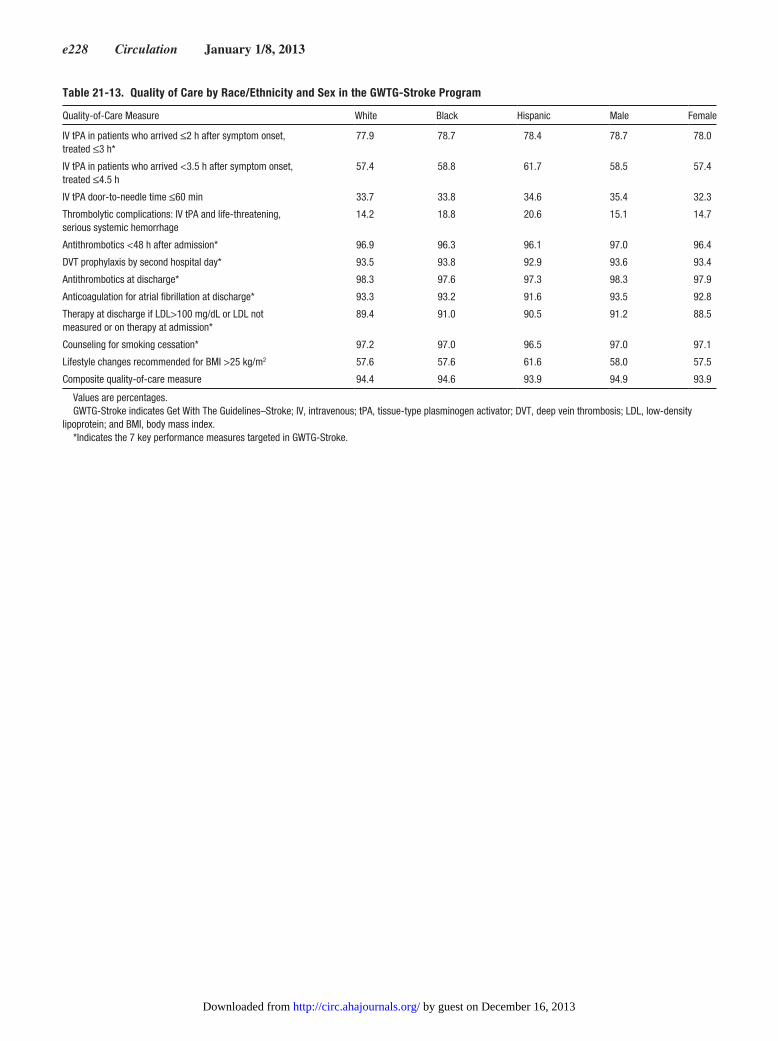
e228 Circulation January 1/8, 2013
Table 21-13. Quality of Care by Race/Ethnicity and Sex in the GWTG-Stroke Program
Quality-of-Care Measure White Black Hispanic Male Female
IV tPA in patients who arrived ≤2 h after symptom onset, treated ≤3 h*
77.9 78.7 78.4 78.7 78.0
IV tPA in patients who arrived <3.5 h after symptom onset, treated ≤4.5 h
57.4 58.8 61.7 58.5 57.4
IV tPA door-to-needle time ≤60 min 33.7 33.8 34.6 35.4 32.3
Thrombolytic complications: IV tPA and life-threatening, serious systemic hemorrhage
14.2 18.8 20.6 15.1 14.7
Antithrombotics <48 h after admission* 96.9 96.3 96.1 97.0 96.4
DVT prophylaxis by second hospital day* 93.5 93.8 92.9 93.6 93.4
Antithrombotics at discharge* 98.3 97.6 97.3 98.3 97.9
Anticoagulation for atrial fibrillation at discharge* 93.3 93.2 91.6 93.5 92.8
Therapy at discharge if LDL>100 mg/dL or LDL not measured or on therapy at admission*
89.4 91.0 90.5 91.2 88.5
Counseling for smoking cessation* 97.2 97.0 96.5 97.0 97.1
Lifestyle changes recommended for BMI >25 kg/m2 57.6 57.6 61.6 58.0 57.5
Composite quality-of-care measure 94.4 94.6 93.9 94.9 93.9
Values are percentages.GWTG-Stroke indicates Get With The Guidelines–Stroke; IV, intravenous; tPA, tissue-type plasminogen activator; DVT, deep vein thrombosis; LDL, low-density
lipoprotein; and BMI, body mass index.*Indicates the 7 key performance measures targeted in GWTG-Stroke.
by guest on December 16, 2013http://circ.ahajournals.org/Downloaded from

Heart Disease and Stroke Statistics—2013 Update: Chapter 22 e229
22. Medical Procedures
See Tables 22-1 and 22-2 and Charts 22-1 through 22-4.
Trends in Operations and Procedures(See Charts 22-1 and 22-2 .)
●● The total number of inpatient cardiovascular operations and procedures increased 28%, from 5 939 000 in 2000 to 7 588 000 in 2010 (NHLBI computation based on NCHS annual data) . Data from the NHDS were examined for trends from 1990 to 2004 for use of PCI and CABG and in-hospital mortality rate attributable to PCI and CABG by sex .1
— Discharge rates (per 10 000 population) for PCI increased 58%, from 37 .2 in 1990 to 1992 to 59 .2 in 2002 to 2004 .
— Discharge rates for CABG increased from 34 .1 in 1990 to 1992 to 38 .6 in 1996 to 1998, then declined to 25 .2 in 2002 to 2004 .
— In 1990 to 1992, discharge rates for CABG were 53 .5 for males and 18 .1 for females; these rates increased through 1996 to 1998, then declined to 38 .8 and 13 .6, respectively, in 2002 to 2004 . The magnitude of these declines decreased by age decile and were essentially flat for both men and women ≥75 years of age .
— PCI discharge rates increased from 54 .5 for males and 23 .0 for females to 83 .0 and 38 .7, respectively, over the 15-year time interval . In 2002 to 2004, discharge rates for men and women 65 to 74 years of age were 135 .1 and 64 .0, respectively . For those ≥75 years of age, the rates were 128 .7 and 69 .0, respectively .
— In-hospital mortality rate (deaths per 100 CABG dis-charges) declined from 4 .3 to 3 .5 between 1990 to 1992 and 2002 to 2004 despite an increase in Charlson comorbidity index . The mortality rate declined in all age and sex subsets, but especially in women .
●● Data from the Acute Care Tracker database were used to estimate the population-based rates per 100 000 population for PCI and CABG procedures from 2002 to 2005, stan-dardized to the 2005 US population2:
● — Adjusted for age and sex, the overall rate for coronary revascularization declined from 382 to 358 per 100 000 . PCI rates during hospitalization increased from 264 to 267 per 100 000, whereas CABG rates declined from 121 to 94 .
●● Data from men and women enrolled in Medicare from 1992 to 2001 suggest that efforts to eliminate racial disparities in the use of high-cost cardiovascular procedures (PCI, CABG, and carotid endarterectomy) were unsuccessful .3
— In 1992, among women, the age-standardized rates of carotid endarterectomy were 1 .59 per 1000 enrollees for whites and 0 .64 per 1000 enrollees for blacks . By 2002, the rates were 2 .42 per 1000 enrollees among white women and 1 .15 per 1000 enrollees among black women . For men, the difference in rates between whites and blacks remained the same . In 1992, the rates were 3 .13 per 1000 enrollees among white men and 0 .82 per 1000 enrollees among black men; in 2001, the rates were 4 .42 and 1 .44, respectively .
Cardiac Catheterization and PCI
●● From 2000 to 2010, the number of cardiac catheterizations decreased slightly, from 1 221 000 to 1 029 000 annually (NHDS, NHLBI tabulation) .
●● In 2010, an estimated 492 000 patients underwent PCI (previously referred to as percutaneous transluminal coro-nary angioplasty, or PTCA) procedures in the United States (NHDS, NHLBI tabulation) .
●● In 2010, ≈67% of PCI procedures were performed on men, and ≈51% were performed on people ≥65 years of age (NHDS, NHLBI tabulation) .
●● In-hospital death rates for PCI have remained stable, although comorbidities increased for patients who received the procedure .1
●● In 2010, ≈75% of stents implanted during PCI were drug-eluting stents compared with 25% that were bare-metal stents (NHDS, NHLBI computation) .
●● In a study of nontransferred patients with STEMI treated with primary PCI from July 2006 to March 2008, there was significant improvement over time in the percentage of patients receiving PCI within 90 minutes, from 54 .1% from July to September 2006 to 74 .1% from January to March 2008, among hospitals participating in the GWTG-CAD program . This improvement was seen whether or not hos-pitals joined the D2B Alliance during that period .4
●● The rate of any cardiac stent procedure rose by 61% from 1999 to 2006, then declined by 27% between 2006 and 2009 .5
Cardiac Open Heart SurgeryThe NHDS (NCHS) estimates that in 2010, in the United States, 219 000 patients underwent a total of 397 000 coro-nary artery bypass procedures (defined by procedure codes) . CABG volumes have declined nationally since 1998 . Risk-adjusted mortality for CABG has declined significantly over the past decade .
●● Data from the Society of Thoracic Surgeons’ National Adult Cardiac Database, which voluntarily collects data
Abbreviations Used in Chapter 22
CABG coronary artery bypass graft
CHF congestive heart failure
D2B Door-to-Balloon Alliance
GWTG-CAD Get With The Guidelines–Coronary Artery Disease
HD heart disease
HPLHS hypoplastic left heart syndrome
ICD-9-CM International Classification of Diseases, 9th Revision, Clinical Modification
NCHS National Center for Health Statistics
NHDS National Hospital Discharge Survey
NHLBI National Heart, Lung, and Blood Institute
PCI percutaneous coronary intervention
PTCA percutaneous transluminal coronary angioplasty
STEMI ST-segment–elevation myocardial infarction
TOF tetralogy of Fallot
VSD ventricular septal defect
by guest on December 16, 2013http://circ.ahajournals.org/Downloaded from

e230 Circulation January 1/8, 2013
from ≈80% of all hospitals that perform CABG in the United States, indicate that a total of 158 008 procedures involved CABG in 2010 .6
●● Data from the Society of Thoracic Surgeons’ National Adult Cardiac Database document a 50% decline in the risk-adjusted mortality rate despite a significant increase in preoperative surgical risk .7
Congenital Heart Surgery, 1998 to 2002 (From Society of Thoracic Surgeons)There were 103 664 procedures performed from July 2006 to June 2010 . The in-hospital mortality rate was 3 .2% in 2010 . The 5 most common diagnoses were the following: pat-ent ductus arteriosus (7 .4%); HPLHS (6 .9%); VSD, type 2 (6 .3%); cardiac, other (5 .3%); and TOF (4 .9%) .8
Congenital Heart Surgery, 1998 to 2002 (From Society of Thoracic Surgeons)There were 16 920 procedures performed from 1998 to 2002 at 18 centers . In 2002, there were 4208 procedures performed . The in-hospital mortality rate ranged from 5 .7% in 1998 to 4 .3% in 2002 . Of these procedures, ≈46% were performed in children >1 year old, ≈32% in infants between 29 days and 1 year of age, and ≈22% in neonates (<29 days old) . The condi-tions for which these procedures were most commonly per-formed were the following: patent ductus arteriosus (6 .5%), VSD (6 .4%), and TOF (6 .0%) .
Heart Transplantations(See Charts 22-3 and 22-4 .)
In 2011, 2322 heart transplantations were performed in the United States (Chart 22-3) . There are 246 transplant hospi-tals in the United States, 128 of which performed heart trans-plantations (based on Organ Procurement and Transplantation Network data as of April 24, 2012) .
●● Of the recipients in 2011, 68 .7% were male, and 65 .8% were white; 20 .9% were black, whereas 9 .6% were Hispanic . Heart transplantations by recipient age are shown in Chart 22-4 .
●● As of April 18, 2012, for transplants that occurred between 2007 and 2008, the 1-year survival rate was 89 .4% for males and 87 .8% for females; the 5-year rates between 2003 and 2008 were 76 .1% for males and 72 .6% for females; and the 10-year rates between 1998 and 2008 were 57 .0% for males and 54 .7% for females . The 1-, 5-, and 10-year sur-vival rates for white cardiac transplant patients were 89 .5%,
77 .4%, and 58 .8%, respectively . For black patients, they were 85 .7%, 65 .8%, and 44 .8%, respectively . For Hispanic patients, they were 91 .5%, 76 .2%, and 62 .5%, respectively .
●● As of April 24, 2012, 3151 patients were on the transplant waiting list for a heart transplant, and 52 patients were on the list for a heart/lung transplant .
Cardiovascular Healthcare Expenditures An analysis of claims and enrollment data from the Con-tinuous Medicare History Sample and from physician claims from 1995 to 2004 was used to evaluate the condi-tions that contributed to the most expensive 5% of Medicare beneficiaries .8
●● Ischemic HD, CHF, and cerebrovascular disease, respec-tively, constituted 13 .8%, 5 .9%, and 5 .7% of the conditions of all beneficiaries in 2004 . In patients in the top 5% over-all for all expenditures, the respective figures were 39 .1%, 32 .7%, and 22 .3% for these cardiovascular conditions .
References 1 . Holmes JS, Kozak LJ, Owings MF . Use and in-hospital mortality associ-
ated with two cardiac procedures, by sex and age: national trends, 1990-2004 . Health Aff (Millwood) . 2007;26:169–177 .
2 . Nallamothu BK, Young J, Gurm HS, Pickens G, Safavi K . Recent trends in hospital utilization for acute myocardial infarction and coronary revas-cularization in the United States . Am J Cardiol . 2007;99:749–753 .
3 . Jha AK, Fisher ES, Li Z, Orav EJ, Epstein AM . Racial trends in the use of major procedures among the elderly . N Engl J Med . 2005;353:683–691 .
4 . Nallamothu BK, Krumholz HM, Peterson ED, Pan W, Bradley E, Stern AF, Masoudi FA, Janicke DM, Hernandez AF, Cannon CP, Fonarow GC; D2B Alliance and the American Heart Association Get-With-The-Guidelines Investigators . Door-to-balloon times in hospitals within the Get-With-The-Guidelines registry after initiation of the Door-to-Balloon (D2B) Alliance . Am J Cardiol . 2009;103:1051–1055 .
5 . Auerbach D, Maeda J, Steiner C . Hospital Stays With Cardiac Stents, 2009. HCUP Statistical Brief #128 . Rockville, MD: Agency for Health-care Research and Quality; 2012 . http://www .hcup-us .ahrq .gov/reports/statbriefs/sb128 .pdf . Accessed July 23, 2012 .
6 . The Society of Thoracic Surgeons . STS Adult Cardiac Surgery Database: Executive Summary: 10 Years . http://www .sts .org/sites/default/files/docu-ments/2011%20-%20Adult%20Cardiac%20Surgery%20-1stHarvestEx-ecutiveSummary .pdf . Accessed July 25, 2011 .
7 . Ferguson TB Jr, Hammill BG, Peterson ED, DeLong ER, Grover FL;STS National Database Committee . A decade of change: risk profiles and outcomes for isolated coronary artery bypass grafting procedures, 1990–1999: a report from the STS National Database Committee and the Duke Clinical Research Institute: Society of Thoracic Surgeons . Ann Thorac Surg . 2002;73:480–489 .
8 . Riley GF . Long-term trends in the concentration of Medicare spending . Health Aff (Millwood) . 2007;26:808–816 .
9 . Agency for Healthcare Research and Quality, Healthcare Cost and Uti-lization Project . HCUPnet . http://www .hcup .ahrq .gov/HCUPnet .jsp . Ac-cessed June 6, 2012 .
by guest on December 16, 2013http://circ.ahajournals.org/Downloaded from
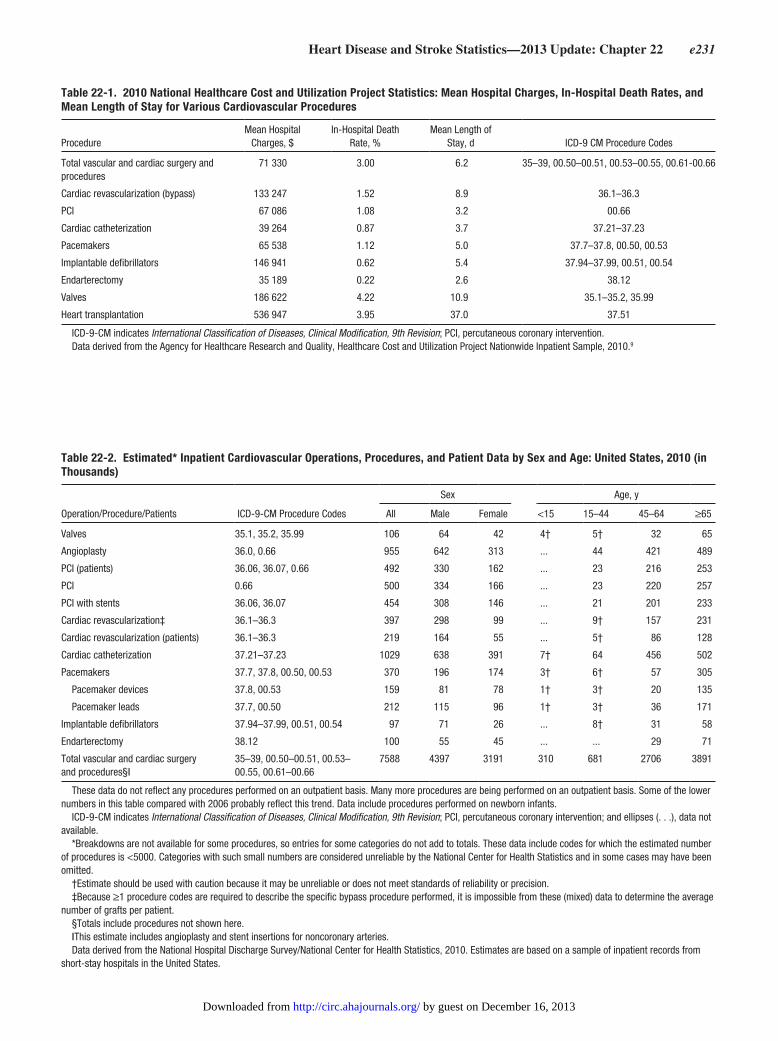
Heart Disease and Stroke Statistics—2013 Update: Chapter 22 e231
Table 22-1. 2010 National Healthcare Cost and Utilization Project Statistics: Mean Hospital Charges, In-Hospital Death Rates, and Mean Length of Stay for Various Cardiovascular Procedures
ProcedureMean Hospital
Charges, $In-Hospital Death
Rate, %Mean Length of
Stay, d ICD-9 CM Procedure Codes
Total vascular and cardiac surgery and procedures
71 330 3.00 6.2 35–39, 00.50–00.51, 00.53–00.55, 00.61-00.66
Cardiac revascularization (bypass) 133 247 1.52 8.9 36.1–36.3
PCI 67 086 1.08 3.2 00.66
Cardiac catheterization 39 264 0.87 3.7 37.21–37.23
Pacemakers 65 538 1.12 5.0 37.7–37.8, 00.50, 00.53
Implantable defibrillators 146 941 0.62 5.4 37.94–37.99, 00.51, 00.54
Endarterectomy 35 189 0.22 2.6 38.12
Valves 186 622 4.22 10.9 35.1–35.2, 35.99
Heart transplantation 536 947 3.95 37.0 37.51
ICD-9-CM indicates International Classification of Diseases, Clinical Modification, 9th Revision; PCI, percutaneous coronary intervention.Data derived from the Agency for Healthcare Research and Quality, Healthcare Cost and Utilization Project Nationwide Inpatient Sample, 2010.9
Table 22-2. Estimated* Inpatient Cardiovascular Operations, Procedures, and Patient Data by Sex and Age: United States, 2010 (in Thousands)
Sex Age, y
Operation/Procedure/Patients ICD-9-CM Procedure Codes All Male Female <15 15–44 45–64 ≥65
Valves 35.1, 35.2, 35.99 106 64 42 4† 5† 32 65
Angioplasty 36.0, 0.66 955 642 313 ... 44 421 489
PCI (patients) 36.06, 36.07, 0.66 492 330 162 ... 23 216 253
PCI 0.66 500 334 166 ... 23 220 257
PCI with stents 36.06, 36.07 454 308 146 ... 21 201 233
Cardiac revascularization‡ 36.1–36.3 397 298 99 ... 9† 157 231
Cardiac revascularization (patients) 36.1–36.3 219 164 55 ... 5† 86 128
Cardiac catheterization 37.21–37.23 1029 638 391 7† 64 456 502
Pacemakers 37.7, 37.8, 00.50, 00.53 370 196 174 3† 6† 57 305
Pacemaker devices 37.8, 00.53 159 81 78 1† 3† 20 135
Pacemaker leads 37.7, 00.50 212 115 96 1† 3† 36 171
Implantable defibrillators 37.94–37.99, 00.51, 00.54 97 71 26 ... 8† 31 58
Endarterectomy 38.12 100 55 45 ... ... 29 71
Total vascular and cardiac surgery and procedures§‖
35–39, 00.50–00.51, 00.53– 00.55, 00.61–00.66
7588 4397 3191 310 681 2706 3891
These data do not reflect any procedures performed on an outpatient basis. Many more procedures are being performed on an outpatient basis. Some of the lower numbers in this table compared with 2006 probably reflect this trend. Data include procedures performed on newborn infants.
ICD-9-CM indicates International Classification of Diseases, Clinical Modification, 9th Revision; PCI, percutaneous coronary intervention; and ellipses (. . .), data not available.
*Breakdowns are not available for some procedures, so entries for some categories do not add to totals. These data include codes for which the estimated number of procedures is <5000. Categories with such small numbers are considered unreliable by the National Center for Health Statistics and in some cases may have been omitted.
†Estimate should be used with caution because it may be unreliable or does not meet standards of reliability or precision.‡Because ≥1 procedure codes are required to describe the specific bypass procedure performed, it is impossible from these (mixed) data to determine the average
number of grafts per patient.§Totals include procedures not shown here.‖This estimate includes angioplasty and stent insertions for noncoronary arteries.Data derived from the National Hospital Discharge Survey/National Center for Health Statistics, 2010. Estimates are based on a sample of inpatient records from
short-stay hospitals in the United States.
by guest on December 16, 2013http://circ.ahajournals.org/Downloaded from

e232 Circulation January 1/8, 2013
0
200
400
600
800
1000
1200
1400
1979 1980 1985 1990 1995 2000 2005 2010
Proc
edur
es in
Tho
usan
ds
Catheterizations Bypass PCI Carotid Endarterectomy Pacemakers
Chart 22-1. Trends in cardiovascular procedures, United States: 1979 to 2010. PCI indicates percutaneous coronary intervention. Note: Inpatient procedures only. Source: National Hospital Discharge Survey, National Center for Health Statistics, and National Heart, Lung, and Blood Institute.
0.4
1.2
1.3
1.4
1.5
1.6
5.3
5.9
7.0
7.4
0.0 1.0 2.0 3.0 4.0 5.0 6.0 7.0 8.0
Hemic and Lymphatic
Urinary System
Nervous System
Respiratory System
Integumentary System
Female Genital Organs
Musculoskeletal
Digestive System
Cardiovascular
Obstetrical
Millions of Discharges
Chart 22-2. Number of surgical procedures in the 10 leading diagnostic groups, United States: 2010. Source: National Hospital Dis-charge Survey/National Center for Health Statistics and National Heart, Lung, and Blood Institute.
by guest on December 16, 2013http://circ.ahajournals.org/Downloaded from

Heart Disease and Stroke Statistics—2013 Update: Chapter 22 e233
22 57
719
2,107
2,363
2,1992,125
2,322
0
500
1000
1500
2000
2500
1975 1980 1985 1990 1995 2000 2005 2011
Nu
mb
er o
f T
ran
spla
nts
Years
Chart 22-3. Trends in heart transplantations (United Network for Organ Sharing: 1975–2011). Source: United Network for Organ Sharing, scientific registry data.
0%
10%
20%
30%
40%
50%
<1 6-101-5 11-17 18-34 35-49 50-64
Perc
ent o
f Tra
nspl
ants
Age (Years)
Chart 22-4. Heart transplantations in the United States by recipient age, 2011. Source: Organ Procurement and Transplantation Network data as of April 13, 2012.
by guest on December 16, 2013http://circ.ahajournals.org/Downloaded from
e234 Circulation January 1/8, 2013
23. Economic Cost of Cardiovascular Disease
See Tables 23-1 and 23-2 and Charts 23-1 through 23-4.
The annual direct and indirect cost of CVD and stroke in the United States is an estimated $312 .6 billion (Table 23-1; Chart 23-1) . This figure includes $192 .1 billion in expenditures (direct costs, which include the cost of physicians and other professionals, hospital services, prescribed medication, and home health care, but not the cost of nursing home care) and $120 .5 billion in lost future productivity attributed to prema-ture CVD and stroke mortality in 2009 (indirect costs) .
The direct costs for CVD and stroke are the healthcare expen-ditures for 2009 available on the Web site of the nationally representative MEPS of the Agency for Healthcare Research and Quality .1 Details on the advantages or disadvantages of using MEPS data are provided in the Heart Disease and Stroke Statistics–2011 Update .2 Indirect mortality costs are estimated for 2009 by multiplying the number of deaths that year attributable to CVD and strokes, in age and sex groups, by estimates of the pres-ent value of lifetime earnings for those age and sex groups as of 2009 . Mortality data are from the National Vital Statistics System of the NCHS .3 The present values of lifetime earnings are unpub-lished estimates furnished by the Institute on Health and Aging, University of California at San Francisco, by Wendy Max, PhD, on April 25, 2012 . Those estimates have a 3% discount rate, the recommended percentage .4 The discount rate removes the effect of inflation in income over the lifetime of earnings .
The indirect costs exclude lost productivity costs attrib-utable to CVD and stroke illness during 2009 among work-ers, people keeping house, people in institutions, and people unable to work . Those morbidity costs were substantial in very old studies, but an adequate update could not be made .
Most Costly Diseases(See Table 23-2 and Chart 23-2 .)
CVD and stroke accounted for 15% of total health expenditures in 2009, more than any major diagnostic group .1,5 That is also the case for indirect mortality costs . By way of comparison, CVD total direct and indirect costs shown in Table 23-1 are higher than the official National Cancer Institute estimates for cancer and benign neoplasms in 2008, which were cited as $228 billion total ($93 billion in direct costs, $19 billion in indirect morbidity costs, and $116 billion in indirect mortality costs) .6
Table 23-2 shows direct and indirect costs for CVD by sex and by 2 broad age groups . Chart 23-2 shows total direct costs for the 14 leading chronic diseases in the MEPS list . HD is the most costly condition .1
Projections(See Charts 23-3 and 23-4 .)
The AHA developed methodology to project future costs of care for HBP, CHD, HF, stroke, and all other CVD .7 By 2030, 40 .8% of the US population is projected to have some form of CVD . Between 2013 and 2030, total direct medical costs of CVD are projected to increase from $320 billion to $818 billion . Indirect costs (attributable to lost productivity) for all CVDs are estimated to increase from $203 billion in 2013 to $308 billion in 2030, an increase of 52% . These data indicate that CVD prevalence and costs are projected to increase substantially . It is important to underscore that differences exist between these estimates and those stated above . These apparent discrepancies largely reflect methodological differences and emphasize that the importance of cost projections resides in the documentation of profoundly adverse trends, which constitute an urgent call to action and must be reversed, rather than in the calculation of precise numbers .
References 1 . Agency for Healthcare Research and Quality . Total expenses and percent
distribution for selected conditions by source of payment: United States, 2008 . Medical Expenditure Panel Survey Household Component Data . Generated interactively . http://meps .ahrq .gov/mepsweb/data_stats/quick_tables_results .jsp?Action=Search&SearchMethod=1&component=1&subcomponent=0&tableSeries=2&year=-1 . Accessed May 29, 2012 .
2 . Roger VL, Go AS, Lloyd-Jones DM, Adams RJ, Berry JD, Brown TM, Carnethon MR, Dai S, de Simone G, Ford ES, Fox CS, Fullerton HJ, Gillespie C, Greenlund KJ, Hailpern SM, Heit JA, Ho PM, Howard VJ, Kissela BM, Kittner SJ, Lackland DT, Lichtman JH, Lisabeth LD, Makuc DM, Marcus GM, Marelli A, Matchar DB, McDermott MM, Meigs JB, Moy CS, Mozaffarian D, Mussolino ME, Nichol G, Paynter NP, Rosamond WD, Sorlie PD, Stafford RS, Turan TN, Turner MB, Wong ND, Wylie-Rosett J; American Heart Association Statistics Committee and Stroke Statistics Subcommittee . Heart disease and stroke statistics: 2011 update: a report from the American Heart Association [published corrections appear in Circulation . 2011;123:e240 and Circulation . 2011;124:e426] . Circulation . 2011;123:e18–e209 .
3 . National Center for Health Statistics . Public use data sets for final US 2009 mortality tabulated by the National Heart, Lung, and Blood Institute . Mortality multiple cause-of-death public use record . http://www .cdc .gov/nchs/data_access/vitalstatsonline .htm . Accessed May 29, 2012 .
4 . Gold MR, Siegel JE, Russell LB, Weinstein MC . Cost-Effectiveness in Health and Medicine. New York, NY: Oxford University Press; 1996 .
5 . Agency for Healthcare Research and Quality . Household component sum-mary tables . Table 1: total health services: median and mean expenses per per-son with expense and distribution of expenses by source of payment: United States, 2008 . Medical Expenditure Panel Survey Household Component Data . Generated interactively . http://www .meps .ahrq .gov/mepsweb/data_stats/tables_compendia_hh_interactive .jsp? . Accessed November 23, 2011 .
6 . American Cancer Society . Economic impact of cancer . http://www .cancer .org/Cancer/CancerBasics/economic-impact-of-cancer . Accessed May 25, 2011 .
7 . Heidenreich PA, Trogdon JG, Khavjou OA, Butler J, Dracup K, Ezekowitz MD, Finkelstein EA, Hong Y, Johnston SC, Khera A, Lloyd-Jones DM, Nelson SA, Nichol G, Orenstein D, Wilson PW, Woo YJ; American Heart Association Advocacy Coordinating Committee; Stroke Council; Council on Cardiovascular Radiology and Intervention; Council on Clinical Cardi-ology; Council on Epidemiology and Prevention; Council on Arterioscle-rosis; Thrombosis and Vascular Biology; Council on Cardiopulmonary; Critical Care; Perioperative and Resuscitation; Council on Cardiovascular Nursing; Council on the Kidney in Cardiovascular Disease; Council on Cardiovascular Surgery and Anesthesia, and Interdisciplinary Council on Quality of Care and Outcomes Research . Forecasting the future of cardio-vascular disease in the United States: a policy statement from the Ameri-can Heart Association . Circulation . 2011;123:933–944 .
Abbreviations Used in Chapter 23
AHA American Heart Association
CHD coronary heart disease
CHF congestive heart failure
COPD chronic obstructive pulmonary disease
CVD cardiovascular disease
GI gastrointestinal
HBP high blood pressure
HD heart disease
HF heart failure
MEPS Medical Expenditure Panel Survey
NCHS National Center for Health Statistics
by guest on December 16, 2013http://circ.ahajournals.org/Downloaded from
Heart Disease and Stroke Statistics—2013 Update: Chapter 23 e235
Table 23-1. Estimated Direct and Indirect Costs (in Billions of Dollars) of CVD and Stroke: United States, 2009
Heart Disease* Stroke Hypertensive Disease†Other Circulatory
Conditions Total CVD
Direct costs‡
Hospital inpatient stays 56.3 10.7 5.9 13.2 86.1
Hospital emergency room visits 5.6 0.6 1.3 0.8 8.3
Hospital outpatient or office-based provider visits 21.4 4.5 14.1 6.7 46.7
Home health care 7.4 6.0 4.8 1.0 19.2
Prescribed medicines 8.5 1.0 21.4 0.9 31.8
Total expenditures 99.2 22.8 47.5 22.6 192.1
Indirect costs§
Lost productivity/mortality|| 96.0 15.8 3.5 5.2 120.5
Grand totals 195.2 38.6 51.0 27.8 312.6
Numbers do not add to total because of rounding.CVD indicates cardiovascular disease.*This category includes coronary heart disease, heart failure, part of hypertensive disease, cardiac dysrhythmias, rheumatic heart disease, cardiomyopathy,
pulmonary heart disease, and other or ill-defined heart diseases.†Costs attributable to hypertensive disease are limited to hypertension without heart disease.‡Medical Expenditure Panel Survey healthcare expenditures are estimates of direct payments for care of a patient with the given disease provided during the
year, including out-of-pocket payments and payments by private insurance, Medicaid, Medicare, and other sources. Payments for over-the-counter drugs are not included. These estimates of direct costs do not include payments attributed to comorbidities. Total CVD costs are the sum of costs for the 4 diseases but with some duplication.
§The Statistics Committee agreed to suspend presenting estimates of lost productivity attributable to morbidity until a better estimating method can be developed.||Lost future earnings of persons who died in 2009, discounted at 3%.Sources: Estimates from the Household Component of the Medical Expenditure Panel Survey of the Agency for Healthcare Research and Quality for direct costs
(2009).1 Indirect mortality costs are based on 2009 counts of deaths by the National Center for Health Statistics and an estimated present value of lifetime earnings furnished for 2009 by Wendy Max (Institute for Health and Aging, University of California, San Francisco, April 25, 2012).
All estimates prepared by Michael Mussolino, National Heart, Lung, and Blood Institute.
Table 23-2. Costs of Total CVD in Billions of Dollars by Age and Sex: United States, 2009
Sex Age
Total Male Female <65 y ≥65 y
Direct 192.1 93.7 98.4 87.7 104.4
Indirect mortality 120.5 88.6 31.9 103.7 16.8
Total 312.6 182.3 130.3 191.4 121.2
Numbers may not add to total because of rounding.CVD indicates cardiovascular diseases and stroke.Source: Medical Expenditure Panel Survey, 2009 (direct costs) and mortality
data from the National Center for Health Statistics and present value of lifetime earnings from the Institute for Health and Aging, University of California, San Francisco (indirect costs).
All estimates prepared by Michael Mussolino, National Heart, Lung, and Blood Institute.
by guest on December 16, 2013http://circ.ahajournals.org/Downloaded from

e236 Circulation January 1/8, 2013
195.2
51.0
38.6
27.8
0
50
100
150
200
250
Heart disease Hypertension Stroke Other CVD
Bill
ion
s o
f D
olla
rs
Chart 23-1. Direct and indirect costs of cardiovascular disease (CVD) and stroke (in billions of dollars), United States, 2009. Source: Prepared by the National Heart, Lung, and Blood Institute.1,3
16.2
17.6
18.4
18.8
18.8
19.9
20.4
24.2
27.2
34.6
35.0
38.6
45.9
47.4
53.7
57.0
72.1
72.2
74.3
95.6
0 20 40 60 80 100 120
Infectious diseases
Other circulatory
Residual codes
Systemic lupus/connective tissue disorders
Stroke
Kidney disease
Other central nervous system disorders
Skin disorders
Disorders of the upper GI
Normal live births
Back problems
Hyperlipidemia
Diabetes mellitus
Hypertension
COPD, asthma
Osteoarthritis
Mental disorders
Cancer
Trauma-related disorders
Heart conditions
Billions of Dollars
Chart 23-2. The 20 leading diagnoses for direct health expenditures, United States, 2008 (in billions of dollars). COPD indicates chronic obstructive pulmonary disease; GI, gastrointestinal. Source: National Heart, Lung, and Blood Institute; estimates are from the Medical Expenditure Panel Survey, Agency for Healthcare Research and Quality, and exclude nursing home costs.
by guest on December 16, 2013http://circ.ahajournals.org/Downloaded from

Heart Disease and Stroke Statistics—2013 Update: Chapter 23 e237
358.0
91.4
46.832.4 38.0
149.2 170.4
470.3
119.1
61.442.9 51.3
195.6222.5
621.6
155.0
81.157.5 70.0
258.0
293.6
818.1
200.3
106.477.7 95.6
338.2
389.0
0
100
200
300
400
500
600
700
800
900
All CVD HBP CHD CHF Stroke Other CVDs HBP as RiskFactor
Tota
l Dol
lars
(in
Bill
ions
)
2015 2020 2025 2030
Chart 23-3. Projected total costs of cardiovascular disease (CVD), 2015–2030 (2010 $ in billions) in the United States. HBP indicates high blood pressure; CHD, coronary heart disease; and CHF, congestive heart failure. Unpublished data tabulated by the American Heart Association using methods described in Heidenreich et al7.
$0
$100
$200
$300
$400
$500
$600
$700
$800
$900
2010 2012 2014 2016 2018 2020 2022 2024 2026 2028 2030
To
tal D
olla
rs (
in b
illio
ns)
Total 18-44 Years 45-64 Years 65 - 79 Years 80 + Years
Chart 23-4. Projected total (direct and indirect) costs of total cardiovascular disease by age (2010 $ in billions). Unpublished data tabu-lated by the American Heart Association using methods described in Heidenreich et al7.
by guest on December 16, 2013http://circ.ahajournals.org/Downloaded from

e238 Circulation January 1/8, 2013
24. At-a-Glance Summary Tables
See Tables 24-1 through 24-4.
Sources: See the following summary tables and charts for complete details:
●● Smoking—Table 3-1●● Physical activity —Table 4-1●● Overweight/obesity—Table 6-1; Chart 6-1
●● Blood cholesterol—Table 8-1●● High blood pressure—Table 9-1●● Diabetes mellitus—Table 10-1●● Total cardiovascular diseases—Table 13-1●● Stroke—Table 14-1●● Congenital heart defects—Table 15-1●● Coronary heart disease—Table 18-1●● Heart failure—Table 19-1
by guest on December 16, 2013http://circ.ahajournals.org/Downloaded from

Heart Disease and Stroke Statistics—2013 Update: Chapter 24 e239
Table 24-1. Males and CVD: At-a-Glance Table
Diseases and Risk Factors Both Sexes Total Males White Males Black MalesMexican
American Males
Smoking
Prevalence, 2011* 43.8 M (19.0%) 24.1 M (21.3%) 22.8% 23.3% 16.2%†
PA‡
Prevalence, 2011* 21.0% 24.9% 26.2% 25.9% 19.0%†
Overweight and obesity
Prevalence, 2010
Overweight and obesity, BMI >25.0 kg/m2§ 154.7 M (68.2%) 79.9 M (72.9%) 73.1% 68.7% 81.3%
Obesity, BMI >30.0 kg/m2§ 78.4 M (34.6%) 36.8 M (33.6%) 33.8% 37.9% 36.0%
Blood cholesterol
Prevalence, 2010
Total cholesterol >200 mg/dL§ 98.9 M (43.4%) 45.3 M (41.3%) 40.5% 38.6% 48.1%
Total cholesterol >240 mg/dL§ 31.9 M (13.8%) 14.0 M (12.7%) 12.3% 10.8% 15.2%
LDL cholesterol >130 mg/dL§ 71.0 M (31.1%) 35.2 M (31.9%) 30.1% 33.1% 39.9%
HDL cholesterol <40 mg/dL§ 48.7 M (21.8%) 34.6 M (31.8%) 33.1% 20.3% 34.2%
HBP
Prevalence, 2010§ 77.9 M (33.0%) 37.2 M (33.6%) 33.4% 42.6% 30.1%
Mortality, 2009|| 61 762 27 668 20 286 6574 N/A
DM
Prevalence, 2010
Physician-diagnosed DM§ 19.7 M (8.3%) 9.6 M (8.7%) 7.7% 13.5% 11.4%
Undiagnosed DM§ 8.2 M (3.5%) 5.3 M (4.7%) 4.5% 4.8% 6.6%
Prediabetes§ 87.3 M (38.2%) 50.7 M (46.0%) 47.7% 35.7% 47.0%
Incidence, diagnosed DM§ 1.9 M N/A N/A N/A N/A
Mortality, 2009|| 68 705 35 054 28 205 5488 N/A
Total CVD
Prevalence, 2010§ 83.6 M (35.3%) 40.7 M (36.7%) 36.6% 44.4% 33.4%
Mortality, 2009|| 787 931 386 436 329 565 46 334 N/A
Stroke
Prevalence, 2010§ 6.8 M (2.8%) 3.0 M (2.6%) 2.4% 4.3% 2.3%
New and recurrent strokes|| 795.0 K 370.0 K 325.0 K 45.0 K N/A
Mortality, 2009|| 128 842 52 073 43 190 6962 N/A
CHD
Prevalence, CHD, 2010§ 15.4 M (6.4%) 8.8 M (7.9%) 8.2% 6.8% 6.7%
Prevalence, MI, 2010§ 7.6 M (2.9%) 5.0 M (4.2%) 4.4% 3.9% 3.6%
Prevalence, AP, 2010§ 7.8 M (3.2%) 3.7 M (3.3%) 3.3% 2.4% 3.4%
New and recurrent CHD¶# 915.0 K 535.0 K 465.0 K 65.0 K N/A
New and recurrent MI# 715.0 K 410.0 K N/A N/A N/A
Incidence, AP (stable angina)** 500.0 K 320.0 K N/A N/A N/A
Mortality, 2009, CHD|| 386 324 210 069 183 453 21 051 N/A
Mortality, 2009, MI|| 125 464 68 814 60 316 6717 N/A
HF
Prevalence, 2010§ 5.1 M (2.1%) 2.7 M (2.5%) 2.5% 4.1% 1.9%
Mortality, 2009|| 56 410 23 563 20 815 2341 N/A
CVD indicates cardiovascular disease; M, millions; PA, physical activity; LDL, low-density lipoprotein; HDL, high-density lipoprotein; BMI, body mass index; HBP, high blood pressure; N/A, data not available; DM, diabetes mellitus; K, thousands; CHD, coronary heart disease (includes heart attack, angina pectoris chest pain, or both); MI, myocardial infarction (heart attack); AP, angina pectoris (chest pain); and HF, heart failure.
*Age ≥18 years (National Health Interview Survey).†All Hispanic (National Health Interview Survey).‡Met 2008 full Federal PA guidelines for adults.§Age >20 years.||All ages.¶New and recurrent MI and fatal CHD.#Age ≥35 years.**Age ≥45 years.
by guest on December 16, 2013http://circ.ahajournals.org/Downloaded from
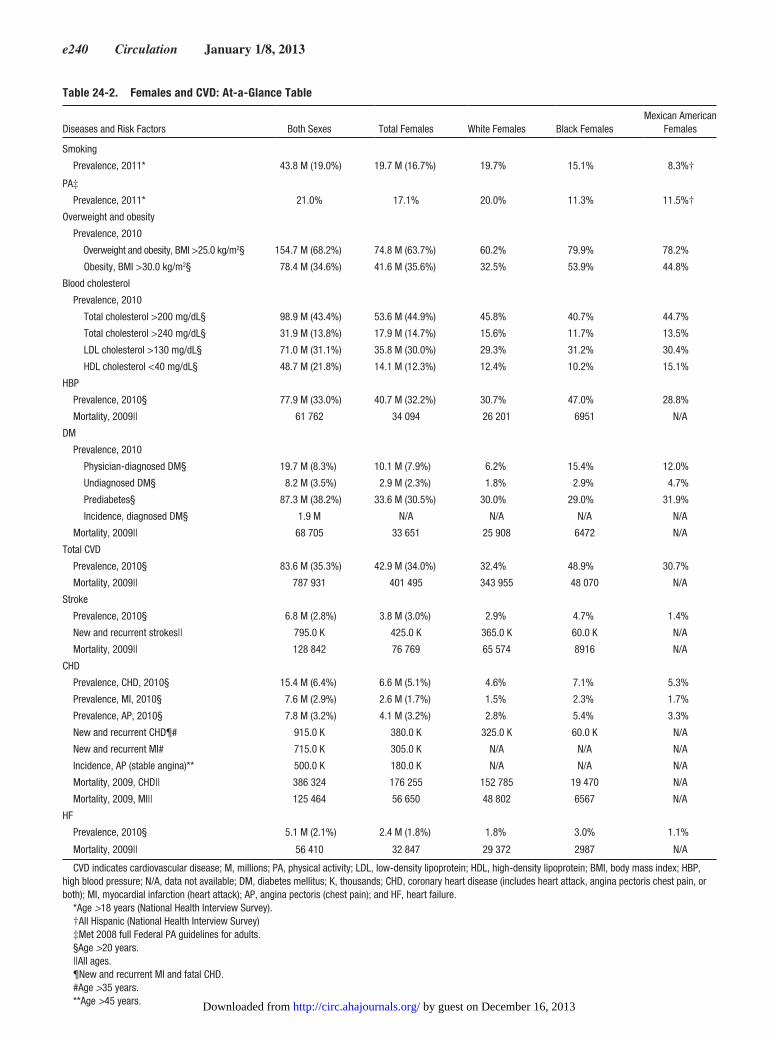
e240 Circulation January 1/8, 2013
Table 24-2. Females and CVD: At-a-Glance Table
Diseases and Risk Factors Both Sexes Total Females White Females Black FemalesMexican American
Females
Smoking
Prevalence, 2011* 43.8 M (19.0%) 19.7 M (16.7%) 19.7% 15.1% 8.3%†
PA‡
Prevalence, 2011* 21.0% 17.1% 20.0% 11.3% 11.5%†
Overweight and obesity
Prevalence, 2010
Overweight and obesity, BMI >25.0 kg/m2§ 154.7 M (68.2%) 74.8 M (63.7%) 60.2% 79.9% 78.2%
Obesity, BMI >30.0 kg/m2§ 78.4 M (34.6%) 41.6 M (35.6%) 32.5% 53.9% 44.8%
Blood cholesterol
Prevalence, 2010
Total cholesterol >200 mg/dL§ 98.9 M (43.4%) 53.6 M (44.9%) 45.8% 40.7% 44.7%
Total cholesterol >240 mg/dL§ 31.9 M (13.8%) 17.9 M (14.7%) 15.6% 11.7% 13.5%
LDL cholesterol >130 mg/dL§ 71.0 M (31.1%) 35.8 M (30.0%) 29.3% 31.2% 30.4%
HDL cholesterol <40 mg/dL§ 48.7 M (21.8%) 14.1 M (12.3%) 12.4% 10.2% 15.1%
HBP
Prevalence, 2010§ 77.9 M (33.0%) 40.7 M (32.2%) 30.7% 47.0% 28.8%
Mortality, 2009|| 61 762 34 094 26 201 6951 N/A
DM
Prevalence, 2010
Physician-diagnosed DM§ 19.7 M (8.3%) 10.1 M (7.9%) 6.2% 15.4% 12.0%
Undiagnosed DM§ 8.2 M (3.5%) 2.9 M (2.3%) 1.8% 2.9% 4.7%
Prediabetes§ 87.3 M (38.2%) 33.6 M (30.5%) 30.0% 29.0% 31.9%
Incidence, diagnosed DM§ 1.9 M N/A N/A N/A N/A
Mortality, 2009|| 68 705 33 651 25 908 6472 N/A
Total CVD
Prevalence, 2010§ 83.6 M (35.3%) 42.9 M (34.0%) 32.4% 48.9% 30.7%
Mortality, 2009|| 787 931 401 495 343 955 48 070 N/A
Stroke
Prevalence, 2010§ 6.8 M (2.8%) 3.8 M (3.0%) 2.9% 4.7% 1.4%
New and recurrent strokes|| 795.0 K 425.0 K 365.0 K 60.0 K N/A
Mortality, 2009|| 128 842 76 769 65 574 8916 N/A
CHD
Prevalence, CHD, 2010§ 15.4 M (6.4%) 6.6 M (5.1%) 4.6% 7.1% 5.3%
Prevalence, MI, 2010§ 7.6 M (2.9%) 2.6 M (1.7%) 1.5% 2.3% 1.7%
Prevalence, AP, 2010§ 7.8 M (3.2%) 4.1 M (3.2%) 2.8% 5.4% 3.3%
New and recurrent CHD¶# 915.0 K 380.0 K 325.0 K 60.0 K N/A
New and recurrent MI# 715.0 K 305.0 K N/A N/A N/A
Incidence, AP (stable angina)** 500.0 K 180.0 K N/A N/A N/A
Mortality, 2009, CHD|| 386 324 176 255 152 785 19 470 N/A
Mortality, 2009, MI|| 125 464 56 650 48 802 6567 N/A
HF
Prevalence, 2010§ 5.1 M (2.1%) 2.4 M (1.8%) 1.8% 3.0% 1.1%
Mortality, 2009|| 56 410 32 847 29 372 2987 N/A
CVD indicates cardiovascular disease; M, millions; PA, physical activity; LDL, low-density lipoprotein; HDL, high-density lipoprotein; BMI, body mass index; HBP, high blood pressure; N/A, data not available; DM, diabetes mellitus; K, thousands; CHD, coronary heart disease (includes heart attack, angina pectoris chest pain, or both); MI, myocardial infarction (heart attack); AP, angina pectoris (chest pain); and HF, heart failure.
*Age >18 years (National Health Interview Survey).†All Hispanic (National Health Interview Survey)‡Met 2008 full Federal PA guidelines for adults.§Age >20 years.||All ages.¶New and recurrent MI and fatal CHD.#Age >35 years.**Age >45 years. by guest on December 16, 2013http://circ.ahajournals.org/Downloaded from

Heart Disease and Stroke Statistics—2013 Update: Chapter 24 e241
Table 24-3. Race/Ethnicity and CVD: At-a-Glance Table
Diseases and Risk FactorsBoth
Sexes
Whites BlacksMexican
AmericansHispanics/
LatinosAsians:
Both Sexes
American Indian/Alaska Native:
Both SexesMales Females Males Females Males Females Males Females
Smoking
Prevalence, 2011* 43.8 M (19.0%) 22.8% 19.7% 23.3% 15.1% 12.3% 16.2% 8.3% 9.6% 26.7%
PA†
Prevalence, 2011* 21.0% 21.7% 17.8% 15.4% 15.4% 16.7% 17.0%
Overweight and obesity
Prevalence, 2010
Overweight and obesity, BMI >25.0 kg/m2‡
154.7 M (68.2%) 73.1% 60.2% 68.7% 79.9% 81.3% 78.2% N/A N/A N/A N/A
Overweight and obesity, BMI >30.0 kg/m2‡
78.4 M (34.6%) 33.8% 32.5% 37.9% 53.9% 36.0% 44.8% N/A N/A N/A N/A
Blood cholesterol
Prevalence, 2010
Total cholesterol >200 mg/dL‡ 98.9 M (43.4%) 40.5% 45.8% 38.6% 40.7% 48.1% 44.7% N/A N/A N/A N/A
Total cholesterol >240 mg/dL‡ 31.9 M (13.8%) 12.3% 15.6% 10.8% 11.7% 15.2% 13.5% N/A N/A N/A N/A
LDL cholesterol >130 mg/dL‡ 71.0 M (31.1%) 30.1% 29.3% 33.1% 31.2% 39.9% 30.4% N/A N/A N/A N/A
HDL cholesterol <40 mg/dL‡ 48.7 M (21.8%) 33.1% 12.4% 20.3% 10.2% 34.2% 15.1% N/A N/A N/A N/A
HBP
Prevalence, 2010‡ 77.9 M (33.0%) 33.4% 30.7% 42.6% 47.0% 30.1% 28.8% 22.2%* 18.7* 25.8%*
Mortality, 2009§ 61 762 20 286 26 201 6574 6951 N/A N/A N/A N/A N/A N/A
DM
Prevalence, 2010
Physician-diagnosed DM‡ 19.7 M (8.3%) 7.7% 6.2% 13.5% 15.4% 11.4% 12.0% N/A N/A N/A N/A
Undiagnosed DM‡ 8.2 M (3.5%) 4.5% 1.8% 4.8% 2.9% 6.6% 4.7% N/A N/A N/A N/A
Prediabetes‡ 87.3 M (38.2%) 47.7% 30.0% 35.7% 29.0% 47.0% 31.9% N/A N/A N/A N/A
Incidence, diagnosed DM‡ 1.9 M N/A N/A N/A N/A N/A N/A N/A N/A N/A N/A
Mortality, 2009§ 68 705 28 205 25 908 5488 6472 N/A N/A N/A N/A N/A N/A
Total CVD
Prevalence, 2010‡ 83.6 M (35.3%) 36.6% 32.4% 44.4% 48.9% 33.4% 30.7% N/A N/A N/A N/A
Mortality, 2009§ 787 931 329 565 343 955 46 334 48 070 N/A N/A N/A N/A N/A N/A
Stroke
Prevalence, 2010‡ 6.8 M (2.8%) 2.4% 2.9% 4.3% 4.7% 2.3% 1.4% 2.8%* 2.7%* 4.6%||
New and recurrent strokes§ 795.0 K 325.0 K 365.0 K 45.0 K 60.0 K N/A N/A N/A N/A N/A N/A
Mortality, 2009§ 128 842 43 190 65 574 6962 8916 N/A N/A N/A N/A N/A N/A
CHD
Prevalence, CHD, 2010‡ 15.4 M (6.4%) 8.2% 4.6% 6.8% 7.1% 6.7% 5.3% N/A N/A N/A N/A
Prevalence, MI, 2010‡ 7.6 M (2.9%) 4.4% 1.5% 3.9% 2.3% 3.6% 1.7% N/A N/A N/A N/A
Prevalence, AP, 2010‡ 7.8 M (3.2%) 3.3% 2.8% 2.4% 5.4% 3.4% 3.3% N/A N/A N/A N/A
New and recurrent CHD¶# 915.0 K 465.0 K 325.0 K 65.0 K 60.0 K N/A N/A N/A N/A N/A N/A
Mortality, CHD, 2009§ 386 324 183 453 152 785 21 051 19 470 N/A N/A N/A N/A N/A N/A
Mortality, MI, 2009§ 125 464 60 316 48 802 6717 6567 N/A N/A N/A N/A N/A N/A
HF
Prevalence, 2010‡ 5.1 M (2.1%) 2.5% 1.8% 4.1% 3.0% 1.9% 1.1% N/A N/A N/A N/A
Mortality, 2009§ 56 410 20 815 29 372 2341 2987 N/A N/A N/A N/A N/A N/A
CVD indicates cardiovascular disease; M, millions; PA, physical activity; N/A, data not available; LDL, low-density lipoprotein; HDL, high-density lipoprotein; BMI, body mass index; HBP, high blood pressure; DM, diabetes mellitus; K, thousands; CHD, coronary heart disease (includes heart attack, angina pectoris chest pain, or both); MI, myocardial infarction (heart attack); AP, angina pectoris (chest pain); and HF, heart failure.
*Age >18 years (National Health Interview Survey).†Met 2008 full Federal PA guidelines for adults.‡Age >20 years.§All ages.||Figure not considered reliable.¶New and recurrent MI and fatal CHD.#Age >35 years.
by guest on December 16, 2013http://circ.ahajournals.org/Downloaded from

e242 Circulation January 1/8, 2013
Table 24-4. Children, Youth, and CVD: At-a-Glance Table
NH Whites NH BlacksMexican
Americans
Diseases and Risk Factors Both Sexes Total Males Total Females Males Females Males Females Males Females
Smoking, %
High school students, grades 9–12
Current cigarette smoking, 2011 18.1 19.9 16.1 21.5 18.9 13.7 7.4 19.5* 15.2*
Current cigar smoking, 2011 13.1 17.8 8.0 19.0 7.5 15.1 8.5 17.2* 9.1*
PA†
Prevalence, grades 9–12, 2011‡
Met currently recommended levels of PA, % 49.5 59.9 38.5 62.1 42.6 57.1 31.9 57.1* 33.0*
Overweight and obesity
Prevalence, 2010
Children and adolescents, ages 2–19 y, overweight or obese
23.9 M (31.8%) 12.7 M (33.0%) 11.2 M (30.4%) 30.1% 25.6% 36.9% 41.3% 40.5% 38.2%
Children and adolescents, age 2–19 y, obese‡
12.7 M (16.9%) 7.2 M (18.6%) 5.5 M (15.0%) 16.1% 11.7% 24.3% 24.3% 24.0% 18.2%
Blood cholesterol, mg/dL, 2010
Mean total cholesterol
Ages 4–11 y 161.9 162.3 161.5 160.9 161.6 165.2 157.9 159.6 160.7
Ages 12–19 y 158.2 156.1 160.3 156.8 161.1 154.1 160.6 157.8 158.0
Mean HDL cholesterol
Ages 4–11 y 53.6 55.1 51.9 53.9 51.4 59.9 55.3 53.5 50.5
Ages 12–19 y 51.4 49.2 53.6 48.4 53.0 53.9 55.4 47.5 53.3
Mean LDL cholesterol
Ages 12–19 y 89.5 88.6 90.5 90.4 90.9 85.8 91.8 90.6 87.1
Congenital cardiovascular defects
Mortality, 2009§ 3189 1754 1435 1370 1086 304 268 N/A N/A
CVD indicates cardiovascular disease; NH, non-Hispanic; PA, physical activity; HDL, high-density lipoprotein; LDL, low-density lipoprotein; M, millions; and N/A, data not available. Overweight indicates a body mass index in the 95th percentile of the Centers for Disease Control and Prevention 2000 growth chart.
*Hispanic.†Regular leisure-time PA.‡Eaton DK, Kann L, Kinchen S, Shanklin S, Flint KH, Hawkins J, Harris WA, Lowry R, McManus T, Chyen D, Whittle L, Lim C, Wechsler H; Centers for Disease Con-
trol and Prevention. Youth risk behavior surveillance: United States, 2011. MMWR Surveill Summ. 2012;61:1–162.§All ages.
by guest on December 16, 2013http://circ.ahajournals.org/Downloaded from
Heart Disease and Stroke Statistics—2013 Update: Chapter 25 e243
25. Glossary
●● Age-adjusted rates—Used mainly to compare the rates of ≥2 communities or population groups or the nation as a whole over time . The American Heart Association (AHA) uses a standard population (2000), so these rates are not affected by changes or differences in the age composition of the population . Unless otherwise noted, all death rates in this publication are age adjusted per 100 000 population and are based on underlying cause of death .
●● Agency for Healthcare Research and Quality—A part of the US Department of Health and Human Services, this is the lead agency charged with supporting research designed to improve the quality of health care, reduce the cost of health care, improve patient safety, decrease the number of medical errors, and broaden access to essential services . The Agency for Healthcare Research and Quality sponsors and conducts research that provides evidence-based information on health-care outcomes, quality, cost, use, and access . The information helps healthcare decision makers (patients, clinicians, health system leaders, and policy makers) make more informed decisions and improve the quality of healthcare services . The Agency for Healthcare Research and Quality conducts the Medical Expenditure Panel Survey (MEPS; ongoing) .
●● Bacterial endocarditis—An infection of the heart’s inner lining (endocardium) or of the heart valves . The bacteria that most often cause endocarditis are streptococci, staphy-lococci, and enterococci .
●● Body mass index (BMI)—A mathematical formula to assess body weight relative to height . The measure corre-lates highly with body fat . It is calculated as weight in kilo-grams divided by the square of the height in meters (kg/m2) .
●● Centers for Disease Control and Prevention/National Cen-ter for Health Statistics (CDC/NCHS)—CDC is an agency within the US Department of Health and Human Services . The CDC conducts the Behavioral Risk Factor Surveillance System (BRFSS), an ongoing survey . The CDC/NCHS conducts or has conducted these surveys (among others):
— National Health Examination Survey (NHES I, 1960–1962; NHES II, 1963–1965; NHES III, 1966–1970)
— National Health and Nutrition Examination Survey I (NHANES I; 1971–1975)
— National Health and Nutrition Examination Survey II (NHANES II; 1976–1980)
— National Health and Nutrition Examination Survey III (NHANES III; 1988–1994)
— National Health and Nutrition Examination Survey (NHANES; 1999 to …) (ongoing)
— National Health Interview Survey (NHIS) (ongoing)— National Hospital Discharge Survey (NHDS)
(1965–2010)— National Ambulatory Medical Care Survey (NAMCS)
(ongoing)— National Hospital Ambulatory Medical Care Survey
(NHAMCS) (ongoing)— National Nursing Home Survey (periodic)— National Home and Hospice Care Survey (periodic)
●● Centers for Medicare & Medicaid Services, formerly Health Care Financing Administration—The federal
agency that administers the Medicare, Medicaid, and Child Health Insurance programs .
●● Comparability ratio—Provided by the NCHS to allow time-trend analysis from one International Classification of Diseases (ICD) revision to another . It compensates for the “shifting” of deaths from one causal code number to another . Its application to mortality based on one ICD revi-sion means that mortality is “comparability modified” to be more comparable to mortality coded to the other ICD revision .
●● Coronary heart disease (CHD) (ICD-10 codes I20–I25)—This category includes acute myocardial infarction (I21–I22), other acute ischemic (coronary) heart disease (I24), angina pectoris (I20), atherosclerotic cardiovascular dis-ease (I25 .0), and all other forms of chronic ischemic CHD (I25 .1–I25 .9) .
●● Death rate—The relative frequency with which death occurs within some specified interval of time in a popula-tion . National death rates are computed per 100 000 pop-ulation . Dividing the total number of deaths by the total population gives a crude death rate for the total population . Rates calculated within specific subgroups, such as age-specific or sex-specific rates, are often more meaningful and informative . They allow well-defined subgroups of the total population to be examined . Unless otherwise stated, all death rates in this publication are age adjusted and are per 100 000 population .
●● Diseases of the circulatory system (ICD codes I00-I99)—Included as part of what the AHA calls “cardiovascular disease .” (“Total cardiovascular disease” in this Glossary .)
●● Diseases of the heart—Classification the NCHS uses in compiling the leading causes of death . Includes acute rheu-matic fever/chronic rheumatic heart diseases (I00–I09), hypertensive heart disease (I11), hypertensive heart and renal disease (I13), CHD (I20-I25), pulmonary heart dis-ease and diseases of pulmonary circulation (I26–I28), heart failure (I50), and other forms of heart disease (I29–I49, I50 .1–I51) . “Diseases of the heart” are not equivalent to “total cardiovascular disease,” which the AHA prefers to use to describe the leading causes of death .
●● Health Care Financing Administration—See Centers for Medicare & Medicaid Services .
●● Hispanic origin—In US government statistics, “Hispanic” includes people who trace their ancestry to Mexico, Puerto Rico, Cuba, Spain, the Spanish-speaking countries of Cen-tral or South America, the Dominican Republic, or other Spanish cultures, regardless of race . It does not include people from Brazil, Guyana, Suriname, Trinidad, Belize, or Portugal, because Spanish is not the first language in those countries . Most of the data in this update are for Mexican Americans or Mexicans, as reported by government agen-cies or specific studies . In many cases, data for all Hispan-ics are more difficult to obtain .
●● Hospital discharges—The number of inpatients (including newborn infants) discharged from short-stay hospitals for whom some type of disease was the first-listed diagnosis . Discharges include those discharged alive, dead, or “status unknown .”
●● International Classification of Diseases (ICD) codes—A classification system in standard use in the United States . The International Classification of Diseases is published by the World Health Organization . This system is reviewed
by guest on December 16, 2013http://circ.ahajournals.org/Downloaded from

e244 Circulation January 1/8, 2013
and revised approximately every 10 to 20 years to ensure its continued flexibility and feasibility . The 10th revision (ICD-10) began with the release of 1999 final mortality data . The ICD revisions can cause considerable change in the number of deaths reported for a given disease . The NCHS provides “comparability ratios” to compensate for the “shifting” of deaths from one ICD code to another . To compare the number or rate of deaths with that of an earlier year, the “comparability-modified” number or rate is used .
●● Incidence—An estimate of the number of new cases of a disease that develop in a population, usually in a 1-year period . For some statistics, new and recurrent attacks, or cases, are combined . The incidence of a specific disease is estimated by multiplying the incidence rates reported in community- or hospital-based studies by the US popula-tion . The rates in this report change only when new data are available; they are not computed annually .
●● Major cardiovascular diseases—Disease classification commonly reported by the NCHS; represents ICD codes I00 to I78 . The AHA does not use “major cardiovascular diseases” for any calculations . See “Total cardiovascular disease” in this Glossary .
●● Metabolic syndrome—The metabolic syndrome is defined* as the presence of any 3 of the following 5 diagnostic mea-sures: Elevated waist circumference (≥102 cm in men or ≥88 cm in women), elevated triglycerides (≥150 mg/dL [1 .7 mmol/L] or drug treatment for elevated triglycerides), reduced high-density lipoprotein (HDL) cholesterol (<40 mg/dL [0 .9 mmol/L] in men, <50 mg/dL [1 .1 mmol/L] in women, or drug treatment for reduced HDL cholesterol), elevated blood pressure (≥130 mm Hg systolic blood pres-sure, ≥85 mm Hg diastolic blood pressure, or drug treat-ment for hypertension), and elevated fasting glucose (≥100 mg/dL or drug treatment for elevated glucose) .
●● Morbidity—Incidence and prevalence rates are both mea-sures of morbidity (ie, measures of various effects of dis-ease on a population) .
●● Mortality—Mortality data for states can be obtained from the NCHS Web site (http://cdc .gov/nchs/), by direct com-munication with the CDC/NCHS, or from the AHA on request . The total number of deaths attributable to a given disease in a population during a specific interval of time, usually a year, are reported . These data are compiled from death certificates and sent by state health agencies to the NCHS . The process of verifying and tabulating the data takes ≈2 years .
●● National Heart, Lung, and Blood Institute (NHLBI)—An institute in the National Institutes of Health in the US Department of Health and Human Services . The NHLBI conducts such studies as the following:
— Framingham Heart Study (FHS; 1948 to …) (ongoing)— Honolulu Heart Program (HHP) (1965–1997)— Cardiovascular Health Study (CHS; 1988 to …)
(ongoing)— Atherosclerosis Risk in Communities (ARIC) study
(1985 to …) (ongoing)
— Strong Heart Study (SHS) (1989–1992, 1991–1998)● — The NHLBI also published reports of the Joint National
Committee on Prevention, Detection, Evaluation, and Treatment of High Blood Pressure and the Third Report of the Expert Panel on Detection, Evaluation, and Treat-ment of High Blood Cholesterol in Adults (Adult Treat-ment Panel III) .
●● National Institute of Neurological Disorders and Stroke (NINDS)—An institute in the National Institutes of Health of the US Department of Health and Human Services . The NINDS sponsors and conducts research studies such as these:
— Greater Cincinnati/Northern Kentucky Stroke Study (GCNKSS)
— Rochester (Minnesota) Stroke Epidemiology Project— Northern Manhattan Study (NOMAS)— Brain Attack Surveillance in Corpus Christi (BASIC)
Project
●● Physical activity—Any bodily movement produced by the contraction of skeletal muscle that increases energy expen-diture above a basal level .
●● Physical fitness—The ability to perform daily tasks with vigor and alertness, without undue fatigue, and with ample energy to enjoy leisure-time pursuits and respond to emer-gencies . Physical fitness includes a number of components consisting of cardiorespiratory endurance (aerobic power), skeletal muscle endurance, skeletal muscle strength, skel-etal muscle power, flexibility, balance, speed of movement, reaction time, and body composition .
●● Prevalence—An estimate of the total number of cases of a disease existing in a population during a specified period . Prevalence is sometimes expressed as a percentage of population . Rates for specific diseases are calculated from periodic health examination surveys that government agen-cies conduct . Annual changes in prevalence as reported in this statistical update reflect changes in the population size . Changes in rates can be evaluated only by comparing prev-alence rates estimated from surveys conducted in different years . Note: In the data tables, which are located in the dif-ferent disease and risk factor categories, if the percentages shown are age adjusted, they will not add to the total .
●● Race and Hispanic origin—Race and Hispanic origin are reported separately on death certificates . In this publica-tion, unless otherwise specified, deaths of people of His-panic origin are included in the totals for whites, blacks, American Indians or Alaska Natives, and Asian or Pacific Islanders according to the race listed on the decedent’s death certificate . Data for Hispanic people include all peo-ple of Hispanic origin of any race . See “Hispanic origin” in this Glossary .
●● Stroke (ICD-10 codes I60–I69)—This category includes subarachnoid hemorrhage (I60); intracerebral hemorrhage (I61); other nontraumatic intracranial hemorrhage (I62); cerebral infarction (I63); stroke, not specified as hemorrhage or infarction (I64); occlusion and stenosis of precerebral arteries not resulting in cerebral infarction (I65); occlusion and stenosis of cerebral arteries not resulting in cerebral infarction (I66); other cerebrovascular diseases (I67);
*According to criteria established by the American Heart Association/National Heart, Lung, and Blood Institute and published in Circulation (Circulation . 2005;112:2735–2752) .
by guest on December 16, 2013http://circ.ahajournals.org/Downloaded from

Heart Disease and Stroke Statistics—2013 Update: Chapter 25 e245
cerebrovascular disorders in diseases classified elsewhere (I68); and sequelae of cerebrovascular disease (I69) .
●● Total cardiovascular disease (ICD-10 codes I00–I99, Q20–Q28)—This category includes rheumatic fever/rheumatic heart disease (I00–I09); hypertensive diseases (I10–I15); ischemic (coronary) heart disease (I20–I25); pulmonary heart disease and diseases of pulmonary circulation (I26–I28); other forms of heart disease (I30–I52); cerebrovascu-lar disease (stroke) (I60–I69); atherosclerosis (I70); other diseases of arteries, arterioles, and capillaries (I71–I79); diseases of veins, lymphatics, and lymph nodes not clas-sified elsewhere (I80–I89); and other and unspecified
disorders of the circulatory system (I95–I99) . When data are available, we include congenital cardiovascular defects (Q20–Q28) .
●● Underlying cause of death or any-mention cause of death—These terms are used by the NCHS when defin-ing mortality . Underlying cause of death is defined by the World Health Organization as “the disease or injury which initiated the train of events leading directly to death, or the circumstances of the accident or violence which produced the fatal injury .” Contributing cause of death would be any other disease or condition that the decedent may also have had and that was reported on the death certificate .
by guest on December 16, 2013http://circ.ahajournals.org/Downloaded from

Correction
e841
In the article by Go et al, “Heart Disease and Stroke Statistics—2013 Update: A Report From the American Heart Association,” which published ahead of print on December 12, 2012, and appeared in the January 1/8, 2013, issue of the journal (Circulation. 2013;127:e6-e245), several corrections were needed.
1. On page e75, in the legend for Chart 8-1, the first sentence read “. . . (National Health and Nutrition Examination Survey: 1988–1994,*. . . .” It has been changed to read, “. . . (National Health and Nutrition Examination Survey: 1976–1980,* 1988–1994,*. . . .”
2. On page e119, In Table 13-3, in the row for “Korea, South (2009),” the “CHD Deaths” column reads, “41.0.” It should read, “13.3.”
3. On page e166, second column, first bullet, the second sentence read “. . . Resuscitation Outcomes Consortium Investigators, unpublished data, June 20, 2011). . . .” It has been changed to read, “. . . . Resuscitation Outcomes Consortium Investigators, unpublished data, June 20, 2012). . . .”
These corrections have been made to the current online version of the article, which is available at http://circ.ahajournals.org/content/127/1/e6.
(Circulation. 2013;127:e841.)© 2013 American Heart Association, Inc.
Circulation is available at http://circ.ahajournals.org DOI: 10.1161/CIR.0b013e31829ae08c