
Stat Arb13030
36
Statistical Arbitrage, Enhanced Indexing and 130/30 Marco Avellaneda & Stanley J. Zhang Courant Institute, New York University Finance Concepts LLC
Transcript of Stat Arb13030

Statistical Arbitrage, Enhanced Indexing and 130/30
Marco Avellaneda &Stanley J. Zhang
Courant Institute, New York UniversityFinance Concepts LLC
Summary
-- Overview of Statistical Arbitrage as an investment strategy
-- Using ETFs as relative-value indicators
-- Mean-reversion & the Ornstein-Uhlenbeck process
-- Examples of trades
-- Portfolio construction: the PLATA fund
-- Synthetic 130/30 funds constructed from PLATA and Indices
-- Comparison of PLATA+SP with 130/30 Mutual Funds and a 130/30 ETF
-- Conclusions

Statistical Arbitrage
Trading strategy consisting of investing in long-short stocks (or another asset class) witha mean-reversion theme
-- Pairs trading: practiced since the 1990s, invented by Morgan Stanley’s prop team
-- ``Factor neutral’’ trading: generalizes pairs trading
-- ETF relative-value trading: the subject of this presentation
Idea: measure statistically a time-series of spread between two or more correlated stocks or indices and invest in overbought/undersold spreads.

Trading Universe:Stocks of more than 1BB cap
Sector ETF Num of StocksMarket Cap unit: 1M/usd
Average Max Min
Internet HHH 22 10,350 104,500 1,047
Real Estate IYR 87 4,789 47,030 1,059
Transportation IYT 46 4,575 49,910 1,089
Oil Exploration OIH 42 7,059 71,660 1,010
Regional Banks RKH 69 23,080 271,500 1,037
Retail RTH 60 13,290 198,200 1,022
Semiconductors SMH 55 7,303 117,300 1,033
Utilities UTH 75 7,320 41,890 1,049
Energy XLE 75 17,800 432,200 1,035
Financial XLF 210 9,960 187,600 1,000
Industrial XLI 141 10,770 391,400 1,034
Technology XLK 158 12,750 293,500 1,008
Consumer Staples XLP 61 17,730 204,500 1,016
Healthcare XLV 109 14,390 192,500 1,025
Consumer discretionary XLY 207 8,204 104,500 1,007
Total 1417 11,291 432,200 1,000 January, 2007
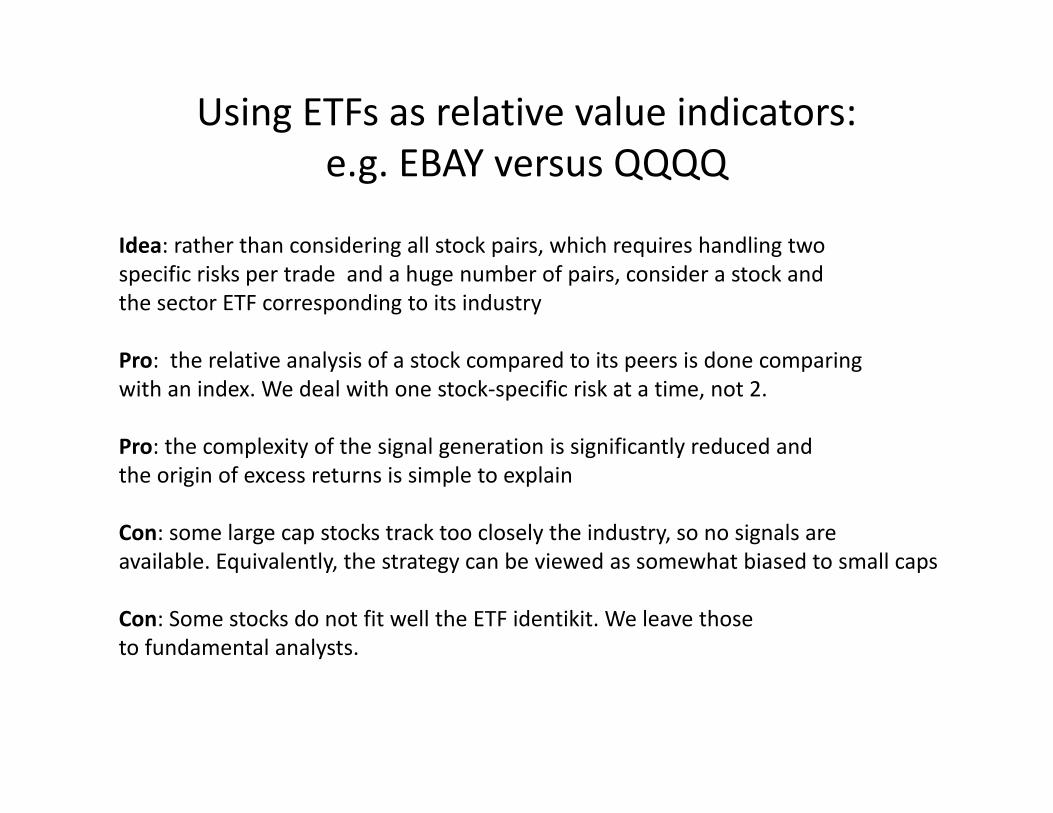
Using ETFs as relative value indicators:e.g. EBAY versus QQQQ
Idea: rather than considering all stock pairs, which requires handling two specific risks per trade and a huge number of pairs, consider a stock and the sector ETF corresponding to its industry
Pro: the relative analysis of a stock compared to its peers is done comparingwith an index. We deal with one stock-specific risk at a time, not 2.
Pro: the complexity of the signal generation is significantly reduced and the origin of excess returns is simple to explain
Con: some large cap stocks track too closely the industry, so no signals areavailable. Equivalently, the strategy can be viewed as somewhat biased to small caps
Con: Some stocks do not fit well the ETF identikit. We leave thoseto fundamental analysts.

( )( )
( )( ) ( )
( ) ( )
( ) ( )( ) ( )tdWdttXmtdX
tdXdtt
ttItdI
tStdS
iiiiii
iii
iii
i
σκ
αε
εβ
+−=
+=
+=
Modeling the Evolution of Stock Residuals
Statistical Estimation Window=3 months (~ 60 business days) toinclude at least one earnings announcement
Stock returns a sum of a multipleof an ETF return and a residual process
Residual= drift component (expectedexcess return above mkt.) + incrementof a stationary process
Ornstein-UlembeckAR-1 process

ETF Abs(Alpha) Beta Kappa Reversion days EquiVol Abs(m)HHH 0.20% 0.69 38 7 4% 3.3%IYR 0.11% 0.90 39 6 2% 1.8%IYT 0.18% 0.97 41 6 4% 3.0%
RKH 0.10% 0.98 39 6 2% 1.7%RTH 0.17% 1.02 39 6 3% 2.7%SMH 0.19% 1.01 40 6 4% 3.2%UTH 0.09% 0.81 42 6 2% 1.4%XLF 0.11% 0.83 42 6 2% 1.8%XLI 0.15% 1.15 42 6 3% 2.4%XLK 0.17% 1.03 42 6 3% 2.7%XLP 0.12% 1.01 42 6 2% 2.0%XLV 0.14% 1.05 38 7 3% 2.5%XLY 0.16% 1.03 39 6 3% 2.5%
Total 0.15% 0.96 40 6 3% 2.4%
Statistics on the Estimated OU Parameters
Average over 2006-2007

Trading Signals
We introduce an s-score for each stock:
( )ieq
iii
mtXts,
)(σ
−=
50.0 ifposition short Close50.0 ifposition long Close25.1 ifposition short Open 25.1 ifposition longOpen
+<−>+>−<
i
i
i
i
ssss
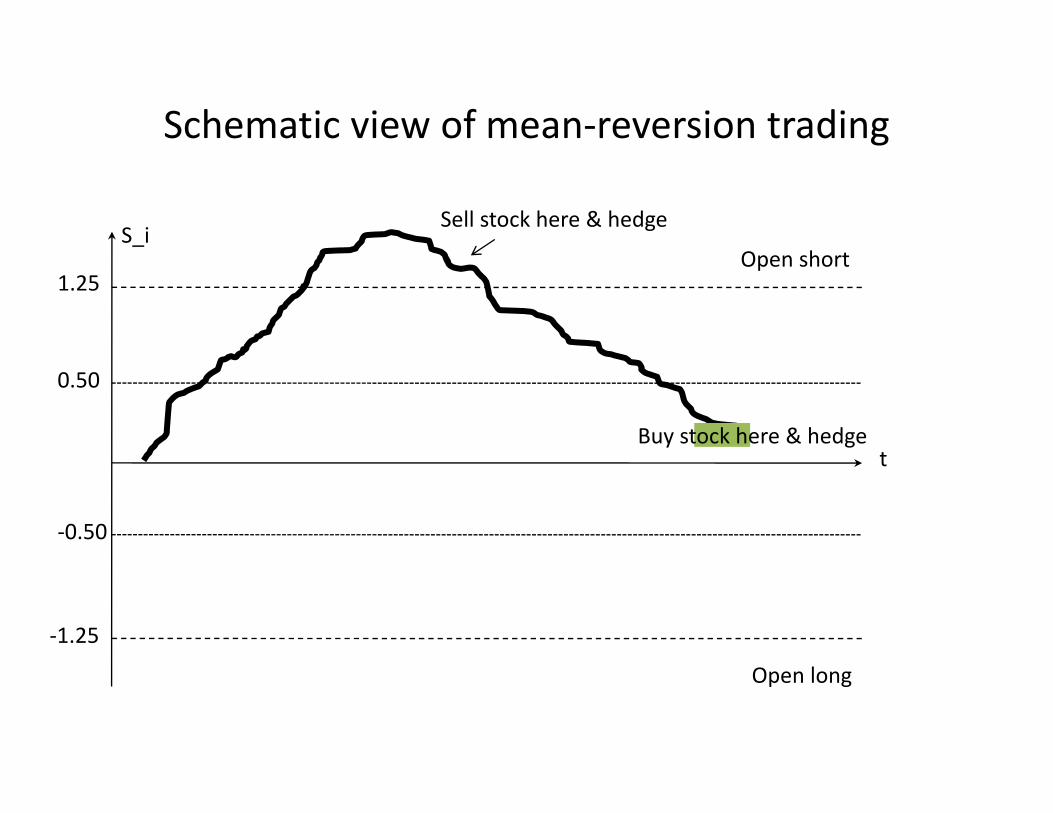
Schematic view of mean-reversion trading
Open short
Open long
S_i
1.25
-1.25
0.50
-0.50
Sell stock here & hedge
Buy stock here & hedget
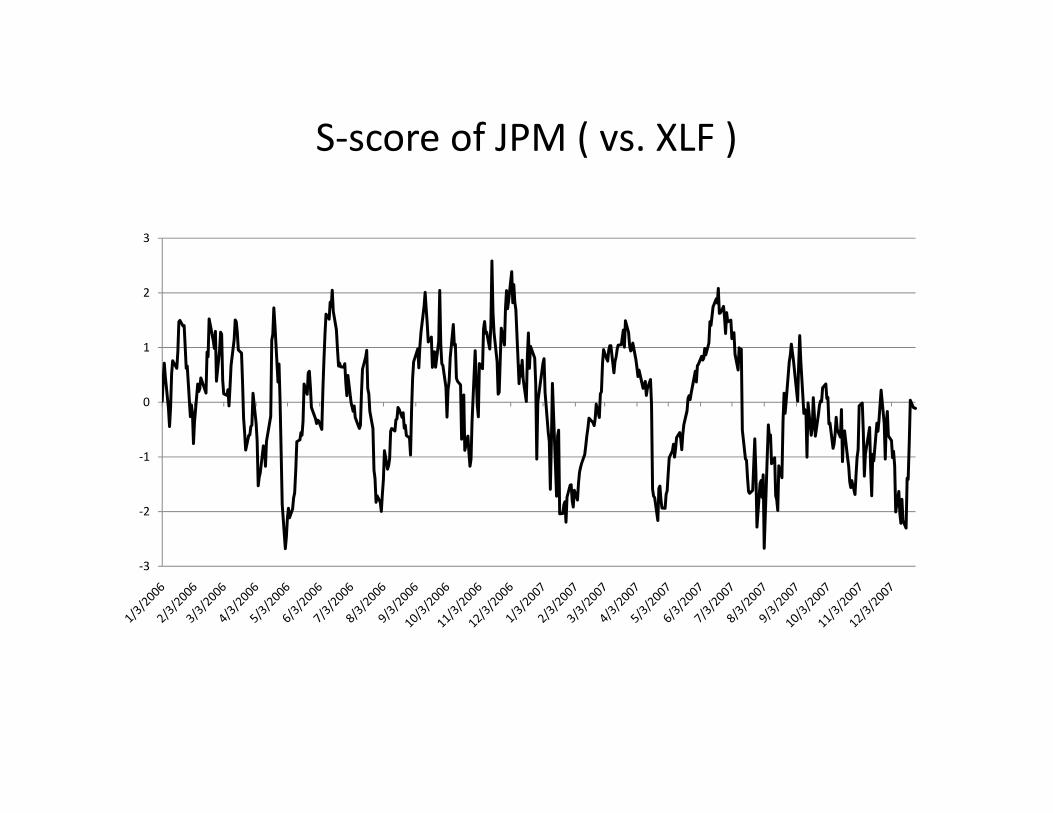
S-score of JPM ( vs. XLF )
-3
-2
-1
0
1
2
3

Stock-ETF real trading example : 6 trades in 2009
ticker trade_date close_date days stock_PNL etf_PNL Total_PNL etf_ticker size
EBAY 10/9/2009 11/9/2009 16 (3,884.70) (2,447.11) (6,331.81) QQQQ 82,152.96
EBAY 5/26/2009 6/8/2009 9 497.31 (5,278.60) (4,781.29) QQQQ 79,388.76
EBAY 5/13/2009 5/14/2009 0 2,973.75 (1,391.58) 1,582.17 QQQQ 79,023.75
EBAY 4/16/2009 4/20/2009 1 (1,981.80) 3,673.72 1,691.92 QQQQ 79,547.25
EBAY 9/23/2009 10/7/2009 9 1,304.16 1,409.00 2,713.16 QQQQ 82,127.76
EBAY 9/8/2009 9/10/2009 1 6,439.61 (2,043.87) 4,395.73 QQQQ 81,613.02
stock_cost stock_shares stock_exe_price etf_cost etf_shares etf_exe_price open_s_score close_s_score beta
24.32 3378 23.17 42.43 (2,562.42) 43.39 (2.24) (0.89) 0.756
17.56 4521 17.67 34.69 (2,559.32) 36.75 (1.84) (1.00) 0.894
16.21 4875 16.82 33.00 (2,676.12) 33.52 (1.53) (0.41) 0.895
14.45 5505 14.09 33.35 (3,251.08) 32.22 (1.27) (0.43) 0.734
23.93 3432 24.31 42.58 (2,471.93) 42.01 (2.35) 0.00 0.780
21.81 3742 23.53 40.62 (2,579.02) 41.41 (2.26) 0.13 0.779

A brief history of the EBAY/QQQQspread (Beta=0.75)

Trading Time vs. Actual Time
Statistics on equity returns (residuals) can be done
-- in actual time (% change/day)
-- in trading time ( % change per share/day)
Trading time incorporates volume information.
In trading-time framework, mean-reverting signals (S-Scores) are
-- weaker when volume is heavy
-- stronger when volume is light

Trading Time vs. Actual Time, II
( ) dWdtYmdY
Y
VVVV
II
SS
t
iit
σκ
ε
εε
βε
+−=
=
Δ>=Δ<=ΔΔ
>Δ<=
Δ−Δ=
∑=1
V averagemedaily volu ,
Using the daily trading volume, construct a residual process which measuresthe change in price per share
Estimate AR-1 / OU process forthe new process Y(t)
This makes deviations on unusually high-volume more likely, so the signal is weaker
(usual residual)
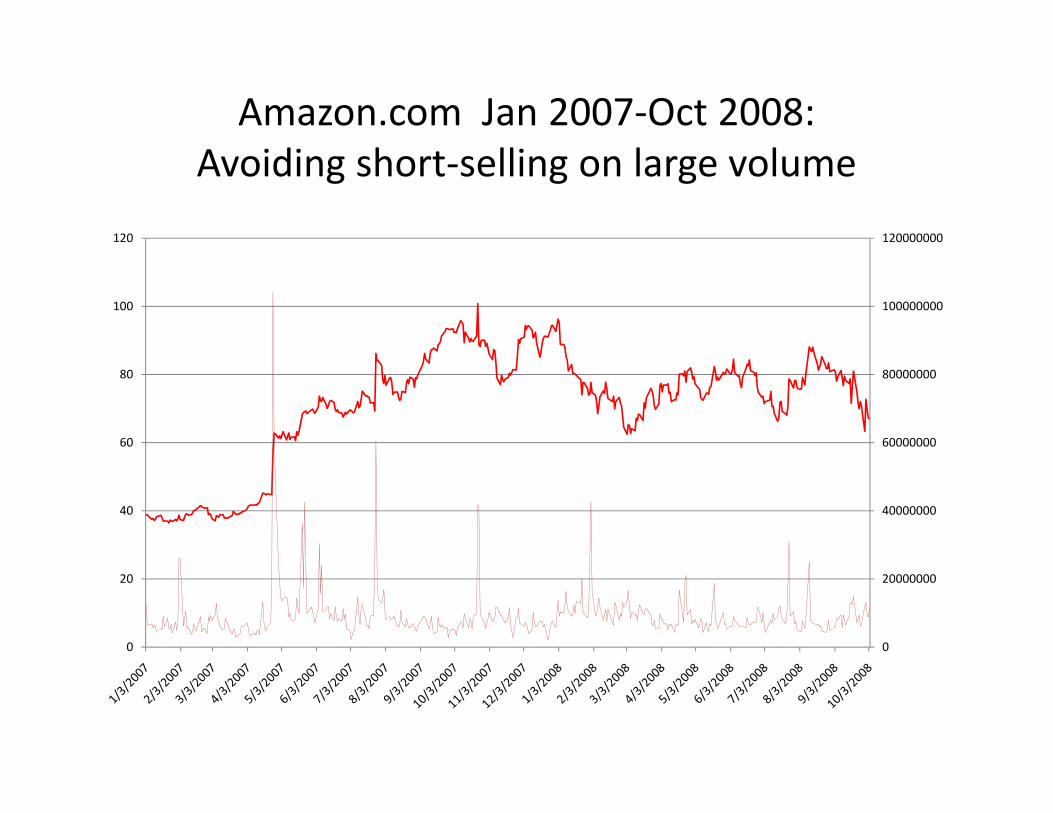
Amazon.com Jan 2007-Oct 2008:Avoiding short-selling on large volume
0
20000000
40000000
60000000
80000000
100000000
120000000
0
20
40
60
80
100
120

Building a portfolio from ETF-based signals: the PLATA strategy
-- Large, diversified trading universe of equities (~ 1400 names)
-- Select within the trading universe those stocks that have atrading signal (s-score) and open trades
-- All trades consist of stocks paired with ETFs
-- Monitor for closing trades through s-score
-- Monitor for degradation of statistical parameters, stop-losses, etc.
-- Investment per stock ~ 25 bps (~250K per 100MM notional capital)
-- Typical profile 30 to 50 % long / 30 to 50 % short, dollar-neutral.
-- Portfolio-level risk management used to ``vet’’ trades.
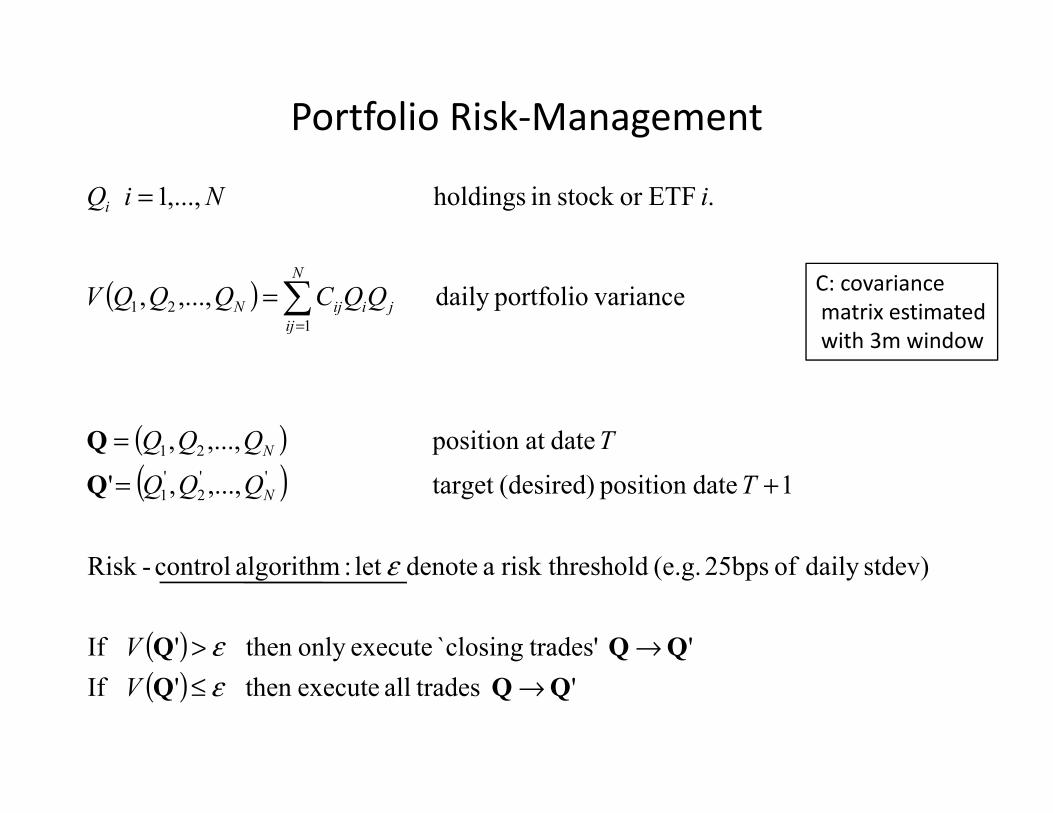
Portfolio Risk-Management
( )
( )( )
( )( ) ' tradesall execute then ' If
' trades'`closing executeonly then ' If
stdev)daily of 25bps (e.g. holdrisk thres a denote let :algorithm control-Risk
1 dateposition (desired) target ,...,,'
dateat position ,...,,
varianceportfoliodaily ,...,,
. ETFor stock in holdings ,...,1
''2
'1
21
121
QQQQQQ
→≤→>
+=
=
=
=
∑=
εε
ε
VV
TQQQ
TQQQ
QQCQQQV
iNiQ
N
N
ji
N
ijijN
i
C: covariancematrix estimatedwith 3m window

Long and Short positions for unmanaged portfolio( % of account equity )

Long/short balances with portfolio risk-management

Comparison between Long balances:managed & unmanaged simulations
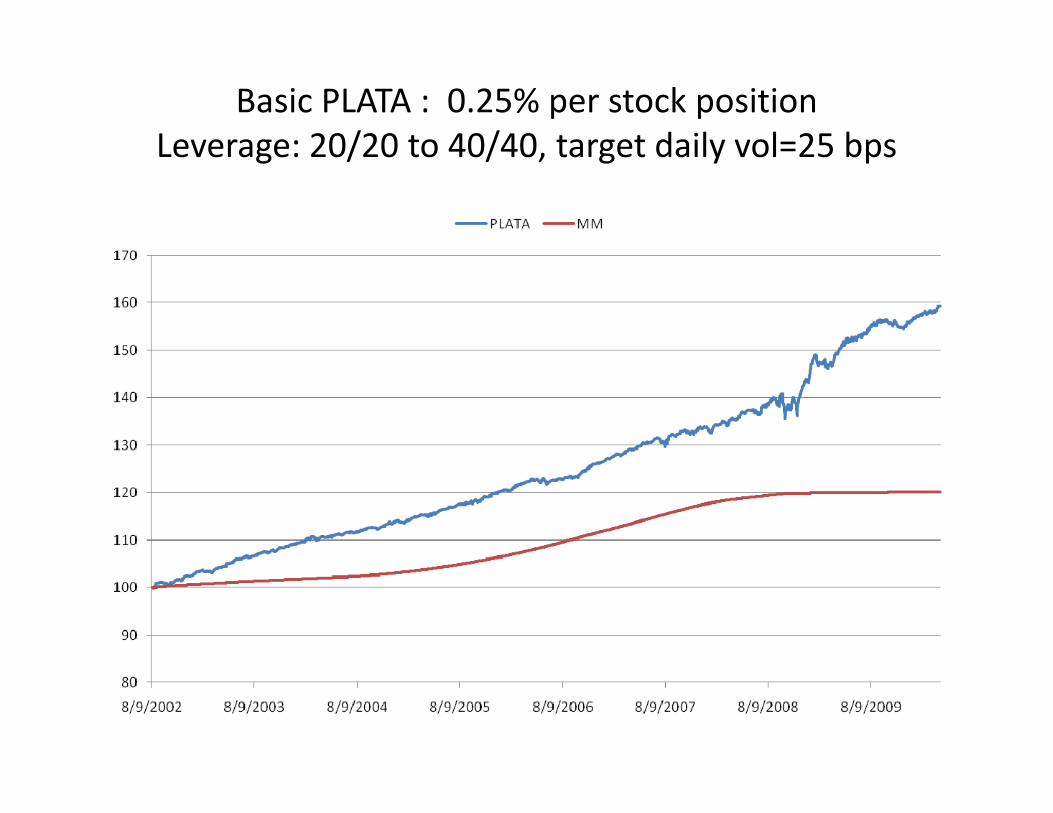
Basic PLATA : 0.25% per stock positionLeverage: 20/20 to 40/40, target daily vol=25 bps

Trailing annualized volatility without portfolio risk management

Volatility of PLATA with and without risk limit

Difference between managed risk and unmanaged risk in the Fall of 2008
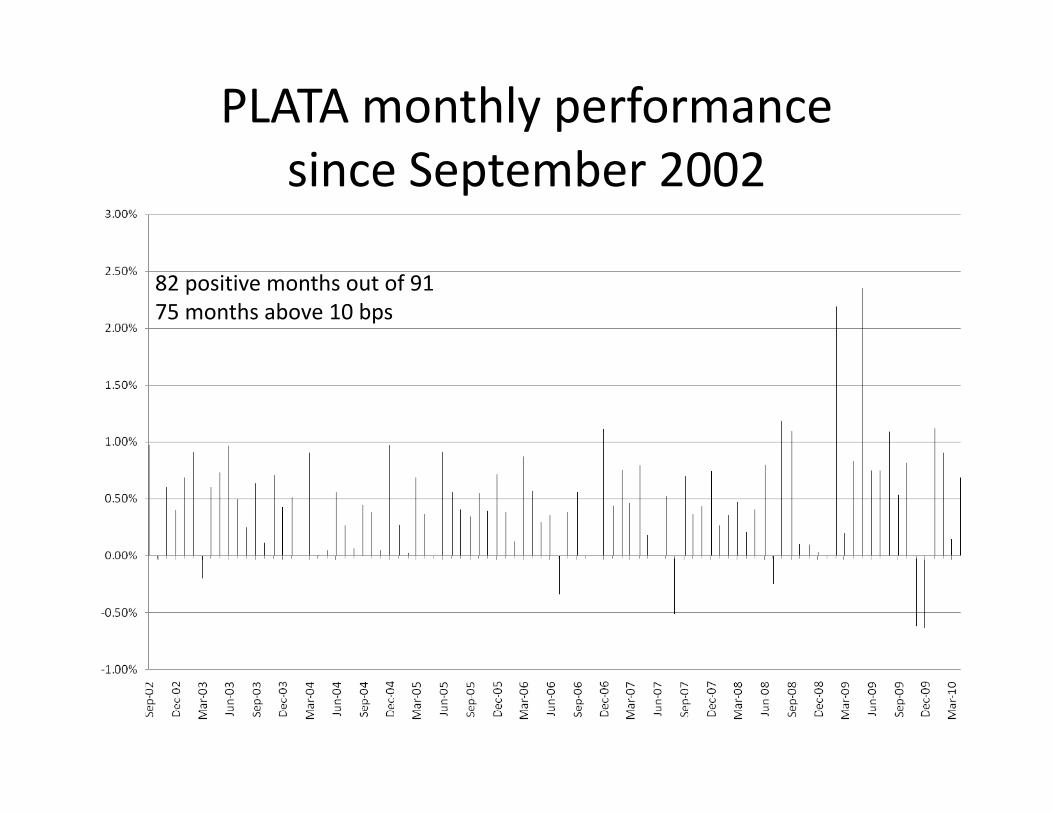
PLATA monthly performancesince September 2002
82 positive months out of 9175 months above 10 bps

PLATA Monthly Statistics
Mean 0.50%
Standard Error 0.05%
Median 0.46%
Mode NA
Standard Deviation 0.48%
Sample Variance 0.00%
Kurtosis 3.01
Skewness 0.75
Range 3%
Minimum -1%
Maximum 2%
Sum 0.46
Count 91
Largest(5) 1.12%
Smallest(5) -0.25%
Confidence Level(99.0%) 0.13%

Volatility and Stat Arb (Plata)
PLATA works better in the aftermath of volatility spikes and lesswell when volatility drops. It is therefore reasonable to blend itwith an index strategy
Statistical Arbitrage and 130/30
Indexers: mutual fund managers and long-only managersObjective: Track (or beat) returns of the overall market or sectorUnderlying theory: CAPM, etc.
130/30 Managers: Long 130%, short 30% with periodic revisions of the portfolioEssentially, a beta strategy with stock picking
Market-neutral managers: Seek returns that are uncorrelated with the market (alpha)
Long-Short Equity MN: Fundamental Stock Picking with shorting
Statistical Arbitrage: Quantitative long-short MN

SPY+PLATA: a synthetic 130/30 fund
Based on a notional amount of 100 MM:
-- go long 100 MM SPY and
-- enter into a PLATA strategy based on 100MM notional amount(30 to 50 mm long/ 30 to 50 mm short)
(parameters for PLATA: big universe, 25bps per stock, target daily stdev of portfolio=25bps)
Due to market-neutrality of PLATA, this portfolio looks essentially like a 130/30 to a 150/50 depending on the volatility in the market and theturnover.
-- Proposed fee structure: ~ 1.20% per year

Comparing SPY+PLATA withSPY
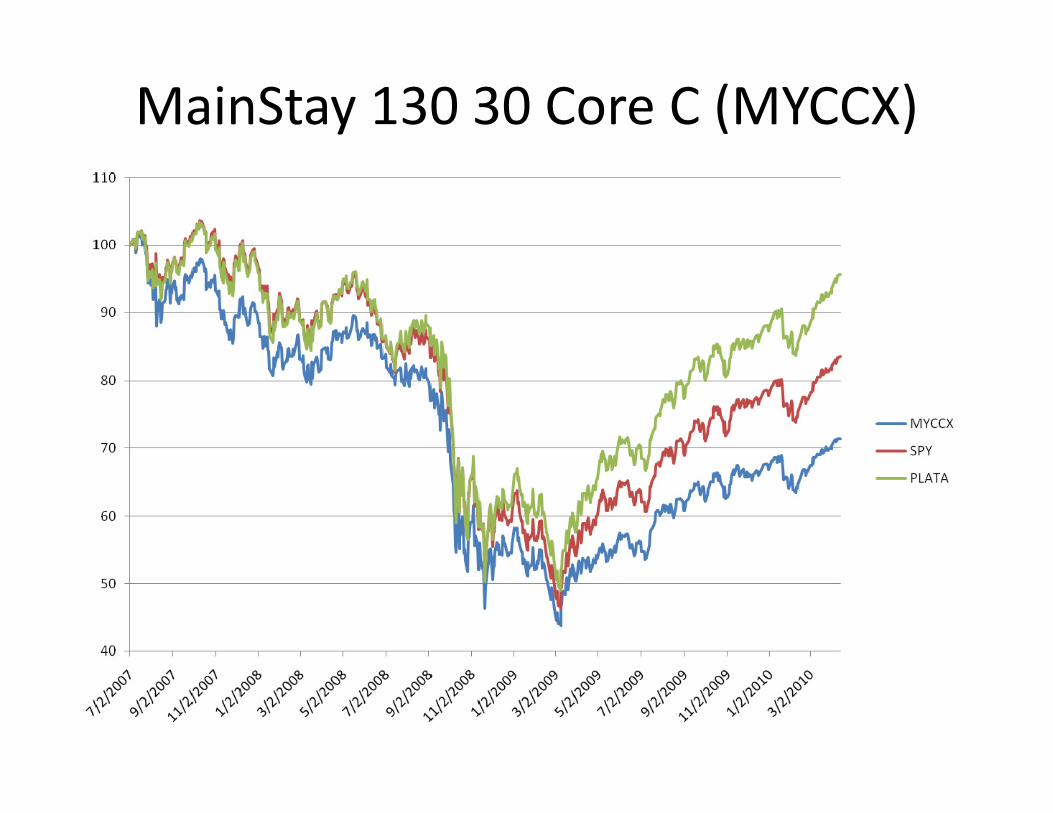
MainStay 130 30 Core C (MYCCX)

Fidelity Advisor Large Cap 130/30(FITOX, FOATX)

BNY Mellon US Core Equity 130/30(MUCIX)

CSM: the first 130/30 ETF
-- Proshares launched the first 130/30 ETF in July 2009
-- Based on the 13030 Large Cap Index constructed by Andrew Lo (MIT) andPanjak Patel (Credit Suisse)
-- Based on ranking stocks in S&P 500 according to 10 quantitative criteria(Book to Value, Momentum, etc)
-- Monthly rebalancings
-- Data available does not include the credit crunch

Comparison of SPY+ PLATA with CSMsince inception (7/2009)

ConclusionIs Statistical Arbitrage ready for the big time?
-- Yes, because it provides a systematic way of picking stocks (long andshort) based on objective criteria.
-- Yes, because it is operates in medium frequency with relatively low turnover costs, so it is scalable.
-- Yes, because it can be leveraged an treated as a total-return strategy (caveatemptor, however).
-- Yes, because it can be merged with a long-index fund to create a systematicenhanced-indexing fund or quantitative 130/30.
-- Stat arb makes money when the market has high cross-sectional volatility, whichis typically when indexing works less well. This is why Stat Arb and indexing shouldbe combined to make a superior yet simple product which can be benchmarked tothe S&P 500.