In Vitro Pharmacodynamic Evaluation of the Mutant Selection Window Hypothesis Using Four...
11
10.1128/AAC.47.5.1604-1613.2003. 2003, 47(5):1604. DOI: Antimicrob. Agents Chemother. Karl Drlica, Yury A. Portnoy and Stephen H. Zinner Alexander A. Firsov, Sergey N. Vostrov, Irene Y. Lubenko, Staphylococcus aureus Using Four Fluoroquinolones against the Mutant Selection Window Hypothesis In Vitro Pharmacodynamic Evaluation of http://aac.asm.org/content/47/5/1604 Updated information and services can be found at: These include: REFERENCES http://aac.asm.org/content/47/5/1604#ref-list-1 at: This article cites 34 articles, 29 of which can be accessed free CONTENT ALERTS more» articles cite this article), Receive: RSS Feeds, eTOCs, free email alerts (when new http://journals.asm.org/site/misc/reprints.xhtml Information about commercial reprint orders: http://journals.asm.org/site/subscriptions/ To subscribe to to another ASM Journal go to: on January 18, 2014 by guest http://aac.asm.org/ Downloaded from on January 18, 2014 by guest http://aac.asm.org/ Downloaded from
-
Upload
independent -
Category
Documents
-
view
0 -
download
0
Transcript of In Vitro Pharmacodynamic Evaluation of the Mutant Selection Window Hypothesis Using Four...
10.1128/AAC.47.5.1604-1613.2003.
2003, 47(5):1604. DOI:Antimicrob. Agents Chemother. Karl Drlica, Yury A. Portnoy and Stephen H. ZinnerAlexander A. Firsov, Sergey N. Vostrov, Irene Y. Lubenko, Staphylococcus aureusUsing Four Fluoroquinolones against the Mutant Selection Window Hypothesis In Vitro Pharmacodynamic Evaluation of
http://aac.asm.org/content/47/5/1604Updated information and services can be found at:
These include:
REFERENCEShttp://aac.asm.org/content/47/5/1604#ref-list-1at:
This article cites 34 articles, 29 of which can be accessed free
CONTENT ALERTS more»articles cite this article),
Receive: RSS Feeds, eTOCs, free email alerts (when new
http://journals.asm.org/site/misc/reprints.xhtmlInformation about commercial reprint orders: http://journals.asm.org/site/subscriptions/To subscribe to to another ASM Journal go to:
on January 18, 2014 by guesthttp://aac.asm
.org/D
ownloaded from
on January 18, 2014 by guest
http://aac.asm.org/
Dow
nloaded from
ANTIMICROBIAL AGENTS AND CHEMOTHERAPY, May 2003, p. 1604–1613 Vol. 47, No. 50066-4804/03/$08.00�0 DOI: 10.1128/AAC.47.5.1604–1613.2003Copyright © 2003, American Society for Microbiology. All Rights Reserved.
In Vitro Pharmacodynamic Evaluation of the Mutant SelectionWindow Hypothesis Using Four Fluoroquinolones against
Staphylococcus aureusAlexander A. Firsov,1* Sergey N. Vostrov,1 Irene Y. Lubenko,1 Karl Drlica,2
Yury A. Portnoy,1 and Stephen H. Zinner3
Department of Pharmacokinetics and Pharmacodynamics, Gause Institute of New Antibiotics, Russian Academyof Medical Sciences, Moscow, Russia1; Public Health Research Institute, New York, New York2; and
Mount Auburn Hospital, Harvard Medical School, Cambridge, Massachusetts3
Received 24 June 2002/Returned for modification 9 November 2002/Accepted 30 January 2003
To study the hypothesis of the mutant selection window (MSW) in a pharmacodynamic context, thesusceptibility of a clinical isolate of methicillin-resistant Staphylococcus aureus exposed to moxifloxacin (MOX),gatifloxacin (GAT), levofloxacin (LEV), and ciprofloxacin (CIP) was tested daily by using an in vitro dynamicmodel that simulates human pharmacokinetics. A series of monoexponential pharmacokinetic profiles thatmimic once-daily administration of MOX (half-life, 12 h), GAT (half-life, 7 h), and LEV (half-life, 6.8 h) andtwice-daily administration of CIP (half-life, 4 h) provided peak concentrations (Cmax) that either equaled theMIC, fell between the MIC and the mutant prevention concentration (MPC) (i.e., within or “inside” the MSW),or exceeded the MPC. The respective ratios of the area under the curve (AUC) over a 24-h dosing interval(AUC24) to the MIC varied from 13 to 244 h, and the starting inoculum was 108 CFU/ml (6 � 109 CFU per60-ml central compartment). With all four quinolones, the greatest increases in MIC were observed at thoseAUC24/MIC values (from 24 to 62 h) that corresponded to quinolone concentrations within the MSW over mostof the dosing interval (>20%). Less-pronounced increases in MIC were associated with the smallest simulatedAUC24/MIC values (15 to 16 h) of GAT and CIP, whose Cmax exceeded the MICs. No such increases wereobserved with the smallest AUC24/MIC values (13 to 17 h) of MOX and LEV, whose Cmax were close to theMICs. Also, less pronounced but significant increases in MIC occurred at AUC24/MIC values (107 to 123 h)that correspond to quinolone concentrations partly overlapping the MIC-to-MPC range. With all four drugs,no change in MIC was seen at the highest AUC24/MIC values (201 to 244 h), where quinolone concentrationsexceeded the MPC over most of the dosing interval. These “protective” AUC24/MIC ratios correspond to 66%of the usual clinical dose of MOX (400 mg), 190% of a 400-mg dose of GAT, 220% of a 500-mg dose of LEV,and 420% of two 500-mg doses of CIP. Thus, MOX may protect against resistance development at subthera-peutic doses, whereas GAT, LEV, and CIP provide similar effects only at doses that exceed their usual clinicaldoses. These data support the concept that resistant mutants are selectively enriched when antibiotic concen-trations fall inside the MSW and suggest that in vitro dynamic models can be used to predict the relativeabilities of quinolones to prevent mutant selection.
Examination of time-kill curves of antibiotic-exposed bacte-ria using in vitro dynamic models allows pharmacokineticallyrelated comparisons of antimicrobial effects but may or maynot directly reflect the selective enrichment of resistant mu-tants. Bacterial resistance has been studied infrequently usingthese models. Limited observations reported from earlier time-kill studies (3, 8, 21–23) precluded delineation of relationshipsof the area under the concentration-time curve (AUC)/MICratio with resistance because the ranges of the simulated AUC-to-MIC ratios were too narrow. In fact, the first attempts torelate resistance to the AUC/MIC or peak concentration(Cmax)/MIC ratio were reported quite recently from studiesthat declared resistance analysis as a primary goal (1, 7, 17, 18,20, 25–27, 30, 33, 34; A. MacGowan and K. Bowker, Abstr. 41stIntersci. Conf. Antimicrob. Agents Chemother., poster A-440,
2001). Despite wide ranges of AUC/MIC ratios simulated insome recent studies (17–20, 27, 33; MacGowan and Bowker,41st ICAAC), reasonable relationships with resistance werenot established. The relatively few studies of these relation-ships can be classified as those that directly attempt to relateresistance to the simulated pharmacokinetics but do not (17,20) and those that imply the existence of relationships with theAUC/MIC ratio measured within a 24-h dosing interval(AUC24/MIC) or with the Cmax/MIC ratio but do not actuallyreport them (26, 27, 30). One study did report a complex effectof AUC24/MIC and duration of moxifloxacin treatment onbacterial resistance (MacGowan and Bowker, 41st ICAAC),but the three-dimensional plots masked rather than high-lighted these links. For example, according to an analysis ofthese data (A. Firsov, S. Vostrov, I. Lubenko, S. Zinner, and Y.Portnoy, Abstr. 42nd Intersci. Conf. Antimicrob. Agents Che-mother., abstr. A-1210, p. 10, 2002), the reported 72-h areaunder the population analysis profile-time curve as an index ofpneumococcal resistance did not correlate with simulatedAUC24/MIC ratios (r2, 0.04).
Without AUC/MIC and Cmax/MIC relationships to resis-
* Corresponding author. Mailing address: Department of Pharma-cokinetics and Pharmacodynamics, Gause Institute of New Antibiotics,Russian Academy of Medical Sciences, 11 Bolshaya Pirogovskaya St.,Moscow, 119021 Russia. Phone: 7 (095) 245-0154. Fax: 7 (095) 245-0295. E-mail: [email protected].
1604
on January 18, 2014 by guesthttp://aac.asm
.org/D
ownloaded from
tance, reports of AUC/MIC and Cmax/MIC values that protectagainst the selection of resistant mutants appear to be contra-dictory. For example, with Streptococcus pneumoniae, “protec-tive” AUC/MIC values for grepafloxacin varied from 32 h (17)to 80 h (7, 34) and those for levofloxacin varied from 9 h (17)to 26 h (20) and 50 h (34). Furthermore, although moxifloxa-cin-resistant S. pneumoniae was not found at the AUC/MICvalues of 107 h (7) and 250 h (34), significant losses in suscep-tibility were seen at AUC/MIC values as high as 43,500 h (17).
There are many possible reasons for these contradictions.One is that simulated concentrations might or might not fallinto the mutant selection window (MSW), i.e., the concentra-tion range between the MIC and the mutant prevention con-centration (MPC), within which it is proposed that resistantmutants are selected (35). To test the MSW hypothesis and tohighlight the reasons for these contradictions, the abilities ofmoxifloxacin, gatifloxacin, levofloxacin, and ciprofloxacin toselectively enrich resistant mutants of Staphylococcus aureusand the dynamics of antistaphylococcal effects were studiedusing in vitro simulations of the four fluoroquinolones at con-centrations equal to the MIC, between the MIC and the MPC,and above the MPC.
(This study was presented in part at the 42nd InterscienceConference on Antimicrobial Agents and Chemotherapy, SanDiego, Calif., 27 to 30 September 2002.)
MATERIALS AND METHODS
Antimicrobial agents, bacterial strain, and susceptibility testing. Moxifloxacinand ciprofloxacin powders were kindly provided by Bayer Corporation (WestHaven, Conn.), gatifloxacin was provided by Bristol-Myers Squibb (New Bruns-wick, N.J.), and levofloxacin was provided by Ortho-McNeill Pharmaceuticals(Raritan, N.J.). A clinical isolate of methicillin-resistant S. aureus 201 was se-lected for the study. MICs were determined prior to, during, and after a 3-daycourse of treatment with the quinolones. Susceptibility testing was performed intriplicate by broth microdilution techniques at 24 h postexposure with the or-ganism grown in Ca2�- and Mg2�-supplemented Mueller-Hinton broth (MHB)at an inoculum size of 106 CFU/ml. In order to obtain more-precise values, MICswere determined by using doubling dilutions with starting concentrations of 3, 4,and 5 mg/liter as described previously (16). MICs for S. aureus 201 were 0.09 �gof moxifloxacin/ml, 0.3 �g of gatifloxacin/ml, 0.6 �g of levofloxacin/ml, and 0.8 �gof ciprofloxacin/ml.
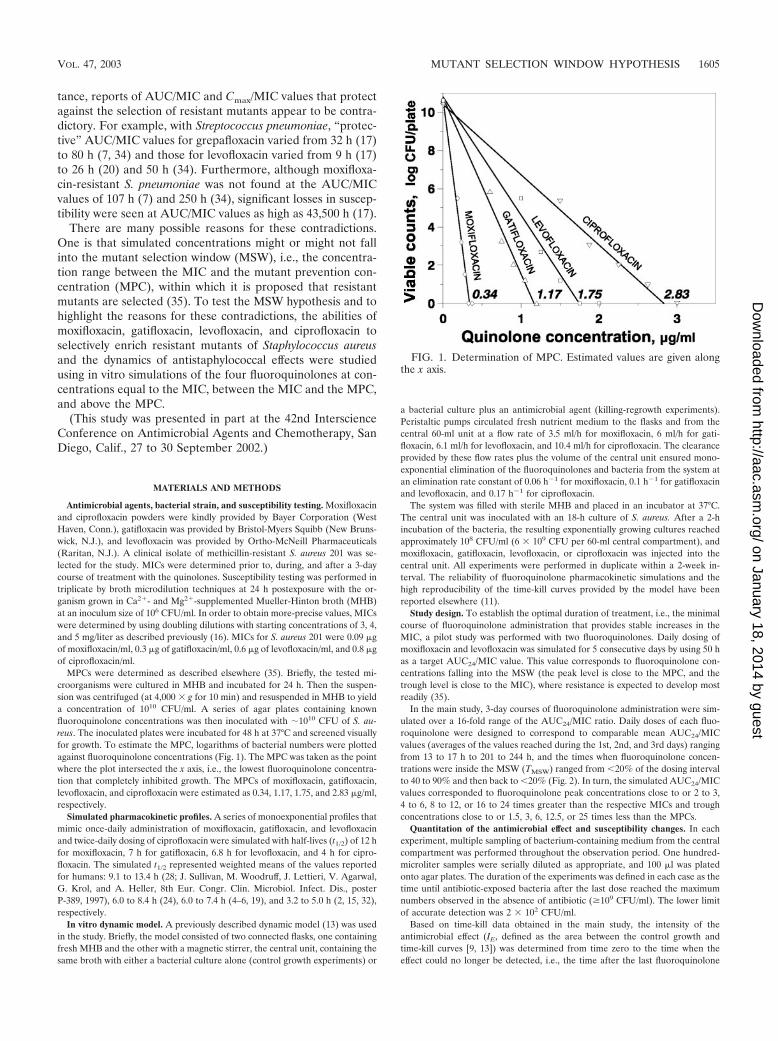
MPCs were determined as described elsewhere (35). Briefly, the tested mi-croorganisms were cultured in MHB and incubated for 24 h. Then the suspen-sion was centrifuged (at 4,000 � g for 10 min) and resuspended in MHB to yielda concentration of 1010 CFU/ml. A series of agar plates containing knownfluoroquinolone concentrations was then inoculated with �1010 CFU of S. au-reus. The inoculated plates were incubated for 48 h at 37°C and screened visuallyfor growth. To estimate the MPC, logarithms of bacterial numbers were plottedagainst fluoroquinolone concentrations (Fig. 1). The MPC was taken as the pointwhere the plot intersected the x axis, i.e., the lowest fluoroquinolone concentra-tion that completely inhibited growth. The MPCs of moxifloxacin, gatifloxacin,levofloxacin, and ciprofloxacin were estimated as 0.34, 1.17, 1.75, and 2.83 �g/ml,respectively.
Simulated pharmacokinetic profiles. A series of monoexponential profiles thatmimic once-daily administration of moxifloxacin, gatifloxacin, and levofloxacinand twice-daily dosing of ciprofloxacin were simulated with half-lives (t1/2) of 12 hfor moxifloxacin, 7 h for gatifloxacin, 6.8 h for levofloxacin, and 4 h for cipro-floxacin. The simulated t1/2 represented weighted means of the values reportedfor humans: 9.1 to 13.4 h (28; J. Sullivan, M. Woodruff, J. Lettieri, V. Agarwal,G. Krol, and A. Heller, 8th Eur. Congr. Clin. Microbiol. Infect. Dis., posterP-389, 1997), 6.0 to 8.4 h (24), 6.0 to 7.4 h (4–6, 19), and 3.2 to 5.0 h (2, 15, 32),respectively.
In vitro dynamic model. A previously described dynamic model (13) was usedin the study. Briefly, the model consisted of two connected flasks, one containingfresh MHB and the other with a magnetic stirrer, the central unit, containing thesame broth with either a bacterial culture alone (control growth experiments) or
a bacterial culture plus an antimicrobial agent (killing-regrowth experiments).Peristaltic pumps circulated fresh nutrient medium to the flasks and from thecentral 60-ml unit at a flow rate of 3.5 ml/h for moxifloxacin, 6 ml/h for gati-floxacin, 6.1 ml/h for levofloxacin, and 10.4 ml/h for ciprofloxacin. The clearanceprovided by these flow rates plus the volume of the central unit ensured mono-exponential elimination of the fluoroquinolones and bacteria from the system atan elimination rate constant of 0.06 h�1 for moxifloxacin, 0.1 h�1 for gatifloxacinand levofloxacin, and 0.17 h�1 for ciprofloxacin.
The system was filled with sterile MHB and placed in an incubator at 37°C.The central unit was inoculated with an 18-h culture of S. aureus. After a 2-hincubation of the bacteria, the resulting exponentially growing cultures reachedapproximately 108 CFU/ml (6 � 109 CFU per 60-ml central compartment), andmoxifloxacin, gatifloxacin, levofloxacin, or ciprofloxacin was injected into thecentral unit. All experiments were performed in duplicate within a 2-week in-terval. The reliability of fluoroquinolone pharmacokinetic simulations and thehigh reproducibility of the time-kill curves provided by the model have beenreported elsewhere (11).
Study design. To establish the optimal duration of treatment, i.e., the minimalcourse of fluoroquinolone administration that provides stable increases in theMIC, a pilot study was performed with two fluoroquinolones. Daily dosing ofmoxifloxacin and levofloxacin was simulated for 5 consecutive days by using 50 has a target AUC24/MIC value. This value corresponds to fluoroquinolone con-centrations falling into the MSW (the peak level is close to the MPC, and thetrough level is close to the MIC), where resistance is expected to develop mostreadily (35).
In the main study, 3-day courses of fluoroquinolone administration were sim-ulated over a 16-fold range of the AUC24/MIC ratio. Daily doses of each fluo-roquinolone were designed to correspond to comparable mean AUC24/MICvalues (averages of the values reached during the 1st, 2nd, and 3rd days) rangingfrom 13 to 17 h to 201 to 244 h, and the times when fluoroquinolone concen-trations were inside the MSW (TMSW) ranged from �20% of the dosing intervalto 40 to 90% and then back to �20% (Fig. 2). In turn, the simulated AUC24/MICvalues corresponded to fluoroquinolone peak concentrations close to or 2 to 3,4 to 6, 8 to 12, or 16 to 24 times greater than the respective MICs and troughconcentrations close to or 1.5, 3, 6, 12.5, or 25 times less than the MPCs.
Quantitation of the antimicrobial effect and susceptibility changes. In eachexperiment, multiple sampling of bacterium-containing medium from the centralcompartment was performed throughout the observation period. One hundred-microliter samples were serially diluted as appropriate, and 100 �l was platedonto agar plates. The duration of the experiments was defined in each case as thetime until antibiotic-exposed bacteria after the last dose reached the maximumnumbers observed in the absence of antibiotic (�109 CFU/ml). The lower limitof accurate detection was 2 � 102 CFU/ml.
Based on time-kill data obtained in the main study, the intensity of theantimicrobial effect (IE, defined as the area between the control growth andtime-kill curves [9, 13]) was determined from time zero to the time when theeffect could no longer be detected, i.e., the time after the last fluoroquinolone
FIG. 1. Determination of MPC. Estimated values are given alongthe x axis.
VOL. 47, 2003 MUTANT SELECTION WINDOW HYPOTHESIS 1605
on January 18, 2014 by guesthttp://aac.asm
.org/D
ownloaded from
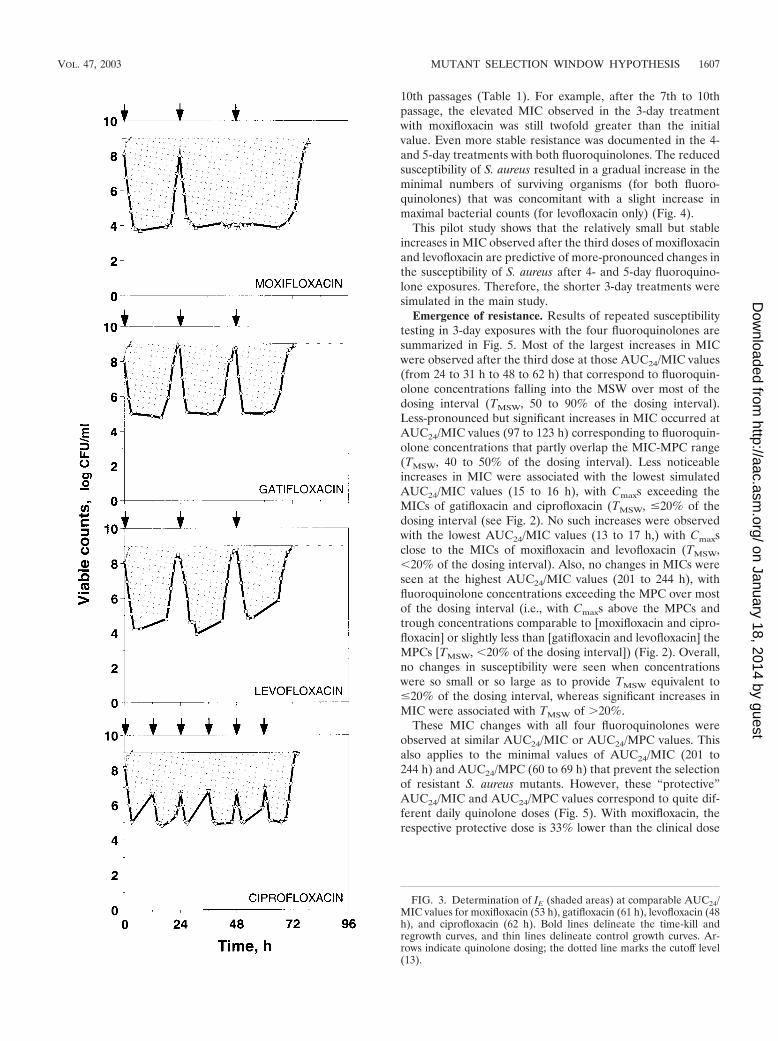
dose at which the number of antibiotic-exposed bacteria reached 109 CFU/ml.The upper limit of bacterial numbers, i.e., the cutoff level on the regrowth andcontrol growth curves used to determine IE, was 109 CFU/ml. The computationof IE at comparable AUC24/MIC values simulated with each drug is depictedgraphically in Fig. 3.
To reveal possible changes in susceptibility during treatment, precise fluoro-quinolone MICs of bacterial cultures sampled from the model were determineddaily for 6 days in the pilot study and for 4 days in the main study. The stabilityof resistance observed in the pilot study was determined by consecutive passagingof S. aureus that was exposed to three, four, and five doses of moxifloxacin andlevofloxacin onto antibiotic-free agar plates for 10 consecutive days. MICs weredetermined on days 1, 3, 7, and 10 as described above.
Relationships of the emergence of resistance to the AUC24/MIC ratio andTMSW. To combine the data obtained with all four fluoroquinolones, increases inthe MIC observed at 72 h (MIC72) were related to the respective initial MIC(MIC0). The ratios of MIC72 to MIC0 were fitted to the log AUC24/MIC by usinga Gaussian type function where Y is the MIC72/MIC0 ratio, x is log AUC24/MIC,xc is the log AUC24/MIC that corresponds to the maximal value of MIC72/MIC0,and a and b are parameters:
Y � 1 � a exp � � �x � xc2/b (1)
Equation 1 also was used to fit the MIC24/MIC0 ratios of levofloxacin andtrovafloxacin reported in a study with Bacteroides fragilis (25) against simulatedAUC24/MIC ratios.
To visualize the sigmoid shape of the TMSW relationship to resistance, theMIC72/MIC0 ratios were fitted to the TMSW by using the Boltzmann function
Y � �1 � Ymax/�1 � exp ��x � x0/dx� � Ymax (2)
where Y is the MIC72/MIC0 ratio and Ymax is its maximal value, x is TMSW, x0 isthe TMSW that corresponds to Ymax/2, and dx is the width parameter.
Fluoroquinolone doses that prevent the selection of resistant mutants werecalculated from AUC24/MIC ratios at which no increases in MIC occurred byusing dose-AUC relationships reported earlier (10, 31).
Relationships of the antimicrobial effect to the AUC24/MIC ratio. The IE wasrelated to log AUC24/MIC. With each fluoroquinolone, the IE versus log AUC24/MIC data were fitted by the logistic function
Y � Ymax/�1 � exp �b � ax. (3)
where x is log AUC24/MIC, Y is IE, Ymax is the maximal value of IE, and a and bare parameters reflecting the slope and amplitude of the curve whose ratio, b/a,corresponds to x50, i.e., to the log AUC24/MIC ratio that provides the antimi-crobial effect equal to Ymax/2.
RESULTS
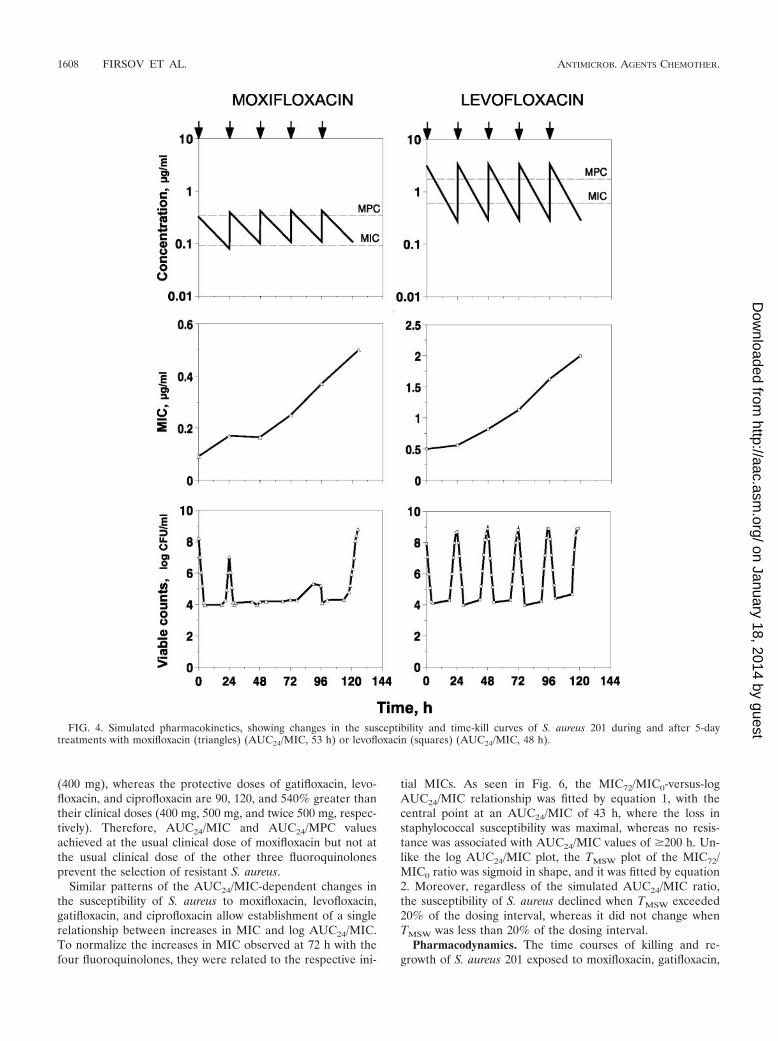
Validation of the optimal study design. To establish theminimal duration of fluoroquinolone treatment that allowsdetection of S. aureus resistance, daily measurement of theMICs of moxifloxacin and levofloxacin was performed duringthe 5-day courses at AUC24/MIC values of approximately 60 h,which correspond to fluoroquinolone concentrations almostentirely within the MSW (Fig. 4). As seen in Fig. 4, significantincreases in the MIC were found with both drugs beginningfrom the third dose. These increases were even more pro-nounced after the fourth dose and, especially, after the fifthdose. Serial passages of resistant isolates sampled 72, 96, and120 to 125 h after fluoroquinolone exposure and placed onantibiotic-free plates revealed minimal or no changes in theelevated MICs, showing stable resistance after the 3rd, 7th, and
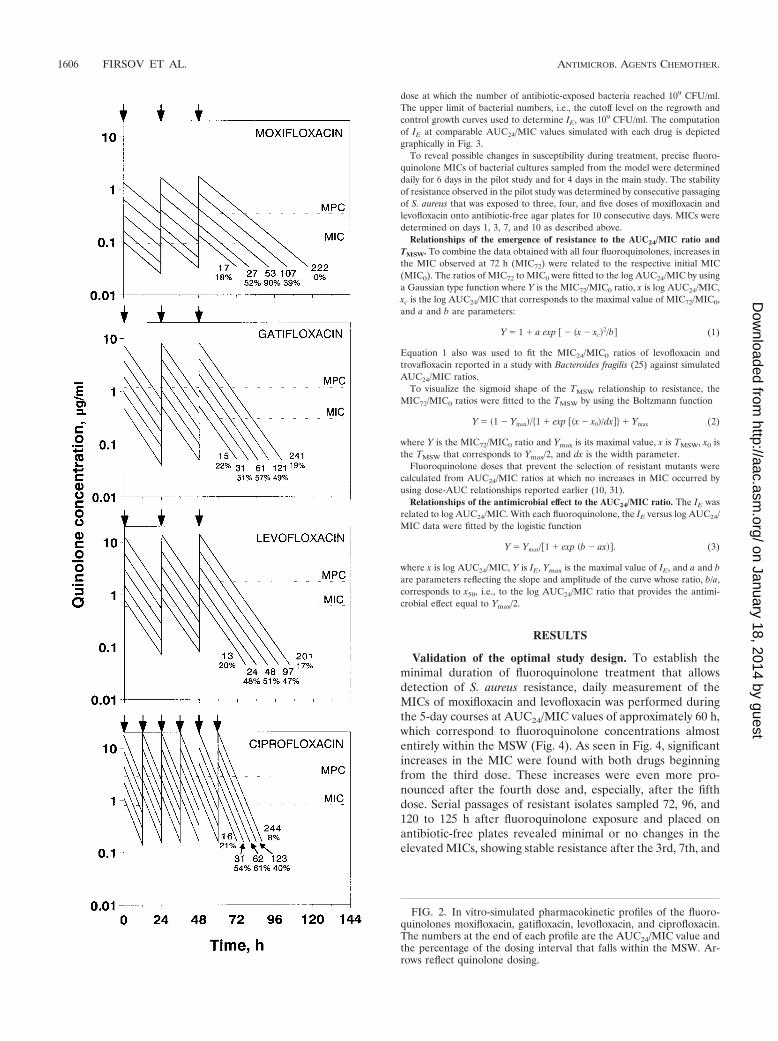
FIG. 2. In vitro-simulated pharmacokinetic profiles of the fluoro-quinolones moxifloxacin, gatifloxacin, levofloxacin, and ciprofloxacin.The numbers at the end of each profile are the AUC24/MIC value andthe percentage of the dosing interval that falls within the MSW. Ar-rows reflect quinolone dosing.
1606 FIRSOV ET AL. ANTIMICROB. AGENTS CHEMOTHER.
on January 18, 2014 by guesthttp://aac.asm
.org/D
ownloaded from
10th passages (Table 1). For example, after the 7th to 10thpassage, the elevated MIC observed in the 3-day treatmentwith moxifloxacin was still twofold greater than the initialvalue. Even more stable resistance was documented in the 4-and 5-day treatments with both fluoroquinolones. The reducedsusceptibility of S. aureus resulted in a gradual increase in theminimal numbers of surviving organisms (for both fluoro-quinolones) that was concomitant with a slight increase inmaximal bacterial counts (for levofloxacin only) (Fig. 4).
This pilot study shows that the relatively small but stableincreases in MIC observed after the third doses of moxifloxacinand levofloxacin are predictive of more-pronounced changes inthe susceptibility of S. aureus after 4- and 5-day fluoroquino-lone exposures. Therefore, the shorter 3-day treatments weresimulated in the main study.
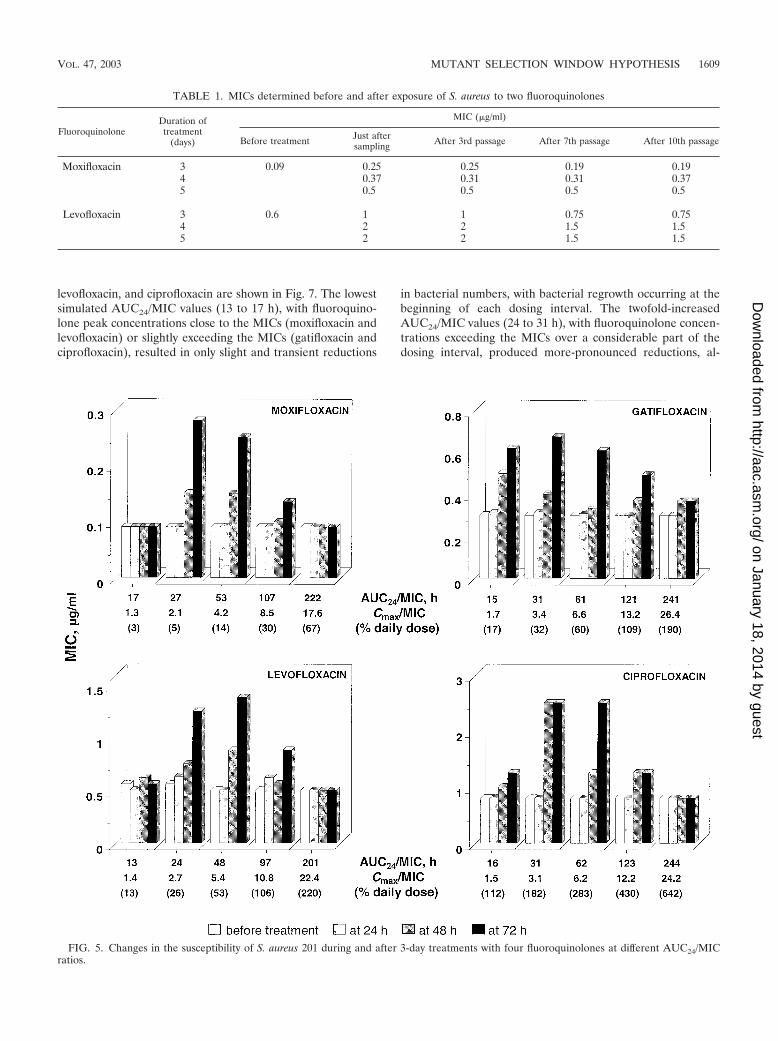
Emergence of resistance. Results of repeated susceptibilitytesting in 3-day exposures with the four fluoroquinolones aresummarized in Fig. 5. Most of the largest increases in MICwere observed after the third dose at those AUC24/MIC values(from 24 to 31 h to 48 to 62 h) that correspond to fluoroquin-olone concentrations falling into the MSW over most of thedosing interval (TMSW, 50 to 90% of the dosing interval).Less-pronounced but significant increases in MIC occurred atAUC24/MIC values (97 to 123 h) corresponding to fluoroquin-olone concentrations that partly overlap the MIC-MPC range(TMSW, 40 to 50% of the dosing interval). Less noticeableincreases in MIC were associated with the lowest simulatedAUC24/MIC values (15 to 16 h), with Cmaxs exceeding theMICs of gatifloxacin and ciprofloxacin (TMSW, �20% of thedosing interval (see Fig. 2). No such increases were observedwith the lowest AUC24/MIC values (13 to 17 h,) with Cmaxsclose to the MICs of moxifloxacin and levofloxacin (TMSW,�20% of the dosing interval). Also, no changes in MICs wereseen at the highest AUC24/MIC values (201 to 244 h), withfluoroquinolone concentrations exceeding the MPC over mostof the dosing interval (i.e., with Cmaxs above the MPCs andtrough concentrations comparable to [moxifloxacin and cipro-floxacin] or slightly less than [gatifloxacin and levofloxacin] theMPCs [TMSW, �20% of the dosing interval]) (Fig. 2). Overall,no changes in susceptibility were seen when concentrationswere so small or so large as to provide TMSW equivalent to�20% of the dosing interval, whereas significant increases inMIC were associated with TMSW of 20%.
These MIC changes with all four fluoroquinolones wereobserved at similar AUC24/MIC or AUC24/MPC values. Thisalso applies to the minimal values of AUC24/MIC (201 to244 h) and AUC24/MPC (60 to 69 h) that prevent the selectionof resistant S. aureus mutants. However, these “protective”AUC24/MIC and AUC24/MPC values correspond to quite dif-ferent daily quinolone doses (Fig. 5). With moxifloxacin, therespective protective dose is 33% lower than the clinical dose
FIG. 3. Determination of IE (shaded areas) at comparable AUC24/MIC values for moxifloxacin (53 h), gatifloxacin (61 h), levofloxacin (48h), and ciprofloxacin (62 h). Bold lines delineate the time-kill andregrowth curves, and thin lines delineate control growth curves. Ar-rows indicate quinolone dosing; the dotted line marks the cutoff level(13).
VOL. 47, 2003 MUTANT SELECTION WINDOW HYPOTHESIS 1607
on January 18, 2014 by guesthttp://aac.asm
.org/D
ownloaded from
(400 mg), whereas the protective doses of gatifloxacin, levo-floxacin, and ciprofloxacin are 90, 120, and 540% greater thantheir clinical doses (400 mg, 500 mg, and twice 500 mg, respec-tively). Therefore, AUC24/MIC and AUC24/MPC valuesachieved at the usual clinical dose of moxifloxacin but not atthe usual clinical dose of the other three fluoroquinolonesprevent the selection of resistant S. aureus.
Similar patterns of the AUC24/MIC-dependent changes inthe susceptibility of S. aureus to moxifloxacin, levofloxacin,gatifloxacin, and ciprofloxacin allow establishment of a singlerelationship between increases in MIC and log AUC24/MIC.To normalize the increases in MIC observed at 72 h with thefour fluoroquinolones, they were related to the respective ini-
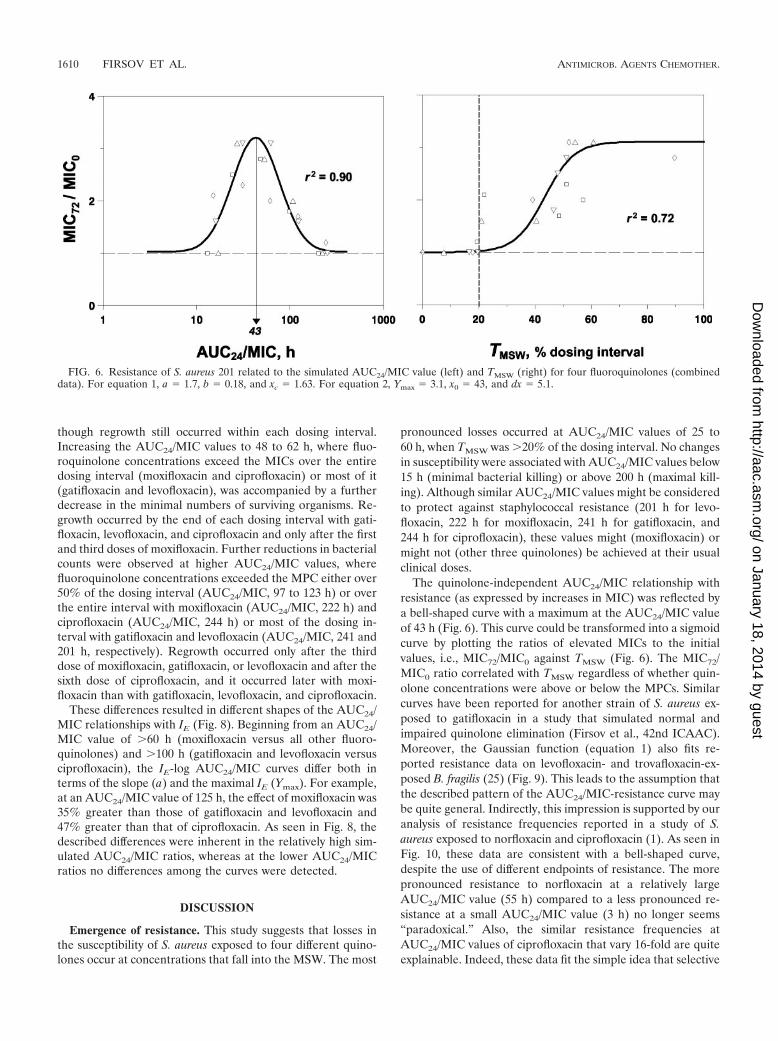
tial MICs. As seen in Fig. 6, the MIC72/MIC0-versus-logAUC24/MIC relationship was fitted by equation 1, with thecentral point at an AUC24/MIC of 43 h, where the loss instaphylococcal susceptibility was maximal, whereas no resis-tance was associated with AUC24/MIC values of �200 h. Un-like the log AUC24/MIC plot, the TMSW plot of the MIC72/MIC0 ratio was sigmoid in shape, and it was fitted by equation2. Moreover, regardless of the simulated AUC24/MIC ratio,the susceptibility of S. aureus declined when TMSW exceeded20% of the dosing interval, whereas it did not change whenTMSW was less than 20% of the dosing interval.
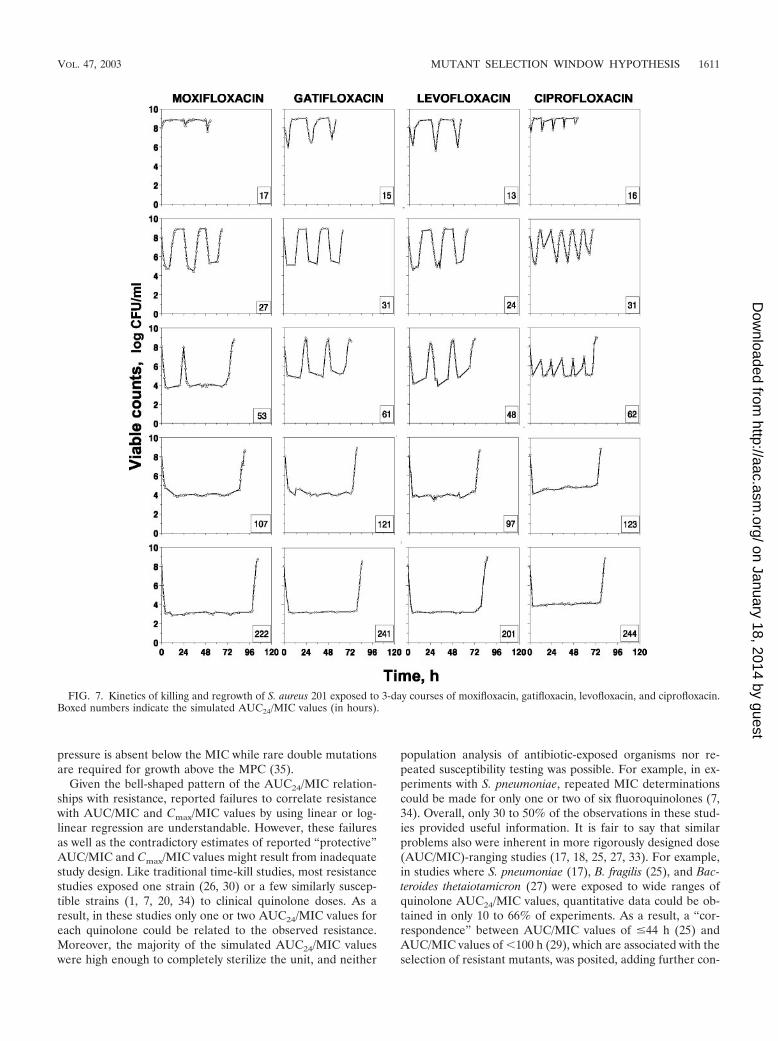
Pharmacodynamics. The time courses of killing and re-growth of S. aureus 201 exposed to moxifloxacin, gatifloxacin,
FIG. 4. Simulated pharmacokinetics, showing changes in the susceptibility and time-kill curves of S. aureus 201 during and after 5-daytreatments with moxifloxacin (triangles) (AUC24/MIC, 53 h) or levofloxacin (squares) (AUC24/MIC, 48 h).
1608 FIRSOV ET AL. ANTIMICROB. AGENTS CHEMOTHER.
on January 18, 2014 by guesthttp://aac.asm
.org/D
ownloaded from
levofloxacin, and ciprofloxacin are shown in Fig. 7. The lowestsimulated AUC24/MIC values (13 to 17 h), with fluoroquino-lone peak concentrations close to the MICs (moxifloxacin andlevofloxacin) or slightly exceeding the MICs (gatifloxacin andciprofloxacin), resulted in only slight and transient reductions
in bacterial numbers, with bacterial regrowth occurring at thebeginning of each dosing interval. The twofold-increasedAUC24/MIC values (24 to 31 h), with fluoroquinolone concen-trations exceeding the MICs over a considerable part of thedosing interval, produced more-pronounced reductions, al-
FIG. 5. Changes in the susceptibility of S. aureus 201 during and after 3-day treatments with four fluoroquinolones at different AUC24/MICratios.
TABLE 1. MICs determined before and after exposure of S. aureus to two fluoroquinolones
FluoroquinoloneDuration oftreatment
(days)
MIC (�g/ml)
Before treatment Just aftersampling After 3rd passage After 7th passage After 10th passage
Moxifloxacin 3 0.09 0.25 0.25 0.19 0.194 0.37 0.31 0.31 0.375 0.5 0.5 0.5 0.5
Levofloxacin 3 0.6 1 1 0.75 0.754 2 2 1.5 1.55 2 2 1.5 1.5
VOL. 47, 2003 MUTANT SELECTION WINDOW HYPOTHESIS 1609
on January 18, 2014 by guesthttp://aac.asm
.org/D
ownloaded from
though regrowth still occurred within each dosing interval.Increasing the AUC24/MIC values to 48 to 62 h, where fluo-roquinolone concentrations exceed the MICs over the entiredosing interval (moxifloxacin and ciprofloxacin) or most of it(gatifloxacin and levofloxacin), was accompanied by a furtherdecrease in the minimal numbers of surviving organisms. Re-growth occurred by the end of each dosing interval with gati-floxacin, levofloxacin, and ciprofloxacin and only after the firstand third doses of moxifloxacin. Further reductions in bacterialcounts were observed at higher AUC24/MIC values, wherefluoroquinolone concentrations exceeded the MPC either over50% of the dosing interval (AUC24/MIC, 97 to 123 h) or overthe entire interval with moxifloxacin (AUC24/MIC, 222 h) andciprofloxacin (AUC24/MIC, 244 h) or most of the dosing in-terval with gatifloxacin and levofloxacin (AUC24/MIC, 241 and201 h, respectively). Regrowth occurred only after the thirddose of moxifloxacin, gatifloxacin, or levofloxacin and after thesixth dose of ciprofloxacin, and it occurred later with moxi-floxacin than with gatifloxacin, levofloxacin, and ciprofloxacin.
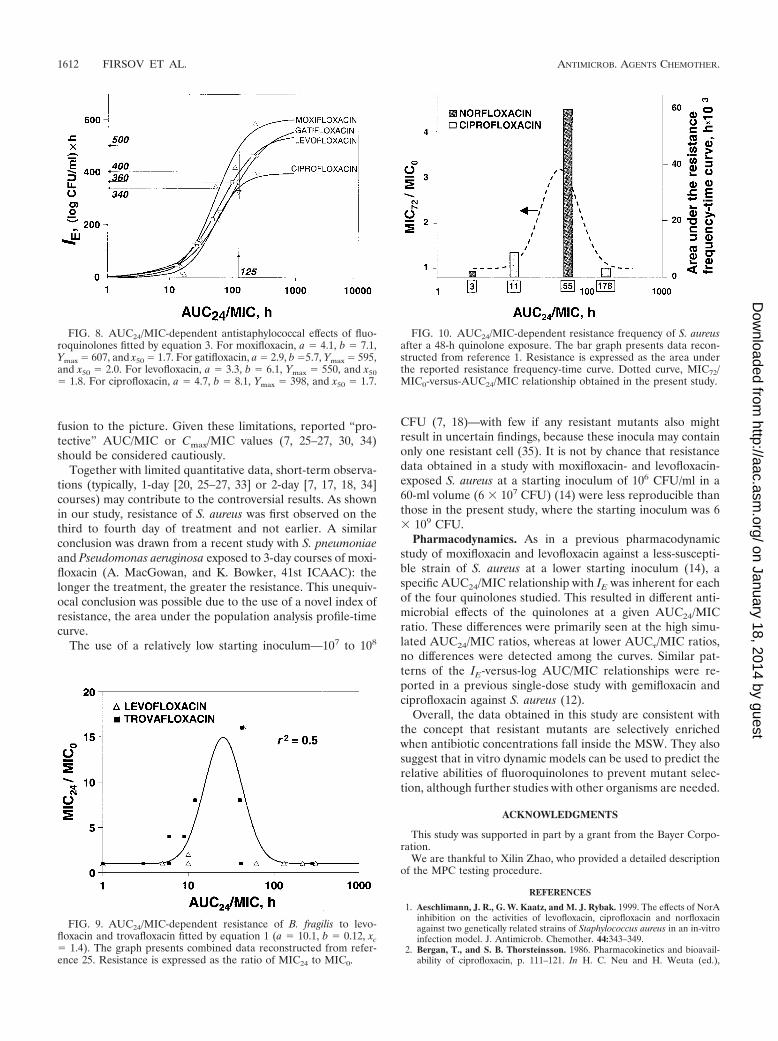
These differences resulted in different shapes of the AUC24/MIC relationships with IE (Fig. 8). Beginning from an AUC24/MIC value of 60 h (moxifloxacin versus all other fluoro-quinolones) and 100 h (gatifloxacin and levofloxacin versusciprofloxacin), the IE-log AUC24/MIC curves differ both interms of the slope (a) and the maximal IE (Ymax). For example,at an AUC24/MIC value of 125 h, the effect of moxifloxacin was35% greater than those of gatifloxacin and levofloxacin and47% greater than that of ciprofloxacin. As seen in Fig. 8, thedescribed differences were inherent in the relatively high sim-ulated AUC24/MIC ratios, whereas at the lower AUC24/MICratios no differences among the curves were detected.
DISCUSSION
Emergence of resistance. This study suggests that losses inthe susceptibility of S. aureus exposed to four different quino-lones occur at concentrations that fall into the MSW. The most
pronounced losses occurred at AUC24/MIC values of 25 to60 h, when TMSW was 20% of the dosing interval. No changesin susceptibility were associated with AUC24/MIC values below15 h (minimal bacterial killing) or above 200 h (maximal kill-ing). Although similar AUC24/MIC values might be consideredto protect against staphylococcal resistance (201 h for levo-floxacin, 222 h for moxifloxacin, 241 h for gatifloxacin, and244 h for ciprofloxacin), these values might (moxifloxacin) ormight not (other three quinolones) be achieved at their usualclinical doses.
The quinolone-independent AUC24/MIC relationship withresistance (as expressed by increases in MIC) was reflected bya bell-shaped curve with a maximum at the AUC24/MIC valueof 43 h (Fig. 6). This curve could be transformed into a sigmoidcurve by plotting the ratios of elevated MICs to the initialvalues, i.e., MIC72/MIC0 against TMSW (Fig. 6). The MIC72/MIC0 ratio correlated with TMSW regardless of whether quin-olone concentrations were above or below the MPCs. Similarcurves have been reported for another strain of S. aureus ex-posed to gatifloxacin in a study that simulated normal andimpaired quinolone elimination (Firsov et al., 42nd ICAAC).Moreover, the Gaussian function (equation 1) also fits re-ported resistance data on levofloxacin- and trovafloxacin-ex-posed B. fragilis (25) (Fig. 9). This leads to the assumption thatthe described pattern of the AUC24/MIC-resistance curve maybe quite general. Indirectly, this impression is supported by ouranalysis of resistance frequencies reported in a study of S.aureus exposed to norfloxacin and ciprofloxacin (1). As seen inFig. 10, these data are consistent with a bell-shaped curve,despite the use of different endpoints of resistance. The morepronounced resistance to norfloxacin at a relatively largeAUC24/MIC value (55 h) compared to a less pronounced re-sistance at a small AUC24/MIC value (3 h) no longer seems“paradoxical.” Also, the similar resistance frequencies atAUC24/MIC values of ciprofloxacin that vary 16-fold are quiteexplainable. Indeed, these data fit the simple idea that selective
FIG. 6. Resistance of S. aureus 201 related to the simulated AUC24/MIC value (left) and TMSW (right) for four fluoroquinolones (combineddata). For equation 1, a � 1.7, b � 0.18, and xc � 1.63. For equation 2, Ymax � 3.1, x0 � 43, and dx � 5.1.
1610 FIRSOV ET AL. ANTIMICROB. AGENTS CHEMOTHER.
on January 18, 2014 by guesthttp://aac.asm
.org/D
ownloaded from
pressure is absent below the MIC while rare double mutationsare required for growth above the MPC (35).
Given the bell-shaped pattern of the AUC24/MIC relation-ships with resistance, reported failures to correlate resistancewith AUC/MIC and Cmax/MIC values by using linear or log-linear regression are understandable. However, these failuresas well as the contradictory estimates of reported “protective”AUC/MIC and Cmax/MIC values might result from inadequatestudy design. Like traditional time-kill studies, most resistancestudies exposed one strain (26, 30) or a few similarly suscep-tible strains (1, 7, 20, 34) to clinical quinolone doses. As aresult, in these studies only one or two AUC24/MIC values foreach quinolone could be related to the observed resistance.Moreover, the majority of the simulated AUC24/MIC valueswere high enough to completely sterilize the unit, and neither
population analysis of antibiotic-exposed organisms nor re-peated susceptibility testing was possible. For example, in ex-periments with S. pneumoniae, repeated MIC determinationscould be made for only one or two of six fluoroquinolones (7,34). Overall, only 30 to 50% of the observations in these stud-ies provided useful information. It is fair to say that similarproblems also were inherent in more rigorously designed dose(AUC/MIC)-ranging studies (17, 18, 25, 27, 33). For example,in studies where S. pneumoniae (17), B. fragilis (25), and Bac-teroides thetaiotamicron (27) were exposed to wide ranges ofquinolone AUC24/MIC values, quantitative data could be ob-tained in only 10 to 66% of experiments. As a result, a “cor-respondence” between AUC/MIC values of �44 h (25) andAUC/MIC values of �100 h (29), which are associated with theselection of resistant mutants, was posited, adding further con-
FIG. 7. Kinetics of killing and regrowth of S. aureus 201 exposed to 3-day courses of moxifloxacin, gatifloxacin, levofloxacin, and ciprofloxacin.Boxed numbers indicate the simulated AUC24/MIC values (in hours).
VOL. 47, 2003 MUTANT SELECTION WINDOW HYPOTHESIS 1611
on January 18, 2014 by guesthttp://aac.asm
.org/D
ownloaded from
fusion to the picture. Given these limitations, reported “pro-tective” AUC/MIC or Cmax/MIC values (7, 25–27, 30, 34)should be considered cautiously.
Together with limited quantitative data, short-term observa-tions (typically, 1-day [20, 25–27, 33] or 2-day [7, 17, 18, 34]courses) may contribute to the controversial results. As shownin our study, resistance of S. aureus was first observed on thethird to fourth day of treatment and not earlier. A similarconclusion was drawn from a recent study with S. pneumoniaeand Pseudomonas aeruginosa exposed to 3-day courses of moxi-floxacin (A. MacGowan, and K. Bowker, 41st ICAAC): thelonger the treatment, the greater the resistance. This unequiv-ocal conclusion was possible due to the use of a novel index ofresistance, the area under the population analysis profile-timecurve.
The use of a relatively low starting inoculum—107 to 108
CFU (7, 18)—with few if any resistant mutants also mightresult in uncertain findings, because these inocula may containonly one resistant cell (35). It is not by chance that resistancedata obtained in a study with moxifloxacin- and levofloxacin-exposed S. aureus at a starting inoculum of 106 CFU/ml in a60-ml volume (6 � 107 CFU) (14) were less reproducible thanthose in the present study, where the starting inoculum was 6� 109 CFU.
Pharmacodynamics. As in a previous pharmacodynamicstudy of moxifloxacin and levofloxacin against a less-suscepti-ble strain of S. aureus at a lower starting inoculum (14), aspecific AUC24/MIC relationship with IE was inherent for eachof the four quinolones studied. This resulted in different anti-microbial effects of the quinolones at a given AUC24/MICratio. These differences were primarily seen at the high simu-lated AUC24/MIC ratios, whereas at lower AUC�/MIC ratios,no differences were detected among the curves. Similar pat-terns of the IE-versus-log AUC/MIC relationships were re-ported in a previous single-dose study with gemifloxacin andciprofloxacin against S. aureus (12).
Overall, the data obtained in this study are consistent withthe concept that resistant mutants are selectively enrichedwhen antibiotic concentrations fall inside the MSW. They alsosuggest that in vitro dynamic models can be used to predict therelative abilities of fluoroquinolones to prevent mutant selec-tion, although further studies with other organisms are needed.
ACKNOWLEDGMENTS
This study was supported in part by a grant from the Bayer Corpo-ration.
We are thankful to Xilin Zhao, who provided a detailed descriptionof the MPC testing procedure.
REFERENCES
1. Aeschlimann, J. R., G. W. Kaatz, and M. J. Rybak. 1999. The effects of NorAinhibition on the activities of levofloxacin, ciprofloxacin and norfloxacinagainst two genetically related strains of Staphylococcus aureus in an in-vitroinfection model. J. Antimicrob. Chemother. 44:343–349.
2. Bergan, T., and S. B. Thorsteinsson. 1986. Pharmacokinetics and bioavail-ability of ciprofloxacin, p. 111–121. In H. C. Neu and H. Weuta (ed.),
FIG. 8. AUC24/MIC-dependent antistaphylococcal effects of fluo-roquinolones fitted by equation 3. For moxifloxacin, a � 4.1, b � 7.1,Ymax � 607, and x50 � 1.7. For gatifloxacin, a � 2.9, b �5.7, Ymax � 595,and x50 � 2.0. For levofloxacin, a � 3.3, b � 6.1, Ymax � 550, and x50� 1.8. For ciprofloxacin, a � 4.7, b � 8.1, Ymax � 398, and x50 � 1.7.
FIG. 9. AUC24/MIC-dependent resistance of B. fragilis to levo-floxacin and trovafloxacin fitted by equation 1 (a � 10.1, b � 0.12, xc� 1.4). The graph presents combined data reconstructed from refer-ence 25. Resistance is expressed as the ratio of MIC24 to MIC0.
FIG. 10. AUC24/MIC-dependent resistance frequency of S. aureusafter a 48-h quinolone exposure. The bar graph presents data recon-structed from reference 1. Resistance is expressed as the area underthe reported resistance frequency-time curve. Dotted curve, MIC72/MIC0-versus-AUC24/MIC relationship obtained in the present study.
1612 FIRSOV ET AL. ANTIMICROB. AGENTS CHEMOTHER.
on January 18, 2014 by guesthttp://aac.asm
.org/D
ownloaded from
Proceedings of the 1st International Ciprofloxacin Workshop. Current Clin-ical Practice series 34. Elsevier Science Publishers B.V. (Excerpta Medica),Amsterdam, The Netherlands.
3. Blaser, J., B. B. Stone, M. C. Groner, and S. H. Zinner. 1987. Comparativestudy with enoxacin and netilmicin in a pharmacodynamic model to deter-mine the importance of ratio of antibiotic peak concentration to MIC forbactericidal activity and emergence of resistance. Antimicrob. Agents Che-mother. 31:1054–1060.
4. Chien, S.-C., A. T. Chow, J. Natarajan, R. R. Williams, F. Wong, M. C.Rogge, and R. K. Nayak. 1997. Absence of age and gender effects on thepharmacokinetics of a single 500-milligram oral dose of levofloxacin inhealthy subjects. Antimicrob. Agents Chemother. 41:1562–1565.
5. Chien, S.-C., A. T. Chow, M. C. Rogge, R. R. Williams, and C. W. Hendrix.1997. Pharmacokinetics and safety of oral levofloxacin in human immuno-deficiency virus-infected individuals receiving concomitant zidovudine. An-timicrob. Agents Chemother. 41:1765–1769.
6. Chien, S.-C., M. C. Rogge, L. G. Gisclon, C. Curtin, F. Wong, J. Natarajan,R. R. Williams, C. L. Fowler, W. K. Cheung, and A. T. Chow. 1997. Phar-macokinetic profile of levofloxacin following once-daily 500-milligram oralor intravenous doses. Antimicrob. Agents Chemother. 41:2256–2260.
7. Coyle, E. A., G. W. Kaatz, and M. J. Rybak. 2001. Activities of newerfluoroquinolones against ciprofloxacin-resistant Streptococcus pneumoniae.Antimicrob. Agents Chemother. 45:1654–1659.
8. Dudley, M. N., H. D. Mandler, D. Gilbert, J. Ericson, K. H. Mayer, and S. H.Zinner. 1987. Pharmacokinetics and pharmacodynamics of intravenous cip-rofloxacin. Studies in vivo and in an in-vitro model. Am. J. Med. 82(Suppl.4A):363–368.
9. Firsov, A. A., V. M. Chernykh, and S. M. Navashin. 1991. Quantitativeanalysis of antimicrobial effect kinetics in an in vitro dynamic model. Anti-microb. Agents Chemother. 34:1312–1317.
10. Firsov, A. A., I. Y. Lubenko, S. N. Vostrov, O. V. Kononenko, S. H. Zinner,and Y. A. Portnoy. 2000. Comparative pharmacodynamics of moxifloxacinand levofloxacin in an in vitro dynamic model: prediction of the equivalentAUC/MIC breakpoints and equiefficient doses. J. Antimicrob. Chemother.46:725–732.
11. Firsov, A. A., A. A. Shevchenko, S. N. Vostrov, and S. H. Zinner. 1998. Inter-and intraquinolone predictors of antimicrobial effect in an in-vitro dynamicmodel: new insight into a widely used concept. Antimicrob. Agents Che-mother. 42:659–665.
12. Firsov, A. A., S. N. Vostrov, I. Y. Lubenko, O. V. Kononenko, S. H. Zinner,and G. Cornaglia. 1999. A comparison of the AUC/MIC-response plots ofgemifloxacin and ciprofloxacin: critical value of the AUC/MIC ranges sim-ulated in an in vitro dynamic model. J. Antimicrob. Chemother. 44(Suppl.A):130.
13. Firsov, A. A., S. N. Vostrov, A. A. Shevchenko, and G. Cornaglia. 1997.Parameters of bacterial killing and regrowth kinetics and antimicrobial effectexamined in terms of area under the concentration-time curve relationships:action of ciprofloxacin against Escherichia coli in an in vitro dynamic model.Antimicrob. Agents Chemother. 41:1281–1287.
14. Firsov, A. A., S. H. Zinner, S. N. Vostrov, Y. A. Portnoy, and I. Y. Lubenko.2002. AUC/MIC relationships to different endpoints of the antimicrobialeffect: multiple-dose in vitro simulations with moxifloxacin and levofloxacin.J. Antimicrob. Chemother. 50:533–539.
15. Hoffken, G., H. Lode, C. Prinzing, K. Borner, and P. Koeppe. 1985. Phar-macokinetics of ciprofloxacin after oral and parenteral administration. An-timicrob. Agents Chemother. 27:375–379.
16. Hyatt, J. M., D. E. Nix, and J. J. Schentag. 1994. Pharmacokinetics andpharmacodynamic activities of ciprofloxacin against strains of Streptococcuspneumoniae, Staphylococcus aureus, and Pseudomonas aeruginosa for whichMICs are similar. Antimicrob. Agents Chemother. 38:2730–2737.
17. Klepser, M. E., E. J. Ernst, C. R. Petzold, P. Rhomberg, and G. V. Doern.2001. Comparative bactericidal activities of ciprofloxacin, levofloxacin, moxi-floxacin, and trovafloxacin against Streptococcus pneumoniae in a dynamic invitro model. Antimicrob. Agents Chemother. 45:673–678.
18. Lacy, M. K., W. Lu, X. Xu, P. R. Tessier, D. P. Nicolau, R. Quintiliani, andC. H. Nightingale. 1999. Pharmacodynamic comparisons of levofloxacin,ciprofloxacin, and ampicillin against Streptococcus pneumoniae in an in vitromodel of infection. Antimicrob. Agents Chemother. 43:672–677.
19. Lee, L.-J., B. Hafkin, I.-D. Lee, J. Hoh, and R. Dix. 1997. Effects of food and
sucralfate on a single oral dose of 500 milligrams of levofloxacin in healthysubjects. Antimicrob. Agents Chemother. 41:2196–2200.
20. Madaras-Kelly, K. J., and T. A. Demasters. 2000. In vitro characterization offluoroquinolone concentration/MIC antimicrobial activity and resistancewhile simulating clinical pharmacokinetics of levofloxacin, ofloxacin, or cip-rofloxacin against Streptococcus pneumoniae. Diagn. Microbiol. Infect. Dis.37:253–260.
21. Madaras-Kelly, K. J., A. J. Larsson, and J. C. Rotschafer. 1996. A pharma-codynamic evaluation of ciprofloxacin and ofloxacin against two strains ofPseudomonas aeruginosa. J. Antimicrob. Chemother. 37:703–710.
22. Madaras-Kelly, K. J., B. E. Ostergaard, L. B. Hovde, and J. C. Rotschafer.1996. Twenty-four-hour area under the concentration-time curve/MIC ratioas a generic predictor of fluoroquinolone antimicrobial effect by using threestrains of Pseudomonas aeruginosa and an in vitro pharmacodynamic model.Antimicrob. Agents Chemother. 40:627–632.
23. Marchbanks, C. R., J. R. McKiel, D. H. Gilbert, N. J. Robillard, B. Painter,S. H. Zinner, and M. N. Dudley. 1993. Dose ranging and fractionation ofintravenous ciprofloxacin against Pseudomonas aeruginosa and Staphylococ-cus aureus in an in vitro model of infection. Antimicrob. Agents Chemother.37:1756–1763.
24. Nakashima, M., T. Uematsu, K. Kosuge, H. Kusajima, T. Ooie, Y. Masuda,R. Ishida, and H. Uchida. 1995. Single- and multiple-dose pharmacokineticsof AM-1155, a new 6-fluoro-8-methoxy quinolone, in humans. Antimicrob.Agents Chemother. 39:2635–2640.
25. Peterson, M. L., L. B. Hovde, D. H. Wright, G. H. Brown, A. D. Hoang, andJ. C. Rotschafer. 2002. Pharmacodynamics of trovafloxacin and levofloxacinagainst Bacteroides fragilis in an in vitro pharmacodynamic model. Antimi-crob. Agents Chemother. 46:203–210.
26. Peterson, M. L., L. B. Hovde, D. H. Wright, A. D. Hoang, J. K. Raddatz, P. J.Boysen, and J. C. Rotschafer. 1999. Fluoroquinolone resistance in Bacte-roides fragilis following sparfloxacin exposure. Antimicrob. Agents Che-mother. 43:2251–2255.
27. Ross, G. H., D. H. Wright, L. B. Hovde, M. L. Peterson, and J. C. Rotschafer.2001. Fluoroquinolone resistance in anaerobic bacteria following exposureto levofloxacin, trovafloxacin, and sparfloxacin in an in vitro pharmacody-namic model. Antimicrob. Agents Chemother. 45:2136–2140.
28. Stass, H. H., A. Dalhoff, D. Kubitza, and U. Schuhly. 1998. Pharmacokinet-ics, safety, and tolerability of ascending single doses of moxifloxacin, a new8-methoxy quinolone, administered to healthy subjects. Antimicrob. AgentsChemother. 42:2060–2065.
29. Thomas, J. K., A. Forrest, S. M. Bhavnani, J. M. Hyatt, A. Cheng, C. H.Ballow, and J. J. Schentag. 1998. Pharmacodynamic evaluation of factorsassociated with the development of bacterial resistance in acutely ill patientsduring therapy. Antimicrob. Agents Chemother. 42:521–527.
30. Thorburn, C. E., and D. I. Edwards. 2001. The effect of pharmacokinetics onthe bactericidal activity of ciprofloxacin and sparfloxacin against Streptococ-cus pneumoniae and the emergence of resistance. J. Antimicrob. Chemother.48:15–22.
31. Vostrov, S. N., O. V. Kononenko, I. Y. Lubenko, S. H. Zinner, and A. A.Firsov. 2000. Comparative pharmacodynamics of gatifloxacin and ciprofloxa-cin in an in vitro dynamic model: prediction of equiefficient doses and thebreakpoints of the area under the curve/MIC ratio. Antimicrob. AgentsChemother. 44:879–884.
32. Wise, R., D. Lister, C. A. M. McNulty, D. Griggs, and J. M. Andrews. 1986.The comparative pharmacokinetics of five quinolones. J. Antimicrob. Che-mother. 18(Suppl. D):71–81.
33. Wright, D. H., S. M. Gunderson, L. B. Hovde, G. H. Ross, A. S. Ibrahim, andJ. C. Rotschafer. 2002. Comparative pharmacodynamics of three newerfluoroquinolones versus six strains of staphylococci in an in vitro modelunder aerobic and anaerobic conditions. Antimicrob. Agents Chemother.46:1561–1563.
34. Zhanel, G. G., M. Walters, N. Laing, and D. J. Hoban. 2001. In vitropharmacodynamic modelling simulating free serum concentrations of fluo-roquinolones against multidrug-resistant Streptococcus pneumoniae. J. Anti-microb. Chemother. 47:435–440.
35. Zhao, X., and K. Drlica. 2001. Restricting the selection of antibiotic-resistantmutants: a general strategy derived from fluoroquinolone studies. Clin. In-fect. Dis. 33(Suppl. 3):S147–S156.
VOL. 47, 2003 MUTANT SELECTION WINDOW HYPOTHESIS 1613
on January 18, 2014 by guesthttp://aac.asm
.org/D
ownloaded from