In vitro digestion behavior of complex formulations for clinical ...
60
In vitro digestion behavior of complex formulations for clinical nutrition applications based on model systems Francina Maria Payeras Perelló Master’s Thesis Master’s degree in chemical science and technology (With a speciality/Itinerary biological chemistry) at the UNIVERSITAT DE LES ILLES BALEARS Academic year 2015-2016 Date September 2016 UIB Master’s Thesis Autor: Francina Maria Payeras Perelló UIB Master’s Thesis Supervisor: Juan Jesús Fiol Arbós UIB Master’s Thesis Co-Supervisor (if required): Críspulo Gallegos Montes
-
Upload
khangminh22 -
Category
Documents
-
view
1 -
download
0
Transcript of In vitro digestion behavior of complex formulations for clinical ...

In vitro digestion behavior of complex formulations for clinical nutrition applications based on model systems
Francina Maria Payeras Perelló
Master’s Thesis
Master’s degree in chemical science and technology
(With a speciality/Itinerary biological chemistry)
at the
UNIVERSITAT DE LES ILLES BALEARS
Academic year 2015-2016
Date September 2016
UIB Master’s Thesis Autor: Francina Maria Payeras Perelló
UIB Master’s Thesis Supervisor: Juan Jesús Fiol Arbós
UIB Master’s Thesis Co-Supervisor (if required): Críspulo Gallegos Montes

Francina Maria Payeras Perelló Master’s thesis 2/60
INDEX:
1. ABSTRACT ................................................................................................................. 3
2. INTRODUCTION ....................................................................................................... 5
2.1. Human gastrointestinal digestion .......................................................................... 5
2.2. In vitro digestion .................................................................................................... 7
2.3. Enzymes .............................................................................................................. 18
2.4. Starch digestion ................................................................................................... 27
3. MATERIALS AND METHODS .............................................................................. 30
3.1. Preparation of model systems .............................................................................. 30
3.2. Determination of enzyme activity ....................................................................... 31
3.3. Static digestion method ....................................................................................... 37
3.4. Dynamic digestion method .................................................................................. 39
3.5. Determination of glucose concentration .............................................................. 43
4. RESULTS AND DISCUSSION ................................................................................ 44
4.1. Determination of enzyme activities ..................................................................... 44
4.2. Static digestion method ....................................................................................... 47
4.3. Dynamic digestion method .................................................................................. 50
4.4. Comparison between static and dynamic digestion method ................................ 53
5. CONCLUSIONS ........................................................................................................ 56
5.1. Following steps .................................................................................................... 56
6. ACKNOWLEDGEMENTS ...................................................................................... 57
7. REFERENCES .......................................................................................................... 58

Francina Maria Payeras Perelló Master’s thesis 3/60
1. ABSTRACT
In vitro digestion methods simulating digestion processes are widely used to study the
gastro-intestinal behavior of food or pharmaceuticals. In vitro digestion methods typically
include the oral, gastric, and small intestinal phases, and occasionally the large intestinal
phase. These methods try to mimic physiological conditions in vivo, taking into account
the presence of digestive enzymes and their concentrations, pH, digestion time, and
temperature, among other factors.
In vitro digestion methods have been used to address such diverse scientific questions as
the digestibility and bio-accessibility of pharmaceuticals, mycotoxins, and
macronutrients such as proteins, carbohydrates, and lipids. Bio-accessibility provides an
indication for the maximum of bioavailability via the oral route and is an important
parameter. In this master’s thesis two different methods were studied:
- Static digestion method: Static in vitro digestion models use sequential exposure to
simulate digestion in different compartments (mouth, stomach, and intestine). During
each step, the substrate is incubated for a specific time with the appropriate simulated
digestive fluids. The pH is generally maintained at a fixed value by using a pH-stat or a
buffer.
- Dynamic digestion method: Dynamic in vitro digestion models reproduce the gradual
transit of ingested compounds through the gastrointestinal tract more. The system
reproduces the temperature, pH changes, gastric emptying, addition of simulated fluids
and dialysis of digestion end products.
To carry out this thesis three different carbohydrate sources were selected, Maltodextrin
DE 11 – 16, Tapioca Dextrin and Modified starch, and all of them are starch derivatives.
To carry out different studies like the study of digestibility, bio-accessibility, volume
effect, matrix effect, etc. the static and dynamic digestion methods were used.
The obtained results show that Maltodextrin DE 11 – 16 liberates more amount of glucose
than Tapioca Dextrin and Modified starch and the results also show the dependency
between length chain and digestibility. The comparison of the static and dynamic
digestion method show that there are no big differences between the recovery obtained
from each method. The obtained results of the study of volume effect suggest that is
possible use smaller volumes with static digestion method, which is important to save
resources. And the results obtained with the study of matrix effect indicate that the
matrixes used do not affect the digestibility of Tapioca Dextrin and the pre-treatment of
the meal favors the release of glucose.
The objectives of this thesis are the following:
- Study of digestibility and bio-accessibility of three different carbohydrate
sources: this is of interest because with this study the amount of released glucose
from the different sources (in a time-dependent manner) can be obtained. The
released glucose represents available glucose for intestinal absorption. In vivo,
this glucose levels would impact on the blood glucose levels and is of special
interest for products intended for patients with diabetes.

Francina Maria Payeras Perelló Master’s thesis 4/60
- Study matrix effect: clinical nutrition products for enteral root are rarely including
only polysaccharides, but also contain macro- and micronutrients. In those
complex mixtures it is most likely that matrix could affect digestibility of the
contained polysaccharides. For this reason, the effect of different matrixes was
also studied.
- Comparison between two different digestion methods: this part of the thesis
should reveal advantages and drawbacks of each method, and, those results should
serve as the basis of decision for the application of each system in future.
- Study volume effect: this part of the study is focused on the used static digestion
method and intents to determine the impact of the used reaction volume and to
explore the potential to save resources.
Francina Maria Payeras Perelló Master’s thesis 5/60
2. INTRODUCTION
Human digestion is a complex process essential for health wherein ingested food is broken into
nutrients that can be used by the body for growth, cell maintenance, and fuel. During human
digestion, two main processes occur simultaneously:
- Mechanical transformations that reduce the size of the food particles.
- Enzymatic transformations where macromolecules are hydrolyzed into smaller
constituents that are absorbed into the bloodstream.
Food disintegration mainly occurs in the mouth and stomach, whereas enzymatic digestion and
absorption of nutrients and water take place mainly in the small and large intestine.
The digestive system is central to numerous questions raised by researchers and industrials in
various fields such as nutrition, toxicology, pharmacology and microbiology1.
2.1. Human digestion
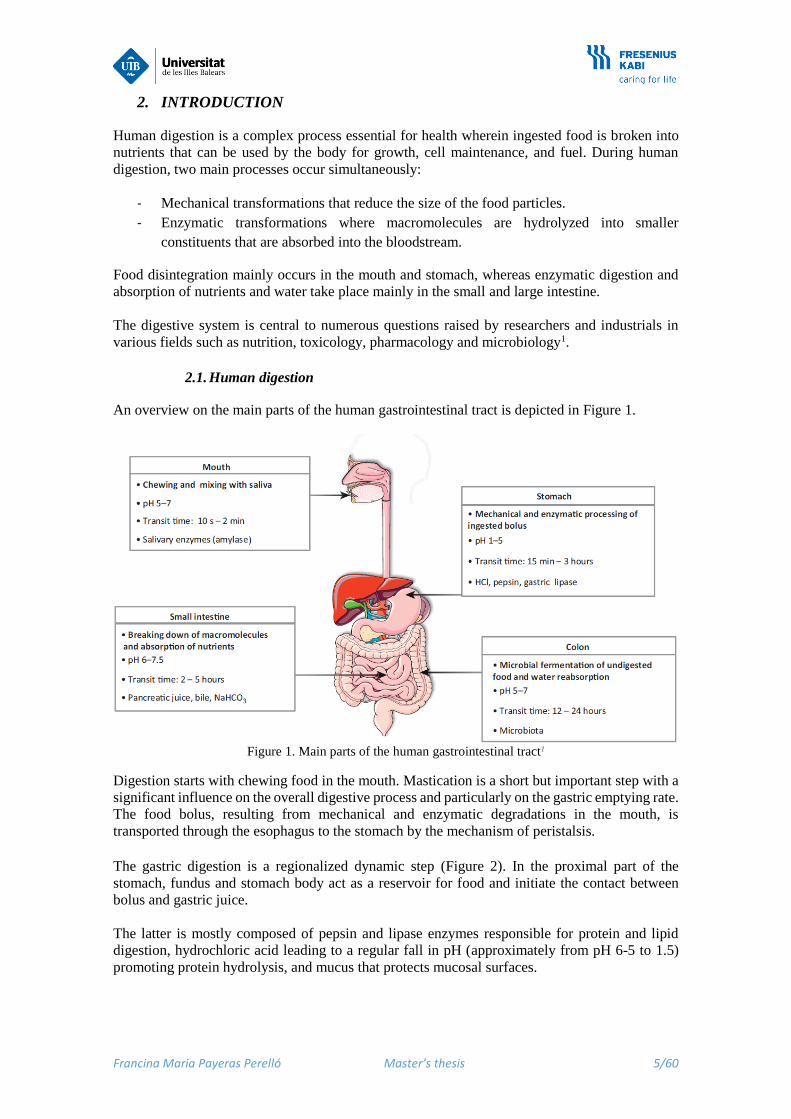
An overview on the main parts of the human gastrointestinal tract is depicted in Figure 1.
Figure 1. Main parts of the human gastrointestinal tract1
Digestion starts with chewing food in the mouth. Mastication is a short but important step with a
significant influence on the overall digestive process and particularly on the gastric emptying rate.
The food bolus, resulting from mechanical and enzymatic degradations in the mouth, is
transported through the esophagus to the stomach by the mechanism of peristalsis.
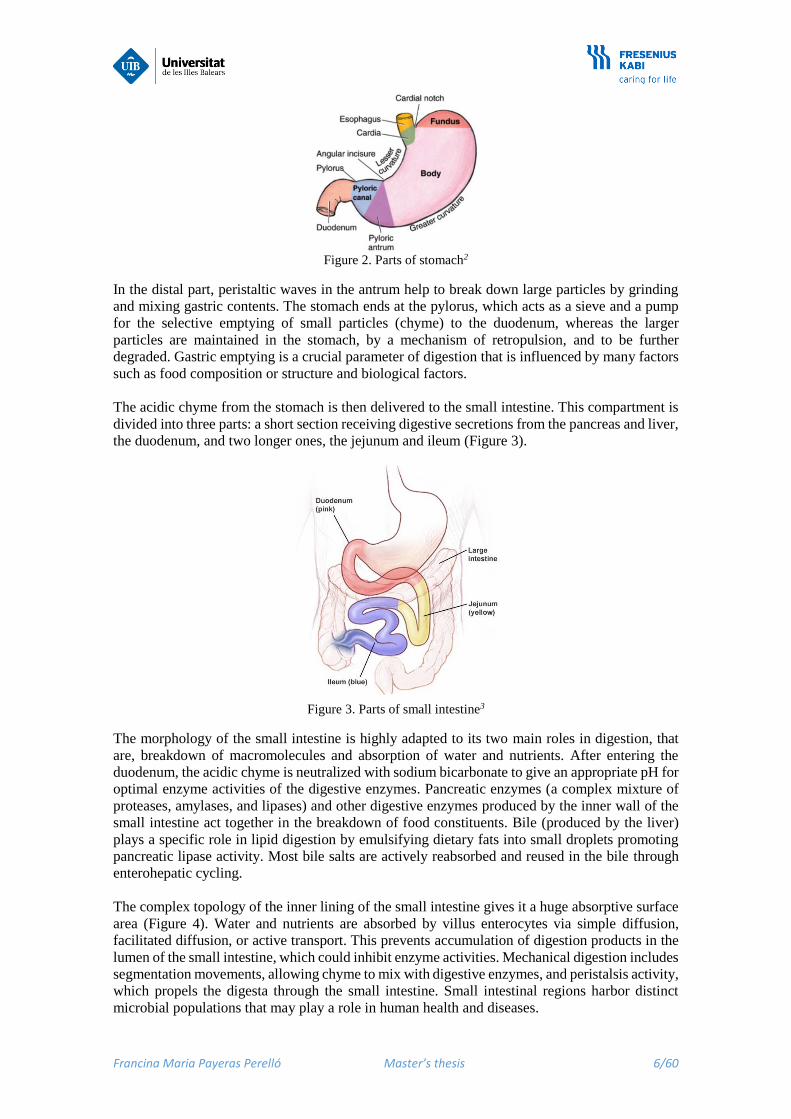
The gastric digestion is a regionalized dynamic step (Figure 2). In the proximal part of the
stomach, fundus and stomach body act as a reservoir for food and initiate the contact between
bolus and gastric juice.
The latter is mostly composed of pepsin and lipase enzymes responsible for protein and lipid
digestion, hydrochloric acid leading to a regular fall in pH (approximately from pH 6-5 to 1.5)
promoting protein hydrolysis, and mucus that protects mucosal surfaces.
Francina Maria Payeras Perelló Master’s thesis 6/60
Figure 2. Parts of stomach2
In the distal part, peristaltic waves in the antrum help to break down large particles by grinding
and mixing gastric contents. The stomach ends at the pylorus, which acts as a sieve and a pump
for the selective emptying of small particles (chyme) to the duodenum, whereas the larger
particles are maintained in the stomach, by a mechanism of retropulsion, and to be further
degraded. Gastric emptying is a crucial parameter of digestion that is influenced by many factors
such as food composition or structure and biological factors.
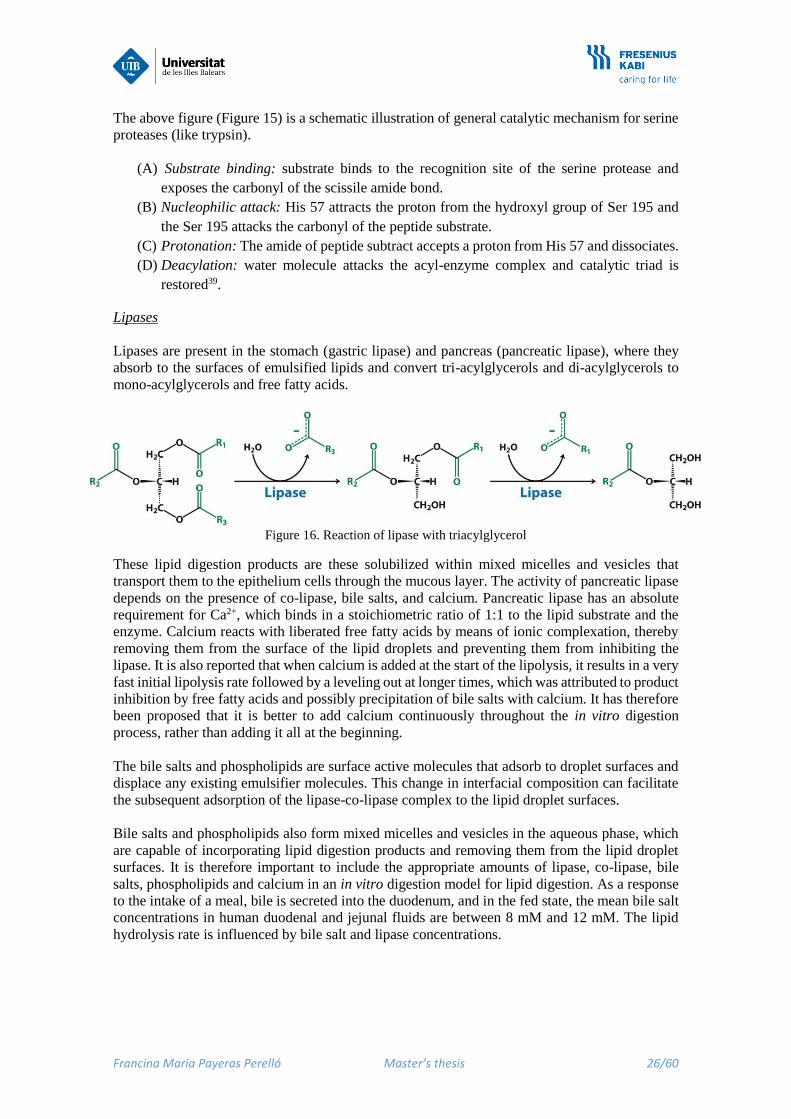
The acidic chyme from the stomach is then delivered to the small intestine. This compartment is
divided into three parts: a short section receiving digestive secretions from the pancreas and liver,
the duodenum, and two longer ones, the jejunum and ileum (Figure 3).
Figure 3. Parts of small intestine3
The morphology of the small intestine is highly adapted to its two main roles in digestion, that
are, breakdown of macromolecules and absorption of water and nutrients. After entering the
duodenum, the acidic chyme is neutralized with sodium bicarbonate to give an appropriate pH for
optimal enzyme activities of the digestive enzymes. Pancreatic enzymes (a complex mixture of
proteases, amylases, and lipases) and other digestive enzymes produced by the inner wall of the
small intestine act together in the breakdown of food constituents. Bile (produced by the liver)
plays a specific role in lipid digestion by emulsifying dietary fats into small droplets promoting
pancreatic lipase activity. Most bile salts are actively reabsorbed and reused in the bile through
enterohepatic cycling.
The complex topology of the inner lining of the small intestine gives it a huge absorptive surface
area (Figure 4). Water and nutrients are absorbed by villus enterocytes via simple diffusion,
facilitated diffusion, or active transport. This prevents accumulation of digestion products in the
lumen of the small intestine, which could inhibit enzyme activities. Mechanical digestion includes
segmentation movements, allowing chyme to mix with digestive enzymes, and peristalsis activity,
which propels the digesta through the small intestine. Small intestinal regions harbor distinct
microbial populations that may play a role in human health and diseases.

Francina Maria Payeras Perelló Master’s thesis 7/60
Figure 4. Small intestine villi4
Non-absorbed material travels further down to the large intestine (colon). The main functions of
the colon are absorption of water and electrolytes, fermentation of undigested polysaccharides
and proteins by colonic microbiota, reabsorption of bile salts, and formation, storage, and
elimination of feces.
The main digestive processes, such as gastric emptying intestinal transit, secretion of digestive
fluids and mucus, and motility are closely controlled by hormonal and neural regulation
mechanisms. Digestive hormones may enhance or inhibit the secretory activity of glandular
organs and the contractions of smooth muscles. Both the autonomic and enteric nervous systems
are involved in the regulation of digestion processes.
Glucose is a major source of energy in our body, but unfortunately, free glucose is relatively rare
in natural human typical diet. Instead, glucose is locked up in many larger forms, including lactose
and sucrose, where two small sugars are connected together and long chains of glucose like
starches and glycogen. One of the major tasks of digestion is to break these chains into their
individual glucose units, which are then delivered by the blood to hungry cells throughout your
body.
2.2. In vitro digestion
Testing foods and new developed products requires on the availability of digestion models that
accurately simulate the complex physicochemical and physiological events that occur in the
human gastrointestinal tract.
In vivo feeding methods, using animals or humans, usually provide the most accurate results, but
they are time consuming, costly and imply ethical restrains, which is why much effort has been
devoted to the development in vitro procedures5. In principle, in vitro digestion models provide a
useful alternative to animal and human models by rapidly screening food ingredients. The ideal
in vitro digestion method would provide accurate results in a short time6 and could thus serve as
a tool for rapid of screening foods or food delivery systems with different compositions and
structures. In practice, any in vitro method is inevitably going to fail to match the accuracy that
can be achieved by actually studying a food in vivo due to the inherent complexity of the
process6,7. Consequently, some compromise is needed between accuracy and ease of utilization
of any in vitro digestion model.
During the past few years, the scientists have utilized a number of in vitro digestion models to
test the structural and chemical changes that occur in different foods under simulated
gastrointestinal conditions8.
In general, in vitro experiments are less expensive, are easy to perform, and, are not limited by
ethical constrains. They are not hampered by biological variation among subjects, they allow
studies with toxic compounds or doses, and they permit the variation of experimental conditions9.
Several factors, such as sample characteristics, enzyme activity, ionic composition, applied
mechanical stresses, and digestion times, have significant influences on the results of in vitro
digestion methods. Therefore, in vivo conditions can never be completely simulated under in vitro
conditions5.

Francina Maria Payeras Perelló Master’s thesis 8/60
In the last 10 years there have been many studies related to in vitro digestion models for foods.
There were important differences in these studies, which depended on the specific food
component being analyzed, the nature of the food matrix, and the sophistication of the in vitro
digestion model used. The survey8 (Hur et al) found that the most predominant food samples
tested using in vitro digestion models were: plant-based foods, such as starch, tea, rice, or bread
(45%); meats (18%); dairy foods (9%); marine foods (9%); and emulsions (9%).
Table 1 gives an overview on differences in between used methods dealing with starch digestion.
Table 1. In vitro digestion studies with starch
Study Measurement parameters Enzymes or chemicals Digestion
times References
Starch digestibility Hydrolysis, kinetics of
starch digestion Alpha-amylase 0 – 180 min 10
Starch digestion Digestion rate of starch,
concentration of starch
Pepsin, alpha-amylase,
amyloglucosidase 0 – 15 h 11
Digestion of starch
Digestion coefficients and
characteristics, digestion of
horse beans
Pepsin, enzyme cocktail
(pancreatin and
amyloglucosidase)
30 min
0 – 6 h 12
Alpha-amylase
digestion of starches
Transmission electron
microscopy, size-exclusion
chromatograms
Pancreatic amylase 2h 13
In vitro digestion of
starch Percent digestion of starch Alpha-amylase 0 – 24 h 14
Develop a model
stomach system and
to investigate the
kinetics of food
disintegration
Food disintegration and
stomach emptying,
disintegration and texture
change, kinetic parameters
Alpha-amylase, mucin,
pepsin
30 sec
2 h 15
The in vitro digestion models surveyed also differed from one another in their operation:
- The number and type of steps included in the digestion sequence, e.g., mouth, stomach,
small intestine, large intestine.
- The composition of the digestive fluids used in each step, e.g., enzymes, salts, buffers,
biological polymers, and surface-active components.
- The mechanical stresses and fluid flows utilized in each step in the digestion sequence,
e.g., magnitude and direction of applied stresses, flow geometries, and flow profiles.
The characteristics of foods, enzyme type, and enzyme concentrations are key factors that control
the digestion of foods during in vitro digestion. In vitro digestion characteristics such as digestion
time, enzyme contents or enzyme composition must be adjusted according to sample
characteristics.
In vitro digestion models do not usually take the large intestine into account, because the human
digestion (and absorption) of compounds mainly takes place in the small intestine16.

Francina Maria Payeras Perelló Master’s thesis 9/60
Several researchers have used in vitro digestion methods to analyze structural changes,
bioavailability, and digestibility of foods, indicating that in vitro digestion systems are common
and useful tools for analyses of foods and drugs8.
The most common parameters measured in in vitro digestion studies were:
digestibility /degradation > bio-accessibility > sample stability > structural changes
Bio-accessibility as an indicator of bioavailability via the oral ingestion route
- Bio-accessibility: fraction of ingested component released from food matrix and available
for intestinal absorption (typically based on in vitro procedures) (Figure 5).
- Bioavailability: fraction of ingested component available for utilization in normal
physiological functions that reaches the target organ or systemic circulation (determined
by in vivo assays) (Figure 5).
Bioavailability of ingested components is an
extremely important area of food and pharmaceutical
research. The main issue is to determine which
fraction of e.g. ingested nutrients, food pollutants, or
drugs can be really used by the organism to exert their
health or deleterious effects.
Bioavailability of ingested components is under the
dependence of numerous factors such as dosage form,
food matrix or food processing, and gastrointestinal
parameters. In vivo approaches (blood sampling)
provide direct data on bioavailability, but present
major drawbacks of cost and variability in individual
physical states. Animal studies are often limited by
differences in digestion and absorption capacity
between animals and humans. In vitro gastric and
small intestinal models provide a suitable alternative
to in vivo assay by determining the bio-accessibility of
an ingested substance, that is, the amount available for
absorption in the gut1.
Figure 5. Differences between bio-accessibility
and bioavailability1
Gastric and small intestinal models as relevant tools for nutrition and health studies
- Nutrient bio-accessibility
In vitro digestion tools have been extensively used to determine the bio-accessibility of ingested
nutrients. Reported studies range from macronutrients to micronutrients such as vitamins,
minerals, or phytoconstituents. Such approaches are particularly relevant to assess the effects of
the chemical form of the nutrient, food structure, interactions with other food components,
thermal, physical, or biological processing, and transit time. In addition, in vitro models have
emerged as relevant tools for global analysis of nutritious components released during digestion,
also known as ‘nutriomic’ analysis.

Francina Maria Payeras Perelló Master’s thesis 10/60
Compared with static systems, dynamic models include specific parameters, such as stomach
emptying rate or gastrointestinal transit time, which may greatly influence the bio-accessibility of
ingested substances by affecting their release from the food matrix, their solubility and their
stability in the digestive lumen. Knowledge of the various factors influencing nutrient bio-
accessibility would be helpful when designing functional foods or establishing process conditions
that maximize the health benefits of bioactive compounds.
- Safety assessment of food constituents
Food intake supplies nutrients essentials for life to the body, but is also a source of substances
that can have adverse effects on health, such as pollutants (e.g., heavy metals, polychlorinated
biphenyls, and polycyclic aromatic hydrocarbons) or allergens (proteins mainly found in milk,
eggs, peanuts, or fish). Both substance classes are considered as major concerns of food safety.
Among in vitro gastric and small intestinal models, the static mono-compartmental model is
specifically dedicated to the evaluation of food pollutants bio-accessibility. Most studies have
been carried out on soil samples because their oral ingestion is a major route of human exposure,
especially in young children. The fraction of contaminant mobilized during digestion depends
crucially on soil parameters and particle size. Bio-accessibility of food pollutants is also affected
by many other parameters: food matrix and food structure, chemical form and concentration of
pollutant, and digestive parameters such as pH or bile salts. Multi-compartmental systems offer
the possibility of gaining further insight into the metabolism of pollutants by following their fate
through the digestive tract.
- Drug development and testing
The oral route is the one most frequently used for the administration of drugs in humans due to
its safety, reduced cost, and high degree of patient compliance, but it is also the most complex
way for an active pharmaceutical ingredient (API) to enter the body. USP (United States
Pharmacopeia) standard methods are routinely applied for disintegration, dissolution, and drug
release studies, but involve a static, closed environment, remote from in vivo complexity. To
investigate further some aspects of drug pharmacokinetics, this approach was improved by adding
mechanical forces or combining dissolution and absorption models.
However, these models do not simulate the continuous changes in luminal conditions that widely
impact drug bioavailability. To predict better in vivo performance of oral formulations, dynamic
in vitro models have been used to investigate the effect of dosage form, feeding state, drug
interaction, and transit time on API bio-accessibility. Bi- or multi-compartmental models are
particularly relevant when following drug precipitation in the intestine or assessing the
performance of controlled-release formulations.
Although multi-compartmental systems remain more complex to use and more costly than
established compendial dissolution, they generate better in vitro/in vivo correlations (IVIVCs).
Their potential has been fully exploited in the development of innovative drug delivery systems
based on genetically engineered microorganisms.

Francina Maria Payeras Perelló Master’s thesis 11/60
In vitro models
Most of the in vitro models developed until 1995 have been dedicated to a single application and
include a limited number of simulated parameters. As has been proposed by Longland17, the
following five aspects should be taken into account when devising new in vitro models of the
gastrointestinal tract:
- Sequential use of enzymes in physiological amounts.
- Appropriate pH for the enzymes and addition of relevant co-factors such as bile salts and
co-enzymes.
- Removal of the products of digestion.
- Appropriate mixing at each stage of digestion.
- Physiological transit times for each step of digestion.
Many attempts to model the human stomach and small intestine have been made in the past two
decades. Most of these in vitro tools are static, include a limited number of simulated parameters,
and are dedicated to a particular application.
However, to simulate the complex physiological and physicochemical events occurring within
the upper human digestive tract, it is crucial to expose a meal to each step of digestion with
realistic transit time, pH and enzymatic conditions.
Consequently, a few dynamic bi-compartmental or multi-compartmental models have been
developed and applied in a large number of studies. Despite their complexity, the gastric and
small intestinal models described so far remain simplified compared to the in vivo situation: they
do not include feedback mechanisms, resident microbiota, immune system, or specific hormonal
controls. Further efforts and technological innovations are therefore needed to improve in vitro
models and keep up with the growing interest of industry researchers.
A wide range of gastric and small intestinal systems has been designed to study the fate of orally
ingested substances, from single static bioreactors to multi-compartmental and dynamic systems.
- Static mono-compartmental models (same reaction vessel)
Static models are the most widespread digestive systems. The gastric phase is reproduced by
pepsin hydrolysis of homogenized food, under fixed pH and temperature, for a set period of time
(e.g. pH 1–2, 37°C, 1–3 h). This step may be followed, in the same bioreactor, by an intestinal
phase involving pancreatic enzymes with or without bile (pH 6–7). Most of these models have
been developed for specific applications and are cheap high-throughput tools, particularly
relevant for large prescreening approaches. Several models were designed to assess the
digestibility of protein, starch, and the bio-accessibility of carotenoids and pollutants.
The United States Pharmacopeia (USP) apparatus dissolution testes also provides a static, closed
environment, widely used to assess dosage form disintegration and dissolution in single medium
reproducing digestive conditions, both gastric (Simulated Gastric Fluid) and intestinal (Simulated
Intestinal Fluid). However, in this approach, large volumes of media are often deployed and the
mechanical forces (continuous stirring) are not representative of complex peristaltic movements.
Other static mono-compartmental models include additional parameters such as mechanical
forces or removal of digestion end products.
However, none of these static models reproduce the dynamic processes occurring during human
digestion such as gastric emptying or continuous changes in pH and secretion flow rates.

Francina Maria Payeras Perelló Master’s thesis 12/60
Table 2 gives an overview of an example of static digestion model.
Table 2. Static mono-compartmental model1
System Schematic representation
Bo
dy
tem
per
atu
re
Fal
l o
f g
astr
ic
pH
Co
ntr
ol
of
inte
stin
al p
H
Gas
tric
emp
tyin
g
Inte
stin
al
tran
sit
Dig
esti
ve
secr
etio
ns
Ch
ym
e m
ixin
g
Inte
stin
al
mic
rob
iota
Inte
stin
al
abso
rpti
on
Static mono-compartmental
Oomen
+ - - - -
Saliva
Gastric
juice
Pancreatic
juice
Bile
Head-
over-
heels
rotator
- -
Oomen is an experimental digestive model developed by Oomen et. al. (2001) 18 to investigate
the effects of a soil matrix on oral bioavailability.
Various digestion models have been proposed, often impeding the possibility to compare results
across research teams. In 2014 consensus method was presented from a scientist and industrial
network (Minekus et al. (2014)19) proposing a general standardized and practical static digestion
method based on physiologically relevant conditions that can be applied for various endpoints,
which may be amended to accommodate further specific requirements. A frameset of parameters
including the oral, gastric and small intestinal digestion are outlined and their relevance discussed
in relation to available in vivo data and enzymes.
To agreement with the requirement for simplicity but not oversimplification, the consensus static
model uses ionic composition endogenous surfactants and enzyme activity that are fixed at the
start of the experiment. The method comprises up to three stages that mimic the oral, gastric and
small intestinal phases of human digestion in vivo.
- Dynamic mono-compartmental models (one organ)
To overcome these limitations, several dynamic gastric models have been developed. One model
developed by Hoebler et. al. (2002)20 reproduces, based on in vivo data, the progressive
acidification of gastric content by HCl addition, the time course of pepsin flow rate and gastric
emptying.
The Dynamic Gastric Model (DGM) was designed to take into account the region specificity of
the stomach. It is composed of two successive compartments:
The ‘body’ where gastric secretions are mixed with food.
The ‘antrum’ where shear forces and stomach grinding are reproduced.
The gastric emptying is regulated by a valve that allows the smallest particles to leave the
stomach, whereas the bigger ones are refluxed into the top chamber to be further digested. Despite
its complexity, the DGM does not accurately reproduce the in vivo peristaltic forces.
The Human Gastric Simulator (HGS), composed of a latex chamber surrounded by a mechanical
driving system, more effectively emulates the peristaltic movements of the stomach in amplitude,
intensity, and frequency.

Francina Maria Payeras Perelló Master’s thesis 13/60
An overview of mono-compartmental systems is given in Table 3.
Table 3. Dynamic mono-compartmental model1
System Schematic representation
Bo
dy
tem
per
atu
re
Fal
l o
f g
astr
ic
pH
Co
ntr
ol
of
inte
stin
al p
H
Gas
tric
emp
tyin
g
Inte
stin
al
tran
sit
Dig
esti
ve
secr
etio
ns
Ch
ym
e m
ixin
g
Inte
stin
al
mic
rob
iota
Inte
stin
al
abso
rpti
on
Dynamic mono-compartmental
DGM
+ + NA + NA
Gastric
juice
HCl
Water
pressure
Piston/Barrel
NA NA
HGS
+ + NA + NA
Saliva
(mixed with
food)
Gastric
juice (HCl)
Mechanical
driving
device
NA NA
Although these systems are particularly relevant for gastric digestion studies, they only provide a
partial insight into gastric and small intestinal digestion. In vivo, the stomach and small intestine
form separate compartments dedicated to a specific function in digestion, such as mixing,
degradation of macromolecules, or nutrient absorption. To study accurately the fate of a digested
compound, it is therefore particularly important to expose the meal to each step of digestion, with
a realistic transit time. In response, bi- and multi-compartmental dynamic systems were
developed.
- Dynamic bi- and multi-compartmental models
Based on in vivo data, computer-controlled bi-and/or multi-compartmental systems reproduce the
temperature, pH changes in the gastric and duodenal compartments, gastric emptying, addition of
pepsin, pancreatic juice and bile, and dialysis of digestion end products. These systems have been
mostly standardized and validated for specific applications, such as the study of alkaline activity
or the survival of probiotics.
To date, the TIM-1 (TNO Gastro-Intestinal Model 1) is the only gastric and small intestinal
system characterized as ‘full’, that is, combining multi-compartmentalization and dynamism, and
that is commercially available.
This model is composed of stomach and three parts of the small intestine, the duodenum, jejunum,
and ileum. It integrates key parameters of human digestion: temperature, kinetics of gastric and
intestinal pH, gastric and ileal deliveries, transit time, peristaltic mixing and transport, sequential
addition of digestive secretions, and passive absorption of water and small molecules through a
dialysis system. TIM-1 is so far the system that allows the closest simulation of in vivo dynamic
events occurring throughout the human gastric and small intestinal lumen. It has been applied in
a large number of nutritional, toxicological, pharmaceutical, and microbiological studies.
In this multi-compartmental dynamic system, bio-accessibility is determined by measuring the
fraction of a compound that has passed the dialysis or filtration membrane.

Francina Maria Payeras Perelló Master’s thesis 14/60
The effect of variability of a specific condition on digestion within a population can be tested by
changing only this specific condition in the digestive protocol. The reproducible conditions allow
comparison of different compounds under the same conditions and do not need as many replicates
as are necessary to obtain sufficient statistical power for in vivo studies.
An overview of dynamic bi and multi-compartmental systems is given in Table 4.
Table 4. Dynamic bi and multi-compartmental models
System Schematic representation
Bo
dy
tem
per
atu
re
Fal
l o
f g
astr
ic
pH
Co
ntr
ol
of
inte
stin
al p
H
Gas
tric
emp
tyin
g
Inte
stin
al
tran
sit
Dig
esti
ve
secr
etio
ns
Ch
ym
e m
ixin
g
Inte
stin
al
mic
rob
iota
Inte
stin
al
abso
rpti
on
Dynamic bi-compartmental
Vatier
+ - + + +/- HCl
NaHCO3
Magnetic
stirrers - -
Mainville
+ + + + - Bile
HCl
Magnetic
stirrers - -
Dynamic multi-compartmental
TIM
+ + + + +
Saliva
(mixed with
food)
Gastric
juice
Pancreatic
juice
Bile
Electrolytes
HCl
NaHCO3
Water
pressure - +
Computer program and mathematical modelling (TIM-1, TNO Gastro-Intestinal Model 1)
TIM-1 computer program has been designed to accept parameters and data obtained from in vivo
studies in animals or human volunteers, such as the quantity and duration of a meal, the pH curves
for the stomach and duodenum, secretion rates into the different compartments, water absorption
from the small intestine and gastric and ileal delivery into the duodenum and colon. To control
the transit of chyme, a power exponential formula for gastric and ileal delivery is used, as
described by Elashoff et al.21:
𝑓 = 1 − 2−(
𝑡
𝑡1 2⁄)𝛽
𝑓′ = 2−(
𝑡
𝑡1 2⁄)𝛽
Equation 1. Power exponential formula for gastric and ileal delivery
Where t is the time, f’ represents the fraction of the meal remaining in the stomach at time t, f
represents the fraction of meal delivered, t1/2 is the time from the start of the meal until 50% of
the meal has emptied and β determines the shape of the curve. For β = 1, the power exponential
is the same as the restricted simple exponential. For a curve with an initial lag in emptying, β is >
1 and this type of curve is often seen for solid meals, where the initial lag phase may represent
the time to grind the food into smaller particles. A value of β < 1 describes a curve with a very
rapid initial emptying followed by a s slower emptying phase.

Francina Maria Payeras Perelló Master’s thesis 15/60
(a) Simple exponential emptying, 𝑓′ = 2−(
𝑡
𝑡1 2⁄),
with t1/2 = 30, 60, 90 min (b) Power exponential emptying, 𝑓′ = 2
−(𝑡
𝑡1 2⁄)𝛽
,
with t1/2 = 10, 60 min, β = 0.5, 2
Graph 1. Stomach delivery representations (a) 𝛽 = 1, for subjects who have undergone ulcer operations,
(b) 𝛽 < 1, for liquid meals and 𝛽 > 1, for solid meals
This formula offers a method for controlling the gastric and ileal delivery in the model, with only
two parameters to describe the curve.
Digestion time
An important factor influencing the digestion time is the nature of the sample being tested. It is
known that large food particles move through the stomach more slowly than smaller ones.
Particles need to be small enough (<1mm) to pass through the pylorus valve separating the
stomach and small intestine. A swallowed food containing large particles therefore requires a
longer incubation time in the stomach.
The digestion time for each step (e.g., mouth, stomach, and small intestine) is an important factor
to establish when designing an appropriate in vitro digestion model. In vivo, the digestion time
depends upon individual characteristics (age, sex, health status, mental state, time of day) and
food properties (total amount, composition, particle size, viscosity), and may vary quite
considerably22. Lipids in the gastrointestinal tract delay the gastric emptying. Therefore, in the
case of testing high-lipid food samples, enzymes (lipase or pancreatin) and bile salt/phospholipid
amounts and digestion time should be increased in an in vitro digestion system. The transit time
or digestion time must be considered according to the food characteristics8.
In vitro-In vivo correlation
In vitro-in vivo correlations in digestion models are extremely important23. Validation of the
developed in vitro digestion models for consumer products is difficult, because human in vivo
data from consumer products with contaminants are scarce16. It was reported that the in vitro
solubilization data correlated well with the in vivo data for lipid-based drug samples. However,
several studies showed that in vivo feeding studies demonstrated large differences in the
microstructure of emulsions as they pass through the gastrointestinal tract depending on
emulsifier type8.
- Static models in relation to in vivo conditions
Static models use a relatively dilute digestive mixture that is well homogenized using a stirrer,
shaker or impeller. Although this does not reflect the mixing of gastric content in vivo, it exposes
all substrates to the set point pH and related enzyme activities, and allows representative samples
to be taken.

Francina Maria Payeras Perelló Master’s thesis 16/60
The complete meal with simulated gastric digestive fluid is exposed to a fixed pH during a fixed
period. Generally, the gastric pH is maintained around 2, which may be the right value for the
fasting state but does not reflect the pH after intake of a meal. Whether or not a static gastric
digestion is adequate depends on the effect of each physiological parameter on the digestion and
intended endpoint.
The omission of gastric lipase during the gastric step, might not be fully adequate for mimicking
the complete process of gastrointestinal lipolysis as for example preliminary digestion of dietary
triglycerides by gastric lipase is known to further trigger pancreatic lipase activity on lecithin-
stabilized emulsions in vitro. In other cases, incubation at pH 2 during 1 h might lead to a complete
peptic digestion, while this is not the case during a much milder exposure in vivo.
In the duodenum, the chyme that is gradually emptied from the stomach, is neutralized with
bicarbonate, and mixed with bile and pancreatic juice. Bile is primarily important to emulsify fat
and to form mixed micelles that solubilize and transport lipophilic products to the gut wall for
absorption. During transit of approximately 3 h through the small intestine, substrates and enzyme
to substrate ratios are changing due to the digestion and absorption of digestive products and
water. The major drawback of small intestinal static models is that they do not include removal
of digestive products during the digestion process, which may cause product inhibition of
enzymes. This is generally overcome by using non physiological low substrate concentrations in
a dilute system.
Limitations and challenges in modeling human gastric and small intestinal digestion
Despite their potential and broad applicability, gastric and small intestinal systems are hindered
by their inability to mimic fully the overall processes occurring in vivo, particularly hormonal and
nervous control, feedback mechanisms, mucosal cell activity, complexity of peristaltic
movements, and involvement of the local immune system. Yet simulating the complexity of the
human gastrointestinal tract remains a crucial challenge and scientific and technological efforts
need to be joined to pursue improvement and validation of in vitro digestive tools.
The mayor limitations and challenges in modeling human digestion are given in Table 5.
Table 5. Major limitations and challenges in modeling human digestion1
Limitations Challenges
No host response factors. Combination of gastric and small intestinal
models with human intestinal cells.
No accurate model of complex mechanical
forces.
Improvement of peristalsis and gastrointestinal
motility.
No accurate reproduction of complex gastric
emptying pattern.
Differential gastric emptying of solids and
liquids.
Absence of microbial ecosystem. Integration of resident microbiota in the small
intestinal compartments.
No simulation of the overall digestive
process.
Serial combination of gastric and small intestinal
models with masticatory and colonic systems.
Reproduction of healthy adults conditions by
most of gastric and small intestinal models.
Development of age related or pathological
gastric and small intestinal models.
Biological significance of in vitro
experiments. Crucial need for in vitro-in vivo correlations.

Francina Maria Payeras Perelló Master’s thesis 17/60
To simulate digestion process more accurately, a combinatorial approach involving in vitro
models and intestinal microorganism in culture has been proposed. This approach, which
integrates active and facilitated transport processes as well as brush border enzyme activities, has
already been used for a more relevant prediction of nutrient, drug, and food pollutant
bioavailability. Recent studies have also investigated the effect of in vitro digesta on intestinal
cell proliferation24 and inflammatory pathways to assess the potential anti-carcinogenic or anti-
inflammatory properties of ingested substances.
So far, gastric and small intestinal systems have mainly mimicked physicochemical conditions of
digestive lumen and gastrointestinal transit, and reproduce real forces in play during digestion
less accurately. Physiological contractions are difficult to simulate due to high complexity in
frequency and strength. In most of the current models, chyme is simply mixed with an impellor,
a magnetic stirrer or a shaking bath, which does not allow any assessment of the importance of
mechanical forces on food or dosage form disintegration25. Hence, one of the major challenges in
in vitro digestion is to simulate as accurately as possible the peristalsis and realistic shape and
motility of gastric and small intestinal compartments.
Interestingly, newly developed gastric and small intestinal models should also reproduce the
biphasic gastric emptying curves observed in vivo, where emptying of solid food components
presents a linear pattern starting after a lag phase, whereas emptying of liquids begins immediately
in an exponential manner.
In addition, gastric and small intestinal models are currently devoid of intestinal microorganisms.
With the growing interest in assessing interactions between ingested compounds and resident
microbiota and the great potential of ‘-omics’ technologies, another major advance would be to
inoculate the resident microbiota in the small intestinal compartments of gastric and small
intestinal models.
Although multi-compartmental systems have been developed, none of them includes all the steps
from mouth to large intestine. The SHIME (Simulator of Human Intestinal Microbial Ecosystem)
integrates the whole gastrointestinal tract from the stomach to colon but has been more
specifically design to study the interactions of food components with human resident microbiota.
Oral processing is particularly difficult to simulate, and most in vitro studies lack this step or use
an oversimplified homogenization procedure. As bolus properties strongly impact the gastric
phase and subsequent steps in digestion, it is critically important to use a bolus with relevant
physicochemical and textural properties during in vitro digestions.
Therefore, in a more holistic view of the human digestion process, gastric and small intestinal
systems should be used in combination with models mimicking the oral phase and large intestinal
conditions. An ultimate approach would be to develop a model integrating all the stages of
digestion.
A major concern for in vitro models is providing an accurate estimation of the in vivo situation.
As a result of the great complexity of the human gastrointestinal tract, none of them can truly
replace in vivo experiments and a careful interpretation of results is always required.
In vitro/in vivo correlations, which reliably associates in vitro and in vivo data, remains a high
priority to validate in vitro results. In addition, comparison between in vitro systems is
complicated and it is difficult to ascertain which of the current models provides the most accurate
values in terms of the human situation. Hence, selection of the most appropriate model requires
careful evaluation of the study objectives to assess the advantages and limitations afforded by
each type of system, and a compromise between technical complexity and physiological relevance
has often to be made1.

Francina Maria Payeras Perelló Master’s thesis 18/60
2.3. Enzymes
The most frequently utilized enzymes and other biological molecules used within in vitro
digestion models were pepsin, pancreatine, trypsin, chymotrypsin, peptidase, α-amylase and
lipase8.
The types of enzyme included within an in vitro digestion model tend to reflect the major food
components being investigate. For example, to study the lipid digestion in oil-in-water emulsions,
researches utilized only pancreatic lipase26.
It should be noted that different enzymes are usually added sequentially, rather than all together,
so as to stimulate the different steps of the digestive process. It should also be noted that enzymes
often require additional components within the digestive fluids to operate efficiently, for example
pancreatic lipase requires the presence of calcium and bile salts5.
Finally, it should be noted that the activity of an enzyme preparation may decrease over time
(enzymes when dissolved into solution are much less stable than in powder form and lose their
activity), and so it is important to prepare them freshly for each study.
The concentration and composition of enzymes are also very important factors to consider when
designing in vitro digestion models. The levels of enzymes depend on the mental state, age and
health status, the time of day the food is consumed, and the type and amount of food consumed8.
Therefore, several factors, such as concentration, temperature, pH, stability, activators, inhibitors,
and incubation time, affect enzyme activities5.
Digestion of the major foodstuffs is an orderly process involving the action of a large number of
digestive enzymes. Some of these enzymes are found in the secretions of the salivary glands, the
stomach and the exocrine portion of the pancreas. Other enzymes are found in the luminal
membranes and the cytoplasm of the cells that line the small intestine. The action of some
enzymes is aided by the hydrochloric acid secreted by the stomach and the bile secreted by the
liver.
Table 6 gives an overview of the principal digestive enzymes.
Table 6. Principal digestive enzymes ((the corresponding pro-enzymes are shown in parentheses)27
Source Enzyme Activator Substrate Catalytic function or products
Salivary
glands
Salivary α-
amylase Cl- Starch
Hydrolyzes 1,4α linkages,
producing α-limit dextrins,
maltotriose and maltose
Stomach Pepsin
(pepsinogen) HCl
Proteins and
polypeptides
Cleave peptide bonds adjacent
to aromatic aminoacids

Francina Maria Payeras Perelló Master’s thesis 19/60
Source Enzyme Activator Substrate
Catalytic
function or
products
Exocrine
pancreas
Trypsin (trypsinogen) Enteropeptidase Proteins and
polypeptides
Cleaves peptides
bonds adjacents
to arginine or
lysine
Chymotrypsins
(chymotrypsinogen) Trypsin
Proteins and
polypeptides
Cleave peptide
bonds adjacent to
aromatic
aminoacids
Pancreatic lipase Triglycerides Monoglycerides
and fatty acids
Pancreatic α-amylase Cl- Starch
Hydrolyzes 1,4α
linkages,
producing α-limit
dextrins,
maltotriose and
maltose
Ribonuclease RNA Nucleotides
Deoxyribonuclease DNA Nucleotides
Phospholipase A
(prophospholipase A) Trypsin Lecithin Lysolecithin
Glucosidases
- Alpha-amylase
Amylase is present in the mouth and small intestine and is mainly responsible for the conversion
of starches to oligosaccharides and monosaccharides (e.g. glucose). Amylase is routinely used for
in vitro digestion studies of plant-based food samples.
Saliva plays a vital role in maintaining the health of the oral cavity and gastrointestinal tract by
aiding in lubrication, inhibiting potentially harmful microbes, and promoting oral tissue healing.
Whether saliva also plays an important role in the digestion and metabolism of food is currently
unknown. The presence of high concentrations of the enzyme α-amylase has led to the hypothesis
that saliva could be important for the digestion of complex carbohydrates8.
Amylase is a digestive enzyme produced by the salivary glands and pancreas that cleaves the
glycosidic linkages in starch molecules to produce smaller saccharides, such as maltotriose,
maltose, and small amounts of glucose.

Francina Maria Payeras Perelló Master’s thesis 20/60
Figure 6 gives the mechanism of alpha-amylase with starch.
Figure 6. Reaction between alpha-amylase and starch
Salivary amylase can account for up to 50% of total salivary protein in some individuals, whereas
others produce barely detectable concentrations. Such substantial variation in amylase production
is due to both environmental (e.g., stress) and genetic factors, such as copy number variation in
AMY140, the gene that codes for salivary amylase.
It is known that considerable starch hydrolysis occurs within s in the oral cavity and can also
continue after swallowing, because partially digested starch protects salivary amylase from acid
inactivation28. In vivo digestion studies demonstrate that delivery of starch directly into the small
intestine, thereby skipping the oral digestion stage, results in substantially less starch digestion
and glucose absorption. In addition, postprandial blood glucose concentrations following
ingestion of starchy foods, such as rice and potatoes, are lower when the food is swallowed whole,
rather than chewed first, mixed with saliva, and then swallowed29.
Two similar types of amylase are made in human body, one is secreted in saliva, where it starts
to break down starch grains when it chewed, and the other is secreted by the pancreas, where it
finishes starch digestion. Then, these little pieces are broken into individual glucose units by a
collection of enzymes that are tethered to the walls of the intestine.
Figure 7. Structure of alpha-amylase (a) pancreatic (b) saliva
The active site of alpha-amylase contains a trio of acidic groups (colored white and red) which
they are primarily responsible for the digestion of starch. In the amylase shown here (Figure 8)
glutamate 233, aspartate 197, and aspartate 300 work together to cleave the connection between
two sugars in a starch chain. This structure contains a short chain of five sugar units (colored
yellow and orange) bound in the active site.
The site of cleavage is shown in pink. A calcium ion, shown as a large gray sphere, is found
nearby where it stabilizes the structure of the enzyme. A chloride ion, shown as a green sphere,
is bound underneath the active site in many amylases, where it may assist the reaction30.

Francina Maria Payeras Perelló Master’s thesis 21/60
Figure 8. Active site of alpha-amylase31
The generally accepted catalytic mechanism of the α-amylase family is that of the α-retaining
double displacement (each step passes through an oxocarbonium ion-like transition state). The
mechanism of alpha-amylase involves two catalytic residues in the active site; a glutamic acid as
acid/base catalyst and an aspartate as the nucleophile. It involves five steps:
- After the substrate has bound in the active site, the glutamic acid in the acid form donates
a proton to the glycosidic bond oxygen, i.e. the oxygen between two glucose molecules
at the subsites −1 and +1 and the nucleophilic aspartate attacks the C1 of glucose at subsite
−1.
- An oxocarbonium ion-like transition state is formed followed by the formation of a
covalent intermediate.
- The protonated glucose molecule at subsite +1 leaves the active site while a water
molecule or a new glucose molecule moves into the active site and attacks the covalent
bond between the glucose molecule at subsite −1 and the aspartate.
- An oxocarbonium ion-like transition state is formed again.
- The base catalyst glutamate accepts a hydrogen from an incoming water or the newly
entered glucose molecule at subsite +1, the oxygen of the incoming water or the newly
entered glucose molecule at subsite +1 replaces the oxocarbonium bond between the
glucose molecule at subsite −1 and the aspartate forming a new hydroxyl group at the C1
position of the glucose at subsite −1 (hydrolysis) or a new glycosidic bond between the
glucose at subsite −1 and +1 (transglycosylation).
Studies with cyclodextrin glycosyltransferase have shown that the intermediate indeed has a
covalently linked bond with the enzyme32.
Proteases
Proteases are mainly present in the stomach (pepsin) and small intestine (trypsin and
chymotrypsin) where they are responsible for breaking down proteins/peptides into smaller
peptides and amino acids. The daily pepsin secretion in adults is 20–30 kU of enzyme activity at
37°C, equivalent to around 10 mg (of pepsin), while a typical adult dietary intake of protein
comprises around 75 g/24 h, giving a pepsin/protein ratio of 1:7500.

Francina Maria Payeras Perelló Master’s thesis 22/60
Abdel-Aal (2008)33 found that the three-enzyme (trypsin, chymotrypsin, and peptidase) one-step
digestion gave approximately 39–66% higher protein digestibility than that obtained by the two-
enzyme (pepsin and pancreatin) two-step digestion method depending on the type of product and
the method used for determining protein hydrolyzates. Therefore, Abdel-Aal (2008) suggested
that the three-enzyme digestion method is more comparable to in vivo conditions. Thus, they
assume that in vitro digestion methods that use complex enzymes (e.g., a mix of saliva, gastric
juice, duodenal juice or bile juice) have the advantage of being more reproducible than those that
use single enzymes. Therefore, enzyme composition and concentrations may be influenced by the
characteristics of the sample. Several studies showed that the number and type of proteolytic
enzymes, digestion conditions, and analysis of protein hydrolyzates employed in in vitro digestion
produced different digestibility results (Abdel-Aal, 2008). An increase in dietary protein induces
an increased secretion of pancreatic proteolytic enzymes, while an increase in starch or lipid
intake induces may increase secretions of amylase and lipase, respectively.
- Pepsin
Pepsin is an enzyme belonging to the family of aspartic protease enzymes. All members of this
class of enzymes have two aspartic acid residues within their structure that act as the active site.
For the most part, this class of enzymes is active at acid pH. In the case of pepsin, the pH of
optimal activity is extremely acid, between 1 and 4. The specific reaction catalyzed by pepsin is
the acid hydrolysis of the peptide bond. This reaction will break down proteins into smaller units
to enable the digestive process.
Pepsin demonstrates an unusual property for an enzyme; it does not actually form chemical bonds
with its substrate. The unique aspect of the pepsin mechanism is the ability of the two aspartic
acids at the reaction site to simultaneously act as both an acid and a base.
Figure 9. Active site of pepsin
The backbone structure above (Figure 9) has been adjusted to illustrate the location of Asp32 and
Asp215. The general structure consists of one amino acid strand that folds itself into two, almost
identical lobes.
Pepsinogen (Figure 10) is similar in composition to pepsin but it contains 44 additional amino
acid residues that prohibit the enzyme reactive site from functioning. The acid conditions of the
stomach cause the pepsinogen to alter its structure and become the activated enzyme, pepsin. The
top space-filing model below represents pepsinogen. The 44 residue chain is colored in green.
This effectively masks the active site of pepsin. Once the active site is cleared, the enzyme can
begin its work on protein cleaving.

Francina Maria Payeras Perelló Master’s thesis 23/60
Figure 10. Structure of pepsinogen and pepsin
The reaction mechanism for the catalyzed hydrolysis of a peptide bond by pepsin:
Figure 11. Mechanism of reaction of pepsin34
In Figure 11 (a), the carboxyl ends of the aspartic acid residues at 215 and 32. Even though they
have the same formula, they have different pKa values. This is due to the different residues
surrounding each aspartic acid.
In Figure 11 (a), the Asp32 is deprotenated while Asp215 still retains its proton. Water will
nucleophillically attack the carbonyl carbon of the substrate while Asp32 accepts a proton from
the water and Asp215 donates a proton to the carbonyl carbon of the substrate. The intermediate
(Figure 11 (b)) that is formed is called an amide dehydrate. This intermediate accepts a proton
from Asp215. This action cleaves the peptide bond in the substrate. The final step of the
mechanism, not pictured in the diagram above is one in which the proton on Asp32 is transferred
to Asp21534.
- Trypsin
Trypsin is a proteolytic enzyme, important for the digestion of proteins. In humans, the protein is
produced in its inactive form, trypsinogen, within the pancreas. Trypsinogen enters the small
intestine, via the common bile duct, where it converted to active trypsin.
Figure 12. Structure of trypsinogen and trypsin with trypsin inhibitor (red)35

Francina Maria Payeras Perelló Master’s thesis 24/60
The digestion of proteins is a complex process. First it is created the enzyme in an inactive
form (termed a zymogen), and it is activated once it is in the intestine. Trypsin is built with
an extra piece of protein chain, colored in green in the structure on the left (Figure 12). This
longer form of trypsin, called trypsinogen, is inactive and cannot cut protein chains. Then,
when it enters the intestine, the enzyme entero-peptidase makes one cut in the trypsin chain.
The pancreas produces a small protein, trypsin inhibitor (shown in red), that binds to any
traces of active trypsin that might be present before it is secreted into the intestine. It binds to
the active site of trypsin, blocking its action but not itself being cut into tiny pieces.
Figure 13. Active site of trypsin35
The active site (Figure 13) is formed by a serine amino acid that is activated by a histidine
and an aspartate. Together, these three amino acids have been termed the charge relay system.
The histidine and the aspartate assist in the removal of the hydrogen atom from the serine
(colored white), which makes it more reactive when attacking the target protein chain. The
site of cleavage in this inhibitor, colored green here, is held just far enough away that it is not
cleaved the way most proteins would be in this location. Notice also the long lysine amino
acid extending down to the lower right from the cleavage site, where it interacts with another
aspartate in the enzyme (shown down in the lower right corner with red oxygens). Through
this interaction, trypsin favors cutting at places next to lysine or arginine amino acids36.
Figure 14. A schematic representation of trypsin interacting with a peptide substrate

Francina Maria Payeras Perelló Master’s thesis 25/60
The catalytic residues (His57, Asp 102 and Ser195, yellow) and the enzyme residues that
contact substrate residues are shown (blue). The positively charged arginine side chain at
position P1 of the substrate is attracted by the negatively charged aspartate 189. This
interaction as well as five enzyme-substrate hydrogen bonds at positions P1 and P3 and
glycine 193 help to position the scissile peptide bond (red) for the nucleophilic attack by the
polarized hydroxyl group of Ser 195 (red arrow)37.
Trypsin is a protein that degrades proteins, therefore it can degrade itself: a process called
autolysis. Autolysis is important for the regulation of trypsin levels within living organisms.
This regulation is assisted by Ca2+ ions, which bind to trypsin (at the Ca2+ binding loop) and
protect the molecule against autolysis. In living organisms, autolysis is controlled and
normally does not cause problems. However, when working with trypsin in vitro, the process
of autolysis often poses some problems. For in vitro processes that require the use of trypsin,
such as working with cell cultures or manufacturing insulin, trypsin's degradation can become
expensive as active trypsin gets "used up". Developing mutant trypsin that does not auto-
degrade could be of great use for researchers.
There are several sites on the trypsin molecule at where autolysis is known to occur. Research
has been done to investigate these sites, because the inability of trypsin to self-degrade has
been linked to human hereditary pancreatitis. This deadly disease is believed to occur due to
inappropriate activation of trypsin within the pancreas. This results in the autodigestion of
pancreatic tissue.
Trypsin cleaves a terminal hexapeptide from trypsinogen to yield a single-chain beta-trypsin.
Subsequent autolysis produces other active forms having two or more peptide chains. The
two predominant forms of trypsin are alpha-trypsin, which has two peptide chains bound by
disulfide bonds, and beta-trypsin38.
Figure 15. Mechanism of reaction of trypsin39
Francina Maria Payeras Perelló Master’s thesis 26/60
The above figure (Figure 15) is a schematic illustration of general catalytic mechanism for serine
proteases (like trypsin).
(A) Substrate binding: substrate binds to the recognition site of the serine protease and
exposes the carbonyl of the scissile amide bond.
(B) Nucleophilic attack: His 57 attracts the proton from the hydroxyl group of Ser 195 and
the Ser 195 attacks the carbonyl of the peptide substrate.
(C) Protonation: The amide of peptide subtract accepts a proton from His 57 and dissociates.
(D) Deacylation: water molecule attacks the acyl-enzyme complex and catalytic triad is
restored39.
Lipases
Lipases are present in the stomach (gastric lipase) and pancreas (pancreatic lipase), where they
absorb to the surfaces of emulsified lipids and convert tri-acylglycerols and di-acylglycerols to
mono-acylglycerols and free fatty acids.
Figure 16. Reaction of lipase with triacylglycerol
These lipid digestion products are these solubilized within mixed micelles and vesicles that
transport them to the epithelium cells through the mucous layer. The activity of pancreatic lipase
depends on the presence of co-lipase, bile salts, and calcium. Pancreatic lipase has an absolute
requirement for Ca2+, which binds in a stoichiometric ratio of 1:1 to the lipid substrate and the
enzyme. Calcium reacts with liberated free fatty acids by means of ionic complexation, thereby
removing them from the surface of the lipid droplets and preventing them from inhibiting the
lipase. It is also reported that when calcium is added at the start of the lipolysis, it results in a very
fast initial lipolysis rate followed by a leveling out at longer times, which was attributed to product
inhibition by free fatty acids and possibly precipitation of bile salts with calcium. It has therefore
been proposed that it is better to add calcium continuously throughout the in vitro digestion
process, rather than adding it all at the beginning.
The bile salts and phospholipids are surface active molecules that adsorb to droplet surfaces and
displace any existing emulsifier molecules. This change in interfacial composition can facilitate
the subsequent adsorption of the lipase-co-lipase complex to the lipid droplet surfaces.
Bile salts and phospholipids also form mixed micelles and vesicles in the aqueous phase, which
are capable of incorporating lipid digestion products and removing them from the lipid droplet
surfaces. It is therefore important to include the appropriate amounts of lipase, co-lipase, bile
salts, phospholipids and calcium in an in vitro digestion model for lipid digestion. As a response
to the intake of a meal, bile is secreted into the duodenum, and in the fed state, the mean bile salt
concentrations in human duodenal and jejunal fluids are between 8 mM and 12 mM. The lipid
hydrolysis rate is influenced by bile salt and lipase concentrations.

Francina Maria Payeras Perelló Master’s thesis 27/60
Digestive enzymes
The most appropriate composition and concentration of enzymes, such as lipase, pepsin, trypsin,
and a-amylase, used within an in vitro digestion model must be considered for each specific food
sample. As mentioned above, several studies have utilized enzymes collected from human
subjects.
However, several studies have suggested that the replacement of human pancreatic lipase and co-
lipase with porcine pancreatic lipase and co-lipase is generally acceptable. Thus, it may be very
difficult to define which enzymes are better for in vitro digestion, and more research is needed in
order to analyze the advantages and disadvantages of using enzymes from human subjects.
Various in vitro methods have been developed to predict the digestibility or physiological changes
of food samples. However, predicting the bioavailability and digestion from the food matrix is
very difficult, as it depends on many factors associated with food composition and structure.
Usually, in vitro methods are based upon starch digestion by a-amylase, lipid digestion by lipase,
and/or protein digestion by pepsin or trypsin. Gastric digestion is imitated using pepsin at pH
around 2. The protease precursors – pepsinogens – produced by chief cells of the stomach, are
optimally activated at a pH between 1.8 and 3.2 in the gastric lumen. This indicates that any
elevation in the pH may result in a limitation of peptic degradation. Bile salt did not inhibit the
lipolytic activity at pH 5.5. Moreover, the changes in the pH in the stomach and intestine can be
influenced by the initial pH or amount of the samples tested. Thus, pH is also an important factor
for in vitro digestion systems. Therefore, the choice of enzyme characteristics such as
composition, concentration, and pH should be considered according to sample characteristics8.
2.4. Starch digestion
Starch is the main source of digestible carbohydrate in the human diet and as such, is the major
source of glucose that appears at relatively high concentrations in the blood circulation following
intestinal digestion of a starch-containing meal. The first stage in the metabolism of starch is
catalyzed by salivary alpha-amylase which progressively brings about hydrolysis of the
polysaccharide resulting in the production of maltose, maltotriose and limit dextrins as the main
products. Considerable differences, however, can occur in the postprandial blood glucose and the
corresponding insulin response, to the ingestion of different foods containing identical amounts
of starch. That such differences occur is evidence of large variations in the rate and extent of
starch digestion in the gastrointestinal tract. Attenuating the fluctuations in postprandial
glycaemia and insulinaemia is important in the prevention and treatment of life-style associated
diseases, notably diabetes mellitus and cardiovascular disease, and also has implications for
obesity management40.
A considerable interest exists for foods containing slow release carbohydrate from the
gastrointestinal tract because they contribute to improve diabetic control and reduce serum lipid
levels41.
The principal dietary carbohydrates (Flow chart 1) are polysaccharides, disaccharides, and
monosaccharides. Starches (glucose polymers) and their derivatives are the polysaccharides that
are digested to any degree in the human gastrointestinal tract. In glycogen, the glucose molecules
are mostly in long chains (glucose molecules in α 1,4 linkage), but there is some chain branching
(produced by α 1,6 linkages). Amylopectin, which constitutes 80-90% of dietary starch, is similar
but less branched, whereas amylose is a straight chain with only α 1,4 linkages. Glycogen is found
in animals, whereas amylose and amylopectin are of plant origin. The disaccharides lactose (milk
sugar) and sucrose (table sugar) are also ingested, along with the monosaccharides fructose and
glucose.

Francina Maria Payeras Perelló Master’s thesis 28/60
Flow chart 1. Types of carbohydrates
Deficiency of disaccharidases leads to diarrhea, bloating, and flatulence after ingestion of sugar.
The diarrhea is due to the increased number of osmotically active oligosaccharide molecules that
remain in the intestinal lumen, causing the volume of the intestinal contents to increase. The
bloating and flatulence are due to the production of gas (CO2 and H2) from disaccharide residues
in the lower small intestine and colon.
Studies on the digestion of carbohydrates and consequent glucose plasma levels are important for
diabetic patients, obesity control and designing sport foods. As an alternative to expensive and
time consuming human trials, a rapid in vitro method has been developed to predict the glycemic
response after intake of carbohydrates (Bellmann et al. 2010)42.
Absorption of carbohydrates
Hexoses (monosaccharide with six carbon atoms) and pentoses (monosaccharide with five carbon
atoms) are rapidly absorbed across the wall of the small intestine. Essentially all of the hexoses
are removed before the remains of a meal reach the terminal part of the ileum. The sugar
molecules pass from the mucosal cells to the blood in the capillaries draining into the portal vein.
The transport of some sugars (monosaccharides such as glucose) is uniquely affected by the
amount of Na+ in the intestinal lumen; a high concentration of Na+ on the mucosal surface of the
cells facilities and a low concentration inhibits sugar influx into the epithelial cells. It now appears
that glucose and Na+ share the same carrier molecule. Intracellular Na+ is low, and Na+ moves
into the cell along its concentration gradient. Glucose moves with the Na+ and is released in the
cell.
Figure 17. Mechanism for glucose transport across intestinal epithelium

Francina Maria Payeras Perelló Master’s thesis 29/60
The Na+ is transported into the lateral intercellular spaces, and the glucose diffuses into the
interstitium and hence to the capillaries. Thus, glucose transport is an example of sary active
transport, the energy for glucose transport is provided indirectly, by the active transport of Na+
out of the cell. This maintains the concentration gradient across the luminal border of the cell, so
that more Na+ and consequently more glucose can reach the intracellular. The glucose mechanism
also transports galactose. Fructose utilizes a different carrier, and its absorption is independent of
Na+ or the transport of glucose and galactose; it is transported instead by facilitated diffusion.
Some fructose is converted to glucose in the mucosal cells.
Pentoses are absorbed by simple diffusion27.
Diabetes Mellitus
Diabetes mellitus is a group of metabolic diseases characterized by hyperglycemia resulting from
defects in insulin secretion, insulin action or both. The chronic hyperglycemia of diabetes is
associated with long-term damage, dysfunction, and failure of various organs, especially the eyes,
kidneys, nerves, heart, and blood vessels.
Several pathogenic processes are involved in the development of diabetes. These range from
autoimmune destruction of the β-cells of the pancreas with consequent insulin deficiency to
abnormalities that result in resistance to insulin action. The basis of the abnormalities in
carbohydrate, fat and protein metabolism in diabetes is deficient action of insulin on target tissues.
Deficient insulin action results from inadequate insulin secretion and diminished tissue responses
to insulin at one or more points in the complex pathways of hormone action.
Impairment of insulin secretion and defects in insulin action frequently coexist in the same patient,
and it is often unclear which abnormality, if either alone, is the primary cause of the
hyperglycemia.
The vast majority of cases of diabetes fall into two broad etiopathogenetic categories. In one
category, type I diabetes, the cause is an absolute deficiency of insulin secretion. Individuals at
increased risk of developing this type of diabetes can often be identified by serological evidence
of an autoimmune pathologic process occurring in the pancreatic islets and by genetic markers.
In the other, much more prevalent category, type II diabetes, the cause is a combination of
resistance to insulin action and an inadequate compensatory insulin secretory response. In the
latter category, a degree of hyperglycemia sufficient to cause pathologic and functional changes
in various target tissues, but without clinical symptoms, may be present for a long period of time
before diabetes is detected. During this asymptomatic period, it is possible to demonstrate an
abnormality in carbohydrate metabolism by measurement of plasma glucose in the fasting state
or after a challenge with an oral glucose load43.
As it mentioned in section 1 of this thesis, one of the objectives is the study of glucose released
from three different sources of carbohydrates, that they are used in some products of clinical
nutrition. And in this section the importance of knowing the blood glucose levels is justified.

Francina Maria Payeras Perelló Master’s thesis 30/60
3. MATERIALS AND METHODS
Chemical products used were acquired commercially (Sigma Aldrich, Merck, Pfizer,
Zoetis, …).
3.1. Preparation of model systems
Three carbohydrate sources were selected:
- Maltodextrin DE 11 – 16: is produced by enzymatic hydrolysis of maize-starch.
Figure 18. Structure of maltodextrin DE 11-16
- Tapioca Dextrin: is a high stability dextrin refined from tapioca starch (high hygroscopic).
- “Modified starch”: chemically modified food starch refined from tapioca (E1442).
Samples were prepared using the following protocol:
Flow chart 2. Sample preparation protocol (a) Static digestion method (b) Dynamic digestion method
The effect of volume of samples was also studied, for the static method. The same proportion
were used, but with reduced final volume (1g of tapioca dextrin in 20mL of demi-water).
Besides these samples, three other samples were prepared. One of these samples was prepared in
different conditions in order to compare how different preparation conditions affects. And the
other two samples were prepared in different matrix (one with proteins, and the other with fat and
proteins) in order to study how the matrix of the carbohydrate, affects starch digestibility.

Francina Maria Payeras Perelló Master’s thesis 31/60
Table 7. Description of different matrix/conditions
Water phase Oil phase Carbohydrate
source
Conditions 1
(CH)
925 g Demi-water
Heating to 38°C
75 g Tapioca
Dextrin
Conditions 2
(CH +
protein)
882 g Demi-water
43 g Milk protein
concentrate
Stirring 20 min at 38°C
75 g Tapioca
Dextrin
Conditions 3
(CH +
protein + fat)
847.2 g Demi-water
43 g Milk protein
concentrate
Stirring 20 min at 38°C
34 g Rapeseed oil
refined
0.8 g Lecithin
Pre-solve at RT
75 g Tapioca
Dextrin
Flow chart 3. Sample preparation protocol (effect of matrix)
3.2. Determination of enzyme activities44
The enzyme activities determination is essential to calculate the quantity of enzymes needed to
achieve a certain activity during the in vitro digestion assays.
There are many methods to determine the enzyme activity, and each method uses different
enzyme activity units (depending on the substrate, temperature, pH...). The protocol that Minekus
et al (2014) proposed was used.
For each enzyme used in this protocol, the respective activity was measured and calculated as
follows.
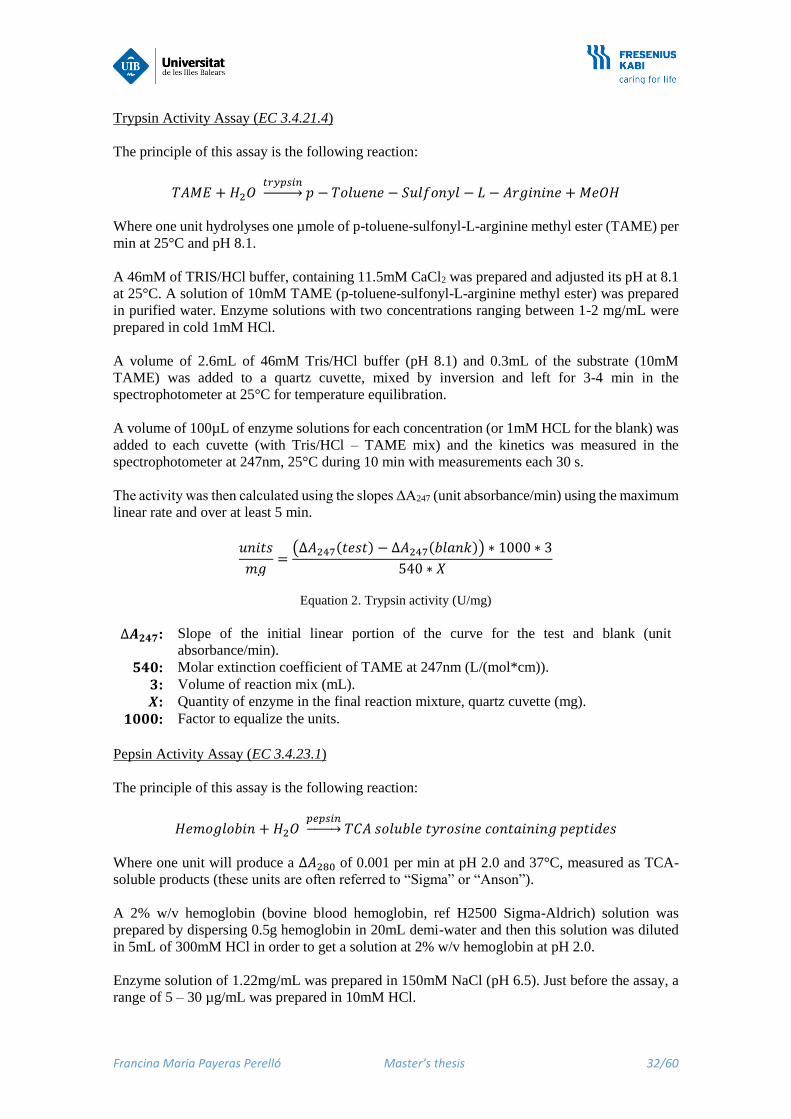
Francina Maria Payeras Perelló Master’s thesis 32/60
Trypsin Activity Assay (EC 3.4.21.4)
The principle of this assay is the following reaction:
𝑇𝐴𝑀𝐸 + 𝐻2𝑂 𝑡𝑟𝑦𝑝𝑠𝑖𝑛→ 𝑝 − 𝑇𝑜𝑙𝑢𝑒𝑛𝑒 − 𝑆𝑢𝑙𝑓𝑜𝑛𝑦𝑙 − 𝐿 − 𝐴𝑟𝑔𝑖𝑛𝑖𝑛𝑒 +𝑀𝑒𝑂𝐻
Where one unit hydrolyses one µmole of p-toluene-sulfonyl-L-arginine methyl ester (TAME) per
min at 25°C and pH 8.1.
A 46mM of TRIS/HCl buffer, containing 11.5mM CaCl2 was prepared and adjusted its pH at 8.1
at 25°C. A solution of 10mM TAME (p-toluene-sulfonyl-L-arginine methyl ester) was prepared
in purified water. Enzyme solutions with two concentrations ranging between 1-2 mg/mL were
prepared in cold 1mM HCl.
A volume of 2.6mL of 46mM Tris/HCl buffer (pH 8.1) and 0.3mL of the substrate (10mM
TAME) was added to a quartz cuvette, mixed by inversion and left for 3-4 min in the
spectrophotometer at 25°C for temperature equilibration.
A volume of 100µL of enzyme solutions for each concentration (or 1mM HCL for the blank) was
added to each cuvette (with Tris/HCl – TAME mix) and the kinetics was measured in the
spectrophotometer at 247nm, 25°C during 10 min with measurements each 30 s.
The activity was then calculated using the slopes ΔA247 (unit absorbance/min) using the maximum
linear rate and over at least 5 min.
𝑢𝑛𝑖𝑡𝑠
𝑚𝑔=(∆𝐴247(𝑡𝑒𝑠𝑡) − ∆𝐴247(𝑏𝑙𝑎𝑛𝑘)) ∗ 1000 ∗ 3
540 ∗ 𝑋
Equation 2. Trypsin activity (U/mg)
∆𝑨𝟐𝟒𝟕: Slope of the initial linear portion of the curve for the test and blank (unit
absorbance/min).
𝟓𝟒𝟎: Molar extinction coefficient of TAME at 247nm (L/(mol*cm)).
𝟑: Volume of reaction mix (mL).
𝑿: Quantity of enzyme in the final reaction mixture, quartz cuvette (mg).
𝟏𝟎𝟎𝟎: Factor to equalize the units.
Pepsin Activity Assay (EC 3.4.23.1)
The principle of this assay is the following reaction:
𝐻𝑒𝑚𝑜𝑔𝑙𝑜𝑏𝑖𝑛 + 𝐻2𝑂 𝑝𝑒𝑝𝑠𝑖𝑛→ 𝑇𝐶𝐴 𝑠𝑜𝑙𝑢𝑏𝑙𝑒 𝑡𝑦𝑟𝑜𝑠𝑖𝑛𝑒 𝑐𝑜𝑛𝑡𝑎𝑖𝑛𝑖𝑛𝑔 𝑝𝑒𝑝𝑡𝑖𝑑𝑒𝑠
Where one unit will produce a ∆𝐴280 of 0.001 per min at pH 2.0 and 37°C, measured as TCA-
soluble products (these units are often referred to “Sigma” or “Anson”).
A 2% w/v hemoglobin (bovine blood hemoglobin, ref H2500 Sigma-Aldrich) solution was
prepared by dispersing 0.5g hemoglobin in 20mL demi-water and then this solution was diluted
in 5mL of 300mM HCl in order to get a solution at 2% w/v hemoglobin at pH 2.0.
Enzyme solution of 1.22mg/mL was prepared in 150mM NaCl (pH 6.5). Just before the assay, a
range of 5 – 30 µg/mL was prepared in 10mM HCl.

Francina Maria Payeras Perelló Master’s thesis 33/60
A volume of 500µL of hemoglobin solution was added into 2mL Eppendorf, and incubated in
shaking incubator at 37°C for 3-4 min to achieve temperature equilibration.
A volume of 100µL of pepsin solutions for each concentration was added to each Eppendorf, and
incubated 10 min exactly. After that a volume of 1mL of 5% TCA (trichloroacetic acid) was added
in each Eppendorf to stop the reaction (Charles Tanford proposed that TCA forces protein to
precipitate by sequestering the protein-bound water45).
The tubes were then centrifuged at 6,000g for 30 min to get a clear soluble phase available for
absorbance measurement. Finally, the supernatant was pipetted into quartz cuvettes and the
absorbance was measured at 280nm. For blank test, the same procedure was followed but the
enzyme was added after the addition of TCA.
The activity was then calculated using the following equation:
𝑈𝑛𝑖𝑡𝑠
𝑚𝑔=(𝐴280(𝑡𝑒𝑠𝑡) − 𝐴280(𝑏𝑙𝑎𝑛𝑘)) ∗ 1000
∆𝑡 ∗ 𝑋
Equation 3. Pepsin activity
∆𝒕: Duration of the reaction (i. e. 10 min).
𝑿: Concentration of enzyme powder in the final reaction mixture (quartz cuvettes,
mg/mL).
𝟏𝟎𝟎𝟎: Factor to equalize the units.
α-Amylase Activity Assay (EC 3.2.1.1)
The type of alpha-amylase used during digestion experiments was a bacterial one, but Minekus
et al (2014)46 proposed using human alpha-amylase. The optimal temperature for bacterial and
human alpha-amylase are different, for this reason, alpha-amylase activity was measured in
different ways.
To know the factor between human and bacterial alpha-amylase, a commercial kit was used
(KA1643, Abnova). But to determine the alpha-amylase activity in the correct units, it was used
the protocol that Minekus et al (2014)46 proposed.
The principle of this assay is the following reaction:
𝑆𝑡𝑎𝑟𝑐ℎ + 𝐻2𝑂𝛼−𝑎𝑚𝑦𝑙𝑎𝑠𝑒→ 𝑅𝑒𝑑𝑢𝑐𝑖𝑛𝑔 𝑔𝑟𝑜𝑢𝑝𝑠 (𝑚𝑎𝑙𝑡𝑜𝑠𝑒)
One unit liberates 1.0mg of maltose from starch in 3 min at pH 6.9 at 20°C.
A potassium phosphate buffer was prepared by dissolving 0.7098g of KH2PO4 and 0.0979g of
NaCl in 250mL demi-water and adjusted to pH 6.9.
A 1.0% soluble starch solution was prepared in the sodium phosphate buffer pH 6.9 by dissolving
0.25g soluble potato starch in an initial volume of 20mL of buffer, then it was covered the beaker
to avoid water evaporation and brought to boil while stirring and was maintained just below
boiling temperature for 15 min. After it was cooled to room temperature and completed the starch
solution to the appropriate volume (25mL) by adding 5mL of demi-water.
After that, a color reagent solution was prepared. A 5.3M sodium potassium tartrate solution was
prepared in 2M NaOH by dissolving 0.8g NaOH in 10mL demi-water, heated the solution to reach
a temperature between 50 – 70°C. After that, 12g of sodium potassium tartrate tetrahydrate were
dissolved in 8mL of this warm 2M NaOH solution. It was maintained at this temperature while
constant stirring to dissolve but do not boil.

Francina Maria Payeras Perelló Master’s thesis 34/60
A 96mM 3,5-dinitrosalicylic acid solution was prepared by dissolving 438mg of acid in 20mL of
demi-water, heated the solution to reach a temperature ranging between 50 – 70°C and it was
maintained at this temperature while constant stirring to dissolve but do not boil.
Finally, 12mL of demi-water was heated to 60°C, added slowly 8mL of the 5.3M sodium
potassium tartrate solution. Then 20mL of the 96mM 3,5-dinitrosalicylic acid solution was added
and stirred until complete dissolution.
A solution of 0.2% (w/v) maltose was prepared by dissolving 2mg in 10mL of demi-water.
Just before use, a solution containing approximately 1 unit/mL of alpha-amylase in demi-water
was prepared.
A volume of 1mL of substrate was pipetted into 15mL cap covered containers, mixed by swirling
and incubated at 20°C for 3-4 min to achieve temperature equilibration. Then, 500µL to 1mL of
enzyme solution was added, was mixed by swirling and incubated at 20°C for exactly 3 min. After
3 min, the reaction was stopped by adding 1mL of color reagent solution and was placed in the
oil bath (100°C), the mixture was made up to 1 mL of enzyme solution. After that, the reaction
mix was boiled for exactly 15 min and cooled on ice for a few min.
A volume of 9mL of demi-water was added, mixed by inversion and finally a volume of 3mL was
pipetted in a cuvette of spectrophotometer and finally recorded the absorbance at 540nm.
For blank assays, the protocol was similar but no enzyme was added before the 3 min incubation.
It was only after the addition of the color reagent and after putting the reaction vessel in the oil
bath, that 1mL of enzyme solution was added.
Table 8. Protocol of alpha-amylase activity
First
concentration of
enzyme
S concentration
of enzyme
Third
concentration of
enzyme
Test
Blank
Substrate: Potato
starch solution
(mL)
1.0 1.0 1.0 1.0
Enzyme solution
(mL) 0.5 0.7 1.0 0.0
Color reagent
(mL) 1.0 1.0 1.0 1.0
Enzyme solution
(mL) 0.5 0.3 0.0 1.0
Demi-water (mL) 9.0 9.0 9.0 9.0

Francina Maria Payeras Perelló Master’s thesis 35/60
A standard curve was established by dilution the maltose solution (0.2% w/v) as followed in demi-
water: Table 9. Standard curve
Maltose solution (mL) Demi-Water (mL)
D1 0.05 1.95
D2 0.20 1.80
D3 0.40 1.60
D4 0.60 1.40
D5 0.80 1.20
D6 1.00 1.00
D7 2.00 0.00
Blank_Std 0.00 2.00
One milliliter of color reagent solution was added for each maltose concentration. After this
addition the maltose solutions were boiled in the oil bath for 15 min, it was cooled on ice to room
temperature and 9mL of demi-water was added. Solutions were mixed by inversion and the
absorbance was recorded for the standards and standard blank.
The absorbance of maltose solutions was recorded, and corrected with standard blank:
∆𝐴540(𝑠𝑡𝑎𝑛𝑑𝑎𝑟𝑑) = 𝐴540(𝑚𝑎𝑙𝑡𝑜𝑠𝑒 𝑠𝑜𝑙) − 𝐴540(𝑠𝑡𝑑 𝑏𝑙𝑎𝑛𝑘)
Equation 4. Corrected absorbance (standard curve)
The absorbance (corrected) of standards was plotted versus quantity of maltose (mg), and the
corresponding linear regression was established.
∆𝐴540(𝑠𝑡𝑎𝑛𝑑𝑎𝑟𝑑) = 𝑠𝑙𝑜𝑝𝑒 ∗ [𝑚𝑎𝑙𝑡𝑜𝑠𝑒(𝑚𝑔)] + 𝑖𝑛𝑡𝑒𝑟𝑐𝑒𝑝𝑡
Equation 5. Equation of standard curve
The absorbance of samples was also corrected, and was interpolated on the calibration curve:
∆𝐴540(𝑠𝑎𝑚𝑝𝑙𝑒) = 𝐴540(𝑠𝑎𝑚𝑝𝑙𝑒) − 𝐴540(𝑡𝑒𝑠𝑡 𝑏𝑙𝑎𝑛𝑘)
Equation 6. Corrected absorbance (sample)
𝑈𝑛𝑖𝑡𝑠
𝑚𝑔 𝑝𝑜𝑤𝑑𝑒𝑟=∆𝐴540(𝑠𝑎𝑚𝑝𝑙𝑒) − 𝑖𝑛𝑡𝑒𝑟𝑐𝑒𝑝𝑡
𝑠𝑙𝑜𝑝𝑒 ∗ 𝑋
Equation 7. Alpha-amylase activity (U/mg)
Where X is the quantity of amylase powder (mg) added before stopping the reaction.

Francina Maria Payeras Perelló Master’s thesis 36/60
Bile salts assays
The concentration of bile salts in the bile was tested using a commercial kit (bile acid kit, ref 1
2212 99 90 313, DiaSys Diagnostic System GmbH, Germany).
The principle of this assay is the following reactions:
3 − 𝛼 − ℎ𝑦𝑑𝑟𝑜𝑥𝑦 𝑏𝑖𝑙𝑒 𝑎𝑐𝑖𝑑𝑠 + 𝑁𝐴𝐷+3−𝛼−𝐻𝑆𝐷↔ 𝑜𝑥𝑖𝑑𝑖𝑧𝑒𝑑 𝑏𝑖𝑙𝑒 𝑎𝑐𝑖𝑑𝑠 + 𝑁𝐴𝐷𝐻 + 𝐻+
𝑁𝐴𝐷𝐻 + 𝐻+ +𝑁𝐵𝑇𝑑𝑖𝑎𝑝ℎ𝑜𝑟𝑎𝑠𝑒↔ 𝑁𝐴𝐷+ + 𝑓𝑜𝑟𝑚𝑎𝑧𝑎𝑛
In the presence of NAD+, the enzyme 3-α-hydroxysteroid dehydrogenase converts 3-α-hydroxy
bile acids to 3-keto steroids and NADH. The NADH formed reacts with nitrotetrazolium blue to
form a formazan dye in the presence of diaphorase enzyme. The dye formation is monitored by
measuring absorbance at 540nm and is directly proportional to the bile acids concentration in the
sample.
The composition of the reagents was:
- Reagent 1
o Diaphorase (50 U/L)
o NAD+ (1 mM)
o NBT (0.2 mM)
- Reagent 2
o 3-α-HSD (60 U/L)
o TRIS buffer (50 mM)
- Buffer
o Phosphate buffer (100mM EDTA)
- Standard
o 35 µM bile acids
A volume of 80µL of demi-water (for blank), sample or standard was mixed with 600µL of
reagent 1. Then, it was mixed well and was incubated for 4 min at 37°C. The absorbance was read
at 540nm (absorbance 1), after that a volume of 120µL of reagent 2 was added, mixed well and
was incubated 5 min at 37°C, finally the absorbance was read (absorbance 2).
The concentration was then calculated using the following equations:
∆𝐴 = (𝐴2 − 0.85 ∗ 𝐴1)𝑠𝑎𝑚𝑝𝑙𝑒 𝑜𝑟 𝑠𝑡𝑎𝑛𝑑𝑎𝑟𝑑 − (𝐴2 − 0.85 ∗ 𝐴1)𝑏𝑙𝑎𝑛𝑘
Equation 8. Corrected absorbance
𝑏𝑖𝑙𝑒 𝑎𝑐𝑖𝑑𝑠 (µ𝑀) =∆𝐴𝑠𝑎𝑚𝑝𝑙𝑒∆𝐴𝑠𝑡𝑎𝑛𝑑𝑎𝑟𝑑
∗ 𝐶𝑜𝑛𝑐𝑒𝑛𝑡𝑟𝑎𝑡𝑖𝑜𝑛 𝑠𝑡𝑎𝑛𝑑𝑎𝑟𝑑 (µ𝑀)
Equation 9. Bile acids concentration
Where A1 and A2 are first and s absorbance, respectevly. And the factor 0.85 compensates the
decrease of the absorbance by addition of reagent 2. The factor was calculated as follows: (sample
+ R1)/Total volume.

Francina Maria Payeras Perelló Master’s thesis 37/60
3.3. Static digestion method (according Mikenus et. al. (2004)19)
The in vitro digestion protocol comprises three different phases: oral, gastric and intestinal.
Simulated Salivary Fluid (SSF), Simulated Gastric Fluid (SGF) and Simulated Intestinal Fluid
(SIF) are made up of the corresponding electrolyte stock solutions, enzymes, calcium chloride
and water.
The electrolyte stock solutions are 1.25 x Concentrated. For example, 4 parts of electrolyte stock
solution + 1 part water give the correct ionic composition in the simulated digestion fluids.
Table 10. Recommended concentrations of electrolytes in simulated digestive fluids based on human in
vivo data
Simulated Salivary
Fluid
Simulated Gastric
Fluid
Simulated Intestinal
Fluid
Constituent Concentration (mM) Concentration (mM) Concentration (mM)
K+ 18.80 7.80 7.60
Na+ 13.60 72.20 123.40
Cl- 19.50 70.20 55.50
H2PO4- 3.70 0.90 0.80
HCO3-,
CO32-
13.70 25.50 85.00
Mg2+ 0.15 0.10 0.33
NH4+ 0.12 1.00 0.00
Ca2+ 1.50 0.15 0.60

Francina Maria Payeras Perelló Master’s thesis 38/60
Simulated salivary fluid, simulated gastric fluid and simulated intestinal fluid were prepared as
described in the following table:
Table 11. Simulated digestive fluids protocol
Simulated salivary fluid
(pH 7)
Simulated gastric fluid
(pH 3)
Simulated intestinal fluid
(pH 7)
Constituent Stock
conc. (M)
Vol. of
stock (mL)
Final
conc.
(mM)
Vol. of stock
(mL)
Final conc.
(mM)
Vol. of
stock (mL)
Final conc.
(mM)
KCl 0.50 7.55 15.10 6.90 6.90 13.60 6.80
KH2PO4 0.50 1.85 3.70 0.90 0.90 1.60 0.80
NaHCO3 1.00 3.40 13.60 12.50 25.00 85.00 85.00
NaCl 2.00 0.00 0.00 11.80 47.20 19.20 38.40
MgCl2(H2O)6 0.15 0.25 0.15 0.40 0.10 2.20 0.33
(NH4)2CO3 0.50 0.03 0.06 0.50 0.50 0.00 0.00
* For pH adjustment
HCl 1.00 0.27 1.10 7.80 15.60 8.40 8.40
The addition of enzymes, bile salts, Ca2+ solution etc. and water will result in the correct
electrolyte concentration in the final digestion mixture. CaCl2(H2O)2 was not added to the
electrolyte stock solutions as precipitation may occur. Instead, it was added to the final mixture
of simulated digestion fluid and food.
Oral phase
A volume of 5 mL of meal was mixed with 3.5 mL of simulated salivary fluid electrolyte stock
solution (a final ratio of food to SSF of 50 : 50 was targeted) and 25µL of 0.3M CaCl2(H2O)2 (to
achieve 0.75 mM in the final mixture). Then the pH was adjusted to 7.0 ± 0.3 with 0.5M HCl,
after that a volume of demi-water was added up to 9.5 mL and finally 0.5 mL of alpha-amylase
was added to the mixture (bacterial alpha-amylase was added to achieve 75 U/mL). The oral phase
was incubated 2 min at 37°C and 450rpm.
Gastric phase
Five parts of oral bolus was mixed with 4 parts of simulated gastric fluid to obtain a final ratio of
oral bolus to simulated gastric fluid 50 : 50 in the final mixture (a volume of 7.5 mL of simulated
gastric fluid was mixed with oral bolus). A volume of 5µL of 0.3M CaCl2(H2O)2 was added to
the mixture (to achieve 0.075 mM in the final digestion mixture) and the pH was adjusted to 3.0
± 0.3 with 1M HCl, after that a volume of demi-water was added up to 18.4 mL and finally 1.6
mL of pepsin was added to the mixture (porcine pepsin was added to achieve 2000 U/mL). Gastric
phase was incubated 2 h at 37°C and 450rpm.

Francina Maria Payeras Perelló Master’s thesis 39/60
Intestinal phase
Five parts of gastric chyme was mixed with 4 parts of simulated intestinal fluid to obtain a final
ratio of gastric chyme to SIF of 50 : 50 in the final digestion mixture (a volume of 11mL of
simulated intestinal fluid was mixed with gastric chyme). The pH was adjusted at 7.0 ± 0.3 and a
volume of demi-water was added up to 32.5 mL. Then 5 mL of pancreatic solution (the amount
of pancreatin added was based on the alpha-amylase activity, 200 U/mL in the final mixture) and
2.5 mL of bile solution (bile salts were added to give a final concentration of 10mM in the final
mixture) were added to the mixture. Intestinal phase was incubated 2 h at 37°C and 450rpm.
Flow chart 4. Protocol of static digestion method
Sampling during digestion
Sample conservation depends on the study focus (food structure, bio-accessibility, enzymatic
digestion product, etc.), and should be carefully considered for each study. In the current study,
individual sample tubes for each time point were used to avoid withdrawing samples from the
reaction vessel.
Directly after stopping the reaction (sampling point), the sample was ultra-filtrated to remove the
enzyme (stop enzyme activity). Finally, the sample was frozen until glucose determination.
3.4. Dynamic digestion method
The in vitro dynamic model used for this study (TIM-1) consists of four successive compartments
simulating the stomach, duodenum, jejunum and ileum. Each compartment is formed by two
connected basic units consisting of a glass jacket with a flexible wall inside.
Water is pumped from a water bath into the glass jackets around the flexible walls to control the
temperature inside the units and the pressure on the flexible walls. Changes in water pressure are
achieved by computer-activated rotatory pumps. This enables mixing of the chyme by alternate
compression and relaxation of the flexible walls.

Francina Maria Payeras Perelló Master’s thesis 40/60
Figure 19. Dynamic model. (a) gastric compartment (b) duodenal compartment (c) jejunal compartment
(d) ileal compartment (e) basic unit (f) glass jacket (g) flexible wall (h) rotary pump (i) water bath (j)
peristaltic valve-pump (k) peristaltic pump (l,m) pH electrodes (n,o) syringe pumps (p) hollow-fibre
device
The compartments are connected by peristaltic valve-pumps consisting of three connected T-
tubes, each with a separate tube-like flexible wall inside. If pressure is applied to the outside of
the flexible wall, the valve is closed, leaving minimal dead space inside. In the open position, the
flexible walls facilitate unhindered passage of the chyme through the valves. Peristaltic pumping
is achieved by regulating the sequence of opening and closing of the three parts of the valve-
pump. During each peristaltic cycle, a constant volume of chyme is transferred.
The frequency of peristaltic cycles is dictated by computer, allowing the flow rate of the chyme
to be controlled. The volume in each compartment (except for stomach) is monitored with a level
sensor connected to the computer.
A predetermined quantity of the meal is introduced into the gastric compartment within a pre-set
period of time, with a peristaltic pump. All the compartments are equipped with pH electrodes.
The pH values are controlled via the computer by screening either water or 1M HCl into the
stomach, or by screening either water or 1M NaHCO3 into the small intestine via syringe pumps.
To avoid the irregular pH values in the stomach due to incomplete mixing, HCl is secreted through
a perforated tube.

Francina Maria Payeras Perelló Master’s thesis 41/60
Secretions of gastric electrolytes and enzymes, bile and pancreatic juices are regulated by using
computer-controlled syringe pumps. The jejunal and ileal compartments are connected with
hollow-fibre devices to absorb digestion products and water from the chyme and to modify
electrolyte and bile salt concentrations in the chyme.
Procedure
The system is loaded with various reagents, mixed in specified ratios as described below. Some
were derived from concentrated stock solutions, whereas all working solutions were prepared on
the day of use. All solutions were made with deionized water unless specified.
Table 12. Concentrations of stock solutions
Constituent Concentration Compartment
NaHCO3 1 M Small intestine
HCl 1 M Stomach
CH3COONa 1 M (pH 5.0) Stomach
Gastric
electrolyte
solution
(GES)
NaCl 106.10 mM
Stomach KCl 29.51 mM
CaCl2(H2O)2 2.04 mM
Small
intestine
electrolyte
solution
(SIES)
NaCl 85.56 mM
Small intestine KCl 8.05 mM
CaCl2(H2O)2 2.04 mM
Pancreatic solution 65.4 mg/mL Duodenum
Enzyme
solution
(pH 5.0)
Lipase 37.5 U/mL (GES)
Stomach Pepsin 600 U/mL (GES)
Bile solution 84.33 mM Duodenum

Francina Maria Payeras Perelló Master’s thesis 42/60
For an experiment, the system was filled with the following solutions:
Flow chart 5. Start residues
For each experimental run the secretion products (e.g. gastric juice with enzymes, electrolytes,
dialysis liquids, bile, pancreatic juice) are freshly prepared, the pH electrodes calibrated and the
filtration units replaced.
Sampling during digestion
Samples were collected every 30 min during the first 3 h, and every h the next two h, from two
locations (jejunum and ileal dialysates, sugars that would enter the systemic circulation) and every
150 min (2.5 h) from one additional location (outlet of the ileal compartment, sugars that would
enter the colon and assumed not to be available for absorption).
At the end of the experiment, the device protocol was stopped and all residues from Stomach to
Ileum were collected. All the samples were stored at -20°C.

Francina Maria Payeras Perelló Master’s thesis 43/60
3.5. Determination of glucose concentration
Concentration of glucose were measured using a commercial kit.
The kit used to determine the glucose concentration was KA1648 (Abnova). First, a standard
curve was prepared:
Table 13. Standard curve (glucose)
Nº Standard
(3000 ppm) Demi-water
Final concentration
(glucose)
1 150 µL 0 µL 3000 ppm
2 100 µL 50 µL 2000 ppm
3 50 µL 100 µL 1000 ppm
4 25 µL 125 µL 500 ppm
5 0 µL 150 µL 0 ppm
For the samples: 12 µL of sample or standard were mixed with 1200 µL of reagent. The mixture
was incubated 8 min in a boiling water bath, followed by 4 min an ice bath. Finally, the absorbance
was measured at 630 nm.
The absorbance of standard solutions was recorded, and corrected with standard blank:
∆𝐴630(𝑠𝑡𝑎𝑛𝑑𝑎𝑟𝑑) = 𝐴630(𝑔𝑙𝑢𝑐𝑜𝑠𝑒 𝑠𝑜𝑙) − 𝐴630(𝑠𝑡𝑑 𝑏𝑙𝑎𝑛𝑘)
Equation 10. Corrected absorbance
The absorbance (corrected) of standards was plotted versus quantity of glucose (mg/L), and the
corresponding linear regression was established.
∆𝐴630(𝑠𝑡𝑎𝑛𝑑𝑎𝑟𝑑) = 𝑠𝑙𝑜𝑝𝑒 ∗ [𝑔𝑙𝑢𝑐𝑜𝑠𝑒(𝑚𝑔/𝐿)] + 𝑖𝑛𝑡𝑒𝑟𝑐𝑒𝑝𝑡
Equation 11. Equation of standard curve
The amount of glucose was then calculated using the following equation:
𝑚𝑔 𝑜𝑓 𝑔𝑙𝑢𝑐𝑜𝑠𝑒 =(𝐴630(𝑠𝑎𝑚𝑝𝑙𝑒) − 𝐴630(𝑠𝑡𝑑 𝑏𝑙𝑎𝑛𝑘) − 𝑖𝑛𝑡𝑒𝑟𝑐𝑒𝑝𝑡
𝑠𝑙𝑜𝑝𝑒) ∗ 𝐴𝑚𝑜𝑢𝑛𝑡 𝑜𝑓 𝑠𝑎𝑚𝑝𝑙𝑒 (𝑚𝐿)
1000
Equation 12. Amount of glucose (mg)

Francina Maria Payeras Perelló Master’s thesis 44/60
4. RESULTS AND DISCUSSION
4.1. Determination of enzyme activities47
The enzyme activities determination is essential to calculate the quantity of enzymes needed to
achieve a certain activity during the in vitro digestion assays.
Trypsin Activity Assay (EC 3.4.21.4)
Trypsin activity of a pancreatic solution (1.37 mg/mL 1mM HCl) was measured. The activity was
calculated using the slopes ΔA247 (unit absorbance/min):
Graph 2. Results of trypsin activity
𝑢𝑛𝑖𝑡𝑠
𝑚𝑔=(∆𝐴247(𝑡𝑒𝑠𝑡) − ∆𝐴247(𝑏𝑙𝑎𝑛𝑘)) ∗ 1000 ∗ 3
540 ∗ 𝑋
𝑢𝑛𝑖𝑡𝑠
𝑚𝑔=(0.0512 − (−0.0014)) ∗ 1000 ∗ 3
540 ∗ 0.137= 2.13 𝑈 𝑚𝑔⁄ → 2133.01 𝑈 𝑔⁄
Equation 13. Trypsin activity
Where one unit hydrolyses one µmole of TAME per min at 25°C and pH 8.1.
Pepsin Activity Assay (EC 3.4.23.1)
Pepsin activity of a pepsin solution (1.22 mg/mL 150mM NaCl buffer) was measured. The
activity was calculated using the following equation:
𝑈𝑛𝑖𝑡𝑠
𝑚𝑔=(𝐴280(𝑡𝑒𝑠𝑡) − 𝐴280(𝑏𝑙𝑎𝑛𝑘)) ∗ 1000
∆𝑡 ∗ 𝑋
Equation 14. Pepsin activity (U/mg)
∆𝒕: Duration of the reaction (i. e. 10 min).
𝑿: Concentration of enzyme powder in the final reaction mixture (quartz cuvettes,
mg/mL).
𝟏𝟎𝟎𝟎: Factor to equalize the units.

Francina Maria Payeras Perelló Master’s thesis 45/60
Table 14. Pepsin activity results
Incubation time
(min)
Enzyme concentration
(mg/mL)
Absorbance
(λ = 280 nm) Pepsin activity
(U/mg)
Blank Sample
10
0.0004 0.210 0.223 3321.05
0.0008 0.240 0.265 3322.61
0.0011 0.282 0.320 3325.81
0.0015 0.295 0.346 3317.95
0.0019 0.300 0.363 3319.80
0.0023 0.315 0.391 3323.90
Therefore, the pepsin activity of the powder is 3321.83 ± 2.85 (0.1) U/mg (one unit will produce
a ∆A280 of 0.001 per min at pH 2.0 and 37°C, measured as TCA-soluble products).
α-Amylase Activity Assay (EC 3.2.1.1)
Alpha-amylase activity of an alpha-amylase solution (0.0086 mg/mL demi-water) was measured.
The absorbance of maltose solutions was recorded, and corrected with standard blank:
∆𝐴540(𝑠𝑡𝑎𝑛𝑑𝑎𝑟𝑑) = 𝐴540(𝑚𝑎𝑙𝑡𝑜𝑠𝑒 𝑠𝑜𝑙) − 𝐴540(𝑠𝑡𝑑 𝑏𝑙𝑎𝑛𝑘)
Equation 15. Corrected absorbance
The absorbance (corrected) of standards was plotted versus quantity of maltose (mg), and the
corresponding linear regression was established.
Graph 3. Standard curve for alpha-amylase activity
The absorbance of samples was also corrected, and was interpolated on the calibration curve:
∆𝐴540(𝑠𝑎𝑚𝑝𝑙𝑒) = 𝐴540(𝑠𝑎𝑚𝑝𝑙𝑒) − 𝐴540(𝑡𝑒𝑠𝑡 𝑏𝑙𝑎𝑛𝑘) →𝑈𝑛𝑖𝑡𝑠
𝑚𝑔 𝑝𝑜𝑤𝑑𝑒𝑟=∆𝐴540(𝑠𝑎𝑚𝑝𝑙𝑒) − 𝑖𝑛𝑡𝑒𝑟𝑐𝑒𝑝𝑡
𝑠𝑙𝑜𝑝𝑒 ∗ 𝑚𝑔𝛼−𝑎𝑚𝑦𝑙𝑎𝑠𝑒

Francina Maria Payeras Perelló Master’s thesis 46/60
Table 15. Results of alpha-amylase activity (One unit liberates 1.0mg of maltose from starch in 3 min at
pH 6.9 at 20°C)
Amount of alpha-amylase
(mg)
Absorbance
(λ = 540 nm) Alpha-amylase activity
(U/mg)
Blank Sample
0.0011
0.223
0.634 1361.2
0.0015 0.819 1384.8
0.0022 1.004 1258.1
Therefore, the alpha-amylase activity of the powder is 1334.7 ± 67.4 (5) U/mg. According product
specification the activity of this product is 1333 U/mg (using the same unit definition).
The focus of these experiments is the study of digestion of carbohydrates, and the enzyme that
cleaves glycosidic bond of starch is alpha-amylase. For this reason, alpha-amylase activity of
pancrex powder was also measured (to know how to prepare pancreatic solution). The alpha-
amylase activity of pancrex powder is 71.92 U/mg.
Bile salts assays
The concentration of bile salts in the bile was tested using a commercial kit (bile acid kit, ref 1
2212 99 90 313, DiaSys Diagnostic System GmbH, Germany). The concentration was then
calculated using the following equations:
∆𝐴 = (𝐴2 − 0.85 ∗ 𝐴1)𝑠𝑎𝑚𝑝𝑙𝑒 𝑜𝑟 𝑠𝑡𝑎𝑛𝑑𝑎𝑟𝑑 − (𝐴2 − 0.85 ∗ 𝐴1)𝑏𝑙𝑎𝑛𝑘
Equation 16. Corrected absorbance
𝑏𝑖𝑙𝑒 𝑎𝑐𝑖𝑑𝑠 (µ𝑀) =∆𝐴𝑠𝑎𝑚𝑝𝑙𝑒∆𝐴𝑠𝑡𝑎𝑛𝑑𝑎𝑟𝑑
∗ 𝐶𝑜𝑛𝑐𝑒𝑛𝑡𝑟𝑎𝑡𝑖𝑜𝑛 𝑠𝑡𝑎𝑛𝑑𝑎𝑟𝑑 (µ𝑀)
Equation 17. Bile acids concentration
Table 16. Bile acids concentration
Absorbance 1 Absorbance 2 ΔA Bile acids
(µM)
Blank 0.084 0.075 --- ---
Standard 0.075 0.160 0.074 35
Sample 1 0.133 0.250 0.114 54.34
Sample 2 0.128 0.243 0.112 53.03
The bile solution was prepared with 12.2mg in 10mL of demi-water, therefore molecular weight
of our bile powder was 454.54 ± 7.8 (2) g/mol.

Francina Maria Payeras Perelló Master’s thesis 47/60
4.2. Static Digestion method
To study the behavior of different samples during in vitro digestion 13 experiments were carried
out, three for each sample, two with demi-water (negative control) and two with glucose (positive
control).
Results of the experiments with demi-water (negative control) revealed that secretions fluids do
not contain glucose (results not shown as below the detection limit of the used method of
detection).
In Graph 4 the released glucose is depicted for the separated phases of digestion and in
dependence of carbohydrate source (Maltodextrin DE 11 – 16, Tapioca Dextrin, “Modified
starch”).
Graph 4. Results of Static digestion method (glucose, %) (number of repetitions (polysaccharides)= 3,
number of repetitions (glucose) = 2)
In the above graph the results are represented as % of intake, and this percentage is calculated
with the following equation:
% 𝑜𝑓 𝑖𝑛𝑡𝑎𝑘𝑒 =𝑚𝑔 𝑔𝑙𝑢𝑐𝑜𝑠𝑒 𝑓𝑜𝑟 𝑠𝑝𝑒𝑐𝑖𝑓𝑖𝑐 𝑠𝑎𝑚𝑝𝑙𝑒
𝑚𝑔 𝑐𝑎𝑟𝑏𝑜ℎ𝑦𝑑𝑟𝑎𝑡𝑒 𝑠𝑜𝑢𝑟𝑐𝑒∗ 100
Equation 18. Calculation the % of intake
For glucose as the positive control an almost value between 80 – 100 % was observed without
significant differences between the digestion phases. A slight increased value is observed for the
oral phase, which may be because during the oral phase carbohydrate source is only mixed with
simulated salivary fluid, and during the other phases there are a bigger background.
The results for different carbohydrate sources are very similar showing lower levels for oral and
gastric phases slightly elevated levels for the first three intestinal samples (5, 15 and 30 min) and
increased levels for the las three intestinal samples. However, the values are distinctly lower than
the levels of glucose (representing the same carbohydrate concentration but as free glucose).
As expected the positive control (glucose) shows similar values for all phases of in vitro digestion
as the monosaccharides is already present as glucose at time 0. In this study a complete sample is
taken per sample point, so that each sample contains the entire amount of starting material
(carbohydrate source; in this case the positive control 125mg of glucose).

Francina Maria Payeras Perelló Master’s thesis 48/60
For the studied carbohydrate sources, it was observed that only low levels of glucose were
released during the static in vitro digestion (max. of ~30%), supposing that the carbohydrate
sources are not very well digestible.
That however, can be explained with the fact that the monosaccharide glucose is the last product
of starch digestion. Before reaching free glucose monomers the starch chains are broken into
oligosaccharides that are consequently broken into tri- di- and monosaccharides. For an
estimation of the digestibility of the carbohydrate sources other starch-digestion products need to
be take into consideration.
Graph 4 shows that during the experiments was not lost sample (% of glucose is around 100% in
almost all samples). It also shows that samples do not release big amount of glucose, and between
them, Maltodextrin DE 11-16 release more amount of glucose than Tapioca Dextrin and
“Modified starch”. These results are as expected because Maltodextrin DE 11-16 has the shortest
chain, and “Modified starch” the biggest one.
Volume effect
Besides studying digestibility of some carbohydrate sources, the effect of volume was also
studied. These trials are useful to know if the protocol can be performed it with less volume of
secretions/samples, because is more easy to handle and cost effective because it needs less amount
of reagents.
Two experiments were carried out with Tapioca Dextrin and one with demi-water (as blank).
Results of the experiments with demi-water (negative control) are bellow of the detection limit
(for glucose results).
In Graph 5 the released glucose is shown for separated phases of digestion to check the possible
differences between when big and small volumes are used during static digestion method.
Graph 5. Comparison between to use big (final volume: 40mL) and small volumes (final volume: 8mL),
sample: Tapioca Dextrin (number of repetitions = 2)
It seems that with small volumes, results are higher than with big volumes, but if it takes account
standard deviation it can affirm that there are not significant differences. For this reason, it can
affirm that is more useful to use small volumes than big volumes.
Different conditions

Francina Maria Payeras Perelló Master’s thesis 49/60
In reality the studied carbohydrate sources are rarely eaten or formulated in food products alone,
they are normally eaten with other proteins, fats, etc. In this section it was studied how affect
proteins, fats or pre-treatment in the release of glucose from Tapioca Dextrin.
To carried out this section of the study, Tapioca Dextrin was subjected to different conditions and
with presence of other macronutrients.
- Conditions 1: Sample was prepared like a real product for clinical nutrition (autoclave,
121°C, 20 min). This experiment is useful to know how affect the pre-treatment in the
release of glucose, because a real product for clinical nutrition has to be sterilized with
autoclave.
- Conditions 2: Sample was prepared with proteins and sterilized with autoclave (same
protocol as conditions 1). This experiment is useful to know how affect the presence of
proteins in the release of glucose, because normally a real product for clinical nutrition is
a complex formulation (not only carbohydrates).
- Conditions 3: Sample was prepared with proteins, fats and sterilized with autoclave (same
protocol as conditions 1). The objective of this experiment is the same than conditions 2,
but more complex.
In Graph 6 the released glucose is depicted for the separated stages of digestion and in dependence
of the different matrixes (only Tapioca Dextrin with pre-treatment, Tapioca Dextrin with protein,
Tapioca Dextrin with protein and fat, Tapioca Dextrin without pre-treatment).
Graph 6. Effect of different conditions in the release of glucose (% of intake) (number of repetitions = 3)
With these results it can affirm that the pre-treatment favors the release of glucose from
carbohydrate source, and this is maybe for the solubility of sample that is higher when the
temperature of preparation is higher (with autoclave 121°C, without pre-treatment 85-90°C).
In the comparison between conditions 1, 2 and 3 it seems that with fat-protein the release of
glucose is higher than with protein or alone, however there are no significant differences (standard
deviation).

Francina Maria Payeras Perelló Master’s thesis 50/60
A difference of glucose released between different matrixes was expected, but the obtained results
do not present significant differences. The conclusions that can be extracted with these results are
that background does not affect to the glucose release, or that the limitations of method (absence
of microbial ecosystem for example) could affect to the glucose release.
4.3. Dynamic Digestion method
To study the behavior of samples during their digestion 5 experiments were done, one for each
sample, one with demi-water (negative control) and one with glucose (positive control).
Table 17. Digestion experiments
Meal Amount Conditions
Demi-water 150 g (100%)
10 min
85 - 90°C
500rpm
Maltodextrin DE 11 – 16
11.25 g (7.5%)
Tapioca Dextrin
“Modified starch”
Glucose
In the following graphs, the results on the percentage of intake are all corrected with the amount
of glucose were obtained for the negative control (originating from secretion fluids).
Bio-accessibility is the fraction of test compound that has become available for intestinal
absorption. In TIM-1 studies, bio-accessibility is determined by measuring the fraction of a
compound that has passed the dialysis or filtration membrane.
𝐵𝑖𝑜𝑎𝑐𝑐𝑒𝑠𝑠𝑖𝑏𝑙𝑒 𝑓𝑟𝑎𝑐𝑡𝑖𝑜𝑛 = 𝐽𝑒𝑗𝑢𝑛𝑢𝑚𝐵𝑖𝑜𝐴𝑐𝑐 𝑓𝑟𝑎𝑐𝑡𝑖𝑜𝑛 + 𝐼𝑙𝑒𝑢𝑚𝐵𝑖𝑜𝐴𝑐𝑐 𝑓𝑟𝑎𝑐𝑡𝑖𝑜𝑛
Equation 19. Bio-accessible fraction
In this case, the results for the experiment with demi-water are higher than detection limit and the
results depicted in the following graphs are corrected with the negative control (glucose
originating from secretion fluids).
In Graph 7 and Graph 8 the released glucose from the studied different carbohydrate sources
(Maltodextrin DE 11 – 16, Tapioca Dextrin, “Modified starch”) is depicted.

Francina Maria Payeras Perelló Master’s thesis 51/60
Graph 7. Bio-accessible fraction of glucose (% of intake as cumulative)
Graph 8. Bio-accessible fraction of glucose (% of intake)
In the previous graphs it has represented bio-accessible fraction of glucose in different ways,
Graph 7 shows bio-accessible fraction as cumulative and in Graph 8 it has represented the same
values of Graph 7 but in this case the graph show % of intake in each sampling time. So that in
the first graph it can know the total amount of bio-accessible fraction in each sampling time and
in the s graph it can know bio-accessible fraction in each moment during digestion.
Graph 7 shows that only ~70% of the meal is present in the bio-accessible fraction (experiment
with glucose). Graph 8 shows that the maximum of bio-accessible fraction of glucose is found
after 2 h.
The results of the experiment with Maltodextrin DE 11-16 suggest that the amount of glucose
available for absorption grows as it goes digesting food until ~25% of intake. The growth profile
is more or less linear and it seems that the amount of glucose does not reach stationary state
(Graph 7).
The maximum of bio-accessible fraction of glucose for Maltodextrin DE 11-16 it’s found at 120
min (time comparable with the one of the maximum bio-accessible fraction of pure glucose).

Francina Maria Payeras Perelló Master’s thesis 52/60
The results of the experiment with Tapioca Dextrin suggest that the amount of bio-accessible
fraction of glucose increases significantly until 150 min. Then it reaches a constant value of ~10%
of intake (30 min after positive control and Maltodextrin DE 11-16).
The results of the experiment with “Modified starch” suggest that the amount of glucose bio-
accessible grows as it goes digesting food until ~15% of intake. It seems that in this case occurs
something like with Maltodextrin DE 11-16; the amount of glucose doesn’t arrive stationary state.
The maximum of bio-accessible fraction of glucose for “Modified starch” it’s found at 240 min
(120 min after positive control and Maltodextrin DE 11-16, and 90 min after Tapioca Dextrin).
These results are more or less as expected. Maltodextrin DE 11-16 is digested more easily because
it has the shortest chain. Short chain polysaccharide releases glucose more rapidly than longer
chain polysaccharide. Therefore, it is normal that Maltodextrin DE 11-16 present the maximum
of bio-accessible fraction earlier than Tapioca Dextrin and “Modified starch”.
For this reason, is a bit strange that the maximum of digested sample is higher for “Modified
starch” than for Tapioca Dextrin. Nevertheless, the differences between both sample are small,
and it has to take account experimental error. This question could be resolved by carrying out
more experiments with these samples, and calculate the standard deviation.
InGraph 9 and Graph 10 the released glucose is shown for each sampling point and in dependence
of the carbohydrate source.
Graph 9. Bio-accessible fraction of glucose in jejunum (% of intake as cumulative)

Francina Maria Payeras Perelló Master’s thesis 53/60
Graph 10. Bio-accessible fraction of glucose in ileum (% of intake as cumulative)
As it can be observed on both graphs, the major part of bio-accessible fraction is in jejunum.
Graph 10 shows a very interesting thing for “Modified starch”. The amount of glucose released
during the last two h is very high compared with the other carbohydrate sources.
As we already mentioned before, the “Modified starch” is the polysaccharide with the longest
chain, i.e. the one with the slowest digestion. Consequently, it’s not surprising that the released
glucose from “Modified starch” is absorbed in the ileum after three h of digestion.
4.4. Comparison between static and dynamic digestion method
pH profile
The following graph (Graph 11) shows the evolution of the pH values in the curse of time, in
different compartments of TIM-1.
Graph 11. Changes of pH during dynamic digestion method (representative example)

Francina Maria Payeras Perelló Master’s thesis 54/60
This graph shows the experimental values of pH, where the theoretical values are:
- Stomach: the initial pH is 5.5.
Table 18. pH profile in the stomach
Time
(min) pH
0
30
60
120
210
300
5.5
4.5
3.0
2.0
1.7
1.7
- Duodenum: constant pH of 5.9.
- Jejunum: constant pH of 6.5.
- Ileum: constant pH of 7.4.
This is a difference between dynamic and static digestion method. During static digestion method
the sample with secretions are mixed at constant pH of 3.0 for the gastric phase and at constant
pH of 7.0 for the intestinal phase.
Gastric emptying
In Graph 12 gastric emptying for dynamic digestion method is depicted.
Graph 12. Stomach delivery (dynamic digestion method)
This graph shows another difference between 2 methods. In the static digestion method, the meal
is incubated during a fixed time, fixed pH and the concentration of sample/secretions is kept
constant. However, in the dynamic digestion method, the concentration of secretions and sample
were changing during the digestion process following the protocol Water Fed HFM (High Fat
Meal).

Francina Maria Payeras Perelló Master’s thesis 55/60
In Graph 13 the released glucose is depicted for static and dynamic digestion method and in
dependence of the carbohydrate sources (Maltodextrin DE 11 – 16, Tapioca Dextrin, Modified
starch).
Graph 13. Comparison between static and dynamic digestion method (glucose)
Graph 13 shows that the profiles between static and dynamic digestion method are different.
During the first 90 min, the bio-accessible fraction of glucose is lower than 5% of intake and there
are no major variations. After 90 min all the profiles are different.
For static digestion method, bio-accessible fractions increase drastically at 120 min for all because
in this moment small intestinal phase started and alpha-amylase was added. Then, for
Maltodextrin DE 11-16 and Tapioca Dextrin there is a large similar increase of glucose in the bio-
accessible fraction. This increase is not so important for “Modified starch” and it looks like that
after 4 h the digestion is not completed for “Modified starch”. This result is confirmed by the
value of recovery after 4 h.
Table 19. Recovery of different methods
Recovery (% of intake)
Static digestion
method
Dynamic digestion
method
Maltodextrin DE 11-16 26.3 23.5
Tapioca Dextrin 22.4 8.79
“Modified starch” 12.3 12.2
Table 19 shows that the values of recovery for static digestion method are very similar to those
obtained for dynamic digestion method, except for Tapioca Dextrin. Recovery obtained in the
static method of different carbohydrate sources are more or less as expected because the largest
polysaccharide chain has the lower recovery and vice versa. So the low value of recovery for
Tapioca Dextrin can be a result of experimental errors, because a value of recovery for Tapioca
Dextrin between Maltodextrin DE 11 – 16 and “Modified starch” was expected.

Francina Maria Payeras Perelló Master’s thesis 56/60
For dynamic digestion method, the bio-accessible fractions of glucose increase in a similar way
during the first 90 min for Maltodextrin DE 11-16 and Tapioca Dextrin. Then, bio-accessible
fraction of glucose for Maltodextrin DE 11-16 increases drastically while bio-accessible fraction
of glucose for Tapioca Dextrin increases moderately and seems to reach a constant value at 150
min.
The increase of glucose in the bio-accessible fraction of “Modified starch” is much slower. As
we already mentioned, the “Modified starch” is the polysaccharide with the longest chain, i.e. the
one with slowest digestion. Consequently, it’s not surprising that the released glucose from
“Modified starch” is delayed. However, it’s more surprising that it is not completed, even after
300 min, what is confirmed by the low value of recovery for “Modified starch” after 5 h.
Francina Maria Payeras Perelló Master’s thesis 57/60
5. CONCLUSIONS
A series of in vitro digestions were carried out to study digestibility and bio-accessibility of three
different carbohydrates sources. The obtained results show the dependency of length chain of the
carbohydrate source and glucose release from the carbohydrate source, except for Tapioca Dextrin
when the dynamic digestion method was used. However, only one experiment for each
carbohydrate source with dynamic digestion method was carried out, and these results could be
caused by experimental errors.
The values of the recovery of glucose (Table 19) are lower than expected, and it seems that the
digestion is not complete. Those results could be explained due to glucose being the last product
of the starch digestion. Before reaching free glucose monomers the starch chains are broken into
oligosaccharides that are consequently broken into tri- di- and monosaccharides.
One of the initial hypothesis was that the matrix of the clinical nutrition products could affect
digestibility of polysaccharide, but the results show that there are no significant differences
between the different used matrixes. Only it was confirmed that by pre-treatment at 121°C favors
the solubilization of the polysaccharide and consequently the recovery is higher than without pre-
treatment.
At the same time, two methods of in vitro digestion have been studied to know the advantages
and drawbacks of each one, and to find out in possible future studies which method is more
convenient (depending on the target of study). The results, as expected, show that the values of
the recovery are similar between both methods, which is important for future experiments. It was
also proved that the static digestion method is faster and easier because two experiments can be
carried out at the same day. However, the results with dynamic method are more reliable, because
the method mimics better human digestion than static digestion method.
Furthermore, effect of the volume was studied. The obtained results take us to the conclusion that
static digestion method with small volumes can be carry out because it does not affect the final
result and also it saves resources.
5.1. Following steps
Due to the complexity of the used methods (enzymes, static method, dynamic method, …) only a
limited number of experiments were able to be performed under the scope of a master’s thesis.
Therefore, the repetition of these experiments could be the next step for more accurate results.
The obtained values of the recovery are lower than as expected, but we have to take into account
that the monosaccharide glucose is the last product of starch digestion, and for this reason, the
next step could be the measurement of the concentration of maltose (two molecules of glucose).
Looking the obtained results of the study of matrix effect, it could be interesting to try more
complex matrixes, to study how a more complex matrix could affect the digestibility of these
polysaccharides.

Francina Maria Payeras Perelló Master’s thesis 58/60
6. ACKNOWLEDGEMENTS
I thank all who in one way or another contributed in the completion of this thesis. I am so
grateful to the Erasmus+ scholarship and Fresenius Kabi company in Bad Homburg for
making it possible for me to do an internship there. It has been a period of intense learning
for me, not only in the scientific arena, but also on a personal level.
In addition, I would like to thank my colleagues from Fresenius Kabi for their wonderful
collaboration. You supported me greatly and provided me with the tools that I needed to
choose the right direction and successfully complete my thesis.

Francina Maria Payeras Perelló Master’s thesis 59/60
7. REFERENCES
1Guerra, A., Mesmin, L. E., Livrelli, V., Denis, S. Diot, S. B., Alric, M. (2012). Relevance and
challenges in modeling human gastric and small intestinal digestion. Trends in Biotechnology, 30(11),
591 – 600. 2 www. quizlet.com (August 2016) 3 www. socratic.org (August 2016) 4 National Digestive Diseases Information Clearinghouse. (2008). Celiac Disease. Bethesda, MD: U.S.
National Institute of Diabetes and Digestive and Kidney Diseases, National Institutes of Health, U. S.
Department of Health and Human Services. 5 Boisen, S., & Eggum, B. O. (1991). Critical evaluation of in vitro methods for estimating digestibility
in simple-stomach animals. Nutrition Research Reviews, 4, 141 – 162. 6 Coles, L. T., Moughan, P. J., & Darragh, A. J. (2005). In vitro digestion and fermentation methods,
including gas production techniques, as applied to nutritive evaluation of foods in the hindgut of
humans and other simple-stomached animals. Animal Food Science and Technology, 123 – 124, 421
– 444. 7 Fuller, M. F. (Ed.). (1991). In vitro digestion for pigs and poultry. Wallington, UK: CAB
International, 333 - 337 8 Hur, S. J., Lim, B. O., Decker, E. A., McClements, D. J. (2011). In vitro human digestion models for
food applications. Food Chemistry, 125, 1 – 12. 9 Minekus, M., Marteau, P., Havenaar, R., Huis, J. H. J. (1995). A Multicompartmental dynamic
computer-controlled model simulating the stomach and small intestine. Alternatives to Laboratory
Animals, 23, 197 – 209. 10 Bravo, L., Siddhuraju, P., & Saura-Calixto, F. (1998). Effect of various processing methods on the
in vitro starch digestibility and resistant starch content of Indian pulses. Journal of Agricultural and
Food Chemistry, 46, 4667-4674 11 Wolf, B. W., Bauer, L. L., & Fahey, G. C (1999). Effects of chemical modification on in vitro rate
and extent of food starch digestion: An attempt to discover a slowly digested starch. Journal of Agricultural and Food Chemistry, 47, 4178-4183. 12 Weurding, R. E., Veldman, A., Veen, W. A. G., van der Aar, P. J., & Verstege, M. W. A. (2001).
In vitro starch digestion correlates well with rate and extent of starch digestion in broiler chicken. Journal of Nutrition, 131, 2336-2342. 13 Evans, A., & Thompson, D. B. (2004). Resistance to α-amylase digestion in four native high
amylose maize starches. Cereal Chemistry, 81, 31-37. 14 Zhang, Q., Abe, T., Takahashi, T., & Sasahara, T. (1996). Variations in in vitro starch digestion of
glutinous rice flour. Journal of Agricultural Food Chemistry, 44, 2672-2674. 15 Kong, F., & Singh, R. P. (2008). A model stomach system to investigate disintegration kinetics of
solid foods during gastric digestion. Journal of Food Science, 73, S202-S210. 16 Brandon, E. F. A., Oomen, A. G., Rompelberg, C. J. M., Versantvoort, C. H. M., van Engelen, J. G.
M., Sips, A., et al. (2006). Consumer product in vitro digestion model: bio-accessibility of
contaminants and its application in risk assessment. Regulatory Toxicology and Pharmacology, 44,
161-171. 17 Longland, A. C. (1991). Digestive enzyme activities in pigs and poultry. In in vitro Digestion for
pigs and Poultry (ed. M. F. Fuller), 3 – 18. 18 Oomen, A. G., Rompelberg, C. J. M., Bruil, M. A., Dobbe, C. J. G., Pereboom, D. P. K. H., Sips,
A. J. A. M. (2001). Development of an in vitro digestion model for estimating the bio-accessibility of
soil contaminants. Archives of environmental contamination and toxicology, 44, 281 – 287. 19 Minekus, M., Alminger, M, Alvito, P, Ballance, S., Bohn, T., et al (2014). A standardized static in
vitro digestion method suitable for food-an international consensus. Food and Function_The Royal Society of Chemistry, 5, 1113 – 1124. 20 Hoebler, C. (2002), Development of an in vitro system simulating bucco-gastric digestion to assess
the physical and chemical changes of food. International Journal of Food Sciences and Nutrition, 53,
389 – 402. 21 Elashoff, J. D., Reedy, T. J., Meyer, J. H. (1982). Analysis of gastric emptying data. Clinical trends and topics, 83, 1306 – 1312. 22 McClements, D. J., Decker, E. A., & Park, Y. (2009). Controlling lipid bioavailability through
physiochemical and structural approaches. Critical Reviews in Food Science and Nutrition, 49, 48-67.

Francina Maria Payeras Perelló Master’s thesis 60/60
23 Fotouros, D. G., & Mullertz, A. (2008). In vitro lipid digestion models in design of drug delivery
systems for enhancing oral bioavailability. Expert Opinion on Drug Metabolism and Toxicology, 4,
65-76. 24 Frontela-Saseta, C. et al. (2011) Evaluation of antioxidant activity and antiproliferative effect of
fruit juices enriched with Pycnogenol(R) in colon carcinoma cells. The effect of in vitro
gastrointestinal digestion. Phytotherapy Research 25, 1870–1875. 25 Kong, F. and Singh, R.P. (2008) Disintegration of solid foods in human stomach. Journal of Food
Science. 73, R67–R80. 26 Mun, S. H., Decker, E. A., & McClements, D. J. (2007). Influence of emulsifier type on in vitro
digestibility of lipid droplets by pancreatic lipase. Food Research International, 40, 770-781. 27 William F. Ganong, MD, Review of Medical Physiology, University of California, 25 (4), 384 – 393 28 Rosenblum JL, Irwin CL, Alpers DH,(1988). Starch and glucose oligosaccharides protect salivary-
type amylase activity at acid pH. American Journal of Physiology, 254, G775–80. 29 Mandel, A. L., Breslin, P. A. S. (2012). High Endogenous salivary amylase activity is associated
with improved glycemic homeostasis following starch ingestion in adults. The journal of nutrition,
142, 853 – 858. 30 McGregor, E. A., Janecek, S., Svensson, B. (2001), Relationship of sequence and structure to
specificity in the alpha-amylase family of enzymes. Biochimica et Biophysica Acta 1546, 1 – 20. 31 http://pdb101.rcsb.org/motm/74 (August 2016) 32 Uitdehaag, J., Mosi, R., Kalk, K., van der Veen, B., Dijkhuizen, L., Withers, S. & Dijkstra, B.
(1999). X-ray structures along the reaction pathway of cyclodextrin glycosyltransferase elucidate
catalysis in the α-amylase family. Nature Structural & Molecular Biology., 6, 432-436. 33 Abdel-Aal, E. S. M. (2008). Effects of baking on protein digestibility of organic spelt products
determined by two in vitro digestion methods. LWT-Food Science and Technology, 41, 1282–1288. 34 Garrett, Grisham (1997), Principles of Biochemistry with Human Focus, Brooks/Cole, Second
Edition 35 http://pdb101.rcsb.org/motm/46 (August 2016) 36 Erickson, R.H., Kim, Y.S. (1990). Digestion and Absorption of Dietary Protein. Annual Review of
Medicine, 41, 133-139. 37 Perona, J. J., Craik, C. S. (1997). Evolutionary divergence of substrate specificity within the
chymotrypsin-like serine protease fold. The Journal of Biological Chemistry. 272 (48), 29987 – 29990. 38 Earnest, T., Fauman, E., Craik, C.S., Stroud, R. (1991). A Structure of Trypsin at 120K:
Comparison of low temperature and room temperature structures. Proteins 10, 171. 39 Yang, Y., Wen, Y. J., Cai, Y. N., Vallée, I., Boireau, P., Liu, M. Y., Cheng, S. P. (2015). Serine
proteases of parasitic helminthes. The Korean journal of parasitology, 53(1), 1 – 11. 40 Butterwoth, P. J., Warren, F. J., Ellis, P. R. (2011). Human alpha-amylase and starch digestion: an
interesting marriage. Starch journal, 63, 35 – 405. 41 Würsch, P., Vedovo, S., Koellreutter, B. (1986). Cell structure and starch nature as key determinants
of the digestion rate of starch in legume. The American journal of clinical nutrition, 43, 25 – 29. 42 Bellmann, S., Minekus, M., Zeijdner, E., Verwei, M., Sanders, P., Basten, W., Havenaar, R. (2010).
TIM-carbo: a rapid, cost-efficient and reliable in vitro method for glycemic response after
carbohydrate ingestion. Dietary fibre: new frontiers for food and health. Wageningen Academic
Publishers, Wageningen, 467 – 473. 43 American diabetes association (2004). Diabetes care. 27(1), S5 – S10. 44 Minekus, M., Alminger, M, Alvito, P, Ballance, S., Bohn, T., et al (2014). A standardized static in
vitro digestion method suitable for food-an international consensus. Food and Function_The Royal
Society of Chemistry, 5, 1113 – 1124. 45 D. Rajalingam, C. Loftis, J. J. Xu, T. K. S. Kumar, Protein science, 18 (5), 980 – 993 (2009) 46 Minekus, M., Alminger, M, Alvito, P, Ballance, S., Bohn, T., et al (2014). A standardized static in
vitro digestion method suitable for food-an international consensus. Food and Function_The Royal Society of Chemistry, 5, 1113 – 1124. 47 Minekus, M., Alminger, M, Alvito, P, Ballance, S., Bohn, T., et al (2014). A standardized static in
vitro digestion method suitable for food-an international consensus. Food and Function_The Royal
Society of Chemistry, 5, 1113 – 1124.