Novel Ophthalmic Formulations For Improved Natamycin ...
154
University of Mississippi University of Mississippi eGrove eGrove Electronic Theses and Dissertations Graduate School 1-1-2020 Novel Ophthalmic Formulations For Improved Natamycin Delivery Novel Ophthalmic Formulations For Improved Natamycin Delivery In Fungal Infections Of The Eye. In Fungal Infections Of The Eye. Akash Vijay Patil Follow this and additional works at: https://egrove.olemiss.edu/etd Recommended Citation Recommended Citation Patil, Akash Vijay, "Novel Ophthalmic Formulations For Improved Natamycin Delivery In Fungal Infections Of The Eye." (2020). Electronic Theses and Dissertations. 1813. https://egrove.olemiss.edu/etd/1813 This Dissertation is brought to you for free and open access by the Graduate School at eGrove. It has been accepted for inclusion in Electronic Theses and Dissertations by an authorized administrator of eGrove. For more information, please contact [email protected].
-
Upload
khangminh22 -
Category
Documents
-
view
1 -
download
0
Transcript of Novel Ophthalmic Formulations For Improved Natamycin ...
University of Mississippi University of Mississippi
eGrove eGrove
Electronic Theses and Dissertations Graduate School
1-1-2020
Novel Ophthalmic Formulations For Improved Natamycin Delivery Novel Ophthalmic Formulations For Improved Natamycin Delivery
In Fungal Infections Of The Eye. In Fungal Infections Of The Eye.
Akash Vijay Patil
Follow this and additional works at: https://egrove.olemiss.edu/etd
Recommended Citation Recommended Citation Patil, Akash Vijay, "Novel Ophthalmic Formulations For Improved Natamycin Delivery In Fungal Infections Of The Eye." (2020). Electronic Theses and Dissertations. 1813. https://egrove.olemiss.edu/etd/1813
This Dissertation is brought to you for free and open access by the Graduate School at eGrove. It has been accepted for inclusion in Electronic Theses and Dissertations by an authorized administrator of eGrove. For more information, please contact [email protected].
NOVEL OPHTHALMIC FORMULATIONS FOR IMPROVED NATAMYCIN
DELIVERY IN FUNGAL INFECTIONS OF THE EYE.
A Dissertation
presented in partial fulfillment of requirements
for the degree of Doctor of Philosophy
in Pharmaceutical Sciences with an emphasis in Pharmaceutics and Drug Delivery
by
Akash V. Patil
The University of Mississippi
School of Pharmacy, Oxford, MS
(May 2020)

Copyright © 2020 by Akash V. Patil
All rights reserved
ii
ABSTRACT
Natamycin (NT) is a front-line drug in the management of ocular fungal infections (OFI).
An ophthalmic marketed NT suspension (Natacyn®) is currently the only FDA approved
medication prescribed in the pharmacotherapy of OFI. Current NT pharmacotherapy requires
frequent topical administration (every hour or 2-hours over 6-8 times in a day) due to it being
instilled as eye-drops. This leads to higher precorneal losses and subsequent poor permeation and
bioavailability. Therefore, in this research study, alternative ocular formulations of NT were
investigated with an intent to improve precorneal retention and corneal permeation in comparison
to Natacyn®.
Chapter 1 discusses various aspects of NT such as its chemistry and pharmacology,
antifungal spectrum and potential for development of resistance, ocular clinical evaluations, and
specifics on Natacyn® to obtain a perspective of NT use in OFI.
Chapter 2 reports the preparation and optimization of NT loaded surface coated PEGylated
NLC (NT-PEG-NLC) using Box-Behnken Design. The optimized NT-PEG-NLC were found to
have desirable physicochemical characteristics and exhibited significantly higher transcorneal
permeation than Natacyn®, in vitro. In vivo ocular biodistribution of NT-PEG-NLC indicated that,
despite NT load in NT-PEG-NLC (0.3%) being 1/16th of Natacyn® (5%), NT-PEG-NLC permeated
the intact cornea to reach the inner tissues.
To further improve ocular delivery of NT, chapter 3 reports on the development of a gelling
system using a full factorial design in which the optimized NT-PEG-NLCs were loaded. This
gelling system at a lower NT concentration (0.3%) compared to Natacyn® (5%), displayed superior
iii
pharmacokinetic parameters in the tear film and comparable NT concentrations in the inner ocular
tissues (in vivo) at a 16-fold lower dose; indicating its potential ocular applications.
Chapter 4 reports on the design of Eudragit™ RLPO based ocular films for ocular delivery
of NT using central composite design. An optimized film formulation was selected on the bases
of the interaction plots between the independent factors and dependent variables; and, it exhibited
significantly higher transcorneal permeation (ex vivo) and superior pharmacokinetic parameters
(in vivo) compared to Natacyn®. These observations imply that, NT-loaded films could also be
explored as alternative dosage forms in the management of OFI.

iv
DEDICATION
To my past, present, and future selves

v
LIST OF ABBREVIATIONS
NT: Natamycin
OFI: Ocular fungal infections
WHO: World Health Organization
NLCs: Nano lipid carriers
PEG: Polyethylene glycol
NT-PEG-NLCs: Natamycin loaded PEGylated nano lipid carriers
NT-NLCs: Natamycin loaded nano lipid carriers
RSM: Response surface methodology
PDI: Polydispersity index
HPH: High-pressure homogenization
DL: Drug loading
STEM: Scanning Tandem Electron Microscopy
PXRD: Powder X-ray diffraction
RMβCD: Randomly methylated-β-cyclodextrin
ICB: Iris-ciliary body
AH: Aqueous humor
vi
VH: Vitreous humor
2FI: 2 factorial interaction
NT-PEG-NLC-GEL: Natamycin loaded PEGylated nano lipid carriers entrapped in gelling system
AUC0-t: Area under curve from time t = 0 to t = t
T0.5: Half-life
Cmax: Maximum concentration
MRT0-∞: Mean residence time
CQA: Critical quality attribute
vii
ACKNOWLEDGMENTS
First and foremost, I would like to extend my deepest gratitude to my advisor Dr. Soumyajit
Majumdar for giving me the opportunity to be a part of his research group and a chance of working
on this research project. He has been instrumental in molding me into an independent researcher
by letting me figure out what questions to ask and how to answer them largely on my own. He has
been an excellent mentor in the truest sense of the word!
Secondly, I would like to thank my committee members – Dr. Michael Repka, Dr. Samir
Ross, and Dr. Mahavir Chougule for all of their invaluable insight and suggestions in making my
dissertation more meaningful and impactful. I also extend my thanks to the staff – Ms. Abigail
Sims, Ms. Deborah Herod, and Ms. Melissa King & scientists – Dr. Bharathi Avula and Dr. Yang-
Hong Wang of the University of Mississippi School of Pharmacy for all their help and
collaborations in my four years of graduate work.
I would like to acknowledge the funding from National Institutes of Health – National Eye
Institute and National Institute of General Medical Sciences towards the successful execution of
my graduate research work and also our collaborators at University of Mississippi Medical Center
(Jackson), University of Tennessee (Knoxville), University of Tennessee Health Science Center
(Memphis), and Campbell University (North Carolina) for all their timely contributions. I would
also give a huge shout out to some of my lab members – Dr. Prit Lakhani, Dr. Pranjal Taskar, Cory
Sweeney, Ruchi Thakkar, Kai-Wei Wu, Dr. Surabhi Shukla, and Dr. Eman Ashour for being so
fantastic and encouraging to work with since the start of my PhD journey!
Last but not the least, I would like to thank my parents – Dr. Vijay Patil and Sushama Patil
viii
for all their love, support, and faith in me until this very day. I am also lucky enough to have
amazingly supportive and caring friends in my life – Dr. Ajinkya Bhagurkar, Dr. Prit Lakhani, Dr.
Pranjal Taskar, Ankur Dashputre, Tanvee Thakur, and Pushkar Saralkar, who I truly consider
family. They have helped me through not just this endeavor, but all of the personal issues that have
arisen in my life. I would also like to thank my oldest friends – Omkar Soparkar, Kunj Karia, and
Ritesh Varyani for being so very supportive of me throughout this process from afar, even though
they never quite understood why I would want to pursue a PhD. I don’t think that I could
adequately express how thankful I am for all my friends!
ix
TABLE OF CONTENTS
Abstract……………………………………………………………………………………………ii
Dedication………………………………………………………………………………………...iv
List of abbreviations………………………………………………………………………………v
Acknowledgments……………………………………………………………………………….vii
List of Figures………………………………………………………………………………….....xi
List of Tables…………………………………………………………………………………....xiv
Chapter 1: Current Perspectives on Natamycin in Ocular Fungal Infections………………………1
1.1. Introduction……………………………………………………………………………….2
1.2. Challenges in current Natamycin therapy……………………………………………….18
1.3. Objective………………………………………………………………………………...19
1.4. Specific aims…………………………………………………………………………….19
Chapter 2: Formulation Development, Optimization, and In vitro – In vivo Characterization of
Natamycin Loaded PEGylated Nano-lipid Carriers for Ocular Applications…………….21
2.1. Introduction……………………………………………………………………………...22
2.2. Materials and methods…………………………………………………………………..23
2.3. Results…………………………………………………………………………………...34
2.4. Discussion…………………………………………………………………………….…46
2.5. Conclusion………………………………………………………………………...…….55
x
Chapter 3: Carboxyvinyl Polymer and Guar-Borate Gelling System Containing Natamycin Loaded
PEGylated Nanolipid Carriers Exhibit Improved Ocular Pharmacokinetic Parameters
…………………………………………………………………………….……...………58
3.1. Introduction……………………………………..……………………………….………60
3.2. Materials and methods……………………………………………………………….….62
3.3. Results………………………………………………………………………………...…71
3.4. Discussion…………………………………………………………………………...…..80
3.5. Conclusion……………………………………………………………………………....87
Chapter 4: Design and In vitro – In vivo Evaluation of Eudragit® Based Natamycin Films for
Fungal Infections of the Eye……………………………………………………………...89
4.1. Introduction……………………………………..……………………………….………90
4.2. Materials and methods……………………………………………………………….….91
4.3.Results………………………………………………………………………………...….98
4.4. Discussion………………………………………………………………………….…..106
4.5. Conclusion…………………………………………………………………………......111
Bibliography…………………………………………………………………………………....113
Vita……………………………………………………………………………………………...135
xi
LIST OF FIGURES
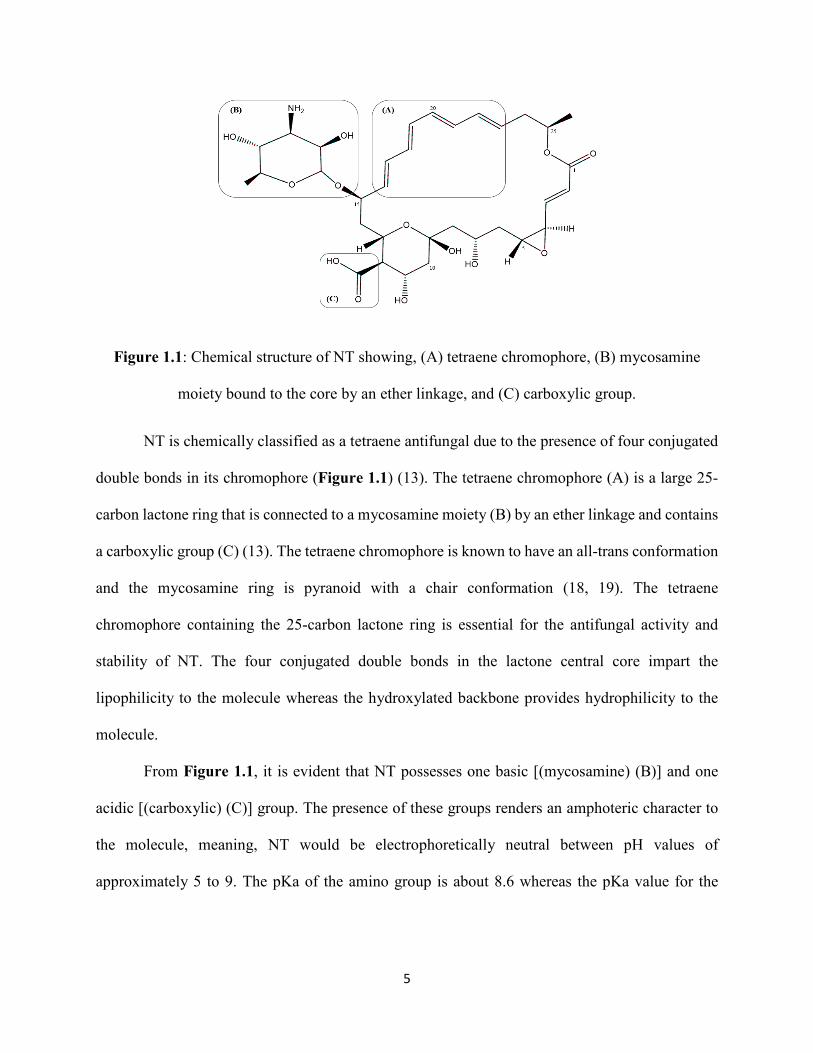
Figure 1.1: Chemical structure of NT showing, (A) tetraene chromophore, (B) mycosamine
moiety bound to the core by an ether linkage, and (C) carboxylic group…………………………...5
Figure 2.1: RSM, interaction, and contour plots showing the effect of Precirol® ATO 5, castor oil,
Span® 80, and HPH time on particle size and plot between the observed and predicted values of
particle size……………………………………………………………………………………….37
Figure 2.2: RSM, interaction, and contour plots showing the effect of castor oil and HPH time on
% entrapment and plot between the observed and predicted values of % entrapment…………….38
Figure 2.3: RSM, interaction, and contour plots showing the effect of castor oil and HPH time on
% DL and plot between the observed and predicted values of % DL……………………………..39
Figure 2.4: STEM image for the optimized NT-PEG-NLC formulation…………………………41
Figure 2.5: PXRD plots for B-NLC (PEG-NLC without NT), NT, and NT-PEG-NLC………….42
Figure 2.6: Plots showing changes in particle size, PDI, and % NT entrapment for the NT-PEG-
NLC formulation for one-month at 4°C and 25°C. The changes are statistically non-significant at
p > 0.05…………………………………………………………………………………………...43
Figure 2.7: Plot of rate (µg/min), flux (µg/min/cm2), and permeability (× 10−5 cm/s) for NT
permeation across the cornea from NT-PEG-NLCs, NT-NLCs and Natacyn® over 3 h, (n=3). The
data for rate, flux, and permeability shows a statistically significant difference at p < 0.05 for NT-
PEG-NLCs, NT-NLCs, and Natacyn®…………………………………………………………...44
xii
Figure 2.8: NT concentrations (µg/g) in cornea, ICB, AH, and VH from NT-PEG-NLC, NT-NLC,
and Natacyn® (0.3% and 5%) obtained after three doses; administered every 2 hours (t = 0, 2, and
4 hours) for a 6-hour study; (*) denotes statistically significant difference at p < 0.05 (n=4, data
represented as Mean ± Standard Error)…………………………………………………………...45
Figure 3.1: Plot of viscosity vs. shear rate for selected NT-PEG-NLC-GEL formulations (B2, B4,
B6, and B8) exhibiting shear-thinning rheology………………………………………………….74
Figure 3.2: Plot of rate (µg/min), flux (µg/min/cm2), and permeability (× 10−5 cm/s) for NT
permeation across the isolated cornea from NT-PEG-NLC-GEL-B2, NT-PEG-NLC-GEL-B6, NT-
PEG-NLC and Natacyn® (dose normalized: diluted to 0.3% w/v) over 3-hours, (n=3); data
represented as mean ± standard error of mean; (*) denotes statistically significant difference at p
< 0.05…………………………………………………………………………………………….75
Figure 3.3: (A): Comparison of NT release from NT-PEG-NLC-GEL (formulation B2) and NT
solution; (B): fit to Higuchi model for drug release kinetics for NT-PEG-NLC-GEL (formulation
B2)………………………………………………………………………………………………..76
Figure 3.4: Plot of dose normalized NT concentrations (µg/µL) versus time (hours) profile for
NT-PEG-NLC-GEL, NT-PEG-NLC, and Natacyn®; (*) and (**) denotes statistically significant
difference between (NT-PEG-NLC-GEL and NT-PEG-NLC) and (NT-PEG-NLC-GEL and
Natacyn®) at p < 0.05, respectively; (n=3, data represented as Mean ± Standard Error)………….78
Figure 3.5: NT concentrations (µg/g) in cornea, ICB, AH, and VH from NT-PEG-NLC-GEL
(dose: 0.3 mg; instillation volume: 100 µL), NT-PEG-NLC (dose: 0.3 mg; instillation volume: 100
xiii
µL), and Natacyn® (dose: 5 mg; instillation volume: 100 µL) obtained after instillation every 3-
hour and 4-hour for a 9-hour and an 8-hour study, respectively; (*) denotes statistically significant
difference at p < 0.05 (n=3, data represented as Mean ± Standard Error)…………………………80
Figure 4.1: One-factor interaction plot showing the effect of Methocel™ grade on % cumulative
release…………………………………………………………………………..………………102
Figure 4.2: One-factor interaction plots showing the effect of Methocel™ grade and Eudragit™
RLPO amount on time required for the release to plateau……………………………………….103
Figure 4.3: One-factor interaction plots showing the effect of Methocel™ grade and Methocel™
amount on film thickness………………………………………………………………………..103
Figure 4.4: Plot of rate (µg/min), flux (µg/min/cm2), and permeability (× 10−5 cm/s) for NT
permeation across the isolated rabbit cornea from NT-film-14 and Natacyn® over 3-hours, (n=3);
data represented as mean ± standard error of mean; (*) denotes statistically significant difference
at p < 0.05……………………………………………………………………………………….104
Figure 4.5: Plot of dose normalized NT concentrations (µg/µL) versus time (hours) profile for
NT-film-14 and Natacyn®; (*) denotes statistically significant difference at p < 0.05; (n=3, data
represented as mean ± standard error of mean)………………………………………………….106
xiv
LIST OF TABLES
Table 1.1: Antifungal spectrum of NT……………………………………………………………9
Table 1.2: Summary of ocular evaluations of NT……………………………………………….13
Table 1.3: Pharmaceutical features and therapeutic regimen for Natacyn®……………………..15
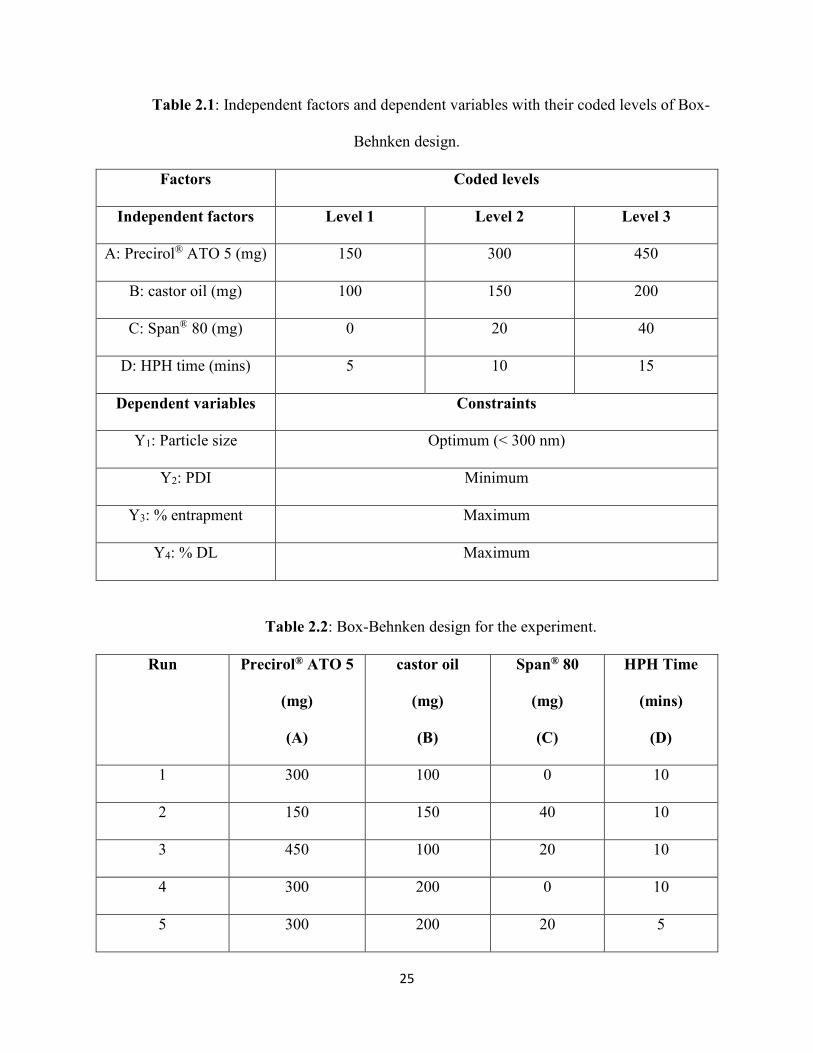
Table 2.1: Independent factors and dependent variables with their coded levels of Box-Behnken
design…………………………………………………………………………………………….25
Table 2.2: Box-Behnken design for the experiment……………………………………………...25
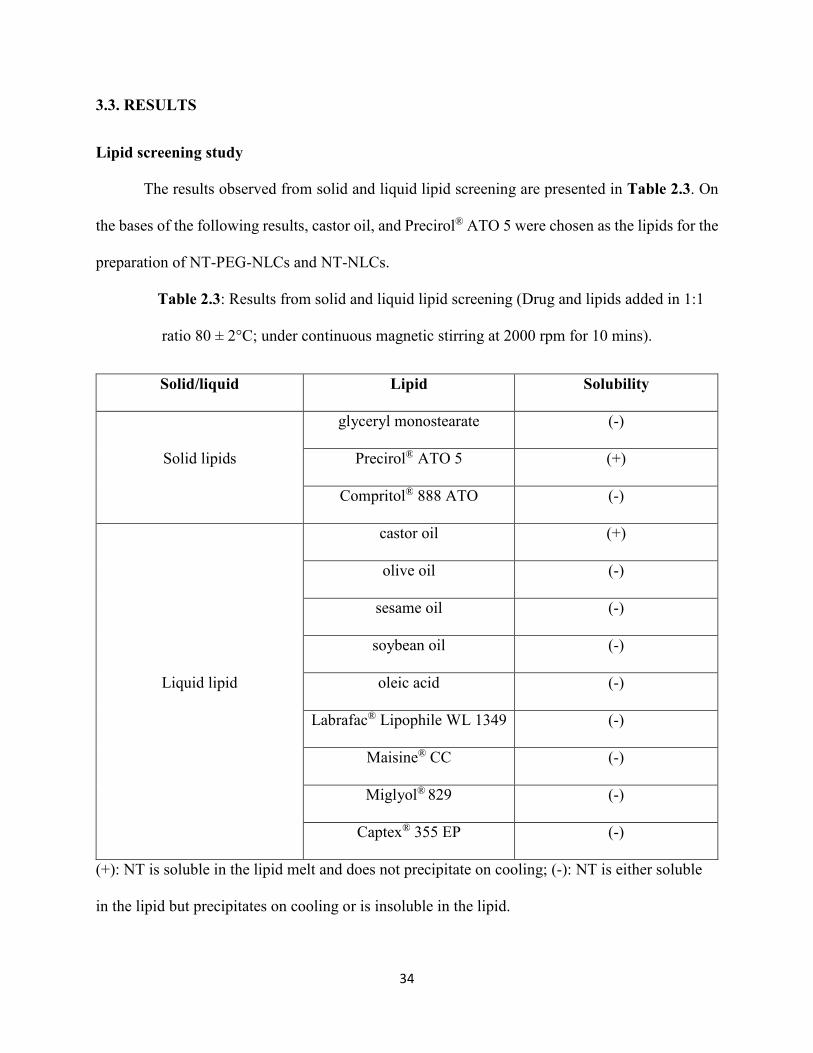
Table 2.3: Results from solid and liquid lipid screening (Drug and lipids added in 1:1 ratio 80 ±
2°C; under continuous magnetic stirring at 2000 rpm for 10 mins)……………………………….34
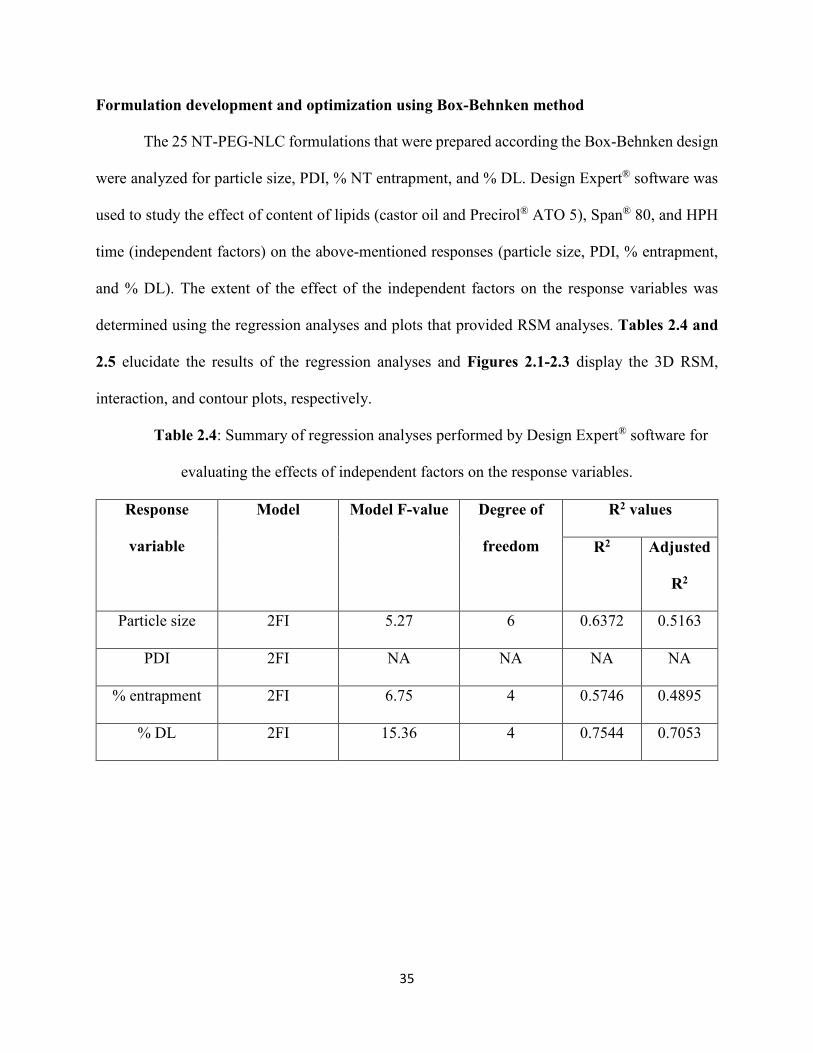
Table 2.4: Summary of regression analyses performed by Design Expert® software for evaluating
the effects of independent factors on the response variables……………………………………...35
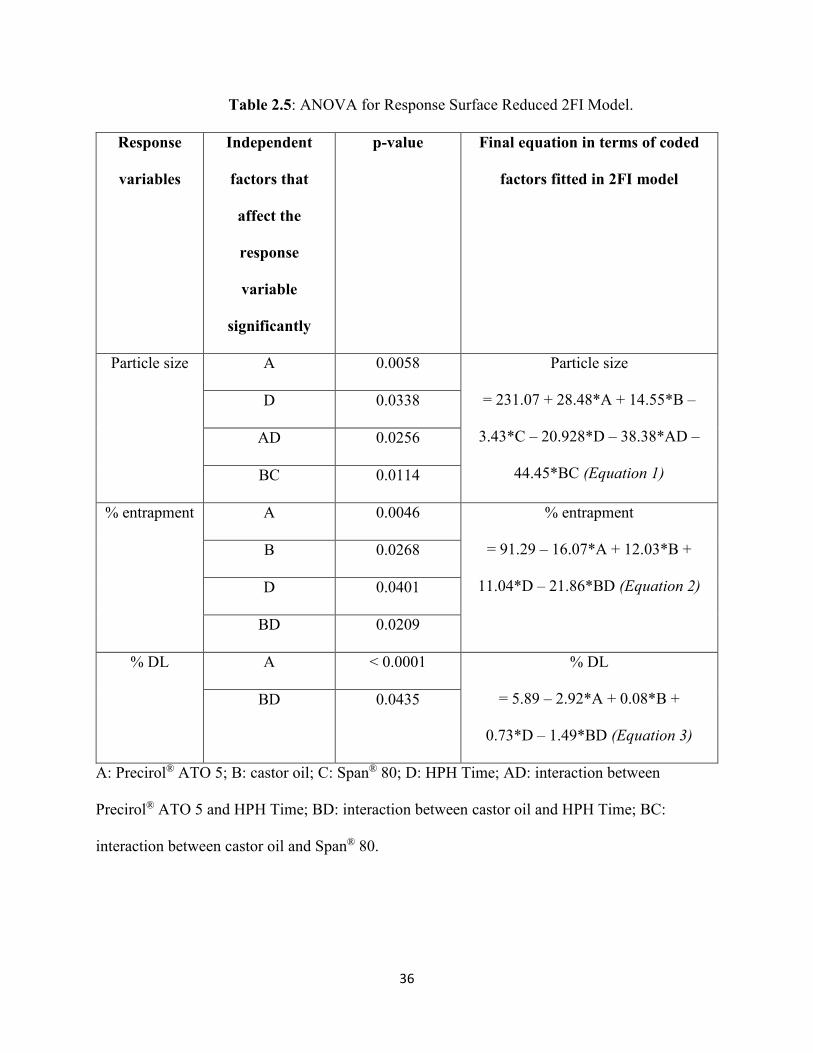
Table 2.5: ANOVA for Response Surface Reduced 2FI Model………………………………….36
Table 2.6: Composition of the most desirable formulation obtained by Design Expert® software
with predicted and experimental values…………………………………………………………..40
Table 3.1: Independent factors (at their two levels) and dependent variables in the experimental
23 factorial design…………………………………………………………………………...……63
Table 3.2: 23 factorial design for the NT-PEG-NLC-GEL……………………………………….64
Table 3.3: Parameters for texture analyses of NT-PEG-NLC-GEL……………………………...66
xv
Table 3.4: Dosing regimen of rabbits (n = 3) for ocular biodistribution studies ………………….69
Table 3.5: Results from gelling time and gel depot collapse time study………………………….72
Table 3.6: Pre-corneal tear PK parameters obtained for NT-PEG-NLC-GEL, NT-PEG-NLC, and
Natacyn® (5%)……………………………………………………………………………………77
Table 4.1: Independent factors (varied at three levels) and dependent variables in the 20
experimental run CCD……………………………………………………………………………92
Table 4.2: 20 experimental run CCD…………………………………………………………….93
Table 4.3: Peelability and NT content results for the 20-experimental run CCD study…………..98
Table 4.4: Results for the 7 NT-film formulations that were selected post the peelability
study………………………………………………………………………………………….…100
Table 4.5: ANOVA for reduced linear model…………………………………………………101
1
Chapter 1
Current Perspectives on Natamycin in Ocular Fungal Infections
Abstract:
Currently, natamycin ophthalmic suspension (Natacyn®) is the only commercially available
antifungal agent that has been approved in the treatment of superficial fungal infections of the eye
such as fungal keratitis, blepharitis, and conjunctivitis. Despite natamycin requiring frequent
application due to low retention at the ocular surface, it has shown efficacy in treating superficial
ophthalmic fungal infections. This is attributed to its broad antifungal spectrum against
filamentous fungi, safety profile, and its trans-corneal penetration capability. The ability of
natamycin to traverse across the intact cornea and reach adjacent stromal layers has been credited
to be one of the major factors favoring its continued use in superficial fungal infections over other
antifungal agents such amphotericin B and azole class of antifungals, which can only penetrate the
debrided cornea, but not intact cornea, to elicit their activity. This has led to natamycin being one
of the front-line agents in the therapy of superficial ocular fungal infections. This chapter discusses
various aspects of natamycin such as its chemistry and pharmacology, antifungal spectrum and
potential for development of resistance, ocular clinical evaluations, and specifics on the marketed
natamycin formulation (Natacyn®) to obtain a perspective of natamycin use in ophthalmic fungal
infections.
2
1.1. INTRODUCTION
Natamycin (NT) has been one of the mainstays in the treatment of fungal keratitis. Fungal
keratitis is fungal infection of the eye that affects the clear corneal surface and its immediate
associated layers (1). Currently, NT is the only commercially available antifungal agent
(Natacyn®) that is used in the treatment of fungal keratitis. Other antifungals such as amphotericin
B, azole and echinocandin antifungals are used off-label in fungal keratitis, albeit to a lesser extent
than NT (2). NT has been the forerunner in fungal keratitis due to its broad spectrum of activity
and higher penetration across the intact cornea upon topical application, compared to the other
antifungal agents (3).
NT shows antifungal activity against both filamentous and non-filamentous fungal species,
with a potent and better activity against the former in comparison to the other antifungal agents.
NT has shown potent antifungal activity against clinical cases of fungal keratitis caused by
Aspergillus and Fusarium species, which are the most common causative organisms for fungal
keratitis apart from Candida species (4). Additionally, NT has been shown to have higher
penetration across the intact cornea into the immediate associated corneal layers in comparison to
amphotericin B and the azoles, upon topical application in fungal keratitis. Hence, NT eye-drops
have been the choice of therapy for superficial corneal infections (3, 4).
The activity of NT against Candida species, non-filamentous fungal species which are also
one of the major causative organisms for fungal keratitis, is weak to moderate (2, 3, 5). Hence, NT
eye-drops alone cannot provide effective antifungal therapy against fungal keratitis caused by
Candida species; therefore, concomitant therapy with other antifungals is frequently necessitated.
Another major challenge that has been associated with NT ocular therapy is that, therapeutic
concentration of NT is not reached in inner ocular tissues upon topical application, thereby
3
restricting its utility only in the superficial ocular fungal infections and not in the clinical cases of
deep seated keratomycosis (5-7).
Despite the challenges associated with the use of NT in ocular fungal infections, it is still
being used clinically. This has been attributed to the clinical efficacy/safety profile of NT eye-
drops in fungal infections in which NT demonstrated lesser side-effects, ocular toxicity reactions,
and lower incidences of resistance in comparison to the other antifungals such as amphotericin B
and the azoles (5, 8-10). This has been one of the primary reasons favoring NT in superficial ocular
fungal infections.
This chapter primarily explores two aspects associated with ocular NT therapy; first, the
various attributes of NT such as its pharmacology, chemistry, ocular clinical evaluations and
second, the existing perspectives and challenges associated with the current therapeutic regimen
provided by the marketed NT eye-drops (Natacyn®) in superficial ocular fungal infections.
Discovery, origin, and production
NT was first isolated in 1955 in the Gist-brocades Research Laboratories, the Netherlands,
from the fermentation broth of Streptomyces natalensis bacterial culture obtained from a soil
sample in South Africa (11). The antifungal compound that was isolated was named pimaricin;
name later changed to natamycin. The discovery and properties of NT was published in a paper
entitled “Pimaricin, a new antifungal antibiotic” by Struyk et al. in 1957 (12). The name pimaricin
was changed according to a World Health Organization (WHO) regulation which stated that
antibiotics produced by Streptomyces had to carry names ending in “-mycin”. Such a stipulation
was mandated by WHO because they wanted the name of the organism responsible for the product
to be reflected in the name of the product. Hence, the name pimaricin was changed to natamycin,
which meant “obtained from Streptomyces natalensis” (13).
4
Independently, in 1959, American scientists isolated an antibiotic, tennecetin, from the
culture medium of a Streptomyces strain, obtained from a soil sample collected in Tennessee. From
the analytical studies and biological assays of tennecetin, it was discovered that it was identical to
NT (14). Apart from the Streptomyces species obtained from South African and American soil,
NT was found to be produced by Streptomyces costae, isolated from a soil sample in Spain (15).
Industrially, NT is produced by fermentation using either Streptomyces natalensis or Streptomyces
gilvosporeus (16). Currently there are two patents for NT commercial production and the methods
described by both the patents are along similar lines. The broth of Streptomyces species inoculum
is fermented for about 48-120 hours, depending on the number of cells in the inoculum, the
medium composition, and the desired yield. The fermentation process is carried out between 25-
30°C and at pH 6-8. After the completion of fermentation process, NT is then subjected to
extraction, filtration, and drying processes. The pH of the culture broth is adjusted first to solubilize
the NT which is then extracted using an organic solvent, such as methanol or butanol. The extract
containing NT is then filtered to separate the impurities from the desired NT product. The pH is
then re-adjusted to about neutral, which causes precipitation of NT crystals which are then
subjected to a drying step, to obtain pure NT powder (11, 17).
Chemistry
NT is an antifungal agent belonging to the polyene class of antifungal drugs. It has an
empirical formula of C33H47NO13 and a molecular weight of 665.75. Figure 1 shows the structural
formula of NT.
5
Figure 1.1: Chemical structure of NT showing, (A) tetraene chromophore, (B) mycosamine
moiety bound to the core by an ether linkage, and (C) carboxylic group.
NT is chemically classified as a tetraene antifungal due to the presence of four conjugated
double bonds in its chromophore (Figure 1.1) (13). The tetraene chromophore (A) is a large 25-
carbon lactone ring that is connected to a mycosamine moiety (B) by an ether linkage and contains
a carboxylic group (C) (13). The tetraene chromophore is known to have an all-trans conformation
and the mycosamine ring is pyranoid with a chair conformation (18, 19). The tetraene
chromophore containing the 25-carbon lactone ring is essential for the antifungal activity and
stability of NT. The four conjugated double bonds in the lactone central core impart the
lipophilicity to the molecule whereas the hydroxylated backbone provides hydrophilicity to the
molecule.
From Figure 1.1, it is evident that NT possesses one basic [(mycosamine) (B)] and one
acidic [(carboxylic) (C)] group. The presence of these groups renders an amphoteric character to
the molecule, meaning, NT would be electrophoretically neutral between pH values of
approximately 5 to 9. The pKa of the amino group is about 8.6 whereas the pKa value for the
6
carboxyl group is reported to be around 4-4.5 (20). Hence, NT is present as a zwitterion with an
isoelectric point at pH 6.5 (21).
The mycosamine and the carboxyl terminal of the NT molecule is very polar, while the
opposite terminal is very non-polar (Figure 1.1). The terminal containing the unsaturated tetraene
chromophore is rigid and completely hydrophobic whereas the hydroxylated side is relatively
flexible. The presence of both hydrophilic and hydrophobic regions, renders NT an amphipathic
chemical character (21). The hydroxyl groups and the zwitterionic carboxyl group contribute to
the relative insolubility of NT in organic solvents and the presence of unsaturated tetraene
chromophore contributes to the aqueous insolubility of NT (21).
NT solutions are stable at pH 5-9 when stored in the dark (13). At lower and higher pH,
NT is known to undergo bond cleavage and saponification reactions, respectively, that lead to
instability and loss in antifungal activity and potency (22). The solutions should be stored in dark,
as NT is susceptible to photo-oxidation and photo-degradation via the cleaving of the chromophore
via light absorption (23).
Mechanism of action
The exact mechanism of action of NT was unknown and was only elucidated in the past
decade. NT is known to inhibit fungal cell growth by binding specifically to ergosterol without
permeabilizing the fungal membrane (24). This mechanism is different from the other polyene
antifungal drugs which are known to inhibit the fungal growth by binding to ergosterol and
permeabilizing the membrane.
Ergosterol in fungal cells is responsible for an ordering effect on the membrane, thereby
maintaining the fungal cell integrity, and is also involved in cellular morphogenetic fusion and
fission processes including endocytosis, exocytosis, and vacuolar fusion (25-28). Binding of
7
ergosterol is attributed to interfering with latter processes without affecting the integrity, order,
and/or permeability of the fungal cell membrane. This interference in the afore-mentioned
processes is responsible for inhibiting the fungal cell growth.
NT enters the fungal cell (both, yeast and filamentous fungi) either by permeation across
the fungal membrane or via endocytosis and inhibits the ergosterol-dependent membrane fusion
and fission processes and endocytosis thereby eliciting cellular toxicity (29-33). It is particularly
known to disturb the ergosterol mediated priming phase of vacuole fusion causing a fragmented
vacuolar morphology, affecting the fungal cell growth (34-36). Inhibition of the fusion processes
during the priming phase in the fungal cells has been attributed to being one the major modes of
action responsible for NT antifungal activity. The priming phase consists of the re-arrangements
of different protein complexes mediated by ergosterol and NT disturbs these protein re-
arrangements by binding to ergosterol thereby hindering the ergosterol-dependent protein
functions, leading to inhibition of fungal growth (34).
Furthermore, NT has been evidenced to affect the activity of ergosterol-dependent plasma
protein transport complexes. NT has been shown to inhibit the activity of plasma proteins
responsible for the transport of essential amino acids and sugars into the fungal cells such as
arginine, proline, and glucose, amongst others (37-39). The cessation and/or inhibition in their
import affects the fungal cell growth thereby eliciting antifungal activity (40).
Spectrum of activity
NT has a broad spectrum of antifungal activity against filamentous and a few non-
filamentous fungal species. NT has shown activity against Aspergillus, Fusarium,
Cephalosporium, Penicillium, and Candida species. NT has demonstrated potent antifungal
activity against 191 different isolates of Aspergilli species, with an average minimum inhibitory
8
concentration (MIC) ranging from 5-40 µg/mL; with the higher MIC values corresponding to more
resistant fungal strains such as Aspergillus parasiticus (41). NT has exhibited a high potency in
inhibiting the growth of Aspergillus flavus, Aspergillus fumigatus, and Aspergillus niger (41, 42).
NT shows a potent in-vitro activity against Fusarium species with MIC ranging between 4-8
µg/mL. This resulting MIC (4-8 µg/mL) was for 20 clinically relevant strains of Fusarium
responsible for fungal keratitis (43). NT has also shown sporicidal activity against a few
Aspergillus and Fusarium fungal spores (41). NT has demonstrated antifungal activity against
Candida species, albeit the potency and MIC varying widely. NT showed potent antifungal activity
against Candida albicans at MIC values ranging from 1-2 µg/mL and a weak activity against
Candida parasilopsis at a MIC value as high as 150 µg/mL (44, 45). NT has also shown activity
against Penicillium roquefortii, Penicillium rubrum, and Penicillium discolor fungal species but
was inactive against Penicillium spores (29, 41, 42). Potent antifungal activity against
Paecilomyces and Rhizopus species with MIC values ranging from 2-6 µg/mL, respectively, has
also been reported (41).
Apart from activity against the afore-mentioned clinically relevant strains of fungal species
causing keratitis; NT shows in-vitro antifungal activity against Curvularia species, Microsporum
species, Epidermophyton species, Blastomyces dermatitidis, Coccidioides immitis, Cryptococcus
neoformans, Histoplasma capsulatum, and Sporothrix schenckii at MIC values ranging between
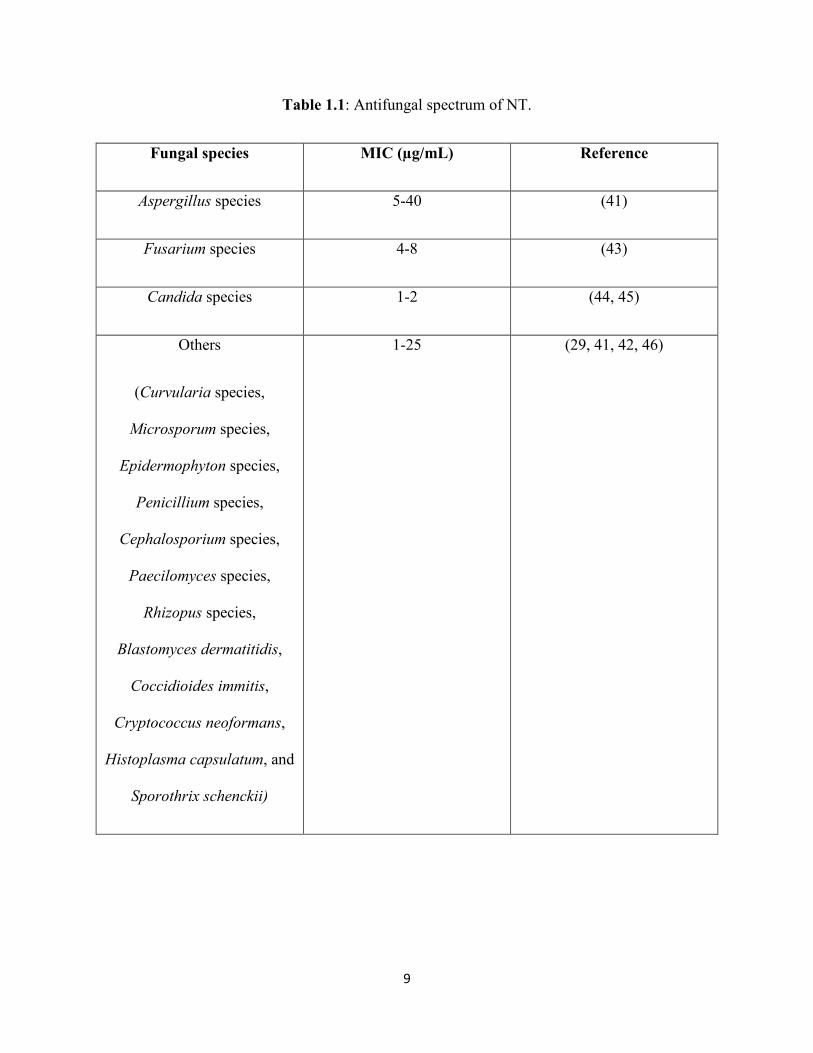
1-25 µg/mL (46). Table 1.1 summarizes the antifungal spectrum of NT.
9
Table 1.1: Antifungal spectrum of NT.
Fungal species MIC (µg/mL) Reference
Aspergillus species 5-40 (41)
Fusarium species 4-8 (43)
Candida species 1-2 (44, 45)
Others
(Curvularia species,
Microsporum species,
Epidermophyton species,
Penicillium species,
Cephalosporium species,
Paecilomyces species,
Rhizopus species,
Blastomyces dermatitidis,
Coccidioides immitis,
Cryptococcus neoformans,
Histoplasma capsulatum, and
Sporothrix schenckii)
1-25 (29, 41, 42, 46)
10
Development of resistance
All antifungal agents are susceptible to the development of fungal resistance. In most of
the cases the development of resistance is manifested as an increase or elevation in the MIC.
However, in the case of NT, it is known that some species and strains, inherently have a low
sensitivity. This is usually seen in the case of Aspergillus and Candida species like Aspergillus
parasiticus, Aspergillus flavus, Candida parapsilosis and others, which owing to low sensitivity
exhibit higher MICs (44, 45, 47, 48). This phenomenon has been attributed to a low concentration
or poor access of NT to the ergosterol target in the fungal cell membrane (24, 29).
A study was performed by Streekstra et al., to observe and evaluate the development of
antifungal resistance against NT (49). Twenty different fungal strains were selected which
included fungal species that caused ocular infections such as Fusarium solani, Fusarium
oxysporum, Aspergillus terreus, Aspergillus fumigatus, Candida parapsilosis, Candida albicans,
Candida krusei amongst others. Upon prolonged exposure to NT, a marginal, statistically non-
significant, increase in MIC (MIC range: 1.2-12.8 µg/mL versus 1.2-13.2 µg/mL) was observed.
An increase in MIC was observed for the Aspergillus and Candida species but not for Fusarium
species, which is consistent with all the reported data in literature (44, 45, 47-49).
However, even though there have been a few strains that have an innately low sensitivity
towards NT, most of the filamentous fungal species such as Fusarium, and some Aspergillus
strains, show susceptibility and no development of resistance, thereby maintaining the continued
utility of NT in superficial fungal infections and/or fungal keratitis.
Ocular evaluations
Fusarium and Aspergillus are the most pre-dominant strains responsible for fungal
keratitis. Fusarium is the most common causative fungal species for fungal keratitis in the US
11
followed by Aspergillus and Candida species (1, 45, 50). However, globally Aspergillus species
is the major causative fungal organism responsible for ophthalmic fungal infections (45).
Therefore, for evaluating the ocular antifungal effectiveness of NT in fungal keratitis, NT
antifungal evaluations have been carried out on Fusarium, Aspergillus, and Candida species
isolated from the eye.
In a study reported by Lalitha et al., the effectiveness of NT against 100 fungal (Fusarium
and Aspergillus) isolates recovered from clinical cases of corneal keratitis were evaluated (47).
The fungal species comprised of 41 Fusarium species, 32 Aspergillus flavus, 18 Aspergillus
fumigatus, 5 Aspergillus terreus, and 4 Aspergillus niger isolates and the MIC values were 2-8
µg/mL, 16-64 µg/mL, 1-4 µg/mL, 4-16 µg/mL, and 2-4 µg/mL, respectively. The results suggested
that NT had good activity against both the species, with a higher MIC for Aspergillus species.
Also, from a comparative evaluation of NT against amphotericin B, caspofungin acetate,
itraconazole, voriconazole, and posaconazole on the fungal species isolated from corneal
infections, it was concluded that NT was more effective than the other antifungal agents (51).
The results from the above-mentioned study are corroborated by a study undertaken by Xu
et al., in which NT was found to be active against 136 Fusarium (Fusarium solani, Fusarium
moniliforme, Fusarium avenaceum, and other complexes), 98 Aspergillus (Aspergillus flavus,
Aspergillus fumigatus, Aspergillus oryzae, Aspergillus versicolor, and other complexes), and 10
Alternaria species (48). These isolates were obtained from ocular keratomycosis. The MIC values
obtained for Fusarium, Aspergillus, and Alternaria alternata were 4-8 µg/mL, 4-32 µg/mL, and 4
µg/mL respectively. The MIC values towards the higher range of 4-32 µg/mL were observed for
Aspergillus fumigatus and Aspergillus oryzae; corroborating the higher MIC values obtained for
Aspergillus species in the study by Lalitha et al.
12
In a study reported by Wang et al., Aspergillus species isolated from clinical fungal keratitis
showed higher MIC values for NT than Fusarium species, and the therapeutic outcome associated
with Aspergillus species was inferior to the clinical therapeutic outcome associated with Fusarium
species (52).
A comparative study by Xuguang et al., reported that NT was more effective, with 89.28%
success rate, in comparison to other antifungal agents such as terbinafine, itraconazole, and
fluconazole, with success rates of 68.58%, 38.18%, and 14.83%, respectively, against clinical
isolates of Fusarium and Aspergillus species obtained from corneal infections (53).
In another study by Kalavathy et al., topical itraconazole (1%) was compared with topical
natamycin (5%) for the treatment of filamentous fungal keratitis caused by Fusarium, Aspergillus,
and Curvularia species (54). The study reported that the treatment outcomes for Fusarium
associated keratitis was significantly better for NT than for itraconazole. However, the treatment
outcomes were similar, between NT and itraconazole treatments, for Aspergillus and Curvularia
species. This study also demonstrated the superior efficacy of NT in treating Fusarium ocular
infections and suggested topical itraconazole as an alternative to topical NT therapy.
In another comparative study, comparing the clinical outcomes of treatment with topical
NT and topical voriconazole for fungal keratitis caused by Fusarium species, a significant
difference between the outcomes associated with both the therapies was not observed (10).
However, in the voriconazole-treated cases perforation of the cornea was more likely to occur than
the NT-treated cases.
In a study reported by Pradhan et al., it was found that NT demonstrated high MIC values
(> 16 µg/mL) against Aspergillus flavus isolated from advanced fungal keratitis; however,
Fusarium, Acremonium, and dematiaceous fungal isolates from advanced fungal keratitis
13
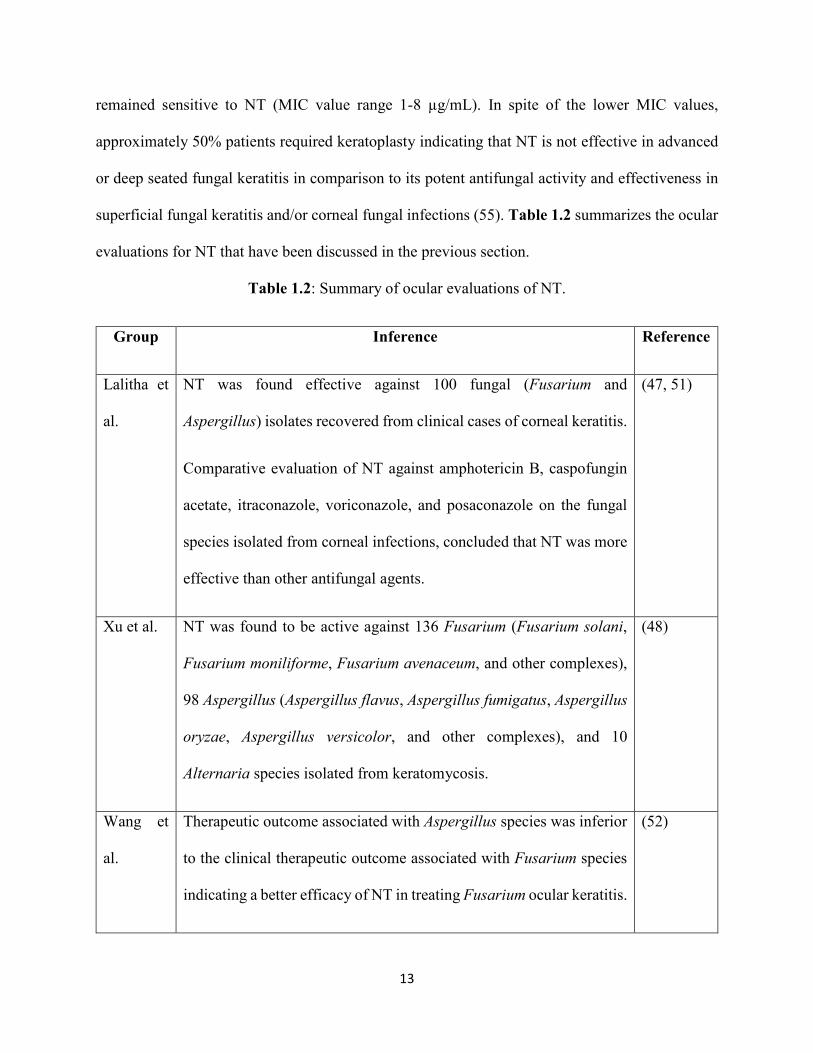
remained sensitive to NT (MIC value range 1-8 µg/mL). In spite of the lower MIC values,
approximately 50% patients required keratoplasty indicating that NT is not effective in advanced
or deep seated fungal keratitis in comparison to its potent antifungal activity and effectiveness in
superficial fungal keratitis and/or corneal fungal infections (55). Table 1.2 summarizes the ocular
evaluations for NT that have been discussed in the previous section.
Table 1.2: Summary of ocular evaluations of NT.
Group Inference Reference
Lalitha et
al.
NT was found effective against 100 fungal (Fusarium and
Aspergillus) isolates recovered from clinical cases of corneal keratitis.
Comparative evaluation of NT against amphotericin B, caspofungin
acetate, itraconazole, voriconazole, and posaconazole on the fungal
species isolated from corneal infections, concluded that NT was more
effective than other antifungal agents.
(47, 51)
Xu et al. NT was found to be active against 136 Fusarium (Fusarium solani,
Fusarium moniliforme, Fusarium avenaceum, and other complexes),
98 Aspergillus (Aspergillus flavus, Aspergillus fumigatus, Aspergillus
oryzae, Aspergillus versicolor, and other complexes), and 10
Alternaria species isolated from keratomycosis.
(48)
Wang et
al.
Therapeutic outcome associated with Aspergillus species was inferior
to the clinical therapeutic outcome associated with Fusarium species
indicating a better efficacy of NT in treating Fusarium ocular keratitis.
(52)
14
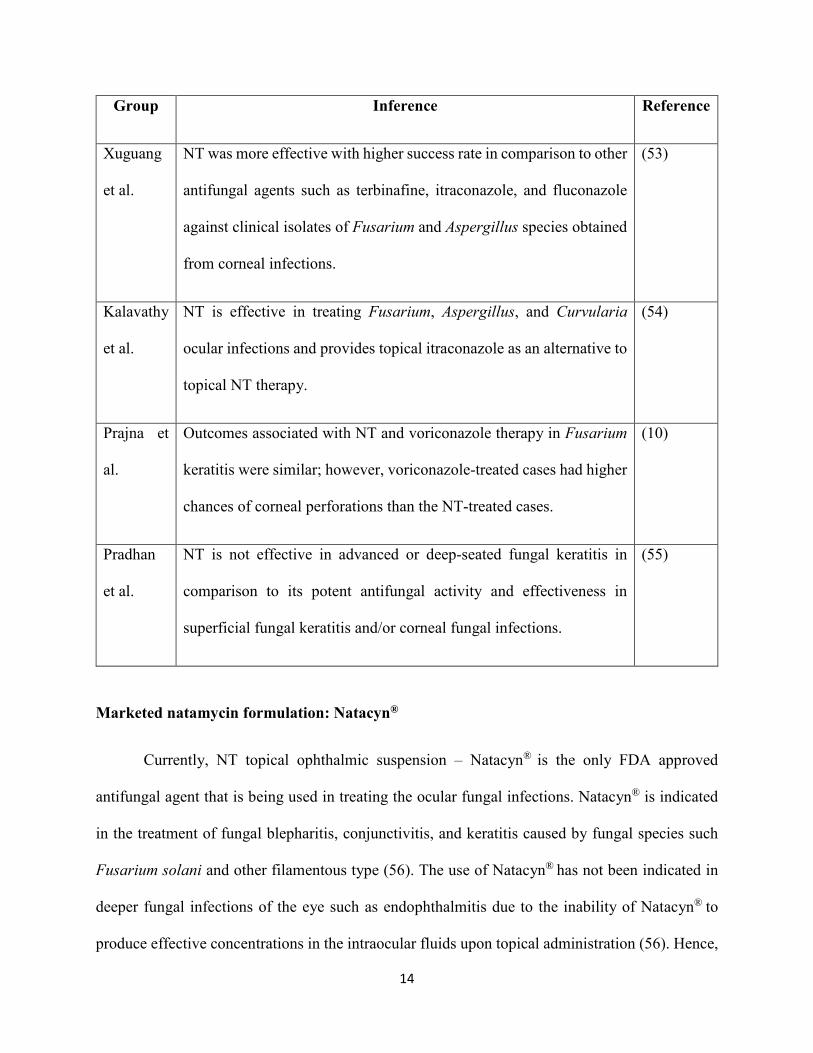
Group Inference Reference
Xuguang
et al.
NT was more effective with higher success rate in comparison to other
antifungal agents such as terbinafine, itraconazole, and fluconazole
against clinical isolates of Fusarium and Aspergillus species obtained
from corneal infections.
(53)
Kalavathy
et al.
NT is effective in treating Fusarium, Aspergillus, and Curvularia
ocular infections and provides topical itraconazole as an alternative to
topical NT therapy.
(54)
Prajna et
al.
Outcomes associated with NT and voriconazole therapy in Fusarium
keratitis were similar; however, voriconazole-treated cases had higher
chances of corneal perforations than the NT-treated cases.
(10)
Pradhan
et al.
NT is not effective in advanced or deep-seated fungal keratitis in
comparison to its potent antifungal activity and effectiveness in
superficial fungal keratitis and/or corneal fungal infections.
(55)
Marketed natamycin formulation: Natacyn®
Currently, NT topical ophthalmic suspension – Natacyn® is the only FDA approved
antifungal agent that is being used in treating the ocular fungal infections. Natacyn® is indicated
in the treatment of fungal blepharitis, conjunctivitis, and keratitis caused by fungal species such
Fusarium solani and other filamentous type (56). The use of Natacyn® has not been indicated in
deeper fungal infections of the eye such as endophthalmitis due to the inability of Natacyn® to
produce effective concentrations in the intraocular fluids upon topical administration (56). Hence,

15
Natacyn® is used in treating the fungal infections of the cornea and associated layers because
topical application of Natacyn® leads to effective NT concentration within the corneal stroma.
Table 1.3 details the pharmaceutical attributes and therapeutic regimen for Natacyn®.
Table 1.3: Pharmaceutical features and therapeutic regimen for Natacyn®.
Feature Details
Dosage form Natamycin ophthalmic suspension (5% w/v)
Dosage composition Active: NT 5% w/v;
Preservative: benzalkonium chloride 0.02% w/v;
Inactive: sodium hydroxide and/or hydrochloric acid
(neutralized to adjust the pH to 5-7.5), and purified water.
Dosage and administration Fungal keratitis: one drop instilled in the conjunctival sac at
hourly or two-hourly intervals for first 3 to 4 days and then
reduced to one drop 6 to 8 times daily for 14 to 21 days.
Fungal blepharitis and conjunctivitis: less frequent dosage
applications (about 4 to 6 times daily).
Supply Supplied as a suspension in a 15 mL amber glass bottle with a
flint glass dropper.
Storage To be refrigerated and not frozen. Exposure to light and
excessive heat should be avoided.
The average Natacyn® therapy generally lasts for 14 to 21 days and if the medication fails
to improve the symptoms of keratitis after 7 to 10 days then Natacyn® therapy needs to be clinically
re-evaluated and additional laboratory tests need to be undertaken. Fungal infection due to non- or

16
less-susceptible fungal species is one of the most common reasons for the failure of Natacyn®
therapy (56). The use of Natacyn® is generally not recommended for pediatric population, pregnant
women, and nursing mothers due to the lack of clinical studies in establishing the safety,
tolerability, and efficacy of Natacyn® in the afore-mentioned special category of population (56).
The commonly reported adverse events for Natacyn® are allergic reactions, changes in vision, chest
pain, corneal opacity, dyspnea, eye discomfort, eye edema, eye hyperemia, eye irritation, eye pain,
foreign body sensation, paresthesia, and tearing (56). These adverse events are common to several
ophthalmic medications and occur on prolonged continuation of the therapy.
Natacyn® has demonstrated better efficacy and success rates in treating fungal infections
of the eye, according to a systematic review and meta-analyses of all the fungal keratitis reports
and database, undertaken by Qiu et al (57). Due to the efficacy of Natacyn® in treating the fungal
infections in the eye due to Fusarium and other filamentous fungi, Natacyn® has been the front-
line therapy in the management of superficial ocular fungal infections.
Pharmaceutical considerations of natamycin
NT is only available as an aqueous ophthalmic suspension, and not as a solution, because
of the challenges associated with its formulation as an ophthalmic solution such as limited aqueous
solubility of NT, formation of lumps and agglomerates of NT powder, chemical instability of NT
in aqueous solution, and susceptibility of NT solutions to bacterial growth (58). Hence, suspension
eye-drops was chosen for the therapeutic delivery of NT at the fungal infection site. The suspension
consists of a pH adjusted aqueous environment (Table 1.3) to ensure the chemical stability of NT
– without its degradation and/or inactivation. Additionally, benzalkonium chloride is added to the
suspension to prevent the growth of bacteria in the formulation (NT is susceptible to bacterial
growth) (58).
17
A preservative (benzalkonium chloride) free formulation of NT is also available in some
countries (Poland, Turkey, the Netherlands, Ireland, Czech Republic), other than the US, under the
label Pimafucin®. It is available as a single dose suspension that is used for medical purposes such
as oral fungal infections (59). Pimafucin®, like Natacyn®, has its pH adjusted to 5.5-7.5 to prevent
the inactivation of NT (58).
In a patent filed by Noordam et al, it has been reported that a chemically and microbially
stable suspension of NT (> 14 days) could be prepared without using any preservatives, by using
a specific pH range and thickening agents (methylcellulose, xanthan gum, carrageenan gum,
Arabic gum and combinations) (58). However, the pH range that was found to be suitable, was
lower than 5.
To further improve and enhance delivery of NT to the eye, various formulation strategies
and/or alternative dosage forms have been studied and evaluated. Use of cyclodextrins along with
NT has been extensively studied and cyclodextrin complexes of NT demonstrated improved trans-
corneal penetration with an equivalent antifungal effectiveness in comparison to the marketed
formulation (60, 61). In a study reported by Chandasana et al., poly-d-glucosamine (PDG)
functionalized polycaprolactone (PCL) nanoparticles of NT were prepared for targeting corneal
mycotic keratitis (62). The nanoparticulate formulation showed a sustained released of NT up to 8
hours and its antifungal potency was similar to the marketed formulation. It was found that the
optimized formulation could be dosed every 5 hours (instead of the conventional every two-hour
dosing) to maintain NT levels in the therapeutic range. In another study by Bhatta et al., NT
encapsulated within lecithin-chitosan mucoadhesive nanoparticles demonstrated improved
pharmacokinetic profiles such as higher concentration, greater area under curve, and lower
clearance in the lachrymal fluid and at the pre-corneal sites in comparison to the marketed NT

18
suspension (63). In yet another evaluation by Paradkar et al., NT niosome loaded in-situ gel could
sustain the NT release up to 24 hours in comparison to the marketed formulation with a
significantly higher trans-corneal penetration (64). However, all these studies report on the
development of novel ocular carriers for NT and evaluate their effectiveness at the pre-corneal site
(in terms of pharmacokinetic parameters) but do not investigate the ocular biodistribution of NT
from their carriers; thereby, not completely elucidating their potential superiority/advantages over
the marketed suspension.
1.2. CHALLENGES IN CURRENT NATAMYCIN THERAPY
Natamycin (Natacyn®) suspension has been the first choice in treating superficial fungal
infections of the eye such as fungal keratitis, blepharitis, and conjunctivitis. It has been one of the
front-line agent due to the potent antifungal activity against the Fusarium and Aspergillus species,
which are the major causative fungal organisms for ophthalmic fungal infections, in addition to
having lower toxicity and side-effect incidences than the other antifungal agents (8-10). However,
one of the major challenges associated with the marketed NT suspension is the low ocular
bioavailability (≈ 2%) through the topical route, that necessitates repeated applications (initially
given every hour/two-hours and then tapered to 6-8 times a day) to achieve therapeutic
concentrations, which is one the prime factors that is responsible for the reduction in patient
compliance (2, 3, 5, 65). In many cases, concomitant oral or systemic administration of NT or
another antifungal agent, in addition to its topical application, is frequently done (65). Although
this co-administration provides good therapeutic outcomes, it is associated with the manifestation
of ocular and systemic toxicities and an increase in the cost of therapy.
19
1.3. OBJECTIVE
The overall objective of this research project was to overcome the challenges associated
with the current NT suspension therapy, by designing and investigating alternative dosage forms
for the therapeutic delivery of NT to the eye to improve and enhance the retention, penetration,
and bioavailability of NT at the ocular site in the treatment of ocular fungal infections such as
fungal keratitis, fungal endophthalmitis, blepharitis, and conjunctivitis.
1.4. SPECIFIC AIMS
1. Design and optimize a surface modified PEGylated nano-lipid carrier system (NT-PEG-NLCs)
for ocular drug delivery of NT and compare their efficacy with the marketed NT formulation
(Natacyn®), in vitro and in vivo.
i. Optimize NT-loaded PEGylated nano-lipid carrier system (NT-PEG-NLC) using
Design of Experiment approach using a Box-Behnken Design,
ii. Evaluate physicochemical characteristics of the NT-PEG-NLCs,
iii. Demonstrate four-week stability of the optimized system,
iv. Evaluate permeation enhancing effect of the NT-PEG-NLCs across excised rabbit
corneas,
v. Develop a LC-MS/MS technique for the rapid quantification of NT from biosamples,
and
vi. Evaluate ocular biodistribution of NT-PEG-NLCs in Male New Zealand White
Rabbits.
2. Develop and optimize a carboxyvinyl polymer-guar gum-borate gelling system containing
NT-PEG-NLCs (NT-PEG-NLC-GEL), evaluate their in vitro and in vivo performance and

20
compare it with Natacyn® to delineate the feasibility of carboxyvinyl polymer-guar gum-
borate gelling system as an alternative to the marketed suspension in ocular fungal
infections (OFI).
i. Optimize NT-PEG-NLC)-GEL using Design of Experiment approach using a
Factorial Design,
ii. Evaluate physicochemical characteristics of the NT-PEG-NLC-GEL,
iii. Evaluate permeation enhancing effect of the NT-PEG-NLC-GEL across excised
rabbit corneas and compare it to NT-PEG-NLCs and Natacyn®,
iv. Evaluate pre-corneal tear pharmacokinetics of NT-PEG-NLC-GEL in Male New
Zealand White Rabbits and compare it to NT-PEG-NLCs and Natacyn®, and
v. Evaluate ocular biodistribution of NT-PEG-NLC-GEL in Male New Zealand White
Rabbits and compare it to NT-PEG-NLCs and Natacyn®.
3. Design and optimize NT based films (NT-film) and compare their efficacy with the
marketed NT suspension (Natacyn®), in vitro and in vivo.
i. Optimize NT-loaded films (NT-film) using Design of Experiment approach using a
Central Composite Design,
ii. Evaluate physicochemical characteristics of NT-films,
iii. Evaluate permeation of the optimized NT-film across excised rabbit corneas and
compare it to Natacyn®,
iv. Evaluate pre-corneal tear pharmacokinetics of optimized NT-film in Male New
Zealand White Rabbits and compare it to Natacyn®
21
Chapter 2
Formulation Development, Optimization, and In vitro – In vivo Characterization of
Natamycin Loaded PEGylated Nano-lipid Carriers for Ocular Applications
Abstract:
Current study aimed at formulating and optimizing natamycin (NT) loaded PEGylated NLCs (NT-
PEG-NLCs) using Box-Behnken Design and investigating their potential in ocular applications.
Response surface methodology (RSM) computations and plots for optimization were performed
using Design Expert® software, to obtain optimum values for response variables based on the
criteria of desirability. Optimized NT-PEG-NLCs had predicted values for the dependent variables
not significantly different from the experimental values. NT-PEG-NLCs were characterized for
their physicochemical parameters; NT’s rate of permeation and flux across rabbit cornea was
evaluated, in vitro; ocular tissue distribution was assessed in rabbits, in vivo. NT-PEG-NLCs were
found to have optimum particle size (< 300 nm) narrow PDI, high NT entrapment and NT content.
In vitro transcorneal permeability and flux of NT from NT-PEG-NLCs was significantly higher
than Natacyn®. NT-PEG-NLC (0.3%) showed improved delivery of NT across the intact cornea
and provided concentrations statistically similar to the marketed suspension (5%) in inner ocular
tissues, in vivo, indicating that it could be a potential alternative to the conventional suspension
during the course of fungal keratitis therapy.
22
3.1. INTRODUCTION
Fungal infections of the eye are serious clinical concerns and can lead to vision loss (50,
66-68). According to an analysis by Collier et al in Morbidity and Mortality Weekly Report for
Centers for Disease Control and Prevention, incidence rates for keratitis were the highest amongst
all the ocular infections, with an estimated 930,000 visits to doctor's office and outpatient clinics
and about 58,000 emergency department visits annually with about 76.5% of keratitis visits
requiring drug prescriptions (50). Episodes of keratitis and other ocular corneal infections
approximated $175 million in direct health care expenditures, that included $58 million for
Medicare patients and $12 million for Medicaid patients annually in the United States.
Natamycin (NT) has been one of the forerunners in ocular antifungal pharmacotherapy,
especially in the management of fungal keratitis (69). It has been used as a first line antifungal
agent because of its action against filamentous fungi causing ocular fungal infections (OFI) and
better ocular safety/tolerability compared to the other antifungal agents (3). However, one of the
major challenges associated with NT is that, intravenous and subconjunctival injections do not
lead to therapeutic concentrations in the eye (57). Upon topical application, NT shows low
retention and a bioavailability (BA) of only 2%, necessitating frequent administration (initially
given every hour/two-hours and then tapered to 6-8 times a day) (65). In many cases, concomitant
oral or systemic administration of NT or another antifungal agent, in addition to its topical
application, is frequently required (65). Although this co-administration provides good therapeutic
outcomes, it is associated with the manifestation of ocular and systemic toxicities and an increase
in the cost of therapy.
Currently, NT is the only commercially available topical agent (Natacyn® eye drops), used
for the treatment of OFI. However, as previously mentioned, these eye drops are associated with
23
two major challenges; the first being low retention and BA and the second being low penetration
into the inner ocular tissues (57, 70). This necessitates the re-formulation of NT as a different
dosage form to harness its antifungal activity whilst overcoming the challenges associated with its
delivery as eye-drops.
In search of alternative strategies for the delivery of NT, nano-lipid carriers (NLCs) were
evaluated since, they are known to enhance both BA and penetration of drugs into deeper tissues
(71-73). Surface modified NLCs with polyethylene glycol (PEG-NLCs) have shown enhanced
penetration, improved BA with lower toxicity profiles, and better stability upon storage, in
comparison to the normal NLCs (74-78). This has been abundantly evidenced in the delivery of
anti-cancer drugs in cancer chemotherapy. Therefore, in the current study we sought to formulate
and optimize NT loaded PEGylated NLCs (NT-PEG-NLCs) using Box-Behnken Design and
evaluate and compare their efficacy with the marketed NT formulation (Natacyn®), in vitro and in
vivo.
3.2. MATERIALS AND METHODS
Chemicals
NT was purchased from Cayman Chemicals (Ann Arbor, MI, USA). N-(Carbonyl-
methoxypolyethylenglycol-2000)-1,2-distearoyl-sn-glycero-3-phosphoethanolamine sodium salt
(mPEG-2K-DSPE sodium salt) was purchased from Lipoid (Ludwigshafen, Germany). Precirol®
ATO 5 was a generous gift from Gattefossé (NJ, USA). Castor oil, Tween® 80, Span® 80,
poloxamer 188, and glycerin were all purchased from Acros Organics (NJ, USA).
24
Methods
Screening of lipid excipients
NLCs are composed of solid and liquid lipids; hence, to select the most optimum solid and
liquid lipids for the NT-PEG-NLCs a lipid screening study was undertaken. Three solid lipids
(Compritol® 888 ATO, Precirol® ATO 5, and Glyceryl monostearate) and nine liquid lipids (castor
oil, olive oil, soybean oil, sesame oil, Maisine® CC, Labrafac® Lipophile WL 1349, oleic acid,
Miglyol® 829, and Captex® 355 EP) were screened. Briefly, 100 mg of NT was added to 100 mg
of the molten lipid (80 ± 2°C; under continuous magnetic stirring at 2000 rpm for 10 mins) and
the NT-lipid mix was cooled. All the NT-lipid mixes were then microscopically observed for the
precipitation of NT and the lipids which did not show any precipitation were selected. Precirol®
ATO 5 and castor oil were found to be the most suitable lipids in which NT showed no
precipitation.
Experimental design
Box-Behnken design was employed in the experimental design where the amount of castor
oil, Precirol® ATO 5, Span® 80, and high-pressure homogenization (HPH) time were varied at
three levels as hypothesized by the design. In the given study, the above-mentioned four factors
were taken as the independent factors (coded as A, B, C, and D, respectively at three different
levels), whereas, formulation characters such particle size, polydispersity index (PDI), % drug
entrapment, and % drug loading (DL) were considered as the response variables (dependent
variables). Tables 2.1 and 2.2 provide the details on the Box-Behnken experimental design
employed in this study.
25
Table 2.1: Independent factors and dependent variables with their coded levels of Box-
Behnken design.
Factors Coded levels
Independent factors Level 1 Level 2 Level 3
A: Precirol® ATO 5 (mg) 150 300 450
B: castor oil (mg) 100 150 200
C: Span® 80 (mg) 0 20 40
D: HPH time (mins) 5 10 15
Dependent variables Constraints
Y1: Particle size Optimum (< 300 nm)
Y2: PDI Minimum
Y3: % entrapment Maximum
Y4: % DL Maximum
Table 2.2: Box-Behnken design for the experiment.
Run Precirol® ATO 5
(mg)
(A)
castor oil
(mg)
(B)
Span® 80
(mg)
(C)
HPH Time
(mins)
(D)
1 300 100 0 10
2 150 150 40 10
3 450 100 20 10
4 300 200 0 10
5 300 200 20 5
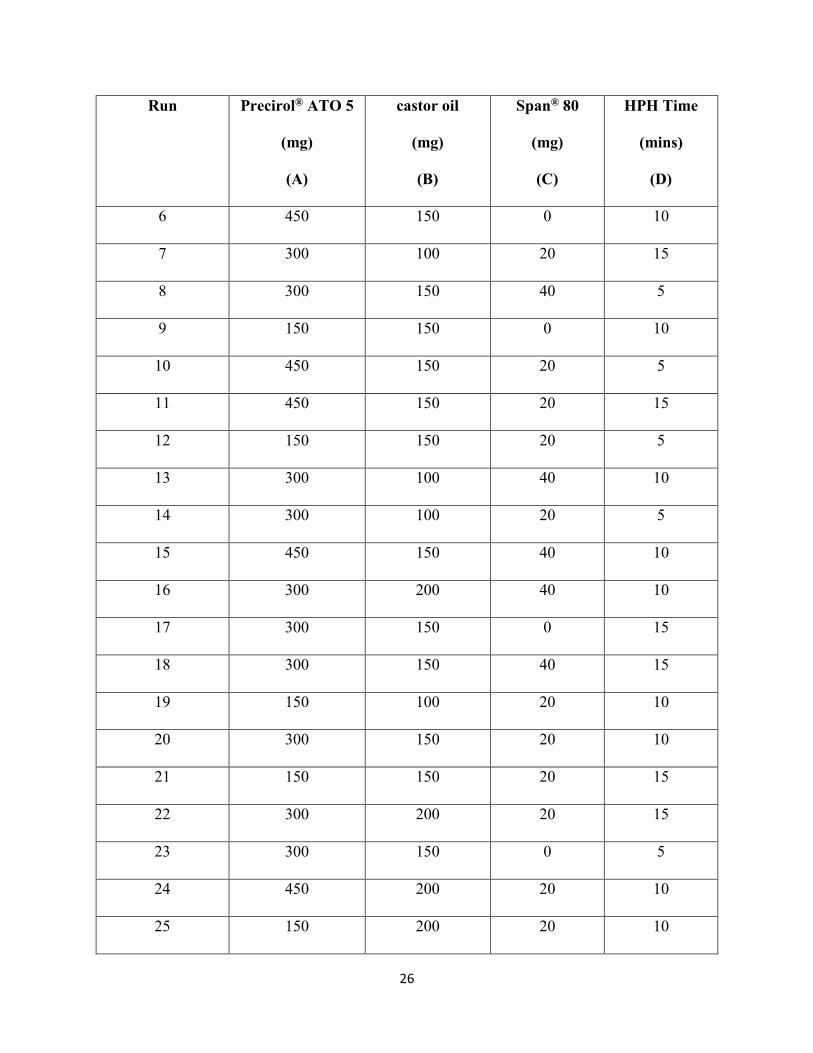
26
Run Precirol® ATO 5
(mg)
(A)
castor oil
(mg)
(B)
Span® 80
(mg)
(C)
HPH Time
(mins)
(D)
6 450 150 0 10
7 300 100 20 15
8 300 150 40 5
9 150 150 0 10
10 450 150 20 5
11 450 150 20 15
12 150 150 20 5
13 300 100 40 10
14 300 100 20 5
15 450 150 40 10
16 300 200 40 10
17 300 150 0 15
18 300 150 40 15
19 150 100 20 10
20 300 150 20 10
21 150 150 20 15
22 300 200 20 15
23 300 150 0 5
24 450 200 20 10
25 150 200 20 10
27
The general form of the model generated from the design is given below,
Y = β0 + β1A + β2B + β3C + β4D + β5AB + β6AC + β7AD + β8BC + β9BD + β10CD + ε
where β0, the intercept, is the arithmetic average of all quantitative outcomes of 25 experimental
runs, β1-β10 are the coefficients computed from the observed experimental values of Y, and A, B,
C, and D, are the coded levels of the independent factors. The A, B, C, and D terms indicate the
average result of changing one factor at a time from its low to high value. The interaction terms
(AB, AC, AD, BC, BD, and CD) suggest the response changes when two factors are changed
simultaneously. The equation aids in understanding the effect of the independent factor/s on the
response variables after considering the intensity of coefficient and the mathematical sign it
carries, that is, positive or negative. A positive sign indicates additive effect. Statistical validity
was established based on ANOVA provided in the Design-Expert® software, with level of
significance considered at p < 0.05.
Formulation optimization
Response surface methodology (RSM) computations including 3-dimensional (3D) RSM,
interaction, and contour plots for the formulation optimization was performed using Design-
Expert® software (8.0.7.1), to obtain optimum values of the response variables based on the criteria
of desirability (Table 2.1). The optimum variables were used to prepare the suggested optimum
formulation; the predicted and experimental values for the suggested formulation were then
compared to validate the chosen experimental design and the models.
Preparation of NT-PEG-NLCs
The NT-PEG-NLCs were prepared by the hot homogenization method. An aqueous phase
was prepared using surfactants such as poloxamer 188 (0.25% w/v), Tween® 80 (0.75% w/v) and
glycerin (2.25% w/v) in de-ionized water, was heated and added to the molten lipid phase under
28
stirring form a premix (2000 rpm, 5 min). The lipid phase consisted of NT (0.3%), Precirol® ATO
5, castor oil, Span® 80, and mPEG-2K-DSPE sodium salt. The premix was then emulsified at
16,000 rpm for 5 mins using T 25 digital Ultra-Turrax to form a hot pre-emulsion. The pre-
emulsion obtained was subjected to HPH (15,000 psi) using thermostated Emulsiflex C5
(Avestin®) resulting in the formation of hot emulsion dispersion. The temperature during the entire
process was maintained at 80 ± 2°C. The hot emulsion obtained was cooled to room temperature
to form the NT-PEG-NLCs.
Particle size and PDI
The hydrodynamic radius and PDI of the NT-PEG-NLC formulations were determined by
photon correlation spectroscopy using a Zetasizer Nano ZS Zen3600 (Malvern Instruments, Inc.)
at 25°C and with 173° backscatter detection in disposable folded capillary clear cells. The
measurements were obtained using a helium-neon laser and the particle size analyses data was
evaluated based on the volume distribution. Briefly, ten microliters of the sample was diluted to
1000 µL using de-ionized water and the particle size and PDI was measured.
Morphological characteristics using Scanning Tandem Electron Microscopy (STEM)
A 20 µL drop of sample was placed on a sheet of clean parafilm. A freshly glow discharged
200 mesh copper grid coated with a thin carbon film was floated, film side down on the drop of
sample. After 30 seconds the grid was removed from the drop and excess sample was removed by
touching a piece of filter paper to the edge of the grid. Before complete drying, the grids were
placed sample side down on a drop of ultra-pure water, immediately removed, excess water was
removed and the grid, sample side down, was placed on a drop of 1% uranyl acetate. After 1 min,
the grid was removed from the drop and excess stain was removed. The grid with sample was dried
29
completely before examination in a Zeiss Auriga® operating in STEM mode at 30kV (studies
performed at The University of Tennessee, Knoxville).
Powder X-ray diffraction (PXRD) analysis
A qualitative PXRD was done (studies performed at Campbell University, North Carolina)
to examine the physical state of NT in the formulated NT-PEG-NLC. The X-ray powder diffraction
patterns of the samples were recorded with the Rigaku Ultima IV X-ray diffractometer using Ni-
filtered, CuKα radiation generated at 40 kV, and a current intensity of 44 mA. The diffraction angle
range of the instrument was operated over a range of 2θ angles from 5° to 50°.
Physio-chemical stability
Physical and chemical stability of the optimized formulation was evaluated by analyzing
the changes in particle size, PDI, assay and % entrapment efficiency upon storage at 4°C and 25°C
for a period of one month.
Natamycin content (assay), entrapment and load
Assay: An accurately measured amount of NT-PEG-NLC (10 µL) was extracted in methanol (990
µL), since, NT is soluble in methanol. The methanol-formulation mixture was then centrifuged at
high speed (13,000 rpm, 15 mins) and the resulting supernatant was analyzed for NT content using
HPLC method. The NT drug content (assay) was utilized in the determination of the % of NT
entrapped in the nanoparticles.
Entrapment: A measured amount of NT-PEG-NLC formulation (500 µL) was taken and placed
in the centrifugal filter (100 kDa) and the sample was centrifuged at a high speed (13,000 rpm, 15
30
mins), following which the filtrate was collected and analyzed for free NT content. Percentage NT
entrapped was calculated using the formula,
% ���������
= �� ��� � ���� ��������� �� ����� − � ��� � ��������� ����� ∗ 100
� ��� � ���� ����ℎ��
Loading: The amount of NT load in the NT-PEG-NLC formulation was determined by the
following formula,
% ���� � �� =� ��� � ���� ���������
� ��� ����� � �����× 100
Analysis of in vitro samples: NT was quantified using a validated HPLC method reported in
literature (79). The HPLC system consisted of a Waters 717 plus auto-sampler coupled with a
Waters 2487 Dual λ Absorbance UV detector, a Waters 600 controller pump, and an Agilent 3395
Integrator. The mobile phase consisted of a mixture of phosphate buffer (0.2 M, pH 5.5) and
acetonitrile (70:30) with flow rate of 1 mL/min. A C18 Phenomenex Luna® (5µ, 250 x 4.6 mm)
column was used. The temperature for the analyses was 25°C, the injection volume was 20 µL,
and the UV detection wavelength was set to 304 nm at AUFS 1.00.
In vitro trans-corneal permeation
Transmembrane permeability of NT from NT-PEG-NLC formulation was evaluated across
isolated rabbit cornea (Pel-Freez Biologicals®) using vertical diffusion cells (PermeGear®, Inc.).
To compare and evaluate the effect of PEGylation, NT-NLCs without the PEG component were
prepared and their transmembrane corneal permeability was assessed (1.5% w/v of PEG was
replaced by 1.5% w/v of Precirol® ATO 5; NT load was kept constant at 0.3% w/v).

31
The cornea was clamped in between the two half-cells with the epithelial surface facing
upwards toward the half-cell with less volume (i.e., the donor cell containing the formulations).
Natacyn® (5% w/v), NT-PEG-NLCs (0.3% w/v), and NT-NLCs (0.3% w/v) were used as donor
formulations; 5% Natacyn® was diluted using Dulbecco's phosphate-buffered saline (DPBS) to
0.3% w/v to dose normalize all three formulations. Five mL of 2.5% solution of randomly
methylated-β-cyclodextrin (RMBCD) in DPBS was used in the receiver compartment. The
contents of the receiver chamber were stirred continuously with a magnetic stirrer. Aliquots (200
μL) were withdrawn from the receiver chamber at predetermined time points and replaced with an
equal volume of 2.5% w/v RMBCD in DPBS. The study duration was 3 h. The concentration of
NT in the receiver chamber solution was determined using the HPLC analyses method for in vitro
samples described above.
In vivo ocular biodistribution studies
In vivo bioavailability of NT was determined in Male New Zealand White Albino Rabbits,
weighing between 2 and 2.5 kg, procured from Charles River Labs. All the animal studies
conformed to the tenets of the Association for Research in Vision and Ophthalmology statement
on the use of animals in ophthalmic vision and research and the University of Mississippi
Institutional Animal Care and Use Committee approved protocols. The NT formulations, namely
the NT-PEG-NLC, NT-NLC, and Natacyn® (0.3% and 5%), were evaluated in conscious rabbits,
in vivo (n = 4). All the above NT topical formulations (100 μL) were given as two doses (50 μL),
every 2 hours for a 6-hour time period (t = 0, 2, and 4 hours). Two hours after the third instillation
at t = 6 hours, the rabbits were anesthetized using a combination of ketamine (35 mg/kg) and
xylazine (3.5 mg/kg) that was injected intramuscularly. The rabbits were euthanized with an
overdose of pentobarbital injected through a marginal ear vein. The eyes of the rabbits were then
32
enucleated and washed thoroughly with IPBS and the intraocular tissues such as, cornea, iris-
ciliary body (ICB), aqueous (AH) and vitreous (VH) humors were separated.
A protein precipitation technique was employed to determine the amount of NT in the
ocular tissue homogenates. Briefly, the solid tissues: cornea and ICB (were cut into small pieces)
and the liquid tissues: AH and VH (taken as they were) were taken and ice-cold methanol was
added (0.6 mL) to precipitate proteins from each individual tissue. The supernatant was then
collected via centrifugation for 0.5 h at 13,000 rpm prior to the analyses.
Quantification of NT was performed using standard calibration curves constructed from
various ocular tissues, such as the cornea (0.6–131.1 ng/mL), the ICB (0.6–65.5 ng/mL), the AH
(2–400 ng/mL), and the VH (2–400 ng/mL), using the LC-MS/MS method. All the standard curves
had a coefficient of determination r2 ⩾ 0.96. The extraction recovery (extraction efficiency) of NT
was higher than 95% for cornea, ICB, and AH whereas was about 82% for VH. The process
efficiency was higher than 90% for all the tissues. Interference was not observed from co-eluted
protein residues with respect to NT peaks in any of the tissues. The limit of detection (LOD) for
various ocular tissues was determined and corresponded to 0.13 ng/mL for all the four tissues.
Quantification of NT in the biosamples
For quantification of NT in the in vivo samples, a Waters Xevo TQ-S triple quadrupole
tandem mass spectrometer with an electrospray ionization source, equipped with the ACQUITY
UPLC® I-Class System were used (Waters Corporation, Milford, MA, USA). Data acquisition was
performed with Waters Xevo TQ-S quantitative analysis TargetLynx software and data processing
was executed with MassLynx mass spectrometry software. Separation operations were
accomplished using a C18 column (Acquity UPLC® BEH C18 100 mm×2.1 m, 1.7μm particle
size). The mobile phase consisted of water (A), and acetonitrile (B) both containing 0.1 % formic
33
acid at a flow rate of 1.0 mL/min with a gradient elution as follows: 0 min, 98 % A/2 % B held for
0.2 minutes and in next 2.3 min to 100% B. Each run was followed by a 1-minute wash with 100
% B and an equilibration period of 2 minutes with 98 % A/2 % B. The column and sample
temperature were maintained at 50ºC and 10°C, respectively. The effluent from the LC column
was directed into the ESI probe. Mass spectrometer conditions were optimized to obtain maximal
sensitivity. The following conditions were used for the electrospray ionization (ESI) source: source
temperature 150°C, desolvation temperature 600°C, capillary voltage 3.0 kV, cone voltage 40 V,
nebulizer pressure, 7 bar and nebulizer gas 1100 L·h−1 N2. Argon was used as the collision gas.
The collision energies were optimized and ranged from 10 to 15 eV for individual analytes.
Instrument control and data processing were performed by using MassLynx software (version 4.1,
Waters, Milford, MA, USA). Mass spectra were acquired in positive mode and multiple reaction
monitoring (MRM) mode. The multiple reaction monitoring (MRM) mode was applied to monitor
the transitions of quantifier ion to qualifier ions (the precursor to fragment ions transitions) of m/z
666.2 → m/z 467.2, 485.2, 503.2 for natamycin, m/z 924.4 → m/z 107.5, 743.2, 761.4 for
amphotericin B. Amphotericin B was used as the internal standard. Confirmation of compounds
was achieved through three fragment ions.
Statistical analyses
Data is represented as the mean ± standard deviation, for a minimum of three independent
experimental runs. Statistical comparisons of the means were performed using one-way analysis
of variance (ANOVA) or Student’s t-test. The differences were considered to be significant when
the p-value was < 0.05.
34
3.3. RESULTS
Lipid screening study
The results observed from solid and liquid lipid screening are presented in Table 2.3. On
the bases of the following results, castor oil, and Precirol® ATO 5 were chosen as the lipids for the
preparation of NT-PEG-NLCs and NT-NLCs.
Table 2.3: Results from solid and liquid lipid screening (Drug and lipids added in 1:1
ratio 80 ± 2°C; under continuous magnetic stirring at 2000 rpm for 10 mins).
Solid/liquid Lipid Solubility
Solid lipids
glyceryl monostearate (-)
Precirol® ATO 5 (+)
Compritol® 888 ATO (-)
Liquid lipid
castor oil (+)
olive oil (-)
sesame oil (-)
soybean oil (-)
oleic acid (-)
Labrafac® Lipophile WL 1349 (-)
Maisine® CC (-)
Miglyol® 829 (-)
Captex® 355 EP (-)
(+): NT is soluble in the lipid melt and does not precipitate on cooling; (-): NT is either soluble
in the lipid but precipitates on cooling or is insoluble in the lipid.
35
Formulation development and optimization using Box-Behnken method
The 25 NT-PEG-NLC formulations that were prepared according the Box-Behnken design
were analyzed for particle size, PDI, % NT entrapment, and % DL. Design Expert® software was
used to study the effect of content of lipids (castor oil and Precirol® ATO 5), Span® 80, and HPH
time (independent factors) on the above-mentioned responses (particle size, PDI, % entrapment,
and % DL). The extent of the effect of the independent factors on the response variables was
determined using the regression analyses and plots that provided RSM analyses. Tables 2.4 and
2.5 elucidate the results of the regression analyses and Figures 2.1-2.3 display the 3D RSM,
interaction, and contour plots, respectively.
Table 2.4: Summary of regression analyses performed by Design Expert® software for
evaluating the effects of independent factors on the response variables.
Response
variable
Model Model F-value Degree of
freedom
R2 values
R2 Adjusted
R2
Particle size 2FI 5.27 6 0.6372 0.5163
PDI 2FI NA NA NA NA
% entrapment 2FI 6.75 4 0.5746 0.4895
% DL 2FI 15.36 4 0.7544 0.7053
36
Table 2.5: ANOVA for Response Surface Reduced 2FI Model.
Response
variables
Independent
factors that
affect the
response
variable
significantly
p-value Final equation in terms of coded
factors fitted in 2FI model
Particle size A 0.0058 Particle size
= 231.07 + 28.48*A + 14.55*B –
3.43*C – 20.928*D – 38.38*AD –
44.45*BC (Equation 1)
D 0.0338
AD 0.0256
BC 0.0114
% entrapment A 0.0046 % entrapment
= 91.29 – 16.07*A + 12.03*B +
11.04*D – 21.86*BD (Equation 2)
B 0.0268
D 0.0401
BD 0.0209
% DL A < 0.0001 % DL
= 5.89 – 2.92*A + 0.08*B +
0.73*D – 1.49*BD (Equation 3)
BD 0.0435
A: Precirol® ATO 5; B: castor oil; C: Span® 80; D: HPH Time; AD: interaction between
Precirol® ATO 5 and HPH Time; BD: interaction between castor oil and HPH Time; BC:
interaction between castor oil and Span® 80.
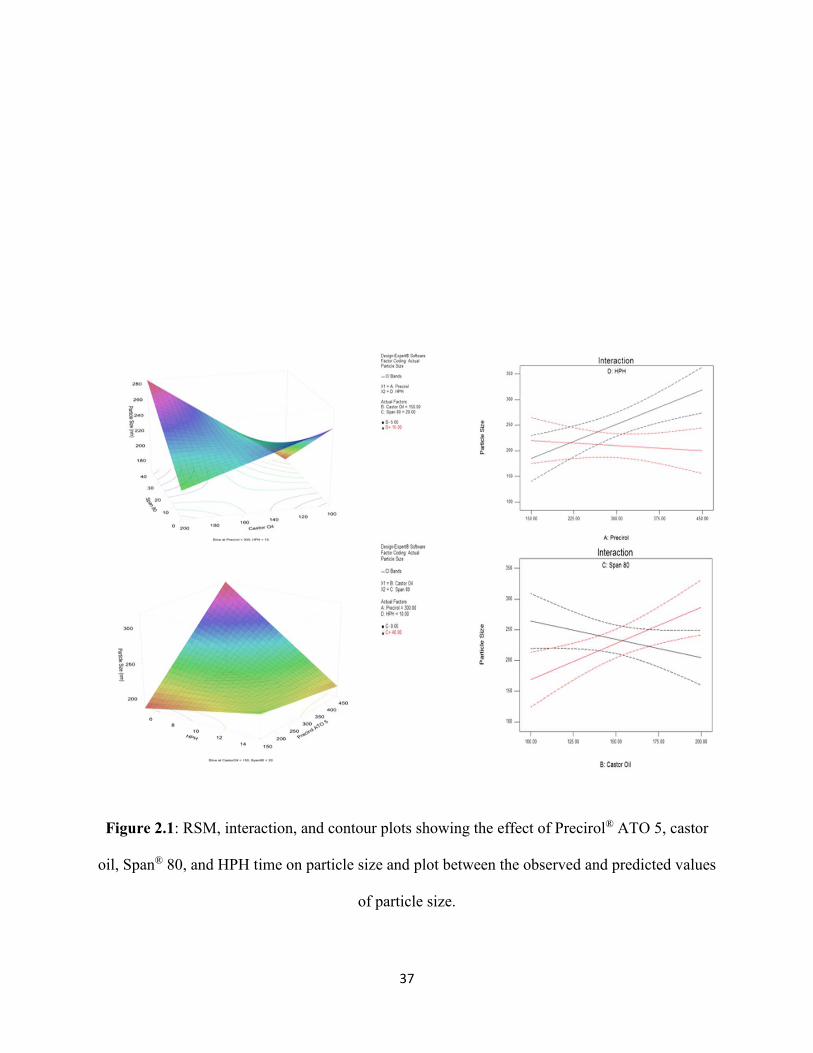
37
Figure 2.1: RSM, interaction, and contour plots showing the effect of Precirol® ATO 5, castor
oil, Span® 80, and HPH time on particle size and plot between the observed and predicted values
of particle size.
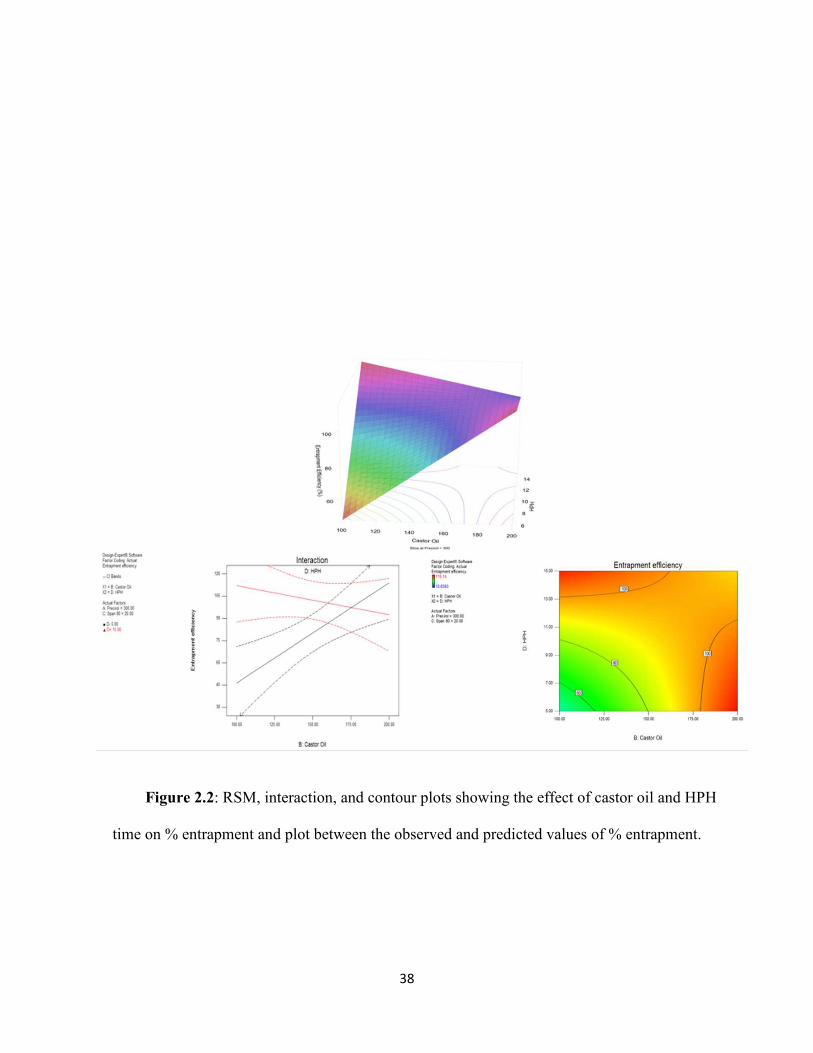
38
Figure 2.2: RSM, interaction, and contour plots showing the effect of castor oil and HPH
time on % entrapment and plot between the observed and predicted values of % entrapment.
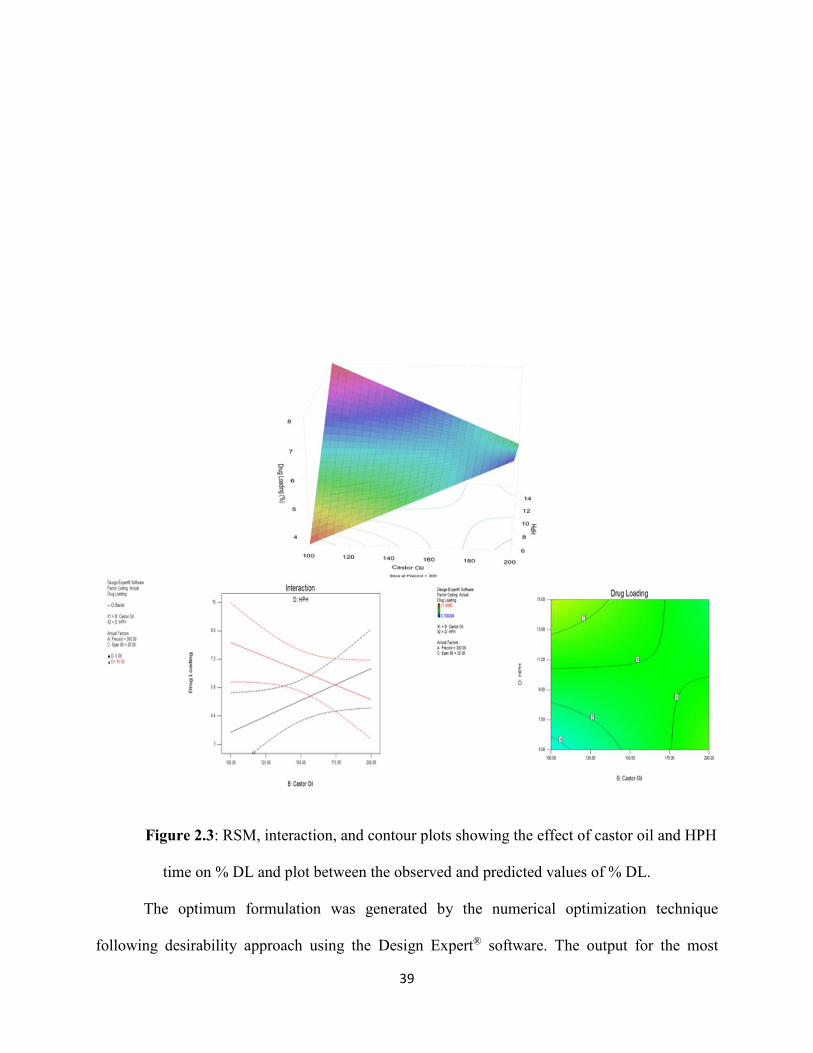
39
Figure 2.3: RSM, interaction, and contour plots showing the effect of castor oil and HPH
time on % DL and plot between the observed and predicted values of % DL.
The optimum formulation was generated by the numerical optimization technique
following desirability approach using the Design Expert® software. The output for the most
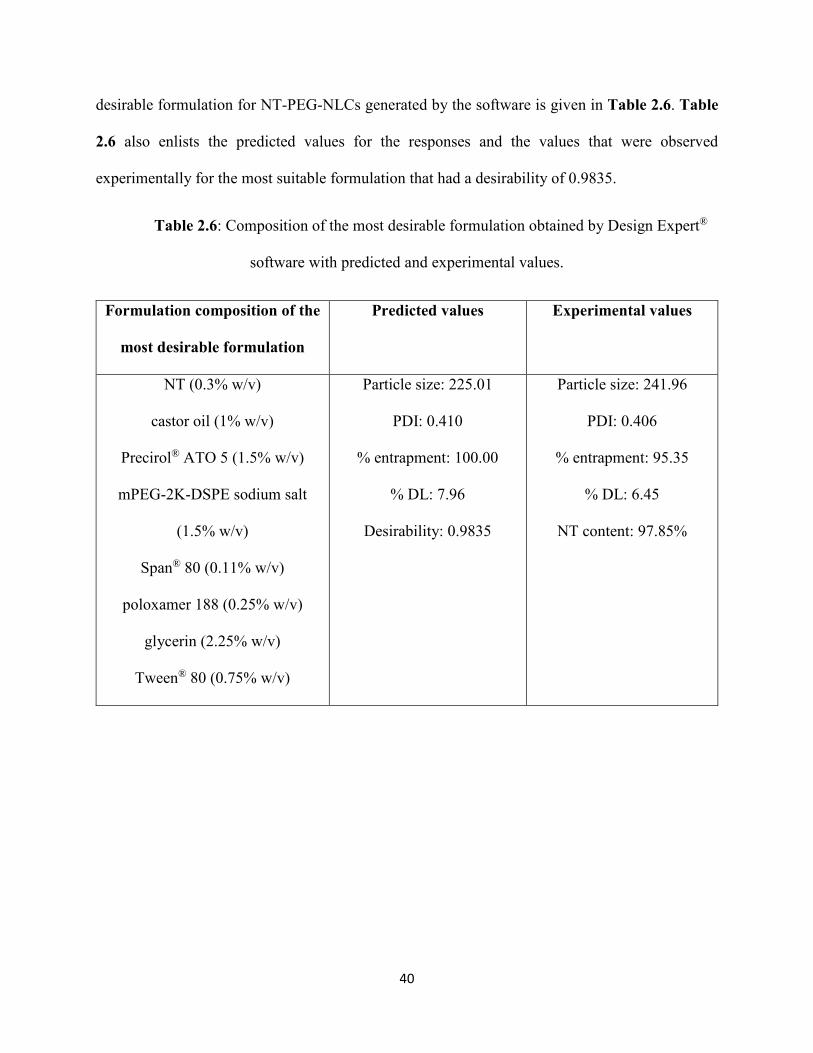
40
desirable formulation for NT-PEG-NLCs generated by the software is given in Table 2.6. Table
2.6 also enlists the predicted values for the responses and the values that were observed
experimentally for the most suitable formulation that had a desirability of 0.9835.
Table 2.6: Composition of the most desirable formulation obtained by Design Expert®
software with predicted and experimental values.
Formulation composition of the
most desirable formulation
Predicted values Experimental values
NT (0.3% w/v)
castor oil (1% w/v)
Precirol® ATO 5 (1.5% w/v)
mPEG-2K-DSPE sodium salt
(1.5% w/v)
Span® 80 (0.11% w/v)
poloxamer 188 (0.25% w/v)
glycerin (2.25% w/v)
Tween® 80 (0.75% w/v)
Particle size: 225.01
PDI: 0.410
% entrapment: 100.00
% DL: 7.96
Desirability: 0.9835
Particle size: 241.96
PDI: 0.406
% entrapment: 95.35
% DL: 6.45
NT content: 97.85%
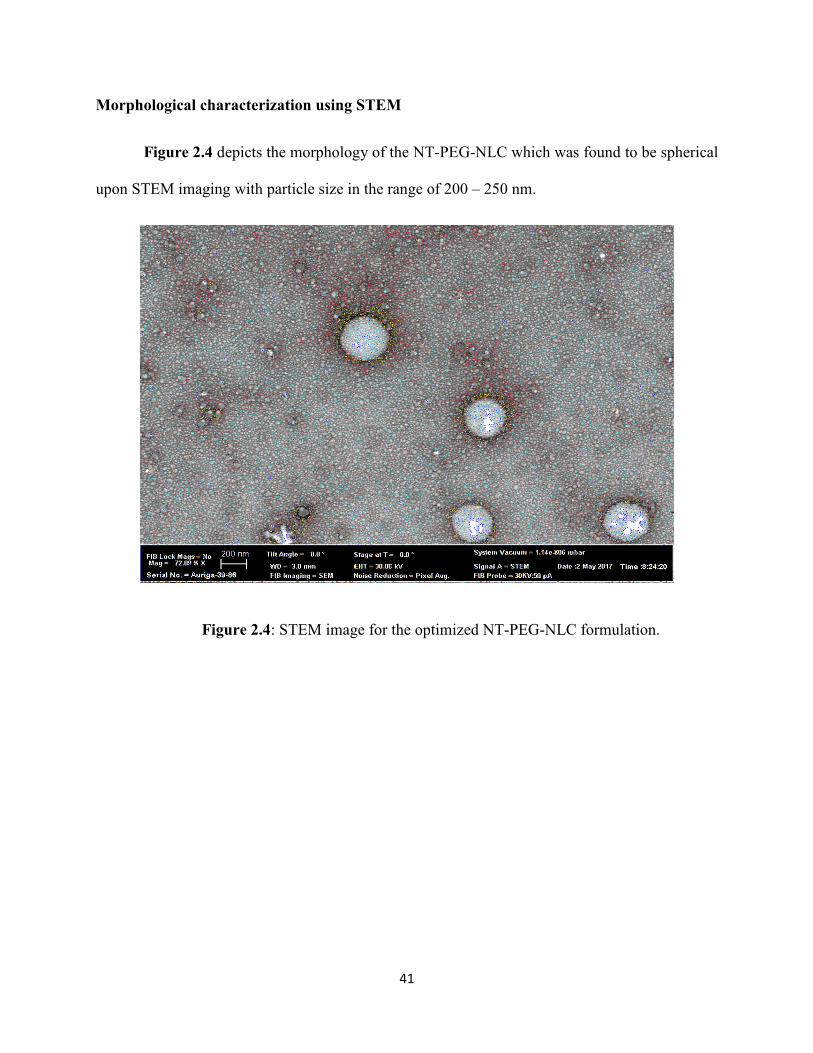
41
Morphological characterization using STEM
Figure 2.4 depicts the morphology of the NT-PEG-NLC which was found to be spherical
upon STEM imaging with particle size in the range of 200 – 250 nm.
Figure 2.4: STEM image for the optimized NT-PEG-NLC formulation.

42
Powder X-ray diffraction (PXRD) analysis
Figure 2.5 represents the PXRD stacked plots. The PXRD plots revealed the absence of
characteristic NT peaks at 2Ө values of 11.95, 15.25, 16.80, and 17.81 in the NT-PEG-NLC
(highlighted within black circles).
Figure 2.5: PXRD plots for B-NLC (PEG-NLC without NT), NT, and NT-PEG-NLC.
Physio-chemical stability
The optimized formulation did not show any particle aggregation upon visual inspection,
until 4 weeks at both the temperature conditions. From Figure 2.6 it can be concluded that the NT-
PEG-NLCs did not show any statistically significant changes in particle size, PDI, and % NT
entrapment during its storage for one-month at 4°C and 25°C (p > 0.05).
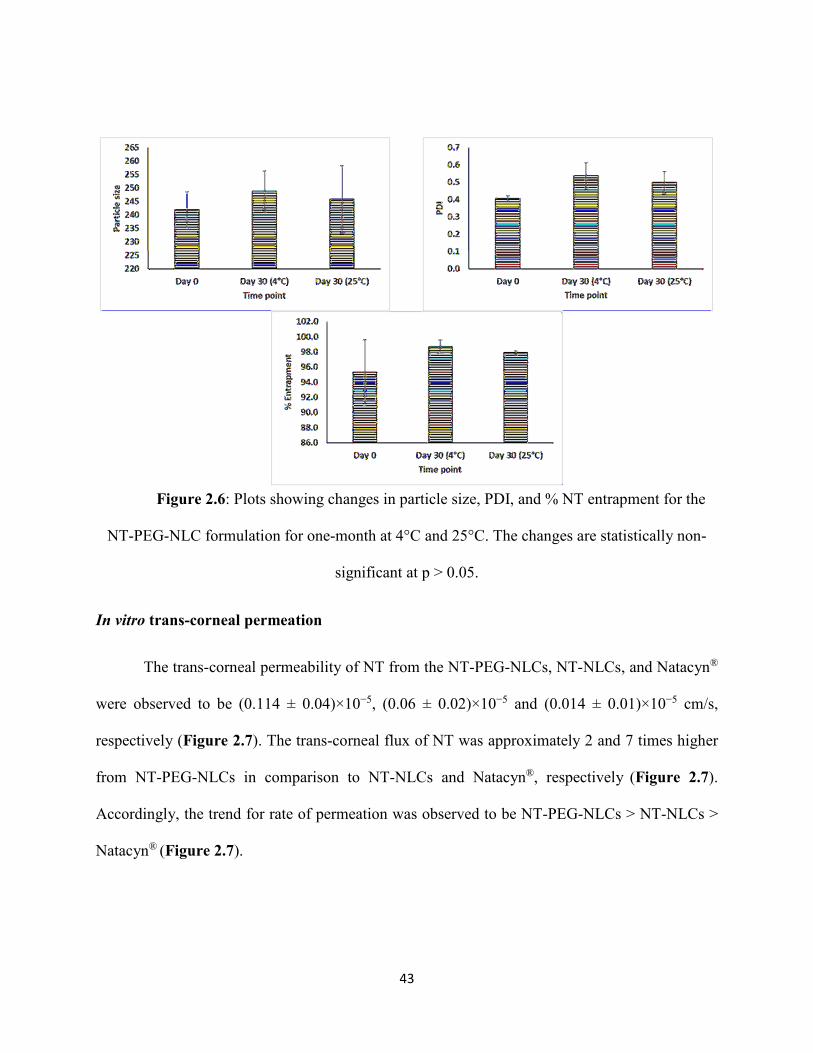
43
Figure 2.6: Plots showing changes in particle size, PDI, and % NT entrapment for the
NT-PEG-NLC formulation for one-month at 4°C and 25°C. The changes are statistically non-
significant at p > 0.05.
In vitro trans-corneal permeation
The trans-corneal permeability of NT from the NT-PEG-NLCs, NT-NLCs, and Natacyn®
were observed to be (0.114 ± 0.04)×10−5, (0.06 ± 0.02)×10−5 and (0.014 ± 0.01)×10−5 cm/s,
respectively (Figure 2.7). The trans-corneal flux of NT was approximately 2 and 7 times higher
from NT-PEG-NLCs in comparison to NT-NLCs and Natacyn®, respectively (Figure 2.7).
Accordingly, the trend for rate of permeation was observed to be NT-PEG-NLCs > NT-NLCs >
Natacyn® (Figure 2.7).
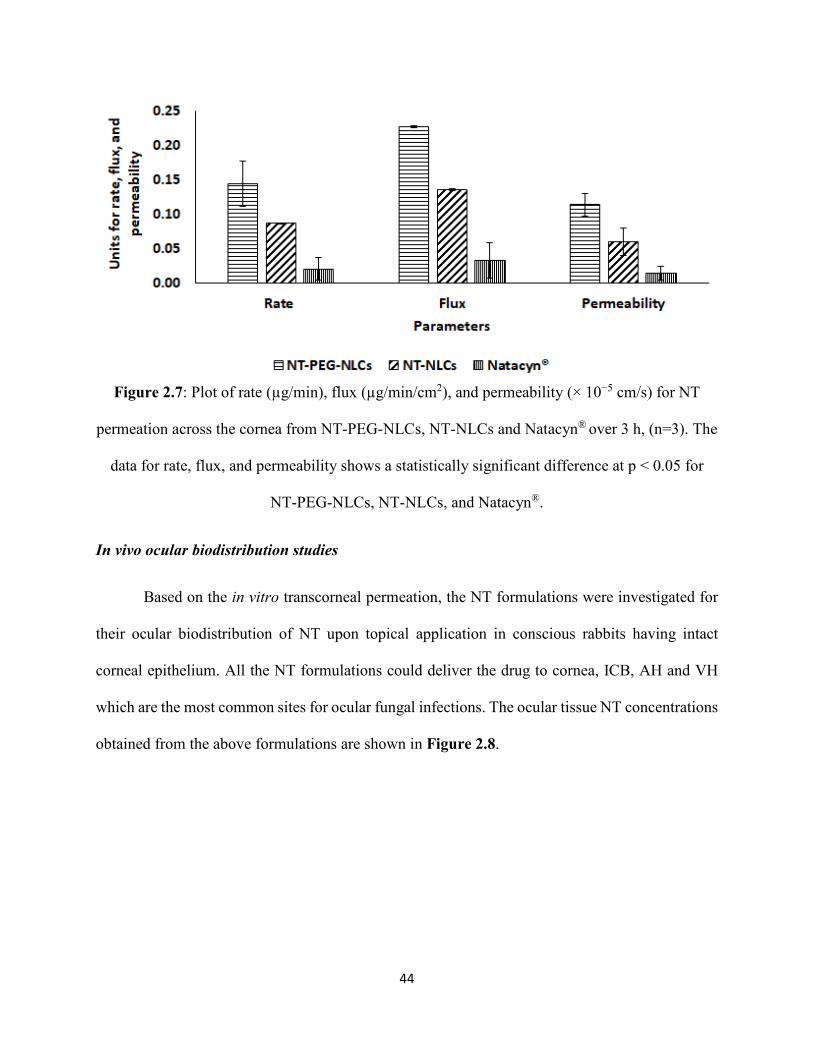
44
Figure 2.7: Plot of rate (µg/min), flux (µg/min/cm2), and permeability (× 10−5 cm/s) for NT
permeation across the cornea from NT-PEG-NLCs, NT-NLCs and Natacyn® over 3 h, (n=3). The
data for rate, flux, and permeability shows a statistically significant difference at p < 0.05 for
NT-PEG-NLCs, NT-NLCs, and Natacyn®.
In vivo ocular biodistribution studies
Based on the in vitro transcorneal permeation, the NT formulations were investigated for
their ocular biodistribution of NT upon topical application in conscious rabbits having intact
corneal epithelium. All the NT formulations could deliver the drug to cornea, ICB, AH and VH
which are the most common sites for ocular fungal infections. The ocular tissue NT concentrations
obtained from the above formulations are shown in Figure 2.8.
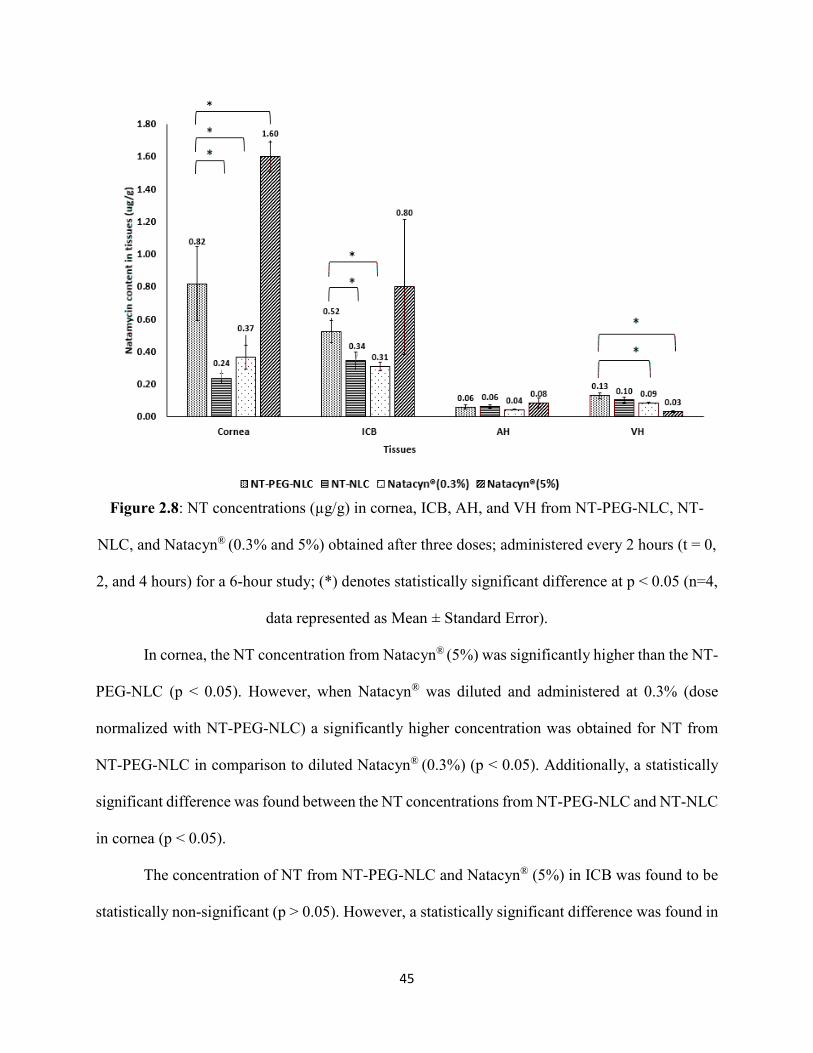
45
Figure 2.8: NT concentrations (µg/g) in cornea, ICB, AH, and VH from NT-PEG-NLC, NT-
NLC, and Natacyn® (0.3% and 5%) obtained after three doses; administered every 2 hours (t = 0,
2, and 4 hours) for a 6-hour study; (*) denotes statistically significant difference at p < 0.05 (n=4,
data represented as Mean ± Standard Error).
In cornea, the NT concentration from Natacyn® (5%) was significantly higher than the NT-
PEG-NLC (p < 0.05). However, when Natacyn® was diluted and administered at 0.3% (dose
normalized with NT-PEG-NLC) a significantly higher concentration was obtained for NT from
NT-PEG-NLC in comparison to diluted Natacyn® (0.3%) (p < 0.05). Additionally, a statistically
significant difference was found between the NT concentrations from NT-PEG-NLC and NT-NLC
in cornea (p < 0.05).
The concentration of NT from NT-PEG-NLC and Natacyn® (5%) in ICB was found to be
statistically non-significant (p > 0.05). However, a statistically significant difference was found in
46
ICB for the NT concentrations from NT-PEG-NLC and diluted Natacyn® (0.3%) at their dose
normalized concentrations. Similar to cornea, in ICB too, a statistically significant difference was
found between the NT concentrations obtained from NT-PEG-NLC and NT-NLC.
The concentration of NT from NT-PEG-NLC, NT-NLC, and Natacyn® (0.3% and 5%) did
not show a statistically significant difference in AH. However, in VH a statistically significant
difference was observed in NT concentrations obtained from NT-PEG-NLC and Natacyn® (5%),
with higher NT concentration from NT-PEG-NLCs.
3.4. DISCUSSION
Currently, NT is the only marketed antifungal drug that is indicated in the management of
ocular fungal infections like fungal keratitis and fungal endophthalmitis (80). One of the major
challenges that is associated with the commercial NT formulation is the low BA (~ 2%) that
necessitates the frequent ocular application (about 6-8 times a day) of the NT commercial
formulation (65). Hence, to potentially improve its BA and enhance its permeation into the ocular
tissues, a surface modified (using mPEG-2K-DSPE) nano-lipid carrier system for NT was
developed. The primary objective of this investigative study was to develop, optimize, and
characterize the optimized PEGylated lipid-based nanoparticulate dosage system for the ocular
delivery of NT and to investigate its corneal permeation, in vitro and in vivo.
Nano-lipid drug carriers are colloidal nanoparticulate dispersions that can be administered
topically in the form of eyedrops. A major advantage of the nanoparticulate systems over the
conventional drug delivery systems is that, their uptake is facilitated by epithelial cells, which
allows for greater penetration into and from the corneal surface (81-84). Moreover, their small
size, biocompatibility, and chemically inert nature improves their interactions and prolongs the
pre-ocular residence time of drugs, thus enhancing drug bioavailability (85-88). Surface
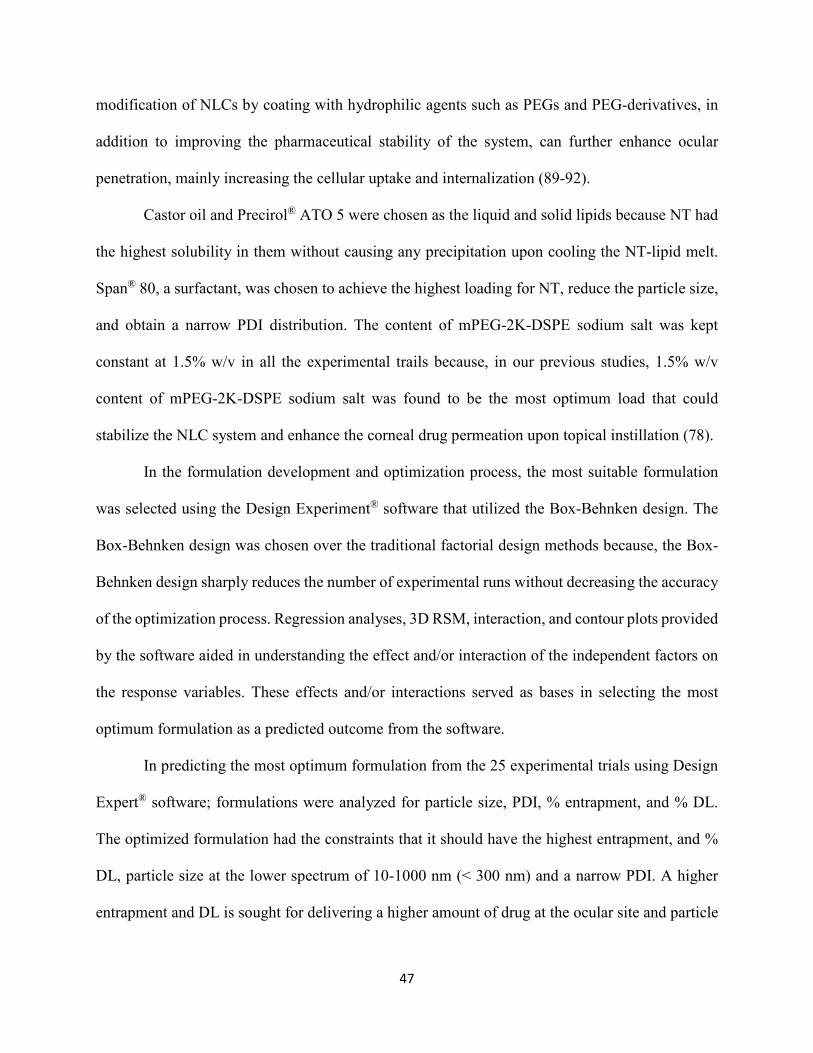
47
modification of NLCs by coating with hydrophilic agents such as PEGs and PEG-derivatives, in
addition to improving the pharmaceutical stability of the system, can further enhance ocular
penetration, mainly increasing the cellular uptake and internalization (89-92).
Castor oil and Precirol® ATO 5 were chosen as the liquid and solid lipids because NT had
the highest solubility in them without causing any precipitation upon cooling the NT-lipid melt.
Span® 80, a surfactant, was chosen to achieve the highest loading for NT, reduce the particle size,
and obtain a narrow PDI distribution. The content of mPEG-2K-DSPE sodium salt was kept
constant at 1.5% w/v in all the experimental trails because, in our previous studies, 1.5% w/v
content of mPEG-2K-DSPE sodium salt was found to be the most optimum load that could
stabilize the NLC system and enhance the corneal drug permeation upon topical instillation (78).
In the formulation development and optimization process, the most suitable formulation
was selected using the Design Experiment® software that utilized the Box-Behnken design. The
Box-Behnken design was chosen over the traditional factorial design methods because, the Box-
Behnken design sharply reduces the number of experimental runs without decreasing the accuracy
of the optimization process. Regression analyses, 3D RSM, interaction, and contour plots provided
by the software aided in understanding the effect and/or interaction of the independent factors on
the response variables. These effects and/or interactions served as bases in selecting the most
optimum formulation as a predicted outcome from the software.
In predicting the most optimum formulation from the 25 experimental trials using Design
Expert® software; formulations were analyzed for particle size, PDI, % entrapment, and % DL.
The optimized formulation had the constraints that it should have the highest entrapment, and %
DL, particle size at the lower spectrum of 10-1000 nm (< 300 nm) and a narrow PDI. A higher
entrapment and DL is sought for delivering a higher amount of drug at the ocular site and particle
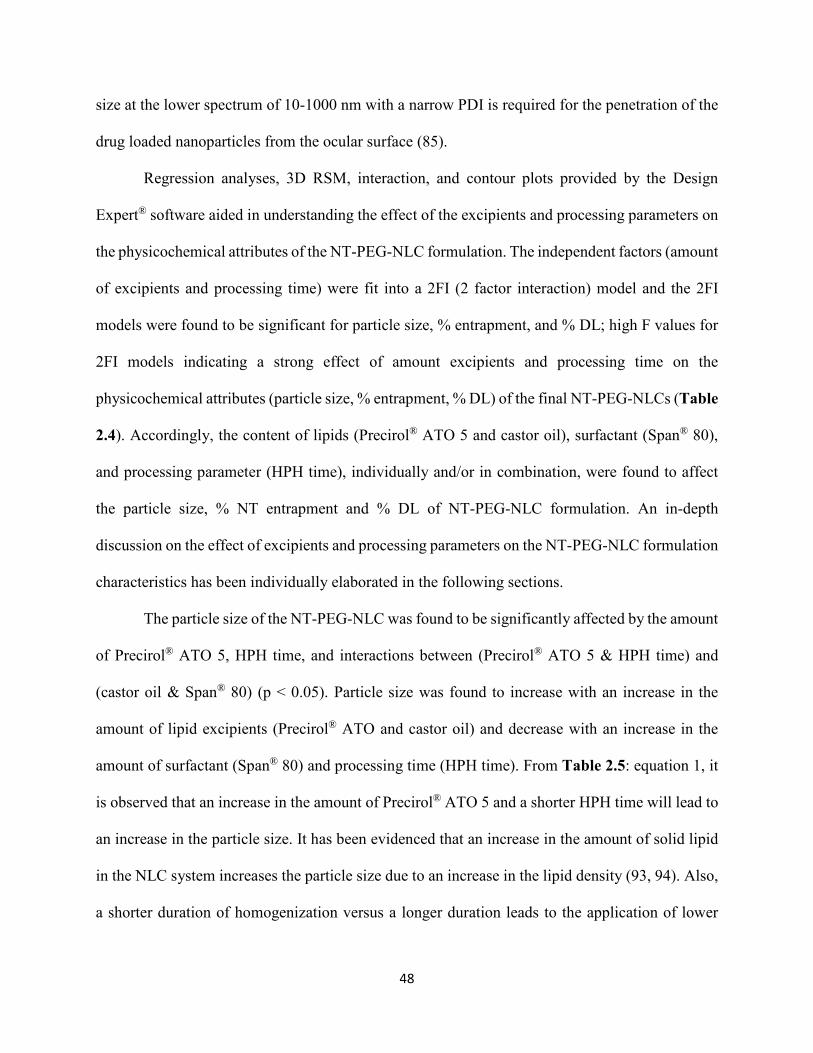
48
size at the lower spectrum of 10-1000 nm with a narrow PDI is required for the penetration of the
drug loaded nanoparticles from the ocular surface (85).
Regression analyses, 3D RSM, interaction, and contour plots provided by the Design
Expert® software aided in understanding the effect of the excipients and processing parameters on
the physicochemical attributes of the NT-PEG-NLC formulation. The independent factors (amount
of excipients and processing time) were fit into a 2FI (2 factor interaction) model and the 2FI
models were found to be significant for particle size, % entrapment, and % DL; high F values for
2FI models indicating a strong effect of amount excipients and processing time on the
physicochemical attributes (particle size, % entrapment, % DL) of the final NT-PEG-NLCs (Table
2.4). Accordingly, the content of lipids (Precirol® ATO 5 and castor oil), surfactant (Span® 80),
and processing parameter (HPH time), individually and/or in combination, were found to affect
the particle size, % NT entrapment and % DL of NT-PEG-NLC formulation. An in-depth
discussion on the effect of excipients and processing parameters on the NT-PEG-NLC formulation
characteristics has been individually elaborated in the following sections.
The particle size of the NT-PEG-NLC was found to be significantly affected by the amount
of Precirol® ATO 5, HPH time, and interactions between (Precirol® ATO 5 & HPH time) and
(castor oil & Span® 80) (p < 0.05). Particle size was found to increase with an increase in the
amount of lipid excipients (Precirol® ATO and castor oil) and decrease with an increase in the
amount of surfactant (Span® 80) and processing time (HPH time). From Table 2.5: equation 1, it
is observed that an increase in the amount of Precirol® ATO 5 and a shorter HPH time will lead to
an increase in the particle size. It has been evidenced that an increase in the amount of solid lipid
in the NLC system increases the particle size due to an increase in the lipid density (93, 94). Also,
a shorter duration of homogenization versus a longer duration leads to the application of lower
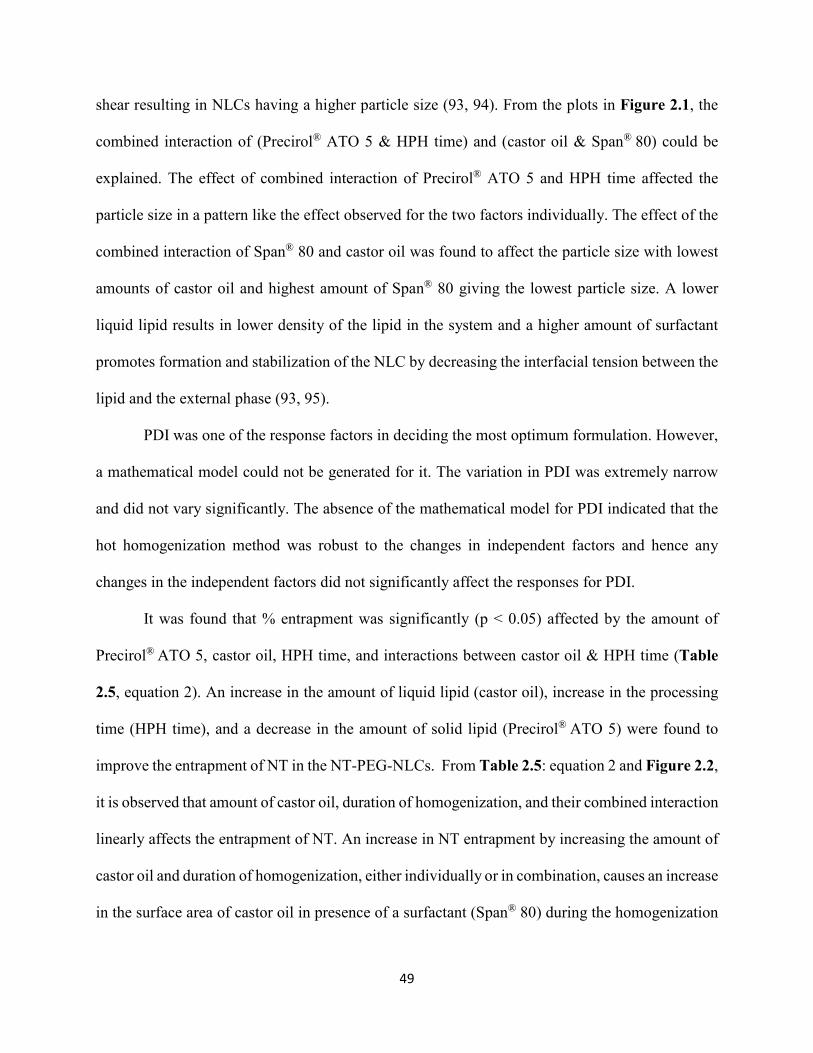
49
shear resulting in NLCs having a higher particle size (93, 94). From the plots in Figure 2.1, the
combined interaction of (Precirol® ATO 5 & HPH time) and (castor oil & Span® 80) could be
explained. The effect of combined interaction of Precirol® ATO 5 and HPH time affected the
particle size in a pattern like the effect observed for the two factors individually. The effect of the
combined interaction of Span® 80 and castor oil was found to affect the particle size with lowest
amounts of castor oil and highest amount of Span® 80 giving the lowest particle size. A lower
liquid lipid results in lower density of the lipid in the system and a higher amount of surfactant
promotes formation and stabilization of the NLC by decreasing the interfacial tension between the
lipid and the external phase (93, 95).
PDI was one of the response factors in deciding the most optimum formulation. However,
a mathematical model could not be generated for it. The variation in PDI was extremely narrow
and did not vary significantly. The absence of the mathematical model for PDI indicated that the
hot homogenization method was robust to the changes in independent factors and hence any
changes in the independent factors did not significantly affect the responses for PDI.
It was found that % entrapment was significantly (p < 0.05) affected by the amount of
Precirol® ATO 5, castor oil, HPH time, and interactions between castor oil & HPH time (Table
2.5, equation 2). An increase in the amount of liquid lipid (castor oil), increase in the processing
time (HPH time), and a decrease in the amount of solid lipid (Precirol® ATO 5) were found to
improve the entrapment of NT in the NT-PEG-NLCs. From Table 2.5: equation 2 and Figure 2.2,
it is observed that amount of castor oil, duration of homogenization, and their combined interaction
linearly affects the entrapment of NT. An increase in NT entrapment by increasing the amount of
castor oil and duration of homogenization, either individually or in combination, causes an increase
in the surface area of castor oil in presence of a surfactant (Span® 80) during the homogenization
50
process which may lead to a higher partition of NT (a lipophilic drug) into the castor oil phase
thereby improving the drug entrapment (96). In NLCs, since the solid lipid forms the outer matrix,
an increase in the amount of Precirol® ATO 5 (solid lipid) could lead to reduced entrapment of NT
within the NLC core (containing the castor oil) and higher presence of NT on the surface of NLCs
(97).
Amount of Precirol® ATO 5 and the combination of interaction between castor oil & HPH
time were found to have an effect on the DL. An increase in % DL was observed with a decrease
in the amount of Precirol® ATO 5 and an increase in the HPH processing time. An increase in
amount of solid lipids without increasing the liquid lipid amounts are reported to reduce the DL
owing to the denser matrix provided by the solid lipids; hence, increasing the amount of Precirol®
ATO 5 (solid lipid) without increasing the castor oil amount leads to a reduction of NT load in the
NLC system (Table 2.5: equation 3) (97, 98). Similarly, the HPH time and the interaction factor
involving it affect the NT load proportionally. A longer duration of homogenization leads to an
increase in the % DL as observed from Table 2.5: equation 3 and Figure 2.3 plots. This could
possibly occur due to the increased surface area available during the prolonged homogenization
process that could lead to a higher drug load (93).
Upon understanding the effects of excipients and processing parameters on the formulation
attributes such as particle size, PDI, % entrapment, and % DL an optimized formulation was
suggested by the Design Expert® software. Using desirability approach, the optimum formulation
was selected and formulated and a close agreement between the predicted values and experimental
values for particle size, PDI, % entrapment, and % DL was observed (Table 2.6).
The particle size of NT-PEG-NLCs, using STEM, was found to be approximately in the
range of 200 – 250 nm which was in agreement with the particle size dimensions obtained from
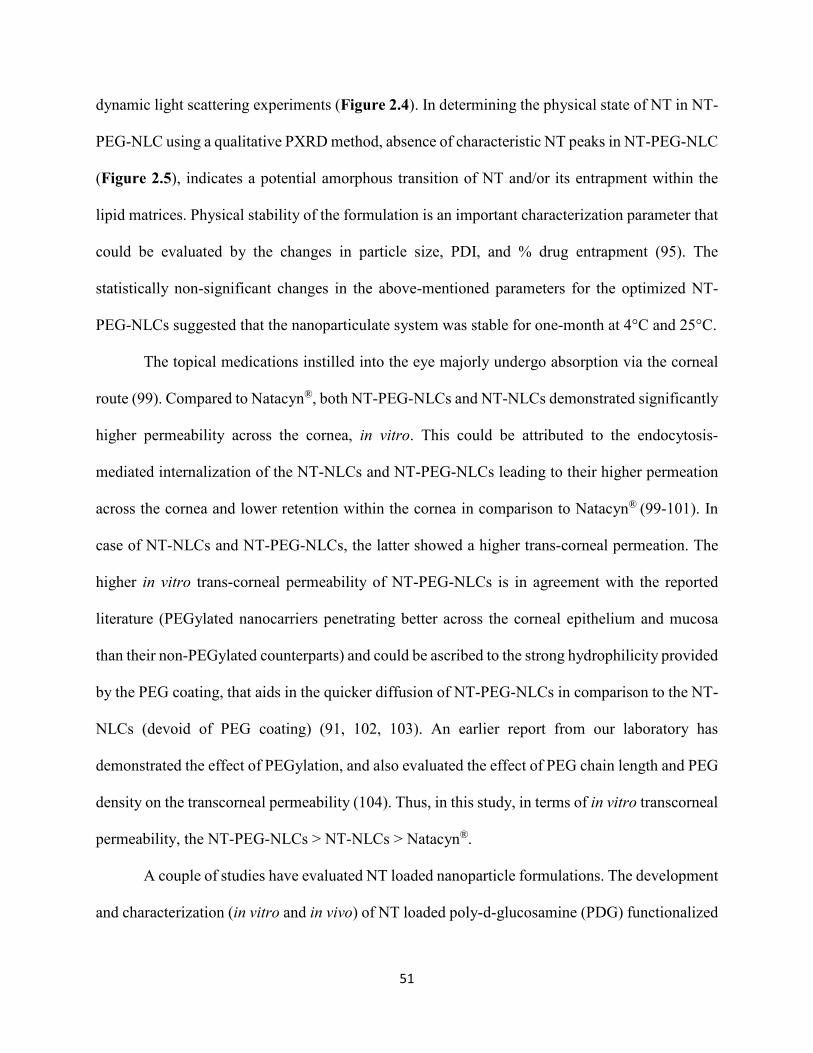
51
dynamic light scattering experiments (Figure 2.4). In determining the physical state of NT in NT-
PEG-NLC using a qualitative PXRD method, absence of characteristic NT peaks in NT-PEG-NLC
(Figure 2.5), indicates a potential amorphous transition of NT and/or its entrapment within the
lipid matrices. Physical stability of the formulation is an important characterization parameter that
could be evaluated by the changes in particle size, PDI, and % drug entrapment (95). The
statistically non-significant changes in the above-mentioned parameters for the optimized NT-
PEG-NLCs suggested that the nanoparticulate system was stable for one-month at 4°C and 25°C.
The topical medications instilled into the eye majorly undergo absorption via the corneal
route (99). Compared to Natacyn®, both NT-PEG-NLCs and NT-NLCs demonstrated significantly
higher permeability across the cornea, in vitro. This could be attributed to the endocytosis-
mediated internalization of the NT-NLCs and NT-PEG-NLCs leading to their higher permeation
across the cornea and lower retention within the cornea in comparison to Natacyn® (99-101). In
case of NT-NLCs and NT-PEG-NLCs, the latter showed a higher trans-corneal permeation. The
higher in vitro trans-corneal permeability of NT-PEG-NLCs is in agreement with the reported
literature (PEGylated nanocarriers penetrating better across the corneal epithelium and mucosa
than their non-PEGylated counterparts) and could be ascribed to the strong hydrophilicity provided
by the PEG coating, that aids in the quicker diffusion of NT-PEG-NLCs in comparison to the NT-
NLCs (devoid of PEG coating) (91, 102, 103). An earlier report from our laboratory has
demonstrated the effect of PEGylation, and also evaluated the effect of PEG chain length and PEG
density on the transcorneal permeability (104). Thus, in this study, in terms of in vitro transcorneal
permeability, the NT-PEG-NLCs > NT-NLCs > Natacyn®.
A couple of studies have evaluated NT loaded nanoparticle formulations. The development
and characterization (in vitro and in vivo) of NT loaded poly-d-glucosamine (PDG) functionalized
52
polycaprolactone (PCL) nanoparticles and NT loaded lecithin-chitosan mucoadhesive
nanoparticles at 1% and 5% w/v of NT loading, for ophthalmic keratitis have been reported by
Chandasana et al and Bhatta et al, respectively. In both these studies, it was found that the NT
nanoparticles (1% and 5% w/v) demonstrated improved tear pharmacokinetic profiles such as
higher concentration, greater area under curve, higher residence times, and lower clearance in the
lacrimal fluid and at the precorneal sites in comparison to the marketed NT suspension (5% w/v)
(62, 63). However, the authors did not investigate/report NT concentrations in the surface or inner
ocular tissues. In another evaluation by Paradkar et al., the authors’ demonstrated a significantly
higher in vitro trans-corneal NT penetration from NT niosome loaded in situ gel in comparison to
NT marketed suspension; however, the performance of the formulation was not evaluated in vivo.
Since, surface and inner ocular tissues (such as cornea, ICB, AH, and VH) are the major sites of
fungal infections and the targets for NT in antifungal therapy; the current study sought to undertake
a comparative evaluation of the concentration of NT from the optimized nano-lipid carriers and
marketed suspension (Natacyn®) in various ocular tissues. To the best of our knowledge, this is
the first study evaluating the effectiveness of nano-lipid carriers in the ocular delivery of NT.
In the in vivo ocular biodistribution assessment, NT-PEG-NLC were compared to their
non-PEGylated counterparts and to marketed Natacyn® suspension at 5% and 0.3% (diluted
marketed formulation). The comparison of NT concentrations from NT-PEG-NLC and NT-NLC
in the ocular tissues was undertaken to determine the effect of PEGylation on the NT loaded nano-
lipid carriers. In case of the marketed suspensions, 5% Natacyn® represented the marketed dose
whereas the 0.3% represented the dose normalized concentration with the formulated NT-PEG-
NLCs. These comparisons at the marketed and dose normalized concentrations aided in delineating
the effectiveness of the nanoparticle formulations in terms of ocular delivery of NT.
53
The NT-PEG-NLC exhibited significantly higher concentration (~3 folds higher) in the
cornea in comparison to NT-NLC. The concentration of NT from NT-PEG-NLC was significantly
higher in ICB and VH also in comparison to the NT-NLC formulation. This observation of higher
concentrations associated with NT-PEG-NLC over the non-PEGylated counterpart is in line with
the numerous literature reports which state that the PEG surface coating facilitates in the better
diffusion of nano-lipid carriers across the corneal epithelium and mucosal layers (91, 102, 103).
The dose normalized comparison of NT-PEG-NLC and diluted Natacyn® (0.3%), yielded
a ~2 folds higher concentration of NT from NT-PEG-NLC than diluted Natacyn® (0.3%) in both
cornea and ICB. The NT concentrations in AH and VH did not show any statistical difference,
indicating that similar NT concentrations were obtained from NT-PEG-NLC and Natacyn® (0.3%).
This in vivo data demonstrates that the NT-NLC are less bioavailable than their PEGylated
counterparts (both having particle size in the range of 200 – 250 nm) and the marketed suspension
(containing natamycin in micronized form) at dose normalized concentrations (0.3%). This is in
contrast to the in vitro transcorneal permeation data (NT-PEG-NLCs > NT-NLCs > Natacyn®);
however, it should be noted that the in vitro set-up conditions are significantly different (static)
from the in vivo environment, which is very dynamic in nature and has additional precorneal
barriers such as the mucus layer. An added advantage of PEGylation is that it allows efficient
penetration across mucus layers (102, 103). Thus, a larger number of NT-PEG-NLC particles will
be able to reach the corneal epithelium (penetrating through the mucus layers) compared to the
NT-NLCs, which can get trapped in the mucus meshwork (91, 101-103). As a result, the NT-PEG-
NLCs demonstrate greater in vivo ocular bioavailability, whereas, contrary to the in vitro result,
bioavailability from the NT-NLCs is decreased. Thus, a combination of better penetration across
54
the mucus as well as better transcorneal permeability of the nanoparticles lead to the overall
enhanced bioavailability from these NT-PEG-NLC formulations.
Natacyn® (5%) showed ~2 folds higher concentration in cornea in comparison to NT-PEG-
NLC. This could be attributed to a 16-fold higher dose for Natacyn® (5%; the marketed dose) when
compared to NT-PEG-NLC (0.3%). It should be noted that the dose of the marketed formulation
which was 16-fold higher led to only a 2-fold increase in corneal concentrations compared to the
NT-PEG-NLC. In contrast, a non-significant difference in NT concentration levels was obtained
from the NT-PEG-NLC and Natacyn® (5%) in the ICB and AH tissues, which again indicated that
a 16-fold higher dose could not lead to significantly higher NT concentrations in the deeper tissues.
In case of VH, a significantly higher NT concentration (~4 folds) was observed from NT-PEG-
NLC in comparison to Natacyn® (5%). The observation that Natacyn® (5%) produced higher
corneal NT concentrations whereas NT-PEG-NLC delivered equivalent/higher NT concentrations
in the AH, ICB and VH tissues could be associated with the NT-PEG-NLC penetrating better
across the corneal epithelium and thus into the ocular tissues due to the strong hydrophilicity
provided by the PEG coating, which aided in its faster diffusion across the corneal epithelium and
mucosa (100, 101, 105). Additionally, the involvement of the conjunctival-scleral pathway could
also be associated with the better penetration of NT-PEG-NLC formulations, since, the
conjunctival-scleral pathway has been attributed to be an important factor in improving and
enhancing the permeation of nano-lipid carrier systems in comparison to the conventional ocular
dosage forms such as the suspensions (78, 105).
In the in vivo evaluation, it is also interesting to note that, there was an approximately 16-
fold decrease in both BAK and NT concentrations in the marketed formulation when 5% Natacyn®
was diluted to 0.3%. However, this 16-fold decrease in the concentration gradient and possible
55
permeation enhancer translated to only an ≈ 4-fold decrease in NT concentration in the cornea and
a 2.5-fold decrease in NT concentrations in the iris-ciliary bodies. This indicates that, for the
marketed formulation, the concentration of drug in the tear fluid primarily governs the
bioavailability. It should be noted that no preservatives have been added to the NT nanoparticle
formulations in this study, and when added, can only lead to an improvement in the ocular
bioavailability (assuming no incompatibility exists).
In ocular fungal infections, such as fungal keratitis, the anterior segment tissues such as
cornea, ICB, and AH are majorly affected (106). Cornea is characterized by the debridement of its
epithelium, which facilitates the passage of the antifungal agents such as NT through its layers and
into the inner ocular tissues (69, 106, 107). However, as the healing of cornea begins during the
course of antifungal therapy, the drug permeation reduces due to the restoration of the corneal
epithelium integrity. Hence, this could pose as a potential risk for the relapse of the fungal
infections due to sub-therapeutic drug concentrations achieved in the inner layers of ICB, AH, and
VH during the corneal healing process. In such a case, NT-PEG-NLC could provide an alternative
approach to the conventional NT suspension by achieving similar concentrations in the inner
ocular tissues of ICB, AH, and VH at a markedly reduced dose (1/16th of the marketed dose).
3.5. CONCLUSION
This study reports the preparation and optimization of natamycin loaded surface coated
PEGylated NLC using Box-Behnken Design, and to the best of our knowledge is the first study
that reports the in vivo ocular biodistribution for NT from nano-lipid carriers. The optimized NT-
PEG-NLC were found to have small particle size, narrow PDI, and a high NT entrapment with a
minimum stability of one-month. The NT-PEG-NLCs exhibited significantly higher trans-corneal
permeation and flux than the marketed suspension (Natacyn®), in vitro. The in vivo ocular
56
biodistribution of NT-PEG-NLC indicated that the concentration of NT from Natacyn® in cornea
was significantly higher than NT-PEG-NLC. However, it should be noted that the NT load in NT-
PEG-NLC (0.3%) was 1/16th of the marketed suspension. In spite of this, NT-PEG-NLC could
permeate the intact cornea to reach the ICB, AH, and VH and the difference in NT concentration
obtained from NT-PEG-NLC and marketed Natacyn® (5%) suspension was statistically non-
significant. To further evaluate the ocular suitability of the NT-PEG-NLC system, it is essential to
determine its ocular safety and efficacy in fungal keratitis models, in vivo. Since NT-PEG-NLCs
showed better penetration across intact cornea to reach the inner ocular tissues at a lower
concentration, they could be a potential alternative during the ocular antifungal regimen. During
the fungal keratitis therapy, when cornea is healing, it is essential for the drug to penetrate the
nearly intact cornea to reach inner ocular tissues and prevent the relapse of infection. Summarizing
the above investigation in determining the in vivo ocular biodistribution of NT from its nano-lipid
carrier system, the NT-PEG-NLC system (at a lower NT load of 0.3%) showed increased ability
to penetrate the intact cornea and provide concentrations statistically similar to marketed
suspension (at a higher dose of 5%) in the inner ocular tissues, indicating that it could be a potential
alternative to the conventional marketed suspension during the course of the therapy for fungal
keratitis.
CONFLICT OF INTEREST
The authors have declared no conflict of interests regarding this article.
ACKNOWLEDGMENTS
This work was supported by the Graduate Student Council Research Grants Program,
undertaken by the University of Mississippi and National Institute of General Medical Sciences,

57
National Institutes of Health (Grant P20 GM104932). The content is solely the responsibility of
the authors and does not necessarily represent the official views of the National Institutes of Health.
58
Chapter 3
Carboxyvinyl Polymer and Guar-Borate Gelling System Containing Natamycin Loaded
PEGylated Nanolipid Carriers Exhibit Improved Ocular Pharmacokinetic Parameters.
Abstract
Presently, FDA has approved only natamycin (NT) ophthalmic suspension for treating ocular
fungal infections. However, short pre-corneal residence and high pre-corneal losses/drainage have
been the foremost challenges associated with the current ocular antifungal pharmacotherapy. In
search of alternative strategies, this study aimed to develop carboxyvinyl polymer, guar gum and
boric acid gelling system, that contained NT loaded PEGylated nanolipid carriers (NT-PEG-
NLCs). NT-PEG-NLCs were fabricated using homogenization technique and demonstrated
favorable physicochemical characteristics. A 23 factorial design was utilized in the formulation
and optimization of the NT-PEG-NLC gelling system (NT-PEG-NLC-GEL) with respect to guar
gum, boric acid, and Carbopol® 940 concentrations. The optimized NT-PEG-NLC-GEL was found
to exhibit shear thinning rheology, adequate firmness, and spreadability, and formed a depot that
did not collapse immediately. Additionally, the in vitro transcorneal evaluations indicated that the
NT-PEG-NLC-GEL exhibited a lower/slower flux and rate in comparison to Natacyn® suspension.
NT-PEG-NLC-GEL (0.3%) exhibited mean residence time and elimination half-life that were
comparable to Natacyn® (5%) at the pre-corneal/corneal sites, and, provided similar in vivo
59
concentrations in innermost tissues of the eye, at a 16-fold lower dose suggesting that it could be
a probable alternative during ophthalmic antifungal therapy.
60
3.1. INTRODUCTION
Currently, natamycin (NT) ophthalmic suspension (Natacyn® topical eye drops) is the only
FDA approved, commercially available, formulation for the treatment of ocular fungal infections
(OFI) (80). NT exhibits activity against filamentous fungal species, particularly Fusarium and
Aspergillus species, common causes of OFI such as keratitis and endophthalmitis (1, 108, 109).
NT also exhibits better safety and tolerability profiles compared to the other polyene and azole
antifungal drugs (3), and has, thus, become a favored first line antifungal agent in treating OFI,
particularly fungal keratitis (80, 110).
Fungal keratitis and endophthalmitis, are characterized by fungal infections primarily in
the cornea and aqueous humor (AH) & vitreous humor (VH), respectively (1, 69, 106, 107). Fungal
keratitis severely affects the corneal integrity and could be localized initially, but if left untreated,
could lead to the spread of fungal infection to the inner ocular tissues causing fungal
endophthalmitis and/or deep-seated mycoses (1, 69, 106, 107). Also, such cases of OFI are
characterized by a loss of corneal integrity, which additionally facilitates quicker passage of
antifungal drugs (such as NT), thereby further achieving higher drug levels in the intraocular
tissues. Despite this, the current therapy involves the need for frequent instillation/dosing of the
marketed suspension owing to the pre-corneal losses/drainage (3, 65)
Short residence times in the conjunctival cul de sac, post instillation, and low permeability
across the corneal membrane, limits ocular bioavailability of NT (≈ 2%) from the Natacyn® topical
eye drops. This necessitates frequent instillation of the NT eye drops; initially given every hour or
2-hour and then gradually reduced to about 6 – 8 times a day (65, 70). Also, Natacyn® suspension
(5%) is associated with adverse reactions/side-effects such as allergic reaction, change in vision,
chest pain, corneal opacity, dyspnea, eye discomfort, eye edema, eye hyperemia, eye irritation, eye
61
pain, foreign body sensation, paresthesia, and tearing (111). In our previous studies, we developed
NT loaded polyethylene glycol nano-lipid carriers (NT-PEG-NLCs) that showed enhanced in vitro
permeation across the intact cornea and improved ocular bioavailability compared to the
commercial NT suspension (Natacyn® eye drops) (110) at a 16-fold lower dose (NT-PEG-NLC:
0.3% versus Natacyn®: 5%) thereby also potentially reducing the chances of the aforementioned
adverse reactions. The goal of the current research was to improve the retention of the NT-PEG-
NLCs at a lower dose (compared to Natacyn® suspension) on the ocular surface without
compromising the enhanced transcorneal delivery characteristics.
Gelling systems containing nanoparticles and/or nano-lipid carriers can improve pre-
corneal and corneal residence times of therapeutic agents, reducing pre-corneal losses, and may
improve the permeation of therapeutic agents across the corneal barriers owing to prolonged
contact. Additionally, the composition may provide a sustained/prolonged release profile of the
therapeutic agent/s, facilitating a reduction in the frequency of application (88, 112-115).
Carboxyvinyl polymers (such as Carbopol® grades) have been evaluated as gelling agents in the
ocular delivery of various therapeutic agents. They have found a favor as gelling and/or viscosity
enhancing agents owing to their ability to provide thickening and gelling effect (by cross-linking)
at lower concentration, bioadhesive properties (at the corneal surface), clear gel appearance,
compatibility with various therapeutic agents, and excellent patient compliance due to their ability
to not interfere with the patients’ vision (116-119). The borate-guar gum combination along with
carboxyvinyl polymer in the system, stabilizes the cross-linked polymer by providing additional
cross-links (borate anion reacts with the galactomannan sugar contributed by guar gum to form
additional cross-links)(120). Therefore, the current study aimed to develop and optimize a
carboxyvinyl polymer-guar gum-borate gelling system containing NT-PEG-NLCs (NT-PEG-
62
NLC-GEL) and compare its in vivo performance against NT-PEG-NLC and Natacyn®.
3.2. MATERIALS AND METHODS
Chemicals
NT was procured from Cayman Chemicals (Michigan, USA). N-(Carbonyl-
methoxypolyethylenglycol-2000)-1,2-distearoyl-sn-glycero-3-phosphoethanolamine sodium salt
(mPEG-2K-DSPE sodium salt) was bought from Lipoid (Ludwigshafen, Germany). Precirol®
ATO 5 (Glyceryl distearate) was a gift from Gattefossé (New Jersey, USA). Castor oil, surfactants
(Span® 80, Tween® 80, poloxamer 188), and glycerin were all bought from Acros Organics (New
Jersey, USA). The gelling components – guar gum, boric acid crystals, and Carbopol® 940
(generally regarded as safe (GRAS) status and used in FDA approved ophthalmic products); and
all the solvents (analytical grade) were purchased from Fisher Scientific (Illinois, USA).
Methods
Preparation of NT-PEG-NLCs
Homogenization method was employed in the preparation of NT-PEG-NLCs which has
been reported earlier (110). Briefly, an aqueous phase consisting of surfactants – Tween® 80
(0.75% w/v; primary surfactant), poloxamer 188 (0.25% w/v; secondary surfactant), and glycerin
(2.25% w/v) was prepared in de-ionized water and heated. Separately a molten lipid phase
containing NT (0.3% w/v), castor oil (1% w/v), Precirol® ATO 5 (1.5% w/v), mPEG-2K-DSPE
sodium salt (1.5% w/v), and Span® 80 (0.1% w/v) was prepared. The aqueous phase was gradually
added to the lipid phase under continuous stirring at 2000 rpm for 5 minutes. The coarse emulsion
was then emulsified (Ultra-Turrax, 16,000 rpm, 5 minutes) to form a fine emulsion. The fine
emulsion was then subjected to high pressure homogenization (HPH; 15,000 psi) using
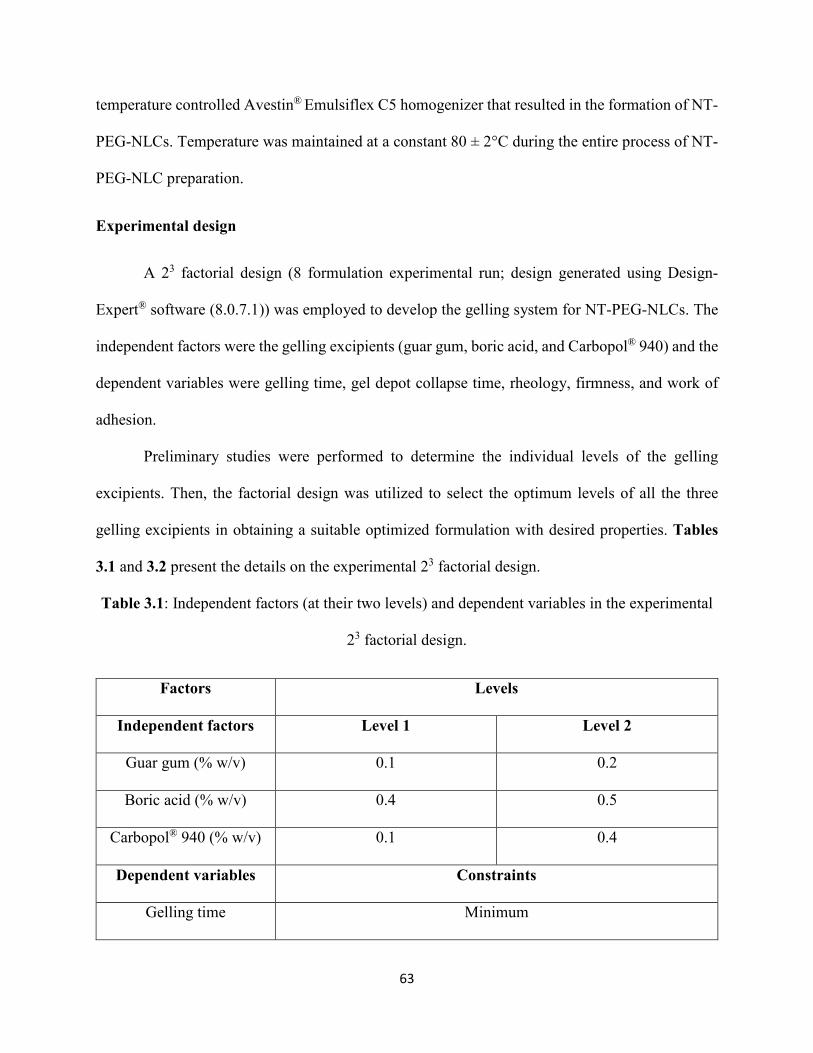
63
temperature controlled Avestin® Emulsiflex C5 homogenizer that resulted in the formation of NT-
PEG-NLCs. Temperature was maintained at a constant 80 ± 2°C during the entire process of NT-
PEG-NLC preparation.
Experimental design
A 23 factorial design (8 formulation experimental run; design generated using Design-
Expert® software (8.0.7.1)) was employed to develop the gelling system for NT-PEG-NLCs. The
independent factors were the gelling excipients (guar gum, boric acid, and Carbopol® 940) and the
dependent variables were gelling time, gel depot collapse time, rheology, firmness, and work of
adhesion.
Preliminary studies were performed to determine the individual levels of the gelling
excipients. Then, the factorial design was utilized to select the optimum levels of all the three
gelling excipients in obtaining a suitable optimized formulation with desired properties. Tables
3.1 and 3.2 present the details on the experimental 23 factorial design.
Table 3.1: Independent factors (at their two levels) and dependent variables in the experimental
23 factorial design.
Factors Levels
Independent factors Level 1 Level 2
Guar gum (% w/v) 0.1 0.2
Boric acid (% w/v) 0.4 0.5
Carbopol® 940 (% w/v) 0.1 0.4
Dependent variables Constraints
Gelling time Minimum
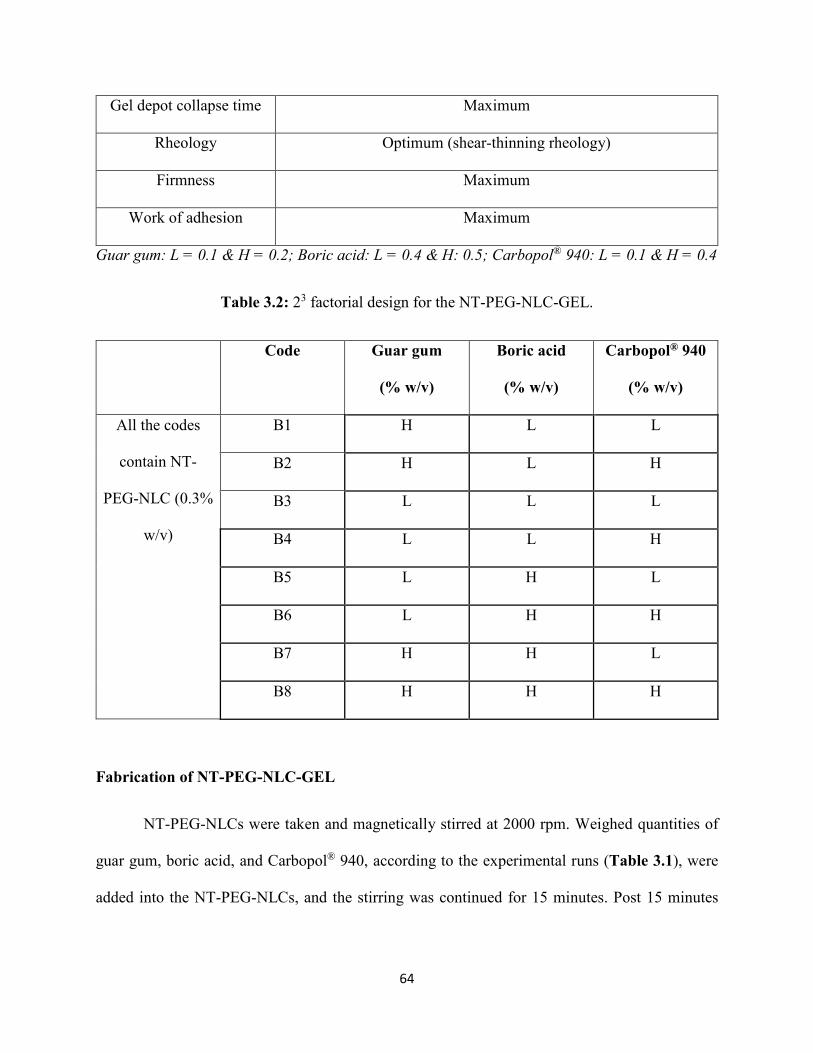
64
Gel depot collapse time Maximum
Rheology Optimum (shear-thinning rheology)
Firmness Maximum
Work of adhesion Maximum
Guar gum: L = 0.1 & H = 0.2; Boric acid: L = 0.4 & H: 0.5; Carbopol® 940: L = 0.1 & H = 0.4
Table 3.2: 23 factorial design for the NT-PEG-NLC-GEL.
Code Guar gum
(% w/v)
Boric acid
(% w/v)
Carbopol® 940
(% w/v)
All the codes
contain NT-
PEG-NLC (0.3%
w/v)
B1 H L L
B2 H L H
B3 L L L
B4 L L H
B5 L H L
B6 L H H
B7 H H L
B8 H H H
Fabrication of NT-PEG-NLC-GEL
NT-PEG-NLCs were taken and magnetically stirred at 2000 rpm. Weighed quantities of
guar gum, boric acid, and Carbopol® 940, according to the experimental runs (Table 3.1), were
added into the NT-PEG-NLCs, and the stirring was continued for 15 minutes. Post 15 minutes
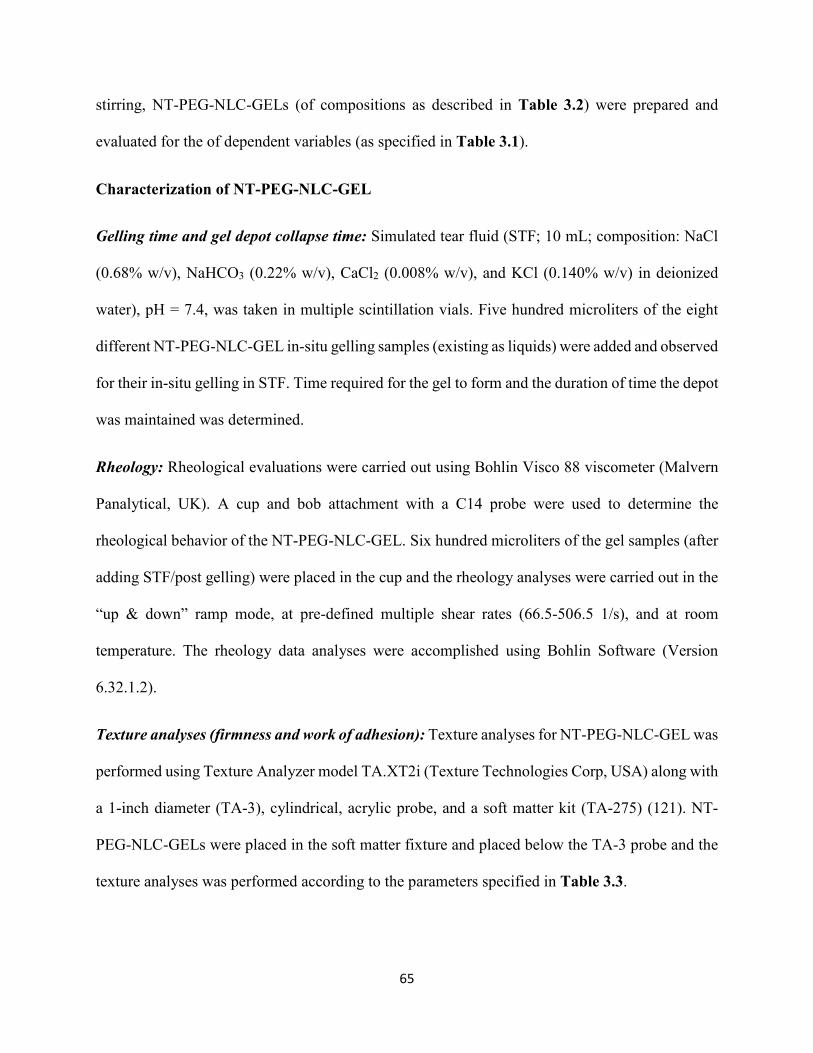
65
stirring, NT-PEG-NLC-GELs (of compositions as described in Table 3.2) were prepared and
evaluated for the of dependent variables (as specified in Table 3.1).
Characterization of NT-PEG-NLC-GEL
Gelling time and gel depot collapse time: Simulated tear fluid (STF; 10 mL; composition: NaCl
(0.68% w/v), NaHCO3 (0.22% w/v), CaCl2 (0.008% w/v), and KCl (0.140% w/v) in deionized
water), pH = 7.4, was taken in multiple scintillation vials. Five hundred microliters of the eight
different NT-PEG-NLC-GEL in-situ gelling samples (existing as liquids) were added and observed
for their in-situ gelling in STF. Time required for the gel to form and the duration of time the depot
was maintained was determined.
Rheology: Rheological evaluations were carried out using Bohlin Visco 88 viscometer (Malvern
Panalytical, UK). A cup and bob attachment with a C14 probe were used to determine the
rheological behavior of the NT-PEG-NLC-GEL. Six hundred microliters of the gel samples (after
adding STF/post gelling) were placed in the cup and the rheology analyses were carried out in the
“up & down” ramp mode, at pre-defined multiple shear rates (66.5-506.5 1/s), and at room
temperature. The rheology data analyses were accomplished using Bohlin Software (Version
6.32.1.2).
Texture analyses (firmness and work of adhesion): Texture analyses for NT-PEG-NLC-GEL was
performed using Texture Analyzer model TA.XT2i (Texture Technologies Corp, USA) along with
a 1-inch diameter (TA-3), cylindrical, acrylic probe, and a soft matter kit (TA-275) (121). NT-
PEG-NLC-GELs were placed in the soft matter fixture and placed below the TA-3 probe and the
texture analyses was performed according to the parameters specified in Table 3.3.
66
Table 3.3: Parameters for texture analyses of NT-PEG-NLC-GEL.
Parameter Set value
Test mode Compression
Pre-test speed 0.5 mm/sec
Test speed 0.5 mm/sec
Post-test speed 0.5 mm/sec
Target mode Distance
Distance 1.0 mm
Trigger type Auto (Force)
Trigger force 2.0 g
Temperature Room temperature
Transcorneal permeation: Transcorneal flux, permeability, and permeation rate of NT from NT-
PEG-NLC-GEL formulation was assessed across rabbit cornea procured from Pel-Freez
Biologicals® (Arkansas, USA) using vertical Franz diffusion cells (PermeGear®, Inc.) (110, 122).
The underlying aim of the transcorneal permeation study was to select the most optimum (guar
gum: boric acid) ratio, and to evaluate the effectiveness of the incorporation of the NT-PEG-NLCs
in the carboxyvinyl polymer-guar gum-borate gels and compare the gelling system to NT-PEG-
NLCs (not incorporated into gel) and diluted Natacyn® (dose normalized; diluted to 0.3% w/v).
Cornea was fixed in between the donor and receiver compartments, with corneal epithelial
surface facing the donor cell containing formulations. Five hundred microliters of diluted
Natacyn® (dose normalized; 0.3% w/v), NT-PEG-NLCs (0.3% w/v), and NT-PEG-NLC-GEL
(0.3% w/v) were the test formulations that were placed in the donor compartment. Randomly
67
methylated-β-cyclodextrin (RMβCD) in Dulbecco's Phosphate-Buffered Saline (DPBS) (2.5%
w/v) was used as the receiver medium (5 mL) to maintain the corneal integrity and sink conditions
during the study and was stirred continuously using a magnetic stirrer (123, 124). Aliquots (600
μL) were withdrawn at pre-determined time intervals over a duration of 3-hours and replenished
with an equal volume of RMβCD in DPBS. NT concentration in the aliquots was quantified using
a HPLC analytical method for in vitro samples described in the subsequent analytical methods
section.
NT content in optimized NT-PEG-NLC-GEL: Pre-determined amount of NT-PEG-NLC-GEL
was taken from three different regions (bottom, middle, and top) of the gel formulation and
dissolved in methanol (extracting solvent). The gel samples were centrifuged at 13,000 rpm for 10
minutes and the supernatant analyzed for NT.
pH of the optimized NT-PEG-NLC-GEL: pH of the optimized NT-PEG-NLC-GEL formulation
was determined by SevenMulti™ Mettler Toledo pH meter (Belgium).
In vitro release and release kinetics of the optimized NT-PEG-NLC-GEL: Twenty milliliters of
STF, pH = 7.4, was taken in six scintillation vials, to evaluate the release of NT from NT-PEG-
NLC-GEL system and NT suspension. STF was selected as a biorelevant medium to study the
drug release at/in the precorneal region, since the gelling system was intended to be
applied/instilled in the precorneal region (125). The study was carried out under continuous
magnetic stirring of the STF at 32 ± 1°C. Briefly, two hundred microliters of the samples were
loaded on to the dialysis cassettes (Slide-A-Lyzer® Mini Dialysis Devices, 10K MWCO) which
contained a cellulose membrane with diffusion area of 0.64 cm2. At pre-determined time points (t
= 0, 0.5, 1, 1.5, 2, 4, 6, 12, 24, and 48 hour) six hundred microliters of the aliquot sample of STF
was withdrawn from the scintillation vial and an equal amount of STF was replaced in the vial
68
post every withdrawal. The aliquot sample of STF was then analyzed using HPLC to quantify the
amount of NT released across the active diffusion membrane. The release data was analyzed to
model the release kinetics using different release models – Higuchi square root, first-order, zero-
order, and Korsmeyer-Peppas models.
In vivo pre-corneal tear pharmacokinetics (PK) of the optimized NT-PEG-NLC-GEL: In vivo
pre-corneal tear kinetics of the various NT formulations was determined in triplicates (n=3) in
male New Zealand White (NZW) Rabbits (2-2.5 kg), which were purchased from Charles River
Labs. All the animal studies conformed to the tenets of the Association for Research in Vision and
Ophthalmology statement on the use of animals in ophthalmic vision and research and the
University of Mississippi Institutional Animal Care and Use Committee approved protocols. The
rabbits were dosed (100 µL administered as two drops of 50 µL each) with NT-PEG-NLC-GEL,
NT-PEG-NLC, and Natacyn® (5%) formulations topically. Therefore, amount of NT dose received
by the rabbits was 0.3 mg (for NT-PEG-NLC-GEL and NT-PEG-NLC) and 5 mg (for Natacyn®).
The tear samples were collected using a pre-weighed piece of filter paper by gently touching the
filter paper at the corneal surface at every time point (t = 0, 0.5, 1, 2, 3, 4, 5, and 6 hours). The wet
weight of the filter paper was then recorded and the difference in their dry and wet weights was
used in the determination of the amount of tear fluid that was collected which was used in the
estimation of NT from the tear biosamples.
NT from the tear biosamples collected on filter papers was extracted with six hundred
microliters of ice-cold methanol, mixed thoroughly using a vortex genie mixer, and centrifuged
(13,000 rpm, 15 minutes) in a table-top centrifuge. The supernatant was then collected and
analyzed for NT using a validated HPLC quantification method that has been outlined below
(analytical methods). The data was then analyzed using PKSolver software 2.0 for determining the
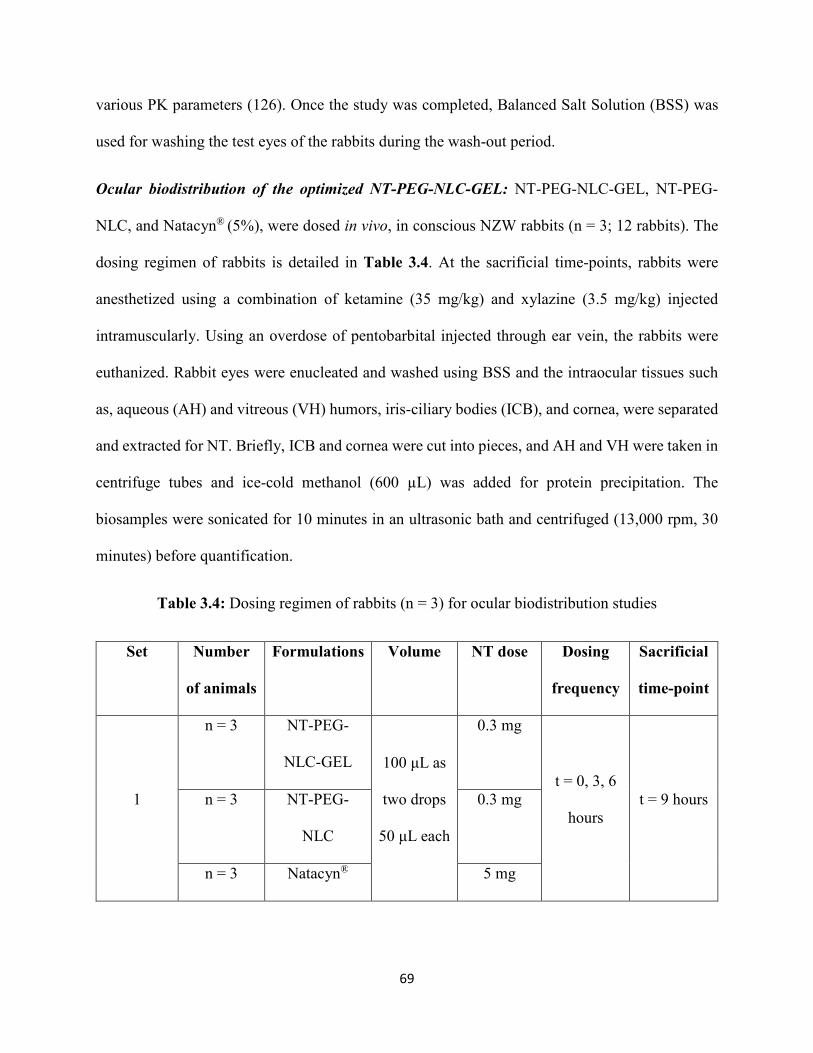
69
various PK parameters (126). Once the study was completed, Balanced Salt Solution (BSS) was
used for washing the test eyes of the rabbits during the wash-out period.
Ocular biodistribution of the optimized NT-PEG-NLC-GEL: NT-PEG-NLC-GEL, NT-PEG-
NLC, and Natacyn® (5%), were dosed in vivo, in conscious NZW rabbits (n = 3; 12 rabbits). The
dosing regimen of rabbits is detailed in Table 3.4. At the sacrificial time-points, rabbits were
anesthetized using a combination of ketamine (35 mg/kg) and xylazine (3.5 mg/kg) injected
intramuscularly. Using an overdose of pentobarbital injected through ear vein, the rabbits were
euthanized. Rabbit eyes were enucleated and washed using BSS and the intraocular tissues such
as, aqueous (AH) and vitreous (VH) humors, iris-ciliary bodies (ICB), and cornea, were separated
and extracted for NT. Briefly, ICB and cornea were cut into pieces, and AH and VH were taken in
centrifuge tubes and ice-cold methanol (600 µL) was added for protein precipitation. The
biosamples were sonicated for 10 minutes in an ultrasonic bath and centrifuged (13,000 rpm, 30
minutes) before quantification.
Table 3.4: Dosing regimen of rabbits (n = 3) for ocular biodistribution studies
Set Number
of animals
Formulations Volume NT dose Dosing
frequency
Sacrificial
time-point
1
n = 3 NT-PEG-
NLC-GEL 100 μL as
two drops
50 μL each
0.3 mg
t = 0, 3, 6
hours t = 9 hours n = 3 NT-PEG-
NLC
0.3 mg
n = 3 Natacyn® 5 mg

70
Set Number
of animals
Formulations Volume NT dose Dosing
frequency
Sacrificial
time-point
2 n = 3 NT-PEG-
NLC-GEL
0.3 mg t = 0, 4
hours t = 8 hours
Using standard calibration curves for AH (0.4–100 ng/mL), VH (2–200 ng/mL), cornea
(1.31–65.57 ng/mL), ICB (1.31–65.57 ng/mL), NT quantification was accomplished using LC-
MS/MS method. A coefficient of determination r2 ⩾ 0.95 was obtained for all the standard curves.
NT extraction efficiency was greater than 95% for cornea, ICB, and AH whereas was about 82%
for VH; and, process efficiency was greater than 90% for all the tissues (110). The LOD for all
ocular tissues corresponded to 0.13 ng/mL for all four intraocular tissues analyzed (110).
Analytical methods
In vitro analyses: NT was quantified using a validated HPLC method reported in literature (79,
110). The HPLC system consisted of a Waters 717 plus auto-sampler coupled with a Waters 2487
Dual λ Absorbance UV detector, a Waters 600 controller pump, and an Agilent 3395 Integrator.
The mobile phase consisted of a mixture of phosphate buffer (0.2 M, pH 5.5) and acetonitrile
(70:30) with flow rate of 1 mL/min. A C18 Phenomenex Luna® (5µ, 250 x 4.6 mm) column was
used. The injection volume was 20 µL, and the UV detection wavelength was set to 304 nm at
AUFS 1.00.
In vivo analyses: A Waters Xevo TQ-S triple quadrupole tandem mass spectrometer with an
electrospray ionization source (ESI), equipped with ACQUITY UPLC® I-Class System were used
(Waters Corporation, Milford, MA, USA) in NT quantification from biosamples. TargetLynx and
MassLynx were utilized for data acquisition and data processing, respectively. Separation was

71
achieved using a C18 column (Acquity UPLC® BEH C18 100 mm×2.1 m, 1.7μm particle size).
Mobile phase consisted of water (A), and acetonitrile (B) both containing 0.1 % formic acid with
a gradient flow rate of 1.0 mL/min (0 min, 98 % A/2 % B held for 0.2 min and in next 2.3 min to
100% B). Each run was followed by 1-minute wash with 100 % B and equilibration period of 2
min with 98 % A/2 % B. Column and sample temperature were maintained at 50ºC and 10°C,
respectively. Column effluent was directed into the ESI probe. The ESI conditions were:
desolvation temperature 600°C, source temperature 150°C, capillary voltage 3.0 kV, cone voltage
40 V, nebulizer gas 1100 L·h−1 N2, and nebulizer pressure, 7 bar. The collision gas utilized was
Argon and collision energies ranged from 10 to 15 eV. Mass spectra were acquired in positive
mode and multiple reaction monitoring (MRM) mode. The MRM mode was applied to monitor
the transitions of quantifier ion to qualifier ions of m/z 666.2 → m/z 467.2, 485.2, 503.2 for NT;
m/z 924.4 → m/z 107.5, 743.2, 761.4 for amphotericin B (internal standard).
STATISTICAL ANALYSES
For each study, a minimum of 3 independent experimental trials have been performed and
the data values have been represented as mean ± standard deviation and/or mean ± standard error.
Statistical comparison was performed using Student’s t-test and/or one-way analysis of variance
(ANOVA). Statistically significant differences were considered at p-value less than 0.05.
3.3. RESULTS
Characterization of NT-PEG-NLC-GEL
Gelling time and gel depot collapse time: The results observed from gelling time and gel depot
collapse time are presented in Table 3.5. Out of 8 (B1-B8) factorial runs, B1, B3, B5, and B7 did
not undergo gelation to form a gel depot. Therefore, these formulations from the experimental

72
design could not be considered for statistical analyses (ANOVA). On the basis of the results, NT-
PEG-NLC-GEL formulation codes (B2, B4, B6, and B8) were selected for further evaluation with
respect to the other aforementioned dependent variables with the intent to optimize and select the
most suitable NT-PEG-NLC-GEL formulation.
Table 3.5: Results from gelling time and gel depot collapse time study.
Code Gelling components in NT-PEG-
NLC-GEL (%)
Gelling
time
Depot
collapse
time
Firmness
(g)
Work of
Adhesion
(g-sec) Guar
gum
Boric
acid
Carbopol®
940
B1 0.2 0.4 0.1 (-) NA NA NA
B2 0.2 0.4 0.4 (+) Depot
until >
12 hours
7.36±2.86 21.54±1.52
B3 0.1 0.4 0.1 (-) NA NA NA
B4 0.1 0.4 0.4 (+) Depot
until >
12 hours
10.32±0.28 23.59±3.04
B5 0.1 0.5 0.1 (-) NA NA NA
B6 0.1 0.5 0.4 (+) Depot
until >
12 hours
11.30±1.37 23.41±4.31
B7 0.2 0.5 0.1 (-) NA NA NA
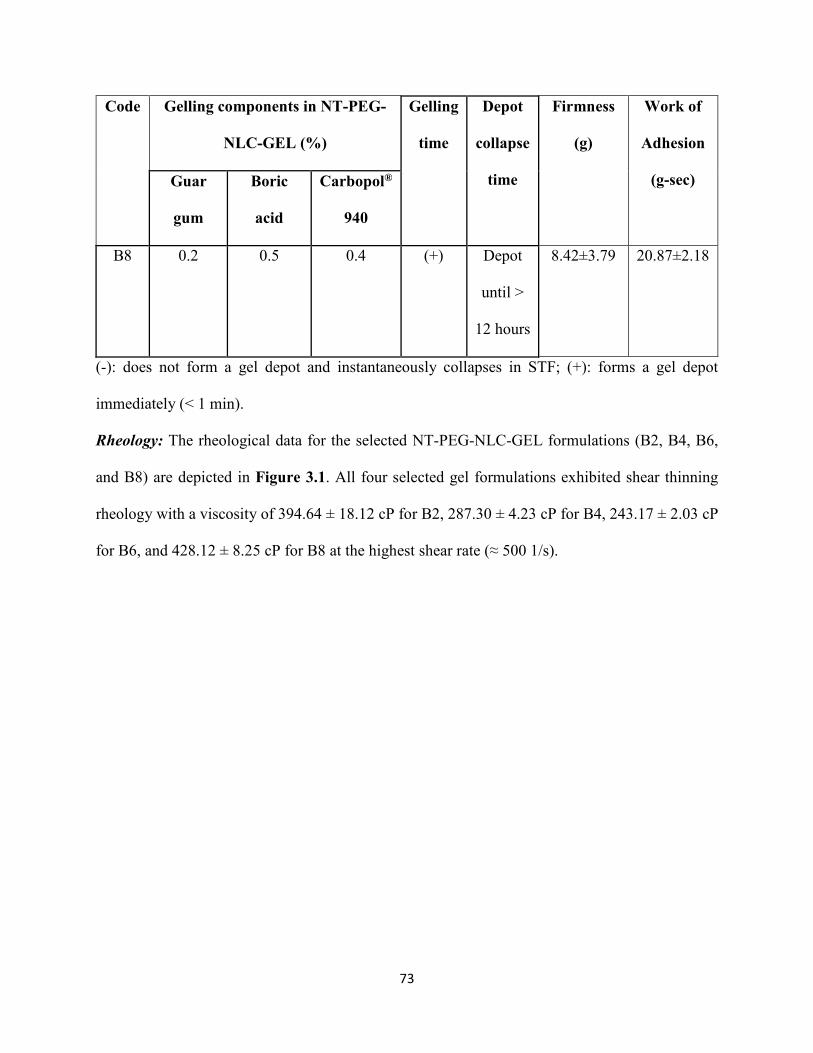
73
Code Gelling components in NT-PEG-
NLC-GEL (%)
Gelling
time
Depot
collapse
time
Firmness
(g)
Work of
Adhesion
(g-sec) Guar
gum
Boric
acid
Carbopol®
940
B8 0.2 0.5 0.4 (+) Depot
until >
12 hours
8.42±3.79 20.87±2.18
(-): does not form a gel depot and instantaneously collapses in STF; (+): forms a gel depot
immediately (< 1 min).
Rheology: The rheological data for the selected NT-PEG-NLC-GEL formulations (B2, B4, B6,
and B8) are depicted in Figure 3.1. All four selected gel formulations exhibited shear thinning
rheology with a viscosity of 394.64 ± 18.12 cP for B2, 287.30 ± 4.23 cP for B4, 243.17 ± 2.03 cP
for B6, and 428.12 ± 8.25 cP for B8 at the highest shear rate (≈ 500 1/s).
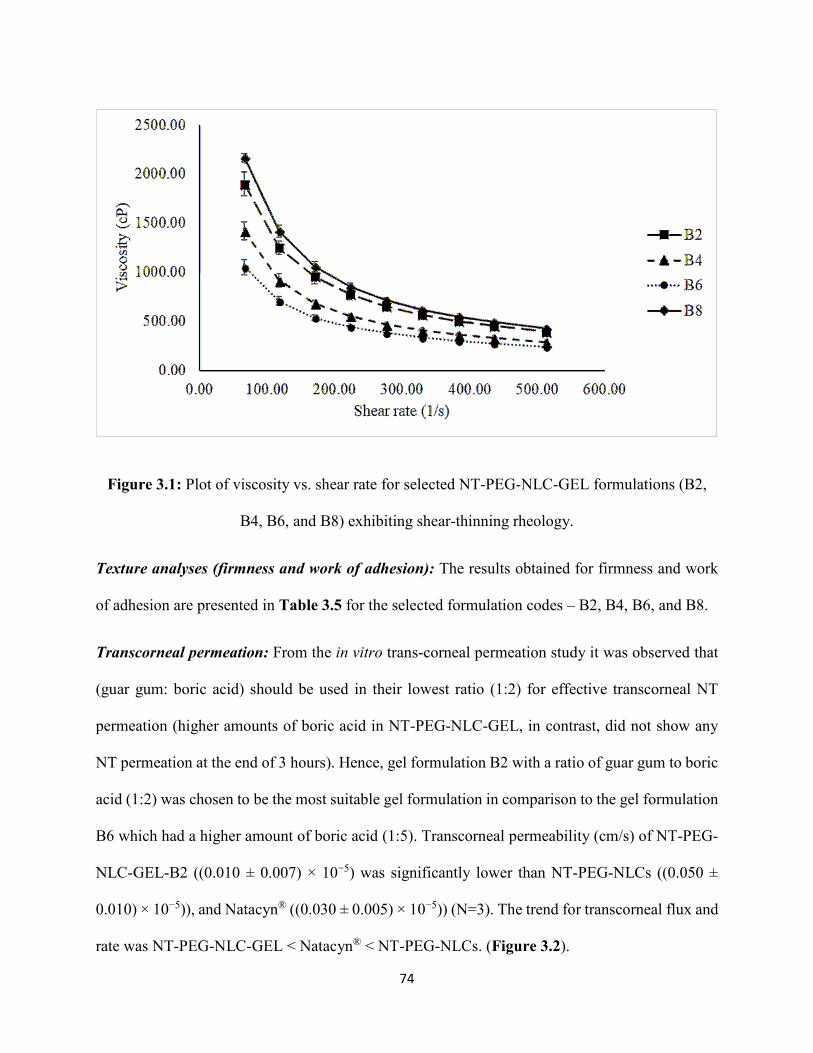
74
Figure 3.1: Plot of viscosity vs. shear rate for selected NT-PEG-NLC-GEL formulations (B2,
B4, B6, and B8) exhibiting shear-thinning rheology.
Texture analyses (firmness and work of adhesion): The results obtained for firmness and work
of adhesion are presented in Table 3.5 for the selected formulation codes – B2, B4, B6, and B8.
Transcorneal permeation: From the in vitro trans-corneal permeation study it was observed that
(guar gum: boric acid) should be used in their lowest ratio (1:2) for effective transcorneal NT
permeation (higher amounts of boric acid in NT-PEG-NLC-GEL, in contrast, did not show any
NT permeation at the end of 3 hours). Hence, gel formulation B2 with a ratio of guar gum to boric
acid (1:2) was chosen to be the most suitable gel formulation in comparison to the gel formulation
B6 which had a higher amount of boric acid (1:5). Transcorneal permeability (cm/s) of NT-PEG-
NLC-GEL-B2 ((0.010 ± 0.007) × 10−5) was significantly lower than NT-PEG-NLCs ((0.050 ±
0.010) × 10−5)), and Natacyn® ((0.030 ± 0.005) × 10−5)) (N=3). The trend for transcorneal flux and
rate was NT-PEG-NLC-GEL < Natacyn® < NT-PEG-NLCs. (Figure 3.2).
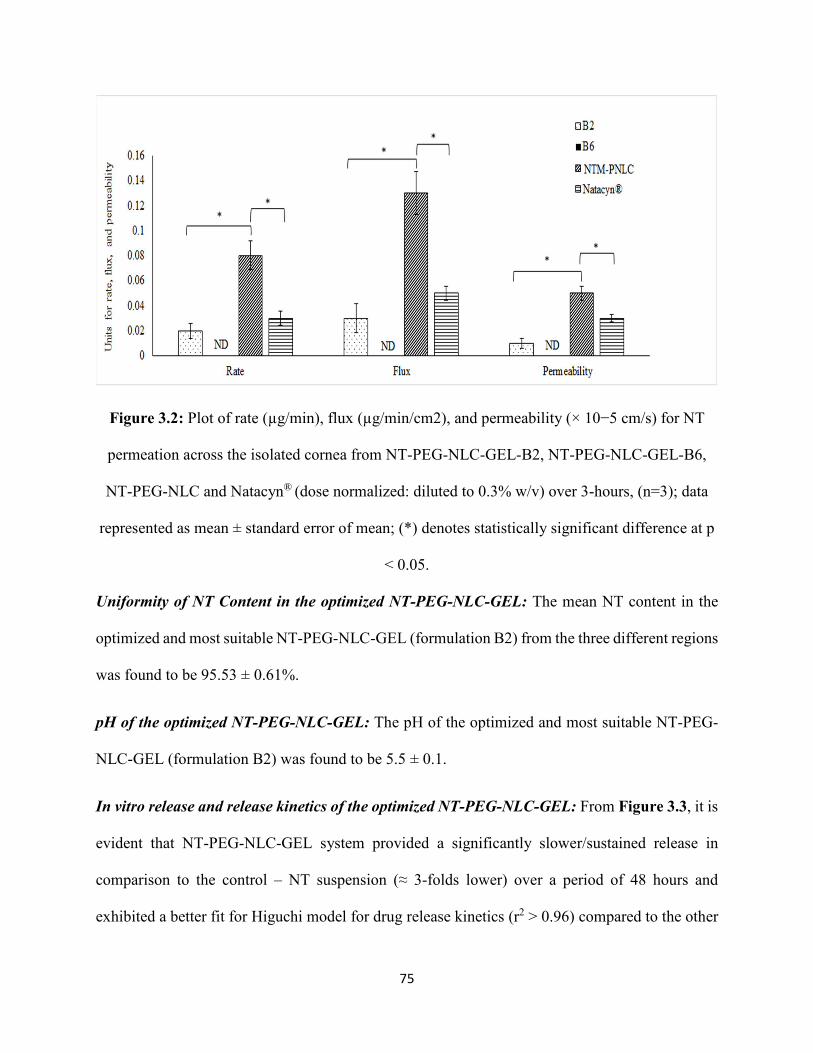
75
Figure 3.2: Plot of rate (µg/min), flux (µg/min/cm2), and permeability (× 10−5 cm/s) for NT
permeation across the isolated cornea from NT-PEG-NLC-GEL-B2, NT-PEG-NLC-GEL-B6,
NT-PEG-NLC and Natacyn® (dose normalized: diluted to 0.3% w/v) over 3-hours, (n=3); data
represented as mean ± standard error of mean; (*) denotes statistically significant difference at p
< 0.05.
Uniformity of NT Content in the optimized NT-PEG-NLC-GEL: The mean NT content in the
optimized and most suitable NT-PEG-NLC-GEL (formulation B2) from the three different regions
was found to be 95.53 ± 0.61%.
pH of the optimized NT-PEG-NLC-GEL: The pH of the optimized and most suitable NT-PEG-
NLC-GEL (formulation B2) was found to be 5.5 ± 0.1.
In vitro release and release kinetics of the optimized NT-PEG-NLC-GEL: From Figure 3.3, it is
evident that NT-PEG-NLC-GEL system provided a significantly slower/sustained release in
comparison to the control – NT suspension (≈ 3-folds lower) over a period of 48 hours and
exhibited a better fit for Higuchi model for drug release kinetics (r2 > 0.96) compared to the other
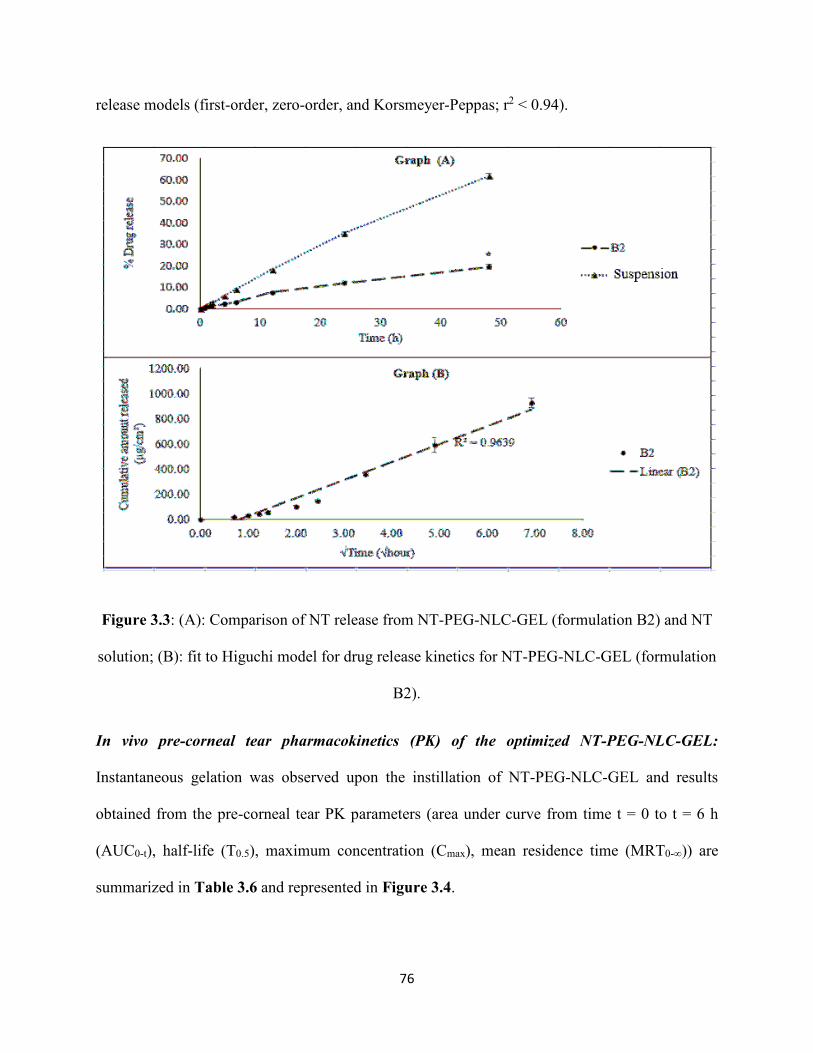
76
release models (first-order, zero-order, and Korsmeyer-Peppas; r2 < 0.94).
Figure 3.3: (A): Comparison of NT release from NT-PEG-NLC-GEL (formulation B2) and NT
solution; (B): fit to Higuchi model for drug release kinetics for NT-PEG-NLC-GEL (formulation
B2).
In vivo pre-corneal tear pharmacokinetics (PK) of the optimized NT-PEG-NLC-GEL:
Instantaneous gelation was observed upon the instillation of NT-PEG-NLC-GEL and results
obtained from the pre-corneal tear PK parameters (area under curve from time t = 0 to t = 6 h
(AUC0-t), half-life (T0.5), maximum concentration (Cmax), mean residence time (MRT0-∞)) are
summarized in Table 3.6 and represented in Figure 3.4.
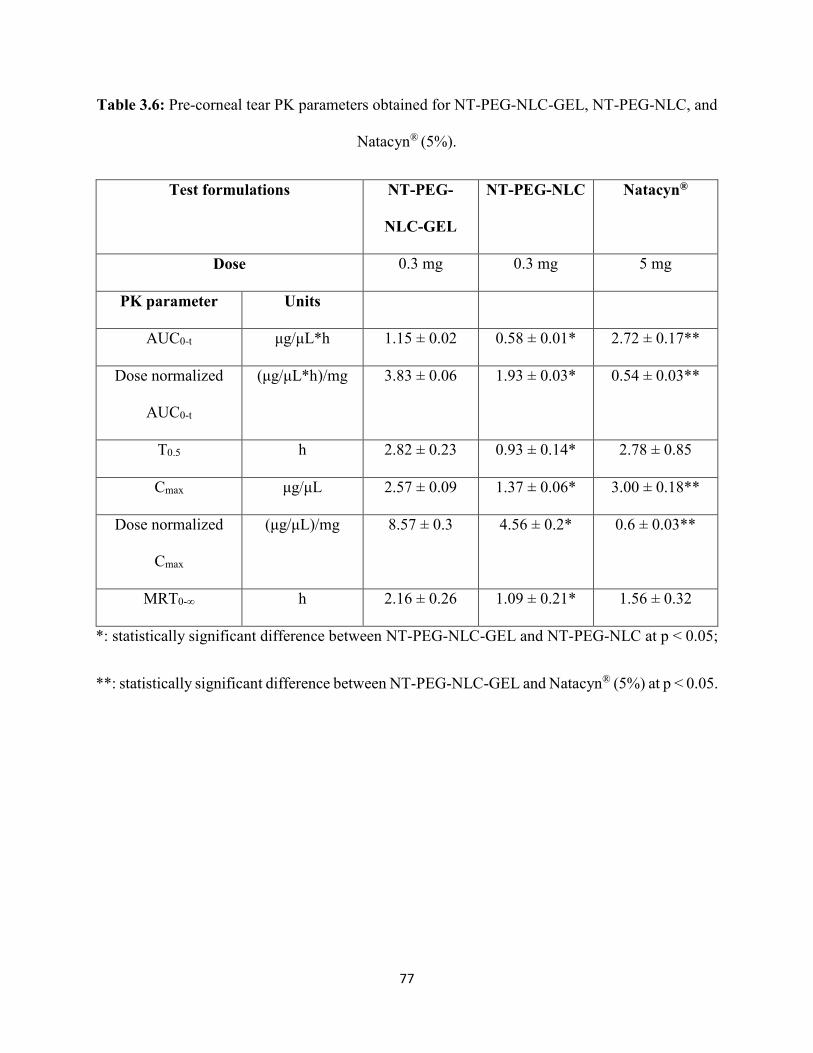
77
Table 3.6: Pre-corneal tear PK parameters obtained for NT-PEG-NLC-GEL, NT-PEG-NLC, and
Natacyn® (5%).
Test formulations NT-PEG-
NLC-GEL
NT-PEG-NLC Natacyn®
Dose 0.3 mg 0.3 mg 5 mg
PK parameter Units
AUC0-t μg/μL*h 1.15 ± 0.02 0.58 ± 0.01* 2.72 ± 0.17**
Dose normalized
AUC0-t
(μg/μL*h)/mg 3.83 ± 0.06 1.93 ± 0.03* 0.54 ± 0.03**
T0.5 h 2.82 ± 0.23 0.93 ± 0.14* 2.78 ± 0.85
Cmax μg/μL 2.57 ± 0.09 1.37 ± 0.06* 3.00 ± 0.18**
Dose normalized
Cmax
(μg/μL)/mg 8.57 ± 0.3 4.56 ± 0.2* 0.6 ± 0.03**
MRT0-∞ h 2.16 ± 0.26 1.09 ± 0.21* 1.56 ± 0.32
*: statistically significant difference between NT-PEG-NLC-GEL and NT-PEG-NLC at p < 0.05;
**: statistically significant difference between NT-PEG-NLC-GEL and Natacyn® (5%) at p < 0.05.
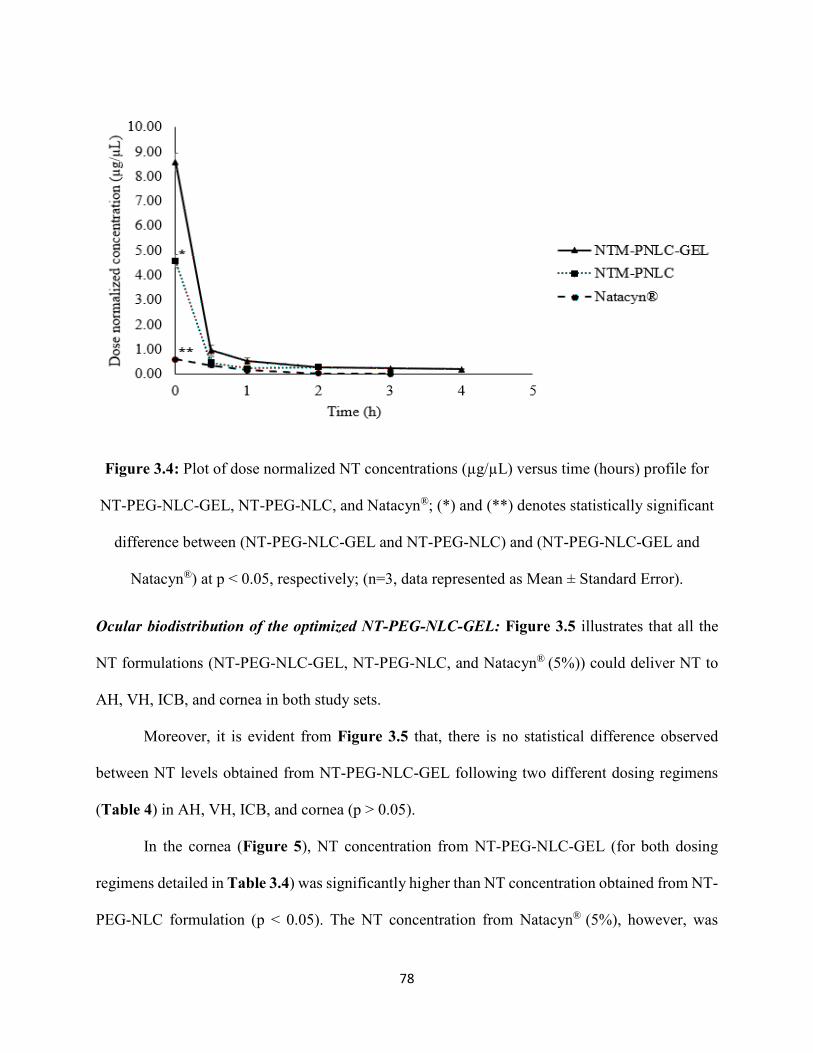
78
Figure 3.4: Plot of dose normalized NT concentrations (µg/µL) versus time (hours) profile for
NT-PEG-NLC-GEL, NT-PEG-NLC, and Natacyn®; (*) and (**) denotes statistically significant
difference between (NT-PEG-NLC-GEL and NT-PEG-NLC) and (NT-PEG-NLC-GEL and
Natacyn®) at p < 0.05, respectively; (n=3, data represented as Mean ± Standard Error).
Ocular biodistribution of the optimized NT-PEG-NLC-GEL: Figure 3.5 illustrates that all the
NT formulations (NT-PEG-NLC-GEL, NT-PEG-NLC, and Natacyn® (5%)) could deliver NT to
AH, VH, ICB, and cornea in both study sets.
Moreover, it is evident from Figure 3.5 that, there is no statistical difference observed
between NT levels obtained from NT-PEG-NLC-GEL following two different dosing regimens
(Table 4) in AH, VH, ICB, and cornea (p > 0.05).
In the cornea (Figure 5), NT concentration from NT-PEG-NLC-GEL (for both dosing
regimens detailed in Table 3.4) was significantly higher than NT concentration obtained from NT-
PEG-NLC formulation (p < 0.05). The NT concentration from Natacyn® (5%), however, was
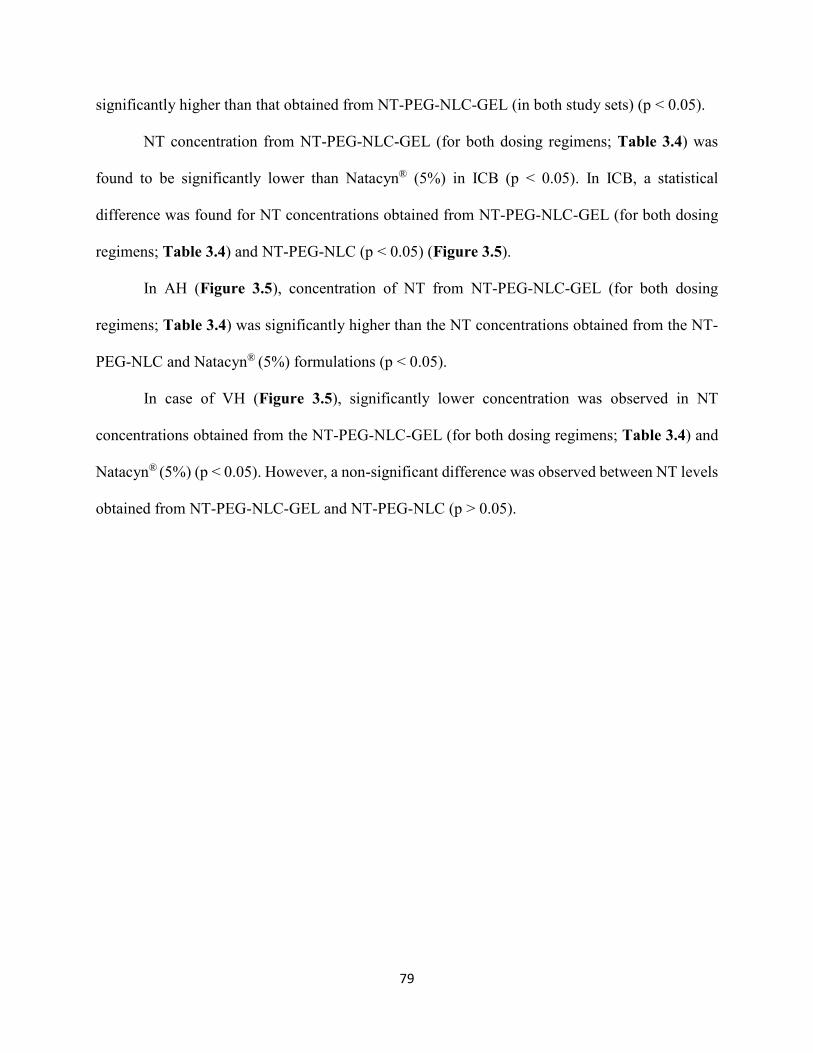
79
significantly higher than that obtained from NT-PEG-NLC-GEL (in both study sets) (p < 0.05).
NT concentration from NT-PEG-NLC-GEL (for both dosing regimens; Table 3.4) was
found to be significantly lower than Natacyn® (5%) in ICB (p < 0.05). In ICB, a statistical
difference was found for NT concentrations obtained from NT-PEG-NLC-GEL (for both dosing
regimens; Table 3.4) and NT-PEG-NLC (p < 0.05) (Figure 3.5).
In AH (Figure 3.5), concentration of NT from NT-PEG-NLC-GEL (for both dosing
regimens; Table 3.4) was significantly higher than the NT concentrations obtained from the NT-
PEG-NLC and Natacyn® (5%) formulations (p < 0.05).
In case of VH (Figure 3.5), significantly lower concentration was observed in NT
concentrations obtained from the NT-PEG-NLC-GEL (for both dosing regimens; Table 3.4) and
Natacyn® (5%) (p < 0.05). However, a non-significant difference was observed between NT levels
obtained from NT-PEG-NLC-GEL and NT-PEG-NLC (p > 0.05).
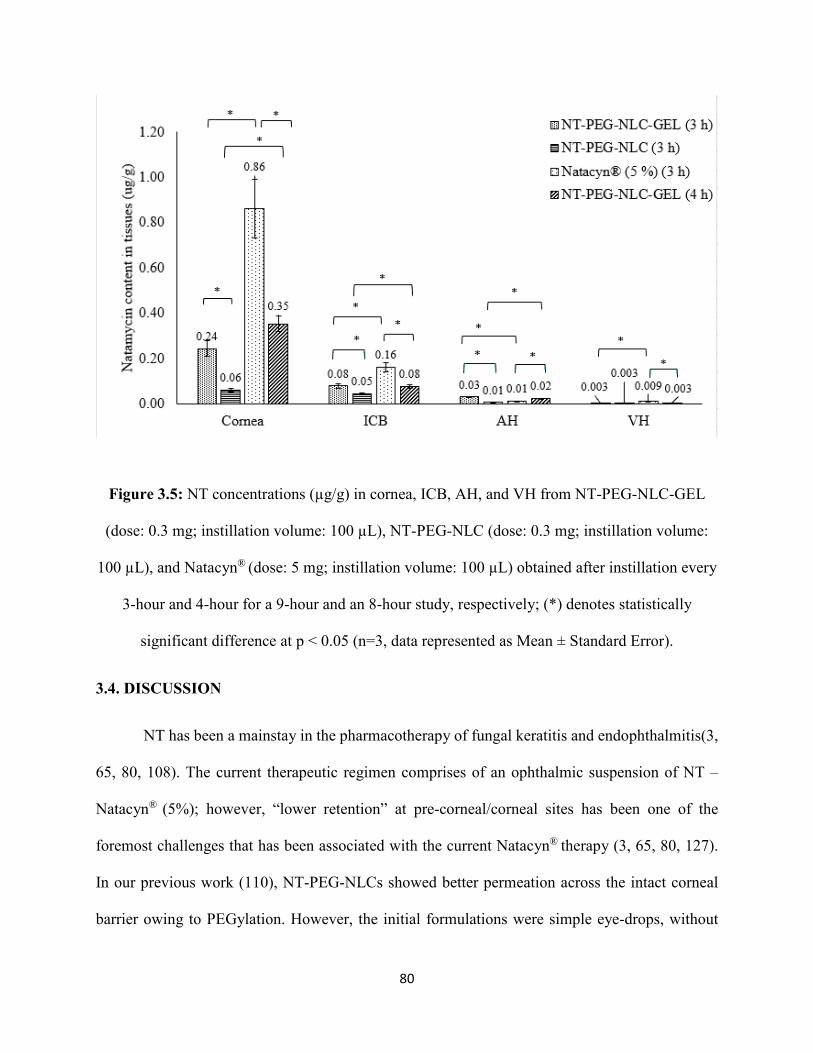
80
Figure 3.5: NT concentrations (µg/g) in cornea, ICB, AH, and VH from NT-PEG-NLC-GEL
(dose: 0.3 mg; instillation volume: 100 µL), NT-PEG-NLC (dose: 0.3 mg; instillation volume:
100 µL), and Natacyn® (dose: 5 mg; instillation volume: 100 µL) obtained after instillation every
3-hour and 4-hour for a 9-hour and an 8-hour study, respectively; (*) denotes statistically
significant difference at p < 0.05 (n=3, data represented as Mean ± Standard Error).
3.4. DISCUSSION
NT has been a mainstay in the pharmacotherapy of fungal keratitis and endophthalmitis(3,
65, 80, 108). The current therapeutic regimen comprises of an ophthalmic suspension of NT –
Natacyn® (5%); however, “lower retention” at pre-corneal/corneal sites has been one of the
foremost challenges that has been associated with the current Natacyn® therapy (3, 65, 80, 127).
In our previous work (110), NT-PEG-NLCs showed better permeation across the intact corneal
barrier owing to PEGylation. However, the initial formulations were simple eye-drops, without
81
any viscosity/mucoadhesive modifiers, and thus had lower retention at the ocular surface. Hence,
to enhance the residence at the pre-corneal/corneal sites, we sought to develop and optimize a
suitable gelling system to incorporate the NT carriers – NT-PEG-NLCs (developed and optimized
in our previous study (110)) – for topical ocular administration.
A couple of studies have reported on the design and performance of NT gelling systems
for ocular application (64, 128). The study by Janga et al., reports on the design and evaluation of
NT loaded bilosome hydrogel system intended for the back-of-the-eye delivery. In their study,
they developed and optimized system showed enhancement in transcorneal flux in vitro and in
vivo. In another study by Paradkar et al., NT loaded niosomal gel also exhibited improved
transcorneal permeation, in vitro. The fabrication processes for the formulations in both the
publications, involves the use of organic solvents (DMSO, chloroform, ethanol, and methanol)
which are known to be toxic even in residual amounts. So also, use of organic solvents makes the
scale-up of the process challenging. The amount of surfactant (Span 60) used in the formulation
of NT-loaded niosomes reported by Janga et al and Paradkar et al., is more than ~5 times the
amount of Span used in the fabrication of NT-PEG-NLC-GEL investigated in this study. Use of
such a high amount of surfactant could also lead to potential irritations/toxicities. In such a case,
the formulation investigated in this study, is without the use of any organic solvents (potentially
scalable formulation) and significantly lower amount of Span (~5 times lower), thereby
circumventing any potential toxicities/irritations in the aggravated diseased conditions. Also, to
the best of our knowledge, ours is the first study that assesses the effectiveness of a carboxyvinyl
polymer based gelling system for ocular applications by evaluating, both, pre-corneal tear PK
(front-of-the-eye delivery) and ocular biodistribution (back-of-the-eye delivery), in vivo.
In this study, different gel formulations were evaluated for their critical quality attributes
82
(CQA); first being the gelling time and gel depot collapse time. From Table 3.5, it is evident that
the gel formulations (B1, B3, B5, and B7) having low Carbopol® 940 concentration (< 0.4% w/v)
did not form a gel depot upon addition in STF. The formulations containing higher amounts of
Carbopol® 940 (0.4% w/v) formed the gel depot in STF that persisted for more than 12 hours. It is
evident that the presence of Carbopol® 940 in higher amounts (> 0.1% w/v) is essential for
maintaining the gel characteristics of the NT-PEG-NLC-GEL formulation. Therefore,
formulations B2, B4, B6, and B8, having higher concentration of Carbopol® 940 (0.4% w/v), were
selected for further evaluation of their CQA.
The second CQA was rheology and viscosity. It is recommended that the ocular gelling
systems exhibit pseudoplastic flow patterns, which implies that the gelling systems should undergo
a reduction in their viscosity upon the application of shear, i.e., exhibit a shear thinning rheology
(129). The mechanism of blinking generates shear that ranges between 10000 – 40000 1/s (129-
131). Therefore, if the gelling formulation exhibits shear-thinning rheology, the process of blinking
is not affected, avoiding any discomfort to the eye, thereby enhancing patient compliance (132).
Also, it is reported that ocular gelling systems having viscosity between 5-1000 cP, exhibit ease
of application without causing any ocular discomfort or interfering with the blinking process (132,
133). The NT-PEG-NLC-GELS exhibit a viscosity of ~500 cP at 500 1/s shear rate (20 times lower
shear than the shear generated by blinking); indicating that the viscosity would further be lower at
the blinking shear rates. Therefore, the application of a gelling system with shear-thinning
rheology, leads to a reduction in the viscosity of the gelling formulation owing to the shearing
force associated with blinking. Accordingly, all the selected gel forming formulations (B2, B4,
B6, and B8) exhibited shear-thinning rheology and a marked decrease in viscosity with increasing
shear rates (Figure 1).
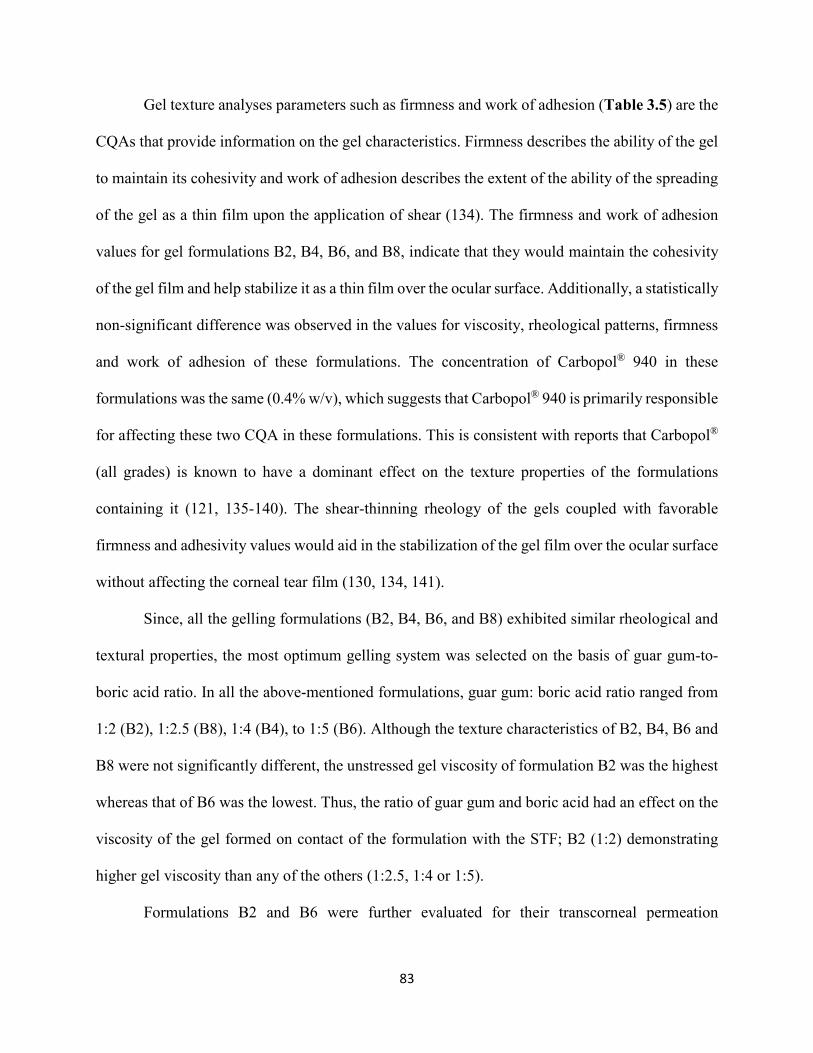
83
Gel texture analyses parameters such as firmness and work of adhesion (Table 3.5) are the
CQAs that provide information on the gel characteristics. Firmness describes the ability of the gel
to maintain its cohesivity and work of adhesion describes the extent of the ability of the spreading
of the gel as a thin film upon the application of shear (134). The firmness and work of adhesion
values for gel formulations B2, B4, B6, and B8, indicate that they would maintain the cohesivity
of the gel film and help stabilize it as a thin film over the ocular surface. Additionally, a statistically
non-significant difference was observed in the values for viscosity, rheological patterns, firmness
and work of adhesion of these formulations. The concentration of Carbopol® 940 in these
formulations was the same (0.4% w/v), which suggests that Carbopol® 940 is primarily responsible
for affecting these two CQA in these formulations. This is consistent with reports that Carbopol®
(all grades) is known to have a dominant effect on the texture properties of the formulations
containing it (121, 135-140). The shear-thinning rheology of the gels coupled with favorable
firmness and adhesivity values would aid in the stabilization of the gel film over the ocular surface
without affecting the corneal tear film (130, 134, 141).
Since, all the gelling formulations (B2, B4, B6, and B8) exhibited similar rheological and
textural properties, the most optimum gelling system was selected on the basis of guar gum-to-
boric acid ratio. In all the above-mentioned formulations, guar gum: boric acid ratio ranged from
1:2 (B2), 1:2.5 (B8), 1:4 (B4), to 1:5 (B6). Although the texture characteristics of B2, B4, B6 and
B8 were not significantly different, the unstressed gel viscosity of formulation B2 was the highest
whereas that of B6 was the lowest. Thus, the ratio of guar gum and boric acid had an effect on the
viscosity of the gel formed on contact of the formulation with the STF; B2 (1:2) demonstrating
higher gel viscosity than any of the others (1:2.5, 1:4 or 1:5).
Formulations B2 and B6 were further evaluated for their transcorneal permeation
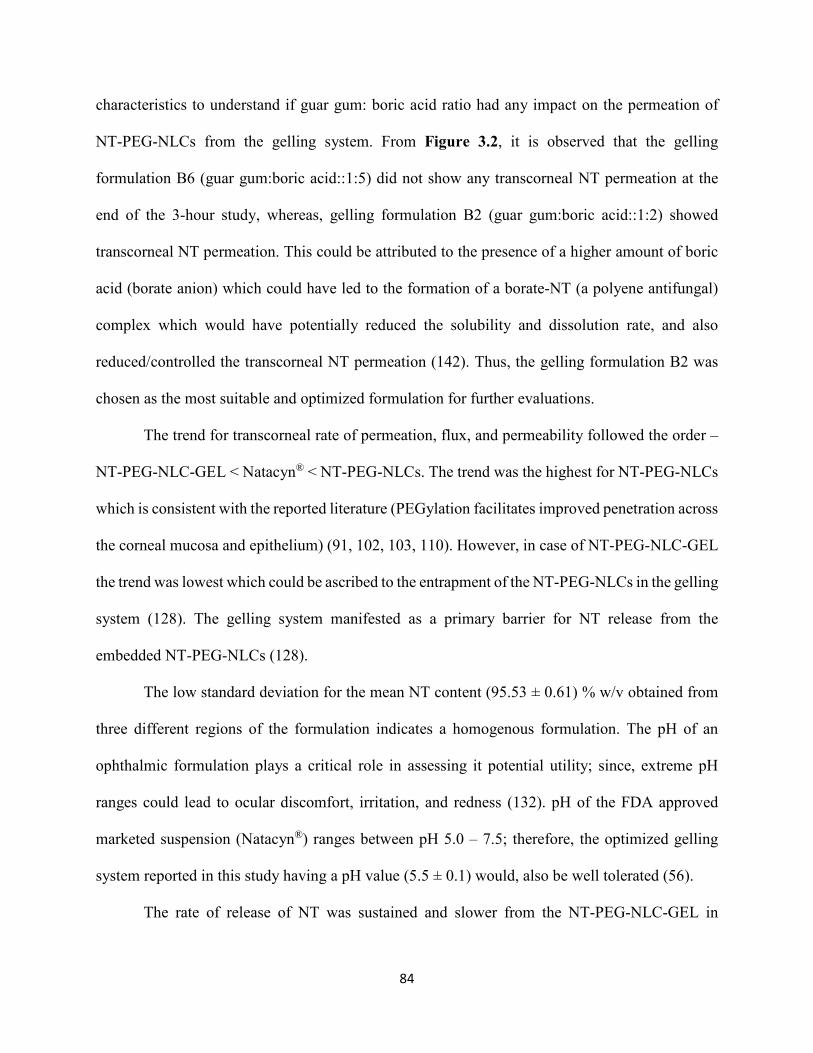
84
characteristics to understand if guar gum: boric acid ratio had any impact on the permeation of
NT-PEG-NLCs from the gelling system. From Figure 3.2, it is observed that the gelling
formulation B6 (guar gum:boric acid::1:5) did not show any transcorneal NT permeation at the
end of the 3-hour study, whereas, gelling formulation B2 (guar gum:boric acid::1:2) showed
transcorneal NT permeation. This could be attributed to the presence of a higher amount of boric
acid (borate anion) which could have led to the formation of a borate-NT (a polyene antifungal)
complex which would have potentially reduced the solubility and dissolution rate, and also
reduced/controlled the transcorneal NT permeation (142). Thus, the gelling formulation B2 was
chosen as the most suitable and optimized formulation for further evaluations.
The trend for transcorneal rate of permeation, flux, and permeability followed the order –
NT-PEG-NLC-GEL < Natacyn® < NT-PEG-NLCs. The trend was the highest for NT-PEG-NLCs
which is consistent with the reported literature (PEGylation facilitates improved penetration across
the corneal mucosa and epithelium) (91, 102, 103, 110). However, in case of NT-PEG-NLC-GEL
the trend was lowest which could be ascribed to the entrapment of the NT-PEG-NLCs in the gelling
system (128). The gelling system manifested as a primary barrier for NT release from the
embedded NT-PEG-NLCs (128).
The low standard deviation for the mean NT content (95.53 ± 0.61) % w/v obtained from
three different regions of the formulation indicates a homogenous formulation. The pH of an
ophthalmic formulation plays a critical role in assessing it potential utility; since, extreme pH
ranges could lead to ocular discomfort, irritation, and redness (132). pH of the FDA approved
marketed suspension (Natacyn®) ranges between pH 5.0 – 7.5; therefore, the optimized gelling
system reported in this study having a pH value (5.5 ± 0.1) would, also be well tolerated (56).
The rate of release of NT was sustained and slower from the NT-PEG-NLC-GEL in

85
comparison to the NT suspension (control) (Figure 3.3 (A)). A 3-fold decrease was found in the
NT release from the gelling system in comparison to the control, indicating that the entrapment of
NT in NLCs and further entrapment of the NT-PEG-NLCs in the cross-linked gelling system
sustained/slowed the release of NT from NT-PEG-NLC-GEL. The modeling of release data for
release kinetics revealed that the NT release from NT-PEG-NLC-GEL showed a better fit to
Higuchi release kinetics compared to the other release models (higher r2 value) (Figure 3.3 (B))
(143). This fit implies that assumptions of Higuchi kinetics hold true (132, 144, 145).
The tear kinetics data shows that the MRT0-∞ and T0.5 with the NT-PEG-NLC-GEL was
significantly greater than NT-PEG-NLCs indicating that the gelling system prolongs the MRT of
NT by decreasing its pre-corneal loss (Table 3.6). The dose normalized Cmax and AUC0-t values
associated with the NT-PEG-NLC-GEL was ≈ 2-folds higher than NT-PEG-NLCs. NT were
detectable in the tear until the end of 5-hours from the gelling system in contrast to NT-PEG-NLCs
wherein NT was detected until the end of 3-hours only. Interestingly, a 16-fold higher dose of NT
with the Natacyn® suspension formulation exhibited similar T0.5 and MRT values (statistically non-
significant). The dose normalized Cmax (Figure 4) and AUC0-t of NT from Natacyn® was, thus,
disproportionately ≈ 14-fold and 7-fold lower than that from NT-PEG-NLC-GEL. The NT-PEG-
NLC-GEL system at a lower dose (1/16th of Natacyn®) achieves significantly better NT PK
parameters compared to Natacyn® suggesting that NT-PEG-NLC-GEL could be a potential
alternative to Natacyn® in case of superficial fungal infections.
In our previous investigations, NT-PEG-NLCs (0.3%) showed enhanced NT permeation
across the intact corneal barrier and the NT levels from NT-PEG-NLCs were similar to the
marketed suspension (Natacyn®, 5%) in inner ocular tissues (AH, VH, and ICB), in vivo (110).
Therefore, to assess the effectiveness of the gelling formulation in NT delivery in the current ocular
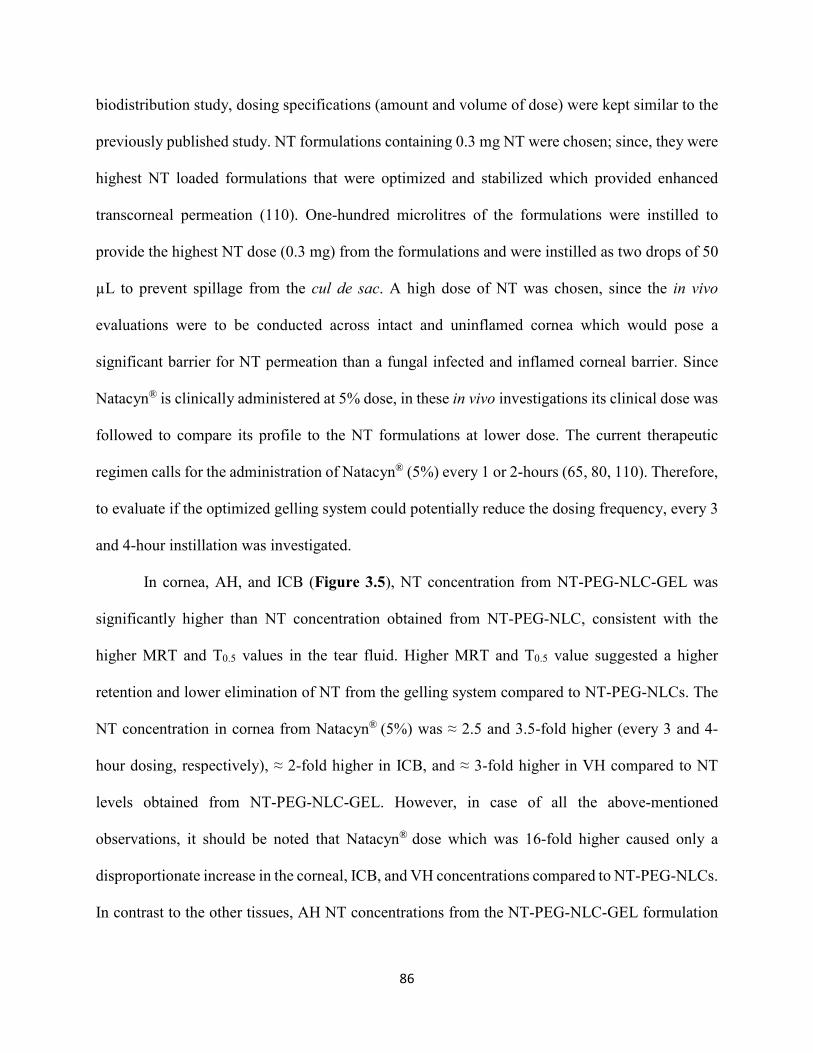
86
biodistribution study, dosing specifications (amount and volume of dose) were kept similar to the
previously published study. NT formulations containing 0.3 mg NT were chosen; since, they were
highest NT loaded formulations that were optimized and stabilized which provided enhanced
transcorneal permeation (110). One-hundred microlitres of the formulations were instilled to
provide the highest NT dose (0.3 mg) from the formulations and were instilled as two drops of 50
µL to prevent spillage from the cul de sac. A high dose of NT was chosen, since the in vivo
evaluations were to be conducted across intact and uninflamed cornea which would pose a
significant barrier for NT permeation than a fungal infected and inflamed corneal barrier. Since
Natacyn® is clinically administered at 5% dose, in these in vivo investigations its clinical dose was
followed to compare its profile to the NT formulations at lower dose. The current therapeutic
regimen calls for the administration of Natacyn® (5%) every 1 or 2-hours (65, 80, 110). Therefore,
to evaluate if the optimized gelling system could potentially reduce the dosing frequency, every 3
and 4-hour instillation was investigated.
In cornea, AH, and ICB (Figure 3.5), NT concentration from NT-PEG-NLC-GEL was
significantly higher than NT concentration obtained from NT-PEG-NLC, consistent with the
higher MRT and T0.5 values in the tear fluid. Higher MRT and T0.5 value suggested a higher
retention and lower elimination of NT from the gelling system compared to NT-PEG-NLCs. The
NT concentration in cornea from Natacyn® (5%) was ≈ 2.5 and 3.5-fold higher (every 3 and 4-
hour dosing, respectively), ≈ 2-fold higher in ICB, and ≈ 3-fold higher in VH compared to NT
levels obtained from NT-PEG-NLC-GEL. However, in case of all the above-mentioned
observations, it should be noted that Natacyn® dose which was 16-fold higher caused only a
disproportionate increase in the corneal, ICB, and VH concentrations compared to NT-PEG-NLCs.
In contrast to the other tissues, AH NT concentrations from the NT-PEG-NLC-GEL formulation

87
were 3 and 2-fold higher (for every 3 and 4-hour instillation, respectively) than Natacyn® (5%).
High MRT and T0.5 for NT-PEG-NLC-GEL coupled with the quicker diffusion of NT-PEG-NLCs
from the gelling system across the corneal and ocular barriers, owing to PEGylation, could have
led to higher NT concentrations in AH from NT-PEG-NLC-GEL in comparison to Natacyn® (5%).
3.5. CONCLUSION
The NT-PEG-NLC-GEL – composed of carboxyvinyl polymer guar gum-borate, reported
in this study could serve as a potential substitute to the suspension in cases of OFI. The optimized
NT-PEG-NLC-GEL system exhibited the formation of a gel depot that did not collapse
immediately (> 12 hours), shear thinning rheology, adequate firmness, and spreadability
(evaluated as work of adhesion). Additionally, the transcorneal permeation and release studies
indicated that the NT-PEG-NLC-GEL exhibited a lower/slower flux, rate, and sustained release of
NT in comparison to the control/s. The NT-PEG-NLC-GEL demonstrated superior pre-corneal PK
parameters and ocular biodistribution in comparison to NT-PEG-NLCs (without the gelling
components) which indicated that incorporation of the gelling agents improves the residence and
lowers the pre-corneal losses/drainage, thereby improving its effectiveness. The NT-PEG-NLC-
GEL (0.3%) attained comparable MRT and T0.5 and higher dose normalized Cmax and AUC0-t at
the pre-corneal/corneal sites and similar NT levels in the inner ocular tissues at a dose which is
about 16-fold lower than the marketed suspension (Natacyn® (5%)), indicating that it could be a
potential lower dose alternative to the conventional marketed suspension during the ocular
antifungal regimen.
CONFLICT OF INTEREST
The authors have declared no conflict of interests regarding this article.
88
ACKNOWLEDGMENTS
This research work was funded and supported by National Institute of General Medical
Sciences, National Institutes of Health (P30GM122733-01A1). The content is solely the
responsibility of the authors and does not necessarily represent the official views of the National
Institutes of Health.
89
Chapter 4
Design and In vitro – In vivo Evaluation of Eudragit™ Based Natamycin Films for
Fungal Infections of the Eye.
Abstract:
Antifungal pharmacotherapy with natamycin (NT) has been one of the foremost therapeutic
approaches utilized in the management of ocular fungal infections (OFI). Presently, Natacyn®
suspension (instilled as eye drops) is the only US-FDA approved medication that is indicated in
the treatment of OFI. However, lower retention and permeation at the ocular site are two of the
major challenges associated with the present NT therapy. Therefore, to overcome these challenges,
Eudragit™ RLPO based ocular films were designed and evaluated as potential alternative dosage
forms for ocular delivery of NT. Central Composite Design was utilized in the design and
optimization of NT-loaded films; with, amounts of Eudragit™ RLPO and amounts & grades of
the Methocel™ being the independent factors and peelability, % cumulative release, time required
for release to plateau, and thickness as the dependent variables. It was found that all the three
independent factors affected the dependent variables significantly which was further elucidated by
one-factor interaction plots. An optimized film formulation (NT-film-14) was selected on the bases
of the constraints and interaction plots; and, it exhibited significantly higher transcorneal
permeation (ex vivo) and superior pharmacokinetic parameters (in vivo) in comparison to the
marketed suspension – Natacyn®. These observations imply that, NT-loaded films could be
explored as alternative dosage forms in the management of OFI.
90
4.1. INTRODUCTION
Polyene (natamycin and amphotericin B) and azole (fluconazole, ketoconazole,
voriconazole) class of antifungal drugs have been routinely used as therapeutic agents in the
management of ocular fungal infections (OFI) (109). Amongst these antifungal agents, natamycin
(NT) has been the only US FDA approved antifungal agent for the management of OFI (108). It
is marketed as a supersaturated ophthalmic suspension that is applied topically at the ocular
surface. The reason that NT is the only approved medication for OFI pharmacotherapy is attributed
to its better safety/tolerability profile upon topical administration and its selective potent activity
against filamentous fungal species, compared to the other antifungal agents (80).
Despite these favorable aspects associated with NT therapy, there are challenges associated
with the ocular delivery of NT in the treatment of superior and deep-seated OFI. One of the major
challenges with the therapy is the higher precorneal losses since it is instilled topically in the form
of eye drops. These losses result in the poor ocular bioavailability of the suspension which
necessitates frequent administration which results in poor patient compliance, increased cost of
therapy, and higher chances of untoward side-effects (80, 109, 110).
In recent times, films have come to be investigated as potential drug delivery platforms for
the delivery of therapeutic agents at the ocular site. These ocular films offer advantages such as
ease of administration, greater accuracy in dosing, prolonged retention at the ocular site,
sustained/controlled drug release, lowered precorneal losses, and superior ocular pharmacokinetic
parameters in comparison to the conventional topical ocular dosage forms such as suspensions and
solutions (146, 147).
Ocular films for the delivery of therapeutics such as acetazolamide, diclofenac sodium,
timolol maleate, ofloxacin, ciprofloxacin, levofloxacin, dorzolamide hydrochloride, triamcinolone
91
acetonide, and naphazoline hydrochloride have been reported in literature (146, 148-152).
Amongst all these, triamcinolone acetonide, diclofenac sodium, and acetazolamide loaded ocular
films have been evaluated for their feasibility to deliver the drugs at their intended ocular site of
action. Tatke et al. reported the development of triamcinolone acetonide (TA) ocular films using
polyethylene oxide (PEO) and Soluplus® and these films exhibited significantly higher TA
concentration in the back-of-the-eye in comparison to the control (TA suspension) (153).
Similarly, in the study reported by Adelli et al., PEO and Duolite® AP 143/1083 based polymeric
films containing diclofenac sodium (DS) could provide higher DS concentrations in the anterior
ocular chamber compared to the DS suspension (154). Acetazolamide loaded ocular films
composed of carbopol® 974P, sodium carboxymethylcellulose, and poloxamer lowered intraocular
pressure in normotensive rabbits thereby exhibiting their effectiveness (150).
Therefore, to potentially improve the therapy associated with NT in OFI, we sought to
design ocular films containing NT. In the current study, Eudragit™ RLPO based NT loaded ocular
films were designed and optimized using a central composite design and the optimized film was
evaluated in vitro, ex vivo, and in vivo to assess its effectiveness in the delivery of NT at the ocular
site.
4.2. MATERIALS AND METHODS
Chemicals
NT was purchased from Cayman Chemicals (Michigan, USA). Eudragit™ RLPO was
kindly gifted by Evonik Corporation (New Jersey, USA); Methocel™ K15M premium
hydroxypropyl cellulose (HPMC K15M; mol wt.: 750 kDa) and Methocel™ K4M CR
hydroxypropyl cellulose (HPMC K4M; mol wt.: 500 kDa) were gifted by Colorcon Corporation
(Pennsylvania, USA). Propylene glycol was purchased from Fisher Scientific (New Jersey, USA).
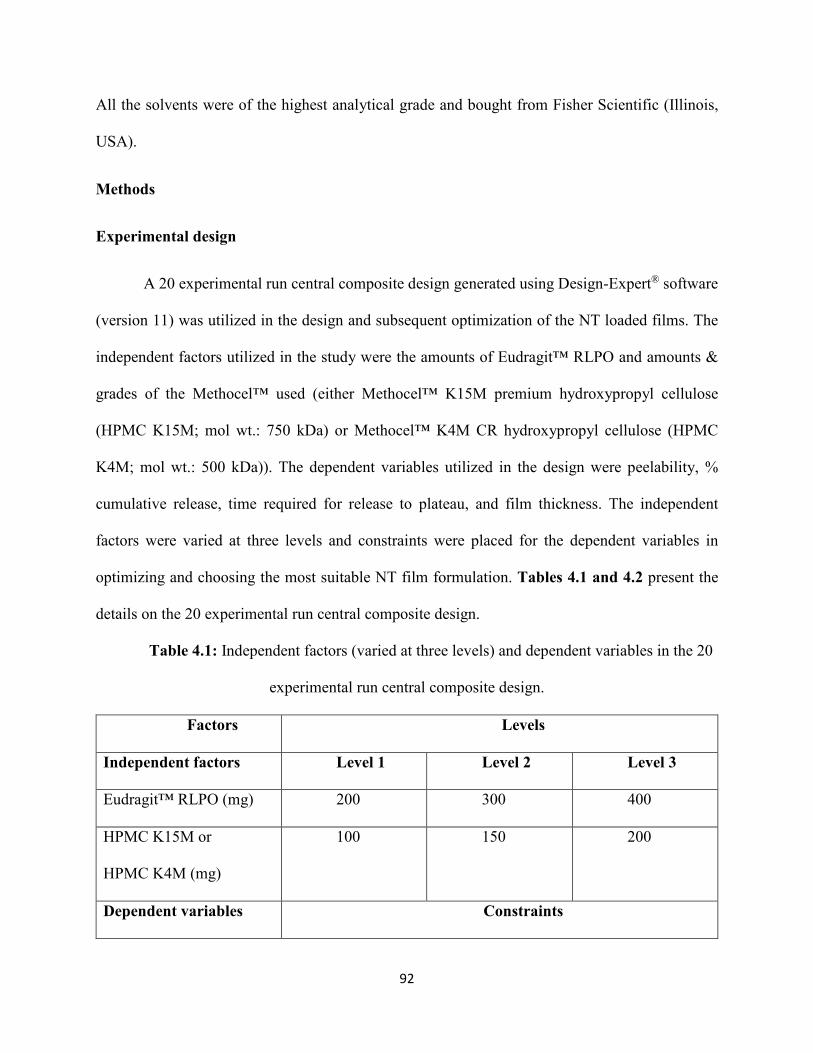
92
All the solvents were of the highest analytical grade and bought from Fisher Scientific (Illinois,
USA).
Methods
Experimental design
A 20 experimental run central composite design generated using Design-Expert® software
(version 11) was utilized in the design and subsequent optimization of the NT loaded films. The
independent factors utilized in the study were the amounts of Eudragit™ RLPO and amounts &
grades of the Methocel™ used (either Methocel™ K15M premium hydroxypropyl cellulose
(HPMC K15M; mol wt.: 750 kDa) or Methocel™ K4M CR hydroxypropyl cellulose (HPMC
K4M; mol wt.: 500 kDa)). The dependent variables utilized in the design were peelability, %
cumulative release, time required for release to plateau, and film thickness. The independent
factors were varied at three levels and constraints were placed for the dependent variables in
optimizing and choosing the most suitable NT film formulation. Tables 4.1 and 4.2 present the
details on the 20 experimental run central composite design.
Table 4.1: Independent factors (varied at three levels) and dependent variables in the 20
experimental run central composite design.
Factors Levels
Independent factors Level 1 Level 2 Level 3
Eudragit™ RLPO (mg) 200 300 400
HPMC K15M or
HPMC K4M (mg)
100 150 200
Dependent variables Constraints
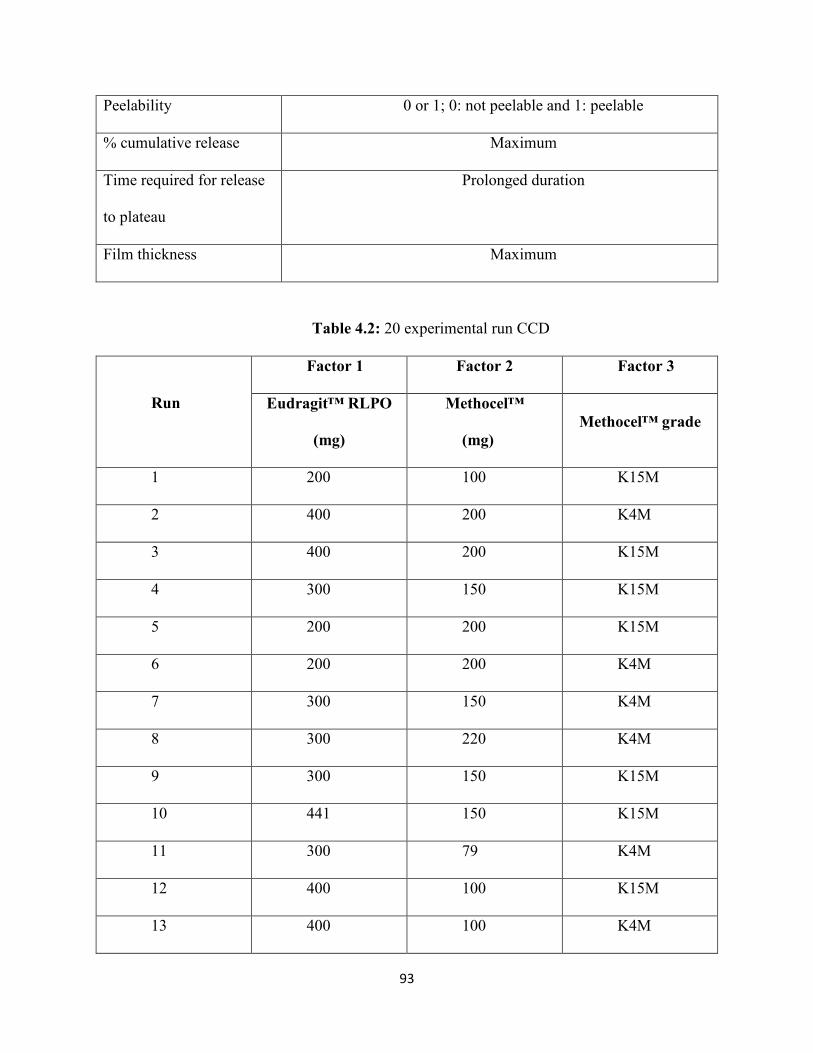
93
Peelability 0 or 1; 0: not peelable and 1: peelable
% cumulative release Maximum
Time required for release
to plateau
Prolonged duration
Film thickness Maximum
Table 4.2: 20 experimental run CCD
Run
Factor 1 Factor 2 Factor 3
Eudragit™ RLPO
(mg)
Methocel™
(mg)
Methocel™ grade
1 200 100 K15M
2 400 200 K4M
3 400 200 K15M
4 300 150 K15M
5 200 200 K15M
6 200 200 K4M
7 300 150 K4M
8 300 220 K4M
9 300 150 K15M
10 441 150 K15M
11 300 79 K4M
12 400 100 K15M
13 400 100 K4M
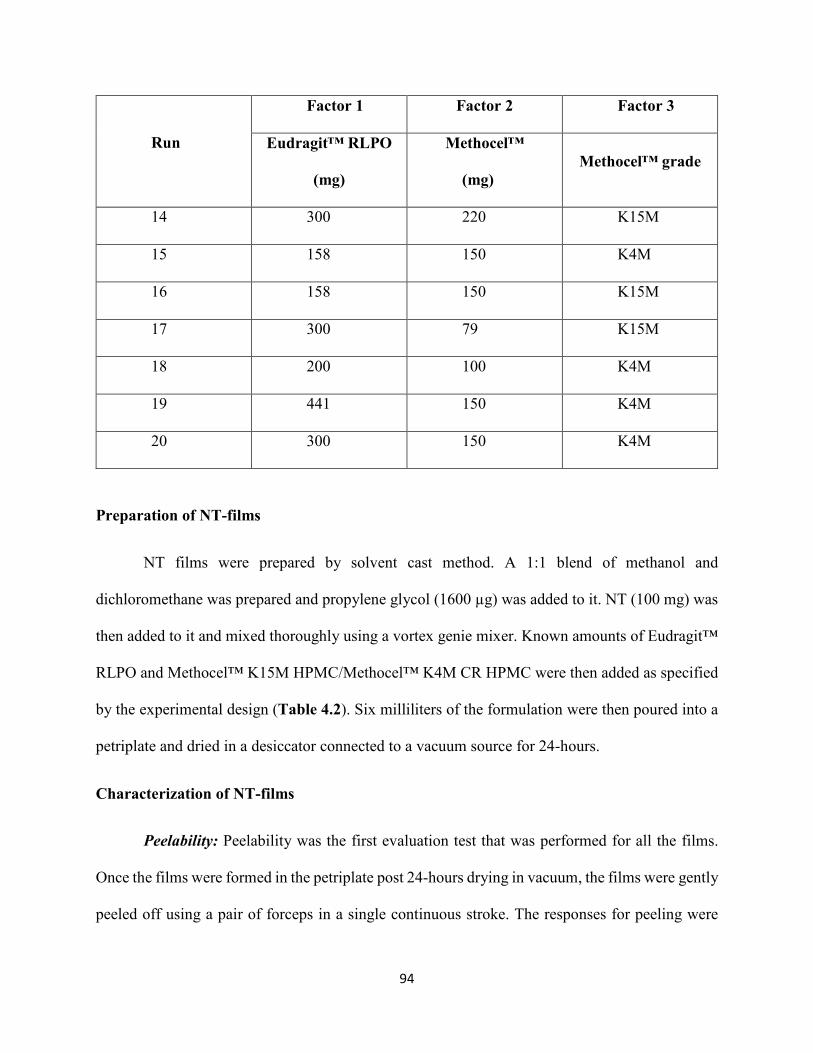
94
Run
Factor 1 Factor 2 Factor 3
Eudragit™ RLPO
(mg)
Methocel™
(mg)
Methocel™ grade
14 300 220 K15M
15 158 150 K4M
16 158 150 K15M
17 300 79 K15M
18 200 100 K4M
19 441 150 K4M
20 300 150 K4M
Preparation of NT-films
NT films were prepared by solvent cast method. A 1:1 blend of methanol and
dichloromethane was prepared and propylene glycol (1600 µg) was added to it. NT (100 mg) was
then added to it and mixed thoroughly using a vortex genie mixer. Known amounts of Eudragit™
RLPO and Methocel™ K15M HPMC/Methocel™ K4M CR HPMC were then added as specified
by the experimental design (Table 4.2). Six milliliters of the formulation were then poured into a
petriplate and dried in a desiccator connected to a vacuum source for 24-hours.
Characterization of NT-films
Peelability: Peelability was the first evaluation test that was performed for all the films.
Once the films were formed in the petriplate post 24-hours drying in vacuum, the films were gently
peeled off using a pair of forceps in a single continuous stroke. The responses for peeling were
95
recorded as 0 or 1; with 0 being the inability of the films to be peeled without breaking and 1 being
the easy peelability of the films without any breaking/damage in a single continuous stroke.
NT content in NT-films: A film of dimension 1cm2 was cut and added into one milliliter
of extracting solvent blend containing methanol: dichloromethane (1:1). It was then mixed using
a vortex genie mixer and centrifuged at 13,000 rpm for 10 minutes on a table-top centrifuge and
the supernatant was analyzed for NT using a validated HPLC method, that is outlined in the
analytical method section subsequently.
Release studies: NT release was evaluated for all the films that passed the peelability test.
For the in vitro release studies, simulated tear fluid (STF; NaCl (0.68% w/v), NaHCO3 (0.22%
w/v), CaCl2 (0.008% w/v), and KCl (0.140% w/v) in deionized water) was used as the release
medium. In vitro release protocols for ocular films outlined by Adelli et al. and Tatke et al., were
followed for evaluating the NT release from films in this study (153, 155). NT-films were placed
at the bottom of glass scintillation vials and a brass mesh of sieve size #10 was positioned on top
of the film with a small magnetic stirrer placed above the mesh. 20-mL of STF was then added
into the glass scintillation vials. The entire release setup was maintained at a temperature of 34 ±
0.2°C with continuous magnetic stirring. At pre-determined time points, 1 mL aliquots were
withdrawn and replenished with an equal amount of STF. NT concentration was analyzed using a
validated HPLC method, as discussed in the subsequent analytical section. % cumulative release
and time required for the release to plateau were evaluated from the in vitro NT release data.
Thickness: Film thickness was evaluated for all the films that passed the peelability test
and could be peeled off. For determining the film thickness, entire film peeled off the petriplate
was used. The thickness was evaluated using General UltraTech® calipers. Three independent
measurements were taken at different positions on the entire film area.
96
Interaction between independent factors and dependent variables (selection of the most
optimized formulation): For evaluating and understanding the interaction between independent
factors and dependent variables, one-factor plots were developed using Design Expert® software
(version 11). These plots further aided in the selection of the most suitable NT-film formulation.
pH: pH of the selected NT-film-14 was evaluated using Mettler Toledo pH meter
(Belgium). Briefly, the films were cut into 1cm2 dimension and soaked placed into 3 mL of STF
(pH = 7.4) and the surface pH was then measured.
Transcorneal permeation: Isolated rabbit cornea (Pel-Freez Biologicals®, Arkansas, USA)
were used to assess the transcorneal flux, permeability, and permeation rate of NT from the
optimized NT-film-14 and Natacyn®. The isolated rabbit corneas were mounted on vertical Franz
diffusion cells (PermeGear®, Inc.) and clamped between the donor and receiver compartments.
The corneal epithelial surface faced the donor cell in which the formulations were placed. NT-
film-14 (1 cm2; containing 2 mg of NT dose) and five hundred microliters of Natacyn® (containing
25 mg of NT dose) were the test formulations that were placed in the donor chamber (n=3). The
receiver medium consisted of 5 mL of 2.5% w/v randomly methylated-β-cyclodextrin (RMBCD)
in Dulbecco's Phosphate-Buffered Saline (DPBS) which helped in preserving the corneal integrity
and maintaining sink conditions during the study. The medium in the receiver compartment was
stirred continuously using a magnetic stirrer (123, 124). Over the 3-hours duration of the study,
600 μL aliquots were withdrawn at designated time intervals and replaced with an equal volume
of RMBCD in DPBS. NT concentration was quantified using the HPLC analytical method outlined
in the subsequent analytical methods section.
In vivo pre-corneal tear pharmacokinetics (PK): Male New Zealand White (NZW)
Rabbits (3-3.5 kg), were purchased from Charles River Labs and were used in the evaluation of
97
pre-corneal tear PK of NT-films and the marketed control – Natacyn®. Tenets of the Association
for Research in Vision and Ophthalmology statement on the use of animals in ophthalmic vision
and research and the University of Mississippi Institutional Animal Care and Use Committee
approved protocols were followed during the in vivo animal studies. NT-film-14 (1 cm2) was
instilled in the lower cul-de-sac of the rabbit and Natacyn® was topically dosed (100 µL
administered as two drops of 50 µL each) in triplicates (n=3). Therefore, amount of NT dose
received by the rabbits was 2 mg (for NT-film-14) and 5 mg (for Natacyn®). At designated time
points (t = 0, 0.5, 1, 2, 3, 4, 5, and 6 hours) by gently touching a pre-weighed piece of filter paper
at the corneal surface tear bio-samples were collected. The estimation of NT from the tear bio-
samples was estimated using the amount of tear fluid collected (determined by calculating the
difference in the dry and wet weights of the filter paper before and after tear collection).
NT from the biosamples was extracted using six hundred microliters of ice-cold methanol,
mixed using a vortex genie mixer, and centrifuged at 13,000 rpm for 15 minutes. The supernatant
was then collected and evaluated for NT content using the HPLC method outlined in the
subsequent section (analytical methods). The data was then analyzed using PKSolver software 2.0
for determining the various PK parameters (126).
Analytical methods
Determination and quantification of NT was performed using a validated HPLC method.
The HPLC analytical system comprised of a Waters 717 plus auto-sampler attached to a Waters
2487 Dual λ Absorbance UV detector, a Waters 600 controller pump, and an Agilent 3395
Integrator. A mixture of phosphate buffer (0.2 M, pH 5.5) and acetonitrile (70:30) with flow rate
of 1 mL/min was used the mobile phase and a C18 Phenomenex Luna® (5µ, 250 x 4.6 mm) column
was used for the chromatographic separation. The injection volume was 20 µL, with detection
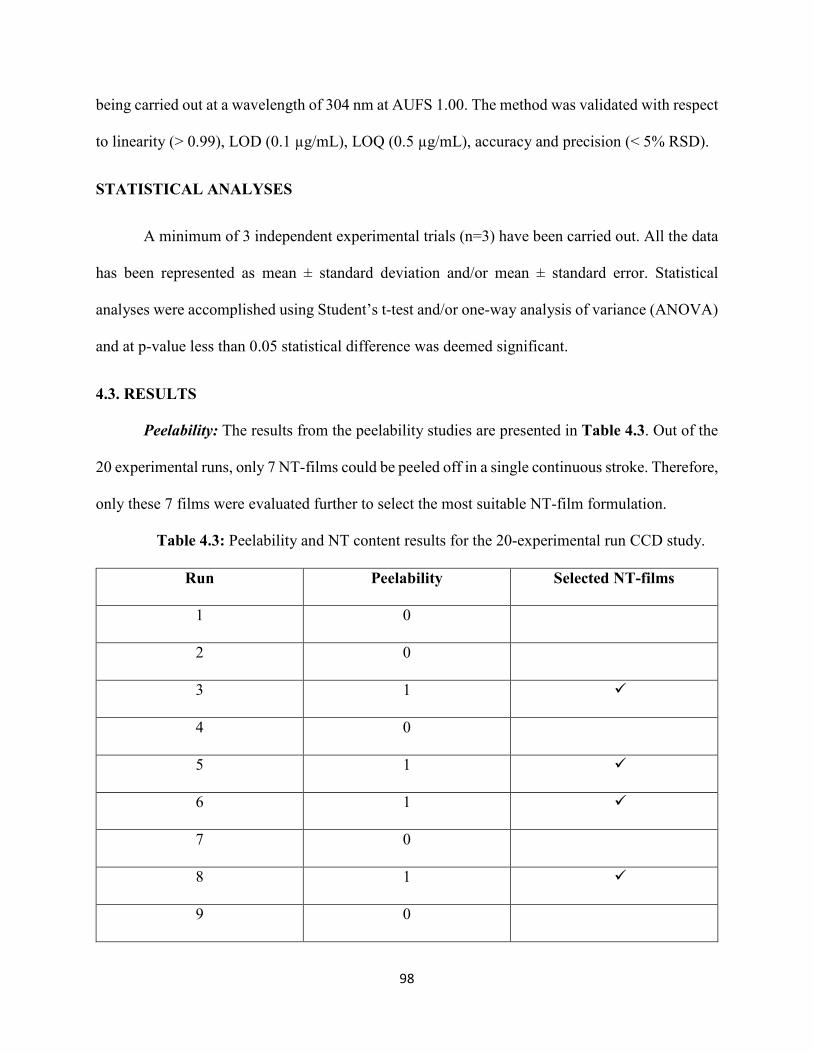
98
being carried out at a wavelength of 304 nm at AUFS 1.00. The method was validated with respect
to linearity (> 0.99), LOD (0.1 µg/mL), LOQ (0.5 µg/mL), accuracy and precision (< 5% RSD).
STATISTICAL ANALYSES
A minimum of 3 independent experimental trials (n=3) have been carried out. All the data
has been represented as mean ± standard deviation and/or mean ± standard error. Statistical
analyses were accomplished using Student’s t-test and/or one-way analysis of variance (ANOVA)
and at p-value less than 0.05 statistical difference was deemed significant.
4.3. RESULTS
Peelability: The results from the peelability studies are presented in Table 4.3. Out of the
20 experimental runs, only 7 NT-films could be peeled off in a single continuous stroke. Therefore,
only these 7 films were evaluated further to select the most suitable NT-film formulation.
Table 4.3: Peelability and NT content results for the 20-experimental run CCD study.
Run Peelability Selected NT-films
1 0
2 0
3 1 �
4 0
5 1 �
6 1 �
7 0
8 1 �
9 0
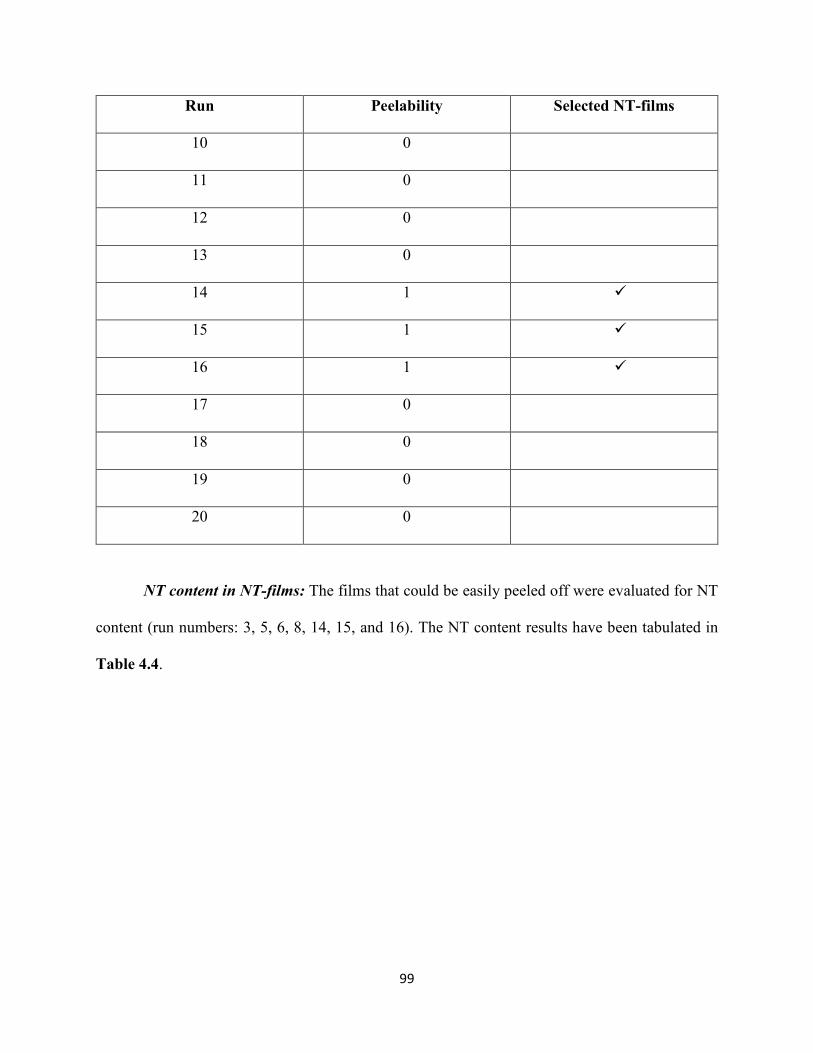
99
Run Peelability Selected NT-films
10 0
11 0
12 0
13 0
14 1 �
15 1 �
16 1 �
17 0
18 0
19 0
20 0
NT content in NT-films: The films that could be easily peeled off were evaluated for NT
content (run numbers: 3, 5, 6, 8, 14, 15, and 16). The NT content results have been tabulated in
Table 4.4.
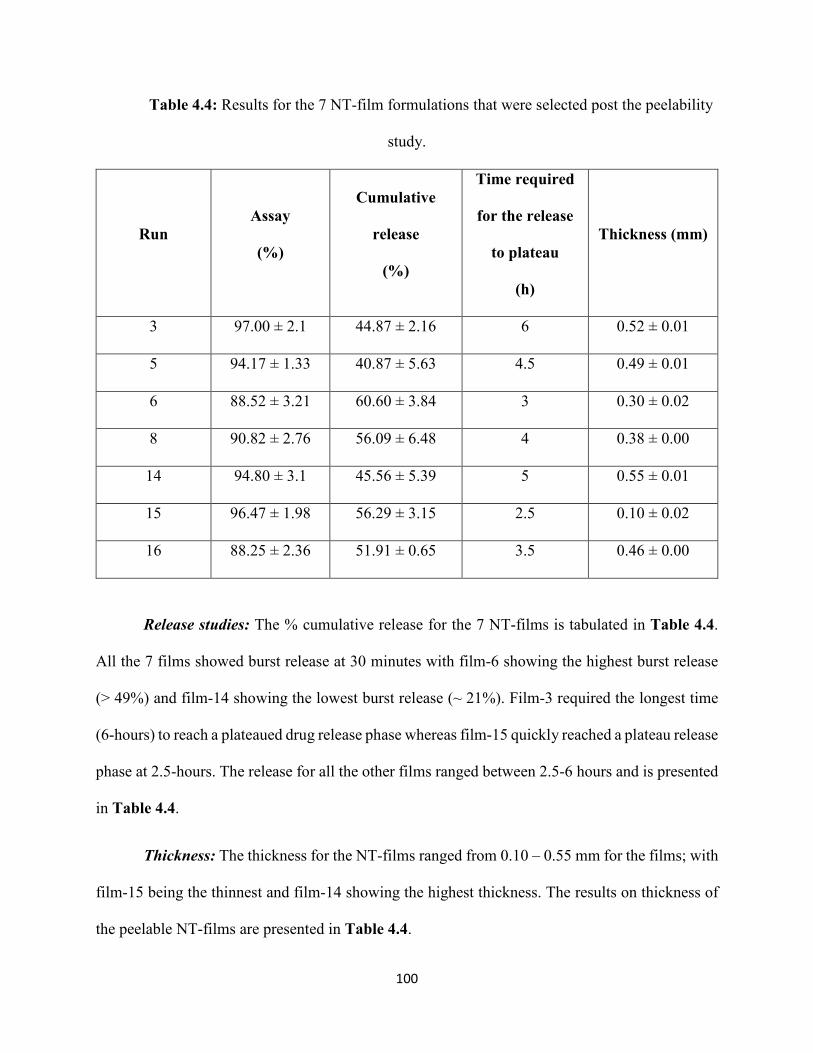
100
Table 4.4: Results for the 7 NT-film formulations that were selected post the peelability
study.
Run
Assay
(%)
Cumulative
release
(%)
Time required
for the release
to plateau
(h)
Thickness (mm)
3 97.00 ± 2.1 44.87 ± 2.16 6 0.52 ± 0.01
5 94.17 ± 1.33 40.87 ± 5.63 4.5 0.49 ± 0.01
6 88.52 ± 3.21 60.60 ± 3.84 3 0.30 ± 0.02
8 90.82 ± 2.76 56.09 ± 6.48 4 0.38 ± 0.00
14 94.80 ± 3.1 45.56 ± 5.39 5 0.55 ± 0.01
15 96.47 ± 1.98 56.29 ± 3.15 2.5 0.10 ± 0.02
16 88.25 ± 2.36 51.91 ± 0.65 3.5 0.46 ± 0.00
Release studies: The % cumulative release for the 7 NT-films is tabulated in Table 4.4.
All the 7 films showed burst release at 30 minutes with film-6 showing the highest burst release
(> 49%) and film-14 showing the lowest burst release (~ 21%). Film-3 required the longest time
(6-hours) to reach a plateaued drug release phase whereas film-15 quickly reached a plateau release
phase at 2.5-hours. The release for all the other films ranged between 2.5-6 hours and is presented
in Table 4.4.
Thickness: The thickness for the NT-films ranged from 0.10 – 0.55 mm for the films; with
film-15 being the thinnest and film-14 showing the highest thickness. The results on thickness of
the peelable NT-films are presented in Table 4.4.
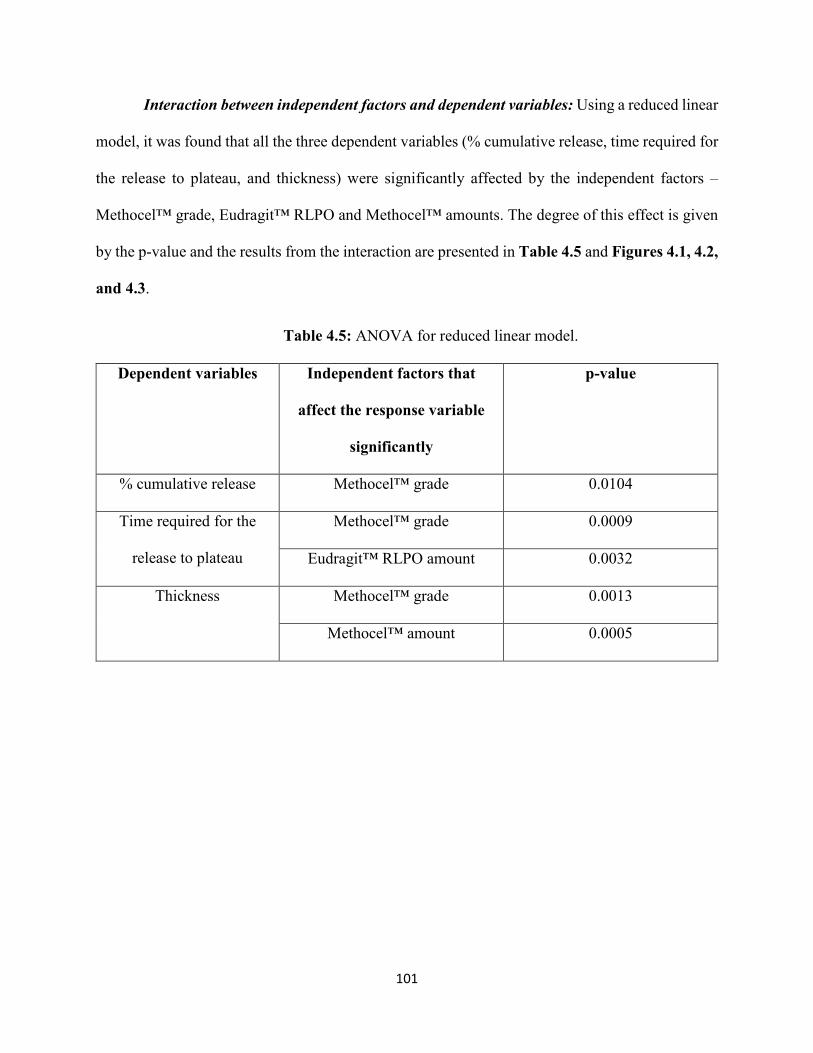
101
Interaction between independent factors and dependent variables: Using a reduced linear
model, it was found that all the three dependent variables (% cumulative release, time required for
the release to plateau, and thickness) were significantly affected by the independent factors –
Methocel™ grade, Eudragit™ RLPO and Methocel™ amounts. The degree of this effect is given
by the p-value and the results from the interaction are presented in Table 4.5 and Figures 4.1, 4.2,
and 4.3.
Table 4.5: ANOVA for reduced linear model.
Dependent variables Independent factors that
affect the response variable
significantly
p-value
% cumulative release Methocel™ grade 0.0104
Time required for the
release to plateau
Methocel™ grade 0.0009
Eudragit™ RLPO amount 0.0032
Thickness Methocel™ grade 0.0013
Methocel™ amount 0.0005
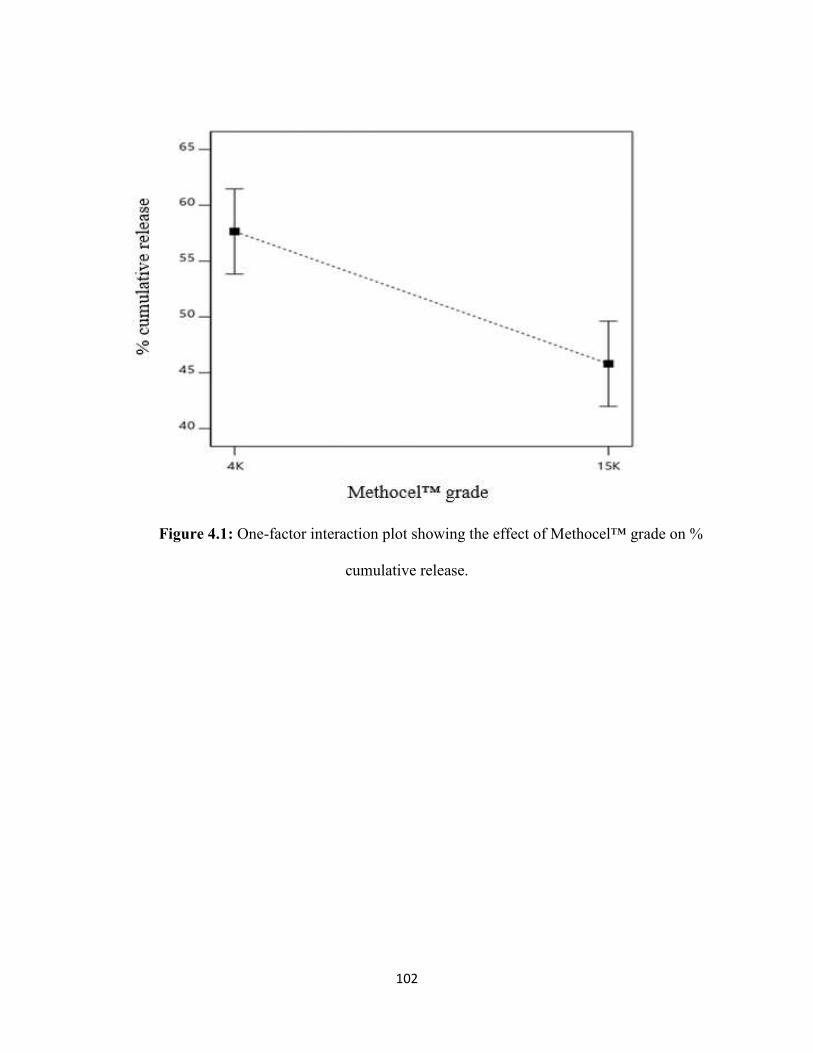
102
Figure 4.1: One-factor interaction plot showing the effect of Methocel™ grade on %
cumulative release.
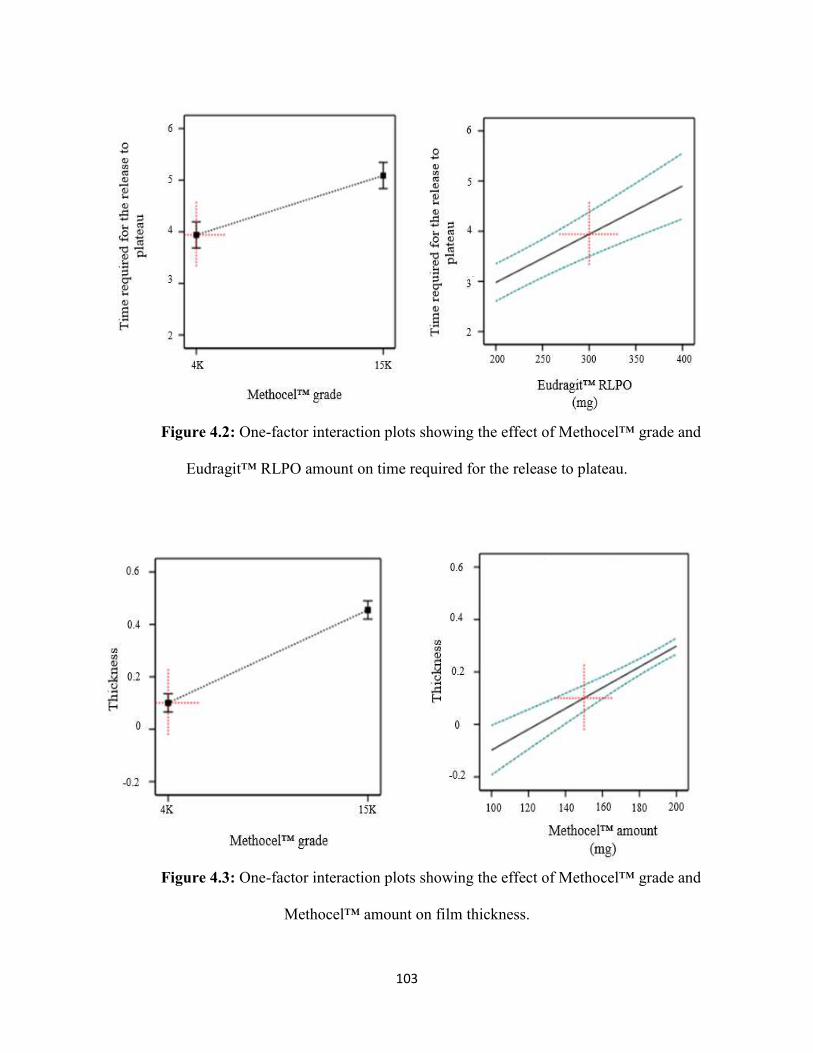
103
Figure 4.2: One-factor interaction plots showing the effect of Methocel™ grade and
Eudragit™ RLPO amount on time required for the release to plateau.
Figure 4.3: One-factor interaction plots showing the effect of Methocel™ grade and
Methocel™ amount on film thickness.
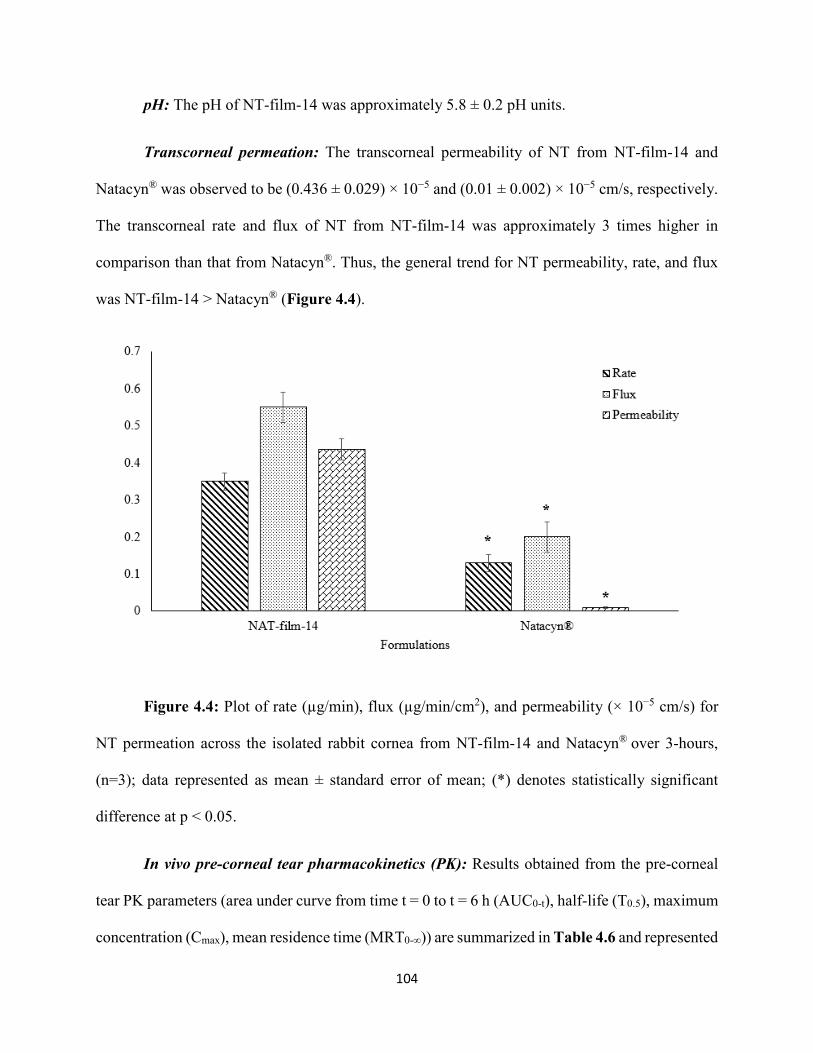
104
pH: The pH of NT-film-14 was approximately 5.8 ± 0.2 pH units.
Transcorneal permeation: The transcorneal permeability of NT from NT-film-14 and
Natacyn® was observed to be (0.436 ± 0.029) × 10−5 and (0.01 ± 0.002) × 10−5 cm/s, respectively.
The transcorneal rate and flux of NT from NT-film-14 was approximately 3 times higher in
comparison than that from Natacyn®. Thus, the general trend for NT permeability, rate, and flux
was NT-film-14 > Natacyn® (Figure 4.4).
Figure 4.4: Plot of rate (µg/min), flux (µg/min/cm2), and permeability (× 10−5 cm/s) for
NT permeation across the isolated rabbit cornea from NT-film-14 and Natacyn® over 3-hours,
(n=3); data represented as mean ± standard error of mean; (*) denotes statistically significant
difference at p < 0.05.
In vivo pre-corneal tear pharmacokinetics (PK): Results obtained from the pre-corneal
tear PK parameters (area under curve from time t = 0 to t = 6 h (AUC0-t), half-life (T0.5), maximum
concentration (Cmax), mean residence time (MRT0-∞)) are summarized in Table 4.6 and represented
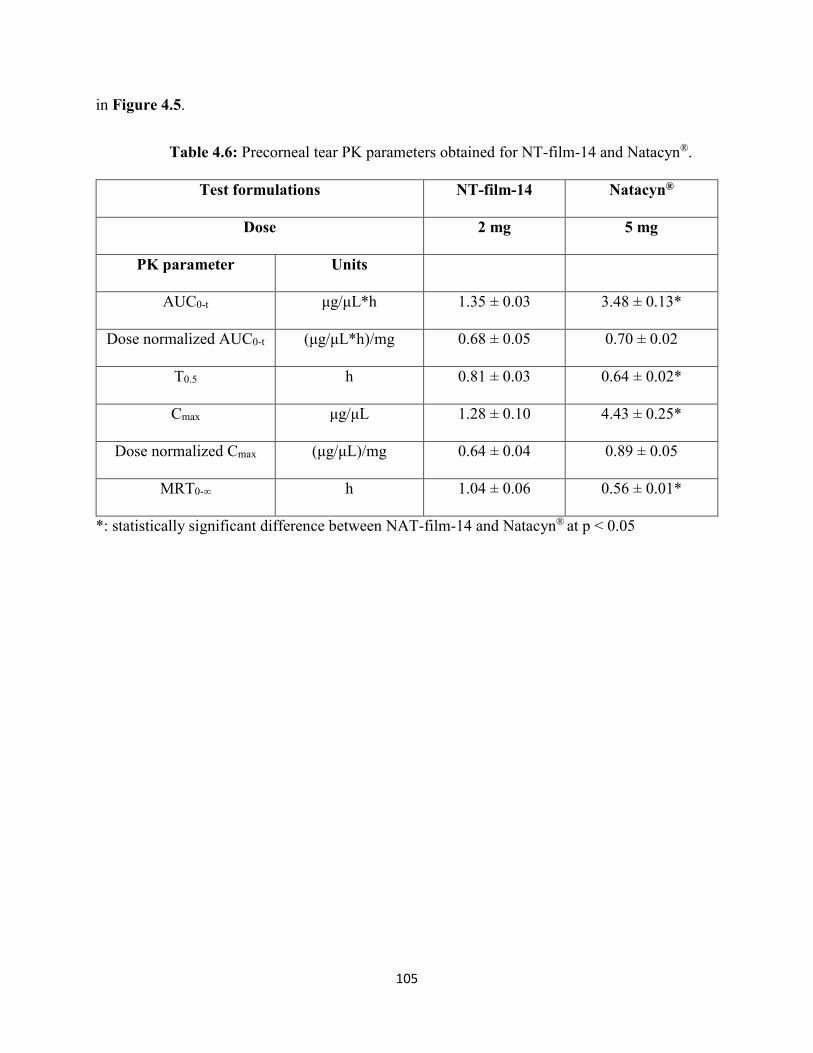
105
in Figure 4.5.
Table 4.6: Precorneal tear PK parameters obtained for NT-film-14 and Natacyn®.
Test formulations NT-film-14 Natacyn®
Dose 2 mg 5 mg
PK parameter Units
AUC0-t μg/μL*h 1.35 ± 0.03 3.48 ± 0.13*
Dose normalized AUC0-t (μg/μL*h)/mg 0.68 ± 0.05 0.70 ± 0.02
T0.5 h 0.81 ± 0.03 0.64 ± 0.02*
Cmax μg/μL 1.28 ± 0.10 4.43 ± 0.25*
Dose normalized Cmax (μg/μL)/mg 0.64 ± 0.04 0.89 ± 0.05
MRT0-∞ h 1.04 ± 0.06 0.56 ± 0.01*
*: statistically significant difference between NAT-film-14 and Natacyn® at p < 0.05
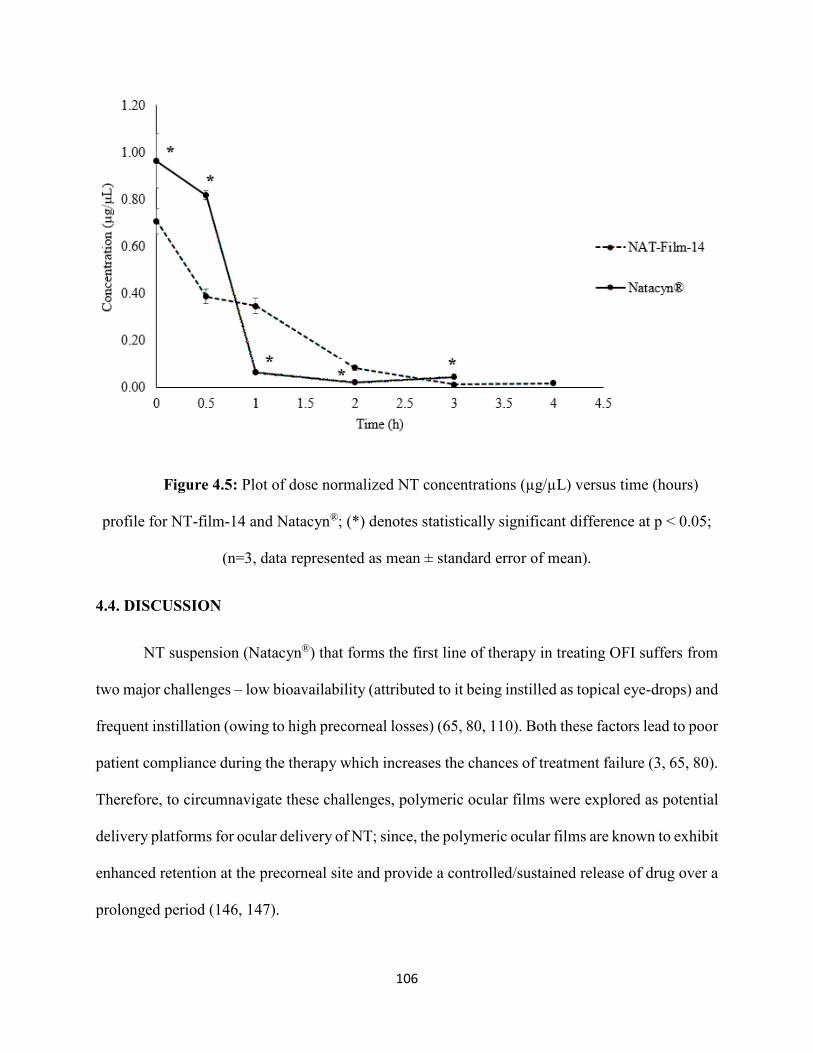
106
Figure 4.5: Plot of dose normalized NT concentrations (µg/µL) versus time (hours)
profile for NT-film-14 and Natacyn®; (*) denotes statistically significant difference at p < 0.05;
(n=3, data represented as mean ± standard error of mean).
4.4. DISCUSSION
NT suspension (Natacyn®) that forms the first line of therapy in treating OFI suffers from
two major challenges – low bioavailability (attributed to it being instilled as topical eye-drops) and
frequent instillation (owing to high precorneal losses) (65, 80, 110). Both these factors lead to poor
patient compliance during the therapy which increases the chances of treatment failure (3, 65, 80).
Therefore, to circumnavigate these challenges, polymeric ocular films were explored as potential
delivery platforms for ocular delivery of NT; since, the polymeric ocular films are known to exhibit
enhanced retention at the precorneal site and provide a controlled/sustained release of drug over a
prolonged period (146, 147).
107
Eudragit™ polymers have been widely used in various drug delivery systems owing to
their non-toxicity, pH sensitive drug release, their ability to provide controlled/sustained release,
and their mucoadhesivity (the positively charged groups in Eudragit™ polymers interact with the
negativity charged mucus layer on the ocular surface to provide mucoadhesion) leading to
improved ocular/precorneal retention (156, 157). Amongst all the Eudragit™ grades, Eudragit™
RLPO has been evaluated for its safety and toxicity upon ocular application and it was found that
Eudragit™ RLPO did not elicit any untoward unsafe/toxic reaction in the eye and showed
improved ocular retention owing to their mucoadhesive nature (158). Owing to these features,
Eudragit™ RLPO was utilized as a mucoadhesive polymer in the fabrication of NT ocular films
in this study.
Methocel™ or HPMC has been widely used in the design of various polymeric dosage
forms and has been primarily used as a retardant to aid in controlling/sustaining the release of drug
in the dosage form. HPMC has been categorized as a ‘generally recognized as safe’ additive
(GRAS)’ in formulations and has also been used in numerous ocular formulations intended for dry
eye disease and glaucoma (159, 160). Owing to these reasons, HPMC and its two grades (HPMC
K15M (high molecular weight; high viscosity) and HPMC K4M (low molecular weight; low
viscosity)) were evaluated as retardants in the fabrication of NT films. Also, from amongst the two
evaluated HPMC grades, one HPMC grade providing a suitable NT release (good retardant ability)
was selected in the selection of the most suitable NT film.
Plasticizers have been used in the preparation of films to improve the film forming ability,
impart flexibility, and reduce brittleness (161). Propylene glycol has been one of the most
commonly used plasticizers; and, has been chosen in this study since it is a GRAS additive and
has been used in ophthalmic formulations (162, 163).
108
To select the most suitable NT-film formulation, a central composite design was utilized
with independent factors and dependent variables specified in the design. Since a
controlled/sustained release over a prolonged duration (with the intent to reduce the frequent
dosing that is associated with the conventional Natacyn® therapy) was warranted from the NT
polymeric film, % cumulative release and time required for release to plateau were chosen as the
dependent variables. The thickness of the film also is known to affect drug release profile and
therefore was incorporated as a dependent variable in the study. All these variables would be
affected by the film forming polymers – Eudragit™ RLPO and Methocel™ (their amounts and
grade) and were therefore selected as independent factors.
Percent cumulative release was found to be significantly affected by Methocel™ grade
(HPMC 4K vs 15K) (Table 4.5; Figure 4.1). The % cumulative release was higher with 4K grade
of Methocel™ in comparison to the 15K grade. This could be attributed to the fact that the 4K
grade has a lower molecular weight and viscosity than the 15K grade. As of result of this, the 15K
grade would induce greater chain entanglement than the 4K grade of Methocel™ which would
exhibit lower chain entanglement owing to a comparatively lower viscosity and molecular weight
(164, 165). Hence, higher viscosity polymers (15K grade) would lead to the formation of thicker
gel layer after hydration in the ocular milieu causing a more retarded/controlled NT release than
lower viscosity (4K) grade Methocel™.
Methocel™ grade and amount of Eudragit™ RLPO were both found to have a significant
effect on the time required for the release to plateau (Table 4.5; Figure 4.2). Methocel™ 4K grade
showed a shorter duration for the release to plateau whereas 15K grade took a longer duration for
the release to plateau. This could be attributed to the fact that 15K grade (higher viscosity and
molecular weight) led to the formation of highly entangled and cross-linked gel-matrix upon
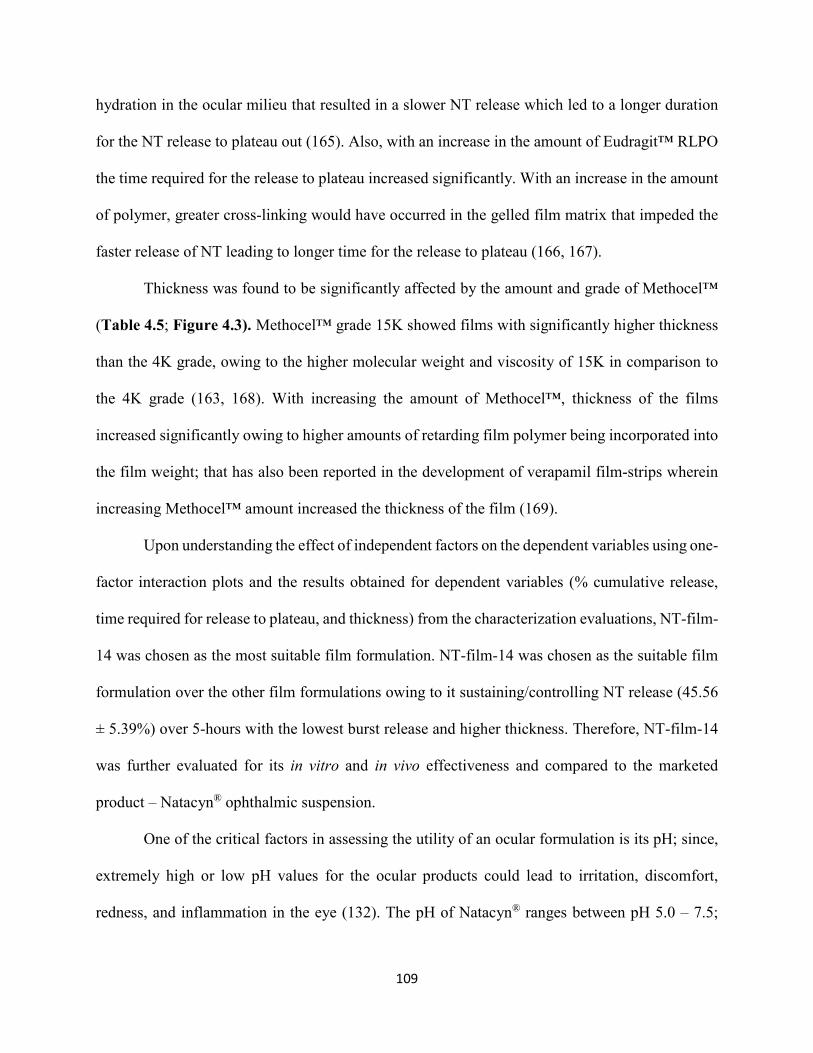
109
hydration in the ocular milieu that resulted in a slower NT release which led to a longer duration
for the NT release to plateau out (165). Also, with an increase in the amount of Eudragit™ RLPO
the time required for the release to plateau increased significantly. With an increase in the amount
of polymer, greater cross-linking would have occurred in the gelled film matrix that impeded the
faster release of NT leading to longer time for the release to plateau (166, 167).
Thickness was found to be significantly affected by the amount and grade of Methocel™
(Table 4.5; Figure 4.3). Methocel™ grade 15K showed films with significantly higher thickness
than the 4K grade, owing to the higher molecular weight and viscosity of 15K in comparison to
the 4K grade (163, 168). With increasing the amount of Methocel™, thickness of the films
increased significantly owing to higher amounts of retarding film polymer being incorporated into
the film weight; that has also been reported in the development of verapamil film-strips wherein
increasing Methocel™ amount increased the thickness of the film (169).
Upon understanding the effect of independent factors on the dependent variables using one-
factor interaction plots and the results obtained for dependent variables (% cumulative release,
time required for release to plateau, and thickness) from the characterization evaluations, NT-film-
14 was chosen as the most suitable film formulation. NT-film-14 was chosen as the suitable film
formulation over the other film formulations owing to it sustaining/controlling NT release (45.56
± 5.39%) over 5-hours with the lowest burst release and higher thickness. Therefore, NT-film-14
was further evaluated for its in vitro and in vivo effectiveness and compared to the marketed
product – Natacyn® ophthalmic suspension.
One of the critical factors in assessing the utility of an ocular formulation is its pH; since,
extremely high or low pH values for the ocular products could lead to irritation, discomfort,
redness, and inflammation in the eye (132). The pH of Natacyn® ranges between pH 5.0 – 7.5;
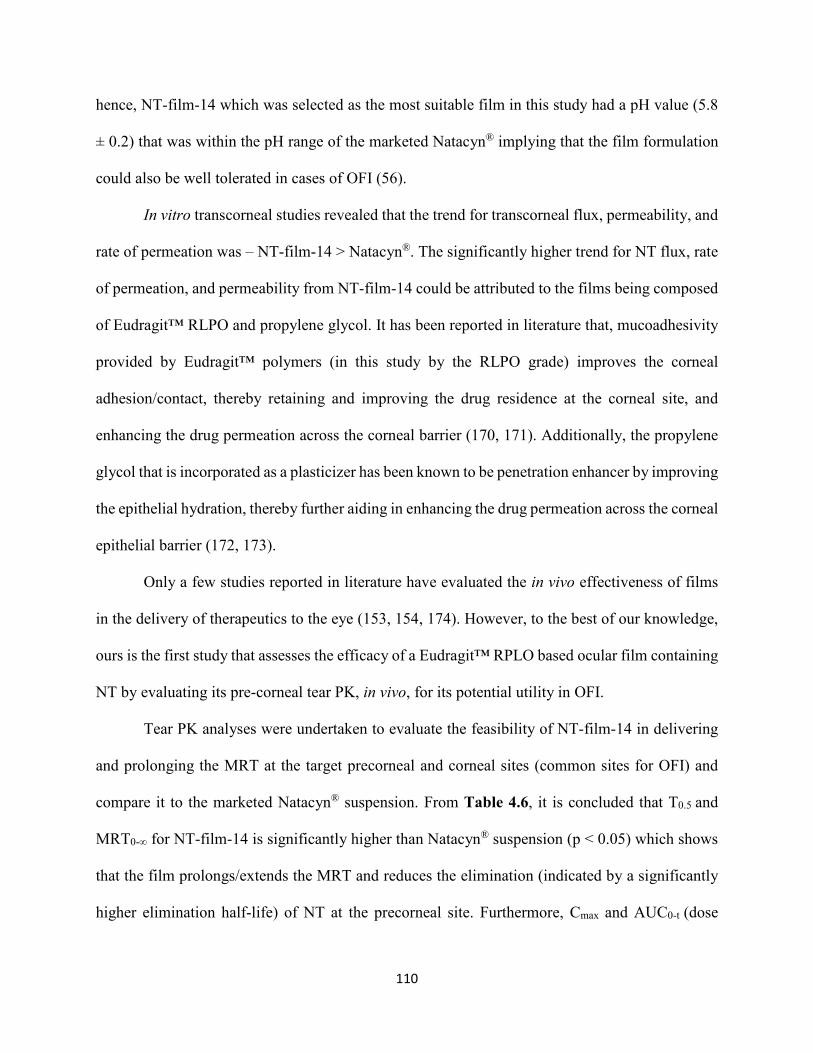
110
hence, NT-film-14 which was selected as the most suitable film in this study had a pH value (5.8
± 0.2) that was within the pH range of the marketed Natacyn® implying that the film formulation
could also be well tolerated in cases of OFI (56).
In vitro transcorneal studies revealed that the trend for transcorneal flux, permeability, and
rate of permeation was – NT-film-14 > Natacyn®. The significantly higher trend for NT flux, rate
of permeation, and permeability from NT-film-14 could be attributed to the films being composed
of Eudragit™ RLPO and propylene glycol. It has been reported in literature that, mucoadhesivity
provided by Eudragit™ polymers (in this study by the RLPO grade) improves the corneal
adhesion/contact, thereby retaining and improving the drug residence at the corneal site, and
enhancing the drug permeation across the corneal barrier (170, 171). Additionally, the propylene
glycol that is incorporated as a plasticizer has been known to be penetration enhancer by improving
the epithelial hydration, thereby further aiding in enhancing the drug permeation across the corneal
epithelial barrier (172, 173).
Only a few studies reported in literature have evaluated the in vivo effectiveness of films
in the delivery of therapeutics to the eye (153, 154, 174). However, to the best of our knowledge,
ours is the first study that assesses the efficacy of a Eudragit™ RPLO based ocular film containing
NT by evaluating its pre-corneal tear PK, in vivo, for its potential utility in OFI.
Tear PK analyses were undertaken to evaluate the feasibility of NT-film-14 in delivering
and prolonging the MRT at the target precorneal and corneal sites (common sites for OFI) and
compare it to the marketed Natacyn® suspension. From Table 4.6, it is concluded that T0.5 and
MRT0-∞ for NT-film-14 is significantly higher than Natacyn® suspension (p < 0.05) which shows
that the film prolongs/extends the MRT and reduces the elimination (indicated by a significantly
higher elimination half-life) of NT at the precorneal site. Furthermore, Cmax and AUC0-t (dose
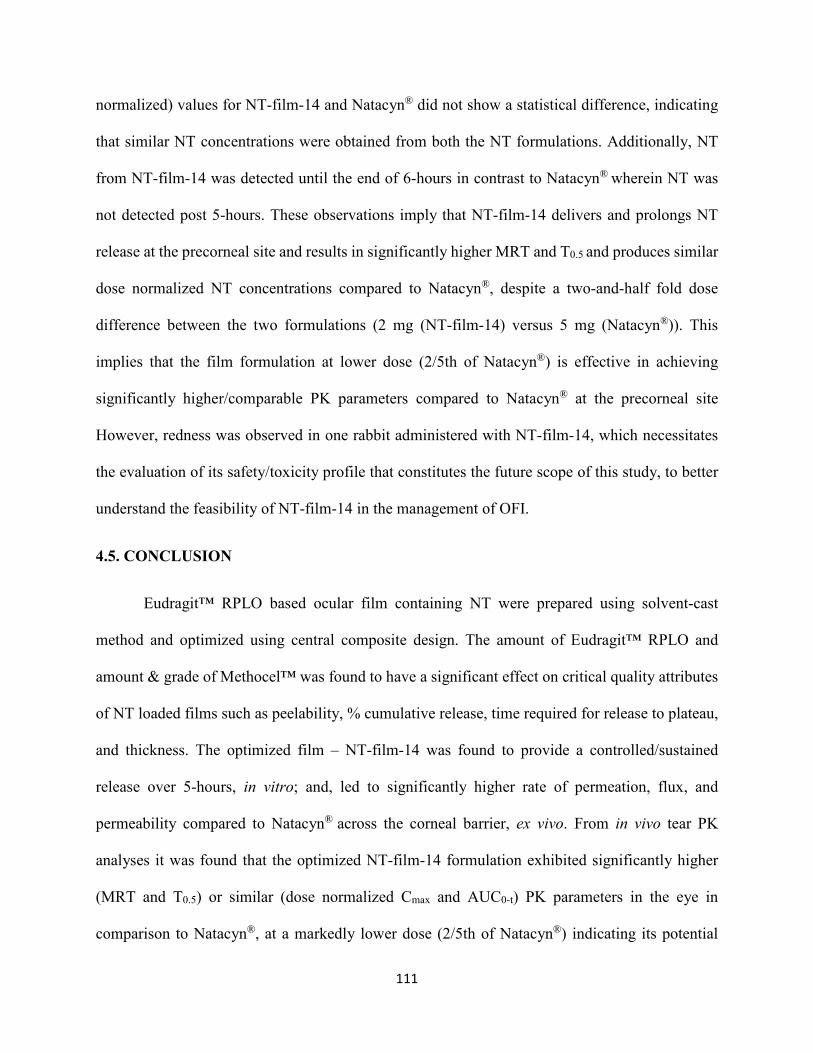
111
normalized) values for NT-film-14 and Natacyn® did not show a statistical difference, indicating
that similar NT concentrations were obtained from both the NT formulations. Additionally, NT
from NT-film-14 was detected until the end of 6-hours in contrast to Natacyn® wherein NT was
not detected post 5-hours. These observations imply that NT-film-14 delivers and prolongs NT
release at the precorneal site and results in significantly higher MRT and T0.5 and produces similar
dose normalized NT concentrations compared to Natacyn®, despite a two-and-half fold dose
difference between the two formulations (2 mg (NT-film-14) versus 5 mg (Natacyn®)). This
implies that the film formulation at lower dose (2/5th of Natacyn®) is effective in achieving
significantly higher/comparable PK parameters compared to Natacyn® at the precorneal site
However, redness was observed in one rabbit administered with NT-film-14, which necessitates
the evaluation of its safety/toxicity profile that constitutes the future scope of this study, to better
understand the feasibility of NT-film-14 in the management of OFI.
4.5. CONCLUSION
Eudragit™ RPLO based ocular film containing NT were prepared using solvent-cast
method and optimized using central composite design. The amount of Eudragit™ RPLO and
amount & grade of Methocel™ was found to have a significant effect on critical quality attributes
of NT loaded films such as peelability, % cumulative release, time required for release to plateau,
and thickness. The optimized film – NT-film-14 was found to provide a controlled/sustained
release over 5-hours, in vitro; and, led to significantly higher rate of permeation, flux, and
permeability compared to Natacyn® across the corneal barrier, ex vivo. From in vivo tear PK
analyses it was found that the optimized NT-film-14 formulation exhibited significantly higher
(MRT and T0.5) or similar (dose normalized Cmax and AUC0-t) PK parameters in the eye in
comparison to Natacyn®, at a markedly lower dose (2/5th of Natacyn®) indicating its potential
112
utility in the management of fungal infections of the eye.
CONFLICTS OF INTEREST
The authors do not declare any conflict of interests regarding this article.
ACKNOWLEDGMENTS
This research work was funded and supported by National Institute of General Medical
Sciences, National Institutes of Health (P30GM122733-01A1). The content is solely the
responsibility of the authors and does not necessarily represent the official views of the National
Institutes of Health.

113
BIBLIOGRAPHY
114
1. CDC. Fungal Eye Infections, https://www.cdc.gov/fungal/diseases/fungal-eye-
infections/definition.html. 2017.
2. Patil A, Majumdar S. Echinocandins in Ocular Therapeutics. Journal of Ocular
Pharmacology and Therapeutics. 2017;33(5):340-52.
3. Müller G, Kara-José N, de Castro R. Antifungals in eye infections: drugs and routes of
administration. Rev Bras Oftalmol. 2013;72(2):132-41.
4. CDC. Treatment for Fungal Eye Infections, https://www.cdc.gov/fungal/diseases/fungal-
eye-infections/treatment.html. 2017.
5. Thomas P. Fungal infections of the cornea. Eye. 2003;17(8):852-62.
6. Singh D. Fungal Keratitis Treatment & Management. Medscape Ophthalmology.
2015;Article ID: 1194167.
7. Bondaryk M, Kurzątkowski W, Staniszewska M. Antifungal agents commonly used in
the superficial and mucosal candidiasis treatment: mode of action and resistance development.
Postepy Dermatol Alergol. 2013;30(5):293-301.
8. Ansari Z, Miller D, Galor A. Current Thoughts in Fungal Keratitis: Diagnosis and
Treatment. Curr Fungal Infect Rep. 2013;7(3):209-18.
9. Rao S, Madhavan H, Rao G, Padmanabhan P. Fluconazole in filamentous fungal
keratitis. Cornea. 1997;16(6):700.
115
10. Prajna N, Mascarenhas J, Krishnan T, Reddy P, Prajna L, Srinivasan M, et al.
Comparison of natamycin and voriconazole for the treatment of fungal keratitis. Archives of
ophthalmology (Chicago, Ill : 1960). 2010;128(6):672-8.
11. Stark J. Permitted preservatives - natamycin. In: Robinson R, Bhatt C, Patel P, editors.
Encylopedia of Food Microbiology. 3. San Diego: Academic Press; 2000. p. 1776-81.
12. Struyk A, Hoette I, Drost G, Waisvisz J, Van Eek T, Hoogerheide J. Pimaricin, a new
antifungal antibiotic. Antibiotics annual. 1957;5:878-85.
13. Raab W. Natamycin (Pimaricin). Its properties and possibilities in medicine. Mycoses.
1974;17(1):21.
14. Divekar P, Bloomer J, Eastham J, Holtman D, Shirley D. The isolation of crystalline
tennecetin and the comparison of this antibiotic with pimaricin. Antibiotics & chemotherapy
(Northfield, Ill). 1961;11:377-80.
15. Canedo L, Costa L, Criado L, Fernandez Puentes J, Moreno M. AB-400, a new tetraene
macrolide isolated from Streptomyces costae. The Journal of antibiotics. 2000;53(6):623-6.
16. Brik H. Natamycin. In: Florey K, editor. Analytical Profiles of Drug Substances. 10. New
York: Academic Press, Inc; 1981. p. 513-61.
17. Natamycin, http://www.natamycin.com/natamycin.
18. Oroshnik W, Mebane A. The Polyene Antifungal Antibiotics. In: Zechmeister L, editor.
Progress in the Chemistry of Organic Natural Products/Progrès Dans La Chimie Des Substances
Organiques Naturelles. Vienna: Springer Vienna; 1963. p. 17-79.
19. Ceder O, Hansson B, Rapp U. Pimaricin—VIII. Tetrahedron. 1977;33(20):2703-14.
20. Hamilton-Miller J. Chemistry and biology of the polyene macrolide antibiotics. Bacteriol
Rev. 1973;37(2):166-96.
116
21. Thomas A. Analysis and assay of polyene antifungal antibiotics. A review. The Analyst.
1976;101(1202):321-40.
22. Brik H. New high-molecular decomposition products of natamycin (pimaricin) with
intact lactone-ring. The Journal of antibiotics. 1976;29(6):632-7.
23. Dekker J, Ark P. Protection of antibiotic pimaricin from oxidation and ultraviolet light by
chlorophyllin and other compounds. Antibiotics & chemotherapy (Northfield, Ill).
1959;9(6):327-32.
24. te Welscher Y, Napel H, Balagué M, Souza C, Riezman H, de Kruijff B, et al. Natamycin
Blocks Fungal Growth by Binding Specifically to Ergosterol without Permeabilizing the
Membrane. Journal of Biological Chemistry. 2008;283(10):6393-401.
25. Wachtler V, Balasubramanian M. Yeast lipid rafts?--an emerging view. Trends in cell
biology. 2005;16(1):1-4.
26. Takeda T, Chang F. Role of fission yeast myosin I in organization of sterol-rich
membrane domains. Current biology : CB. 2005;15(14):1331-6.
27. Kato M, Wickner W. Ergosterol is required for the Sec18/ATP-dependent priming step of
homotypic vacuole fusion. Embo j. 2001;20(15):4035-40.
28. Munn A. Molecular requirements for the internalisation step of endocytosis: insights
from yeast. Biochimica et biophysica acta. 2001;1535(3):236-57.
29. Van Leeuwen M, Golovina E, Dijksterhuis J. The polyene antimycotics nystatin and
filipin disrupt the plasma membrane, whereas natamycin inhibits endocytosis in germinating
conidia of Penicillium discolor. Journal of Applied Microbiology. 2009;106(6):1908-18.
30. Wickner W, Haas A. Yeast homotypic vacuole fusion: a window on organelle trafficking
mechanisms. Annual review of biochemistry. 2000;69:247-75.
117
31. Heese-Peck A, Pichler H, Zanolari B, Watanabe R, Daum G, Riezman H. Multiple
functions of sterols in yeast endocytosis. Molecular biology of the cell. 2002;13(8):2664-80.
32. Mayer A. Membrane fusion in eukaryotic cells. Annual review of cell and developmental
biology. 2002;18:289-314.
33. Munn A, Heese-Peck A, Stevenson B, Pichler H, Riezman H. Specific sterols required
for the internalization step of endocytosis in yeast. Molecular biology of the cell.
1999;10(11):3943-57.
34. te Welscher Y, Jones L, van Leeuwen M, Dijksterhuis J, de Kruijff B, Eitzen G, et al.
Natamycin Inhibits Vacuole Fusion at the Priming Phase via a Specific Interaction with
Ergosterol. Antimicrob Agents Chemother. 2010;54(6):2618-25.
35. Banta L, Robinson J, Klionsky D, Emr S. Organelle assembly in yeast: characterization
of yeast mutants defective in vacuolar biogenesis and protein sorting. The Journal of cell
biology. 1988;107(4):1369-83.
36. Baars T, Petri S, Peters C, Mayer A. Role of the V-ATPase in regulation of the vacuolar
fission-fusion equilibrium. Molecular biology of the cell. 2007;18(10):3873-82.
37. Ozcan S, Johnston M. Function and regulation of yeast hexose transporters. Microbiology
and molecular biology reviews : MMBR. 1999;63(3):554-69.
38. Robl I, Grassl R, Tanner W, Opekarova M. Construction of phosphatidylethanolamine-
less strain of Saccharomyces cerevisiae. Effect on amino acid transport. Yeast (Chichester,
England). 2001;18(3):251-60.
39. Regenberg B, During-Olsen L, Kielland-Brandt M, Holmberg S. Substrate specificity and
gene expression of the amino-acid permeases in Saccharomyces cerevisiae. Current genetics.
2000;36(6):317-28.
118
40. te Welscher Y, van Leeuwen M, de Kruijff B, Dijksterhuis J, Breukink E. Polyene
antibiotic that inhibits membrane transport proteins. Proc Natl Acad Sci USA.
2012;109(28):11156-9.
41. Brothers A, Wyatt R. The antifungal activity of natamycin toward molds isolated from
commercially manufactured poultry feed. Avian diseases. 2000;44(3):490-7.
42. Türe H, Eroğlu E, Soyer F, Özen B. Antifungal activity of biopolymers containing
natamycin and rosemary extract against Aspergillus niger and Penicillium roquefortii.
International Journal of Food Science & Technology. 2008;43(11):2026-32.
43. Al-Hatmi A, Meletiadis J, Curfs-Breuker I, Bonifaz A, Meis J, Hoog S. In vitro
combinations of natamycin with voriconazole, itraconazole and micafungin against clinical
Fusarium strains causing keratitis. The Journal of antimicrobial chemotherapy. 2016;71:953-5.
44. Gray K, Palacios D, Dailey I, Endo M, Uno B, Wilcock B, et al. Amphotericin primarily
kills yeast by simply binding ergosterol. Proceedings of the National Academy of Sciences of the
United States of America. 2012;109(7):2234-9.
45. Salvosa F, Cubillan L, Nievera L. In vitro evaluation of natamycin 5% suspension against
Aspergillus flavus, Fusarium solani, and Candida parasilopsis. Philippine Journal of
Ophthalmology. 2004;29(1):26-8.
46. Mauger T, Craig E. Antimicrobials. Havener’s Ocular Pharmacology. 6 ed. St. Louis,
Missouri: Mosby; 1994.
47. Lalitha P, Vijaykumar R, Prajna N, Fothergill A. In Vitro Natamycin Susceptibility of
Ocular Isolates of Fusarium and Aspergillus Species: Comparison of Commercially Formulated
Natamycin Eye Drops to Pharmaceutical-Grade Powder. Journal of clinical microbiology.
2008;46(10):3477-8.
119
48. Xu Y, Pang G, Zhao D, Gao C, Zhou L, Sun S, et al. In Vitro Activity of Thimerosal
against Ocular Pathogenic Fungi. Antimicrob Agents Chemother. 2010;54(1):536-9.
49. Streekstra H, Verkennis A, Jacobs R, Dekker A, Stark J, Dijksterhuis J. Fungal strains
and the development of tolerance against natamycin. International journal of food microbiology.
2016;238:15-22.
50. Collier S, Gronostaj M, MacGurn A, Cope J, Yoder J, Beach M. Estimated Burden of
Keratitis — United States, 2010. MMWR 2014; 63:1027-30.
51. Lalitha P, Shapiro B, Srinivasan M, Prajna N, Acharya N, Fothergill A, et al.
Antimicrobial susceptibility of Fusarium, Aspergillus, and other filamentous fungi isolated from
keratitis. Archives of ophthalmology (Chicago, Ill : 1960). 2007;125(6):789-93.
52. Wang L, Wang L, Han L, Yin W. Study of Pathogens of Fungal Keratitis and the
Sensitivity of Pathogenic Fungi to Therapeutic Agents with the Disk Diffusion Method. Current
eye research. 2015;40(11):1095-101.
53. Xuguang S, Zhixin W, Zhiqun W, Shiyun L, Ran L. Ocular fungal isolates and antifungal
susceptibility in northern China. Am J Ophthalmol. 2006;143(1):131-3.
54. Kalavathy C, Parmar P, Kaliamurthy J, Philip V, Ramalingam M, Jesudasan C, et al.
Comparison of topical itraconazole 1% with topical natamycin 5% for the treatment of
filamentous fungal keratitis. Cornea. 2005;24(4):449-52.
55. Pradhan L, Sharma S, Nalamada S, Sahu S, Das S, Garg P. Natamycin in the treatment of
keratomycosis: Correlation of treatment outcome and in vitro susceptibility of fungal isolates.
Indian journal of ophthalmology. 2011;59(6):512-4.
56. Natacyn®, United States Food and Drug Administration,
https://www.accessdata.fda.gov/drugsatfda_docs/label/2008/050514s009lbl.pdf.
120
57. Qiu S, Zhao G, Lin J, Wang X, Hu L, Du Z, et al. Natamycin in the treatment of fungal
keratitis: a systematic review and Meta-analysis. Int J Ophthalmol. 82015. p. 597-602.
58. Noordam B, Stark J, De Haan B, Tan H. Stable natamycin suspensions. Google Patents;
1996.
59. Rokicka Milewska R, Derulska D, Lipnicki D, Skrobowska Wozniak A, Moszczenska A.
Pimafucin (natamycin) oral drops in the treatment of fungal infections of the oral cavity in
children with chronic blood diseases. Journal of chemotherapy (Florence, Italy). 1989;1(4
Suppl):1311-3.
60. Badhani A, Dabral P, Rana V, Upadhyaya K. Evaluation of cyclodextrins for enhancing
corneal penetration of natamycin eye drops. Journal of Pharmacy & Bioallied Sciences.
2012;4(Suppl 1):S29-S30.
61. Koontz J, Marcy J. Formation of Natamycin: Cyclodextrin Inclusion Complexes and
Their Characterization. Journal of Agricultural and Food Chemistry. 2003;51(24):7106-10.
62. Chandasana H, Prasad Y, Chhonker Y, Chaitanya T, Mishra N, Mitra K, et al. Corneal
targeted nanoparticles for sustained natamycin delivery and their PK/PD indices: An approach to
reduce dose and dosing frequency. International journal of pharmaceutics. 2014;477(1):317-25.
63. Bhatta R, Chandasana H, Chhonker Y, Rathi C, Kumar D, Mitra K, et al. Mucoadhesive
nanoparticles for prolonged ocular delivery of natamycin: In vitro and pharmacokinetics studies.
International journal of pharmaceutics. 2012;432(1):105-12.
64. Paradkar M, Parmar M. Formulation development and evaluation of Natamycin niosomal
in-situ gel for ophthalmic drug delivery. Journal of Drug Delivery Science and Technology.
2017;39:113-22.
121
65. Patil A, Majumdar S. Echinocandins in Ocular Therapeutics. Journal of ocular
pharmacology and therapeutics : the official journal of the Association for Ocular Pharmacology
and Therapeutics. 2017;33(5):340-52.
66. CDC. Fungal Diseases 2014 [
67. Huang S, Dugel P, Williams G, Kim M, Oyong K, Tyson C, et al. Notes from the field:
Multistate outbreak of postprocedural fungal endophthalmitis associated with a single
compounding pharmacy—United States, March-April 2012. MMWR 2012;61:310-1.
68. Jeng B, Gritz D, Kumar A, Holsclaw D, Porco T, Smith S, et al. Epidemiology of
ulcerative keratitis in Northern California. Archives of ophthalmology (Chicago, Ill : 1960).
2010;128(8):1022-8.
69. Thomas P, Kaliamurthy J. Mycotic keratitis: epidemiology, diagnosis and management.
Clin Microbiol Infect. 2013;19(3):210-20.
70. O'Day D, Head W, Robinson R, Clanton J. Corneal penetration of topical amphotericin B
and natamycin. Current eye research. 1986;5(11):877-82.
71. Liu C, Chiu H, Wu W, Sahoo S, Hsu C. Novel Lutein Loaded Lipid Nanoparticles on
Porcine Corneal Distribution. Journal of Ophthalmology. 2014;2014:11.
72. Liu D, Li J, Pan H, He F, Liu Z, Wu Q, et al. Potential advantages of a novel chitosan-N-
acetylcysteine surface modified nanostructured lipid carrier on the performance of ophthalmic
delivery of curcumin. Sci Rep. 2016;6.
73. Battaglia L, Serpe L, Foglietta F, Muntoni E, Gallarate M, Del Pozo Rodriguez A, et al.
Application of lipid nanoparticles to ocular drug delivery. Expert opinion on drug delivery.
2016;13(12):1743-57.
122
74. Poonia N, Kharb R, Lather V, Pandita D. Nanostructured lipid carriers: versatile oral
delivery vehicle. Future Sci OA. 2016;2(3).
75. Farace C, Sánchez-Moreno P, Orecchioni M, Manetti R, Sgarrella F, Asara Y, et al.
Immune cell impact of three differently coated lipid nanocapsules: pluronic, chitosan and
polyethylene glycol. Scientific Reports. 2016;6:18423.
76. Jiang W, Wang J, Yang L, Jiang X, Bai Z, Wang Z, et al. Nanostructured lipid carriers
modified with PEGylated carboxymethylcellulose polymers for effective delivery of docetaxel.
RSC Advances. 2015;5(110):90386-95.
77. Zhang X, Gan Y, Gan L, Nie S, Pan W. PEGylated nanostructured lipid carriers loaded
with 10-hydroxycamptothecin: an efficient carrier with enhanced anti-tumour effects against
lung cancer. Journal of Pharmacy and Pharmacology. 2008;60(8):1077-87.
78. Balguri S, Adelli G, Bhagav P, Repka M, Majumdar S. Development of nano structured
lipid carriers of ciprofloxacin for ocular delivery : Characterization, in vivo distribution and
effect of PEGylation. Investigative ophthalmology & visual science. 2015;56(7):2269-.
79. Thangabalan B, Kumar V. Analytical Method Development and Validation of Natamycin
in Eye Drop by RP-HPLC. Asian Journal of Pharmaceutical and Clinical Research.
2013;6(1):134-5.
80. Patil A, Lakhani P, Majumdar S. Current perspectives on natamycin in ocular fungal
infections. Journal of Drug Delivery Science and Technology. 2017;41(C):206-12.
81. Barar J, Asadi M, Mortazavi-Tabatabaei S, Omidi Y. Ocular Drug Delivery; Impact of in
vitro Cell Culture Models. J Ophthalmic Vis Res. 2009;4(4):238-52.
123
82. McMillan J, Batrakova E, Gendelman H. Chapter 14 - Cell Delivery of Therapeutic
Nanoparticles. In: Antonio V, editor. Progress in Molecular Biology and Translational Science.
Volume 104: Academic Press; 2011. p. 563-601.
83. Penaloza J, Marquez-Miranda V, Cabana-Brunod M, Reyes-Ramirez R, Llancalahuen F,
Vilos C, et al. Intracellular trafficking and cellular uptake mechanism of PHBV nanoparticles for
targeted delivery in epithelial cell lines. Journal of nanobiotechnology. 2017;15(1):1.
84. Park J, Jeong H, Hong J, Chang M, Kim M, Chuck R, et al. The Effect of Silica
Nanoparticles on Human Corneal Epithelial Cells. Sci Rep. 2016;6:37762.
85. Zhou H, Hao J, Wang S, Zheng Y, Zhang W. Nanoparticles in the ocular drug delivery.
Int J Ophthalmol. 2013;6(3):390-6.
86. Miladi K, Sfar S, Fessi H, Elaissari. Nanoprecipitation Process: From Particle Preparation
to In Vivo Applications. In: Vauthier C, Ponchel G, editors. Polymer Nanoparticles for
Nanomedicines: A Guide for their Design, Preparation and Development: Springer; 2017. p. 17-
55.
87. Xu Q, Kambhampati S, Kannan R. Nanotechnology Approaches for Ocular Drug
Delivery. Middle East Afr J Ophthalmol. 2013;20(1):26-37.
88. Bhagurkar A, Repka M, Murthy S. A Novel Approach for the Development of a
Nanostructured Lipid Carrier Formulation by Hot-Melt Extrusion Technology. Journal of
pharmaceutical sciences. 2017;106(4):1085-91.
89. Li J, Li Z, Zhou T, Zhang J, Xia H, Li H, et al. Positively charged micelles based on a
triblock copolymer demonstrate enhanced corneal penetration. Int J Nanomedicine.
2015;10:6027-37.
124
90. Gaudana R, Ananthula H, Parenky A, Mitra A. Ocular Drug Delivery. AAPS J. 122010.
p. 348-60.
91. Mun E, Morrison P, Williams A, Khutoryanskiy V. On the Barrier Properties of the
Cornea: A Microscopy Study of the Penetration of Fluorescently Labeled Nanoparticles,
Polymers, and Sodium Fluorescein. Molecular Pharmaceutics. 2014;11:3556-64.
92. Siafaka P, Üstündağ Okur N, Karavas E, Bikiaris D. Surface Modified Multifunctional
and Stimuli Responsive Nanoparticles for Drug Targeting: Current Status and Uses. Int J Mol
Sci. 2016;17(9).
93. Azhar Shekoufeh Bahari L, Hamishehkar H. The Impact of Variables on Particle Size of
Solid Lipid Nanoparticles and Nanostructured Lipid Carriers; A Comparative Literature Review.
Adv Pharm Bull. 2016;6(2):143-51.
94. Peng J, Dong W, Li L, Xu J, Jin D, Xia X, et al. Effect of high-pressure homogenization
preparation on mean globule size and large-diameter tail of oil-in-water injectable emulsions.
Journal of Food and Drug Analysis. 2015;23(4):828-35.
95. Ferreira M, Chaves L, Lima S, Reis S. Optimization of nanostructured lipid carriers
loaded with methotrexate: A tool for inflammatory and cancer therapy. International journal of
pharmaceutics. 2015;492(1–2):65-72.
96. Gupta S, Kesarla R, Chotai N, Misra A, Omri A. Systematic Approach for the
Formulation and Optimization of Solid Lipid Nanoparticles of Efavirenz by High Pressure
Homogenization Using Design of Experiments for Brain Targeting and Enhanced
Bioavailability. BioMed Research International. 2017;2017:18.
97. Üner M, Yener G. Importance of solid lipid nanoparticles (SLN) in various
administration routes and future perspectives. Int J Nanomedicine. 2007;2(3):289-300.
125
98. Das S, Chaudhury A. Recent Advances in Lipid Nanoparticle Formulations with Solid
Matrix for Oral Drug Delivery. AAPS PharmSciTech. 2011;12(1):62-76.
99. Gukasyan H, Kim K, Lee V. The Conjunctival Barrier in Ocular Drug Delivery. In:
Ehrhardt C, Kim K-J, editors. Drug Absorption Studies: In Situ, In Vitro and In Silico Models.
Boston, MA: Springer US; 2008. p. 307-20.
100. Wang Y, Rajala A, Rajala R. Lipid Nanoparticles for Ocular Gene Delivery. J Funct
Biomater. 2015;6(2):379-94.
101. De Campos A, Sánchez A, Gref R, Calvo P, Alonso M. The effect of a PEG versus a
chitosan coating on the interaction of drug colloidal carriers with the ocular mucosa. European
Journal of Pharmaceutical Sciences. 2003;20(1):73-81.
102. Lai S, Wang Y, Hanes J. Mucus-penetrating nanoparticles for drug and gene delivery to
mucosal tissues. Advanced Drug Delivery Reviews. 2009;61(2):158–71.
103. Xu Q, Boylan N, Cai S, Miao B, Patel H, Hanes J. Scalable method to produce
biodegradable nanoparticles that rapidly penetrate human mucus. Journal of controlled release :
official journal of the Controlled Release Society. 2013;170(2):279-86.
104. Balguri S, Adelli G, Janga K, Bhagav P, Majumdar S. Ocular disposition of ciprofloxacin
from topical, PEGylated nanostructured lipid carriers: Effect of molecular weight and density of
poly (ethylene) glycol. International journal of pharmaceutics. 2017;529(1-2):32-43.
105. Balguri S, Adelli G, Majumdar S. Topical ophthalmic lipid nanoparticle formulations
(SLN, NLC) of indomethacin for delivery to the posterior segment ocular tissues. European
Journal of Pharmaceutics and Biopharmaceutics. 2016;109:224-35.
106. Thomas PA. Fungal infections of the cornea. Eye (London, England). 2003;17(8):852-62.
126
107. Thomas P. Current Perspectives on Ophthalmic Mycoses. Clin Microbiol Rev.
2003;16(4):730-97.
108. Lakhani P, Patil A, Majumdar S. Challenges in the Polyene- and Azole-Based
Pharmacotherapy of Ocular Fungal Infections. Journal of Ocular Pharmacology and
Therapeutics. 2019;35(1):6-22.
109. Thakkar R, Patil A, Mehraj T, Dudhipala N, Majumdar S. Updates in Ocular Antifungal
Pharmacotherapy: Formulation and Clinical Perspectives. Current Fungal Infection Reports.
2019;13(2):45-58.
110. Patil A, Lakhani P, Taskar P, Wu KW, Sweeney C, Avula B, et al. Formulation
Development, Optimization, and In Vitro-In Vivo Characterization of Natamycin-Loaded
PEGylated Nano-Lipid Carriers for Ocular Applications. Journal of pharmaceutical sciences.
2018;107(8):2160-71.
111. Natacyn Product Insert
[http://www.accessdata.fda.gov/drugsatfda_docs/label/2008/050514s009lbl.pdf].
112. Kumar D, Jain N, Gulati N, Nagaich U. Nanoparticles laden in situ gelling system for
ocular drug targeting. Journal of Advanced Pharmaceutical Technology & Research.
2013;4(1):9-17.
113. Iqbal MA, Md S, Sahni JK, Baboota S, Dang S, Ali J. Nanostructured lipid carriers
system: Recent advances in drug delivery. Journal of Drug Targeting. 2012;20(10):813-30.
114. Singh V, Bushetti SS, Raju SA, Ahmad R, Singh M, Ajmal M. Polymeric ocular
hydrogels and ophthalmic inserts for controlled release of timolol maleate. Journal of Pharmacy
and Bioallied Sciences. 2011;3(2):280-5.
127
115. Patel A, Cholkar K, Agrahari V, Mitra A. Ocular drug delivery systems: An overview.
World J Pharmacol. 2013;2(2):47-64.
116. Felt O, Einmahl S, Furrer P, Baeyens V, Gurny R. Polymeric Systems for Ophthalmic
Drug Delivery. In: Dumitriu S, editor. Polymeric Biomaterials, Revised and Expanded. 2 ed.
New York: CRC Press; 2001. p. 377-43.
117. Baranowski P, Karolewicz B, Gajda M, Pluta J. Ophthalmic Drug Dosage Forms:
Characterisation and Research Methods. The Scientific World Journal. 2014;2014:14.
118. Shaikh R, Raj Singh TR, Garland MJ, Woolfson AD, Donnelly RF. Mucoadhesive drug
delivery systems. Journal of Pharmacy and Bioallied Sciences. 2011;3(1):89-100.
119. Guo J-H. Carbopol polymers for pharmaceutical drug delivery applications. Drug Deliv
Technol. 2003;3:1-3.
120. Chowhan MA, Ghosh M, Asgharian B, Han WW, inventors; Alcon Research Ltd
assignee. Carboxyvinyl polymer-containing nanoparticle suspensions (US 8921337 B2). United
States2014.
121. Bhagurkar AM, Angamuthu M, Patil H, Tiwari RV, Maurya A, Hashemnejad SM, et al.
Development of an Ointment Formulation Using Hot-Melt Extrusion Technology. AAPS
PharmSciTech. 2016;17(1):158-66.
122. Lakhani P, Patil A, Taskar P, Ashour E, Majumdar S. Curcumin-loaded Nanostructured
Lipid Carriers for ocular drug delivery: Design optimization and characterization. Journal of
Drug Delivery Science and Technology. 2018;47:159-66.
123. Majumdar S, Hingorani T, Srirangam R, Gadepalli RS, Rimoldi JM, Repka MA.
Transcorneal Permeation of l- and d-Aspartate Ester Prodrugs of Acyclovir: Delineation of
128
Passive Diffusion Versus Transporter Involvement. Pharmaceutical Research. 2009;26(5):1261-
9.
124. Warsi MH, Anwar M, Garg V, Jain GK, Talegaonkar S, Ahmad FJ, et al. Dorzolamide-
loaded PLGA/vitamin E TPGS nanoparticles for glaucoma therapy: Pharmacoscintigraphy study
and evaluation of extended ocular hypotensive effect in rabbits. Colloids and Surfaces B:
Biointerfaces. 2014;122:423-31.
125. Marques M, Löbenberg R, Almukainzi M. Simulated Biological Fluids with Possible
Application in Dissolution Testing2011. 15-28 p.
126. Zhang Y, Huo M, Zhou J, Xie S. PKSolver: An add-in program for pharmacokinetic and
pharmacodynamic data analysis in Microsoft Excel. Computer Methods and Programs in
Biomedicine. 2010;99(3):306-14.
127. Lakhani P, Patil A, Wu K-W, Sweeney C, Tripathi S, Avula B, et al. Optimization,
stabilization, and characterization of amphotericin B loaded nanostructured lipid carriers for
ocular drug delivery. International journal of pharmaceutics. 2019;572:118771.
128. Janga KY, Tatke A, Balguri SP, Lamichanne SP, Ibrahim MM, Maria DN, et al. Ion-
sensitive in situ hydrogels of natamycin bilosomes for enhanced and prolonged ocular
pharmacotherapy: in vitro permeability, cytotoxicity and in vivo evaluation. Artificial Cells,
Nanomedicine, and Biotechnology. 2018:1-12.
129. Zignani M, Tabatabay C, Gurny R. Topical semi-solid drug delivery: kinetics and
tolerance of ophthalmic hydrogels. Advanced Drug Delivery Reviews. 1995;16(1):51-60.
130. Bother H, Waaler T. Rheological Characterization of Tear Substitutes. Drug development
and industrial pharmacy. 1990;16(5):755-68.
129
131. Schoenwald RD, Ward RL, DeSantis LM, Roehrs RE. Inlfuence of high-viscosity
vehicles on miotic effect of pilocarpine. Journal of pharmaceutical sciences. 1978;67(9):1280-3.
132. Patil A, Singh S, Opere C, Dash A. Sustained-Release Delivery System of a Slow
Hydrogen Sulfide Donor, GYY 4137, for Potential Application in Glaucoma. AAPS
PharmSciTech. 2017;18(6):2291-302.
133. Rathore K. Insitu gelling ophthalmic drug delivery system: An overview. Int J Pharm Sci.
2010;2(4):30-4.
134. Hurler J, Engesland A, Poorahmary Kermany B, Škalko-Basnet N. Improved texture
analysis for hydrogel characterization: Gel cohesiveness, adhesiveness, and hardness. Journal of
Applied Polymer Science. 2012;125(1):180-8.
135. Poorahmary Kermany B. Carbopol hydrogels for topical administration: treatment of
wounds. Tromsø, Norway: University of Tromsø; 2010.
136. A-sasutjarit R, Sirivat A, Vayumhasuwan P. Viscoelastic properties of Carbopol 940 gels
and their relationships to piroxicam diffusion coefficients in gel bases. Pharm Res.
2005;22(12):2134-40.
137. Dantas MGB, Reis SAGB, Damasceno CMD, Rolim LA, Rolim-Neto PJ, Carvalho FO,
et al. Development and Evaluation of Stability of a Gel Formulation Containing the Monoterpene
Borneol. The Scientific World Journal. 2016;2016:7394685.
138. Shukr M, Metwally G. Evaluation of Topical Gel Bases Formulated with Various
Essential Oils for Antibacterial Activity against Methicillin Resistant Staphylococcus Aureus.
Tropical Journal of Pharmaceutical Research 2013;12(6):877-84.
139. Barry BW, Meyer MC. The rheological properties of carbopol gels I. Continuous shear
and creep properties of carbopol gels. International journal of pharmaceutics. 1979;2(1):1-25.
130
140. Todica M, Pop CV, Udrescu L, Pop M. Rheological Behavior of Some Aqueous Gels of
Carbopol with Pharmaceutical Applications. Chinese Physics Letters. 2010;27(1):018301.
141. Manjappa AS, Nanjwade BK, Manvi FV, Murthy RSR. Sustained ophthalmic in situ gel
of ketorolac tromethamine: rheology and in vivo studies. Drug Development Research.
2009;70(6):417-24.
142. Vandeputte J, inventor; ER Squibb and Sons LLC assignee. Borate complex of polyene
macrolide antibiotics. United States1973.
143. Patil A. Preparation, Characterization and Toxicity Evaluation of a Novel Sustained
Release Delivery System for a Hydrogen Sulfide Donor - GYY 4137. Omaha, Nebraska, United
States: Creighton University; 2016.
144. Dash S, Murthy P, Nath L, Chowdhury P. Kinetic modeling on drug release from
controlled drug delivery systems. Acta poloniae pharmaceutica. 2010;67(3):217-23.
145. Schwartz J, Simonelli A, Higuchi W. Drug release from wax matrices. I. Analysis of data
with first-order kinetics and with the diffusion-controlled model. Journal of pharmaceutical
sciences. 1968;57(2):274-7.
146. Mahajan HS, Deshmukh SR. Development and evaluation of gel-forming ocular films
based on xyloglucan. Carbohydrate Polymers. 2015;122:243-7.
147. Abdelkader H, Pierscionek B, Alany RG. Novel in situ gelling ocular films for the opioid
growth factor-receptor antagonist-naltrexone hydrochloride: Fabrication, mechanical properties,
mucoadhesion, tolerability and stability studies. International journal of pharmaceutics.
2014;477(1):631-42.
131
148. de Oliveira Fulgencio G, Viana FA, Silva RO, Lobato FC, Ribeiro RR, Fanca JR, et al.
Mucoadhesive chitosan films as a potential ocular delivery system for ofloxacin: preliminary in
vitro studies. Veterinary ophthalmology. 2014;17(2):150-5.
149. Tandale Y, D. Wagh V. Formulation and Evaluation of Dorzolamide Hydrochloride
Polymeric Film2011. page no. 1211-8 p.
150. Tartara LI, Palma SD, Allemandi D, Ahumada MI, Llabot JM. New mucoadhesive
polymeric film for ophthalmic administration of acetazolamide. Recent patents on drug delivery
& formulation. 2014;8(3):224-32.
151. Jafariazar Z, Jamalinia N, Ghorbani-Bidkorbeh F, Mortazavi SA. Design and Evaluation
of Ocular Controlled Delivery System for Diclofenac Sodium. Iran J Pharm Res.
2015;14(Suppl):23-31.
152. Karki S, Kim H, Na S-J, Shin D, Jo K, Lee J. Thin films as an emerging platform for
drug delivery. Asian Journal of Pharmaceutical Sciences. 2016;11(5):559-74.
153. Tatke A, Dudhipala N, Janga KY, Soneta B, Avula B, Majumdar S. Melt-Cast Films
Significantly Enhance Triamcinolone Acetonide Delivery to the Deeper Ocular Tissues.
Pharmaceutics. 2019;11(4):158.
154. Adelli GR, Balguri SP, Bhagav P, Raman V, Majumdar S. Diclofenac sodium ion
exchange resin complex loaded melt cast films for sustained release ocular delivery. Drug
delivery. 2017;24(1):370-9.
155. Adelli GR, Hingorani T, Punyamurthula N, Balguri SP, Majumdar S. Evaluation of
topical hesperetin matrix film for back-of-the-eye delivery. European Journal of Pharmaceutics
and Biopharmaceutics. 2015;92:74-82.
132
156. Singh S, Neelam, Arora S, Singla Y. An overview of multifaceted significance of
eudragit polymers in drug delivery systems. Asian Journal of Pharmaceutical and Clinical
Research. 2015;8(5):1-6.
157. Thakral S, Thakral NK, Majumdar DK. Eudragit: a technology evaluation. Expert
opinion on drug delivery. 2013;10(1):131-49.
158. Pignatello R, Bucolo C, Puglisi G. Ocular tolerability of Eudragit RS100® and RL100®
nanosuspensions as carriers for ophthalmic controlled drug delivery. Journal of pharmaceutical
sciences. 2002;91(12):2636-41.
159. Prabhasawat P, Ruangvaravate N, Tesavibul N, Thewthong M. Effect of 0.3%
Hydroxypropyl Methylcellulose/Dextran Versus 0.18% Sodium Hyaluronate in the Treatment of
Ocular Surface Disease in Glaucoma Patients: A Randomized, Double-Blind, and Controlled
Study. Journal of ocular pharmacology and therapeutics : the official journal of the Association
for Ocular Pharmacology and Therapeutics. 2015;31(6):323-9.
160. Hydroxypropyl methyl cellulose, Code of Federal Regulations Title 21, US-FDA,
https://www.accessdata.fda.gov/scripts/cdrh/cfdocs/cfcfr/CFRSearch.cfm?fr=172.874.
161. Sothornvit R, Krochta JM. 23 - Plasticizers in edible films and coatings. In: Han JH,
editor. Innovations in Food Packaging. London: Academic Press; 2005. p. 403-33.
162. Propylene glycol, Code of Federal Regulations Title 21, US-FDA
https://www.accessdata.fda.gov/scripts/cdrh/cfdocs/cfcfr/cfrsearch.cfm?fr=184.1666.
163. Roy A, Ghosh A, Datta S, Das S, Mohanraj P, Deb J, et al. Effects of plasticizers and
surfactants on the film forming properties of hydroxypropyl methylcellulose for the coating of
diclofenac sodium tablets. Saudi pharmaceutical journal : SPJ : the official publication of the
Saudi Pharmaceutical Society. 2009;17(3):233-41.
133
164. Kim H, Fassihi R. Application of binary polymer system in drug release rate modulation.
2. Influence of formulation variables and hydrodynamic conditions on release kinetics. Journal of
pharmaceutical sciences. 1997;86(3):323-8.
165. Singhvi G, Parmar N, Patel N, Saha R. Novel multi granules controlled release tablets of
milnacipran: Design with simplex lattice, in-vitro characterization and pharmacokinetic
predictions. Journal of Young Pharmacists. 2014;6(3):24-31.
166. Dvorackova K, Kaledaite R, Gajdziok J, Rabiskova M, Bajerova M, Muselik J, et al. The
development of Eudragit(R) NM-based controlled-release matrix tablets. Medicina (Kaunas,
Lithuania). 2012;48(4):192-202.
167. S Karthikeyini C, Jayaprakash S, Abirami A, Halith M. Formulation and evaluation of
aceclofenac sodium bilayer sustained release tablets. Int J Chemtech Res. 2009;1:1381-5.
168. Siepmann F, Siepmann J, Walther M, MacRae RJ, Bodmeier R. Blends of aqueous
polymer dispersions used for pellet coating: importance of the particle size. Journal of controlled
release : official journal of the Controlled Release Society. 2005;105(3):226-39.
169. Kunte S, Tandale P. Fast dissolving strips: A novel approach for the delivery of
verapamil. Journal of pharmacy & bioallied sciences. 2010;2(4):325-8.
170. El-Nahas AE, Allam AN, El-Kamel AH. Mucoadhesive buccal tablets containing
silymarin Eudragit-loaded nanoparticles: formulation, characterisation and ex vivo permeation.
Journal of microencapsulation. 2017;34(5):463-74.
171. Chatterjee B, Amalina N, Sengupta P, Mandal U. Mucoadhesive Polymers and Their
Mode of Action: A Recent Update. Journal of Applied Pharmaceutical Science. 2017;7(5):195-
203.

134
172. Stahl J, Kietzmann M. The effects of chemical and physical penetration enhancers on the
percutaneous permeation of lidocaine through equine skin. BMC Vet Res. 2014;10:138-.
173. Williams AC, Barry BW. Penetration enhancers. Adv Drug Deliv Rev. 2004;56(5):603-
18.
174. Balguri SP, Adelli GR, Tatke A, Janga KY, Bhagav P, Majumdar S. Melt-Cast
Noninvasive Ocular Inserts for Posterior Segment Drug Delivery. Journal of pharmaceutical
sciences. 2017;106(12):3515-23.
135
VITA
AKASH V. PATIL
SUMMARY OF QUALIFICATIONS:
• Successfully completed 8-month co-op training at Johnson & Johnson in BioTherapeutics Drug Product Development Team supporting formulation, process, and device development of large molecules therapeutics.
• Successfully led and collaborated on multiple research projects focused on development and delivery of formulations for small molecule therapeutics as a part of doctoral research at the University of Mississippi School of Pharmacy.
• Excellent written and verbal communication skills anchored by 14 publications and 12 conference presentations.
AREAS OF EXPERTISE:
• Drug product development
• Dosage form design • Pharmaceutical
nanotechnology
• Design of experiments • Biopharmaceutical
evaluations • Drug delivery
• Large molecule development
• Sub-Q, ophthalmic, and oral dosage forms
EDUCATION:
• PhD in Pharmaceutics and Drug Delivery 2016 – 2020
School of Pharmacy, University of Mississippi, Oxford, MS • MS in Pharmaceutical Sciences 2014 – 2016
School of Pharmacy and Health Professions, Creighton University, Omaha, NE • Bachelor of Pharmacy 2010 – 2014
Bombay College of Pharmacy, The University of Mumbai, India RESEARCH EXPERIENCES:
BioTherapeutics Drug Product Development (DPD) Co-op May 2019 – February 2020
Johnson and Johnson, Malvern, PA • Lead the technical evaluation of novel container closure systems to support prefilled syringe
products of large molecule therapeutics (e.g. mAbs). � Defining requirements towards the selection of alternative container closure systems based
on technical benefits, cost effectiveness, product and patient need by connecting with DPD formulation scientists, device and primary container engineers and vendors to align on formulation, device, and container characteristics.
� Lead designing and execution of studies towards the evaluation.
136
� Summarizing reports and present findings to DPD leadership. • Support formulation and process development of lead biologic entities.
� Support screening, pre-formulation and formulation development studies to support early and late phase formulation selection.
Graduate Research Assistant, 2016 – 2020
University of Mississippi, MS PhD Thesis title: Novel ophthalmic formulations for improved natamycin delivery in fungal infections of the eye. • Designed and optimized novel surface engineered lipidic and polymeric formulations for
antifungal, anti-inflammatory, antimalarial, and controlled drugs by Quality-by-Design using Design of Experiment software.
• In vitro physicochemical evaluation, ex vivo evaluations, in vivo pharmacokinetics and biodistribution at target therapeutic sites; development and validation of analytical and bioanalytical methods as per ICH guidelines.
Graduate Research Assistant, 2014 – 2016
Creighton University, NE MS Thesis title: Preparation, Characterization, and Toxicity Evaluation of a Novel Sustained Release Delivery System for a Hydrogen Sulfide Donor – GYY 4137. • Explored the development and validation of analytical method for hydrogen sulfide,
formulation characterization studies, and toxicity evaluations using in vitro cellular techniques.
INTELLECTUAL PROPERTY:
• “Amphotericin loaded pegylated lipid nanoparticles and methods of use” S. Majumdar, P. Lakhani, A. Patil. Publication Number: WO 2020/028916 A1
PROFESSIONAL ORGANIZATIONS & LEADERSHIP EXPERIENCES:
• Elsevier, Taylor & Francis, and Springer, US 2017 – present � Reviewer, Drug Delivery Science & Technology, Drug Development & Industrial
Pharmacy, AAPS PharmSciTech
• University of Mississippi, MS � Chair, UM AAPS Students’ Chapter 2018 – 2019 � Instructor/Assistant, Hands – On Course in Tablet Technology 2017 – 2019
• Creighton University, NE � Vice-Chair, CU AAPS Students’ Chapter 2014 – 2016
• Indian Pharmaceutical Association, India � Editorial assistant, PharmaTimes, Mumbai, India 2011 – 2013
AWARDS AND ACHIEVEMENTS:
• Phi Kappa Phi Fellowship, Phi Kappa Phi Honor Society, Louisiana 2019
• Phi Kappa Phi Honor Society Inductee, University of Mississippi 2019
• Rho Chi Academic Honor Society Inductee, University of Mississippi 2018
• UM Graduate Students’ Research Grant, University of Mississippi 2017 – 2018
• Virginia Dolores Cantú Fellowship, University of Mississippi 2016 – 2017 • Government Scholarship, Bombay College of Pharmacy 2015, 2013, 2012
137
PUBLICATIONS:
1. Patil A, Preparation, characterization and toxicity evaluation of a novel sustained release delivery system for a hydrogen sulfide donor-GYY 4137. Creighton University (2016).
2. Patil A, Singh S, Opere C, Dash A. Sustained-Release Delivery System of a Slow Hydrogen Sulfide Donor, GYY 4137, for Potential Application in Glaucoma. AAPS PharmSciTech 18, 2291–2302 (2017).
3. Patil A, Majumdar S, Echinocandins in Ocular Therapeutics, Journal of Ocular Pharmacology
and Therapeutics, 33 (2017), 340-352. 4. Patil A, Majumdar S, (2017), Echinocandins in antifungal pharmacotherapy. J Pharm
Pharmacol, 69: 1635–1660. doi:10.1111/jphp.12780 (top 20 impactful papers for Royal
Pharmaceutical Society and Wiley Publishers in 2017-2019). 5. Patil A, Lakhani P, Majumdar S, Current perspectives on natamycin in ocular fungal infections,
Journal of Drug Delivery Science and Technology, 41 (2017) 206-212. 6. Patil A, Bhide S, Bookwala M, et al. AAPS PharmSciTech (2018) 19: 36.
https://doi.org/10.1208/s12249-017-0866-2. 7. Lakhani P, Patil A, Majumdar S, Recent advances in topical nano drug-delivery systems for
the anterior ocular segment, Therapeutic Delivery 2018 9:2, 137-153. 8. Patil A, Lakhani P, Taskar P, Wu K-W, Sweeney C, Avula B, Wang Y-H, Khan IA, Majumdar
S 2018. Formulation Development, Optimization, and In vitro – In vivo Characterization of Natamycin Loaded PEGylated Nano-lipid Carriers for Ocular Applications. Journal of pharmaceutical sciences 107(8):2160-2171.
9. Lakhani P, Patil A, Taskar P, Ashour E, Majumdar S. Curcumin-loaded Nanostructured Lipid Carriers for ocular drug delivery: Design optimization and characterization. Journal of Drug Delivery Science and Technology. 2018; 47:159-66.
10. Lakhani P, Patil A, Majumdar S. Challenges in the Polyene- and Azole-Based Pharmacotherapy of Ocular Fungal Infections Prit Lakhani, Akash Patil, and Soumyajit Majumdar, Journal of Ocular Pharmacology and Therapeutics 2019 35:1, 6-22.
11. Taskar P, Adelli G, Patil A, Lakhani P, Ashour E, Gul W, ElSohly M, Majumdar S. Analog Derivatization of Cannabidiol for Improved Ocular Permeation. Journal of Ocular Pharmacology and Therapeutics. 2019 35:5, 301-310.
12. Thakkar R, Patil A, Mehraj T, Dudhipala N. Updates in Ocular Antifungal Pharmacotherapy: Formulation and Clinical Perspectives. Current Fungal Infection Reports. 2019 13: 45-58.
13. Taskar P, Patil A, Lakhani P, Ashour E, Gul W, ElSohly MA, Murphy B, Majumdar S; Δ9-Tetrahydrocannabinol Derivative-Loaded Nanoformulation Lowers Intraocular Pressure in Normotensive Rabbits. Trans. Vis. Sci. Tech. 2019;8(5):15.
14. Lakhani P, Patil A, Wu K-W, et al. Optimization, stabilization, and characterization of amphotericin B loaded nanostructured lipid carriers for ocular drug delivery. International journal of pharmaceutics 2019; 572:118771.