Evaluation of newly developed HPMC ophthalmic inserts with ...
239
Faculteit Farmaceutische, Biomedische en Diergeneeskundige Wetenschappen Departement Farmaceutische Wetenschappen Evaluation of newly developed HPMC ophthalmic inserts with sustained release properties as a carrier for thermolabile therapeutics Evaluatie van nieuw ontwikkelde HPMC oculaire inserten met verlengde afgifte als drager voor thermolabiele geneesmiddelen Antwerpen - 2017 Proefschrift voorgelegd tot het behalen van de graad van doctor in de farmaceutische wetenschappen aan de Universiteit van Antwerpen te verdedigen door Arnout EVERAERT Promotoren: Prof. dr. Wim Weyenberg, Prof. dr. Annick Ludwig en Prof. dr. Filip Kiekens
-
Upload
khangminh22 -
Category
Documents
-
view
5 -
download
0
Transcript of Evaluation of newly developed HPMC ophthalmic inserts with ...

Faculteit Farmaceutische, Biomedische en Diergeneeskundige Wetenschappen
Departement Farmaceutische Wetenschappen
Evaluation of newly developed HPMC ophthalmic inserts with sustained release properties as a carrier for thermolabile
therapeutics
Evaluatie van nieuw ontwikkelde HPMC oculaire inserten met verlengde afgifte als drager voor thermolabiele geneesmiddelen
Antwerpen - 2017
Proefschrift voorgelegd tot het behalen van de graad van
doctor in de farmaceutische wetenschappen aan de Universiteit van Antwerpen
te verdedigen door
Arnout EVERAERT
Promotoren:
Prof. dr. Wim Weyenberg, Prof. dr. Annick Ludwig en Prof. dr. Filip Kiekens


TABLE OF CONTENTS
List of abbreviations _________________________________________________________
Introduction _______________________________________________________________ 1
Chapter 1: Biopharmaceutical aspects of ocular drug delivery
1 General anatomy and structures of the eye __________________________________ 4
1.1 Anatomy of the eye _______________________________________________________ 4
1.2 Ocular barriers and availability of topically applied drugs _________________________ 8
Precorneal factors _______________________________________________________________ 9
1.2.1.1 Drainage of the drug solution __________________________________________________ 9
1.2.1.2 Mechanical removal of foreign substances ______________________________________ 11
1.2.1.3 Conjunctival sac capacity ____________________________________________________ 11
1.2.1.4 Drug binding ______________________________________________________________ 11
Tissue barriers__________________________________________________________________ 12
1.2.2.1 Corneal absorption _________________________________________________________ 12
1.2.2.2 Conjunctival/scleral absorption _______________________________________________ 15
2 Strategies improving topical ocular drug delivery ____________________________ 16
2.1 Optimisation of ocular availability ___________________________________________ 17
Increasing corneal permeation ____________________________________________________ 17
2.1.1.1 Modification corneal integrity ________________________________________________ 17
2.1.1.2 Physicochemical modification drug ____________________________________________ 17
Improving residence time ________________________________________________________ 18
2.1.2.1 Viscosity increase __________________________________________________________ 18
2.1.2.2 Bio- and mucoadhesive dosage forms __________________________________________ 20
3 Inserts _______________________________________________________________ 22
3.1 Classification of ophthalmic solid dosage forms ________________________________ 23
Drug reservoir systems ___________________________________________________________ 23
3.1.1.1 Diffusional systems _________________________________________________________ 23
3.1.1.2 Osmotic systems ___________________________________________________________ 24
Matrix systems _________________________________________________________________ 25
3.1.2.1 Contact lenses: insoluble ophthalmic drug delivery systems ________________________ 25
3.1.2.2 Soluble and bioerodible ophthalmic inserts _____________________________________ 26
3.1.2.2.1 Soluble inserts __________________________________________________________ 26
3.1.2.2.2 Bioerodible inserts _______________________________________________________ 29
4 Ophthalmic delivery of peptides and proteins _______________________________ 31
4.1 Peptides and proteins as biopharmaceuticals in general _________________________ 31
4.2 Treatment of eye disorders with peptides and proteins __________________________ 34
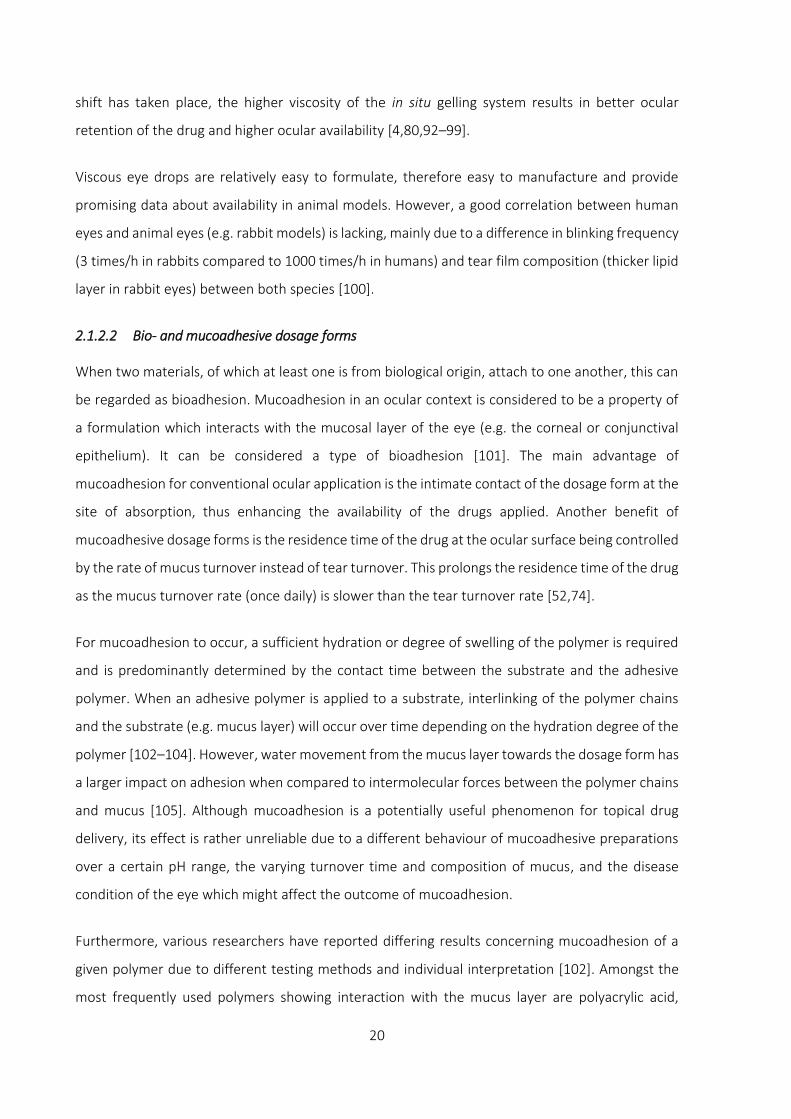
Vitreomacular traction ___________________________________________________________ 35
Age-related macular degeneration _________________________________________________ 36
Corneal neovascularisation _______________________________________________________ 40
Dry eye disease ________________________________________________________________ 41
4.3 Formulation considerations for ocular (protein) delivery _________________________ 42
5 Sterilisation methods ___________________________________________________ 44
5.1 Heat ___________________________________________________________________ 45
Steam sterilisation ______________________________________________________________ 45
Dry heat ______________________________________________________________________ 45
5.2 Chemicals _______________________________________________________________ 45
Ethylene oxide _________________________________________________________________ 45
5.3 Radiation _______________________________________________________________ 46
Gamma radiation _______________________________________________________________ 46
Electron beam _________________________________________________________________ 46
Non-ionising UV radiation ________________________________________________________ 47
Chapter 2: Objectives
Objectives ____________________________________________________________ 64
Chapter 3: Development of a novel ocular insert with slow release properties loaded with
sodium fluorescein 1 Introduction __________________________________________________________ 68
2 Materials and methods _________________________________________________ 70
2.1 Materials _______________________________________________________________ 70
2.2 Characterisation of the excipients ___________________________________________ 70
Hydroxypropylmethyl cellulose ____________________________________________________ 70
Glycerol _______________________________________________________________________ 77

2.3 Initial method for the preparation of inserts ___________________________________ 77
2.4 Factorial design of experiments _____________________________________________ 83
2.5 Characterisation of the extruded inserts ______________________________________ 84
Uniformity of content ____________________________________________________________ 84
Characterisation of the drying process ______________________________________________ 85
Tensile strength and elongation ___________________________________________________ 85
Water uptake of inserts __________________________________________________________ 86
Drug release measurement _______________________________________________________ 86
3 Results and discussion __________________________________________________ 87
3.1 Uniformity of content _____________________________________________________ 87
3.2 Characterisation of the drying process _______________________________________ 91
3.3 Tensile strength and elongation _____________________________________________ 93
3.4 Water uptake of inserts ___________________________________________________ 97
3.5 Drug release measurement ________________________________________________ 99
4 Conclusion ___________________________________________________________ 101
Chapter 4: Further development of an ocular insert with slow release properties loaded
with lysozyme
1 Introduction _________________________________________________________ 106
2 Materials and methods ________________________________________________ 108
2.1 Materials ______________________________________________________________ 108
2.2 Preparation of ocular inserts ______________________________________________ 108
2.3 Factorial design and statistical analysis ______________________________________ 113
2.4 Visual appearance and texture ____________________________________________ 114
2.5 Uniformity of drug content _______________________________________________ 114
2.6 Water uptake __________________________________________________________ 115
2.7 Viscosity measurements __________________________________________________ 115
2.8 In vitro drug release studies _______________________________________________ 115

2.9 Drug release analysis_____________________________________________________ 116
3 Results and discussion _________________________________________________ 117
3.1 Visual appearance and texture _____________________________________________ 117
3.2 Uniformity of drug content ________________________________________________ 117
3.3 Water uptake___________________________________________________________ 119
3.4 Viscosity measurements __________________________________________________ 121
3.5 Release profile __________________________________________________________ 122
3.6 Release kinetics _________________________________________________________ 126
4 Conclusion __________________________________________________________ 127
Chapter 5: Optimisation of the preparation of ocular inserts loaded with sodium
fluorescein, lysozyme and bovine serum albumin
1 Introduction _________________________________________________________ 132
2 Materials and methods ________________________________________________ 133
2.1 Materials ______________________________________________________________ 133
2.2 Preparation of ocular inserts ______________________________________________ 133
2.3 Factorial design and statistical analysis ______________________________________ 138
2.4 In vitro drug release studies _______________________________________________ 139
2.5 Drug release analysis_____________________________________________________ 139
3 Results and discussion _________________________________________________ 140
3.1 In vitro drug release studies _______________________________________________ 140
Sodium fluorescein ____________________________________________________________ 140
Lysozyme from chicken egg white _________________________________________________ 142
Bovine serum albumin __________________________________________________________ 143
Influence of molecular weight ____________________________________________________ 145
Viscous polymer drug solution ___________________________________________________ 147
3.2 Drug release analysis_____________________________________________________ 149
Sodium fluorescein ____________________________________________________________ 149
Lysozyme from chicken egg white _________________________________________________ 150

Bovine serum albumin __________________________________________________________ 151
4 Conclusion ___________________________________________________________ 152
Chapter 6: Release rate comparison between FITC-dextrans with different molecular
weight
1 Introduction _________________________________________________________ 156
2 Materials and methods ________________________________________________ 157
2.1 Materials ______________________________________________________________ 157
2.2 Preparation of ocular inserts ______________________________________________ 157
2.3 In vitro drug release studies _______________________________________________ 159
3 Results and discussion _________________________________________________ 161
3.1 Inserts with large dimensions _____________________________________________ 161
Rehydration period: three days ___________________________________________________ 161
Rehydration period: ten days _____________________________________________________ 163
Rehydration period: six weeks ____________________________________________________ 165
3.2 Inserts with small dimensions _____________________________________________ 166
Rehydration period: six weeks ____________________________________________________ 166
4 Conclusion ___________________________________________________________ 169
Chapter 7: Evaluation of cytotoxicity and viability of SV40-HCEC in the presence of blank
ocular inserts
1 Introduction _________________________________________________________ 172
2 Materials and methods ________________________________________________ 173
2.1 Materials ______________________________________________________________ 173
2.2 Preparation of inserts ____________________________________________________ 173
2.3 Cytotoxicity and biocompatibility __________________________________________ 173
3 Results and discussion _________________________________________________ 176
3.1 Cytotoxicity and biocompatibility __________________________________________ 176

4 Conclusion __________________________________________________________ 181
Chapter 8: Stability testing of inserts containing lysozyme
1 Introduction _________________________________________________________ 184
2 Materials and methods ________________________________________________ 185
2.1 Materials ______________________________________________________________ 185
2.2 Method _______________________________________________________________ 185
Activity ______________________________________________________________________ 185
Release profiles _______________________________________________________________ 186
Rheological measurement _______________________________________________________ 187
3 Results and discussion _________________________________________________ 188
3.1 Activity ________________________________________________________________ 188
3.2 Release profiles _________________________________________________________ 189
3.3 Rheological measurement ________________________________________________ 190
4 Conclusion __________________________________________________________ 192
Chapter 9: In vivo evaluation
1 Introduction _________________________________________________________ 196
2 Materials and methods ________________________________________________ 197
2.1 Materials ______________________________________________________________ 197
2.2 Method _______________________________________________________________ 197
Surgical induction of dry eye disease ______________________________________________ 197
Evaluation of ocular tissue damage ________________________________________________ 198
Tear volume measurement ______________________________________________________ 198
Tear collection ________________________________________________________________ 198
Flow cytometric analysis of tear fluid ______________________________________________ 198
Preparation of eye drops ________________________________________________________ 199
Preparation of insert ___________________________________________________________ 199
Experimental setup ____________________________________________________________ 200
3 Results and discussion _________________________________________________ 201

3.1 Evaluation of ocular tissue damage _________________________________________ 201
3.2 Tear volume measurement _______________________________________________ 202
3.3 Measurement of cytokine levels ___________________________________________ 203
4 Conclusion ___________________________________________________________ 207
General conclusions and future perspectives ___________________________________ 209
Summary _______________________________________________________________ 213
Samenvatting ____________________________________________________________ 217
Appendix
1 Regression analyses ___________________________________________________ 221
1.1 Sodium fluorescein ______________________________________________________ 221
1.2 Lysozyme from chicken egg white __________________________________________ 223
1.3 Bovine serum albumin ___________________________________________________ 225

LIST OF ABBREVIATIONS
AMD Age-related macular degeneration
Ang Angiopoietin
ANOVA Analysis of variance
API Active pharmaceutical ingredient
BPE Bovine pituitary extract
CI Confidence interval
DDS Drug delivery system
EGF Epidermal growth factor
EVA Ethylene-vinyl acetate
FDA US Food and Drug Administration
FGF Fibroblast growth factor
FITC Fluorescein isothiocyanate
Flt fms-like tyrosine kinase
G’ Storage modulus (elastic modulus)
G” Loss modulus (viscous modulus)
HEC Hydroxyethyl cellulose
HPC Hydroxypropyl cellulose
HPMC Hydroxypropylmethyl cellulose
IL-1α Interleukin-1α
KDR Kinase insert domain-containing receptor
K-SFM Keratinocyte-Serum-Free Medium
LVER Linear viscoelastic region
MC Methyl cellulose
Na CMC Sodium carboxymethyl cellulose
PBS Phosphate-buffered saline
PDGF Platelet-derived growth factor
Ph. Eur. European Pharmacopoeia
PLGA Poly-lactic-co-glycolic acid
PlGF Placental growth factor
PVA Polyvinyl alcohol
PVC Polyvinyl chloride
PVD Posterior vitreous detachment
PVP Polyvinyl pyrrolidone
RPE Retinal pigment epithelium
RSD Relative standard deviation
SAL Security assurance level
SV40-HCEC SV40-immortalised human corneal epithelial cells
Tm Thermal gelation temperature

TNF-α Tumour necrosis factor-α
TPPV Trans pars plana vitrectomy
USP US Pharmacopeia
UV Ultraviolet
VEGF Vascular endothelial growth factor
VEGFR Vascular endothelial growth factor receptor
VMT Vitreomacular traction

1
INTRODUCTION
Eye drops have been the most popular and best accepted dosage form for ocular delivery of drugs.
However, conventional eye drops have well known disadvantages such as low ocular availability
due to defence mechanisms of the eye. Frequent instillation is recommended or even required in
order to reach therapeutic levels of the drug at the site of action. Many attempts have been made
over several decades to increase the ocular availability and hence improve the efficacy of topically
applied drugs. This has led to the emergence of new drug delivery devices with common ambitions,
including decreasing the instillation frequency, prolonging the residence time of the drug applied
and thus improving patient compliance.
The discovery of novel peptides and proteins has led to some breakthroughs in the ophthalmic field.
For instance, proteins such as ranibizumab (Lucentis®) and bevacizumab (Avastin®, off-label use)
are used to treat age-related macular degeneration, a disease affecting people over the age of 50.
It is one of the leading causes of blindness and is characterised by an overgrowth of blood vessels
and leakage of blood in the macular region of the retina, which is responsible for visual acuity. There
is no permanent cure known for this disease and a monthly or two-monthly injection of an anti-
VEGF drug substance in the vitreous of the eye is required to inhibit the growth of blood vessels.
Although the efficiency and efficacy of intravitreal injections are difficult to match with topical
delivery of the drug, the development of a precorneal insert with slow release properties might be
worth considering as this can result in improved patient comfort and a significant reduction in
severe side effects associated with intravitreal injections. Furthermore, the burden that such
monthly ophthalmic injections pose on both the patient and the ophthalmologist can certainly not
be underestimated.
In the present research work, a drug delivery system (DDS) for ophthalmic use was developed to
allow thermolabile drugs, such as peptides and proteins, to be incorporated in an ocular insert with
slow release properties. Proteins pose specific challenges during formulation, production and
storage, for instance denaturation caused by shear forces applied to proteins, stability issues due
to elevated temperatures during the production of the DDS, air entrapment potentially causing
oxidation, etc.
The main objective of this research project was to develop a method of preparing rod-shaped ocular
inserts with slow release properties while maintaining drug stability of thermolabile molecules. This

2
method brings new opportunities to incorporate thermolabile molecules, which were not suited to
be loaded in slow-release formulations earlier. Consequently, this might also allow molecules to be
administered topically as most peptides and proteins are currently administered through injection.
As storage time and temperature might have a significant influence on the drug and drug carrier
stability, the stability of the inserts was verified by means of activity assay, rheological
characterisation and release profiles.
Finally, the in vivo behaviour of the inserts was examined in rats with dry eye disease.
The method of developing this DDS might become interesting in the future, as more therapeutic
peptides and proteins for ocular use will emerge.

Chapter 1: Biopharmaceutical aspects of ocular drug delivery

4
1 GENERAL ANATOMY AND STRUCTURES OF THE EYE
1.1 Anatomy of the eye
The human eye is a very complex optical system and of great importance for everyday life. It detects
light and converts it into electro-chemical signals which in turn are converted to impulses in
neurons, located in the brain. For a better understanding of the complexity of the human eye, the
anatomical overview is given in figure 1 [1,2].
Fig. 1. Anatomy of the human eye. Figure adapted from myvmc.com [3].
The wall of the eyeball is made up of three major layers: the outer coat, the uveal coat, which is
located underneath, and the retina being the inner layer.
The outer coat is built up from sclera, better known as the white part of the eye. The sclera consists
of a connective tissue coat encircling the entire surface of the eye except anteriorly, where it
continues in the cornea. The cornea is a transparent tissue which is entirely avascular under normal
physiological conditions. It is segmented into three different layers: the outer layer being the
epithelium, the stroma making up the largest part of the cornea and the inner layer being the
endothelium [4]. The anatomy and function of the cornea will be discussed further in section 1.2.2.1
corneal absorption.

5
The sclera provides an anchoring site for the extrinsic eye muscles (superior and inferior rectus
muscle) and is almost entirely avascular in healthy humans. It is also responsible for the retention
of the shape of the eyeball and protects the internal structures such as the retina and the lens. The
sclera and the inner surface of the eyelids are covered by a thin and transparent, but highly
vascularised layer, called the conjunctiva. It is composed of a non-keratinised epithelium with
goblet cells which lubricate the surface of the eye by secreting mucus. The conjunctiva that lines
the inner surface of the eyelids is called palpebral conjunctiva. The conjunctiva that covers the eye
itself is referred to as the bulbar conjunctiva; the area where the bulbar and the palpebral
conjunctiva meet, is referred to as the fornix or conjunctival sac [5].
The uveal coat is the middle layer of the eye wall and contains the choroid. It is highly vascularised
in order to provide nutrition and gases mainly to the iris and ciliary body but also to the lens, retinal
layer and sclera. The ciliary body is attached to the lens through suspensory ligaments and is
responsible for the shape of the lens. The uveal coat is also very important for the optical properties
of the retina. Due to its dark colour, the uveal coat absorbs light that is transmitted through the
sclera, improving the contrast of the image that the retina registers [5]. The choroid is situated
between the sclera and Bruch’s membrane. Bruch’s membrane is a thin, acellular membrane
between the retinal pigment epithelium (RPE) and the choroid, regulating fluid permeability and
nutrient transport [6,7]. The build-up of the eyewall and specifically the macular region is illustrated
in more detail in figure 2.
Fig. 2. Cross-section of the eyewall in the macular region. Figure adapted from Yuan X. et al. [8].
6
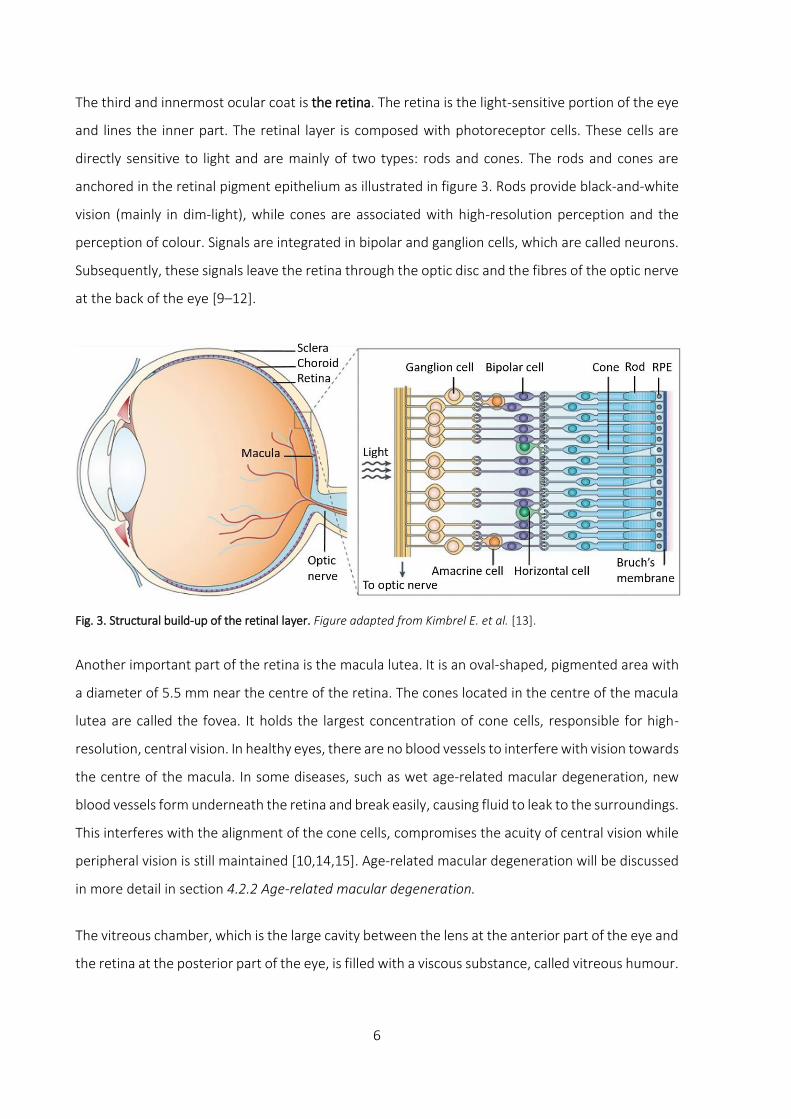
The third and innermost ocular coat is the retina. The retina is the light-sensitive portion of the eye
and lines the inner part. The retinal layer is composed with photoreceptor cells. These cells are
directly sensitive to light and are mainly of two types: rods and cones. The rods and cones are
anchored in the retinal pigment epithelium as illustrated in figure 3. Rods provide black-and-white
vision (mainly in dim-light), while cones are associated with high-resolution perception and the
perception of colour. Signals are integrated in bipolar and ganglion cells, which are called neurons.
Subsequently, these signals leave the retina through the optic disc and the fibres of the optic nerve
at the back of the eye [9–12].
Fig. 3. Structural build-up of the retinal layer. Figure adapted from Kimbrel E. et al. [13].
Another important part of the retina is the macula lutea. It is an oval-shaped, pigmented area with
a diameter of 5.5 mm near the centre of the retina. The cones located in the centre of the macula
lutea are called the fovea. It holds the largest concentration of cone cells, responsible for high-
resolution, central vision. In healthy eyes, there are no blood vessels to interfere with vision towards
the centre of the macula. In some diseases, such as wet age-related macular degeneration, new
blood vessels form underneath the retina and break easily, causing fluid to leak to the surroundings.
This interferes with the alignment of the cone cells, compromises the acuity of central vision while
peripheral vision is still maintained [10,14,15]. Age-related macular degeneration will be discussed
in more detail in section 4.2.2 Age-related macular degeneration.
The vitreous chamber, which is the large cavity between the lens at the anterior part of the eye and
the retina at the posterior part of the eye, is filled with a viscous substance, called vitreous humour.

7
The external surface of the eye is protected by the eyelids. They lubricate the surface of the eye by
spreading tear fluid by blinking. On average, the human eye voluntarily blinks about 10-20 times
per minute (periodic blinking) and is highly dependent on the medical condition of the individual.
Stimulation of the highly innervated cornea by a foreign substance can elicit a rapid series of
repeated and involuntary blinking of the eyelids in order to remove the foreign substance from the
eye surface [16]. This process is called corneal reflex or reflex blinking and is often accompanied
with tear secretion, draining the foreign substance towards the lachrymal puncti as depicted in
figure 4. The puncti are small openings on the inside of the upper and lower eyelids and allow
drainage of tear fluid, collected via the lachrymal canaliculi in the lachrymal sac and eventually
ending up in the nasal cavity through the nasolachrymal duct. Additionally, the eyelids aid in the
regulation of light entering the eye [4,17,18].
Fig. 4. Overview of the lachrymal drainage system. Figure adapted from Benjamin Cummings Accessory Structures
of the Eye [19].
Tear glands, found in the upper-outer orbit of each eye, are responsible for the production of
lachrymal fluid, the main component of tears. The production of tears is very important for
lubrication, cleaning and protection of the ocular surface. Tear fluid serves as a pool for many ions
and molecules such as potassium, sodium, glucose, urea, immunoglobulin, lactoferrin, lipocalin,
lacritin, lysozyme, mucin and lipids. Therefore, tear fluid and the movement of the eyelids serve as
an important barrier against foreign substances [20–25].
8
1.2 Ocular barriers and availability of topically applied drugs
Topical delivery of drugs through eye drops into the lower fornix (cul-de-sac) is probably the easiest
way of administrating drugs to the eye for the treatment of ocular diseases or for diagnostic
purposes. Because of its ease of use, eye drops (especially when low viscous) are well accepted by
patients causing little to no discomfort when formulated properly [26].
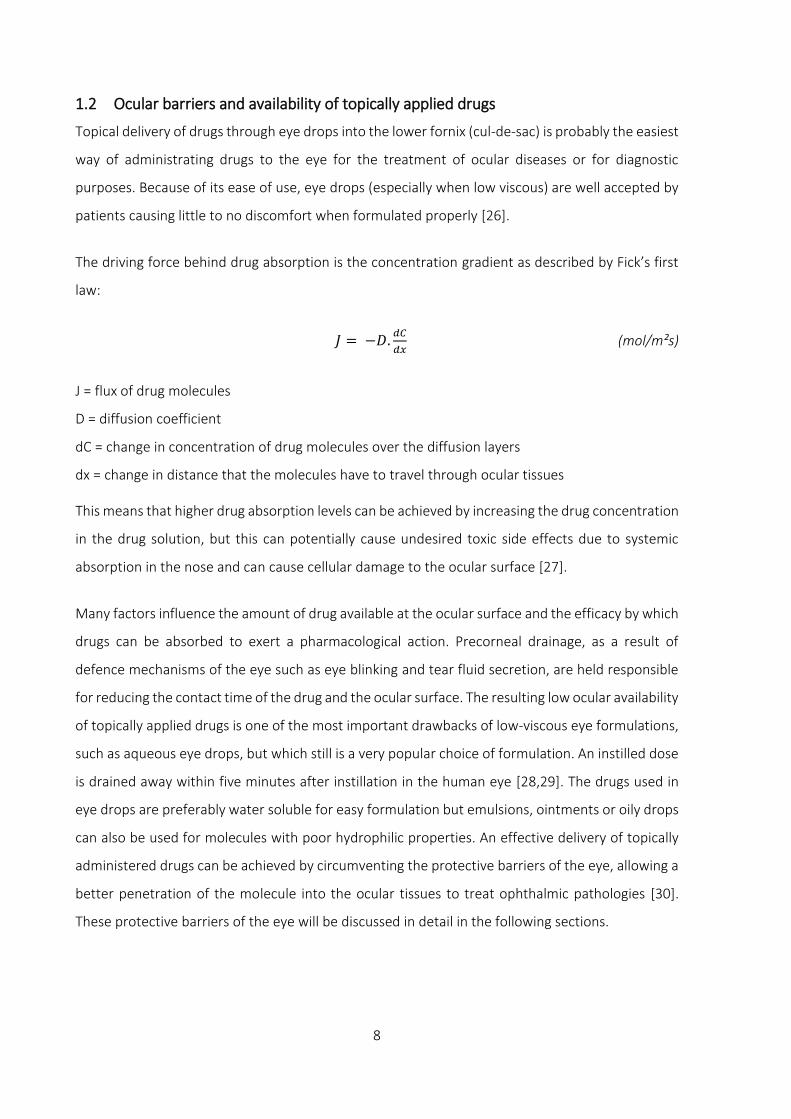
The driving force behind drug absorption is the concentration gradient as described by Fick’s first
law:
𝐽 = −𝐷.𝑑𝐶
𝑑𝑥 (mol/m²s)
J = flux of drug molecules
D = diffusion coefficient
dC = change in concentration of drug molecules over the diffusion layers
dx = change in distance that the molecules have to travel through ocular tissues
This means that higher drug absorption levels can be achieved by increasing the drug concentration
in the drug solution, but this can potentially cause undesired toxic side effects due to systemic
absorption in the nose and can cause cellular damage to the ocular surface [27].
Many factors influence the amount of drug available at the ocular surface and the efficacy by which
drugs can be absorbed to exert a pharmacological action. Precorneal drainage, as a result of
defence mechanisms of the eye such as eye blinking and tear fluid secretion, are held responsible
for reducing the contact time of the drug and the ocular surface. The resulting low ocular availability
of topically applied drugs is one of the most important drawbacks of low-viscous eye formulations,
such as aqueous eye drops, but which still is a very popular choice of formulation. An instilled dose
is drained away within five minutes after instillation in the human eye [28,29]. The drugs used in
eye drops are preferably water soluble for easy formulation but emulsions, ointments or oily drops
can also be used for molecules with poor hydrophilic properties. An effective delivery of topically
administered drugs can be achieved by circumventing the protective barriers of the eye, allowing a
better penetration of the molecule into the ocular tissues to treat ophthalmic pathologies [30].
These protective barriers of the eye will be discussed in detail in the following sections.

9
Precorneal factors
1.2.1.1 Drainage of the drug solution
A tear film covers and protects the ocular surface. It also has multiple purposes such as providing
nutrition to the epithelial cells and lubricating the surface of the eye. The tear film has a volume of
approximately 7 µl [31,32]. Tear fluid, mainly consisting of water, lipids and mucins, is produced by
cooperation of different glands and is distributed during blinking of the eyelids resulting in a thin
tear film over the entire ocular surface. The water of the tear film is produced by the main lachrymal
gland and the Krause and Wolfring accessory glands as shown in figure 5 [33].
Fig. 5. Overview of various gland and eyelid structures. Figure adapted from studyblue.com [34].
A significant part of this layer evaporates (10%), while the remaining solution will be drained
through the puncti due to periodic blinking. Since the tear film is relatively unstable, it has to be
renewed frequently and continuously and is indicated by the term tear turnover. The basal tear
turnover rate is estimated to be at 1.2 µl/minute [35,36]. The basic structure of the tear film is
illustrated in figure 6.

10
Fig. 6. Structure of the tear film. Figure adapted from nfburnetthodd.com [37].
Mucins are large glycoproteins produced by goblet cells. They can be categorised in either
transmembrane or secretory mucins. The glycocalyx is a layer of transmembrane mucins which are
anchored on the apical surface of the corneal epithelial cells and are secreted by the cornea and
the conjunctiva. Secreted mucins play a prominent role as viscosity-enhancers of the tear film. It
protects the epithelia from damage, facilitates the movement of the eyelids and spreading of the
tear film [38–40]. The tear film does not only protect the ocular surface mechanically, but also
through secretion of antimicrobial enzymes by the tear glands, e.g. lysozyme. The presence of
certain ocular enzymes, mainly peptidases, limits the absorption of peptides due to their
metabolism and clearance. More specifically, endopeptidases, such as plasmin, and collagenase,
exopeptidases and aminopeptidases, which reside in the tear film and ocular tissues, form an
effective ophthalmic barrier for peptides [41,42].
The outer layer of the tear film is built up from meibum, an oily substance that prevents excessive
evaporation of the tear film. Meibum is produced by the Meibomian or tarsal glands, located at the
rims of the upper and lower eyelids. There are approximately 50 glands located in the upper and
25 glands in the lower eyelid. Meibomian secretion has a very complex composition. It is mainly
composed of various lipids such as sterol esters, wax esters, triacyl glycerol, free sterols, free fatty
acids and polar lipids (phospholipids). The lipid layer of the tear film has a biphasic structure. The
most hydrophobic, non-polar lipids are found in the superficial region of the lipid layer, while more
polar lipids are adjacent to the aqueous layer of the tear film. The non-polar lipids are thought of
controlling the evaporation rate of water from the aqueous layer [43–46]. Besides lipids, more than
90 different proteins could be identified, such as lysozyme C precursor, lactotransferrin, lipocalin 1,
lacritin precursor, defensin, etc. [23,25,47,48].

11
1.2.1.2 Mechanical removal of foreign substances
The cornea is strongly innervated with sensory axons of the trigeminal ganglion, making the cornea
very sensitive to external stimuli such as cold, touch or nerve stimuli. These sensory nerves are
located in the middle and anterior stromal layers and radially spread towards the middle of the
cornea. They respond to these stimuli by reflex blinking and inducing lachrymation, which in turn
causes administered drugs to be washed out [49,50].
When reflex blinking occurs, the amount of tear flow can vary between 3 to 400 µl/minute
triggering the eyelids to blink rapidly [36]. The combination of tear flow and rapid mechanical
movement efficiently removes foreign substances from the ocular surface. These mechanisms
accelerate the drainage of the instilled eye drop towards the puncti. It enters the nasal cavity
through the lachrymal sac and lachrymal duct where it can be absorbed through capillaries,
potentially resulting in systemic effects and side effects [51].
1.2.1.3 Conjunctival sac capacity
An aqueous eye drop typically has a volume of about 20-50 µl. But roughly half of it reaches the
ocular surface when instilled as the conjunctival sac only has a maximum capacity of 20-30 µl. The
conjunctival sac cannot accommodate any excess of fluid when this threshold is surpassed. As a
result, the instilled drop will flow over the cheeks and reflex blinking is induced causing a significant
amount of drug being lost [31,52].
1.2.1.4 Drug binding
Another precorneal barrier that needs to be considered, is drug metabolism (especially for
prodrugs) and proteins in the tear film that have drug binding properties. Examples of such proteins
are albumin, globulin and lysozyme. This binding can result in the formation of non-absorbable
complexes. These complexes with high molecular weight are unable to cross biological membranes
in order to bind to a receptor site [23,28,32,47,53].

12
Tissue barriers
The remaining part of the instilled eye drop that resides at the ocular surface still needs to penetrate
through the biological barriers. Topically applied drugs can reach intraocular tissues through the
corneal or through the conjunctival-scleral pathway (transscleral pathway) [54–56]. But
precorneally, the ocular drug absorption is mainly limited due to the very tight and selective
epithelium of the cornea and the less restricting epithelium of the conjunctiva and sclera [32,57].
1.2.2.1 Corneal absorption
Merely 1-5% of an applied dose will reach the inner eye either through the corneal route or the
transscleral pathway where an even smaller portion will be available to exert biological activity. To
reach therapeutic levels, eye drops need to be instilled frequently, compromising patient
compliance. Consequently, a frequent regime of instillations can also elevate the risk of toxic side
effects, due to higher systemic absorption. Frequent instillation also results in pulsed delivery of
the drug, meaning that a drug reaches high concentration levels shortly after instillation, followed
by underdosage after clearance of the drug as illustrated in figure 7 [5,26].
Fig. 7. Profiles of tear film concentrations after instillation. The curve in grey indicates the tear film concentration
after eye drop instillation, the curve in purple is indicative for a constant-rate releasing insert and the curve in blue
indicates other types of inserts. Therapeutic activity is reached when the dose is higher than the threshold of the
therapeutic level (indicated in green), but lower than the toxic level (indicated in red).
0
10
20
30
40
50
60
70
80
90
100
Dru
g co
nce
ntr
atio
n in
tea
r fl
uid
(A
U)
Time
Eye drops Toxic level
Constant-rate releasing insert Therapeutic level
Other inserts
13
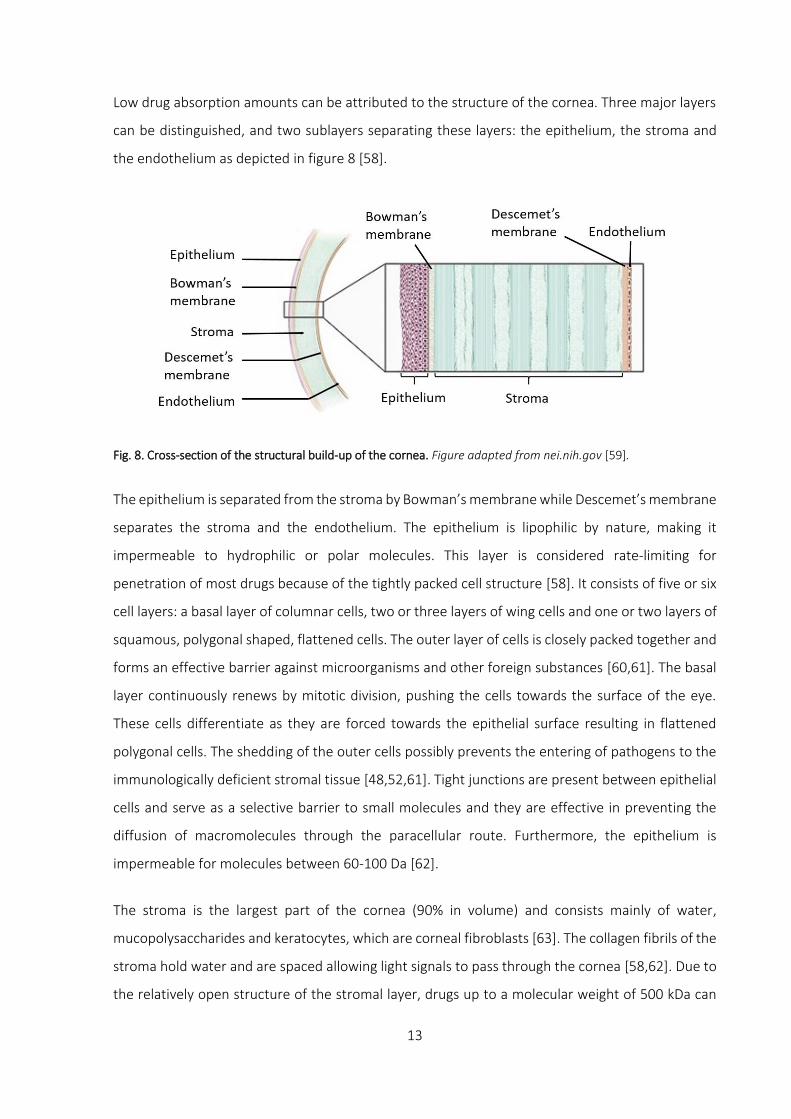
Low drug absorption amounts can be attributed to the structure of the cornea. Three major layers
can be distinguished, and two sublayers separating these layers: the epithelium, the stroma and
the endothelium as depicted in figure 8 [58].
Fig. 8. Cross-section of the structural build-up of the cornea. Figure adapted from nei.nih.gov [59].
The epithelium is separated from the stroma by Bowman’s membrane while Descemet’s membrane
separates the stroma and the endothelium. The epithelium is lipophilic by nature, making it
impermeable to hydrophilic or polar molecules. This layer is considered rate-limiting for
penetration of most drugs because of the tightly packed cell structure [58]. It consists of five or six
cell layers: a basal layer of columnar cells, two or three layers of wing cells and one or two layers of
squamous, polygonal shaped, flattened cells. The outer layer of cells is closely packed together and
forms an effective barrier against microorganisms and other foreign substances [60,61]. The basal
layer continuously renews by mitotic division, pushing the cells towards the surface of the eye.
These cells differentiate as they are forced towards the epithelial surface resulting in flattened
polygonal cells. The shedding of the outer cells possibly prevents the entering of pathogens to the
immunologically deficient stromal tissue [48,52,61]. Tight junctions are present between epithelial
cells and serve as a selective barrier to small molecules and they are effective in preventing the
diffusion of macromolecules through the paracellular route. Furthermore, the epithelium is
impermeable for molecules between 60-100 Da [62].
The stroma is the largest part of the cornea (90% in volume) and consists mainly of water,
mucopolysaccharides and keratocytes, which are corneal fibroblasts [63]. The collagen fibrils of the
stroma hold water and are spaced allowing light signals to pass through the cornea [58,62]. Due to
the relatively open structure of the stromal layer, drugs up to a molecular weight of 500 kDa can

14
penetrate. For highly lipophilic drugs, the hydrophilic stroma represents a rate-limiting barrier for
ocular absorption [4,29,58].
The endothelial layer is a single cell layer with a thickness of approximately 4-6 µm. Along the lateral
membrane, the endothelial cells exhibit a vast number of active pump sites for transport of ions.
The endothelial layer is held responsible for maintaining a normal corneal hydration by actively
pumping water out and restraining the influx of water from the aqueous humour of the eye.
Adequate water levels to keep the stroma transparent are required: water is actively pumped out
of the stroma through sodium-potassium adenosine triphosphate ATPase coupled to a bicarbonate
pump while the endothelial cells restrict entry of fluid from the aqueous humour by acting as a tight
barrier. These pumps account for 75% of all hydration activity of the cornea. As opposed to the
corneal epithelium, the cells of the endothelium are not nearly as closely in contact to each other.
This allows the endothelium to be more physiologically leaky for molecules to pass [58,64].
Molecules up to 70 kDa can penetrate through this layer [62].
Permeation of drug molecules through the cornea depends largely on the physicochemical
properties of the molecule. Lipophilic drugs penetrate through the transcellular route, while
hydrophilic molecules prefer the paracellular pathway. Both pathways involve passive diffusion
along the concentration gradient which is the primary mechanism for permeation across the
cornea. Due to the particular structural build-up of the cornea, strongly hydrophilic or lipophilic
molecules cannot permeate through the cornea as either the lipophilic epithelium or the
hydrophilic stroma will effectively block these molecules at a certain stage during penetration [64].
The lipophilic endothelium, being a monolayer of cells, does not have a significant blocking effect
on the entry of molecules. The epithelium is the main penetrant barrier of the cornea. It is
important to note that these cell layers act as effective barriers only when fully intact [58,65]. In
case of disease or in case of instillation of certain chemicals, the structure of the intercellular spaces
and tight junctions can be disrupted, causing a higher influx of drug molecules through the cornea.
For instance, the use of calcium chelators is well described in literature for disrupting tight
junctions. Corneal permeability changes on an epithelial level can also occur with amphiphilic,
surface active compounds such as glycosides, fatty acids, preservatives and topical anaesthetics
[2,4,65–67].

15
1.2.2.2 Conjunctival/scleral absorption
While the cornea is avascular, the conjunctiva is highly vascularised. The thin mucous membrane
lining the inside of the eyelids and the anterior sclera is known to be very permeable to a variety of
molecules. The permeability of the conjunctiva is approximately 20-times higher, compared to the
cornea and roughly double compared to the sclera [68]. Also, the relatively large, accessible surface
area of the conjunctiva towards an instilled eye drop contributes to the penetration of drugs in the
eye. The sclera is a hard, white layer giving the eyeball a tough construction. It is mainly built up
from collagen and elastin fibres [69]. The high degree of water content and a low amount of
proteolytic enzymes makes the transscleral pathway an interesting route for macromolecules
[54,55].
Although the conjunctival and transscleral routes are a possible pathway for the delivery of drugs
to the posterior segment of the eye, it is also considered to be an important route for drug loss due
to systemic absorption potentially leading to undesired side effects [69]. If an eye drop is instilled
in the fornix of the lower eyelid, permeation of the drug occurs for a large part through the
conjunctival pathway instead of through the cornea. The conjunctival epithelium also includes tight
junctions as an important barrier for drug penetration but the intercellular spaces in the conjunctiva
are not as closely packed compared to the tight junctions of the corneal epithelium [64,68,70,71].
For instance in rabbits, the conjunctival permeability for polar solutes was demonstrated to be
several times larger than the corneal permeability. Especially for hydrophilic and large molecules,
which show poor corneal permeability, the conjunctival/transscleral route is important for
delivering drugs to the uveal coat and the vitreous [55,56,72]. Therefore, the transscleral pathway
is becoming an important and alternative route for drug delivery of macromolecules, especially with
the gaining interest in peptide and protein delivery [54,56,72]. Studies have demonstrated the
possibility to deliver high molecular weight molecules up to 150 kDa across rabbit and porcine sclera
[54,55].
16
2 STRATEGIES IMPROVING TOPICAL OCULAR DRUG DELIVERY
As previously mentioned, poor ocular availability due to precorneal barriers and defence
mechanisms of the eye hinder topical delivery of drugs. More than 95% of the instilled dose does
not even reach the tissues targeted [28,71]. Over the course of decades, many attempts have been
made to increase the availability of the drugs administered and lengthen its action, albeit with
mixed results. One strategy involves maximising corneal absorption and thereby minimising
precorneal drug loss. Another possibility is to use drug delivery systems which provide a prolonged
residence time in order to increase drug delivery. An ideal dosage form might be one that is equally
easy to use as eye drops, creating little to no problem with vision but with a frequency of application
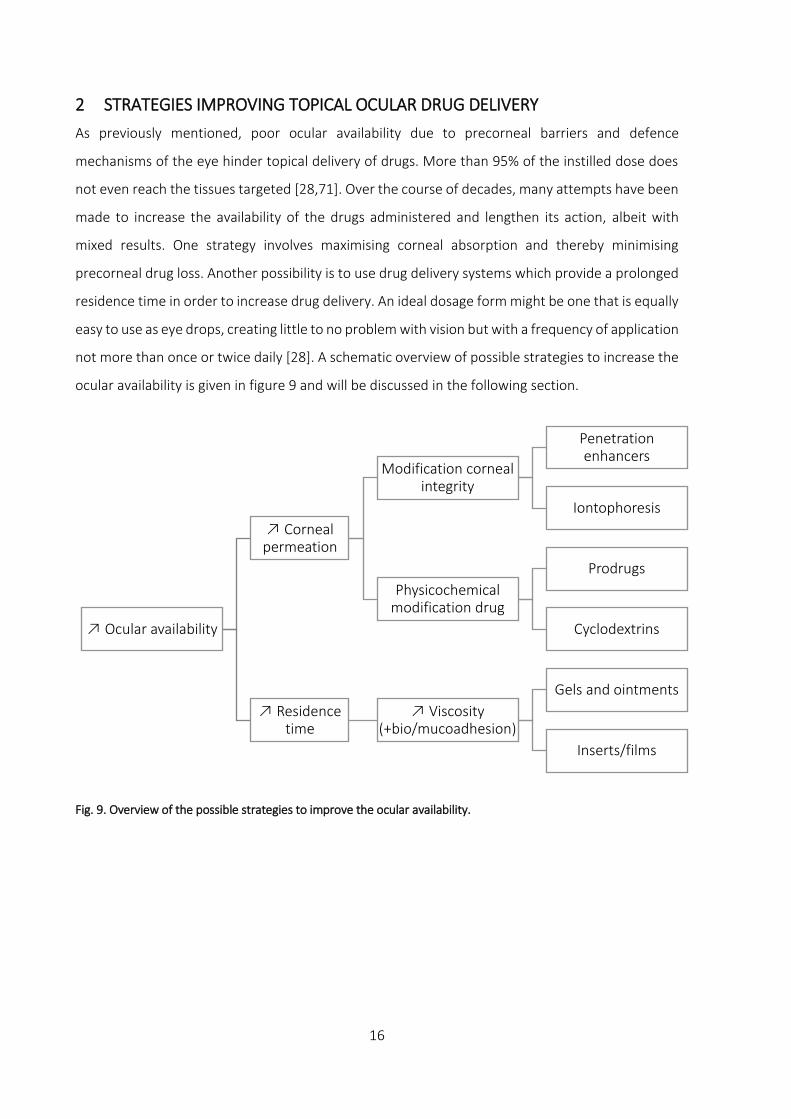
not more than once or twice daily [28]. A schematic overview of possible strategies to increase the
ocular availability is given in figure 9 and will be discussed in the following section.
Fig. 9. Overview of the possible strategies to improve the ocular availability.
Ocular availability
Corneal permeation
Modification corneal integrity
Penetration enhancers
Iontophoresis
Physicochemical modification drug
Prodrugs
Cyclodextrins
Residence time
Viscosity (+bio/mucoadhesion)
Gels and ointments
Inserts/films

17
2.1 Optimisation of ocular availability Increasing corneal permeation
The first strategy of ocular availability optimisation was set up in order to enhance the absorption
of drugs at the ocular surface. By optimising the ocular availability, not only is the retention and
penetration of the drug improved, the potentially toxic side effects are minimised. From a
theoretical point of view, this can be achieved by disrupting the epithelial barrier of the cornea with
chemical substances (penetration enhancers), by decreasing the tear turnover rate or by slowing
down drainage of the drug solution, for instance by sealing the puncti of the eyelids with tear duct
plugs (punctal plugs) [18,65,66,73]. Except for sealing the puncti, the aforementioned strategies
can only be accomplished by compromising the integrity of the protective mechanisms of the eye,
thereby increasing the risk of infection which is of course unacceptable for actual use in humans or
animals.
2.1.1.1 Modification corneal integrity
Penetration enhancers such as surfactants, fatty acids and some preservatives affect the stability
of the phospholipid membranes of the epithelial cells where they induce defects by changing the
physical properties of the cell membranes. Paracellular transport can be improved with the use of
for example EDTA. As EDTA complexes Ca²+ ions, which regulate the tight junctions, the integrity of
the tight junctions is compromised [73,74]. Another relatively intrusive technique is iontophoresis.
As opposed to the previously mentioned chemical techniques, iontophoresis is a physical method
to improve transport of drugs through the epithelial barriers by applying an electric current on the
tissues. The major drawback of this method is the use of specially designed electric equipment and
the risk of ocular damage that might occur [57,75,76]. This technique is used with success on a
limited scale for ocular delivery of large proteins, such as bevacizumab (149 kDa), but the true role
of iontophoresis in ophthalmic drug delivery still needs to be identified [77]. The use of peptides
and proteins will be discussed in section 4 Ophthalmic delivery of peptides and proteins.
2.1.1.2 Physicochemical modification drug
Another less intrusive method of enhancing ocular availability is by modification of the
physicochemical properties of the drug. Permeation of the transcellular pathway can be promoted
by increasing the lipophilic nature of the drug of interest. A drug molecule with a log[octanol/buffer]
partition coefficient greater than 1 has good penetrating properties. However, a partition
coefficient greater than 2-3 does not further increase its permeability due to the hydrophilic barrier

18
of the stroma. Drugs can be made more lipophilic by derivatisation creating lipophilic prodrugs.
These prodrugs can be absorbed more easily than its active counterpart, to which it is converted
chemically or enzymatically after corneal penetration [26,78–80]. Unfortunately, the use of
prodrugs in topical ocular delivery is not very common for reasons of stability and solubility. Its
inherently lipophilic nature is unsuited for formulation of aqueous eye drops. Furthermore,
irritation to the ocular surface has limited its efficacy and clinical acceptability. A possible strategy
to diminish the local irritation is by complexation of prodrugs into cyclodextrins [78]. These
molecules are a group of homologous cyclic oligosaccharides consisting of six, seven or eight
glucose units, more specifically α-, β- and γ-cyclodextrin, which have the unique property of being
soluble in water, although having a lipophilic cavity in the centre. With many drugs, cyclodextrin
can interact and form complexes, including a lipophilic drug in the central cavity. For ocular
administration, hydroxypropyl-β-cyclodextrin is used as it does not have cytotoxic properties [81–
84]. The use of cyclodextrins shows great potential for drugs that are poorly water soluble, unstable,
irritating or difficult to formulate, but a real breakthrough fails to appear to date.
Improving residence time
2.1.2.1 Viscosity increase
Increasing the viscosity is a very effective approach to increase the drug concentration in the tear
film and to improve ocular availability. A higher viscosity of the drug carrier slows down drug
elimination from the precorneal site, reducing precorneal drug loss and improving ocular retention
and therapeutic efficacy [26,32,84,85].
Except for dermal use, ointments can also be employed for ophthalmic application. The drug
availability is influenced by the solubility of the drug in the ointment, the release of the drug and
the ability to mix the ointment with tear fluid. The most important inconveniences of ointments are
interference with vision associated with visual discomfort and ocular mucosal irritation [86].
The viscosity of an ophthalmic solution can be modified by adding viscosifying agents, either
natural, synthetic or semisynthetic. An overview of different polymers used for ophthalmic
application is given in table 1.

19
Table 1. Non-limitative overview of different classes of viscosifying agents for ocular use.
Natural polymers Synthetic polymers Semisynthetic polymers
Guar gum, dextran gum,
xanthan gum, sodium
alginate, carrageenan,
chitosan, sodium hyaluronate
Polyvinyl alcohol, polyvinyl
pyrrolidone, polyacrylic acid
Hydroxyethyl cellulose,
hydroxypropylmethyl
cellulose, hydroxypropyl
cellulose, methyl cellulose,
sodium carboxymethyl
cellulose
Natural polymers include botanical polysaccharides (guar gum), microbial polysaccharides (dextran
and xanthan gum), algal polysaccharides (sodium alginate, carrageenan) and animal
polysaccharides (chitosan, sodium hyaluronate). The most common synthetic polymers are
polyvinyl alcohol (PVA), polyvinyl pyrrolidone (PVP) and polyacrylic acid (carbomer). Semisynthetic
polymers include cellulose derivatives such as hydroxyethyl cellulose (HEC), hydroxypropylmethyl
cellulose (HPMC), hydroxypropyl cellulose (HPC), methyl cellulose (MC) and sodium carboxymethyl
cellulose (Na CMC) [87]. Compared to low-viscous eye drops, the commercially available 1% (w/V)
suspension of fusidic acid in a viscous aqueous carbomer base has demonstrated a delayed
elimination profile from the tear film [88]. In contrast, in 1986, Lee et al. concluded that increasing
the viscosity of the ocular solution only has a limited effect on improving the ocular retention and
the amount of drug absorbed. Increasing the viscosity can cause discomfort to the patient’s eye,
resulting in an increase in blinking frequency and drainage rate, which in turn is responsible for
faster drug elimination [28]. Viscous solutions based on a gelling agent are commercially used as
artificial tears without drug, e.g. Celoftal® eye drops (2% (w/V) HPMC), Lacrisert® (5 mg HPC) and
Vidisic® (carbomer 980, 2 mg/g) [1,89–91].
In an attempt to reduce or eliminate the viscosity associated issues, phase transition systems or in
situ gelling systems were developed. These systems are formulated as aqueous eye drops but shift
to a gel or solid phase upon instillation in the lower fornix. The gelling process is triggered by a
change in pH, activated by electrolytes present in tear film or by a change in temperature after
instillation in the lower fornix. Examples of polymers used for these applications are respectively
cellulose acetophtalate, gellan gum (Gelrite®) and poloxamer polymers. For patient compliance,
instillation as an eye drop has a major advantage over semisolid or solid devices. After the phase
20
shift has taken place, the higher viscosity of the in situ gelling system results in better ocular
retention of the drug and higher ocular availability [4,80,92–99].
Viscous eye drops are relatively easy to formulate, therefore easy to manufacture and provide
promising data about availability in animal models. However, a good correlation between human
eyes and animal eyes (e.g. rabbit models) is lacking, mainly due to a difference in blinking frequency
(3 times/h in rabbits compared to 1000 times/h in humans) and tear film composition (thicker lipid
layer in rabbit eyes) between both species [100].
2.1.2.2 Bio- and mucoadhesive dosage forms
When two materials, of which at least one is from biological origin, attach to one another, this can
be regarded as bioadhesion. Mucoadhesion in an ocular context is considered to be a property of
a formulation which interacts with the mucosal layer of the eye (e.g. the corneal or conjunctival
epithelium). It can be considered a type of bioadhesion [101]. The main advantage of
mucoadhesion for conventional ocular application is the intimate contact of the dosage form at the
site of absorption, thus enhancing the availability of the drugs applied. Another benefit of
mucoadhesive dosage forms is the residence time of the drug at the ocular surface being controlled
by the rate of mucus turnover instead of tear turnover. This prolongs the residence time of the drug
as the mucus turnover rate (once daily) is slower than the tear turnover rate [52,74].
For mucoadhesion to occur, a sufficient hydration or degree of swelling of the polymer is required
and is predominantly determined by the contact time between the substrate and the adhesive
polymer. When an adhesive polymer is applied to a substrate, interlinking of the polymer chains
and the substrate (e.g. mucus layer) will occur over time depending on the hydration degree of the
polymer [102–104]. However, water movement from the mucus layer towards the dosage form has
a larger impact on adhesion when compared to intermolecular forces between the polymer chains
and mucus [105]. Although mucoadhesion is a potentially useful phenomenon for topical drug
delivery, its effect is rather unreliable due to a different behaviour of mucoadhesive preparations
over a certain pH range, the varying turnover time and composition of mucus, and the disease
condition of the eye which might affect the outcome of mucoadhesion.
Furthermore, various researchers have reported differing results concerning mucoadhesion of a
given polymer due to different testing methods and individual interpretation [102]. Amongst the
most frequently used polymers showing interaction with the mucus layer are polyacrylic acid,

21
hyaluronic acid, chitosan and thiomers, which are capable of forming disulphide bonds with
cysteine structures in the mucosal layer [30,102,106]. Mucoadhesive polymers are generally
macromolecular hydrocolloids with a large number of hydrophilic functional groups establishing
electrostatic forces and hydrogens bonds in particular between the polymer and the mucus layer
[101].

22
3 INSERTS
Inserts can be described as preparations with a solid or semisolid consistency with a shape and size
particularly suited for ophthalmic application, e.g. rods and shields. These devices are interesting
for ophthalmic use because the release rate of the drug can be controlled by choosing the
excipients thoughtfully. From a therapeutic point of view, the improved accurate dosing and longer
residence time leading to less systemic absorption are important benefits of using ocular inserts.
However, compared to eye drops, inserts are not very well accepted or tolerated by patients,
application is more difficult and a slow release of viscosifying agents can lead to interference with
vision [30,106,107]. Different types of inserts can be distinguished based on appearance or based
on properties such as solubility behaviour in the fornix of the eye. An overview of the classification
of ophthalmic inserts is given in figure 10.
Fig. 10. Classification of ophthalmic inserts.
When the insert is placed in the conjunctival sac, tear fluid will immediately begin to penetrate into
the matrix of the insert. Processes of swelling and polymer chain relaxation will occur which in turn
will cause drug molecules to diffuse out of the insert and in case of non-crosslinked polymer
matrices, dissolution of the matrix will take place [106]. In the following section, a classification of
ophthalmic solid dosage forms will be discussed in more detail.
Inserts
Drug reservoir systems
Diffusional systems
Osmotic systems
Matrix systems
Insoluble inserts
(contact lenses)
Soluble and bioerodible inserts

23
3.1 Classification of ophthalmic solid dosage forms
The composition and solubility of ophthalmic solid dosage forms will be used for the classification
of different formulations. Firstly, drug reservoir systems such as diffusional and osmotic systems and
secondly, matrix systems subdivided into soluble and insoluble systems will be discussed.
Drug reservoir systems
Drug reservoir systems are devices involving a reservoir comprising the drug of interest and which
is in close contact to the inner surface of the rate controlling membrane of the device. This reservoir
contains a liquid, gel, colloid, semisolid, solid matrix or a carrier-containing drug dispersed
homogeneously or heterogeneously, or dissolved therein.
3.1.1.1 Diffusional systems
Diffusional systems are composed of a central drug reservoir enclosed by semipermeable,
transparent membranes which allow the drug to diffuse out of the reservoir compartment at a
predetermined rate. The best known ocular device of this type is Ocusert®. This insoluble insert was
designed for the treatment of glaucoma. The dimensions of the elliptically shaped Ocusert® dosage
form are 13.4 mm x 5.7 mm with a thickness of 0.3 mm. This ocular device consists of a reservoir
containing pilocarpine alginate and is limited above and below by a thin, transparent, rate-
controlling ethylene-vinyl acetate (EVA) membrane. A ring made of EVA and impregnated with
titanium dioxide for visual purposes, encloses the reservoir circumferentially. The build-up of the
Ocusert® insert is schematically presented in figure 11.
Fig. 11. Schematic overview of the Ocusert® dosage form.
A zero-order release rate is obtained if all variables such as the total surface area, thickness of the
insert and concentration gradient remain constant during the diffusional process. Advantages of
the device include therapeutic effectiveness and continuous release rate over a period of seven
days, less effect on accommodation, less miosis, convenience for the patient and improved
compliance for patients who must rely on others for treatment (e.g. children and the elderly). Some

24
disadvantages that were encountered, were the need for instruction and encouragement of
patients; retention difficulties, with some patients being unaware when the device was lost,
occasional side effects of a cutting sensation (as when the Ocusert® sometimes doubles over),
movement of the insert in the eye, transient blurring of vision and miosis, and high cost. Although
from a technological point of view, diffusional systems are very interesting for ophthalmic
application, there is a large category of drug molecules that cannot be delivered by these devices
because of at least one feature adversely affecting their rate of release from the system or
preventing the release of the active agent from the system altogether. For example, many agents
cannot be delivered from a diffusion controlled delivery system because their permeation rate
through the rate controlling material is too low for a sufficiently high therapeutic effect. Another
possible reason is the inability of drug molecules to diffuse through the rate controlling membranes
due to their molecular weight or because a suitable membrane material has not been identified
yet. Also, chemical characteristics of the drug may prevent a successful diffusion through the
membranes, limiting its use. For instance, some salts will not diffuse because of their ionic character
through most polymers and polymeric-like materials [30,84,106,108,109].
3.1.1.2 Osmotic systems
Osmotic inserts are the most often described devices in patent literature and can be divided into
two major types. The first type consists of a central part which is surrounded by a peripheral part.
The central part is generally composed of a single reservoir containing the drug of interest with or
without an osmotic solute dispersed through a polymeric matrix. In this case, the drug is
surrounded by the polymer as discrete small deposits. In the second case, the drug and the osmotic
solutes are placed in two separate compartments. The drug reservoir is surrounded by an elastic
impermeable membrane while the osmotic solute reservoir is surrounded by a semipermeable
membrane. The peripheral part of these osmotic inserts are comprised of a film covering made of
an insoluble semipermeable polymer. As the insert is placed in the lower conjunctival sac, tear fluid
starts to diffuse into the peripheral deposits through the semipermeable polymeric membrane
causing the deposits to hydrate and inducing dissolution of the drug molecules. The hydrated
deposits create a hydrostatic pressure pushing against the polymer matrix, which in turn causes
apertures in the structure as the dosage form ruptures. Through these apertures, the drug is
released in the conjunctival sac by means of osmosis which is initially characterised by zero order
kinetics. As the insert disintegrates over time, the apertures become more interconnected, thereby
releasing the drug molecules in a non-constant diffusional manner [30,107,110].

25
Matrix systems
In a matrix system, the drug is dispersed throughout the entire matrix and released by means of
diffusion, erosion or a combination of both.
3.1.2.1 Contact lenses: insoluble ophthalmic drug delivery systems
Contact lenses are drug delivery devices made up of a covalently crosslinked hydrophilic or
hydrophobic polymer forming a three-dimensional matrix capable of retaining water, aqueous
solutions or solid components. Several studies have demonstrated great potential for topical drug
delivery with a particular focus on corneal penetration and availability of topically applied
pharmaceutical agents. Generally, contact lenses are loaded by soaking them in a drug solution.
After applying the contact lens on the cornea, drug molecules are slowly released through
diffusional processes. This results in an initial high release of drug, followed by a slower, long-term
release during the next hours of lens wearing. This method of loading the drug into contact lenses
is attractive for delivery of antibiotics for severe infections and non-steroidal anti-inflammatory
drugs postoperatively. A drawback of this method is the relatively imprecise release rate compared
to other non-soluble ophthalmic systems with a rate-limiting membrane. The amount of drug
absorbed by the lens is mainly determined by parameters such as the material of the contact lens,
the soaking time and the drug concentration of the soaking solution, contributing to and resulting
in different release rates [111–116].
Bandage lenses are another type of contact lenses. A topical drug can be applied over the lens while
the lens is in situ used as a protective device. These lenses take up a certain amount of drug from
the tear film and acts as a reservoir in order to slowly release the drug [49,117].
Contact lenses have certain drawbacks, limiting their popularity. Firstly, contact lenses are
expensive and require careful manipulation by the patient as cleaning and rinsing procedures can
deteriorate contact lenses. Secondly, an issue closely related to the maintenance of these devices
is the insufficient exchange of air and other gases with the environment, although the emergence
of soft contact lens materials, for once-a-day use, have diminished this issue significantly.
Furthermore, covering the cornea might lead to severe eye conditions such as corneal
neovascularisation, eye infections such as bacterial or fungal keratitis as well as ‘contact lens
induced dry eye’ [25,118–122].

26
3.1.2.2 Soluble and bioerodible ophthalmic inserts
3.1.2.2.1 Soluble inserts
Soluble inserts for ophthalmic application are made up from one or more hydrophilic polymers that
undergo gradual dissolution in the presence of water. Being soluble implies that removal is not
necessary which is a major advantage over contact lenses. The release rate mainly depends on the
viscosity of the system and releases the drug slowly, lengthening the residence time of the drug at
the ocular site. It is important to point out that the terms ‘soluble’ and ‘erodible’ correspond to two
different chemical processes. If an insert is considered soluble, the main process involves
dissolution through polymer swelling in the presence of water, while erodible devices correspond
to a hydrolytic process where a chemical or enzymatic hydrolytic reaction leads to solubilisation of
the polymer or degradation to smaller water-soluble molecules. These polymers may undergo bulk
or surface hydrolysis. If a drug is dispersed in a polymeric matrix, as in case of swelling-controlled
devices, the rate of release is mainly determined by polymer swelling, polymer erosion (chemically,
physically or enzymatically), drug diffusion through the polymeric network or a combination of
these processes [107,123–126]. The process of polymer swelling and erosion is shown in figure 12.
Fig. 12. Swelling and erosion process of an HPMC hydrogel in water. Pictures have been taken every three hours
during 27 hours. The hydrogel (20% (w/w)) starts to hydrate and swell upon first contact with water. Parts of the
hydrogel that are in a highly swollen state, are not able to absorb more water and start to erode.

27
As mentioned earlier, after applying a soluble insert in the lower fornix, removal of the insert from
the site of application is not required as the insert is entirely soluble and will be drained through
the puncti of the eyelids. This is of great importance for patient comfort as inserting these devices
is the only manipulation required. Two major categories can be distinguished for soluble inserts,
based upon their composition. The first category represent inserts based on natural polymers, the
other on (semi)synthetic polymers.
Natural polymers
The best known natural polymers used to produce soluble ophthalmic inserts are collagen, gelatine
and chitosan [67,87,127,128]. Collagen was one of the first excipients described in literature for the
development of an ophthalmic insert. Bloomfield et al. were credited being the first to develop
collagen inserts as delivery systems for the antibiotic gentamicin. Drug loading of collagen inserts
occurs by soaking the insert into a drug solution. After placing the insert in the conjunctival sac, the
drug is released gradually from the matrix as the collagen dissolves in the aqueous environment of
the eye [129,130]. The residence time of drugs such as antibacterial, antiviral and anti-inflammatory
agents appeared to be lengthened when compared to traditional eye drops [131].
Another example of soluble inserts are so-called ocular shields. Collagen-based inserts were first
developed by Fyodorov et al. as a corneal bandage used after surgical operations and various eye
diseases. The collagen corneal bandages in the shape of contact lenses were proposed as an
alternative for soft contact lenses to protect the healing corneal epithelium after surgery [106].
Only later, collagen-based shields were also suggested as potential drug carriers for active
pharmaceutical ingredients (API) such as amphotericin B, ofloxacin and tobramycin [132–134].
Collagen, as being a natural polymer, is often obtained from porcine (Bio-Cor®, Bausch and Lomb)
or bovine (Medilens®, Chiron Ophthalmics) origin. The use of collagen shields has become
controversial, as the main problem arising from its use are inflammatory reactions and ulcerations
of the cornea in rabbits [106,134].
Another commonly used natural polymer for ophthalmic inserts is gelatine. The first soluble inserts
(lamellae) were made of glycerinated gelatine, containing different ophthalmic drugs. However, the
use of these inserts ended when more stringent rules for sterility were required [135]. If an
ophthalmic inserts based on a gelatine matrix is placed in the conjunctival sac, the lachrymal
secretion immediately causes the insert to dissolve. It is possible to convert the soluble gelatine

28
insert into a non-dissolving insert, if it is chemically or thermally treated to form a crosslinked
gelatine hydrogel. Such gelatine hydrogel (Gelfoam®, Pfizer) has been proposed as a carrier in
controlled ophthalmic drug delivery. The Gelfoam® device consists of a crosslinked gelatine sponge
which is loaded with the active ingredient by soaking the device in a solution containing the active
compound. In vivo studies have indicated that Gelfoam® is more effective than conventional eye
drops for delivery of pilocarpine, phenylephrine and tropicamide [66,67,128].
Synthetic and semisynthetic polymers
Ophthalmic inserts with a matrix based on synthetic (e.g. polyvinyl alcohol) and semisynthetic (e.g.
cellulose derivatives) polymers are the most frequently described type of inserts in literature
[110,130,136–139]. The preference for (semi)synthetic polymers above natural polymers stems
from their advantage of being well adapted for ophthalmic use, as well as their ease of
manufacturing by conventional methods including compression, compression moulding or
extrusion [137,138,140,141]. The drug release from these systems is characterised by two distinct
phases: the first one corresponds to the penetration of tear fluid into the insert that induces a high
release rate of drug by diffusion and forms a gel layer around the core of the insert. This external
gel formation induces a second phase marked by a decreased release rate of the drug incorporated,
but still mainly controlled by diffusional forces. The penetration of aqueous solvent into the matrix
followed by matrix swelling, dissolution of drug and the relaxation of the polymer chains inducing
erosion of the insert, also contribute to the drug release process. The dissolution of inserts can
bring up issues such as blurred vision as a result of the rapid penetration of lachrymal fluid causing
the polymer to dissolve, or expulsion of the insert. In order to reduce blurred vision, the
hydrophobic polymer ethylcellulose can be incorporated in the ophthalmic formulation to diminish
insert deformation [123,136,137,142]. Regarding the expulsion of the insert, this can be addressed
by using polymers with bio-adhesive properties such as carbomer, which is well-tolerated in low
concentrations [136,137,143,144].
Many attempts have been made by researchers in order to prolong the release of the drug.
Cellulose acetate phthalate in combination with gentamicin sulphate has been used in order to
reduce the drug solubility resulting in a prolonged drug release [136,137,145,146]. By using the co-
polymer of methacrylic acid (Eudragit®) as a coating agent, the release rate can also be decreased
[138,141].

29
Another well-known drug delivery device based on soluble polymers is Lacrisert®, commercialised
by Merck Sharp and Dohme in 1981 and still commercially available (although not in Belgium). This
ophthalmic device is not loaded with a drug and only consists of hydroxypropyl cellulose (HPC). It
weighs 5 mg, measures 1.27 mm in diameter and has a length of 3.5 mm. Lacrisert® has proven to
be useful for the treatment of dry eye disease and is placed in the lower fornix of the eye, where it
slowly dissolves over a time period of 6-8 hours. The HPC polymer is released in the lachrymal fluid
to stabilise and thicken the tear film [1,90,106,126].
3.1.2.2.2 Bioerodible inserts
These inserts mainly consist of bioerodible polymers such as crosslinked gelatine derivatives and
polyesters. They are marked by their ability to undergo chemical hydrolysis of chemical bonds and
thereby releasing the drug by means of dissolution. They are particularly suited for implants since
their use eliminates the step of removing the implant after the drug has been released from the
matrix. One of the main advantages of this type of polymer is the ability to modify the rate of
erosion by altering the chemical structure of the polymer during synthesis and by addition of
cationic or anionic surfactants. Generally, the release rate is increased when anionic surfactants are
used (e.g. sulphated derivatives) while cationic surfactants (e.g. alkylammonium derivatives) tend
to slow down the erosion rate. These advantages come with potentially severe drawbacks:
degradation products and the presence of residual solvents during the preparation of the polymer
can initiate inflammatory reactions in patients. Another concern is the significantly variable erosion
rates that erodible systems tend to show as a result of individual patient physiology and
lachrymation patterns [109,110,139,147–149].

30
Over several decades, researchers have been trying to develop inserts with various compositions in
order to provide a valuable alternative to conventional eye drops. The number of patents and
publications over the last few decades have been enormous. However, the number of commercially
available inserts is very limited. This can be attributed to the reluctance of clinicians and patients
to replace traditional ophthalmic solutions as well as the cost to formulate such ophthalmic inserts.
For diseases requiring a frequent instillation of eye drops, inserts can be regarded as a valuable
means of drug delivery. But the rather small number of patients benefiting from inserts as a drug
delivery device is commercially not interesting for the pharmaceutical industry.
In the future, the use of ophthalmic inserts is likely to increase as a result of the development of
new polymers, the emergence of new drugs characterised by short biological half-lives or systemic
effects, and also the need to improve the efficacy of ophthalmic treatments by ensuring an effective
drug concentration at the site of action over a longer period in time.

31
4 OPHTHALMIC DELIVERY OF PEPTIDES AND PROTEINS
4.1 Peptides and proteins as biopharmaceuticals in general
Peptides and proteins have emerged as a potentially powerful and interesting group of therapeutics
of the future [150–154]. They are estimated to be about 10% of the global market share (sales) of
pharmaceuticals. This market is currently growing at a greater pace than the market for small
molecules [155]. Peptides and proteins are generally regarded as being highly selective, highly
potent, efficacious, have a predictable metabolism while at the same time being relatively safe with
excellent tolerability. Especially peptides are truly interesting future therapeutics as they are
typically associated with lower production complexity compared to protein biopharmaceuticals,
combining the cost and development advantages of small molecules and biopharmaceuticals
[153,155,156].
But peptides and proteins have inherent drawbacks: e.g. they are physically and chemically instable
as these molecules tend to be prone to oxidation and hydrolysis, have a tendency for aggregation,
usually have short half-lives, fast elimination and low membrane permeability, and a significant risk
for immunogenicity [150,153,157–159]. A brief overview of possible stability issues of peptides and
proteins is given in figure 13.
Fig. 13. Overview of possible stability issues associated with peptides and proteins [158,160–166].
The majority of the therapeutic peptides and proteins are delivered through intravenous or
subcutaneous injections, to overcome issues of absorption, although not resolving issues related to
External conditions: temperature, pH, chemicals, shear forces, radiation, etc.
Physical instability
Denaturation
Aggregation
Adsorption
Chemical instability
Oxidation
Hydrolysis
Deamination
Polymerisation

32
low bioavailability due to conformational changes in protein structure, rapid metabolisation or
enzymatic degradation [155]. For instance, enzymes such as proteases and aminopeptidases are
held responsible for enzymatic degradation of peptides and proteins in the eye [150].
Oncology, neurology and endocrinology are the main driving forces of peptide and protein
therapeutics but immunology and infectious diseases are also important fields of discovery [151–
153,155]. Table 2 shows a non-limitative list of peptide and protein therapeutics with their major
therapeutic indication(s).
Table 2. Non-limitative overview of peptide and protein therapeutics [15,167–170].
Field of application Product Therapeutic indication
Oncology
Zoladex® (goserelin) Breast and prostate cancer
Velcade® (bortezomib) Multiple myeloma, mantle cell
lymphoma
Lupron®/Enantone®/Eligard®
(leuprorelin)
Prostate cancer, endometriosis
Avastin® (bevacizumab) Colorectal cancer, non-small-cell
lung cancer
Cardiovascular
Angiomax® (bivalirudin) Anticoagulant agent
Integrilin® (eptifibatide) Antithrombotic agent
Central Nervous System
Copaxone® (glatiramer) Multiple sclerosis
Rebif® (interferon β-1a) Multiple sclerosis
Plegridy® (peginterferon β-1a) Multiple sclerosis
Endocrinology
Humulin® (insulin) Diabetes mellitus type II
Byetta® (exenatide) Diabetes mellitus type II
Victoza® (liraglutide) Diabetes mellitus type II
Sandostatin® (octreotide) Acromegaly, metastatic carcinoid
tumours

33
Infection
Incivek® (telaprevir) Hepatitis C
Victrelis® (boceprevir) Hepatitis C
Fuzeon® (enfuvirtide) HIV
Pneumological Disorders
Xolair® (omalizumab) Persistent allergic asthma and
chronic idiopathic Urticaria
Hematological Disorders
Firazyr® (icatibant) Hereditary angioedema
Kalbitor® (ecallantide) Hereditary angioedema
Aranesp® (darbepoetin-α) Anaemia due to chronic kidney
disease
Auto-immune Disorders
Cimzia® (certolizumab) Crohn’s disease, rheumatoid
arthritis, psoriatic arthritis
Humira® (adalimumab) Rheumatoid arthritis, Crohn’s
disease, ankylosing spondylitis,
psoriatic arthritis
Enbrel® (etanercept) Rheumatoid arthritis, psoriatic
arthritis, ankylosing spondylitis,
plaque psoriasis
Remicade® (infliximab) Rheumatoid arthritis, Crohn’s
disease, ankylosing spondylitis,
psoriatic arthritis, plaque psoriasis
Gastrointestinal
Gattex® (teduglutide) Short bowel syndrome
Linzess® (linaclotide) Irritable bowel syndrome
Lactaid® (lactase) Lactose intolerance

34
Ophthalmology
Lucentis® (ranibizumab) Neovascular age-related macular
degeneration (wet-AMD)
Eylea® (aflibercept) Wet-AMD
Macugen® (pegaptanib) Wet-AMD
Jetrea® (ocriplasmin) Vitreomacular traction
Restasis® (cyclosporin A) Dry eye disease
Increasing obesity (endocrinology) and a profound desire for replacement of chemotherapeutics
(oncology) are linked to the development of these new types of drugs. Other fields of discovery
include oral, intranasal and transdermal delivery routes, but to a lesser extent. Unfortunately,
ophthalmology does not appear to be a field where a lot of peptide and protein research efforts
have gone to so far [153].
4.2 Treatment of eye disorders with peptides and proteins
Even though ophthalmic proteins only represent a very small share of the market, the use of
proteins for the treatment of certain eye disorders has been one of great consequence. For
ophthalmic application, topical delivery of therapeutic drugs is considered the most favourable
option for the treatment of ocular diseases due to patient comfort. As discussed previously, the
main challenge of topical drug delivery is to circumvent the ocular barriers which limit the efficacy
of the drugs administered to the eye [28]. But a systemic delivery of macromolecules such as
peptides and proteins has also been demonstrated for topically applied drugs [171]. Therefore, the
loss of peptides and proteins due to nasolachrymal drainage and hence systemic circulation and
the resulting side effects also need to be taken into account when designing ocular formulations.
This makes ocular injection currently the primary choice for protein delivery in the eye [153,172].
For certain ocular diseases such as uveitis, wound healing or ocular inflammation diseases (e.g. dry
eye disease), several peptides and proteins have been investigated and some have been
commercially exploited. Other experimental peptides and proteins are still under investigation
[173–180].
Proteins are currently being used for the treatment of some major retinal diseases. A description
of the most common protein-treated eye diseases is given in the following section.

35
Vitreomacular traction
The vitreous is the central part of the eyeball and is filled with 98% water and 2% proteins such as
collagen fibrils, glycosaminoglycan, opticin and hyaluronic acid, which is held responsible for the
gel-like consistency of the vitreous. The vitreous humour is encircled by a collagen membrane,
called the vitreous cortex [181,182]. From the age of four, the vitreous starts to liquefy and to
contract, which is a common process called synchysis and syneresis respectively. At a certain point,
the vitreous humour has contracted to such an extent that separation of the vitreous cortex and
retina starts to occur. The separation between the posterior vitreous cortex and the retina is called
posterior vitreous detachment (PVD). It is detected in half of subjects at the age of 50 and in almost
all of the subjects at the age of 80 and older. Under normal circumstances, PVD is asymptomatic
and results in a clean and complete detachment of the collagen fibrils between the macula and the
cortical vitreous [183,184]. The progression of PVD with age is shown in figure 14.
Fig. 14. Progression of posterior vitreous detachment. (L) represents the situation at birth. (R) represents the
situation after complete detachment of the vitreous cortex from the retinal layer. Figure adopted from
scottpautlermd.com [185].
If the vitreous is unable to fully detach from the macular area and continues to liquefy and contract,
this creates a traction on the foveal surface which typically results in distorted or reduced vision.
This condition is called vitreomacular traction (VMT) and is a sight threatening condition affecting
the elderly [181–183]. Until recently, the only viable treatment was trans pars plana vitrectomy
(TPPV) surgery, where the fibrils were mechanically released. Surgery has the associated risk of
hemorrhage, infection, retinal detachment, increased ocular pressure and cataract formation
[183].
36
Fig. 14. (L) represents vitreomacular traction where the posterior vitreous cortex did not fully detach from the retina.
(R) represents the situation three and a half months after an intravitreal ocriplasmin injection. Figure adapted from
Schumann R. et al. [186].
The US Food and Drug Administration (FDA) approval of the protein ocriplasmin (Jetrea®, 27.2 kDa)
in 2012 led to a breakthrough in VMT treatment. This product was developed by ThromboGenics®,
a spin-off company of the University of Leuven, Belgium. Ocriplasmin is the truncated form of the
human serine protease plasmin obtained from microplasminogen produced in a Pichia
pastoris expression system by recombinant DNA technology. It has proteolytic activity against
laminin and fibronectin, two major proteins involved in the vitreomacular attachment. This basically
means that the vitreous is enzymatically released from the macula, no longer resulting in traction
of the fovea. Ocriplasmin is administered through intravitreal injection giving ophthalmologists and
patients a valuable alternative to surgery. The effect of ocriplasmin treatment is visualised in figure
14. About one in four patients is successfully treated with ocriplasmin injections [104,181–
184,186,187].
Interestingly, topical delivery of ocriplasmin might be possible as some researchers have
demonstrated the possibility of repeated topical instillation in rabbits of ranibizumab, a molecule
with nearly twice the molecular weight of ocriplasmin [171]. Additionally, topical delivery of
ocriplasmin through the transscleral pathway into the vitreous humour could benefit from
synchysis, which is at the base of VMT itself [188].
Age-related macular degeneration
Proteins have also changed the treatment of age-related macular degeneration (AMD). AMD is a
common eye disease and an important cause of vision loss among people over age 50. It is the
leading cause of blindness in industrialised countries and is third worldwide. It is listed among the
top ten priority eye diseases by the World Health Organization [9,189–191]. Generally, two

37
subtypes of AMD are distinguished: a non-neovascular (dry) and a neovascular (wet) AMD type.
About 90% of all patients with AMD suffer from the non-neovascular type. Although the
neovascular type of AMD is less common, the prognosis of this subtype is much worse [191]. With
time, non-neovascular AMD can progress to neovascular AMD. Both types of AMD can be present
in the same patient in different eyes. A comparison between a normal macula, dry macular
degeneration and wet macular degeneration is given in figure 15.
As age advances, drusen, which are deposits of glycoproteins, lipids, collagen and other debris
accumulate extracellularly in the area between the retinal pigment epithelium and Bruch’s
membrane. A small amount of these drusen are fairly typical, but larger and more numerous drusen
can be an indication of AMD. Accumulation of drusen causes deformation of the retinal pigment
epithelium and can deprive the RPE from oxygen and nutrients. This can progress into neovascular
AMD, characterised by chronic oxidative damage which eventually stimulates the growth and
penetration of new blood vessels originating from the choroid into the retina. These vessels leak
lipid-rich fluid into the region of the macula, affecting the cells of the retina and resulting in rapid
loss of visual acuity. In haemorrhagic forms, blood sometimes leaks from these vessels through the
retina into the vitreous [10,11,191–199].
Fig. 15. Comparison between a normal macula, dry macular degeneration and wet macular degeneration. Figure
adapted from brightfocus.org [200].

38
For this reason, neovascular age-related macular degeneration is commonly called exudative AMD
or wet-AMD [14,201]. The process of growth of blood vessels in AMD appears to be mediated by
vascular endothelial growth factor (VEGF), a dimeric glycoprotein (signal protein) promoting
angiogenesis. Numerous ligands such as placental growth factor (PlGF), fibroblast growth factor
(FGF), angiopoietin-1 and -2 (Ang-1 and -2), platelet-derived growth factor (PDGF) and others play
an important role in angiogenesis, but there is a general consensus stating that the hypoxia-
inducible cytokine VEGF is the most important angiogenic factor and a crucial rate-determining step
in the process of angiogenesis [151,189,191,202–204].
VEGF-A is the first and most important member of the VEGF family that also includes PlGF, VEGF-
B, VEGF-C, VEGF-D and VEGF-E [190]. Four different isoforms of VEGF-A have been identified in
humans: VEGF121, VEGF165, VEGF189 and VEGF206. VEGF165 is the predominant isoform in ocular
neovascularisation processes. It is generally expressed in hypoxic conditions, where the growth of
new blood vessels restore the transport of oxygen molecules [205]. It exerts its action by binding
to tyrosine kinase receptors (VEGFR) on the cell surface, which are mainly expressed on endothelial
cells [190,199,206,207].
Wet age-related macular degeneration is currently treated with anti-VEGF antibodies such as
pegaptanib, bevacizumab, ranibizumab or aflibercept through injection in the vitreous of the eye
on a monthly or two-monthly basis [14,15,170,189,191,208–211]. The development of these
molecules resulted in a revolution in the management of wet-AMD. Still, after many decades of
research, the delivery of macromolecules to the posterior segment of the eye remains one of the
toughest challenges in ophthalmology [171,172,212,213]. Although other anti-VEGF molecules
such as small interfering RNA and tyrosine kinase inhibitors (lapatinib, sunitinib, sorafenib, axitinib
and pazopanib) have been developed, the previously mentioned drugs are the main choice of
treatment in the ophthalmic field of wet-AMD. It is important to note that there is no permanent
cure to date for this medical condition. An ongoing chronic treatment is therefore required [9,214].
An overview of the anti-VEGF agents that are currently used for the treatment of wet-AMD are
given in table 3.

39
Table 3. Overview of anti-VEGF agents currently used for wet-AMD treatment.
Pegaptanib Bevacizumab Ranibizumab Aflibercept
Trade name Macugen® Avastin® Lucentis® Eylea®
Molecule type 28-base ribonucleic
acid aptamer
covalently linked to 2
branched 20 kDa PEG
moieties
Recombinant
humanised full-
length antibody
Fab fragment
derivative from
bevacizumab
Recombinant
fusion protein
Biological
target
VEGF-A isoform 165 VEGF-A all
isoforms
VEGF-A all
isoforms
VEGF-A all
isoforms,
VEGF-B, PlGF
Molecular
weight
50 kDa 149 kDa 48 kDa 97 kDa
FDA approval
date
2004 Not approved for
wet-AMD
2006 2011
Pegaptanib (Macugen®, 50 kDa) is a pegylated RNA aptamer targeted against VEGF-A isoform 165.
It was approved by the FDA in 2004 and was the first anti-angiogenic therapy for the treatment of
wet-AMD [191,215,216]. The molecule is built up from a 28-base ribonucleic acid aptamer
covalently linked to two branched 20 kDa polyethylene glycol moieties [198]. It was proven that
pegaptanib was able to maintain vision in about 70% of eyes with wet-AMD, but was only able to
improve vision in about 10% of patients [191].
Bevacizumab (Avastin®, 149 kDa) is a recombinant humanised monoclonal antibody (full-length
antibody, mouse-derived) that was initially developed and FDA approved in 2004 as an angiogenesis
inhibitor for certain metastatic colorectal, lung and breast cancers [168,190,192]. The drug
substance is not FDA approved for ophthalmic use but nevertheless, starting from 2005-2006,
short-term promising results have been described when used off-label with little to no short-term
difference compared to ranibizumab. Due to the much lower cost of bevacizumab compared to
ranibizumab and aflibercept (roughly 40 times cheaper [210]), bevacizumab is extensively being
used for wet-AMD treatment despite the lack of enough clinical evidence supporting its long-term
safety and efficacy although comparative studies are continuously being published [191,198,217–
220].

40
Derived from bevacizumab, ranibizumab (Lucentis®, 48 kDa) is a recombinant humanised antibody
fragment (Fab fragment derivative, developed from the same parent mouse antibody as
bevacizumab) and was FDA approved in 2006 for treatment of wet-AMD through intravitreal
injection. Not being a full-sized antibody as opposed to bevacizumab, ranibizumab reduces the risk
of allergic reactions and can penetrate more easily through the vitreous humour [190,192,221]. It
does not only bind to VEGF165 but ranibizumab also inhibits all other isoforms of VEGF-A
[6,192,196,222]. Monthly intravitreal injections of ranibizumab have become the standard care for
patients suffering from this medical condition [212,214].
Aflibercept (Eylea®, 97 kDa) is a recombinant fusion protein acting as a VEGF-antagonist and
inhibiting the action of all isoforms of the VEGF-A family, VEGF-B and placental growth factor
[14,170,191,198,201,204]. It is the newest member of the anti-VEGF family and was approved by
the FDA in 2011 [6,198,204,216,223]. Aflibercept is a potent inhibitor of VEGF mainly due to its
strong binding affinity and pharmacokinetic profile potentially leading to prolonged duration of
clinical effect when compared to other anti-VEGF agents. As a result, fewer injections (two-
monthly) are required [197,201,210,224]. Aflibercept combines the truncated form of the fms-like
tyrosine kinase (Flt), the kinase insert domain-containing receptor (KDR), and the Fc portion of
human immunoglobulin G [201,223]. This means that aflibercept has two binding domains for VEGF
receptors and one for PlGF, enabling stronger binding capacities compared to earlier anti-VEGF
agents [204,223].
Corneal neovascularisation
Neovascularisation does not only occur at the back of the eye but the anterior segment is also
susceptible. Corneal neovascularisation involves the growth of new blood vessels in the cornea,
sprouting from capillaries of the pericorneal plexus [225,226]. Under normal physiological
circumstances, the cornea is highly innervated, but clear and avascular [49,204,223,227]. The
growth of blood vessels in the cornea can be induced by infectious, degenerative, traumatic,
ischemic and inflammatory insults and can cause corneal scarring, inflammation and oedema
[223,225,227]. Therefore, contact lens wearers are more prone to developing corneal
neovascularisation [225]. As mentioned earlier, VEGF plays an essential role in the formation of new
blood vessels and is the main culprit for corneal neovascularisation [204,226,228]. A number of
comparative studies have indicated more effective results comparing aflibercept and ranibizumab
to bevacizumab after intravitreal injection, but studies comparing topical delivery of different anti-

41
VEGF agents remain relatively limited [204,218,229,230]. It should also be noted that none of the
anti-VEGF molecules used for wet-AMD are FDA approved for corneal neovascularisation.
Dry eye disease
Another well-described ocular disease that can be treated with proteins is dry eye disease. Topical
delivery of cyclosporin A for the treatment of dry eye disease has gained a lot of interest in the past
decade and the development of formulations based on cyclosporin A have been widely explored
and commercialised [175,180,231–236]. Dry eye disease can be classified into two major groups:
aqueous tear-deficient dry eye and evaporative dry eye. Aqueous tear-deficient dry eye is marked
by an inability to produce or secrete sufficient tear fluid onto the eye surface due to a dysfunction
of the lachrymal glands. This can be caused by certain auto-immune diseases such as Sjögren’s
syndrome dry eye which activates T-cells in the exocrine glands. Evaporative dry eye is caused by
an excessive loss of water from the eye by evaporation. The most common cause for this type of
dry eye is Meibomian gland dysfunction which is responsible for the secretion of an oily substance
in the tear film, limiting the evaporation of water at the surface of the eye. The excessive
evaporation can lead to hyperosmolarity of the tear fluid which in turn activates a cascade of
inflammatory events. Inflammatory mediators are released at the epithelial surface which results
in epithelial damage and apoptosis, a loss of goblet cells and abnormal mucin secretion resulting in
tear film instability. Cyclosporin A is a cyclic undecapeptide produced by the fungi Tolypocladium
inflatum and Beauveria nevus. It is well known for its immunomodulatory properties to prevent
rejection of transplanted organs after surgery but cyclosporin A is currently also used in ophthalmic
applications for its anti-inflammatory properties interrupting the inflammatory cycle of dry eye
disease. Contrary to most other proteins, cyclosporin A is lipophilic and therefore formulated as a
topical emulsion which allows the patient to apply it as eye drops [234,237–241].

42
4.3 Formulation considerations for ocular (protein) delivery
Intravitreal aqueous injections are efficient in delivering the drug to the site of action, but they may
cause severe adverse side effects including endophthalmitis, retinal detachment, cataract, vitreous
haemorrhage, hyphema, uveitis, loss of visual acuity and increased intraocular pressure, especially
when chronic treatment is required [115,197,205,214,242,243]. Consequently, to reduce the risk
of endophthalmitis, 80% of the ophthalmologists use ophthalmic antibiotics following an
intraocular injection [214]. Although these events are relatively rare, the high cost of treatment and
severity of these complications cannot be disregarded [54]. Moreover, discomfort and
inconvenience associated with repeated and frequent intravitreal injections lead to poor patient
acceptance. The recommended volume of injection is merely 100 µl, which stresses the importance
of the drug potency required to treat ocular diseases intravitreally [205]. Repeated topical
administration of macromolecules would be advantageous as being non-invasive, but these types
of formulations are plagued with common issues of low availability especially when peptides and
proteins are involved [9,190,205,243]. An aqueous formulation of ranibizumab for the treatment
of wet-AMD is unlikely to be an effective therapeutic means as a very high frequency of topical
administration is required to reach sufficiently high levels of ranibizumab in the posterior segment
of the eye, although some researchers have suggested this possibility [171]. Therefore, current eye
research is focussing more towards transscleral pathways for topical delivery of macromolecules to
provide a viable alternative to invasive intraocular injections [54,55,77,172,216]. A slow-release
formulation might provide a good solution for delivery of macromolecules through the transscleral
route.
For the anterior segment of the eye as in the case of corneal neovascularisation, it is anatomically
easier to reach the affected tissue through repeated topical delivery, resulting in improved patient
comfort, reduced cost and lower complication rates [54,244]. The cornea is an effective barrier for
macromolecules under normal physiological circumstances, but a medical condition such as corneal
neovascularisation appears to change the structure of the cornea, making it susceptible for topical
treatment of proteins such as bevacizumab giving researchers the opportunity to reach tissues
which are otherwise impermeable [230].
Alternative vehicles can increase drug permeability to the ocular tissues. Sustained release of
peptides and proteins can theoretically be achieved after loading them into a carrier system such
as liposomes or biodegradable nanoparticles but a commercial entrance on the market fails to

43
appear to date [57,84,172,213,245–248]. Another formulation for drug delivery to the posterior
segment of the eye are intravitreal implants. After insertion in the vitreous, implants can release a
drug substance over a period varying from days to even years [26,249,250]. These implants can
deliver molecules when loaded into a reservoir system or when loaded into a matrix system. As
mentioned earlier, reservoir systems deliver molecules through zero order kinetics but do not allow
biodegradable polymers to be used. This implicates the necessity to remove the implant after drug
delivery, making matrix systems the more desirable option, despite non-zero order kinetics [9,205].
Marketed non-biodegradable implants are successfully and routinely being used for molecules such
as ganciclovir (Vitrasert®) or fluocinolone acetonide (Retisert® and Iluvien®) with the former being
indicated for retinitis and the latter for non-infectious posterior uveitis. Retisert® is said to remain
active up to two and a half years after injection while Vitrasert® remains active for over a year
[205,243,251–255]. Ozurdex® (dexamethasone) is a commercially available biodegradable implant
that is directly injected into the vitreous. It is used to treat macular oedema secondary to retinal
vein occlusion and non-infectious posterior and intermediate uveitis. The implant is built up of poly-
lactic-co-glycolic acid (PLGA), a biodegradable polymer that is more commonly known for
application in nanoparticle technology. The Ozurdex® implant can release the drug up to four
months [243,250,254,256,257].
Currently, commercially successful intravitreal implants loaded with peptides or proteins have not
been launched due to the nature of these molecules. Their susceptibility to denaturation and
degradation as well as their inherently short half-life challenges the formulation process
significantly [153,258–260]. But the excipients used for slow-release formulations can be
advantageous for protein formulation; excipients such as cellulose-ethers, PLGA, osmolytes and
others can stabilise peptides and proteins through surface activity, preferential exclusion, steric
hindrance of protein-protein interactions or by increasing viscosity and limiting protein structural
movement [258,261–271].

44
5 STERILISATION METHODS
A very important step in the development of a drug delivery system for ocular use is sterility of the
dosage form. Sterility is obviously required in order to prevent the spread of infection.
Nevertheless, absolute sterility cannot be verified. For this reason, a statistical definition of sterility
is given by the security assurance level (SAL) which is defined as the probability of a single viable
microorganism occurring in or on a product after sterilisation. Currently, sterility is regarded as
being achieved if the chance of finding a viable organism in or on a medical device is at most 1 in
1 000 000 or a SAL of at most 10-6 [272]. Ideally, a sterilisation technique should be fast and safe,
efficient, highly reliable and penetrant with a homogeneous distribution within the load. No
modifications should occur on both drug molecule or the drug delivery device after sterilisation.
Although many sterilisation techniques are currently available, each has its own advantages
and disadvantages. If none of the sterilisation methods can be employed, an aseptic
preparation method remains a possibility. An overview of the most common sterilisation
techniques that will be discussed in this section is given in figure 16.
Fig. 16. Overview of common sterilisation techniques [273].
Sterilisation methods
Heat
Steam sterilisation
Dry heat
Chemicals Ethylene oxide gas
Radiation
γ-radiaton
Electron beam
Non-ionising UV

45
5.1 Heat Steam sterilisation
Steam or moist heat sterilisation (autoclaving) is one of the most effective and most frequently
used sterilisation techniques of medical products. Sterility is obtained by exposing the product
directly to saturated steam at a temperature of typically 121 °C and a pressure of 1 bar or 132/134
°C and 2 bar in a pressurised sterilisation chamber during 15 to 30 minutes after all surfaces of the
product reach the indicated temperature. Lower temperatures (105-120 °C) can be used to prevent
degradation to materials, nutrients, polymers and other substances. Higher temperatures are used
for faster, flash sterilisation if the product can withstand these conditions. Sterilisation is based on
the thermal damage of metabolic and structural components (denaturation of proteins and nucleic
acids) that are essential for the replication of the microorganism [273–278].
Steam sterilisation is easy, safe and efficient with good penetrability. It is also relatively cheap and
rapid with no toxic residues. However, this technique has some important limitations: due to its
high temperature and moisture, it is incompatible with many products such as most peptides and
proteins.
Dry heat
Steam sterilisation is the preferred choice of sterilisation in case of heat-stabile products, but in
some cases where moisture is undesirable, such as powders and oils, dry heat can be useful. The
latent heat of vaporisation, used in steam sterilisation, transfers at least seven times more heat
compared to dry heat at the same temperature. This implicates that sterilisation through dry heat
requires much higher temperatures and longer sterilisation times for equivalent sterility levels. Dry
heat sterilisation is typically performed at temperatures above 160 °C for several hours (e.g. 160 °C
during two hours). Oxidation of cellular components is regarded as being the cause for microbial
inactivation [273–276,278].
The high temperatures involved with dry heat sterilisation make this method inapplicable for
sterilisation of drug delivery devices loaded with peptides and proteins.
5.2 Chemicals Ethylene oxide
The class of chemical sterilisation is very broad, but ethylene oxide gas is probably the most popular
choice of sterilisation through chemicals. Ethylene oxide sterilisation generally occurs at a
temperature of 55 °C, but temperatures between 25-65 °C are possible as well. The gas

46
concentration levels are set between 400-1500 mg/l during two to five hours. This sterilisation
technique has the advantage of having a very broad compatibility with most materials that are non-
liquid, contained in gas-permeable packaging and not compatible with heat sterilisation. It is
therefore a suitable choice of sterilisation of cellulosic materials such as HPMC. Sterilisation with
this gas has serious drawbacks, because it is highly toxic and mutagenic posing safety risks for
sterilisation personnel. Aeration is required as toxic ethylene oxide residues and reaction products
can occur [273–278].
5.3 Radiation Gamma radiation
Gamma radiation (γ-radiation) is the primary choice of sterilisation through radiation. The
radioisotope cobalt 60 (60Co) is used as the energy source to produce γ-rays. It decays into 60Ni and
an electron, emitting γ-rays in the process. These rays ionise cellular components such as nucleic
acids, which in turn leads to death of microorganisms. In addition, the formation of hydroxyl
radicals, causing DNA damage is responsible for its sterilising action. Gamma radiation has excellent
penetrating capabilities, making it a great choice for end-package sterilisation. The amount of dose
absorbed is expressed in kilogray (kGy). The radiation dose is approximately between 5-30 kGy with
25 kGy being the most commonly validated dose used for sterilisation of medical products. It also
has significant advantages opposed to the other sterilisation methods: it gives better sterility
assurance compared to filtration and aseptic processing techniques, it leaves no residues unlike
ethylene oxide and it is a low temperature process. However, there are some significant drawbacks
of using γ-radiation. Firstly, it is known to alter the structure of some polymers such as HPMC,
especially with increasing dose. Secondly, the formation of short-lived but highly reactive hydroxyl
radicals as a result of γ-rays interacting with water molecules makes it unsuited for sterilisation of
aqueous products, such as hydrogels. Finally, sterilisation through γ-radiation takes several hours
to complete [273,274,276–279].
Electron beam
The electron beam (E-beam) technique uses an ionising energy that differs from γ-radiation by its
low penetration and high dosage rates. The beam, made up from concentrated, highly energetic
electrons, is generated by the acceleration and conversion of electricity. As the product passes the
electron beam, energy from the electrons is absorbed. The high dosage rates allow the sterilisation
process to complete in seconds to minutes instead of hours as in case of γ-radiation. But the lower
penetrability limits the use of E-beams in favour of γ-radiation techniques [273,274,278].

47
Non-ionising UV radiation
Sterilisation through ultraviolet (UV) radiation is not ionising, which is a major difference compared
to the radiation methods mentioned above. The mechanism of sterilisation is based on the
formation of dimers (crosslinking) between cytosine and thymine residues, leading to irreversible,
stable bonds preventing replication and transcription processes, essential for the survival of
microorganisms. The use of UV radiation is limited by its lower energy potential and lower
penetrating power than gamma radiation and even electron beams, making it a good choice for
small surface sterilisation, but not suitable for dense materials [273,274,278].
It is clear that sterilisation of ocular inserts containing water and thermolabile drugs is not an easy
task to perform with the aforementioned sterilisation techniques. The development of novel
sterilisation techniques or the use of aseptic preparation methods need to be considered.
48
References
1. Kuno N, Fujii S. Recent advances in ocular drug delivery systems. Polymers (Basel). 2011;3: 193–221.
2. Achouri D, Alhanout K, Piccerelle P, Andrieu V. Recent advances in ocular drug delivery. Drug Dev Ind Pharm.
2013;39: 1599–1617.
3. The Eye and Vision [Internet]. [cited 3 Feb 2017]. doi:http://www.myvmc.com/anatomy/the-eye-and-vision/
4. Järvinen K, Järvinen T, Urtti A. Ocular absorption following topical delivery. Adv Drug Deliv Rev. 1995;16: 3–19.
5. Sasaki H, Yamamura K, Nishida K, Nakamura J, Ichikawa M. Delivery of drugs to the eye by topical application.
Prog Retin Eye Res. 1996;15: 583–620.
6. Sizmaz S, Kucukerdonmez C, Kal A, Pinarci EY, Canan H, Yilmaz G. Retinal and choroidal thickness changes after
single anti-vegf injection in neovascular age-related macular degeneration: Ranibizumab vs bevacizumab. Eur J
Ophthalmol. 2014;24: 904–910.
7. Chhablani J, Wong IY, Kozak I. Choroidal imaging: A review. Saudi J Ophthalmol. Saudi Ophthalmological Society,
King Saud University; 2014;28: 123–128.
8. Yuan X, Gu X, Crabb JS, Yue X, Shadrach K, Hollyfield JG, et al. Quantitative proteomics: comparison of the
macular Bruch membrane/choroid complex from age-related macular degeneration and normal eyes. Mol Cell
Proteomics. 2010;9: 1031–1046.
9. Thakur SS, Barnett NL, Donaldson MJ, Parekh HS. Intravitreal drug delivery in retinal disease: are we out of our
depth? Expert Opin Drug Deliv. 2014;11: 1575–1590.
10. Provis JM, Penfold PL, Cornish EE, Sandercoe TM, Madigan MC. Anatomy and development of the macula:
Specialisation and the vulnerability to macular degeneration. Clin Exp Optom. 2005;88: 269–281.
11. Lee SS, Robinson MR. Novel drug delivery systems for retinal diseases: A review. Ophthalmic Res. 2009;41: 124–
135.
12. D’amico DJ. Diseases of the Retina. N Engl J Med. 1994;331: 95–106.
13. Kimbrel E a., Lanza R. Current status of pluripotent stem cells: moving the first therapies to the clinic. Nat Rev
Drug Discov. Nature Publishing Group; 2015;14: 681–692.
14. Yuzawa M, Fujita K, Wittrup-Jensen KU, Norenberg C, Zeitz O, Adachi K, et al. Improvement in vision-related
function with intravitreal aflibercept: Data from phase 3 studies in wet age-related macular degeneration.
Ophthalmology. 2015;122: 571–578.
15. Zhu M, Chew JK, Broadhead GK, Luo K, Joachim N, Hong T, et al. Intravitreal Ranibizumab for neovascular Age-
related macular degeneration in clinical practice: five-year treatment outcomes. Graefe’s Arch Clin Exp
Ophthalmol. 2015;253: 1217–1225.
16. Barney NP, Cook EB, Stahl JL. Allergic and Immunologic Diseases of the Eye. Eighth Edi. Middleton’s Allergy:
Principles and Practice: Eighth Edition. 2013.
17. Capita L, Chalita MR, dos Santos-Neto LL. Prospective evaluation of hypromellose 2% for punctal occlusion in
patients with dry eye. Cornea. 2015;34: 188–192.
18. Rabensteiner DF, Boldin I, Klein A, Horwath-Winter J. Collared silicone punctal plugs compared to
intracanalicular plugs for the treatment of dry eye. Curr Eye Res. 2013;38: 521–525.
19. Cummings B. Accessory Structures of the Eye Figure 8.2b. Pearson Education; 2006.
20. Aicher SA, Hermes SM, Hegarty DM. Denervation of the lacrimal gland leads to corneal hypoalgesia in a novel

49
rat model of aqueous dry eye disease. Investig Ophthalmol Vis Sci. 2015;56: 6981–6989.
21. Rolando M, Zierhut M. The ocular surface and tear film and their dysfunction in dry eye disease. Surv
Ophthalmol. 2001;45 Suppl 2: S203–S210.
22. Zoukhri D. Effect of inflammation on lacrimal gland function. Exp Eye Res. 2006;82: 885–898.
23. McDermott AM. Antimicrobial compounds in tears. Exp Eye Res. 2013;117: 53–61.
24. Sen DK, Sarin GS. Biological variations of lysozyme concentration in the tear fluids of healthy persons. Br J
Ophthalmol. 1986;70: 246–248.
25. Narayanan S, Redfern RL, Miller WL, Nichols KK, Mcdermott AM. Dry eye disease and microbial keratitis: Is there
a connection? Ocul Surf. 2013;11: 75–92.
26. Patel A, Cholkar K, Agrahari V, Mitra AK. Ocular drug delivery systems: An overview. World J Pharmacol. 2015;2:
47–64.
27. Himmelstein K. Mathematical models of ocular drug transport and disposition. Mitra AK, editor. New York (USA):
Marcel Dekker; 1993.
28. Lee VHL, Robinson JR. Review : Topical Ocular Drug Delivery : Recent Developments and Future Challenges. Ocul
Pharmacol. 1986;2: 67–108.
29. Edsman K, Hägerström H. Pharmaceutical applications of mucoadhesion for the non-oral routes. J Pharm
Pharmacol. 2005;57: 3–22.
30. Shell J. Ophthalmic Drug Delivery Systems. Surv Ophthalmol. 1984;29: 117–128.
31. Mishima S, Gasset A, Klyce SD. Determination of Tear Volume and Tear Flow. Invest Ophthalmol. 1966;5: 264–
276.
32. Cholkar K, Patel SP, Vadlapudi AD, Mitra AK. Novel Strategies for Anterior Segment Ocular Drug Delivery. J Ocul
Pharmacol Ther. 2013;29: 106–123.
33. Ludwig A. Study on the administration and physical properties of ophthalmic solutions and the precorneal
retention of a tracer. University of Antwerp; 1990.
34. Lachrymal glands [Internet]. [cited 6 Feb 2017]. doi:www.studyblue.com/notes/note/n/des-mgd-blepharitis/
35. Hughes PM, Mitra AK. Overview of ocular drug delivery and iatrogenic ocular cytopathologies. Mitra AK, editor.
New York (USA): Marcel Dekker; 1993.
36. Van Ooteghem MM. Factors influencing the retention of ophthalmic solutions on the eye surface. Saettone,
M.F., Bucci, M., Speiser P, editor. Padova (Italy): Livinia Press; 1987.
37. Structure of Tear Film [Internet]. [cited 3 Apr 2011]. doi:http://www.nfburnetthodd.com/dryeye.html
38. Ruponen M, Urtti A. Undefined role of mucus as a barrier in ocular drug delivery. Eur J Pharm Biopharm.
2015;96: 442–446.
39. Yoshida Y, Ban Y, Kinoshita S. Tight junction transmembrane protein claudin subtype expression and distribution
in human corneal and conjunctival epithelium. Investig Ophthalmol Vis Sci. 2009;50: 2103–2108.
40. Zhang Z, Yang WZ, Zhu ZZ, Hu QQ, Chen YF, He H, et al. Therapeutic effects of topical doxycycline in a
benzalkonium chloride-induced mouse dry eye model. Investig Ophthalmol Vis Sci. 2014;55: 2963–2974.
41. Hayasaka S. Lysosomal enzymes in ocular tissues and diseases. Surv Ophthalmol. 1983;27: 245–258.
42. Dartt DA, Willcox MDP. Complexity of the tear film: Importance in homeostasis and dysfunction during disease.
Exp Eye Res. 2013;117: 1–3.

50
43. Nicolaides N, Kaitaranta JK, Rawdah TN, Macy JI, Boswell FM, Smith RE. Meibomian gland studies: comparison
of steer and human lipids. Investig Ophthalmol Vis Sci. 1981;20: 522–536.
44. Shine WE, McCulley JP, Pandya AG. Minocycline effect on meibomian gland lipids in meibomianitis patients. Exp
Eye Res. 2003;76: 417–420.
45. Butovich IA. The Meibomian Puzzle: Combining pieces together. Prog Retin Eye Res. 2009;28: 483–498.
46. Johnson ME, Murphy PJ. Changes in the tear film and ocular surface from dry eye syndrome. Prog Retin Eye Res.
2004;23: 449–474.
47. Tsai PS, Evans JE, Green KM, Sullivan RM, Schaumberg DA, Richards SM, et al. Proteomic analysis of human
meibomian gland secretions. Br J Ophthalmol. 2006;90: 372–377.
48. Evans DJ, Fleiszig SMJ. Why does the healthy cornea resist pseudomonas aeruginosa infection? Am J
Ophthalmol. 2013;155: 961–970.
49. Shaheen BS, Bakir M, Jain S. Corneal nerves in health and disease. Surv Ophthalmol. 2014;59: 263–285.
50. Müller LJ, Marfurt CF, Kruse F, Tervo TMT. Corneal nerves: Structure, contents and function. Exp Eye Res.
2003;76: 521–542.
51. Lang JC. Ocular drug delivery conventional ocular formulations. Adv Drug Deliv Rev. 1995;16: 39–43.
52. Greaves JL, Wilson CG. Treatment of diseases of the eye with mucoadhesive delivery systems. Adv Drug Deliv
Rev. 1993;11: 349–383.
53. Mann A, Tighe B. Contact lens interactions with the tear film. Exp Eye Res. 2013;117: 88–98.
54. Srikantha N, Mourad F, Suhling K, Elsaid N, Levitt J, Chung PH, et al. Influence of molecular shape, conformability,
net surface charge, and tissue interaction on transscleral macromolecular diffusion. Exp Eye Res. 2012;102: 85–
92.
55. Miao H, Wu BD, Tao Y, Li XX. Diffusion of macromolecules through sclera. Acta Ophthalmol. 2013;91: 1–6.
56. Tratta E, Pescina S, Padula C, Santi P, Nicoli S. In vitro permeability of a model protein across ocular tissues and
effect of iontophoresis on the transscleral delivery. Eur J Pharm Biopharm. 2014;88: 116–122.
57. Souza JG, Dias K, Pereira TA, Bernardi DS, Lopez RF V. Topical delivery of ocular therapeutics: Carrier systems
and physical methods. J Pharm Pharmacol. 2014;66: 507–530.
58. Edwards A, Prausnitz MR. Predicted permeability of the cornea to topical drugs. Pharm Res. 2001;18: 1497–
1508.
59. Corneal Disease [Internet]. [cited 3 Feb 2017]. doi:https://nei.nih.gov/health/cornealdisease
60. Grass GM, Robinson JR. Mechanisms of corneal drug penetration II: Ultrastructural analysis of potential
pathways for drug movement. J Pharm Sci. 1988;77: 15–23.
61. Dua HS, Gomes JA, Singh A. Corneal epithelial wound healing. Br J Ophthalmol. 1994;78: 401–408.
62. Malhotra M, Majumdar DK. Permeation Through Cornea. Indian J Exp Biol. 2001;39: 11–24.
63. Fini ME, Girard MT. Expression of collagenolytic/gelatinolytic metalloproteinases by normal cornea. Investig
Ophthalmol Vis Sci. 1990;31: 1779–1788.
64. Huang AJW, Tseng SCG, Kenyon KR. Paracellular permeability of corneal and conjunctival epithelia. Investig
Ophthalmol Vis Sci. 1989;30: 684–689.
65. van der Bijl P, van Eyk A, Meyer D. Effects of three penetration enhancers on transcorneal permeation of
cyclosporine. Cornea. 2001;20: 505–508.

51
66. Kaur IP, Kanwar M. Ocular preparations: the formulation approach. Drug Dev Ind Pharm. 2002;28: 473–493.
67. Pahuja P, Arora S, Pawar P. Ocular drug delivery system: a reference to natural polymers. Expert Opin Drug
Deliv. 2012;9: 837–861.
68. Hämäläinen KM, Kananen K, Auriola S, Kontturi K, Urtti A. Characterization of Paracellular and Aqueous
Penetration Routes in Cornea , Conjunctiva , and Sclera. Invest Ophthalmol Vis Sci. 1997;38: 627–634.
69. Venturoli D. Ficoll and dextran vs. globular proteins as probes for testing glomerular permselectivity: effects of
molecular size, shape, charge, and deformability. AJP Ren Physiol. 2004;288: 605–613.
70. Watsky MA, Jablonski MM, Edelhauser HF. Comparison of conjunctival and corneal surface areas in rabbit and
human. Curr Eye Res. 1988;7: 483–486.
71. Kaur IP, Garg A, Singla AK, Aggarwal D. Vesicular systems in ocular drug delivery: An overview. Int J Pharm.
2004;269: 1–14.
72. Pescina S, Govoni P, Antopolsky M, Murtomäki L, Padula C, Santi P, et al. Permeation of Proteins, Oligonucleotide
and Dextrans Across Ocular Tissues: Experimental Studies and a Literature Update. J Pharm Sci. 2015;104: 2190–
2202.
73. Monti D, Chetoni P, Burgalassi S, Najarro M, Saettone MF. Increased corneal hydration induced by potential
ocular penetration enhancers: Assessment by differential scanning calorimetry (DSC) and by desiccation. Int J
Pharm. 2002;232: 139–147.
74. Kaur IP, Smitha R. Penetration enhancers and ocular bioadhesives: two new avenues for ophthalmic drug
delivery. Drug Dev Ind Pharm. 2002;28: 353–369.
75. Eljarrat-Binstock E, Raiskup F, Stepensky D, Domb AJ, Frucht-Pery J. Delivery of gentamicin to the rabbit eye by
drug-loaded hydrogel iontophoresis. Investig Ophthalmol Vis Sci. 2004;45: 2543–2548.
76. Colligris B, Crooke A, Huete-Toral F, Pintor J. An update on dry eye disease molecular treatment: advances in
drug pipelines. Expert Opin Pharmacother. 2014;15: 1371–1390.
77. Pescina S, Ferrari G, Govoni P, MacAluso C, Padula C, Santi P, et al. In-vitro permeation of bevacizumab through
human sclera: Effect of iontophoresis application. J Pharm Pharmacol. 2010;62: 1189–1194.
78. Suhonen P, Järvinen T, Lehmussaari K, Reunamäki T, Urtti A. Ocular Absorption and Irritation of Pilocarpine
Prodrug Is Modified with Buffer, Polymer, and Cyclodextrin in the Eyedrop. Pharm Res. 1995;12: 529–533.
79. Tirucherai GS, Dias C, Mitra AK. Corneal permeation of ganciclovir: mechanism of ganciclovir permeation
enhancement by acyl ester prodrug design. J Ocul Pharmacol Ther. 2002;18: 535–548.
80. Gaudana R, Jwala J, Boddu SHS, Mitra AK. Recent perspectives in ocular drug delivery. Pharm Res. 2009;26:
1197–1216.
81. Loftssona T, Järvinen T. Cyclodextrins in ophthalmic drug delivery. Adv Drug Deliv Rev. 1999;36: 59–79.
82. Brewster ME, Loftsson T. Cyclodextrins as pharmaceutical solubilizers. Adv Drug Deliv Rev. 2007;59: 645–666.
83. Loftsson T, Stefánsson E. Cyclodextrins in eye drop formulations: enhanced topical delivery of corticosteroids to
the eye. Acta Ophthalmol Scand. 2002;80: 144–150.
84. Bourlais CL, Acar L, Zia H, Sado P, Needham T, Leverge R. Ophthalmic drug delivery systems--recent advances.
Prog Retin Eye Res. 1998;17: 33–58.
85. Ludwig A, Van Ooteghem M. Influence of viscolysers on the residence of ophthalmic solutions evaluated by slit
lamp fluorophotometry. STP pharma Sci. 1992;2: 81–87.
52
86. Kaur IP, Rana C, Singh H. Development of effective ocular preparations of antifungal agents. J Ocul Pharmacol
Ther. 2008;24: 481–493.
87. Sintzel MB, Bernatchez SF, Tabatabay C, Gurny R. Biomaterials in ophthalmic drug delivery. Eur J Pharm
Biopharm. 1996;42: 358–374.
88. Van Bijsterveld OP, Andriesse H, Nielsen BH. Fusidic acid in tear fluid: Pharmacokinetic study with fusidic acid
viscous eye drops. Eur J Drug Metab Pharmacokinet. 1987;12: 215–218.
89. Thakur RR, Kashiv M. Modern delivery systems for ocular drug formulations: a comparative overview W.R.T
conventional dosage form. Int J Res Pharm Biomed Sci. 2011;2: 8–18.
90. Jung HJ, Chauhan A. Extended release of timolol from nanoparticle-loaded fornix insert for glaucoma therapy. J
Ocul Pharmacol Ther. 2013;29: 229–235.
91. Nguyen T, Latkany R. Review of hydroxypropyl cellulose ophthalmic inserts for treatment of dry eye. Clin
Ophthalmol. 2011;5: 587–591.
92. Deshmukh PK, Gattani SG. In vitro and in vivo consideration of novel environmentally responsive ophthalmic
drug delivery system. Pharm Dev Technol. 2013;18: 950–956.
93. Kaur IP, Kakkar S. Newer therapeutic vistas for antiglaucoma medicines. Crit Rev Ther Drug Carrier Syst. 2011;28:
165–202.
94. Zhang M, Djabourov M, Bourgaux C, Bouchemal K. Nanostructured fluids from pluronic® mixtures. Int J Pharm.
2013;454: 599–610.
95. Lin Y-K, Chen K-H, Kuan C-Y. The synthesis and characterization of a thermally responsive hyaluronic acid/
Pluronic copolymer and an evaluation of its potential as an artificial vitreous substitute. J Bioact Compat Polym.
2013;4: 355-367.
96. Gratieri T, Gelfuso GM, De Freitas O, Rocha EM, Lopez RF V. Enhancing and sustaining the topical ocular delivery
of fluconazole using chitosan solution and poloxamer/chitosan in situ forming gel. Eur J Pharm Biopharm.
2011;79: 320–327.
97. Desai SD, Blanchard J. In vitro evaluation of pluronic F127-based controlled-release ocular delivery systems for
pilocarpine. J Pharm Sci. 1998;87: 226–230.
98. Rozier A, Mazuel C, Grove J, Plazonnet B. Gelrite: A novel, ion-activated, in-situ gelling polymer for ophthalmic
vehicles. Effect on bioavailability of timolol. Int J Pharm. 1989;57: 163–168.
99. Sanzgiri YD, Maschi S, Crescenzi V, Callegaro L, Topp EM, Stella VJ. Gellan-based systems for ophthalmic
sustained delivery of methylprednisolone. J Control Release. 1993;26: 195–201.
100. Maurice D. The effect of the low blink rate in rabbits on topical drug penetration. J Ocul Pharmacol Ther.
1995;11: 297–304.
101. Smart JD. The basics and underlying mechanisms of mucoadhesion. Adv Drug Deliv Rev. 2005;57: 1556–1568.
102. Grabovac V, Guggi D, Bernkop-Schnürch A. Comparison of the mucoadhesive properties of various polymers.
Adv Drug Deliv Rev. 2005;57: 1713–1723.
103. Mikos AG, Peppas NA. Systems for controlled delivery of drugs. V. Bioadhesive Systems. STP pharma Sci. 1986;
705–716.
104. Yellepeddi VK, Palakurthi S. Recent Advances in Topical Ocular Drug Delivery. J Ocul Pharmacol Ther. 2016;32:
67–82.

53
105. Dumortier G, Zuber M, Chast F, Chaumeil JC. Comparison between a thermoreversible gel and an insert in order
to prolong the systemic absorption of morphine after ocular administration. STP pharma Sci. 1992; 111–117.
106. Saettone MF, Salminen L. Ocular inserts for topical delivery. Adv Drug Deliv Rev. 1995;16: 95–106.
107. Sahane NK, Banarjee SK, Gaikwad DD, Jadhav SL, Thorat RM. Ocular Inserts : A Review. Drug Invent Today.
2010;2: 57–64.
108. Molokhia SA, Thomas SC, Garff KJ, Mandell KJ, Wirostko BM. Anterior Eye Segment Drug Delivery Systems:
Current Treatments and Future Challenges. J Ocul Pharmacol Ther. 2013;29: 92–105.
109. Sendelbeck L, Moore D, Urquhart J. Comparative distribution of pilocarpine in ocular tissues of the rabbit during
administration by eyedrop or by membrane-controlled delivery systems. Am J Ophthalmol. 1975;80: 274–283.
110. Gurtler F, Gurny R. Patent Literature Review of Ophthalmic Inserts. Drug Dev Ind Pharm. 1995;21: 1–18.
111. Xinming L, Yingde C, Lloyd AW, Mikhalovsky S V., Sandeman SR, Howel CA, et al. Polymeric hydrogels for novel
contact lens-based ophthalmic drug delivery systems: A review. Contact Lens Anterior Eye. 2008;31: 57–64.
112. Malakooti N, Alexander C, Alvarez-Lorenzo C. Imprinted Contact Lenses for Sustained Release of Polymyxin B
and Related Antimicrobial Peptides. J Pharm Sci. 2015;104: 3386–3394.
113. Tieppo A, Boggs AC, Pourjavad P, Byrne ME. Analysis of release kinetics of ocular therapeutics from drug
releasing contact lenses: Best methods and practices to advance the field. Contact Lens Anterior Eye. British
Contact Lens Association; 2014;37: 305–313.
114. Tieppo A, Pate KM, Byrne ME. In vitro controlled release of an anti-inflammatory from daily disposable
therapeutic contact lenses under physiological ocular tear flow. Eur J Pharm Biopharm. 2012;81: 170–177.
115. Tashakori-Sabzevar F, Mohajeri SA. Development of ocular drug delivery systems using molecularly imprinted
soft contact lenses. Drug Dev Ind Pharm. 2014;0: 1–11.
116. Bengani LC, Hsu K-H, Gause S, Chauhan A. Contact lenses as a platform for ocular drug delivery. Expert Opin
Drug Deliv. 2013;10: 1483–1496.
117. Carreira AS, Ferreira P, Ribeiro MP, Correia TR, Coutinho P, Correia IJ, et al. New drug-eluting lenses to be applied
as bandages after keratoprosthesis implantation. Int J Pharm. 2014;477: 218–226.
118. Jain MR. Drug delivery through soft contact lenses. Br J Ophthalmol. 1988;72: 150–154.
119. Gulsen D, Chauhan A. Ophthalmic Drug Delivery through Contact Lenses. Invest Ophthalmol Vis Sci. 2004;45:
2342–2347.
120. Karlgard CCS, Wong NS, Jones LW, Moresoli C. In vitro uptake and release studies of ocular pharmaceutical
agents by silicon-containing and p-HEMA hydrogel contact lens materials. Int J Pharm. 2003;257: 141–151.
121. Hehl EM, Beck R, Luthard K, Guthoff R, Drewelow B. Improved penetration of aminoglycosides and
fluoroquinolones into the aqueous humour of patients by means of Acuvue contact lenses. Eur J Clin Pharmacol.
1999;55: 317–323.
122. White CJ, McBride MK, Pate KM, Tieppo A, Byrne ME. Extended release of high molecular weight hydroxypropyl
methylcellulose from molecularly imprinted, extended wear silicone hydrogel contact lenses. Biomaterials.
2011;32: 5698–5705.
123. Mundada AS, Shrikhande BK. Design and Evaluation of Soluble Ocular Drug Insert for Controlled Release of
Ciprofloxacin Hydrochloride Controlled Release of Ciprofloxacin Hydrochloride. Drug Dev Ind Pharm. 2006;32:
443–448.

54
124. Buwalda SJ, Boere KWM, Dijkstra PJ, Feijen J, Vermonden T, Hennink WE. Hydrogels in a historical perspective:
From simple networks to smart materials. J Control Release. 2014;190: 254–273.
125. Kirchhof S, Goepferich AM, Brandl FP. Hydrogels in ophthalmic applications. Eur J Pharm Biopharm. 2015;95:
227–238.
126. Lamberts DW, Langston DP, Chu W. A clinical study of slow-releasing artificial tears. Ophthalmology. American
Academy of Ophthalmology, Inc; 1978;85: 794–800.
127. Jain D, Carvalho E, Banthia AK, Banerjee R. Development of polyvinyl alcohol-gelatin membranes for antibiotic
delivery in the eye. Drug Dev Ind Pharm. 2011;37: 167–177.
128. Lee YC, Yalkowsky SH. Systemic absorption of insulin from a Gelfoam ocular device. Int J Pharm. 1999;190: 35–
40.
129. Bloomfield SE, Dunn MW, Miyata T. Soluble artificial tear inserts. Arch Ophthalmol. 1977;95: 247–250.
130. Bloomfield SE, Miyata T, Dunn MW, Bueser N, Stenzel KH, Rubin AL. Soluble Gentamicin Ophthalmic Inserts as
a Drug Delivery System. Arch Ophthalmol. 1978;96: 885–887.
131. Schoenwald RD, Boltralik JJ. A bioavailability comparison in rabbits of two steroids formulated as high-viscosity
gels and reference aqueous preparations. Investig Ophthalmol Vis Sci. 1979;18: 61–66.
132. Schwartz SD, Harrison SA, Engstrom Jr. RE, Bawdon RE, Lee DA, Mondino BJ. Collagen shield delivery of
amphotericin B. Am J Ophthalmol. 1990;109: 701–704.
133. Taravella MJ, Balentine J, Young D a, Stepp P. Collagen shield delivery of ofloxacin to the human eye. J Cataract
Refract Surg. 1999;25: 562–565.
134. Gussler JR, Ashton P, Van Meter WS, Smith TJ. Collagen shield delivery of trifluorothymidine. J Cataract Refract
Surg. American Society of Cataract and Refractive Surgery; 1990;16: 719–722.
135. Bisht R, Durgapal S. Potential advantages of novel intracorneal drug delivery system in managemant of fungal
keratitis an overview. Int J Pharm Pharm Sci. 2011;3: 12–17.
136. Baeyens V, Kaltsatos V, Boisramé B, Varesio E, Veuthey JL, Fathi M, et al. Optimized release of dexamethasone
and gentamicin from a soluble ocular insert for the treatment of external ophthalmic infections. J Control
Release. 1998;52: 215–220.
137. Gurtler F, Kaltsatos V, Boisramé B, Gurny R. Long-acting soluble bioadhesive ophthalmic drug insert (BODI)
containing gentamicin for veterinary use: optimization and clinical investigation. J Control Release. 1995;33:
231–236.
138. Saettone MF, Torracca MT, Pagano A, Giannaccini B, Rodriguez L, Cini M. Controlled release of pilocarpine from
coated polymeric ophthalmic inserts prepared by extrusion. Int J Pharm. 1992;86: 159–166.
139. Urtti A, Salminen L, Miinalainen O. Systemic absorption of ocular pilocarpine is modified by polymer matrices.
Int J Pharm. 1985;23: 147–161.
140. Harwood R, Schwartz J. Drug Release from Compression Molded Films: Preliminary Studies with Pilocarpine.
Drug Dev Ind Pharm. 1982;8: 663–682.
141. Saettone MF, Chetoni P, Bianchi LM, Giannaccini B, Conte U, Sangalli ME. Controlled release of timolol maleate
from coated ophthalmic mini-tablets prepared by compression. Int J Pharm. 1995;126: 79–82.
142. Aburahma MH, Mahmoud AA. Biodegradable ocular inserts for sustained delivery of brimonidine tartarate:
preparation and in vitro/in vivo evaluation. AAPS PharmSciTech. 2011;12: 1335–1347.

55
143. Lee VHL, Li SY, Sasaki H, Saettone MF, Chetoni P. Influence of Drug-Release Rate on Systemic Timolol Absorption
From Polymeric Ocular Inserts in the Pigmented Rabbit. J Ocul Pharmacol. 1994;10: 421–429.
144. Tamburic S, Craig DQM. A comparison of different in vitro methods for measuring mucoadhesive performance.
Eur J Pharm Biopharm. 1997;44: 159–167.
145. Sundararaj SC, Thomas M V., Dziubla TD, Puleo DA. Bioerodible system for sequential release of multiple drugs.
Acta Biomater. 2014;10: 115–125.
146. Deshpande PB, Dandagi P, Udupa N, Gopal S V, Jain SS, Vasanth SG. Controlled release polymeric ocular delivery
of acyclovir. Pharm Dev Technol. 2010;15: 369–378.
147. Pavan-Langston D, Langston R, Geary P. Idoxuridine Ocular Insert Therapy. Arch Ophthalmol. 1975;93: 1349–
1351.
148. Punch PI, Slatter DH, Costa ND, Edwards ME. Investigation of gelatin as a possible biodegradable matrix for
Sustained delivery of gentamicin to the bovine eye. J Vet Pharmacol Ther. 1985; 335–338.
149. Mönkäre J, Pajander J, Hakala RA, Savolainen P, Järveläinen M, Korhonen H, et al. Characterization of internal
structure, polymer erosion and drug release mechanisms of biodegradable poly(ester anhydride)s by X-ray
microtomography. Eur J Pharm Sci. 2012;47: 170–178.
150. Ibraheem D, Elaissari A, Fessi H. Administration strategies for proteins and peptides. Int J Pharm. 2014;477:
578–589.
151. Kanwar JR, Shankaranarayanan JS, Gurudevan S, Kanwar RK. Aptamer-based therapeutics of the past, present
and future: From the perspective of eye-related diseases. Drug Discov Today. 2014;19: 1309–1321.
152. Steckbeck JD, Deslouches B, Montelaro RC. Antimicrobial peptides: new drugs for bad bugs? Expert Opin Biol
Ther. 2014;14: 11–14.
153. Fosgerau K, Hoffmann T. Peptide therapeutics: Current status and future directions. Drug Discov Today.
2015;20: 122–128.
154. Kim YC, Chiang B, Wu X, Prausnitz MR. Ocular delivery of macromolecules. J Control Release. 2014;190: 172–
181.
155. Bruno BJ, Miller GD, Lim CS. Basics and recent advances in peptide and protein drug delivery. Ther Deliv. 2013;4:
1443–1467.
156. Craik DJ, Fairlie DP, Liras S, Price D. The Future of Peptide-based Drugs. Chem Biol Drug Des. 2013;81: 136–147.
157. Torosantucci R, Schöneich C, Jiskoot W. Oxidation of therapeutic proteins and peptides: Structural and biological
consequences. Pharm Res. 2014;31: 541–553.
158. Yang AS, Honig B. On the pH dependence of protein stability. Journal of molecular biology. 1993; 459–474.
159. Manning MC, Chou DK, Murphy BM, Payne RW, Katayama DS. Stability of protein pharmaceuticals: An update.
Pharm Res. 2010;27: 544–575.
160. Wang W. Instability, stabilization, and formulation of liquid protein pharmaceuticals. Int J Pharm. 1999;185:
129–188.
161. Kang F, Jiang G, Hinderliter A, Deluca PP, Singh J. Lysozyme stability in primary emulsion for PLGA microsphere
preparation: Effect of recovery methods and stabilizing excipients. Pharm Res. 2002;19: 629–633.
162. Wu L, Zhang J, Watanabe W. Physical and chemical stability of drug nanoparticles. Adv Drug Deliv Rev. 2011;63:
456–469.

56
163. Tamizi E, Jouyban A. Forced degradation studies of biopharmaceuticals: Selection of stress conditions. Eur J
Pharm Biopharm. 2016;98: 26–46.
164. Vulic K, Pakulska MM, Sonthalia R, Ramachandran A, Shoichet MS. Mathematical model accurately predicts
protein release from an affinity-based delivery system. J Control Release. 2015;197: 69–77.
165. Mozziconacci O, Schöneich C. Chemical degradation of proteins in the solid state with a focus on photochemical
reactions. Adv Drug Deliv Rev. 2015;93: 2–13.
166. Chi EY, Krishnan S, Randolph TW, Carpenter JF. Physical stability of proteins in aqueous solution: Mechanism
and driving forces in nonnative protein aggregation. Pharm Res. 2003;20: 1325–1336.
167. Aydinoglu-Candan Ö, Araz-Ersan B, Gul A, Badur S, Tugal-Tutkun I. Anti-interferon alpha antibodies and
autoantibodies in patients with Behcet’s disease uveitis treated with recombinant human interferon alpha-2a.
Graefe’s Arch Clin Exp Ophthalmol. 2015;253: 457–465.
168. Leader B, Baca QJ, Golan DE. Protein therapeutics: a summary and pharmacological classification. Nat Rev Drug
Discov. 2008;7: 21–39.
169. Zhang Y, Yao Z, Kaila N, Kuebler P, Visich J, Maia M, et al. Pharmacokinetics of ranibizumab after intravitreal
administration in patients with retinal vein occlusion or diabetic macular edema. Ophthalmology. 2014;121:
2237–2246.
170. Oishi A, Tsujikawa A, Yamashiro K, Ooto S, Tamura H, Nakanishi H, et al. One-year result of aflibercept treatment
on age-related macular degeneration and predictive factors for visual outcome. Am J Ophthalmol. 2015;159:
853–860.
171. Chen JJ, Ebmeier SE, Sutherland WM, Ghazi NG. Potential penetration of topical ranibizumab (Lucentis) in the
rabbit eye. Eye. Nature Publishing Group; 2011;25: 1504–1511.
172. Davis BM, Normando EM, Guo L, Turner LA, Nizari S, O’Shea P, et al. Topical delivery of avastin to the posterior
segment of the eye in vivo using annexin A5-associated liposomes. Small. 2014;10: 1575–1584.
173. El Zaoui I, Touchard E, Berdugo M, Abadie C, Kowalczuk L, Deloche C, et al. Subconjunctival injection of XG-102,
a c-Jun N-terminal kinase inhibitor peptide, in the treatment of endotoxin-induced uveitis in rats. J Ocul
Pharmacol Ther. 2015;31: 17–24.
174. Zanon C de F, Sonehara NM, Girol AP, Gil CD, Oliani SM. Protective effects of the galectin-1 protein on in vivo
and in vitro models of ocular inflammation. Mol Vis. 2015;21: 1036–1050.
175. Di Tommaso C, Torriglia A, Furrer P, Behar-Cohen F, Gurny R, Möller M. Ocular biocompatibility of novel
Cyclosporin A formulations based on methoxy poly(ethylene glycol)-hexylsubstituted poly(lactide) micelle
carriers. Int J Pharm. 2011;416: 515–524.
176. McClellan SA, Ekanayaka SA, Li C, Jiang X, Barrett RP, Hazlett LD. Thrombomodulin Protects Against Bacterial
Keratitis, Is Anti-Inflammatory, but Not Angiogenic. Investig Opthalmology Vis Sci. 2015;56: 8091.
177. Sims JN, Lawler J. Thrombospondin-1-Based Antiangiogenic Therapy. J Ocul Pharmacol Ther. 2015;31: 366–370.
178. Vijmasi T, Chen FYT, Balasubbu S, Gallup M, McKown RL, Laurie GW, et al. Topical administration of lacritin is a
novel therapy for aqueous-deficient dry eye disease. Invest Ophthalmol Vis Sci. 2014;55: 5401–5409.
179. Turgut B, Eren K, Akin MM, Bilir Can N, Demir T. Impact of trastuzumab on wound healing in experimental
glaucoma surgery. Clin Experiment Ophthalmol. 2014; 67–76.
180. Dogru M, Nakamura M, Shimazaki J, Tsubota K. Changing trends in the treatment of dry-eye disease. Expert

57
Opin Investig Drugs. 2013;22: 1581–1601.
181. García-Layana A, García-Arumí J, Ruiz-Moreno JM, Arias-Barquet L, Cabrera-López F, Figueroa MS. A review of
current management of vitreomacular traction and macular hole. J Ophthalmol. 2015;2015.
182. Levison AL, Kaiser PK. Vitreomacular interface diseases: Diagnosis and management. Taiwan J Ophthalmol.
2014;4: 63–68.
183. Knudsen VM, Kozak I. A retrospective study of a single practice use of ocriplasmin in the treatment of
vitreomacular traction. Saudi J Ophthalmol. 2014;28: 139–144.
184. Sharma P, Juhn A, Houston SK, Fineman M, Chiang A, Ho A, et al. Efficacy of intravitreal ocriplasmin on
vitreomacular traction and full-thickness macular holes. Am J Ophthalmol. 2015;159: 861–867.
185. Pautler S, Pautler C. Posterior Vitreous Detachment [Internet]. [cited 14 Feb 2017].
doi:http://www.scottpautlermd.com/tag/posterior-vitreous-detachment/
186. Schumann RG, Wolf A, Mayer WJ, Compera D, Hagenau F, Ziada J, et al. Pathology of Internal Limiting Membrane
Specimens Following Intravitreal Injection of Ocriplasmin. Am J Ophthalmol. 2015;160: 767–778.
187. Varma R, Haller J a., Kaiser PK. Improvement in Patient-Reported Visual Function After Ocriplasmin for
Vitreomacular Adhesion. JAMA Ophthalmol. 2015;133: 997–1004.
188. Mains J, Wilson CG. The Vitreous Humor As a Barrier to Nanoparticle Distribution. J Ocul Pharmacol Ther.
2013;29: 143–150.
189. Barakat MR, Kaiser PK. VEGF inhibitors for the treatment of neovascular age-related macular degeneration.
Expert Opin Investig Drugs. 2009;18: 637–646.
190. Hosseini H, Nowroozzadeh MH, Salouti R, Nejabat M. Anti-VEGF therapy with bevacizumab for anterior segment
eye disease. Cornea. 2012;31: 322–34.
191. Hashemi S, Faramarzi MA, Ghasemi Falavarjani K, Abdollahi M. Bevacizumab for choroidal neovascularization
secondary to age-related macular degeneration and pathological myopia. Expert Opin Biol Ther. 2014;14: 1837–
1848.
192. Volz C, Pauly D. Antibody therapies and their challenges in the treatment of age-related macular degeneration.
Eur J Pharm Biopharm. 2015;95: 158–172.
193. Klein R, Myers CE, Buitendijk GHS, Rochtchina E, Gao X, De Jong PTVM, et al. Lipids, lipid genes, and incident
age-related macular degeneration: The three continent age-related macular degeneration consortium. Am J
Ophthalmol. 2014;158: 513–524.
194. Dahlin A, Geier E, Stocker SL, Cropp CD, Grigorenko E, Bloomer M, et al. Gene Expression Profiling of
Transporters in the Solute Carrier and ATP-Binding Cassette Superfamilies in Human Eye Substructures. Mol
Pharm. 2013;10: 650–663.
195. Channa R, Sophie R, Bagheri S, Shah SM, Wang J, Adeyemo O, et al. Regression of choroidal neovascularization
results in macular atrophy in anti-vascular endothelial growth factor-treated eyes. Am J Ophthalmol. 2015;159:
9–19.
196. Yasin MN, Svirskis D, Seyfoddin A, Rupenthal ID. Implants for drug delivery to the posterior segment of the eye:
A focus on stimuli-responsive and tunable release systems. J Control Release. 2014;196: 208–221.
197. Hashemi S, Faramarzi MA, Ghasemi Falavarjani K, Abdollahi M. Bevacizumab for choroidal neovascularization
secondary to age-related macular degeneration and pathological myopia. Expert Opin Biol Ther. 2014;14: 1837–
58
1848.
198. Freund KB, Mrejen S, Gallego-Pinazo R. An update on the pharmacotherapy of neovascular age-related macular
degeneration. Expert Opin Pharmacother. 2013;14: 1017–1028.
199. Costagliola C, Agnifili L, Arcidiacono B, Duse S, Fasanella V, Mastropasqua R, et al. Systemic thromboembolic
adverse events in patients treated with intravitreal anti-VEGF drugs for neovascular age-related macular
degeneration. Expert Opin Biol Ther. 2012;12: 1299–1313.
200. Infographic Macula [Internet]. [cited 1 Feb 2017]. doi:http://www.brightfocus.org/macular/infographic/what-
macular/
201. Yazdi MH, Faramarzi MA, Nikfar S, Falavarjani KG, Abdollahi M. Ranibizumab and aflibercept for the treatment
of wet age-related macular degeneration. Expert Opin Biol Ther. 2015;15: 1349–1358.
202. Lipp M, Bucher F, Parthasarathy A, Hos D, Onderka J, Cursiefen C, et al. Blockade of the VEGF isoforms in
inflammatory corneal hemangiogenesis and lymphangiogenesis. Graefe’s Arch Clin Exp Ophthalmol. 2014;252:
943–949.
203. Pérez-Santonja JJ, Campos-Mollo E, Lledo-Riquelme M, Javaloy J, Alio JL. Inhibition of corneal neovascularization
by topical bevacizumab (Anti-VEGF) and sunitinib (Anti-VEGF and Anti-PDGF) in an animal model. Am J
Ophthalmol. 2010;150: 519–528.
204. Hall LB, Zebardast N, Huang JJ, Adelman RA. Aflibercept in the treatment of neovascular age-related macular
degeneration in previously treated patients. J Ocul Pharmacol Ther. 2014;30: 346–352.
205. Peyman GA, Lad EM, Moshfeghi DM. Intravitreal injection of therapeutic agents. Retina. 2009;29: 875–912.
206. Chatziralli I, Nicholson L, Sivaprasad S, Hykin P. Intravitreal steroid and anti-vascular endothelial growth agents
for the management of retinal vein occlusion: Evidence from randomized trials. Expert Opin Biol Ther. 2015;15:
1685–1697.
207. Kim J-AJ, Kim TE, Kim J-AJ, Yun J-H, Sohn S, Shim SR, et al. Intravitreal Tanibirumab, a Fully Human Monoclonal
Antibody Against Vascular Endothelial Growth Factor Receptor 2, Partially Suppresses and Regresses Laser-
Induced Choroidal Neovascularization in a Rat Model. J Ocul Pharmacol Ther. 2014;30: 847–853.
208. Grewal DS, Gill MK, Sarezky D, Lyon AT, Mirza RG. Visual and anatomical outcomes following intravitreal
aflibercept in eyes with recalcitrant neovascular age-related macular degeneration: 12-month results. Eye.
2014;28: 895–899.
209. Segal O, Mimouni M, Nemet AY, Segev F, Geffen N, Nesher R. The effects of the frequency of the initial
treatment with intravitreal bevacizumab on macular volume and visual acuity. J Ocul Pharmacol Ther. 2015;31:
277–281.
210. Hartnett TE, O’Connor AJ, Ladewig K. Cubosomes and other potential ocular drug delivery vehicles for
macromolecular therapeutics. Expert Opin Drug Deliv. 2015;12: 1–14.
211. Furuhashi R, Ito Y, Takahashi A, Ishikawa K, Terasaki H. Two-year outcome of intravitreal bevacizumab for myopic
choroidal neovascularization. Japanese J Clin Ophthalmol. 2013;67: 1577–1583.
212. El Sanharawi M, Kowalczuk L, Touchard E, Omri S, de Kozak Y, Behar-Cohen F. Protein delivery for retinal
diseases: From basic considerations to clinical applications. Prog Retin Eye Res. 2010;29: 443–465.
213. Lajunen T, Hisazumi K, Kanazawa T, Okada H, Seta Y, Yliperttula M, et al. Topical drug delivery to retinal pigment
epithelium with microfluidizer produced small liposomes. Eur J Pharm Sci. 2014;62: 23–32.

59
214. Kim SJ, Toma HS. Ophthalmic antibiotics and antimicrobial resistance: A randomized, controlled study of
patients undergoing intravitreal injections. Ophthalmology. 2011;118: 1358–1363.
215. Eugene WM, Shima DT, Calias P, Cunningham ET, Guyer DR, Adamis AP. Pegaptanib, a targeted anti-VEGF
aptamer for ocular vascular disease. Nat Rev Drug Discov. 2006;5: 123–132.
216. Schwartz SG, Scott IU, Flynn HW, Stewart MW. Drug delivery techniques for treating age-related macular
degeneration. Expert Opin Drug Deliv. 2014;11: 61–68.
217. Berg K, Pedersen TR, Sandvik L, Bragadóttir R. Comparison of ranibizumab and bevacizumab for neovascular
age-related macular degeneration according to LUCAS treat-and-extend protocol. Ophthalmology. 2015;122:
146–152.
218. Schmid MK, Bachmann LM, Fäs L, Kessels AG, Job OM, Thiel M a. Efficacy and adverse events of aflibercept,
ranibizumab and bevacizumab in age-related macular degeneration: a trade-off analysis. Br J Ophthalmol. 2014;
14–15.
219. Avery RL, Pieramici DJ, Rabena MD, Castellarin AA, Nasir MA, Giust MJ. Intravitreal Bevacizumab (Avastin) for
Neovascular Age-Related Macular Degeneration. Ophthalmology. 2006;113: 363–372.
220. Pinheiro-Costa J, Freitas-da-Costa P, Falcao MS, Brandao EM, Falcao-Reis F, Carneiro AM. Switch from
intravitreal ranibizumab to bevacizumab for the treatment of neovascular age-related macular degeneration:
clinical comparison. Ophthalmologica. 2014;232: 149–155.
221. Altun A, Kurna SA, Olcaysu OO, Sengor T, Aki SF, Atakan TG. Success of ranibizumab in central serous
chorioretinopathy resistant to bevacizumab. J Ocul Pharmacol Ther. 2014;30: 842–846.
222. Bashshur ZF, Haddad ZA, Schakal A, Jaafar RF, Saab M, Noureddin BN. Intravitreal Bevacizumab for Treatment
of Neovascular Age-related Macular Degeneration: A One-year Prospective Study. Am J Ophthalmol. 2008;145:
249–256.
223. Park Y-R, Chung SK. Inhibitory Effect of Topical Aflibercept on Corneal Neovascularization in Rabbits. Cornea.
2015;34: 1303–1307.
224. Soohoo JR, Seibold LK, Pantcheva MB, Kahook MY. Original Article Aflibercept for the treatment of neovascular
glaucoma. 2015; 803–807.
225. Chang J-H, Garg N, Lounde E, Han kyu yeon, Sandeep J, Azar D mitri. Corneal Neovascularisation: An Anti-VEGF
Therapy Review. Surv Ophthalmol. 2012;57: 415–429.
226. Menzel-Severing J. Emerging techniques to treat corneal neovascularisation. Eye. Nature Publishing Group;
2012;26: 2–12.
227. Papathanassiou M, Theodoropoulou S, Analitis A, Tzonou A, Theodossiadis PG. Vascular endothelial growth
factor inhibitors for treatment of corneal neovascularization: a meta-analysis. Cornea. 2013;32: 435–444.
228. Gonzalez L, Loza RJ, Han K-Y, Sunoqrot S, Cunningham C, Purta P, et al. Nanotechnology in Corneal
Neovascularization Therapy—A Review. J Ocul Pharmacol Ther. 2013;29: 124–134.
229. Fassnacht-Riederle H, Becker M, Graf N, Michels S. Effect of aflibercept in insufficient responders to prior anti-
VEGF therapy in neovascular AMD. Graefe’s Arch Clin Exp Ophthalmol. 2014;252: 1705–1709.
230. Stevenson W, Cheng SF, Dastjerdi MH, Ferrari G, Dana R. Corneal neovascularization and the utility of topical
VEGF inhibition: Ranibizumab (Lucentis) Vs bevacizumab (Avastin). Ocul Surf. 2012;10: 67–83.
231. Small DS, Acheampong A, Reis B, Stern K, Stewart W, Berdy G, et al. Blood concentrations of cyclosporin A during

60
long-term treatment with cyclosporin A ophthalmic emulsions in patients with moderate to severe dry eye
disease. J Ocul Pharmacol Ther. 2002;18: 411–418.
232. Turner K, Pflugfelder SC, Ji Z, Feuer WJ, Stern M, Reis BL. Interleukin-6 levels in the conjunctival epithelium of
patients with dry eye disease treated with cyclosporine ophthalmic emulsion. Cornea. 2000;19: 492–496.
233. Brignole F, Pisella PJ, De Saint Jean M, Goldschild M, Goguel A, Baudouin C. Flow cytometric analysis of
inflammatory markers in KCS: 6-month treatment with topical cyclosporin A. Investig Ophthalmol Vis Sci.
2001;42: 90–95.
234. Pflugfelder SC. Antiinflammatory therapy for dry eye. Am J Ophthalmol. 2004;137: 337–342.
235. Rodriguez-Aller M, Kaufmann B, Guillarme D, Stella C, Furrer P, Rudaz S, et al. In vivo characterisation of a novel
water-soluble Cyclosporine A prodrug for the treatment of dry eye disease. Eur J Pharm Biopharm. 2012;80:
544–552.
236. Strong B, Farley W, Stern ME, Pflugfelder SC. Topical cyclosporine inhibits conjunctival epithelial apoptosis in
experimental murine keratoconjunctivitis sicca. Cornea. 2005;24: 80–85.
237. Donnenfeld E, Pflugfelder SC. Topical Ophthalmic Cyclosporine: Pharmacology and Clinical Uses. Surv
Ophthalmol. 2009;54: 321–338.
238. Kymionis GD, Bouzoukis DI, Diakonis VF, Siganos C. Treatment of chronic dry eye: focus on cyclosporine. Clin
Ophthalmol. 2008;2: 829–836.
239. Suzuki T, Schaumberg DA, Sullivan BD, Liu M, Richards SM, Sullivan RM, et al. Do Estrogen and Progesterone
Play a Role in the Dry Eye of Sjögren’s Syndrome? Ann N Y Acad Sci. 2002;966: 223–225.
240. Latkany R. Dry eyes: etiology and management. Curr Opin Ophthalmol. 2008;19: 287–291.
241. Hermans K, Van Den Plas D, Everaert A, Weyenberg W, Ludwig A. Full factorial design, physicochemical
characterisation and biological assessment of cyclosporine A loaded cationic nanoparticles. Eur J Pharm
Biopharm. 2012;82: 27–35.
242. Alqawlaq S, Huzil JT, Ivanova M V, Foldvari M. Challenges in neuroprotective nanomedicine development:
progress towards noninvasive gene therapy of glaucoma. Nanomedicine. 2012;7: 1067–1083.
243. Delplace V, Payne S, Shoichet M. Delivery strategies for treatment of age-related ocular diseases: From a
biological understanding to biomaterial solutions. J Control Release. 2015;219: 652–668.
244. Shell JW. Pharmacokinetics of topically applied ophthalmic drugs. Surv Ophthalmol. 1982;26: 207–218.
245. Jo DH, Kim JH, Lee TG, Kim JH. Nanoparticles in the Treatment of Angiogenesis-Related Blindness. J Ocul
Pharmacol Ther. 2013;29: 135–142.
246. Diebold Y, Calonge M. Progress in Retinal and Eye Research Applications of nanoparticles in ophthalmology.
Prog Retin Eye Res. 2010;29: 596–609.
247. Kompella UB, Amrite AC, Pacha Ravi R, Durazo SA. Nanomedicines for back of the eye drug delivery, gene
delivery, and imaging. Prog Retin Eye Res. 2013;36: 172–198.
248. Kaur IP, Kakkar S. Nanotherapy for posterior eye diseases. J Control Release. 2014;193: 100–112.
249. Cunha-Vaz J, Ashton P, Iezzi R, Campochiaro P, Dugel PU, Holz FG, et al. Sustained delivery fluocinolone
acetonide vitreous implants: Long-term benefit in patients with chronic diabetic macular edema.
Ophthalmology. 2014;121: 1892–1903.
250. Ali Y, Lehmussaari K, Christie CL, Coelho JF, Ferreira PC, Alves P, et al. Recent advances in ophthalmic drug
61
delivery. Adv Drug Deliv Rev. 2011;1: 219–263.
251. Jaffe GJ, Martin D, Callanan D, Pearson PA, Levy B, Comstock T. Fluocinolone Acetonide Implant (Retisert) for
Noninfectious Posterior Uveitis. Thirty-Four-Week Results of a Multicenter Randomized Clinical Study.
Ophthalmology. 2006;113: 1020–1027.
252. Campochiaro PA, Nguyen QD, Hafiz G, Bloom S, Brown DM, Busquets M, et al. Aqueous levels of fluocinolone
acetonide after administration of fluocinolone acetonide inserts or fluocinolone acetonide implants.
Ophthalmology. 2013;120: 583–587.
253. Edelhauser HF, Rowe-Rendleman CL, Robinson MR, Dawson DG, Chader GJ, Grossniklaus HE, et al. Ophthalmic
Drug Delivery Systems for the Treatment of Retinal Diseases: Basic Research to Clinical Applications. Investig
Opthalmology Vis Sci. 2010;51: 5403–5420.
254. Perrie Y, Badhan RKS, Kirby DJ, Lowry D, Mohammed AR, Ouyang D. The impact of ageing on the barriers to drug
delivery. J Control Release. 2012;161: 389–398.
255. Yasukawa T, Tabata Y, Kimura H, Ogura Y. Recent advances in intraocular drug delivery systems. Recent Pat Drug
Deliv Formul. 2011;5: 1–10.
256. Haller JA, Bandello F, Belfort R, Blumenkranz MS, Gillies M, Heier J, et al. Randomized, Sham-Controlled Trial of
Dexamethasone Intravitreal Implant in Patients with Macular Edema Due to Retinal Vein Occlusion.
Ophthalmology. 2010;117: 1134–1146.
257. Peptu CA, Popa M, Savin C, Popa RF, Ochiuz L. Modern Drug Delivery Systems for Targeting the Posterior
Segment of the Eye. 2015; 6055–6069.
258. Agarwal P, Rupenthal ID. Injectable implants for the sustained release of protein and peptide drugs. Drug Discov
Today. 2013;18: 337–349.
259. Shmueli RB, Ohnaka M, Miki A, Pandey NB, Lima e Silva R, Koskimaki JE, et al. Long-term suppression of ocular
neovascularization by intraocular injection of biodegradable polymeric particles containing aserpin-derived
peptide. Biomaterials. 2013;34: 7544–7551.
260. Kirchhof S, Abrami M, Messmann V, Hammer N, Goepferich AM, Grassi M, et al. Diels-Alder Hydrogels for
Controlled Antibody Release: Correlation between Mesh Size and Release Rate. Mol Pharm. 2015;12: 3358–
3368.
261. Haj-Ahmad RR, Elkordy AA, Chaw CS, Moore A. Compare and contrast the effects of surfactants (Pluronic F-127
and Cremophor EL) and sugars (beta-cyclodextrin and inulin) on properties of spray dried and crystallised
lysozyme. Eur J Pharm Sci. 2013;49: 519–534.
262. Avanti C, Saluja V, Van Streun ELP, Frijlink HW, Hinrichs WLJ. Stability of lysozyme in aqueous extremolyte
solutions during heat shock and accelerated thermal conditions. PLoS One. 2014;9: 2–7.
263. Varshochian R, Jeddi-Tehrani M, Mahmoudi AR, Khoshayand MR, Atyabi F, Sabzevari A, et al. The protective
effect of albumin on bevacizumab activity and stability in PLGA nanoparticles intended for retinal and choroidal
neovascularization treatments. Eur J Pharm Sci. 2013;50: 341–352.
264. Wang L, Yang T, Ma G. Microspheres and microcapsules for protein drug delivery. Microspheres Microcapsules
Biotechnol Des Prep Appl. 2013; 6340–6352.
265. Edelman R, Kusner I, Kisiliak R, Srebnik S, Livney YD. Sugar stereochemistry effects on water structure and on
protein stability: The templating concept. Food Hydrocoll. 2015;48: 27–37.

62
266. Rawat S, Kohli N, Suri CR, Sahoo DK. Molecular mechanism of improved structural integrity of protein in polymer
based microsphere delivery system. Mol Pharm. 2012;9: 2403–2414.
267. Thrimawithana TR, Rupenthal ID, Young SA, Alany RG. Environment-sensitive polymers for ophthalmic drug
delivery. J Drug Deliv Sci Technol. 2012;22: 117–124.
268. Vagenende V, Yap MGS, Trout BL. Mechanisms of protein stabilization and prevention of protein aggregation
by glycerol. Biochemistry. 2009;48: 11084–11096.
269. Asmus LR, Grimshaw JPA, Richle P, Eicher B, Urech DM, Gurny R, et al. Injectable formulations for an intravitreal
sustained-release application of a novel single-chain VEGF antibody fragment. Eur J Pharm Biopharm. 2015;95:
250–260.
270. Cicerone MT, Pikal MJ, Qian KK. Stabilization of proteins in solid form. Adv Drug Deliv Rev. 2015;93: 14–24.
271. Tonnis WF, Mensink MA, De Jager A, Van Der Voort Maarschalk K, Frijlink HW, Hinrichs WLJ. Size and molecular
flexibility of sugars determine the storage stability of freeze-dried proteins. Mol Pharm. 2015;12: 684–694.
272. Woedtke T von, Kramer A. The limits of sterility assurance. GMS Krankenhhyg Interdiszip. 2008;3: Doc19.
273. Govindaraj S, Muthuraman MS. Systematic Review on Sterilization Methods of Implants and Medical Devices.
Int J ChemTech Res. 2015;8: 897–911.
274. Dai Z, Ronholm J, Tian Y, Sethi B, Cao X. Sterilization techniques for biodegradable scaffolds in tissue engineering
applications. J Tissue Eng. 2016;7: 1–13.
275. Rutala W a, Weber DJ. Infection control: the role of disinfection and sterilization. J Hosp Infect. 1999;43 Suppl:
S43–S55.
276. Rnjak-Kovacina J, Desrochers TM, Burke KA, Kaplan DL. The effect of sterilization on silk fibroin biomaterial
properties. Macromol Biosci. 2015;15: 861–874.
277. Leo WJ, Mcloughlin AJ, Malone DM. Effects of Sterilization Treatments on Some Properties of Alginate Solutions
and Gels. Biotechnol Prog. 1990;6: 51–53.
278. Silindir M, Özer AY. Sterilization methods and the comparison of E-beam sterilization with gamma radiation
sterilization. Fabad J Pharm Sci. 2009;34: 43–53.
279. Maggi L, Segale L, Machiste EO, Buttafava A, Faucitano A, Conte U. Chemical and physical stability of
hydroxypropylmethylcellulose matrices containing diltiazem hydrochloride after gamma irradiation. J Pharm Sci.
2003;92: 131–141.

Chapter 2: Objectives

64
OBJECTIVES
The most popular ophthalmic route of administering drugs is through topically applied eye drops.
However, since the ocular availability of these formulations is very low due to the anatomic
structure and protective mechanisms of the eye, the strategy of enhancing the viscosity of the
ocular drug delivery systems was followed in the present research work, in order to improve the
amount of drug available at the ocular surface. The developed insert is based on
hydroxypropylmethyl cellulose as the polymer of choice and is designed to be applied in the lower
conjunctival sac of the eyes for once- or twice-a-day application.
The main objective of the present research work was to develop a new drug delivery system that
allows thermolabile molecules, such as peptides and proteins, to be incorporated in a gelling system
with slow release properties. As these molecules often tend to denaturate when heat or shear
forces are applied or in an oxidative environment such as air, a careful approach is required when
formulating such molecules in a new drug carrier system. At the same time, the insert should be
soft and mouldable to reduce foreign-body sensation and eye irritation and thereby avoiding reflex
tears and rapid blinking. The insert should have slow release properties to improve patient
compliance by minimising the application frequency to once of twice daily. It should be noted that
no particular pathology nor drug substance was targeted in this study.
To achieve this objective, the main strategy was based on preparing the excipients to such an
extent, that manipulation of the drug substance is minimised as much as possible. The evolution
and progress of developing the inserts is discussed in chapters 3-9.
In chapter 3, a first attempt was performed to load an insert with a small, tracer molecule. Sodium
fluorescein was selected as a coloured tracer molecule. The preparation of the inserts involves a
loading step of the drug of interest into the blank polymeric device which was carefully prepared
to allow drug loading through a passive diffusion process. Exploring the possibilities of the method
developed, identifying the influence of various parameters and obtaining slow release kinetics were
set as the primary objectives of this chapter.
Following the data obtained in chapter 3, loading of a blank insert with a protein (lysozyme) was
undertaken in chapter 4. The higher molecular weight of lysozyme (14.3 kDa) in comparison to
sodium fluorescein exposed new challenges, which led to a further improvement of the method.
65
Subsequently, the method was further optimised in order to improve the preparation
characteristics of the inserts.
Analysis of the behaviour of lysozyme loaded inserts led to the development of a significantly
altered production method in chapter 5. At this stage, bovine serum albumin (66.4 kDa) was added
to the comparison, along with sodium fluorescein and lysozyme in order to assess the next
embodiment of the production process.
It was clear from chapter 5 that the physicochemical properties of the drug and polymeric network
are the main influencing factors of the drug loading rate and drug release profiles. Therefore, the
influence of the molecular weight was determined using FITC labelled dextrans on both the
preparation of the inserts as well as on the drug release profiles in chapter 6.
Cytotoxicity and biocompatibility tests were conducted in chapter 7 to assess the potential harm
that blank inserts may cause to human corneal epithelial cells. This was evaluated both
quantitatively and qualitatively.
Furthermore, good stability is a key requirement for ophthalmic inserts. The stability of the inserts
was verified by means of an activity assay, rheological characterisation and release profile analysis.
These results are highlighted in chapter 8.
Finally, the objective of chapter 9 was to evaluate the behaviour of dexamethasone loaded inserts
in vivo in rats with dry eye disease.


Chapter 3: Development of a novel ocular insert with slow release properties loaded with sodium fluorescein
Parts of this chapter have been published in:
Everaert, A., Ludwig, A., Van den Plas, D., Weyenberg, W.
Thermolabile drug release formulation, 2014. Patent: WO/2014/184243

68
1 INTRODUCTION
In recent years, eye research has been putting more focus and efforts on the administration of
proteins for diseases including wet age-related macular degeneration [1,2], uveitis [3,4] and corneal
neovascularisation [5,6]. The sensitivity of proteins to elevated temperatures, pH changes,
mechanical shear forces and oxidation by air complicates the manufacturing process of ocular drug
delivery devices loaded with these molecules [7–9]. For the development of the present drug
delivery system, special attention was paid to the development of a method that could potentially
minimise the risk of stability issues of thermolabile molecules such as peptides and proteins during
preparation to avoid protein unfolding, breakdown and consequently loss of activity. Therefore,
shear forces should be minimised and both air entrapment and heating should be avoided. In order
to improve eye-comfort, the foreign-body sensation typically associated with ocular inserts in
general, should be reduced [10–12]. This can be achieved by making the inserts as small as possible
and flexible when pressure is applied by the lower eyelid. The insert should be entirely water
dispersible, eliminating the need to remove the insert from its site of application after drug delivery.
Ocular delivery of molecules while maintaining drug stability is already a major challenge, but
delivering these drug molecules in a slow release manner complicates matters significantly. To
allow slow release, the polymer hydroxypropylmethyl cellulose (HPMC) was used to build up the
matrix of the ocular inserts and thereby elevate the viscosity of the matrix to desired levels. HPMC
is one of the most frequently used polymers for slow release purposes and has excellent properties
for matrix build-up [13–16].
Generally, the homogeneous dispersion of highly viscous polymers in water, such as cellulose
ethers, implies the use of hot water to avoid air bubble entrapment and to disperse the polymer
molecules homogeneously in the solvent. After being fully wetted and dispersed, a non-
thermolabile drug can be added to the mixture at high temperature while stirring continuously. The
low-viscous dispersion can be cooled to room temperature or below, promoting the formation of
hydrogen bonds and structure build-up. Of course, this procedure cannot be used for peptide or
protein molecules as they require a more careful treatment during formulation as a result of their
labile physicochemical nature. The developed method was designed to incorporate any molecule
with relatively unstable properties, only being limited by its molecular weight and water solubility.
69
For the initial development of the novel HPMC ophthalmic insert, sodium fluorescein (0.376 kDa)
was selected as a tracer molecule because it allows an easy visual assessment of the inserts
prepared as well as a good determination of the drug loading capability and release. Sodium
fluorescein has excellent water-soluble properties and is stable at physiological pH in the absence
of light, making it a good choice for drug carrier development. To enhance the flexibility of the
inserts, glycerol was added as a plasticiser. Glycerol is also known to have stabilising effects on
proteins, which can be of importance for the development of protein loaded ocular inserts [17–19].
To assess the influence of the subtype of HPMC polymer used, the initial percentage of HPMC
polymer, the percentage glycerol and the drying period of the inserts after extrusion, a 24 full
factorial design was set up.
This chapter describes the proof-of-concept of inserts loaded with sodium fluorescein.

70
2 MATERIALS AND METHODS
2.1 Materials
Hydroxypropylmethyl cellulose (HPMC) types E4M and E10M CR Premium were obtained from
Colorcon (Dartford, UK). By specification, a 2% (w/w) E4M and E10M HPMC solution gives an
apparent viscosity of respectively 4.000 and 10.000 mPa.s (20 °C) under the same measuring
conditions. Sodium fluorescein and glycerol analytical grade (99.5% (V/V)) were provided by Sigma-
Aldrich (Steinheim, Germany). Purified water (18.2 MΩ.cm) was used after being filtered over a 0.2
µm cellulose acetate filter from Sartorius (Vilvoorde, Belgium). Sodium chloride (NaCl), sodium
dihydrogen phosphate dihydrate (NaH2PO4.2H2O) and disodium hydrogen phosphate dihydrate
(Na2HPO4.2H2O) of analytical grade were purchased from Merck (Darmstadt, Germany) and were
used to prepare phosphate-buffered saline solution (PBS, pH 7.4). PBS is an electrolyte solution
composed of 8.2 g/l NaCl, 0.3 g/l NaH2PO4.2H2O, 1.54 g/l Na2HPO4.2H2O and purified water.
A Topitec® barrel with a diameter of 36 mm and a height of 60 mm was supplied by ACA Pharma
(Waregem, Belgium). A custom made seal was developed and made out of Teflon with an opening
of 2 mm through which the inserts were extruded.
2.2 Characterisation of the excipients
Hydroxypropylmethyl cellulose
Hydroxypropylmethyl cellulose (HPMC) or hypromellose is a semisynthetic, non-ionic, hydrophilic
polymer based on the polymeric backbone of cellulose. Hypromellose is soluble in cold water and
is called a colloidal solution or sol [20,21]. Because of their viscous properties, these colloidal
solutions are also called viscous solutions or hydrogels, although the latter is technically spoken
reserved for crosslinked gels where polymers are physically or chemically interlinked for instance
by means of covalent or ionic bonds [22–24]. These hydrogels are generally obtained after
modification by a crosslinking agent (e.g. chemical substance or radiation) and implicate non-
dissolving matrices. The gel network consists of a very large branched polymer which spans the
entire gel. They can be deformed, but retain their shape like a solid as the crosslinks have a
permanent character [25].
However, the term hydrogel is also often used to indicate a highly viscous aqueous solution with
gel-like structure. Entangled polymer systems are sometimes referred to as pseudo gels as physical
entanglements can mimic chemical crosslinks giving them gel-like properties. This is especially true
for high molecular weight polymers which can entangle with themselves [25,26]. Therefore, for the

71
sake of clarity, the term hydrogel will be used in this research work to indicate highly viscous
polymer solutions with gel-like structure. Preparing a viscous solution of HPMC results in a non-
crosslinked or unlinked polymeric network, where simple entanglement gives strength to the
hydrogel structure. Rheological analysis can give a valuable insight in whether a solution is a
colloidal solution or a true gel through oscillatory measurements. A sample can be characterised by
a storage modulus (G’), which is indicative for elastic behaviour of the sample measured, and a loss
modulus (G”) which indicates the viscous behaviour. The relationship between G’ and G” of a
polymeric sample describes the resistance to an externally applied force and hence the relative
strength of the intermolecular bonds. This is termed viscoelastic behaviour. In case of a true gel, G’
and G” will show a flat spectrum (parallel curves) in an oscillatory measurement with the loss
modulus G” being considerably smaller than the elastic component G’. This implicates that the
polymer chains are interlinked and the intermolecular bonds are not broken with varying
frequencies. In other words, ideal gels have an almost purely elastic response, independent of the
frequency applied on the sample [25].
For colloidal solutions with polymeric entanglement, both shear moduli will increase with increasing
frequency. The viscous component G” will be higher than the elastic component G’ at low
oscillatory frequencies, suggesting that the polymer chains have time to disentangle and are unable
to store energy. At high frequencies, the polymer will not have sufficient time to rearrange the
polymer structure resulting in G’ being higher than G”. This suggest an elastic and hence more gel-
like behaviour [27,28]. The point where G’ equals G” is called the crossover point and is defined as
the point where the measured sample changes from a viscoelastic liquid to a viscoelastic solid [25].
To determine the viscoelastic behaviour of an HPMC colloidal solution, HPMC E10M aqueous
solutions were prepared in three different percentages (5%, 10% and 20% (w/w)). The viscoelastic
properties were measured through oscillation on an Anton Paar rheometer (MCR 102, Graz,
Austria) at a temperature of 32.0 ± 0.1 °C. Prior to the frequency sweep measurements, an
amplitude sweep was performed to determine the linear viscoelastic region (LVER). The LVER
determines the amplitudes in which the polymer network is maintained. Setting the amplitude too
high will cause a destruction of the polymer network, therefore an amplitude must be chosen within
the LVER. In the LVER, the measured moduli G’ and G” are independent of the applied strain [25].
After performing an amplitude sweep determining the LVER, the strain was consequently set at 1%
amplitude. The following settings were used for all oscillation measurements: parallel plate with a
diameter of 8 mm and the gap size set at 1 mm. The angular frequency was varied from 100 to 0.1

72
rad/s. To prevent evaporation of water from the hydrogel during the measurements, a solvent trap
was used to cover the sample.
Fig. 1. Overview of the viscoelastic behaviour of three colloidal solutions with an HPMC E10M percentage of 5%,
10% and 20% (w/w). For the sake of clarity, angular frequencies below 20 rad/s are shown.
In figure 1, it can be seen that for every colloidal solution tested, the elastic component G’ is higher
than the viscous component G” at high oscillatory frequencies, except for a 20% (w/w) HPMC
solution. But the opposite is true at low frequencies which is typical for viscoelastic behaviour. The
crossover point of the 20% (w/w) HPMC solution has not even been reached at 0.1 rad/s, but in
case of a true gel, G’ would be much higher than G” which is clearly not the case. Nevertheless, a
clear shift of the crossover point towards lower frequencies is noted when increasing the
concentration of HPMC with G’ still being predominant over G” at the highest percentage HPMC
tested. Increasing the percentage polymer in solution increases the likelihood of gel-like behaviour
for a colloidal solution as can be noticed for HPMC E10M 20% (w/w).
The polymer HPMC is widely used in the drug and food industry as a stabiliser of emulsions, as an
important excipient of slow release matrix tablets, as a viscosifying agent in solid and semisolid
formulations, etc. [29,30]. Its stability in the presence of heat, light and air, its excellent
biocompatibility, swelling capacity and low toxicity make this polymer a popular choice for various
1,0E+01
1,0E+02
1,0E+03
1,0E+04
1,0E+05
0,1 1 10
G' a
nd
G"
(Pa)
Angular frequency (rad/s)
G' 5% (w/w) G' 10% (w/w) G' 20% (w/w)
G" 5% (w/w) G" 10% (w/w) G" 20% (w/w)

73
applications [31–34]. The β-D-glucose (anhydroglucose) units of HPMC are interlinked through β-
(1,4)-glycosidic bonds. The basic structure is given in figure 2 [14].
Fig. 2. General structure of hydroxypropylmethyl cellulose with R= -H, or -CH3, or -CH2CH(OH)CH3.
During the manufacturing of cellulose ethers, cellulose fibres are treated with a caustic solution
(sodium hydroxide), which in turn is treated with methyl chloride and propylene oxide. The fibrous
reaction product is purified and ground to a fine powder. Different types of HPMC are classified
according to their degree of methoxyl substitution, moles of hydroxypropyl substitution and degree
of polymerisation which is indirectly defined by the molecular weight measured as 2% (w/w)
solution viscosity [14,33]. The USP 32 describes four different types of HPMC suitable for
pharmaceutical use and they are classified according to their methoxy and hydroxypropoxy groups:
HPMC 1828, HPMC 2208, HPMC 2906 and HPMC 2910. The first two digits refer to the approximate
percentage content of methoxy groups. The second two digits refer to the approximate percentage
content of hydroxypropoxy groups, determined after drying at 105 °C for two hours [14,30]. The
largest HPMC producing company, the Dow Chemical Company, also describes three different types
of HPMC MethocelTM based on a letter, followed by a number indicating the viscosity of an aqueous
2% (w/w) solution at 20 °C expressed in mPa.s. For instance, in E10M, the “E” denotes the chemical
type of HPMC, while “10M” stands for an apparent viscosity of 10.000 mPa.s for an aqueous
solution at 20 °C. The viscosity number is an approximate value and can, in this case, vary between
7.500 and 14.000 mPa.s [35]. An overview of the different HPMC types is given in table 1.

74
Table 1. Specification for different types of HPMC, classified according to their degree of methoxy and
hydroxypropoxy substitution.
Substitution type
Ph. Eur. / USP
Methocel™
classification
Methoxy
substitution % (w/w)
Hydroxypropoxy
substitution % (w/w)
Min. Max. Min. Max.
1828 N/A 16.5 20.0 23.0 32.0
2208 K 19.0 24.0 4.0 12.0
2906 F 27.0 30.0 4.0 7.5
2910 E 28.0 30.0 7.0 12.0
The methoxy and hydroxypropoxy groups, substituted on β-D-glucose units influence the
properties of HPMC of being reversibly insoluble in water at temperatures above the thermal
gelation temperature (Tm) [36]. Hypromellose is one of the very few cellulosic polymers that exhibit
clear thermal gelation properties. Methyl cellulose (MC) also exhibits these gelation properties, but
the limited commercial availability of different subtypes and the lower clarity of MC compared to
HPMC makes HPMC a more desirable choice for ophthalmic insert development [29]. At low
temperatures, the hydrophobic methyl groups are believed to be shielded by water molecules [37].
If an aqueous solution of HPMC is heated above the Tm, these water molecules are removed and
gelation is promoted as intermolecular hydrophobic interactions are being formed [30,37,38]. A
schematic representation is given in figure 3.
Fig. 3. Sol-gel transition upon heating and cooling. Figure adopted from Joshi S. et al. [21].

75
The thermal gelation temperature is also highly dependent on the percentage HPMC in solution:
increasing the polymer concentration will reduce the thermal gelation temperature [39–41]. At
temperatures below the thermal gelation temperature, HPMC molecules are hydrated as
hydrophilic interactions between hydroxyl groups of HPMC and water molecules are stimulated.
There is little polymer-polymer interaction besides physical entanglement. Increasing the
temperature reduces the viscosity of the colloidal solution until the thermal gelation temperature
is reached. From this point, a polymer-polymer interaction mainly through methoxyl groups will
take place, reflected by a sharp rise in viscosity as a gel is formed [30,36,39]. This process is entirely
reversible and this property has been cleverly exploited in the development of the ocular inserts.
The thermal gelation temperature of a 20% (w/w) HPMC E10M solution was estimated using an
Anton Paar rheometer (MCR 102, Graz, Austria) using a parallel plate geometry of 8 mm diameter.
The measurement was performed through oscillation at constant shear with an amplitude of 1%
and a frequency of 1 Hz. The temperature was ramped up between 20-90 °C at a heating rate of 1
°C per 0.15 s. The experiment was performed in triplicate and the mean value is shown in figure 4.
Fig. 4. Viscosity profile of a 20% (w/w) HPMC E10M viscous solution using a temperature ramp between 20-90 °C at
a rate of 1 °C/0.15 s. The temperature at which the viscosity starts to rise is considered to be the thermal gelation
temperature.
0
10000
20000
30000
40000
50000
60000
70000
0 10 20 30 40 50 60 70 80
Vis
cosi
ty (
Pa.
s)
Temperature (°C)

76
Figure 5 gives the viscosity profile in more detail between 20-53.4 °C for better visual
understanding.
Fig. 5. Enlargement of the viscosity profile shown in figure 4 of a 20% (w/w) HPMC E10M viscous solution using a
temperature ramp between 20-53.4 °C.
From 20 °C to 49.8 °C, below the gelation temperature, the viscous solution demonstrates expected
behaviour of decreasing viscosity with increasing temperature. Beyond the gelation temperature,
viscosity increases as the temperature is increased [29]. At 51 ± 1.2 °C the viscosity increases as
polymer-polymer interactions start to appear. This point is considered to be the thermal gelation
temperature. A sharp rise in viscosity is seen from 57 ± 1.2 °C in figure 4.
The thermal gelation properties of HPMC, the commercial availability of various subtypes and the
pharmaceutical applicability of HPMC have been the main criteria for polymer selection. From
preliminary experiments, HPMC E10M seems particularly suited for ophthalmic use. The
MethocelTM E-type polymers have higher clarity than K-type polymers, while more commercial
grades of E-type polymers are available compared to F-types. However, throughout this research
study, E10M and E4M will be studied in the present chapter, while E10M, which is the highest
available E-type grade, will be compared to K100M in chapter 4. The polymer HPMC K100M is
0
500
1000
1500
2000
2500
3000
3500
0 10 20 30 40 50 60
Vis
cosi
ty (
Pa.
s)
Temperature (°C)

77
intrinsically the highest HPMC polymerisation grade available, and was used as a measure of
reference despite lower clarity and hence less suited ophthalmic properties.
Glycerol
Glycerol or propane-1,2,3-triol is a clear, viscous solution with hygroscopic properties. Due to its
biocompatibility with ocular tissues, it is often added to ocular formulations to enhance the
flexibility of the final product [42–45], but glycerol also has excellent protein stabilising properties
[17–19]. For these reasons, glycerol was selected as primary choice of plasticiser. The structure of
glycerol is given in figure 6.
Fig. 6. Structure of glycerol.
2.3 Initial method for the preparation of inserts
Rod-shaped, ocular inserts with different composition were developed and prepared. They are
composed of varying initial percentages of HPMC, 0.3% (w/w) sodium fluorescein, a varying amount
of glycerol as a plasticiser and purified water as solvent. The choice of HPMC over other polymers
was based on its unique gelation properties, commercial availability of pharmaceutical grade HPMC
types with different viscosities and suitability for ocular purposes. The final percentage HPMC in
the inserts was fixed for all formulations at 15% (w/w). The initial method of preparing this drug
delivery system consists of four major phases. A schematic overview of the initial preparation
method is given in figure 7.

Phase I Phase II Phase III Phase IV
Phase I Phase II Phase III Phase IV
Fig. 7. General overview of the preparation method. A clear hydrogel is prepared while applying heat and stirring, but in the absence of the drug of interest. Dehydration occurs as the
hydrogel is placed in a drying oven at a temperature of 100 °C. The endpoint of the dehydration is determined gravimetrically at 35% (w/w) HPMC. The dehydrated matrix is rehydrated
with a mixture of drug, plasticiser and solvent. After a rehydration period of six weeks, the rehydrated mass with an HPMC percentage of 15% (w/w) is extruded from the barrel through
an opening of 2 mm.
Hydrogel
(HPMC + water)
Percentage HPMC: 10% or 20% (w/w)
Dehydrated HPMC polymer
Percentage HPMC: 35% (w/w)
Dehydration T = 100 °C
Rehydration T = 2 °C
Drug loaded HPMC
polymer
(barrel)
Extrusion of inserts
Percentage HPMC: 15% (w/w)
Rehydration solution:
Drug, plasticiser, solvent
6 weeks T = 2 °C

79
Phase I: Hydrogel-formation
A polymer suspension of E4M or E10M HPMC at a percentage of 10 or 20% (w/w) was prepared by
heating purified water up to a temperature of 90-100 °C and adding HPMC as powder to the heated
water under continuous stirring (VMS-C7-2, IKA, Staufen, Germany). After homogenisation, the
polymer suspension was allowed to cool down to room temperature (22 ± 2 °C) resulting in a highly
viscous solution. In addition to this, it was stored at 2 °C overnight in order to obtain full hydration
of the polymer chains. For a further understanding of certain effects in the result section, it is
important to note that the total mass of the prepared hydrogel was kept constant at 40 g.
Phase II: Dehydration of the polymer solution
The colloidal polymer solution was put in a drying oven (Thermo Scientific Heraeus Function Line
T12, Langenselbold, Germany) at a temperature of 100 °C, well above the thermal gelation
temperature, in order to dehydrate the HPMC polymer solution [36,37]. At this temperature, the
HPMC molecules precipitate rapidly, resulting in the formation of a white polymer core, expelling
water from its polymeric network as shown in figure 8. The water expelled from the polymer matrix
is clear and removed by pouring it off. The dry percentage of the dehydrated polymer cylinder was
set at 35% (w/w) and determined gravimetrically on an analytical balance (Mettler Toledo AB135-
S, Greifensee, Switzerland). The drying period took up to several hours for polymer cylinders to
partially dehydrate. After dehydration, the HPMC polymer cylinders revert to a clear matrix below
the thermal gelation temperature.

80
Fig. 8. Representation of the different stages of phase II, starting from a clear, highly viscous HPMC polymer solution
(1) (hydrogel, T = 22 °C, 10% (w/w) HPMC) to a dehydrated polymer cylinder (2, 3, 4, and 5) when heated up to 100
°C and reverting to a clear, partially dehydrated polymer matrix (35% (w/w) HPMC) upon cooling to room
temperature (6). Pictures 2, 3, 4 and 5 represent different stages during heating, showing that the dehydrated
polymer cylinder shrinks as water is expelled from the matrix.
Phase III: Rehydration of the polymer cylinder with drug solution
The partially dehydrated polymer cylinder was rehydrated with drug solution. Prior to adding the
drug solution, the partially dehydrated polymer cylinder was perforated centrally to allow the drug
solution to reach the centre of the dehydrated polymer cylinder. A larger contact area with the drug
solution facilitates the drug diffusion process. The diameter of the central cut was set at 5 mm.
Imbibition of the drug solution into the polymer cylinder occurred, even at temperatures as low as
2 °C. This temperature was chosen in favour of temperature stability of the potential thermolabile
molecules to be incorporated. By means of passive diffusion, the drug solution migrates into the
polymer cylinder avoiding the use of external forces to obtain a homogeneously loaded matrix.

81
Figure 9a shows a partially dehydrated HPMC polymer cylinder after placing the bottom part of the
polymer cylinder in a sodium fluorescein solution. The polymer cylinder swells where it was
submerged in the solution, while the dimensions of the upper half of the polymer cylinder remained
more or less unchanged after two hours. This picture was merely taken to demonstrate the effect
of swelling and drug solution uptake. In figure 9b, the end result of swelling is shown when a
partially dehydrated polymer cylinder was fully submerged in a sodium fluorescein solution. Both
components homogenised over the course of six weeks. The polymer cylinder absorbed the
coloured solution over time after which it could be extruded. The time required to achieve full
hydration and a homogeneous distribution of the drug is highly dependent on the ratio dehydrated
polymer mass and drug solution, as well as on the physicochemical properties of the drug.
Fig. 9a. Effect of hydration and swelling, situation after two hours. The bottom part of a partially dehydrated HPMC
polymer cylinder (L) was submerged in a sodium fluorescein solution, after which the submerged half of the polymer
cylinder absorbed the yellow solution (R).
Fig. 9b. End result after a polymer cylinder had been fully submerged in a sodium fluorescein solution over the course
of six weeks. Notice how the highly viscous mass does not appear to flow when lying flat on the surface. Picture
taken from above. The samples in these pictures have only been prepared and photographed for demonstrative
purposes.

82
Due to the inherently low temperature during phase III, the high viscosity of the polymer cylinder
and the low diffusional rate lowers the rehydration rate compared to when rehydration would
occur at room temperature. For this reason, the rehydration process takes up to several weeks
depending on the formulation parameters and the mass produced before extrusion.
Phase IV: Extrusion
After obtaining a semisolid hydrogel in the barrel, the content was manually extruded by means of
gentle force where the piston of the barrel extruded the mass through an opening with a diameter
of 2 mm after a period of six weeks. A photograph of the insert loaded with sodium fluorescein,
with a diameter of 2 mm and a length of 10 mm, is shown in figure 10.
Fig. 10. Extruded insert loaded with sodium fluorescein. The dimensions of the inserts are 2 mm diameter and 10
mm in length.

83
2.4 Factorial design of experiments
It is clear from the description of the method, that a number of parameters might influence the
properties of the inserts obtained. For experiments to be performed efficiently, experimental
design allows researchers to obtain a maximum of information about a process while requiring
fewer experiments. The influence of four different parameters on the properties of the inserts was
evaluated using a 24 full factorial design. All formulations were carried out in duplicate to estimate
the experimental error. The polymer type, initial percentage HPMC, final percentage glycerol and
the drying period of the insert after extrusion were chosen as the factors investigated. All
parameters have a certain degree of influence on the viscosity of the inserts extruded. The viscosity
of the matrix is regarded as an important release rate determining factor. A total number of 32
experiments was carried out and an overview is presented in table 3. The lower and higher values
are represented by (-) or (+) levels, which are given in table 2. The statistical analysis of the data
was performed with Statistica® software (Statsoft, Tulsa, USA) using analysis of variance (ANOVA).
Effects are considered statistically significant at a level of p<0.05.
Table 3. Factorial design of experiments for the preparation of inserts in the initial stage of development.
Formulation Polymer type Initial % HPMC Final % glycerol Drying period after extrusion
1 + + + +
2 + + + -
3 + + - +
4 + + - -
5 + - + +
6 + - + -
7 + - - +
8 + - - -
9 - + + +
10 - + + -
11 - + - +
12 - + - -
13 - - + +
14 - - + -
15 - - - +
16 - - - -
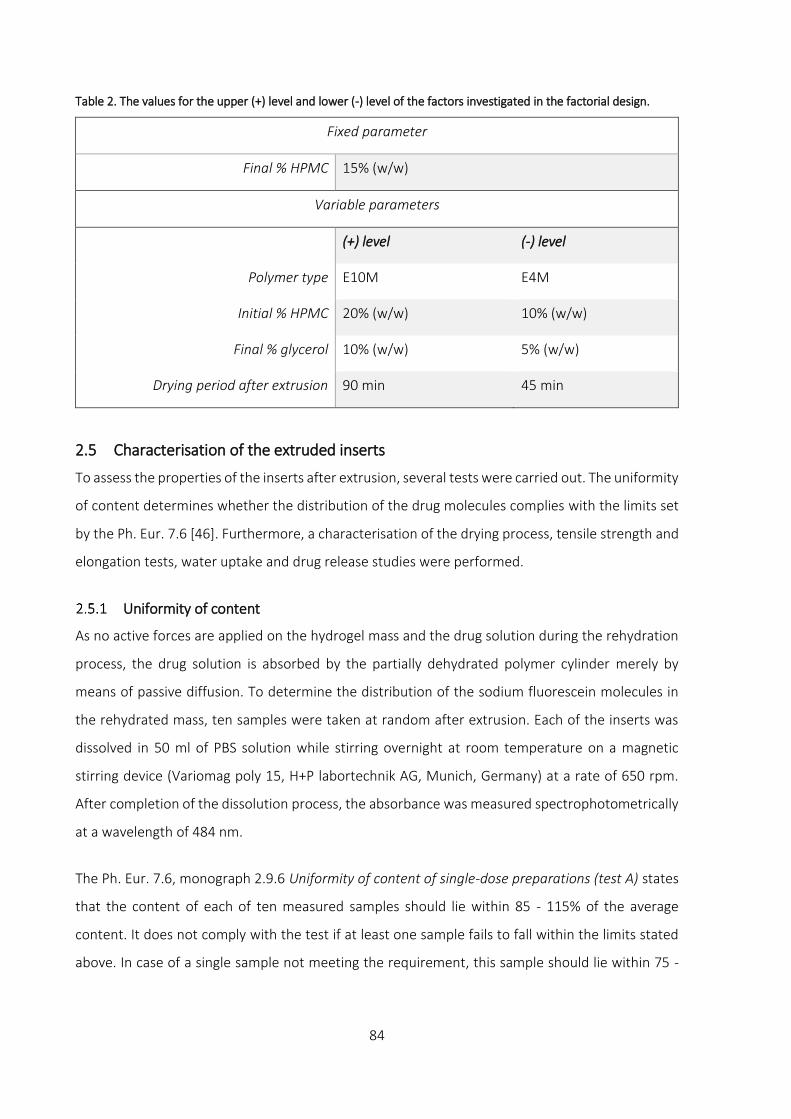
84
Table 2. The values for the upper (+) level and lower (-) level of the factors investigated in the factorial design.
Fixed parameter
Final % HPMC 15% (w/w)
Variable parameters
(+) level (-) level
Polymer type E10M E4M
Initial % HPMC 20% (w/w) 10% (w/w)
Final % glycerol 10% (w/w) 5% (w/w)
Drying period after extrusion 90 min 45 min
2.5 Characterisation of the extruded inserts
To assess the properties of the inserts after extrusion, several tests were carried out. The uniformity
of content determines whether the distribution of the drug molecules complies with the limits set
by the Ph. Eur. 7.6 [46]. Furthermore, a characterisation of the drying process, tensile strength and
elongation tests, water uptake and drug release studies were performed.
Uniformity of content
As no active forces are applied on the hydrogel mass and the drug solution during the rehydration
process, the drug solution is absorbed by the partially dehydrated polymer cylinder merely by
means of passive diffusion. To determine the distribution of the sodium fluorescein molecules in
the rehydrated mass, ten samples were taken at random after extrusion. Each of the inserts was
dissolved in 50 ml of PBS solution while stirring overnight at room temperature on a magnetic
stirring device (Variomag poly 15, H+P labortechnik AG, Munich, Germany) at a rate of 650 rpm.
After completion of the dissolution process, the absorbance was measured spectrophotometrically
at a wavelength of 484 nm.
The Ph. Eur. 7.6, monograph 2.9.6 Uniformity of content of single-dose preparations (test A) states
that the content of each of ten measured samples should lie within 85 - 115% of the average
content. It does not comply with the test if at least one sample fails to fall within the limits stated
above. In case of a single sample not meeting the requirement, this sample should lie within 75 -

85
125% limits. In this case, an additional number of 20 samples should be taken and measured which
all should comply with the limits between 85 - 115%.
Characterisation of the drying process
After extrusion, the inserts were dried for either 45 or 90 minutes in a laminar flow cabinet
(Safemate 1.8, Euroclone, Pero, Italy) under continuous flow (inflow: 0.54m/s, downflow: 0.39 m/s).
The influence of the ‘polymer type’ and ‘final % glycerol’ on the drying process was determined.
For each formulation, three inserts weighing 150 mg each were taken at random. These samples
were weighed carefully before and after the drying process. The amount of evaporated water was
calculated with the following formula and expressed as a percentage (W):
𝑊 = 𝑚𝑖 − 𝑚𝑓
𝑚𝑖
.100%
W: percentage water evaporated from the insert
mi: initial mass of the insert before the drying process
mf: final mass of the insert after the drying process
Only the results of inserts complying with the test uniformity of content as described in section 2.5.1
Uniformity of content are given and discussed in the results section.
Tensile strength and elongation
Tensile strength is defined as the maximum force a sample can withstand during elongation until it
breaks. Elongation is defined as the maximum length of a sample before the sample ruptures. These
are useful mechanical properties for a drug delivery device to understand the behaviour of the
product when the final product is packaged, handled by the patient or applied in the eye.
To determine the tensile strength of the inserts, three samples of 10 cm each were extruded for
every formulation of the experimental design, in duplicate. The extrusion product was dried before
measurements, following the drying conditions as described in section 2.5.2 Characterisation of the
drying process. Both ends of the sample were attached to a custom built measuring device with an
initial length of the extrusion product of 20 mm. Consequently, increasing weights were attached
to exhibit forces on the insert. The length of the extrusion product before rupture was monitored
continuously to determine the maximum elongation.

86
Water uptake of inserts
The swelling properties of the inserts were determined. Swelling affects the drug release from the
polymeric matrix as the insert can no longer retain its shape. The water uptake was studied
gravimetrically at room temperature (22 ± 2 °C) using a Baumann capillary apparatus. For each
experiment, a sample of 150 mg was weighed carefully on an analytical balance and placed on the
fritted glass filter of the Baumann apparatus filled with PBS medium. After time intervals of 2, 4 and
24 hours, the mass of the insert was weighed to measure the amount of PBS absorbed by the insert.
The measurements were carried out in quadruplicate for each formulation. The amount of water
uptake was calculated as follows:
𝑊 = 𝑚𝑎 − 𝑚𝑑
𝑚𝑑
.100%
W: amount of PBS absorbed by the insert expressed as a percentage
ma: mass of the insert after absorption of medium
md: mass of the insert before absorption of medium
Drug release measurement
The amount of sodium fluorescein released from the inserts was determined by cumulative release.
For each formulation, samples of 150 mg were taken in duplicate and dried following the method
described in section 2.5.2 Characterisation of the drying process and during 45 or 90 minutes
according to the design of experiments. The dried sample was put in a test tube at 2 cm above the
bottom of the tube to which 10 g of PBS solution was added. The test tube was placed in a non-
oscillating hot water bath (Julabo 20B, Merck-Belgolabo, Overijse, Belgium) at a temperature of
32.0 ± 0.5 °C, corresponding to the lowest temperature of the ocular surface [47]. After sampling
intervals of 20, 40, 60, 180 and 300 minutes, 5 g of sample was taken and replaced with fresh PBS
medium at 32 °C. The absorbance of the samples was measured spectrophotometrically at a
wavelength of 484 nm. After 300 minutes, the insert was dissolved entirely by shaking the test tube
to release all of the remaining drug. The drug content was calculated from the total percentage
drug present in the insert. Only samples complying with the uniformity of content, as described in
section 2.5.1 Uniformity of content, were plotted.

87
3 RESULTS AND DISCUSSION
3.1 Uniformity of content
After measuring the content of ten at random taken samples from each formulation (A) and its
duplicate (B) (cf. Table 3.), the results are shown in figures 11a and 11b. The average content of all
measured inserts is considered 100%. In green, the 85% and 115% limits set by the Ph. Eur. 7.6,
monograph 2.9.6 are given. The blue and orange bars represent the lowest and highest value of
content of ten measured samples respectively. All formulations of which the lowest and highest
content values are calculated within the 85 - 115% limits, comply with the test.
Fig. 11a and 11b. Overview of the sodium fluorescein content in formulations with HPMC E10M and E4M
respectively. The 85% and 115% limits are indicated with green lines.
0
25
50
75
100
125
150
175
1A 1B 2A 2B 3A 3B 4A 4B 5A 5B 6A 6B 7A 7B 8A 8B
E10M
Co
nte
nt
(%)
Lowest value Highest value
0
25
50
75
100
125
150
175
9A 9B 10A 10B 11A 11B 12A 12B 13A 13B 14A 14B 15A 15B 16A 16B
E4M
Co
nte
nt
(%)
Lowest value Highest value

88
There is not a single formulation prepared with an initial HPMC concentration of 20% (w/w) (F1-4
and F9-12) that complies with the limits of monograph 2.9.6. With exclusion of formulation 6B, two
distinct groups can be identified. All inserts prepared with an initial HPMC percentage of 10% (w/w)
(F5-8 and F13-16) comply with the test for uniformity of content. Just one of ten extruded inserts
from formulation 6B falls short of the 85% limit (84.6%). According to the guidelines of the Ph. Eur.
7.6, an additional number of 20 samples should have been extruded and measured. From a practical
point of view, this was not feasible.
The influence of the various parameters on the drug loading was calculated through statistical
analysis on the relative standard deviation (RSD) of the drug content of each formulation. The
results are given in table 4. A low value for the RSD is indicative for small variations of the individual
contents of the inserts compared to the average content of all inserts. The term ‘effect’ expresses
the average value by which a parameter is changed when altering the parameter from the lower
level to the upper level.
Table 4. Statistical analysis on RSD of the uniformity of content.
Parameter Effect (%) p-value
Polymer type -2.49 0.054
Initial % HPMC 16.88 0.000
Final % glycerol -1.48 0.237
Statistical analysis confirms that the initial percentage of HPMC has the largest significant influence
(p = 0.000) on the homogeneous distribution of sodium fluorescein molecules in the polymer mass
upon rehydration. Changing the initial percentage of HPMC from the (-) level (10% (w/w)) to the (+)
level (20% (w/w)) increases the RSD with 16.88% on average. This means that samples prepared
with an initial HPMC percentage of 10% (w/w) instead of 20% (w/w) yield inserts with the smallest
variation on drug content. The type of polymer used (E4M or E10M) also seems to have a modest
effect on the RSD, but compared to the initial percentage of HPMC, this effect can be regarded as
being minor and strictly spoken, this effect is not considered being statistically significant.
While preparing the inserts, it was clear that the geometry of the dehydrated polymer cylinder was
of great importance. The geometry of the dehydrated polymer cylinder is closely linked to the initial
percentage HPMC. It is likely one of the most important factors determining the distribution of drug
molecules in the polymer cylinder. The experimental design described in this chapter did not allow

89
to evaluate the effect of geometry directly. The importance of the geometry can be explained by
Fick’s first law and the Stokes-Einstein law as given below.
Fick’s first law
𝐽 = −𝐷.𝑑𝐶
𝑑𝑥 (mol/m²s)
J = flux of drug molecules
D = diffusion coefficient
dC = change in drug concentration
dx = change in drug diffusion distance
Stokes-Einstein law
𝐷 = 𝐾𝑏. 𝑇.1
6𝜋𝜂𝑟 (m²/s)
D = diffusion coefficient
Kb = Boltzmann constant
T = absolute temperature of the system
η = viscosity of the polymer cylinder
r = hydrodynamic radius of the migrating particles
However, with drug diffusion occurring in one or more dimensions during drug loading, a change
in drug concentration and therefore non-constant mass flux takes place. In this case of non-steady
state, Fick’s second law is applicable and given as follows:
𝑑𝐶
𝑑𝑡=
𝑑𝐽
𝑑𝑥= 𝐷.
𝑑²𝐶
𝑑𝑥²
Fick’s second law states that the change in concentration with time in a particular region is
proportional to the change in the concentration gradient at that point of time.
As the mass prepared during phase I (hydrogel formation) was kept constant at 40 g, this implicates
that a hydrogel with an initial percentage of 20% (w/w) has a different volume when it is dehydrated
to 35% (w/w) HPMC compared to a hydrogel with an initial percentage of 10% (w/w) dried to the

90
same level. As an equal mass of hydrogel was prepared for both 10% (w/w) and 20% (w/w) HPMC,
the volume of the partially dried polymer cylinder prepared from 20% (w/w) is larger. This means
that the surface area for contact between the drug solution and the partially dehydrated polymer
cylinder is larger, speeding up the diffusion process. On the other hand, a larger volume also means
that the diffusion distance (dx) the molecules have to travel, is longer, slowing down the distribution
of drug molecules. In addition, a polymer cylinder with larger dimensions will reach the boundaries
of the recipient more quickly upon swelling in comparison to a polymer cylinder of 10% (w/w)
HPMC. From that moment on, the swelling can only continue axially. This reduced surface area will
slow down the diffusion process. The geometry of the partially dehydrated polymer cylinder in
relation to its recipient clearly plays an important role on the diffusion pathway of the drug
molecules. Therefore, in the next chapter, the geometry of the polymer matrix will be investigated
in more depth.
The data shown in table 4 is visually illustrated in the following surface plot. The effect of the ‘initial
% HPMC’ and ‘polymer type’ on the RSD is shown figure 12.
Fig. 12. Influence of the ‘initial % HPMC’ and ‘polymer type’ on the RSD of the average sodium fluorescein content
in the inserts measured.
The surface plot shows that the initial percentage HPMC can be held responsible for the largest
effect on the RSD, while the influence of the type of polymer is very limited.

91
3.2 Characterisation of the drying process
After extrusion, the inserts were dried following the given time periods in the design of
experiments. The parameters ‘type polymer’ and ‘percentage plasticiser’ were studied and
statistically analysed as they were expected to have a possible influence on the in vitro release,
water uptake, tensile strength and elongation of inserts. The results of the loss of water during the
drying process is given in table 5 while in table 6 the statistical analysis is presented.
Table 5. The average loss of water is given per insert complying with the uniformity of content and expressed as a
percentage compared to its initial weight. Inserts marked with (*) were dried during 90 minutes instead of 45
minutes.
Insert Average loss of water (%) Standard deviation
*5A* 45.49 ± 3.95
*5B* 45.61 ± 2.83
6A 27.73 ± 0.72
6B 35.03 ± 3.65
*7A* 52.54 ± 0.95
*7B* 51.72 ± 1.57
8A 24.75 ± 1.64
8B 25.17 ± 1.81
*13A* 50.93 ± 2.85
*13B* 48.63 ± 4.42
14A 25.63 ± 0.56
14B 26.43 ± 2.92
*15A* 45.94 ± 1.71
*15B* 43.94 ± 1.20
16A 21.81 ± 0.92
16B 21.62 ± 0.59
Table 6. Statistical analysis on the loss of water.
Parameter Effect (%) p-value
Polymer type 1.32 0.497
Final % glycerol 3.07 0.134
Drying period 21.26 0.000

92
From table 6, the most influential parameter on the loss of water is unsurprisingly the parameter
‘drying period’ (p = 0.000). On average, an additional 21.26% (w/w) water is lost when changing the
drying period from 45 minutes to 90 minutes. The influence of both ‘polymer type’ and ‘final %
glycerol’ are not considered statistically significant. These effects are graphically laid out in figures
13a and 13b by means of surface plots.
Fig. 13a and 13b. Effect between the ‘drying period’ and ‘polymer type’ (a) and the ‘drying period’ and the ‘final %
glycerol’ (b) on the amount of water lost from the insert.
Figures 13a and 13b indicate that changing the drying period from 45 minutes ((-) level) to 90
minutes ((+) level) increases the amount of water lost from the insert irrespective of the level of
the parameters ‘final % glycerol’ and ‘polymer type’. Interestingly, both HPMC and glycerol are
known to be hygroscopic compounds and a significant retention of water was expected when
increasing the value of these parameters. Statistical analysis reveals that their effect on the amount
of water in the insert is small compared to the influence of the drying period and not statistically
significant.

93
3.3 Tensile strength and elongation
The tensile strength of the extruded and dried inserts was measured for all samples complying with
the uniformity of content. The results are graphically presented in figure 14a for HPMC type E10M
and in figure 14b for HPMC type E4M, the statistical analysis is given in table 7.
Fig. 14a and 14b. Comparison of the tensile strength between different inserts prepared with HPMC E10M and E4M
respectively. Only inserts complying with the uniformity of content are shown. The designation of the legend is as
follows: HPMC type – initial % HPMC – final % glycerol – drying time after extrusion.
Table 7. Statistical analysis on the tensile strength.
Parameter Effect (N) p-value
Polymer type 0.10 0.069
Final % glycerol 0.61 0.000
Drying period 0.92 0.000
Interaction effect
polymer type – final % glycerol
-0.05 0.309
Interaction effect
polymer type – drying period
0.10
0.081
Interaction effect
final % glycerol – drying period
0.61
0.000
Firstly, the main effects of the measured parameter are given, followed by the interaction effects.
Interaction effects represent the combined effects of factors on the dependent measure. When an
0,00
0,25
0,50
0,75
1,00
1,25
1,50
1,75
2,00
Forc
e (N
)
E10M-10%-10%-90min
E10M-10%-5%-90min
E10M-10%-10%-45min
E10M-10%-5%-45min
0,00
0,25
0,50
0,75
1,00
1,25
1,50
1,75
2,00
Forc
e (N
)
E4M-10%-10%-90min
E4M-10%-5%-90min
E4M-10%-10%-45min
E4M-10%-5%-45min

94
interaction effect is observed, the impact of one factor depends on the level of the other factor.
Therefore, in case of statistically significant interaction effects, interpretation of the main effects is
incomplete or misleading. Part of the power of ANOVA is the ability to estimate and test interaction
effects [48].
The results from table 7 show a statistically significant effect for the ‘final % glycerol’ and the ‘drying
period’. The parameter ‘polymer type’ was expected to have a significant influence on the tensile
strength, but falls short of the threshold value of statistical significance. A more accurate measuring
device might have changed the outcome of the results obtained. The largest effect can be seen for
the drying period, which means that drying the inserts for 90 minutes will yield inserts with higher
HPMC percentages and therefore higher tensile strengths. But the effect of the drying period
appears to be linked to the amount of glycerol in the insert (interaction effect) as shown in figure
15. Inserts prepared with 10% (w/w) glycerol can withstand higher forces than inserts prepared
with 5% (w/w) glycerol, particularly after 90 minutes of drying as opposed to 45 minutes where the
influence of the percentage glycerol is minimal. This is a clear example stressing the importance of
interpreting the interaction effect (p = 0.000) between the ‘final % glycerol’ and the ‘drying period’.
Fig. 15. Interaction effect and influence of the ‘drying period’ and ‘final % glycerol’ on the tensile strength of the
inserts.
A possible explanation why the influence of glycerol is higher for the tensile strength after 90
minutes of drying, can be given when the ratio plasticiser/water is considered. Water basically acts

95
as a plasticiser, therefore, drying for an extended period of time reduces water levels in the insert
and increases the relative amount of glycerol in the insert. This makes the effect of glycerol on the
tensile strength more pronounced after 90 minutes of drying. When more water is present in the
insert, the relative impact of glycerol as a plasticiser is reduced and mobility of the polymer chains
is increased, lowering the tensile strength.
The elongation of the insert is expressed as the ratio between the final length of the insert before
it breaks, compared to the initial length of the insert and is expressed as a percentage. The results
of elongation of the measured inserts is given in the following figures 16a and 16b. Statistical
analysis is presented in table 8.
Fig. 16a and 16b. Comparison of the elongation between different inserts prepared with HPMC E10M and E4M. Only
inserts complying with the uniformity of content are shown. The designation of the legend is as follows: HPMC type
– initial % HPMC – final % glycerol – drying time after extrusion.
0
50
100
150
200
Elo
nga
tio
n (
%)
E10M-10%-10%-90min E10M-10%-5%-90min
E10M-10%-10%-45min E10M-10%-5%-45min
0
50
100
150
200El
on
gati
on
(%
)
E4M-10%-10%-90min E4M-10%-5%-90min
E4M-10%-10%-45min E4M-10%-5%-45min

96
Table 8. Statistical analysis on the elongation of inserts.
Parameter Effect (%) p-value
Polymer type 10.10 0.254
Final % glycerol -1.56 0.855
Drying period -30.73 0.005
As expected, drying the inserts for a longer period of time (90 minutes instead of 45 minutes)
reduces elongation by 30.73%. The ‘drying period’ was found to be the only statistically significant
parameter (p = 0.005) on the elongation of the inserts. A graphical representation of the influence
of the ‘drying period’ compared to ‘polymer type’ and ‘final % glycerol’ is given in figure 17a and
17b.
Fig. 17a and 17b. Effect between the ‘drying period’ and the ‘polymer type’ (a) and the ‘drying period’ and the ‘final
% glycerol’ (b) on the elongation of the insert.
The influence of the ‘polymer type’ and ‘final % glycerol’ is relatively small and not statistically
significant compared to the effect of the ‘drying period’ on the elongation.

97
3.4 Water uptake of inserts
The degree of hydration and the time required for the inserts to lose their shape was measured.
The results for water uptake are given in figures 18a and 18b. Statistical analysis was carried out on
every measured time point (2, 4 and 24 hours) and a summary is given in table 9.
Fig. 18a and 18b. Comparison of the water uptake between different inserts prepared with HPMC E10M and E4M
respectively and complying with the uniformity of content. The designation of the legend is as follows: HPMC type
– initial % HPMC – final % glycerol – drying time after extrusion.
From figure 18a and 18b, a distinct difference in water uptake can be observed between the
polymer types HPMC E10M and E4M. Particularly after 24 hours, HPMC E10M approximately
doubled the amount of water taken up compared to HPMC E4M. This can be attributed to the larger
hydrodynamic volume occupied by higher molecular weight chains when hydrated. As the polymer
chains become more hydrated, disentanglement of polymer chains will occur. Polymers with a
higher polymerisation degree, such as HPMC E10M in this case, are able to absorb more water
before disentanglement will take place [49,50].
0
50
100
150
200
250
300
350
400
2 4 24
Wat
er u
pta
ke (
%)
Time (h)
E10M-10%-10%-90min E10M-10%-10%-45min E10M-10%-5%-90min E10M-10%-5%-45min
0
50
100
150
200
2 4 24
Wat
er u
pta
ke (
%)
Time (h)
E4M-10%-10%-90min E4M-10%-10%-45min E4M-10%-5%-90min E4M-10%-5%-45min

98
Table 9. Statistical analysis on the water uptake of inserts.
Parameter Effect (%) 2 h
p-value Effect (%) 4 h
p-value Effect (%)
24 h
p-value
Polymer type 23.04 0.000 25.85 0.000 116.78 0.000
Final % glycerol 7.41 0.022 4.01 0.299 -43.59 0.001
Drying period 26.99 0.000 38.01 0.000 108.58 0.000
Interaction effect
polymer type – final % glycerol
3.50 0.224 1.30 0.728 -30.12 0.009
Interaction effect
polymer type – drying period
13.48 0.001 15.62 0.002 48.95 0.000
Interaction effect
final % glycerol – drying period
2.28 0.417 -11.35 0.012 -33.24 0.005
The largest effect on the water uptake is observed for the ‘polymer type’ and ‘drying period’ from
the initial measuring point after two hours up till 24 hours. By dehydrating the inserts for a longer
period, the inserts are able to absorb larger quantities of water. Even though the overall effect is
smaller, after two hours, the amount of water absorbed by the insert is also higher when 10% (w/w)
glycerol is used (p = 0.022) likely due to the hygroscopic effect of glycerol.
The interaction effect between the ‘polymer type’ and the ‘drying period’ results in the highest
water uptake when HPMC E10M is used and even more pronounced when the drying period is
increased (p = 0.000). An additional interaction effect is also seen between the ‘final % glycerol’ and
the ‘drying period’ after four hours (p = 0.012) and between the ‘polymer type’ and the ‘final %
glycerol’ after 24 hours (p = 0.009). At first glance, it might seem strange that adding a higher
percentage of glycerol has a negative impact on the water absorbing properties of the inserts by
11.35% (w/w), but this could be indicative for competition between glycerol and HPMC. During
preliminary studies, glycerol in a percentage up to 50% (w/w) of the drug solution was added to the
dehydrated polymer cylinder, in order to see the effect of high amounts of plasticiser on the
rehydration process. It was noticed that rehydration of the polymer cylinder did not occur at all in
the presence of high amounts of glycerol. Even five years after preparing the sample, both phases
(dehydrated polymer cylinder and the drug solution containing glycerol) are still present.

99
Figures 19a and 19b show the interaction effects of ‘drying period’, ‘polymer type’ and ‘final %
glycerol’ on the water uptake after 24 hours.
Fig. 19a and 19b. Effect between the ‘drying period’ and the ‘polymer type’ (a) and the ‘drying period’ and the ‘final
% glycerol’ (b) on the water uptake capacity of the inserts after 24 hours.
In figure 19a, it can be seen that changing the polymer type from E4M ((-) level) to E10M ((+) level)
gives an additional effect on the water uptake when the drying period is set to 90 minutes ((+) level)
compared to 45 minutes ((-) level). A similar effect was found for the ‘final % glycerol’, where using
a percentage of glycerol of 5% (w/w) ((-) level) instead of 10% (w/w) ((+) level) resulted in an
additional effect on the water uptake when drying the inserts for 90 minutes after extrusion.
3.5 Drug release measurement
The sodium fluorescein release curves from the extruded inserts are drawn in figure 20 for inserts
prepared from HPMC E10M and HPMC E4M.
At this stage of the development, the main goal was to investigate whether slow release profiles
could be obtained. For both HPMC types, sodium fluorescein was released in a slow release manner
by means of diffusion or, most likely to a lesser extent, erosion with no appreciable lag time. Solvent
absorption into the matrix causes polymer chain relaxation and volume expansion which in turn
facilitates the drug diffusion into the surrounding medium [51]. About 50% of the total amount of
sodium fluorescein was released between 120-180 minutes, while 70-80% of sodium fluorescein is

100
released after 300 minutes. The chosen parameters of the insert do not have a significant impact
on the release rate of sodium fluorescein, most likely due to its low molecular weight (0.376 kDa).
Fig. 20. Comparison of release profiles from inserts developed with HPMC E4M and E10M. The designation of the
legend is as follows: HPMC type – initial % HPMC – final % glycerol – drying time after extrusion (n=4).
From visual observation, an immediate release of yellow-coloured sodium fluorescein was seen
from the surface of the insert. Generally, the release process of the HPMC molecules of the inserts
can be described as a combination of a two-stage process [52]. Firstly, the HPMC matrix absorbs
water from the release medium after which the insert hydrates and the rate of diffusion of drug
molecules accelerates. In the second stage, swelling of the unlinked polymer matrix causes
disentanglement and hence inserts to erode, releasing the drug molecules further. In case of small,
highly water-soluble molecules, drug diffusion will occur before polymer erosion takes place
[13,14,16,52]. The chosen formulation parameters might have a significant impact on the release
rate and kinetics of larger molecules, as will be investigated in more depth in the following chapters.
0
10
20
30
40
50
60
70
80
90
100
0 50 100 150 200 250 300
Cu
mu
lati
ve r
elea
se (
%)
Time (min)
E4M-10%-10%-90min E4M-10%-10%-45min E4M-10%-5%-90min
E4M-10%-5%-45min E10M-10%-5%-45min E10M-10%-10%-90min
E10M-10%-10%-45min E10M-10%-5%-90min

101
4 CONCLUSION
In this chapter, a first proof of concept was demonstrated. The method developed showed it is
possible to formulate inserts loaded with a tracer molecule such as sodium fluorescein with slow
release properties but without the need for shear forces, heat or air entrapment. The inserts were
flexible in order to reduce foreign-body sensation and hence circumvent the defence mechanisms
of the eye. The initial percentage HPMC was the main influencing factor for a homogeneous
distribution of sodium fluorescein molecules during rehydration, not necessarily due to the
percentage chosen, but due to the geometry of the partially dehydrated polymer cylinder as a result
of the initial percentage HPMC. As expected, the drying percentage of HPMC had the largest
influence on the tensile strength and elongation. The HPMC type E10M appeared to have greater
water uptake capacity compared to E4M most likely caused by its longer polymer chains which
allow more hydration before disentanglement starts to occur. The amount of plasticiser has an
important influence on the behaviour of the water uptake. Changing the chosen parameters had a
limited influence on the drug release amounts of sodium fluorescein over time, caused by the
relatively small size of sodium fluorescein, but the goal of obtaining slow release profiles was
achieved.
The most interesting observation was the impact of the initial HPMC percentage, or indirectly the
geometry of the polymer cylinder as a result of the chosen HPMC percentage, on the drug loading
process. Therefore, in the next chapter, a new experimental design was set up starting with HPMC
E10M in order to investigate the effect of geometry on the drug loading characteristics in closer
detail. In order to estimate the relative influence of the viscosity of the insert, HPMC K100M with
an intrinsically higher viscosity grade was added to the comparison, despite less favourable
ophthalmic characteristics as mentioned earlier. Furthermore, a globular model protein (lysozyme)
was loaded in inserts, using the basic principles of the method developed with further
improvements to accelerate the drug loading rate.

102
References
1. Barakat MR, Kaiser PK. VEGF inhibitors for the treatment of neovascular age-related macular
degeneration. Expert Opin Investig Drugs. 2009;18: 637–646.
2. Yazdi MH, Faramarzi MA, Nikfar S, Falavarjani KG, Abdollahi M. Ranibizumab and aflibercept for the
treatment of wet age-related macular degeneration. Expert Opin Biol Ther. 2015;15: 1349–1358.
3. Pleyer U, Stübiger N. New pharmacotherapy options for noninfectious posterior uveitis. Expert Opin Biol
Ther. 2014;14: 1783–1799.
4. Mesquida M, Molins B, Llorenç V, Sainz De La Maza M, Adán A. Long-term effects of tocilizumab therapy
for refractory uveitis-related macular edema. Ophthalmology. 2014;121: 2380–2386.
5. Chang J-H, Garg N, Lounde E, Han kyu yeon, Sandeep J, Azar D. Corneal Neovascularisation: An Anti-VEGF
Therapy Review. Surv Ophthalmol. 2012;57: 415–429.
6. Liarakos VS, Papaconstantinou D, Vergados I, Douvali M, Theodossiadis PG. The effect of subconjunctival
ranibizumab on corneal and anterior segment neovascularization: Study on an animal model. Eur J
Ophthalmol. 2013;24: 299–308.
7. Vogt W. Oxidation of methionyl residues in proteins: Tools, targets, and reversal. Free Radic Biol Med.
1995;18: 93–105.
8. Di Stasio E, De Cristofaro R. The effect of shear stress on protein conformation: Physical forces operating
on biochemical systems: The case of von Willebrand factor. Biophys Chem. 2010;153: 1–8.
9. Torosantucci R, Schöneich C, Jiskoot W. Oxidation of therapeutic proteins and peptides: Structural and
biological consequences. Pharm Res. 2014;31: 541–553.
10. Nguyen T, Latkany R. Review of hydroxypropyl cellulose ophthalmic inserts for treatment of dry eye. Clin
Ophthalmol. 2011;5: 587–591.
11. Le Bourlais C, Acar L, Zia H, Sado P, Needham T, Leverge R. Ophthalmic Drug Delivery Systems - Recent
Advances. Prog Retin Eye Res. 1998;17: 33–58.
12. Saettone MF, Salminen L. Ocular inserts for topical delivery. Adv Drug Deliv Rev. 1995;16: 95–106.
13. Bettini R, Catellani PL, Santi P, Massimo G, Peppas NA, Colombo P. Translocation of drug particles in HPMC
matrix gel layer: Effect of drug solubility and influence on release rate. J Control Release. 2001;70: 383–
391.
14. Siepmann J, Peppas NA. Modeling of drug release from delivery systems based on hydroxypropyl
methylcellulose (HPMC). Adv Drug Deliv Rev. 2001;48: 139–157.
15. Barba AA, d’Amore M, Chirico S, Lamberti G, Titomanlio G. Swelling of cellulose derivative (HPMC) matrix
systems for drug delivery. Carbohydr Polym. 2009;78: 469–474.
16. Siepmann J, Kranz H, Bodmeier R, Peppas NA. HPMC-matrices for controlled drug delivery: A new model
combining diffusion, swelling, and dissolution mechanisms and predicting the release kinetics.
Pharmaceutical Research. 1999; 1748–1756.
17. Sedgwick H, Cameron JE, Poon WCK, Egelhaaf SU. Protein phase behavior and crystallization: Effect of
glycerol. J Chem Phys. 2007;127: 1–6.

103
18. Esposito A, Comez L, Cinelli S, Scarponi F, Onori G. Influence of glycerol on the structure and thermal
stability of lysozyme: a dynamic light scattering and circular dichroism study. J Phys Chem B. 2009;113:
16420–16424.
19. Vagenende V, Yap MGS, Trout BL. Mechanisms of protein stabilization and prevention of protein
aggregation by glycerol. Biochemistry. 2009;48: 11084–11096.
20. Bajwa GS, Sammon C, Timmins P, Melia CD. Molecular and mechanical properties of hydroxypropyl
methylcellulose solutions during the sol:gel transition. Polymer. 2009;50: 4571–4576.
21. Joshi SC. Sol-gel behavior of hydroxypropyl methylcellulose (HPMC) in ionic media including drug release.
Materials. 2011;4: 1861–1905.
22. Peppas NA, Bures P, Leobandung W, Ichikawa H. Hydrogels in pharmaceutical formulations. Eur J Pharm
Biopharm. 2000;50: 27–46.
23. Sannino A, Demitri C, Madaghiele M. Biodegradable cellulose-based hydrogels: Design and applications.
Materials. 2009;2: 353–373.
24. Sannino A, Pappadà S, Madaghiele M, Maffezzoli A, Ambrosio L, Nicolais L. Crosslinking of cellulose
derivatives and hyaluronic acid with water-soluble carbodiimide. Polymer. 2005;46: 11206–11212.
25. Grillet AM, Wyatt NB, Gloe LM. Polymer Gel Rheology and Adhesion. Rheology. 2012; 59–81.
26. Patel SK, Malone S, Cohen C, Gillmor JR, Colby RH. Elastic modulus and equilibrium swelling of poly
(dimethylsiloxane) networks. Macromolecules. 1992;25: 5241–5251.
27. Ferry JD. Viscoelastic properties of polymer solutions. J Res Natl Bur Stand. 1948;41: 53–62.
28. Ceulemans J, Vermeire A, Adriaens E, Remon JP, Ludwig A. Evaluation of a mucoadhesive tablet for ocular
use. J Control Release. 2001;77: 333–344.
29. Rowe R, Sheskey P, Quinn M. Handbook of Pharmaceutical Excipients. Handbook of pharmaceutical
excipients, Sixth edition. 2009.
30. Silva SMC, Pinto F V., Antunes FE, Miguel MG, Sousa JJS, Pais AACC. Aggregation and gelation in
hydroxypropylmethyl cellulose aqueous solutions. J Colloid Interface Sci. 2008;327: 333–340.
31. Zhou D, Law D, Reynolds J, Davis L, Smith C, Torres JL, et al. Understanding and managing the impact of
HPMC variability on drug release from controlled release formulations. J Pharm Sci. 2014;103: 1664–1672.
32. Asare-Addo K, Conway BR, Larhrib H, Levina M, Rajabi-Siahboomi AR, Tetteh J, et al. The effect of pH and
ionic strength of dissolution media on in-vitro release of two model drugs of different solubilities from
HPMC matrices. Colloids Surfaces B Biointerfaces. 2013;111: 384–391.
33. Burdock GA. Safety assessment of hydroxypropyl methylcellulose as a food ingredient. Food Chem Toxicol.
2007;45: 2341–2351.
34. Li CL, Martini LG, Ford JL, Roberts M. The use of hypromellose in oral drug delivery. J Pharm Pharmacol.
2005;57: 533–546.
35. Dow. METHOCEL Cellulose Ethers Technical Handbook. Journal of the National Cancer Institute. 2012.
36. Ford JL. Thermal analysis of hydroxypropylmethylcellulose and methylcellulose: Powders, gels and matrix
tablets. Int J Pharm. 1999;179: 209–228.
37. Hussain S, Keary C, Craig DQM. A thermorheological investigation into the gelation and phase separation

104
of hydroxypropyl methylcellulose aqueous systems. Polymer. 2002;43: 5623–5628.
38. Almeida N, Rakesh L, Zhao J. Monovalent and divalent salt effects on thermogelation of aqueous
hypromellose solutions. Food Hydrocoll. 2014;36: 323–331.
39. Bain MK, Maity D, Bhowmick B, Mondal D, Mollick MMR, Sarkar G, et al. Effect of PEG-salt mixture on the
gelation temperature and morphology of MC gel for sustained delivery of drug. Carbohydr Polym. 2013;91:
529–536.
40. Dewan M, Bhowmick B, Sarkar G, Rana D, Bain MK, Bhowmik M, et al. Effect of methyl cellulose on gelation
behavior and drug release from poloxamer based ophthalmic formulations. Int J Biol Macromol. 2015;72:
706–710.
41. Bain MK, Bhowmick B, Maity D, Mondal D, Mollick MMR, Paul BK, et al. Effect of PVA on the gel
temperature of MC and release kinetics of KT from MC based ophthalmic formulations. Int J Biol
Macromol. 2012;50: 565–572.
42. Kurek M, Brachais CH, Nguimjeu CM, Bonnotte A, Voilley A, Galić K, et al. Structure and thermal properties
of a chitosan coated polyethylene bilayer film. Polym Degrad Stab. 2012;97: 1232–1240.
43. Fajardo P, Balaguer MP, Gomez-Estaca J, Gavara R, Hernandez-Munoz P. Chemically modified gliadins as
sustained release systems for lysozyme. Food Hydrocoll. 2014;41: 53–59.
44. Cissé M, Montet D, Loiseau G, Ducamp-Collin MN. Influence of the Concentrations of Chitosan and
Glycerol on Edible Film Properties Showed by Response Surface Methodology. J Polym Environ. 2012;20:
830–837.
45. Silva CL, Pereira JC, Ramalho A, Pais AACC, Sousa JJS. Films based on chitosan polyelectrolyte complexes
for skin drug delivery: Development and characterization. J Memb Sci. 2008;320: 268–279.
46. European Pharmacopoeia Online. In: European Pharmacopoeia 7.6 [Internet]. [cited 1 May 2012].
doi:http://online.edqm.eu/EN/entry.htm#
47. Purslow C, Wolffsohn JS. Ocular Surface Temperature. Eye Contact Lens Sci Clin Pract. 2005;31: 117–123.
48. Stevens. Interaction Effects in ANOVA. In: UOregon [Internet]. 1999; 1–36.
doi:http://eprints.utas.edu.au/4774/
49. Akbari J, Enayatifard R, Saeedi M, Saghafi M. Influence of hydroxypropyl methylcellulose molecular weight
grade on water uptake, erosion and drug release properties of diclofenac sodium matrix tablets. Trop J
Pharm Res. 2011;10: 535–541.
50. Abrahamsson B, Alpsten M, Bake B, Larsson A, Sjögren J. In vitro and in vivo erosion of two different
hydrophilic gel matrix tablets. Eur J Pharm Biopharm. 1998;46: 69–75.
51. Siepmann J, Siepmann F. Modeling of diffusion controlled drug delivery. J Control Release. 2012;161: 351–
362.
52. Ghori MU, Ginting G, Smith AM, Conway BR. Simultaneous quantification of drug release and erosion from
hypromellose hydrophilic matrices. Int J Pharm. 2014;465: 406–412.

Chapter 4: Further development of an ocular insert with slow release properties loaded with lysozyme
Parts of this chapter have been published in:
Everaert A, Broeckx G, Fransen E, Ludwig A, Kiekens F, Weyenberg W. Evaluation of a newly
developed HPMC ophthalmic insert with sustained release properties as a carrier for thermolabile
therapeutics. Int J Pharm. 2015;481: 37–46.

106
1 INTRODUCTION
The primary objective of the present chapter was to further develop and evaluate the method of
preparing ocular HPMC inserts while avoiding production steps that might have a negative impact
on drug stability. Instead of a small molecule such as sodium fluorescein, the much larger molecule
lysozyme was chosen as a globular model protein [1,2]. Lysozyme or muramidase is a ubiquitous
enzyme present in various body fluids, such as human serum, urine, tears, seminal fluid and milk.
Lysozyme hydrolyses ß-(1-4)-glycosidic linkages between N-acetylmuramic acid and N-acetyl-D-
glucosamine residues present in the mucopolysaccharide cell wall of a variety of microorganisms
[3–6]. Despite a visibly lower opacity of K100M polymers, HPMC K100M was selected and
compared to HPMC E10M. From the manufacturer’s technical handbook, K100M has an intrinsically
higher viscosity which might influence the outcome of drug loading and release [7]. Preliminary
studies showed that increasing the glycerol percentage negatively influences the diffusion process
of the drug solution in the partially dehydrated polymer cylinder. Therefore, in this chapter, the
amount of glycerol was set to 5% (w/w) instead of 10% (w/w).
Peptides and proteins require specific attention during the development and processing of
ophthalmic inserts as described in the following parts. Firstly, proteins containing thiol groups, such
as methionine and cysteine residues, are particularly susceptible to oxidation [8,9]. Therefore, air
bubble entrapment in the viscous polymer dispersion should be avoided. Solvent casting is a
commonly used method for the preparation of ocular inserts (e.g. ocular films) [10–18]. This
method does not require heat in order to disperse the drug molecules homogeneously. A low-
viscous solution is formed by mixing the various components and is poured into an appropriate
mould. The solution is dried over an extended period of time at room temperature or above. The
exposure of the drug molecules to air and the suboptimal temperatures at which solvent casting is
performed, may cause proteins to denaturate. Oxidation can be avoided by performing the
dehydration step in an inert atmosphere and at low temperatures for drug stability reasons.
However, inherent to low temperatures, the time required to dry the dispersion will extend and is
therefore undesirable. In addition, the very thin shape and low moisture content of polymer based
ocular films can make these formulations extract tear fluid from the eye, hereby elevating the risk
of eye irritation [19].
Secondly, denaturation of peptides and proteins can also occur by applying mechanical stress such
as shear forces [20–24]. Mechanical agitation such as high shear homogenisers and comparable

107
blending devices can change the conformation of peptides and proteins, potentially causing loss of
activity.
Thirdly, the most common way of preparing a homogeneous gel is blending the different excipients
and active pharmaceutical ingredient (API) together in the same vessel under high shear forces [25].
Due to the desired properties of the gel (high viscosity), the aforementioned method of preparing
homogeneous gels is not appropriate as lumping of the hydrogel cannot be avoided easily at low
temperatures. Additionally, high shear mixing enhances the entrapment of air bubbles.
In the previous chapter, sodium fluorescein was used as a tracer molecule to assess the early
development of the new preparation method for ocular inserts. The incorporation of lysozyme as
model protein is described in this chapter. The higher molecular weight of lysozyme (14.3 kDa) as
opposed to the molecular weight of sodium fluorescein (0.376 kDa) brings new challenges along.
The early method described the loading process of sodium fluorescein in a period of six weeks. In
the present chapter, the aim was to keep the loading process at six weeks, while homogeneously
incorporating a protein with a higher molecular weight.

108
2 MATERIALS AND METHODS
2.1 Materials
Hydroxypropylmethyl cellulose types E10M CR Premium and K100M Premium were obtained from
Colorcon (Dartford, UK). By specification, a 2% (w/w) E10M HPMC solution gives an apparent
viscosity of 10.000 mPa.s (20 °C) while a 2% (w/w) solution of K100M HPMC has an apparent
viscosity of 100.000 mPa.s under the same measuring conditions. Glycerol analytical grade and
lysozyme from chicken egg white were provided by Sigma-Aldrich (Steinheim, Germany). Purified
water (18.2 MΩ.cm) was used after being filtered over a 0.2 µm cellulose acetate filter from
Sartorius (Vilvoorde, Belgium). Sodium chloride (NaCl), sodium dihydrogen phosphate dihydrate
(NaH2PO4.2H2O) and disodium hydrogen phosphate dihydrate (Na2HPO4.2H2O) of analytical grade
were purchased from Merck (Darmstadt, Germany) and were used to prepare phosphate-buffered
saline solution (PBS, pH 7.4). PBS is an electrolyte solution composed of 8.2 g/l NaCl, 0.3 g/l
NaH2PO4.2H2O, 1.54 g/l Na2HPO4.2H2O and purified water.
The barrels are syringes of 20 ml and 30 ml with the outer cylinder consisting of polypropylene. The
piston is made of polypropylene and polyethylene. The joint of the piston is made of synthetic
isoprene with silicone as lubricant (BD Plastipak, Drogheda, Ireland).
2.2 Preparation of ocular inserts
The different rod-shaped, ocular inserts consist of varying percentages of HPMC, 3% (w/w)
lysozyme, 5% (w/w) glycerol as a plasticiser and water as solvent. The preparation of this drug
delivery system consists of four major phases which have been described in chapter 3 under 2.3
Initial method for the preparation of inserts. A schematic overview of the preparation method is
summarised in figure 1 and the differences with the early method are marked with an asterisk (*)
throughout this section.

Phase I Phase II Phase III Phase IV
Fig. 1. General overview of the preparation method. A clear hydrogel is prepared while applying heat, but in the absence of lysozyme. Dehydration occurs as the hydrogel is placed in a
drying oven at a higher temperature (150 °C) compared to the early method (100 °C), to allow better dehydration of the HPMC polymer K100M. The endpoint of the dehydration is
determined gravimetrically at 35% (w/w) or 45% (w/w) depending on the design of experiments. The dehydrated matrix is rehydrated with a solution of lysozyme, glycerol and purified
water. After a rehydration period of six weeks, the mass is extruded from the barrel through an opening of 2 mm.
Hydrogel
(HPMC + water)
Percentage HPMC: 10% (w/w)*
Dehydrated HPMC polymer
Percentage HPMC: 35 - 45% (w/w)*
Dehydration T = 150 °C*
Rehydration T = 2 °C
Drug loaded HPMC
polymer
Barrel volume
20 - 30 ml*
Extrusion of inserts
Percentage HPMC: 15 - 20% (w/w)*
6 weeks T = 2 °C
Rehydration solution:
lysozyme, glycerol, purified water

110
Contrary to other often used preparation methods such as solvent casting methods, a drying step
at room temperature is not necessary, thus minimising air contact time and potential oxidation of
the protein. The entrapment of air bubbles was avoided by preparing the HPMC solution in hot
purified water (>90 °C) which allows air bubbles to escape due to the initially low viscosity of the
polymer dispersion upon cooling. Temperature stability of the drug was ensured by working
conditions below room temperature and storing conditions at 2 °C. With the exception of gentle
extrusion, no external shear forces were applied on the formulations, thereby avoiding alleged
conformational modifications of the drug.
Phase I: Hydrogel-formation
A polymer solution of E10M or K100M* 10% (w/w)* was prepared by heating purified water up to
a temperature of 90-100 °C and adding HPMC to the water under continuous agitation. The HPMC
dispersion was steadily stirred (VMS-C7-2, IKA, Staufen, Germany) and was cooled down to room
temperature (22 ± 2 °C) resulting in a highly viscous polymer solution. In addition to this, it was
stored at 2 °C overnight in order to obtain full hydration of the polymer chains.
Phase II: Dehydration of the polymer solution
The viscous polymer solution was put in a drying oven (Thermo Scientific Heraeus Function Line
T12, Langenselbold, Germany) at a temperature of 150 °C* in order to dehydrate the HPMC
polymer solution. The higher temperature was required to allow dehydration of the polymer HPMC
K100M which did not adequately precipitate and expel water at 100 °C as initially chosen. The dry
percentage of the dehydrated polymer cylinder was determined gravimetrically on an analytical
balance (Mettler Toledo AB135-S, Greifensee, Switzerland). To avoid a strongly dehydrated outer
layer and a relatively more hydrated core, a glass beaker was reversely put over the polymer
cylinder to create a saturated atmosphere of vapour around the polymer cylinder during
dehydration. The drying time took up to three hours for polymer cylinders dried up to 45% HPMC
(w/w)* and about two hours for polymer cylinders dried up to 35% HPMC (w/w).
Phase III: Rehydration of the polymer cylinder formed
In the previous, early method, only a central perforation was punched in the polymer matrix for a
better and easier distribution of the drug solution. For this series of experiments, the polymer
cylinder was cut into a hashtag geometry* viewed from above to reduce the diffusion path of the
drug solution and was put in a closed barrel with a volume of 20 ml or 30 ml. These barrels have an
inner diameter of 20 mm and 25 mm respectively. The diameter of the central cut was set to 5 mm.
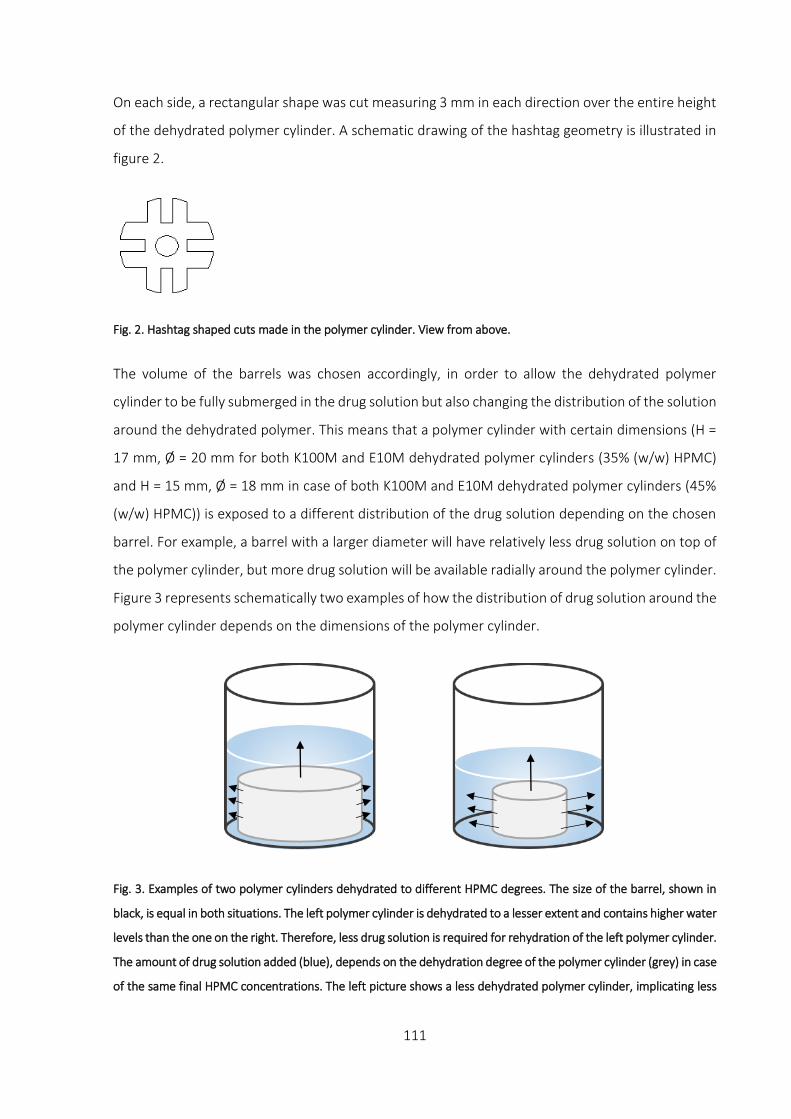
111
On each side, a rectangular shape was cut measuring 3 mm in each direction over the entire height
of the dehydrated polymer cylinder. A schematic drawing of the hashtag geometry is illustrated in
figure 2.
Fig. 2. Hashtag shaped cuts made in the polymer cylinder. View from above.
The volume of the barrels was chosen accordingly, in order to allow the dehydrated polymer
cylinder to be fully submerged in the drug solution but also changing the distribution of the solution
around the dehydrated polymer. This means that a polymer cylinder with certain dimensions (H =
17 mm, Ø = 20 mm for both K100M and E10M dehydrated polymer cylinders (35% (w/w) HPMC)
and H = 15 mm, Ø = 18 mm in case of both K100M and E10M dehydrated polymer cylinders (45%
(w/w) HPMC)) is exposed to a different distribution of the drug solution depending on the chosen
barrel. For example, a barrel with a larger diameter will have relatively less drug solution on top of
the polymer cylinder, but more drug solution will be available radially around the polymer cylinder.
Figure 3 represents schematically two examples of how the distribution of drug solution around the
polymer cylinder depends on the dimensions of the polymer cylinder.
Fig. 3. Examples of two polymer cylinders dehydrated to different HPMC degrees. The size of the barrel, shown in
black, is equal in both situations. The left polymer cylinder is dehydrated to a lesser extent and contains higher water
levels than the one on the right. Therefore, less drug solution is required for rehydration of the left polymer cylinder.
The amount of drug solution added (blue), depends on the dehydration degree of the polymer cylinder (grey) in case
of the same final HPMC concentrations. The left picture shows a less dehydrated polymer cylinder, implicating less

112
drug solution being available radially of the polymer cylinder compared to the situation on the right. This means that
swelling is mainly limited in the axial direction for the picture on the left, while swelling in all directions will occur for
the polymer cylinder on the right. These examples show the influence of the polymer cylinder dimensions on the
distribution of the drug solution added.
An aqueous solution of lysozyme and glycerol was prepared and added to the barrel after finalising
the dehydration step. As all calculations have been performed by mass, the composition of the drug
solution added can be given by means of mass. The exact composition of the drug solution
depended on the exact composition and cut of every dehydrated polymer cylinder prepared. Table
1 gives an overview of the composition of the different formulations merely as an example.
Table 1. Overview of the different formulations and their composition.
*The amount of lysozyme added to the solution was calculated as 3% (w/w) of the total mass.
The rehydration process is performed at 2 °C to ensure drug stability of the potentially thermolabile
proteins or molecules incorporated in the insert. Even at temperatures as low as 2 °C, the drug
solution migrates by means of passive diffusion into the polymer matrix avoiding the use of mixing
forces to obtain a homogeneously loaded matrix. Due to the low temperature used during this
phase, the high viscosity of the polymer cylinder and the low diffusional rate slow down the
rehydration process in comparison to the same process at room temperature. After a
homogenisation period of six weeks, the inserts were extruded from the barrel. The period of
rehydration was kept equal to the previously introduced method, keeping in mind that lysozyme is
a much larger molecule than sodium fluorescein.
Phase IV: Extrusion
After obtaining a semisolid hydrogel in the barrel, the content of the syringe was manually extruded
through an opening of 2 mm by applying mild extrusion forces. The extruded samples were
packaged in a sealed container and stored in a refrigerator at a temperature of 2 °C.
Dry percentage
HPMC % (w/w)
End percentage
HPMC % (w/w)
Mass glycerol
added (g)
Mass purified
water added (g)
Mass lysozyme
added (g)*
35 20 0.31 2.195 0.189
35 15 0.42 4.127 0.252
45 20 0.30 2.890 0.182
45 15 0.41 4.753 0.243

113
2.3 Factorial design and statistical analysis
A 24 full factorial design, performed in duplicate resulting in 2 x 16 different formulations, was set
up to determine the influence of the chosen parameters yielding inserts with suitable
characteristics. Furthermore, their influence on the release profile and water uptake was
investigated by means of statistical analysis with an ANOVA-test using the statistical software
package R®, version 2.13.1 (R Foundation for Statistical Computing, Vienna, Austria). An overview
of the levels of the parameters is given in table 2 and an overview of the experiments is summarised
in table 3.
Table 3. Overview of the different experiments and selected variables. Each formulation was prepared and measured
in duplicate.
Formulation Polymer type Dry % HPMC Final % HPMC Volume barrel
1 + + + +
2 + + - +
3 + - + +
4 + - - +
5 - + + -
6 - + - -
7 - - + +
8 - - - +
9 + + + -
10 + + - -
11 + - + -
12 + - - -
13 - + + +
14 - + - +
15 - - + -
16 - - - -
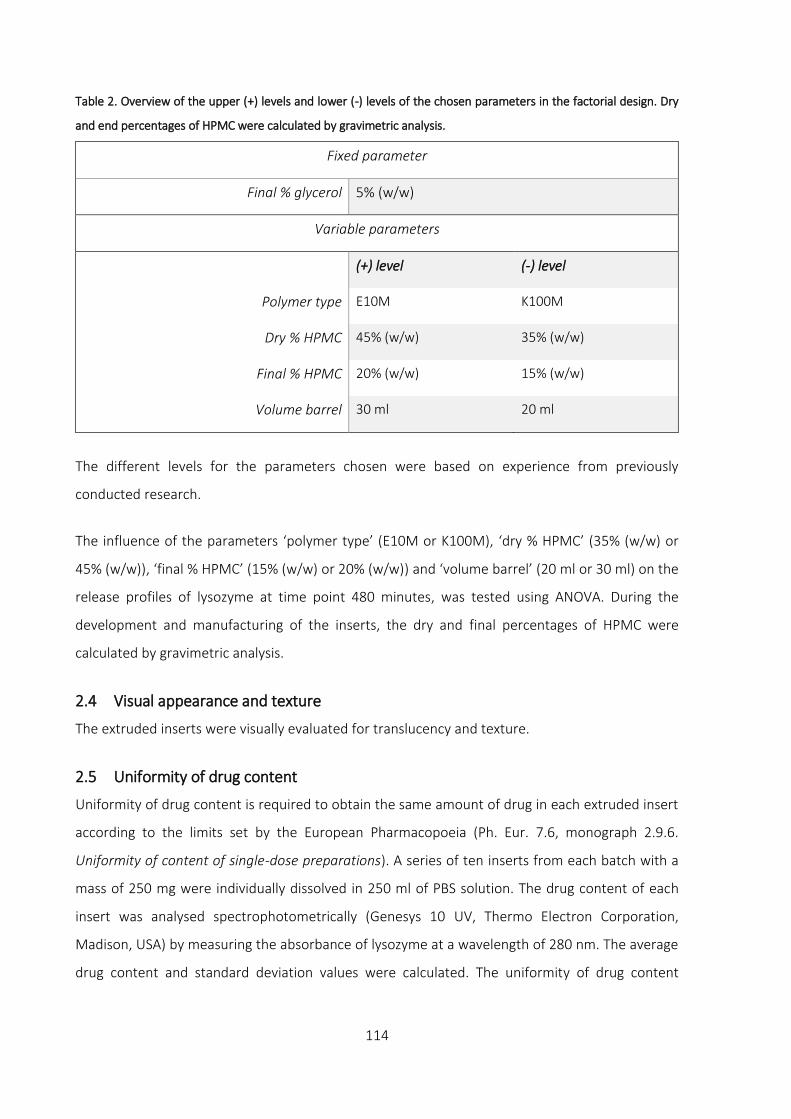
114
Table 2. Overview of the upper (+) levels and lower (-) levels of the chosen parameters in the factorial design. Dry
and end percentages of HPMC were calculated by gravimetric analysis.
Fixed parameter
Final % glycerol 5% (w/w)
Variable parameters
(+) level (-) level
Polymer type E10M K100M
Dry % HPMC 45% (w/w) 35% (w/w)
Final % HPMC 20% (w/w) 15% (w/w)
Volume barrel 30 ml 20 ml
The different levels for the parameters chosen were based on experience from previously
conducted research.
The influence of the parameters ‘polymer type’ (E10M or K100M), ‘dry % HPMC’ (35% (w/w) or
45% (w/w)), ‘final % HPMC’ (15% (w/w) or 20% (w/w)) and ‘volume barrel’ (20 ml or 30 ml) on the
release profiles of lysozyme at time point 480 minutes, was tested using ANOVA. During the
development and manufacturing of the inserts, the dry and final percentages of HPMC were
calculated by gravimetric analysis.
2.4 Visual appearance and texture
The extruded inserts were visually evaluated for translucency and texture.
2.5 Uniformity of drug content
Uniformity of drug content is required to obtain the same amount of drug in each extruded insert
according to the limits set by the European Pharmacopoeia (Ph. Eur. 7.6, monograph 2.9.6.
Uniformity of content of single-dose preparations). A series of ten inserts from each batch with a
mass of 250 mg were individually dissolved in 250 ml of PBS solution. The drug content of each
insert was analysed spectrophotometrically (Genesys 10 UV, Thermo Electron Corporation,
Madison, USA) by measuring the absorbance of lysozyme at a wavelength of 280 nm. The average
drug content and standard deviation values were calculated. The uniformity of drug content

115
measurement was performed in duplicate on each formulation. Validation of the method was
assessed prior to the measurements and given in Appendix.
2.6 Water uptake
Water uptake was studied gravimetrically using a Baumann apparatus with PBS as medium. A small
amount of sample (± 120 mg) was put on a molecular porous membrane (Spectra/Por® MWCO:
12000 – 14000, Spectrum, Breda, The Netherlands) which was placed on the fritted glass plate of
the Baumann capillary apparatus and covered to prevent evaporation of the medium. The amount
of water absorption was calculated after the sample had been weighed at 60, 120, 240 and 360
minutes. The following formula was used to determine the amount of water uptake (W) at a given
time:
𝑊 = 𝑚𝑎 − 𝑚𝑑
𝑚𝑑
.100%
W: amount of PBS absorbed by the insert expressed as a percentage
ma: mass of the insert after absorption of medium
md: mass of the insert before absorption of medium
2.7 Viscosity measurements
In order to correlate the drug release profiles to the viscosity of the lysozyme loaded inserts,
viscosity measurements were carried out. Samples of HPMC K100M and E10M, both in 20% (w/w)
and 15% (w/w) final HPMC percentages with 5% (w/w) glycerol, were prepared. The viscosity was
measured through oscillation on an Anton Paar rheometer (MCR 102, Graz, Austria) at a
temperature of 32.0 ± 0.1 °C. Prior to the frequency sweep measurements, a maximum amplitude
measurement was performed to determine the linear viscoelastic region. The strain was
consequently set at an amplitude of 1%. The following settings were used for all oscillation
measurements: parallel plate with a diameter of 8 mm and the gap size set at 1 mm. The angular
frequency was varied from 100 to 0.1 rad/s. To prevent evaporation of water from the hydrogel
during the measurements, a solvent trap was used to cover the sample.
2.8 In vitro drug release studies
The release patterns of the different formulations were determined. Two inserts weighing 150 mg
each (Ø = 2 mm, L = 10 ± 1 mm) were extruded at random from a single barrel and put into separate

116
test tubes containing 5 g PBS. The test tubes were placed in a non-oscillating water bath (Julabo
20B, Merck-Belgolabo, Overijse, Belgium) at a temperature of 32.0 ± 0.5 °C. After intervals of 30,
60, 90, 120, 180, 240, 360, 420 and 480 minutes, samples of 1 g were withdrawn from the release
medium after gentle homogenisation and replaced with an equal mass of fresh PBS solution at 32
°C. The drug content at each time interval was measured spectrophotometrically at a maximum
wavelength of 280 nm. After 480 minutes, the insert was intensively vortexed to release all of the
remaining drug from the insert. The drug content was calculated from the total percentage drug
present in the insert.
2.9 Drug release analysis
The in vitro release patterns were analysed for zero order, first order or mixed order kinetics. The
Korsmeyer-Peppas equation, also referred to as the so-called power law, is a semi-empirical
equation to describe drug release from a polymeric system. The power law is given as follows:
M𝑡
M= K𝑡𝑛
Mt: amount of drug released at time t
M: total amount of drug in the dosage form
K: kinetic constant
n: release exponent indicating the drug release mechanism
This equation is applicable in swellable systems when the system only swells to a moderate
equilibrium degree [26]. For cylindrically shaped dosage forms, a release exponent of n ≤ 0.45
indicates Fickian diffusion or first order kinetics. If n ≥ 0.89, the drug release rate is independent of
time, corresponding to case-II transport or zero order kinetics. Values of n between 0.45 and 0.89
can be seen as mixed zero and first order kinetics, also referred to as anomalous diffusion or non-
Fickian diffusion [27].

117
3 RESULTS AND DISCUSSION
3.1 Visual appearance and texture
The extruded ocular inserts were rod shaped and appeared translucent with a smooth texture. All
inserts were flexible and had no sharp edges which is beneficial for pre-corneal use. However, when
large volumes of hydrogels were prepared with HPMC K100M, some turbidity was noticed, even in
percentages as low as 2% (w/w). Hydrogels prepared with HPMC E10M always showed excellent
clarity, regardless of the volume prepared or the percentage of HPMC used. Whether this turbidity
influences the vision in human eyes in case of very small inserts, remains to be investigated.
3.2 Uniformity of drug content
For the different experiments, uniformity of content revealed that four out of sixteen duplicate
experiments complied with the limits set by the Ph. Eur. 7.6, monograph 2.9.6 Uniformity of single-
dose preparations. Content measurements of formulations 2, 4, 13 and 14 exhibited a
homogeneous distribution of lysozyme for both duplicates. The results are graphically shown in
figure 4a and 4b.
0
25
50
75
100
125
150
175
1A 1B 2A 2B 3A 3B 4A 4B 9A 9B 10A 10B 11A 11B 12A 12B
E10M
Co
nte
nt
(%)
Lowest value Highest value

118
Fig. 4a and 4b. Overview of the content lysozyme in formulations with HPMC E10M and K100M respectively. The
average content of all measured inserts is considered 100%. Indicated with green lines, the 85% and 115% limits set
by the Ph. Eur. 7.6, monograph 2.9.6 are given. The blue and orange bars represent the lowest and highest value of
content of ten measured samples respectively. All formulations of which the lowest and highest values are within
the 85 - 115% limits, comply with the test and are shown in green/yellow bars.
Although the formulations 2, 4, 13 and 14 comply with the monograph 2.9.6 in duplicate, the
average drug content was also calculated and expressed in function of the theoretical drug content.
The results for these experiments are shown in table 3.
Table 3. Results of the average drug content of ten inserts extruded from a single barrel. For each formulation, two
replicates A and B were prepared and analysed.
Formulation Average drug content Standard deviation
2A 86,58% 4,38
2B 89,65% 1,79
4A 81,83% 3,32
4B 79,01% 3,19
13A 84,61% 5,80
13B 85,17% 6,58
14A 91,40% 2,96
14B 90,71% 4,19
0
25
50
75
100
125
150
175
5A 5B 6A 6B 7A 7B 8A 8B 13A 13B 14A 14B 15A 15B 16A 16B
K100M
Co
nte
nt
(%)
Lowest value Highest value
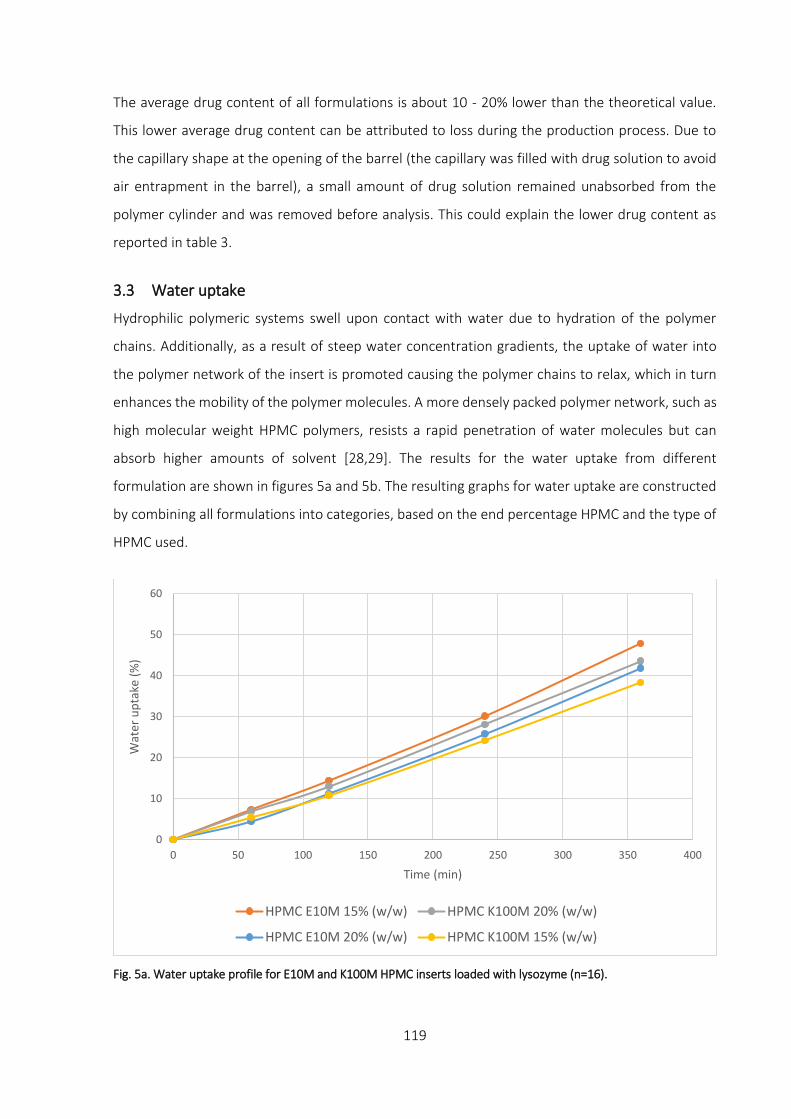
119
The average drug content of all formulations is about 10 - 20% lower than the theoretical value.
This lower average drug content can be attributed to loss during the production process. Due to
the capillary shape at the opening of the barrel (the capillary was filled with drug solution to avoid
air entrapment in the barrel), a small amount of drug solution remained unabsorbed from the
polymer cylinder and was removed before analysis. This could explain the lower drug content as
reported in table 3.
3.3 Water uptake
Hydrophilic polymeric systems swell upon contact with water due to hydration of the polymer
chains. Additionally, as a result of steep water concentration gradients, the uptake of water into
the polymer network of the insert is promoted causing the polymer chains to relax, which in turn
enhances the mobility of the polymer molecules. A more densely packed polymer network, such as
high molecular weight HPMC polymers, resists a rapid penetration of water molecules but can
absorb higher amounts of solvent [28,29]. The results for the water uptake from different
formulation are shown in figures 5a and 5b. The resulting graphs for water uptake are constructed
by combining all formulations into categories, based on the end percentage HPMC and the type of
HPMC used.
Fig. 5a. Water uptake profile for E10M and K100M HPMC inserts loaded with lysozyme (n=16).
0
10
20
30
40
50
60
0 50 100 150 200 250 300 350 400
Wat
er u
pta
ke (
%)
Time (min)
HPMC E10M 15% (w/w) HPMC K100M 20% (w/w)
HPMC E10M 20% (w/w) HPMC K100M 15% (w/w)

120
Fig. 5b. Water uptake profile for HPMC inserts E10M and K100M loaded with lysozyme (n=16).
Graphical analysis showed that the increase in water uptake over time was almost linear. However,
the large gap between the last measuring point at 1440 minutes and the previous measuring point
(360 minutes) makes the last measurement significantly influential in a regression analysis.
Therefore, regression analysis was carried out excluding the measurements at 1440 minutes and
they are therefore not shown. A first regression analysis was carried out on the results of time point
360 minutes. The influence of ‘polymer type’, ‘dry % HPMC’, ‘final % HPMC’ and ‘volume barrel’
was assessed using stepwise backward regression, starting from a model with these four variables
and their pairwise interactions. No significant effect of any of these factors could be found (p>0.05).
Next, the effect of time on the water uptake was examined by a longitudinal analysis on all
measurements between the start of the experiment and time point 360 minutes. The influence of
the parameters ‘polymer type’, ‘end percentage’ and ‘volume barrel’ on the water uptake was
investigated. Since the evolution of water uptake over time appeared linear, the parameter ‘time’
was included as a continuous variable. On each formulation, several repeated measurements over
time were carried out. To account for the dependence between different samples within one
formulation, a random intercept term for the formulation type was added to the regression model.
0
10
20
30
40
50
60
0 50 100 150 200 250 300 350 400
Wat
er u
pta
ke (
%)
Time (min)
HPMC E10M HPMC K100M

121
Starting from a model with the parameters ‘time’, ‘polymer type’, ‘volume barrel’ and ‘final %
HPMC’ including their pairwise interactions, a stepwise backward model building was used. The
final model revealed a significant interaction between ‘polymer type’ and ‘time’ (p = 0.010)
indicating that the slope of the curve versus time is different for E10M and K100M HPMC samples.
Although from figure 5a, it could have been expected that the percentage of polymer had a
significant influence on the water uptake, no statistical difference between 15% (w/w) and 20%
(w/w) HPMC on the water uptake behaviour was observed. In contrast, the type of polymer used
had a statistically significant effect on the water uptake as demonstrated in figure 5b. In conclusion,
the polymer HPMC E10M appears to have a higher water uptake capacity than HPMC K100M for
the given time period, albeit the overall effect is relatively small.
3.4 Viscosity measurements
The viscosity was plotted in function of angular frequency, as shown in figure 6.
Fig. 6. Viscosity profiles for inserts loaded with lysozyme with both types of HPMC (E10M and K100M) and two
different HPMC percentages (15% (w/w) and 20% (w/w)).
The viscosity of all measured samples increased with decreasing angular frequencies. As expected,
K-type HPMC has a higher viscosity than E-type HPMC for corresponding polymer percentages
measured. The highest viscosity values were obtained in case of HPMC K100M 20% (w/w) while the
lowest viscosity values were measured for HPMC E10M 15% (w/w). HPMC E10M 20% (w/w) showed
1,00E+02
1,00E+03
1,00E+04
1,00E+05
1,00E+06
0,1 1 10 100
Vis
cosi
ty (
Pa.
s)
Angular frequency (rad/s)
HPMC E10M 15% (w/w) HPMC E10M 20% (w/w)
HPMC K100M 15% (w/w) HPMC K100M 20% (w/w)

122
higher viscosity values than K100M 15% (w/w), although the viscosities of both samples were
comparable at the lowest angular frequencies.
3.5 Release profile
The initial release rate of drug molecules is mainly driven by diffusional forces. As the prepared
inserts already contain a certain amount of water, drug molecules can readily be released by means
of passive diffusion from the unlinked polymer matrix. Additionally, as the polymer chains become
hydrated, the hydrodynamic dimensions of the polymeric matrix will increase as a result from
swelling of the insert. This swelling dilutes the polymeric network causing disentanglement, and
thereby releasing the drug by means of erosion until equilibrium is reached [30,31]. Polymers with
high molecular weight such as HPMC K100M have a more closely packed polymeric network and a
higher intrinsic viscosity, slowing down the release rate of the drug molecules incorporated [17,31–
33]. This effect is more pronounced for larger drug molecules.
The amount of lysozyme released from the HPMC inserts is given in the cumulative release plots in
figures 7a and 7b for inserts prepared in 20 ml and 30 ml barrels respectively.
Fig. 7a. Cumulative release profiles of lysozyme loaded inserts prepared in 20 ml barrels (n=8).
0
10
20
30
40
50
60
70
80
90
100
0 50 100 150 200 250 300 350 400 450 500
Cu
mu
lati
ve r
elea
se (
%)
Time (min)
HPMC K100M 15% (w/w) - 20 ml HPMC E10M 15% (w/w) - 20 ml
HPMC K100M 20% (w/w) - 20 ml HPMC E10M 20% (w/w) - 20 ml

123
Fig. 7b. Cumulative release profiles of lysozyme loaded inserts prepared in 30 ml barrels (n=8). The drug release is
compared to the total amount of drug present after full release of the drug from the matrix.
Erosion of the inserts became visually apparent as the release continued over the course of hours.
The differences within the amount of lysozyme released from inserts prepared in a barrel with a
volume of 30 ml are statistically significant. In this case, lysozyme molecules exhibit slower release
from a K100M matrix than for E10M inserts for the same HPMC percentage. Additionally, the
release rate is slower from 20% (w/w) than 15% (w/w) end percentage HPMC inserts. The protein
release appears to be influenced by the resistance from the polymer network which is determined
by the molecular weight of the drug molecules and the concentration HPMC used to build up the
polymer matrix [33]. There seems to be a good correlation between the release profile of inserts
prepared in a barrel of 30 ml and the viscosity data obtained. The slower release of drug molecules
from the K100M matrix compared to the E10M matrix at the same HPMC percentage correlated
with the differences in viscosity measured as shown in figure 6. Furthermore, inserts prepared with
K100M 15% (w/w) appear to show similar release profiles and comparable viscosities (at low
oscillatory frequencies) as inserts prepared with E10M 20% (w/w).
From a theoretical point of view, inserts loaded in barrels of 20 ml or 30 ml should yield the same
end result as the final composition of the drug-polymer mass is the same in both type of barrels.
When the polymer cylinder is loaded with the drug solution in 20 ml barrels, the end product has
0
10
20
30
40
50
60
70
80
90
100
0 50 100 150 200 250 300 350 400 450 500
Cu
mu
lati
ve r
elea
se (
%)
Time (min)
HPMC E10M 15% (w/w) - 30 ml HPMC K100M 15% (w/w) - 30 ml
HPMC E10M 20% (w/w) - 30 ml HPMC K100M 20% (w/w) - 30 ml
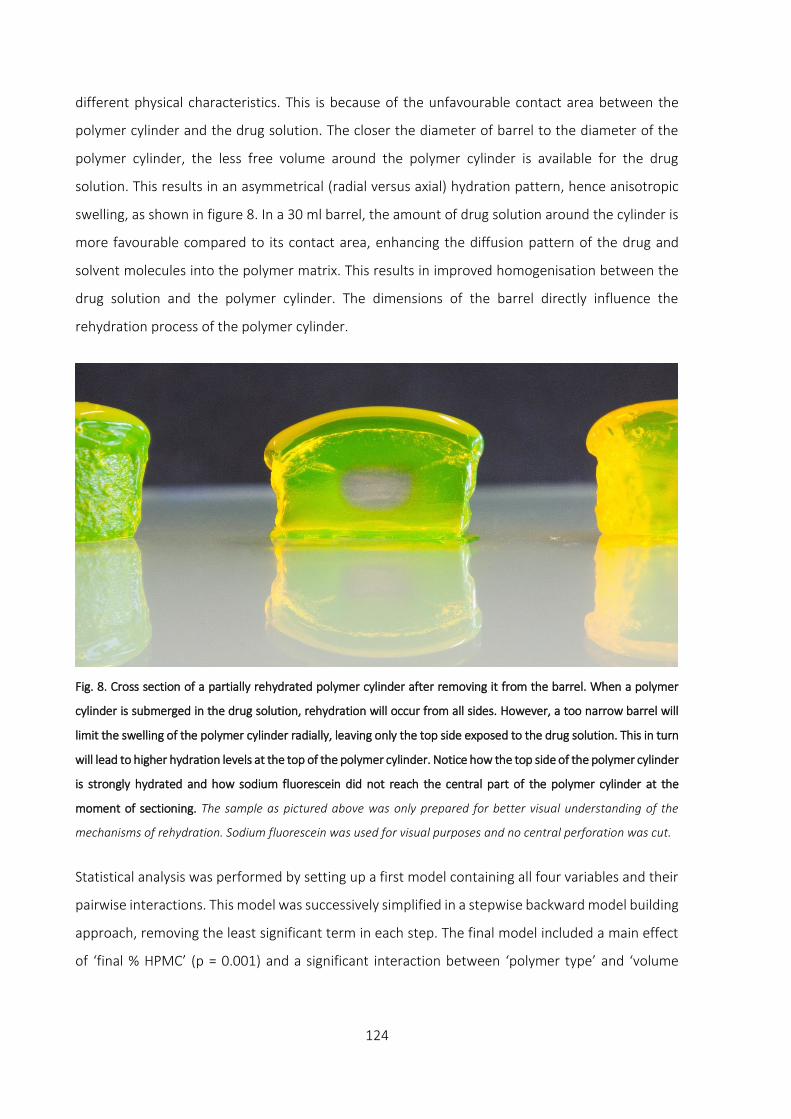
124
different physical characteristics. This is because of the unfavourable contact area between the
polymer cylinder and the drug solution. The closer the diameter of barrel to the diameter of the
polymer cylinder, the less free volume around the polymer cylinder is available for the drug
solution. This results in an asymmetrical (radial versus axial) hydration pattern, hence anisotropic
swelling, as shown in figure 8. In a 30 ml barrel, the amount of drug solution around the cylinder is
more favourable compared to its contact area, enhancing the diffusion pattern of the drug and
solvent molecules into the polymer matrix. This results in improved homogenisation between the
drug solution and the polymer cylinder. The dimensions of the barrel directly influence the
rehydration process of the polymer cylinder.
Fig. 8. Cross section of a partially rehydrated polymer cylinder after removing it from the barrel. When a polymer
cylinder is submerged in the drug solution, rehydration will occur from all sides. However, a too narrow barrel will
limit the swelling of the polymer cylinder radially, leaving only the top side exposed to the drug solution. This in turn
will lead to higher hydration levels at the top of the polymer cylinder. Notice how the top side of the polymer cylinder
is strongly hydrated and how sodium fluorescein did not reach the central part of the polymer cylinder at the
moment of sectioning. The sample as pictured above was only prepared for better visual understanding of the
mechanisms of rehydration. Sodium fluorescein was used for visual purposes and no central perforation was cut.
Statistical analysis was performed by setting up a first model containing all four variables and their
pairwise interactions. This model was successively simplified in a stepwise backward model building
approach, removing the least significant term in each step. The final model included a main effect
of ‘final % HPMC’ (p = 0.001) and a significant interaction between ‘polymer type’ and ‘volume

125
barrel’ (p = 0.002), indicating that the difference in release between E10M and K100M was
dependent on the volume of the barrel used for loading lysozyme in the matrix.
Subsequently, the dataset was split into the measurements of samples prepared in 20 ml volume
and the results of samples loaded in 30 ml volume barrels. As shown in figure 9a, when the sample
was prepared in a volume of 20 ml, there was a slight but not statistically significant effect of ‘final
% HPMC’ (p = 0.090) and no significant effect of ‘polymer type’. On the other hand, when samples
were prepared in the 30 ml barrel, both the effect of ‘polymer type’ (p = 0.004) and ‘final % HPMC’
(p = 0.004) were statistically significant. The mean release percentage was 9.37% (w/w) lower in
the K100M compared to the E10M inserts. For inserts with a final percentage 20% (w/w) HPMC,
the release percentage was 9.30% (w/w) lower as opposed to inserts with a final percentage of 15%
(w/w) HPMC.
The boxplots in figure 9a and figure 9b show the effects of the parameters ‘polymer type’, ‘volume
barrel’ and ‘final % HPMC’.
Fig. 9a and 9b. The ordinate is expressed as release percentage. (a) Boxplots comparing the parameters affecting
the amount of lysozyme released from the inserts at time point 480 minutes with a final percentage HPMC of 15%
(w/w) or 20% (w/w). (b) Boxplots comparing the parameters affecting the amount of lysozyme released from the
inserts at time point 480 minutes with different HPMC types E10M or K100M.
As demonstrated in figure 9a, across all volumes and polymers, the 15% (w/w) final percentage
HPMC has a higher amount of drug released from the matrix when compared to the 20% (w/w)
HPMC. When loaded in 30 ml barrels, the difference is even more pronounced.

126
The difference between E10M and K100M inserts is marginal as indicated in figure 9b when loaded
in the 20 ml volume (two left panels), while prepared in the 30 ml volume barrels the E10M inserts
have a considerable larger release percentage.
3.6 Release kinetics
As described above, the release of drug molecules from the polymeric network is both determined
by passive diffusion of the drug molecules, as well as the rate of hydration of the polymer matrix.
As larger molecules experience more resistance from the polymeric network, drug release will
depend less on passive diffusion and more on erosion of the matrix as a result of disentanglement
of the unlinked polymer matrix.
The analysis for the release kinetics of the cumulative release profiles is shown in figure 10.
Fig. 10. Release kinetics of lysozyme loaded inserts using the Peppas–Korsmeyer model.
From figure 10, the slope calculated for lysozyme loaded inserts reveals no significant differences
in release kinetics for all measured samples. The slope of the linear regression equals a value of
0.4799, thus indicative for mixed zero and first order release kinetics with possibly higher first order
kinetics for all formulations. However, it should be pointed out that the application of the power
law merely gives a limited insight into the exact release mechanism of the drug due to swelling
properties and dissolution of the HPMC insert.
R² = 0,9847
y = 0,4799x + 0,547
0
0,5
1
1,5
2
2,5
0 0,5 1 1,5 2 2,5 3 3,5
Log
cum
ula
tive
rel
ease
lyso
zym
e (%
)
Log time (min)
15% (w/w) E10M 20% (w/w) E10M
20% (w/w) K100M 15% (w/w) K100M

127
4 CONCLUSION
The newly designed ocular inserts described in this chapter, demonstrate that a water-soluble
protein can be loaded into an ocular insert without heat or high shear forces being required and
avoiding air bubble entrapment, reducing the risk of oxidation. The amount of drug released from
the insert depends on the molecular weight of the drug molecule, due to the entangled polymer
network of HPMC used for the development of the inserts. The rehydration period was kept equally
lengthy as in the initially developed method described in chapter 3, but obtaining homogeneous
results with a much larger molecule as lysozyme can be considered an achievement. The release
characteristics of these inserts make this drug delivery system suitable for the incorporation of
proteins such as lysozyme, although the method or batch size requires optimisation to speed up
the drug solution absorption process. The extrusion phase to obtain inserts can be regarded as
shear forces, albeit very mild. These shear forces should preferably be avoided or at least reduced
as much as possible.
For this reason, the next chapter primarily focusses on shortening the drug loading time and
avoiding extrusion forces by preparing the inserts individually. Furthermore, the final HPMC
percentage will be increased to 25% (w/w) in an attempt to slow down the release rate even further
and bovine serum albumin was added to investigate the effect of even larger proteins on the drug
release behaviour.
I would sincerely like to thank prof. dr. Erik Fransen (StatUA, Center for Statistics, University of
Antwerp) for his help with the statistical analyses described in this chapter.

128
References
1. Day L, Zhai J, Xu M, Jones NC, Hoffmann S V., Wooster TJ. Conformational changes of globular proteins
adsorbed at oil-in-water emulsion interfaces examined by synchrotron radiation circular dichroism. Food
Hydrocoll. 2014;34: 78–87.
2. Bhowal AC, Das K, Kundu S. Fluorescence behavior of globular proteins from their bulk and thin film
conformations in presence of mono-, di- and tri-valent ions. Colloids Surfaces B Biointerfaces. 2015;133:
263–269.
3. Brasca M, Morandi S, Silvetti T, Rosi V, Cattaneo S, Pellegrino L. Different analytical approaches in assessing
antibacterial activity and the purity of commercial lysozyme preparations for dairy application. Molecules.
2013;18: 6008–6020.
4. Guascito MR, Chirizzi D, Malitesta C, Giotta L, Mastrogiacomo D, Valli L, et al. Development and
characterization of a novel bioactive polymer with antibacterial and lysozyme-like activity. Biopolymers.
2014;101: 461–470.
5. Carreira AS, Ferreira P, Ribeiro MP, Correia TR, Coutinho P, Correia IJ, et al. New drug-eluting lenses to be
applied as bandages after keratoprosthesis implantation. Int J Pharm. 2014;477: 218–226.
6. Haj-Ahmad RR, Elkordy AA, Chaw CS, Moore A. Compare and contrast the effects of surfactants (Pluronic
F-127 and Cremophor EL) and sugars (beta-cyclodextrin and inulin) on properties of spray dried and
crystallised lysozyme. Eur J Pharm Sci. 2013;49: 519–534.
7. Dow® METHOCEL Cellulose Ethers Technical Handbook. Journal of the National Cancer Institute. 2012.
8. Vogt W. Oxidation of methionyl residues in proteins: Tools, targets, and reversal. Free Radic Biol Med.
1995;18: 93–105.
9. Torosantucci R, Schöneich C, Jiskoot W. Oxidation of therapeutic proteins and peptides: Structural and
biological consequences. Pharm Res. 2014;31: 541–553.
10. Siemann U. Solvent cast technology - A versatile tool for thin film production. Prog Colloid Polym Sci.
2005;130: 1–14.
11. Mahajan HS, Deshmukh SR. Development and evaluation of gel-forming ocular films based on xyloglucan.
Carbohydr Polym. 2015;122: 243–247.
12. Aburahma MH, Mahmoud AA. Biodegradable ocular inserts for sustained delivery of brimonidine
tartarate: preparation and in vitro/in vivo evaluation. AAPS PharmSciTech. 2011;12: 1335–1347.
13. Mukherjee P, Manvi F V., Sreenivas SA. Sulphacetamide sodium ocular inserts: Design, formulation and
evaluation. Indian Drugs. 2006;43: 705–708.
14. Rathore KS, Nema RK, Sisodia SS. Preparation and characterization of timolol maleate ocular films. Int J
PharmTech Res. 2010;2: 1995–2000.
15. Kurek M, Brachais CH, Nguimjeu CM, Bonnotte A, Voilley A, Galić K, et al. Structure and thermal properties
of a chitosan coated polyethylene bilayer film. Polym Degrad Stab. 2012;97: 1232–1240.
16. Harwood R, Schwartz J. Drug Release from Compression Molded Films: Preliminary Studies with
Pilocarpine. Drug Dev Ind Pharm. 1982;8: 663–682.
17. Ghosal K, Chakrabarty S, Nanda A. Hydroxypropyl methylcellulose in drug delivery. Pelagia Res Libr. 2011;2:

129
152–168.
18. Sundararaj SC, Thomas M V., Dziubla TD, Puleo DA. Bioerodible system for sequential release of multiple
drugs. Acta Biomater. 2014;10: 115–125.
19. Hermans K, Van Den Plas D, Everaert A, Weyenberg W, Ludwig A. Full factorial design, physicochemical
characterisation and biological assessment of cyclosporine A loaded cationic nanoparticles. Eur J Pharm
Biopharm. 2012;82: 27–35.
20. Di Stasio E, De Cristofaro R. The effect of shear stress on protein conformation: Physical forces operating
on biochemical systems: The case of von Willebrand factor. Biophys Chem. 2010;153: 1–8.
21. Ashton L, Dusting J, Imomoh E, Balabani S, Blanch EW. Shear-induced unfolding of lysozyme monitored in
situ. Biophys J. 2009;96: 4231–4236.
22. Jaspe J, Hagen SJ. Do protein molecules unfold in a simple shear flow? Biophys J. 2006;91: 3415–3424.
23. Charm SE, Wong BL. Shear effects on enzymes. Enzyme Microb Technol. 1981;3: 111–118.
24. Ashton L, Dusting J, Imomoh E, Balabani S, Blanch EW. Susceptibility of different proteins to flow-induced
conformational changes monitored with Raman spectroscopy. Biophys J. 2010;98: 707–714.
25. Rowe R, Sheskey P, Quinn M. Handbook of Pharmaceutical Excipients. Handbook of pharmaceutical
excipients, Sixth edition. 2009.
26. Ritger PL, Peppas NA. A simple equation for description of solute release II. Fickian and anomalous release
from swellable devices. J Control Release. 1987;5: 37–42.
27. Siepmann J, Kranz H, Bodmeier R, Peppas NA. HPMC-matrices for controlled drug delivery: A new model
combining diffusion, swelling, and dissolution mechanisms and predicting the release kinetics.
Pharmaceutical Research. 1999; 1748–1756.
28. Akbari J, Enayatifard R, Saeedi M, Saghafi M. Influence of hydroxypropyl methylcellulose molecular weight
grade on water uptake, erosion and drug release properties of diclofenac sodium matrix tablets. Trop J
Pharm Res. 2011;10: 535–541.
29. Abrahamsson B, Alpsten M, Bake B, Larsson A, Sjögren J. In vitro and in vivo erosion of two different
hydrophilic gel matrix tablets. Eur J Pharm Biopharm. 1998;46: 69–75.
30. Rajabi-Siahboomi AR, Bowtell RW, Mansfield P, Henderson A, Davies MC, Melia CD. Structure and
behaviour in hydrophilic matrix sustained release dosage forms: 2. NMR-imaging studies of dimensional
changes in the gel layer and core of HPMC tablets undergoing hydration. J Control Release. 1994;31: 121–
128.
31. Bettini R, Catellani PL, Santi P, Massimo G, Peppas NA, Colombo P. Translocation of drug particles in HPMC
matrix gel layer: Effect of drug solubility and influence on release rate. J Control Release. 2001;70: 383–
391.
32. Ghori MU, Ginting G, Smith AM, Conway BR. Simultaneous quantification of drug release and erosion from
hypromellose hydrophilic matrices. Int J Pharm. 2014;465: 406–412.
33. Gao P, Skoug JW, Nixon PR, Ju TR, Stemm NL, Sung KC. Swelling of hydroxypropyl methylcellulose matrix
tablets. 2. Mechanistic study of the influence of formulation variables on matrix performance and drug
release. J Pharm Sci. 1996;85: 732–740.


Chapter 5: Optimisation of the preparation of ocular inserts loaded with sodium fluorescein, lysozyme and bovine serum albumin
Parts of this chapter have been submitted to:
Everaert A, Wouters Y, Melsbach E, Zakaria N, Ludwig A, Kiekens F, Weyenberg W. Optimisation of
HPMC ophthalmic inserts with sustained release properties as a carrier for thermolabile
therapeutics. Int J Pharm. 2017

132
1 INTRODUCTION
In the previous chapters, it has been demonstrated that the newly developed method for preparing
drug-loaded ocular inserts is possible without the use of heat, air bubble entrapment or mixing
forces. One major drawback that needed to be overcome, was the time-consuming rehydration
period of six weeks to obtain a homogeneous HPMC hydrogel loaded with sodium fluorescein and
lysozyme.
To achieve a significantly shorter rehydration time without changing the basic principles of the
method developed, the inserts were no longer prepared as a batch of multiple inserts per syringe.
Instead, the inserts were prepared individually. For practical reasons, the dimensions of the inserts
prepared were not as small as the inserts after extrusion.
From a theoretical point of view, preparing inserts individually shortens the rehydration time
required, as the diffusion path is reduced [1]. This optimised method allows a rehydration time of
days instead of weeks. In contrast to the method described in the previous chapter, shear forces
have also been reduced to a minimum. Bovine serum albumin (66.4 kDa) was added as the molecule
with the largest molecular weight tested. Polymer HPMC E10M was preferred over previously
tested polymers (E4M and K100M) due to its excellent rheological and ophthalmic properties. The
HPMC percentage was increased to 25% (w/w) to explore the possibility of slowing down the
release rate even further.

133
2 MATERIALS AND METHODS
2.1 Materials
Sodium fluorescein, lysozyme from chicken egg white, bovine serum albumin and glycerol analytical
grade (99.5% (V/V)) were obtained from Sigma-Aldrich (Steinheim, Germany).
Hydroxypropylmethyl cellulose type E10M Premium CR was provided by Colorcon (Dartford, UK).
By specification, an aqueous 2% (w/w) E10M solution gives an apparent viscosity of 10.000 mPa.s
(at 20 °C).
Phosphate-buffered saline solution (PBS, pH 7.4) was prepared using 8.2 g/l sodium chloride (NaCl),
0.300 g/l sodium dihydrogen phosphate dihydrate (NaH2PO4.2H2O), 1.540 g/l disodium hydrogen
phosphate dihydrate (Na2HPO4.2H2O) and purified water. All electrolytes of analytical grade were
purchased from Merck (Darmstadt, Germany).
Polyvinyl chloride (PVC)-blisters capsule size 4, used as a mould to produce the ocular inserts, were
kindly provided by Janssen Pharmaceutica (Beerse, Belgium).
2.2 Preparation of ocular inserts
In the previous chapters, rod-shaped, ocular inserts were prepared by a method consisting of four
phases. Firstly, a polymer solution was prepared using high shear forces and high temperatures,
but in the absence of the drug of interest. Subsequently, the resulting polymer solution was
dehydrated at a temperature of 150 °C yielding polymer cylinders of high HPMC concentration.
These partially dehydrated polymer cylinders were transferred to a closed barrel to which a drug
solution was added. The drug solution consisted of drug molecules, glycerol and purified water
allowing the polymer cylinder to rehydrate during several weeks. After rehydration, small ocular
inserts were extruded from the barrel by means of mild extrusion forces. A major drawback of this
method is the extended period required to fully rehydrate and load the polymer cylinder after
which extruded inserts could be obtained. Furthermore, shear forces, although they can be
considered mild, are still applied in this method during the extrusion step.
To minimise the duration of the production process and to eliminate any shear forces including the
mild forces used during extrusion, an alternative method, but based on the same principles as the
method described above, was developed. The objective was to shorten the time required for the
production process and at the same time to avoid any shear forces by preparing the rod-shaped
inserts individually in a PVC-package for capsule size 4. This alternative production method can be

134
divided into three major phases. The major differences with the previous method are highlighted
with an asterisk (*). A schematic overview is given in figure 1.
Fig. 1. General overview of the preparation method.
Phase I: Polymer matrix formation
A polymer solution of HPMC 20% (w/w)* was prepared by heating purified water up to 90-100 °C
and adding HPMC powder under continuous agitation on a magnetic stirring device (VWR, VMS-C7-
2, IKA, Staufen, Germany). A small amount of glycerol was added from the beginning* to obtain a
percentage of 0.80% (w/w). The polymer dispersion was continuously stirred and heated. Once a
homogeneous HPMC dispersion was obtained, the hot solution was gravimetrically casted into
individual PVC-blisters* using an analytical balance (Mettler Toledo AB135-S, Greifensee,
Switzerland) and cooled down to room temperature to allow build-up of the polymer matrix.
Casting the HPMC dispersion into PVC-blisters causes the inserts to be semi-rod shaped instead of
being entirely rod shaped if extruded.

135
Phase II: Dehydration of the polymer solution
The casted hydrogel was exposed to air to allow evaporation of water from the polymer matrix. The
individually filled blisters were dried to the chosen HPMC concentrations. The percentage of HPMC
in the matrix was determined by gravimetrical analysis using an analytical balance. The drying time
took up several hours at room temperature in order to obtain dry percentages of 50% (w/w) HPMC
and 75% (w/w) HPMC. In case of drying to a constant weight yielding a theoretical HPMC
percentage of nearly 100% (w/w), the drying period took up to three days. Achieving 100%
dehydration is technically not possible when drying to air, due to the presence of bound water. In
general, water associated to a polymer can display different types of interaction. In literature,
different types of thermodynamic water are recognised. Type I water corresponds to bulk free
water. This type of water does not interact with the polymer and behaves as normal water in terms
of melting and freezing. If water is loosely bound to the polymer, it is designated as type II water. It
displays considerable amounts of supercooling and therefore freezes at temperatures lower than
that of type I water. The third type of water is named type III water and is tightly bound to the
polymer and is incapable of freezing. The sum of type II and III can be defined as bound water [2,3].
The amount of bound water will most likely not cause any practical implications for the
development of the inserts at this level and was therefore not investigated further. In contrary to
the previous method, the viscous polymer solution could not be exposed to high temperatures
accelerating the evaporation process, due to the deformational nature of the PVC-blister packaging
when heat is applied [4]. Therefore, the choice of the packaging material has a significant influence
on the choice of drying conditions.
Phase III: Rehydration of the polymer matrix
In this phase, an aqueous drug solution was added to the dried polymer matrix. The percentages of
drug and glycerol in the aqueous solution added to the dried polymer matrix was chosen
accordingly, to reach final percentages of 3% (w/w) drug, 1% (w/w) glycerol and 25% (w/w) HPMC*.
As opposed to the aforementioned aqueous drug solution, a viscous drug solution* comprising
HPMC as a viscosity enhancing agent of the drug solution was additionally tested and evaluated as
a secondary experiment. The viscous drug solution consisted of 1% (w/w) HPMC, drug, glycerol and
purified water. Because of the viscous character of the drug solution, the migration of water into
the dehydrated polymer matrix is slowed down and drug molecules are surrounded by polymer
molecules straight from the beginning of the diffusion process.

136
After adding the drug solution to the dehydrated polymer matrix, blisters containing the different
components were stored at a temperature of 2 °C to allow rehydration of the polymer matrix. The
rehydration time was either 24 or 72 hours* depending on the design of experiments.
After phase III, the final inserts were carefully removed from the blister package in order to perform
dissolution testing. The shape of the blister package is illustrated in figure 2.
Fig. 2. Graphical representation of semi-rod-shaped inserts.
In figure 3, an overview comparing the previously developed method and the method described in
this chapter is schematically laid out. The differences are marked with an asterisk (*).

Fig. 3. Overview of the previously developed method compared to the method for preparing insert in individual packaging. The differences are marked with an asterisk (*).
Hydrogel
(HPMC + water)
Percentage HPMC: 10% (w/w)
Dehydrated HPMC polymer
Percentage HPMC: 35 - 45% (w/w)
Dehydration T = 150 °C
Rehydration T = 2 °C
Drug loaded HPMC
polymer
(Barrel of different
volumes)
Extrusion of inserts
Percentage HPMC: 15 - 20% (w/w)
6 weeks T = 2 °C
Rehydration solution:
drug, glycerol, purified water
Hydrogel
(HPMC + water
+ plasticiser*)
Percentage HPMC: 20% (w/w)*
Dehydrated HPMC polymer
Percentage HPMC: up to 100% (w/w)*
Dehydration at Troom *
Rehydration T = 2 °C
Drug loaded HPMC
polymer
(Individual
packaging*)
No extrusion*
Percentage HPMC: 25% (w/w)* Days*
T = 2 °C
(Viscous*) Rehydration solution:
drug, glycerol, purified water
(+ HPMC 1% (w/w)*)

138
2.3 Factorial design and statistical analysis
Three molecules of different molecular weight, sodium fluorescein 0.376 kDa, lysozyme from
chicken egg white 14.3 kDa and bovine serum albumin 66.4 kDa, were used as model molecules to
determine the influence of molecular weight on the release profiles of the inserts prepared. The
dry percentage of HPMC and the rehydration time were selected as variable parameters based on
experience from earlier research. A 2² full factorial design was set up for each of these molecules.
An overview of the parameters and different levels is given in table 1 and an overview of the
different formulations is given in table 2.
Table 1. Overview of the fixed and variable parameters in the factorial design. The upper (+) and lower (-) levels of
the chosen parameters are given.
Fixed parameters
Final % drug 3% (w/w)
Final % glycerol 1% (w/w)
Final % HPMC 25% (w/w)
Variable parameters
(+) level (-) level
Dry % HPMC 75% (w/w) 50% (w/w)
Rehydration time 72 h 24 h
Table 2. Overview of the different experiments and the chosen variables. Four inserts per formulation were prepared
and analysed. Each formulation was prepared in duplicate.
Formulation Dry % HPMC Rehydration time
1 + +
2 + -
3 - +
4 - -
The influence of dry percentage HPMC (50% (w/w) and 75% (w/w)) and rehydration time (24 and
72 hours) on the release profiles of different molecules at time point 460 or 480 minutes was tested
139
using ANOVA with Statistica® 12 (Statsoft, Tulsa, USA). Each experiment was performed in duplicate
with four inserts per formulation. An effect is considered statistically significant when p<0.05.
2.4 In vitro drug release studies
The release patterns of the different formulations were plotted and analysed. Four inserts per
formulation (in duplicate) were put into separate test tubes to which 15 g PBS was added at a
temperature of 32 °C. The test tubes were placed in a non-oscillating water bath (Julabo 20B,
Merck-Belgolabo, Overijse, Belgium) at a temperature of 32.0 ± 0.5 °C. At different time points,
samples of 2 g release medium were withdrawn from each test tube and replaced with an equal
amount of PBS at 32 °C ensuring sink conditions. Sampling intervals of 10, 30, 60, 90, 120, 180, 240,
300, 360, 420 and 480 minutes were chosen for sodium fluorescein and lysozyme. Sampling
intervals of inserts formulated with albumin were chosen at 10, 30, 60, 90, 120, 180, 240, 300, 390
and 460 minutes. Before and after sampling, the content of the test tubes was homogenised by
means of gentle stirring.
Samples were analysed spectrophotometrically at a wavelength of 484 nm, 280 nm and 278 nm for
the molecules sodium fluorescein, lysozyme and albumin respectively. At the end of every series of
measurements, the content of each test tube was intensively vortexed to release the remaining
drug from the insert and measured spectrophotometrically.
2.5 Drug release analysis
The in vitro drug release curves were analysed for zero order, first order or mixed order kinetics as
described under section 2.9 Drug release analysis in chapter 4.

140
3 RESULTS AND DISCUSSION
3.1 In vitro drug release studies
The objective of the research described in this chapter was to shorten the time required to
rehydrate the dehydrated polymer matrix using a (viscous) drug solution. To achieve this goal,
smaller single-dose inserts were prepared. Not only is the contact area of the polymer matrix with
the surrounding drug solution increased relative to its volume, but the depth to be penetrated by
the drug molecules is also reduced thereby shortening the rehydration time required. An additional
benefit of this method is that even the mild extrusion process is avoided all together. This method
was evaluated using three drug molecules of different molecular weight.
Sodium fluorescein
The inserts contain a certain amount of water, which implicates that the drug molecules can readily
be released from the insert by means of diffusion. Upon contact with the release medium, the insert
swells due to water uptake and as a result, the polymeric network disentangles. A total
disentanglement of the unlinked polymeric network will eventually occur, slowly releasing the drug
by means of erosion [5–7]. Because of the dense packing of the polymer network, slower release
rates are expected to take place, especially for larger molecules such as lysozyme and albumin [8,9].
The amount of sodium fluorescein released from HPMC inserts is plotted in the cumulative release
profiles in figure 4. An overview of the effect of the different parameters on the release of sodium
fluorescein loaded inserts is summarised in table 3. Each of the formulations in the design of
experiments exhibit slow release with an average cumulative release amount of 68.82% (w/w) of
the total amount of drug after an interval of 480 minutes. Statistical analysis revealed no significant
differences when the dry percentage HPMC or rehydration time was altered. Sodium fluorescein
has a relatively low molecular weight (0.376 kDa) compared to lysozyme and albumin and therefore
experiences little resistance from the polymer network upon diffusion.

141
Fig. 4. Cumulative release profiles of sodium fluorescein loaded HPMC inserts. Each graph is a representation of
inserts formulated with the parameters as shown in the legend (rehydration period – dry percentage HPMC). The
drug release is compared to the total amount of drug present after full release of the drug from the matrix (n=8).
Table 3. An overview of the effect of the different parameters on the release of sodium fluorescein loaded inserts.
Parameter Effect % p-value
Dry % HPMC -0.19 0.145
Rehydration time 0.60 0.643
0
10
20
30
40
50
60
70
80
90
100
0 50 100 150 200 250 300 350 400 450 500
Cu
mu
lati
ve r
elea
se (
%)
Time (min)
24 h - 50% (w/w) 24 h - 75% (w/w) 72 h - 50% (w/w) 72 h - 75% (w/w)

142
Lysozyme from chicken egg white
Release profiles of inserts loaded with lysozyme from chicken egg white are shown in figure 5.
Fig. 5. Cumulative release profiles of inserts loaded with lysozyme. Each graph is a representation of inserts
formulated with the parameters as shown in the legend (rehydration period – dry percentage HPMC). The drug
release is compared to the total amount of drug present after full release of the drug from the matrix (n=8).
In table 4, an overview of the effect of the different parameters on the release of lysozyme loaded
inserts is compiled.
Table 4. An overview of the effect of the different parameters on the release of chicken egg white lysozyme loaded
inserts.
Parameter Effect % p-value
Dry % HPMC 1.79 0.177
Rehydration time -9.99 0.000
The dry percentage of HPMC showed no significant influence upon statistical analysis. Contrary to
the parameter ‘dry % HPMC’, increasing the rehydration time from 24 to 72 hours did have a
statistical significant impact (p = 0.000). Due to the higher molecular weight of lysozyme, the total
amount of drug released from the insert for a given time was lower compared to sodium fluorescein
and decreased even further by prolonging the rehydration period from 24 to 72 hours. An additional
0
10
20
30
40
50
60
70
80
90
100
0 50 100 150 200 250 300 350 400 450 500
Cu
mu
lati
ve r
elea
se (
%)
Time (min)
24 h - 75% (w/w) 24 h - 50% (w/w) 72 h - 75% (w/w) 72 h - 50% (w/w)

143
difference of 9.99% (w/w) over a time interval of 480 minutes was calculated. This could be
indicative for the influence of drug loading time on the diffusion process of drug molecules into the
polymeric network. The molecular weight of lysozyme is 38 times higher than sodium fluorescein.
Therefore the lysozyme molecule experiences more resistance from the polymeric network upon
diffusion out of the network as well as upon diffusion into the polymer matrix during preparation
[8–10]. After 24 hours, it was visually apparent that the lysozyme molecules did not fully penetrate
the core of the insert whereas after 72 hours, the lysozyme molecules appeared to be loaded more
deeply in the insert, resulting in slower release rates.
Bovine serum albumin
In figure 6, the release curves of inserts loaded with bovine serum albumin are drawn. Slow release
curves of inserts loaded with bovine serum albumin could not be achieved with the chosen
parameters. An amount of 45% (w/w) albumin was released rapidly from all formulations tested
after a time interval of 10 minutes. After 30 minutes, 80% (w/w) of the total amount of drug present
in the insert was released into the surrounding medium. Varying either the parameter ‘dry % HPMC’
or ‘rehydration time’ in accordance with the design, did not slow down the release rate of the
albumin molecules. A modest but statistically significant reduction (p = 0.024) of the total amount
of albumin released after 460 minutes could be achieved by extending the rehydration time to 72
hours, but the practical significance of the lower release amount is comparatively low. This effect
was minimal with an average decrease of 3.30% (w/w) albumin released after 460 minutes when
rehydration time was increased from 24 to 72 hours. The results and their significance are
summarised in table 5.

144
Fig. 6. Cumulative release profiles of inserts loaded with bovine serum albumin. Each graph is a representation of
inserts formulated with the parameters as shown in the legend (rehydration period – dry percentage HPMC). The
drug release is compared to the total amount of drug present after full release of the drug from the matrix (n=8).
Table 5. An overview of the effect of the different parameters on the release of bovine serum albumin loaded inserts.
Parameter Effect % p-value
Dry % HPMC 1.10 0.432
Rehydration time -3.30 0.024
The molecular weight of the drug molecules influences the release behaviour from the inserts
formulated. Bovine serum albumin is a protein with the highest molecular weight (66.4 kDa) of the
three molecules tested. Its diffusion into the matrix during preparation is limited due to the
entanglement of the polymeric network, especially in case of a final HPMC percentage of 25%
(w/w). As larger molecules diffuse at a lower rate compared to smaller molecules, only a small
amount of albumin is embedded deeply enough in the matrix. The majority of drug molecules is
located at the surface of the insert. The hydrodynamic volume of the drug molecules on one hand
and the relatively high diffusional rate of solvent molecules on the other can provide an explanation
for this observation. Solvent molecules will diffuse rapidly into the matrix hydrating the surrounding
HPMC chains. At the surface of the insert, the diffusion of the solvent molecules into the insert may
0
10
20
30
40
50
60
70
80
90
100
0 50 100 150 200 250 300 350 400 450 500
Cu
mu
lati
ve r
elea
se (
%)
Time (min)
72 h - 75% (w/w) 72 h - 50% (w/w)
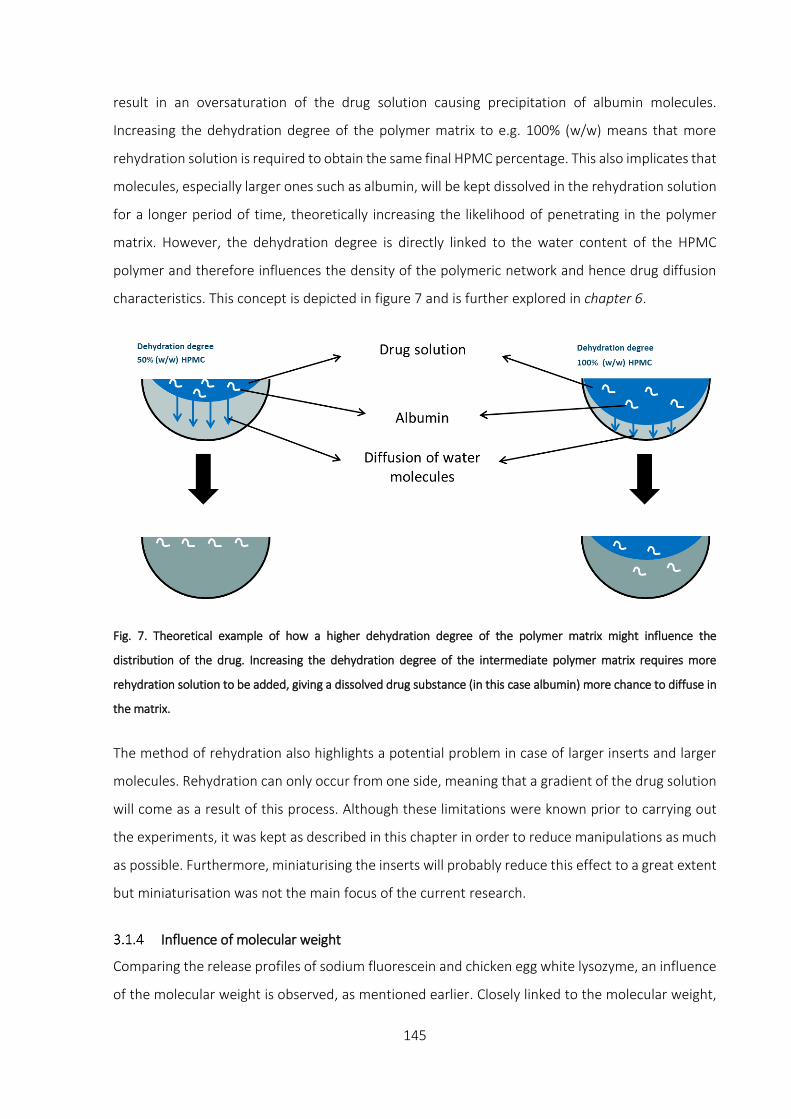
145
result in an oversaturation of the drug solution causing precipitation of albumin molecules.
Increasing the dehydration degree of the polymer matrix to e.g. 100% (w/w) means that more
rehydration solution is required to obtain the same final HPMC percentage. This also implicates that
molecules, especially larger ones such as albumin, will be kept dissolved in the rehydration solution
for a longer period of time, theoretically increasing the likelihood of penetrating in the polymer
matrix. However, the dehydration degree is directly linked to the water content of the HPMC
polymer and therefore influences the density of the polymeric network and hence drug diffusion
characteristics. This concept is depicted in figure 7 and is further explored in chapter 6.
Fig. 7. Theoretical example of how a higher dehydration degree of the polymer matrix might influence the
distribution of the drug. Increasing the dehydration degree of the intermediate polymer matrix requires more
rehydration solution to be added, giving a dissolved drug substance (in this case albumin) more chance to diffuse in
the matrix.
The method of rehydration also highlights a potential problem in case of larger inserts and larger
molecules. Rehydration can only occur from one side, meaning that a gradient of the drug solution
will come as a result of this process. Although these limitations were known prior to carrying out
the experiments, it was kept as described in this chapter in order to reduce manipulations as much
as possible. Furthermore, miniaturising the inserts will probably reduce this effect to a great extent
but miniaturisation was not the main focus of the current research.
Influence of molecular weight
Comparing the release profiles of sodium fluorescein and chicken egg white lysozyme, an influence
of the molecular weight is observed, as mentioned earlier. Closely linked to the molecular weight,

146
is the hydrodynamic radius of a molecule [11–13]. The larger hydrodynamic radius of a molecule
such as lysozyme compared to sodium fluorescein resulted in slower release of lysozyme from the
polymeric network [14]. Based on this principle, It was expected that inserts loaded with albumin
would yield inserts with an even slower release profile. But due to the high molecular weight and
hydrodynamic radius, the resistance upon diffusion into the polymer during loading was too large
to overcome in a period of 72 hours. In figure 8, an overview of release profiles of albumin, sodium
fluorescein and lysozyme is graphically represented.
Fig. 8. Cumulative release profiles of inserts loaded with bovine serum albumin (ALB), sodium fluorescein (NaFl) and
lysozyme from chicken egg white (LYS). Each graph is a representation of inserts formulated with parameters shown
in the legend (molecule type – rehydration period – dry percentage HPMC). The drug release is compared to the
total amount of drug present after full release of the drug from the matrix (n=8).
0
10
20
30
40
50
60
70
80
90
100
0 50 100 150 200 250 300 350 400 450 500
Cu
mu
lati
ve r
elea
se (
%)
Time (min)
ALB 72 h - 75% (w/w) NaFl 72 h - 75% (w/w) LYS 72 h - 75% (w/w)

147
Viscous polymer drug solution
In order to produce slow release ocular inserts of molecules with the largest molecular weight
tested, inserts were dehydrated at room temperature to a constant weight giving a theoretical dry
percentage of almost 100% (w/w) HPMC. Instead of using an aqueous drug solution in which
albumin molecules would precipitate on the surface of the insert as a result of solvent absorption,
a viscous polymer drug solution was prepared and added. Because of the viscous character of the
drug solution, the migration of water into the dehydrated polymer matrix is slowed down.
Additionally, the drug molecules are surrounded by polymer molecules forming a polymeric
network from the beginning of the diffusion process. This results in a lower migration speed of
water molecules towards the dehydrated polymer matrix which might prevent the occurrence of
an oversaturated drug solution, giving solvated drug molecules more time to diffuse into the
polymer matrix. This process is depicted in figure 9.
Fig. 9. Theoretical representation of the influence of a viscous drug solution on the embeddedness of albumin
molecules in the HPMC matrix. Adding HPMC to the drug solution causes the water molecules to migrate at lower
rates into the dehydrated polymer matrix. It also surrounds the albumin molecules with some HPMC molecules,
forming a network around the drug substance, slowing down the drug release rate.
Earlier results indicated that time is an important and influential parameter for the drug loading
process. For this reason, a rehydration period of 72 hours was chosen instead of 24 hours. The
release profiles of inserts loaded with bovine serum albumin with a rehydration time of 72 hours

148
are shown in figure 10. For the sake of reference, a fully dehydrated polymer matrix rehydrated
with an aqueous instead of viscous solution of albumin was added to the comparison.
Fig. 10. Cumulative release profiles of inserts loaded with bovine serum albumin. Each graph is a representation of
inserts formulated with parameters shown in the legend. The drug release is compared to the total amount of drug
present after full release of the drug from the matrix. Inserts are formulated with an aqueous drug solution for dry
percentages 50% (w/w), 75% (w/w) (n=8) and 100% (w/w) (n=4), whereas a viscous drug solution (VS) is used for
inserts with a theoretical dry percentage of 100% (w/w) (n=4).
The amount of albumin released from the insert is lower at all time points when inserts are
formulated with a viscous polymer drug solution. After an interval of 60 minutes, an amount of
44.47% (w/w) albumin was released opposed to 85.18% (w/w) from inserts prepared with an
aqueous drug solution. Although a clear improvement was observed, the release profiles are not
up to the same level as the release profiles of inserts loaded with lysozyme, as a burst release is still
observed.
0
10
20
30
40
50
60
70
80
90
100
0 50 100 150 200 250 300 350 400 450 500
Cu
mu
lati
ve r
elea
se (
%)
Time (min)
72 h - 75% (w/w) 72 h - 100% (w/w)
72 h - 50% (w/w) 72 h - 100% (w/w) (VS)

149
3.2 Drug release analysis
Sodium fluorescein
The release profiles of ocular inserts formulated with sodium fluorescein and loaded during 24 and
72 hours are presented in figure 11a. The slope of the linear regression of the curve equals a value
of 0.5176 and 0.4900 respectively, indicating the release of drug by means of diffusion as well as
case-II transport. However, the slope n obtained for the inserts prepared with a loading time of 72
hours, approaches the value of 0.45 which could be indicative for a release of drug molecules
predominantly characterised by diffusion.
Fig. 11a. Release kinetics of sodium fluorescein loaded inserts using the Peppas–Korsmeyer model.
y = 0,5176x + 0,4877R² = 0,9802
y = 0,4900x + 0,5506R² = 0,9870
0
0,2
0,4
0,6
0,8
1
1,2
1,4
1,6
1,8
2
0 0,5 1 1,5 2 2,5 3
Log
cum
ul.
rele
ase
sod
ium
flu
ore
scei
n (
%)
log time (min)
sodium fluorescein loaded inserts 24 h rehydration
sodium fluorescein loaded inserts 72 h rehydration

150
Upon closer inspection of the release kinetics of sodium fluorescein in figure 11a, it was noticed
that the first measuring point is very influential. Therefore, in figure 11b, the same cumulative
release profiles are shown after omitting the first measuring point (10 minutes).
Fig. 11b. Release kinetics of sodium fluorescein loaded inserts using the Peppas–Korsmeyer model after omitting the
first measuring point (10 min).
A very small but rapid release of drug molecules within the first 30 minutes of the release process
was apparent. Thereafter, the drug molecules were released by diffusion indicated by the slope n
being smaller than 0.45 after regression analysis. This observation can be attributed to drug
molecules residing on the surface of the insert and being rapidly released in the release medium.
Lysozyme from chicken egg white
Figure 12 shows the release profiles of inserts loaded with chicken egg white lysozyme and
represents the release kinetics of inserts which were allowed to rehydrate over a period of 24 hours
and the release kinetics of inserts which were measured after a rehydration period of 72 hours.
Both profiles indicate the release by means of first and mixed zero order release kinetics due to the
value of the slope of their linear regression lines, 0.5086 and 0.5461 respectively. Inserts which
were allowed to rehydrate over a period of 72 hours display a value of n closer to 0.89 than inserts
rehydrated over a period of 24 hours, indicative of a more prominent role for case-II transport of
the drug. This supports the hypothesis that a longer rehydration period allows the protein
molecules to penetrate deeper into the polymer matrix. Upon contact with the release medium,
resistance from the polymer network and the increased diffusional distance by swelling of the
y = 0,4470x + 0,6529R² = 0,9977
y = 0,4372x + 0,6742R² = 0,9971
0
0,2
0,4
0,6
0,8
1
1,2
1,4
1,6
1,8
2
0 0,5 1 1,5 2 2,5 3
Log
cum
ul.
rele
ase
sod
ium
flu
ore
scei
n (
%)
log time (min)
sodium fluorescein loaded inserts 24 h minus first measuring point
sodium fluorescein loaded inserts 72 h minus first measuring point

151
polymer matrix impairs immediate diffusion of deeply penetrated drug molecules to the
surrounding medium. These deeply embedded drug molecules will be released when the unlinked
polymeric network disentangles releasing the drug by means of erosion.
Fig. 12. Cumulative release profiles of inserts loaded with chicken egg white lysozyme.
Bovine serum albumin
Slow release profiles were not obtained for inserts loaded with albumin. Therefore, no release
kinetic profiles were generated.
y = 0,5086x + 0,1695R² = 0,9966
y = 0,5461x - 0,101R² = 0,9977
0
0,2
0,4
0,6
0,8
1
1,2
1,4
1,6
1,8
0 0,5 1 1,5 2 2,5 3
Log
cum
ula
tive
rel
ease
lyso
zym
e (%
)
log time (min)
lysozyme loaded inserts 24 h rehydration
lysozyme loaded inserts 72 h rehydration

152
4 CONCLUSION
The ocular inserts prepared by the modified preparation method, as described in the present
chapter, shows that the production of inserts with slow release without any extrusion forces is
achievable. Furthermore, obtaining inserts with equal amounts of drug is no longer an issue, as the
drug solution is added individually for every insert. The method also demonstrates that a drug can
be loaded into the insert without exposing the molecules to high temperatures while minimising
the risk of oxidation. When large molecules such as lysozyme need to be incorporated, a significant
influence of the rehydration time is observed on the release profiles of the inserts.
Another major advantage of the present method compared to the previously developed method is
the significant reduction of the rehydration time from several weeks to a few days for sodium
fluorescein and lysozyme. However, obtaining slow release was not possible for albumin molecules
without further modification. Such a modification involved adding a viscous drug solution which
improved the drug release characteristics in case of albumin loaded inserts. Burst release to a
certain extent was still observed. However, it should be noted that the increase of the final
percentage HPMC to 25% (w/w) and hence resulting in a denser polymeric network can be held
partially responsible for the result observed. For this reason, the next chapter will explore the
limitations set by the molecular weight of the molecule of interest together with the final HPMC
percentage as well as the dimensions of the insert.
Finally, an additional benefit of the method is that rehydration of the polymer matrix with a drug
solution is able to occur in the final package of the product, even after being sealed.

153
References
1. Siepmann J, Siepmann F. Modeling of diffusion controlled drug delivery. J Control Release. 2012;161: 351–
362.
2. Ford JL. Thermal analysis of hydroxypropylmethylcellulose and methylcellulose: Powders, gels and matrix
tablets. Int J Pharm. 1999;179: 209–228.
3. Almeida N, Rakesh L, Zhao J. Monovalent and divalent salt effects on thermogelation of aqueous
hypromellose solutions. Food Hydrocoll. 2014;36: 323–331.
4. Ognedal A. Large-Deformation Behaviour of Thermoplastics at Various Stress States. Norwegian University
of Science and Technology. 2012.
5. Barba AA, d’Amore M, Chirico S, Lamberti G, Titomanlio G. Swelling of cellulose derivative (HPMC) matrix
systems for drug delivery. Carbohydr Polym. 2009;78: 469–474.
6. Rajabi-Siahboomi AR, Bowtell RW, Mansfield P, Henderson A, Davies MC, Melia CD. Structure and
behaviour in hydrophilic matrix sustained release dosage forms: 2. NMR-imaging studies of dimensional
changes in the gel layer and core of HPMC tablets undergoing hydration. J Control Release. 1994;31: 121–
128.
7. Bettini R, Catellani PL, Santi P, Massimo G, Peppas NA, Colombo P. Translocation of drug particles in HPMC
matrix gel layer: Effect of drug solubility and influence on release rate. J Control Release. 2001;70: 383–
391.
8. Ghosal K, Chakrabarty S, Nanda A. Hydroxypropyl methylcellulose in drug delivery. Pelagia Res Libr. 2011;2:
152–168.
9. Ghori MU, Ginting G, Smith AM, Conway BR. Simultaneous quantification of drug release and erosion from
hypromellose hydrophilic matrices. Int J Pharm. 2014;465: 406–412.
10. Gao P, Skoug JW, Nixon PR, Ju TR, Stemm NL, Sung KC. Swelling of hydroxypropyl methylcellulose matrix
tablets. 2. Mechanistic study of the influence of formulation variables on matrix performance and drug
release. J Pharm Sci. 1996;85: 732–740.
11. Charalel RA, Engberg K, Noolandi J, Cochran JR, Frank C, Ta CN. Diffusion of protein through the human
cornea. Ophthalmic Res. 2012;48: 50–55.
12. Esposito A, Comez L, Cinelli S, Scarponi F, Onori G. Influence of glycerol on the structure and thermal
stability of lysozyme: a dynamic light scattering and circular dichroism study. J Phys Chem B. 2009;113:
16420–16424.
13. Fetters LJ, Hadjichristidis N, Lindner JS, Mays JW. Molecular Weight Dependence of Hydrodynamic and
Thermodynamic Properties for Well-Defined Linear Polymers in Solution. Journal of Physical and Chemical
Reference Data. 1994; 619–640.
14. Mawad D, Anne Boughton E, Boughton P, Lauto A. Advances in Hydrogels Applied to Degenerative
Diseases. Curr Pharm Des. 2012;18: 2558–2575.


Chapter 6: Release rate comparison between FITC-dextrans with different molecular weight

156
1 INTRODUCTION
Chapter 5 pointed out that preparing inserts with small proteins is possible, but a clear limitation in
molecular weight was noticed, particularly with a final HPMC percentage of 25% (w/w). In the
current chapter, inserts were prepared and loaded with fluorescein isothiocyanate (FITC) dextrans
of different molecular weight in order to determine the limitations of the drug loading size for the
preparation method developed. These FITC-dextrans are prepared from native Dextran B512F,
which was subsequently labelled with fluorescein through stable thiocarbamoyl linkage. The linkage
procedure does not lead to depolymerisation [1]. FITC-dextrans are widely used for permeability
testing in cells and tissue [2–6], but also for permeability studies of gel matrices [7,8].
Firstly, the inserts were prepared with the same dimensions as described in section 2.2 Preparations
of ocular inserts in chapter 5. Thereafter, inserts with smaller dimensions were prepared and loaded
with FITC labelled dextrans.

157
2 MATERIALS AND METHODS
2.1 Materials
FITC labelled dextrans of different molecular weight (10, 20, 40 and 70 kDa) were obtained from
Sigma-Aldrich (Steinheim, Germany). Hydroxypropylmethyl cellulose type E10M Premium CR was
provided by Colorcon (Dartford, UK). By specification, an aqueous 2% (w/w) E10M solution gives an
apparent viscosity of 10.000 mPa.s (at 20 °C).
Phosphate-buffered saline solution (PBS, pH 7.4) was prepared using 8.2 g/l sodium chloride (NaCl),
0.300 g/l sodium dihydrogen phosphate dihydrate (NaH2PO4.2H2O), 1.540 g/l disodium hydrogen
phosphate dihydrate (Na2HPO4.2H2O) and purified water. All electrolytes of analytical grade were
purchased from Merck (Darmstadt, Germany).
PVC-blisters capsule size 4, used to produce the ocular inserts, were kindly provided by Janssen
Pharmaceutica (Beerse, Belgium). Custom developed Teflon moulds, for the production of smaller
inserts, were developed by the technical service of the University of Antwerp (Wilrijk, Belgium).
2.2 Preparation of ocular inserts
The inserts were loaded identically to the method described in section 2.2 Preparation of ocular
inserts in chapter 5 with a final HPMC percentage of 15% (w/w) or 20% (w/w) and with a rehydration
period of three days, ten days and six weeks for all four tested FITC-dextran types. The average
mass of the inserts was weighed at approximately 550 mg. Although such a mass is not suited for
clinic use in human eyes, the influence of molecular weight during the drug loading process can be
demonstrated more clearly in larger inserts. Also, the risk of errors during insert production is
reduced. These discriminating conditions help to understand the underlying processes better, but
the practical relevance remains to be seen. Therefore, smaller inserts were also produced using
custom built Teflon moulds in HPMC percentages of 15% (w/w), 20% (w/w) and 25% (w/w). The
average weight of the inserts was set at approximately 82 mg and were loaded over a period of six
weeks for all four tested FITC-dextrans (10, 20, 40 and 70 kDa). The method of preparation was
identical to the method mentioned above. The dimensions of the inserts are compared in figure 1.

158
Fig. 1. Dimensions and shape of the inserts weighing approximately 550 mg (L) and 82 mg (R), casted in PVC-blisters
and Teflon moulds respectively.
An alteration to this method was also made by directly adding dry FITC-powder to the dehydrated
HPMC matrix on which the 1% (w/w) viscous HPMC solution was casted. Basically, this means that
the FITC-dextrans were dissolved in situ instead of a drug solution being prepared in advance. This
alternative method was assessed in order to examine whether there was an influence of the way
the drug was added to the dehydrated polymer. For every individual blister package, the calculated
amount of drug was weighed and added, resulting in no waste of drug compound. The final HPMC
percentage was kept at 15% (w/w) and 20% (w/w). The drug loading time was set to three days and
compared to the results obtained with inserts prepared with a viscous drug solution. This
experiment, in which FITC-dextrans are dissolved in situ, was only performed on the large-sized
inserts prepared in the PVC-blister package. A summary of the experiments is laid out in figure 2.

159
Fig. 2. Overview of the experiments carried out on inserts loaded with FITC-dextrans of different molecular weight.
The label ‘small inserts’ refers to inserts with a total weight of 82 mg while ‘large inserts’ refers to inserts weighing
approximately 550 mg.
2.3 In vitro drug release studies
The release patterns of the different formulations were plotted and analysed. For inserts prepared
in the PVC-blister package, four inserts per formulation were put into separate test tubes to which
15 g PBS was added at a temperature of 32 °C. The test tubes were placed in a non-oscillating hot
water bath (Julabo 20B, Merck-Belgolabo, Overijse, Belgium) at a temperature of 32.0 ± 0.5 °C. At
different time points, samples of 2 g release medium were withdrawn from each test tube and
replaced with an equal amount of PBS at 32 °C. Sampling intervals of 10, 30, 60, 90, 120, 180, 240,
300, 360, 420 and 480 minutes were chosen. For the smaller inserts prepared in Teflon moulds,
four inserts per formulation were put into separate test tubes to which 10 g PBS was added and
sampled at different intervals of 20, 60, 90, 120, 180, 240, 300, 360, 420 and 480 minutes. Before
and after sampling, the content of the test tubes was homogenised by means of gentle stirring.
FITC-DEXTRANS
'Small inserts'(viscous drug solution) (FITC 10, 20, 40 kDa)
6 weeks
'Large inserts'(viscous drug solution)
(FITC 10, 20, 40, 70 kDa)
3 days
10 days
6 weeks
'Large inserts' (dry powder)
(FITC 10, 20, 40, 70 kDa)
3 days

160
All samples were analysed spectrophotometrically at a wavelength of 484 nm. At the end of every
series of measurements, the content of each test tube was intensively vortexed to release all of the
remaining drug from the insert and measured spectrophotometrically.

161
3 RESULTS AND DISCUSSION
3.1 Inserts with large dimensions
Rehydration period: three days
Firstly, the results obtained from inserts prepared with dry FITC powder and the viscous FITC
solution were compared after a drug loading time of three days. The results are respectively given
in figure 3 and in figure 4.
Fig. 3. Cumulative release profiles of inserts loaded with FITC-dextrans of different molecular weight and a
rehydration period of three days using dry FITC-dextran powder for in situ dissolution. In the legend, the molecular
weight is given, followed by the rehydration period, while DP stands for Dry Powder and the final HPMC percentage
is given at the end (n=4).
All release profiles in figure 3 demonstrate a rapid release of the FITC-dextrans for all molecular
weight tested. Inserts prepared with 10 kDa FITC seem to release the FITC molecules a little slower,
as 10 kDa is the smallest molecule of the FITC-dextrans examined [9].
0
10
20
30
40
50
60
70
80
90
100
0 50 100 150 200 250 300 350 400 450 500
Cu
mu
lati
ve r
elea
se (
%)
Time (min)
FITC-10 kDa - 3D - DP - 15% (w/w) FITC-20 kDa - 3D - DP - 15% (w/w)
FITC-40 kDa - 3D - DP - 15% (w/w) FITC-70 kDa - 3D - DP - 15% (w/w)
FITC-10 kDa - 3D - DP - 20% (w/w) FITC-20 kDa - 3D - DP - 20% (w/w)
FITC-40 kDa - 3D - DP - 20% (w/w) FITC-70 kDa - 3D - DP - 20% (w/w)
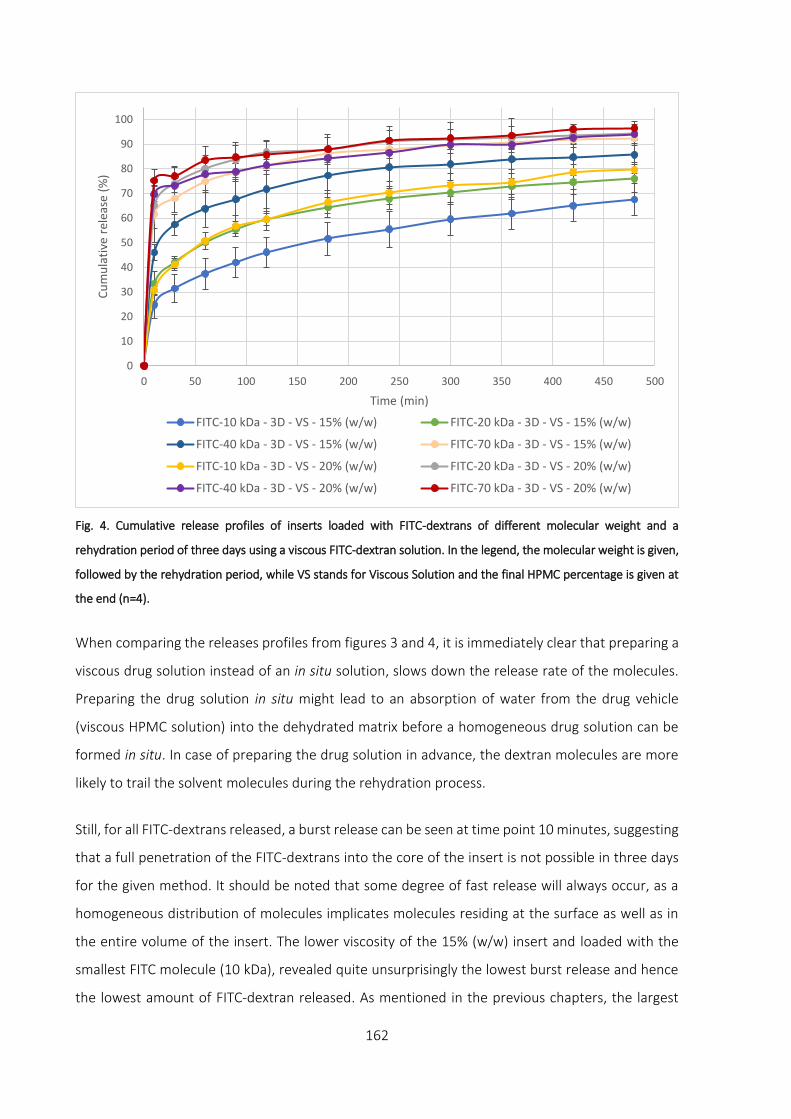
162
Fig. 4. Cumulative release profiles of inserts loaded with FITC-dextrans of different molecular weight and a
rehydration period of three days using a viscous FITC-dextran solution. In the legend, the molecular weight is given,
followed by the rehydration period, while VS stands for Viscous Solution and the final HPMC percentage is given at
the end (n=4).
When comparing the releases profiles from figures 3 and 4, it is immediately clear that preparing a
viscous drug solution instead of an in situ solution, slows down the release rate of the molecules.
Preparing the drug solution in situ might lead to an absorption of water from the drug vehicle
(viscous HPMC solution) into the dehydrated matrix before a homogeneous drug solution can be
formed in situ. In case of preparing the drug solution in advance, the dextran molecules are more
likely to trail the solvent molecules during the rehydration process.
Still, for all FITC-dextrans released, a burst release can be seen at time point 10 minutes, suggesting
that a full penetration of the FITC-dextrans into the core of the insert is not possible in three days
for the given method. It should be noted that some degree of fast release will always occur, as a
homogeneous distribution of molecules implicates molecules residing at the surface as well as in
the entire volume of the insert. The lower viscosity of the 15% (w/w) insert and loaded with the
smallest FITC molecule (10 kDa), revealed quite unsurprisingly the lowest burst release and hence
the lowest amount of FITC-dextran released. As mentioned in the previous chapters, the largest
0
10
20
30
40
50
60
70
80
90
100
0 50 100 150 200 250 300 350 400 450 500
Cu
mu
lati
ve r
elea
se (
%)
Time (min)
FITC-10 kDa - 3D - VS - 15% (w/w) FITC-20 kDa - 3D - VS - 15% (w/w)
FITC-40 kDa - 3D - VS - 15% (w/w) FITC-70 kDa - 3D - VS - 15% (w/w)
FITC-10 kDa - 3D - VS - 20% (w/w) FITC-20 kDa - 3D - VS - 20% (w/w)
FITC-40 kDa - 3D - VS - 20% (w/w) FITC-70 kDa - 3D - VS - 20% (w/w)

163
molecule should theoretically be released the slowest if a homogeneous distribution of the FITC-
dextrans in the inserts is obtained. But the less compact structure of the 15% (w/w) polymeric
matrix allows the molecules to be more deeply embedded, improving the drug release profile,
especially when the drug loading time is relatively short. The release profile of 10 kDa at an HPMC
percentage of 20% (w/w) seems very similar to the higher molecular weight FITC-dextran of 20 kDa
but from an insert with a lower final HPMC percentage of 15% (w/w). The largest FITC-dextrans (40
kDa and especially 70 kDa) exhibit high burst release amounts, confirming the difficulty large
molecules face when penetrating into the polymer matrix at the given rehydration period. The
influence of the molecular weight and the viscosity of the matrix are major determining factors for
the drug loading process.
Rehydration period: ten days
Although using the viscous drug solution did improve the release profile dramatically for smaller
proteins (see chapter 5, 3.1.5 Viscous polymer drug solution), burst release occurs for all
formulations tested in this research with a drug loading period of three days. In order to improve
the distribution of the FITC-dextrans in the polymeric matrix, the rehydration period was increased
to ten days and the inserts were prepared using a viscous drug solution. The result for the drug
release after ten days of rehydration is given in figure 5.

164
Fig. 5. Cumulative release profiles of inserts loaded with FITC-dextrans of different molecular weight and a
rehydration period of ten days using a viscous FITC-dextran solution. In the legend, the molecular weight is given,
followed by the rehydration period, while VS stands for Viscous Solution and the final HPMC percentage is given at
the end (n=4).
Lengthening the rehydration period to ten days, improves the drug loading in the insert for all
formulations. The amount of FITC-dextrans released after ten minutes is much lower compared to
the three days loading time. But the looser packing of the polymer chains of the matrix helps the
penetration process of the molecules during loading as the FITC-molecules for all formulations
prepared with a final HPMC percentage of 15% (w/w) are released slower than their equivalent
counterpart with an HPMC percentage of 20% (w/w). There seems to be only a small improvement
for the largest FITC-molecules (70 kDa) for both 15% (w/w) and 20% (w/w) HPMC inserts, suggesting
that the pore size of the HPMC matrix is too narrow for FITC-70 kDa to pass through. Nevertheless,
for inserts prepared with a final percentage of 20% (w/w) HPMC, a loading time of ten days remains
insufficient. Therefore, the rehydration period was increased to six weeks.
0
10
20
30
40
50
60
70
80
90
100
0 50 100 150 200 250 300 350 400 450 500
Cu
mu
lati
ve r
elea
se (
%)
Time (min)
FITC-10 kDa - 10D - VS - 15% (w/w) FITC-20 kDa - 10D - VS - 15% (w/w)
FITC-40 kDa - 10D - VS - 15% (w/w) FITC-70 kDa - 10D - VS - 15% (w/w)
FITC-10 kDa - 10D - VS - 20% (w/w) FITC-20 kDa - 10D - VS - 20% (w/w)
FITC-40 kDa - 10D - VS - 20% (w/w) FITC-70 kDa - 10D - VS - 20% (w/w)
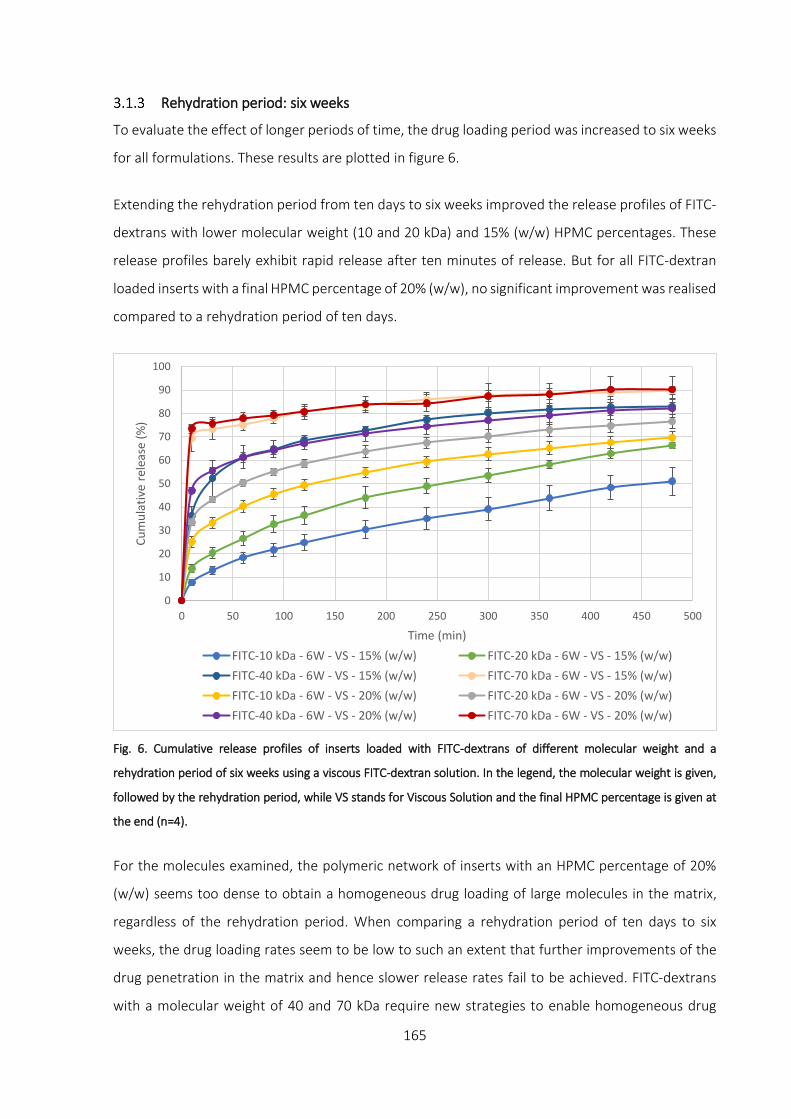
165
Rehydration period: six weeks
To evaluate the effect of longer periods of time, the drug loading period was increased to six weeks
for all formulations. These results are plotted in figure 6.
Extending the rehydration period from ten days to six weeks improved the release profiles of FITC-
dextrans with lower molecular weight (10 and 20 kDa) and 15% (w/w) HPMC percentages. These
release profiles barely exhibit rapid release after ten minutes of release. But for all FITC-dextran
loaded inserts with a final HPMC percentage of 20% (w/w), no significant improvement was realised
compared to a rehydration period of ten days.
Fig. 6. Cumulative release profiles of inserts loaded with FITC-dextrans of different molecular weight and a
rehydration period of six weeks using a viscous FITC-dextran solution. In the legend, the molecular weight is given,
followed by the rehydration period, while VS stands for Viscous Solution and the final HPMC percentage is given at
the end (n=4).
For the molecules examined, the polymeric network of inserts with an HPMC percentage of 20%
(w/w) seems too dense to obtain a homogeneous drug loading of large molecules in the matrix,
regardless of the rehydration period. When comparing a rehydration period of ten days to six
weeks, the drug loading rates seem to be low to such an extent that further improvements of the
drug penetration in the matrix and hence slower release rates fail to be achieved. FITC-dextrans
with a molecular weight of 40 and 70 kDa require new strategies to enable homogeneous drug
0
10
20
30
40
50
60
70
80
90
100
0 50 100 150 200 250 300 350 400 450 500
Cu
mu
lati
ve r
elea
se (
%)
Time (min)
FITC-10 kDa - 6W - VS - 15% (w/w) FITC-20 kDa - 6W - VS - 15% (w/w)
FITC-40 kDa - 6W - VS - 15% (w/w) FITC-70 kDa - 6W - VS - 15% (w/w)
FITC-10 kDa - 6W - VS - 20% (w/w) FITC-20 kDa - 6W - VS - 20% (w/w)
FITC-40 kDa - 6W - VS - 20% (w/w) FITC-70 kDa - 6W - VS - 20% (w/w)

166
loading for this polymer type and percentages used. This might implicit the need of facilitated
diffusion forces such as pressure differences or oscillatory techniques to temporarily increase the
pore size of the polymeric network. Although the relationship between the physical principles of
polymeric density versus molecular weight are generally true, the molecular weight of the
molecules is only indirectly indicative for the molecular shape. In literature, some researchers have
described the influence of the molecular shape and deformability of the molecule having a
significant impact on drug diffusion properties [10–12]. FITC-dextrans with a molecular weight
greater than 5 kDa, behave as flexible, extended coils in solution [13]. This is markedly different
compared to globular proteins such as lysozyme [14,15]. These properties were not within the
scope of this research work and therefore not examined.
3.2 Inserts with small dimensions
Rehydration period: six weeks
The results of inserts with an HPMC percentage of 15% (w/w) and 20% (w/w) loaded with 10, 20
and 40 kDa dextrans and a rehydration period of six weeks are presented in figure 7.
Fig. 7. Cumulative release profiles of inserts loaded with FITC-dextrans of different molecular weight and a
rehydration period of six weeks using a viscous FITC-dextran solution. In the legend, the molecular weight is given,
followed by the rehydration period, while VS stands for Viscous Solution and the final HPMC percentage is given at
the end (n=4).
0
10
20
30
40
50
60
70
80
90
100
0 50 100 150 200 250 300 350 400 450 500
Cu
mu
lati
ve r
elea
se (
%)
Time (min)
FITC-10 kDa - 6W - VS - 15% (w/w) FITC-10 kDa - 6W - VS - 20% (w/w)
FITC-20 kDa - 6W - VS - 15% (w/w) FITC-20 kDa - 6W - VS - 20% (w/w)
FITC-40 kDa - 6W - VS - 15% (w/w) FITC-40 kDa - 6W - VS - 20% (w/w)

167
It is important to note that the results discussed in this section cannot be directly compared to
results previously obtained. The smaller dimensions and therefore different surface-to-volume
ratio make direct comparison of release rates difficult. This means that high initial release amounts
cannot strictly be attributed to an insufficient penetration depth of the drug molecules, while for
larger inserts, a rapid release of molecules residing on the surface can be held responsible for this
effect.
In these smaller inserts, the trend of smaller molecules being able to penetrate more easily in the
polymeric matrix is still visible. While lower HPMC percentages and hence a less compact polymeric
network are still beneficial for the drug loading, the differences between 15% (w/w) and 20% (w/w)
HPMC are less pronounced and the release amount is similar for a given molecular weight after 20
minutes.
Interestingly, there is a substantial difference in the amount of drug released after 20 minutes
between all formulations. The drug release amounts for all formulations are situated between 20%
and 55% after 20 minutes, while after 480 minutes, the drug is released between 75% and 90%, a
much smaller difference. Furthermore, inserts loaded with FITC 10 kDa show good drug loading,
but as this molecule has the lowest molecular weight, it is released relatively faster than the other
molecules, especially when 15% (w/w) HPMC is used. The slope of the plot has unsurprisingly the
highest inclination, indicative for faster release due to lower polymeric resistance of the network,
resulting in a total amount of FITC released after 480 minutes being situated amongst all other
release profiles at just over 80%.
Out of curiosity, the HPMC percentage of the inserts was increased to 25% (w/w). After evaluating
the results obtained for 15% (w/w) and 20% (w/w), it was expected that the release profiles of 25%
(w/w) would be higher as a result of a too dense polymeric network. This additional experiment
might shed some light on the importance of the polymeric network for both drug loading as well as
drug release. The results are presented in figure 8.

168
Fig. 8. Cumulative release profiles of inserts loaded with FITC-dextrans of different molecular weight and a
rehydration period of six weeks using a viscous FITC-dextran solution. In the legend, the molecular weight is given,
followed by the rehydration period, while VS stands for Viscous Solution and the final HPMC percentage is given at
the end (n=4).
Increasing the final HPMC percentage and hence viscosity and polymeric density has a negative
impact on the amount of drug loaded in the inserts as anticipated. The amount of FITC 10 kDa
released from the insert has almost doubled to nearly 40% (w/w) after 20 minutes compared to an
insert with the same dimensions, but with an HPMC percentage of 15% (w/w). Comparable results
were recorded for 20 kDa and 40 kDa. But similar to inserts with an HPMC percentage of 15% (w/w)
and 20% (w/w), the large difference between inserts loaded with FITC-dextran 10 kDa and FITC-
dextran 40 kDa after 20 minutes of release decreases, as the drug release progresses. After 480
minutes, the difference between all FITC molecules tested is much smaller.
These findings could lead to improved development of ocular inserts when different polymeric
compounds are mixed for different drug release behaviour. An initial drug release burst can even
be regarded as beneficial if certain minimum peptide or protein levels are required for biological
activity.
0
10
20
30
40
50
60
70
80
90
100
0 50 100 150 200 250 300 350 400 450 500
Cu
mu
lati
ve r
elea
se (
%)
Time (min)
FITC-10 kDa - 6W - VS - 25% (w/w) FITC-20 kDa - 6W - VS - 25% (w/w)
FITC-40 kDa - 6W - VS - 25% (w/w)

169
4 CONCLUSION
This chapter describes the loading characteristics of FITC-dextran loaded inserts. Both for large and
smaller inserts, the same trends in drug release were registered. Increasing the final HPMC
percentage, which enhances the viscosity and polymeric density, resulted in higher initial drug
release amounts suggesting poorer drug loading capacities. The dense polymeric network hinders
the diffusion of molecules particularly affecting the larger molecules such as FITC-dextrans 40 kDa
and 70 kDa. However, it is important to understand that the molecular shape might have a
significant influence on the diffusion behaviour into the polymeric matrix. This complicates a precise
prediction on how a given drug substance will behave.
The final HPMC percentage also allows researchers to control the release rate to a certain degree.
A mixture of different polymer blends could alter the release rate in a desired manner. The
experiments performed in this chapter also indicate a limitation in molecular weight for FITC-
dextrans. For the method used to develop these inserts, incorporating FITC molecules over 20 kDa
can be very challenging and new strategies involving facilitated diffusion are required to
homogeneous distribute the drug in the polymeric network.

170
References
1. De Belder AN, Granath K. Preparation and properties of fluorescein-labelled dextrans. Carbohydr Res.
1973;30: 375–378.
2. Hämäläinen KM, Kananen K, Auriola S, Kontturi K, Urtti A. Characterization of Paracellular and Aqueous
Penetration Routes in Cornea , Conjunctiva , and Sclera. Invest Ophthalmol Vis Sci. 1997;38: 627–634.
3. Järvinen K, Järvinen T, Urtti A. Ocular absorption following topical delivery. Adv Drug Deliv Rev. 1995;16:
3–19.
4. Braeckmans K, Peeters L, Sanders NN, De Smedt SC, Demeester J. Three-dimensional fluorescence
recovery after photobleaching with the confocal scanning laser microscope. Biophys J. 2003;85: 2240–
2252.
5. Tratta E, Pescina S, Padula C, Santi P, Nicoli S. In vitro permeability of a model protein across ocular tissues
and effect of iontophoresis on the transscleral delivery. Eur J Pharm Biopharm. 2014;88: 116–122.
6. Rai UDJP, Young SA, Thrimawithana TR, Abdelkader H, Alani AWG, Pierscionek B, et al. The suprachoroidal
pathway: A new drug delivery route to the back of the eye. Drug Discov Today. 2015;20: 491–495.
7. Balakrishnan G, Nicolai T, Durand D. Relation between the gel structure and the mobility of tracers in
globular protein gels. J Colloid Interface Sci. 2012;388: 293–299.
8. Mains J, Wilson CG. The Vitreous Humor As a Barrier to Nanoparticle Distribution. J Ocul Pharmacol Ther.
2013;29: 143–150.
9. Fetters LJ, Hadjichristidis N, Lindner JS, Mays JW. Molecular Weight Dependence of Hydrodynamic and
Thermodynamic Properties for Well-Defined Linear Polymers in Solution. Journal of Physical and Chemical
Reference Data. 1994; 619–640.
10. Silva JVC, Peixoto PDS, Lortal S, Floury J. Transport phenomena in a model cheese: The influence of the
charge and shape of solutes on diffusion. J Dairy Sci. 2013;96: 6186–6198.
11. Venturoli D. Ficoll and dextran vs. globular proteins as probes for testing glomerular permselectivity:
effects of molecular size, shape, charge, and deformability. AJP Ren Physiol. 2004;288: 605–613.
12. Srikantha N, Mourad F, Suhling K, Elsaid N, Levitt J, Chung PH, et al. Influence of molecular shape,
conformability, net surface charge, and tissue interaction on transscleral macromolecular diffusion. Exp
Eye Res. 2012;102: 85–92.
13. TdB Consultancy. FITC-Dextran. Tech sheet. 2010; 1–5.
14. Bhowal AC, Das K, Kundu S. Fluorescence behavior of globular proteins from their bulk and thin film
conformations in presence of mono-, di- and tri-valent ions. Colloids Surfaces B Biointerfaces. 2015;133:
263–269.
15. Day L, Zhai J, Xu M, Jones NC, Hoffmann S V., Wooster TJ. Conformational changes of globular proteins
adsorbed at oil-in-water emulsion interfaces examined by synchrotron radiation circular dichroism. Food
Hydrocoll. 2014;34: 78–87.

Chapter 7: Evaluation of cytotoxicity and viability of SV40-HCEC in the presence of blank ocular inserts
Parts of this chapter have been submitted to:
Everaert A, Wouters Y, Melsbach E, Zakaria N, Ludwig A, Kiekens F, Weyenberg W. Optimisation of
HPMC ophthalmic inserts with sustained release properties as a carrier for thermolabile
therapeutics. Int J Pharm. 2017

172
1 INTRODUCTION
The developed ocular inserts should be suited for precorneal use. Not only is the drug released
from the insert, but also the various excipients dissolve over time into the tear film. Therefore, to
determine the cytotoxicity and biocompatibility of the excipients used for the development of the
ophthalmic inserts, SV40-immortalised human corneal epithelial cells (SV40-HCEC) were used [1].
The human corneal epithelial cells were treated by adding two different dilutions of a blank insert
based on HPMC. These results were assessed and compared to two different dilutions of a
reference polymer (HPC). The polymer HPC was chosen based on the commercially available insert
Lacrisert®, a precorneal rod-shaped device to treat dry eye disease [2,3].
The cell viability was measured using PrestoBlue® reagent, which is a resazurin-based cell viability
reagent. Resazurin, a blue compound with no intrinsic fluorescent value, is irreversibly reduced to
resorufin, a red in colour and highly fluorescent substance. This conversion is proportional to the
number of metabolically active cells making quantitative measurements possible [4].
The present chapter evaluates the cytotoxicity and biocompatibility of blank HPMC inserts on SV40-
HCEC both in a quantitative and qualitative manner.

173
2 MATERIALS AND METHODS
2.1 Materials
SV40-immortalised human corneal epithelium cells were kindly gifted by the Integrative
Regenerative Medicine Centre, (Linköping University, Linköping, Sweden). Keratinocyte-Serum-
Free Medium (K-SFM) enriched with bovine pituitary extract (BPE) and human recombinant
epidermal growth factor type B 1-53 (EGF 1-53) nutrients were obtained from Gibco® by Life
Technologies (Paisley, UK). PrestoBlue® cell viability reagent and trypan blue stain (0.4% (w/V))
were purchased from Life Technologies (Frederick, USA).
Glycerol analytical grade (99.5% (V/V)) was obtained from Sigma-Aldrich (Steinheim, Germany).
Hydroxypropylmethyl cellulose type E10M Premium CR was provided by Colorcon (Dartford, UK)
and hydroxypropyl cellulose was purchased from ABC Chemicals (Wauthier-Braine, Belgium). By
specification, an aqueous 2% (w/w) HPMC E10M solution gives an apparent viscosity of 10.000
mPa.s (at 20 °C), while the apparent viscosity of an aqueous 2% (w/w) HPC solution is 304 mPa.s.
2.2 Preparation of inserts
Blank inserts were prepared following the principles described in phase I of the method in section
2.2 Preparation of ocular inserts in chapter 5.
2.3 Cytotoxicity and biocompatibility
Two different dilutions of 0.555% (w/w) and 1.11% (w/w) HPMC E10M were prepared by dissolving
an adequate amount of HPMC insert (containing 20% (w/w) HPMC and 1% (w/w) glycerol in purified
water) in K-SFM. These percentages, determining the viscosity of the dilutions, were chosen to
allow pipetting in 96-well plates. For the sake of reference, two different dilutions of 1.22% (w/w)
and 2.44% (w/w) HPC were prepared by dissolving HPC powder in medium, also comprising glycerol
in a 1% (w/w) percentage. The amount of HPC polymer was chosen based on comparable viscosities
between the HPMC solution and the HPC solution. The viscosity was measured using rotational
viscosimetry (flow) (Anton Paar MCR-102, Graz, Austria). A parallel plate measuring device with a
diameter of 50 mm was used, set at 1 mm gap and at a temperature of 32.0 ± 0.1 °C. The shear rate
was set between 0.01 s-1 to 100 s-1. To prevent the polymer from drying out during the
measurements, a solvent trap was used to cover the sample. All measurements were performed in
triplicate. Figure 1 shows the rheological profiles for HPMC in a percentage of 0.555% (w/w) and
1.11% (w/w) and for HPC in a percentage of 1.22% (w/w) and 2.44% (w/w).

174
Fig. 1. Rheological profiles for HPMC in a percentage of 0.555% (w/w) (HPMC LV) and 1.11% (w/w) (HPMC HV) and
for HPC in a percentage of 1.22% (w/w) (HPC LV) and 2.44% (w/w) (HPC HV).
The stock cell cultures were maintained in T-75 flasks in Keratinocyte-SFM (K-SFM) medium
enriched with bovine pituitary extract (BPE) and human recombinant epidermal growth factor type
B 1-53 (EGF 1-53) at 37 °C in a 95% air and 5% CO2 incubator (Galaxy R, Eppendorf, Hamburg,
Germany). The human corneal epithelial cells were plated into 96-well plates with K-SFM at 37 °C
in a 5% CO2 incubator overnight. During this time period, cells were allowed to attach. The amount
of cells was determined at an average of 30.000 cells per well using an automated cell counter (ABX
Micros 60 OT, Horiba, Montpellier, France). Both hydrogel types (HPMC and HPC) and both groups
of dilutions (high and low viscosities) were added to different wells on the same plate. The
properties of benzalkonium chloride are well understood and it is often used in commercial eye
drops as a preservative. It is mainly active against Gram-positive bacteria (e.g. Staphylococcus spp.)
even at very low concentrations (0.004% (w/V)). Furthermore, adding EDTA in a concentration of
0.1% (w/V) increases its activity against Gram-negative bacteria (e.g. Pseudomonas aeruginosa). In
general, quaternary ammonium compounds are also active against fungi and particularly active
against Candida albicans and Aspergillus fumigatus [5]. Benzalkonium chloride is also known to be
cytotoxic [5–8] and was used in three different percentages, 1% (w/V), 0.01% (w/V) and 0.004%
(w/V) as a positive control group [5]. Untreated cells in medium and plain medium without cells
were added as negative and blank control groups respectively.
0,01
0,1
1
10
0,1 1 10 100
Vis
cosi
ty (
Pa.
s)
Shear Rate (1/s)
HPMC HV HPC HV HPMC LV HPC LV

175
All experiments were performed in triplicate and on different time points: 0, 2, 8, 24, 48 and 72
hours. For each time point, a separate 96-well plate was used. At every time point, all wells were
rinsed four times with medium to remove the compound of interest. The wells with the highest
percentage HPMC or HPC were rinsed up to seven times to remove the viscous polymer solution as
much as possible. The viability of the cells was measured at every time point by adding 100 µl
PrestoBlue® solution for exactly 30 minutes to all wells after rinsing. The PrestoBlue® solution was
prepared by adding one part of pure PrestoBlue® reagent to nine parts of K-SFM. The fluorescence
was measured using a microplate reader (Victor 3 1420 Multilabel Counter, Perkin Elmer, Shelton,
USA) at a wavelength of 531/590 nm for excitation/emission respectively.
As it was not practically possible to assess the influence of the insert in its true shape and
composition, a qualitative analysis of the HPMC inserts was set up and performed using microscopic
visualisation. Inserts weighing approximately 150 mg of a 10% (w/w) and 20% (w/w) final
percentage of HPMC were prepared and added to three wells of a six-well plate for each polymer
percentage type in the centre of the well. These inserts were allowed to settle during 24 hours at
37 °C and 5% CO2 in a humidified atmosphere. An amount of 400.000 cells per well was seeded and
incubated using the same conditions. After seeding the cells (time point 0 hours (T0)) and after 5,
24, 29, 48, 53 and 72 hours, pictures were taken with a Sony ILCE-7Rm2 camera (Tokyo, Japan)
using a Leica DM IL microscope (Leica Microsystems, Wetzlar, Germany) with 40x magnification as
depicted in figure 2. All measurements were carried out in triplicate. Additionally, at the 72 hours
time point, a trypan blue staining was performed. Trypan blue stain is an aqueous solution which is
not absorbed by healthy viable cells but can readily enter damaged or dead cells. Visibly blue cells
are therefore indicative for damaged or dead cells.
Fig. 2. Overview and crop of the section of the insert that has been visually determined. Six wells are drawn with an
insert (in blue) placed in each well (time point T0).
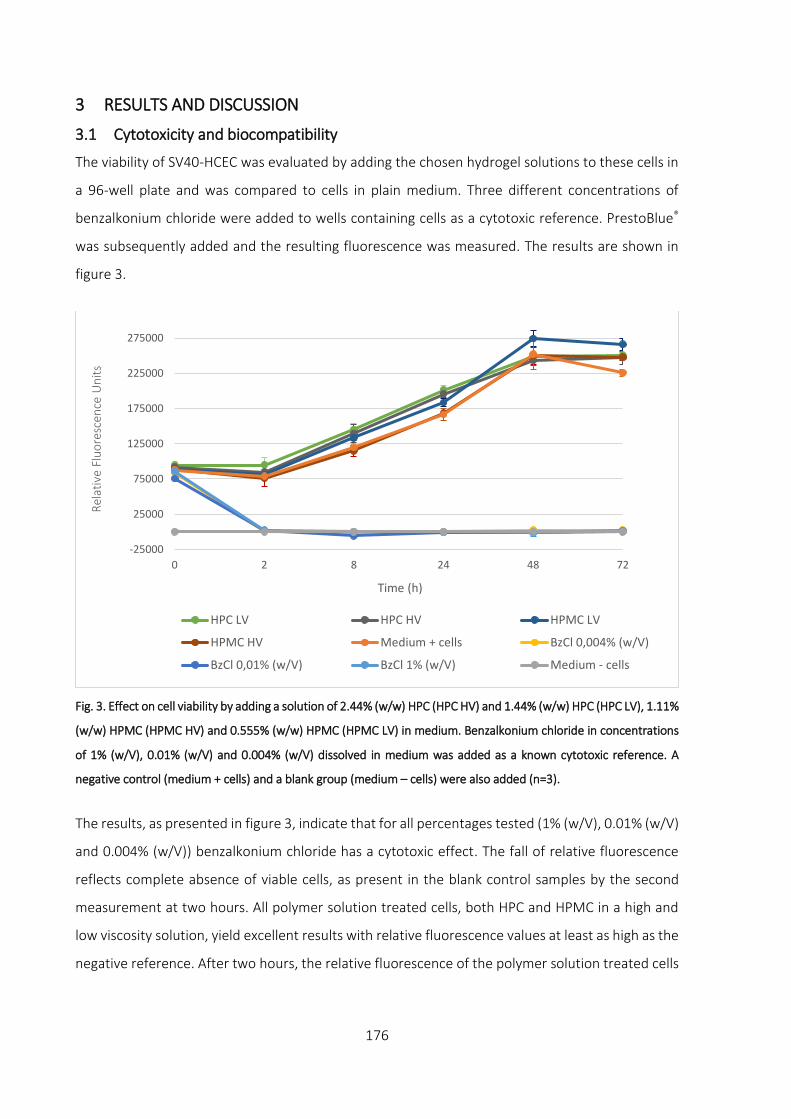
176
3 RESULTS AND DISCUSSION
3.1 Cytotoxicity and biocompatibility
The viability of SV40-HCEC was evaluated by adding the chosen hydrogel solutions to these cells in
a 96-well plate and was compared to cells in plain medium. Three different concentrations of
benzalkonium chloride were added to wells containing cells as a cytotoxic reference. PrestoBlue®
was subsequently added and the resulting fluorescence was measured. The results are shown in
figure 3.
Fig. 3. Effect on cell viability by adding a solution of 2.44% (w/w) HPC (HPC HV) and 1.44% (w/w) HPC (HPC LV), 1.11%
(w/w) HPMC (HPMC HV) and 0.555% (w/w) HPMC (HPMC LV) in medium. Benzalkonium chloride in concentrations
of 1% (w/V), 0.01% (w/V) and 0.004% (w/V) dissolved in medium was added as a known cytotoxic reference. A
negative control (medium + cells) and a blank group (medium – cells) were also added (n=3).
The results, as presented in figure 3, indicate that for all percentages tested (1% (w/V), 0.01% (w/V)
and 0.004% (w/V)) benzalkonium chloride has a cytotoxic effect. The fall of relative fluorescence
reflects complete absence of viable cells, as present in the blank control samples by the second
measurement at two hours. All polymer solution treated cells, both HPC and HPMC in a high and
low viscosity solution, yield excellent results with relative fluorescence values at least as high as the
negative reference. After two hours, the relative fluorescence of the polymer solution treated cells
-25000
25000
75000
125000
175000
225000
275000
0 2 8 24 48 72
Rel
ativ
e Fl
uo
resc
ence
Un
its
Time (h)
HPC LV HPC HV HPMC LV
HPMC HV Medium + cells BzCl 0,004% (w/V)
BzCl 0,01% (w/V) BzCl 1% (w/V) Medium - cells

177
increases progressively, indicating increasing cellular proliferation and metabolic activity reaching
a plateau after 48 hours, indicative for confluency of the cells.
To evaluate the ability of SV40-HCEC to grow in the presence of an insert with a final HPMC E10M
percentage of 10% (w/w) and 20% (w/w), an insert of approximately 150 mg was added to a 6-well
plate and incubated overnight to allow the insert to spread out. Thereafter, 400.000 cells were
added in medium to each well. Each experiment was performed in triplicate. The growth of the cells
was visually evaluated and is presented in figure 4a and 4b (40x magnification) for inserts prepared
with 10% (w/w) HPMC. An overview of the growth of these cells over different time points is given
as a reference in figure 4c.
The photographs obtained of 20% (w/w) HPMC inserts revealed visually identical results.

178
Fig. 4a. Visual evaluation of the growth of SV40-HCEC in the presence of a 10% (w/w) HPMC insert after 5 hours
incubation. On the bottom left hand side of the picture, a small part of the area where the insert was placed, is
visible.
Fig. 4b. Visual evaluation of the growth of SV40-HCEC in the presence of a 10% (w/w) HPMC insert after 72 hours
incubation.

Fig. 4c. Overview of the growth of SV40-HCEC cells in the presence of 10% (w/w) HPMC inserts. At T0* no cells are added to the well, the black area is a small part of the entire insert.
At T0, the cells are seeded but have not attached to the bottom of the well or on the insert. From T5 to T72, attachment to the well and growth of SV40-HCEC can be seen. The high
viscosity of the insert acts as an effective mechanical barrier against the cells. The growth of the cells does not appear to be limited by the ocular insert, even after T72.
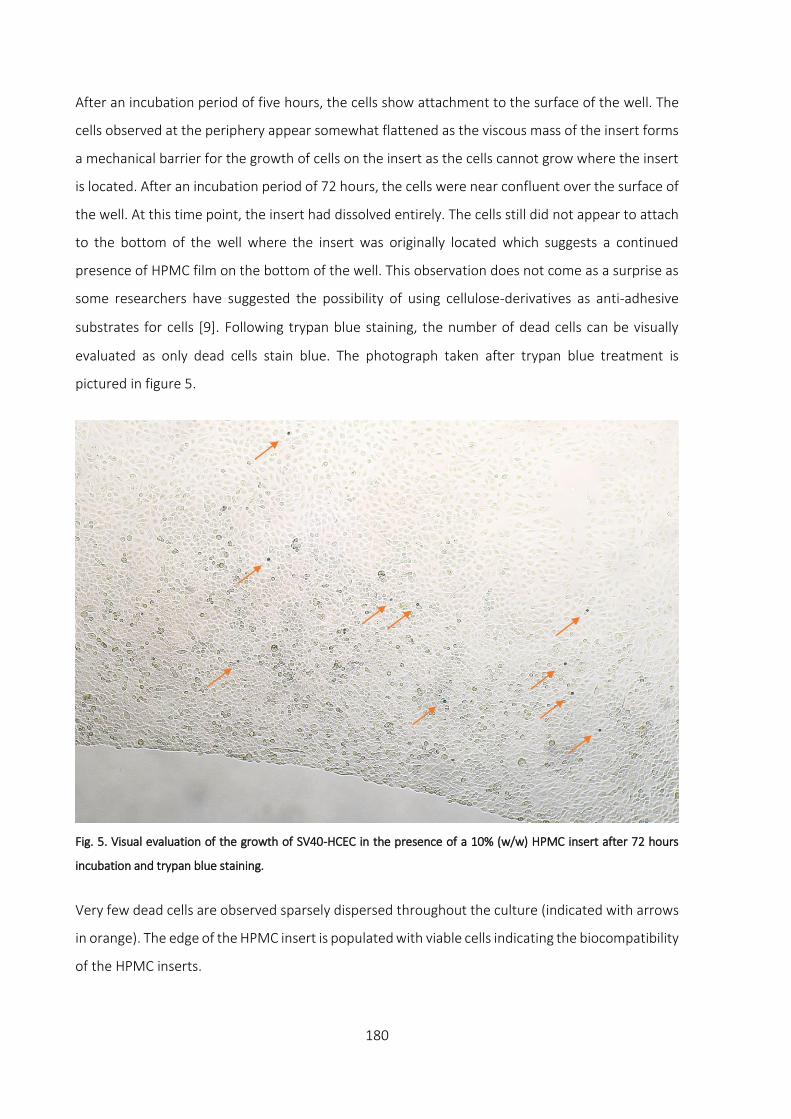
180
After an incubation period of five hours, the cells show attachment to the surface of the well. The
cells observed at the periphery appear somewhat flattened as the viscous mass of the insert forms
a mechanical barrier for the growth of cells on the insert as the cells cannot grow where the insert
is located. After an incubation period of 72 hours, the cells were near confluent over the surface of
the well. At this time point, the insert had dissolved entirely. The cells still did not appear to attach
to the bottom of the well where the insert was originally located which suggests a continued
presence of HPMC film on the bottom of the well. This observation does not come as a surprise as
some researchers have suggested the possibility of using cellulose-derivatives as anti-adhesive
substrates for cells [9]. Following trypan blue staining, the number of dead cells can be visually
evaluated as only dead cells stain blue. The photograph taken after trypan blue treatment is
pictured in figure 5.
Fig. 5. Visual evaluation of the growth of SV40-HCEC in the presence of a 10% (w/w) HPMC insert after 72 hours
incubation and trypan blue staining.
Very few dead cells are observed sparsely dispersed throughout the culture (indicated with arrows
in orange). The edge of the HPMC insert is populated with viable cells indicating the biocompatibility
of the HPMC inserts.

181
4 CONCLUSION
The HPMC inserts described in this research work have no negative influence on the growth of the
SV40-HCEC. Viability measurements show high cytotoxicity levels for benzalkonium chloride treated
cells, as expected. No difference was noted in cell viability between HPC and HPMC (E10M)
polymers, irrespective of the percentage polymer used. All polymer treated cells were able to grow
in the presence of HPC or HPMC. Visual evaluation confirmed the ability of the cells to grow close
to the insert, only being mechanically hindered. After trypan blue staining (at T72), very few blue
cells could be visually detected, indicative for healthy cells. Therefore, it can be concluded that the
HPMC inserts tested are not harmful to SV40-immortalised human corneal epithelial cells.
Acknowledgements
I would like to express my utmost appreciation to Eline Melsbach and prof. dr. Nadia Zakaria
(Department of Ophthalmology, Antwerp University Hospital) for their help with cytotoxicity
testing.

182
References
1. Kang S, Choi H, Rho CR. Differential Effects of Bevacizumab, Ranibizumab, and Aflibercept on the Viability
and Wound Healing of Corneal Epithelial Cells. J Ocul Pharmacol Ther. 2016;32: 671–676.
2. Nguyen T, Latkany R. Review of hydroxypropyl cellulose ophthalmic inserts for treatment of dry eye. Clin
Ophthalmol. 2011;5: 587–591.
3. Saettone MF, Salminen L. Ocular inserts for topical delivery. Adv Drug Deliv Rev. 1995;16: 95–106.
4. Invitrogen. PrestoBlue TM reagent Product Overview. Technical information. 2012.
5. Baudouin C, Labbé A, Liang H, Pauly A, Brignole-Baudouin F. Preservatives in eyedrops: The good, the bad
and the ugly. Prog Retin Eye Res. 2010;29: 312–334.
6. Paimela T, Ryhänen T, Kauppinen A, Marttila L, Salminen A, Kaarniranta K. The preservative
polyquaternium-1 increases cytoxicity and NF-kappaB linked inflammation in human corneal epithelial
cells. Mol Vis. 2012;18: 1189–1196.
7. Durand-cavagna G, Delort P, Duprat P, Bailly Y, Plazonnet B, Gordon LR. Corneal toxicity studies in rabbits
and dogs with hydroxyethyl Cellulose and benzalkonium chloride. Toxicol Sci. 1989;13: 500–508.
8. Noecker R. Effects of common ophthalmic preservatives on ocular health. Adv Ther. 2001;18: 205–215.
9. Velzenberger E, Vayssade M, Legeay G, Nagel MD. Study of cell behaviour on a cellulose anti-adhesive
substratum. Cellulose. 2008;15: 347–357.

Chapter 8: Stability testing of inserts containing lysozyme
184
1 INTRODUCTION
The purpose of stability testing is to examine how drug loaded inserts behave after longer periods
of storage. The quality of the drug substance or product can vary with time and under given
circumstances such as changing temperature, humidity and light. Therefore, stability studies are
important to understand and ensure that the properties of the product do not alter during storage,
particularly when peptides and proteins are involved [1]. This chapter investigates the behaviour of
the inserts prepared and loaded with lysozyme over time at a constant temperature of 2 °C. Stability
testing was assessed by performing activity measurements on lysozyme loaded inserts, on
rheological data and through release profile analysis.
Release profiles describe the behaviour when an incorporated drug substance is released from its
carrier, but it gives no information whether the drug substance remains active. Activity assays can
give a valuable insight on the physicochemical behaviour of lysozyme after storage. Rheological
measurements can provide a useful understanding of the stability of the hydrogel and whether the
loaded drug substance influences the viscosity of the carrier over time.
The factors limiting the stability of these inserts are likely to be determined by the drug substance
(peptide or protein), rather that the excipients used to build up the insert. For this reason, stability
testing at this stage of product development is non-classical and relatively limited, as the final
specifications of the insert, as well as the drug of interest and packaging material are not yet
specified.

185
2 MATERIALS AND METHODS
2.1 Materials
Lysozyme from chicken egg white and glycerol analytical grade (99.5% (V/V)) were obtained from
Sigma-Aldrich (Steinheim, Germany). Hydroxypropylmethyl cellulose type E10M Premium CR was
provided by Colorcon (Dartford, UK). By specification, an aqueous 2% (w/w) E10M solution gives an
apparent viscosity of 10.000 mPa.s (at 20 °C).
Phosphate-buffered saline solution (PBS, pH 7.4) was prepared using 8.2 g/l sodium chloride (NaCl),
0.300 g/l sodium dihydrogen phosphate dihydrate (NaH2PO4.2H2O), 1.540 g/l disodium hydrogen
phosphate dihydrate (Na2HPO4.2H2O) and purified water. All electrolytes of analytical grade were
purchased from Merck (Darmstadt, Germany).
EnzChek® Lysozyme Assay Kit was purchased from Life Technologies (Erembodegem, Belgium) and
used to perform activity testing.
PVC-blisters capsule size 4, used as a mould to produce the ocular inserts, were kindly provided by
Janssen Pharmaceutica (Beerse, Belgium).
2.2 Method
The inserts were prepared following the method as described in section 2.2 Preparation of ocular
inserts in chapter 5. The inserts were loaded with 3% (w/w) lysozyme with a final HPMC percentage
of 25% (w/w). The average weight of the inserts was chosen at approximately 400 mg and stored
at a temperature of 2 °C up to 12 months.
Activity
The lysozyme activity was measured using a lysozyme assay kit. The lysozyme activity assay is a
fluorescence-based assay to measure lysozyme activity on Micrococcus lysodeikticus cell walls.
These cell walls are labelled to such a degree that the fluorescence is quenched. Lysozyme activity
on the cell wall of Micrococcus lysodeikticus relieves this quenching, resulting in a measurable
fluorescence amount, proportional to lysozyme activity [2].
The lysozyme activity measurement was performed at day 0 in PBS solution to determine the
maximum activity after preparation of the inserts. This value was used as a reference and compared
to lysozyme activity measurements (both in the insert as in solution) performed after 1, 3, 6 and 12
months. At day 0, the lysozyme activity was measured for newly prepared lysozyme loaded inserts.

186
Obviously, the activity at day 0 for these inserts is expected to be similar if not identical to the
activity level of a lysozyme-PBS solution.
All inserts were prepared in quadruplicate and dissolved while stirring in 15 g PBS overnight at room
temperature (22 ± 2 °C). All quadruplicates were serially diluted in a white 96-well plate starting
from 1/50 up to 1/1600. Two additional lysozyme solutions were also prepared at day 0 in a
concentration of 0.084% (w/w) in PBS solution (pH 7.4) and purified water. This percentage
corresponds to the amount of lysozyme present in the insert after dissolution in 15 g PBS. These
solutions make a direct comparison between lysozyme dissolved in purified water and in PBS
possible, as well as a comparison between lysozyme loaded in the insert and both lysozyme
solutions. Comparing these solutions mutually gives an idea on whether the excipients of the insert
have a potentially stabilising effect on the denaturation of lysozyme during storage over 12 months,
retaining its initial activity as much as possible. The enzyme is active over a broad pH range (6-9)
[3].
Fluorescence measurements were performed using a fluorescence microplate reader
(Tecan Infinite 200, Männedorf, Switzerland) using excitation/emission wavelengths of 485/530 nm
respectively. The data obtained was converted to percentages and compared to the activity of
0.084% (w/w) lysozyme dissolved in PBS at day 0, which was set as the reference activity level.
Release profiles
Different inserts stored during 1, 3, 6 and 12 months at 2 °C were analysed. The inserts were put
into separate test tubes to which 15 g PBS was added at a temperature of 32 °C. All experiments
were carried out in quadruplicate. The test tubes were placed in a non-oscillating water bath (Julabo
20B, Merck-Belgolabo, Overijse, Belgium) at a temperature of 32.0 ± 0.5 °C. At different time points,
samples of 2 g release medium were taken from each test tube and replaced with an equal amount
of PBS at 32 °C. Sampling intervals of 10, 30, 60, 90, 120, 180, 240, 300, 360, 420 and 480 minutes
were chosen. Before and after sampling, the content of the test tubes was homogenised by means
of gentle stirring.
Samples were analysed spectrophotometrically at a wavelength of 280 nm. At the end of every
series of measurements, the content of each test tube was intensively vortexed to release the
remaining drug from the insert and measured spectrophotometrically.
187
Rheological measurement
The viscosity of the inserts was measured using an Anton Paar rheometer (MCR-102, Graz, Austria)
with a parallel plate measuring device. The measurement was performed through oscillation at a
constant amplitude of 1% and a varying angular frequency of 100 to 0.1 rad/s. A parallel plate with
a diameter of 8 mm was chosen. The gap was set at 1.5 mm and a temperature of 32.0 ± 0.1 °C was
configured. To prevent the polymer from drying out during the measurements, a solvent trap was
used to cover the sample. Every formulation was measured in quadruplicate and two separate
measurements were taken per replicate.

188
3 RESULTS AND DISCUSSION
3.1 Activity
In figure 1, the activity levels compared to the reference lysozyme solution is given.
Fig. 1. Evolution of activity over time for a lysozyme (lyso) solution in PBS, lysozyme loaded inserts in PBS and a
solution of lysozyme in purified water.
The activity of lysozyme in PBS at day 0 was set as the reference activity level. Unsurprisingly, the
PBS solution of lysozyme and the insert showed near identical activity levels at day 0. After one
month, interesting data was collected. The activity level of a lysozyme solution in purified water
seems to drop dramatically, compared to lysozyme in PBS solution. The buffered environment of
PBS keeps the pH within a stable range for lysozyme. The result of the activity level of lysozyme
after one month loaded in the insert seems to be at least equal if not slightly better than the activity
levels in PBS. After three months, the results obtained are similar. A very small increase is observed
for all three solutions, which might be the result of small errors during pipetting in the 96-well plate.
A sharp drop in activity levels is seen for all solutions after six months. Still, a solution of lysozyme
in PBS seems to retain the activity of lysozyme better compared to lysozyme in an aqueous solution,
while the excipients of the inserts seem to improve the stability of lysozyme even more. Even after
12 months, the activity level of lysozyme loaded in inserts is still over 60% of its initial activity. The
activity of lysozyme in PBS and purified water have dropped to the same level (respectively 28%
0
20
40
60
80
100
0 1 3 6 12
Act
ivit
y le
vel (
%)
Months
Lyso in PBS solution Lyso in insert Lyso in purified water
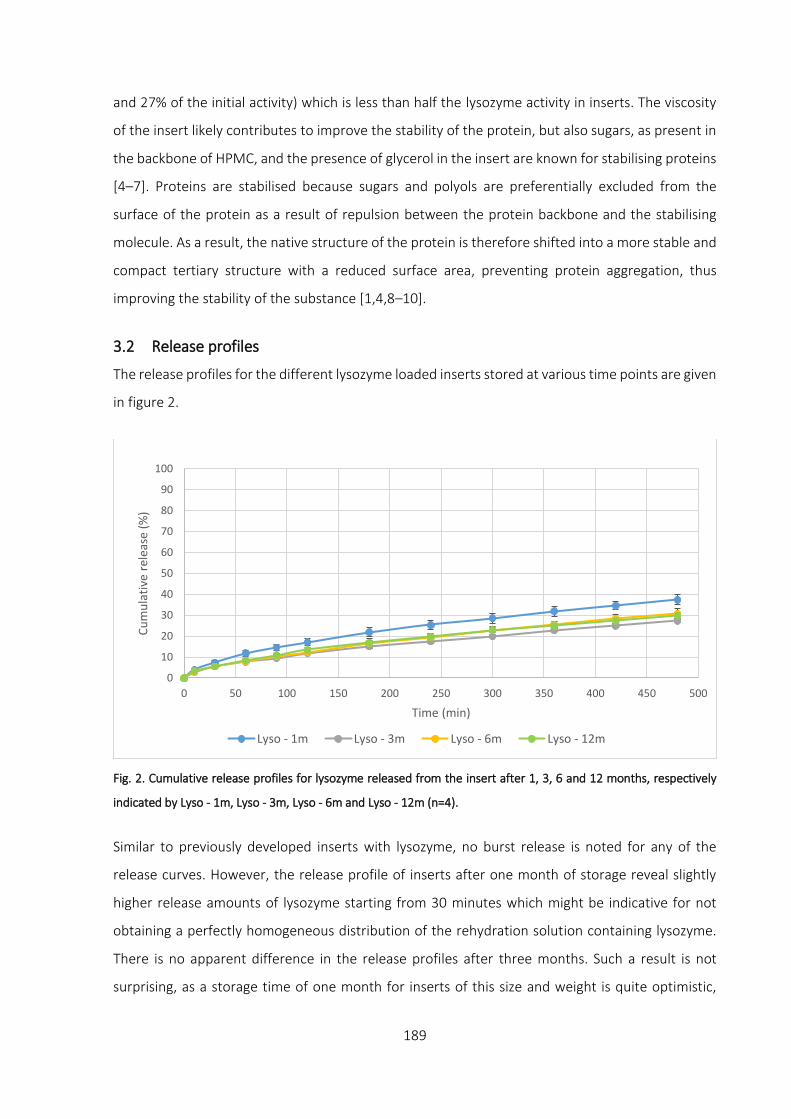
189
and 27% of the initial activity) which is less than half the lysozyme activity in inserts. The viscosity
of the insert likely contributes to improve the stability of the protein, but also sugars, as present in
the backbone of HPMC, and the presence of glycerol in the insert are known for stabilising proteins
[4–7]. Proteins are stabilised because sugars and polyols are preferentially excluded from the
surface of the protein as a result of repulsion between the protein backbone and the stabilising
molecule. As a result, the native structure of the protein is therefore shifted into a more stable and
compact tertiary structure with a reduced surface area, preventing protein aggregation, thus
improving the stability of the substance [1,4,8–10].
3.2 Release profiles
The release profiles for the different lysozyme loaded inserts stored at various time points are given
in figure 2.
Fig. 2. Cumulative release profiles for lysozyme released from the insert after 1, 3, 6 and 12 months, respectively
indicated by Lyso - 1m, Lyso - 3m, Lyso - 6m and Lyso - 12m (n=4).
Similar to previously developed inserts with lysozyme, no burst release is noted for any of the
release curves. However, the release profile of inserts after one month of storage reveal slightly
higher release amounts of lysozyme starting from 30 minutes which might be indicative for not
obtaining a perfectly homogeneous distribution of the rehydration solution containing lysozyme.
There is no apparent difference in the release profiles after three months. Such a result is not
surprising, as a storage time of one month for inserts of this size and weight is quite optimistic,
0
10
20
30
40
50
60
70
80
90
100
0 50 100 150 200 250 300 350 400 450 500
Cu
mu
lati
ve r
elea
se (
%)
Time (min)
Lyso - 1m Lyso - 3m Lyso - 6m Lyso - 12m

190
based on experience and results from earlier experiments as described in the previous chapters. It
is important to understand that obtaining a homogeneous distribution of both drug and
rehydration solution will highly be influenced by the characteristics of the drug, but also influenced
by the temperature and not the least the dimensions of the insert. Stability-wise, the release
profiles show no evidence of altered release profiles between three and twelve months of storage.
3.3 Rheological measurement
The results of viscosity measurements of different inserts loaded with lysozyme and stored during
various time periods, are graphically presented in figure 3.
Fig. 3. Viscosity profiles for inserts loaded with lysozyme and measured after 1, 3, 6 and 12 months, respectively
indicated by 1m, 3m, 6m and 12m (n=8).
Similar to the results of release profiles in figure 2, the inserts stored during one month show a
slightly deviating viscosity profile compared to inserts stored during three or more months. The
lower viscosity could be explained by the insufficiently homogeneous distribution of the drug and
particularly in this case, a nonhomogeneous distribution of the rehydration solution. This causes
one side of the insert to be slightly less hydrated than the opposing side, based on the mechanism
of rehydration of the method developed. As a drug solution is added from one side of the
dehydrated polymeric matrix, the top part of the matrix will be hydrated sooner than the bottom
part of the insert. An incomplete hydration of the polymer matrix will lead to a viscosity gradient.
1,00E+02
1,00E+03
1,00E+04
1,00E+05
1,00E+06
0,1 1 10 100
Vis
cosi
ty (
Pa.
s)
Angular frequency (rad/s)
1m 3m 6m 12m

191
This in turn alters rheological measurements or in the case of a relatively ‘wet’ surface to wall slip.
Wall slip is a phenomenon where one of the plates of the viscosimeter cannot sufficiently grip the
entire sample resulting in an underestimation of the true viscosity of the sample. In this case, only
a part of the sample would be brought into movement which affects the rheological profile [11–
13]. Nonetheless, the rheological results indicate excellent stability of the properties of the HPMC
inserts.

192
4 CONCLUSION
From the activity measurements, a stabilising effect of the drug carrier on lysozyme is seen over
time. Especially after 12 months of storage, the activity of lysozyme loaded in inserts is more than
double the activity of lysozyme in both PBS and purified water. The stabilising effect of the
excipients glycerol and HPMC can most likely be held responsible for this observation. Both release
profiles and rheological measurements show signs of evidence that full rehydration of the drug
solution in the dehydrated polymer matrix have not fully occurred after one month. Storage of the
inserts between three and twelve months show no difference in both release profiles as well as in
the rheological data which indicated excellent stability of the inserts over the time period
investigated.
Acknowledgements
I would like to express my gratitude to drs. Gwendolyn Vliegen and prof. dr. Anne-Marie Lambeir
(Laboratory of Medical Biochemistry, Department of Pharmaceutical Sciences, University of
Antwerp) for their help with the stability measurements.

193
References
1. Manning MC, Chou DK, Murphy BM, Payne RW, Katayama DS. Stability of protein pharmaceuticals: An
update. Pharm Res. 2010;27: 544–575.
2. Molecular Probes. EnzChek® Lysozyme Assay Kit (E-22013). Technical information. 2001.
3. Davies RC, Neuberger A, Wilson BM. The dependence of lysozyme activity on pH and ionic strength.
Biochim Biophys Acta - Enzymol. 1969;178: 294–305.
4. Avanti C, Saluja V, Van Streun ELP, Frijlink HW, Hinrichs WLJ. Stability of lysozyme in aqueous extremolyte
solutions during heat shock and accelerated thermal conditions. PLoS One. 2014;9: 2–7.
5. Sedgwick H, Cameron JE, Poon WCK, Egelhaaf SU. Protein phase behavior and crystallization: Effect of
glycerol. J Chem Phys. 2007;127: 1–6.
6. Vagenende V, Yap MGS, Trout BL. Mechanisms of protein stabilization and prevention of protein
aggregation by glycerol. Biochemistry. 2009;48: 11084–11096.
7. Esposito A, Comez L, Cinelli S, Scarponi F, Onori G. Influence of glycerol on the structure and thermal
stability of lysozyme: a dynamic light scattering and circular dichroism study. J Phys Chem B. 2009;113:
16420–16424.
8. Edelman R, Kusner I, Kisiliak R, Srebnik S, Livney YD. Sugar stereochemistry effects on water structure and
on protein stability: The templating concept. Food Hydrocoll. 2015;48: 27–37.
9. Tonnis WF, Mensink MA, De Jager A, Van Der Voort Maarschalk K, Frijlink HW, Hinrichs WLJ. Size and
molecular flexibility of sugars determine the storage stability of freeze-dried proteins. Mol Pharm.
2015;12: 684–694.
10. Honig B. Protein Folding: From the Levinthal Paradox to Structure Prediction. J Mol Biol. 1999;293: 283–
293.
11. Durairaj R, Man LW, Ekere NN, Mallik S. The effect of wall-slip formation on the rheological behaviour of
lead-free solder pastes. Mater Des. 2010;31: 1056–1062.
12. Walls HJ, Caines SB, Sanchez AM, Khan SA. Yield stress and wall slip phenomena in colloidal silica gels. J
Rheol. 2003;47: 847–868.
13. Ozkan S, Gillece TW, Senak L, Moore DJ. Characterization of yield stress and slip behaviour of skin/hair
care gels using steady flow and LAOS measurements and their correlation with sensorial attributes. Int J
Cosmet Sci. 2012;34: 193–201.


Chapter 9: In vivo evaluation

196
1 INTRODUCTION
In the previous chapters, it has been demonstrated that the inserts developed have slow release
characteristics in vitro and do not reveal any cytotoxic effects on human corneal epithelial cells ex
vivo. The main aim of the in vivo study is to analyse the behaviour of the ocular inserts when
administered in living animals.
For this experiment, a dry eye rat model has been developed by researchers of the Laboratory of
Microbiology, Parasitology and Hygiene at the University of Antwerp, Belgium. This method
includes the surgical removal of the exorbital gland of the rat, responsible for tear fluid production.
Dry eye disease is characterised by a series of inflammatory events, releasing cytokines such as
interleukin-1α (IL-1α) and tumour necrosis factor-α (TNF-α) [1,2]. Therefore, to treat the dry eye
pathology, dexamethasone sodium phosphate was used as a reference drug in an aqueous eye drop
solution to suppress the inflammatory cycle [1,3,4]. Experimentally, inserts with different
concentrations of dexamethasone sodium phosphate were administered and compared to the
reference group.
Measurements were performed on the ocular tissue damage through fluorescein scoring, tear
volumes were measured and an analysis was performed on the cytokine levels of IL-1α and TNF-α,
linked to dry eye disease.
Although the treatment of dry eye disease is not necessarily within the scope of this research work,
the data obtained from such animal model could provide valuable information on the strengths and
weaknesses of ocular inserts in vivo.

197
2 MATERIALS AND METHODS
2.1 Materials
Twenty female Wistar rats with a body mass between 200 g and 300 g were purchased from Janvier
(Saint-Berthevin Cedex, France) and kept under controlled, pathogen-free conditions. The female
Wistar rats were kept in the following husbandry conditions: at a temperature of 20-25 °C and a
humidity level of 45%. The day-night cycle was set at 12 h/12 h. Food and water were available ad
libitum. Dexamethasone sodium phosphate was purchased from Sigma-Aldrich (Steinheim,
Germany). Isoflurane (Halocarbon®, New-Jersey, USA), ketamine (Anesketin®, Eurovet, Bladel,
Netherlands) and xylazine (Rompun®, Bayer, Leverkusen, Germany) were used as anaesthetics.
Isobetadine® (Meda, Brussels, Belgium), Astrexine® (Pierre-Fabre Médicament, Boulogne, France)
and Temgesic® (Reckitt Benckiser Healthcare, Hull, UK) were used to perform surgery. Baytrill®
(Bayer, Leverkusen, Germany) was given to the rats post-surgically as an antibiotic.
Glycerol analytical grade (99.5% (V/V)) was obtained from Sigma-Aldrich (Steinheim, Germany).
Hydroxypropylmethyl cellulose type E10M Premium CR was provided by Colorcon (Dartford, UK).
By specification, an aqueous 2% (w/w) E10M solution gives an apparent viscosity of 10.000 mPa.s
(at 20 °C).
2.2 Method
All in vivo experiments were approved by the Animal Ethical Committee of the University of
Antwerp (2013-67).
Surgical induction of dry eye disease
All rats were anaesthetised prior to surgery with an intraperitoneal injection of 25 mg/kg
bodyweight ketamine and 2.5 mg/kg xylazine after a three-fold dilution in PBS solution. The right
exorbital lachrymal gland of the rat was surgically removed by an incision of approximately 10 mm
in front of and inferior to the tragus below the right ear. The left eye remained untreated and served
as a control eye.
Prior to surgery, Isobetadine® was used to disinfect the skin of the rat. After surgery, the wound
was disinfected with Astrexine®. To relieve pain, Temgesic® was given as a post-operative analgesic.
In order to reduce the risk of post-operative complications, an antibiotic (Baytrill®) was
administered orally for five consecutive days (1 ml Baytrill® per drinking bottle).

198
Evaluation of ocular tissue damage
A volume of 1 µl sodium fluorescein solution (1% (w/V) in PBS) was topically administered on the
eye surface using a micropipette. After two minutes, the excess sodium fluorescein solution was
removed by rinsing the eye with 4 µl PBS. The eye was photographed using a Canon digital camera
with a microscopic lens attached to it. The photographs were taken in a darkened room under
cobalt blue light. In case of tissue damage, yellow fluorescent stains are visible.
The photographs were analysed using the Oxford fluorescein grading scale for evaluation of the
ocular surface. Scores were given from 0 to 5 for each eye to indicate the severity of tissue damage.
A score of 0 implies no noticeable harm done to the eye, while 5 indicates severe ocular surface
deterioration [5].
Tear volume measurement
The tear volume was measured once a week using a phenol red thread tear test (Zone-QuickTM,
Menicon, Nagoya, Japan) which was placed centrally under the lower conjunctival fornix during 15
seconds. The tear volume can be estimated by measuring the discolouration of the phenol red
thread from yellow to red and is expressed in the length of discolouration of the cotton thread in
mm.
Tear collection
Tear fluid was collected with a glass capillary, connected to a flexible tube and a syringe. A partial
vacuum was induced using the syringe, in order to increase the amount of tear fluid collected. The
capillaries were subsequently stored at -80 °C for flow cytometric analysis. The tear collection was
carried out twice every week.
Flow cytometric analysis of tear fluid
The cytokine levels of IL-1α and TNF-α in tear fluid were measured using a Cytometric Bead Array
(CBA) kit according to the manufacturers protocol (Rat IL-1α and TNF-α CBA flex sets, BD
Biosciences, Erembodegem, Belgium). The data was collected through flow cytometric techniques
(FACS calibur, BD Biosciences, San Jose, USA). Tear fluid samples were taken as much as possible,
given the available amount. Tear fluid of all animals (n=4) of the same treatment group were pooled
per animal prior to the analysis. The collected samples were diluted to 15 μl with assay diluent. The
same protocol was followed for the untreated left eye of the rat.

199
Preparation of eye drops
The eye drops were prepared in a laminar flow cabinet (Safemate 1.8, Euroclone, Pero, Italy) by
dissolving dexamethasone sodium phosphate in PBS solution in a concentration of 1 mg/ml. The
rats were given four eye drops per day, with a single drop measuring 2.5 µl.
Preparation of insert
The inserts loaded with dexamethasone sodium phosphate were prepared in custom made Teflon
moulds with a diameter of 2 mm and a length of 10 mm. The method described in section 2.2
Preparation of ocular inserts in chapter 5 was followed using an aqueous solution of
dexamethasone sodium phosphate. The mass of the inserts was set at 70 mg, but to accommodate
the dimensions of the rats fornix, smaller samples weighing 4 mg were taken and inserted in the
lower conjunctival fornix of the right eye.
Two series of inserts were prepared with different concentrations of dexamethasone sodium
phosphate. The dosage of the inserts was calculated for twice a day application in case an insert
would get expelled from the conjunctival fornix and set at a dose twice the daily dose of the eye
drops (20 µg dexamethasone sodium phosphate) and a dose equivalent to five times the daily dose
(50 µg dexamethasone sodium phosphate). These groups are hereafter indicated by ‘dexa-2x’ and
‘dexa-5x’ respectively. An additional series of blank inserts were also produced.

200
Experimental setup
Within the same day of surgical removal of the exorbital lachrymal gland, all rats were treated
during 12 days. For the inserts, both loaded with dexamethasone sodium phosphate and blank
inserts, the experiment was executed in a double blind manner. All inserts were administered to
the rats within one hour, between 8h30 – 9h30 and a second dose between 15h30 – 16h30. Tear
samples were taken on every Monday, Wednesday and Friday morning. An overview of the
experimental groups is given in table 1.
Table 1. Overview of the experimental groups.
Group Treatment # Animals Treatment
frequency
Negative control (dry eye) No treatment 4 -
Positive control (eye drops) Eye drops (1 mg/ml) 4 4x 1 drop/day
Test group A (insert)
‘dexa-2x’
Inserts with 2-fold of daily
eye drop dosage
4 2x/day
Test group B (insert)
‘dexa-5x’
Inserts with 5-fold of daily
eye drop dosage
4 2x/day
Blank insert Inserts without drug 4 2x/day
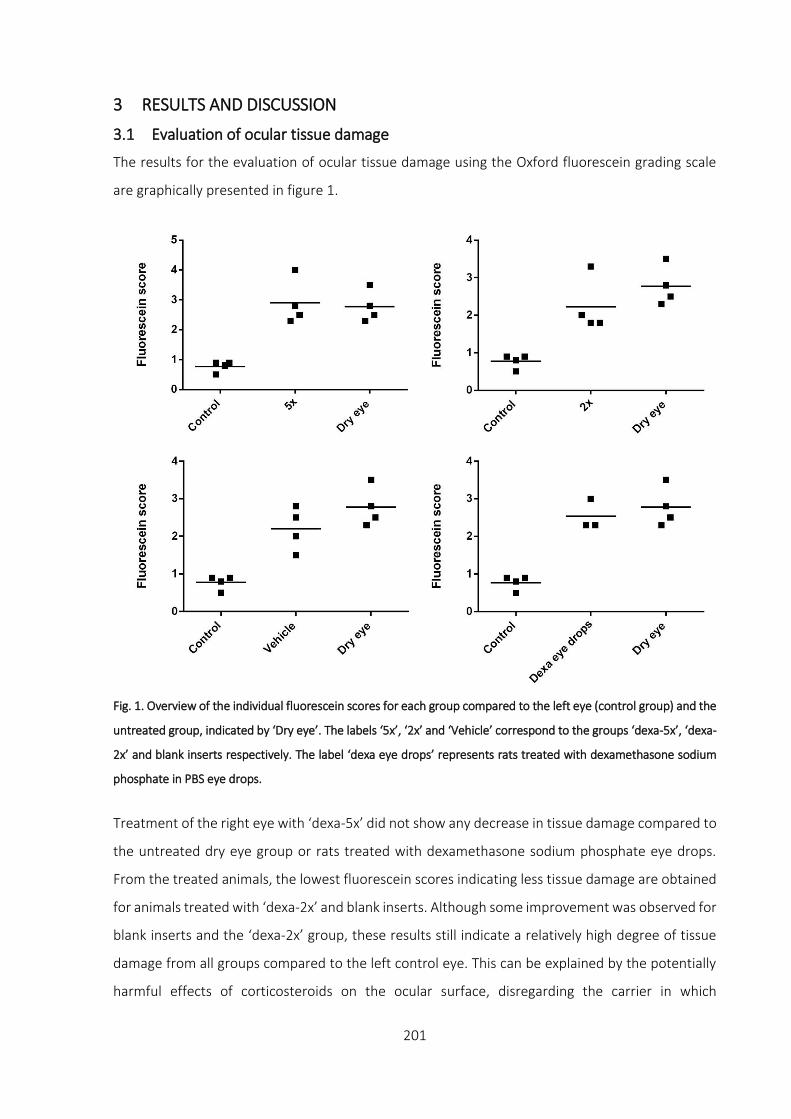
201
3 RESULTS AND DISCUSSION
3.1 Evaluation of ocular tissue damage
The results for the evaluation of ocular tissue damage using the Oxford fluorescein grading scale
are graphically presented in figure 1.
Fig. 1. Overview of the individual fluorescein scores for each group compared to the left eye (control group) and the
untreated group, indicated by ‘Dry eye’. The labels ‘5x’, ‘2x’ and ‘Vehicle’ correspond to the groups ‘dexa-5x’, ‘dexa-
2x’ and blank inserts respectively. The label ‘dexa eye drops’ represents rats treated with dexamethasone sodium
phosphate in PBS eye drops.
Treatment of the right eye with ‘dexa-5x’ did not show any decrease in tissue damage compared to
the untreated dry eye group or rats treated with dexamethasone sodium phosphate eye drops.
From the treated animals, the lowest fluorescein scores indicating less tissue damage are obtained
for animals treated with ‘dexa-2x’ and blank inserts. Although some improvement was observed for
blank inserts and the ‘dexa-2x’ group, these results still indicate a relatively high degree of tissue
damage from all groups compared to the left control eye. This can be explained by the potentially
harmful effects of corticosteroids on the ocular surface, disregarding the carrier in which
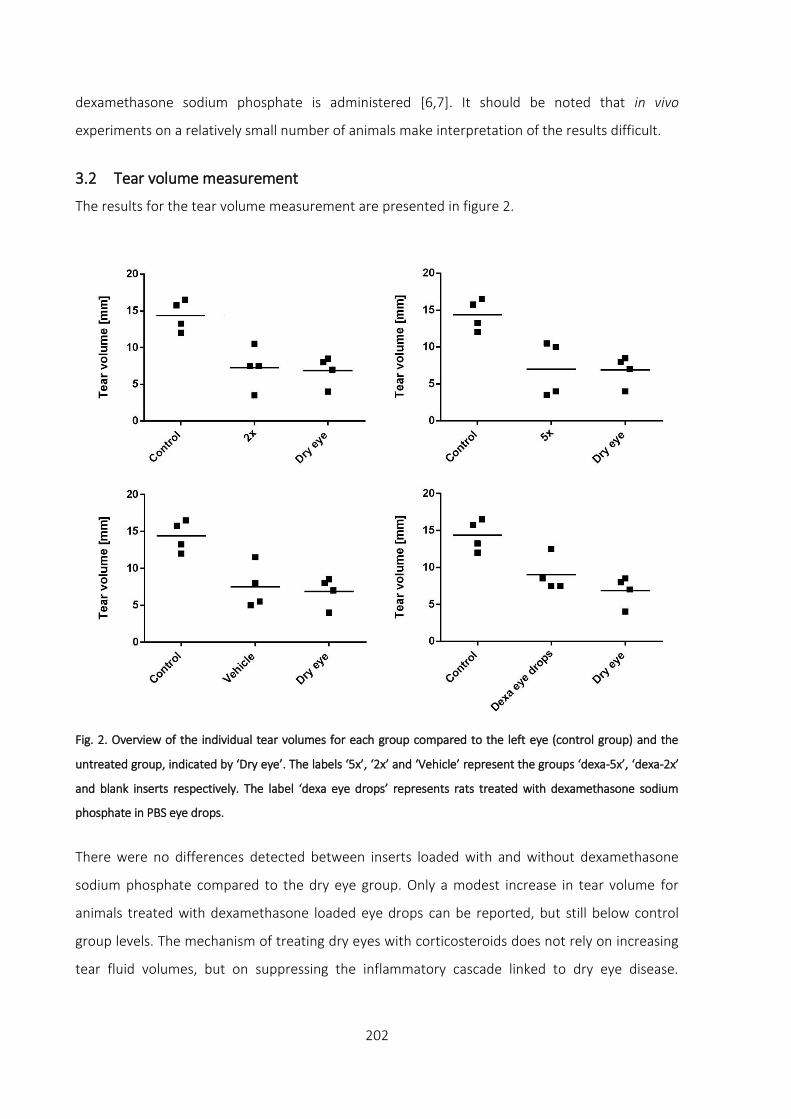
202
dexamethasone sodium phosphate is administered [6,7]. It should be noted that in vivo
experiments on a relatively small number of animals make interpretation of the results difficult.
3.2 Tear volume measurement
The results for the tear volume measurement are presented in figure 2.
Fig. 2. Overview of the individual tear volumes for each group compared to the left eye (control group) and the
untreated group, indicated by ‘Dry eye’. The labels ‘5x’, ‘2x’ and ‘Vehicle’ represent the groups ‘dexa-5x’, ‘dexa-2x’
and blank inserts respectively. The label ‘dexa eye drops’ represents rats treated with dexamethasone sodium
phosphate in PBS eye drops.
There were no differences detected between inserts loaded with and without dexamethasone
sodium phosphate compared to the dry eye group. Only a modest increase in tear volume for
animals treated with dexamethasone loaded eye drops can be reported, but still below control
group levels. The mechanism of treating dry eyes with corticosteroids does not rely on increasing
tear fluid volumes, but on suppressing the inflammatory cascade linked to dry eye disease.

203
Furthermore, this dry eye rat model is based on the surgical removal of the exorbital lachrymal
gland. Therefore, tear volumes as high as the control group were not expected.
3.3 Measurement of cytokine levels
After flow cytometric analysis, the results for IL-1α and TNF-α concentrations were plotted in the
following figure 3 and figure 4.
Fig. 3. Overview of the individual cytokine concentrations of IL-1α for each group compared to the left eye (control
group) and the untreated group, indicated by ‘Dry eye’. The labels ‘5x’, ‘2x’ and ‘Vehicle’ represent the groups ‘dexa-
5x’, ‘dexa-2x’ and blank inserts respectively. The label ‘dexa eye drops’ represents rats treated with dexamethasone
sodium phosphate in PBS eye drops.
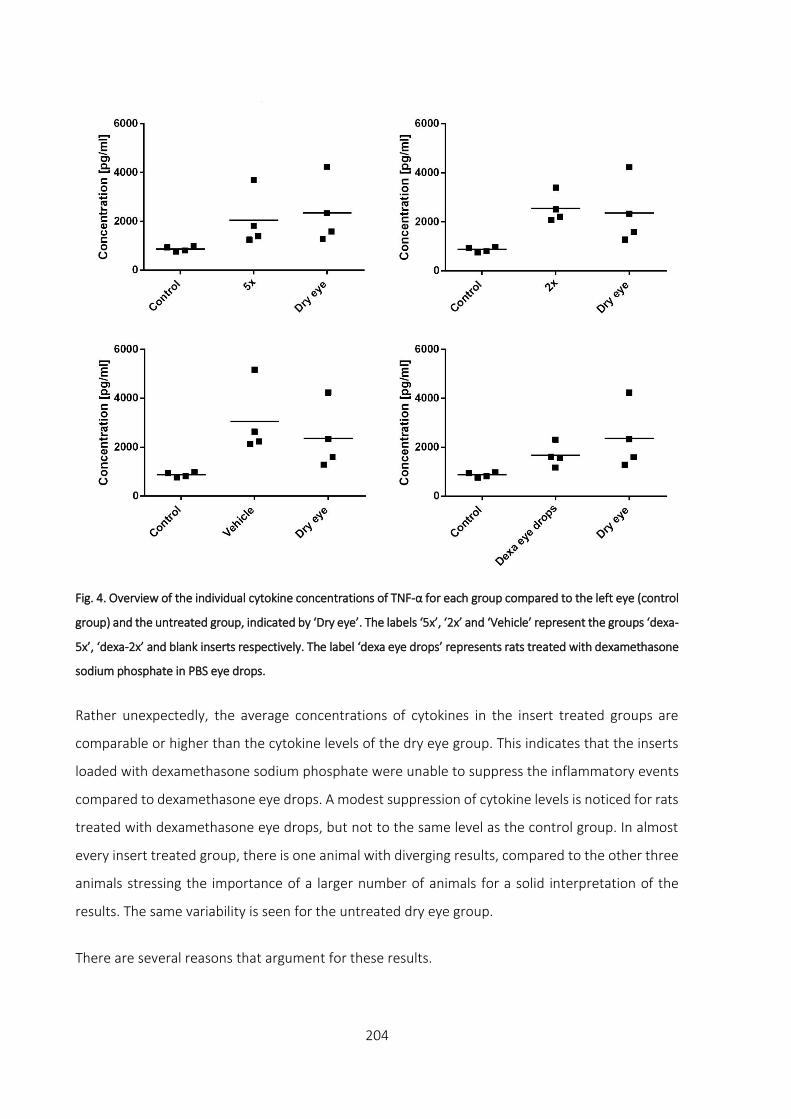
204
Fig. 4. Overview of the individual cytokine concentrations of TNF-α for each group compared to the left eye (control
group) and the untreated group, indicated by ‘Dry eye’. The labels ‘5x’, ‘2x’ and ‘Vehicle’ represent the groups ‘dexa-
5x’, ‘dexa-2x’ and blank inserts respectively. The label ‘dexa eye drops’ represents rats treated with dexamethasone
sodium phosphate in PBS eye drops.
Rather unexpectedly, the average concentrations of cytokines in the insert treated groups are
comparable or higher than the cytokine levels of the dry eye group. This indicates that the inserts
loaded with dexamethasone sodium phosphate were unable to suppress the inflammatory events
compared to dexamethasone eye drops. A modest suppression of cytokine levels is noticed for rats
treated with dexamethasone eye drops, but not to the same level as the control group. In almost
every insert treated group, there is one animal with diverging results, compared to the other three
animals stressing the importance of a larger number of animals for a solid interpretation of the
results. The same variability is seen for the untreated dry eye group.
There are several reasons that argument for these results.

205
Firstly, the inserts are given twice daily, but whether the inserts remained at the site of application
is unknown. From preliminary studies, it was noticed that in case of hydrated eyes, the inserts got
expelled from the fornix more easily due to the movement of the eyelids and the inability of the
inserts to absorb tear fluid and attach to the ocular surface. The small size and transparency of the
inserts make it hard to detect such an event. Experience and practice improved the insertion
techniques, minimising the apparent frequency of expulsion.
Secondly, it is possible that the viscosity of the inserts was too high for the amount of tear fluid
available in the eye of the rats. In some cases, when the second insert was applied, the first insert
was found in a partially dissolved state on the surface of the eye. This could mean that therapeutic
levels of the drug might not have been reached or only for a short period of time, insufficient to
trigger an anti-inflammatory response. Such an observation implicates the need to make the
dimensions of the insert even smaller for drug unloading to occur or the development of inserts
with lower viscosities and hence faster dissolution and drug release rates for the treatment of dry
eye disease in rats, but not necessarily in humans.
Thirdly, hydrogels are known to absorb aqueous fluid from their surroundings and swell [8–10].
Application of a hydrogel on the ocular surface might lead to reduced free tear fluid, which in case
of dry eye disease is not desirable. However, hydrogels are already commercially used for treatment
of dry eye disease as the polymer chains of hydrogels disentangle in tear fluid and spread over the
surface of the eye in a thin film, retaining water at the ocular surface. A well-known example of
such a device is Lacrisert®, based on the polymer hydroxypropyl cellulose (HPC) [11]. High
concentrations of HPMC in the insert or inserts with large dimensions might reduce or even
annihilate the lubricating effect of polymers entirely in case of severe dry eye disease, certainly in
the case where certain lachrymal glands are lacking. Additionally, it was noticed that collecting
sufficient amounts of tear fluid was more difficult to achieve for insert treated eyes. In case of insert
treated eyes, smaller amounts of tear fluid were available for cytokine analysis compared to non-
insert treated eyes, potentially causing erroneous results and misinterpretation.
The property of inserts to absorb tear fluid could also lead to higher levels of cytokines measured
in free tear fluid. From earlier studies, it has been proven that small molecules are more easily
embedded in hydrogels through passive diffusion. For instance water is a very small molecule
compared to larger molecules such as IL-1α and TNF-α and is therefore absorbed easily by an insert.
Absorption of tear fluid might shift the ratio cytokines/tear fluid to higher levels due to less free

206
tear volume being available for tear collection, increasing the measured cytokine concentrations.
However, the time period between application of an insert and the collection of tear fluid is
approximately 17 hours. Although it was impossible to determine whether the insert was able to
exert its effect, it is less likely that the insert was still present at the site of application. No cases as
such were reported, although the presence of a thin layer of polymer over the surface might be
enough to reduce the amount of tear fluid available for tear collection.

207
4 CONCLUSION
The inserts loaded with a dexamethasone sodium phosphate brought no clear improvements for
the treatment of dry eyes in rats. No difference was measured between blank, ‘dexa-2x’ and ‘dexa-
5x’ inserts which suggest that other mechanisms prohibit the action of dexamethasone sodium
phosphate. The slow dissolution rate of the insert and hence slow release rate of the drug
incorporated seems to play an important role in the outcome of the conducted experiments. The
viscosity and absorbing capacity of the insert increasing the local cytokine concentration in tear
fluid might also contribute to this observation.
Acknowledgements
I am very grateful to drs. Cedric Joossen and prof. dr. Paul Cos (Laboratory for Parasitology,
Microbiology and Hygiene, Department of Pharmaceutical Sciences, University of Antwerp) for
conducting the animal studies.

208
References
1. De Paiva CS, Corrales RM, Villarreal AL, Farley WJ, Li DQ, Stern ME, et al. Corticosteroid and doxycycline
suppress MMP-9 and inflammatory cytokine expression, MAPK activation in the corneal epithelium in
experimental dry eye. Exp Eye Res. 2006;83: 526–535.
2. Enríquez-de-Salamanca A, Castellanos E, Stern ME, Fernández I, Carreño E, García-Vázquez C, et al. Tear
cytokine and chemokine analysis and clinical correlations in evaporative-type dry eye disease. Mol Vis.
2010;16: 862–873.
3. Sadrai Z, Stevenson W, Okanobo A, Chen Y, Dohlman TH, Hua J, et al. PDE4 inhibition suppresses IL-17-
associated immunity in dry eye disease. Investig Ophthalmol Vis Sci. 2012;53: 3584–3591.
4. Narayanan S, Redfern RL, Miller WL, Nichols KK, Mcdermott AM. Dry eye disease and microbial keratitis:
Is there a connection? Ocul Surf. 2013;11: 75–92.
5. Bron AJ, Evans VE, Smith JA. Grading of corneal and conjunctival staining in the context of other dry eye
tests. Cornea. 2003;22: 640–650.
6. Bourcier T, Forgez P, Borderie V, Scheer S, Rostène W, Laroche L. Regulation of human corneal epithelial
cell proliferation and apoptosis by dexamethasone. Invest Ophthalmol Vis Sci. 2000;41: 4133–4141.
7. Petersen A, Carlsson T, Karlsson J, Jonhede S, Zetterberg M. Effects of dexamethasone on human lens
epithelial cells in culture. Mol Vis. 2008;14: 1344–1352.
8. Barba AA, d’Amore M, Chirico S, Lamberti G, Titomanlio G. Swelling of cellulose derivative (HPMC) matrix
systems for drug delivery. Carbohydr Polym. 2009;78: 469–474.
9. Joshi SC. Sol-gel behavior of hydroxypropyl methylcellulose (HPMC) in ionic media including drug release.
Materials. 2011;4: 1861–1905.
10. Siepmann J, Kranz H, Bodmeier R, Peppas NA. HPMC-matrices for controlled drug delivery: A new model
combining diffusion, swelling, and dissolution mechanisms and predicting the release kinetics.
Pharmaceutical Research. 1999; 1748–1756.
11. Nguyen T, Latkany R. Review of hydroxypropyl cellulose ophthalmic inserts for treatment of dry eye. Clin
Ophthalmol. 2011;5: 587–591.

209
GENERAL CONCLUSIONS AND FUTURE PERSPECTIVES
One of the most prominent challenges for researchers in the ophthalmic field is the development
of a drug delivery device that replaces eye drops for sustained delivery of ocular drugs. Despite
many efforts over several decades, the popularity of eye drops has remained high. However, in
recent years, peptide and protein therapeutics have emerged as a new field of ocular therapeutics
with specific requirements during formulation.
In this regard, a novel method for preparing ocular inserts was developed, particularly focussing on
the incorporation of peptides and proteins. Generally, these molecules have to be treated with
necessary care and require specific attention, as they tend to be temperature sensitive, prone to
oxidation and can lose their conformation and activity as the result of external forces applied.
However, many drug carriers based on polymers require heat or shear forces, therefore not
appearing to be suitable for drug carrier development when peptides or proteins are involved. The
objective of the present work was to develop a novel method exploring the possibilities of a protein
loaded polymeric insert.
Is was demonstrated that it is possible to produce ocular inserts loaded with a peptide or protein
without the need for shear forces, air bubble entrapment (which is common when using polymers
in high concentrations) or elevated temperatures. The drug loading occurs through a passive
diffusion process, which was made possible by an initial pre-treatment of the HPMC hydrogel
serving as the drug carrier. Using passive diffusion implies that the drug loading is a temperature
dependent process where mainly the viscosity of the carrier as well as the molecular weight of the
drug play an important role. Due to the nature of the molecules envisioned, the temperature was
fixed at 2 °C.
The dissolution tests showed interesting results. Slow release profiles were measured for most
molecules tested such as sodium fluorescein, lysozyme or FITC-dextrans 10 – 20 kDa. For slow
release to occur, full penetration of the drug in the core of the matrix is a basic requirement as the
slow release profiles are closely linked to the drug loading process. Unsurprisingly, small molecules,
such as sodium fluorescein, can easily be loaded through passive diffusion in the inserts, even in a
single day loading period. Reducing the dimension of the polymeric matrix had a beneficial effect
on the drug loading process. As expected, an increase in molecular weight reduced the level of
success by which molecules can penetrate into the matrix. Loading FITC-dextrans with a molecular
weight of 40 kDa or larger showed high initial drug release amount where slow release was
210
expected. The large size of these molecules caused impregnation of the surface of the insert rather
than reaching the core of the insert matrix due to the high polymeric density. Lowering the final
percentage of HPMC in the drug carrier improved the drug loading and hence release
characteristics to some extent, but passive diffusion clearly poses limitations on the drug loading
behaviour of large molecules. The final percentage HPMC also depends on the characteristics
imposed by researchers for a semisolid ocular device.
The excipients used to build up the insert did not show any harmful effect on SV40-immortalised
human corneal epithelial cells (SV40-HCEC). The results obtained through cell viability
measurements showed no difference between HPMC or HPC hydrogels, which was used as a
reference polymer. The latter is commercially available as a solid insert for the treatment of dry eye
disease in humans. This data was also compared to cell viability measurements performed with
benzalkonium chloride in different concentrations, which is a known cytotoxic compound. Even at
concentrations as low as 0.004% (w/V), benzalkonium chloride appeared lethal to SV40-HCEC.
Excellent stability results were reported for lysozyme loaded inserts. Both rheological and release
measurements yielded good results with no noticeable difference between profiles of inserts
stored between three and twelve months. Inserts stored during one month showed slightly
differing results compared to three or more months of storage. An insufficient completion of the
drug loading process can be held responsible for this observation. Activity measurements showed
a stabilising effect of HPMC and/or glycerol on the stability of lysozyme. After a storage period of
twelve months at a temperature of 2 °C, the activity of lysozyme was measured to be twice as high
as lysozyme stored under the same conditions in purified water or PBS solution.
In vivo studies on rats with dry eye disease did not reveal any improvement over untreated eyes.
However, the low number of animals and the tear collection difficulty associated with the viscous
nature of the inserts, might have had a significant influence on the outcome of the experiment.
Therefore, the true in vivo potential of the inserts remains to be seen.
The ocular inserts described in the work were developed to meet the increasing need of slow
release preparations loaded with peptide or protein therapeutics. Further studies could provide
insights on the diffusion behaviour of drug molecules both during loading and release when
different polymer blends in varying concentrations are used. For instance, the use of thermogelling
systems such as poloxamer polymers in combination with HPMC hydrogels can be useful for lower
211
viscosities during drug loading, hence better penetration of the drug in the core of the insert. But
after placing the insert in the lower fornix, the higher temperature of the conjunctival sac will trigger
a sharp viscosity increase of poloxamer, thereby slowing down drug release.
The influence of pressure or vibration might increase the chance of successfully incorporating large
molecules. By using low pressure chambers or vibration during drug loading, the polymeric density
of the matrix might be temporarily lowered, making passive diffusion of the large molecules more
likely to occur or speed up the drug loading process in case of small molecules, provided that
denaturation of these molecules under the given forces does not occur.
Optimisation of rehydration can also be achieved by altering the shape of the dehydrated polymer
matrix and increasing the contact area with the rehydration solution. Very thin sheets of
dehydrated polymer sandwiched between drug solution can accelerate and improve drug
penetration.
Furthermore, miniaturisation of the insert is absolutely required for patient compliance as well as
from a technological point of view. Inserts weighing approximately 5 mg instead or 82 mg (for the
smallest inserts examined in this research) can be proposed bringing such inserts in the same league
as commercially available products such as Lacrisert®.
If technologically feasible, drug loading could be done by injecting the drug of interest directly in a
laser-burnt cavity in the core of insert. The drug could homogeneously distribute radially starting
from the core of the insert or in case of large molecular weight molecules be trapped in the centre
of the insert, only being released by means of erosion. Even water insoluble drugs might benefit
from this method.
The emergence of 3D-printing might open new technological doors in drug delivery sciences.
Obtaining homogeneous inserts could be made possible by printing the polymer of choice onto and
around the drug of interest, thereby avoiding unnecessary manipulations on the thermolabile drug.


213
SUMMARY
In chapter 1, the major biopharmaceutical aspects related to the anatomical structures and
physiological barriers of the eye are discussed, followed by an overview of possible strategies to
overcome the issues of low ocular availability, typically associated with eye drops. Moreover, the
importance of inserts and the technological role in the treatment of eye diseases with peptides and
proteins it can play, are explored. A number of (eye) diseases that are currently treated with
proteins is summarised. As sterility of ocular inserts is legally required, a brief summary of the most
common sterilisation methods is given.
The main purpose of this research is described in chapter 2. The development of a method to
produce slow release ocular inserts without the need for heat, air bubble entrapment or shear
forces was set as the primary objective in order to incorporate thermolabile molecules.
A proof-of-concept method is described in chapter 3. The inserts were prepared in four phases.
Phase I involved preparation of a highly viscous hydrogel with heat while stirring but devoid of air
bubbles. In phase II, the hydrogel was dehydrated by increasing the temperature to 100 °C. At this
temperature, the polymer chains cannot retain water and the polymer matrix shrinks as water is
lost. Rehydration with a drug solution occurs in phase III. Both drug solution and the partially
dehydrated polymer matrix (cylindrically shaped) are placed in a syringe and stored for six weeks
at a temperature of 2 °C. After this period, the resulting mass is extruded from the syringe in phase
IV after which it can be evaluated for e.g. homogeneity, release kinetics, etc. Factorial design was
used, in order to efficiently conduct different experiments determining the influence of various
parameters. The resulting inserts were soft and mouldable to prevent the eye from tissue damage.
Slow release was obtained, even with a small molecule such as sodium fluorescein. The initial
percentage HPMC was the main influencing factor for a homogeneous distribution of sodium
fluorescein molecules during rehydration, followed by the polymer type (HPMC E10M or E4M) to a
lesser extent.
In chapter 4, the ocular inserts were developed further using a model protein, lysozyme. The same
basic methodology described in chapter 3 was applied with some modifications to the polymer
cylinder geometry and the dehydration temperature. In order to increase the viscosity of the insert
and hence slow down the release rate, HPMC types E10M and K100M were selected. A factorial
design was set up and additionally, the influence of the geometry of the dehydrated polymer

214
cylinder was also taken into account. To accelerate the drug loading process, a hashtag geometry
was cut in the polymer cylinder. This has led to homogeneous results for some formulations of the
experimental design over the course of six weeks. Considering the relative size of lysozyme over
sodium fluorescein, obtaining homogeneous results can be considered an interesting achievement.
In Chapter 5, three molecules with different molecular weight (sodium fluorescein (0.376 kDa),
lysozyme (14.3 kDa) and albumin (66.4 kDa)) were compared. Significant alterations to the method
were made to reduce the time required for rehydration of the polymer matrix. This was achieved
by decreasing the diffusion depth. The modified method is based on preparing the inserts
individually, although the dimensions of a single insert were sized up for practical reasons. Instead
of a drug loading period of six weeks, the inserts were only rehydrated during one or three days. In
case of inserts loaded with sodium fluorescein, no difference concerning release rate was observed
between one or three days of loading. For lysozyme and albumin, the rehydration time did have a
significant effect on the release rate. Incorporating molecules as large as albumin did pose issues
that were hard to overcome. The dense polymeric network of HPMC in the percentages used,
caused an insufficient penetration into the core of the insert, thereby releasing albumin molecules
rapidly as they resided on the surface of the insert. Adding a viscous drug solution instead of a
merely aqueous drug solution did slow down the release rate of albumin from the insert.
In the previous chapter, it became apparent that the molecular weight played an important role in
the penetration of the drug molecule and the drug release profiles. In chapter 6, four FITC-dextrans
were used as model molecules to compare the release rate of molecules with different molecular
weight. Changing the dimensions of the insert did influence the release behaviour of FITC-dextrans,
but the general conclusions remained the same. For FITC-dextrans with a molecular weight over 40
kDa, obtaining sufficient penetration in the core of the insert and slow release profiles, continues
to be a challenge.
In chapter 7, the cytotoxicity and biocompatibility of blank inserts was studied on human corneal
epithelial cells. Cell viability was tested using hydroxypropyl cellulose (HPC) as the reference
polymer along with cells to which no compound was added. Benzalkonium chloride, often used in
commercial eye drops as a preservative, was added as a known cytotoxic compound. Expectedly,
adding benzalkonium chloride immediately led to cell death, even in percentages as low as 0.004%
(w/V). There was no difference observed between HPC and HPMC viscous solutions on cell viability
and in comparison to cells to which no compound was added.

215
Chapter 8 describes the effect of storage, which was evaluated on viscosity, release profiles and the
activity of lysozyme. Storage of inserts loaded with lysozyme during twelve months at a
temperature of 2 °C did not reveal any negative impact both on rheological behaviour nor on
release patterns. However, activity measurements were surprisingly positive: the activity levels
decreased over time but after twelve months, the activity level of lysozyme loaded in the insert was
twice as high compared to lysozyme stored in solution. Protective mechanisms of HPMC and/or
glycerol have been suggested.
In vivo studies on rats with dry eye disease were performed in chapter 9. Treatment of these rats
with inserts loaded with dexamethasone sodium phosphate did not show any improvement over
untreated eyes. The low number of animals and the tear collection difficulty associated with the
viscosity of the inserts, limits the insights this experiment might provide on truly understanding the
potential of the inserts developed.


217
SAMENVATTING
De biofarmaceutische aspecten van het oog worden in hoofdstuk 1 besproken. Deze
biofarmaceutische aspecten worden beïnvloed door de anatomische structuren en fysiologische
barrières van het oog. Verder komen in dit hoofdstuk de mogelijke strategieën aan bod die een
oplossing kunnen bieden voor de lage oculaire beschikbaarheid van oogdruppels. De potentiële rol
die oculaire inserten in de strijd tegen oogziekten kunnen spelen, wordt besproken, voornamelijk
dankzij de toenemende interesse en ontwikkeling van peptiden en proteïnen als therapeutica.
Steriliteit is een wettelijke bepaling voor oogpreparaten; een kort overzicht van de voornaamste
sterilisatietechnieken wordt gegeven.
Het algemene doel van het onderzoek wordt aangegeven in hoofdstuk 2. De ontwikkeling van een
methode die het mogelijk maakt om thermolabiele moleculen zoals peptiden en proteïnen te
verwerken in oculaire inserten met vertraagde afgifte maar zonder het gebruik van hoge
temperaturen, luchtbelvorming of scheerkrachten, werd als primair doel voorop gesteld.
Een eerste voorstel van dergelijke methode wordt uitgebreid beschreven in hoofdstuk 3. De initiële
bereidingsmethode van de inserten kan opgedeeld worden in vier fasen. In de eerste fase wordt
een hoog viskeuze hydrogel bereid, gebruik makend van hitte en mengkrachten ten einde een
homogene, luchtbelvrije hydrogel te bekomen. Deze hydrogel wordt dan in fase II bij een
temperatuur van 100 °C gedehydrateerd tot het gewenste niveau en is cilindervormig. In fase III
wordt de bekomen matrix vervolgens opnieuw gerehydrateerd in een spuit met een waterige
oplossing waarin het gewenste geneesmiddel is opgelost, in dit geval natrium fluoresceïne als
tracer. Dit rehydratatieproces voltrekt zich bij een temperatuur van 2 °C. Na een oplaadperiode van
zes weken, wordt de massa geëxtrudeerd. Factorial design werd toegepast om op efficiënte wijze
een groot aantal experimenten uit te voeren waarbij de invloed van verschillende parameters werd
nagegaan. De geëxtrudeerde inserten waren zacht en flexibel zodat het oogoppervlak niet
beschadigd zou worden. Het vooropgestelde doel van vertraagde afgifte van natrium fluoresceïne
werd gehaald. Voorts bleek het startpercentage HPMC een significante parameter om een
homogene verdeling van natrium fluoresceïne te bekomen, gevolgd door het type polymeer (HPMC
E10M of E4M) hetzij in veel geringere mate.
De initieel ontwikkelde methode wordt in hoofdstuk 4 verder onderzocht. Hierbij werd gebruik
gemaakt van lysozyme als model proteïne. Er werden wijzigingen doorgevoerd aan het
bereidingsproces, waaronder een gewijzigde geometrie van de gedehydrateerde polymeercilinder,
218
alsook een dehydratatie bij hogere temperatuur. De mogelijkheden van vertraagde afgifte werden
eveneens onderzocht door gebruik te maken van intrinsiek viskeuze polymeertypes (E10M en
K100M). Door gebruik te maken van factorial design, werd de invloed van de vorm van de
gedehydrateerde polymeercilinder onderzocht. Hoewel het oplaadproces nog steeds op zes weken
werd gesteld, heeft de wijziging van een kleine molecule als natrium fluoresceïne naar een grotere
molecule zoals lysozyme een belangrijke invloed op het oplaadproces. Om deze oplading mogelijk
te maken, werd de polymeercilinder als een hashtag vorm uitgesneden. Het bekomen van een
homogene massa met lysozyme in plaats van natrium fluoresceïne over eenzelfde tijdspanne, kan
als een gunstig resultaat beschouwd worden.
Vervolgens werden formulaties, opgeladen met drie moleculen met een verschillend moleculair
gewicht (natrium fluoresceïne (0.376 kDa), lysozyme (14.3 kDa) en albumine (66.4 kDa)) bereid en
onderling vergeleken. Het voornaamste doel van het onderzoek dat uitgevoerd werd in hoofdstuk
5, is het verkorten van de oplaadtijd. Door gebruik te maken van drie verschillende moleculen werd
een eerste inzicht verkregen in de beperking van het oplaadproces in verhouding tot het
moleculaire gewicht. Het oplaadproces werd verkort van zes weken tot één of drie dagen. In geval
van inserten opgeladen met natrium fluoresceïne, bleek er geen statistisch significant verschil te
bestaan wat betreft een oplaadtijd van één of drie dagen. Lysozyme daarentegen, ondervond wel
een invloed van deze parameter, waarbij drie dagen oplaadtijd voor een vertraagde afgifte zorgde
als gevolg van een betere penetratie van lysozyme in de kern van het insert. Op het eerste gezicht
bleek het niet mogelijk albumine op te laden in de inserten, wat werd afgeleid uit de
afgifteprofielen. Deze profielen werden gekenmerkt door een snelle afgifte van albumine bij het
eerste meetpunt (10 minuten). Een wijziging van de waterige oplossing met albumine naar een
viskeuze oplossing met deze molecule had een significante invloed op het afgifteprofiel. Toch kan
ook in dit geval niet gesproken worden van vertraagde afgifte op het niveau als deze van natrium
fluoresceïne of lysozyme.
In het vorige hoofdstuk bleek duidelijk dat het moleculair gewicht van de doelwitmolecule een
belangrijke invloed heeft op het oplaadproces en daarmee ook op de wijze van afgifte van de
molecule. In hoofdstuk 6 worden vier FITC-dextranen met een verschillend moleculair gewicht
gebruikt om het gedrag van HPMC inserten opgeladen met deze moleculen te onderzoeken. Er
konden telkens vergelijkbare trends worden waargenomen, ongeacht de dimensies van de
geproduceerde inserten. Echter, om FITC-dextranen op te laden met een moleculair gewicht van

219
meer dan 40 kDa dienen nieuwe technieken ontwikkeld te worden om een voldoende penetratie
in de kern van het insert te bewerkstelligen.
Hoofdstuk 7 beschrijft de cytotoxische eigenschappen en biocompatibiliteit van blanco HPMC
inserten. Dit onderzoek werd uitgevoerd op humane corneale epitheelcellen. Het polymeer
hydroxypropylcellulose (HPC) werd als referentiepolymeer aangewend alsook cellen in
groeimedium zonder toevoeging van een substantie. Benzalkonium chloride werd als gekend
cytotoxisch product gebruikt. De celoverleving in aanwezigheid van blanco HPMC inserten werd
onderling vergeleken. De resultaten voor celoverleving bleken vergelijkbaar voor zowel HPMC als
HPC viskeuze oplossingen tegenover cellen in groeimedium. Dit resultaat was ongeacht de geteste
concentraties aan polymeer. Benzalkonium gaf, geheel in lijn met de verwachting, aanleiding tot
onmiddellijke celdood, zelfs in een zeer lage concentratie van 0,004% (m/V).
De invloed van langdurige bewaring bij 2 °C wordt beschreven in hoofdstuk 8. Deze invloed werd
onderzocht door de evolutie in viscositeit van het insert, de afgifteprofielen en activiteit van
lysozyme over een periode van 12 maanden na te gaan. Er werd geen negatieve invloed
waargenomen wat de viscositeit en het afgifteprofiel betreft voor inserten die bewaard werden
gedurende 12 maanden bij een temperatuur van 2 °C. Wel werd opgemerkt dat, zoals bleek uit de
vorige hoofdstukken, een periode van één maand wellicht niet resulteert in een volledige
penetratie van lysozyme in het insert met de gegeven afmetingen. Vanaf drie maanden werden
geen verschillen gedetecteerd. Daarentegen bleken de activiteitsmetingen wel verrassend positief:
de activiteit van lysozyme daalde in functie van de tijd, maar wanneer lysozyme werd opgeladen in
het insert, werd na 12 maanden een dubbel zo hoge activiteit vastgesteld in vergelijking met
lysozyme in oplossing. In de literatuur worden beschermende mechanismen van HPMC en/of
glycerol ten aanzien van proteïnen beschreven.
In vivo onderzoek uitgevoerd op ratten, lijdend aan droge ogen, wordt behandeld in hoofdstuk 9.
De behandeling van deze ratten met inserten opgeladen met dexamethason natrium fosfaat gaf
geen beduidend verschil in resultaat met ratten die geen behandeling ontvingen. Het kleine aantal
proefdieren, alsook de moeilijkheden van traanstaalname die gepaard gaan met de viskeuze massa
eigen aan een insert, kunnen bijgedragen hebben tot dit resultaat. Het werkelijke potentieel van de
ontwikkelde inserten blijft daarmee grotendeels onverkend.


APPENDIX
In the following part, the linear regression analyses of sodium fluorescein, lysozyme from chicken
egg white and bovine serum albumin are discussed.
1 REGRESSION ANALYSES
The regression analyses were performed using Microsoft Excel® 2010 (Microsoft®, Redmond, USA).
1.1 Sodium fluorescein
A stock solution of sodium fluorescein was prepared in PBS and serially diluted in five-fold and
measured at an experimentally determined wavelength of 484 nm. Every measurement was
performed in duplicate using a UV/VIS spectrophotometer (Genesys 10 UV, Thermo Electron
Corporation, Madison, USA). The linear regression is shown in figure A1.
Fig. A1. Linear regression of sodium fluorescein.
No trend was seen using residual analysis. The residual plot, as shown in figure A2, is considered to
be homoscedastic, which means that the deviations are scattered at random. There is no
correlation between the deviations and the concentration of sodium fluorescein measured.
y = 109,72x - 0,0156R² = 0,9994
0,000
0,200
0,400
0,600
0,800
1,000
1,200
0,000 0,001 0,002 0,003 0,004 0,005 0,006 0,007 0,008 0,009 0,010
Ab
sorb
ance
Concentration (mg/g)

Fig. A2. Residual analysis of sodium fluorescein.
An overview of all regression statistics is given in table A1.
To statistically prove that the slope of the linear regression is not equal to zero, a t-test was
performed. The t-value should exceed the value of the calculated critical t-value. The critical t-value
in this case was calculated as 2.306. The t-value (111.023) is larger than 2.306, which means that
there is a linear relationship between X and Y.
The 95% confidence interval (CI) for analysis of the intercept was calculated. If this CI encloses the
value 0, the linear plot is considered intersecting with the origin (0,0). In this case the value 0 is not
enclosed between the lower and upper 95% CI (-0.029 and -0.002) which implicates that one-point
calibration is not possible.
The correlation coefficient (multiple R) represents the degree of correlation between X and Y. The
closer this number is to 1, the higher the correlation. R square (R²) is a statistical measure which
expresses the percentage of the response variable variation that is explained by the linear model.
Values higher than 0.99 are considered excellent.
Table A1. Overview of regression statistics.
Regression Statistics
Multiple R 0,99968
R Square 0,99935
Adjusted R Square 0,99927
Standard Error 0,00849
Observations 10
-0,015
-0,01
-0,005
0
0,005
0,01
0,015
0,02
0,000 0,001 0,002 0,003 0,004 0,005 0,006 0,007 0,008 0,009 0,010
Res
idu
als
Variable X 1

ANOVA
df SS MS F P-value
Regression 1 0,88883 0,88883 12326,19 4,840E-14
Residual 8 0,00057 7,21097E-05 Total 9 0,88941
Coeff. Standard
Error t Stat P-
value Lower
95% Upper
95% Lower 95,0%
Upper 95,0%
Intercept -0,016 0,006 -2,698 0,027 -0,029 -0,002 -0,029 -0,002
Var X 1 109,723 0,988 111,023 0,000 107,444 112,002 107,444 112,002
1.2 Lysozyme from chicken egg white
A stock solution of lysozyme from chicken egg white was prepared in PBS and serially diluted in five-
fold and measured at an experimentally determined wavelength of 280 nm. Every measurement
was performed in duplicate using a UV/VIS spectrophotometer (Genesys 10 UV, Thermo Electron
Corporation, Madison, USA). The linear regression is shown in figure A3.
Fig. A3. Linear regression of lysozyme.
No trend was observed using residual analysis. The residual plot, as shown in figure A4, is
considered to be homoscedastic, which means that the deviations are scattered at random. There
is no correlation between the deviations and the concentration of lysozyme measured.
y = 2,5005x - 0,0042R² = 0,9998
0,000
0,100
0,200
0,300
0,400
0,500
0,600
0,700
0,800
0,900
1,000
0,000 0,050 0,100 0,150 0,200 0,250 0,300 0,350 0,400 0,450
Ab
sorb
ance
Concentration (mg/g)

Fig. A4. Residual analysis of lysozyme.
An overview of all regression statistics is given in table A2.
To statistically prove that the slope of the linear regression is not equal to zero, a t-test was
performed. The t-value should exceed the value of the calculated critical t-value. The critical t-value
in this case was calculated as 2.306. The t-value (230.134) is larger than 2.306, which means that
there is a linear relationship between X and Y.
The 95% CI for analysis of the intercept was calculated. If this CI encloses the value 0, the linear plot
is considered intersecting with the origin (0,0). In this case the value 0 is enclosed between the
lower and upper 95% CI (-0.010 and 0.002) which implicates that one-point calibration is possible.
The correlation coefficient (multiple R) represents the degree of correlation between X and Y. The
closer this number is to 1, the higher the correlation. R square (R²) is a statistical measure which
expresses the percentage of the response variable variation that is explained by the linear model.
Values higher than 0.99 are considered excellent.
Table A2. Overview of regression statistics.
Regression Statistics
Multiple R 0,99992
R Square 0,99985
Adjusted R Square 0,99983
Standard Error 0,00393
Observations 10
-0,01
-0,008
-0,006
-0,004
-0,002
0
0,002
0,004
0,006
0 0,05 0,1 0,15 0,2 0,25 0,3 0,35 0,4 0,45
Res
idu
als
Variable X 1

ANOVA df SS MS F P-value
Regression 1 0,82007 0,82007 52961,83968 1,42275E-16
Residual 8 0,00012 1,54842E-05 Total 9 0,82019
Coeff. Standard
Error t Stat P-value Lower
95% Upper
95% Lower 95,0%
Upper 95,0%
Intercept -0,004 0,003 -1,557 0,158 -0,010 0,002 -0,010 0,002
Var X 1 2,501 0,011 230,134 0,000 2,475 2,526 2,475 2,526
1.3 Bovine serum albumin
A stock solution of bovine serum albumin was prepared in PBS and serially diluted in five-fold and
measured at an experimentally determined wavelength of 278 nm. Every measurement was
performed in duplicate using a UV/VIS spectrophotometer (Genesys 10 UV, Thermo Electron
Corporation, Madison, USA). The linear regression is shown in figure A5.
Fig. A5. Linear regression of bovine serum albumin.
No trend was noticed using residual analysis. The residual plot, as shown in figure A6, is considered
to be homoscedastic, which means that the deviations are scattered at random. There is no
correlation between the deviations and the concentration of lysozyme measured.
y = 0,6332x + 0,0091R² = 0,9998
0,000
0,100
0,200
0,300
0,400
0,500
0,600
0,700
0,800
0,900
1,000
0,000 0,200 0,400 0,600 0,800 1,000 1,200 1,400 1,600
Ab
sorb
ance
Concentration (mg/g)

Fig. A6. Residual analysis of bovine serum albumin.
An overview of all regression statistics is given in table A3.
To statistically prove that the slope of the linear regression is not equal to zero, a t-test was
performed. The t-value should exceed the value of the calculated critical t-value. The critical t-value
in this case was calculated as 2.306. The t-value (223.536) is larger than 2.306, which means that
there is a linear relationship between X and Y.
The 95% CI for analysis of the intercept was calculated. If this CI encloses the value 0, the linear plot
is considered intersecting with the origin (0,0). In this case the value 0 is not enclosed between the
lower and upper 95% CI (0.002 and 0.016) which implicates that one-point calibration is not
possible.
The correlation coefficient (multiple R) represents the degree of correlation between X and Y. The
closer this number is to 1, the higher the correlation. R square (R²) is a statistical measure which
expresses the percentage of the response variable variation that is explained by the linear model.
Values higher than 0.99 are considered excellent.
Table A3. Overview of regression statistics.
Regression Statistics
Multiple R 0,99992
R Square 0,99984
Adjusted R Square 0,99982
Standard Error 0,00418
Observations 10
-0,01
-0,008
-0,006
-0,004
-0,002
0
0,002
0,004
0,006
0,008
0,00 0,20 0,40 0,60 0,80 1,00 1,20 1,40 1,60
Res
idu
als
Variable X 1

ANOVA df SS MS F P-value
Regression 1 0,87264 0,872647 49968,38 1,8E-16
Residual 8 0,00014 1,75E-05 Total 9 0,87278
Coeff. Standard
Error t Stat P-
value Lower
95% Upper
95% Lower 95,0%
Upper 95,0%
Intercept 0,009 0,003 3,107 0,015 0,002 0,016 0,002 0,016
Var X 1 0,633 0,003 223,536 0,000 0,627 0,640 0,627 0,640