
Gene-Gene Interactions Among CHRNA4, CHRNB2, BDNF, and NTRK2 in Nicotine Dependence
In silico evolution of the hunchback gene indicates redundancy
in cis-regulatory organization and spatial gene expression
Elizaveta A. Zagrijchuk*,§, Marat A. Sabirov*,¶,
David M. Holloway†,|| and Alexander V. Spirov*,‡,**
*Lab Modeling of EvolutionI.M. Sechenov Institute of Evolutionary Physiology & Biochemistry
Russian Academy of Sciences
Thorez Pr. 44, St.-Petersburg, 2194223, Russia†Mathematics Department, British Columbia Institute of Technology
3700 Willingdon Ave. Burnaby, B.C. V5G 3H2, Canada
‡Computer Science and CEWIT, SUNY Stony Brook, Stony Brook
1500 Stony Brook Road
Stony Brook, 11794 NY, USA§[email protected]
¶[email protected]||[email protected]
Received 7 October 2013
Revised 24 January 2014
Accepted 25 January 2014Published 21 March 2014
Biological development depends on the coordinated expression of genes in time and space.
Developmental genes have extensive cis-regulatory regions which control their expression.These regions are organized in a modular manner, with di®erent modules controlling expression
at di®erent times and locations. Both how modularity evolved and what function it serves are
open questions. We present a computational model for the cis-regulation of the hunchback (hb)
gene in the fruit °y (Drosophila). We simulate evolution (using an evolutionary computationapproach from computer science) to ¯nd the optimal cis-regulatory arrangements for ¯tting
experimental hb expression patterns. We ¯nd that the cis-regulatory region tends to readily
evolve modularity. These cis-regulatory modules (CRMs) do not tend to control single spatial
domains, but show a multi-CRM/multi-domain correspondence. We ¯nd that the CRM-domaincorrespondence seen in Drosophila evolves with a high probability in our model, supporting the
biological relevance of the approach. The partial redundancy resulting from multi-CRM control
may confer some biological robustness against corruption of regulatory sequences. The tech-nique developed on hb could readily be applied to other multi-CRM developmental genes.
Keywords: Gene regulation; evolutionary computations; evolution in silico.
Journal of Bioinformatics and Computational BiologyVol. 12, No. 2 (2014) 1441009 (20 pages)#.c Imperial College Press
DOI: 10.1142/S0219720014410091
1441009-1

1. Introduction
The development of biological organisms requires the coordinated expression of
numerous genes. Cis-regulatory regions of genes are critical in maintaining expres-
sion at the right levels, positions and times. Developmental processes such as seg-
mentation of the body or formation of the limbs can involve the coordinated
expression of hundreds of genes. Gene products can act as transcription factors (TFs)
a®ecting the spatial and temporal expression of target genes, giving rise to these gene
regulatory networks (GRNs).1–3
Cis-regulatory organization in the targets can strongly modulate the e®ect of TFs.
Mutual co-activation, co-repression or quenching can depend on the relative prox-
imity of bound TFs. Medium-range TF clustering can support highly synergistic
transcriptional e®ects. At longer range, cis-regulatory modules (CRMs) tend to be
present in many genes. These can be regulatory regions of hundreds to thousands of
base pairs (bp), separated by much longer sequences unrelated to the target gene of
interest. CRMs can operate semi-autonomously, with distinct CRMs controlling
particular temporal or spatial aspects of a gene's expression. This has been well-
documented in a number of cases of body segmentation and neural development in
the fruit °y, Drosophila,4–8 and it appears that many, if not most, developmental
genes are regulated by multiple CRMs.9
How these long range organizational structures evolved and what function they
serve are still very open questions. Increasingly, studies are ¯nding multiple CRMs
which appear to control overlapping or even identical spatio-temporal expression
patterns.10–13 Such redundancy may play a part in developmental robustness, such
that an organism could survive partial corruption of its regulatory sequences (e.g.
Refs. 14 and 15). Or, the redundancy may help to bu®er development in extreme
environments.16 For instance, removal of one redundant CRM has been shown to
produce more developmental defects in a °uctuating temperature environment.17,18
It has also been suggested that synergy between CRMs is used to interpret broad
upstream gradients of TFs.19,20 CRM synergy has been shown during regulation of
the brk21 and slp122 genes in Drosophila, but it is likely that there are a number of
mechanisms for integrating the control of multiple CRMs.
Multiple CRMs may have arisen from duplications [e.g. Ref. 23], such as is
documented for coding regions of genes. This has the potential for disrupting the
gene regulation controlled by the original CRM, but formation of multiple CRMs
also has the potential for adding functionality while retaining the regulatory capa-
bilities of the original CRM.
In this work, we focus on the hunchback (hb) gene in Drosophila, one of the ¯rst
zygotic genes expressed in early body segmentation. This gene has been very well
characterized, from its DNA structure, including the coding regions and several
distinct CRMs, to high resolution data on the spatial and temporal expression of its
mRNA and protein. Recent analysis of the hb regulatory region (RedFly database:
http://red°y.ccr.bu®alo.edu/search.php) indicates numerous CRMs. Four CRMs
E. A. Zagrijchuk et al.
1441009-2
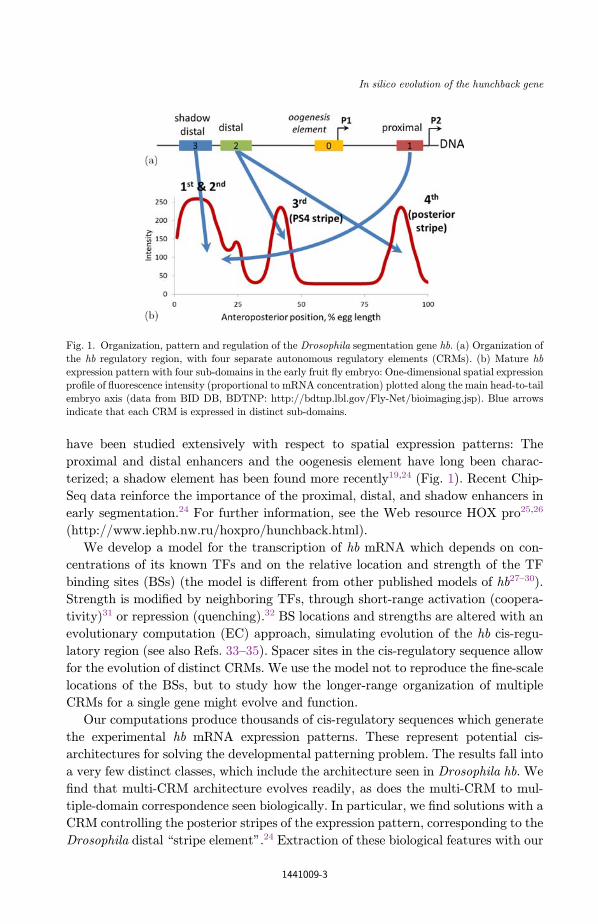
have been studied extensively with respect to spatial expression patterns: The
proximal and distal enhancers and the oogenesis element have long been charac-
terized; a shadow element has been found more recently19,24 (Fig. 1). Recent Chip-
Seq data reinforce the importance of the proximal, distal, and shadow enhancers in
early segmentation.24 For further information, see the Web resource HOX pro25,26
(http://www.iephb.nw.ru/hoxpro/hunchback.html).
We develop a model for the transcription of hb mRNA which depends on con-
centrations of its known TFs and on the relative location and strength of the TF
binding sites (BSs) (the model is di®erent from other published models of hb27–30).
Strength is modi¯ed by neighboring TFs, through short-range activation (coopera-
tivity)31 or repression (quenching).32 BS locations and strengths are altered with an
evolutionary computation (EC) approach, simulating evolution of the hb cis-regu-
latory region (see also Refs. 33–35). Spacer sites in the cis-regulatory sequence allow
for the evolution of distinct CRMs. We use the model not to reproduce the ¯ne-scale
locations of the BSs, but to study how the longer-range organization of multiple
CRMs for a single gene might evolve and function.
Our computations produce thousands of cis-regulatory sequences which generate
the experimental hb mRNA expression patterns. These represent potential cis-
architectures for solving the developmental patterning problem. The results fall into
a very few distinct classes, which include the architecture seen in Drosophila hb. We
¯nd that multi-CRM architecture evolves readily, as does the multi-CRM to mul-
tiple-domain correspondence seen biologically. In particular, we ¯nd solutions with a
CRM controlling the posterior stripes of the expression pattern, corresponding to the
Drosophila distal \stripe element".24 Extraction of these biological features with our
Fig. 1. Organization, pattern and regulation of the Drosophila segmentation gene hb. (a) Organization of
the hb regulatory region, with four separate autonomous regulatory elements (CRMs). (b) Mature hb
expression pattern with four sub-domains in the early fruit °y embryo: One-dimensional spatial expressionpro¯le of °uorescence intensity (proportional to mRNA concentration) plotted along the main head-to-tail
embryo axis (data from BID DB, BDTNP: http://bdtnp.lbl.gov/Fly-Net/bioimaging.jsp). Blue arrows
indicate that each CRM is expressed in distinct sub-domains.
In silico evolution of the hunchback gene
1441009-3

simpli¯ed model indicates that they are likely outcomes of evolution (i.e. represented
by multiple trajectories). We model hb cis-regulation, but the approach should be
generally applicable to spatial gene expression controlled from multiple CRMs.
2. Methods and Approaches
The model starts from a calculation of transcriptional strength, with transcription
rate depending on binding strength and the location of the BSs (Sec. 2.1, Fig. 2).
Transcriptional strength is used as input to a reaction-di®usion model for hb tran-
scription, decay and transport (Sec. 2.2). Solutions of this model (hb mRNA con-
centration versus spatial coordinate) are evaluated against experimental data for hb
patterns (Sec. 2.3, Fig. 3). The TF BS strengths and locations in the hb cis-regulatory
region are altered by simulated evolution (Sec. 2.3, Fig. 4). The presence of nonTF
spacers allows separate CRMs to evolve. Multiple generations of evolution produce
optimized cis-regulatory sequences for ¯tting the hb expression pattern. This gen-
erates a set of potential cis-architectures for hb. Characterizing classes within these,
and understanding where the biological solution falls, sheds light on the evolutionary
constraints of a developmental GRN at the cis-regulatory level. For a broader
overview of this evolution in silico or evolutionary design of GRNs approach, please
see Ref. 33.
(a)
(b)
Fig. 2. Representation of hb regulatory region. (a) Schematic of two of the four hb CRMs, showing BSs for
speci¯c TFs (visualized with Genamics Expression software). (b) Representation of the TFBS (Bcd� B,Cad� C, Ems� E, Gt�G, Hb� H, Kr�K, Kni�N, Tll� T, etc.) as strings of characters, neglecting
distance along the DNA between BSs. Asterisks denote spacers (nonBS DNA) separating CRMs. (c)
Strength of an activating BS is calculated by a 3-step algorithm which sums activation (including co-
activation) and repression (quenching) strengths dependent on neighboring TFs (a short action radius ofthree BSs is used): (1) local activation strength is tallied; (2) neighboring activation is added; (3) neigh-
boring repression is added.
E. A. Zagrijchuk et al.
1441009-4

2.1. Model for hb CRMs
The model incorporates TFs known to regulate hb: the maternal activators Bicoid
(Bcd) and Caudal (Cad); and the gap repressors Krüppel (Kr), Giant (Gt), Knirps
(Kni), Huckebein (Hkb), Tailless (Tll), and the head gap factor Empty spiracles
(Ems). BSs for these factors in the hb cis-regulatory region were coded as shown in
Fig. 2. Each BS is represented by two characters on the string representing the hb
regulatory region: The ¯rst identi¯es the TF (the letter representations of these are
shown in Fig. 2; computations used an octal representation); the second represents
the binding a±nity of the site (set to 1 for all BSs in this study). Transcription
depends on both the TF binding strengths and their relative positions (modeling TF
cross-e®ects). The activation strength of the cis-regulatory region is summed
according to the number and strength of activator sites, the activator concentrations
and co-activation e®ects; as well as the number, strength and quenching radii of the
repressor sites, and the repressor concentrations [Fig. 2(c)]. Activation strength for
each (ith) BS is calculated according to
Si ¼ aiAi þ �i
Xmk¼1
akAk
!�Xl
j¼1
rjRj; ð1Þ
(c)
Fig. 2. (Continued)
In silico evolution of the hunchback gene
1441009-5
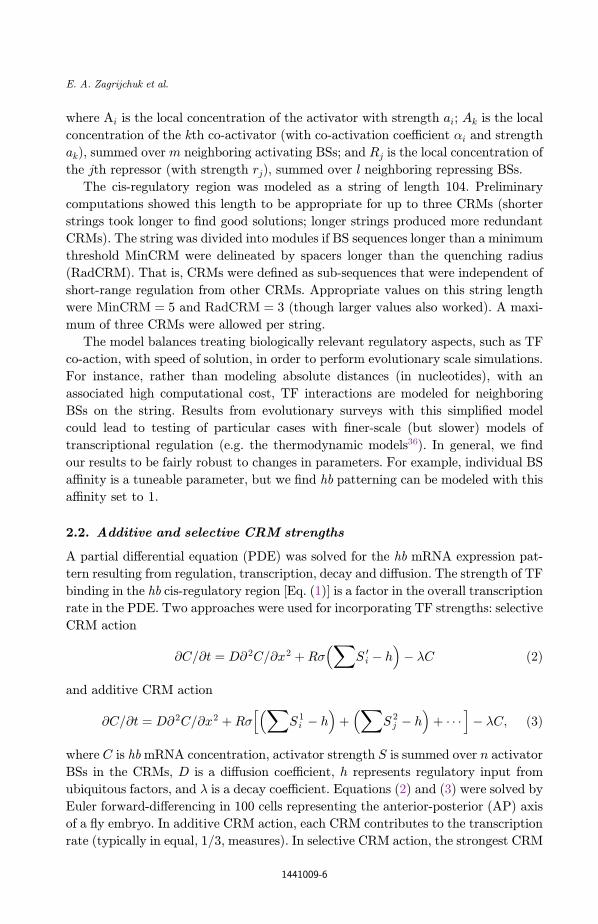
where Ai is the local concentration of the activator with strength ai; Ak is the local
concentration of the kth co-activator (with co-activation coe±cient �i and strength
akÞ, summed over m neighboring activating BSs; and Rj is the local concentration of
the jth repressor (with strength rjÞ, summed over l neighboring repressing BSs.
The cis-regulatory region was modeled as a string of length 104. Preliminary
computations showed this length to be appropriate for up to three CRMs (shorter
strings took longer to ¯nd good solutions; longer strings produced more redundant
CRMs). The string was divided into modules if BS sequences longer than a minimum
threshold MinCRM were delineated by spacers longer than the quenching radius
(RadCRM). That is, CRMs were de¯ned as sub-sequences that were independent of
short-range regulation from other CRMs. Appropriate values on this string length
were MinCRM ¼ 5 and RadCRM ¼ 3 (though larger values also worked). A maxi-
mum of three CRMs were allowed per string.
The model balances treating biologically relevant regulatory aspects, such as TF
co-action, with speed of solution, in order to perform evolutionary scale simulations.
For instance, rather than modeling absolute distances (in nucleotides), with an
associated high computational cost, TF interactions are modeled for neighboring
BSs on the string. Results from evolutionary surveys with this simpli¯ed model
could lead to testing of particular cases with ¯ner-scale (but slower) models of
transcriptional regulation (e.g. the thermodynamic models36). In general, we ¯nd
our results to be fairly robust to changes in parameters. For example, individual BS
a±nity is a tuneable parameter, but we ¯nd hb patterning can be modeled with this
a±nity set to 1.
2.2. Additive and selective CRM strengths
A partial di®erential equation (PDE) was solved for the hb mRNA expression pat-
tern resulting from regulation, transcription, decay and di®usion. The strength of TF
binding in the hb cis-regulatory region [Eq. (1)] is a factor in the overall transcription
rate in the PDE. Two approaches were used for incorporating TF strengths: selective
CRM action
@C=@t ¼ D@ 2C=@x2 þ R�X
S 0i � h
� �� �C ð2Þ
and additive CRM action
@C=@t ¼ D@ 2C=@x2 þR�X
S 1i � h
� �þX
S 2j � h
� �þ � � �
h i� �C; ð3Þ
where C is hbmRNA concentration, activator strength S is summed over n activator
BSs in the CRMs, D is a di®usion coe±cient, h represents regulatory input from
ubiquitous factors, and � is a decay coe±cient. Equations (2) and (3) were solved by
Euler forward-di®erencing in 100 cells representing the anterior-posterior (AP) axis
of a °y embryo. In additive CRM action, each CRM contributes to the transcription
rate (typically in equal, 1/3, measures). In selective CRM action, the strongest CRM
E. A. Zagrijchuk et al.
1441009-6

(in a given cell) is the only one contributing to the transcription rate. �ðxÞ is a
sigmoid regulation-expression function
�ðxÞ ¼ffiffiffiffiffiffiffiffiffiffiffiffiffiffiffiffiffiffiffiffiffiffiffiffiffix2=ð1þ x2Þ
p: ð4Þ
2.3. Evolutionary simulations of the CRMs
A set of initial parameters [for Eqs. (2) and (3)] was chosen for each evolutionary
experiment. Data on the spatial distributions of the TFs [Fig. 3(a)] were used as
input to the model.
Evolution of hb CRMs was simulated with an EC algorithm, shown schematically
in Fig. 4. Random candidate BS sequences comprised \individuals" in the initial
population (36,000–54,000 individuals; Fig. 4, upper left). Individuals were evaluated
according to the closeness of ¯t (squared di®erences) between the C pattern from
Eqs. (2) or (3) and the data [Figs. 3(b) and 3(c); Fig. 4, lower left]. The best-¯tting
33.33% of individuals were retained for the next generation of the evolutionary
(a)
(b) (c)
Fig. 3. Data used for evolutionary model ¯tting. (a) Experimental spatial patterns of hb regulatory TFs in
mid nuclear cleavage (NC) cycle 14, from FlyEx (urchin.spbcas.ru/°yex). Vertical axis: °uorescence in-
tensity, proportional to protein concentration; horizontal axis, AP position, in percent egg length (%EL)�Early, immature (b) and late, mature (c) NC14 AP \target" pro¯le used to test goodness of ¯t for theevolutionary computations (ECs) (derived from averaged hbmRNAdata fromBIDBDTNP [http://bdtnp.
lbl.gov/Fly-Net/bidatlas.jsp]).
In silico evolution of the hunchback gene
1441009-7
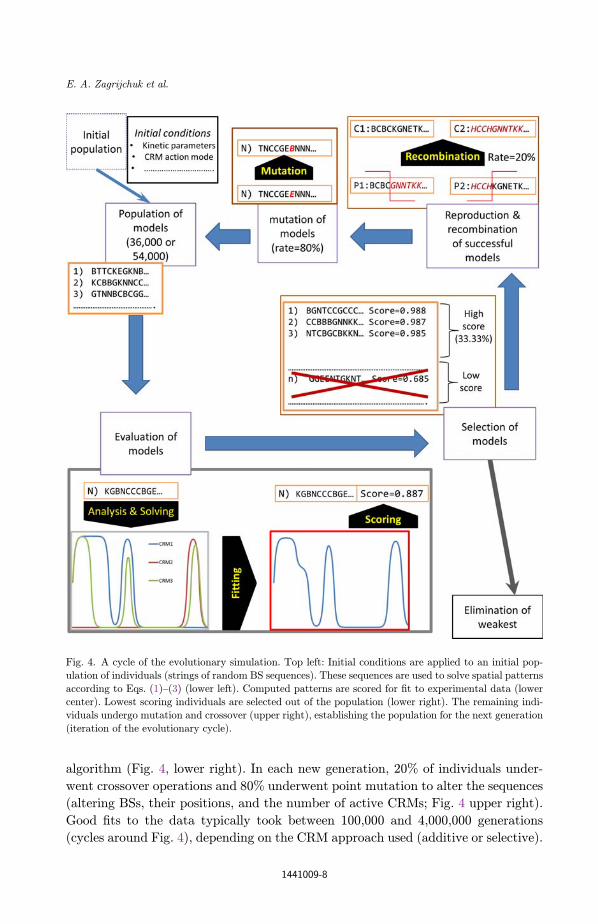
algorithm (Fig. 4, lower right). In each new generation, 20% of individuals under-
went crossover operations and 80% underwent point mutation to alter the sequences
(altering BSs, their positions, and the number of active CRMs; Fig. 4 upper right).
Good ¯ts to the data typically took between 100,000 and 4,000,000 generations
(cycles around Fig. 4), depending on the CRM approach used (additive or selective).
Fig. 4. A cycle of the evolutionary simulation. Top left: Initial conditions are applied to an initial pop-
ulation of individuals (strings of random BS sequences). These sequences are used to solve spatial patterns
according to Eqs. (1)–(3) (lower left). Computed patterns are scored for ¯t to experimental data (lowercenter). Lowest scoring individuals are selected out of the population (lower right). The remaining indi-
viduals undergo mutation and crossover (upper right), establishing the population for the next generation
(iteration of the evolutionary cycle).
E. A. Zagrijchuk et al.
1441009-8

Goodness of ¯t was evaluated over the entire AP axis, divided into four expression
sub-domains observable in the mRNA data Figs. 3(b) and 3(c): domain 1, the broad
far-anterior peak; sub-domain 2, a ¯ne stripe or shoulder just posterior of domain 1;
domain 3, the mid-embryo PS4 (parasegment 4) stripe; and domain 4, the posterior
peak.
2.4. Model variations
We tested several variations on the model, including: (i) additive versus selective
CRM action (see Sec. 2.2); (ii) whether or not hb self-e®ects were allowed (whether
Hb protein acted as a self-TF or not); (iii) whether mature or immature posterior hb
domains were ¯t [Figs. 3(b) and 3(c); (iv) whether Hkb, Tll or Ems BSs were in-
cluded in the model, and if Ems BSs were present, whether they acted as activators
or repressors. On the last item, initial results indicated that Hkb and Tll are not
crucial (especially with selective CRM action), while Ems and whether it acts as an
activator or repressor is important for ¯tting immature [Fig. 3(b)] or mature hb
patterns [Fig. 3(c)], respectively.
3. Results
3.1. Additive CRM action
With additive CRM action, all CRMs in the hb regulatory region actively contribute
to the transcription rate. Biologically, this corresponds to all CRMs being available
for TF binding and either interacting directly with the promoter (region of the
transcription start site) or cooperating with other CRMs. We found this mode of
regulation to have the richest variety of biologically interesting features.
Of special interest was that for particular ranges of the R, h and � parameters,
[Eqs. (2) and (3); especially R ¼ ½79; 109�, h ¼ ½0:1; 1:1� and � ¼ 1] solutions com-
monly included a CRM controlling the PS4 and posterior stripes [Fig. 5(a), CRM2;
Fig. 5(b), CRM3).
This is analogous to the biological \stripe element"24 and indicates that the
evolutionary processes used in our model can e±ciently capture the evolutionary
trajectories of real genes.
3.1.1. Dependence on overall regulation strength, R
How is the overall level of expression controlled when there are redundant CRMs, i.e.
with similar expression patterns? For example, if one is deleted (as in a mutant), does
the overall level of expression go down (as is seen with Kr and Kni mutants37), or is it
compensated?
In the model, the overall expression level depends on the R parameter. To test the
e®ect of expression level on CRM number, we ran a series of evolutionary simulations
varying R from 59 to 109, with �ð¼ 1) and hð¼ 1:1) held constant. Above R ¼ 109,
no solutions could be found. Over this range of R's, we see ¯ve dominant classes of
In silico evolution of the hunchback gene
1441009-9
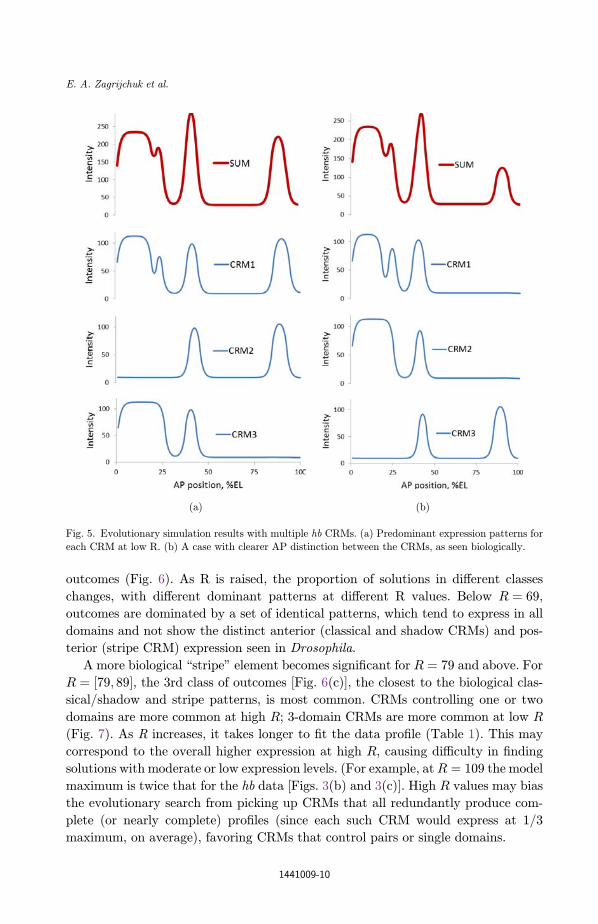
outcomes (Fig. 6). As R is raised, the proportion of solutions in di®erent classes
changes, with di®erent dominant patterns at di®erent R values. Below R ¼ 69,
outcomes are dominated by a set of identical patterns, which tend to express in all
domains and not show the distinct anterior (classical and shadow CRMs) and pos-
terior (stripe CRM) expression seen in Drosophila.
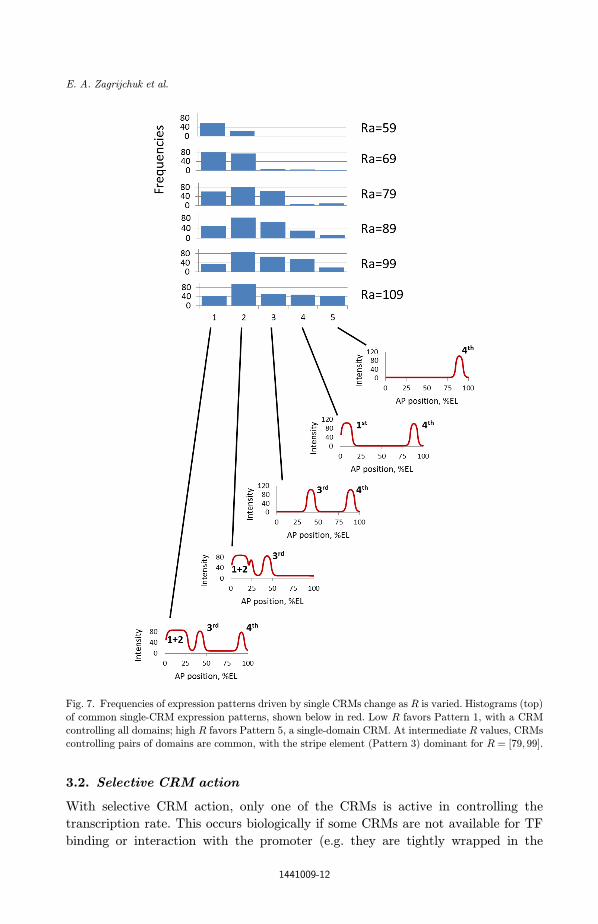
A more biological \stripe" element becomes signi¯cant for R ¼ 79 and above. For
R ¼ ½79; 89�, the 3rd class of outcomes [Fig. 6(c)], the closest to the biological clas-
sical/shadow and stripe patterns, is most common. CRMs controlling one or two
domains are more common at high R; 3-domain CRMs are more common at low R
(Fig. 7). As R increases, it takes longer to ¯t the data pro¯le (Table 1). This may
correspond to the overall higher expression at high R, causing di±culty in ¯nding
solutions with moderate or low expression levels. (For example, atR ¼ 109 the model
maximum is twice that for the hb data [Figs. 3(b) and 3(c)]. High R values may bias
the evolutionary search from picking up CRMs that all redundantly produce com-
plete (or nearly complete) pro¯les (since each such CRM would express at 1/3
maximum, on average), favoring CRMs that control pairs or single domains.
(a) (b)
Fig. 5. Evolutionary simulation results with multiple hb CRMs. (a) Predominant expression patterns for
each CRM at low R. (b) A case with clearer AP distinction between the CRMs, as seen biologically.
E. A. Zagrijchuk et al.
1441009-10

Fig. 6. Frequencies of the main classes of successful solutions change as R is varied. Histograms (top) of
common dominant classes, illustrated in A-E. As R is increased, solutions shift from completely redundant(Class A, all three CRMs each control all domains), to increasing diversity (with a prevalence of CRMs
controlling pairs of domains), and the emergence of single-domain CRMs (Class D).
In silico evolution of the hunchback gene
1441009-11
3.2. Selective CRM action
With selective CRM action, only one of the CRMs is active in controlling the
transcription rate. This occurs biologically if some CRMs are not available for TF
binding or interaction with the promoter (e.g. they are tightly wrapped in the
Fig. 7. Frequencies of expression patterns driven by single CRMs change as R is varied. Histograms (top)
of common single-CRM expression patterns, shown below in red. Low R favors Pattern 1, with a CRM
controlling all domains; high R favors Pattern 5, a single-domain CRM. At intermediate R values, CRMscontrolling pairs of domains are common, with the stripe element (Pattern 3) dominant for R ¼ ½79; 99�.
E. A. Zagrijchuk et al.
1441009-12

histone), or if there is competition between CRMs for interaction with the promoter
(e.g. there is some steric hindrance for multiple CRM interaction with the promoter.
We computed 860 runs with a basic selective CRM action model: ¯tting to early
(immature) posterior hb; no hb self-activation; eight input TFs (Bcd, Cad, Tll, Ems,
Kr, Gt, Kni, Hkb); and Ems as a repressor. All runs successfully ¯t the data. Other
variations with selective CRM action had similar outcomes.
Most successful solutions had either 2 or 3 CRMs (with roughly equal occurrence).
Single CRM solutions producing all hb domains were much more rare (3–4%). Cases
with one-to-one domain-CRM correspondence were very rare: 3–4% of solutions
showed a single CRM controlling domain 1; and there were only two cases of a single
CRM controlling domain 3 (see e.g. Sec. 3.1, R ¼ 109). The two CRM solutions tend
to show a recurrent motif, with one CRM expressing in the anterior domains 1/2/3
(see e.g. the classical and shadow enhancers25Þ and the other CRM expressing in
domains 1/3/4 [Fig. 8(a)]. With three CRMs there is more diversity of outcomes,
(a) (b)
Fig. 8. Selective CRM action. Common outcomes for hb expression controlled by (a) two CRMs, and (b)
three CRMs.
In silico evolution of the hunchback gene
1441009-13

including a common motif in which two of the CRMs control domains 1/3, and the
other CRM can be expressed in all domains [Fig. 8(B)].
Tests with other versions of the model indicate that the simpler the model (less
TF BSs), the faster the evolutionary search (Table 2). Selective CRM action pro-
duces substantially faster computational searches than additive action (see
e.g. Tables 1 and 2), but the results are less relevant to the Drosophila CRM-domain
relation.
4. Discussion
Nearly all simulations, with all tested versions, returned successful ¯ts to the data
(with a very few exceptions). Most good solutions belonged to one or a few dominant
classes with respect to CRM-domain correspondence.
For additive CRM action, all three allowed CRMs usually evolved. We initially
thought this might re°ect the particular R (production rate) and � (degradation
rate) parameters chosen: R and � were initially set such that each CRM produced
about 1/3 of the total required hb level. But we found that even with doubled R, the
solutions still tended to have multiple CRMs, indicating a more general e®ect. For
selective CRM action, we see outcomes with one, two, or three CRMs. Cases with
one-to-one domain-CRM correspondence were generally rare: A few percent of
solutions showed a single CRM controlling PS4 (domain 3) or the posterior domain
(4) only. At some parameter limits (e.g. high RÞ, we observed an increase in the
Table 2. E±cacy of evolutionary searches with selective CRM action(mean number of solutions tested before success).
Evolutionary test E±cacy
No hb self-activation, 7 TFs, repressive Ems 80; 171:5� 34; 969:3
No hb self-activation, 8 TFs, repressive Ems 146; 365:8� 45; 401:6
No hb self-activation, 9 TFs, repressive Ems 238; 863:7� 65; 308:7
No hb self-activation, 9 TFs, activating Ems 1; 451; 041:0� 218; 555:9hb self-activation, 9 TFs, repressive Ems 1; 208; 207:8� 141; 947:8
Table 1. E±cacy of evolutionary
search for additive CRM action(mean number of solutions tested
before success).
R E±cacy
59 647; 085:7� 67; 360:3
69 1; 346; 888:7� 170; 803:0
79 1; 737; 514:3� 212; 023:889 1; 877; 451:8� 229; 023:4
99 2; 059; 735:7� 249; 811:2
E. A. Zagrijchuk et al.
1441009-14

formation of one-to-one correspondence. But in general each CRM tended to con-
tribute to several domains, with each domain controlled by multiple CRMs.
4.1. Stripe element evolution is robust
The main biological conclusion from the evolution in silico is that the stripe element,
i.e. a CRM driving expression in the PS4 and posterior peaks (domains 3 and 4), can
readily evolve. This was seen in particular for the basic model with additive CRM
action, over a broad range of parameters. In light of the simplicity of the gene
regulation and the evolutionary processes in our model, this suggests that stripe
element evolution is quite robust and reproducible, i.e. it is represented by many
evolutionary trajectories and is relatively insensitive to the details of the evolu-
tionary process. We plan to test the generality of these ¯ndings on other types of
models for multiple CRM control in other genes.38–40
4.2. Redundant CRMs evolve readily
Across the di®erent versions of our evolutionary simulations, partial or even nearly
complete redundancy of CRMs (multiple CRMs having the same expression pat-
terns) appears to be common. For instance, at R ¼ ½39; 59� (h ¼ 0:1; 1:1) the domi-
nant case displayed nearly complete redundancy of CRM-domain correspondence,
with all three CRMs controlling complete or nearly-complete pattern [Fig. 6(A)]; and
several percent of the cases have two redundant CRMs controlling anterior pat-
terning [domains 1/2/3; Fig. 5(b)].
R ¼ 69ðh ¼ 0:1; 1:1Þ was the richest case for redundant solutions, with more than
2/3 of all solutions having either two or three CRMs controlling complete or nearly-
complete patterns, and about 1/10 of solutions having two CRMs controlling an-
terior (domain 1/2/3) patterning.
Redundancy appears lower at higher R. For R ¼ ½79; 99�ðh ¼ 0:1; 1:1Þ we ob-
served only a few percent of solutions with two CRMs redundantly controlling
domains 1/2/3. At R ¼ 99, we see about 5% of cases with two (not three) redundant
CRMs controlling a complete or nearly-complete pattern.
Overall, the simulations indicate that evolution of multiple CRM control of the
domains occurs readily, and that the CRM-domain correspondence can be repeated
by multiple CRMs. We have focused on the three Drosophila CRMs studied with
respect to segmentation patterning. The RedFly database (http://red°y.ccr.bu®alo.
edu/search.php) predicts many more hb CRMs (though with uncharacterized func-
tionality) ��� our simulations indicate that such high redundancy is readily evolv-
able. This redundancy may contribute to robustness by making particular sequences
nonessential for proper gene expression. Even with the simple model for the evolution
and regulation of hb, the redundancy of regulatory elements is common. This likely
re°ects a general evolutionary trend which could be observed across developmental
genes.
In silico evolution of the hunchback gene
1441009-15

4.3. TFs active in the stripe element
The TFs found in our computed \stripe element" CRMs correspond to the TFBSs
found experimentally. We generally ¯nd the canonical gap genes (Gt, Kni, Kr)
strongly represented24,41 as repressors, and maternal factors Bcd and Cad well
represented as activators.41,42 In many solutions, Hkb appears as a repressor, Tll as
an activator, and Hb appears as a self-e®ector; these factors have all been reported in
the stripe element.24,41
TF binding in the model stripe element suggests that a minimum of two activa-
tors is needed. We observe that the activators tend to pair or form small clusters ���short-range homotypic clusters which are related to the cooperative interaction of
the sites.43 Repressor binding agrees with experimental conclusions, that domain 3
(PS4) is repressed by Kr and domain 4 (posterior peak) is repressed by Kni and Gt.24
If Hb binding is allowed in the computations, it tends to be seen in good solutions,
corroborating the self-binding observed experimentally.44,45
In general, TF cooperativity and co-action is an active area of discussion in
Drosophila segmentation. We hope that our computed CRMs might aid in guiding
experimental elucidation of these e®ects.
4.4. Conclusion
(i) Partial or even nearly-complete redundancy of CRMs, one of the key features of
the regulatory design for many developmental genes, is typical and common
across the various evolutionary simulations presented here for hb, one of the
most studied Drosophila segmentation genes.
(ii) The key CRM responsible for mature PS4 and posterior domain formation (the
\stripe element") evolves easily and reproducibly at a broad range of model
parameters. CRMs controlling pairs of domains have also been reported in the
pair-rule class of segmentation genes,46 with similar design to the hb stripe
element.24 This suggests a general applicability of our evolutionary approach to
study the cis-architecture of developmental genes.
(iii) Our computations suggest that the evolution of GRNs with one-to-one CRM-
domain correspondence is very rare. If evolution of multiple CRMs is possible
(as with hb, biologically), it is much more likely to have domains which depend
on several CRMs (with each CRM contributing to multiple domains).
Acknowledgments
The authors would like to thank the anonymous reviewers for their helpful and
constructive comments that greatly contributed to improving the ¯nal version of the
paper. This work is supported by U.S. NIH grant R01-GM072022 and The Russian
Foundation for Basic Research grant 13-04-02137.
E. A. Zagrijchuk et al.
1441009-16

References
1. Levine M, Davidson EH, Gene regulatory networks for development, Proc Natl Acad Sci102:4936–4942, 2005.
2. Erwin DH, Davidson EH, The evolution of hierarchical gene regulatory networks, NatureRev Gen 10:141–148, 2009.
3. Davidson EH, Emerging properties of animal gene regulatory networks, Nature 468:911–920, 2010.
4. Kuzin A, Kundu M, Ekatomatis A, Brody T, Odenwald WF, Conserved sequence blockclustering and °anking inter-cluster °exibility delineate enhancers that regulate ner¯n-1expression during Drosophila CNS development, Gene Expr Patterns 9:65–72, 2009.
5. Fujioka M, Jaynes JB, Regulation of a duplicated locus: Drosophila sloppy paired isreplete with functionally overlapping enhancers, Dev Biol 362:309–319, 2012.
6. Kuzin A, Kundu M, Ross J, Koizumi K, Brody T et al., The cis-regulatory dynamics ofthe Drosophila CNS determinant castor are controlled by multiple sub-pattern enhancers,Gene Expr Patterns 12:261–272, 2012.
7. Bejerano G, Siepel AC, Kent WJ, Haussler D, Computational screening of conservedgenomic DNA in search of functional noncoding elements, Nat Methods 2:535–545, 2005.
8. Kundu M, Kuzin A, Lin T-Y, Lee C-H, Brody T et al., Cis-regulatory complexity within alarge non-coding region in the Drosophila genome, PLoS ONE 8:e60137, 2013.
9. Hong JW, Hendrix DA, Levine MS, Shadow enhancers as a source of evolutionary nov-elty, Science 321:1314, 2008.
10. Werner T, Hammer A, Wahlbuhl M, Bosl MR, Wegner M, Multiple conserved regulatoryelements with overlapping functions determine Sox10 expression in mouse embryogenesis,Nucl Acids Res 35:6526–6538, 2007.
11. Zeitlinger J, Zinzen RP, Stark A, Kellis M, Zhang H, Young RA, Levine M, Whole-genome ChIP-chip analysis of Dorsal, Twist, and Snail suggests integration of diversepatterning processes in the Drosophila embryo, Genes Dev 21:385–390, 2007.
12. Jeong Y, El-Jaick K, Roessler E, Muenke M, Epstein DJ, A functional screen for sonichedgehog regulatory elements across a 1Mb interval identi¯es long-range ventral fore-brain enhancers, Development 133:761–772, 2006.
13. Spitz F, Furlong EM, Transcription factors: From enhancer binding to developmentalcontrol, Nat Rev Genet 13:613–626, 2012.
14. Frankel N, Erezyilmaz DF, McGregor AP, Wang S, Payre F and Stern DL, Phenotypicrobustness conferred by apparently redundant transcriptional enhancers, Nature 466(7305):490–493, 2010.
15. Cretekos W, Eric DG et al., Regulatory divergence modi¯es limb length between mam-mals, Genes Dev 22:141–151, 2008.
16. Barolo S, Shadow enhancers: Frequently asked questions about distributed cis-regulatoryinformation and enhancer redundancy, Bioessays 34:135–141, 2012.
17. Frankel N, Davis GK, Vargas D, Wang S, Payre F, Stern DL, Phenotypic robustnessconferred by apparently redundant transcriptional enhancers, Nature 466:490–493, 2010.
18. Perry MW, Boettiger AN, Bothma JP, Levine M, Shadow enhancers foster robustness ofDrosophila gastrulation, Curr Biol 20:1562–1567, 2010.
19. Perry MW, Boettiger AN, Levine M, Multiple enhancers ensure precision of gap gene-expression patterns in the Drosophila embryo, Proc Natl Acad Sci USA 108:13570–13575, 2011.
20. Garnett AT, Square TA, Medeiros DM, BMP, Wnt and FGF signals are integratedthrough evolutionarily conserved enhancers to achieve robust expression of Pax3 and Zicgenes at the zebra¯sh neural plate border, Development 139:4220–4231, 2012.
In silico evolution of the hunchback gene
1441009-17

21. Yao L-C, Phin S, Cho J, Rushlow C, Arora K, Warrior R, Multiple modular promoterelements drive graded brinker expression in response to the Dpp morphogen gradient,Development 135:2183–2192, 2008.
22. Prazak L, Fujioka M, Gergen JP, Non-additive interactions involving two distinct ele-ments mediate sloppy-paired regulation by pair-rule transcription factors, Dev Biol344:1048–1059, 2010.
23. Jeong S, Rebeiz M, Andolfatto P, Werner T, True J, Carroll SB, The evolution of generegulation underlies a morphological di®erence between twoDrosophila sister species, Cell132:783–793, 2008.
24. Perry MW, Bothma JP, Luu RD, Levine M, Precision of Hunchback expression in theDrosophila embryo, Curr Biol 22:1–6, 2012.
25. Spirov AV, Bowler T, Reinitz J, HOX Pro: A specialized data base for clusters andnetworks of homeobox genes, Nucl Acids Res 28:337–340, 2000.
26. Spirov AV, Borovsky M, Spirova OA, HOX Pro DB: The functional genomics of hoxensembles, Nucl Acids Res 30:351–353, 2002.
27. Papatsenko D, Levine MS, Dual regulation by the Hunchback gradient in the Drosophilaembryo, PNAS 105(8):2901–2906, 2008.
28. Manu SS, Spirov AV, Gursky VV, Janssens H et al., Canalization of gene expression inthe Drosophila blastoderm by gap gene cross regulation, PLoS Biol 7(3):e1000049, 2009.
29. Papatsenko D, Levine M, The Drosophila gap gene network is composed of two paralleltoggle switches, PLoS ONE 6(7):e21145, 2011.
30. Holloway DM, Lopes FJP, da Fontoura Costa L, Travençolo B, Golyandina N et al.,Gene expression noise in spatial patterning: Hunchback promoter structure a®ects noiseamplitude and distribution in Drosophila segmentation, PLoS Comput Biol 7(2):e1001069, 2011.
31. Ma XG, Yuan D, Diepold K, Scarborough T, Ma J, The Drosophila morphogeneticprotein Bicoid binds DNA cooperatively, Development 122:1195–1206, 1996.
32. Hewitt GF, Strunk B, Margulies C, Priputin T, Wang XD, Amey R, Pabst B, Kosman D,Reinitz J, Arnosti DN, Transcriptional repression by the Drosophila giant protein: Ciselement positioning provides an alternative means of interpreting an e®ector gradient,Development 126:1201–1210, 1999.
33. Spirov A, Holloway D, Using evolutionary computations to understand the design andevolution of gene and cell regulatory networks, Methods 62:39–55, 2013.
34. Spirov AV, Holloway DM, New approaches to designing genes by evolution in the com-puter, in Real-World Applications of Genetic Algorithms, Roeva O (ed.), InTech,pp. 235–260, 2012, DOI: 10.5772/36817. Available from: http://www.intechopen.com/books/real-world-applications-of-genetic-algorithms/new-approaches-to-designing-genes-by-evolution-in-the-computer
35. Spirov AV, Holloway DM, Evolution in silico of genes with multiple regulatory moduleson the example of the Drosophila segmentation gene hunchback, IEEE Sympos Compu-tational Intelligence and Computational Biology, CIBCB 2012, pp. 244–251, 2012.
36. Dresch JM, Liu X, Arnosti DN and Ay A, Thermodynamic modeling of transcription:Sensitivity analysis di®erentiates biological mechanism from mathematical model-induced e®ects, BMC Syst Biol 4:142, 2010.
37. Surkova S, Golubkova E, Manu, Panok L, Mamon L, Reinitz J, Samsonova M, Quan-titative dynamics and increased variability of segmentation gene expression in the Dro-sophila Krüppel and knirps mutants, Dev Biol 376:99–112, 2013.
38. Janssens H, Hou S, Jaeger J, Kim AR, Myasnikova E, Sharp D, Reinitz J, Quantitativeand predictive model of transcriptional control of the Drosophila melanogaster evenskipped gene, Nature Gen 38:1159–1165, 2006.
E. A. Zagrijchuk et al.
1441009-18

39. Martinez CA, Barr K, Kim AR, Reinitz J, A synthetic biology approach to the devel-opment of transcriptional regulatory models and custom enhancer design, Methods62:91–98, 2013.
40. He X, Samee MAH, Blatti C, Sinha S, Thermodynamics-based models of transcriptionalregulation by enhancers: The roles of synergistic activation, cooperative binding andshort-range repression, PLoS Comput Biol 6:e1000935, 2010.
41. Li XY, MacArthur S, Bourgon R, Nix D, Pollard DA, Iyer VN, Hechmer A, Simirenko L,Stapleton M, Luengo Hendriks CL et al., Transcription factors bind thousands of activeand inactive regions in the Drosophila blastoderm, PLoS Biol 6:e27, 2008.
42. Berman BP, Nibu Y, Pfei®er BD, Tomancak P, Celniker SE, Levine M, Rubin GM, EisenMB, Exploiting transcription factor binding site clustering to identify cis-regulatorymodules involved in pattern formation in the Drosophila genome, Proc Natl Acad SciUSA 99(2):757–762, 2002.
43. He X, Duque TS, Sinha S, Evolutionary origins of transcription factor binding siteclusters, Mol Biol Evol 29:1059–1070, 2012.
44. Treisman J, Desplan C, The products of the Drosophila gap genes Hunchback andkrüppel bind to the Hunchback promoters, Nature 341:335–337, 1989.
45. Margolis JS, Borowsky ML, Steingrimsson E, Shim GW, Lengyel JA et al. Posterior stripeexpression of Hunchback is driven from 2 promoters by a common enhancer element,Development 121:3067–3077, 1995.
46. Schroeder MD, Greer C, Gaul U, How to make stripes: Deciphering the transition fromnon-periodic to periodic patterns in Drosophila segmentation, Development 138:3067–3078, 2011.
Elizaveta A. Zagrijchuk was educated at Herzen State Pedagogical University,
Saint-Petersburg (Russia). Her main ¯eld of expertise is environmental engineering.
Her ¯eld of interests include genetic algorithms, evolutionary computation, computer
modeling in biology, systems biology.
Marat A. Sabirov M.Sc., Junior Researcher, is interested in population dynamics
modeling. After receiving his grade of specialist of Ecology in Saint-Petersburg State
University he ¯nished M.Sc. Program \Biodiversity and Nature Conservation" in the
University. Within a framework of his Ph.D. project in Sechenov Institute of Evo-
lutionary Physiology and Biochemistry (Saint-Petersburg) he is developing a data-
driven model of population dynamics. Field of interests also includes evolutionary
optimization, arti¯cial life and arti¯cial intelligence.
David M. Holloway's research is on how the biochemical and gene regulatory
networks that determine spatial positioning of cell types stay robust to external
variability (in temperature, maternal dosage, size, for example) and to the noise
intrinsic to chemical reactions. He is also interested in the interplay between
chemical patterning and tissue growth, particularly in plant morphogenesis.
In silico evolution of the hunchback gene
1441009-19

Holloway's work is supported by NSERC (Canada) and the NIH (US). He has a Ph.
D. in physical chemistry from the University of British Columbia (1995) and has
been in the Mathematics Department at the B.C. Institute of Technology since 1998.
Alexander V. Spirov is a research assistant professor in the Department of
Computer Science at the State University of New York at Stony Brook and a senior
researcher in the Sechenov Institute of Evolutionary Physiology and Biochemistry,
St.-Petersburg, Russia. Dr. Spirov received M.S. degree in molecular biology in 1978
from the St.-Petersburg State University, St.-Petersburg, Russia. He received his
Ph.D. in the area of biometrics in 1987 from the Irkutsk State University, Irkutsk,
Russia. His research interests are in computational biology and bioinformatics, Web
databases, data mining, evolutionary computations, animates, arti¯cial life and
evolutionary biology.
E. A. Zagrijchuk et al.
1441009-20
Copyright © 2022 FDOKUMEN