Phosphorylation releases constraints to domain motion in ERK2
Biochimica et Biophysica Acta 1837 (2014) 811–824
Contents lists available at ScienceDirect
Biochimica et Biophysica Acta
j ourna l homepage: www.e lsev ie r .com/ locate /bbab io
Single-molecule in vivo imaging of bacterial respiratory complexesindicates delocalized oxidative phosphorylation
Isabel Llorente-Garcia a,b,1, Tchern Lenn c,d,1, Heiko Erhardt e,1, Oliver L. Harriman a, Lu-Ning Liu c,2,Alex Robson a, Sheng-Wen Chiu a, Sarah Matthews a, Nicky J. Willis c, Christopher D. Bray c, Sang-Hyuk Lee d,Jae Yen Shin d, Carlos Bustamante d, Jan Liphardt d, Thorsten Friedrich e,Conrad W. Mullineaux c, Mark C. Leake f,⁎a Clarendon Laboratory, University of Oxford, Oxford OX1 3PU, UKb Department of Physics and Astronomy, University College London, Gower St., London WC1E 6BT, UKc School of Biological and Chemical Sciences, Queen Mary University of London, London E1 4NS, UKd QB3 University of California, Berkeley CA94720, USAe Institut für Biochemie 79104 Freiburg, Germanyf Biological Physical Sciences Institute (BPSI), University of York, York YO10 5DD, UK
⁎ Corresponding author at: Biological Physical ScienceYork, York, YO10 5DD, UK. Tel.: +44 1904 320000; fax: +
E-mail address: [email protected] (M.C. Leake).1 Contributed equally to this work.2 Institute of Integrative Biology, University of Liverpoo
http://dx.doi.org/10.1016/j.bbabio.2014.01.0200005-2728/© 2014 The Authors. Published by Elsevier B.V
a b s t r a c t
a r t i c l e i n f oArticle history:Received 8 November 2013Received in revised form 22 January 2014Accepted 30 January 2014Available online 7 February 2014
Keywords:Cytoplasmic membraneCo-localization analysisFluorescence microscopyFluorescent proteinOxidative phosphorylationSingle-molecule biophysics
Chemiosmotic energy coupling through oxidative phosphorylation (OXPHOS) is crucial to life, requiring coordi-nated enzymes whose membrane organization and dynamics are poorly understood. We quantitatively explorelocalization, stoichiometry, and dynamics of key OXPHOS complexes, functionally fluorescent protein-tagged, inEscherichia coli using low-angle fluorescence and superresolution microscopy, applying single-molecule analysisand novel nanoscale co-localization measurements. Mobile 100–200 nmmembrane domains containing tens tohundreds of complexes are indicated. Central to our results is that domains of different functional OXPHOS com-plexes do not co-localize, but ubiquinone diffusion in the membrane is rapid and long-range, consistent with amobile carrier shuttling electrons between islands of different complexes. Our results categorically demonstratethat electron transport and proton circuitry in this model bacterium are spatially delocalized over the cell mem-brane, in stark contrast to mitochondrial bioenergetic supercomplexes. Different organisms use radically differ-ent strategies for OXPHOS membrane organization, likely depending on the stability of their environment.
© 2014 The Authors. Published by Elsevier B.V. This is an open access article under the CC BY license (http://creativecommons.org/licenses/by/3.0/).
1. Introduction
Adenosine triphosphate (ATP) is the universal cellular energycurrency. The energy released upon hydrolysis of ATP powers many bi-ological processes. Most organisms meet ATP demands by oxidativephosphorylation (OXPHOS), a multi-enzyme process spanning all do-mains of life using nutrient molecule catabolism. In OXPHOS, electron-transfer reactions between membrane-associated enzymes are coupledvia the proton-motive force (pmf) to ATP synthesis by FoF1ATPase [1,2].Individually, enzymes have been studied extensively for mitochondrialOXPHOS in terms of structure/biochemistry [2], with significant under-standing of gene expression/regulation stemming from prokaryotes [3].However, the system-level architecture and dynamics of OXPHOSmembranes are not resolved.
s Institute (BPSI), University of44 1904 322214.
l, Liverpool L69 7ZB, UK.
. This is an open access article under
Two principal hypotheses for molecular organization have emerged[4]. In the ‘liquid-state’ model, individual enzymes are randomlymembrane-interspersed, interacting via stochastic mobility. The‘solid-state’ model assumes that electron flow is mediated through en-zyme supercomplexes, which are functionally and structurally definedregions of the membrane [5–7]. The liquid-state model dominateduntil supercomplexes, from the bacterium Paracoccus denitrificans [8]and mitochondrial inner membrane extracts from plant, yeast andmammalian cells, were isolated by native gel electrophoresis [6,9,10].In addition, membrane sub-structures consistent with supercomplexeshave since been observed by cryo-electron microscopy of inner mito-chondrial membranes from plant [11] and mammalian cells [12]. Thusthere is strong evidence in support of solid-state models of OXPHOS ineukaryotes and some prokaryotes.
Fluorescence imaging of bacterial OXPHOS in Bacillus subtilis [13]and E. coli [14,15] has shown mobile membrane patches of enzymes inthe cytoplasmic membrane. Also, Halo-Tag imaging of FoF1ATPase ininner mitochondrial membrane cristae indicates mobility [16]. Thecombination of evidence for supercomplexes and diffusive elementsled to speculation of membrane ‘respirazones’: functionally isolated,
the CC BY license (http://creativecommons.org/licenses/by/3.0/).
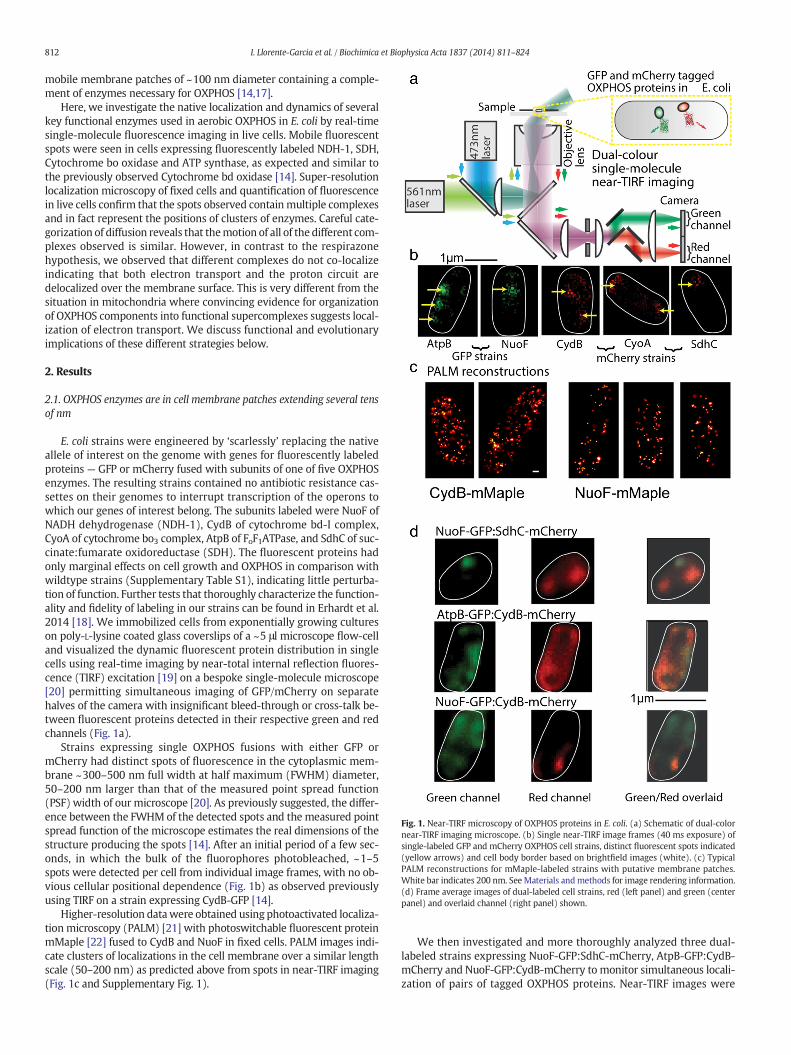
Fig. 1. Near-TIRF microscopy of OXPHOS proteins in E. coli. (a) Schematic of dual-colornear-TIRF imaging microscope. (b) Single near-TIRF image frames (40 ms exposure) ofsingle-labeled GFP and mCherry OXPHOS cell strains, distinct fluorescent spots indicated(yellow arrows) and cell body border based on brightfield images (white). (c) TypicalPALM reconstructions for mMaple-labeled strains with putative membrane patches.White bar indicates 200 nm. See Materials andmethods for image rendering information.(d) Frame average images of dual-labeled cell strains, red (left panel) and green (centerpanel) and overlaid channel (right panel) shown.
812 I. Llorente-Garcia et al. / Biochimica et Biophysica Acta 1837 (2014) 811–824
mobile membrane patches of ~100 nm diameter containing a comple-ment of enzymes necessary for OXPHOS [14,17].
Here, we investigate the native localization and dynamics of severalkey functional enzymes used in aerobic OXPHOS in E. coli by real-timesingle-molecule fluorescence imaging in live cells. Mobile fluorescentspots were seen in cells expressing fluorescently labeled NDH-1, SDH,Cytochrome bo oxidase and ATP synthase, as expected and similar tothe previously observed Cytochrome bd oxidase [14]. Super-resolutionlocalization microscopy of fixed cells and quantification of fluorescencein live cells confirm that the spots observed containmultiple complexesand in fact represent the positions of clusters of enzymes. Careful cate-gorization of diffusion reveals that themotion of all of the different com-plexes observed is similar. However, in contrast to the respirazonehypothesis, we observed that different complexes do not co-localizeindicating that both electron transport and the proton circuit aredelocalized over the membrane surface. This is very different from thesituation in mitochondria where convincing evidence for organizationof OXPHOS components into functional supercomplexes suggests local-ization of electron transport. We discuss functional and evolutionaryimplications of these different strategies below.
2. Results
2.1. OXPHOS enzymes are in cell membrane patches extending several tensof nm
E. coli strains were engineered by ‘scarlessly’ replacing the nativeallele of interest on the genome with genes for fluorescently labeledproteins — GFP or mCherry fused with subunits of one of five OXPHOSenzymes. The resulting strains contained no antibiotic resistance cas-settes on their genomes to interrupt transcription of the operons towhich our genes of interest belong. The subunits labeled were NuoF ofNADH dehydrogenase (NDH-1), CydB of cytochrome bd-I complex,CyoA of cytochrome bo3 complex, AtpB of FoF1ATPase, and SdhC of suc-cinate:fumarate oxidoreductase (SDH). The fluorescent proteins hadonly marginal effects on cell growth and OXPHOS in comparison withwildtype strains (Supplementary Table S1), indicating little perturba-tion of function. Further tests that thoroughly characterize the function-ality and fidelity of labeling in our strains can be found in Erhardt et al.2014 [18]. We immobilized cells from exponentially growing cultureson poly-L-lysine coated glass coverslips of a ~5 μl microscope flow-celland visualized the dynamic fluorescent protein distribution in singlecells using real-time imaging by near-total internal reflection fluores-cence (TIRF) excitation [19] on a bespoke single-molecule microscope[20] permitting simultaneous imaging of GFP/mCherry on separatehalves of the camera with insignificant bleed-through or cross-talk be-tween fluorescent proteins detected in their respective green and redchannels (Fig. 1a).
Strains expressing single OXPHOS fusions with either GFP ormCherry had distinct spots of fluorescence in the cytoplasmic mem-brane ~300–500 nm full width at half maximum (FWHM) diameter,50–200 nm larger than that of the measured point spread function(PSF) width of our microscope [20]. As previously suggested, the differ-ence between the FWHM of the detected spots and the measured pointspread function of the microscope estimates the real dimensions of thestructure producing the spots [14]. After an initial period of a few sec-onds, in which the bulk of the fluorophores photobleached, ~1–5spots were detected per cell from individual image frames, with no ob-vious cellular positional dependence (Fig. 1b) as observed previouslyusing TIRF on a strain expressing CydB-GFP [14].
Higher-resolution datawere obtained using photoactivated localiza-tion microscopy (PALM) [21] with photoswitchable fluorescent proteinmMaple [22] fused to CydB and NuoF in fixed cells. PALM images indi-cate clusters of localizations in the cell membrane over a similar lengthscale (50–200 nm) as predicted above from spots in near-TIRF imaging(Fig. 1c and Supplementary Fig. 1).
We then investigated and more thoroughly analyzed three dual-labeled strains expressing NuoF-GFP:SdhC-mCherry, AtpB-GFP:CydB-mCherry and NuoF-GFP:CydB-mCherry to monitor simultaneous locali-zation of pairs of tagged OXPHOS proteins. Near-TIRF images were

813I. Llorente-Garcia et al. / Biochimica et Biophysica Acta 1837 (2014) 811–824
recorded over ~10 s at a 25 Hz frame rate. Dual-color images indicatedsimilar spots of fluorescence as seen for single-labeled strains, withmovie data showing some spots are mobile across the cell membranesurface (Supplementary Movies S1, S2), as observed previously [14],while a proportion is relatively immobile, indicated by comparativelyunblurred fluorescence foci on frame averaged images generated fromdata sequences over several seconds (Fig. 1d upper panel).
2.2. There is a broad range in stoichiometry between different OXPHOSenzymes and different patches
Diffusing spots of fluorescence were tracked in each separate colorchannel for at least five consecutive image frames, with some trackslasting several seconds. We then calculated the stoichiometry of eachdetected spot in vivo by a simple ratio of the initial intensity of eachtrack to the brightness of single fluorescent protein molecule as de-scribed in Materials and methods. The distribution of stoichiometryfor each strain was generated using unbiased kernel density estimation[23], a technique (alternative to the use of histograms) that convolvesthe raw data using Gaussian functions to represent each measurementand its error, andwhich results in an objective final distribution of mea-surements that is not biased by subjective and arbitrary histogram binwidths and edge positions. The distributions indicate a broad range innumber of molecules per spot (Fig. 2 and Table 1). For dual-labeledstrains (Fig. 2a–c), the distributions indicate FWHM ranges of 10–20and 20–40 molecules per spot for NuoF and SdhC respectively, 40–60molecules per spot for AtpB, and, similar to an earlier study [14],70–180molecules per spot of CydB (Supplementary Fig. 2 indicates ex-ample in vivo photobleach traces compared to purified single surface-immobilized fluorescent protein molecules obtained under the sameimaging conditions). Spots from the same cells ranged in stoichiometryacross the full range of these distributions. In addition to the dual-labeled strains, which gave information for four of the OXPHOS com-plexes, we investigated the stoichiometry of spots in a single-labeledstrain expressing a genomic mCherry fusion of the terminal oxidase
Fig. 2. Stoichiometry of OXPHOS complexes. Unbiased kernel density estimations for numbers o(d) the CyoA single-labeled strain. GFP (blue) and mCherry (red) components shown, with pe
CyoA, containing 25–45 molecules per spot (Fig. 2d). Calculationsbased on cell doubling times and fluorescence maturation data indicatethat less than 1% of the proportion of fluorescent protein is in an imma-ture ‘dark’ state [20].We note that while it may be tempting to calculatethe number of patches per cell taking into account our results and com-bining them with possibly available measurements of total numbers ofOXPHOS proteins per cell from high-throughput studies (see for in-stance Taniguchi et al. [24]), significant differences in the details of thetechniques used for each type of measurement make these studies notimmediately comparable. In particular, there are significant geneticdifferences (our study uses specific linkers and mutations which are‘scar-less’ in nature, compared to generic linkers and issues withantibiotic-resistance cassette remains in the above mentioned high-throughput study), as well as differences in growth and imaging condi-tions that preclude direct comparison.
2.3. OXPHOS patches exhibit confined and unconfined diffusion
ThediffusionofOXPHOS complexes in dual-label strainswas charac-terized using BARD analysis [25] which applies Bayesian inference todetermine the most likely type of diffusion (from either confined,anomalous, normal/Brownian, or directed diffusion) from experimentaltrajectory data from tracked spots. The proportions of tracks assigned toeach diffusion type for all tagged complexes in all strains analyzed areshown in Supplementary Table S3. Supplementary Table S4 shows thefrequencies of tracks which are confined or unconfined (anomalous,Brownian or directed) for the dual-label strains. On average 47% ±10% (±s.d.) of tracks have confined mobility and 53% ± 10% (±s.d.)have unconfined mobility, consistent across the dual-label strains towithin the error of the BARD analysis. A two-way chi-squared test ofthe diffusion categorizations for NuoF, CydB, SdhC, and AtpB, yielded anon-significant result:χ2= 4.306 (Pearson's chi-squared test statistic);N=342 (total number of tracks analyzed); d.f. = 3 (number of degreesof freedom); and P=0.23 (P-value, probability). It is therefore unlikelythat these four OXPHOS proteins differ from each other in terms of their
f OXPHOS protein molecules per fluorescent spot, for (a)–(c) dual-labeled cell strains andak value (arrow). n = 18–134 tracks analyzed.

Table 1OXPHOS protein stoichiometry values in cytoplasmic membrane patches, using peakvalue from Gamma fit to the kernel density estimation for stoichiometry distribution,with corresponding half width at half maximum (HWHM) fit values indicated.
OXPHOS protein (source cell strain) Peak stoichiometry ± HWHM(molecules per spot)
NuoF (NuoF-GFP:SdhC-mCherry) 16 ± 4NuoF (NuoF-GFP:CydB-mCherry) 14 ± 6SdhC (NuoF-GFP:SdhC-mCherry) 27 ± 10AtpB (AtpB-GFP:CydB-mCherry) 48 ± 13CydB (NuoF-GFP:CydB-mCherry) 103 ± 33CydB (AtpB-GFP:CydB-mCherry) 132 ± 46CyoA (CyoA-mCherry) 35 ± 8
814 I. Llorente-Garcia et al. / Biochimica et Biophysica Acta 1837 (2014) 811–824
‘preference’ for diffusion type. Roughly half of the unconfined spots ex-hibited anomalous/sub-diffusion, while the remainder exhibitedBrownian diffusion at a mean rate of 0.007 ± 0.005 μm2 s−1 (±s.d.)across all strains (Supplementary Fig. 3a). For confined spots (Supple-mentary Fig. 3b,c) we found confinement domains with a mean effec-tive radius of 0.05 ± 0.02 μm (±s.d.), which is greater than ourlocalization precision. We observed no dependence on either diffusioncoefficient or confinement radius with number of fluorescent proteinsin each spot (Supplementary Fig. 4).
Our trajectory measurements are in principle a projection onto thecamera imaging plane of the three-dimensional diffusion movementof the complexes within a curved bacterial membrane of capped-cylindrical shape. However, both our measured confinement radius of0.05 ± 0.02 μm (±s.d.) and measured total displacements of labeledOXPHOS proteins diffusing in the membrane (particularly the trans-verse displacements, perpendicular to long axis of bacterial body), arean order of magnitude smaller than the width of a cell body (~1 μm),such that effects of curvature [26,27], of the cytoplasmic membraneare likely to be small within the area explored by the diffusing proteincomplexes, consistent with BARDmobility analysis indicating no signif-icant difference in the one-dimensional diffusion coefficients estimatedfrom trajectory data parallel to the cell long-axis compared to those per-pendicular to the long-axis. In particular, given our experimental imag-ing frame rate, the typical width of E. coli bacteria and the expectedrange of diffusion coefficient values, according to reference [27], the un-derestimation bias resulting frommembrane curvature for our diffusioncoefficients is negligible.
Although the mean value of diffusion coefficient of ~0.007 μm2 s−1
across all strains was smaller than that measured from an earlier studyin reference [14] obtained using single particle tracking of CydB-GFP,the range of diffusion coefficients estimated for the CydB-mCherry strainin our studyhere (Supplementary Fig. 4a)waswithin experimental errorto that measured for the CydB-GFP previously when comparing equiva-lent levels of molecular stoichiometry.
2.4. Different OXPHOS enzymes assemble in different patches
The aforementioned respirazone hypothesis predicts co-localizationof OXPHOS complexes in ~100 nm patches – patches smaller than theresolution limit of the microscope – and we have already observedthat the patches are dynamic.We therefore determined how frequentlysignals in the red and green channelswere co-localized in order to see ifco-localization occurred more frequently than by chance, given the ob-served density of proteins in the membrane.
To quantify co-localization, we implemented several complementa-ry approaches.Wefirst investigated co-localization at the length scale ofthe whole cell (a), both looking at frame averages (time scale of sec-onds) (a.1) and at single frames (frame-by-frame, time scale of 40 ms)(a.2), for all image sequences in each dual-label-strain data set. The sec-ond approach (b) consisted of calculating the overlap of individual fluo-rescent spots tracked on both channels simultaneously.
2.4.1. Whole cell methodWegenerated co-localizationmaps for each cell, using the difference
in normalizedfluorescence intensities on a pixel-by-pixel basis betweencorresponding pixels in the green and red channels inside each cellboundary. The analysis output is a pixel map of coefficients, with valuesof −1 and +1 corresponding theoretically to features present only ingreen or red channels respectively whereas values clustered aroundzero indicate features common to both channels.
2.4.2. Looking at frame averagesA color map and histogram of co-localization values were produced
for each frame-averaged fluorescence image sequence in a data set inorder to generate qualitative estimates from our dual-labeled data;spots tracked on both channels presented typically a relatively lowmo-bility over our time scale of observation, still appearing very clearly onimages after frame averaging for at least ~10 s.
Fluorescence frame averages were calculated and separated intotheir red and green channels and any spatial translation betweenimages acquired on the red and green channels was determined asdescribed in the Materials and methods section. For both channels, aregion of interest around the cell body was selected and pixel-thresholding was employed to define ‘cell masks’ in both channels toisolate cell fluorescence from the image background. Both channelswere then re-scaled to normalize pixel intensities between 0 and 1.
The difference between re-scaled translated red channel and re-scaled green channel intensity values was then calculated for eachpixel. These final co-localization values were plotted on a color map(see example on Fig. 3a), with values close to +1 representing brightfeatures found on the red channel but not on the green channel, valuesclose to −1 representing bright features on the green channel but noton the red channel, and values around 0 corresponding to features com-mon to both channels in terms of normalized brightness (including anyputative co-localized bright spots on the frame averages).
With this qualitative method, it is clear that over a time scale of sec-onds the different OXPHOS complexes do not on average occupy similarlocations in the cell membrane, and that the low-mobility patches donot contain different OXPHOS complexes.
2.4.3. Frame-by-frame approachCo-localization was also analyzed on a frame-by-frame basis by fol-
lowing the same process as outlined above, but applied to single frames(see Fig. 3b) instead of frame averages, which rendered co-localizationdata over an effective time scale of seconds, to probe smaller time scalesof tens of ms while still obtaining a measure of co-localization averagedover single whole cells. Co-localization values (see Fig. 3c) were calcu-lated for each of the first 25 frames in a given fluorescence imagesequence, and then accumulated together to produce histograms suchas those in Fig. 3d. Such histograms or distributions of co-localizationcoefficients could be fitted to a sum of three Gaussian curves withtheir centers constrained to be in the ranges of −0.4 to −0.1, 0, and0.1 to 0.4 and their widths in the ranges of 0.15–0.25, 0–0.5, and 0.15–0.25, respectively. These constraints came from applying the sameanalysismethod to single-label-strain data acquired under the same im-aging conditions as the dual-label data; the analysis of imageswithfluo-rescence present on one of the channels only, with only noise on theother channel, yielded distributions of co-localization values whosemagnitude was centered typically around 0.2–0.3, with standard devia-tions of ~0.2.
The fraction of brightness featureswhich appeared to be co-localizedon both channels was estimated for the dual-label data as the fractionrepresented by the area under the Gaussian curve centered aroundzero, out of the total area under the sum of the three Gaussian curves.Note that when applied to single-label data, this method yielded, asexpected, fractions of brightness corresponding to the actual fluores-cence channel in excess of 90% (96 ± 4% (±s.d.)) and very small frac-tions (3 ± 4% (±s.d.)) under the central Gaussian. The contribution to

Fig. 3. OXPHOS protein co-localization analysis, whole-cell method. (a) Typical frame-average dual-labeled cell strain near-TIRF images with cell borders shown (white), normalized in-tensity (false-color) for GFP (left panel) andmCherry content (center panel), and frame average co-localization pixelmap (right panel); (b) Typical single-frame dual-label data with GFP(left) andmCherry (center) normalized intensity channels, andwith single-frame co-localizationmap (right); (c) Example distribution of co-localization values from the single-framemapin (b) (right); (d) Example distribution of co-localization coefficients formedby accumulating values from25 single frames in a given image sequence (same one as for b and c), showing fitto a sum of three Gaussians (black) as well as the individual Gaussians for GFP (left, green) and mCherry (right, red) channels, and central Gaussian in blue. The central blue Gaussianindicates features common to both color channels and the percentage area under it of the total (indicated %) gives a measure of the co-localized fraction; (e) Co-localization fractions(%) (fractional area under central Gaussian, data from 25 frames) for all image sequences analyzed in all three dual-labeled strains.
815I. Llorente-Garcia et al. / Biochimica et Biophysica Acta 1837 (2014) 811–824

816 I. Llorente-Garcia et al. / Biochimica et Biophysica Acta 1837 (2014) 811–824
the co-localized fraction due to random image noise is therefore verysmall. The co-localized fractions estimated provide an upper thresholdto the degree of intrinsic co-localization between different observedOXPHOS protein complexes, given unavoidable small contributionsdue solely to co-localized background features.
For all dual-label image sequences analyzed, there was excellentagreement of the qualitative color maps of co-localization valuesobtained from frame averages, with the corresponding fractions of co-localized brightness and of brightness coming from either the red orgreen channels, obtained from sets of single frames.
Therefore, for each dual-labeled strain, the area under the centralGaussian curve as a fraction of the total, indicated the proportion ofpixels with common red/green features (Table 2), indicating a meanvalue of 22 ± 7% (±s.d.) across the three dual-label data sets. The indi-vidual fractions obtained for each data set can be seen in Fig. 3e.
2.4.4. Tracked spot methodThe most robust quantitative metric for co-localization utilized sin-
gle particle tracking of fluorescent spots in each color channel.We iden-tified green and red channel tracks at least five consecutive imageframes in duration which were coincident in time, and constructed ananalytical overlap integral function modified from an earlier method[28].We considered all frames forwhich bright spots had been detectedand tracked on both red and green channels simultaneously. For thesespots detected at coincident times on both channels, we used theGaussian-fit parameters (amplitude, center and width) obtained fromthe previous tracking analysis of the image sequences, taking into ac-count the appropriate spatial translation between the red and greenchannels for each image sequence. This shift was pre-calculated fromthe corresponding brightfield images which bled through into eachchannel, in the same way as described for the whole cell methods, byfinding the position of best overlap of the red and green channels,i.e. the maximum of their cross-correlation function (see Materialsand methods). The Gaussian intensity profiles of the bright spots werenormalized by dividing by their fitted Gaussian amplitudes and, foreach time-overlapping track pair, the overlap of the Gaussian spots(overlap integral, v, see Materials and methods) was calculated on aframe-by-frame basis. The overlap integral can take values between 0(no overlap) and 1 (complete overlap). We made use of a modifiedRayleigh-type resolution criterion and considered that two spots wereco-localized when their overlap was large enough or, in other words,when they could not be ‘resolved’ due to their separation on theimage being below ~2.5 times their Gaussianwidth. The actual Rayleighresolution criterion states that two spots can only be resolved whentheir separation is large enough such that at least the maximum ofone of the Airy-diffraction patterns is at the same position as the firstminimum of the diffraction pattern from the other spot. Though weused Gaussian function approximations to Airy functions to fit the in-tensity pattern of each detected spot we can still define a similar criteri-on, considering that at a distance from the center of ~2.5 times theGaussian width, which encapsulates 99% of the total area under theGaussian curve.
Table 2Co-localization fractions of pixels for dual-labeled OXPHOS cell strains fromwhole cell im-ages based on 3-Gaussian fit method using n= 7–10 cells (column 2) (see also Fig. 4e),compared against proportion of spot pairs that are within the optical resolution limit ofeach other (column 3), n = 24–468 spot pairs analyzed.
Strain name Mean co-localizedfraction of pixelsusing wholecells ± s.e.m. (%)
Proportion of spot pairs withoverlap integral N0.2 of all spotpairs coincident in time (%)
NuoF-GFP:SdhC-mCherry 30 ± 10 17AtpB-GFP:CydB-mCherry 14 ± 7 13NuoF-GFP:CydB-mCherry 25 ± 6 21
Therefore, we considered two spots as co-localized when their sep-aration was below 2.5 times their Gaussian width. For two equal-width Gaussians separated by 2.5 times their width, the overlap integraltakes a value of ~0.2 and hence, our criterion considered two spots asco-localized if their overlap integral was above 0.2. This threshold-overlap value would change for spots of different widths, however,the widths of the spots detected on both channels were very similar,and the distributions of width ratios (σ1/σ2) obtained from all spotpairs for this analysis were centered around 1 and had standard devia-tions of 0.1–0.2.
The overlap integral value for each red–green track pair (see Fig. 4a)was calculated as a function of relative separation between red–greenspot intensity centroids, and of spot widths. For each time point this re-sulted in an overlap number in the range 0–1 (see Fig. 4b), with 0 indi-cating no overlap and 1 that both spots are precisely co-localized. Thedistribution of overlap integral values across all three dual-labeledstrains is shown in Fig. 4c, where the theoretical co-localization thresh-old of 0.2 such that two spots are no longer resolved independently hasbeen indicated. Our results indicate a mean of 17 ± 4% (±s.d.) timepoints have an overlap integral in excess of 0.2 (Table 2).
We used a Poisson nearest-neighbor model to characterize the dis-tribution of spots in the cell membrane and calculate the probabilityof chance co-localization (see Materials and methods). The theoreticallikelihood for observing chance co-localization within the optical reso-lution limit of our microscope of different OXPHOS complexes is 24%,based on the observed surface density of spots in the cell membrane,taking into account the width, length and shape of the bacterial cells,and the measured point spread function width of our microscope. Theproportions of pixels observed indicating putative co-localization fromall of our analysis methods at both the whole cell and single trackedspot levels are on average below or consistent with this 24% chanceco-localization threshold, indicating that the observed co-localizationis due to single, unassociated spots from different color channels over-lapping within the optical resolution limit, rather than to differentOXPHOS enzymes associated as a supercomplex.
2.5. Ubiquinone mobility is correlated to respiratory activity
In order to compare the distribution and dynamics of the mobileelectron carrier ubiquinone with those of the OXPHOS enzymes, E. colicells were incubated with OXPHOS active, fluorescently-labeledubiquinone calledNBDHA-Q [29]. Confocal imaging indicated halos con-sistent with cell membrane localization with no indication of distinctspots (Fig. 5a), which contrasts the patchy distribution of OXPHOScomplexes seen above. To clarify if NBDHA-Q was located in outer orinner cell membranes, we elongated cells using cephalexin [30] onagar plates with 15% sucrose for osmotic shock treatment [31] resultingin inner membrane invagination, subsequent imaging indicating cyto-plasmic membrane localization (Fig. 5b). Estimates for ubiquinonediffusion coefficient were obtained using fluorescence recovery afterphotobleaching (FRAP) (Fig. 5c).
FRAP data were modeled by relating changes in bleach profilewith respect to time to effective diffusion coefficient [32], indicatingtemperature-dependent diffusion from 1.0 ± 0.3 μm2 s−1 at 15 °C upto 1.8± 0.3 μm2 s−1 (±s.d.) at 37 °C (Fig. 5d, Table 3), roughly correlat-ed to respiratory activity as assessed by cellular oxygen uptake whichcould be modeled using a Boltzmann factor [33] whose activationbarrier was ~18 kcal/mol, comparable to ATP synthesis requirements(Supplementary Fig. 5).
3. Discussion
All the OXPHOS complexes that we examined in E. coli appear to bepackaged in clusters of like complexes. The pairs of complexes that weexamined (NDH-1 with cytochrome bd-1; cytochrome bd-1 withFoF1ATPase; NDH-1 with SDH) show no significant co-localization,
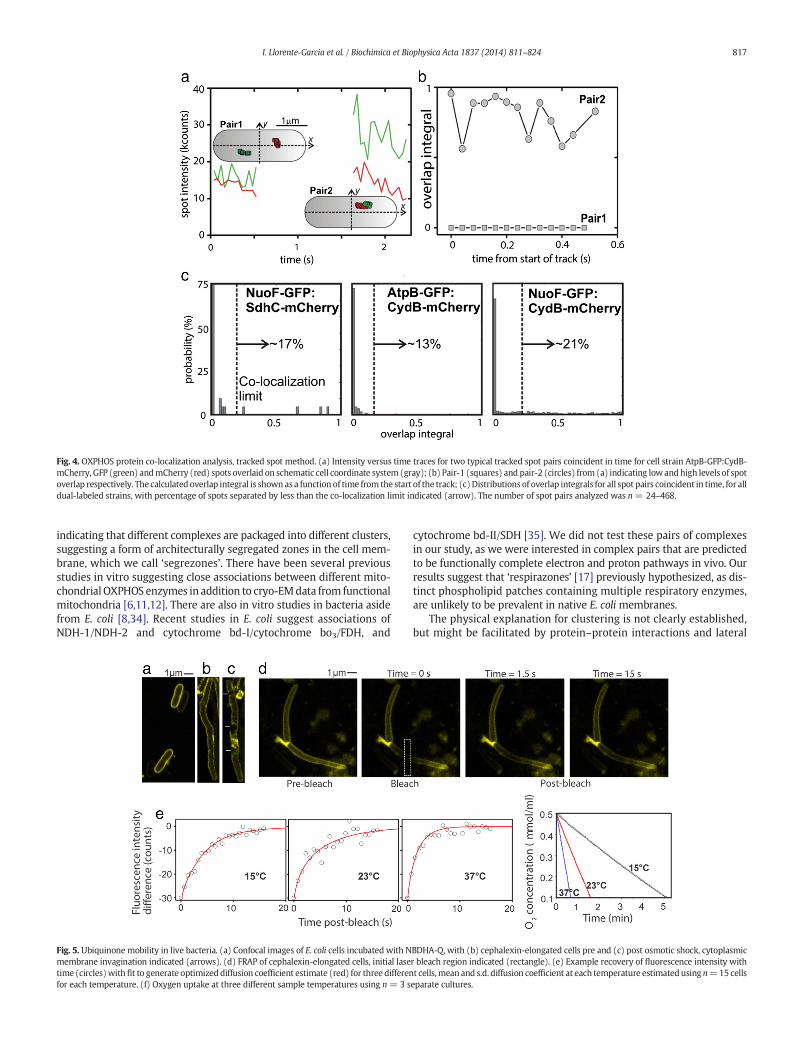
Fig. 4. OXPHOS protein co-localization analysis, tracked spot method. (a) Intensity versus time traces for two typical tracked spot pairs coincident in time for cell strain AtpB-GFP:CydB-mCherry, GFP (green) andmCherry (red) spots overlaid on schematic cell coordinate system (gray); (b) Pair-1 (squares) and pair-2 (circles) from (a) indicating low and high levels of spotoverlap respectively. The calculated overlap integral is shown as a function of time from the start of the track; (c)Distributions of overlap integrals for all spot pairs coincident in time, for alldual-labeled strains, with percentage of spots separated by less than the co-localization limit indicated (arrow). The number of spot pairs analyzed was n = 24–468.
817I. Llorente-Garcia et al. / Biochimica et Biophysica Acta 1837 (2014) 811–824
indicating that different complexes are packaged into different clusters,suggesting a form of architecturally segregated zones in the cell mem-brane, which we call ‘segrezones’. There have been several previousstudies in vitro suggesting close associations between different mito-chondrial OXPHOS enzymes in addition to cryo-EMdata from functionalmitochondria [6,11,12]. There are also in vitro studies in bacteria asidefrom E. coli [8,34]. Recent studies in E. coli suggest associations ofNDH-1/NDH-2 and cytochrome bd-I/cytochrome bo3/FDH, and
Fig. 5. Ubiquinonemobility in live bacteria. (a) Confocal images of E. coli cells incubated with Nmembrane invagination indicated (arrows). (d) FRAP of cephalexin-elongated cells, initial lasetime (circles)withfit to generate optimizeddiffusion coefficient estimate (red) for three differenfor each temperature. (f) Oxygen uptake at three different sample temperatures using n = 3 s
cytochrome bd-II/SDH [35]. We did not test these pairs of complexesin our study, as we were interested in complex pairs that are predictedto be functionally complete electron and proton pathways in vivo. Ourresults suggest that ‘respirazones’ [17] previously hypothesized, as dis-tinct phospholipid patches containing multiple respiratory enzymes,are unlikely to be prevalent in native E. coli membranes.
The physical explanation for clustering is not clearly established,but might be facilitated by protein–protein interactions and lateral
BDHA-Q, with (b) cephalexin-elongated cells pre and (c) post osmotic shock, cytoplasmicr bleach region indicated (rectangle). (e) Example recovery of fluorescence intensity witht cells,mean and s.d. diffusion coefficient at each temperature estimatedusing n=15 cellseparate cultures.

Table 3Variation of effective diffusion coefficient forfluorescently-labeled ubiquinone, as estimat-ed using FRAP, and oxygen uptake rates with respect to temperature.
Temperature(°C)
Diffusion coefficient ± SD(μm2 s−1)
Oxygen uptake rate ± SD(μmol ml−1 h−1)
15 0.96 ± 0.26 0.590 ± 0.00723 1.26 ± 0.23 2.260 ± 0.00337 1.79 ± 0.33 5.362 ± 0.048
818 I. Llorente-Garcia et al. / Biochimica et Biophysica Acta 1837 (2014) 811–824
segregation of membrane lipids. Previous fluorescence imaging moni-toring phase transitions in artificial giant unilamellar lipid vesicles indi-cates the presence of distinct patches composed of a lower viscosityphase surrounded by a phospholipid sea of higher viscosity [36]. Char-acterizing such liquid domains using a two-dimensional Ising modelpredicated severalmetastable patches of phospholipids,whose effectivewidth covers the range of length scales we observe here [37].
Alternatively, clustering could be effected by protein–protein inter-actions through entropically-driven aggregation in which collectionsof neighboring proteins are probabilistically driven closer by a ‘deple-tion’ force [38]. In support of this, Monte Carlo simulations based onanother bioenergetic membrane, developing chromatophore mem-branes in purple photosynthetic bacteria, illustrate the potential forentropically-driven sorting of protein complexes of like size and shapeinto separate domains [39]. The sorting of complexes into such domainsmay serve as an efficientway to pack protein complexes into a crowdedmembrane, however this may not solely explain our lack of observednon-random co-localization.
Our observations here did not indicate a significant variation ofdiffusion coefficient with stoichiometry, in addition calculations basedon a comparison of the physical size of OXPHOS enzymes comparedto the patches indicate less than 30% of a patch is occupied byfluorescently-labeled OXPHOS protein [14], suggesting they consist ofloose assemblages and that the observed movement of fluorescentspots is due to the motion of a whole patch as opposed to tightly-bound multimers/supercomplexes.
A significant proportion of patches was immobile beyond a lengthscale of ~100 nm, in contrast to earlier imaging observations in artificiallipid vesicles in which similar sized patches experienced exclusivelyBrownian diffusion [36]. This may indicate that the source of confine-ment derives not from intrinsic lipid bilayer architecture but fromanex-trinsic origin, such as the cytoskeleton or the effects of crowding frommembrane-integrated proteins [40].
One of the pairs of OXPHOS complexes we examined constitutes thetwo enzymes involved in a major E. coli electron transport pathway:NADH to oxygen via NADH dehydrogenase and cytochrome bd-I.These enzymes are thought to be co-regulated at the transcriptionallevel and be the major route of electron flux from NADH to oxygenunder microaerobic conditions [3,41]. The absence of any clear co-localization between NDH-1 and cytochrome bd-I (Fig. 1d lowerpanel) indicates that there is no supercomplex involved in this pathway.Electron transport between the two complexes is mediated by ubiqui-none [42], and our FRAP data indicate that ubiquinone diffusion is ~2orders of magnitude faster than diffusion of the membrane patches(Fig. 5). This suggests that electron exchange between NADH dehydro-genase and cytochrome bd-I is mediated by long-range diffusion of aubiquinone pool that is delocalized in the membrane. Furthermore,modeling the change in diffusion coefficient with temperature using aheuristic power-law (Supplementary Fig. 5a) indicated the diffusioncoefficient varied as ~Tawhere a=8±1 (±s.d.). The rate of oxygenup-take could be fitted with a Boltzmann dependence exp(−ΔG/kBT), assuggested from several previous studies of metabolic rate dependencewith temperature [33], whose effective free energy activation barrier,ΔG, we estimate as 18 ± 4 kcal/mol (±s.d.) where T is the absolutetemperature and kB is the Boltzmann constant (SupplementaryFig. 5b). Previous estimates from lipid vesicles suggest free energy barrier
values corresponding to the phospholipid phase transition process great-er than our observed value here by a factor of 2–3 [36], and so phospho-lipid phase transition behavior per se is unlikely to account for thetemperature dependence in our present study. Conversely, in vitro esti-mates fromkinetic studies of isolated enzymes indicate that for each elec-tron pair transferred in the oxidation of a molecule of NADH there is again in free energy through the transmembrane proton-motive forceof ~31 kcal/mol,which is sufficient to energize the synthesis of threemol-ecules of ATP requiring ~22 kcal/mol. Similarly, the oxidation of a mole-cule of succinate results in an increase in free energy through theproton-motive force of ~20 kcal/mol, which is sufficient to energizesynthesis of two molecules of ATP requiring ~15 kcal/mol [42].Therefore, synthesis of ATP from NADH and succinate requires freeenergy coupled to the proton-motive force of ~15–22 kcal/mol,which agrees with our observed free energy barrier to withinexperimental error. It is therefore likely that ubiquinone is a signifi-cant mediator of electron flow acting as a common electron carrierbetween different membrane patches.
Our results also shed light on spatial organization of the E. colichemiosmotic proton circuit. We tagged two of the major sites for pmfgeneration, NADH:ubiquinone oxidoreductase and cytochrome bd-I,and one of the major sinks for the pmf, FoF1ATPase. The lack of any co-localization between NDH-1 and cytochrome bd-I indicates that pmf isgenerated by different complexes at multiple sites in the membrane.Likewise, the lack of co-localization between cytochrome bd-I and FoF1-ATPase (Fig. 1d middle panel) indicates that sinks for the pmf are notnecessarily located close to pmf sources. We also note that anotherpmf sink, the flagellar motor, is dispersed around the cell surface andimmobilized by association with the cell wall [43], so unlikely to co-localize significantly with patches of NADH:ubiquinone oxidoreductase,cytochrome bd-I and FoF1ATPase that we observe. It has been suggestedthat pmf in chemiosmotic membranes may be effectively localized bybinding of protons to lipid head-groups, and this localization is energet-ically advantageous if the pmf sink is located close to the pmf source[44]. However, our results indicate that in E. coli the pmf is utilized bycomplexes spatially separated from pmf sources, therefore the classicalpicture of pmf delocalized over the entire cell surface is more likely.
The localization of these E. coliOXPHOS complexes contrast striking-ly with the emerging picture of the inner mitochondrial membrane,where functional electron transport supercomplexes seem to playsignificant roles [11,45], and FoF1ATPase is located in a spatially-controlled fashion at cristae margins [46]. A key to the different strate-gies employed in E. coli and mitochondria may lie in the need forE. coli to rapidly acclimatize to changing environments by regulatingexpression of multiple electron transport modules. Such flexibilitywould be difficult to achieve if enzymes were locked into stablesupercomplexes. By contrast, mitochondria inhabit a more stableenvironment in eukaryotic cytoplasm, exhibiting very restricted elec-tron transport options, which may indicate a distinct adaptation.Supercomplexes may have evolved stochastically at the level of associ-ations between individual pairs of OXPHOS enzymes, as opposed to enmasse, which may explain the observation of supercomplexes in E. colifrom other studies [35,47] and for other bacteria such as Paracoccusdenitrificans [8]. Interestingly, recent data from fluorescence imagingand immuno EM of native mitochondrial OXPHOS enzymes suggestthat the formation of supercomplexes may be a slow, stochastic processmediated by restricted diffusion in the cristae [48], and data from pho-tosynthetic cyanobacteria also suggest a pooling of electron transportcomplexes into membrane patches of diameter 100–300 nm [49].
Our results belong to a rapidly emergingfield of single-molecule cel-lular biophysics [50], and although restricted to E. coli may suggestdeeper reflection on the physiological role OXPHOS supercomplexes.In addition, the presence of distinct patches whose size and mobilityare heterogeneous, may indicate a general level of local membrane ar-chitecture beyond the OXPHOS process, with more complexity thanhas been assumed in prokaryotes.

819I. Llorente-Garcia et al. / Biochimica et Biophysica Acta 1837 (2014) 811–824
4. Materials and methods
4.1. Cell strain construction and characterization
4.1.1. Mutagenesis of E. coli strains
I) λ-red mediated recombination using the nptI-sacB (kanamycin-sucrose) counterselection. The relevant endogenous OXPHOS geneswere replacedwith functionalfluorescent protein fusionsperformedthrough λ-redmediated recombination [51,52] allowing integrationof either the egfp or mcherry gene coding for enhanced GFP ormCherry respectively [53,54] into the chromosomal operon for theE. coli cydB, atpB, cyoA, nuoF, and sdhC genes respectively. In brief,plasmid pKF2-6 contained all the genes for E. coli FoF1-ATP synthaseand additionally coded for a fusion of eGFP to AtpB (atpB) at the C-terminus. To integrate into the chromosome we inserted the nptI-sacRB cartridge in the genomic operon, replacing atpB, via λ-redmediated recombination. The cartridge was amplified from plasmidpVO1100 using primers P18 and P19 (Supplementary Table S2) thatimparted flanking homologous regions to the chromosomal atp-operon and this new BW25113 atpB:nptI-sacRB strain was charac-terized by colony PCR. For the insertion of the genes for thefluorescently-labeled subunit AtpB we amplified a linear fragmentfrom pkF2-6 with primers P20 and P21 (Supplementary Table S2).The fragment was integrated into the chromosome of BW25113atpB:nptI-sacRB via λ-red mediated recombination. The strainBW25113 atpB-egfpwas characterized by colony PCR and by sequenc-ing. BW25113 egfp-nuoF, BW25113 sdhC-mCherry and BW25113cyoA-mcherrywere similarly produced. The NuoF-GFP:SdhC-mCherrydual-labeled strain was made using the same methods.II) Combination λ-red mediated recombination and double-strandbreak repair. Strains expressing the CydB-mCherry fusion proteinwere made by introducing the mCherry DNA coding sequence intothe E. coli genome, downstream of cydB with the same 5 aminoacid linker used in the construction of strain YTL01 [14]. This wasachieved by a modification of the method previously describedbased on λ-red recombination and DNA double-stranded break re-pair [55]. Briefly, the pTKS/CS and pTKIP plasmids were replacedby plasmids pTKYTLmCh(v) and pYTLmChDonor. In pTKYTLmCh(v)the random sequence ‘landing pads’ from pTKS/CS were replacedwith 30 base sequences with homology to the N and C termini ofmCherry, to form ‘landing pads’ for mCherry. The neomycin resis-tance cassette in pTKIP-neo was replaced with the mCherry codingsequence to yield pYTLmChDonor. The red recombination plasmidpTKRED, was introduced into host strains by electroporation. Over-lap PCR was used to generate the recombineering template whichconsisted of 2–300 bases of homology to the C-terminus of CydB,the 5 amino-acid linker coding sequence, N-terminal mCherry land-ing pad, the tetA counter-selectable marker with flanking I-SceI re-striction sites, C-terminal mCherry landing pad and 2–300 bases ofdownstream homology to CydB. The introduction of the counter-selectable marker into the host strain genome and at its subsequentreplacement with mCherry was carried out accordingly [55], usingpYTLmChDonor in place of pTKIP-neo. Mutants were screened bycolony PCR and subsequent sequence analysis of the cydB allele inmutant colonies. The cydB-mCherry allele was similarly introducedinto BW25113 egfp-nuoF and BW25113 atpB-egfp.III) λ-red mediated recombination using nptI-ccdB (kanamycin-rhamnose) counterselection. E. coli strains expressing mMaple [22]tagged CydB and NuoF were generated by allele replacement on theE. coli MG1655 chromosome by λ-red recombination with λ-red
plasmid pTKRED [55]. Two rounds of recombination were used toachieve the desired mutation. In the first round of recombination,the recombination templates were generated by PCR amplificationof the counter-selectable cassette fromplasmidpKD45 [56], encodingkanamycin resistance and the ccdB toxin under the control of therhamnose inducible rha promoter, using primer pair cydB-cs-F andcydb-cs-R, for mutations of the cyd operon, and primers nuof-cs-Fand nuoF-cs-R, for mutations to the nuo operon (primer sequencesare given in Supplementary Table S2). This counter-selection wasdeemed to be the most efficient hence the use of MG1655 ratherthan BW25113, which has a Δrha genotype [51] and therefore canneither import nor metabolize rhamnose. Using these templates,the counter-selectable cassette was inserted into the cyd and nuo op-erons at the insertion sites for themMaple gene by λ-red recombina-tion with λ-red plasmid pTKRED as previously described [55].Recombinants were selected by growth at 30 °C on LB plates withkanamycin (50 μg/ml) and spectinomycin (100 μg/ml) yielding mu-tants resistant to kanamycin but sensitive to rhamnose. In the secondround of λ-red recombination, primer pairs cydB-maple-F and cydB-maple-R and nuoF-maple-F and nuoF-maple-R were used to PCRamplify the mMaple gene and linker with flanking homology to theinsertion sites in the cyd and nuo operons respectively. λ-red recom-bination was performed as before with these new templates andsecond-round recombinantswere selected for by growth onM9min-imal medium plates with 0.3% rhamnose as the sole carbon source.The counter-selectable cassette was thus replaced with the mMaplegene. The primary sequences of the linkers used were identical tothose for mCherry tagging of CydB and GFP tagging of NuoF. Mutantswere confirmed by colony PCR and sequencing of the mutant alleles.
4.1.2. Characterization of E. coli strainsThese cell strains were confirmed as having similar cell doubling-
time measurements when grown in rich Luria-Bertani (LB) medium asthe parental strain BW25113, with Western blotting of the detergent-extracted cytoplasmic membrane content confirming the presence offluorescent protein fusion constructs at the correct anticipated molecu-lar weights. OXPHOS activity was estimated to be at least ~70% of theparental strain level, either frommeasuring NADH or succinate oxidaseactivity of cytoplasmic membranes and either NADH/ferricyanide oxi-doreductase activity of cytoplasmic membranes and detergent extractsfor the complex I or II variants respectively, or with estimating ATP-synthase activity of the atpB-egfp cell strain using succinate minimalmedia plates [18].
Fluorescence imaging of CydB-mCherry expressing strains showedred fluorescence localized to the periphery of the cell, indicating thatthe fusion protein is expressed, and that it remains intact. By phenotypictests described for a previous cydB-GFP fusion strain [14], CydB-mCherry was determined to be a functional protein.
The aerobic growth of single- and dual-label strains in batch cultureswas compared to the parental wild-type strain BW25113, with mea-sured cell doubling times under aerobic growth for all strains usedshown in Supplementary Table S1. Function of the CydB-mMaple ex-pressing strain was demonstrated by comparison of growth of thisstrain with wild-type and cydB-knockout strains.
4.1.3. Synthesis of fluorescently labeled ubiquinoneNBDHA-Q was synthesized, modifying a previous protocol [57,58].
4.1.4. General methods and chemical instrumentationCommercially available reagents were used as received without fur-
ther purification. All reactions required anhydrous conditions and wereconducted in flame-dried apparatus under an atmosphere of nitrogen.Analytical thin-layer chromatography (TLC) was performed on silica

820 I. Llorente-Garcia et al. / Biochimica et Biophysica Acta 1837 (2014) 811–824
gel plates (0.25 mm) pre-coated with a fluorescent indicator. Standardflash chromatography procedures were performed using Kieselgel 60(40-63 μm). UV/vis spectra were recorded using a PerkinElmer Lambda35 UV/vis spectrometer. 1H NMR spectra were recorded using a BrukerAV400 NMR spectrometer. Chemical shifts δ are reported in ppm (rela-tive to TMS (δH=0.0) andmultiplicity of signals denoted s= singlet, bs= broad singlet, d = doublet, t = triplet and m = multiplet, respec-tively with coupling constants (J) reported in Hertz (Hz).
4.1.5. Preparation of NBD-idebenone (3)To a solution of 6-aminohexanoic acid (263 mg, 2.00 mmol) and
NaHCO3 (506 mg, 6.00 mmol) in MeOH (20 mL) at 0 °C was added 4-chloro-7-nitrobenzofurazan (NBD-Cl) (401 mg, 2.00 mmol) portion-wise. The reaction was stirred at 50 °C for 2 h before being cooled andacidified by careful addition of dilute HCl (0.1 M). The precipitate wasfiltered off and then purified by flash column chromatography (SiO2;CHCl3 → 2% MeOH in CHCl3) and then by recrystallization fromMeOH/H2O to give 6-(7-nitrobenzo[c][1,2,5]oxadiazol-4-ylamino)hexanoic acid (100 mg) as an orange solid (100 mg); 1H NMR(DMSO-d6) δ = 11.98 (bs, 1H), 9.53 (bs, 1H), 8.51 (d, J = 8.6 Hz, 1H),6.41 (d, J = 8.6 Hz, 1H), 3.51–3.42 (m, 2H), 2.22 (t, J = 7.3 Hz, 2H),1.73–1.64 (m, 2H), 1.61–1.49 (m, 2H), 1.42–1.32 (m, 2H).
To a solution of 100 mg, 0.34 mmol, 3.4 equiv. in anhydrous CH2Cl2(5 ml) under N2 was added N,N′-dicyclohexylcarbodiimide (DCC)(37 mg, 0.18 mmol, 1.8 equiv.) in a reaction vessel shielded from UVlight. The reaction was left to stir at room temperature for 5 h atwhich point the orange solid had fully dissolved and a white precipitate(dicyclohexylurea) was visible. 4-(Dimethylamino)pyridine (DMAP)(1.0 mg, 0.2 μmol, 2.0 × 10⁻³ equiv.) and idebenone (35 mg,0.1 mmol, 1.0 equiv.) were then added and the reaction was left tostir for a further 16 h. The reaction mixture was then filtered and con-centrated under reduced pressure at room temperature, before purifica-tion of the red/orange residue by silica gel chromatography (nHexane:EtOAc; 1:1) limiting UV exposure to a minimum afforded the title com-pound as a bright orange solid (20.9 mg, 34.0%). Rf = 0.27; 1H NMR(400 MHz, CDCl3): δ = 1.03–1.93 (m, 16H, 8 × CH2), 1.97 (s, 3H, CH3),2.39 (t, 2H, J = 6.7 Hz, CH2), 3.43–3.51 (m, 2H, CH2), 3.57–3.68 (m,2H, CH2), 3.85–3.96 (m, 2H, CH2), 4.01 (s, 6H, 2 × OCH3), 6.10 (d, 1H, J= 8.6, CH ß to NO2), 6.71 (brs, 1H, NH), 8.40 (d, 1H, J = 8.6, CH α toNO2); UVmax (EtOH) = 463.
4.2. Optical imaging
4.2.1. MicroscopyFor near-TIRF imaging [59] we used a home-built inverted dual-
color microscope capable of multi-modal illumination, includingcontrolled near-TIRF/TIRF microscopy, providing laser excitation at473 nm and 561 nm wavelengths for GFP and mCherry respectively atintensities in the range 125–250 W cm−2. Emissions were separatedinto green/red channels using a bespoke spectral splitter and imagedat 25 Hz onto separate halves of a 512 × 512pixel, cooled, back-thinned EMCCD camera (iXon + DV897-BI, Andor Technology, UK) ata magnification of ~40 nm/pixel, sampling continuously for up to ~10 s.
We set the focal plane at 100 nm from the glass coverslip surface, toimage cytoplasmic membranes of single E. coli cells [43]. With near-TIRF, the angle of laser incidence was sub-critical at ~45° resulting inoblique transmission into the sample. We obtained high contrast dueto reduction in back-scatter, but resulting in uniform excitation acrossindividual cells unlike conventional TIRF. The objective lens depth offield was low (0.2 μm) compared to E. coli cell diameters (1 μm),resulting in relatively planar imaged sections with little correction re-quired for membrane curvature.
4.2.2. PALM imagingOvernight cultures in LB were diluted 1:20 in M9mediumwith glu-
cose (0.2%) as a carbon source and grown aerobically for 3–4 h to OD600
0.6–0.7 at approximately 30 °C. Cells pellets were obtained by centrifu-gation and washed in filtered growthmedium and fixed in a solution of4% paraformaldehyde, 0.1% glutaraldehyde in phosphate buffered salineat approximately 30 °C for 15 min. Fixed cells and 100 nm gold nano-spheres, used as fiducial markers, were adhered to poly-L-lysine coatedcleaned coverslips by centrifugation in a microcentrifuge at 6000 rpmfor 1 min in coverslip-holder/chambers. Samples were rinsed with fil-tered media and imaged in a reservoir of medium.
Samples were imaged with TIRF illumination in a custom-built fluo-rescence microscope and images rendered as described previously [60].Briefly, a 561 nmwavelength laser of intensity 22 mWmm−2 was usedto excite mMaple fluorophores in their red state and a 405 nm wave-length laser was used to switch fluorophores from their green to redstate. The intensity of the 405 nm laser was continuously increased upto an intensity of 3.5mWmm−2 during acquisition in an approximationto a Fermi activation regime [60], minimizing the likelihood of simulta-neous photoactivation of multiple molecules and thus optimally sepa-rating single molecules in time. Fluorescence was detected by anAndor iXon + EMCCD camera sampling at 50 ms per frame using typi-cally 8000–10,000 consecutive image frames in total for PALM recon-struction. Image reconstruction was as previously reported [60]. Thecenters of cylindrical Gaussian distributions with standard deviationdetermined by the localization uncertainty of that molecule, calculatedas previously described [61], and normalized integrated intensity werecentered on localizations of mMaple. Bright patches are produced bythe summation of multiple Gaussian profiles in close proximity to oneanother. Fields of view showingmultiple cells are shown in Supplemen-tary Fig. 1.
4.2.3. NBDHA-Q-FRAPFRAP experiments were performed using a Leica TCS-SP5 laser-
scanning confocal microscopy with 63× oil-immersion objective(NA 1.4) and excitation wavelength 488 nm, recording emission at515–560 nm.
4.3. Data analysis
4.3.1. Spatial shift between green and red channels during two-colorimaging
The spatial shift between the green and red channels on the imageplane, was determined for each image sequence by finding the positionof best overlap of the two channels on the corresponding brightfield se-quence (non-fluorescence images which bled through into each chan-nel), acquired prior to each fluorescence sequence during dataacquisition. This was done using a frame average (typically 10 frames)of the brightfield sequence, separating it into its red channel andgreen channel halves, calculating a spatial cross-correlation function ofthe top and bottom halves and finding the position of the maximumof that cross-correlation function on the image plane. This positioncorresponded to the spatial shift of the red channel with respect to thegreen one during image acquisition. This shift was typically up to afew pixels and could be due to alignment of the optics and to chromaticaberrations. Only a linear shift on the image plane was considered forour analysis.
4.3.2. Tracking softwareSpots could be localized using bespoke software in MATLAB
(Mathworks) improved from earlier algorithms [62]. This softwarerecognized spots, quantified spot widths as well as corrected for localbackground intensity due to diffusefluorescent protein, cellular autoflu-orescence or ‘dark’ camera noise.
Initially, an average of the first few frames (typically five) in a givenimage sequence was used to obtain, by means of image pixel-thresholding, a cellmask and a backgroundmask, in order to distinguishthe regions on the image where bacteria cells were actually located,from background regions. These cell masks were used for estimating
821I. Llorente-Garcia et al. / Biochimica et Biophysica Acta 1837 (2014) 811–824
cell length and width, as well as for transforming Cartesian coordinatesof tracked spots to a local cell coordinate system referenced to the geo-metric centroid of the cell image.
Candidate positions for bright spotswere found on each framewith-in a given image sequence by applying a combination of morphologicalimage transformations. For candidate spots within the ‘cell’ region, aniterative Gaussian-masking algorithm [23,28,43] was used to locatethe intensity centroid of the bright spots on the image plane with sub-pixel precision (b40 nm). This algorithm essentially finds the positionof best overlap of the spot's intensity distribution with a two-dimensional Gaussian distribution of fixed width (sigma = 2 pixels)which moves around within a fixed squared sub-array of edge length17 pixels. Inside this sub-array, a circular region of diameter 10 pixelsand centered on the determined spot center position, was used to dis-criminate the bright spot from its surroundings.
The average background counts per pixel were calculated from themean of the intensities in all pixels in the background region, i.e. the re-gionwithin the fixed squared sub-array but outside the circular spot re-gion. Background subtraction was then performed by subtracting thisaverage background (per pixel) from the intensity corresponding toeach pixel in the inner circular region. A final total spot intensity wascalculated by adding all resulting intensities, after background subtrac-tion, within this circular region. A Gaussian function was fitted to theresulting background-corrected total spot intensity in order to charac-terize all spots by obtaining their width and peak intensity.
A detected spot was accepted only if it had large enough signal-to-noise ratio (SNR) and r-squared value of the Gaussian fit, and a widthbelow the diameter of the above mentioned inner circular region. TheSNR was calculated as the peak intensity of the Gaussian fit of the spotdivided by the standard deviation of all the intensities in the backgroundregion. The corresponding Gaussian fit for each candidate and acceptedspot was subtracted from the raw frame data before attempting to findthe next spot center. This step improved the chances of detecting spotswhich were very close together, particularly for dim spots adjacent tomuch brighter spots.
Two accepted bright spots in consecutive frames were then linkedinto a track if, simultaneously, their centers were less than 5 pixelsapart, the ratio of their widths was between 0.5 and 2, and the ratio oftheir background-corrected total spot intensities was between 0.5 and3. When there were competing assignments with several bright spotsthat could be possibly linked to a spot in a previous frame, the best as-signment was chosen such that the distance between the spot centersto link was minimized.
We generated simulated data in the form of synthetic imagesequences with controlled background and shot noise levels and ranthese through the algorithm finding a localization precision of b1pixel (i.e. b40 nm).
4.3.3. Stoichiometry analysisFor our stoichiometry calculations, we used the total fluorescence
spot intensity (integrated over the whole spot), and corrected for anylocal background. No filtering of the data was employed. First, aphotobleaching time constant was obtained for a given fluorophore(GFP or mCherry) and data set (at given excitation laser powers) bymeans of two different approaches. The first approach consisted ofobtaining the intensity integrated over the whole bacteria cell body asa function of time, for each image sequence, andfitting it to an exponen-tial decay functionwith no offset. This approachwas consistentwith themeasured background cell autofluorescence contribution being negligi-ble compared to the measured whole cell intensity due to either GFP ormCherry (the measured bleaching rate measured from the parentalstrains, without fluorescent protein labels, was significantly faster).The photobleaching time constants obtained in this way for all imagesequences in a given data set were then used to determine a resultingrange of values for the photobleaching time constant.
These determined time constant values were checked for consis-tency against a second method, which consisted of constructing anaveraged intensity trace from many tracks from many spots withinthe data set. Tracks had their intensity normalized to the initial in-tensity at the start of the track, and their time origin was shiftedso that they would all start at time zero before being averaged.Only tracks with at least 25 points (~1 s long) were used, and onlypoints on the averaged trace resulting from an average over atleast 2–5 tracks were kept. The error for each point on the averagedtrace was calculated appropriately and used for weighting the expo-nential fitting of the resulting averaged trace. A final range of valuesfor the photobleaching decay time constant was obtained combin-ing the ranges of values obtained from the two methods outlinedabove, for every data set and for each fluorophore. The relativeerror in these final estimates was between 7% and 36% for the ma-jority of the data sets, though very rarely as high as 50% for onedata set.
The determined photobleaching time constants were then usedas fixed parameters for fitting the intensities of all tracks from allimages (for a given data set and fluorophore), to exponential fitswith no offset. An estimate of the initial spot intensity at the startof the data acquisition was obtained from the fit. Only tracks witha minimum of 5 data points were fitted, and results from the expo-nential fits with pre-determined time constants were only acceptedfor positive r-squared values and for small enough squared devia-tions of the fitted model from the data points averaged over alldata points. Also, a reduced chi-squared test was performed inorder to assess the goodness of all fits imposing a probability levelof 99% for acceptance.
The stoichiometry of each tracked bright spot was then determinedby dividing the obtained initial intensity for each track by the corre-sponding single-molecule brightness value obtained from purified,immobilized single-molecule fluorescent proteins (SupplementaryFig. 2). From all final stoichiometry values, a histogram or a Gaussiankernel distribution (a sum of many Gaussian curves, one per stoichiom-etry value, centered on the stoichiometry value and with a Gaussianwidth equal to the uncertainty of that value) was derived.
The single-molecule fluorophore brightness (intensity) esti-mates from in vitro data were obtained by firstly detecting pointspread function width (HWHM of 200–300 nm) spots of distinctfluorescence intensity on the frame averaged in vitro image se-quences of single-molecule GFP or mCherry in a manner as de-scribed previously [20]. Traces of spot intensity versus time werethen obtained for each fixed position of the bright spots found onthe frame average. The intensity values were background correctedin the same way as for the previously described analysis of in vivodata.
4.3.4. Calculation of the overlap integral for co-localization analysisHaving two normalized, two-dimensional Gaussian intensity distri-
butions g1 and g2, centered around (x1, y1) with width σ1, and around(x2, y2) with width σ2, respectively, and defined as:
g1 x; yð Þ ¼ e− x−yð Þ2þ y−yð Þ2½ �= 2σ21ð Þ;
g2 x; yð Þ ¼ e− x−yð Þ2þ y−y2ð Þ2½ �= 2σ22ð Þ;
their overlap can be calculated from the integral of their product:
v0 ¼Zþ∞
−∞
Zþ∞
−∞
g1 x−yð Þg2 x−yð Þdxdy ¼ Ce−Δr2= 2 σ21þσ2
2ð Þ½ �:
Here, Δr is the distance between the centers of the Gaussians on thex–y image plane, and C is a normalization constant equal to the

822 I. Llorente-Garcia et al. / Biochimica et Biophysica Acta 1837 (2014) 811–824
maximum overlap possible for two perfectly overlapped spots of differ-ent widths σ1 and σ2, so that:
Δr2 ¼ x1−x2ð Þ2 ¼ y1−y2ð Þ2;C ¼ 2πσ2
1σ22
σ21 þ σ2
2
:
We defined the overlap integral, v, for a pair of spots of known posi-tions and widths as:
v ¼ v0C
¼ e−Δr2= 2 σ21þσ2
2ð Þ½ �:
4.3.5. Calculating the likelihood for random chance co-localization ofOXPHOS fluorescent spots
Using nearest neighbor analysis for a random distribution of parti-cles on a two-dimensional surface – a modification of the analysis pre-sented in [63] for three dimensions – we can call p(r)dr theprobability that the distance from one OXPHOS fluorescent spot in thecell membrane to another of the same type in a given single-label cellstrain is between r and r + dr. This must be equal to the probabilitythat there are zero such fluorescent spots particles in the range 0–r,multiplied by the probability that a single spot exists in the annuluszone between r and r + dr. Thus:
p rð Þdr ¼ 1−Zr
0
p r′� �
dr′24
352πrndr:
Here, n is the number of bright spots per unit area in the patch of cellmembrane observed in the focal plane under near-TIRF imaging. Thisindicates that:
ddr
p2πrn
� �þ 2πrn � p
2πrn¼ 0:
Solving for p(r) and using that p→ 2πrn in the limit r→ 0,we obtain:
p rð Þ ¼ 2πrnexp −πr2n� �
:
Thus, the probability p1(w) that the nearest neighbor spot separa-tion is greater than a distance w is [59]:
p1 wð Þ ¼ 1−Zw
0
p rð Þdr ¼ 1−Zw
0
2πr exp −πr2n� �
dr ¼ exp −πw2n� �
:
The effective number density per unit area, n, at the focal plane isgiven by the number of spots Nmem observed in the cell membrane(Nmem ~4 spots per image on average over all cell strains: 2 spots ineach channel, i.e., 2 mCherry-labeled plus 2 GFP-labeled OXPHOS com-plexes), divided by the portion, A, of the E. coli cell membrane imaged infocus within the 0.2 μmdepth of field of our microscope's objective lensusing near-TIRF illumination. Assuming each cell can be approximatedby a cylinder capped with hemispheres of total length ~3 μm and diam-eter ~1 μm,we estimate that approximately a quarter of the total surfacecell membrane area of the bacteria is within 200 nm of the coverslip andimaged in focus (the focal plane was set at ~100 nm from the glasscoverslip). Therefore A ~ 2.5 μm2 (the total bacterial membranearea would be ~9 μm2 or ~ 6,000 pixels2 on our camera detector).
The probability that a nearest neighbor spot will be a distance lessthan w away is given by 1-p1(w) = 1-exp(−πw2Nmem/A). If w is setto be the optical resolution limit (wres ~ 0.3 μm, equivalent to ~6 pixelson our camera detector) then we obtain a value 1-p1(wres) = 0.37.The probability of chance co-localization of two spots of different
types (different OXPHOS complexes) is 2/3 of that value, i.e. 0.24.Therefore, the probability of chance co-localization of differentOXPHOS complexes within the optical resolution limit of our micro-scope is pchance ≈ 24%.
Note that we have made sure that bleed-through from one channel(color) into the otherwas negligible. Additionally, possible spontaneousspectral shifts due to changes in the cell environment (in thefluorophore neighborhood) are small, of order ~20–30 nm [25,64]. Inour experiments, GFP and mCherry fluorophores are excited at laserwavelengths of 473 nm and 561 nm, respectively, which are ~90 nmapart. Our excitationfilters are ~20nmwide, and so are our emission fil-ters, for which the central wavelengths are also ~90 nm apart. Hence,possible small spectral shifts could not be responsible for ‘false positives’of co-localization.
4.3.6. Comparison to other reported methods for co-localization analysisAlternative popular recent methods of co-localization analysis are
image cross-correlation spectroscopy (ICCS) [65] and standard fluores-cence microscopy co-localization algorithms such as Pearson's coeffi-cient and Manders' coefficients M1 and M2 [66]. Pearson's coefficientonly performs well for samples with similar stoichiometries (numberdensities) of fluorescently labeled complexes in each channel, and themethod based on Manders' coefficients works well for number densityratios up to ~2, being very sensitive to the choice of the relevant re-quired thresholds which can in turn be determined through automaticalgorithms [67]. Both Pearson's and Manders' coefficient methodswork better at low particle densities and are more sensitive than ICCS,being capable of measuring low levels of co-localization. ICCS performsbetter at high number densities and is more accurate when the particledensities in the two channels are different (density ratios up to ~10).However, ICCS fails for low co-localization fractions and is particularlysensitive to image heterogeneity, since a step involving fitting a spatialcorrelation function to a Gaussian can become non-trivial for imagesin which the spatial distribution of bright particles is not sufficientlyuniform (for instance, images with sharp bright edges such as cellboundaries), making the automation of this step technically challeng-ing, and hence making the ICCSmethod unusable in a practical context.
Given the very different stoichiometries of the labeled complexes inour red and green channels, the low level of co-localization seen on ourimage sequences, and the heterogeneity of our fluorescence imageshere, we use ‘co-localization value’ maps and estimate co-localizationfractions by use of overlap integrals. Our calculation of overlap integralsis similar to that described previously [28], but improves the algorithmby employing a Rayleigh-type criterion to determine a co-localizationthreshold, where histograms of displacements on the image plane ofputatively co-localized spots are plotted and fitted to a 2D Gaussianfunction using three times the Gaussian width as a fixed threshold todetermine co-localization fractions. The authors have recently becomeaware of a similar approach to ours in recent work [68] However, ourmethod is more generic and includes the possibility of considering var-iable spot widths in the two channels when calculating the overlapintegral.
4.3.7. Mobility analysisThe Bayesian Ranking of Diffusion (BARD) analysis inputs spatial x–y
coordinates for each detected spot as a function of time over which is itis tracked, and constructs an estimate for the theoretical posterior distri-bution corresponding to common diffusion modes of anomalous/sub-diffusion, normal/Brownian, confined, or directed diffusion by usingthemeasuredmean square displacement (MSD) of each track in combi-nation with analytical prior distributions which indicate the expecta-tions of mobility parameters. The MSD for anomalous, Brownian anddirected diffusion was modeled as:
MSD ¼ 4Dτα þ vτ2;

823I. Llorente-Garcia et al. / Biochimica et Biophysica Acta 1837 (2014) 811–824
where D is the apparent diffusion coefficient, τ the time interval, α theanomalous diffusion coefficient (set to precisely 1 for Brownian, and0.7–0.8 for anomalous diffusion) and v is the mean drift-speed (set toprecisely zero for Brownian and anomalous diffusion models). For con-fined diffusion, a circularly symmetrical confinement domain wasmodeled in which Brownian diffusion could occur inside the domainsubject to a harmonic potential well such that a particle at the domainedge experiences a forcing function that drives it back into the domain[25].
The calculated posteriors were then ranked from lowest to highestprobability, with highest corresponding to the most likely model ac-counting for the observed data. Relevant mobility parameters for eachdiffusionmode, for example the diffusion coefficient and the equivalentradius of a confinement domain, could then be extracted for each track.
The performance of the BARD algorithm was characterized thor-oughly using multiple simulated 2D tracks of particles covering abroad range of effective diffusion coefficients and confinement radii,as well as other mobility parameters such as mean drift speed andanomalous diffusion coefficient, as outlined in full in [25]. Simulatingpurely immobile particles, i.e. with a zero effective diffusion coefficient,but with a realistic Gaussian noise on spatial localization equivalent tothe high end of the experimental localization precision for a singleGFPmolecule under our imaging conditions of sigmawidth ~40 nm, in-dicated that the most likely diffusion model from the four candidatesmodels used above was confined with a predicated confinement radiusof 15 ± 10 nm. Brighter diffusing particles, e.g. equivalent to the inten-sity of 10–100 fluorescent protein molecules as found from our experi-mental OXPHOS data, have a smaller localization precision by roughlythe square-root of this increase in brightness factor [61], consistentwith our simulations indicating a range of localization precision of ~5–30 nm across the range of spot intensities we observed experimentally,indicating a predicted confinement radius for simulated immobile par-ticles of more typically ~5 nm.
4.3.8. Respiratory rate analysisOxygen uptake of E. coli cultures at defined temperatures was mea-
sured in a Hansatech Oxylab electrode, with water-jacketed electrodechamber for temperature control.
Supplementary data to this article can be found online at http://dx.doi.org/10.1016/j.bbabio.2014.01.020.
Acknowledgements
We thank Abdullah Al-Mahmood for preliminary FRAP develop-ment, and Ian Dobbie for technical microscopy support. We thank AnnMcEvoy and Will Draper for advice on PALM. This work was fundedby an EPSRC grant EP/G061009/1, the Biological Physical Sciences Insti-tute (BPSI) at York University and Royal Society URF (M.C.L.), RCUKscholarships (O.H. and A.R.), Wellcome Trust VIP Award (T.L. andC.W.M.), Marie Curie Intra-European Fellowship FP7-PEOPLE-2009-IEF254575 (L.-N.L.), NIH grant GM RO1 32543 (C.B.), Deutsche ForschungsGemeinschaft FOR 929 (T.F.), and BBSRC grant BB/J016985/1 (C.W.M.).
References
[1] P. Mitchell, Coupling of phosphorylation to electron and hydrogen transfer by achemi-osmotic type of mechanism, Nature 191 (1961) 144–148.
[2] P.R. Rich, Themolecular machinery of Keilin's respiratory chain, Biochem. Soc. Trans.31 (2003) 1095–1105.
[3] G. Unden, J. Bongaerts, Alternative respiratory pathways of Escherichia coli: energet-ics and transcriptional regulation in response to electron acceptors, Acta Bioenerg.1320 (1997) 217–234.
[4] G. Lenaz, M.L. Genova, Kinetics of integrated electron transfer in the mitochondrialrespiratory chain: random collisions vs. solid state electron channeling, Am. J. Phys-iol. Cell Physiol. 292 (2007) C1221–C1239.
[5] B. Chance, G.R. Williams, A method for the localization of sites for oxidative phos-phorylation, Nature 176 (1955) 250–254.
[6] H. Schägger, K. Pfeiffer, Supercomplexes in the respiratory chains of yeast andmam-malian mitochondria, EMBO J. 19 (2000) 1777–1783.
[7] C.M. Cruciat, S. Brunner, F. Baumann, W. Neupert, R.A. Stuart, The cytochrome bc1and cytochrome c oxidase complexes associate to form a single supracomplex inyeast mitochondria, J. Biol. Chem. 275 (2000) 18093–18098.
[8] A. Stroh, O. Anderka, K. Pfeiffer, T. Yagi, M. Finel, B. Ludwig, et al., Assembly of respi-ratory complexes I, III, and IV into NADH oxidase supercomplex stabilizes complex Iin Paracoccus denitrificans, J. Biol. Chem. 279 (2004) 5000–5007.
[9] M. Zhang, E. Mileykovskaya, W. Dowhan, Cardiolipin is essential for organization ofcomplexes III and IV into a supercomplex in intact yeast mitochondria, J. Biol. Chem.280 (2005) 29403–29408.
[10] E. Nübel, I. Wittig, S. Kerscher, U. Brandt, H. Schägger, Two-dimensional native elec-trophoretic analysis of respiratory supercomplexes from Yarrowia lipolytica, Prote-omics 9 (2009) 2408–2418.
[11] N.V. Dudkina, J. Heinemeyer, S. Sunderhaus, E.J. Boekema, H.-P. Braun, Respiratorychain supercomplexes in the plant mitochondrial membrane, Trends Plant Sci. 11(2006) 232–240.
[12] E. Schäfer, H. Seelert, N.H. Reifschneider, F. Krause, N.A. Dencher, J. Vonck, Architec-ture of active mammalian respiratory chain supercomplexes, J. Biol. Chem. 281(2006) 15370–15375.
[13] A.S. Johnson, S. van Horck, P.J. Lewis, Dynamic localization of membrane proteins inBacillus subtilis, Microbiology 150 (2004) 2815–2824.
[14] T. Lenn, M.C. Leake, C.W. Mullineaux, Clustering and dynamics of cytochrome bd-Icomplexes in the Escherichia coli plasma membrane in vivo, Mol. Microbiol. 70(2008) 1397–1407.
[15] M. Renz, T. Rendler, M. Börsch, Diffusion Properties of Single FoF1-ATP Synthases ina Living Bacterium Unraveled by Localization, Microscopy, 2012. (822513–822513–11).
[16] T. Appelhans, C.P. Richter, V. Wilkens, S.T. Hess, J. Piehler, K.B. Busch, Nanoscale or-ganization of mitochondrial microcompartments revealed by combining trackingand localization microscopy, Nano Lett. 12 (2012) 610–616.
[17] T. Lenn, M.C. Leake, C.W. Mullineaux, Are Escherichia coli OXPHOS complexes con-centrated in specialized zones within the plasma membrane? Biochem. Soc. Trans.36 (2008) 1032–1036.
[18] H. Erhardt, F. Dempwolff, M. Pfreundschuh, M. Riehle, C. Schäfer, T. Pohl, et al., Or-ganization of the Escherichia coli aerobic enzyme complexes of oxidative phosphor-ylation in dynamic domains within the cytoplasmic membrane, Microbiol. Open(Jan 7 2014) (Accepted 7 Jan 2014).
[19] B. Cui, C. Wu, L. Chen, A. Ramirez, E.L. Bearer, W.-P. Li, et al., One at a time, live track-ing of NGF axonal transport using quantum dots, Proc. Natl. Acad. Sci. U. S. A. 104(2007) 13666–13671.
[20] A. Badrinarayanan, R. Reyes-Lamothe, S. Uphoff, M.C. Leake, D.J. Sherratt, In vivo ar-chitecture and action of bacterial structural maintenance of chromosome proteins,Science 338 (2012) 528–531.
[21] B. Huang, M. Bates, X. Zhuang, Super-resolution fluorescence microscopy, Annu.Rev. Biochem. 78 (2009) 993–1016.
[22] A.L. McEvoy, H. Hoi, M. Bates, E. Platonova, P.J. Cranfill, M.A. Baird, et al., mMaple: aphotoconvertible fluorescent protein for use in multiple imaging modalities, PLoSOne 7 (2012) e51314.
[23] R. Reyes-Lamothe, D.J. Sherratt, M.C. Leake, Stoichiometry and architecture of activeDNA replication machinery in Escherichia coli, Science 328 (2010) 498–501.
[24] Y. Taniguchi, P.J. Choi, G.-W. Li, H. Chen, M. Babu, J. Hearn, et al., Quantifying E. coliproteome and transcriptome with single-molecule sensitivity in single cells, Science329 (2010) 533–538.
[25] A. Robson, K. Burrage, M.C. Leake, Inferring diffusion in single live cells at thesingle-molecule level, Philos. Trans. R. Soc. Lond. B Biol. Sci. 368 (2013) 20120029.
[26] S. Wieser, G.J. Schutz, M.E. Cooper, Single molecule diffusion analysis on cellularnanotubules: implications on plasma membrane structure below the diffractionlimit, Appl. Phys. 91 (23) (2007) p233901.
[27] M. Renner, Y. Domanov, F. Sandrin, I. Izeddin, P. Bassereau, A. Triller, Lateral diffu-sion on tubular membranes: quantification of measurements bias, PLoS One 6(2011) e25731.
[28] I.E.G. Morrison, I. Karakikes, R.E. Barber, N. Fernández, R.J. Cherry, Detecting andquantifying colocalization of cell surface molecules by single particle fluorescenceimaging, Biophys. J. 85 (2003) 4110–4121.
[29] B. Chazotte, E.S. Wu, C.R. Hackenbrock, The mobility of a fluorescent ubiquinone inmodel lipid membranes. Relevance to mitochondrial electron transport, Biochim.Biophys. Acta 1058 (1991) 400–409.
[30] E. Boye, A. Løbner-Olesen, Bacterial growth control studied by flow cytometry, Res.Microbiol. 142 (1991) 131–135.
[31] I. Fishov, C.L. Woldringh, Visualization of membrane domains in Escherichia coli, Mol.Microbiol. 32 (1999) 1166–1172.
[32] H. Kirchhoff, S. Haferkamp, J.F. Allen, D.B.A. Epstein, C.W. Mullineaux, Protein diffu-sion and macromolecular crowding in thylakoid membranes, Plant Physiol. 146(2008) 1571–1578.
[33] J.F. Gillooly, J.H. Brown, G.B. West, V.M. Savage, E.L. Charnov, Effects of size and tem-perature on metabolic rate, Science 293 (2001) 2248–2251.
[34] E.A. Berry, B.L. Trumpower, Isolation of ubiquinol oxidase from Paracoccusdenitrificans and resolution into cytochrome bc1 and cytochrome c-aa3 complexes,J. Biol. Chem. 260 (1985) 2458–2467.
[35] P.M.F. Sousa, S.T.N. Silva, B.L. Hood, N. Charro, J.N. Carita, F. Vaz, et al., Supramolec-ular organizations in the aerobic respiratory chain of Escherichia coli, Biochimie 93(2011) 418–425.
[36] P. Cicuta, S.L. Keller, S.L. Veatch, Diffusion of liquid domains in lipid bilayer mem-branes, J. Phys. Chem. B 111 (2007) 3328–3331.
[37] S.L. Veatch, P. Cicuta, P. Sengupta, A. Honerkamp-Smith, D. Holowka, B. Baird,Critical fluctuations in plasma membrane vesicles, ACS Chem. Biol. 3 (2008)287–293.
824 I. Llorente-Garcia et al. / Biochimica et Biophysica Acta 1837 (2014) 811–824
[38] E.J. Deeds, O. Ashenberg, J. Gerardin, E.I. Shakhnovich, Robust protein–protein inter-actions in crowded cellular environments, Proc. Natl. Acad. Sci. U. S. A. 104 (2007)14952–14957.
[39] R.N. Frese, J.C. Pàmies, J.D. Olsen, S. Bahatyrova, C.D. van der Weij-de Wit, T.J.Aartsma, et al., Protein shape and crowding drive domain formation and curvaturein biological membranes, Biophys. J. 94 (2008) 640–647.
[40] N. Wilke, B. Maggio, The influence of domain crowding on the lateral diffusion ofceramide-enriched domains in a sphingomyelin monolayer, J. Phys. Chem. B 113(2009) 12844–12851.
[41] S. Shalel-Levanon, K.-Y. San, G.N. Bennett, Effect of oxygen, and ArcA and FNR regu-lators on the expression of genes related to the electron transfer chain and the TCAcycle in Escherichia coli, Metab. Eng. 7 (2005) 364–374.
[42] H.F. Lodish, Molecular Cell Biology, 4th ed. W.H. Freeman, New York, 2000.[43] M.C. Leake, J.H. Chandler, G.H. Wadhams, F. Bai, R.M. Berry, J.P. Armitage, Stoichiom-
etry and turnover in single, functioning membrane protein complexes, Nature 443(2006) 355–358.
[44] D.A. Cherepanov, B.A. Feniouk, W. Junge, A.Y. Mulkidjanian, Low dielectric permit-tivity of water at themembrane interface: effect on the energy couplingmechanismin biological membranes, Biophys. J. 85 (2003) 1307.
[45] E. Lapuente-Brun, R. Moreno-Loshuertos, R. Acín-Pérez, A. Latorre-Pellicer, C. Colás,E. Balsa, et al., Supercomplex assembly determines electron flux in themitochondri-al electron transport chain, Science 340 (2013) 1567–1570.
[46] G.B. John, Y. Shang, L. Li, C. Renken, C.A. Mannella, J.M.L. Selker, et al., The mitochon-drial inner membrane protein mitofilin controls cristae morphology, Mol. Biol. Cell16 (2005) 1543–1554.
[47] P.M.F. Sousa, M.A.M. Videira, A. Bohn, B.L. Hood, T.P. Conrads, L.F. Goulao, et al., Theaerobic respiratory chain of Escherichia coli: from genes to supercomplexes, Micro-biology 158 (2012) 2408–2418.
[48] V.Wilkens,W. Kohl, K. Busch, Restricted diffusion of OXPHOS complexes in dynamicmitochondria delays their exchange between cristae and engenders a transitorymosaic distribution, J. Cell Sci. 126 (2013) 103–116.
[49] L.-N. Liu, S.J. Bryan, F. Huang, J. Yu, P.J. Nixon, P.R. Rich, et al., Control of electrontransport routes through redox-regulated redistribution of respiratory complexes,Proc. Natl. Acad. Sci. U. S. A. 109 (2012) 11431–11436.
[50] T. Lenn, M.C. Leake, Experimental approaches for addressing fundamental biologicalquestions in living, functioning cells with single molecule precision, Open Biol. 2(2012) 120090.
[51] K.A. Datsenko, B.L.Wanner, One-step inactivation of chromosomal genes in Escherichiacoli K-12 using PCR products, Proc. Natl. Acad. Sci. U. S. A. 97 (2000) 6640–6645.
[52] T. Pohl, M. Uhlmann, M. Kaufenstein, T. Friedrich, Lambda red-mediatedmutagenesis and efficient large scale affinity purification of the Escherichia coliNADH:ubiquinone oxidoreductase (Complex I)†, Biochemistry 46 (2007)10694–10702.
[53] Y. Ito, M. Suzuki, Y. Husimi, A novel mutant of green fluorescent protein with en-hanced sensitivity for microanalysis at 488 nm excitation, Biochem. Biophys. Res.Commun. 264 (1999) 556–560.
[54] N.C. Shaner, R.E. Campbell, P.A. Steinbach, B.N.G. Giepmans, A.E. Palmer, R.Y. Tsien,Improved monomeric red, orange and yellow fluorescent proteins derived fromDiscosoma sp. red fluorescent protein, Nat. Biotechnol. 22 (2004) 1567–1572.
[55] T.E. Kuhlman, E.C. Cox, Site-specific chromosomal integration of large synthetic con-structs, Nucleic Acids Res. 38 (2010) e92.
[56] T. Kolmsee, R. Hengge, Rare codons play a positive role in the expression of the sta-tionary phase sigma factor RpoS (σS) in Escherichia coli, RNA Biol. 8 (5) (2011)913–921.
[57] C.A. Yu, L.Q. Gu, Y.Z. Lin, L. Yu, Effect of alkyl side chain variation on the electron-transferactivity of ubiquinone derivatives, Biochemistry 24 (1985) 3897–3902.
[58] J. Novotný, K. Pospechová, A. Hrabálek, R. Cáp, K. Vávrová, Synthesis of fluorescent C24-ceramide: evidence for acyl chain length dependent differences in penetration of exog-enousNBD-ceramides intohuman skin, Bioorg.Med. Chem. Lett. 19 (2009) 6975–6977.
[59] G.J. Schutz, M. Sonnleitner, H. Schindler, Ultrasensitive microscopy of the plasmamembrane of living cells, J. Fluoresc. 11 (2001) 177–185.
[60] S.-H. Lee, J.Y. Shin, A. Lee, C. Bustamante, Counting single photoactivatable fluores-cent molecules by photoactivated localization microscopy (PALM), Proc. Natl.Acad. Sci. U. S. A. 109 (2012) 17436–17441.
[61] R.E. Thompson, D.R. Larson, W.W. Webb, Precise nanometer localization analysis forindividual fluorescent probes, Biophys. J. 82 (5) (2002) 2775–2783.
[62] M.C. Leake, N.P. Greene, R.M. Godun, T. Granjon, G. Buchanan, S. Chen, et al., Variablestoichiometry of the TatA component of the twin-arginine protein transport systemobserved by in vivo single-molecule imaging, Proc. Natl. Acad. Sci. U. S. A. 105(2008) 15376–15381.
[63] S. Chandrasekhar, Stochastic problems in physics and astronomy, Rev. Mod. Phys. 15(1943) 0001–0089.
[64] M.A. Rizzo, M.W. Davidson, D.W. Piston, Fluorescent protein tracking and detection:fluorescent protein structure and color variants, Cold Spring Harb. Protoc. (2009),http://dx.doi.org/10.1101/pdb.top63.
[65] J.W.D. Comeau, S. Costantino, P.W. Wiseman, A guide to accurate fluorescence mi-croscopy colocalization measurements, Biophys. J. 91 (2006) 4611–4622.
[66] E.M.M. Manders, F.J. Verbeek, J.A. Aten, Measurement of co-localization of objects indual-color confocal images, J. Microsc. 169 (1993) 375–382.
[67] S.V. Costes, D. Daelemans, E.H. Cho, Z. Dobbin, G. Pavlakis, S. Lockett, Automatic andquantitative measurement of protein–protein colocalization in live cells, Biophys. J.86 (2004) 3993–4003.
[68] A. Revyakin, Z. Zhang, R.A. Coleman, Y. Li, C. Inouye, J.K. Lucas, et al., Transcriptioninitiation by human RNA polymerase II visualized at single-molecule resolution,Genes Dev. 26 (2012) 1691–1702.
Copyright © 2022 FDOKUMEN