Canalization of Gene Expression in the Drosophila Blastoderm by Gap Gene Cross Regulation
13
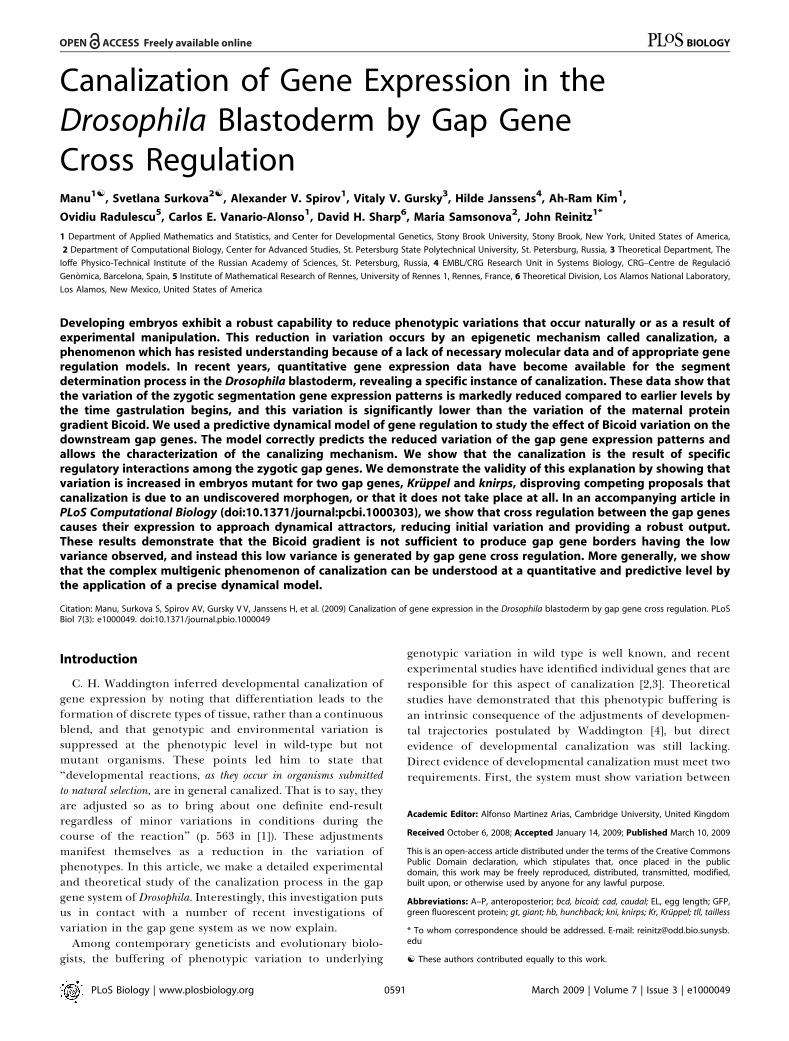
Canalization of Gene Expression in the Drosophila Blastoderm by Gap Gene Cross Regulation Manu 1[ , Svetlana Surkova 2[ , Alexander V. Spirov 1 , Vitaly V. Gursky 3 , Hilde Janssens 4 , Ah-Ram Kim 1 , Ovidiu Radulescu 5 , Carlos E. Vanario-Alonso 1 , David H. Sharp 6 , Maria Samsonova 2 , John Reinitz 1* 1 Department of Applied Mathematics and Statistics, and Center for Developmental Genetics, Stony Brook University, Stony Brook, New York, United States of America, 2 Department of Computational Biology, Center for Advanced Studies, St. Petersburg State Polytechnical University, St. Petersburg, Russia, 3 Theoretical Department, The Ioffe Physico-Technical Institute of the Russian Academy of Sciences, St. Petersburg, Russia, 4 EMBL/CRG Research Unit in Systems Biology, CRG–Centre de Regulacio ´ Geno ` mica, Barcelona, Spain, 5 Institute of Mathematical Research of Rennes, University of Rennes 1, Rennes, France, 6 Theoretical Division, Los Alamos National Laboratory, Los Alamos, New Mexico, United States of America Developing embryos exhibit a robust capability to reduce phenotypic variations that occur naturally or as a result of experimental manipulation. This reduction in variation occurs by an epigenetic mechanism called canalization, a phenomenon which has resisted understanding because of a lack of necessary molecular data and of appropriate gene regulation models. In recent years, quantitative gene expression data have become available for the segment determination process in the Drosophila blastoderm, revealing a specific instance of canalization. These data show that the variation of the zygotic segmentation gene expression patterns is markedly reduced compared to earlier levels by the time gastrulation begins, and this variation is significantly lower than the variation of the maternal protein gradient Bicoid. We used a predictive dynamical model of gene regulation to study the effect of Bicoid variation on the downstream gap genes. The model correctly predicts the reduced variation of the gap gene expression patterns and allows the characterization of the canalizing mechanism. We show that the canalization is the result of specific regulatory interactions among the zygotic gap genes. We demonstrate the validity of this explanation by showing that variation is increased in embryos mutant for two gap genes, Kru ¨ppel and knirps, disproving competing proposals that canalization is due to an undiscovered morphogen, or that it does not take place at all. In an accompanying article in PLoS Computational Biology (doi:10.1371/journal:pcbi.1000303), we show that cross regulation between the gap genes causes their expression to approach dynamical attractors, reducing initial variation and providing a robust output. These results demonstrate that the Bicoid gradient is not sufficient to produce gap gene borders having the low variance observed, and instead this low variance is generated by gap gene cross regulation. More generally, we show that the complex multigenic phenomenon of canalization can be understood at a quantitative and predictive level by the application of a precise dynamical model. Citation: Manu, Surkova S, Spirov AV, Gursky V V, Janssens H, et al. (2009) Canalization of gene expression in the Drosophila blastoderm by gap gene cross regulation. PLoS Biol 7(3): e1000049. doi:10.1371/journal.pbio.1000049 Introduction C. H. Waddington inferred developmental canalization of gene expression by noting that differentiation leads to the formation of discrete types of tissue, rather than a continuous blend, and that genotypic and environmental variation is suppressed at the phenotypic level in wild-type but not mutant organisms. These points led him to state that ‘‘developmental reactions, as they occur in organisms submitted to natural selection, are in general canalized. That is to say, they are adjusted so as to bring about one definite end-result regardless of minor variations in conditions during the course of the reaction’’ (p. 563 in [1]). These adjustments manifest themselves as a reduction in the variation of phenotypes. In this article, we make a detailed experimental and theoretical study of the canalization process in the gap gene system of Drosophila. Interestingly, this investigation puts us in contact with a number of recent investigations of variation in the gap gene system as we now explain. Among contemporary geneticists and evolutionary biolo- gists, the buffering of phenotypic variation to underlying genotypic variation in wild type is well known, and recent experimental studies have identified individual genes that are responsible for this aspect of canalization [2,3]. Theoretical studies have demonstrated that this phenotypic buffering is an intrinsic consequence of the adjustments of developmen- tal trajectories postulated by Waddington [4], but direct evidence of developmental canalization was still lacking. Direct evidence of developmental canalization must meet two requirements. First, the system must show variation between Academic Editor: Alfonso Martinez Arias, Cambridge University, United Kingdom Received October 6, 2008; Accepted January 14, 2009; Published March 10, 2009 This is an open-access article distributed under the terms of the Creative Commons Public Domain declaration, which stipulates that, once placed in the public domain, this work may be freely reproduced, distributed, transmitted, modified, built upon, or otherwise used by anyone for any lawful purpose. Abbreviations: A–P, anteroposterior; bcd, bicoid; cad, caudal; EL, egg length; GFP, green fluorescent protein; gt, giant; hb, hunchback; kni, knirps; Kr, Kru ¨ppel; tll, tailless * To whom correspondence should be addressed. E-mail: [email protected]. edu [ These authors contributed equally to this work. PLoS Biology | www.plosbiology.org March 2009 | Volume 7 | Issue 3 | e1000049 0591 P L o S BIOLOGY
Transcript of Canalization of Gene Expression in the Drosophila Blastoderm by Gap Gene Cross Regulation
Canalization of Gene Expression in theDrosophila Blastoderm by Gap GeneCross RegulationManu
1[, Svetlana Surkova
2[, Alexander V. Spirov
1, Vitaly V. Gursky
3, Hilde Janssens
4, Ah-Ram Kim
1,
Ovidiu Radulescu5
, Carlos E. Vanario-Alonso1
, David H. Sharp6
, Maria Samsonova2
, John Reinitz1*
1 Department of Applied Mathematics and Statistics, and Center for Developmental Genetics, Stony Brook University, Stony Brook, New York, United States of America,
2 Department of Computational Biology, Center for Advanced Studies, St. Petersburg State Polytechnical University, St. Petersburg, Russia, 3 Theoretical Department, The
Ioffe Physico-Technical Institute of the Russian Academy of Sciences, St. Petersburg, Russia, 4 EMBL/CRG Research Unit in Systems Biology, CRG–Centre de Regulacio
Genomica, Barcelona, Spain, 5 Institute of Mathematical Research of Rennes, University of Rennes 1, Rennes, France, 6 Theoretical Division, Los Alamos National Laboratory,
Los Alamos, New Mexico, United States of America
Developing embryos exhibit a robust capability to reduce phenotypic variations that occur naturally or as a result ofexperimental manipulation. This reduction in variation occurs by an epigenetic mechanism called canalization, aphenomenon which has resisted understanding because of a lack of necessary molecular data and of appropriate generegulation models. In recent years, quantitative gene expression data have become available for the segmentdetermination process in the Drosophila blastoderm, revealing a specific instance of canalization. These data show thatthe variation of the zygotic segmentation gene expression patterns is markedly reduced compared to earlier levels bythe time gastrulation begins, and this variation is significantly lower than the variation of the maternal proteingradient Bicoid. We used a predictive dynamical model of gene regulation to study the effect of Bicoid variation on thedownstream gap genes. The model correctly predicts the reduced variation of the gap gene expression patterns andallows the characterization of the canalizing mechanism. We show that the canalization is the result of specificregulatory interactions among the zygotic gap genes. We demonstrate the validity of this explanation by showing thatvariation is increased in embryos mutant for two gap genes, Kruppel and knirps, disproving competing proposals thatcanalization is due to an undiscovered morphogen, or that it does not take place at all. In an accompanying article inPLoS Computational Biology (doi:10.1371/journal:pcbi.1000303), we show that cross regulation between the gap genescauses their expression to approach dynamical attractors, reducing initial variation and providing a robust output.These results demonstrate that the Bicoid gradient is not sufficient to produce gap gene borders having the lowvariance observed, and instead this low variance is generated by gap gene cross regulation. More generally, we showthat the complex multigenic phenomenon of canalization can be understood at a quantitative and predictive level bythe application of a precise dynamical model.
Citation: Manu, Surkova S, Spirov AV, Gursky V V, Janssens H, et al. (2009) Canalization of gene expression in the Drosophila blastoderm by gap gene cross regulation. PLoSBiol 7(3): e1000049. doi:10.1371/journal.pbio.1000049
Introduction
C. H. Waddington inferred developmental canalization ofgene expression by noting that differentiation leads to theformation of discrete types of tissue, rather than a continuousblend, and that genotypic and environmental variation issuppressed at the phenotypic level in wild-type but notmutant organisms. These points led him to state that‘‘developmental reactions, as they occur in organisms submittedto natural selection, are in general canalized. That is to say, theyare adjusted so as to bring about one definite end-resultregardless of minor variations in conditions during thecourse of the reaction’’ (p. 563 in [1]). These adjustmentsmanifest themselves as a reduction in the variation ofphenotypes. In this article, we make a detailed experimentaland theoretical study of the canalization process in the gapgene system of Drosophila. Interestingly, this investigation putsus in contact with a number of recent investigations ofvariation in the gap gene system as we now explain.
Among contemporary geneticists and evolutionary biolo-gists, the buffering of phenotypic variation to underlying
genotypic variation in wild type is well known, and recentexperimental studies have identified individual genes that areresponsible for this aspect of canalization [2,3]. Theoreticalstudies have demonstrated that this phenotypic buffering isan intrinsic consequence of the adjustments of developmen-tal trajectories postulated by Waddington [4], but directevidence of developmental canalization was still lacking.Direct evidence of developmental canalization must meet tworequirements. First, the system must show variation between
Academic Editor: Alfonso Martinez Arias, Cambridge University, United Kingdom
Received October 6, 2008; Accepted January 14, 2009; Published March 10, 2009
This is an open-access article distributed under the terms of the Creative CommonsPublic Domain declaration, which stipulates that, once placed in the publicdomain, this work may be freely reproduced, distributed, transmitted, modified,built upon, or otherwise used by anyone for any lawful purpose.
Abbreviations: A–P, anteroposterior; bcd, bicoid; cad, caudal; EL, egg length; GFP,green fluorescent protein; gt, giant; hb, hunchback; kni, knirps; Kr, Kruppel; tll, tailless
* To whom correspondence should be addressed. E-mail: [email protected]
[ These authors contributed equally to this work.
PLoS Biology | www.plosbiology.org March 2009 | Volume 7 | Issue 3 | e10000490591
PLoS BIOLOGY

individuals that decreases significantly over the course ofdevelopment. Second, this decrease in variation must bedemonstrated to be an inherent property of the system understudy, rather than being imposed from a different part orfrom outside the organism. The first requirement implies theneed for data on the dynamics of developmental determi-nants, some or all of which will be molecular. Thedemonstration that reduction in variance of a developmentalsystem is inherent to that system requires precise under-standing of the consequences of the interaction of manydevelopmental determinants. Understanding such conse-quences requires a quantitative model.
The segmentation system of Drosophila melanogaster [5,6] ishighly suitable for studies of canalization because it is alreadyknown that the first of the above requirements, decrease inphenotypic variability over time, is satisfied. In work reportedelsewhere [6], we performed a quantitative analysis of theexpression of segmentation genes expressed from thematernal genome only (bicoid), the maternal and zygoticgenomes (caudal and hunchback), and the zygotic genome(Kruppel, giant, knirps, tailless, fushi tarazu, even skipped, runt,hairy, odd skipped, paired, and sloppy paired). These expressiondata have cellular resolution in space and about 6.5-minresolution in time, and comprise either the expression levelsof even skipped (eve) and two other genes in individual embryosor the integrated averaged expression of all 14 protein geneproducts. These data show that segmentation gene expressionis highly variable among individual embryos in cleavage cycle13 and the early part of cycle 14. There is extensive variationin expression levels, locations of domain borders, and thetime and order of the appearance of individual domains.However, the variation in the expression patterns reducesover time and is significantly lower at the onset ofgastrulation than at earlier times.
In this article, we restrict our attention to a particularlyimportant class of phenomena concerning the variation inthe location of the boundaries of zygotic gene expressiondomains. These boundaries shift when maternal gradients are
perturbed, and hence are at least in part under the control ofthese gradients [7,8]. Nevertheless, the variation in theboundary positions of gap and pair-rule expression domainsis much lower than the variation in the maternal gradient ofBicoid (Bcd) protein [6,9,10]. Under the simplest model ofspecification, expression borders would form at a fixedthreshold of its concentration [11]. The variation of the Bcdgradient can be measured in terms of the range (qBcd) orstandard deviation (rBcd) of the position (xBcd) where itcrosses the threshold concentration. In our data rBcd¼ 4.6%egg length (EL), whereas gap gene domain border positionshave r ; 1% EL [6]. Pair-rule stripe border positions alsohave similar low variation [6] compared to the Bcd thresholdposition.Of the large number of gene expression borders that have
lesser variation than Bcd, the posterior border of the anteriorhunchback (hb) domain has received intense scrutiny [9,12–18].Gregor and colleagues [16] measured the absolute concen-tration of Bcd in the nuclei at the hb border using a Bcd-GFPfusion rescue construct. This measurement led the authors totwo important but mutually contradictory conclusions. First,using a result from bacterial chemotaxis theory [19], it wasshown that noise due to small number of Bcd molecules ishigh enough so that the hb border cannot be accuratelyspecified by Bcd alone. Second, by measuring Bcd profilesfrom several live embryos in parallel, it was found that rBcd ;
2% EL. The amount of variance reduction implied by thisvalue of rBcd is significantly smaller than the estimates fromfixed-tissue experiments [6,9], presumably because the GFPmeasurements do not have scaling error introduced in thesetting of microscope gain in separate fixed-tissue experi-ments. Under the assumption that Bcd is the only regulator ofhb, it was argued that these results can be reconciled if spatialaveraging from the diffusion of Hb molecules is taken intoaccount, and the authors draw the conclusion that Bcd aloneis sufficient to specify the hb border accurately.The assumption that hb is under the sole control of Bcd is
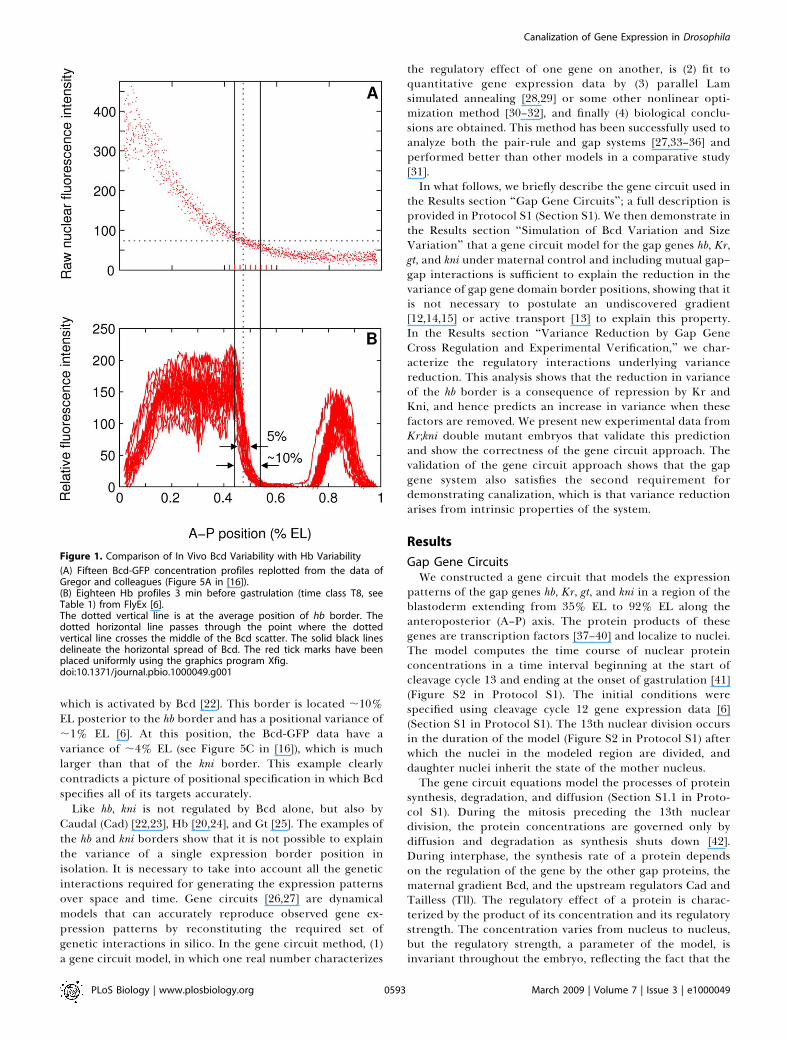
incorrect, because its border position changes in embryosmutant for giant (gt) [9], Kruppel (Kr) [20], Kruppel;knirps(Kr;kni) [20], and in embryos lacking Nanos [9]. Apart fromthe average position, the variation of the position is alsoincreased in embryos lacking chromosome arm 3L or Nanosto ;2% EL and ;1.6% EL respectively [9], close to the Bcdvariation measured in live embryos. The Bcd-dependentresponse of a fragment of the hb promoter has variation closeto Bcd variation (see Figure 4 in [21]) (qBcd ; 9% EL; comparewith Figure 1A) and higher than the variation of endogenoushb (Figure 1B). All these experiments suggest that endogenoushb expression has lower variation than Bcd, which is increasedto the level of Bcd variation when other inputs to hb areremoved.To make the relationship between Bcd variation and hb
border variation clear, we have plotted the data of Gregor etal. and compare it with fixed-tissue Hb data (Figure 1). The hbborder is steep, and its position can be measured unambig-uously in fixed tissue since it is not sensitive to scalingvariation, unlike a Bcd threshold concentration. This com-parison shows that the Bcd threshold position at which the hbborder forms is about twice as variable as the border position.It is important to note that the hb border is just one amongmany that have low positional variance. As an example,consider the anterior border of the posterior kni domain,
PLoS Biology | www.plosbiology.org March 2009 | Volume 7 | Issue 3 | e10000490592
Canalization of Gene Expression in Drosophila
Author Summary
Animals have an astonishing ability to develop reliably in spite ofvariable conditions during embryogenesis. More than 60 years ago,it was proposed that this property of development, called canal-ization, results from genetic interactions that adjust biochemicalreactions so as to bring about reliable outcomes. Since then, a greatdeal of progress has been made in understanding the buffering ofgenotypic and environmental variation, and individual mutationsthat reveal variation have been identified. However, the mechanismsby which genetic interactions produce canalization are not yet wellunderstood, because this requires molecular data on multipledevelopmental determinants and models that correctly predictcomplex interactions. We make use of gene expression data at bothhigh spatial and temporal resolution for the gap genes involved inthe segmentation of Drosophila. We also apply a mathematicalmodel to show that cross regulation among the gap genes isresponsible for canalization in this system. Furthermore, the modelpredicted specific interactions that cause canalization, and theprediction was validated experimentally. Our results show thatgroups of genes can act on one another to reduce variation andhighlights the importance of genetic networks in generating robustdevelopment.
which is activated by Bcd [22]. This border is located ;10%EL posterior to the hb border and has a positional variance of;1% EL [6]. At this position, the Bcd-GFP data have avariance of ;4% EL (see Figure 5C in [16]), which is muchlarger than that of the kni border. This example clearlycontradicts a picture of positional specification in which Bcdspecifies all of its targets accurately.
Like hb, kni is not regulated by Bcd alone, but also byCaudal (Cad) [22,23], Hb [20,24], and Gt [25]. The examples ofthe hb and kni borders show that it is not possible to explainthe variance of a single expression border position inisolation. It is necessary to take into account all the geneticinteractions required for generating the expression patternsover space and time. Gene circuits [26,27] are dynamicalmodels that can accurately reproduce observed gene ex-pression patterns by reconstituting the required set ofgenetic interactions in silico. In the gene circuit method, (1)a gene circuit model, in which one real number characterizes
the regulatory effect of one gene on another, is (2) fit toquantitative gene expression data by (3) parallel Lamsimulated annealing [28,29] or some other nonlinear opti-mization method [30–32], and finally (4) biological conclu-sions are obtained. This method has been successfully used toanalyze both the pair-rule and gap systems [27,33–36] andperformed better than other models in a comparative study[31].In what follows, we briefly describe the gene circuit used in
the Results section ‘‘Gap Gene Circuits’’; a full description isprovided in Protocol S1 (Section S1). We then demonstrate inthe Results section ‘‘Simulation of Bcd Variation and SizeVariation’’ that a gene circuit model for the gap genes hb, Kr,gt, and kni under maternal control and including mutual gap–gap interactions is sufficient to explain the reduction in thevariance of gap gene domain border positions, showing that itis not necessary to postulate an undiscovered gradient[12,14,15] or active transport [13] to explain this property.In the Results section ‘‘Variance Reduction by Gap GeneCross Regulation and Experimental Verification,’’ we char-acterize the regulatory interactions underlying variancereduction. This analysis shows that the reduction in varianceof the hb border is a consequence of repression by Kr andKni, and hence predicts an increase in variance when thesefactors are removed. We present new experimental data fromKr;kni double mutant embryos that validate this predictionand show the correctness of the gene circuit approach. Thevalidation of the gene circuit approach shows that the gapgene system also satisfies the second requirement fordemonstrating canalization, which is that variance reductionarises from intrinsic properties of the system.
Results
Gap Gene CircuitsWe constructed a gene circuit that models the expression
patterns of the gap genes hb, Kr, gt, and kni in a region of theblastoderm extending from 35% EL to 92% EL along theanteroposterior (A–P) axis. The protein products of thesegenes are transcription factors [37–40] and localize to nuclei.The model computes the time course of nuclear proteinconcentrations in a time interval beginning at the start ofcleavage cycle 13 and ending at the onset of gastrulation [41](Figure S2 in Protocol S1). The initial conditions werespecified using cleavage cycle 12 gene expression data [6](Section S1 in Protocol S1). The 13th nuclear division occursin the duration of the model (Figure S2 in Protocol S1) afterwhich the nuclei in the modeled region are divided, anddaughter nuclei inherit the state of the mother nucleus.The gene circuit equations model the processes of protein
synthesis, degradation, and diffusion (Section S1.1 in Proto-col S1). During the mitosis preceding the 13th nucleardivision, the protein concentrations are governed only bydiffusion and degradation as synthesis shuts down [42].During interphase, the synthesis rate of a protein dependson the regulation of the gene by the other gap proteins, thematernal gradient Bcd, and the upstream regulators Cad andTailless (Tll). The regulatory effect of a protein is charac-terized by the product of its concentration and its regulatorystrength. The concentration varies from nucleus to nucleus,but the regulatory strength, a parameter of the model, isinvariant throughout the embryo, reflecting the fact that the
Figure 1. Comparison of In Vivo Bcd Variability with Hb Variability
(A) Fifteen Bcd-GFP concentration profiles replotted from the data ofGregor and colleagues (Figure 5A in [16]).(B) Eighteen Hb profiles 3 min before gastrulation (time class T8, seeTable 1) from FlyEx [6].The dotted vertical line is at the average position of hb border. Thedotted horizontal line passes through the point where the dottedvertical line crosses the middle of the Bcd scatter. The solid black linesdelineate the horizontal spread of Bcd. The red tick marks have beenplaced uniformly using the graphics program Xfig.doi:10.1371/journal.pbio.1000049.g001
PLoS Biology | www.plosbiology.org March 2009 | Volume 7 | Issue 3 | e10000490593
Canalization of Gene Expression in Drosophila
zygotic genome is the same in each blastoderm nucleus. Thesum of all the regulatory terms for a gene, called the totalregulatory input (u), determines its synthesis rate through thesigmoidal regulation-expression function gðuÞ ¼ 1
2 ½ uffiffiffiffiffiffiffiffiu2þ1p þ 1�
(Figure S1 in Protocol S1).To fully specify the model the concentrations of Bcd, Cad
and Tll must be provided. The concentrations of Cad and Tllwere provided by the interpolation of average data [6] in time(Section S1.2 in Protocol S1). A representative profile of Bcdwas provided as follows.
The Bcd gradient is essentially stationary during cleavagecycles 13 and 14 [6,43,44], and hence, its concentration vBcd isassumed to be constant in time. It is known through antibodystudies [6,9,12,43] and a recent GFP-Bcd [44] study that theBcd profile is an exponential function of A–P position x, sothat
vBcdðxÞ ¼ A expð�cxÞ ð1Þ
The arithmetic mean of exponential curves is not exponen-tial. Thus, it is not possible to generate a representative Bcd
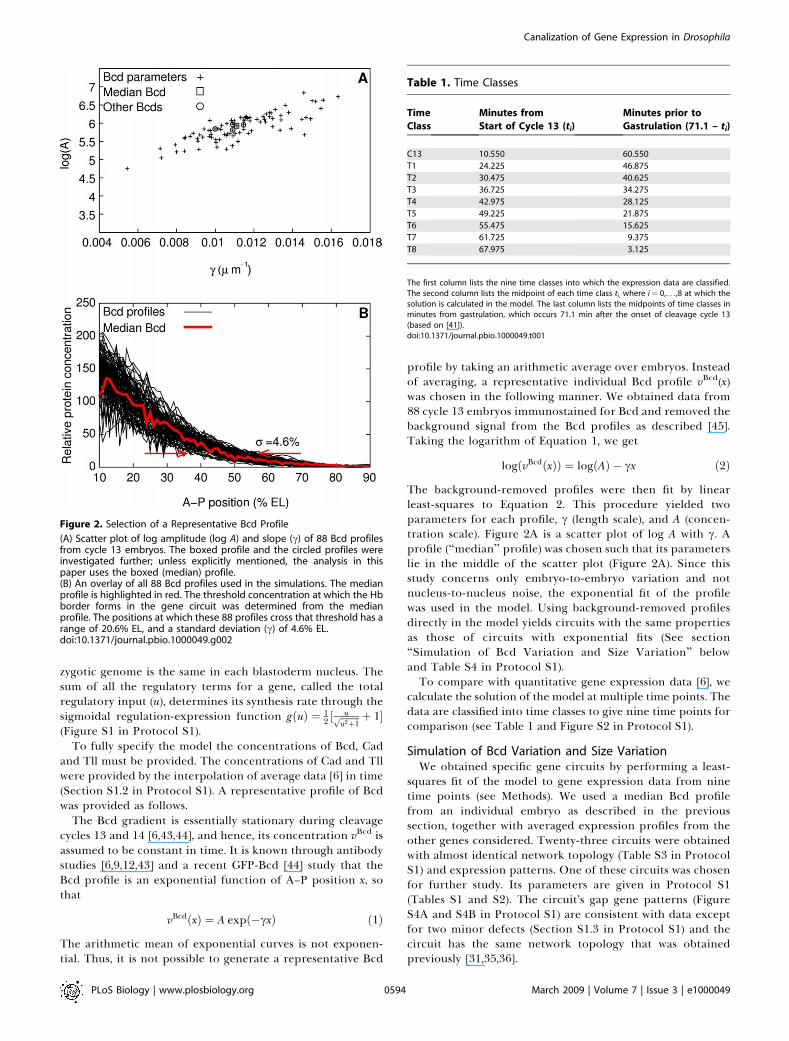
profile by taking an arithmetic average over embryos. Insteadof averaging, a representative individual Bcd profile vBcd(x)was chosen in the following manner. We obtained data from88 cycle 13 embryos immunostained for Bcd and removed thebackground signal from the Bcd profiles as described [45].Taking the logarithm of Equation 1, we get
logðvBcdðxÞÞ ¼ logðAÞ � cx ð2Þ
The background-removed profiles were then fit by linearleast-squares to Equation 2. This procedure yielded twoparameters for each profile, c (length scale), and A (concen-tration scale). Figure 2A is a scatter plot of log A with c. Aprofile (‘‘median’’ profile) was chosen such that its parameterslie in the middle of the scatter plot (Figure 2A). Since thisstudy concerns only embryo-to-embryo variation and notnucleus-to-nucleus noise, the exponential fit of the profilewas used in the model. Using background-removed profilesdirectly in the model yields circuits with the same propertiesas those of circuits with exponential fits (See section‘‘Simulation of Bcd Variation and Size Variation’’ belowand Table S4 in Protocol S1).To compare with quantitative gene expression data [6], we
calculate the solution of the model at multiple time points. Thedata are classified into time classes to give nine time points forcomparison (see Table 1 and Figure S2 in Protocol S1).
Simulation of Bcd Variation and Size VariationWe obtained specific gene circuits by performing a least-
squares fit of the model to gene expression data from ninetime points (see Methods). We used a median Bcd profilefrom an individual embryo as described in the previoussection, together with averaged expression profiles from theother genes considered. Twenty-three circuits were obtainedwith almost identical network topology (Table S3 in ProtocolS1) and expression patterns. One of these circuits was chosenfor further study. Its parameters are given in Protocol S1(Tables S1 and S2). The circuit’s gap gene patterns (FigureS4A and S4B in Protocol S1) are consistent with data exceptfor two minor defects (Section S1.3 in Protocol S1) and thecircuit has the same network topology that was obtainedpreviously [31,35,36].
Figure 2. Selection of a Representative Bcd Profile
(A) Scatter plot of log amplitude (log A) and slope (c) of 88 Bcd profilesfrom cycle 13 embryos. The boxed profile and the circled profiles wereinvestigated further; unless explicitly mentioned, the analysis in thispaper uses the boxed (median) profile.(B) An overlay of all 88 Bcd profiles used in the simulations. The medianprofile is highlighted in red. The threshold concentration at which the Hbborder forms in the gene circuit was determined from the medianprofile. The positions at which these 88 profiles cross that threshold has arange of 20.6% EL, and a standard deviation (c) of 4.6% EL.doi:10.1371/journal.pbio.1000049.g002
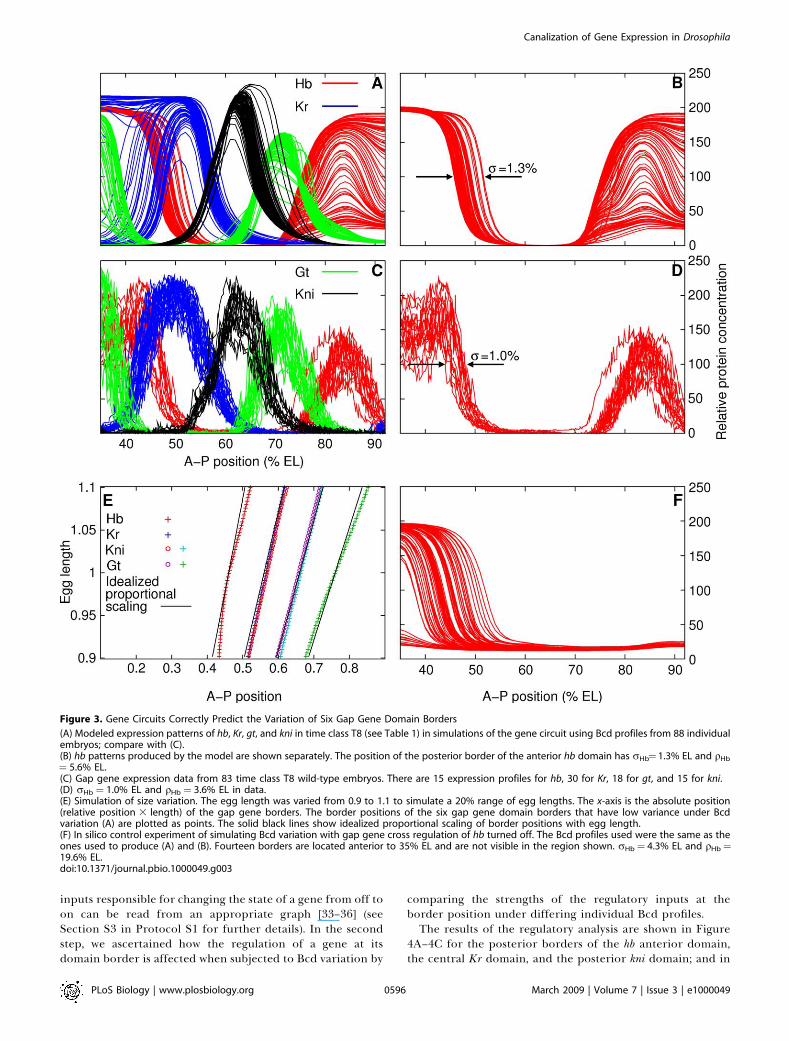
Table 1. Time Classes
Time
Class
Minutes from
Start of Cycle 13 (ti)
Minutes prior to
Gastrulation (71.1 – ti)
C13 10.550 60.550
T1 24.225 46.875
T2 30.475 40.625
T3 36.725 34.275
T4 42.975 28.125
T5 49.225 21.875
T6 55.475 15.625
T7 61.725 9.375
T8 67.975 3.125
The first column lists the nine time classes into which the expression data are classified.The second column lists the midpoint of each time class ti, where i¼ 0,. . .,8 at which thesolution is calculated in the model. The last column lists the midpoints of time classes inminutes from gastrulation, which occurs 71.1 min after the onset of cleavage cycle 13(based on [41]).doi:10.1371/journal.pbio.1000049.t001
PLoS Biology | www.plosbiology.org March 2009 | Volume 7 | Issue 3 | e10000490594
Canalization of Gene Expression in Drosophila
Bcd variation. We simulated the effects of embryo-to-embryo variation by running an ensemble of 88 simulationsof the chosen circuit such that each simulation used a Bcdprofile from a distinct individual embryo (Figure 2B). Allparameters of the circuit were kept fixed, and only the Bcdinput to the circuit was varied across the ensemble. Thepositional variance of the gap gene borders was comparedwith that of Bcd profiles. The position of a gap gene domain’sborder was calculated as the point where the concentration ofthe gene’s protein product was half its maximum level in thatdomain (see Methods). The positional variance of a border isthe standard deviation of its position in the 88 simulations.The positional variance of the family of Bcd profiles is thestandard deviation (rBcd) of the position (xBcd) at which eachprofile crosses a threshold concentration. The Bcd thresholdfor a particular gap gene border is the Bcd concentration atwhich the border forms in the circuit with the median Bcd.
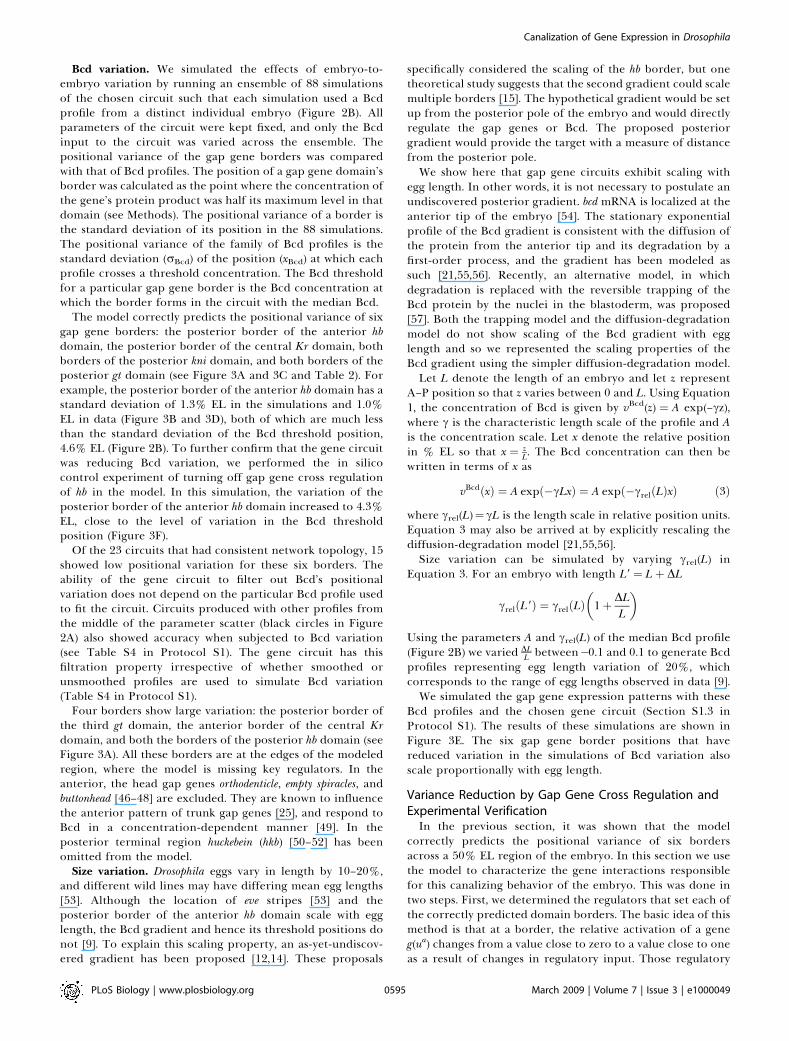
The model correctly predicts the positional variance of sixgap gene borders: the posterior border of the anterior hbdomain, the posterior border of the central Kr domain, bothborders of the posterior kni domain, and both borders of theposterior gt domain (see Figure 3A and 3C and Table 2). Forexample, the posterior border of the anterior hb domain has astandard deviation of 1.3% EL in the simulations and 1.0%EL in data (Figure 3B and 3D), both of which are much lessthan the standard deviation of the Bcd threshold position,4.6% EL (Figure 2B). To further confirm that the gene circuitwas reducing Bcd variation, we performed the in silicocontrol experiment of turning off gap gene cross regulationof hb in the model. In this simulation, the variation of theposterior border of the anterior hb domain increased to 4.3%EL, close to the level of variation in the Bcd thresholdposition (Figure 3F).
Of the 23 circuits that had consistent network topology, 15showed low positional variation for these six borders. Theability of the gene circuit to filter out Bcd’s positionalvariation does not depend on the particular Bcd profile usedto fit the circuit. Circuits produced with other profiles fromthe middle of the parameter scatter (black circles in Figure2A) also showed accuracy when subjected to Bcd variation(see Table S4 in Protocol S1). The gene circuit has thisfiltration property irrespective of whether smoothed orunsmoothed profiles are used to simulate Bcd variation(Table S4 in Protocol S1).
Four borders show large variation: the posterior border ofthe third gt domain, the anterior border of the central Krdomain, and both the borders of the posterior hb domain (seeFigure 3A). All these borders are at the edges of the modeledregion, where the model is missing key regulators. In theanterior, the head gap genes orthodenticle, empty spiracles, andbuttonhead [46–48] are excluded. They are known to influencethe anterior pattern of trunk gap genes [25], and respond toBcd in a concentration-dependent manner [49]. In theposterior terminal region huckebein (hkb) [50–52] has beenomitted from the model.
Size variation. Drosophila eggs vary in length by 10–20%,and different wild lines may have differing mean egg lengths[53]. Although the location of eve stripes [53] and theposterior border of the anterior hb domain scale with egglength, the Bcd gradient and hence its threshold positions donot [9]. To explain this scaling property, an as-yet-undiscov-ered gradient has been proposed [12,14]. These proposals
specifically considered the scaling of the hb border, but onetheoretical study suggests that the second gradient could scalemultiple borders [15]. The hypothetical gradient would be setup from the posterior pole of the embryo and would directlyregulate the gap genes or Bcd. The proposed posteriorgradient would provide the target with a measure of distancefrom the posterior pole.We show here that gap gene circuits exhibit scaling with
egg length. In other words, it is not necessary to postulate anundiscovered posterior gradient. bcd mRNA is localized at theanterior tip of the embryo [54]. The stationary exponentialprofile of the Bcd gradient is consistent with the diffusion ofthe protein from the anterior tip and its degradation by afirst-order process, and the gradient has been modeled assuch [21,55,56]. Recently, an alternative model, in whichdegradation is replaced with the reversible trapping of theBcd protein by the nuclei in the blastoderm, was proposed[57]. Both the trapping model and the diffusion-degradationmodel do not show scaling of the Bcd gradient with egglength and so we represented the scaling properties of theBcd gradient using the simpler diffusion-degradation model.Let L denote the length of an embryo and let z represent
A–P position so that z varies between 0 and L. Using Equation1, the concentration of Bcd is given by vBcd(z) ¼ A exp(–cz),where c is the characteristic length scale of the profile and Ais the concentration scale. Let x denote the relative positionin % EL so that x ¼ z
L. The Bcd concentration can then bewritten in terms of x as
vBcdðxÞ ¼ A expð�cLxÞ ¼ A expð�crelðLÞxÞ ð3Þ
where crel(L)¼ cL is the length scale in relative position units.Equation 3 may also be arrived at by explicitly rescaling thediffusion-degradation model [21,55,56].Size variation can be simulated by varying crel(L) in
Equation 3. For an embryo with length L9¼ L þ DL
crelðL9Þ ¼ crelðLÞ 1þ DLL
� �
Using the parameters A and crel(L) of the median Bcd profile(Figure 2B) we varied DL
L between�0.1 and 0.1 to generate Bcdprofiles representing egg length variation of 20%, whichcorresponds to the range of egg lengths observed in data [9].We simulated the gap gene expression patterns with these
Bcd profiles and the chosen gene circuit (Section S1.3 inProtocol S1). The results of these simulations are shown inFigure 3E. The six gap gene border positions that havereduced variation in the simulations of Bcd variation alsoscale proportionally with egg length.
Variance Reduction by Gap Gene Cross Regulation andExperimental VerificationIn the previous section, it was shown that the model
correctly predicts the positional variance of six bordersacross a 50% EL region of the embryo. In this section we usethe model to characterize the gene interactions responsiblefor this canalizing behavior of the embryo. This was done intwo steps. First, we determined the regulators that set each ofthe correctly predicted domain borders. The basic idea of thismethod is that at a border, the relative activation of a geneg(ua) changes from a value close to zero to a value close to oneas a result of changes in regulatory input. Those regulatory
PLoS Biology | www.plosbiology.org March 2009 | Volume 7 | Issue 3 | e10000490595
Canalization of Gene Expression in Drosophila
inputs responsible for changing the state of a gene from off toon can be read from an appropriate graph [33–36] (seeSection S3 in Protocol S1 for further details). In the secondstep, we ascertained how the regulation of a gene at itsdomain border is affected when subjected to Bcd variation by
comparing the strengths of the regulatory inputs at theborder position under differing individual Bcd profiles.The results of the regulatory analysis are shown in Figure
4A–4C for the posterior borders of the hb anterior domain,the central Kr domain, and the posterior kni domain; and in
Figure 3. Gene Circuits Correctly Predict the Variation of Six Gap Gene Domain Borders
(A) Modeled expression patterns of hb, Kr, gt, and kni in time class T8 (see Table 1) in simulations of the gene circuit using Bcd profiles from 88 individualembryos; compare with (C).(B) hb patterns produced by the model are shown separately. The position of the posterior border of the anterior hb domain has rHb¼ 1.3% EL and qHb
¼ 5.6% EL.(C) Gap gene expression data from 83 time class T8 wild-type embryos. There are 15 expression profiles for hb, 30 for Kr, 18 for gt, and 15 for kni.(D) rHb ¼ 1.0% EL and qHb ¼ 3.6% EL in data.(E) Simulation of size variation. The egg length was varied from 0.9 to 1.1 to simulate a 20% range of egg lengths. The x-axis is the absolute position(relative position 3 length) of the gap gene borders. The border positions of the six gap gene domain borders that have low variance under Bcdvariation (A) are plotted as points. The solid black lines show idealized proportional scaling of border positions with egg length.(F) In silico control experiment of simulating Bcd variation with gap gene cross regulation of hb turned off. The Bcd profiles used were the same as theones used to produce (A) and (B). Fourteen borders are located anterior to 35% EL and are not visible in the region shown. rHb¼ 4.3% EL and qHb¼19.6% EL.doi:10.1371/journal.pbio.1000049.g003
PLoS Biology | www.plosbiology.org March 2009 | Volume 7 | Issue 3 | e10000490596
Canalization of Gene Expression in Drosophila
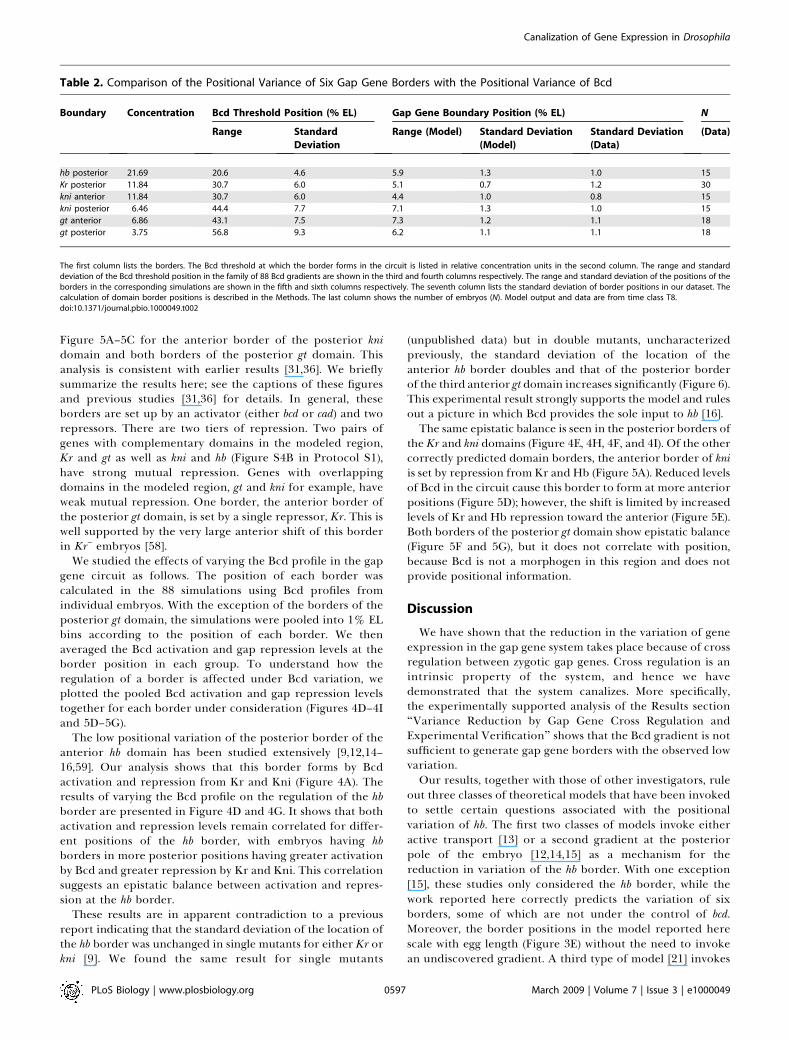
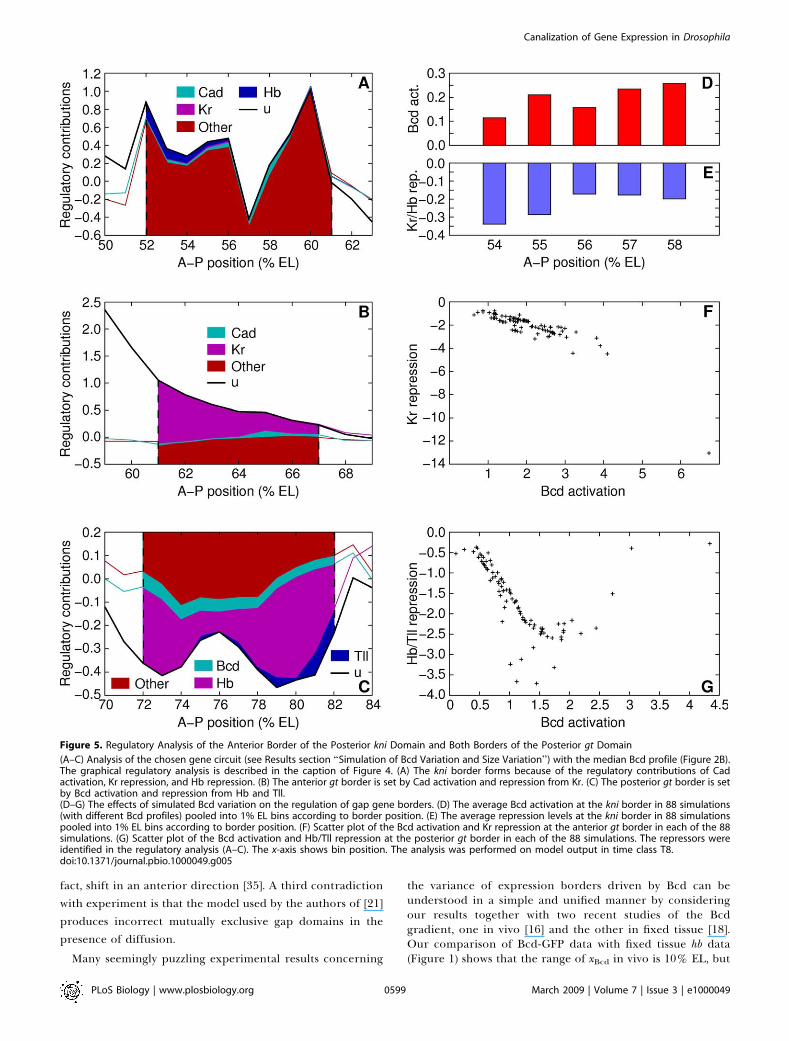
Figure 5A–5C for the anterior border of the posterior knidomain and both borders of the posterior gt domain. Thisanalysis is consistent with earlier results [31,36]. We brieflysummarize the results here; see the captions of these figuresand previous studies [31,36] for details. In general, theseborders are set up by an activator (either bcd or cad) and tworepressors. There are two tiers of repression. Two pairs ofgenes with complementary domains in the modeled region,Kr and gt as well as kni and hb (Figure S4B in Protocol S1),have strong mutual repression. Genes with overlappingdomains in the modeled region, gt and kni for example, haveweak mutual repression. One border, the anterior border ofthe posterior gt domain, is set by a single repressor, Kr. This iswell supported by the very large anterior shift of this borderin Kr– embryos [58].
We studied the effects of varying the Bcd profile in the gapgene circuit as follows. The position of each border wascalculated in the 88 simulations using Bcd profiles fromindividual embryos. With the exception of the borders of theposterior gt domain, the simulations were pooled into 1% ELbins according to the position of each border. We thenaveraged the Bcd activation and gap repression levels at theborder position in each group. To understand how theregulation of a border is affected under Bcd variation, weplotted the pooled Bcd activation and gap repression levelstogether for each border under consideration (Figures 4D–4Iand 5D–5G).
The low positional variation of the posterior border of theanterior hb domain has been studied extensively [9,12,14–16,59]. Our analysis shows that this border forms by Bcdactivation and repression from Kr and Kni (Figure 4A). Theresults of varying the Bcd profile on the regulation of the hbborder are presented in Figure 4D and 4G. It shows that bothactivation and repression levels remain correlated for differ-ent positions of the hb border, with embryos having hbborders in more posterior positions having greater activationby Bcd and greater repression by Kr and Kni. This correlationsuggests an epistatic balance between activation and repres-sion at the hb border.
These results are in apparent contradiction to a previousreport indicating that the standard deviation of the location ofthe hb border was unchanged in single mutants for either Kr orkni [9]. We found the same result for single mutants
(unpublished data) but in double mutants, uncharacterizedpreviously, the standard deviation of the location of theanterior hb border doubles and that of the posterior borderof the third anterior gt domain increases significantly (Figure 6).This experimental result strongly supports the model and rulesout a picture in which Bcd provides the sole input to hb [16].The same epistatic balance is seen in the posterior borders of
the Kr and kni domains (Figure 4E, 4H, 4F, and 4I). Of the othercorrectly predicted domain borders, the anterior border of kniis set by repression from Kr and Hb (Figure 5A). Reduced levelsof Bcd in the circuit cause this border to form at more anteriorpositions (Figure 5D); however, the shift is limited by increasedlevels of Kr and Hb repression toward the anterior (Figure 5E).Both borders of the posterior gt domain show epistatic balance(Figure 5F and 5G), but it does not correlate with position,because Bcd is not a morphogen in this region and does notprovide positional information.
Discussion
We have shown that the reduction in the variation of geneexpression in the gap gene system takes place because of crossregulation between zygotic gap genes. Cross regulation is anintrinsic property of the system, and hence we havedemonstrated that the system canalizes. More specifically,the experimentally supported analysis of the Results section‘‘Variance Reduction by Gap Gene Cross Regulation andExperimental Verification’’ shows that the Bcd gradient is notsufficient to generate gap gene borders with the observed lowvariation.Our results, together with those of other investigators, rule
out three classes of theoretical models that have been invokedto settle certain questions associated with the positionalvariation of hb. The first two classes of models invoke eitheractive transport [13] or a second gradient at the posteriorpole of the embryo [12,14,15] as a mechanism for thereduction in variation of the hb border. With one exception[15], these studies only considered the hb border, while thework reported here correctly predicts the variation of sixborders, some of which are not under the control of bcd.Moreover, the border positions in the model reported herescale with egg length (Figure 3E) without the need to invokean undiscovered gradient. A third type of model [21] invokes
Table 2. Comparison of the Positional Variance of Six Gap Gene Borders with the Positional Variance of Bcd
Boundary Concentration Bcd Threshold Position (% EL) Gap Gene Boundary Position (% EL) N
Range Standard
Deviation
Range (Model) Standard Deviation
(Model)
Standard Deviation
(Data)
(Data)
hb posterior 21.69 20.6 4.6 5.9 1.3 1.0 15
Kr posterior 11.84 30.7 6.0 5.1 0.7 1.2 30
kni anterior 11.84 30.7 6.0 4.4 1.0 0.8 15
kni posterior 6.46 44.4 7.7 7.1 1.3 1.0 15
gt anterior 6.86 43.1 7.5 7.3 1.2 1.1 18
gt posterior 3.75 56.8 9.3 6.2 1.1 1.1 18
The first column lists the borders. The Bcd threshold at which the border forms in the circuit is listed in relative concentration units in the second column. The range and standarddeviation of the Bcd threshold position in the family of 88 Bcd gradients are shown in the third and fourth columns respectively. The range and standard deviation of the positions of theborders in the corresponding simulations are shown in the fifth and sixth columns respectively. The seventh column lists the standard deviation of border positions in our dataset. Thecalculation of domain border positions is described in the Methods. The last column shows the number of embryos (N). Model output and data are from time class T8.doi:10.1371/journal.pbio.1000049.t002
PLoS Biology | www.plosbiology.org March 2009 | Volume 7 | Issue 3 | e10000490597
Canalization of Gene Expression in Drosophila

transient behavior of the Bcd gradient and its associatedthresholds during cycles 10–13 as a mechanism of variancereduction. This model has been invalidated by the exper-imental demonstration that intranuclear Bcd concentrations
are in fact constant during this period of time [44].Furthermore, threshold concentrations of Bcd propagatetoward the posterior of the embryo during the establishmentof the Bicoid gradient, but gap domains in the posterior, in
Figure 4. Regulatory Analysis of the Posterior Borders of the Anterior hb, the Central Kr, and the Posterior kni Domains
(A–C) Analysis of the chosen gene circuit (see Results section ‘‘Simulation of Bcd Variation and Size Variation’’) with the median Bcd profile (Figure 2B).Dashed vertical lines demarcate a border, and correspond to positions where the expression is at 90% maximum and at 10% maximum. The solid blackline is the spatial derivative of the total regulatory input to the gene ua (see Section S3 in Protocol S1). The area above the black line is the total changein total regulatory input ua that causes the border to form. The colored areas correspond to the contributions to the change in total input by differentregulators of the gene. The regulatory inputs that cannot set a border are shown in red (see Section S3 in Protocol S1 for details), and are not includedin the analysis. A regulatory contribution can be from an activator or a repressor depending on the sign of the regulatory parameter (see Table S1 inProtocol S1 for values).(A) The hb border forms because of the regulatory contributions of Bcd activation, Kr repression, and Kni repression. The contribution of Hbautoactivation, shown in red, does not set the border but merely sharpens it [9,36]. The colored bar inset shows the relative contributions of Bcdactivation, Kr repression, and Kni repression to hb, showing that the repressive contribution is significant compared to the activating one. (B) The Krborder is set by Bcd activation and repression from Kni and Gt. (C) The kni border is set by repression from Gt and Hb.(D–I) The effects of simulated Bcd variation on the regulation of gap gene borders. (D–F) The average Bcd activation at a border in 88 simulations (withdifferent Bcd profiles) pooled into 1% EL bins according to border position. (G–I) The average repression levels at a border in 88 simulations pooled into1% EL bins according to border position. The repressors were identified in the regulatory analysis (A–C). The x-axis shows bin position. The analysis wasperformed on model output in time class T8.doi:10.1371/journal.pbio.1000049.g004
PLoS Biology | www.plosbiology.org March 2009 | Volume 7 | Issue 3 | e10000490598
Canalization of Gene Expression in Drosophila
fact, shift in an anterior direction [35]. A third contradiction
with experiment is that the model used by the authors of [21]
produces incorrect mutually exclusive gap domains in the
presence of diffusion.
Many seemingly puzzling experimental results concerning
the variance of expression borders driven by Bcd can beunderstood in a simple and unified manner by consideringour results together with two recent studies of the Bcdgradient, one in vivo [16] and the other in fixed tissue [18].Our comparison of Bcd-GFP data with fixed tissue hb data(Figure 1) shows that the range of xBcd in vivo is 10% EL, but
Figure 5. Regulatory Analysis of the Anterior Border of the Posterior kni Domain and Both Borders of the Posterior gt Domain
(A–C) Analysis of the chosen gene circuit (see Results section ‘‘Simulation of Bcd Variation and Size Variation’’) with the median Bcd profile (Figure 2B).The graphical regulatory analysis is described in the caption of Figure 4. (A) The kni border forms because of the regulatory contributions of Cadactivation, Kr repression, and Hb repression. (B) The anterior gt border is set by Cad activation and repression from Kr. (C) The posterior gt border is setby Bcd activation and repression from Hb and Tll.(D–G) The effects of simulated Bcd variation on the regulation of gap gene borders. (D) The average Bcd activation at the kni border in 88 simulations(with different Bcd profiles) pooled into 1% EL bins according to border position. (E) The average repression levels at the kni border in 88 simulationspooled into 1% EL bins according to border position. (F) Scatter plot of the Bcd activation and Kr repression at the anterior gt border in each of the 88simulations. (G) Scatter plot of the Bcd activation and Hb/Tll repression at the posterior gt border in each of the 88 simulations. The repressors wereidentified in the regulatory analysis (A–C). The x-axis shows bin position. The analysis was performed on model output in time class T8.doi:10.1371/journal.pbio.1000049.g005
PLoS Biology | www.plosbiology.org March 2009 | Volume 7 | Issue 3 | e10000490599
Canalization of Gene Expression in Drosophila

that of xHb in fixed tissue data is 5% EL. This comparisonfinds support in the fixed-tissue study [18] in which amodified staining protocol was used and data were acquiredin a single imaging cycle to minimize experimental error. TheBcd data thus obtained had the same level of error as Bcd-GFP data [16], yet a direct comparison between the Bcd andHb data showed that the posterior border of the anterior hbdomain was half as variable. The observation that the range ofxBcd is twice that of xHb is extremely important, because thereare many experimental manipulations that can double therange or standard deviation of xHb, making it equivalent tothe range or standard deviation of xBcd.
First, these results indicate that the increased variance ofxHb in Kr;kni double mutants (Figure 6A caption) can beinterpreted as arising from the unmodified action of Bcdwithout reduction in variance mediated by other genes. Thisis a key point, because the larger standard deviation of xBcdobserved in data from fixed tissue here and elsewhere [9]appeared to imply that variance reduction still took place indouble mutants, albeit at a reduced level. Second, a 9% rangeof border positions has been observed from reporters drivenby a fragment of the hb promoter believed to contain onlyBcd binding sites (see Figure 4 in [21]), suggesting that thisexpression reflects the underlying variation of xBcd. Third,when chromosome arm 3L is completely removed [9], the
standard deviation of xHb doubles. We suggest that all three ofthese experimental manipulations uncover unmodified ac-tion of Bcd on hb by removing additional modulatorsrespectively in trans, in cis, and by a currently uncharacterizedmechanism.Other important experimental results can be understood
by recalling that the maximum accuracy of the Bcd gradientis inversely proportional to the square root of the Bcdconcentration [16,19,60], suggesting that borders underunmodified Bcd control will have lower variation at moreanterior positions. This fact explains the observation that asynthetic reporter construct driven only by Bcd has the samestandard deviation as xHb [59]. The synthetic construct formsits border at 28.6% EL, where the in vivo data (see Figure 2Bin [16]) indicate that the Bcd concentration is about threetimes greater than at the native hb border. If the standarddeviation of 2.2% EL seen here in Kr;kni double mutants isthe unmodified response to Bcd at 47% EL, then theexpected standard deviation at 29% EL is 1.3%, which isclose to the 1.6% observed (see Figure 5C in [59]). Finally, thefact that the standard deviation of the posterior border ofthe anterior gt domain increases by less than that of hb inKr;kni mutant embryos can be understood by noting that it islocated at about 40% EL. At this position, the in vivo dataappear to indicate that the Bcd concentration is 1.69 times
Figure 6. The Control of Positional Variation of the Posterior Border of the Anterior hb Domain by Kr and Kni
hb (A) and gt (B) expression profiles in 28 Kr;kni double mutant embryos from time classes T4–T7 (Table 1); rHb¼2.2% EL (standard deviation) and qHb¼9.3% EL (range). The standard deviation of the posterior border of the third gt domain is rGt¼ 1.9% EL; qGt ¼ 8.9% EL.hb (C) and gt (D) expression profiles in wild-type embryos of the same age as in (A) and (B). rHb¼1.1% EL and qHb¼5.6% EL (68 embryos). rGt¼1.2% ELand qGt¼5.6% EL (92 embryos). Expression patterns are shown normalized against the maximum level (see Methods) in the anterior hb (A and C) or theanterior gt (B and D) domains.doi:10.1371/journal.pbio.1000049.g006
PLoS Biology | www.plosbiology.org March 2009 | Volume 7 | Issue 3 | e10000490600
Canalization of Gene Expression in Drosophila
greater than that at the hb border. This concentration ratiopredicts that the standard deviation of this border in Kr;knidouble mutants will be 1.7% EL, while the actual value is1.9% EL.
In recently published work, He et al. [18] report that theBcd threshold at which the posterior border of the anteriorhb domain forms is not constant but varies in a correlatedmanner with the slope of the Bcd profile. Figure 4D showsthat in our simulations, the Bcd level at which the hb borderforms changes as the Bcd profile is varied. Figure 4G showsthat this effect is a consequence of the dynamic adjustmentof the repression levels, arising from gap gene crossregulation. He et al. speculate that the stability of the Bcdprotein might affect its ability to activate hb. However, ourresults suggest that the dynamic adjustment of the activationlevel is in fact an indirect consequence of gap gene crossregulation.
One remaining question concerns the reason for thecorrect prediction of gap gene domain border variationpresented here, as it is clear that the fixed tissue Bcd dataused for the theoretical study exaggerate the standarddeviation of xBcd [16]. We believe that the high degree ofcanalization observed (Figure 3A) makes the theoreticalmodel quite insensitive to initial variation, as is true of thebiological system itself. In a companion work [61], we showthat robust insensitivity to initial conditions is an inherentmathematical property of the gene circuit equations for thissystem. Moreover, the observed in vivo standard deviation ofxBcd was obtained in an approximately isogenic stock grownat fixed temperature, while natural populations have muchmore variable genotypes and develop in the presence oftemperature fluctuations. These factors alter the profile ofthe Bcd gradient but have little effect on the border positionof downstream targets [9,62]. We believe that the fixed-tissueBcd profiles used in the present study capture this extra levelof variability characteristic of natural populations.
This analysis of canalization has focused on the reductionof variation of border positions of the gap genes with respectto the threshold positions of the maternal determinant Bcd(Results sections ‘‘Simulation of Bcd Variation and SizeVariation’’ and ‘‘Variance Reduction by Gap Gene CrossRegulation and Experimental Verification’’). The gap geneborders are specified at a low enough molecular number ofBcd [16] that intrinsic fluctuations are a significant source ofvariation [16,60]. The buffering of phenotypic variationagainst intrinsic fluctuations in molecular number, whilenot considered by Waddington, is likely to be an importantaspect of canalization in biological systems. It is noteworthythat we were able to model canalization using a deterministicmodel with what were, essentially, stochastic initial condi-tions. Future work will need to treat the role of intrinsicfluctuations in the formation of maternal gradient systems[63,64]. While stochastic interactions undoubtedly occuramong zygotic gap gene products, understanding the func-tional role of stochastic processes in the segmentation systemwill require the formulation of a fully stochastic model. Sucha model must also produce the observed reduction invariation in the gap gene system, although the numericaldetails will differ.
Waddington hypothesized that canalization arises fromgene interactions [1,65–68]. We have identified specificregulatory interactions among the gap genes responsible for
canalization. It is noteworthy that variation reduction is anemergent property of the system and does not require specialbuilt-in mechanisms such as a posterior gradient. The mutualrepression between the gap genes that is required for correctspatiotemporal expression is also responsible for canaliza-tion, providing support for the ‘‘intrinsic’’ [67] or ‘‘single-mode’’ [69] canalization hypothesis.Our results make it possible to characterize in a more
precise way how canalization works. The reduction of gapgene expression variation over time [6] suggests that canal-ization occurs because the possible developmental trajecto-ries of the system tend to converge over time, thus reducingvariation. In an accompanying manuscript [61], we show thatthe trajectories of the gap gene system in individual nuclei dotend to converge and are stable against perturbations. Thisconvergence and stability are a consequence of the fact thatthe regulatory interactions of the gene circuit cause the stateof the system to approach a stable steady state [70,71], alsocalled an attractor. A given nucleus can potentially approachone of many attractors, a property called multistability, and aparticular attractor is chosen based on the initial state of thenucleus. Waddington inferred canalization, in part, from theobservation that there are discrete tissue types rather than acontinuous blend. Multistability provides a rigorous mathe-matical justification for the connection between canalizationand the discreteness of tissue type. If the initial state isperturbed by a small amount, the system is attracted by thesame attractor, providing variation reduction. However, ifthe perturbation is large enough, or if attractors are createdor destroyed, the trajectory can switch to a different attractorproviding a discrete response. Our analysis [61] suggests thatswitching between attractors occurs in the gap gene systemand is the mechanism by which the posterior border of theanterior hb domain forms. These results show that the gapgene network is a system with the intrinsic property ofreducing variation, a form of error correction, and that thiscanalization property is a consequence of the mutualregulatory actions of the gap gene network.
Methods
Experimental methods. The methods used to obtain and character-ize the quantitative data are as described in earlier work [6]. All geneexpression levels are on a scale of 0–255, chosen to maximize dynamicrange without saturation. The Kr;kni double mutant embryos weremade by crossing Kr1 and Df(3L)ri-79c flies. 3–4-hours-old embryoswere fixed and stained as described [72] using guinea pig anti-Kr andanti-Kni antibodies with Alexa Fluor 488 conjugated secondaryantibody, rabbit anti-Gt and rat anti-Hb antibodies with Alexa Fluor555 and 647 conjugated secondary antibodies (Molecular Probes),respectively. Embryos null for Kr and Kni showed no signal on thefirst channel. Double mutants in lateral orientation were scannedusing a Leica TCS SP2 confocal microscope and the images were thenprocessed as described [73]. Domain border positions for wild typeand mutants were determined by calculating the A–P position atwhich the relative concentration is half its maximum value in thedomain. The local maximum in a domain was determined using aquadratic spline approximation [74].
Numerical methods. The numerical implementation of the genecircuit equations is as described [35,36] with the addition of timevarying external inputs (see Section S1.2 in Protocol S1). The gapgene circuit was fit to integrated gap gene data [6] using Parallel LamSimulated Annealing (PLSA) [28,29]. PLSA minimizes the root meansquared (RMS) difference between model output and data. Theminimized RMS difference for a circuit is a measure of the quality offit, and is called the RMS score. The RMS score indicates the averagedifference between the model and the data. Search spaces, penaltyfunction, and other annealing parameters were as described [27,36].
PLoS Biology | www.plosbiology.org March 2009 | Volume 7 | Issue 3 | e10000490601
Canalization of Gene Expression in Drosophila
The circuit analyzed in detail had an RMS score of 10.76,corresponding to a proportional error in expression residuals ofabout 4–5%. Protocol S1 (Section S1.3) contains further details.
Supporting Information
Protocol S1. Detailed Description of Gene Circuits, Bcd VariationSimulations, and Regulatory Analysis
Found at doi:10.1371/journal.pbio.1000049.sd001 (148 KB PDF).
Acknowledgments
We thank T. Gregor, W. Bialek, D. Tank, and E. Wieschaus forgenerously sharing the numerical data [16] used to plot Figure 1A. Wethank J. P. Gergen, J. Jaeger, K. Krishan, C. Martinez, and A. M.Samsonov for valuable discussions and helpful comments on themanuscript.
Author contributions. M, AVS, DHS, MS, and JR conceived anddesigned the experiments. M, VVG, HJ, ARK, OR, and CEVAperformed the experiments. SS analyzed the data. M, DHS, MS, andJR wrote the paper.
Funding. This work was supported by grant RR07801 from the USNational Institutes of Health (NIH), GM072022 jointly from the USNIH and National Science Foundation, awards RBO-1286 and RUB1-1578 from the US Civilian Research and Development FoundationGrant Assistance Program, contract 02.467.11.1005 from the FederalAgency for Science and Innovation of the Russian Federation, project047.011.2004.013 of the Organisatie voor Wetenschappelijk Onder-zoek and the Russian Foundation for Basic Research (RFBR), andgrants 08-01-00315a and 08-04-00712a of the RFBR. The funders hadno role in study design, data collection and analysis, decision topublish, or preparation of the manuscript.
Competing interests. The authors have declared that no competinginterests exist.
References1. Waddington CH (1942) Canalization of development and the inheritance of
acquired characters. Nature 150: 563–565.2. Rutherford SL, Lindquist S (1998) Hsp90 as a capacitor for morphological
evolution. Nature 396: 336–342.3. Sollars V, Lu X, Xiao L, Wang X, Garfinkel MD, et al. (2002) Evidence for an
epigenetic mechanism by which Hsp90 acts as a capacitor for morpho-logical evolution. Nat Genet 33: 70–74.
4. Siegal ML, Bergman A (2002) Waddington’s canalization revisited: Devel-opmental stability and evolution. Proc Natl Acad Sci U S A 99: 10528–10532.
5. Nusslein-Volhard C, Wieschaus E (1980) Mutations affecting segmentnumber and polarity in Drosophila. Nature 287: 795–801.
6. Surkova S, Kosman D, Kozlov K, Manu, Myasnikova E, et al. (2008)Characterization of the Drosophila segment determination morphome. DevBiol 313: 844–862.
7. Driever W, Nusslein-Volhard C (1988) The Bicoid protein determinesposition in the Drosophila embryo in a concentration-dependent manner.Cell 54: 95–104.
8. Struhl G, Johnston P, Lawrence PA (1992) Control of Drosophila bodypattern by the Hunchback morphogen gradient. Cell 69: 237–249.
9. Houchmandzadeh B, Wieschaus E, Leibler S (2002) Establishment ofdevelopmental precision and proportions in the early Drosophila embryo.Nature 415: 798–802.
10. Spirov AV, Holloway D (2003) Making the body plan: precision in the genetichierarchy of Drosophila embryo segmentation. In Silico Biol 3: 0009.Available: http://www.bioinfo.de/isb/2003/03/0009/. Accessed 29 January 2009.
11. Wolpert L (1969) Positional information and the spatial pattern of cellulardifferentiation. J Theor Biol 25: 1–47.
12. Houchmandzadeh B, Wieschaus E, Leibler S (2005) Precise domainspecification in the developing Drosophila embryo. Phys Rev E 72. Art. No.061920 Part 1.
13. Aegerter-Wilmsen T, Aegerter CM, Bisseling T (2005) Model for the robustestablishment of precise proportions in the early Drosophila embryo. JTheor Biol 234: 13–19.
14. Howard M, ten Wolde PR (2005) Finding the center reliably: Robustpatterns of developmental gene expression. Phys Rev Lett 95: 208103.
15. McHale P, Rappel WJ, Levine H (2006) Embryonic pattern scaling achievedby oppositely directed morphogen gradients. Phys Biol 3: 107–120.
16. Gregor T, Tank DW, Wieschaus EF, Bialek W (2007) Probing the limits topositional information. Cell 130: 153–164.
17. Hardway H, Mukhopadhyay B, Burke T, Hitchman TJ, Forman R (2008)Modeling the precision and robustness of Hunchback border duringDrosophila embryonic development. J Theor Biol 254: 390–399.
18. He F, Wen Y, Deng J, Lin X, Lu LJ, et al. (2008) Probing intrinsic propertiesof a robust morphogen gradient in Drosophila. Dev Cell 15: 558–567.
19. Berg HC, Purcell E (1977) Physics of chemoreception. Biophys J 20: 193–219.
20. Clyde DE, Corado MS, Wu X, Pare A, Papatsenko D, et al. (2003) A self-organizing system of repressor gradients establishes segmental complexityin Drosophila. Nature 426: 849–853.
21. Bergmann S, Sandler O, Sberro H, Shnider S, Schejter E, et al. (2007) Pre-steady-state decoding of the Bicoid morphogen gradient. PLoS Biol 5(2):e46. doi:10.1371/journal.pbio.0050046
22. Rivera-Pomar R, Lu X, Perrimon N, Taubert H, Jackle H (1995) Activationof posterior gap gene expression in the Drosophila blastoderm. Nature 376:253–256.
23. Schulz C, Tautz D (1995) Zygotic caudal regulation by hunchback and its rolein abdominal segment formation of the Drosophila embryo. Development121: 1023–1028.
24. Hulskamp M, Pfeifle C, Tautz D (1990) A morphogenetic gradient ofHunchback protein organizes the expression of the gap genes Kruppel andknirps in the early Drosophila embryo. Nature 346: 577–580.
25. Eldon ED, Pirrotta V (1991) Interactions of the Drosophila gap gene giant withmaternal and zygotic pattern-forming genes. Development 111: 367–378.
26. Mjolsness E, Sharp DH, Reinitz J (1991) A connectionist model ofdevelopment. J Theor Biol 152: 429–453.
27. Reinitz J, Sharp DH (1995) Mechanism of eve stripe formation. Mech Dev 49:133–158.
28. Chu KW, Deng Y, Reinitz J (1999) Parallel simulated annealing by mixing ofstates. J Comput Phys 148: 646–662.
29. Chu KW (2001) Optimal parallelization of simulated annealing by statemixing. [PhD dissertation] Stony Brook (New York): Department ofApplied Mathematics and Statistics, Stony Brook University.
30. Kozlov KN, Samsonov AM (2003) A novel method of experimental dataprocessing based on optimal control theory. Tech Phys 48: 6–14.
31. Perkins TJ, Jaeger J, Reinitz J, Glass L (2006) Reverse engineering the gapgene network of Drosophila melanogaster. PLoS Comput Biol 2: e51. doi:10.1371/journal.pcbi.0020051
32. Fomekong-Nanfack Y, Kaandorp J, Blom J (2007) Efficient parameterestimation for spatio-temporal models of pattern formation: case study ofDrosophila melanogaster. Bioinformatics 23: 3356–3363.
33. Reinitz J, Mjolsness E, Sharp DH (1995) Cooperative control of positionalinformation in Drosophila by bicoid and maternal hunchback. J Exp Zool 271:47–56.
34. Reinitz J, Kosman D, Vanario-Alonso CE, Sharp DH (1998) Stripe formingarchitecture of the gap gene system. Dev Genet 23: 11–27.
35. Jaeger J, Surkova S, Blagov M, Janssens H, Kosman D, et al. (2004) Dynamiccontrol of positional information in the early Drosophila embryo. Nature430: 368–371.
36. Jaeger J, Blagov M, Kosman D, Kozlov KN, Manu, et al. (2004) Dynamicalanalysis of regulatory interactions in the gap gene system of Drosophilamelanogaster. Genetics 167: 1721–1737.
37. Tautz D, Lehmann R, Schnurch H, Schuh R, Seifert E, et al. (1987) Fingerprotein of novel structure encoded by hunchback, a second member of thegap class of Drosophila segmentation genes. Nature 327: 383–389.
38. Redemann N, Gaul U, Jackle H (1988) Disruption of a putative Cys-zincinteraction eliminates the biological activity of the Kruppel finger protein.Nature 332: 90–92.
39. Nauber U, Pankratz MJ, Kienlin A, Seifert E, Klemm U, et al. (1988)Abdominal segmentation of the Drosophila embryo requires a hormonereceptor-like protein encoded by the gap gene knirps. Nature 336: 489–492.
40. Mohler J, Eldon ED, Pirrotta V (1989) A novel spatial transcription patternassociated with the segmentation gene, giant, of Drosophila. EMBO J 8: 1539–1548.
41. Foe VE, Alberts BM (1983) Studies of nuclear and cytoplasmic behaviourduring the five mitotic cycles that precede gastrulation in Drosophilaembryogenesis. J Cell Sci 61: 31–70.
42. Shermoen AW, O’Farrell PH (1991) Progression of the cell cycle throughmitosis leads to abortion of nascent transcripts. Cell 97: 303–310.
43. Driever W, Nusslein-Volhard C (1988) A gradient of Bicoid protein inDrosophila embryos. Cell 54: 83–93.
44. Gregor T, Wieschaus EF, McGregor AP, Bialek W, Tank DW (2007) Stabilityand nuclear dynamics of the Bicoid morphogen gradient. Cell 130: 141–152.
45. Myasnikova E, Samsonova M, Kosman D, Reinitz J (2005) Removal ofbackground signal from in situ data on the expression of segmentationgenes in Drosophila. Dev Genes Evol 215: 320–326.
46. Dalton D, Chadwick R, McGinnis W (1989) Expression and embryonicfunction of empty spiracles: A Drosophila homeo box gene with two patterningfunctions on the anterior-posterior axis of the embryo. Genes Dev 3: 1940–1956.
47. Finkelstein R, Perrimon N (1990) The orthodenticle gene is regulated bybicoid and torso and specifies Drosophila head development. Nature 346: 485–488.
48. Wimmer EA, Simpson-Brose M, Cohen SM, Desplan C, Jackle H (1995)
PLoS Biology | www.plosbiology.org March 2009 | Volume 7 | Issue 3 | e10000490602
Canalization of Gene Expression in Drosophila
Trans- and cis-acting requirements for blastodermal expression of the headgap gene buttonhead. Mech Dev 53: 235–245.
49. Gao Q, Finkelstein R (1998) Targeting gene expression to the head: theDrosophila orthodenticle gene is a direct target of the Bicoid morphogen.Development 125: 4185–4193.
50. Weigel D, Jurgens G, Klingler M, Jackle H (1990) Two gap genes mediatematernal terminal pattern information in Drosophila. Science 248: 495–498.
51. Bronner G, Jackle H (1991) Control and function of terminal gap geneactivity in the posterior pole region of the Drosophila embryo. Mech Dev 35:205–211.
52. Pignoni F, Steingrimsson E, Lengyel JA (1992) bicoid and the terminalsystem activate tailless expression in the early Drosophila embryo. Develop-ment 115: 239–251.
53. Lott S, Kreitman M, Palsson A, Alekseeva E, Ludwig M (2007) Canalizationof segmentation and its evolution in Drosophila. Proc Natl Acad Sci U S A104: 10926–10931.
54. Berleth T, Burri M, Thoma G, Bopp D, Richstein S, et al. (1988) The role oflocalization of bicoid RNA in organizing the anterior pattern of theDrosophila embryo. EMBO J 7: 1749–1756.
55. Lacalli TC, Harrison LG (1991) From gradients to segments: Models forpattern formation in early Drosophila embryogenesis. Semin Dev Biol 2:107–117.
56. Gregor T, Bialek W, de Ruyter van Steveninck RR, Tank DW, Wieschaus EF(2005) Diffusion and scaling during early embryonic pattern formation.Proc Natl Acad Sci U S A 102: 18403–18407.
57. Coppey M, Berezhkovskii AM, Kim Y, Boettiger AN, Shvartsman SY (2007)Modeling the Bicoid gradient: Diffusion and reversible nuclear trapping ofa stable protein. Dev Biol 312: 623–630.
58. Kraut R, Levine M (1991) Mutually repressive interactions between the gapgenes giant and Kruppel define middle body regions of the Drosophilaembryo. Development 111: 611–621.
59. Crauk O, Dostatni N (2005) Bicoid determines sharp and precise targetgene expression in the Drosophila embryo. Curr Biol 15: 1888–1898.
60. Tostevin F, ten Wolde PR, Howard M (2007) Fundamental limits to positiondetermination by concentration gradients. PLoS Comput Biol 3: e78.doi:10.1371/journal.pcbi.0030078
61. Manu, Surkova S, Spirov AV, Gursky VV, Janssens H, et al. (2009)Canalization of gene expression and domain shifts in the Drosophilablastoderm by dynamical attractors. PLoS Comput Biol 5(3): e1000303.doi:10.1371/journal.pcbi.1000303
62. Lucchetta EM, Lee J, Fu L, Patel N, Ismagilov R (2005) Dynamics ofDrosophila embryonic patterning network perturbed in space and timeusing microfluidics. Nature 434: 1134–1138.
63. Wu YF, Myasnikova E, Reinitz J (2007) Master equation simulation analysisof immunostained Bicoid morphogen gradient. BMC Syst Biol 1: 52.
64. Lepzelter D, Wang J (2008) Exact probabilistic solution of spatial-depend-ent stochastics and associated spatial potential landscape for the bicoidprotein. Phys Rev E 77.: Art. No. 041917.
65. Waddington CH (1959) Canalization of development and genetic assim-ilation of acquired characters. Nature 183: 1654–1655.
66. Wagner G, Booth G, Bagheri-Chaichian H (1997) A population genetictheory of canalization. Evolution 51: 329–347.
67. Gibson G, Wagner G (2000) Canalization in evolutionary genetics: astabilizing theory? BioEssays 22: 3 72–380.
68. Hansen TF (2006) The evolution of genetic architecture. Annu Rev EcolEvol Syst 37: 123–157.
69. Meiklejohn CD, Hartl DL (2002) A single mode of canalization. Trends EcolEvol 17: 468–473.
70. Hirsch M, Smale S, Devaney R (2004) Differential equations, dynamicalsystems, and an introduction to chaos. Boston: Academic Press.
71. Thom R (1983) Mathematical models of morphogenesis. West Sussex(England): Ellis Horwood Limited.
72. Kosman D, Small S, Reinitz J (1998) Rapid preparation of a panel ofpolyclonal antibodies to Drosophila segmentation proteins. Dev Genes Evol208: 290–294.
73. Janssens H, Kosman D, Vanario-Alonso CE, Jaeger J, Samsonova M, et al.(2005) A high-throughput method for quantifying gene expression datafrom early Drosophila embryos. Dev Genes Evol 215: 374–381.
74. Myasnikova E, Samsonova A, Kozlov K, Samsonova M, Reinitz J (2001)Registration of the expression patterns of Drosophila segmentation genes bytwo independent methods. Bioinformatics 17: 3–12.
PLoS Biology | www.plosbiology.org March 2009 | Volume 7 | Issue 3 | e10000490603
Canalization of Gene Expression in Drosophila