Comparative genome sequencing of Drosophila pseudoobscura: Chromosomal, gene, and cis-element...
18
Comparative genome sequencing of Drosophila pseudoobscura: Chromosomal, gene, and cis-element evolution Stephen Richards, 1,15 Yue Liu, 1,2,3 Brian R. Bettencourt, 4 Pavel Hradecky, 4 Stan Letovsky, 4 Rasmus Nielsen, 5 Kevin Thornton, 5 Melissa J. Hubisz, 5 Rui Chen, 1 Richard P. Meisel, 6 Olivier Couronne, 8,12 Sujun Hua, 9 Mark A. Smith, 4 Peili Zhang, 4 Jing Liu, 1 Harmen J. Bussemaker, 10 Marinus F. van Batenburg, 10,13 Sally L. Howells, 1 Steven E. Scherer, 1 Erica Sodergren, 1 Beverly B. Matthews, 4 Madeline A. Crosby, 4 Andrew J. Schroeder, 4 Daniel Ortiz-Barrientos, 11 Catharine M. Rives, 1 Michael L. Metzker, 1 Donna M. Muzny, 1 Graham Scott, 1 David Steffen, 1 David A. Wheeler, 1 Kim C. Worley, 1 Paul Havlak, 1 K. James Durbin, 1 Amy Egan, 1 Rachel Gill, 1 Jennifer Hume, 1 Margaret B. Morgan, 1 George Miner, 1 Cerissa Hamilton, 1 Yanmei Huang, 4 Lenée Waldron, 1 Daniel Verduzco, 1 Kerstin P. Clerc-Blankenburg, 1 Inna Dubchak, 8 Mohamed A.F. Noor, 11 Wyatt Anderson, 14 Kevin P. White, 9 Andrew G. Clark, 5 Stephen W. Schaeffer, 7 William Gelbart, 4 George M. Weinstock, 1 and Richard A. Gibbs 1 1 Human Genome Sequencing Center and Department of Molecular and Human Genetics, 2 Program in Structural and Computational Biology and Molecular Biophysics, and 3 W.M. Keck Center for Computational Biology, Baylor College of Medicine, Houston Texas 77030, USA; 4 FlyBase–Harvard, Department of Molecular and Cellular Biology, Harvard University, Biological Laboratories, Cambridge, Massachusetts 021383, USA; 5 Department of Biological Statistics and Computational Biology, and Department of Molecular Biology and Genetics, Cornell University, Ithaca, New York 14853, USA; 6 Intercollege Graduate Degree Program in Genetics, 7 Department of Biology and Institute of Molecular Evolutionary Genetics, The Pennsylvania State University, University Park, Pennsylvania 16802, USA; 8 Lawrence Berkeley National Laboratory, Berkeley, California 94720, USA; 9 Department of Genetics, Yale University School of Medicine, New Haven, Connecticut 06520, USA; 10 Department of Biological Sciences and Center for Computational Biology and Bioinformatics, Columbia University, New York, New York 10027, USA; 11 Department of Biological Sciences, Louisiana State University, Baton Rouge, Louisiana 70803, USA; 12 U.S. Department of Energy Joint Genome Institute, Walnut Creek, California 94598, USA; 13 Swammerdam Institute for Life Sciences, University of Amsterdam, The Netherlands; 14 Department of Genetics, University of Georgia, Athens, Georgia 30602, USA We have sequenced the genome of a second Drosophila species, Drosophila pseudoobscura, and compared this to the genome sequence of Drosophila melanogaster, a primary model organism. Throughout evolution the vast majority of Drosophila genes have remained on the same chromosome arm, but within each arm gene order has been extensively reshuffled, leading to a minimum of 921 syntenic blocks shared between the species. A repetitive sequence is found in the D. pseudoobscura genome at many junctions between adjacent syntenic blocks. Analysis of this novel repetitive element family suggests that recombination between offset elements may have given rise to many paracentric inversions, thereby contributing to the shuffling of gene order in the D. pseudoobscura lineage. Based on sequence similarity and synteny, 10,516 putative orthologs have been identified as a core gene set conserved over 25–55 million years (Myr) since the pseudoobscura/melanogaster divergence. Genes expressed in the testes had higher amino acid sequence divergence than the genome-wide average, consistent with the rapid evolution of sex-specific proteins. Cis-regulatory sequences are more conserved than random and nearby sequences between the species—but the difference is slight, suggesting that the evolution of cis-regulatory elements is flexible. Overall, a pattern of repeat-mediated chromosomal rearrangement, and high coadaptation of both male genes and cis-regulatory sequences emerges as important themes of genome divergence between these species of Drosophila. 15 Corresponding author. E-mail [email protected]; fax (713) 798-5741. Article and publication are at http://www.genome.org/cgi/doi/10.1101/gr.3059305. Freely available online through the Genome Research Immediate Open Access option. Article 15:1–18 ©2005 by Cold Spring Harbor Laboratory Press; ISSN 1088-9051/05; www.genome.org Genome Research 1 www.genome.org
-
Upload
personal-psu -
Category
Documents
-
view
1 -
download
0
Transcript of Comparative genome sequencing of Drosophila pseudoobscura: Chromosomal, gene, and cis-element...
Comparative genome sequencing of Drosophilapseudoobscura: Chromosomal, gene,and cis-element evolutionStephen Richards,1,15 Yue Liu,1,2,3 Brian R. Bettencourt,4 Pavel Hradecky,4
Stan Letovsky,4 Rasmus Nielsen,5 Kevin Thornton,5 Melissa J. Hubisz,5 Rui Chen,1
Richard P. Meisel,6 Olivier Couronne,8,12 Sujun Hua,9 Mark A. Smith,4 Peili Zhang,4
Jing Liu,1 Harmen J. Bussemaker,10 Marinus F. van Batenburg,10,13 Sally L. Howells,1
Steven E. Scherer,1 Erica Sodergren,1 Beverly B. Matthews,4 Madeline A. Crosby,4
Andrew J. Schroeder,4 Daniel Ortiz-Barrientos,11 Catharine M. Rives,1
Michael L. Metzker,1 Donna M. Muzny,1 Graham Scott,1 David Steffen,1
David A. Wheeler,1 Kim C. Worley,1 Paul Havlak,1 K. James Durbin,1 Amy Egan,1
Rachel Gill,1 Jennifer Hume,1 Margaret B. Morgan,1 George Miner,1 Cerissa Hamilton,1
Yanmei Huang,4 Lenée Waldron,1 Daniel Verduzco,1 Kerstin P. Clerc-Blankenburg,1
Inna Dubchak,8 Mohamed A.F. Noor,11 Wyatt Anderson,14 Kevin P. White,9
Andrew G. Clark,5 Stephen W. Schaeffer,7 William Gelbart,4 George M. Weinstock,1
and Richard A. Gibbs1
1Human Genome Sequencing Center and Department of Molecular and Human Genetics, 2Program in Structural andComputational Biology and Molecular Biophysics, and 3W.M. Keck Center for Computational Biology, Baylor College of Medicine,Houston Texas 77030, USA; 4FlyBase–Harvard, Department of Molecular and Cellular Biology, Harvard University, BiologicalLaboratories, Cambridge, Massachusetts 021383, USA; 5Department of Biological Statistics and Computational Biology, andDepartment of Molecular Biology and Genetics, Cornell University, Ithaca, New York 14853, USA; 6Intercollege Graduate DegreeProgram in Genetics, 7Department of Biology and Institute of Molecular Evolutionary Genetics, The Pennsylvania State University,University Park, Pennsylvania 16802, USA; 8Lawrence Berkeley National Laboratory, Berkeley, California 94720, USA;9Department of Genetics, Yale University School of Medicine, New Haven, Connecticut 06520, USA; 10Department of BiologicalSciences and Center for Computational Biology and Bioinformatics, Columbia University, New York, New York 10027, USA;11Department of Biological Sciences, Louisiana State University, Baton Rouge, Louisiana 70803, USA; 12U.S. Department ofEnergy Joint Genome Institute, Walnut Creek, California 94598, USA; 13Swammerdam Institute for Life Sciences, University ofAmsterdam, The Netherlands; 14Department of Genetics, University of Georgia, Athens, Georgia 30602, USA
We have sequenced the genome of a second Drosophila species, Drosophila pseudoobscura, and compared this to thegenome sequence of Drosophila melanogaster, a primary model organism. Throughout evolution the vast majority ofDrosophila genes have remained on the same chromosome arm, but within each arm gene order has been extensivelyreshuffled, leading to a minimum of 921 syntenic blocks shared between the species. A repetitive sequence is foundin the D. pseudoobscura genome at many junctions between adjacent syntenic blocks. Analysis of this novel repetitiveelement family suggests that recombination between offset elements may have given rise to many paracentricinversions, thereby contributing to the shuffling of gene order in the D. pseudoobscura lineage. Based on sequencesimilarity and synteny, 10,516 putative orthologs have been identified as a core gene set conserved over 25–55million years (Myr) since the pseudoobscura/melanogaster divergence. Genes expressed in the testes had higher aminoacid sequence divergence than the genome-wide average, consistent with the rapid evolution of sex-specific proteins.Cis-regulatory sequences are more conserved than random and nearby sequences between the species—but thedifference is slight, suggesting that the evolution of cis-regulatory elements is flexible. Overall, a pattern ofrepeat-mediated chromosomal rearrangement, and high coadaptation of both male genes and cis-regulatorysequences emerges as important themes of genome divergence between these species of Drosophila.
15Corresponding author.E-mail [email protected]; fax (713) 798-5741.Article and publication are at http://www.genome.org/cgi/doi/10.1101/gr.3059305. Freely available online through the Genome Research Immediate Open Accessoption.
Article
15:1–18 ©2005 by Cold Spring Harbor Laboratory Press; ISSN 1088-9051/05; www.genome.org Genome Research 1www.genome.org
[Supplemental material is available online at www.genome.org. The annotated whole genome project has beendeposited into DDBJ/EMBL/GenBank under the project accession AADE00000000. The version described in thispaper is the first version, AADE01000000. The sequences of the proximal and distal Arrowhead breakpoints havebeen deposited in GenBank with accession nos. AY693425 and AY693426. The following individuals kindly providedreagents, samples, or unpublished information as indicated in the paper: P.J. de Jong and K. Osoegawa.]
Comparative genome sequencing is an important tool in the on-going effort to annotate and analyze genes, cis-regulatory ele-ments, and architectural features of genomes. A single genomicsequence provides a wealth of information about the numberand location of genes, but the experimental confirmation of ge-netic function and regulation can be a painstaking process. Thestructure of the genetic code facilitates identification of con-served protein-coding regions (Nekrutenko et al. 2002), whereasapproaches such as “phylogenetic footprinting” (Boffelli et al.2003) may aid the identification of functional noncoding ele-ments. A recent small-scale study of four Drosophila species (Berg-man et al. 2002) suggested that the sequence divergence betweenDrosophila pseudoobscura and Drosophila melanogaster is appropri-ate for the identification of cis-regulatory regions. Such a com-parison also provides support for gene predictions, allows con-served protein-coding sequences to be identified, and is a majorrationale for the D. pseudoobscura genome sequencing project.
Comparative genomic sequencing can also provide insightsinto the evolutionary mechanisms of genome rearrangement,which is of special interest in these species. Selection may favorinversions, because they maintain epistatic combinations withinthe inverted segment (Dobzhansky 1949; Charlesworth andCharlesworth 1973; Wu and Beckenbach 1983; Otto and Barton2001), or selection may favor rearrangements that reorganizegenes into clusters of coordinately expressed genes (Roy et al.2002; Spellman and Rubin 2002; Lercher et al. 2003). Once es-tablished in populations, chromosomal inversions may play arole in the formation of new species (Noor et al. 2001; Navarroand Barton 2003).
Drosophila has been a model system for studying the evolu-tion of chromosomes and gene order (Sturtevant and Tan 1937;Sturtevant and Novitski 1941). Chromosomal rearrangementshave negative fitness consequences in many organisms becauseof the deleterious effects of segmental aneuploidy resulting fromchromosomal segregation (reciprocal translocations and transpo-sitions) or recombination (pericentric inversions) (Swanson et al.1981). In Drosophila, however, special features of meiosis avoidthe negative fitness effect for one class of rearrangements—paracentric inversions (inversions with both breakpoints on thesame chromosome arm). In male meiosis there is no crossingover and hence no recombinant aneuploid dicentric/acentric ga-metes. In female meiosis, where crossing over does occur, thedicentric/acentric recombinant chromosomes are directed intopolar bodies rather than the functional gamete (Sturtevant andBeadle 1936). As a result, paracentric inversions are highly poly-morphic within populations of most Drosophila species (Sperlichand Pfriem 1986), and some of these inversions become fixedduring speciation.
Sturtevant and Dobzhansky discovered a wealth of naturallyoccurring chromosomal inversion polymorphisms in D. pseudo-obscura, predominantly on the third and X-chromosomes (Stur-tevant and Dobzhansky 1936), through an examination of sali-vary chromosomes (Painter 1934). Ten of these arrangements arewidely distributed and abundant. Dobzhansky first used paracen-tric inversion events to reconstruct relationships among D. pseu-
doobscura and Drosophila persimilis third chromosomes(Dobzhansky and Epling 1944). Genes within the D. pseudoob-scura chromosomal inversions are likely targets of selection as thepolymorphic gene arrangements form stable geographic clines(Dobzhansky and Epling 1944), from altitudinal clines in certainpopulations (Dobzhansky 1948a), exhibit seasonal cycling(Dobzhansky 1948a) and exhibit high levels of linkage disequi-librium (Schaeffer et al. 2003). More than 300 inversions havebeen detected across the six chromosomal arms of D. melanogas-ter (Lemeunier and Aulard 1992), but only two arrangements perchromosome are widely distributed and abundant. An obviousquestion, therefore, is what is the mechanism responsible fordifferences in the distribution of inversions in different Dro-sophila genomes?
Random breakage (Ohno 1973; Nadeau and Taylor 1984),transposon-mediated recombination (Krimbas 1992; Caceres etal. 1999; Mathiopoulos et al. 1999; Evgen’ev et al. 2000; Casals etal. 2003), and fragile breakpoints (Novitski 1946; Pevzner andTesler 2003) have been suggested as possible mechanisms forgenerating paracentric inversions in natural populations, butthere is little definitive evidence. Our study provides a uniqueopportunity to explore the origin of these rearrangements byexamining sequences at junctions of synteny blocks between thetwo species.
Genome sequence of D. pseudoobscura
We sequenced the genome of D. pseudoobscura using a wholegenome shotgun method. In all, 2.6 million sequence reads wereproduced and assembled into a high-quality draft genome se-quence (the numbers of reads from libraries of different insertsizes are summarized in Supplemental Table S1). The sequence iscomprised of 8288 contigs (average length 16.3 kb, N50 51.9 kb)joined by paired end read information into 755 scaffolds with anN50 of 1.0 Mb, covering a total of 139 Mb (Supplemental TableS2). Although the total number of reads attempted suggests a13� coverage, the actual read coverage within the assembly is9.1�. A description of the N50 scaffold best reflects the quality ofthe sequence. Fifty percent of the sequence is in scaffolds longerthan scaffold contig 2803–contig 3631, the N50 scaffold. TheN50 scaffold is 994,609 bp in length and is comprised of 15,143sequence reads in 26 contigs. Of the sequence reads 2927 arefrom the 2.7-kb library, 7565 from the 3.4-kb library, 4413 fromthe 6.3-kb library, 178 are fosmid end sequences, and 19 BAC endsequences. The average Phred (Ewing and Green 1998; Ewing etal. 1998) quality score of the consensus contig sequence is 86.8,with 908,521 bp (91.3%) having the highest Phred Score of 90and only 1198 bp (0.1%) having a Phred score <20. The totalestimated length of the gaps is 15,143 bp or 1.5% of the scaffoldsequence length. The quality of the sequence has been furtherassessed by comparison with a small amount of finished se-quence. From this comparison an error rate of 0.26 � 10�4 wasestimated—see Methods for further information on this assess-ment.
The 755 scaffolds can be placed into 16 ultra-scaffolds an-chored onto the six chromosomal arms or Muller elements
Richards et al.
2 Genome Researchwww.genome.org

(Muller 1940) (see Methods, ‘Anchoring sequence scaffolds tochromosomes’). These ultra-scaffolds have an N50 of ∼12 Mb,with Muller elements C and E covered by single ultra-scaffolds,Muller element B comprising four ultra-scaffolds, and Muller el-ements A and D having five and six ultra-scaffolds, respectively.
Genome size
The chromosome arms of D. pseudoobscura are ∼17% larger thanthose of D. melanogaster sequence version 3 (Celniker et al. 2002)with the exception of Muller element C, which is approximatelythe same size (the sizes of the chromosome arms are shown inSupplemental Table S3). The assembly contains 156 Mb of se-quence in scaffolds with >1 contig of at least 1 kb, with 17 Mb ofthis in the form of reptigs (contigs produced from the separateassembly of highly repetitive sequence, then merged with themain assembly). We estimate the euchromatic portion to be ∼131Mb, based on the extent of the genome covered by and betweenscaffolds >100 kb anchored to chromosomes. This set of se-quence scaffolds is ∼18% longer than the finished D. melanogastereuchromatic sequence and forms the basis of the data in Supple-mental Table S3. Much of the remaining sequence consists ofsmall contigs resistant to scaffolding and anchoring. In D. mela-nogaster, many such small contigs mapped to heterochromaticregions of the genome, and we expect the same will be true ofD. pseudoobscura.
To compare unique sequence between the two genomes, weidentified distinct 16-mer sequences within the assemblies. Wefound 111.9 Mb and 102.3 Mb of unique sequence in theD. pseudoobscura and D. melanogaster assemblies, respectively.Thus, the additional sequence is not predominantly due to repeatexpansion, unless such repeats are old enough to have signifi-cantly diverged from one another. To determine whether therelative additional sequence resides in a small number of largedifferences or a large number of smaller differences, we comparedorthologous pairs of intergenic lengths in regions where syntenicorder was conserved. The total length of these regions is 65 Mb inD. pseudoobscura and 59 Mb in D. melanogaster— ∼11% longer inD. pseudoobscura. The increase in length appears to be fairlyevenly distributed over many intergenic regions and not due to asmall number of large sequence insertions. The frequency of or-thologous intergenic and intron length ratios is shown in graphi-cal form in Supplemental Figure S1. The mean ratio of the or-thologous intronic length pairs is very close to zero, indicatingthat intron length is not the source of the increased size of thegenome. The orthologous intergenic pairs analyzed show an in-creased length of ∼17% in D. pseudoobscura relative to D. mela-nogaster.
Genome coverage
A biologically relevant measure of genome size is the gene con-tent. In D. melanogaster release 3.1, 13,676 genes have been an-notated in the euchromatic portion of the assembly (Misra et al.2002). Others in the heterochromatic portion of the assemblybring the total gene content of D. melanogaster to ∼14,000. Morethan 90% of these genes can be putatively found using TBLASTNto search the D. pseudoobscura assembly. Of this number, 10,516are likely orthologs (see annotation and gene prediction). Thegenome coverage of the assembly was additionally estimated bycomparison with the 1.1 Mb total finished sequence: 96.3% wascontained in the assembly. A search for a set of 22,347 D. pseu-doobscura EST sequences found that 96.2% could be aligned tothe assembly. Together, these data indicate that the draft se-
quence included >96% of the euchromatic genome in D. pseudo-obscura.
Syntenic map
A map summarizing the syntenic regions between D. pseudoob-scura and D. melanogaster is extremely useful in the identificationof orthologous genes, for the identification of chromosomal re-arrangements, and the seeding of genome alignments. As proteinsequences provided more robust similarity signals than noncod-ing sequences, the initial syntenic map was based on TBLASTNcomparison of release 3.1 D. melanogaster protein predictions(one chosen for each gene) to the D. pseudoobscura “freeze 1”genomic sequence. In most cases, the D. pseudoobscura sequencematch was the best TBLASTN hit to a given melanogaster protein.Semiautomatic inspection was used to refine the initial set ofmatches. Occasionally, a less strong TBLASTN hit was selected asthe “valid” match if it resided in the expected linkage location,closing a gap in a run of D. melanogaster–D. pseudoobscura syn-tenic conservation. Matches that were inconsistent with syntenicdata, where other data were consistent with the true match fall-ing into a sequence gap, were rejected as false positives. Thesyntenic relationships of the D. melanogaster protein to D. pseu-doobscura sequence anchor points described by these BLAST hitswere then manually inspected to define and refine the order ofsyntenic blocks. Synteny blocks were defined as runs of consecu-tive D. melanogaster protein sequence–D. pseudoobscura genomicsequence pairs. Within a syntenic block, gaps were permitted(since there are genes that fall into sequence gaps) and an occa-sional gene out of order was also permitted (if it fell within fivegenes of its expected location). Gene duplications in one speciescould be perceived as synteny breaks. Gene duplications were notconsidered in the derivation of synteny blocks.
Figure 1 shows the synteny blocks of the chromosomes areshort and extremely mixed, but the great majority of syntenicsequences are found on the same Muller element in D. pseudoob-scura as they are in D. melanogaster. Thus, as expected, the ma-jority of the chromosomal rearrangements between the D. pseu-doobscura and D. melanogaster lineages have been confined torelated chromosome arms. The average number of D. melanogas-ter genes in a syntenic block is 10.7, corresponding to ∼83 kb. Thelength distribution of syntenic blocks on different Muller ele-ments is shown in Supplemental Figure S2.
Alignment with D. melanogaster
We produced several alignments of D. pseudoobscura and D. me-lanogaster, and focused on a BLASTZ alignment filtered by com-parison with our syntenic map (see Methods). The number ofbases that could be aligned (alignability) of the different chro-mosome arms between D. pseudoobscura and D. melanogaster av-erages ∼48% and is shown for the five large chromosome arms inSupplemental Figure S3. The fraction of identical bases in thealignment along D. melanogaster chromosomes is quite variable,and is shown for both all sequence and aligned sequence only inSupplemental Figures S4 and S5. Notably, for Muller element Awe are able to align only 34% of the bases, compared with be-tween 46.5% and 51% of the bases on the other chromosomearms. The Muller element A is Chromosome XL in D. pseudoob-scura and Chromosome X in D. melanogaster. Muller element D,which is the sex chromosome arm XR in D. pseudoobscura and theautosomal 3L in D. melanogaster, has 46.5% of its base pairs inalignments, the second lowest value. Further analysis showed
D. pseudoobscura genome
Genome Research 3www.genome.org
that amino acid identities of orthologs between the two specieson Muller elements A and D are not markedly different from theother chromosomes. Possibly, the haploid nature of the X-chromosome in males allows faster accumulation of differencesthan in the autosomes.
Annotation and gene prediction
Using TBLASTN we identified 12,179 regions of the D. pseudoob-scura genome containing a putative ortholog of a D. melanogastergene. These regions were compared to the locations of gene mod-els produced by three separate gene prediction programs (seeMethods). Of the 12,179 regions containing an ortholog of a D.melanogaster gene, 9946 overlapped a D. pseudoobscura genemodel predicted by one or more of the prediction programs andfor which the proteins in the two species were reciprocal besthits. These 9946 gene models are annotated in the GenBank sub-mission, and the remaining 2233 gene loci have been annotatedin the GenBank submission as gene loci identified by TBLASTNanalysis but lacking gene models. Despite being a draft sequence,only 9.6% of the gene models contain sequence gaps. A total of19.9% of the gene models align to the entire orthologous D.melanogaster gene model, while the remaining 80% of the D.pseudoobscura gene models align to an average of 92% of theorthologous D. melanogaster gene model. A frequency histogram
of the percent identity within alignments of orthologous pro-teins is shown in Supplemental Figure S10. The mean amino acididentity for all of the gene pairs was 77%, with a mode around85%. These gene models provide an excellent starting point forfurther annotation of the D. pseudoobscura genome. A modestamount of EST sequence is available in D. pseudoobscura. Of the12,179 gene loci, 3859 overlap with one or more ESTs regardlessof the strand, among them 3592 overlapping with one or moreESTs on the same strand. Unfortunately, the only cDNAs so farsequenced are from a non-normalized embryonic library; thus,without additional tissues or normalization, we expect little in-crease in this coverage.
This analysis of gene loci leaves two interesting sets of genes.First, there are 1485 (10.9% of all gene models) D. melanogastergene models in FlyBase without associated D. pseudoobscura geneloci. We believe that the majority of these 1485 “orphaned”D. melanogaster genes have D. pseudoobscura orthologs, but theyfail to be identified either because the D. pseudoobscura orthologis located within a sequence gap in the current WGS assembly, orbecause there is no supporting synteny evidence. Of the remain-der (which we expect are at most 500 genes), this set no doubtcontains rapidly evolving genes whose sequence similarity is toolow for our TBLASTN cutoffs, and possibly novel genes that havearisen since the D. pseudoobscura–D. melanogaster divergence. The
Figure 1. The syntenic relationship between D. pseudoobscura and D. melanogaster. Synteny dot-plots showing the shuffled syntenic relationshipsbetween D. pseudoobscura and D. melanogaster for the five chromosome arms. In each case the D. melanogaster chromosome is shown on the x-axisand the D. pseudoobscura chromosome on the y-axis. Note that lines within the graph are all of the same thickness, but are of varying length. Owingto the compression inherent in the figure, many of the lines are shorter than they are wide. Chromosomes have been color coded to allow identificationof interchromosomal synteny blocks. For example, in the top left of the D. pseudoobscura Chromosome 4–D. melanogaster Chromosome 2L plot, a smallregion of sequence on D. pseudoobscura Chromosome 4 with similarity to D. melanogaster Chromosome X can be seen. Muller element F is not shownbecause of the lack of sequence anchoring data on this chromosome.
Richards et al.
4 Genome Researchwww.genome.org

reverse set of D. pseudoobscura gene predictions without D. mela-nogaster counterparts cannot currently be assessed. The threegene prediction programs produced 14,646 gene predictions(many of these are overlapping between the three programs) thatdid not correspond to a TBLASTN-identified putative orthologto a D. melanogaster gene model. The majority of these areGENSCAN and TWINSCAN predictions as these do not require aD. melanogaster protein like GeneWise. We expect that most ofthese are invalid predictions, but that some will turn out to benovel genes not present in D. melanogaster, while some otherswill turn out to have D. melanogaster orthologs that have thus farescaped annotation by FlyBase. Additional data are required todistinguish between invalid predictions and true genes unique toD. pseudoobscura. Until such data are present, we are reluctant tospeculate further on the gene set unique to D. pseudoobscura.
Chromosomal evolution
Comparison of the D. pseudoobscura and D. melanogaster genomesequences identifies conserved linkage blocks and the associatedrearrangement breakpoints in the two lineages. Despite strongconservation of sequence blocks within the five orthologouschromosome arms, each chromosome arm has experienced ex-tensive internal shuffling, much of which can be interpreted asthe result of a sequential series of paracentric inversions (Fig. 1).No large interarm translocations were observed (with one pos-sible exception), consistent with previous small-scale analyses(Ranz et al. 2001). D. pseudoobscura scaffold 7059_2327 had amixture of best hits from genes located at the base of 2L and 2Rin D. melanogaster. This exception may therefore reflect a class ofpericentric inversions whose breaks are so proximal on each armthat recombination does not overlap the inversion, allowingthem to be tolerated without loss of fitness. A similar pericentricinversion has been observed within the melanogaster species sub-group in Drosophila erecta, Drosophila teissieri, and Drosophilayakuba based on chromosome banding patterns (Lemeunier andAshburner 1976), and it is possible that the D. melanogaster genedistribution between proximal 2L and 2R is not ancestral.
Single gene transpositions between Muller elements wereobserved, and in some cases a lack of introns in one orthologindicates that these arose through retrotransposition events.Analysis of 27 well-defined retrotransposition events showedthat 11 were from the D. melanogaster X-chromosome to aD. pseudoobscura autosome versus possible other directions (prob-ability < 0.01, �2 test), suggesting that gene movement awayfrom the X-chromosome is favored, consistent with observationsmade by Betran et al. (2002). Thus far, transcripts from seven ofthe 11 D. melanogaster genes derived from the X to autosometranspositions have been found only in testis-derived EST librar-ies and absent from other EST collections derived from othertissues. This is consistent with the hypothesis that the selectivepressure favors testis-specific gene movement to autosomes, en-suring gene expression despite X inactivation during spermato-genesis (Betran et al. 2002).
Chromosomal rearrangements
Transposable or repetitive elements may be involved in the gen-esis of rearrangements in Drosophila chromosomes through re-combination between offset copies of an element in reverse ori-entation (Potter 1982; Collins and Rubin 1984; Engels and Pres-ton 1984; Blackman et al. 1987; Lim 1988; Krimbas 1992; Lyttleand Haymer 1992; Sheen et al. 1993; Ladeveze et al. 1998;
Caceres et al. 1999; Mathiopoulos et al. 1999; Evgen’ev et al.2000; Casals et al. 2003). The differences in gene order observedbetween D. melanogaster and D. pseudoobscura reflect the rear-rangement history since the two species diverged from a com-mon ancestor (known rearrangements since the species divergedare depicted in Supplemental Fig. S6). Genes can move to differ-ent chromosome arms either through transpositions or pericen-tric inversions or can be shuffled within chromosomal arms viaparacentric inversions. In all of these cases, junctions betweenadjacent syntenic blocks contain rearrangement breakpoints thathave occurred in either the D. pseudoobscura or D. melanogasterlineage. Most of the rearrangement breakpoints are interspecificinversions long ago fixed in one or the other lineage, but eightbreakpoints on Muller element C are the result of four inversionmutations that converted the ancestral D. pseudoobscura TreeLine arrangement into the Arrowhead arrangement (the chromo-some arrangement in the D. pseudoobscura strain whose genomewas sequenced).
A total of 921 rearrangement breakpoints were identified inthe comparison of the D. pseudoobscura and D. melanogaster ge-nomes. This number is likely an underestimate as breaks causedby scaffold ends were excluded if the map location of the nextscaffold was not known. It has been estimated that 460 inver-sions have occurred in the two lineages (Ranz et al. 1997). Wecompared the sequences within the rearrangement breakpointsto determine (1) if breakpoints shared common sequence ele-ments; (2) if shared sequences are similar to known transposableelements; (3) if the distribution of common sequence elements iscorrelated with the presence of inversion polymorphism; and(4) if sequences between breakpoints are similar between species.This analysis did not include a comparison to Anopheles gambiaebecause the intra- and interchromosomal rearrangements be-tween D. melanogaster and the mosquito genomes have been tooextensive (Zdobnov et al. 2002).
Identification of intraspecific inversion breakpoints
PCR was used to identify the two breakpoints for the inversionthat converted the Standard gene arrangement into the Arrow-head gene arrangement. The vestigial gene is located near thedistal Standard to Arrowhead breakpoint based on in situ hybrid-ization (Fig. 2; Schaeffer et al. 2003). Using the synteny mapdescribed above, a break in conserved gene order betweenD. pseudoobscura and D. melanogaster, located 17 kb 3� of thevestigial gene (Schaeffer et al. 2003) was confirmed as the distalArrowhead breakpoint with a PCR amplification that spannedthe breakpoint (Fig. 2). The proximal Arrowhead breakpoint wasalso mapped with conserved linkage information and verifiedwith PCR analysis (Fig. 2).
If we reconstruct the Standard gene order by inverting thegenes within the two breakpoints, then the two genes that flankthe distal breakpoint are qkr58E-1 and qkr58E-2, which are alsoadjacent in D. melanogaster. The two genes flanking the proximalbreakpoint are vestigial and the predicted gene CG11798, whichare not adjacent in D. melanogaster. These data suggest that thedistal breakpoint has been used a single time, while the proximalbreakpoint has been used multiple times. The two breakpointsdefine a 6.0-Mb inverted region of Muller element C in D. pseu-doobscura that is predicted to contain 775 genes with D. melano-gaster putative orthologs. There is good evidence that naturalselection modulates the frequencies of the D. pseudoobscura genearrangements (Dobzhansky 1944, 1948b; Wright and Dobzhan-
D. pseudoobscura genome
Genome Research 5www.genome.org

sky 1946; Schaeffer et al. 2003); however, it will require furtherwork to identify which genes or combination of genes within theinverted regions are the targets of selection.
The junctions between syntenic blocks for the proximal anddistal Arrowhead breakpoints, as defined by their flanking syn-tenic blocks, are 20 and 5 kb in length, respectively. Comparisonof the two junctions revealed two, short repeat sequences of 128and 315 bp (“breakpoint motifs”) (Fig. 3). The breakpoint motifsare in reverse orientation relative to each other, suggesting thatpairing followed by ectopic exchange led to the Arrowhead genearrangement. The breakage event between elements was stag-gered, at opposite ends of repeats p1F and d1B (Fig. 3). The simi-larity among the 13 copies of the 128-bp repeat vary between49.6% and 96.9%, while similarity among the three copies of the315-bp repeat 2 varies between 83.7% and 86% (alignments areshown in Supplemental Fig. S7). The sequences show no signifi-
cant similarity to any known Drosophila transposable elementsequence, and we have been unable to detect coding function foreither a transposase or a reverse transcriptase near the breakpointmotifs.
Analysis of interspecific breakpoints
Junctions between syntenic blocks from the six Muller elementswere extracted from D. pseudoobscura and D. melanogaster ge-nomic sequence. The location and motif presence of each junc-tion is listed in Supplemental Table S9. Junctions without in-ferred gaps have an average length of 5.6 kb, and tend to beA/T-rich sequences with a mean A+T content of 60%. These junc-tion statistics are shown by Muller elements in SupplementalTable S4.
The breakpoint motif found at the two Arrowhead break-points of D. pseudoobscura is also found at other synteny break-points. A BLAST analysis of each breakpoint junction sequenceagainst the set of all breakpoint junctions found that >60% of thesequences had at least one High-scoring Segment Pair (HSP) toone other breakpoint within the genome (E-value, 1 � 10�5)(Supplemental Table S5); this similarity is largely due to thebreakpoint motif. Each chromosomal arm had at least one break-point that had an HSP to >40% of breakpoint sequences, sup-porting the idea that the breakpoint motif constitutes a singlerepetitive element family that has numerous degenerate copies inthe D. pseudoobscura genome. The higher frequency of the break-point motif within the junction sequences on Muller elements Cand E led to higher breakpoint similarity than Muller elements A,B, and D when a nonparametric Kruskal-Wallis test was used. Thedistribution of match fractions for breakpoints on the five majorMuller elements is shown in Supplemental Figure S8. The inter-breakpoint match frequency for Muller element F is not pre-sented because only seven breakpoints were identified on thischromosome. This analysis shows that D. pseudoobscura break-points tend to have similar sequences; however, the repeat is notrestricted to the two chromosomes segregating for inversionswith D. pseudoobscura. A similar analysis of breakpoint junctionsin D. melanogaster failed to detect an abundant repeat sequence(Supplemental Fig. S8).
Distribution of the breakpoint motif
The breakpoint motif is found at other locations in the genome,but the frequencies are much reduced (Table 1). The breakpointmotif is found at the highest frequencies at junctions betweensyntenic blocks (33.8%–42.6%), at moderate frequencies in non-coding sequences (10.3%–15.3%), and at minimal frequencies incoding regions (0.4%–0.8%). The motif frequencies in break-points and noncoding sequences of the Muller element F arehigh relative to the other chromosomal arms. This may reflectthe small numbers of sequences on the Muller element F, the dotchromosome, or more likely, that the heterochromatic nature ofthe chromosome allows a greater accumulation of repetitive el-ements (Sun et al. 2000). These observed frequency differencesare significantly different from each other with �2 heterogeneitytests (S.W. Schaeffer, unpubl.). These data suggest that the break-point motif is nonrandomly distributed in the genome and isenriched in breakpoints.
We asked whether breakpoint motifs are associated withparacentric inversions on Muller element C (Fig. 4). In all, 80junctions between syntenic blocks on Muller element C containthe motif. Of those, 18 motifs are within the boundaries of two
Figure 2. Mapping intraspecific inversion breakpoints. (A) Comparisonof Muller element C between D. melanogaster and the Arrowhead ar-rangement of D. pseudoobscura revealed a junction in conserved linkagenear vestigial (vg). The numbered sections 51E2, 58E1, 49D2, and 58D8are the D. melanogaster cytological locations that are homologous to70A, 76B, 70B, and 76C sections on the D. pseudoobscura cytologicalmap, respectively. vg maps near the distal breakpoint of the inversion thatconverted the Standard arrangement into the Arrowhead arrangement(Schaeffer et al. 2003). The locations of four PCR primers, a, b, c, and d,are shown on the Standard and Arrowhead physical maps. Note that thetwo internal primers, b and c, are switched in the two chromosomes. (B)PCR results. The Arrowhead-specific primer combinations (a + c andb + d) only amplified Arrowhead DNA, while the Standard-specific primercombinations (a + b and c + d) only amplified breakpoints on Standardarrangements. Sequence analysis of the PCR products from the Standardand Arrowhead backgrounds verifies that PCR amplified the appropriatesequences.
Richards et al.
6 Genome Researchwww.genome.org

ancestral syntenic blocks and can be hypothesized to generatesimple two-break rearrangements. The other 62 motif-containingjunctions were likely involved in multiple rearrangement eventswhere exchanges involved a motif within an ancestral syntenicblock and a motif at a pre-existing conserved linkage junction.The high frequency of motifs at pre-existing conserved linkagejunctions suggests that reconstructing the rearrangement historybetween D. pseudoobscura and D. melanogaster will be difficult,because breakpoints have been used multiple times. In addition,this observation suggests that the estimate of 460 rearrangementsis likely to be an underestimate of the true number of rearrange-ments that have occurred during the D. pseudoobscura andD. melanogaster lineages. Figure 4 also shows the orientations ofthe breakpoint motifs (indicated by open and filled triangles),which alternate more frequently than expected at random basedon a runs test (ts = 2.20, P < 0.05) (Sokal and Rohlf 1981).
The interbreakpoint sequence similarity is not solely due tothe breakpoint motif seen in the Standard to Arrowhead break-points. Transposable elements and repetitive sequences werefound in the junctions between syntenic blocks, but the junc-tions were not enriched for these known transposable elements.For example, some D. pseudoobscura breakpoints had sequencessimilar to the mini-me element (Wilder and Hollocher 2001),which uses reverse transcriptase for retrotransposition (S.W.Schaeffer, unpubl.). The mini-me element is found at a lower fre-quency at breakpoints than the breakpoint motif (3.4% vs.38.9%) and is not found at significantly different frequenciesbetween breakpoints and noncoding regions with �2 heteroge-neity tests.
A phylogeny of the breakpoint motifs, shown in Supple-mental Figure S9, which are 85% identical on average, has manylong terminal branches. This suggests that the breakpoint motif
Figure 3. Structure of the repeats within the breakpoints that converted the Standard gene arrangement into the Arrowhead arrangement. The heavyline at the bottom indicates Muller element C, and the tick marks indicate the locations of the proximal and distal breakpoints for the Arrowheadinversion. The black histograms at the top indicate the frequency that a BLAST High-scoring Segment Pair (HSP) included a particular nucleotide inBLASTN comparison of each breakpoint to the entire genome (E-value �1 � 10�5). Two repeat families of 128 and 315 bp (open and filled boxes,respectively) are shown within the two breakpoint regions within the detail regions at the top of the figure. The individual repeats were labeled with athree-letter designation, where the first letter indicates proximal or distal, the number indicates the repeat family, and the last letter indicates the distinctrepeat copy. Larger repeats can be generated from the small repeats such as the 443-bp repeat created by the adjacent 128- and 315-bp repeats. Thedashed box indicates the putative repeat unit involved in the rearrangement event, and the triangles indicate the approximate location of the DNAbreaks with respect to the repeat motif.
Table 1. Breakpoint sequence motif frequencies in three classes of sequence in six Muller elements in D. pseudoobscura
Mullerelement
Breakpoints Noncoding Coding
na (% � SD)b n (% � SD) �2 n (% � SD) �2
A 210 33.8 � 3.3 1698 15.3 � 0.9 45.5c 1851 0.8 � 0.2 513.6c
B 135 43.0 � 4.3 2031 12.9 � 0.7 90.3c 2124 0.8 � 0.2 703.0c
C 205 39.0 � 3.4 2082 11.4 � 0.7 119.4c 2276 0.7 � 0.2 733.4c
D 141 42.6 � 4.2 2068 14.3 � 0.8 78.3c 2159 0.6 � 0.2 758.0c
E 223 38.1 � 3.3 2636 10.3 � 0.6 146.1c 2923 0.4 � 0.1 985.8c
F 7 57.1 � 18.7 76 44.7 � 5.7 0.4 63 17.5 � 4.8 5.9c
aThe total number of sequences within each category.bThe percentage of sequences within each category that matched the conserved sequence motif � standard deviation. The three categories arebreakpoints, sequences at the boundary of two conserved linkage groups; noncoding, sequences that are not breakpoints or coding; and coding,sequences of protein-coding genes including introns.cProbability of the �2 value for the heterogeneity test with one degree of freedom is �0.05 after applying a Bonferroni correction for multiplecomparisons (Rice 1989). A �2 heterogeneity test is used to determine if the frequency of the breakpoint motif is significantly different between eitherthe noncoding or coding regions.
D. pseudoobscura genome
Genome Research 7www.genome.org

has rapidly radiated throughout the D. pseudoobscura genome.Breakpoint motifs fail to form monophyletic clusters by chromo-some or region of origin, rejecting the idea that these elementsare unique to a particular chromosome or have diversified basedon their chromosome of origin. Also, breakpoint motifs from thesame local genomic region are not more similar than sequencesseparated by longer distances. In fact, the two motifs that werethe most similar in this subset of sequences are from differentchromosomes.
Conservation of genes between D. pseudoobscuraand D. melanogaster
To investigate the conservation of genes between D. pseudoob-scura and D. melanogaster, we examined both the nucleotide andamino acid sequences of orthologous genes. Using the filteredglobal BLASTZ alignment and D. melanogaster 3.1 gene modelannotations (Misra et al. 2002), we were able to investigate theconservation of gene features between D. pseudoobscura andD. melanogaster. Figure 5 shows the degree of sequence conserva-tion in promoter regions, upstream regions, untranslated regions(UTRs), coding regions, introns, and other gene features, aver-aged over a large number of orthologous D. pseudoobscura–D.melanogaster gene feature pairs. (The number of gene feature pairsanalyzed for each category varies from 2300 to 43,000 as shownin Supplemental Fig. S11.) The average identity of coding se-quence at the nucleotide level is ∼70% for the first and secondbase pair of the codon, and 49% for the wobble base. Intronsequences are ∼40% identical, UTRs 45%–50%, and protein-binding sites from the literature 63%. Within our genome align-ment, 46% of total D. melanogaster base pairs are identical, and71.3% of D. melanogaster base pairs are in aligned regions. Wealso examined sequence conservation at the protein level.Supplemental Figure S10 depicts the percent amino acid identityof aligned orthologous protein sequences as a frequency histo-gram for alignments for four sets of proteins—all, male-specific,
transcription factors, and proteins with functions in the nervoussystem. The majority of protein sequences show >70% aminoacid identity, with a mode around 85%.
Male-specific proteins are less conserved than others
In contrast to the overall mode of 85% amino acid identity, pro-teins with ESTs derived from testis-specific libraries had a meanamino acid identity of just 60%. This suggested that there mightalso be an excess of testis-specific genes for which orthologsmight not be found because of overly rapid divergence. Wesearched for D. melanogaster genes for which no ortholog couldbe found in the entire D. pseudoobscura sequence set includingunassembled sequence reads. We focused on cases in which thesyntenic neighbors of the D. melanogaster orthologs of the miss-ing D. pseudoobscura gene were present. We found 75 such genes,20 of which contained no introns, suggesting they might be theresult of a retrotransposition event. It is impossible to ascertainthe origins of this class of genes without additional data, but ofthe 20 intronless D. melanogaster genes not found in D. pseudo-obscura, 11 were male specific, based on representations in testis-derived EST libraries and absence from EST libraries derived fromother tissues (�2-value = 59.7, df = 1, p < 0.00001). Furthermore,in 761 cases in which putative orthologous genes with testis-specific derived ESTs could be identified, the mean identity was∼15% more divergent than for other orthologs (p < e � 75)(Supplemental Fig. S10).
Evolutionary analysis of divergence of orthologous gene pairs
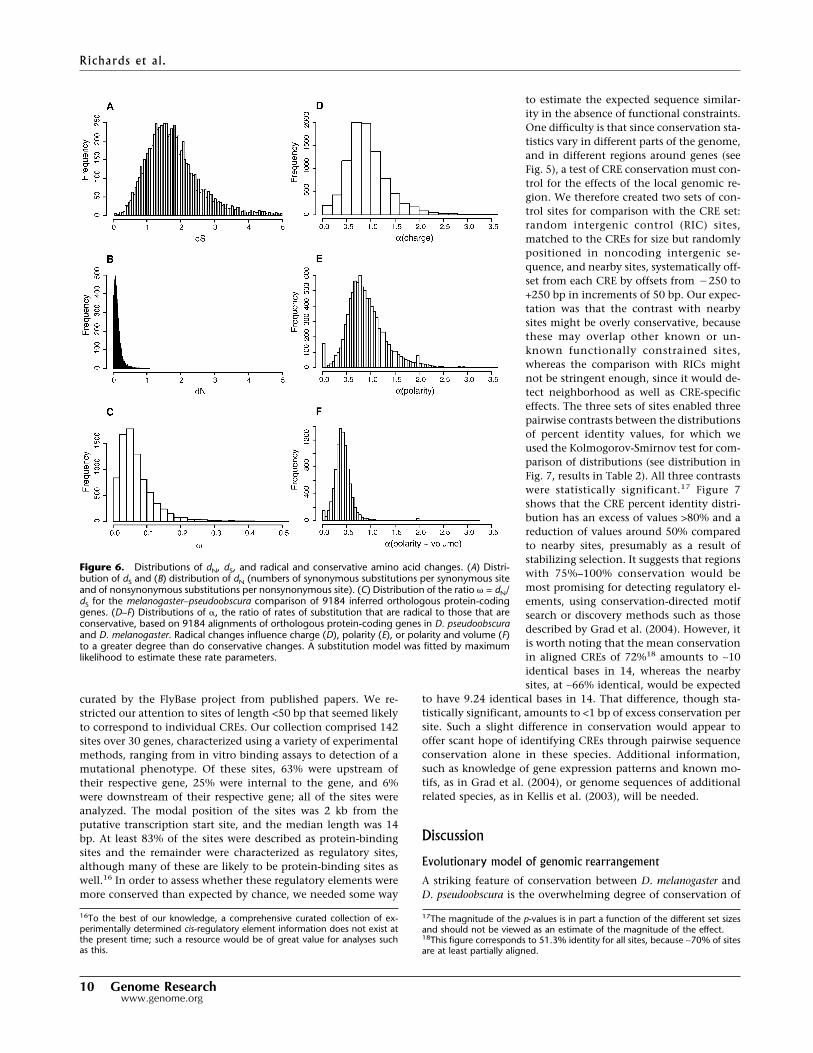
Coding regions of genomes have a built-in contrast between si-lent, synonymous sites and amino-acid-replacing nonsynony-mous sites that allow a variety of evolutionary inferences. Themedian number of synonymous substitutions per synonymoussite between D. pseudoobscura and D. melanogaster was dS = 1.79,and the median number of nonsynonymous substitutions pernonsynonymous site was dN = 0.14, with a skewed distribution
Figure 4. Rearrangement of conserved linkage groups between D. melanogaster and D. pseudoobscura. The thick horizontal lines represent thechromosomal maps of the D. melanogaster and D. pseudoobscura Muller element C. Vertical lines drawn either down (D. melanogaster) or up (D.pseudoobscura) indicate conserved linkage groups. The locations and orientations of 80 breakpoint motifs are indicated with open and filled trianglesat the junctions of conserved linkage groups. Diagonal lines connect homologous linkage groups in the two species where a single inversion eventbetween breakpoint motifs will bring adjacent D. melanogaster genes together (dashed and gray lines). A second example that shows ectopic exchangebetween a pair of motifs where only one breakpoint brings adjacent D. melanogaster genes together is indicated with black solid lines.
Richards et al.
8 Genome Researchwww.genome.org
around both values (Fig. 6). Estimates of median dS for XL, XR,and the autosomes were 1.82, 1.75, and 1.81, indicating thatsilent positions have suffered multiple hits per site. XR had asignificantly lower dS by a nonparametric Kruskal-Wallis test(H = 14.39, P < 0.001). Median values of dN for XL, XR, and theautosomes were 0.118, 0.105, and 0.108, and XR is again signifi-cantly lower (H = 9.92, P = 0.007). This is a surprise, as one mightexpect the translocation of the Muller element D from an auto-some to the X (to form XR) would result in an acceleration inevolution on this arm.
As the high level of synonymous divergence between D.pseudoobscura versus D. melanogaster gene sequences resulted inlow power and low reliability to detect positive selection usingthe dN/dS ratio, an alternative test was required. We fitted substi-tution models that split the nonsynonymous substitution rateinto two bins (radical vs. conservative as defined in Zhang 2000),each with its own rate parameter (see Methods). After controllingfor several factors that can influence this test (Dagan et al. 2002;
Smith 2003), we use a rate ratio of radical to conservative aminoacid substitutions >1 to identify an accelerated rate of radicalchanges. The set of genes such that the probability a false positiveis <5% (the 5% false discovery rate set) were identified from theP-values associated with the likelihood ratio test. There were 27genes in the polarity 5% FDR set and 44 genes in the 5% FDR setfor charge, providing rather conservative sets of genes showingexcess rates of radical amino acid substitution (these genes arelisted in Supplemental Tables S6 and S7). The list includes severaltranscription factors and activators, trithorax group genes, genesinvolved in innate immunity, cytochrome P450s, and choriongenes, reflecting a diverse set of biological functions that mayhave faced positive selection.
Conservation of known regulatory elements
To investigate conservation of cis-regulatory elements (CREs), wecollected a set of experimentally characterized regulatory sites
Figure 5. Averaged conservation of different segments of a “prototypical gene.” Conservation statistics were computed over thousands of alignedpairs of regions of various types, aligned at different reference points. At each position we compute the fraction of aligned pairs that have identical basesat that position (green + purple tiers), have mismatched bases (red), melanogaster bases aligned to deleted bases in pseudoobscura (yellow), or areunaligned in our synteny-filtered BLASTZ alignment (blue). The purple tier shows the fraction of bases that would be expected to match by chance giventhe base composition at that position in both species. The expected match is <25% because of the inclusion of unaligned and deleted sequences; if theseare removed, the baseline is ∼28% because of the slight AT richness of the genome. The vertical panels correspond to different segments of a prototypicalgene, indicated on the x-axis. A cartoon of the prototypical gene is represented under the panels. The segments are labeled by the segment of the genefollowed in parentheses by the part of that segment by which the segment was aligned. For example, CDS (5�-end) represents the start of the codingsequence aligned by the ATG start sequence, whereas the coding exon (3�-end) is aligned at the 3�-end of the coding exon, and thus the sequencesare not all in phase with each other. (A) RIC, random intergenic controls for CRE analysis; (B) nearby controls in order from �250 bp to +250 bp offsetfrom CREs. The right-most nearby controls are closest to the gene start and therefore in a region that is on average more conserved. Some of the nearbycontrols have a higher match percent (green) as a result; however, CREs have the highest match percent of identical base pairs as a fraction of alignedbases (everything but blue). (C) 142 Cis-regulatory elements of 50 bp or less from literature; (D) compressed sampling of the 5�-proximal region every50 bp from 50 to 500; (E) 50 bp proximal to the transcription start site (TS), aligned at TS; (F) genomic span of 5�-UTR, aligned at TS; (G) 5�-UTR spanaligned at protein start site (PS); (H) 5�-end of protein-coding region aligned at PS; (I) 3�-end of coding exons aligned at donor site; (J) intron alignedat donor site; (K) introns aligned at acceptor; (L) 5�-end of internal coding exons aligned at acceptor site; (M) 3�-end of protein-coding region alignedat protein end site (PE); (N) 3�-UTR span aligned at PE; (O) 3�-UTR span aligned at transcript end; (P) 50 bp of 3�-proximal region aligned at transcriptend; (Q) compressed sampling of 3�-proximal region every 50 bp from 50 to 500; and (R) genome-wide average.
D. pseudoobscura genome
Genome Research 9www.genome.org
curated by the FlyBase project from published papers. We re-stricted our attention to sites of length <50 bp that seemed likelyto correspond to individual CREs. Our collection comprised 142sites over 30 genes, characterized using a variety of experimentalmethods, ranging from in vitro binding assays to detection of amutational phenotype. Of these sites, 63% were upstream oftheir respective gene, 25% were internal to the gene, and 6%were downstream of their respective gene; all of the sites wereanalyzed. The modal position of the sites was 2 kb from theputative transcription start site, and the median length was 14bp. At least 83% of the sites were described as protein-bindingsites and the remainder were characterized as regulatory sites,although many of these are likely to be protein-binding sites aswell.16 In order to assess whether these regulatory elements weremore conserved than expected by chance, we needed some way
to estimate the expected sequence similar-ity in the absence of functional constraints.One difficulty is that since conservation sta-tistics vary in different parts of the genome,and in different regions around genes (seeFig. 5), a test of CRE conservation must con-trol for the effects of the local genomic re-gion. We therefore created two sets of con-trol sites for comparison with the CRE set:random intergenic control (RIC) sites,matched to the CREs for size but randomlypositioned in noncoding intergenic se-quence, and nearby sites, systematically off-set from each CRE by offsets from �250 to+250 bp in increments of 50 bp. Our expec-tation was that the contrast with nearbysites might be overly conservative, becausethese may overlap other known or un-known functionally constrained sites,whereas the comparison with RICs mightnot be stringent enough, since it would de-tect neighborhood as well as CRE-specificeffects. The three sets of sites enabled threepairwise contrasts between the distributionsof percent identity values, for which weused the Kolmogorov-Smirnov test for com-parison of distributions (see distribution inFig. 7, results in Table 2). All three contrastswere statistically significant.17 Figure 7shows that the CRE percent identity distri-bution has an excess of values >80% and areduction of values around 50% comparedto nearby sites, presumably as a result ofstabilizing selection. It suggests that regionswith 75%–100% conservation would bemost promising for detecting regulatory el-ements, using conservation-directed motifsearch or discovery methods such as thosedescribed by Grad et al. (2004). However, itis worth noting that the mean conservationin aligned CREs of 72%18 amounts to ∼10identical bases in 14, whereas the nearbysites, at ∼66% identical, would be expected
to have 9.24 identical bases in 14. That difference, though sta-tistically significant, amounts to <1 bp of excess conservation persite. Such a slight difference in conservation would appear tooffer scant hope of identifying CREs through pairwise sequenceconservation alone in these species. Additional information,such as knowledge of gene expression patterns and known mo-tifs, as in Grad et al. (2004), or genome sequences of additionalrelated species, as in Kellis et al. (2003), will be needed.
Discussion
Evolutionary model of genomic rearrangement
A striking feature of conservation between D. melanogaster andD. pseudoobscura is the overwhelming degree of conservation of
16To the best of our knowledge, a comprehensive curated collection of ex-perimentally determined cis-regulatory element information does not exist atthe present time; such a resource would be of great value for analyses suchas this.
17The magnitude of the p-values is in part a function of the different set sizesand should not be viewed as an estimate of the magnitude of the effect.18This figure corresponds to 51.3% identity for all sites, because ∼70% of sitesare at least partially aligned.
Figure 6. Distributions of dN, dS, and radical and conservative amino acid changes. (A) Distri-bution of dS and (B) distribution of dN (numbers of synonymous substitutions per synonymous siteand of nonsynonymous substitutions per nonsynonymous site). (C) Distribution of the ratio � = dN/dS for the melanogaster–pseudoobscura comparison of 9184 inferred orthologous protein-codinggenes. (D–F) Distributions of �, the ratio of rates of substitution that are radical to those that areconservative, based on 9184 alignments of orthologous protein-coding genes in D. pseudoobscuraand D. melanogaster. Radical changes influence charge (D), polarity (E), or polarity and volume (F)to a greater degree than do conservative changes. A substitution model was fitted by maximumlikelihood to estimate these rate parameters.
Richards et al.
10 Genome Researchwww.genome.org

gene synteny. This contrasts with the A. gambiae–D. melanogastercomparison, where there is a tendency for far weaker arm con-servation. Thus, although the basic mechanism favoring para-centric rearrangements appears to be a dipteran-wide phenom-enon, over longer evolutionary time (250–300 Mya since the di-vergence of Anopheles and Drosophila, compared with 25–55 Myasince the divergence of D. melanogaster and D. pseudoobscura)(Beckenbach et al. 1993; Russo et al. 1995; Tamura et al. 2003)there is clearly a breakdown of synteny (Zdobnov et al. 2002).Perhaps scaffold 7059_2327 with its mixture of proximally lo-cated genes from D. melanogaster 2L and 2R arms is a hint at onemechanism that can, over long evolutionary time, lead to exten-sive reshuffling of genes between arms of a chromosome.
Previous investigations have identified specific cases oftransposons and repetitive sequences at inversion break-
points (Lyttle and Haymer 1992; Caceres et al. 1999; Mathiopou-los et al. 1999; Evgen’ev et al. 2000; Casals et al. 2003), and inother cases, repetitive elements have not been seen at inver-sion breakpoints (Wesley and Eanes 1994; Cirera et al. 1995).This study provides evidence that repetitive sequences caneffect rearrangements on the genome scale, and may be the causeof the majority of inversions. Several pieces of evidence are con-sistent with the breakpoint motif being causal in the genera-tion of chromosomal rearrangements in the D. pseudoobscuralineage. The breakpoint motifs at opposite ends of the Arrowheadinversion are in reverse orientation, consistent with a mecha-nism where ectopic exchange generates an inversion event (Fig.8). The conserved sequence motif is virtually absent from intronand coding sequences. This suggests that strong purifying selec-tion has acted to prevent the accumulation of this sequencewithin introns. An alternative explanation is that intron se-quences are inaccessible either because of a nucleotide com-position unfavorable for motif insertion, or because the intronsare in an unfavorable location with respect to chromatin struc-ture. If the conserved motif serves as the target for rearrange-ments, then inversions that use elements within a gene wouldcause loss-of-function mutations that would be quickly removedfrom populations (Charlesworth et al. 1992). Repeated se-quences have also been detected at conserved linkage break-points among trypanosome species (Ghedin et al. 2004). Theanalysis of repeat structures within breakpoints should be viewedwith caution. Each breakpoint sequence should be viewed as acomposite of repetitive sequences. The breakpoint motif repre-sents the largest family of repeats within the D. pseudoobscuragenome detected to date, but other repeats within junctions ofconserved lineage may contribute to the process of genomic re-arrangement.
One problem with the high frequency of the breakpointmotif is that ectopic exchange between elements in the sameorientation would lead to deletion mutations. The lack of puri-fying selection on the breakpoint motif has allowed for its rapiddecay through the accumulation of nucleotide and indel substi-tutions. These data are consistent with the “dead-on-arrival” el-ements of Drosophila virilis that preferentially delete sequence(Petrov et al. 1996; Petrov and Hartl 1998). As a consequence, few
Table 2. Comparison of conservation of cis-regulatory elements (CREs) to two types of control sites
Group 1 vs. group 2CRE vs.nearby
CRE vs.random intergenic
Nearby vs.random intergenic
Per site analysis Group 1 mean per site % identity 51.3% 51.3% 47.8%Group 2 mean per site % identity 47.8% 42.9% 42.9%Difference of means (group 1 � group 2) 3.6% 8.4% 4.9%Difference of means resampling p-value 0.05 0.003 1E-5Distribution comparison KS p-value 0.026 0.0016 2E-6
Per base analysis Group 1 mean per base % identity 47.8% 47.8% 46.3%Group 2 mean per base % identity 46.3% 42.4% 42.4%Difference of means (group 1 � group 2) 1.5% 5.4% 3.9%Difference of means resampling p-value 0.24 0.05 5.8E-4
For each CRE 20 RICs were generated by randomly choosing sites of the same length as the CRE, on the same chromosome and strand, and rejectingany that overlapped a known gene. Then 10 nearby control sites were generated for each CRE by adding positive and negative (i.e., 3� and 5�) offsetsof 50, 100, 150, 200, and 250 bp to the coordinates of each true CRE. Percentage identities for all CRE and control sites were computed relative toreference alignment, on both a per site and per base basis. Unaligned bases, mismatchs, and D. melanogaster insertions contributed zeros to % identityresults; D. pseudoobscura insertions were ignored. The distributions of % identity values were clearly not normal, thus we avoided using tests such asthe t-test that assume normality. We compared the per site and per base mean % identities of each group using a resampling test, in which the p-valueof the observed difference was estimated as the frequency (over a million trials) in which a value as large or larger than the observed CRE mean wasobserved in an equal-sized sample of control sites. Similarly, the p-value of the difference between the two control sets was estimated using arandomization test (over a million trials) in which the sets mixed and then repartitioned into corresponding mock control sets. We compared thedistributions using the Kolmogorov-Smirnov test, which measures the likelihood that samples came from the same continuous distribution.
Figure 7. Smoothed distributions of percent identity values for thethree groups of cis-regulatory element sequences, excluding sequenceswith no aligned bases. The KS test can be viewed as answering the ques-tion “are these curves different?” All three curves are significantly differ-ent (see Table 2). The true CREs show a distinctive peak in the 80%–90%identity range, presumably a consequence of stabilizing selection. Therise on the left is due to unaligned or mostly deleted sequences.
D. pseudoobscura genome
Genome Research 11www.genome.org

intact elements are capable of ectopic exchange. Molecular evo-lutionary studies of homologous breakpoint motifs will be nec-essary to test the element degradation hypothesis. The conclu-sion that the conserved sequence element causes paracentric in-versions should be tempered as other possible explanations forthe coincidence of the breakpoint repeat and inversion break-point may exist.
One can speculate about why breakpoint repeat elementsare found only in D. pseudoobscura. Perhaps a new repetitive DNAelement has been introduced in the obscura group lineage. Dro-sophila subobscura is a close relative of D. pseudoobscura, and fiveof the six chromosomal elements are segregating for paracentricinversions in European populations (Krimbas 1992). It will beinteresting to determine if the repeat motif is present at thebreakpoints of D. subobscura rearrangements.
The distribution of the breakpoint motif was not restrictedto the D. pseudoobscura chromosomes with the major rearrange-ment polymorphisms. The genome-wide distribution of this re-petitive element suggests that all chromosomes are capable ofrearrangements, but has no bearing on the fixation of such in-versions in the population. Rare inversions have been describedon the other chromosomal arms both within D. pseudoobscura(Dobzhansky 1944) and between D. pseudoobscura and D. persi-milis (Tan 1935).
Fixed inversion differences between the species may play asignificant role in the formation of new species because inver-sions prevent the spread of incompatibility genes between dif-ferent chromosomal backgrounds (Noor et al. 2001; Navarro andBarton 2003). By reducing rates of crossover, chromosomal in-versions act as a barrier to gene flow, allowing Dobzhansky-Muller incompatibility genes to be fixed in different gene ar-rangement backgrounds, greatly enhancing the possibility ofspeciation (Noor et al. 2001; Navarro and Barton 2003). InDrosophila, hybrid male sterility genes appear to be involved inthe process of speciation. In fact, we find that D. pseudoob-scura genes with testis expression show a significant decrease inidentity with their D. melanogaster orthologs. It will be interest-ing to determine if genes within inverted regions, and par-ticularly those with male-specific expression, are associatedwith the sterility of male hybrids of D. pseudoobscura and D. per-similis.
Conservation of known cis-regulatory regions
D. pseudoobscura was chosen as the second fly species to be se-quenced in part because it appeared to have the appropriate de-gree of sequence divergence from D. melanogaster to locate cis-regulatory sequences (Bergman et al. 2002). We were somewhatsurprised at the overall low level of conservation of known cis-regulatory regions. Bergman et al. (2002) used clusters of theseconserved noncoding sequences to identify enhancer sequencesin the apterous gene. However, when known regulatory regionsare examined, the conservation signal is not striking. Othershave come to a similar conclusion using different alignmentmethods (Emberly et al. 2003). Alignment of Caenorhabditis el-egans and Caenorhabditis briggsae has also suggested that manyconserved noncoding regions will not be due to cis-regulatorysequences, increasing the noise in the conservation signal ofthese elements (Stein et al. 2003). Alignments of additional spe-cies of intermediate divergence may improve the detection ofknown regulatory elements as in Kellis et al. (2003), assuming theelements are conserved.
The lack of a clear conservation of cis-regulatory sequencessuggests that simple models of sequence divergence in regulatoryregions may be naive. Ludwig et al. (1998) observed that the D.pseudoobscura eve stripe 2 enhancer was functional in D. melano-gaster despite significant differences between the regulatory pro-tein-binding sites. In contrast, chimeric eve stripe 2 promotershad improper expression patterns, suggesting that stabilizing se-lection was acting on the enhancer (Ludwig et al. 2000), where“…selection can maintain functional conservation of gene ex-pression for long periods of evolutionary time despite bindingsite turnover.” The D. pseudoobscura transcription factor proteinsare 17% diverged from their D. melanogaster orthologs (Supple-mental Fig. S5), different enough to allow variation of bindingspecificity. Evidence of cis-regulatory binding site conservation isencouraging; however, it is clear the D. pseudoobscura–D. melano-gaster sequence comparisons will not identify binding sites alone.Instead, approaches like phylogenetic shadowing (Boffelli et al.2003) that make use of a multiple alignment with species ofintermediate divergence show more promise, owing to the re-duced chance of binding site turnover between more recentlydiverged species. A recent paper (Berman et al. 2004) suggests theidentification of binding-site clusters to reduce false positiveswhen identifying regulatory regions.
Impact of the D. pseudoobscura sequenceon the D. melanogaster annotation
The sequence of D. pseudoobscura will have a substantial impacton gene predictions in other species, most notably D. melanogas-ter. This will include direct conservation evidence for the validityof current predictions, modification of predictions based on con-served sequences with hallmarks of open reading frames such asthird position variation, and support for ab initio predictions,which in previous annotation efforts were rejected as being toounreliable (Misra et al. 2002).
The first of these benefits from comparative analysis be-tween these two flies, is the additional supporting evidence forthe current D. melanogaster gene model set. FlyBase uses a simpleconfidence scoring system in which one point is given for a geneprediction being supported by at least one instance of each of thefollowing four sources of evidence: full-length cDNA sequence,EST sequence, similarities to known proteins, and ab initio pre-dictions. Thus, the most evidence-based gene models are as-
Figure 8. Mechanism for chromosomal inversion with a repeated se-quence motif. A hypothetical chromosome is shown with genes Athrough N and two repeated sequence motifs (open and black arrows) ina reverse orientation (top). Repeated motifs are shown pairing duringmeiosis with a recombination event occurring in the middle of the pairedmotifs (middle). Resolution of the recombination event between the re-peated sequence motifs leading to the inversion of the central gene re-gion (bottom).
Richards et al.
12 Genome Researchwww.genome.org
signed 4 points and the weakest accepted gene models have 1(typically an ab initio prediction) (Misra et al. 2002). Of the13,329 D. melanogaster Release_3.1 genes that were analyzedhere and that remain in FlyBase, 11,989 have a putative orthologin D. pseudoobscura (using a less stringent definition not requir-ing a gene model in D. pseudoobscura sequence). Table 3 describesthe distribution of these putative orthologs by confidence valuecategory. For the 1164 least supported gene models (confi-dence value of 1), 80.5% now have support based on orthology.For the confidence value 2 and 3 groups, the majority of genemodels lack full-length cDNA evidence, and hence the con-servations between the D. melanogaster and pseudoobscuragenes are likely to permit significant improvement in the de-tails of the gene models. Even for the most fully supported genemodels (confidence value of 4), the conservation betweenD. melanogaster and pseudoobscura is likely to aid in the identi-fication of the actual translation start and of alternative codingexons.
Finally, it should be noted that identification of putativeorthologs is 89.9% overall, and as expected goes up from 80.5%for the predictions with the least supporting evidence to 93.8%for those with the most. Hence, the majority of even D. melano-gaster ab initio predictions accepted as valid gene models by Fly-Base are likely to represent real expressed genes.
Methods
Strain selectionThe availability of an isogenic or highly inbred strain is a criticalfactor to simplify the whole genome shotgun assembly problem.As the required balancer chromosomes are not available inD. pseudoobscura to produce an isogenic strain, an inbred strainwas used. The sequenced strain was derived from a Mesa Verde,Colorado isolate collected in 1996 (W. Anderson, unpubl.). Apopulation cage was set up in 1997 from eight iso-female lines.After ∼50 generations, inbred lines were established using a singlevirgin male and female for each line. A single brother–sister in-breeding procedure was repeated for an additional 14 genera-tions, when a single line (MV-25) was selected on the basis of itsviability. Cytological examination of the larval polytene chro-mosomes confirmed both the identity of the species and that thestock was homozygous for the Arrowhead inversion on the thirdchromosome. To avoid contamination with DNA from gut con-tents, and possible issues of unequal representation of the ge-nome in larval polytene chromosomes, embryos were used forthe isolation of genomic DNA for sequencing library production.The sequencing strain is available from the Tucson DrosophilaSpecies Stock Center.
Library productionHigh-molecular-weight Genomic DNA was isolated from purifiedembryonic nuclei. pUC18 subclone libraries were constructed asdescribed previously (Andersson et al. 1996). A BAC library(CHORI-226) and fosmid library (CHORI-1226) were prepared byand are available from BACPAC resources (Oakland, CA; http://bacpac.chori.org/). These large insert libraries were constructedfrom the same inbred MV-25 strain that was used for the prepa-ration of the subclone libraries.
Sequencing and assemblyA total of 2.6 million high-quality sequence reads were producedfrom WGS sequencing libraries of ∼3 and 6 kb in pUC18 sub-clones, as well as additional reads from fosmids (40 kb) and BACs(130 kb) (Supplemental Table S1). DNA sequencing reactionswere performed using BigDye version 3.1 (Applied Biosystems),and analyzed on ABI 3700 sequencing machines. These readswere assembled using the Atlas suite of assembly tools (Havlak etal. 2004). The Atlas suite identifies relatively small groups ofreads that contain sequence overlap, assembles these groups in-dividually, and uses paired-end information to join the resultingcontigs into large scaffolds. All 2.6 million sequence reads werecompared to each other for overlap using Atlas-overlapper. Pu-tative overlaps were confirmed by banded dynamic program-ming alignment around the seed overlaps. Groups of sequencereads were then selected for local assembly by analysis of thesequence read overlaps using Atlas-binner, and individual assem-blies were performed on the BCM-HGSC computer cluster.Paired-end sequence information was used with the Atlas-scaffolder program to generate larger scaffolds. This approachgenerated scaffolds with an N50 of 0.995 Mb and contigs withinthose scaffolds with an N50 of 51 kb (Supplemental Table S2).The total length of the sequence contained in scaffolds of thismain assembly is ∼136 Mb. A complete description of the assem-bly process will be described elsewhere.
Certain sequence reads were resistant to assembly using thisapproach. Some lacked sufficient sequence overlap to be placedinto a contig. Other sequence reads overlapped too many othersequences, and were assembled in a high-stringency repeatassembly. “Reptigs” from this repeat assembly were integratedinto the main assembly on the basis of paired end sequence in-formation. All of the sequence data are available on the BCM-HGSC Web site (http://hgsc.bcm.tmc.edu/projects/drosophila/).The annotated whole genome project has also been depositedinto DDBJ/EMBL/GenBank under the project accessionAADE00000000. The version described in this paper is the firstversion, AADE01000000.
Polymorphic sequenceDespite multiple generations of inbreeding the strain of D. pseu-doobscura selected for sequencing still displayed a low level ofsequence polymorphism. Because DNA was isolated from mul-tiple D. pseudoobscura embryos, the assembly contained polymor-phic sequences that do not assemble because of the presence ofhigh-quality discrepancies including insertions and deletions.The sequence identity of these polymorphic regions ranges from92% to 98% in short regions preventing assembly. In all, 6.4 Mbof sequence overlapped but did not assemble because of the pres-ence of these discrepancies. It is possible to determine that aparticular region contains strain polymorphisms, as opposed torepetitive regions in the genome, by using measures of sequencecoverage and careful analysis of paired end sequence informa-tion. In cases in which similar sequences were identified in theassembly with high-quality discrepancies, further analysis sug-
Table 3. Number of D. melanogaster gene models havingD. pseudoobscura orthologs
Confidencevalue
D. melanogastergene models
D. melanogaster gene models withD. pseudoobscura orthologsa (%)
1 1194 962 (80.5)2 1961 1614 (82.3)3 2422 2137 (88.2)4 7752 7276 (93.8)Total 13,329 11,989 (89.9)
aUsing a relaxed definition of orthology, not requiring a D. pseudoobscuragene prediction.
D. pseudoobscura genome
Genome Research 13www.genome.org

gested that the cause was polymorphism within the strain. Thesesequence reads were removed from the assembly, so that a singleversion of the polymorphic sequence was retained in the assem-bly. The fewest possible reads were removed that allowed properassembly of the region, in order to keep the quality of the as-sembled sequence as high as possible. The sequence reads con-taining the putative polymorphisms are available from the BCM-HGSC Web site.
Anchoring sequence scaffolds to chromosomesThe lack of fine-resolution genetic maps, STS markers, and cyto-logically mapped sequences made the anchoring of draft se-quences to the cytogenetic map a significant challenge. The ge-nome of D. pseudoobscura is comprised of five chromosome arms(XL, XR, 2, 3, 4) and a dot chromosome (5). D. melanogaster hasthe same chromosome arm numerology although the arms areorganized differently into chromosomes, presumably reflectingan evolutionary process of Robertsonian fusions and fissions. Ithas been recognized that within the genus Drosophila, there is avery strong tendency for the genes to remain on a single chro-mosome arm, although the relative gene order on the arm can bequite different (Segarra et al. 1995; Ranz et al. 2001). Drosophilaevolutionary geneticists have thus identified six “Muller ele-ments,” designated A–F to describe the conserved euchromaticchromosome arms. The correspondence between D. pseudoob-scura, D. melanogaster, and Muller element nomenclature isshown in Supplemental Table S3. Thus, given that the D. mela-nogaster sequences are known, the identification of orthologousgenes can be used to assign large scaffolds to D. pseudoobscurachromosome arms via Muller element conservation. In the vastmajority of cases, this led to an unambiguous chromosome as-signment. Of 234 large scaffolds covering >90% of the sequence,four aligned to more than one chromosome. Further investiga-tion revealed erroneous joins between contigs based on paired-end reads assembling into repeat regions. In these four cases, thescaffolds were split at the gap erroneously joined by the paired-end reads. Since erroneous joins are more likely to occur betweenchromosome arms than within one (as any one arm is only ∼20%of the genome), we believe there are very few, if any, erroneouscontig joins in the final assembly.
Despite the Muller element conservation, the D. pseudoob-scura and D. melanogaster genomes differ by a succession of in-trachromosomal arm inversions, such that only small stretchesof synteny exist between the two species (see syntenic map).Therefore, chromosome arm assignment via Muller element con-servation does not inform order and orientation of genes withinarms. The order and orientation of the sequence scaffolds wereaided by additional BAC end sequencing. BAC libraries werescreened to identify new clones extending the ends of sequencescaffolds (in particular, probes were made at the ends of all scaf-folds >50 kb). Local synteny information from the comparisonwith D. melanogaster was used to extend scaffold groups if it wasconsistent with other information, such as single BAC end se-quence reads. This anchoring information was confirmed bycomparison to a recombination map produced from microsatel-lite markers in all scaffolds >100 kb. This anchoring procedureyielded 16 groups of ordered and oriented scaffolds (ultra-scaffolds), containing ∼90% of the D. pseudoobscura sequence andall scaffolds >100 kb. Chromosomes 2 and 3 are represented by asingle group of ordered and oriented scaffolds. The remainingthree chromosome arms have a small number of groups: XL, fourgroups; XR, five groups; and Chromosome 4, five groups. Al-though scaffolds can be identified as belonging to the dot Chro-mosome 5, there was not enough data to reliably order and orient
scaffolds on this chromosome. It is not surprising that less con-tiguity was obtained with XL and XR. Because embryos of bothsexes (XX female and XY male) were used for the DNA prepara-tion, the X portion of the WGS coverage is at 75% the coverageof the autosomes. The Y-chromosome sequence is the topic of aseparate paper (Carvalho and Clark 2004).
Sequence quality assessmentWe assessed the quality of the draft sequence at three levels ofdetail. At the finest level, the draft genome sequence was com-pared to 0.5 Mb of finished D. pseudoobscura sequences. Gap clo-sure confirmed that the order and orientation of all 19 contigs inthe finished part of this scaffold was correct, and estimates of gapsize in the draft sequence were within expectations based onvariation of subclone insert size. The only discrepancies observedin the alignment of the draft and finished sequences were at thesingle base level: a total of 13 mismatches were observed, an errorrate of 0.26 � 10�4 per base. Thus the overall quality within thecontigs of the draft sequence is comparable to that required forthe finished human genome sequence (Felsenfeld et al. 1999).
To validate the assembly at the contig level, ten fosmids(GenBank accessions AC134177, AC131961, AC131959,AC131960, AC134174, AC132213, AC134175, AC132164,AC132165, AC132166) from a different D. pseudoobscura strain(Tucson Drosophila Species stock center strain 14011-0121.4, col-lected from Death Valley, CA; note that the assembly only con-tains Fosmid and BAC end sequences from libraries made fromthe same DNA as the plasmid libraries) were sequenced to thehigh-quality finished grade. Misassemblies at the contig level areobservable when a portion of the contig aligns to the finishedsequence, but the remaining contig sequence does not. Of 17contigs aligned to the finished fosmids, no such cases were ob-served. In all cases, the order and orientation of the contigs wereconfirmed by comparison to the finished sequence. The align-ment revealed 15 minor discrepancies between the assembly andthe finished fosmid sequences, all of which were small insertion/deletions between 30 and 300 bp in length. These differences arelikely due to sequence polymorphisms between the sequencedstrain and the Death Valley strain from which the fosmid librarywas derived.
Genome alignmentWe produced several alignments of D. pseudoobscura and D. me-lanogaster genomic sequences with BLASTZ (Schwartz et al. 2003),PARAGON (O. Couronne, unpubl.), and the local/global tech-nique of the Berkeley Genome Pipeline (Couronne et al. 2003)with both AVID (Bray et al. 2003) and LAGAN (Brudno et al.2003) global alignment programs. The AVID and LAGAN align-ments are viewable via the VISTA Genome Browser at http://pipeline.lbl.gov/pseudo/. All these programs provide reasonablealignments of the two genomes. A higher-accuracy alignmentwas constructed based on the high-quality manually curatedgene ortholog list. In theory, the high-quality alignments gener-ated in the ortholog regions would provide anchor points for thegenome alignment, and in the case of specific genes, we could bemore certain that the orthologous sequences were being aligned.Two approaches to incorporating the curated ortholog data intothe BLASTZ alignment were taken. The first was a filteringmethod: in cases in which conflicting high-scoring pairs (HSPs)overlapped a gene with a known ortholog, HSPs not in agree-ment with the known orthologous sequence were filtered out.The second was an “align and extend” method in which BLASTZalignments were generated first around the known orthologoussequences and then extended as far as possible. The filtered
Richards et al.
14 Genome Researchwww.genome.org

BLASTZ alignment was the one used for the remainder of theanalyses and is available at http://www.hgsc.bcm.tmc.edu/projects/drosophila/.
Gene predictionIn D. melanogaster, the majority of gene predictions are based oneither full-length cDNA sequences or expressed sequence tag(EST) sequences (Misra et al. 2002) creating accurate gene models.Such a comprehensive biological data set is not available forD. pseudoobscura, thus a gene prediction method was designed totake advantage of the D. melanogaster annotations. Three geneprediction algorithms were used, GENSCAN (Burge and Karlin1997), TWINSCAN (Korf et al. 2001), and GeneWise (Birney andDurbin 2000). These three were chosen because of their differingreliance on comparative sequence data. GENSCAN requires noinput other than genomic sequence. TWINSCAN is based onGENSCAN, but makes use of a BLASTN comparison of the targetsequence to a related sequence (in this case, D. melanogaster) toimprove accuracy. GeneWise uses protein sequences fromD. melanogaster as one of its inputs. A total of 48,000 gene pre-dictions were produced by these three programs. The best pre-dictions in this overlapping set were identified on the basis ofsimilarity to D. melanogaster expressed sequence-based gene mod-els—a similar process has been used for C. briggsae (Stein et al.2003). Comparison of these gene predictions with D. melanogas-ter protein sequences was accomplished with the reciprocal use ofBLASTP. D. pseudoobscura gene models with no similarity to anyD. melanogaster protein sequence were removed. This reduced thenumber of independent gene predictions to 10,987. This set ofgene predictions was further filtered for orthologous gene pairsusing our synteny map to a total of 10,516 gene predictions.These 10,516 gene predictions were further screened for goodgene models to annotate the D. pseudoobscura genome.
Identification of the Standard to Arrowhead breakpointGenomic DNA was prepared from D. pseudoobscura strains thatwere isochromosomal either for Arrowhead or Standard gene ar-rangements (Schaeffer et al. 2003). Four oligonucleotide primerswere designed to amplify sequences that straddle the inversionbreakpoints of the event that converted the Standard arrange-ment into the Arrowhead arrangement, a (5�-TCCTTGGAGCTGGTCTCGGA-3�), b (5�-CCAGAGGTAGTCGCAGTATG-3�), c (5�-TGGTGCGCTGCTGGTAGACA-3�), and d (5�-GCTGTGTCCTCGTTGTAGTC-3�). The following PCR conditions were used to amplifythe proximal and distal breakpoints in the ancestral (Standard)and derived (Arrowhead) gene arrangements: 5.0 min at 94°C for1 cycle; denature for 1.0 min at 94°C, anneal for 1.0 min at 65°C,extension for 2.0 min at 72°C for 30 cycles. The sequences of theproximal and distal Arrowhead breakpoints have been depositedin GenBank (accession nos. AY693425 and AY693426).
The proximal and distal breakpoints were compared usingdot-plots and local alignment algorithms within the MEGALIGNprogram in the LASERGENE suite of DNA analysis software(DNAStar). In addition, BLAST analysis of the proximal and distalbreakpoints was used to find regions that matched interspecificbreakpoints in the genome.
Breakpoint sequence analysisThe conserved linkage groups and the breaks between groupswere inferred from the orthologous gene calls between the twospecies in our synteny map. The junctions between homologousconserved linkage groups were assumed to be rearrangementbreakpoints. The D. pseudoobscura breakpoints are inferred basedon the ordered D. pseudoobscura sequence compared to the rear-
ranged D. melanogaster sequence and the D. melanogaster break-points are inferred by the inverse process. The conserved linkageblocks within the scaffolds of each Muller element were num-bered sequentially as a method of bookkeeping. Breakpoint se-quences were extracted from scaffold sequences by taking thenucleotides defined by the end of one conserved linkage blockand the beginning of the adjacent conserved linkage block. Thebreakpoint sequences were each labeled BP plus the left- andrightmost conserved linkage group numbers and the appropriateMuller element (Supplemental Table S9). For instance,BP_167_168_C is the breakpoint sequence at the boundary ofconserved linkage groups 167 and 168 on Muller element C. Thecoordinates of all inferred interspecific breakpoints are shown inSupplemental Table S9. BLASTN (Altschul et al. 1990) was used totest each conserved linkage breakpoint for similarity to otherbreakpoint regions on the same chromosomal element. An E-value of 1 � 10�5 was used as the cutoff for the BLAST searchesbecause the expected probability of a match given the size of thebreakpoint database is <0.05. The breakpoint match distributionwas determined by estimating the fraction of breakpoint se-quences that each breakpoint matched on the chromosome. Thenumber of interbreakpoint matches for an interspecific break-point are presented in Supplemental Table S5, and the distribu-tion of interbreakpoint match fraction is shown in SupplementalFigure S8.
The discovery of a conserved repetitive element amongbreakpoints leads us to ask what the distribution of this sequencewas in the genome. Sequences on each chromosomal elementwere partitioned into one of three categories, breakpoints, codingsequences, and noncoding/nonbreakpoint sequences. GeneWise(Birney and Durbin 2000) predictions (see below) of coding se-quence locations in D. pseudoobscura were used to define a nonre-dundant set of coding regions for each chromosomal element. Incases in which two transcripts of the same gene or different genesoverlapped, the intersection of the two transcripts was used todefine a single coding segment of DNA. The noncoding/non-breakpoint database was defined as all of the remaining se-quences not found in either coding or breakpoint sequences. Thefrequency of conserved breakpoint motifs present in the threeclasses of sequence were determined with a BLASTN search of thethree concatenated sequence databases using an E-value of1 � 10�5. Seven conserved linkage breakpoints (BP_007_008_A,BP_081_082_B, BP_202_203_C, BP_104_105_D, BP_201_202_E,proximal and distal Arrowhead inversion breakpoints) were eachused as query sequences for the BLASTN search for all chromo-somal arms to detect the conserved motif in coding, noncoding,and breakpoint sequences. Multiple query sequences were usedto survey the genome for the conserved breakpoint motif becausethe breakpoint sequence motifs are heterogeneous among break-points. We chose the breakpoint sequence from each of the fivemajor chromosomal arms that had the maximum number ofinterbreakpoint matches as well as the proximal and distal Ar-rowhead inversion breakpoints. �2 tests of homogeneity wereused to determine if the distribution of the breakpoint motif wassimilar in the different classes of sequences. Supplemental TableS9 also indicates the presence and absence of the breakpointmotif sequence in each interspecific breakpoint.
Phylogenetic analysis of conserved sequence motifsWe wanted to determine the phylogenetic relationships amongthe breakpoint motifs to determine if copies from the same chro-mosome or local region were monophyletic. The breakpoint mo-tifs are similar in sequence, but the different copies in the ge-nome vary in length. We wanted to maximize the number of
D. pseudoobscura genome
Genome Research 15www.genome.org

motifs and the number of base pairs in the phylogenetic analysis.Increasing the number of copies led to a reduction in the numberof alignment bases, while increasing the number of aligned basesreduced the sample size. We chose to use a 443-bp motif se-quence because this size provided an adequate sample of motifsequences from the major chromosomes, maximized the numberof aligned bases, and tended to include adjacent copies of repeat1 (128 bp) and repeat 2 (315 bp). A phylogenetic analysis wasused to infer the relationships among the elements found indifferent categories of sequences and among different Muller el-ements. A total of 91 motifs that varied in length from 296 to 446bp were aligned with CLUSTALX (Higgins et al. 1992), where 22,3, and 66 sequences were found in breakpoints, coding regions,and noncoding regions, respectively. The 91 sequences sharedthe same 5�-end, but differed in their 3�-ends. The Kimura 2 pa-rameter model was used to estimate the pairwise distancesamong breakpoint motifs because there is a slight bias in favor oftransversions versus transitions. Deletions were excluded forpairwise estimates of distances. Phylogenetic trees of the break-point motifs were inferred with the neighbor-joining and maxi-mum parsimony algorithms (Saitou and Nei 1987) as imple-mented in the Molecular Evolutionary Genetic Analysis package(Kumar et al. 2001).
Inference of positive selection from radical versus conservativeamino acid substitutionsEach amino acid substitution was identified as being either aradical or a conservative change based on charge or on polarity,as defined by Zhang (2000). We tested for an excess of radicalversus conservative substitutions using a likelihood model. Acontinuous time Markov chain was defined on the state space ofall 20 amino acids and with transition rates derived from acodon-based model taking into account the observed codon fre-quencies and a transition/transversion bias as in Yang et al.(1998). Letting uij be the transition rate from amino acid i toamino acid j in the Yang et al. (1998) model, we defined thetransition rates as
qij = ��ij if i → j conservative�ij� if i → j radical
The parameter � then measures the relative increase or decreasein the rate of evolution of radical amino acid substitutions com-pared to conservative amino acid substitutions. The maximumlikelihood value assuming H0: � = 1, was compared to the maxi-mum likelihood value assuming � ∈ [1, �). A p-value (p) calcu-lated assuming two times the log likelihood ratio was distributedas a mixture between a �1
2-distribution and a point mass at zero.Because the likelihood surface in a general model in which� ∈ [0, �) always had a single mode, maximum likelihood esti-mates of �̂ < 1 in this model imply that p = 1.
Acknowledgments
We thank Hugh Robertson for incisive comments and discus-sions. The sequencing of D. pseudoobscura was supported by NIHgrant 1U01 HG02570 to R.G. Members of FlyBase were supportedby Grant Numbers 5 P41 HG00739 and 5 R37 GM28669 from theNational Institutes of Health (PHS). M.F.vB. was supported bygrant BMI-050.50.201 from the Netherlands Organization for Sci-entific Research (NWO). H.J.B. was partly supported by NIH grantLM007276. A.G.C. was supported by NIH grants AI-45402 andGM-64590. K.T. was supported by an Alfred P. Sloan fellowshipin Computational Biology. Finally, we thank the Center for Ge-nomic Research at Harvard University for the use of computing
resources, and Pieter J. de Jong and Kazutoyo Osoegawa of BAC-PAC at the Children’s Hospital Oakland Research Institute for theconstruction of BAC and Fosmid libraries.
References
Altschul, S.F., Gish, W., Miller, W., Myers, E.W., and Lipman, D.J. 1990.Basic local alignment search tool. J. Mol. Biol. 215: 403–410.
Andersson, B., Wentland, M.A., Ricafrente, J.Y., Liu, W., and Gibbs, R.A.1996. A “double adaptor” method for improved shotgun libraryconstruction. Anal. Biochem. 236: 107–113.
Beckenbach, A.T., Wei, Y.W., and Liu, H. 1993. Relationships in theDrosophila obscura species group, inferred from mitochondrialcytochrome oxidase II sequences. Mol. Biol. Evol. 10: 619–634.
Bergman, C.M., Pfeiffer, B.D., Rincon-Limas, D.E., Hoskins, R.A., Gnirke,A., Mungall, C.J., Wang, A.M., Kronmiller, B., Pacleb, J.M., Park, S.,et al. 2002. Assessing the impact of comparative genomic sequencedata on the functional annotation of the Drosophila genome. GenomeBiol. 3: RESEARCH0086.
Berman, B.P., Pfeiffer, B.D., Laverty, T.R., Salzberg, S.L., Rubin, G.M.,Eisen, M.B., and Celniker, S.E. 2004. Computational identification ofdevelopmental enhancers: Conservation and function oftranscription factor binding-site clusters in Drosophila melanogasterand Drosophila pseudoobscura. Genome Biol. 5: R61.
Betran, E., Thornton, K., and Long, M. 2002. Retroposed new genes outof the X in Drosophila. Genome Res. 12: 1854–1859.
Birney, E. and Durbin, R. 2000. Using GeneWise in the Drosophilaannotation experiment. Genome Res. 10: 547–548.
Blackman, R.K., Grimaila, R., Koehler, M.M., and Gelbart, W.M. 1987.Mobilization of hobo elements residing within the decapentaplegicgene complex: Suggestion of a new hybrid dysgenesis system inDrosophila melanogaster. Cell 49: 497–505.
Boffelli, D., McAuliffe, J., Ovcharenko, D., Lewis, K.D., Ovcharenko, I.,Pachter, L., and Rubin, E.M. 2003. Phylogenetic shadowing ofprimate sequences to find functional regions of the human genome.Science 299: 1391–1394.
Bray, N., Dubchak, I., and Pachter, L. 2003. AVID: A global alignmentprogram. Genome Res. 13: 97–102.
Brudno, M., Do, C.B., Cooper, G.M., Kim, M.F., Davydov, E., Green,E.D., Sidow, A., and Batzoglou, S. 2003. LAGAN and Multi-LAGAN:Efficient tools for large-scale multiple alignment of genomic DNA.Genome Res. 13: 721–731.
Burge, C. and Karlin, S. 1997. Prediction of complete gene structures inhuman genomic DNA. J. Mol. Biol. 268: 78–94.
Caceres, M., Ranz, J.M., Barbadilla, A., Long, M., and Ruiz, A. 1999.Generation of a widespread Drosophila inversion by a transposableelement. Science 285: 415–418.
Carvalho, A.B. and Clark, A.G. 2004. The Y chromosome of D.pseudoobscura is not homologous to the ancestral Drosophila Y.Science (in press).
Casals, F., Caceres, M., and Ruiz, A. 2003. The foldback-like transposonGalileo is involved in the generation of two different naturalchromosomal inversions of Drosophila buzzatii. Mol. Biol. Evol.20: 674–685.
Celniker, S.E., Wheeler, D.A., Kronmiller, B., Carlson, J.W., Halpern, A.,Patel, S., Adams, M., Champe, M., Dugan, S.P., Frise, E., et al. 2002.Finishing a whole-genome shotgun: Release 3 of the Drosophilamelanogaster euchromatic genome sequence. Genome Biol.3: RESEARCH0079.
Charlesworth, B. and Charlesworth, D. 1973. Selection of new inversionin multi-locus genetic systems. Genet. Res. 21: 167–183.
Charlesworth, B., Lapid, A., and Canada, D. 1992. The distribution oftransposable elements within and between chromosomes in apopulation of Drosophila melanogaster. II. Inferences on the nature ofselection against elements. Genet. Res. 60: 115–130.
Cirera, S., Martin-Campos, J.M., Segarra, C., and Aguade, M. 1995.Molecular characterization of the breakpoints of an inversion fixedbetween Drosophila melanogaster and D. subobscura. Genetics139: 321–326.
Collins, M. and Rubin, G.M. 1984. Structure of chromosomalrearrangements induced by the FB transposable element inDrosophila. Nature 308: 323–327.
Couronne, O., Poliakov, A., Bray, N., Ishkhanov, T., Ryaboy, D., Rubin,E., Pachter, L., and Dubchak, I. 2003. Strategies and tools forwhole-genome alignments. Genome Res. 13: 73–80.
Dagan, T., Talmor, Y., and Graur, D. 2002. Ratios of radical toconservative amino acid replacement are affected by mutational andcompositional factors and may not be indicative of positiveDarwinian selection. Mol. Biol. Evol. 19: 1022–1025.
Richards et al.
16 Genome Researchwww.genome.org
Dobzhansky, T. 1944. Chromosomal races in Drosophila pseudoobscuraand Drosophila persimilis. In Carnegie Institution of WashingtonPublication 554, pp. 47–144. Washington, DC.
———. 1948a. Genetics of natural populations XVI, altitudanal andseasonal changes in certain populations of Drosophila pseudoobscuraand Drosophila persimilis. Genetics 33: 158.
———. 1948b. Genetics of natural populations. XVIII. Experiments onchromosomes of Drosophila pseudoobscura from different geographicregions. Genetics 33: 588–602.
———. 1949. Observations and experiments on natural selection inDrosophila. In Proc. Int. Congress. Genet., pp. 210–224.
Dobzhansky, T. and Epling, C. 1944. Contributions to the genetics,taxonomy and ecology of Drosophila pseudoobscura and its relatives.In Carnegie Institution of Washington Publication 554, pp. 1–46.Washington, DC.
Emberly, E.G., Rajewsky, N., and Siggia, E.D. 2003. Conservation ofregulatory elements between two species of Drosophila. BMCBioinformatics 4: 57.
Engels, W.R. and Preston, C.R. 1984. Formation of chromosomerearrangements by P factors in Drosophila. Genetics 107: 657–678.
Evgen’ev, M.B., Zelentsova, H., Poluectova, H., Lyozin, G.T.,Veleikodvorskaja, V., Pyatkov, K.I., Zhivotovsky, L.A., and Kidwell,M.G. 2000. Mobile elements and chromosomal evolution in thevirilis group of Drosophila. Proc. Natl. Acad. Sci. 97: 11337–11342.
Ewing, B. and Green, P. 1998. Base-calling of automated sequencertraces using phred. II. Error probabilities. Genome Res. 8: 186–194.
Ewing, B., Hillier, L., Wendl, M.C., and Green, P. 1998. Base-calling ofautomated sequencer traces using phred. I. Accuracy assessment.Genome Res. 8: 175–185.
Felsenfeld, A., Peterson, J., Schloss, J., and Guyer, M. 1999. Assessing thequality of the DNA sequence from the Human Genome Project.Genome Res. 9: 1–4.
Ghedin, E., Bringaud, F., Peterson, J., Myler, P., Berriman, M., Ivens, A.,Andersson, B., Bontempi, E., Eisen, J., Angiuoli, S., et al. 2004. Genesynteny and evolution of genome architecture in trypanosomatids.Mol. Biochem. Parasitol. 134: 183–191.
Grad, Y.H., Roth, F.P., Halfon, M.S., and Church, G.M. 2004. Predictionof similarly-acting cis-regulatory modules by subsequence profilingand comparative genomics in D. melanogaster and D. pseudoobscura.Bioinformatics May 14 [Epub ahead of print].
Havlak, P., Chen, R., Durbin, K.J., Egan, A., Ren, Y., Song, X.Z.,Weinstock, G.M., and Gibbs, R.A. 2004. The Atlas genome assemblysystem. Genome Res. 14: 721–732.
Higgins, D.G., Bleasby, A.J., and Fuchs, R. 1992. CLUSTAL V: Improvedsoftware for multiple sequence alignment. Comput. Appl. Biosci.8: 189–191.
Kellis, M., Patterson, N., Endrizzi, M., Birren, B., and Lander, E.S. 2003.Sequencing and comparison of yeast species to identify genes andregulatory elements. Nature 423: 241–254.
Korf, I., Flicek, P., Duan, D., and Brent, M.R. 2001. Integrating genomichomology into gene structure prediction. Bioinformatics 17 Suppl1: S140–S148.
Krimbas, C.B. 1992. In Drosophila inversion polymorphism (eds. C.B.Krimbas and J.R. Powell), pp. 127–220. CRC Press, Boca Raton, FL.
Kumar, S., Tamura, K., Jakobsen, I.B., and Nei, M. 2001. MEGA2:Molecular evolutionary genetics analysis software. Bioinformatics17: 1244–1245.
Ladeveze, V., Aulard, S., Chaminade, N., Periquet, G., and Lemeunier, F.1998. Hobo transposons causing chromosomal breakpoints. Proc. RSoc. Lond. B Biol. Sci. 265: 1157–1159.
Lemeunier, F. and Ashburner, M.A. 1976. Relationships within themelanogaster species subgroup of the genus Drosophila (Sophophora).II. Phylogenetic relationships between six species based uponpolytene chromosome banding sequences. Proc. R Soc. Lond. B Biol.Sci. 193: 275–294.
Lemeunier, F. and Aulard, S. 1992. Inversion polymorphism inDrosophila melanogaster. In Drosophila inversion polymorphism (eds.C.B. Krimbas and J.R. Powell), pp. 339–405. CRC Press, Boca Raton,FL.
Lercher, M.J., Blumenthal, T., and Hurst, L.D. 2003. Coexpression ofneighboring genes in Caenorhabditis elegans is mostly due to operonsand duplicate genes. Genome Res. 13: 238–243.
Lim, J.K. 1988. Intrachromosomal rearrangements mediated by hobotransposons in Drosophila melanogaster. Proc. Natl. Acad. Sci.85: 9153–9157.
Ludwig, M.Z., Patel, N.H., and Kreitman, M. 1998. Functional analysisof eve stripe 2 enhancer evolution in Drosophila: Rules governingconservation and change. Development 125: 949–958.
Ludwig, M.Z., Bergman, C., Patel, N.H., and Kreitman, M. 2000.Evidence for stabilizing selection in a eukaryotic enhancer element.Nature 403: 564–567.
Lyttle, T.W. and Haymer, D.S. 1992. The role of the transposableelement hobo in the origin of endemic inversions in wildpopulations of Drosophila melanogaster. Genetica 86: 113–126.
Mathiopoulos, K.D., della Torre, A., Santolamazza, F., Predazzi, V.,Petrarca, V., and Coluzzi, M. 1999. Are chromosomal inversionsinduced by transposable elements? A paradigm from the malariamosquito Anopheles gambiae. Parassitologia 41: 119–123.
Misra, S., Crosby, M.A., Mungall, C.J., Matthews, B.B., Campbell, K.S.,Hradecky, P., Huang, Y., Kaminker, J.S., Millburn, G.H., Prochnik,S.E., et al. 2002. Annotation of the Drosophila melanogastereuchromatic genome: A systematic review. Genome Biol.3: RESEARCH0083.
Muller, H.J. 1940. In The new systematics (ed. J. Huxley), pp. 185–268.Clarendon Press, Oxford, UK.
Nadeau, J.H. and Taylor, B.A. 1984. Lengths of chromosomal segmentsconserved since divergence of man and mouse. Proc. Natl. Acad. Sci.81: 814–818.
Navarro, A. and Barton, N.H. 2003. Accumulating postzygotic isolationgenes in parapatry: A new twist on chromosomal speciation. Evol.Int. J. Org. Evol. 57: 447–459.
Nekrutenko, A., Makova, K.D., and Li, W.H. 2002. The KA/KS ratio testfor assessing the protein-coding potential of genomic regions: Anempirical and simulation study. Genome Res. 12: 198–202.
Noor, M.A., Grams, K.L., Bertucci, L.A., and Reiland, J. 2001.Chromosomal inversions and the reproductive isolation of species.Proc. Natl. Acad. Sci. 98: 12084–12088.
Novitski, E. 1946. Chromosomal variation in Drosophila athabasca.Genetics 31: 508–524.
Ohno, S. 1973. Ancient linkage groups and frozen accidents. Nature244: 259–262.
Otto, S.P. and Barton, N.H. 2001. Selection for recombination in smallpopulations. Evol. Int. J. Org. Evol. 55: 1921–1931.
Painter, T.S. 1934. A new method for the study of chromosomalaberrations and the plotting of chromosomal maps in Drosophilamelanogaster. Genetics 19: 175–188.
Petrov, D.A. and Hartl, D.L. 1998. High rate of DNA loss in theDrosophila melanogaster and Drosophila virilis species groups. Mol.Biol. Evol. 15: 293–302.
Petrov, D.A., Lozovskaya, E.R., and Hartl, D.L. 1996. High intrinsic rateof DNA loss in Drosophila. Nature 384: 346–349.
Pevzner, P. and Tesler, G. 2003. Human and mouse genomic sequencesreveal extensive breakpoint reuse in mammalian evolution. Proc.Natl. Acad. Sci. 100: 7672–7677.
Potter, S.S. 1982. DNA sequence analysis of a Drosophila foldbacktransposable element rearrangement. Mol. Gen. Genet. 188: 107–110.
Ranz, J.M., Segarra, C., and Ruiz, A. 1997. Chromosomal homology andmolecular organization of Muller’s elements D and E in theDrosophila repleta species group. Genetics 145: 281–295.
Ranz, J.M., Casals, F., and Ruiz, A. 2001. How malleable is theeukaryotic genome? Extreme rate of chromosomal rearrangement inthe genus Drosophila. Genome Res. 11: 230–239.
Rice, W.R. 1989. Analyzing tables of statistical tests. Evolution43: 223–225.
Roy, P.J., Stuart, J.M., Lund, J., and Kim, S.K. 2002. Chromosomalclustering of muscle-expressed genes in Caenorhabditis elegans. Nature418: 975–979.
Russo, C.A., Takezaki, N., and Nei, M. 1995. Molecular phylogeny anddivergence times of drosophilid species. Mol. Biol. Evol. 12: 391–404.
Saitou, N. and Nei, M. 1987. The neighbor-joining method: A newmethod for reconstructing phylogenetic trees. Mol. Biol. Evol.4: 406–425.
Schaeffer, S.W., Goetting-Minesky, M.P., Kovacevic, M., Peoples, J.R.,Graybill, J.L., Miller, J.M., Kim, K., Nelson, J.G., and Anderson,W.W. 2003. Evolutionary genomics of inversions in Drosophilapseudoobscura: Evidence for epistasis. Proc. Natl. Acad. Sci.100: 8319–8324.
Schwartz, S., Kent, W.J., Smit, A., Zhang, Z., Baertsch, R., Hardison, R.C.,Haussler, D., and Miller, W. 2003. Human–mouse alignments withBLASTZ. Genome Res. 13: 103–107.
Segarra, C., Lozovskaya, E.R., Ribo, G., Aguade, M., and Hartl, D.L. 1995.P1 clones from Drosophila melanogaster as markers to study thechromosomal evolution of Muller’s A element in two species of theobscura group of Drosophila. Chromosoma 104: 129–136.
Sheen, F., Lim, J.K., and Simmons, M.J. 1993. Genetic instability inDrosophila melanogaster mediated by hobo transposable elements.Genetics 133: 315–334.
Smith, N.G. 2003. Are radical and conservative substitution rates usefulstatistics in molecular evolution? J. Mol. Evol. 57: 467–478.
Sokal, R.R. and Rohlf, F.J. 1981. Biometry. W.H. Freeman, New York.Spellman, P.T. and Rubin, G.M. 2002. Evidence for large domains of
similarly expressed genes in the Drosophila genome. J. Biol. 1: 5.
D. pseudoobscura genome
Genome Research 17www.genome.org

Sperlich, D. and Pfriem, P. 1986. Chromosomal polymorphism innatural and experimental populations. In The genetics and biology ofDrosophila (eds. M. Ashburner et al.), pp. 257–309. Academic Press,New York.
Stein, L.D., Bao, Z., Blasiar, D., Blumenthal, T., Brent, M.R., Chen, N.,Chinwalla, A., Clarke, L., Clee, C., Coghlan, A., et al. 2003. Thegenome sequence of Caenorhabditis briggsae: A platform forcomparative genomics. PLoS Biol. 1: E45.
Sturtevant, A.H. and Beadle, G.W. 1936. The relations of inversions inthe X chromosome of Drosophila melanogaster to crossing over anddisjunction. Genetics 21: 544–604.
Sturtevant, A.H. and Dobzhansky, T. 1936. Inversions in the thirdchromosome of wild race of Drosophila pseudoobscura, and their usein the study of the history of the species. Proc. Natl. Acad. Sci.22: 448.
Sturtevant, A.H. and Novitski, E. 1941. The homologies of thechromosome elements in the genus Drosophila. Genetics 26: 517–541.
Sturtevant, A.H. and Tan, C.C. 1937. The comparative genetics ofDrosophila pseudoobscura and D. melanogaster. J. Genet. 34: 415–432.
Sun, F.L., Cuaycong, M.H., Craig, C.A., Wallrath, L.L., Locke, J., andElgin, S.C. 2000. The fourth chromosome of Drosophila melanogaster:Interspersed euchromatic and heterochromatic domains. Proc. Natl.Acad. Sci. 97: 5340–5345.
Swanson, C.P., Merz, T., and Young, W.J. 1981. Cytogenetics: Thechromosome in division, inheritance and evolution. Prentice-Hall, UpperSaddle River, NJ.
Tamura, K., Subramanian, S., and Kumar, S. 2003. Temporal patterns offruit fly (Drosophila) evolution revealed by mutation clocks. Mol.Biol. Evol. 21: 36–44.
Tan, C.C. 1935. Salivary gland chromosomes in the two races ofDrosophila pseudoobscura. Genetics 20: 392–402.
Wesley, C.S. and Eanes, W.F. 1994. Isolation and analysis of thebreakpoint sequences of chromosome inversion In(3L)Payne in
Drosophila melanogaster. Proc. Natl. Acad. Sci. 91: 3132–3136.Wilder, J. and Hollocher, H. 2001. Mobile elements and the genesis of
microsatellites in Dipterans. Mol. Biol. Evol. 18: 384–392.Wright, S. and Dobzhansky, T. 1946. Genetics of natural populations.
XII. Experimental reproduction of some of the changes caused bynatural selection in certain populations of Drosophila pseudoobscura.Genetics 31: 125–156.
Wu, C.-I. and Beckenbach, A.T. 1983. Evidence for extensive geneticdifferentiation between the sex ratio and the standard arrangementof Drosophila pseudoobscura and D. persimilis and identification ofhybrid sterility factors. Genetics 105: 71–86.
Yang, Z., Nielsen, R., and Hasegawa, M. 1998. Models of amino acidsubstitution and applications to mitochondrial protein evolution.Mol. Biol. Evol. 15: 1600–1611.
Zdobnov, E.M., von Mering, C., Letunic, I., Torrents, D., Suyama, M.,Copley, R.R., Christophides, G.K., Thomasova, D., Holt, R.A.,Subramanian, G.M., et al. 2002. Comparative genome and proteomeanalysis of Anopheles gambiae and Drosophila melanogaster. Science298: 149–159.
Zhang, J. 2000. Rates of conservative and radical nonsynonymousnucleotide substitutions in mammalian nuclear genes. J. Mol. Evol.50: 56–68.
Web site references
http://bacpac.chori.org/; BACPAC resources.http://hgsc.bcm.tmc.edu/projects/drosophila/; BCM-HGSC.http://pipeline.lbl.gov/pseudo/; VISTA Genome Browser.
Received July 27, 2004; accepted in revised form October 14, 2004.
Richards et al.
18 Genome Researchwww.genome.org