Social intelligence in the normal and autistic brain: an fMRI study

Submitted 15 October 2013Accepted 15 January 2014Published 25 February 2014
Corresponding authorMichael J. Hautus,[email protected]
Academic editorDon Rojas
Additional Information andDeclarations can be found onpage 12
DOI 10.7717/peerj.261
Copyright2014 Lodhia et al.
Distributed underCreative Commons CC-BY 4.0
OPEN ACCESS
Reduced object related negativityresponse indicates impaired auditoryscene analysis in adults with autisticspectrum disorderVeema Lodhia1, Jon Brock2,3, Blake W. Johnson2,3 and Michael J. Hautus1
1 Research Centre for Cognitive Neuroscience, School of Psychology, The University of Auckland,New Zealand
2 ARC Centre of Excellence in Cognition and its Disorders, Australia3 Department of Cognitive Science, Macquarie University, Sydney, Australia
ABSTRACTAuditory Scene Analysis provides a useful framework for understanding atypicalauditory perception in autism. Specifically, a failure to segregate the incoming acous-tic energy into distinct auditory objects might explain the aversive reaction autisticindividuals have to certain auditory stimuli or environments. Previous researchwith non-autistic participants has demonstrated the presence of an Object RelatedNegativity (ORN) in the auditory event related potential that indexes pre-attentiveprocesses associated with auditory scene analysis. Also evident is a later P400 compo-nent that is attention dependent and thought to be related to decision-making aboutauditory objects. We sought to determine whether there are differences betweenindividuals with and without autism in the levels of processing indexed by these com-ponents. Electroencephalography (EEG) was used to measure brain responses from agroup of 16 autistic adults, and 16 age- and verbal-IQ-matched typically-developingadults. Auditory responses were elicited using lateralized dichotic pitch stimuli inwhich inter-aural timing differences create the illusory perception of a pitch thatis spatially separated from a carrier noise stimulus. As in previous studies, controlparticipants produced an ORN in response to the pitch stimuli. However, thiscomponent was significantly reduced in the participants with autism. In contrast,processing differences were not observed between the groups at the attention-dependent level (P400). These findings suggest that autistic individuals have diffi-culty segregating auditory stimuli into distinct auditory objects, and that this diffi-culty arises at an early pre-attentive level of processing.
Subjects Neuroscience, Cognitive Disorders, Psychiatry and PsychologyKeywords Autism, Auditory scene analysis, Object related negativity, Event related potential,Binaural processing, Electroencephalography, ORN, P400, Dichotic pitch
INTRODUCTIONAutism is a developmental disorder that is defined and diagnosed in terms of impairments
in social interaction and communication co-occurring with restricted behaviours and
interests (American Psychiatric Association, 1994; American Psychiatric Association, 2013).
How to cite this article Lodhia et al. (2014), Reduced object related negativity response indicates impaired auditory scene analysis inadults with autistic spectrum disorder. PeerJ 2:e261; DOI 10.7717/peerj.261

In addition to these core diagnostic ‘symptoms’, many individuals with autism also experi-
ence hyper- or hypo-sensitivities in visual, auditory, and tactile domains (Talay-Ongan
& Wood, 2000; Grandin & Scariano, 1986; Rosenhall et al., 1999). Indeed, the recent
revision of the DSM-5 (2013) diagnostic criteria for Autism Spectrum Disorder now makes
explicit reference to sensory symptoms. Atypical auditory processing is particularly well
documented. Many autistic individuals experience a distressing hyper-reactivity to noise
(Grandin & Scariano, 1986; Rosenhall et al., 1999) and several studies have reported that
autistic individuals have difficulty extracting relevant auditory information (i.e., speech) in
the presence of competing background noise (Boatman et al., 2001; Alcantara et al., 2004;
Teder-Salejarvi et al., 2005; Groen et al., 2009).
In the current study, we investigated auditory processing in autism within the context
of Bregman’s (1990) auditory scene analysis framework. According to Bregman, auditory
perception involves grouping the incoming acoustic information into distinct auditory
“objects” that correspond to inferred events in the listener’s environment. This grouping
occurs across time, space, and frequency and is determined by gestalt principles (such
as similarity and temporo-spatial proximity) as well as attention and top-down effects
of prior knowledge. Traditionally, auditory scene analysis has been investigated using
behavioural methods in which participants report what they perceive as a function
of stimulus manipulations. However, such methods are likely to be inappropriate for
individuals with developmental disorders such as autism, who may be unable to provide an
accurate introspective report of their perceptual experience. For this reason, investigations
of auditory scene analysis in autism have measured auditory grouping indirectly via the
measurement of brain responses.
In a 2005 study, Teder-Salejarvi et al. reported that, amongst individuals with autism,
brain responses to sounds emanating from attended versus ignored spatial locations were
indistinguishable. The authors concluded that the ability to focus auditory attention in
complex acoustic environments is impaired in autism. However, this result could also
indicate a problem with low-level perceptual segregation of the two sources. Subsequently,
Lepisto et al. (2009) investigated auditory streaming using the mismatch negativity (MMN)
paradigm. Adults with autism evidenced a typical MMN response to pitch deviants in a
sequence of tones. However, this effect was eliminated when a separate stream of much
higher tones was overlain, suggesting that the participants with autism did not segregate
the sounds into separate auditory streams.
The current study investigated concurrent auditory segregation in adolescents and
young adults with autism via the dichotic pitch paradigm. Dichotic pitch refers to the
perception of pitches from stimuli that do not contain monaural cues to pitch (Bilsen,
1976; Cramer & Huggins, 1958; Dougherty et al., 1998). Time-shifted dichotic pitch is
created by presenting to each ear copies of broadband noises that have identical spectra
but contain interaural time delays across a narrow frequency band. The frequency band
containing the delay becomes perceptually separated from the remaining noise and is heard
as a pitch with a tonal quality that is related to the centre frequency of the narrow frequency
band (Johnson, Hautus & Clapp, 2003; Hautus & Johnson, 2005). Because the time shift has
Lodhia et al. (2014), PeerJ, DOI 10.7717/peerj.261 2/15

no effect on the spectral content of the stimuli, any differential response can be assumed
to reflect the cortical processes underlying auditory segregation (Hautus & Johnson, 2005;
Johnson et al., 2004; Hautus, Johnson & Colling, 2009).
Our previous research using such stimuli has demonstrated that perception of dichotic
pitch is associated with a negative ERP component with a latency of about 150–250 ms
(Hautus & Johnson, 2005; Clapp, Johnson & Hautus, 2007; Johnson et al., 2007). This Object
Related Negativity (ORN) was originally described by Alain, Arnott & Picton (2001) in the
context of mistuned harmonics. It arises with or without attention to the auditory stimuli
and is therefore assumed to represent a neurological marker of the pre-attentive stage of
auditory scene segregation (Alain, Arnott & Picton, 2001; Johnson & Hautus, 2010).
A magnetic counterpart, the mORN, has also been found using magnetoencephalogra-
phy (MEG) (Johnson & Hautus, 2010; Johnson et al., 2004; Alain & McDonald, 2007). In a
recent MEG study, we found that children with autism failed to show an mORN to dichotic
pitch stimuli, suggesting a failure of auditory segregation (Brock et al., 2013). However,
results were inconclusive as the magnitude of the ORN was not significantly smaller than
that evidenced by age-matched typically developing children.
The current study built on our earlier MEG study, using EEG to investigate the ORN.
Rather than testing children, we tested young adults with autism, thereby allowing us
to administer many more trials and achieve more reliable responses. Moreover, brain
responses of adults are likely to be more consistent across individuals. Auditory evoked
responses are typically mature by late adolescence (Mahajan & McArthur, 2012) and
studies comparing adolescents, young adults and middle-aged adults have found no
evidence of developmental change in the ORN (Alain, Arnott & Picton, 2001; Alain et
al., 2003; Alain & McDonald, 2007). To maximize the ORN response, we used “lateralized”
dichotic pitch stimuli, whereby the broadband noise is also time-shifted in a direction
opposite the narrow frequency band. In this case the segregation of pitch and noise is
enhanced such that the listeners perceive the broadband noise lateralized to one side of
auditory space and the pitch lateralized to the other side (see Fig. 1; Johnson & Hautus,
2010). This contrasts with the stimuli in our MEG study in which the pitch was lateralized
but the residual noise was presented without an interaural timing difference and was
therefore perceived as emanating from the centre of space.
As a final point of difference, we added a behavioural task in which participants were
required to indicate via button press whether or not they heard the pitch sound. This
contrasts with Brock et al. (2013) in which the participants were instructed to ignore the
stimuli whilst watching a sound-attenuated movie. This allowed us to directly compare
behavioural and electrophysiological indices of auditory perception. Previous studies have
indicated that the addition of a behavioural task elicits a positive component, termed the
P400, with a latency of about 400–500 ms and, like the ORN, the P400 can be produced
by ITD and inharmonicity. Unlike the ORN, the P400 is attention dependent, occurring
only when participants are actively listening to (and discriminating between) stimuli. It
is therefore thought to reflect the decision-making process related to the parsing of the
Lodhia et al. (2014), PeerJ, DOI 10.7717/peerj.261 3/15
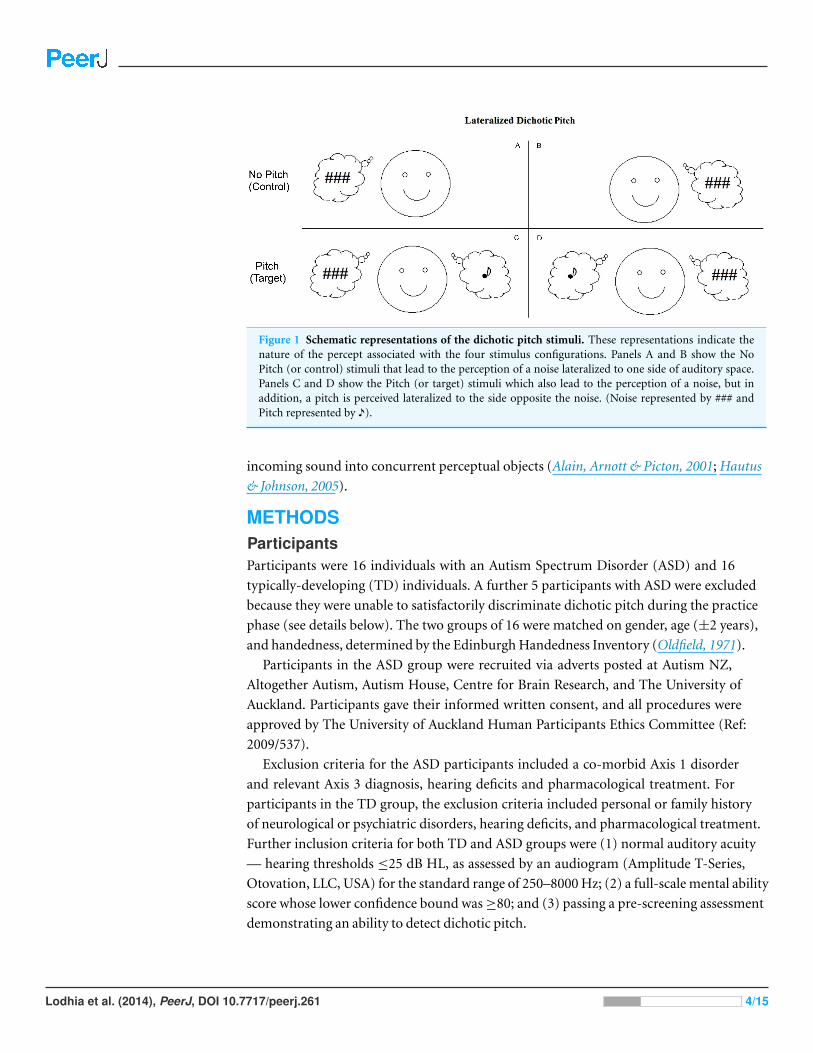
Figure 1 Schematic representations of the dichotic pitch stimuli. These representations indicate thenature of the percept associated with the four stimulus configurations. Panels A and B show the NoPitch (or control) stimuli that lead to the perception of a noise lateralized to one side of auditory space.Panels C and D show the Pitch (or target) stimuli which also lead to the perception of a noise, but inaddition, a pitch is perceived lateralized to the side opposite the noise. (Noise represented by ### andPitch represented by ♪).
incoming sound into concurrent perceptual objects (Alain, Arnott & Picton, 2001; Hautus
& Johnson, 2005).
METHODSParticipantsParticipants were 16 individuals with an Autism Spectrum Disorder (ASD) and 16
typically-developing (TD) individuals. A further 5 participants with ASD were excluded
because they were unable to satisfactorily discriminate dichotic pitch during the practice
phase (see details below). The two groups of 16 were matched on gender, age (±2 years),
and handedness, determined by the Edinburgh Handedness Inventory (Oldfield, 1971).
Participants in the ASD group were recruited via adverts posted at Autism NZ,
Altogether Autism, Autism House, Centre for Brain Research, and The University of
Auckland. Participants gave their informed written consent, and all procedures were
approved by The University of Auckland Human Participants Ethics Committee (Ref:
2009/537).
Exclusion criteria for the ASD participants included a co-morbid Axis 1 disorder
and relevant Axis 3 diagnosis, hearing deficits and pharmacological treatment. For
participants in the TD group, the exclusion criteria included personal or family history
of neurological or psychiatric disorders, hearing deficits, and pharmacological treatment.
Further inclusion criteria for both TD and ASD groups were (1) normal auditory acuity
— hearing thresholds ≤25 dB HL, as assessed by an audiogram (Amplitude T-Series,
Otovation, LLC, USA) for the standard range of 250–8000 Hz; (2) a full-scale mental ability
score whose lower confidence bound was ≥80; and (3) passing a pre-screening assessment
demonstrating an ability to detect dichotic pitch.
Lodhia et al. (2014), PeerJ, DOI 10.7717/peerj.261 4/15
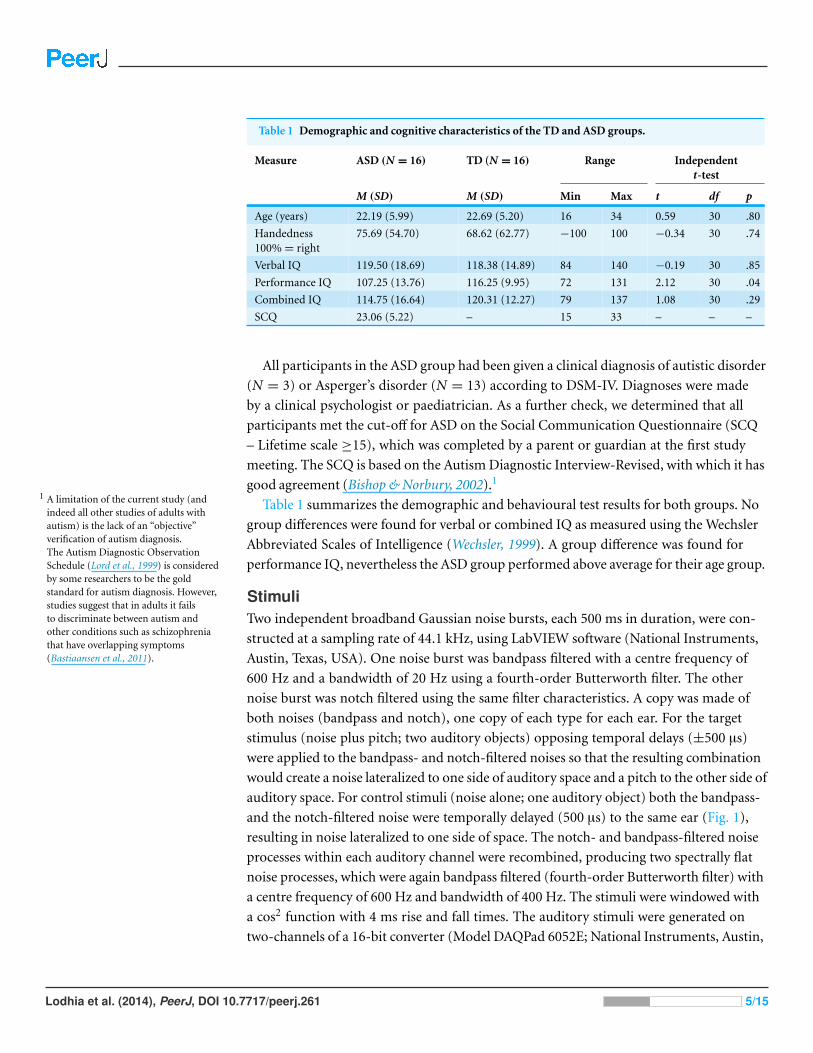
Table 1 Demographic and cognitive characteristics of the TD and ASD groups.
Measure ASD (N = 16) TD (N = 16) Range Independentt-test
M (SD) M (SD) Min Max t df p
Age (years) 22.19 (5.99) 22.69 (5.20) 16 34 0.59 30 .80
Handedness100% = right
75.69 (54.70) 68.62 (62.77) −100 100 −0.34 30 .74
Verbal IQ 119.50 (18.69) 118.38 (14.89) 84 140 −0.19 30 .85
Performance IQ 107.25 (13.76) 116.25 (9.95) 72 131 2.12 30 .04
Combined IQ 114.75 (16.64) 120.31 (12.27) 79 137 1.08 30 .29
SCQ 23.06 (5.22) – 15 33 – – –
All participants in the ASD group had been given a clinical diagnosis of autistic disorder
(N = 3) or Asperger’s disorder (N = 13) according to DSM-IV. Diagnoses were made
by a clinical psychologist or paediatrician. As a further check, we determined that all
participants met the cut-off for ASD on the Social Communication Questionnaire (SCQ
– Lifetime scale ≥15), which was completed by a parent or guardian at the first study
meeting. The SCQ is based on the Autism Diagnostic Interview-Revised, with which it has
good agreement (Bishop & Norbury, 2002).11 A limitation of the current study (and
indeed all other studies of adults withautism) is the lack of an “objective”verification of autism diagnosis.The Autism Diagnostic ObservationSchedule (Lord et al., 1999) is consideredby some researchers to be the goldstandard for autism diagnosis. However,studies suggest that in adults it failsto discriminate between autism andother conditions such as schizophreniathat have overlapping symptoms(Bastiaansen et al., 2011).
Table 1 summarizes the demographic and behavioural test results for both groups. No
group differences were found for verbal or combined IQ as measured using the Wechsler
Abbreviated Scales of Intelligence (Wechsler, 1999). A group difference was found for
performance IQ, nevertheless the ASD group performed above average for their age group.
StimuliTwo independent broadband Gaussian noise bursts, each 500 ms in duration, were con-
structed at a sampling rate of 44.1 kHz, using LabVIEW software (National Instruments,
Austin, Texas, USA). One noise burst was bandpass filtered with a centre frequency of
600 Hz and a bandwidth of 20 Hz using a fourth-order Butterworth filter. The other
noise burst was notch filtered using the same filter characteristics. A copy was made of
both noises (bandpass and notch), one copy of each type for each ear. For the target
stimulus (noise plus pitch; two auditory objects) opposing temporal delays (±500 µs)
were applied to the bandpass- and notch-filtered noises so that the resulting combination
would create a noise lateralized to one side of auditory space and a pitch to the other side of
auditory space. For control stimuli (noise alone; one auditory object) both the bandpass-
and the notch-filtered noise were temporally delayed (500 µs) to the same ear (Fig. 1),
resulting in noise lateralized to one side of space. The notch- and bandpass-filtered noise
processes within each auditory channel were recombined, producing two spectrally flat
noise processes, which were again bandpass filtered (fourth-order Butterworth filter) with
a centre frequency of 600 Hz and bandwidth of 400 Hz. The stimuli were windowed with
a cos2 function with 4 ms rise and fall times. The auditory stimuli were generated on
two-channels of a 16-bit converter (Model DAQPad 6052E; National Instruments, Austin,
Lodhia et al. (2014), PeerJ, DOI 10.7717/peerj.261 5/15

TX). Programmable attenuators (Model PA4; Tucker-Davis Technologies, Alachua, FL) set
the binaural stimuli to yield 70 dB SPL from insert earphones at the ear. (ER2; Etymotic
Research Inc., Elk Grove Village, Illinois, USA).
Behavioural taskOn each trial, participants indicated on a button box whether the stimulus presented
consisted of one or two auditory objects. In an initial practice session, prior to EEG
recording, participants completed four 100-trial blocks with feedback received after
each trial. Five of the original 21 participants with ASD did not reach the criterion of
69 percent correct (approximately d′= 1; cf. Macmillan & Creelman, 2005, p. 9) in the
practice session and were therefore excluded from the EEG part of the study because they
could not sufficiently discriminate between the two types of stimuli.
During the EEG recording, the task was similar, except that no feedback was given and
the trial timed out after 1500 ms if no response was made. The inter-stimulus intervals
were drawn from a rectangular distribution between 2000 ms and 3400 ms. Participants
completed four blocks of 256 trials, each of which took approximately 13 min to complete.
Short breaks were given after each block.
ElectroencephalographyEEG recordings were conducted in an electrically shielded room (Model L3000; Belling
Lee, Enfield, England) using 128-chanel Ag/AgCl electrode nets (Tucker, 1993; Electrical
Geodesics Inc., Eugene, Oregon, USA). EEG was recorded continuously (250-Hz sample
rate; 0.1–100 Hz analogue bandpass) with Electrical Geodesics Inc. amplifiers (200-MΩ
input impedance). Electrode impedances were kept below 40 kΩ, an acceptable level for
this system (Tucker, 1993). Common vertex (Cz) was used as a reference. During the EEG,
participants were asked to fixate on a cross, presented on a computer screen.
Data analysisEEG files were segmented into 750 ms epochs (including a 100 ms pre-stimulus baseline)
during which all ocular artifacts were corrected (Jervis et al., 1985). Trials with channels
marked as bad were dropped from the averaging process. 98% of trials remained for
analysis from each group. Given that the ORN is elicited regardless of whether a task
is performed, all trials were included, irrespective of response accuracy. ERPs were
re-referenced to the average reference. ERPs from individual participants were combined
to produce grand-averaged ERPs for each condition. Grand averaged data were then
digitally filtered with a zero-phase-shift 3-pole Butterworth filter (0.1–30 Hz; Alarcon,
Guy & Binnie, 2000) and then re-referenced to the mean.
For statistical analysis, the electrode clusters of interest for the ORN and the P400
components were selected by combining all 32 participants’ data for the No Pitch and
the Pitch conditions. These grand averaged waveform topographic maps were then used
to select a symmetrical cluster of electrodes that showed the greatest difference in mean
amplitude between the No pitch and the Pitch conditions (left hemisphere electrodes: 7,
12, 13, 20, 28, 29, 30, 31, 37; right hemisphere: 5, 80, 87, 105, 106, 111, 112, 117, 118). For
Lodhia et al. (2014), PeerJ, DOI 10.7717/peerj.261 6/15
each participant we then averaged across these channels to calculate a Pitch and a No-Pitch
waveform. Time windows for the ORN and P400 components were determined based on
the full width half max of the difference waveform for the combined group (N = 32). For
each participant, the magnitude of the two components was calculated as the area under
the curve in the difference waveform.
As Kilner (2013) has recently pointed out, selecting channels and time windows based
on the observed peaks inflates the likelihood of false-positives in the within-subjects effect
(i.e., it increases the likelihood of finding a main effect of Condition when none exists).
However, our aim was not to replicate the numerous previous studies demonstrating the
existence of the ORN and P400 but rather to determine whether the components differed
in magnitude across groups. Because our choices were all made based on the data averaged
across both groups (and because the groups were of equal size), they should not increase
the likelihood of a false positive group difference.
RESULTSBehavioural performanceANOVA revealed a main effect of Group, (F(1,30) = 12.75, p < .001, η2
p = .298), indicating
that the TD group obtained a higher percentage correct score (87.38%) than the ASD
group (70.38%).
Event-related potentialsFigure 2 shows the ERP waveforms for Typically Developing and ASD participants in
response to Pitch and No Pitch (Control) stimuli. Typically developing participants
showed an increased negativity (ORN) to the Pitch stimuli, coincident with the P2 and
N2 peaks. This was followed by an increased positivity P400 at around 400 ms. Waveforms
for participants with ASD were similar overall, but there was little evidence of a differential
response to Pitch and No Pitch stimuli.
For the ORN time window, ANOVA confirmed a more negative response to Pitch
compared with the No Pitch stimuli (F(1,30) = 34.87, p < .001, η2p = .538). There was
no main effect of Group (F(1,30) = 0.79, p = .382, η2p = .026). However, as predicted,
there was a significant Pitch × Group interaction (F(1,30) = 8.66, p = .006, η2p = .224),
with a considerably larger effect of Pitch in the TD group (see Fig. 3). Follow-up t-tests
(two-tailed) indicated that the TD group showed a significant ORN (t(15) = −6.43,
p < .001) but the ASD group did not (t(15) = −2.04, p = .059).
Figure 3 also indicates the presence of an outlier in the TD group, with an ORN
(−0.72 µV) that was considerably larger than that of the other participants. We therefore
repeated the analyses with the outlier excluded. Critically, the Pitch x Group interaction
remained significant (F(1,29) = 7.31, p = .011, η2p = .201) indicating that the group
differences were not driven solely by this outlier.
Pearson’s correlation analyses revealed that, within the ASD group, better behavioural
performance during the EEG recording was associated with a more negative ORN
(r(16) = −.567, p = .022). In other words, individuals with ASD who performed
Lodhia et al. (2014), PeerJ, DOI 10.7717/peerj.261 7/15

Figure 2 Event related potential waveform graphs. Grand averaged ERP (−100–750 ms) graphs of theNo Pitch and Pitch stimuli for the TD group and ASD group. Shaded regions indicate the time windowsused for calculating the ORN (168–284 ms) and P400 (404–520 ms).
Table 2 Correlations for each group between electrophysiological measures (ORN and P400) andparticipant demographics and accuracy.
Measure ORN P400
ASD TD ASD TD
Accuracy −.567*−.314 .222 −.187
Age .253 .046 −.341 .313
Verbal IQ .073 .691** .496 .295
Performance IQ −.049 .226 .393 .335
SCQ −.148 N/A −.148 N/A
Notes.* p < .05.
** p < .01.
well on the task tended to show a typical ORN, whereas those who performed poorly
demonstrated a reduced ORN (Fig. 3). Within the TD group, the correlation was in the
same direction but fell well short of significance (r(16) = −.314, p = .237), perhaps
reflecting ceiling effects on performance.
Further correlation analyses (see Table 2) showed no association between ORN
magnitude and either age, scores on the Social Communication Questionnaire, verbal
IQ, or performance IQ within the ASD group (minimum p = .34). Similar analyses of the
TD group revealed a significant correlation between the ORN and verbal IQ (r(16) = .691,
p = .003) but this became non-significant when the outlier was excluded (r(15) = .500,
p = .057). All other correlations were non-significant, with or without the outlier.
Lodhia et al. (2014), PeerJ, DOI 10.7717/peerj.261 8/15
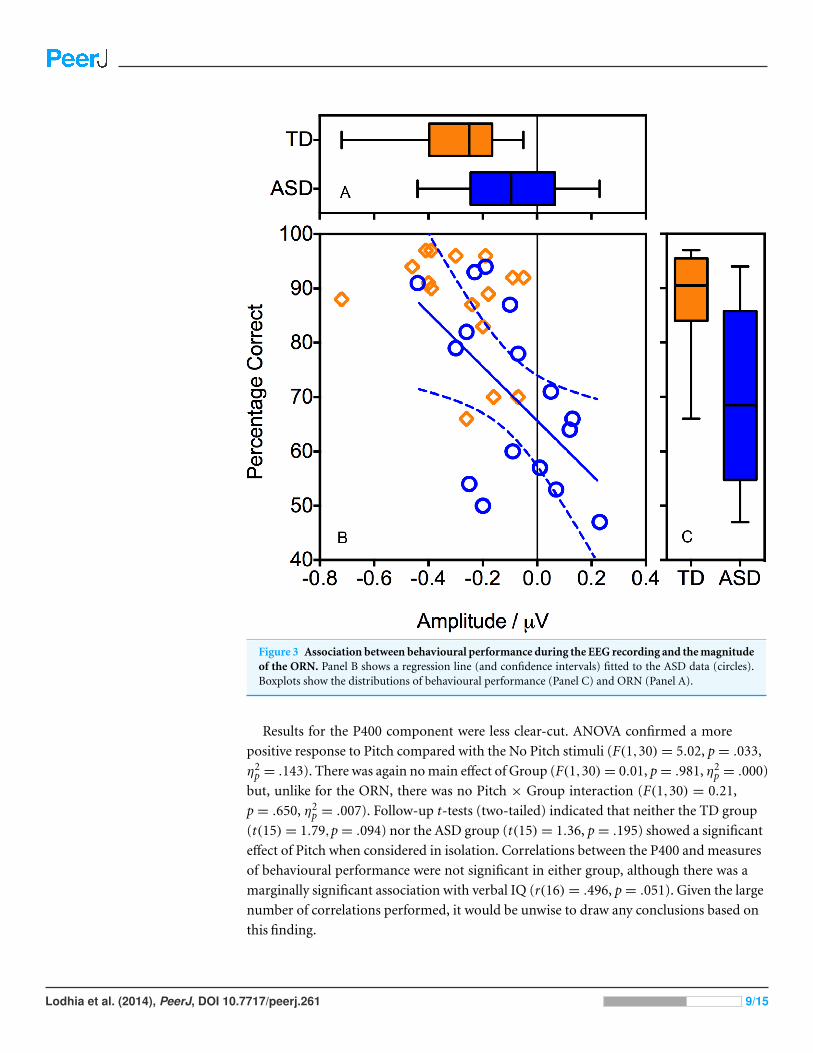
Figure 3 Association between behavioural performance during the EEG recording and the magnitudeof the ORN. Panel B shows a regression line (and confidence intervals) fitted to the ASD data (circles).Boxplots show the distributions of behavioural performance (Panel C) and ORN (Panel A).
Results for the P400 component were less clear-cut. ANOVA confirmed a more
positive response to Pitch compared with the No Pitch stimuli (F(1,30) = 5.02, p = .033,
η2p = .143). There was again no main effect of Group (F(1,30) = 0.01, p = .981, η2
p = .000)
but, unlike for the ORN, there was no Pitch × Group interaction (F(1,30) = 0.21,
p = .650, η2p = .007). Follow-up t-tests (two-tailed) indicated that neither the TD group
(t(15) = 1.79,p = .094) nor the ASD group (t(15) = 1.36, p = .195) showed a significant
effect of Pitch when considered in isolation. Correlations between the P400 and measures
of behavioural performance were not significant in either group, although there was a
marginally significant association with verbal IQ (r(16) = .496, p = .051). Given the large
number of correlations performed, it would be unwise to draw any conclusions based on
this finding.
Lodhia et al. (2014), PeerJ, DOI 10.7717/peerj.261 9/15

DISCUSSIONAuditory Scene Analysis provides a useful framework for understanding atypical auditory
perception in autism. Specifically, a failure to segregate the confusion of incoming
auditory energy into distinct auditory objects might explain the aversive reaction autistic
individuals have to certain auditory stimuli or environments. Our prediction in this
study was that autistic individuals would evidence a reduced ORN, indicating a failure
to segregate the dichotic pitch stimuli into spatially separate auditory objects. This proved
to be the case. Where TD participants showed a significant ORN, the effect was reduced in
adults with ASD, who did not themselves show a significant ORN.
As in previous studies, we focused on electrophysiological measures of auditory
perception in order to avoid potential confounds such as task understanding and attention
that might affect performance on behavioural tasks. However, there was, in fact, substantial
agreement between behavioural and electrophysiological measures both at the group and
the individual level. This indicates that, in the high-functioning adults tested here, the
behavioural performance is a good indicator of underlying perceptual processes, and that
together the two measures provide converging evidence for atypical perception, at least
in a subgroup of individuals with ASD. These results are also broadly consistent with
our previous study in which we failed to find a significant ORN in a group of autistic
children (Brock et al., 2013). The current results are, however, more compelling insofar
as they revealed a significant group by condition interaction, which was only a trend in
the earlier study.2 It is not clear which of the various methodological differences might2 In our previous MEG study, analyses
were conducted by a bootstrappinganalysis of the difference waveforms. Toallow a more direct comparison with thecurrent study, we re-analysed the MEGdata, calculating the mean amplitudeof the source waveform for the righthemisphere between 250 and 360 ms.This choice was based on analysis ofdata from a larger sample of typicallydeveloping children (Johnson et al.,2013) which showed a significant ORNin this window. Consistent with thecurrent study, we found no ORN in theASD group (t(9) = 0.23, p = .827), butthe group by condition interaction wasalso non-significant (F(1,18) = 1.48,p = .239, η2
p = .076).
explain this difference in outcome. The current study used EEG rather than MEG, used
lateralized noise rather than centralized noise, included more participants and more
trials, and involved adults rather than children. Any or all of these differences could be
relevant. Alternatively, given the variation in both the ORN and behavioural performance
within our ASD group, as well as the inherent heterogeneity in the wider ASD population,
results could simply reflect differences in sampling across the two studies. Also of potential
significance is the absence of “gold standard” tests for diagnosing adults with autism, and
that diagnoses of autism were made by several qualified professionals.
It is also difficult to be sure at this stage to what extent these findings are specific to
the dichotic pitch paradigm or reflect auditory segregation more generally. Our ongoing
research looks to address this issue by using other auditory stimuli that also produce an
ORN. That being said, participants with ASD were all significantly above chance in the
practice session, indicating that they were at least able to detect the inter-aural timing
differences that gave rise to the dichotic pitch perception. The reduced ORN in their
response suggests that, even though they were able to detect some difference between
the pitch and control stimuli, their auditory systems did not fully segregate these two
sound qualities (noise and pitch) into separate auditory objects. Rather, they are more
likely to perceive a single auditory object that has both noise- and pitch-like qualities. The
distinction in the qualities of this single object allows the behavioural task to be completed
successfully; albeit with lower performance than the TD participants.
Lodhia et al. (2014), PeerJ, DOI 10.7717/peerj.261 10/15

This interpretation would also be consistent with the absence of group differences in
the later P400 component, which is thought to index the task-based decision. However,
caution is required in interpreting the P400 responses given that neither group evidenced
a significant P400 effect on their own, and that the P400 response did not correlate
significantly with behavioural performance. Thus, it may simply be the case that the P400
response is unreliable, or that its latency or spatial distribution varies across individuals,
meaning that we were unable to extract a measure of the P400 size that actually reflected
the strength of the underlying neurophysiological processes.
Our working hypothesis, therefore, is that ASD individuals have (or are more likely
to have) difficulties in the segregation of auditory stimuli into distinct auditory objects.
This ability is known to begin in infancy (Folland et al., 2012; Dermany, 1982; McAdams
& Bertoncini, 1997) and continues to improve in conjunction with growth of neuronal
connectivity in adolescence (Smith & Trainor, 2011). Reduced ability to filter out and
process multiple sounds may, therefore, be attributed to atypical brain development and
growth in ASD. Source modelling suggests that the neural generators of the ORN are
located in the posterior supratemporal plane for dichotic pitch stimuli (Hautus & Johnson,
2005), consistent with the view that the planum temporale neural network has a functional
role in concurrent sound segregation (Alain, Arnott & Picton, 2001; Griffiths & Warren,
2002). Of note, there have been several reports that individuals with ASD have a smaller
planum temporale compared to typically developing individuals (Rojas et al., 2002; Rojas et
al., 2005) although, without MRIs for the current participants, this remains speculative.
Further research is therefore required to determine how common the deficits in
auditory object processing are within the ASD population, and whether they relate at
the individual level to atypical perceptual experiences. In particular, our study specifically
concentrated on high functioning adults. It is unclear whether we would find similar
pre-attentive processing difficulties with other ASD profiles such as younger children and
lower functioning individuals. Some sub-groups within the autistic spectrum may have
very different auditory perceptual experiences to those tested here.
It also remains to be established how specific these difficulties are to ASD. In a recent
study, we found no difference in the ORNs generated by typically developing children and
those with specific reading difficulties (Johnson et al., 2013). There are, however, many
other conditions associated with atypical auditory processing, and affected individuals
might show effects similar to those with autism (e.g., Elsabbagh, Cohen & Karmiloff-Smith,
2010; Goll, Crutch & Warren, 2010). These caveats notwithstanding, the current study adds
to the growing body of evidence that atypical auditory perception associated with autism
may be understood in terms of differences in auditory scene analysis.
ACKNOWLEDGEMENTSThe authors gratefully acknowledge the assistance and support from Autism NZ,
Altogether Autism, Autism House, the participants and their families for supporting this
research, and Ms Chaturangi Nelumdeniya for assistance with the collection of data.
Lodhia et al. (2014), PeerJ, DOI 10.7717/peerj.261 11/15

ADDITIONAL INFORMATION AND DECLARATIONS
FundingThe work of BWJ and JB was supported by the Australian Research Council (ARC) Centre
of Excellence for Cognition and its Disorders (CE110001021): http://www.ccd.edu.au. JB
was supported by an ARC Australian Research Fellowship (DP098466). The funders had
no role in study design, data collection and analysis, decision to publish, or preparation of
the manuscript.
Grant DisclosuresThe following grant information was disclosed by the authors:
Australian Research Council (ARC) Centre of Excellence for Cognition and its Disorders:
CE110001021.
ARC Australian Research Fellowship: DP098466.
Competing InterestsJB is an Academic Editor for PeerJ. There are no other competing interests.
Author Contributions• Veema Lodhia and Michael J. Hautus conceived and designed the experiments,
performed the experiments, analyzed the data, contributed reagents/materials/analysis
tools, wrote the paper.
• Jon Brock and Blake W. Johnson conceived and designed the experiments, analyzed the
data, wrote the paper.
Human EthicsThe following information was supplied relating to ethical approvals (i.e., approving body
and any reference numbers):
The University of Auckland Human Participants Ethics Committee: Ref: 2009/537.
REFERENCESAlain C, Arnott SR, Picton TW. 2001. Bottom-up and top-down influenced on the auditory
scene analysis: evidence from event related brain potentials. Journal of Experimental Psychology27(5):1072–1089.
Alain C, McDonald K. 2007. Age-related differences in neuromagnetic brain activity underlyingconcurrent sound perception. The Journal of Neuroscience 27:1308–1314DOI 10.1523/JNEUROSCI.5433-06.2007.
Alain C, Theunissen EL, Chevalier H, Batty M, Taylor M. 2003. Developmental changes indistinguishing concurrent auditory objects. Cognitive Brain Research 16:210–218DOI 10.1016/S0926-6410(02)00275-6.
Alarcon G, Guy CN, Binnie CD. 2000. A simple algorithm for a digital three-pole Butterworthfilter of arbitrary cut-off frequency: application to digital electroencephalography. Journal ofNeuroscience Methods 104(1):35–44 DOI 10.1016/S0165-0270(00)00324-1.
Lodhia et al. (2014), PeerJ, DOI 10.7717/peerj.261 12/15

Alcantara JI, Weisblatt EJL, Moore BCJ, Bolton PF. 2004. Speech-in-noise perception in highfunctioning individuals with autism or Asperger’s syndrome. Journal of Child Psychology andPsychiatry 45(6):1107–1114 DOI 10.1111/j.1469-7610.2004.t01-1-00303.x.
American Psychiatric Association. 1994. Diagnostic and statistical manual of mental disorders,Fourth edition (DSM-IV). Washington, DC: American Psychiatric Publishing.
American Psychiatric Association. 2013. Diagnostic and statistical manual of mental disorders,Fifth edition (DSM-5). Arlington, VA: American Psychiatric Publishing.
Bastiaansen JA, Meffert H, Hein S, Huizinga P, Ketelaars C, Pijnenborg M, Bartels A,Minderaa R, Keysers C, de Bildt A. 2011. Diagnosing autism spectrum disorders in adults:the use of Autism Diagnostic Observation Schedule (ADOS) Module 4. Journal of Autism andDevelopmental Disorders 41:1256–1266 DOI 10.1007/s10803-010-1157-x.
Bishop DV, Norbury CF. 2002. Exploring the borderlands of autistic disorder and specificlanguage impairment: a study using standardised diagnostic instruments. Journal of ChildPsychology and Psychiatry 43:917–929 DOI 10.1111/1469-7610.00114.
Bilsen FA. 1976. Pronounced binaural pitch phenomenon. Journal of the Acoustical Society ofAmerica 59:467–468 DOI 10.1121/1.380892.
Boatman D, Alidoost M, Gordan B, Lipsky F, Zimmerman W. 2001. Enhanced pitch sensitivityin individuals with autism: a signal detection analysis. Journal of Cognitive Neuroscience15:226–235.
Bregman AS. 1990. Auditory scene analysis: the perceptual organization of sound. Cambridge,Massachusetts: MIT Press.
Brock J, Bzishvili S, Reid M, Hautus M, Johnson BW. 2013. Atypical neuromagnetic responsesto illusory auditory pitch in children with autism spectrum disorders. Journal of Autism andDevelopmental Disorders 47(11):2726–2731 DOI 10.1007/s10803-013-1805-z.
Cramer EM, Huggins WH. 1958. Creation of pitch through binaural interaction. Journal of theAcoustical Society of America 30(5):413–417 DOI 10.1121/1.1909628.
Clapp WC, Johnson BW, Hautus MJ. 2007. Graded cue information in dichotic pitch: effects onevent-related potentials. NeuroReport 18(4):365–638 DOI 10.1097/WNR.0b013e32801776d1.
Dougherty R, Cynader MS, Bjornson BH, Edgell D, Giaschi DE. 1998. Dichotic pitch: a newstimulus distinguishes normal and dyslexic auditory function. NeuroReport 9(13):3001–3005DOI 10.1097/00001756-199809140-00015.
Dermany L. 1982. Auditory stream segregation in infancy. Infant Behaviour & Development48:261–276 DOI 10.1016/S0163-6383(82)80036-2.
Elsabbagh M, Cohen H, Karmiloff-Smith A. 2010. Discovering structure in auditory input:evidence from Williams Syndrome. American Journal on Intellectual and DevelopmentalDisabilities 115(2):128–139 DOI 10.1352/1944-7558-115.2.128.
Folland N, Bulter BE, Smith NA, Trainor LJ. 2012. Processing simultaneous auditory objectsin infancy: music and mistuned harmonics. Journal of the Acoustical Society of America313:993–997 DOI 10.1121/1.3651254.
Goll JC, Crutch SJ, Warren JD. 2010. Central auditory disorders: toward a neuropsychology ofauditory objects. Current Opinion in Neurology 23(6):617–627DOI 10.1097/WCO.0b013e32834027f6.
Grandin T, Scariano MM. 1986. Emergence: labelled autistic. New York: Arena Press.
Griffiths TD, Warren JD. 2002. The planum temporale as a computational hub. Trends inNeurosciences 25:348–353 DOI 10.1016/S0166-2236(02)02191-4.
Lodhia et al. (2014), PeerJ, DOI 10.7717/peerj.261 13/15

Groen WB, van Orsouw L, ter Huurne N, Swinkels S, van der Gaag RJ, Buitelaar JK, Zwiers MP.2009. Intact spectral but abnormal temporal processing of auditory stimuli in autism. Journalof Autism and Developmental Disorders 39(3):742–750 DOI 10.1007/s10803-008-0682-3.
Hautus MJ, Johnson BW, Colling LJ. 2009. Event-related potentials for interaural timingdifferences and spectral cues. NeuroReport 20:951–956 DOI 10.1097/WNR.0b013e32832c92bf.
Hautus MJ, Johnson BW. 2005. Object-related brain potentials associated with the perceptualsegregation of dichotically embedded pitch. Journal of the Acoustical Society of America117(1):275–280 DOI 10.1121/1.1828499.
Jervis BW, Nichols MR, Allen EM, Hudson NR, Johnson TE. 1985. The assessment of twomethods for removing eye movement artifacts from the EEG. Electroencephalography andClinical Neurophysiology 61:444–452 DOI 10.1016/0013-4694(85)91037-5.
Johnson BW, Hautus MJ. 2010. Processing of binaural spatial information in human auditorycortex: neuromagnetic responses to interaural timing and level difference. Neuropsychologia48:2610–2619 DOI 10.1016/j.neuropsychologia.2010.05.008.
Johnson BW, Hautus MJ, Clapp WC. 2003. Neural activity associated with binaural processes forthe perceptual segregation of pitch. Clinical Neurophysiology 114:2245–2250DOI 10.1016/S1388-2457(03)00247-5.
Johnson BW, Hautus MJ, Duff DJ, Clapp WC. 2007. Sequential processing of interaural timingdifferences for sound source segregation and spatial localization: evidence from event-relatedcortical potentials. Psychophysiology 44:541–551 DOI 10.1111/j.1469-8986.2007.00535.x.
Johnson BW, McArthur G, Hautus M, Reid M, Brock J, Castles A, Crain S. 2013. Lateralizedauditory brain function in children with normal reading ability and in children with dyslexia.Neuropsychologia 51(4):633–641 DOI 10.1016/j.neuropsychologia.2012.12.015.
Johnson BW, Muthukumaraswamy SD, Hautus MJ, Gaetz WC, Cheyne DO. 2004.Neuroimaging responses associated with perceptual segregation of pitch. Neurology and ClinicalNeurophysiology 33:1–4.
Kilner JM. 2013. Bias in a common EEG and MEG statistical analysis and how to avoid it. ClinicalNeurophysiology 124(10):2062–2063 DOI 10.1016/j.clinph.2013.03.024.
Lepisto T, Kuitunen A, Sussman E, Saalasti S, Jansson-Verkasalo E, Nieminen-von Wendt T,Kujala T. 2009. Auditory stream segregation in children with aspergers syndrome. BiologicalPsychology 82:301–307 DOI 10.1016/j.biopsycho.2009.09.004.
Lord C, Rutter M, DiLavore PC, Risi S. 1999. Autism diagnostic observation schedule. Manual. LosAngeles, CA: Western Psychological Services.
Macmillan NA, Creelman CD. 2005. Detection theory: a user’s guide, 2nd edn. Mahwah, NewJersey: Lawrence Erlbaum Associates.
Mahajan Y, McArthur G. 2012. Maturation of auditory event-related potentials acrossadolescence. Hearing Research 294:82–94 DOI 10.1016/j.heares.2012.10.005.
McAdams S, Bertoncini J. 1997. Organization and discrimination of repeating soundsequences by newborn infants. Journal of the Acoustical Society of America 102:2945–2953DOI 10.1121/1.420349.
Oldfield RC. 1971. The assessment and analysis of handedness: the Edinburgh inventory.Neuropsychologia 9:97–113 DOI 10.1016/0028-3932(71)90067-4.
Rojas DC, Bawn SD, Benkers TL, Reite ML, Rogers SL. 2002. Smaller left hemisphere planumtemporale in adults with autistic disorder. Neuroscience Letters 328:237–240DOI 10.1016/S0304-3940(02)00521-9.
Lodhia et al. (2014), PeerJ, DOI 10.7717/peerj.261 14/15

Rojas DC, Camou SL, Reite ML, Rogers SL. 2005. Planum temporale volume in children andadolescents with autism. Journal of Autism and Developmental Disorders 35(4):479–486DOI 10.1007/s10803-005-5038-7.
Rosenhall U, Nordin V, Sandstrom M, Ahlsen G, Gillberg C. 1999. Autism and hearing loss.Journal of Autism and Developmental Disorders 29:349–357 DOI 10.1023/A:1023022709710.
Smith NA, Trainor LJ. 2011. Auditory stream segregation improves infants’ selective attention totarget tones and distracters. Infancy 16:1–14 DOI 10.1111/j.1532-7078.2011.00067.x.
Talay-Ongan A, Wood K. 2000. Unusual sensory sensitivities in autism: a possible crossroads.International Journal of Disability, Development and Education 47(2):201–212DOI 10.1080/713671112.
Teder-Salejarvi WA, Pierce KL, Courchesne E, Hillyard SA. 2005. Auditory spatial localizationand attention deficits in autistic adults. Cognitive Brain Research 23:221–234DOI 10.1016/j.cogbrainres.2004.10.021.
Tucker DM. 1993. Spatial sampling of head electrical fields: the geodesic sensor net. Electroen-cephalography & Clinical Neurophysiology 87(3):154–163 DOI 10.1016/0013-4694(93)90121-B.
Wechsler D. 1999. Wechsler abbreviated scale of intelligence (WASI). New York: The PsychologicalCorporation.
Lodhia et al. (2014), PeerJ, DOI 10.7717/peerj.261 15/15
Copyright © 2022 FDOKUMEN