Distinct Face-Processing Strategies in Parents of Autistic Children
11
Distinct Face Processing Strategies in Parents of Autistic Children Ralph Adolphs 1 , Michael L. Spezio 1,2 , Morgan Parlier 3 , and Joseph Piven 3,* 1California Institute of Technology, Pasadena, CA 2Scripps College, Claremont, CA 3University of North Carolina, Chapel Hill, NC Summary In his original description of autism, Kanner [1] noted that the parents of autistic children often exhibited unusual social behavior themselves, consistent with what we now know about the high heritability of autism [2]. We investigated this so-called “Broad Autism Phenotype” in the parents of children with autism, who themselves did not have a diagnosis of any psychiatric illness. Building on recent quantifications of social cognition in autism [3], we investigated face processing using the “Bubbles” method [4] to measure how viewers make use of information from specific facial features in order to judge emotions. Parents of autistic children who were assessed as socially aloof (N=15), a key component of the phenotype [5], showed a remarkable reduction in processing the eye region in faces, together with enhanced processing of the mouth, compared to a control group of parents of neurotypical children (N=20), as well as to non-aloof parents of autistic children (N=27, whose pattern of face processing was intermediate). The pattern of face processing seen in the Broad Autism Phenotype showed striking similarities to that previously reported to occur in autism [3], and for the first time provides a window into the endophenotype that may result from a subset of the genes that contribute to social cognition. Results and Discussion We used a sensitive and data-driven technique, called “bubbles” [4], to assess how viewers make use of information from faces. The approach is conceptually related to reverse correlation and shows participants only small regions of a randomly sampled face space (Figure 1). Using this technique, it is possible to identify statistically the extent to which specific facial features contribute to judgments about the faces. In our prior studies with this method [3,6,7], we asked subjects to discriminate between two emotions, fear and happiness, because these emotions are distinguished by particular facial features [8], and because there is evidence that their recognition can be differentially impaired following brain pathology [6,9]. To provide comparisons with prior results, we used the identical task here. We contrasted three groups of participants (Table 1): parents who had a child with autism and met criteria for the aloof component of the Broad Autism Phenotype (“BAP+”); those who had * Address for correspondence: Joseph Piven, MD CB #3366 University of North Carolina Chapel Hill, NC [email protected] 919-843-8641 Publisher's Disclaimer: This is a PDF file of an unedited manuscript that has been accepted for publication. As a service to our customers we are providing this early version of the manuscript. The manuscript will undergo copyediting, typesetting, and review of the resulting proof before it is published in its final citable form. Please note that during the production process errors may be discovered which could affect the content, and all legal disclaimers that apply to the journal pertain. Supplemental Data One Supplementary Figure and a Supplementary Methods description accompanies this paper. NIH Public Access Author Manuscript Curr Biol. Author manuscript; available in PMC 2009 July 22. Published in final edited form as: Curr Biol. 2008 July 22; 18(14): 1090–1093. NIH-PA Author Manuscript NIH-PA Author Manuscript NIH-PA Author Manuscript
-
Upload
scrippscollege -
Category
Documents
-
view
2 -
download
0
Transcript of Distinct Face-Processing Strategies in Parents of Autistic Children

Distinct Face Processing Strategies in Parents of Autistic Children
Ralph Adolphs1, Michael L. Spezio1,2, Morgan Parlier3, and Joseph Piven3,*
1California Institute of Technology, Pasadena, CA
2Scripps College, Claremont, CA
3University of North Carolina, Chapel Hill, NC
SummaryIn his original description of autism, Kanner [1] noted that the parents of autistic children oftenexhibited unusual social behavior themselves, consistent with what we now know about the highheritability of autism [2]. We investigated this so-called “Broad Autism Phenotype” in the parentsof children with autism, who themselves did not have a diagnosis of any psychiatric illness. Buildingon recent quantifications of social cognition in autism [3], we investigated face processing using the“Bubbles” method [4] to measure how viewers make use of information from specific facial featuresin order to judge emotions. Parents of autistic children who were assessed as socially aloof (N=15),a key component of the phenotype [5], showed a remarkable reduction in processing the eye regionin faces, together with enhanced processing of the mouth, compared to a control group of parents ofneurotypical children (N=20), as well as to non-aloof parents of autistic children (N=27, whosepattern of face processing was intermediate). The pattern of face processing seen in the Broad AutismPhenotype showed striking similarities to that previously reported to occur in autism [3], and for thefirst time provides a window into the endophenotype that may result from a subset of the genes thatcontribute to social cognition.
Results and DiscussionWe used a sensitive and data-driven technique, called “bubbles” [4], to assess how viewersmake use of information from faces. The approach is conceptually related to reverse correlationand shows participants only small regions of a randomly sampled face space (Figure 1). Usingthis technique, it is possible to identify statistically the extent to which specific facial featurescontribute to judgments about the faces. In our prior studies with this method [3,6,7], we askedsubjects to discriminate between two emotions, fear and happiness, because these emotionsare distinguished by particular facial features [8], and because there is evidence that theirrecognition can be differentially impaired following brain pathology [6,9]. To providecomparisons with prior results, we used the identical task here.
We contrasted three groups of participants (Table 1): parents who had a child with autism andmet criteria for the aloof component of the Broad Autism Phenotype (“BAP+”); those who had
*Address for correspondence: Joseph Piven, MD CB #3366 University of North Carolina Chapel Hill, NC [email protected]'s Disclaimer: This is a PDF file of an unedited manuscript that has been accepted for publication. As a service to our customerswe are providing this early version of the manuscript. The manuscript will undergo copyediting, typesetting, and review of the resultingproof before it is published in its final citable form. Please note that during the production process errors may be discovered which couldaffect the content, and all legal disclaimers that apply to the journal pertain.Supplemental DataOne Supplementary Figure and a Supplementary Methods description accompanies this paper.
NIH Public AccessAuthor ManuscriptCurr Biol. Author manuscript; available in PMC 2009 July 22.
Published in final edited form as:Curr Biol. 2008 July 22; 18(14): 1090–1093.
NIH
-PA Author Manuscript
NIH
-PA Author Manuscript
NIH
-PA Author Manuscript

a child with autism but were negative for the aloof component (“BAP−”); and those who hada neurotypical child that was not autistic (“Controls”). All three groups had similar meanperformance accuracy on the Bubbles Task (82.2%, 82.2%, 83.5% for Controls, BAP−, BAP+, respectively) as well as reaction times (2.0, 1.7, 1.8 sec), and very similar mean number ofbubbles (across all spatial frequency bands); moreover, since the bubble locations wererandomly and homogeneously distributed, all subjects saw similar parts of the face revealedin the trials, on average. There were no significant differences on any of these measures betweengroups (all ps>0.1 from uncorrected t-tests).
Despite the essentially identical stimuli and overall performances, the three groups differed intheir performance strategies. We calculated classification images that revealed the effectiveinformation a viewer uses to perform the task. Classification images from the Control grouplooked similar to those that have been published previously for psychiatrically andneurologically healthy participants, showing substantial use of the eye region of the face(Figure 2a). Comparisons of the classification images revealed statistically significantdifferences between the three groups (all images thresholded at P<0.001, corrected). Comparedto the Control group, both the BAP+ group (Fig. 2b) and the BAP− group (Fig. 2c) made lessuse of the eyes, an effect most notable for the right eye region. When contrasting the two BAPgroups, we found that the BAP+ group made more use of the mouth than the BAP− group (Fig.3a) whereas the BAP− group made more use of the eye region than did the BAP+ group (Fig.3b).
Overall, these findings indicate that BAP+ participants did not show the normal pattern ofdependence upon the eyes for judgements of emotions. Instead, they relied more heavily onthe mouth. The pattern in use of facial information we found here bears a striking similarity towhat we have reported previously in individuals with autism [3] (reproduced in Figure 3c,d).Direct difference classification images between the present data and our previously publisheddata from autism subjects [3] showed that both BAP groups still used the eyes more than didautism subjects, although as expected the BAP+ less so than the BAP− group (Fig. 3e,f). Sinceour groups had different gender ratios (see Table 1 and Methods), we also repeated all theabove analyses solely on male participants; the overall pattern of results in the classificationimages remained significant, verifying that the group differences in the use of facialinformation that we report were not driven by different gender ratios between the groups (seeSupplementary Figure 1).
To provide additional quantification to the results from the classification images we calculatedand contrasted SSIM scores, which focus specifically on the relative use of information fromthe eyes or the mouth in faces (see Methods). The use of information from either the right eyeregion or the left eye region was highest in the control group, somewhat lower in the BAP−group, and lowest in the BAP+ group (right eye region SSIM: 0.24, 0.22, 0.20; left eye regionSSIM: 0.27, 0.26, 0.24), consistent with what would be expected from the classification images.Also consistent with the classification images was the SSIM from the mouth, which was lowestin the controls and higher in the two BAP groups (0.29, 0.33, 0.33) (Figure 4). By contrast, theSSIM values for the whole face or the nose did not differ between groups (0.50, 0.49, 0.49;and 0.46, 0.46, 0.46, respectively). It is intriguing to note the consistent rank-order of SSIMscores for the left and right eye regions seen in Figure 4 as one goes from Controls, to BAP−parents, to BAP+ parents. Such a pattern is consistent with the idea that there is a continuumof genetic liability for autism, expressed in non-autistic relatives in ways that are milder butqualitatively similar to those seen in autism.
To produce a summary measure that captured the pattern apparent in the classification images,we took the maximum of the SSIM for the two eye regions, and divided it by the SSIM for themouth region. We found statistically significant differences on this summary measure: the
Adolphs et al. Page 2
Curr Biol. Author manuscript; available in PMC 2009 July 22.
NIH
-PA Author Manuscript
NIH
-PA Author Manuscript
NIH
-PA Author Manuscript
control group had the highest value, followed by the aloof-negative group, followed by thealoof-positive group. Non-parametric contrasts confirmed the reliability of this finding:Controls differed from aloof-positive participants (P<0.05, one-tailed Mann-Whitney U test,corrected for multiple comparisons) and from aloof-negative participants (P<0.05) (the contrastbetween aloof-negative and aloof-positive groups failed to achieve statistical significance).
The present study complements findings in siblings of autistic infants, which have indicateddisproportionate gaze onto the mouth when interacting with people, even in the absence of anylater development of autism [10] . Eye tracking studies of adolescents who had autistic siblingshave found reduced eye fixation compared to controls, and both the autistic individuals andtheir non-autistic siblings had abnormally reduced amygdala volumes [11]. Possible pathologyof the amygdala has been one among several hypotheses for social dysfunction in autism[12-14], although its precise role remains debated [15]. We have previously reported thatneurological subjects with focal amygdala lesions fail to make use of the eye region of faces,showing classification images on the same Bubbles Task that are notable for an absence of theeyes [16]. However, while subjects with amygdala lesions fail to make normal use of the eyes,they do not appear to make increased used of the mouth. The present findings in parents ofautistic children, as well as the sibling studies noted above [10,11] and findings in individualswith autism [3,7,14,17-21], are consistent with the hypothesis that there is active avoidance ofthe eyes in autism, but our findings also fit the hypothesis that there is reduced attraction to theeyes and/or increased attraction to the mouth. Of course, these hypotheses are not mutuallyexclusive; additional studies will be required to determine their relative importance.
This is the first study to quantify a specific cognitive endophenotype defining a distinct faceprocessing style in the parents of individuals with autism. We found a pattern of face processing(increased use of the mouth and diminished use of the eyes) similar to that seen in autisticindividuals. Our finding emerged from a difficult and sensitive task, and it will be importantto extend this also to whole faces in the real world, an issue that could be probed further withmethods such as eyetracking. The face processing style we found appears to segregate with aspecific component of the Broad Autism Phenotype, aloof personality; further studies withlarger samples will be needed to explore possible correlates with other dimensions of the BAP,such as rigid personality. Taken together, the findings provide further support for a BroadAutism Phenotype and suggest avenues for isolating the genes that influence social behaviorin autism.
Experimental ProceduresParticipants
All participants were neurologically and psychiatrically healthy adults. Specifically, none hadany diagnosis of any autism spectrum disorder, including Asperger's Syndrome or PDD-NOS,as verified by detailed clinical assessment. We initially enrolled participants in two maingroups: Fifty-three parents who had a child with a diagnosis of DSM-IV autistic disorder (andalso meeting criteria on the ADI-R and the ADOS), and twenty parents who had a typically-developing child and no first-degree relatives who had autism (“Controls”). We note that noneof our prior publications concerned the children of any of the parents in the present study (whowere younger and lower functioning than autistic subjects we have tested previously [3,7,20]). The parents who had a child with autism were subsequently assessed in detail for theBroad Autism Phenotype [22,23] as described further in the supplementary materials, andclassified on the basis of whether they had reliable evidence of ‘aloof personality’ (“BAP+”group) or whether they had no evidence of ‘aloof personality’ (“BAP−” group), using aconsensus rating (2 independent raters) from videotaped interviews of both the subject and his/her spouse. Assessing the aloof personality feature of the Broad Autism Phenotype has
Adolphs et al. Page 3
Curr Biol. Author manuscript; available in PMC 2009 July 22.
NIH
-PA Author Manuscript
NIH
-PA Author Manuscript
NIH
-PA Author Manuscript

previously been shown to be reliable [22,23], and in our study we had an inter-rater reliabilityof 85% for every component trait of the BAP.
On the basis of the above criteria, a total of sixty-two subjects entered the next phase of thestudy (42 parents of children with autism and 20 control parents) (see Table 1). There were nosignificant differences in age or IQ between any groups (Ps > 0.2, t-test for unequal variances).Gender ratios differed significantly between the three groups (Chi-square (2) = 10.9, P<0.005)and between the BAP+ and BAP− group (Fisher's exact test, P=0.0014), making gender animportant factor to explore in future studies with larger sample sizes. Groups did not differwith respect to distribution of race, years of education, or socioeconomic status. All participantshad normal or corrected-to-normal vision, and performed in the normal range on tasks of basicvisual discrimination (the Benton Line Orientation and Benton Facial Recognition tasks; therewere no group differences on these tasks). All subjects had given informed consent as approvedby the Institutional Review Boards at the California Institute of Technology and the Universityof North Carolina.
Stimuli and TaskParticipants were tested one at a time. Stimuli were 4 cropped (256 × 256 pixel) facialexpressions of emotion selected from Paul Ekman's “Pictures of Facial Affect” [24], each ofa different posing participant, and balanced for gender and facial expression (2 fearful, 2happy), spatially normalized to align their features and with similar power across all spatialfrequencies. The stimuli were randomly filtered using the “bubbles” method [4] (see Figure1), and shown on a 19-inch flat-screen monitor with an eye-to-screen distance of ca. 24 inches.Participants were instructed to respond as quickly as possible with a button press to categorizethe stimulus as “happy” or “afraid”, and to guess if they could not make up their mind. Theytook breaks as needed when a periodic “pause” screen came up, and indicated that they wereready to proceed with the experiment by pushing another “go” button. A given trial lasted thetime it took participants to decide whether the face showed fear or happiness, for a maximaldecision time of 10 seconds following image onset. All participants completed 512 trials.
“Bubbles” faces showed randomly revealed regions of an underlying whole face, as previouslydescribed [3,4]. Briefly, on each trial, a randomly selected Ekman face image was firstdecomposed into spatial frequencies and filtered with a number of Gaussian filters (“bubbles”)whose centers were randomly distributed across the image. The number of bubbles wasadjusted for each participant on a trial-by-trial basis in order to maintain a relatively stableperformance accuracy around 80% throughout the experiment; all participants required asimilar mean number of bubbles to reach this performance criterion. We began the experimentwith trials in which a relatively large number of bubbles was used, making the first few trialseasy and encouraging normal face processing. Note that bubbles were allowed to overlap,increasing the amount of the face revealed beyond the size of a single bubble.
AnalysisData from the Bubbles Task were analyzed as previously described [4,25] with somemodification [3]. Analyses determined which regions of the face associated with correctemotion discrimination by summing the trial-specific bubbles masks across all correct trialsand across all incorrect trials, yielding a “correct” and an “incorrect” bubbles mask. We thensubtracted, for each spatial frequency level, the normalized incorrect from the normalizedcorrect mask, resulting in a difference mask. In order to select regions of statistically significantdifference for the difference mask, we converted all pixel values into Z-scores relative to thatmean and standard deviation, and then subjected this Z-scored classification image to clustertests, setting a threshold t = 2.5 and a significance P = 0.001. This resulted in a diagnostic
Adolphs et al. Page 4
Curr Biol. Author manuscript; available in PMC 2009 July 22.
NIH
-PA Author Manuscript
NIH
-PA Author Manuscript
NIH
-PA Author Manuscript

image, showing which features of the face a participant used significantly more, on average,during the behavioral task.
Further quantification of individual participants' reliance on the eyes and mouthIn addition to the group analyses described above, we sought to quantify each individual'sreliance on the eyes and mouth during emotion judgment. We estimated the effective strengthof the appearance of each region of interest (i.e., eyes and mouth) in an individual's diagnosticimage, using a metric known as the Structural SIMilarity (SSIM) index [26], a quantitativeestimate of the similarity between two images that corresponds closely to similarity judgmentsby human observers. SSIM values were calculated between each individual's diagnostic imageand the corresponding base image, for each specified region on the face.
Supplementary MaterialRefer to Web version on PubMed Central for supplementary material.
Acknowledgements
The authors thank the families who participated in our study. The work was supported in part by grants from NIMHto J.P. (grants U54 MH66418 and R01MH077843), and from the Simons Foundation to R.A.
References1. Kanner L. Autistic disturbances of affective contact. Nervous Child 1943;2:217–250.2. Gupta AR, State MW. Recent advances in the genetics of autism. Biol Psychiatry 2007;61:429–37.
[PubMed: 16996486]3. Spezio ML, et al. Abnormal use of facial information in high-functioning autism. J Autism Dev Disord
2007;37:929–39. [PubMed: 17006775]4. Gosselin F, Schyns PG. Bubbles: a technique to reveal the use of information in recognition tasks.
Vision Res 2001;41:2261–71. [PubMed: 11448718]5. Losh M, Piven J. Social-cognition and the broad autism phenotype: identifying genetically meaningful
phenotypes. J Child Psychol Psychiatry 2007;48:105–12. [PubMed: 17244276]6. Adolphs R, et al. A mechanism for impaired fear recognition after amygdala damage. Nature
2005;433:68–72. [PubMed: 15635411]7. Spezio ML, et al. Analysis of face gaze in autism using “Bubbles”. Neuropsychologia 2007;45:144–
51. [PubMed: 16824559]8. Smith ML, et al. Transmitting and decoding facial expressions. Psychological Science 2005;16:184–
189. [PubMed: 15733197]9. Adolphs R. Recognizing emotion from facial expressions: psychological and neurological
mechanisms. Behavioral and Cognitive Neuroscience Reviews 2002;1:21–61. [PubMed: 17715585]10. Merin N, et al. Visual fixation patterns during reciprocal social interaction distinguish a subgroup fo
6-month-old infants at-risk for autism from comparison infants. J Autism Dev Disord 2007;37:108–121. [PubMed: 17191096]
11. Dalton KM, et al. Gaze-fixation, brain activation, and amygdala volume in unaffected siblings ofindividuals with autism. Biological Psychiatry 2007;61:512–520. [PubMed: 17069771]
12. Baron-Cohen S, et al. The amygdala theory of autism. Neuroscience and Biobehavioral Reviews2000;24:355–364. [PubMed: 10781695]
13. Bauman M, Kemper TL. Histoanatomic observations of the brain in early infantile autism. Neurology1985;35:866–874. [PubMed: 4000488]
14. Nacewicz BM, et al. Amygdala volume and nonverbal social impairment in adolescent and adultmales with autism. Arch Gen Psychiatry 2006;63:1417–1428. [PubMed: 17146016]
15. Amaral DG, Bauman MD, Schumann CM. The amygdala and autism: implications from non-humanprimate studies. Genes, Brain and Behavior 2003;2:295–302.
Adolphs et al. Page 5
Curr Biol. Author manuscript; available in PMC 2009 July 22.
NIH
-PA Author Manuscript
NIH
-PA Author Manuscript
NIH
-PA Author Manuscript

16. Adolphs R, et al. A mechanism for impaired fear recognition after amygdala damage. Nature2005;433:68–72. [PubMed: 15635411]
17. Pelphrey KA, et al. Visual scanning of faces in autism. Journal of Autism and DevelopmentalDisorders 2002;32:249–261. [PubMed: 12199131]
18. Klin A, et al. Visual fixation patterns during viewing of naturalistic social situations as predictors ofsocial competence in individuals with autism. Arch Gen Psychiatry 2002;59:809–16. [PubMed:12215080]
19. Dalton KM, et al. Gaze fixation and the neural circuitry of face processing in autism. NatureNeuroscience 2005;8:519–526.
20. Neuman D, et al. Looking you in the mouth: abnormal gaze in autism resulting from impaired top-down modulation of visual attention. Social Cognitive and Affective Neuroscience 2006;1:194–202.
21. Kylliainen A, Hietanen JK. Skin conductance responses to another person's gaze in children withautism. Journal of Autism and Developmental Disorders 2006;36:517–525. [PubMed: 16555137]
22. Piven J, et al. Broader autism phenotype: evidence from a family history study of multiple-incidenceautism families. Am J Psychiatry 1997;154:185–90. [PubMed: 9016266]
23. Piven J, Landa R, Santangelo S, Jacobi D, Childress D. Personality and language characteristics inparents from multiple-incidence autism families. American Journal of Medical Genetics1997;74:398–411. [PubMed: 9259376]
24. Ekman, P.; Friesen, W. Pictures of facial affect. Consulting Psychologists Press; Palo Alto, CA: 1976.25. Schyns PG, Bonnar L, Gosselin F. Show me the features! Understanding recognition from the use of
visual information. Psychological Science 13:402–409.26. Wang Z, et al. Image quality assessment: from error visibility to structural similarity. IEEE
Transactions on Image Processing 2004;13:600–612. [PubMed: 15376593]
Adolphs et al. Page 6
Curr Biol. Author manuscript; available in PMC 2009 July 22.
NIH
-PA Author Manuscript
NIH
-PA Author Manuscript
NIH
-PA Author Manuscript

Figure 1.Construction of the stimuli. On the far left is one of the base images we began with (anexpression of happiness or of fear from the Pictures of Facial Affect [24]). The base face wasdecomposed and randomly filtered so as to reveal only small parts of it. The amount of the facerevealed was adjusted interactively so as to keep performance accuracy relatively stablethroughout the experiment, except for the first few trials. A sample stimulus image is shownon the far lower right.
Adolphs et al. Page 7
Curr Biol. Author manuscript; available in PMC 2009 July 22.
NIH
-PA Author Manuscript
NIH
-PA Author Manuscript
NIH
-PA Author Manuscript

Figure 2.Classification images showing the use of facial information. A: Controls (parents of a childwithout autism). B: Difference between Controls and BAP+ (the image shows the region ofthe face used more by controls). C: Difference between Controls and BAP−. All classificationimages are based on the accuracy with which subjects performed the task, and are statisticallythresholded at P<0.001 (corrected). The regions of the face that are visible in the images thuscorrelate with performance accuracy at P<0.001.
Adolphs et al. Page 8
Curr Biol. Author manuscript; available in PMC 2009 July 22.
NIH
-PA Author Manuscript
NIH
-PA Author Manuscript
NIH
-PA Author Manuscript
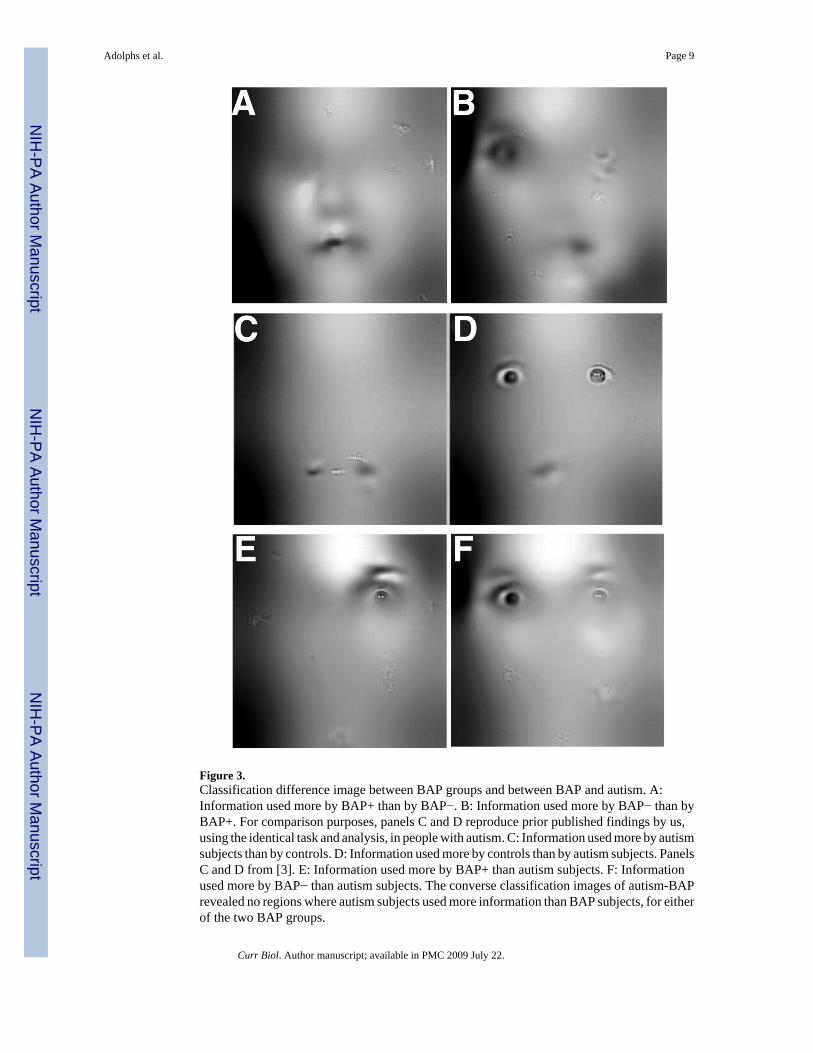
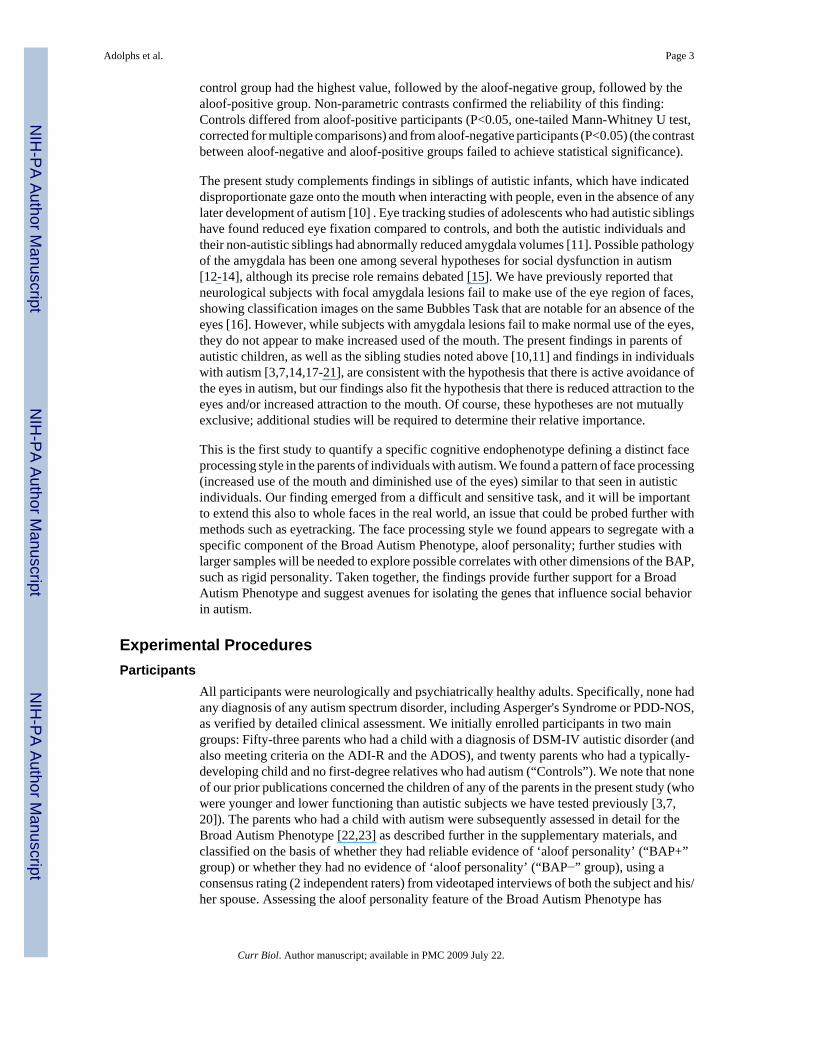
Figure 3.Classification difference image between BAP groups and between BAP and autism. A:Information used more by BAP+ than by BAP−. B: Information used more by BAP− than byBAP+. For comparison purposes, panels C and D reproduce prior published findings by us,using the identical task and analysis, in people with autism. C: Information used more by autismsubjects than by controls. D: Information used more by controls than by autism subjects. PanelsC and D from [3]. E: Information used more by BAP+ than autism subjects. F: Informationused more by BAP− than autism subjects. The converse classification images of autism-BAPrevealed no regions where autism subjects used more information than BAP subjects, for eitherof the two BAP groups.
Adolphs et al. Page 9
Curr Biol. Author manuscript; available in PMC 2009 July 22.
NIH
-PA Author Manuscript
NIH
-PA Author Manuscript
NIH
-PA Author Manuscript

Figure 4.Numerical quantification of the use of facial information. The three bar graph categories plotthe use of information from the right eye, left eye, and mouth region of the face. The y-axisplots the structural similarity metric (SSIM; see Methods), a measure of the degree to whichinformation was used from a specific region of interest on the face. White bars: Controls. Lightgray bars: BAP−. Dark Gray bars: BAP+. Means and SEM are shown for each subject group.
Adolphs et al. Page 10
Curr Biol. Author manuscript; available in PMC 2009 July 22.
NIH
-PA Author Manuscript
NIH
-PA Author Manuscript
NIH
-PA Author Manuscript

NIH
-PA Author Manuscript
NIH
-PA Author Manuscript
NIH
-PA Author Manuscript
Adolphs et al. Page 11
TABLE 1Means and S.D. of the participant groups for age, gender, and full-scale IQ.
Age Gender IQ NBAP+ 47±8 12M/3F 122±12 15BAP− 48±7 7M/20F 120±7 27Controls 44±7 12M/8F 117±9 20
Curr Biol. Author manuscript; available in PMC 2009 July 22.