
Social intelligence in the normal and autistic brain: an fMRI study
34
1 This paper appeared in the European J. of Neurosci., 1999, 11, 1891-1898. Social intelligence in the normal and autistic brain: an fMRI study Simon Baron-Cohen*, Howard A. Ring+, Sally Wheelwright*, Edward T. Bullmore++, Mick J. Brammer++, Andrew Simmons**, and Steve C.R. Williams**. *Departments of Experimental Psychology and Psychiatry, University of Cambridge, Downing St., Cambridge, CB2 3EB, UK. +Academic Department of Psychological Medicine, St. Bartholomew’s and the Royal London School of Medicine, Whitechapel, London, E1 1BB, UK. ** Neuroimaging Research, Department of Clinical Neuroscience, and ++ Department of Biostatistics and Computing, Institute of Psychiatry, University of London, Denmark Hill, London, SE5 8AF, UK.
Transcript of Social intelligence in the normal and autistic brain: an fMRI study
1
This paper appeared in the European J. of Neurosci., 1999, 11, 1891-1898.
Social intelligence in the normal and
autistic brain: an fMRI study
Simon Baron-Cohen*, Howard A. Ring+, Sally Wheelwright*, Edward T.
Bullmore++, Mick J. Brammer++, Andrew Simmons**, and Steve C.R. Williams**.
*Departments of Experimental Psychology and Psychiatry,
University of Cambridge, Downing St., Cambridge, CB2 3EB, UK.
+Academic Department of Psychological Medicine,
St. Bartholomew’s and the Royal London School of Medicine,
Whitechapel, London, E1 1BB, UK.
** Neuroimaging Research, Department of Clinical Neuroscience, and
++ Department of Biostatistics and Computing, Institute of Psychiatry,
University of London, Denmark Hill, London, SE5 8AF, UK.
2
Acknowledgments: This work was funded by a grant to SBC, HR, and SCW from the Wellcome Trust, and by a grant to the first author from the Gatsby Foundation. EB is also supported by the Wellcome Trust. We are grateful to Barry Everitt for comments on the first draft of this paper, and Chris Andrew for technical support.Correspondence and requests for materials to SBC (email: [email protected]).
3
Abstract
There is increasing support for the existence of “social intelligence”(Humphrey,
1984), independent of general intelligence. Brothers (Brothers, 1990) proposed a
network of neural regions that comprise the “social brain”: the orbito-frontal cortex
(OFC), superior temporal gyrus (STG) and amygdala. We tested Brothers’ theory by
examining both normal subjects as well as patients with high-functioning autism or
Asperger Syndrome (AS), who are well known to have deficits in social intelligence,
and perhaps deficits in amygdala function (Bauman & Kemper, 1988).We used a test
of judging from the expressions of another person’s eyes what that other person might
be thinking or feeling. Using functional magnetic resonance imaging (fMRI) we
confirmed Brothers’ prediction that the STG and amygdala show increased activation
when using social intelligence. Some areas of prefrontal cortex also showed
activation. In contrast, patients with autism or AS activated the fronto-temporal
regions but not the amygdala when making mentalistic inferences from the eyes.
These results provide support for the social brain theory of normal function, and the
amygdala theory of autism.
4
Social intelligence encompasses our abilities to interpret others’ behaviour in terms of
mental states (thoughts, intentions, desires, and beliefs), to interact both in complex
social groups and in close relationships, to empathize with others’ states of mind, and
to predict how others will feel, think, and behave. The idea that social intelligence
might be independent of, or dissociable from, general intelligence comes from
several sources: First, individuals exist who are capable of considerable
understanding of the non-social world (e.g., physics, maths, engineering) yet who
readily admit to finding the social world confusing (Baron-Cohen, Wheelwright,
Stone & Rutherford, submitted; Sacks, 1994). The opposite type of individual also
exists: people who have no difficulty interacting with the social world but who find
non-social problem-solving confusing (Karmiloff-Smith, Grant, Bellugi & Baron-
Cohen, 1995). Secondly, certain kinds of brain damage can cause selective
impairment in social judgment (Damasio, Tranel & Damasio, 1990) without any
necessary loss to general problem-solving ability. Loss of social judgment can co-
occur with memory and executive dysfunction, following amygdala damage (Tranel
& Hyman, 1990), but the functional double dissociation between social and non-
social intelligence implies their neural independence. Finally, many primatologists
now believe that social problem-solving was a key driving force behind the evolution
of primate intelligence, rather than tool-use or other non-social problem solving
(Whiten, 1991).
A neural basis of social intelligence was first proposed by Brothers (Brothers, 1990).
She suggested from both animal lesion studies (Kling & Brothers, 1992), single cell
recording studies (Brothers, Ring & Kling, 1990), and neurological studies (cited
above) that this involves the amygdala, OFC, and STG. Together, she postulated these
5
comprise the “social brain”. Damage to the amygdala impairs judgment of emotion
(Calder et al., 1996), damage to the OFC impairs judgement of what is socially
appropriate (Eslinger & Damasio, 1985), and damage to the STG impairs face-
perception (Campbell, Heywood, Cowey, Regard & Landis, 1990). Single cell
recording studies in non-human primates also confirm the role of the STG in
detection of gaze (Perrett et al., 1985). Recent PET and SPECT studies of “theory of
mind” (or the ability to impute mental states) also implicate areas of prefrontal cortex,
specifically the medial frontal cortex (MFC) (Fletcher et al., 1995; Goel, Grafman,
Sadato & Hallett, 1995) and the OFC (Baron-Cohen et al., 1994).
The present fMRI study had 2 main aims: (1) To test Brothers’ social brain theory
that these neural regions, identified independently from several different studies and
methods of investigation, are jointly activated in a group of normal subjects
performing a novel social intelligence test. (2) To test the validity of this neural model
of social intelligence by comparing normal cerebral blood oxygenation changes
induced by performance of this task to hypothetically abnormal changes in a group of
patients with high-functioning autism or Asperger Syndrome, known to have social
impairment (Baron-Cohen & Ring, 1994). In particular, we predicted abnormal
amygdala activation in the autism1 group, on the basis of 5 lines of evidence: (a) a
neuroanatomical study of autism at post-mortem found microscopic pathology (in the
form of increased cell density) in the amygdala, in the presence of normal amygdala
volume (Bauman & Kemper, 1994; Rapin & Katzman, 1998); (b) the only animal
model of autism involves ablation of the amygdala (in rhesus monkeys) (Bachevalier,
1 For brevity here, we refer to the autism group, but remind the reader that this includes patients with high functioning autism.
6
1991). Whilst there is some dispute as to whether one can have an animal model
of autism when the syndrome involves deficits in higher order cognition, this is at
least consistent with the amygdala theory; (c) patients with amygdala lesions show
impairments in social judgement (Adolphs, Tranel, Damasio & Damasio, 1994;
Young, Hellawell, De Wal & Johnson, 1996)[(d) using SPECT, patients with autism
spectrum conditions show significant reductions in temporal lobe blood flow,
regardless of whether they have temporal lobe epilepsy (Gillberg, Bjure, Uvebrant,
Vestergren & Gillberg, 1993); and (e) in cases of tuberous sclerosis, autistic
comorbidity is determined by hamartomata in the temporal lobe (Bolton & Griffiths,
1997). For all these reasons, a basic impairment of amygdala function in autism
seems very plausible2.
Subjects
6 subjects with autism (4 m, 2 f) were matched for mean age, handedness, IQ,
socioeconomic status, and educational level, with 12 subjects in the normal group
(6m, 6f). IQ was assessed with the full Wechsler Adult Intelligence Scale (WAIS-R).
Subjects were only included if their IQ was in the normal range (i.e., above 85 both in
terms of full-scale IQ, and in terms of performance and verbal IQ). These variables
are shown in Table 1. There were no significant differences on any of these
dimensions. Individuals in the clinical group all had a diagnosis of autism or Asperger
Syndrome, using DSM-IV (APA, 1994) and ICD-10 (1994) criteria.
2 We emphasize the amygdala theory of autism, and it might be thought that this is too narrow, since some of the lines of evidence cited here implicate temporal lobe structures more widely, which include the amygdala but also include other adjacent mesiotemporal areas. To the extent that the results reported later support the amygdala theory, it remains for future work to establish the specificity of this finding.
7
insert Table 1 here
Experimental Design
We used a blocked periodic ABA... design. Each epoch (A or B) was presented for
30 secs, and there were 5 cycles of AB alternation in total. Images were acquired
from each subject during visual presentation of two tasks, both of which involved
deriving socially relevant information from facial stimuli. This periodically designed
(ABA..) experiment was expected to induce periodic MR signal change with signal
maximum during task A in brain regions relatively specialized for gender recognition
from facial stimuli; and periodic MR signal change with signal maximum during task
B in brain regions relatively specialized for mental state recognition from facial
stimuli. The response involved a forced choice between the two words offered
(pressing one of two buttons with the right hand to select the right or left word).
Correct words were counterbalanced to left and right side. Since both tasks were
social, either may have resulted in anomalous activation in the autism group,
though we predicted abnormalities would only arise in Task B.
Method
Task A: Subjects were visually presented with a series of photographs of eyes and
asked to indicate by right handed button press whether each stimulus was a man or a
woman. In this first task (A: gender recognition), instructions to subjects were to
8
decide for each stimulus which of two simultaneously presented words (“male” or
“female”) best described the face. Each stimulus was presented for 5 secs and was
followed by a 0.75 sec interval in which the screen was blank. Stimuli were drawn
from 30 faces of women or men. Stimuli were presented 3.5m from the subject,
subtending visual angles of 10 degrees horizontally and 8 degrees vertically.
Task B: Subjects were presented with exactly the same stimuli but were asked to
indicate by button press which of two simultaneously presented words best described
the mental state of the photographed person. Thus, the key difference between the two
tasks was the type of judgement the subject had to make when viewing the eyes3.
Subjects were presented with an example of the stimuli before scanning. For this
second task (B: theory of mind), instructions to subjects was to decide for each
stimulus which of two simultaneously presented words best described what the
person in the photograph was feeling or thinking. Task B is an “advanced” theory of
mind test, in that it is used with adults.
Adults with high-functioning autism or AS, with intelligence in the normal range,
show deficits on this task (Baron-Cohen, Jolliffe, Mortimore & Robertson, 1997), as
do parents of children with autism/AS (Baron-Cohen & Hammer, 1997). Children
with William’s Syndrome are not impaired on this test, despite their general
retardation (Tager-Flusberg, Boshart & Baron-Cohen, 1998). Examples of the eyes
used in the experimental condition, together with the forced choice words that
3 A secondary difference between tasks A and B is that in A the same words (male, female) always appear, whilst in B different words (describing a range of mental states) appear. This is inevitable if one uses the same pictorial stimuli in both tasks, whilst varying the social judgement required. However, we cannot see any reason why this factor should explain the results.
9
appeared underneath each face, are shown in Figure 1. Finally, as a control pre-test
outside the scanner, subjects were given the opportunity to pick out any words
in a list of mental state words that would appear in Task B that they did not
recognize or understand, in which case a glossary definition was provided by the
experimenter. Neither group made use of this, reflecting that the words used
were relatively common, and that the adult subjects in both groups were of
normal intelligence.
insert Figure 1 here
Image Acquisition and Analysis
Single shot gradient echo, echoplanar images were acquired using a 1.5 Tesla GE
Signa system (General Electric, Milwaukee, WI, USA) fitted with Advanced NMR
hardware and software (ANMR, Woburn, MA, USA) using a standard head coil. 100
T2*-weighted images depicting BOLD contrast (Ogawa, Lee, Kay & Tank, 1990)
were acquired over 5 min at each of 14 near-axial non-contiguous 7-mm-thick planes
parallel to the intercommissural (AC-PC) line, providing whole-brain coverage: TE,
40ms; TR, 3s; in-plane resolution, 3mm; interslice gap, 0.7mm. At the same session,
an inversion recovery EPI dataset was also acquired from 43 near-axial 3-mm-thick
slices parallel to the AC-PC line: TE, 80ms; TI, 180ms; TR, 16s; in plane resolution
1.5mm; number of signal averages = 8.
Periodic change in T2*-weighted signal intensity at the (fundamental) experimentally
determined frequency of alternation between A and B conditions (= 1/60 Hz) was
10
modelled by the sum of a sine wave and cosine wave at that frequency. The
amplitudes of the sine and cosine waves, γ and δ respectively, were estimated by
pseudogeneralized least-squares fit to the movement-corrected time fMRI series at
each voxel. The sum of squared amplitudes, γ2 and δ2, divided by its standard error,
provided a standardised estimate of experimentally determined power, the
fundamental power quotient (FPQ) (Bullmore et al., 1996). The sign of γ indicated the
phase of periodic signal change with respect to the input function. Maps were
constructed to represent FPQ and γ at each voxel of each observed dataset. Each
observed time series was randomly permuted 10 times, and FPQ estimated as above
in each randomized time series, to generate 10 randomized parametric maps of FPQ
for each subject in each anatomical plane.
To construct generic brain activation maps, observed and randomized FPQ maps
derived from each subject were transformed into the standard space of Talairach and
Tournoux and smoothed by a 2D Gaussian filter (SD = 4.5mm) (Talairach &
Tournoux, 1988). The median value of FPQ at each intracerebral voxel in standard
space was then tested against a critical value of the randomisation distribution for
median FPQ ascertained from the randomised FPQ maps. For a one-tailed test of size
α = 0.0008, the critical value was the 100 x (1-α)th percentile value of the
randomisation distribution. Maps of γ observed in each individual were likewise
transformed into standard space and smoothed. The median value of γ was computed
for each generically activated voxel. If median γ > 0, that voxel was considered to be
generically activated by the gender recognition task (A); if median γ < 0, that voxel
was considered to be generically activated by the theory of mind task (B).
11
To estimate the difference between control and autism groups in the mean power of
response to task B, we fitted the following ANOVA model at each of 1,658 voxels
generically activated by the ToM task in one or both of the groups:
FPQi, j = µ + β1 Groupj +ε i, j .
Here, FPQ (i, j) denotes the standardized power of response at the ith individual in the
jth group. Group denotes a factor coding the main effects of diagnostic status. The
null hypothesis of zero between-group difference in mean FPQ was tested by
comparing the observed coefficient β1 to critical values of its non-parametrically
ascertained null distribution. To do this, the elements of Group were randomly
permuted 10 times at each voxel; β1 was estimated at each voxel after each
permutation; and these estimates were pooled over all intracerebral voxels in standard
space to sample the randomisation distribution of β1(Brammer et al., 1997). Critical
values for a two-tailed test of size α = 0.01were the 100*(α/2)th and 100*(1-α/2)th
percentiles of this distribution (Edgington, 1980). For this size of test (α=0.01) and
search volume (1,658 voxels), we expect no more than 16 voxels to be Type I (false
positive) errors4.
An analysis of variance in this context assumes that it is meaningful to
characterise pathological differences in functional activation in terms of
a quantitative difference in mean power of response at each voxel. This
4 In fact, 51 voxels were found to have significantly greater power of response to the theory of mind task in controls compared to autistics; and 7 voxels had significantly greater power of response in autistics compared to controls.
12
assumption has been widely adopted in previous functional imaging studies of
neuropsychiatric disorder, most notably it is central to
characterisation of schizophrenic abnormalities of functional anatomy in
terms of hypofrontality (Weinberger & Berman, 1998). There is also evidence
from previous imaging studies of normal subjects that the magnitude of
functional response in a given region may be proportional to the cognitive
processing load imposed by experimental design (eg (Price & Friston, 1997; Price,
Moore & Frackowiak, 1996)). It therefore seems reasonable to interpret
differences in power of functional response between control and patient groups
as a proxy measure of differences in local neural processing which reflect
differences in cognitive strategy imposed by disease.
Results
Considering task performance, both the autism and normal control groups performed
both tasks significantly better than chance during scanning. The control group was
more accurate in both gender recognition (x = 86%, sd = 3.0) and theory of mind (x =
83%, sd = 7.3) than the autism group (x = 82%, sd = 7.5 and x = 74%, sd = 1.8
correct, respectively). For both tasks, there was a significant effect of group, with the
normal controls performing better than the subjects with autism or AS (analysis of
variance [ANOVA], theory of mind: F(1,16) = 6.1, p = 0.02; Gender recognition:
F(1,16) = 15.6, p = 0.001).
Functional MRI data were analysed in two stages: First, generic brain activation maps
were constructed separately for the control and autism groups. These maps identified
13
voxels demonstrating significant power of periodic signal change over all subjects in
each group; they also represented differences between generically activated voxels in
terms of phase of response to the experimental input function. Thus it was possible to
determine which voxels were activated in each group by each of the two tasks.
Second, we used ANOVA to identify voxels that demonstrated a significant
difference between groups in mean power of response to each task (see Methods).
Figure 2 shows the functional system activated by presentation of the theory of mind
task in the control and autism groups. This system can be anatomically subdivided
into two main components: (i) a set of fronto-temporal neocortical regions,
comprising left dorsolateral prefrontal cortex (DLPFC) approximately Brodmann area
(BA) 44, 45, 46; the left medial frontal cortex MFC (BA 9); supplementary motor
area (SMA) (medial BA 6); and bilateral temporo-parietal regions, including middle
and superior temporal, angular and supramarginal gyri (BA 21, 22, 39, and 40); and
(ii) a number of non-neocortical areas, including the left amygdala, the left
hippocampal gyrus (BA 27 and 30), bilateral insulae, and left striatum.
The autism group activated the frontal components less extensively than the control
group; and did not activate the amygdala at all. As shown in Table 2, the control
group demonstrated significantly greater power of response in the left amygdala, right
insula, and left inferior frontal gyrus. The autism group demonstrated significantly
greater power of response in bilateral superior temporal gyrus (STG).
insert Table 2 and Figure 2 here
14
Discussion
These results are a striking confirmation of Brothers’ theory that extracting socially
relevant information from visual stimuli is normally associated with activation of the
STG, areas of prefrontal cortex5, and the amygdala. We next discuss each of these
neural regions in turn, both in relation to normal functioning, and to autism.
Regarding the left amygdala, this area may be critically involved in identifying
mental state/ emotional information from complex visual stimuli such as the eye
region. This laterality effect is consistent with previous studies: the left amygdala
appears to be specifically activated in emotion processing (Ketter et al., 1996; Morris
et al., 1996)[but see (Breiter et al., 1996; Phillips et al., 1997)]. The autism group
appear not to perform the task using the amygdala, but instead place a greater
processing load on temporal lobe structures, specialized for verbally labelling
complex visual stimuli and processing faces and eyes. We interpret this as showing
that people with autism may be solving the task using both language and facial
memory functions, perhaps in compensation for an amygdala abnormality. Although
it is known that the amygdala plays a role in the recognition of fear (Adolphs et al.,
1994; Calder et al., 1996; Scott et al., 1997; Young et al., 1996), here we have also
shown that it is involved in inference of a broader range of mental states, from the
face and especially the eyes. We consider it unlikely that these results simply reflect
emotion-processing or arousal, as the stimuli in the present study involve judging
expressions of a broad range of mental states, many of which are not primarily
5 We have no strong evidence for OFC activation in these data. This may reflect magnetic susceptibility artefacts induced by the proximity of frontal bone and air spaces.
15
emotional (e.g., interest, reflective, ignoring). Furthermore, whereas previous studies
showing amygdala activation have involved passive perception of powerful emotional
stimuli, our task involved an active judgement of a different kind: attribution of a
mental state. This suggests that mental state concepts are processed in this region,
both when the task involves inferring these from eyes, or other animate actions
(Bonda, Petrides, Ostry & Evans, 1996).
Regarding the left prefrontal regions, these may subserve the verbal working memory/
central executive function (D'Esposito et al., 1995; Frith, Friston, Liddle &
Frackowiak, 1991; Salmon et al., 1996), entailed in matching words whilst observing
the eyes. A previous study of autism suggested attenuated activation of MFC (Happe
et al., 1996). In the present study we also found MFC was activated less extensively
by the autism group, but this was not statistically significant.
Regarding the temporal regions, these may be involved in the processing of words
and serve as a word store (Wise et al., 1991), and in the processing of eyes (Perrett et
al., 1990). We consider that the STG activation seen in the theory of mind condition
here is likely to reflect the processing of eyes and faces since it involved bilateral
activity, whereas the processing of words would be more likely to have only activated
STG lateralized to the left side.
The fundamental premise of this study is that social intelligence is modular or
dissociable from general intelligence. More specifically, we have assumed that it
will be possible to design a periodic contrast between two experimental
conditions which differ exclusively in terms of social cognition, and that the
16
experimental response to this design will be specific to elements of the "social
brain". The validity of this set of assumptions is supported by the
correspondence between our results in normal subjects and a prior model of the
social brain (Brothers & Ring, 1992). But it may be instructive also to note some
limitations and ambiguities inherent in our design.
The two contrasting conditions, although closely matched for stimulus frequency
and motor response, may not have differed exclusively in terms of social
cognition. For example, subjects may have attempted to solve the experimental
problem of mental state assignment by retrieval from long term memory, or by
inducing in themselves the emotional states represented by the stimuli. The
theory of mind task involved presentation of novel word pairs with each set of
visual stimuli, whereas the same pair of short, high frequency words ("male"
and "female") were repeatedly presented with each set of stimuli during the
gender assignment task. It is thus possible that the experimental contrast could
have caused periodic signal change in areas specialised for novelty detection, or
differential engagement of languagesystems. Finally, the simultaneous
presentation of visual and verbal stimuli, although necessary so that response
during scanning could be monitored by forced choice button press, allows an
important ambiguity: Do subjects match the eyes to associations or memories
primarily induced by the words, or vice versa? In short, the design does not
allow us to implicate a particular modality of stimulation (visual or verbal) in
experimental activation of the social brain. Several of these problems are typical
of periodic or subtraction designs generally, and it will be important in future
work to consider so-called parametric experimental designs, in which a single

17
task is presented at continuously variablelevels of difficulty during fMRI data
acquisition.
Abnormalities of functional activation by patient groups have often been
attributed simply to failure of the patients to perform the task. This seems an
inadequate explanation of our findings since the patients performed both tasks
better than chance during scanning and had no difficulty in comprehending
examples of mental state adjectives presented to them before scanning. However,
a number of possible interpretations remain open. It could be that patients with
autism have a general deficit in emotional processing, rather than specifically
emotional processing to inform mental state assignation. Such a possibility is
attractive simply because it is known that the amygdala responds to fearful faces
(Breiter et al., 1996; Morris et al., 1996), and that such amygdala acitivity occurs
regardless of whether the subject are aware of the face (Whalen et al, 1998) or aware
that different facial expressions were critical to the study (Morris et al., 1996).
However, since we regard emotional processing as part of social intelligence this
interpretation is a refinement rather than a contradiction of our preferred
interpretation that autistic patients fail to activate the social brain. Furthermore,
whilst this might be part of the explanation, it cannot be sufficient, since some of the
expressions were of non-affective mental states (e.g., “reflective”).
A more problematic alternative is that the patients with autism may in fact
activate the social brain, but under both experimental conditions. This pattern of
response would not engender periodic signal change and cannot be excluded on
the basis of these data. However, even if it were true that the subjects with

18
autism promiscuously activated the social brain under both conditions, this
would still constitute interesting evidence for abnormal modularity or
modularisation (Karmiloff-Smith, 1992) of social intelligence in autism. (Here we
use the term modularity not in the strong Fodorian (Fodor, 1983) sense, but in a
weaker sense
(Baron-Cohen, 1994; Baron-Cohen, in press). Against this, however, analysis of the
individidual subject scans in each condition shows little if any evidence of amygdala
activity in the volunteers with autism, which renders the amygdala theory of autism
quite plausible.
A further alternative account of the present results might be that people with autism
have simply had less experience of the relevant mental states or attitudes being
expressed towards them. This also seems unlikely, in relation to states such as
‘sympathy’, ‘reflective’, ‘sad thought’, and ‘friendly’. These are not rare sorts of
expressions, and there is no reason to expect that others would not have shown such
attitudes towards the subjects in both groups equally. Of course, none of these
alternative explanations rules out that the subjects with autism might not understand
such concepts and expressions less well than controls, but that is precisely the
hypothesis that was tested.
Three final alternative accounts might be that eye-movements made by subjects with
autism during Task B might have differed significantly in comparison to Task A. We
cannot see why the stimuli in Tasks A and B might have provoked different patterns
of eye-movement/ visual scanning, since the stimuli were identical in both conditions.
However, this remains a small possibility since it may be that when one understands a
19
visual scene less well, that one scans it less. This should be checked in future studies.
A vague and untestable account might be that the autistic group simply expend less
‘effort’ in attempting to solve such tasks. We do not consider this further as this could
never be determined, and in any case would not necessarily be independent of a
comprehension deficit.
Future studies are also needed since a task like this could be dismantled into multiple,
simpler mental elements. First, patients with autism should be presented with the eyes
and no words, and vice versa, to establish which neural activations are due to these
two separate factors. Secondly, it will be important to attempt to activate the
amygdala in these patients, using a range of cognitive paradigms, to test if the present
results reflect a general hypofunctioning of this structure, or whether this is specific to
tasks involving inferring mental state. Converging evidence from another social
intelligence task will also be important, since the above study employs just one such
task. But the present study provides strong evidence of the role of the amygdala in
normal social intelligence, and abnormality of the amygdala in autism.
20
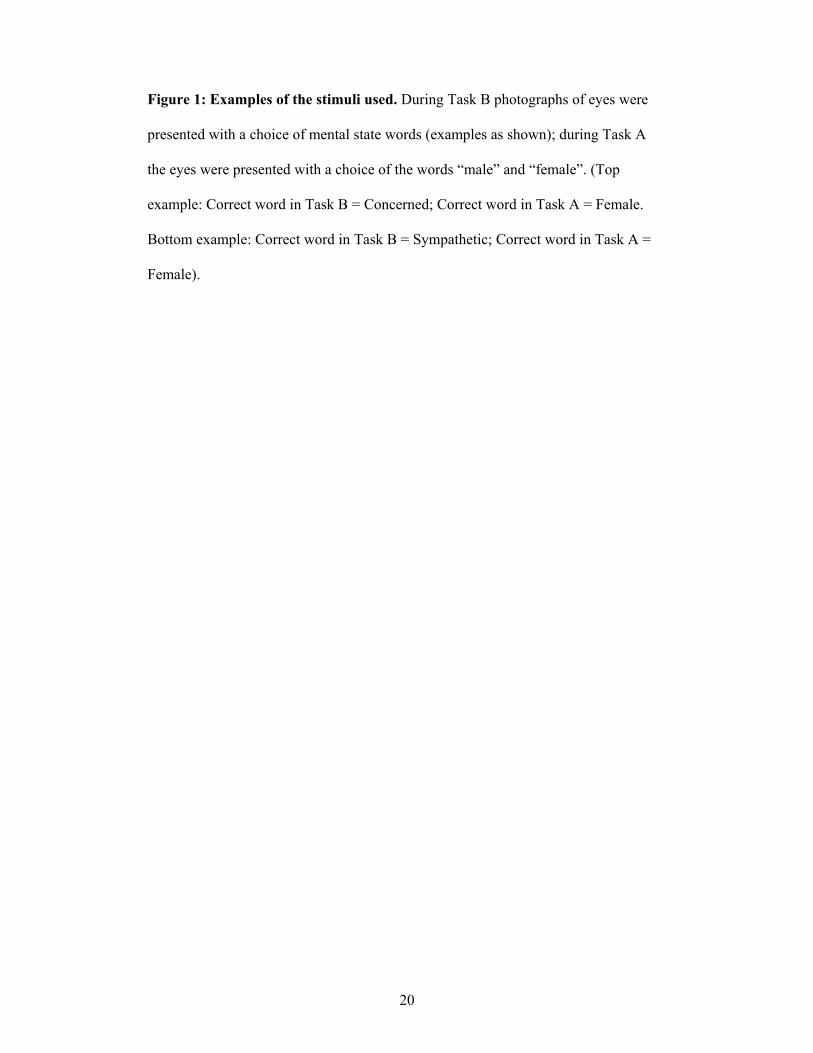
Figure 1: Examples of the stimuli used. During Task B photographs of eyes were
presented with a choice of mental state words (examples as shown); during Task A
the eyes were presented with a choice of the words “male” and “female”. (Top
example: Correct word in Task B = Concerned; Correct word in Task A = Female.
Bottom example: Correct word in Task B = Sympathetic; Correct word in Task A =
Female).
21
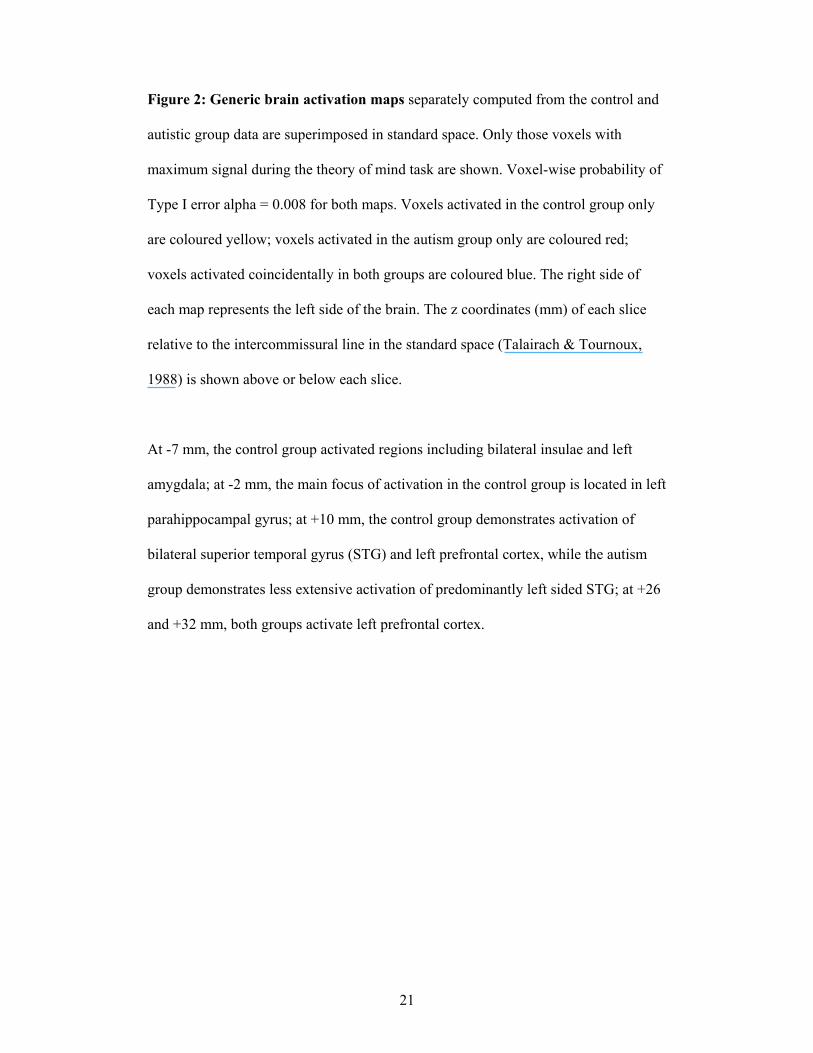
Figure 2: Generic brain activation maps separately computed from the control and
autistic group data are superimposed in standard space. Only those voxels with
maximum signal during the theory of mind task are shown. Voxel-wise probability of
Type I error alpha = 0.008 for both maps. Voxels activated in the control group only
are coloured yellow; voxels activated in the autism group only are coloured red;
voxels activated coincidentally in both groups are coloured blue. The right side of
each map represents the left side of the brain. The z coordinates (mm) of each slice
relative to the intercommissural line in the standard space (Talairach & Tournoux,
1988) is shown above or below each slice.
At -7 mm, the control group activated regions including bilateral insulae and left
amygdala; at -2 mm, the main focus of activation in the control group is located in left
parahippocampal gyrus; at +10 mm, the control group demonstrates activation of
bilateral superior temporal gyrus (STG) and left prefrontal cortex, while the autism
group demonstrates less extensive activation of predominantly left sided STG; at +26
and +32 mm, both groups activate left prefrontal cortex.
22
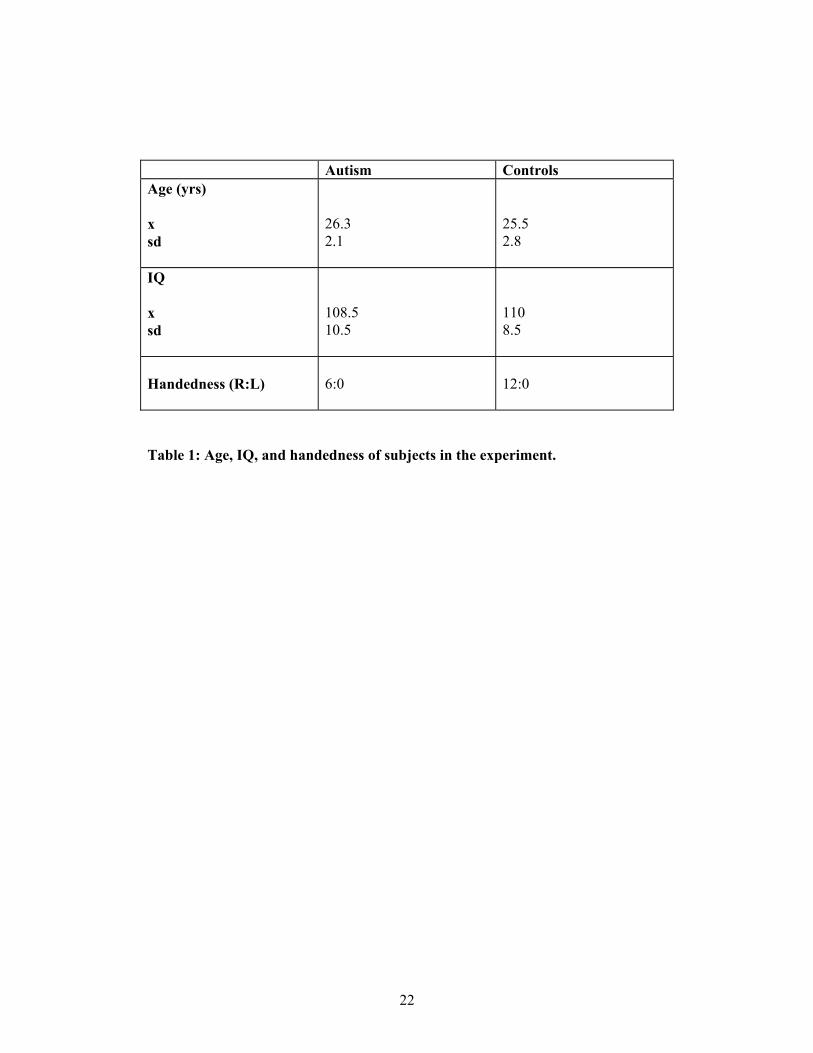
Autism Controls Age (yrs) x sd
26.3 2.1
25.5 2.8
IQ x sd
108.5 10.5
110 8.5
Handedness (R:L)
6:0
12:0
Table 1: Age, IQ, and handedness of subjects in the experiment.
23
Cerebral region
BA
Side
N
(voxels)
x
y
z
Difference
P
Superior Temporal Gyrus*
22
L
12
-55
-28
15
A > C
0.004
Superior Temporal Gyrus
22
R
8
40
-28
15
A > C
0.002
Inferior Frontal Gyrus+
44/45
L
5
-46
22
9
C > A
0.001
Insula
R
5
40
11
-7
C > A
0.001
Amygdala
L
4
-23
-11
-7
C > A
0.001
Table 2: Main brain regions differentially activated by theory of mind task between control (C) and autism (A) groups. BA = Brodmann Area. * (or Wernicke’s area) + (or Broca’s area)
24
References
Adolphs, R., Tranel, D., Damasio, H., & Damasio, A. (1994). Impaired
recognition of emotion in facial expressions following bilateral damage to the human
amygdala. Nature, 372(669-672).
APA. (1994). DSM-IV Diagnostic and Statistical Manual of Mental
Disorders, 4th Edition. Washington DC: American Psychiatric Association.
Bachevalier, J. (1991). An animal model for childhood autism: memory loss
and socioemotional disturbances following neonatal damage to the limbic system in
monkeys. In C. Tamminga & S. Schulz (Eds.), Advances in Neuropsychiatry and
Psychopharmacology: Volume 1. Schizophrenia Research, . New York: Raven Press.
Baron-Cohen, S. (1994). How to build a baby that can read minds: Cognitive
mechanisms in mindreading. Cahiers de Psychologie Cognitive/ Current Psychology
of Cognition, 13, 513-552.
Baron-Cohen, S. (in press). Does the study of autism justify minimalist innate
modularity? Learning and Individual Differences.
Baron-Cohen, S., & Hammer, J. (1997). Parents of children with Asperger
Syndrome: what is the cognitive phenotype? Journal of Cognitive Neuroscience, 9,
548-554.
Baron-Cohen, S., Jolliffe, T., Mortimore, C., & Robertson, M. (1997).
Another advanced test of theory of mind: evidence from very high functioning adults
with autism or Asperger Syndrome. Journal of Child Psychology and Psychiatry, 38,
813-822.
25
Baron-Cohen, S., & Ring, H. (1994). A model of the mindreading
system:neuropsychological and neurobiological perspectives. In P. Mitchell & C.
Lewis (Eds.), Origins of an understanding of mind, : Lawrence Erlbaum Associates.
Baron-Cohen, S., Ring, H., Moriarty, J., Shmitz, P., Costa, D., & Ell, P.
(1994). Recognition of mental state terms: a clinical study of autism, and a functional
neuroimaging study of normal adults. British Journal of Psychiatry, 165, 640-649.
Baron-Cohen, S., Wheelwright, S., Stone, V., & Rutherford, M. (submitted).
A mathematician, a physicist, and a computer scientist with Asperger Syndrome:
performance on folk psychology and folk physics test. .
Bauman, M., & Kemper, T. (1988). Limbic and cerebellar abnormalities:
consistent findings in infantile autism. Journal of Neuropathology and Experimental
Neurology, 47, 369.
Bauman, M., & Kemper, T. (1994). The Neurobiology of Autism. Baltimore:
Johns Hopkins.
Bolton, P., & Griffiths, P. (1997). Association of tuberous sclerosis of
temporal lobes with autism and atypical autism. The Lancet, 349, 392-395.
Bonda, E., Petrides, M., Ostry, D., & Evans, A. (1996). Specific involvement
of human parietal systems and the amygdala in the perception of biological motion.
Journal of Neuroscience, 15(3737-3744).
Brammer, M., Bullmore, E., Simmons, A., Williams, S., Grasby, P., Howard,
R., Woodruff, P., & Rabe-Hesketh, S. (1997). Generic brain activation mapping in
fMRI: a non-parametric approach. Magnetic Resonance Imaging, 15, 763-770.
Breiter, H. C., Etcoff, N. L., Whalem, P. J., Kennedy, W. A., Rauch, S. L.,
Buckner, R. L., Strauss, M. M., Hyman, S. E., & Rosen, B. R. (1996). Response and
26
habituation of the human amygdala during visual processing of facial expression.
Neuron, 17, 875-887.
Brothers, L. (1990). The social brain: a project for integrating primate
behaviour and neurophysiology in a new domain. Concepts in Neuroscience, 1, 27-
51.
Brothers, L., & Ring, B. (1992). A neuroethological framework for the
representation of minds. Journal of Cognitive Neuroscience, 4, 107-118.
Brothers, L., Ring, B., & Kling, A. (1990). Responses of neurons in the
macaque amygdala to complex social stimuli. Behavioural Brain Research, 41, 199-
213.
Bullmore, E., Brammer, M., Williams, S., Rabe-Hesketh, S., Janot, N., David,
A., Mellers, J., Howard, R., & Sham, P. (1996). Statistical methods of estimation and
inference for functional MR image analysis. Magnetic Resonance in Medicine, 35,
261-277.
Calder, A., J, Young, A., W, Rowland, D., Perrett, D., I, Hodges, J., R, &
Etcoff, N., L. (1996). Facial emotion recognition after bilateral amygdala damage:
Differentially severe impairment of fear. Cognitive Neuropsychology, 13, 699-745.
Campbell, R., Heywood, C., Cowey, A., Regard, M., & Landis, T. (1990).
Sensivity to eye gaze in prosopagnosic patients and monkeys with superior temporal
sulcus ablation. Neuropsychologia, 28, 1123-1142.
D'Esposito, M., Detre, J. A., Alsop, D. C., Shin, R. K., Atlas, S., & Grossman,
M. (1995). The neural basis of the central executive system of working memory.
Nature, 378, 279-281.
27
Damasio, A., Tranel, D., & Damasio, H. (1990). Individuals with sociopathic
behaviour caused by frontal lobe damage fail to respond autonomically to socially
charged stimuli. Behavioural Brain Research, 14, 81-94.
Edgington, E. S. (1980). Randomisation Tests. New York: Marcel Dekker.
Eslinger, P., & Damasio, A. (1985). Severe disturbance of higher cognition
after bilateral frontal lobe ablation: Patient EVR. Neurology, 35, 1731-41.
Fletcher, P. C., Happe, F., Frith, U., Baker, S. C., Dolan, R. J., Frackowiak, R.
S. J., & Frith, C. D. (1995). Other minds in the brain: a functional imaging study of
"theory of mind" in story comprehension. Cognition, 57, 109-128.
Fodor, J. (1983). The modularity of mind: MIT/Bradford Books.
Frith, C., Friston, K., Liddle, P., & Frackowiak, R. (1991). A PET study of
word finding. Neuropsychologia, 29, 1137-1148.
Gillberg, I., Bjure, J., Uvebrant, P., Vestergren, E., & Gillberg, C. (1993).
SPECT in 31 children and adolescents with autism and autistic like syndromes.
European Child and Adolescent Psychiatry, 2, 50-59.
Goel, V., Grafman, J., Sadato, N., & Hallett, M. (1995). Modeling other
minds. Neuroreport, 6, 1741-1746.
Happe, F., Ehlers, S., Fletcher, P., Frith, U., Johansson, M., Gillberg, C.,
Dolan, R., Frackowiak, R., & Frith, C. (1996). "Theory of mind" in the brain.
Evidence from a PET scan study of Asperger Syndrome. NeuroReport, 8, 197-201.
Humphrey, N. (1984). The social function of the intellect, N. Humphrey
Consciousness Regained, (pp. 14-28): Oxford University Press .
Karmiloff-Smith, A. (1992). Beyond modularity: MIT Press/Bradford Books.
28
Karmiloff-Smith, A., Grant, J., Bellugi, U., & Baron-Cohen, S. (1995). Is
there a social module? Language, face-processing and theory of mind in William's
Syndromeand autism, in press. Journal of Cognitive Neuroscience, 7, 196-208.
Ketter, T., Andreason, P., George, M., Lee, C., Gill, D., Parekh, P., Willis, M.,
Herscovitch, P., & Post, R. (1996). Anterior paralimbic mediation of procaine
induced emotional and psychosensory experience. Archives of General Psychiatry,
53, 59-69.
Kling, A., & Brothers, L. (1992). The Amygdala and social behavior. In J.
Aggleton (Ed.), Neurobiological aspects of emotion, memory, and mental
dysfunction, . New York: Wiley-Liss,Inc.
Morris, J., Frith, C., Perrett, D., Rowland, D., Young, A., Calder, A., & Dolan,
R. (1996). A differential neural response in the human amygdala to fearful and happy
facial expressions. Nature, 383(812-815).
Ogawa, S., Lee, T., Kay, A., & Tank, D. (1990). Brain magnetic resonance
imaging with contrast dependent blood oxygenation. Proceedings of the National
Academy of Science (USA), 3, 9868-9872.
Perrett, D., Harries, M., Mistlin, A., Hietanen, J., Benson, P., Bevan, R.,
Thomas, S., Oram, M., Ortega, J., & Brierley, K. (1990). Social signals analyzed at
the single cell level: someone is looking at me, something touched me, something
moved! International Journal of Comparative Psychology, 4, 25-55.
Perrett, D., Smith, P., Potter, D., Mistlin, A., Head, A., Milner, A., & Jeeves,
M. (1985). Visual cells in the temporal cortex sensitive to face view and gaze
direction. Proceedings of the Royal Society of London, B223, 293-317.
Phillips, M., Young, A., Senior, C., Brammer, M., Andrew, C., Calder, A.,
Bullmore, E., Perrett, D., Rowland, D., Williams, S., Gray, J., & David, A. (1997). A
29
specific neural substrate for perceiving facial expressions of disgust. Nature, 389,
495-498.
Price, C., & Friston, K. (1997). The temporal dynamics of reading: a PET
study. Proceedings of the Royal Society, 264, 1785-1791.
Price, C., Moore, C., & Frackowiak, R. (1996). The effect of varying stimulus
rate and duration on brain activity during reading. NeuroImage, 3, 40-52.
Rapin, I., & Katzman, R. (1998). Neurobiology of Autism. Annals of
Neurology, 43, 7-14.
Sacks, O. (1994). An anthropologist on Mars.
Salmon, E., Van der Linden, M., Collette, F., Maquet, P., Degueldre, C.,
Luxen, A., & Franck, G. (1996). Regional brain activity during working memory
tasks. Brain, 119, 1617-1625.
Scott, S., Young, A., Calder, A., Hellawell, D., Aggleton, J., & Johnson, M.
(1997). Impaired auditory recognition of fear and anger following bilateral amygdala
lesions. Nature, 385, 254-257.
Tager-Flusberg, H., Boshart, J., & Baron-Cohen, S. (1998). Reading the
windows of the soul: evidence of domain specificity sparing in Williams syndrome.
Journal of Cognitive Neuroscience, 10, 631-639.
Talairach, J., & Tournoux, P. (1988). Coplanar stereotaxic atlas of the human
brain. New York: Thieme Medical Publishers.
Tranel, D., & Hyman, B., T. (1990). Neuropsycholoical correlates of bilateral
amygdala damage. Arch Neurol, 47, 349-355.
Weinberger, D., & Berman, K. (1998). Prefrontal function in schizophrenia:
confounds and controversies. In A. Roberts, T. Robbins, & L. Weiskrantantz (Eds.),
30
The Prefrontal Cortex: Executive and cognitive functions, . Oxford: Oxford
University Press.
Whiten, A. (1991). Natural theories of mind. Oxford: Basil Blackwell.
Wise, R., Chollet, F., Hadar, U., Friston, K., Hoffner, E., & Frackowiak, R.
(1991). Distribution of cortical neural networks involved in word comprehension and
retrieval. Brain, 114, 1803-1817.
Young, A., Hellawell, D., De Wal, C., & Johnson, M. (1996). Facial
expression processing after amygdalectomy. Neuropsychologia, 34, 31-39.

31
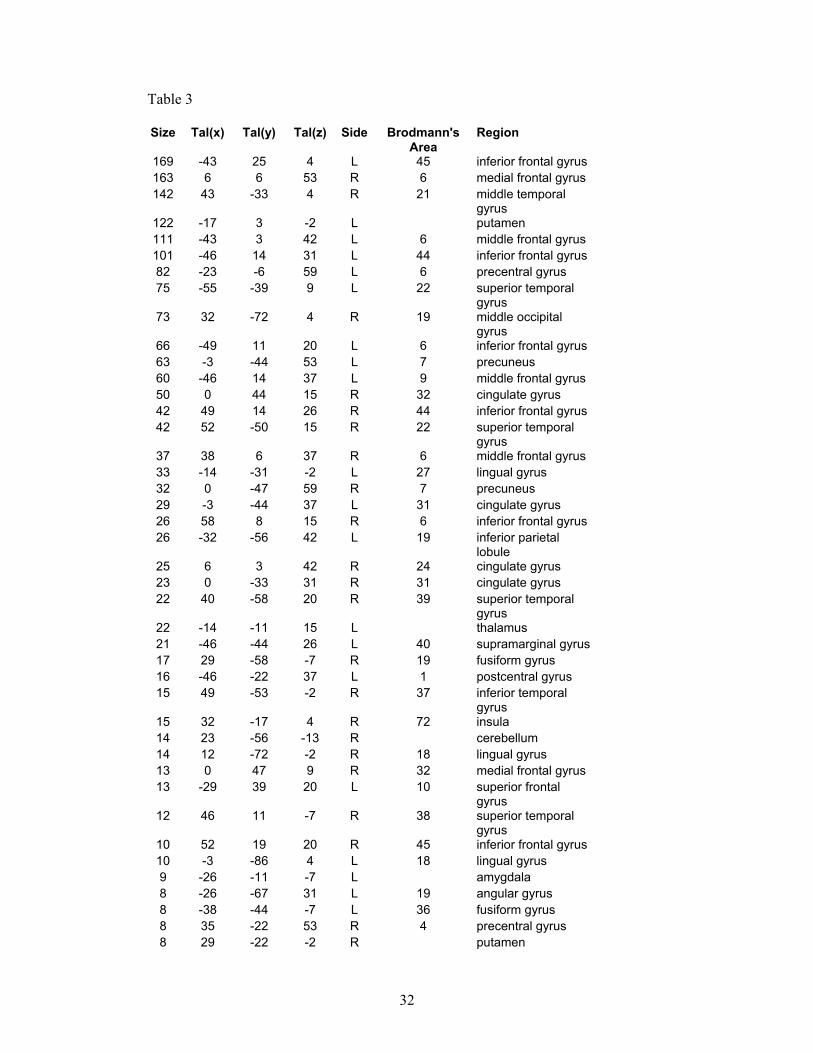
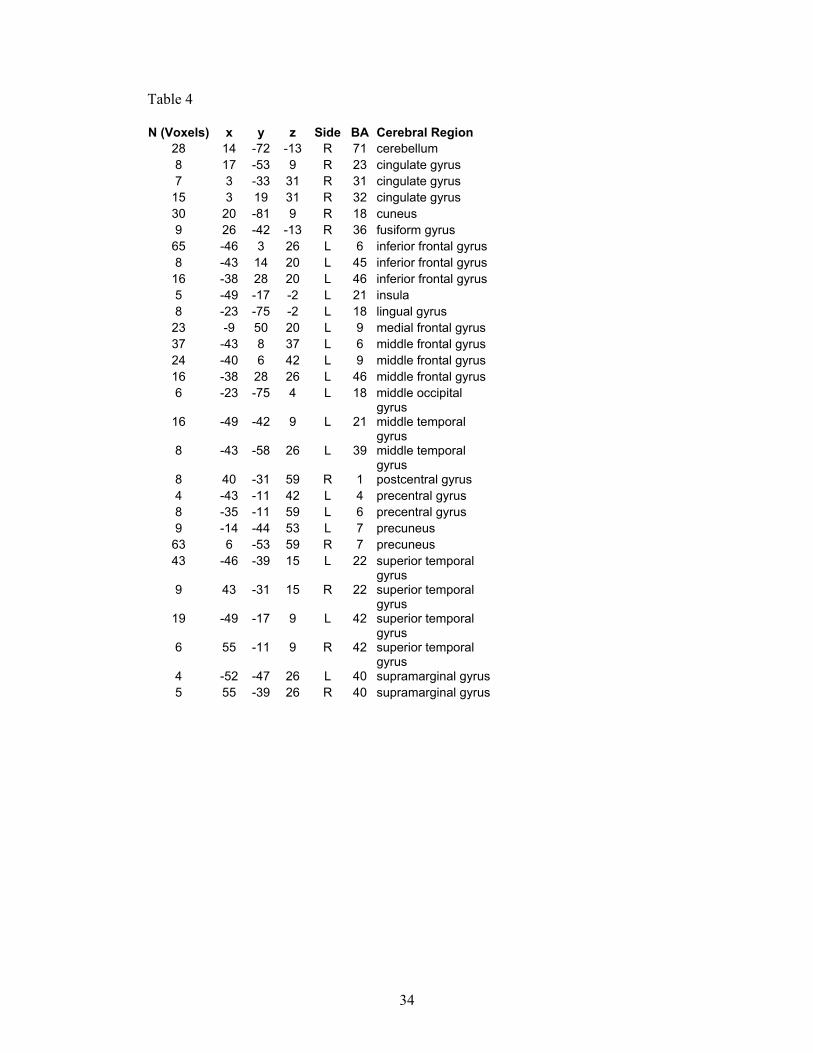
Overleaf: Tables 3 and 4: These are provided for completeness, and show the full results of our preliminary study. Table 3 shows all the regions activated by the ‘theory of mind’ (or social intelligence) condition in the control group, and Table 4 shows all the regions activated by the same condition but in the autism group.
32
Table 3
Size Tal(x) Tal(y) Tal(z) Side Brodmann's Area
Region
169 -43 25 4 L 45 inferior frontal gyrus 163 6 6 53 R 6 medial frontal gyrus 142 43 -33 4 R 21 middle temporal
gyrus 122 -17 3 -2 L putamen 111 -43 3 42 L 6 middle frontal gyrus 101 -46 14 31 L 44 inferior frontal gyrus 82 -23 -6 59 L 6 precentral gyrus 75 -55 -39 9 L 22 superior temporal
gyrus 73 32 -72 4 R 19 middle occipital
gyrus 66 -49 11 20 L 6 inferior frontal gyrus 63 -3 -44 53 L 7 precuneus 60 -46 14 37 L 9 middle frontal gyrus 50 0 44 15 R 32 cingulate gyrus 42 49 14 26 R 44 inferior frontal gyrus 42 52 -50 15 R 22 superior temporal
gyrus 37 38 6 37 R 6 middle frontal gyrus 33 -14 -31 -2 L 27 lingual gyrus 32 0 -47 59 R 7 precuneus 29 -3 -44 37 L 31 cingulate gyrus 26 58 8 15 R 6 inferior frontal gyrus 26 -32 -56 42 L 19 inferior parietal
lobule 25 6 3 42 R 24 cingulate gyrus 23 0 -33 31 R 31 cingulate gyrus 22 40 -58 20 R 39 superior temporal
gyrus 22 -14 -11 15 L thalamus 21 -46 -44 26 L 40 supramarginal gyrus 17 29 -58 -7 R 19 fusiform gyrus 16 -46 -22 37 L 1 postcentral gyrus 15 49 -53 -2 R 37 inferior temporal
gyrus 15 32 -17 4 R 72 insula 14 23 -56 -13 R cerebellum 14 12 -72 -2 R 18 lingual gyrus 13 0 47 9 R 32 medial frontal gyrus 13 -29 39 20 L 10 superior frontal
gyrus 12 46 11 -7 R 38 superior temporal
gyrus 10 52 19 20 R 45 inferior frontal gyrus 10 -3 -86 4 L 18 lingual gyrus 9 -26 -11 -7 L amygdala 8 -26 -67 31 L 19 angular gyrus 8 -38 -44 -7 L 36 fusiform gyrus 8 35 -22 53 R 4 precentral gyrus 8 29 -22 -2 R putamen
33
8 -35 -25 15 L 42 superior temporal gyrus
7 -3 36 -2 L 24 cingulate gyrus 7 20 -53 -2 R 19 lingual gyrus 7 -32 -56 48 L 7 superior parietal
lobule 6 52 6 9 R 6 precentral gyrus 6 0 -31 4 R thalamus 5 -49 -56 15 L 39 superior temporal
gyrus 4 -14 -78 -13 L cerebellum 4 -35 -17 9 L 72 insula 4 -23 -44 59 L 7 postcentral gyrus 1 20 -8 -7 R amygdala
34
Table 4
N (Voxels) x y z Side BA Cerebral Region 28 14 -72 -13 R 71 cerebellum 8 17 -53 9 R 23 cingulate gyrus 7 3 -33 31 R 31 cingulate gyrus
15 3 19 31 R 32 cingulate gyrus 30 20 -81 9 R 18 cuneus 9 26 -42 -13 R 36 fusiform gyrus
65 -46 3 26 L 6 inferior frontal gyrus 8 -43 14 20 L 45 inferior frontal gyrus
16 -38 28 20 L 46 inferior frontal gyrus 5 -49 -17 -2 L 21 insula 8 -23 -75 -2 L 18 lingual gyrus
23 -9 50 20 L 9 medial frontal gyrus 37 -43 8 37 L 6 middle frontal gyrus 24 -40 6 42 L 9 middle frontal gyrus 16 -38 28 26 L 46 middle frontal gyrus 6 -23 -75 4 L 18 middle occipital
gyrus 16 -49 -42 9 L 21 middle temporal
gyrus 8 -43 -58 26 L 39 middle temporal
gyrus 8 40 -31 59 R 1 postcentral gyrus 4 -43 -11 42 L 4 precentral gyrus 8 -35 -11 59 L 6 precentral gyrus 9 -14 -44 53 L 7 precuneus
63 6 -53 59 R 7 precuneus 43 -46 -39 15 L 22 superior temporal
gyrus 9 43 -31 15 R 22 superior temporal
gyrus 19 -49 -17 9 L 42 superior temporal
gyrus 6 55 -11 9 R 42 superior temporal
gyrus 4 -52 -47 26 L 40 supramarginal gyrus5 55 -39 26 R 40 supramarginal gyrus