
Proteomic and SAGE Profiling of Murine Melanoma Progression Indicates the Reduction of Proteins...
11
RESEARCH ARTICLE Proteomic and SAGE profiling of murine melanoma progression indicates the reduction of proteins responsible for ROS degradation Gustavo A. de Souza 1, 2 , Lyris M. F. Godoy 1, 2 , Veronica R. Teixeira 3 , Andreia H. Otake 3 , Adão Sabino 4 , José C. Rosa 1, 2 , Anemari R. Dinarte 1, 5 , Daniel G. Pinheiro 1, 5 , Wilson A. Silva, Jr. 1, 5 , Marcos N. Eberlin 4 , Roger Chammas 1, 3 * and Lewis J. Greene 1, 2 1 Centro de Terapia Celular, Centro Regional de Hemoterapia de Ribeirão Preto, Centro de Pesquisa, Inovac ¸ão e Difusão (CEPID) – FAPESP, Brasil 2 Centro de Quimica de Proteinas, Departamento de Biologia Celular, Molecular e Bioagentes Patogênicos, Faculdade de Medicina de Ribeirão Preto, Universidade de São Paulo, Ribeirão Preto, SP, Brasil 3 Laboratorio de Oncologia Experimental LIM-24, Faculdade de Medicina, Universidade de São Paulo, São Paulo, SP, Brasil 4 Laboratorio Thomson de Espectrometria de Massa, Instituto de Química, Universidade de Campinas, Campinas, SP, Brasil 5 Laboratorio de Genética Molecular e BioInformática, Centro Regional de Hemoterapia de Ribeirão Preto, Ribeirão Preto, SP, Brasil Using 2-DE of total cell protein extracts, we compared soluble proteins from murine melanoma lines Tm1 and Tm5 with proteins from the nontumoral cell melan-a from which they were derived. Seventy-one of the 452 spots (average) detected with CBB were differentially accumu- lated, i.e., increased or decreased twofold. Forty-four spots were identified by PMF/MALDI-TOF, 15 with increased and 29 with decreased protein levels. SAGE showed that 17/34 (50%) of the differentially accumulated proteins, pI range 4–7, presented similar differences at the mRNA level. Major reductions in protein were observed in tumor cells of proteins that degrade reactive oxygen species (ROS). Decreases of twofold in GST, superoxide dismutase, aldehyde dehy- drogenase, thioredoxin, peroxiredoxin 2, and peroxiredoxin 6 protein were observed. SAGE indicated the reduction of other proteins involved in ROS degradation. As expected, the accu- mulation of exogenous peroxides was significantly higher in the tumor cells while the levels of glutathionylation were two times lower in the tumor cells compared to melan-a. The differential accumulation of proteins involved in oncogene/tumor suppressor pathways was observed. Mel- anoma cells can favor survival pathways activated by ROS by inhibiting p53 pathways and acti- vation of Ras and c-myc pathways. Received: April 15, 2005 Revised: August 16, 2005 Accepted: August 22, 2005 Keywords: Mass spectrometry / Melanoma progression / Proteome / Reactive oxygen species / SAGE 1460 Proteomics 2006, 6, 1460–1470 1 Introduction Melanoma progression is a multistep process which involves an unidentified sequence of genetic events resulting in aber- rant gene expression [1]. Functional consequences are com- Correspondence: Professor Lewis J. Greene, Centro de Quimica de Proteinas, Fundacão Hemocentro de Ribeirão Preto, R.Ten. Catão Roxo 2501, 14051–140 Ribeirão Preto, SP, Brasil E-mail: [email protected] Fax: 155-16-2101-9366 Abbreviations: DHE, dihydroethidium; ROS, reactive oxygen spe- cies * Additional corresponding author: Professor Roger Chammas, E-mail: [email protected] DOI 10.1002/pmic.200500243 © 2006 WILEY-VCH Verlag GmbH & Co. KGaA, Weinheim www.proteomics-journal.com
-
Upload
independent -
Category
Documents
-
view
0 -
download
0
Transcript of Proteomic and SAGE Profiling of Murine Melanoma Progression Indicates the Reduction of Proteins...
RESEARCH ARTICLE
Proteomic and SAGE profiling of murine melanoma
progression indicates the reduction of proteins
responsible for ROS degradation
Gustavo A. de Souza1, 2, Lyris M. F. Godoy1, 2, Veronica R. Teixeira3, Andreia H. Otake3,Adão Sabino4, José C. Rosa1, 2, Anemari R. Dinarte1, 5, Daniel G. Pinheiro1, 5,Wilson A. Silva, Jr.1, 5, Marcos N. Eberlin4, Roger Chammas1, 3* and Lewis J. Greene1, 2
1 Centro de Terapia Celular, Centro Regional de Hemoterapia de Ribeirão Preto, Centro de Pesquisa,Inovacão e Difusão (CEPID) – FAPESP, Brasil
2 Centro de Quimica de Proteinas, Departamento de Biologia Celular, Molecular e Bioagentes Patogênicos,Faculdade de Medicina de Ribeirão Preto, Universidade de São Paulo, Ribeirão Preto, SP, Brasil
3 Laboratorio de Oncologia Experimental LIM-24, Faculdade de Medicina, Universidade de São Paulo,São Paulo, SP, Brasil
4 Laboratorio Thomson de Espectrometria de Massa, Instituto de Química, Universidade de Campinas,Campinas, SP, Brasil
5 Laboratorio de Genética Molecular e BioInformática, Centro Regional de Hemoterapia de Ribeirão Preto,Ribeirão Preto, SP, Brasil
Using 2-DE of total cell protein extracts, we compared soluble proteins from murine melanomalines Tm1 and Tm5 with proteins from the nontumoral cell melan-a from which they werederived. Seventy-one of the 452 spots (average) detected with CBB were differentially accumu-lated, i.e., increased or decreased twofold. Forty-four spots were identified by PMF/MALDI-TOF,15 with increased and 29 with decreased protein levels. SAGE showed that 17/34 (50%) of thedifferentially accumulated proteins, pI range 4–7, presented similar differences at the mRNAlevel. Major reductions in protein were observed in tumor cells of proteins that degrade reactiveoxygen species (ROS). Decreases of � twofold in GST, superoxide dismutase, aldehyde dehy-drogenase, thioredoxin, peroxiredoxin 2, and peroxiredoxin 6 protein were observed. SAGEindicated the reduction of other proteins involved in ROS degradation. As expected, the accu-mulation of exogenous peroxides was significantly higher in the tumor cells while the levels ofglutathionylation were two times lower in the tumor cells compared to melan-a. The differentialaccumulation of proteins involved in oncogene/tumor suppressor pathways was observed. Mel-anoma cells can favor survival pathways activated by ROS by inhibiting p53 pathways and acti-vation of Ras and c-myc pathways.
Received: April 15, 2005Revised: August 16, 2005
Accepted: August 22, 2005
Keywords:
Mass spectrometry / Melanoma progression / Proteome / Reactive oxygen species / SAGE
1460 Proteomics 2006, 6, 1460–1470
1 Introduction
Melanoma progression is a multistep process which involvesan unidentified sequence of genetic events resulting in aber-rant gene expression [1]. Functional consequences are com-
Correspondence: Professor Lewis J. Greene, Centro de Quimicade Proteinas, Fundacão Hemocentro de Ribeirão Preto, R.Ten.Catão Roxo 2501, 14051–140 Ribeirão Preto, SP, BrasilE-mail: [email protected]: 155-16-2101-9366
Abbreviations: DHE, dihydroethidium; ROS, reactive oxygen spe-cies
* Additional corresponding author: Professor Roger Chammas,E-mail: [email protected]
DOI 10.1002/pmic.200500243
© 2006 WILEY-VCH Verlag GmbH & Co. KGaA, Weinheim www.proteomics-journal.com
Proteomics 2006, 6, 1460–1470 Cell Biology 1461
plex and affect several biological processes such as control ofthe cell cycle [2], apoptosis [3], enzymatic hydrolysis of theextracellular matrix [4], local immunosuppression andmechanisms of immunological escape [5, 6], angiogenesis[7], and cell migration [8]. Melanomas in the early stages ofdevelopment are curable, but the prognosis of individualswith metastatic melanoma is poor, with a 5-year survival rateof approximately 12% [9, 10]. Consequently, the identifica-tion of the molecular events involved in the progression ofmetastatic melanomas is of clinical importance.
The in vitro characterization of melanoma cells hasdemonstrated several differences from normal melanocytes.The main differences are in groups of proteins related to theability to survive in different environments, facilitatingmigration and metastasis. It has been shown that the reper-toire of proteins involved in cell-cell and cell-extracellularmatrix adhesion changes during melanoma progression, asnormal cells advance toward a more invasive phenotype. Al-though not detected in the present study, it has recently beenshown by others that melanocytes express E-cadherin, a pro-tein involved in cell-cell adhesion of epithelial tissues, whilemelanoma cells express N-cadherin, a protein characteristicof connective tissue. This change in protein expressionresults in the escape of melanoma cells from the negativecontrol of keratinocytes, while gaining new affinities forfibroblasts, thus facilitating invasion [11, 12].
Recently proteomics, cDNA microarrays, and SAGE havebeen used to identify proteins associated with melanomaprogression [13–18]. Several proteins such as nucleo-phosmin [17], secreted acidic cysteine-rich glycoprotein(SPARC) [16], macrophage migration inhibitory factor (MIF)[16], and RhoC [13] were identified in various melanoma celllines by these methods. However, the complex etiology ofthis disease makes the characterization of molecular eventsdifficult and, even more importantly, the cells used to com-pare stages of melanoma progression were not derived fromthe same line.
In the present study, we used a tumor progression modelconsisting of melan-a [19] and two tumoral cell lines, Tm1and Tm5, having a vertical growth phase phenotype andderived from melan-a, after selection by anchorage-inde-pendent growth [20]. The objective of the research was tocompare the normal melanocyte cell line with the two mela-noma cell lines derived from it using proteomic and SAGEanalysis to identify critical molecules and/or pathwaysinvolved in melanoma progression and, when possible, toextend these data by carrying out parallel functional studies.Major changes of abundance were observed for enzymesinvolved in the degradation of reactive oxygen species (ROS).SAGE data were in agreement with about 50% of the resultsobtained by proteomic analysis and, in addition, SAGErevealed a general down-regulation of other proteinsinvolved in ROS degradation in the tumor lines. The biolog-ical consequences of the modifications observed in the pro-teomic analysis were tested in separate experiments by com-paring the level of total protein glutathionylation and the rate
of clearance of exogenously added H2O2 in melan-a and thetumor cells. As expected from the proteome and SAGE data,the accumulation of peroxides was significantly higher in thetumor cells than in the normal cell line from which theywere derived (Fig. 3) while the levels of glutathionylationwere two times lower in the tumor cells to melan-a (Fig. 4).
2 Methods
2.1 Cell culture
Cells were grown in bovine fetal serum-free OPTI-MEMmedium, (Invitrogen-Gibco), pH 6.9, containing 200 nMphorbol ester acetate (Invitrogen-Gibco) in a humid atmos-phere with 5% CO2 at 377C. Cells in the logarithmic phasewere washed with Hanks solution at 47C, collected with a cellscraper, counted, and then lysed as described in Section 2.2.
2.2 Lysis and protein solubilization
Cells (16107) were resuspended in 500 mL of protein extrac-tion buffer (8 M urea, 2% CHAPS w/v, 1 mM PMSF). Theywere submitted to three cycles of sonication at 47C and thencentrifuged at 18 500g for 30 min at 47C (Model 5804,Eppendorf). The supernatant was collected and total proteinwas measured by the Bradford method [21] using BSA asstandard.
2.3 2-DE
IEF was performed with Immobiline pH 4–7 gradient (IPG)strips, 18 cm long (GE Healthcare-Amersham) in an IPG-Phor electrophoretic system (GE Healthcare). The total pro-tein extract (1 mg) was applied to the IPG strip during rehy-dration, as described by Rabilloud et al. [22]. Rehydration wascarried out with 8 M urea, 2% CHAPS w/v, 65 mM DTT,0.5% IPG buffer v/v, and traces of bromophenol, added to thesample to a final volume of 400 mL. Electrophoresis was car-ried out overnight using 50 mA/strip and 150 V for 1 h, 500 Vfor 1 h, 1000 V for 1 h, and 8000 V until 70 000 Vh wereaccumulated.
After IEF, strips were reduced with 65 mM DTT for15 min in equilibrium buffer (50 mM Tris-HCl, 6 M urea, 2%SDS w/v, 30% glycerol v/v, and traces of bromophenol,pH 8.0), followed by alkylation for 15 min by the addition of100 mM iodoacetamide in equilibrium buffer. All reagentswere of Plus One quality (GE Healthcare). These selectiveconditions gave the largest number of separated proteins.
SDS-PAGE was carried out in an Ettan Dalt-Six electro-phoretic system (GE Healthcare), using homogeneous12.5% polyacrylamide gels of 1.5 mm thickness [23]. The IEFstrip was placed on top of the gel, fixed with 0.5% agarosew/v and submitted to electrophoresis (20 mA/gel, 300 V,6 W) at 107C until the bromophenol left the gel (about 16 h).Proteins were detected in the 2-DE gel with colloidal CBB
© 2006 WILEY-VCH Verlag GmbH & Co. KGaA, Weinheim www.proteomics-journal.com
1462 G. A. de Souza et al. Proteomics 2006, 6, 1460–1470
G-250 staining (Serva Electrophoresis GmbH, Heidelberg,Germany) [24]. Other reagents used during staining wereproducts of Merck, analytical grade.
2.4 2-D gel scanning and analysis
After staining, gels were scanned using the ImageScannerdata acquisition system (GE Healthcare). Spot detection,mapping, spot volume determination, and comparisonsbetween gels were performed using ImageMaster-2D soft-ware, version 4.01 (GE Healthcare). The 2-D mapsobtained from melan-a, Tm1, and Tm5 contained an aver-age of 452 spots.
The comparisons between 2-D maps of melan-a, Tm1,and Tm5 cells were made only on the basis of spots presentin all three replicate gels of each cell type. At least 90% of thespots with high staining intensity (.400) were detected atthe same location in all three replicates for each cell type.Analysis of 20 spots present in each of the three replicatesprepared from a single lysate of each cell type indicated thatthe SD of protein spot intensity was less than 40%. On thisbasis, we defined protein accumulation or reduction as anincrease or decrease of more than twofold (100%), i.e.,�2 SD, when the same spots in different cell lines werecompared. The differences observed amongst cell types par-alleled the reduced peroxide metabolism.
The pI, molecular weight (MW), and normalized volume(proportional to protein content) of the spots correspondingto differentially accumulated proteins were calculated foreach type of cell from data obtained for nine gels.
2.5 Sample preparation for MS
Spots corresponding to differentially accumulated proteinswere submitted to tryptic digestion in situ as described byWilliams and Stone [25]. After excision from the gel, spotswere washed with 200 mL of 0.1 M NH4HCO3, pH 8.0, con-taining 50% ACN, until elution of SDS and the CBB stain.Spots were then incubated with 100% ACN for 20 min anddried in a vacuum concentrator (SpeedVac AS290, Savant).Samples were rehydrated with 5 mL of 0.1 M NH4HCO3 con-taining 0.4 mg trypsin (MS grade, Promega). After rehydra-tion, 50 mL of buffer was added to the sample and digestionwas performed for 24 h at 377C. The reaction was stoppedwith 5% TFA. Peptides were eluted from the gel three timeswith 100 mL of 50% ACN containing 2.5% TFA, and thesupernatants were combined, concentrated to 5 mL andcleaned with C18 resin (Poros) in a pipette tip.
2.6 MS
Peptide mass fingerprint analysis was done with a MALDI-TOF model Maldi LR (Micromass, Manchester, UK). Pep-tides were diluted 1:5 in the organic matrix (1% CHCA, 50%ACN, 0.2% TFA), crystallized on the MALDI plates, andsubmitted to ionization. Calibration was done using a mix-
ture of: angiotensin I (1297.51 Da), ACTH 1–17(2094.35 Da), ACTH 18–39 (2466.74 Da), ACTH 7–38(3660.22 Da), and bovine insulin (5734.60 Da).
2.7 Databank searches
Ions identified by MS were analyzed with the MS-Fit tool(Protein Prospector–http://prospector.ucsf.edu) using theSwiss-Prot databank for human-mouse proteins (except forspots 15 and 24, which were identified only using theNCBInr databank). The parameters used for the search were0.2 Da for permitted mass error and one missed cleavage sitefor trypsin hydrolysis specificity. Proteins were identified onthe basis of a minimum sequence coverage of more than15%. Functional protein classification was based on level 5 ofthe Gene Ontology classification, available at http://source.stanford.edu.
2.8 SAGE
Total RNA was prepared from 46107 melan-a, Tm1, or Tm5cells obtained from a fresh culture using TRIzol® LS Reagent(Invitrogen) and treated with RQ1 RNase-Free Dnase (Pro-mega). Thirty milligram of total RNA was then used for theSAGE procedure, which was carried out with the I-SAGE kit(Invitrogen) [26]. Tag frequency tables were constructed fromsequence data by the SAGE analysis software, with theminimum tag count set at 1 and the maximum ditag lengthset at 28 bp, and the parameters were set as default. Theannotation was based on the SAGEmap database (http://www.ncbi.nlm.nih.gov/SAGE/). Statistical analysis was car-ried out with the H2G software (hyper- and hypo-expressedGenes) for the comparison of two SAGE libraries. The H2Gsoftware was also used to perform the normalization ofcompared libraries, using as reference the library with thehighest number of annotations. Most representative differ-entially expressed genes were selected on the basis of nor-malized tag frequency higher then 30.
2.9 H2O2 degradation
Melan-a, Tm1, and Tm5 cells were cultured in the presenceof 100 mM H2O2 for varying periods of time (0.5–3 h). Intra-cellular peroxide content was then measured after 30-minincubation and then hourly up to 3 h with 1 mM dihy-droethidium (DHE) at 377C using a flow cytometer (FACS-calibur). Peroxide-oxidized DHE binds DNA emitting abright red fluorescence, read at FL-2 PMT, when cells areexcited with Ar laser light (488 nm) [27].
2.10 Protein glutathionylation
To determine the overall level of glutathione attached to cellproteins, 60 mg of an extract of total protein from each cellline was submitted to nonreducing 12.5% SDS-PAGE, fol-lowed by protein transfer to an NC membrane using a
© 2006 WILEY-VCH Verlag GmbH & Co. KGaA, Weinheim www.proteomics-journal.com
Proteomics 2006, 6, 1460–1470 Cell Biology 1463
MiniVE electrophoretic system (GE Healthcare). A mousemAb against glutathione (Chemicon) was used at 1:500dilution, and visualized with a donkey secondary antibody tomouse immunoglobulin (GE Healthcare) at 1:2500, using achemoluminescence imaging kit (GE Healthcare) followedby exposure to X-ray film (Kodak). The film was scanned withan ImageMaster scanner (GE Healthcare) and band inten-sities were measured with ImageMaster 2D software.
3 Results
3.1 Analysis of differentially accumulated proteins
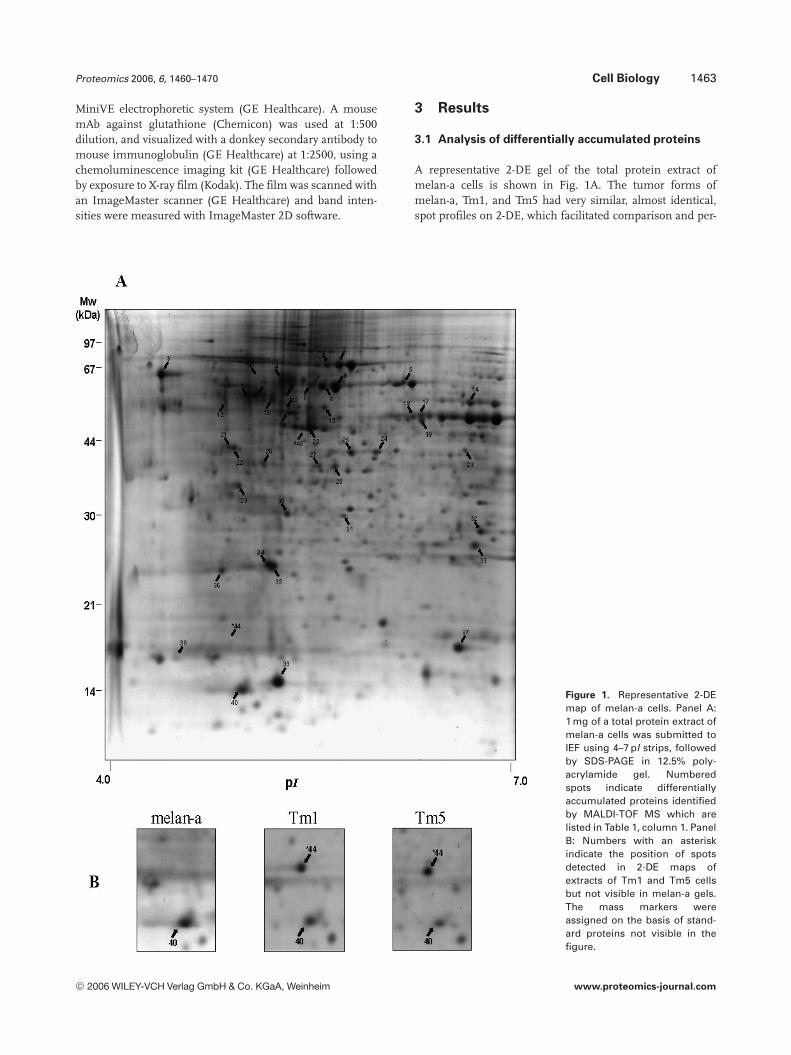
A representative 2-DE gel of the total protein extract ofmelan-a cells is shown in Fig. 1A. The tumor forms ofmelan-a, Tm1, and Tm5 had very similar, almost identical,spot profiles on 2-DE, which facilitated comparison and per-
Figure 1. Representative 2-DEmap of melan-a cells. Panel A:1 mg of a total protein extract ofmelan-a cells was submitted toIEF using 4–7 pI strips, followedby SDS-PAGE in 12.5% poly-acrylamide gel. Numberedspots indicate differentiallyaccumulated proteins identifiedby MALDI-TOF MS which arelisted in Table 1, column 1. PanelB: Numbers with an asteriskindicate the position of spotsdetected in 2-DE maps ofextracts of Tm1 and Tm5 cellsbut not visible in melan-a gels.The mass markers wereassigned on the basis of stand-ard proteins not visible in thefigure.
© 2006 WILEY-VCH Verlag GmbH & Co. KGaA, Weinheim www.proteomics-journal.com

1464 G. A. de Souza et al. Proteomics 2006, 6, 1460–1470
Table 1. Differentially accumulated proteins during melanoma progression from melan-a to Tm1 and Tm5
1.Spot
2. Identified protein 3.Sequencecovered, %
4. AccessnumberSwiss-Prot
5. Proteomics 6. SAGE 7. Mass/pI 2-DE
8. Mass/pISwiss-Prot
Tm1/m-a
Tm5/m-a
Tm1/m-a
Tm5/m-a
1 Stress-70 Protein (G) 21 P38647 0.31 0.23 0.23 0.2 72.261/5.582 16 0.34 0.34 72.235/5.50 73.529/5.97 19 0.55 0.8 65.031/5.263 Calreticulin 20 P14211 3.83 3.40 0.5 0.5 69.549/4.36 47.995/4.34 28 a) 0.34 66.914/5.23
10 Vimentin (G) 18 P20152 a) a) 1.0 5.19 62.345/4.98 53.688/5.112 45 a) a) 61.547/4.80
5 T-complex protein 1, epsilon subunit (N,G) 19 P80316 a) a) 0.33 0.86 65.617/6.03 59.625/5.76 HSP60 (G) 17 P19226 0.9 a) 1.45 1.98 65.775/5.398 26 2.00 0.84 65.278/5.47 60.956/5.99 37 3.35 2.56 64.932/5.56
11 Tubulin beta chain 24 P05218 16.73 22.08 8.82 5.13 62.174/5.13 49.671/4.828 23 0.43 0.5 43.597/5.5513 ATP synthase beta chain 42 P56480 1.21 2.00 1.18 1.67 60.662/5.12 56.301/5.214 Aldehyde dehydrogenase 15 P47738 0.17 0.3 1.00 2.59 58.442/6.45 56.382/6.615 Similar to M6P receptor-binding protein (N) 21 26340270 0.81 0.45 0.23 11.67 58.509/5.48 46.886/6.016 Heterogeneous nuclear ribonucleoprotein F (N) 28 P52597 0.35 0.5 1.00 1.00 57.223/5.24 45.672/5.417 Alpha enolase (G) 29 P17182 0.45 1.00 3.61 4.63 54.975/6.15 47.141/6.418 26 0.5 0.63 54.858/6.0924 Enolase/myc-binding protein (G) 20 P17182 0.5 0.39 1.00 1.73 46.045/5.83 47.141/6.419 Ornithine aminotransferase (N) 29 P29758 a) a) 4.59 6.48 53.738/6.15 48.355/6.220 Actin (G) 42 P02570 2.24 2.23 1.27 1.51 52.633/5.39 41.737/5.321 Nucleophosmin (G) 29 Q61937 4.29 1.00 7.08 4.04 47.575/4.83 32.560/4.622 29 4.21 2.0 47.503/4.8723 LIM and SH3 domain protein 1 25 Q14847 0.46 a) 0.46 0.25 45.329/6.46 29.717/6.625 Eukaryotic translation initiation factor 3 subunit 2 (N) 27 Q9QZD9 0.35 0.31 1.15 0.65 46.224/5.66 36.461/6.426 Elongation factor 1 delta 39 P57776 0.5 0.67 1.14 1.33 43.612/5.06 31.293/4.927 F-actin capping protein (N,G) 29 P47753 a a) 1.09 1.08 43.515/5.45 32.940/5.329 Tropomyosin alpha 3 chain (G) 20 P06753 2.09 0.86 0.54 0.61 38.873/4.90 32.819/4.730 Ran-specific GTPase-activating protein (N,G) 35 P43487 a) a) 0.41 0.86 34.109/5.22 23.310/5.231 6-phosphogluconolactonase (N,G) 21 O95336 0.39 a) 0.71 1.44 33.831/5.61 27.547/5.732 Peroxiredoxin 6 (N,G) 53 O08709 0.19 a) 0.69 0.54 30.060/6.56 24.874/5.733 GST P1 34 P19157 0.31 0.23 0.77 1.05 27.966/6.52 23.609/7.734 Peroxiredoxin 2 (N,G) 48 Q61171 0.3 0.36 1.00 1.00 26.358/5.09 21 779/5.235 Phosphatidyl ethanolamine-binding protein 56 P70296 1.11 0.4 1.00 1.30 26.040/5.12 20.831/5.236 Tranlationally controlled tumor protein (N,G) 31 P14701 0.26 0.28 0.12 0.09 26.355/4.78 19.462/4.837 Superoxide dismutase 31 P08228 0.49 0.34 4.13 8.43 16.760/6.40 15.943/6.038 Myosin light chain alkali (G) 41 P16475 2.02 2.11 0.38 0.86 15.906/4.47 16.930/4.639 Galectin-1 (G) 66 P16045 2.00 0.77 3.82 3.8 14.172/5.15 14.866/5.340 Thioredoxin 1 58 P10639 0.5 0.42 1.49 1.61 13.589/4.91 11.676/4.841 Protein Disulfide Isomerase (G) 37 P09103 b) b) 4.22 2.20 63.434/4.97 57.144/4.842 26S protease regulatory subunit 6A (N) 17 P17980 b) b) 0.42 0.52 57.153/5.37 49.204/5.143 Cathepsin D precursor 19 P18242 b) b) 0.46 0.16 49.094/5.46 44.954/6.744 Cytochrome b5 (N) 47 P56395 b) b) 14.08 8.07 16.793/4.90 15.241/5.0
(N) = Protein not reported to be involved in melanoma progression (see column 2).(G) = Protein reported to be a target of glutathionylation (see column 2).a) Protein spot not detected in either tumor cell extract (see column 5).b) Protein spot not detected in melan-a extract (see column 5).
© 2006 WILEY-VCH Verlag GmbH & Co. KGaA, Weinheim www.proteomics-journal.com
Proteomics 2006, 6, 1460–1470 Cell Biology 1465
mitted the detection of differentially accumulated proteins,i.e., more than twofold higher or lower in protein contentthan the corresponding spot from melan-a cells. Of the spotsthat were detected in the gel, 30 increased and 41 decreasedwhen Tm1 and Tm5 were compared to melan-a. The num-bers next to some of the spots indicate that the protein wasidentified by MALDI-TOF MS. Spots 41–44 also marked withasterisks in Fig. 1A correspond to proteins detected in Tm1and Tm5 melanoma cells, but not in melan-a (Fig. 1B). SAGEdetected transcripts of all four proteins in each of the celllines (Table 1, column 6).
The terms “accumulation” and “reduction” have beenused in this article when there was a twofold (100% increase)or decrease of protein content. “Expression” and relatedgenomic terms are not used for proteomic data because pro-tein degradation data are not available. Forty-four of the 71proteins that were differentially accumulated during tumorprogression were identified by MALDI-TOF MS of trypticpeptides (Table 1). The number given to each protein in Fig. 1is the same as the number in Table 1, column 1. The data inTable 1, column 3 indicate that the sequence coverage of theMS identifications was from 15% (spot 14–aldehyde dehy-drogenase 2) to 66% (spot 39–Galectin 1). Swiss-Prot accessnumbers are given in Table 1, column 4.
The values given in column 5 of Table 1indicate the resultof the comparison of the relative amounts of differentiallyaccumulated proteins when each tumor cell is compared tothe melan-a cells. In most cases, 66/71 proteins, the extentand direction (increased or decreased) of the differentiallyaccumulated proteins were the same for both Tm1 and Tm5cells when compared to melan-a cells.
The multiple entries for the same protein in Table 1indicate that more than one electrophoretic form was identi-fied as the same protein on the basis of the peptide massfingerprint. Proteins detected as multiple electrophoreticforms are spots 1, 2, and 7, all identified as stress-70 proteinin the Swiss-Prot databank, spots 4, 10, and 12 (vimentin),spots 6, 8, and 9 (HSP60), spots 11 and 28 (Tubulin betachain), spots 17, 18, and 24 (a-enolase) and spots 21 and 22(nucleophosmin). Experimental and theoretical molecularmasses and pI are given in Table 1, columns 7 and 8,respectively. Most of the molecular masses were higher by atleast 10% (29/44) or lower (2/44) than the molecular massesreported by the Swiss-Prot databank. Similarly, differences of0.1 pI units lower were observed for 15/44 proteins and pIhigher for 11/44 proteins.
3.2 SAGE
SAGE experiments were carried out to complement theproteomic data. Although it is not possible to deduce quan-titative protein expression profiles from mRNA analysis,SAGE provides an overview of gene expression which canbe compared qualitatively to the proteomic result. Thelibraries yielded 32 490 nonredundant tags for melan-a,
30 130 tags for Tm1 and 22 122 tags for Tm5. In order toobtain more reliable SAGE data to better compare with theproteomic data, we listed all the differentially expressedgenes (.26) with frequency n � 30 (Table 1, Supplemen-tary Material). We were able to identify 160 differentiallyexpressed genes in Tm1 when compared to melan-a (90 up-regulated and 70 down-regulated in the tumoral line) and131 differentially expressed genes in Tm5 (84 up-regulated,47 down-regulated). Of the 34 different proteins identifiedin the proteomic analysis as differentially accumulated, tenproteins (stress 70 protein (hspa9a), tubulin beta chain(tubb5), enolase (eno1), actin (actb), vimentin (vim), T-com-plex protein 1 (cct5), superoxide dismutase (sod1), galectin 1(gals1), protein disulfide isomerase (PDI), and cytochromeb-5 (cyb5)) are also listed in the SAGE SupplementaryMaterial. This shows that most of the proteins identified byus in the pI range 4–7 (24/34 proteins) would not have beenidentified on the basis of SAGE data, demonstrating thatdeductions from mRNA transcript analysis can be mislead-ing, as also pointed out by others [28, 29].
Column 6 of Table 1 indicates the correspondingSAGE data for the proteins identified by the proteomicstudy. We were able to discriminate between proteinswhose differences in levels observed in 2-DE resultedfrom differential gene expression (SAGE and proteomicdata were in agreement) or presumably were the result ofposttranscriptional or posttranslational control. Of the 34proteins identified in the present study, 17 had similardecreases/increases of expression by SAGE for Tm1 and15 for Tm5 when compared to melan-a, as observed forthe 2-DE protein profile, indicating that approximately50% of the differentially accumulated proteins identifiedin the 2-DE gels did not have similar differential expres-sion of their respective mRNAs. Correlation between theratio of protein levels (Table 1, column 5) and transcriptabundance (Table 1, column 6) in the tumor cell lines ascompared to the normal counterpart was low, but signifi-cant for Tm1 versus melan-a cells (Spearman r = 0.3087,p = 0.0415) and absent for Tm5 versus melan-a (Spearmanr = 0.064, p = 0.67).
Since the main group of proteins identified by the pro-teome data participates in the degradation of ROS, we alsolooked for differences in mRNA expression of proteins spe-cifically involved in ROS degradation, but not detected by theproteome study. Figure 2 shows the expression profiles of the25 mRNAs tags of molecules involved in ROS degradationand that were differentially expressed by at least more thantwo-fold during tumor progression according to SAGE data.This indicates that an overall down-regulation of thesemolecules (19/25 mRNAs) (Fig. 2B) occurs during melan-atumoral progression.
The main proteomic results concerning the progressionof melanoma were extended in separate experiments inwhich H2O2 degradation and glutathionylation were meas-ured in melanoma cells and in melan-a cells from which theywere derived.
© 2006 WILEY-VCH Verlag GmbH & Co. KGaA, Weinheim www.proteomics-journal.com

1466 G. A. de Souza et al. Proteomics 2006, 6, 1460–1470
Figure 2. SAGE data for differentiallyexpressed mRNA whose products parti-cipate in ROS degradation but were notdetected by 2-DE. Most representativemRNA tag of genes that are involved inROS degradation pathways were com-pared between cell lines. Only differen-tially expressed mRNAs (.26) arereported. Gray bars correspond to Tm1cells and black bars to Tm5 cells. PanelA: Gpx5–glutathione peroxidase 5;Gpx6–glutathione peroxidase 6; Gstm2–GST mu2; Gsto1–GST omega 1; Gss–glutathione synthetase; Gsr–glutathionereductase 1; Prdx4–peroxiredoxin 4;Prdx5–peroxiredoxin 5; Txnrd3–thio-redoxin reductase 3; Txndc4–thio-redoxin domain containing 4; Txn2–thioredoxin 2; Cat–catalase; Nxn–nucleoredoxin; Sod2–superoxide dis-mutase; aldh3a2–aldehyde dehy-drogenase 3; aldh6a1–aldehyde dehy-drogenase 6; aldh7a1–aldehyde dehy-drogenase 7; aldh9a1–aldehydedehydrogenase 9; ndufs2–NADH dehy-drogenase Fe-S protein 2. Panel B:Genes that were up-regulated duringmelanoma progression. Gsta2–GSTalpha 2; Gsta3–GST alpha 3; Gstt3–GSTteta 3; Txnrd2–thioredoxin reductase 2;Txndc1–thioredoxin domain containing1; Sod3–superoxide dismutase 3.
3.3 H2O2 degradation
Incubation of the three cell lines with the same concentra-tion of H2O2 permitted us to demonstrate overall peroxidedegradation measured indirectly by oxidized DHE content.DHE staining was higher in both Tm1 and Tm5 cells, peak-ing at 1 h of exposure to H2O2, as indicated in Fig. 3; melan-acells cleared exogenous peroxides more efficiently, as indi-cated by the amplitude of the response at 1 h of treatmentand the residual levels of peroxides after 2–3 h of exposure toH2O2. These data provide independent confirmation that theoverall capacity of ROS degradation in Tm1 and Tm5 isdecreased compared to melan-a.
3.4 Protein glutathionylation
The proteomic and SAGE data indicate that modifications ofprotein and gene levels of molecules involved in redox con-trol can affect biological events in tumoral cells Tm1 andTm5. Since the decrease of GST levels reported here is a well-characterized event in melanoma progression [30], one con-sequence of the reduction of the amount of the enzymeshould be the decrease of overall glutathionylation of pro-
Figure 3. Tm1 and Tm5 cells accumulate higher levels of intra-cellular peroxides than melan-a after exposure to endogenousH2O2. Intracellular peroxide content was measured indirectly byflow cytometry, using the fluorochrome DHE. Data are reportedas the mean fluorescence intensity 6 SD of triplicate measure-ments. There were no differences between Tm1 and Tm5 interms of levels of peroxide, but there was a significant decreaseof peroxide concentration in Melan-a cells (p , 0.01, ANOVA fol-lowed by Newman–Keuls Multiple Comparison Test).
© 2006 WILEY-VCH Verlag GmbH & Co. KGaA, Weinheim www.proteomics-journal.com

Proteomics 2006, 6, 1460–1470 Cell Biology 1467
teins in the tumoral lines. We submitted total cell proteinextracts to nonreducing SDS-PAGE and measured the glu-tathione bound to proteins with a mAb. Figure 4A shows aportion of the gel with two proteins detected by the antibody.Figure 4B shows the CBB-stained control. The volume of thebands visualized in each lane was measured and the overalllevel of glutathionylation was taken to be the sum of all thebands detected in each cell line. There was a statistically sig-nificant (p , 0.01, Student’s t-test) reduction of glutathiony-lation in both Tm1 and Tm5 cell lines when compared tomelan-a cells (Fig. 4C).
4 Discussion
Proteomics and SAGE have proven to be powerful tools forthe identification of proteins involved in tumor progressionin the present study and others [17, 31, 32]. In the presentstudy we report the differential expression of genes and thedifferential accumulation of proteins in a recently describedmodel of melanoma progression [20], which is unique in thisarea, because there is no other melanoma progression sys-tem in the literature in which the tumor cells were derivedfrom the normal cell line used for comparison. We havedemonstrated differential accumulation (.26 or ,0.5) of44 proteins during melanoma progression, by comparingmelanoma cells Tm1 and Tm5 with melan-a cells, the cellsfrom which the tumors were derived. Fifteen proteins wereincreased in quantity during tumor progression and 29decreased. Multiple electrophoretic forms identified by MSaccounted for 34% of the identified spots (16/44 spots,representing six different proteins). In addition, SAGE datacomplemented and extended the proteomic characterizationwith the measurement of the levels of transcriptional activity.
Fifty percent of the proteins identified by the proteomicapproach had similar (increased or decreased) mRNAexpression profiles for Tm1 and Tm5 cells, suggesting thatdifferences in expression had occurred at the gene tran-scription level during tumor progression. (Compare column5 with column 6 in Table 1.)
Some of the genes identified in our SAGE analysis and/or proteome studies have been reported by others to beassociated with melanoma progression. These includenucleophosmin ([17], see our Table 1), SPARC ([16], seeSupplemental Material), members of the cyclin D family([33, 34], see Supplemental Material), and Cdk2 ([35], seeSupplemental material).
In addition, genes reported to be down-regulated such asgalectin 3 [36] and RNA binding motif protein RBM3 [15] arealso down-regulated in Tm1 and Tm5. Taken together, thesedata show that many of the features of our melan-a mela-noma progression model are consistent with melanoma celllines described in the literature.
Our data show the overall down-regulation and decreaseof levels of proteins that participate in the ROS degradationpathways, indicating that these proteins involved in theelimination of ROS may be relevant for melanoma progres-sion. The inability to eliminate ROS has been demonstratedby others in skin cancers, especially melanomas [37]. Ingeneral, melanomas have high levels of H2O2 and superoxidecaused mainly by constant exposure to UV radiation [38], as aresult of melanin biosynthesis [39] and down-regulation ofGST, catalase, and superoxide dismutase (MnSOD), allinvolved in ROS elimination [30]. Our results indicate thatduring melanoma progression, in addition to the down-reg-ulation of GST and MnSOD, other proteins involved in theelimination of ROS are down-regulated. These include per-oxiredoxin 2 (spot 34), peroxiredoxin 6 (spot 32), thioredoxin
Figure 4. Protein glutathionylation is lower inmelanoma cells Tm1 and Tm5 than in melano-cyte melan-a cells from which they were derived.Total protein extracts of each cell line (60 mg)were submitted to nonreducing SDS-PAGEusing 12.5% polyacrylamide gels. Panel A: Pro-teins were blotted to NC and incubated with amouse monoclonal antiglutathione antibody.Panel B: Load control stained with colloidal CBB.Panel C: Densitometric analysis of the visiblebands in the Western-blot. *p � 0.01 comparedto melan-a (Student’s t-test).
© 2006 WILEY-VCH Verlag GmbH & Co. KGaA, Weinheim www.proteomics-journal.com
1468 G. A. de Souza et al. Proteomics 2006, 6, 1460–1470
1 (spot 40), and aldehyde dehydrogenase (spot 14), indicatingthat the enzymes responsible for ROS degradation arereduced during tumor progression. Thus our data confirmand extend results obtained by others [30, 37] who reportedthat the increase of ROS in melanoma cells is the result ofthe decrease in the expression of GST, MnSOD, and catalase.SAGE data show that 19/25 of the mRNA tags presenteddecreased expression (Fig. 2). Taken together, these datademonstrate that an overall down-regulation of these genesoccurs during tumor progression. By treating melan-a, Tm1,and Tm5 with H2O2 and then measuring the intracellularlevel of oxidative compounds by DHE, we demonstrated thatthe tumoral cells were less efficient in eliminating thehydrogen peroxide, thus demonstrating that these cells had adecreased capacity to eliminate ROS, as suggested by prote-omic and SAGE data (Fig. 3)
A remarkable characteristic of the ROS activity in skincancers is that ROS compounds such as H2O2 and super-oxide determine the activation and expression of severalproteins associated with the progression of these cancers[40]. On the other hand, ROS are considered to be toxiccompounds which cause DNA damage and trigger p53-de-pendent apoptosis in most cell types [41, 42]. Despite thistoxic activity, melanoma cells appear to activate survivalpathways by ROS.
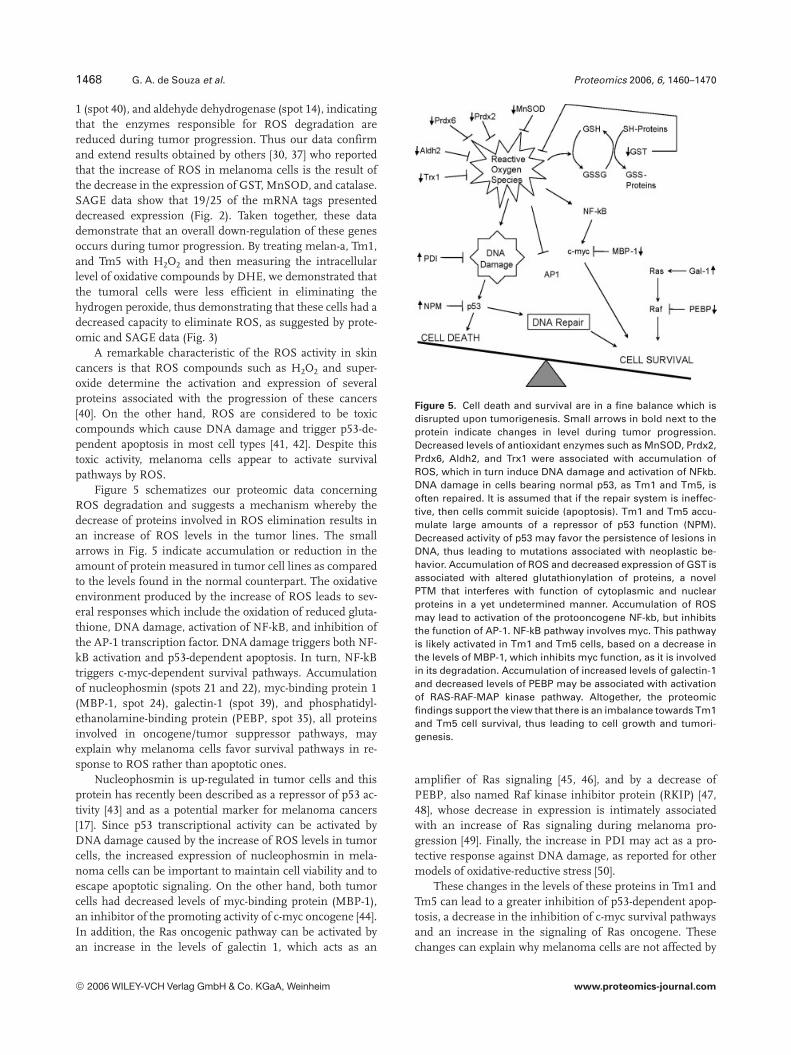
Figure 5 schematizes our proteomic data concerningROS degradation and suggests a mechanism whereby thedecrease of proteins involved in ROS elimination results inan increase of ROS levels in the tumor lines. The smallarrows in Fig. 5 indicate accumulation or reduction in theamount of protein measured in tumor cell lines as comparedto the levels found in the normal counterpart. The oxidativeenvironment produced by the increase of ROS leads to sev-eral responses which include the oxidation of reduced gluta-thione, DNA damage, activation of NF-kB, and inhibition ofthe AP-1 transcription factor. DNA damage triggers both NF-kB activation and p53-dependent apoptosis. In turn, NF-kBtriggers c-myc-dependent survival pathways. Accumulationof nucleophosmin (spots 21 and 22), myc-binding protein 1(MBP-1, spot 24), galectin-1 (spot 39), and phosphatidyl-ethanolamine-binding protein (PEBP, spot 35), all proteinsinvolved in oncogene/tumor suppressor pathways, mayexplain why melanoma cells favor survival pathways in re-sponse to ROS rather than apoptotic ones.
Nucleophosmin is up-regulated in tumor cells and thisprotein has recently been described as a repressor of p53 ac-tivity [43] and as a potential marker for melanoma cancers[17]. Since p53 transcriptional activity can be activated byDNA damage caused by the increase of ROS levels in tumorcells, the increased expression of nucleophosmin in mela-noma cells can be important to maintain cell viability and toescape apoptotic signaling. On the other hand, both tumorcells had decreased levels of myc-binding protein (MBP-1),an inhibitor of the promoting activity of c-myc oncogene [44].In addition, the Ras oncogenic pathway can be activated byan increase in the levels of galectin 1, which acts as an
Figure 5. Cell death and survival are in a fine balance which isdisrupted upon tumorigenesis. Small arrows in bold next to theprotein indicate changes in level during tumor progression.Decreased levels of antioxidant enzymes such as MnSOD, Prdx2,Prdx6, Aldh2, and Trx1 were associated with accumulation ofROS, which in turn induce DNA damage and activation of NFkb.DNA damage in cells bearing normal p53, as Tm1 and Tm5, isoften repaired. It is assumed that if the repair system is ineffec-tive, then cells commit suicide (apoptosis). Tm1 and Tm5 accu-mulate large amounts of a repressor of p53 function (NPM).Decreased activity of p53 may favor the persistence of lesions inDNA, thus leading to mutations associated with neoplastic be-havior. Accumulation of ROS and decreased expression of GST isassociated with altered glutathionylation of proteins, a novelPTM that interferes with function of cytoplasmic and nuclearproteins in a yet undetermined manner. Accumulation of ROSmay lead to activation of the protooncogene NF-kb, but inhibitsthe function of AP-1. NF-kB pathway involves myc. This pathwayis likely activated in Tm1 and Tm5 cells, based on a decrease inthe levels of MBP-1, which inhibits myc function, as it is involvedin its degradation. Accumulation of increased levels of galectin-1and decreased levels of PEBP may be associated with activationof RAS-RAF-MAP kinase pathway. Altogether, the proteomicfindings support the view that there is an imbalance towards Tm1and Tm5 cell survival, thus leading to cell growth and tumori-genesis.
amplifier of Ras signaling [45, 46], and by a decrease ofPEBP, also named Raf kinase inhibitor protein (RKIP) [47,48], whose decrease in expression is intimately associatedwith an increase of Ras signaling during melanoma pro-gression [49]. Finally, the increase in PDI may act as a pro-tective response against DNA damage, as reported for othermodels of oxidative-reductive stress [50].
These changes in the levels of these proteins in Tm1 andTm5 can lead to a greater inhibition of p53-dependent apop-tosis, a decrease in the inhibition of c-myc survival pathwaysand an increase in the signaling of Ras oncogene. Thesechanges can explain why melanoma cells are not affected by
© 2006 WILEY-VCH Verlag GmbH & Co. KGaA, Weinheim www.proteomics-journal.com
Proteomics 2006, 6, 1460–1470 Cell Biology 1469
the increase of ROS [37], while other tumors are reported toundergo growth inhibition and activation of apoptotic path-ways by increased levels of ROS [41].
Another objective of the current study was to extend theproteomic results to the identification of biological processesthat could be affected by the observed differences in proteinaccumulation or depletion. We expected the extent of proteinglutathionylation to be altered during melanoma progres-sion, since GST is down-regulated in melanoma cells. Theformation of disulfide bonds between oxidized glutathione(GSSG) and proteins is a normal defensive response of cellswith higher levels of ROS [51]. Our data showed that glu-tathionylation levels in protein extracts obtained from Tm1and Tm5 were, in fact, lower than in melan-a (Fig. 4). It hasbeen demonstrated that glutathionylation can modify pro-tein activity either negatively [52, 53] or positively [54]. Sev-eral proteins have been identified as targets of glutathiony-lation in vivo [55–57] and interestingly, of the 33 proteinsidentified in the present study as differentially accumulatedduring melan-a tumor progression, 18 (55%) are reported tobe targets of glutathionylation. This suggests that glutathio-nylation, a posttranslational mechanism for the control ofprotein activity, may participate in melanoma tumor pro-gression.
Both proteomic and SAGE data have identified the majormolecules involved in the redox imbalance characteristic ofmelanomas. A likely consequence of this imbalance is theaccumulation of mutations leading to melanoma hetero-geneity and resistance to chemotherapeutic agents. Studieson the clinical significance of the expression pattern of thesemolecules are now underway.
Gustavo A. de Souza was a predoctoral fellow of Fundação deAmparo à Pesquisa do Estado de São Paulo – FAPESP (Process# 01/12971–3). This study was supported by FAPESP, FAPESP(CEPID), CNPq, and CNPq (Pronex).
5 References
[1] Castellano, M., Parmiani, G., Melanoma Res. 1999, 9, 421–432.
[2] Walker, G. J., Flores, J. F., Glendensing, J. M., Lin, A. H. et al.,Genes Chromosomes Cancer 1998, 22, 157–163.
[3] Soengas, M. S., Capodieci, P., Polsky, D., Mora, J. et al., Na-ture 2001, 409, 207–211.
[4] Iida, J., Pei, D., Kang, T., Simpson, M. A. et al., J. Biol. Chem.2001, 276, 18786–18794.
[5] Nestle, F. O., Oncogene 2000, 19, 6673–6679.
[6] Geertsen, R., Hofbauer, G., Kamarashev, J., Yue, F. Y., Dum-mer, R., Int. J. Mol. Med. 1999, 3, 49–57.
[7] Hess, A. R., Seftor, E. A., Gardner, L. M., Carles-Kinch, K. et al.,Cancer Res. 2001, 61, 3250–3255.
[8] Friedl, P., Brocker, E. B., Zanker, K. S., Cell Adhes. Commun.1998, 6, 225–236.
[9] Clark, W. H., Jr., Elder, D. E., Guerry, D, Braitman, L. E. et al.,J. Natl. Cancer Inst. 1989, 81, 1893–1904.
[10] Berwick, M., Halpern, A., Curr. Opin. Oncol. 1997, 9, 178–182.
[11] Meier, F., Satyamoorthy, K., Nesbit, M., Hsu, M. Y. et al.,Front. Biosci. 1998, 3, D1005–D1010.
[12] Li, G., Herlyn, M., Mol. Med. Today 2000, 6, 163–169.
[13] Clark, E. A., Golub, T. R., Lander, E. S., Hynes, R. O., Nature2000, 406, 532–535.
[14] Bittner, M., Meltzer, P., Chen, Y., Jiang, Y. et al., Nature 2000,406, 536–540.
[15] Baldi, A., Battista, T., De Luca, A., Santini, D. et al., Exp. Der-matol. 2003, 12, 213–218.
[16] Rumpler, G., Becker, B., Hafner, C., McClelland, M. et al., Exp.Dermatol. 2003, 12, 761–771.
[17] Bernard, K., Litman, E., Fitzpatrick, J. L., Shellman, Y. G. etal., Cancer Res. 2003, 63, 6716–6725.
[18] Clauser, K. R., Hall, S. C., Smith, D. M., Webb, J. W. et al.,Proc. Natl. Acad. Sci. USA 1995, 92, 5072–5076.
[19] Bennett, D. C., Cooper, P. J., Hart, I. R., Int. J. Cancer 1987, 39,414–418.
[20] Correa, M., Machado, M., Carneiro, C. R. W., Pesquero, J. B.et al., Int. J. Cancer 2005, 114, 356–363.
[21] Bradford, M. M., Anal. Biochem. 1976, 72, 248–254.
[22] Rabilloud, T., Valette, C., Lawrence, J. J., Electrophoresis1994, 15, 1552–1558.
[23] Laemmli, U. K., Nature 1970, 227, 680–685.
[24] Neuhoff, V., Arold, N., Taube, D., Ehrhardt, W., Electropho-resis 1998, 9, 255–262.
[25] Williams, K. R., Stone, K. L., Mol. Biotechnol. 1997, 8, 155–167.
[26] Silva, W. A., Jr., Covas, D. T., Panepucci, R. A., Proto-Siqueira, R. et al., Stem Cells 2003, 21, 661–669.
[27] Metarrese, P., Tinari, N., Semeraro, M. L., Natoli, C. et al.,FEBS Lett. 2000, 473, 311–315.
[28] Gygi, S. P., Rochon, Y., Franza, B. R., Aebersold, R., Mol. CellBiol. 1999, 19, 1720–1730.
[29] Anderson, L., Seilhamer, J., Electrophoresis 1997, 18, 533–537.
[30] Picardo, M., Grammatico, P., Roccella, F., Roccella, M. et al.,J. Invest. Dermatol. 1996, 107, 322–326.
[31] Roblick, U. J., Hirschberg, D., Habermann, J. K., Palmberg,C. et al., Cell. Mol. Life Sci. 2004, 61, 1246–1255.
[32] Zhou, G., Li, H., DeCamp, D., Chen, S. et al., Mol. Cell. Pro-teomics 2002, 1, 117–124.
[33] Florenes, V. A., Faye, R. S., Maelandsmo, G. M., Nesland, J.M., Holm, R., Clin. Cancer Res. 2002, 6, 3614–3620.
[34] Georgieva, J., Sinha, P., Schadendorf, D., J. Clin. Pathol.2001, 54, 229–235.
[35] Du, J., Widlund, H. R., Horstmann, M. A., Ramaswami, S. etal., Cancer Cell 2004, 6, 565–576.
[36] Mollenhauer, J., Deichmann, M., Helmke, B., Muller, H. et al.,Int. J. Cancer 2003, 105, 149–157.
[37] Meyskens, F. L., Jr., McNulty, S. E., Buckmeier, J. A., Tohi-dian, N. B. et al., Free Radic. Biol. Med. 2001, 31, 799–808.
[38] de Gruijl, F. R., Eur. J. Cancer 1999, 35, 2003–2009.
[39] Chedekel, M. R., Photochem. Photobiol. 1982, 35, 881–885.
© 2006 WILEY-VCH Verlag GmbH & Co. KGaA, Weinheim www.proteomics-journal.com
1470 G. A. de Souza et al. Proteomics 2006, 6, 1460–1470
[40] Meyskens, F. L., Jr., Buckmeier, J. A., McNulty, S. E., Tohi-dian, N. B., Clin. Cancer Res. 1999, 5, 1197–1202.
[41] Datta, K., Babbar, P., Srivastava, T., Sinha, S., Chatto-padhyay, P., Int. J. Biochem. Cell Biol. 2002, 34, 148–157.
[42] Armstrong, J. S., Steinauer, K. K., Hornung, B., Irish, J. M. etal., Cell Death Differ. 2002, 9, 252–263.
[43] Maiguel, D. A., Jones, L., Chakravarty, D., Yang, C., Carrier,F., Mol. Cell. Biol. 2004, 24, 3703–3711.
[44] Subramanian, A., Miller, D. M., J. Biol. Chem. 2000, 275,5958–5965.
[45] Paz, A., Haklai, R., Elad-Sfadia, G., Ballan, E., Kloog, Y.,Oncogene 2001, 20, 7486–7493.
[46] Elad-Sfadia, G., Haklai, R., Ballan, E., Gabius, H. J., Kloog, Y.,J. Biol. Chem. 2002, 277, 37169–37175.
[47] Yeung, K., Seitz, T., Li, S., Janosch, P. et al., Nature 1999, 401,173–177.
[48] Yeung, K., Janosch, P., McFerran, B., Rose, D. W. et al., Mol.Cell Biol. 2000, 20, 3079–3085.
[49] Schuierer, M. M., Bataille, F., Hagan, S., Kolch, W., Bosserh-off, A. K., Cancer Res. 2004, 64, 5186–5192.
[50] Tanaka, S., Uehara, T., Nomura, Y., J. Biol. Chem. 2000, 275,10388–10393.
[51] Cotgreave, I. A., Gerdes, R. G., Biochem. Biophys. Res.Commun. 1998, 242, 1–9.
[52] Mohr, S., Hallak, H., de Boitte, A., Lapetina, E. G., Brune, B.,J. Biol. Chem. 1999, 274, 9427–9430.
[53] Casagrande, S., Bonetto, V., Fratelli, M., Gianazza, E. et al.,Proc. Natl. Acad. Sci. USA 2002, 99, 9745–9749.
[54] Manevich, Y., Feinstein, S. I., Fisher, A. B., Proc. Natl. Acad.Sci. USA 2004, 101, 3780–3785.
[55] Fratelli, M., Demol, H., Puype, M., Casagrande, S. et al., Proc.Natl. Acad. Sci. USA 2002, 99, 3505–3510.
[56] Fratelli, M., Demol, H., Puype, M., Casagrande, S. et al., Pro-teomics 2003, 3, 1154–1161.
[57] Lind, C., Gerdes, R., Hamnell, Y., Schuppe-Koistinen, I. et al.,Arch. Biochem. Biophys. 2002, 406, 229–240.
© 2006 WILEY-VCH Verlag GmbH & Co. KGaA, Weinheim www.proteomics-journal.com