Improved thermal analysis of buried landmines
11
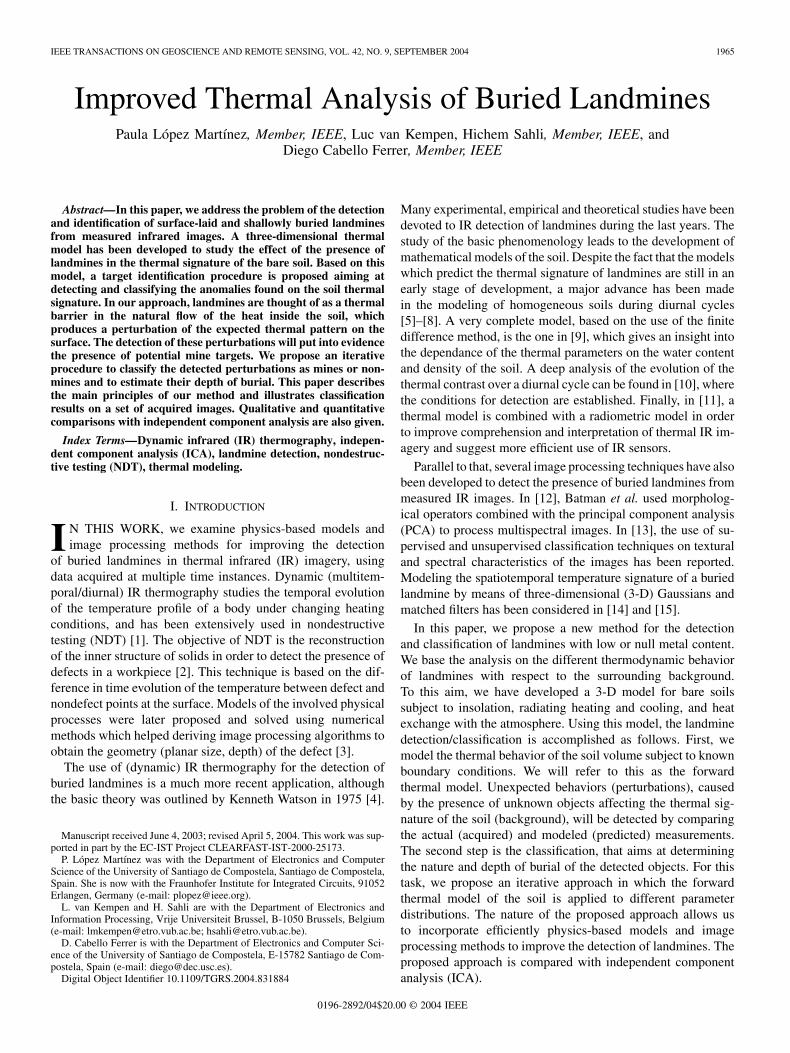
IEEE TRANSACTIONS ON GEOSCIENCE AND REMOTE SENSING, VOL. 42, NO. 9, SEPTEMBER 2004 1965 Improved Thermal Analysis of Buried Landmines Paula López Martínez, Member, IEEE, Luc van Kempen, Hichem Sahli, Member, IEEE, and Diego Cabello Ferrer, Member, IEEE Abstract—In this paper, we address the problem of the detection and identification of surface-laid and shallowly buried landmines from measured infrared images. A three-dimensional thermal model has been developed to study the effect of the presence of landmines in the thermal signature of the bare soil. Based on this model, a target identification procedure is proposed aiming at detecting and classifying the anomalies found on the soil thermal signature. In our approach, landmines are thought of as a thermal barrier in the natural flow of the heat inside the soil, which produces a perturbation of the expected thermal pattern on the surface. The detection of these perturbations will put into evidence the presence of potential mine targets. We propose an iterative procedure to classify the detected perturbations as mines or non- mines and to estimate their depth of burial. This paper describes the main principles of our method and illustrates classification results on a set of acquired images. Qualitative and quantitative comparisons with independent component analysis are also given. Index Terms—Dynamic infrared (IR) thermography, indepen- dent component analysis (ICA), landmine detection, nondestruc- tive testing (NDT), thermal modeling. I. INTRODUCTION I N THIS WORK, we examine physics-based models and image processing methods for improving the detection of buried landmines in thermal infrared (IR) imagery, using data acquired at multiple time instances. Dynamic (multitem- poral/diurnal) IR thermography studies the temporal evolution of the temperature profile of a body under changing heating conditions, and has been extensively used in nondestructive testing (NDT) [1]. The objective of NDT is the reconstruction of the inner structure of solids in order to detect the presence of defects in a workpiece [2]. This technique is based on the dif- ference in time evolution of the temperature between defect and nondefect points at the surface. Models of the involved physical processes were later proposed and solved using numerical methods which helped deriving image processing algorithms to obtain the geometry (planar size, depth) of the defect [3]. The use of (dynamic) IR thermography for the detection of buried landmines is a much more recent application, although the basic theory was outlined by Kenneth Watson in 1975 [4]. Manuscript received June 4, 2003; revised April 5, 2004. This work was sup- ported in part by the EC-IST Project CLEARFAST-IST-2000-25173. P. López Martínez was with the Department of Electronics and Computer Science of the University of Santiago de Compostela, Santiago de Compostela, Spain. She is now with the Fraunhofer Institute for Integrated Circuits, 91052 Erlangen, Germany (e-mail: [email protected]). L. van Kempen and H. Sahli are with the Department of Electronics and Information Processing, Vrije Universiteit Brussel, B-1050 Brussels, Belgium (e-mail: [email protected]; [email protected]). D. Cabello Ferrer is with the Department of Electronics and Computer Sci- ence of the University of Santiago de Compostela, E-15782 Santiago de Com- postela, Spain (e-mail: [email protected]). Digital Object Identifier 10.1109/TGRS.2004.831884 Many experimental, empirical and theoretical studies have been devoted to IR detection of landmines during the last years. The study of the basic phenomenology leads to the development of mathematical models of the soil. Despite the fact that the models which predict the thermal signature of landmines are still in an early stage of development, a major advance has been made in the modeling of homogeneous soils during diurnal cycles [5]–[8]. A very complete model, based on the use of the finite difference method, is the one in [9], which gives an insight into the dependance of the thermal parameters on the water content and density of the soil. A deep analysis of the evolution of the thermal contrast over a diurnal cycle can be found in [10], where the conditions for detection are established. Finally, in [11], a thermal model is combined with a radiometric model in order to improve comprehension and interpretation of thermal IR im- agery and suggest more efficient use of IR sensors. Parallel to that, several image processing techniques have also been developed to detect the presence of buried landmines from measured IR images. In [12], Batman et al. used morpholog- ical operators combined with the principal component analysis (PCA) to process multispectral images. In [13], the use of su- pervised and unsupervised classification techniques on textural and spectral characteristics of the images has been reported. Modeling the spatiotemporal temperature signature of a buried landmine by means of three-dimensional (3-D) Gaussians and matched filters has been considered in [14] and [15]. In this paper, we propose a new method for the detection and classification of landmines with low or null metal content. We base the analysis on the different thermodynamic behavior of landmines with respect to the surrounding background. To this aim, we have developed a 3-D model for bare soils subject to insolation, radiating heating and cooling, and heat exchange with the atmosphere. Using this model, the landmine detection/classification is accomplished as follows. First, we model the thermal behavior of the soil volume subject to known boundary conditions. We will refer to this as the forward thermal model. Unexpected behaviors (perturbations), caused by the presence of unknown objects affecting the thermal sig- nature of the soil (background), will be detected by comparing the actual (acquired) and modeled (predicted) measurements. The second step is the classification, that aims at determining the nature and depth of burial of the detected objects. For this task, we propose an iterative approach in which the forward thermal model of the soil is applied to different parameter distributions. The nature of the proposed approach allows us to incorporate efficiently physics-based models and image processing methods to improve the detection of landmines. The proposed approach is compared with independent component analysis (ICA). 0196-2892/04$20.00 © 2004 IEEE
Transcript of Improved thermal analysis of buried landmines
IEEE TRANSACTIONS ON GEOSCIENCE AND REMOTE SENSING, VOL. 42, NO. 9, SEPTEMBER 2004 1965
Improved Thermal Analysis of Buried LandminesPaula López Martínez, Member, IEEE, Luc van Kempen, Hichem Sahli, Member, IEEE, and
Diego Cabello Ferrer, Member, IEEE
Abstract—In this paper, we address the problem of the detectionand identification of surface-laid and shallowly buried landminesfrom measured infrared images. A three-dimensional thermalmodel has been developed to study the effect of the presence oflandmines in the thermal signature of the bare soil. Based on thismodel, a target identification procedure is proposed aiming atdetecting and classifying the anomalies found on the soil thermalsignature. In our approach, landmines are thought of as a thermalbarrier in the natural flow of the heat inside the soil, whichproduces a perturbation of the expected thermal pattern on thesurface. The detection of these perturbations will put into evidencethe presence of potential mine targets. We propose an iterativeprocedure to classify the detected perturbations as mines or non-mines and to estimate their depth of burial. This paper describesthe main principles of our method and illustrates classificationresults on a set of acquired images. Qualitative and quantitativecomparisons with independent component analysis are also given.
Index Terms—Dynamic infrared (IR) thermography, indepen-dent component analysis (ICA), landmine detection, nondestruc-tive testing (NDT), thermal modeling.
I. INTRODUCTION
I N THIS WORK, we examine physics-based models andimage processing methods for improving the detection
of buried landmines in thermal infrared (IR) imagery, usingdata acquired at multiple time instances. Dynamic (multitem-poral/diurnal) IR thermography studies the temporal evolutionof the temperature profile of a body under changing heatingconditions, and has been extensively used in nondestructivetesting (NDT) [1]. The objective of NDT is the reconstructionof the inner structure of solids in order to detect the presence ofdefects in a workpiece [2]. This technique is based on the dif-ference in time evolution of the temperature between defect andnondefect points at the surface. Models of the involved physicalprocesses were later proposed and solved using numericalmethods which helped deriving image processing algorithms toobtain the geometry (planar size, depth) of the defect [3].
The use of (dynamic) IR thermography for the detection ofburied landmines is a much more recent application, althoughthe basic theory was outlined by Kenneth Watson in 1975 [4].
Manuscript received June 4, 2003; revised April 5, 2004. This work was sup-ported in part by the EC-IST Project CLEARFAST-IST-2000-25173.
P. López Martínez was with the Department of Electronics and ComputerScience of the University of Santiago de Compostela, Santiago de Compostela,Spain. She is now with the Fraunhofer Institute for Integrated Circuits, 91052Erlangen, Germany (e-mail: [email protected]).
L. van Kempen and H. Sahli are with the Department of Electronics andInformation Processing, Vrije Universiteit Brussel, B-1050 Brussels, Belgium(e-mail: [email protected]; [email protected]).
D. Cabello Ferrer is with the Department of Electronics and Computer Sci-ence of the University of Santiago de Compostela, E-15782 Santiago de Com-postela, Spain (e-mail: [email protected]).
Digital Object Identifier 10.1109/TGRS.2004.831884
Many experimental, empirical and theoretical studies have beendevoted to IR detection of landmines during the last years. Thestudy of the basic phenomenology leads to the development ofmathematical models of the soil. Despite the fact that the modelswhich predict the thermal signature of landmines are still in anearly stage of development, a major advance has been madein the modeling of homogeneous soils during diurnal cycles[5]–[8]. A very complete model, based on the use of the finitedifference method, is the one in [9], which gives an insight intothe dependance of the thermal parameters on the water contentand density of the soil. A deep analysis of the evolution of thethermal contrast over a diurnal cycle can be found in [10], wherethe conditions for detection are established. Finally, in [11], athermal model is combined with a radiometric model in orderto improve comprehension and interpretation of thermal IR im-agery and suggest more efficient use of IR sensors.
Parallel to that, several image processing techniques have alsobeen developed to detect the presence of buried landmines frommeasured IR images. In [12], Batman et al. used morpholog-ical operators combined with the principal component analysis(PCA) to process multispectral images. In [13], the use of su-pervised and unsupervised classification techniques on texturaland spectral characteristics of the images has been reported.Modeling the spatiotemporal temperature signature of a buriedlandmine by means of three-dimensional (3-D) Gaussians andmatched filters has been considered in [14] and [15].
In this paper, we propose a new method for the detectionand classification of landmines with low or null metal content.We base the analysis on the different thermodynamic behaviorof landmines with respect to the surrounding background.To this aim, we have developed a 3-D model for bare soilssubject to insolation, radiating heating and cooling, and heatexchange with the atmosphere. Using this model, the landminedetection/classification is accomplished as follows. First, wemodel the thermal behavior of the soil volume subject to knownboundary conditions. We will refer to this as the forwardthermal model. Unexpected behaviors (perturbations), causedby the presence of unknown objects affecting the thermal sig-nature of the soil (background), will be detected by comparingthe actual (acquired) and modeled (predicted) measurements.The second step is the classification, that aims at determiningthe nature and depth of burial of the detected objects. For thistask, we propose an iterative approach in which the forwardthermal model of the soil is applied to different parameterdistributions. The nature of the proposed approach allows usto incorporate efficiently physics-based models and imageprocessing methods to improve the detection of landmines. Theproposed approach is compared with independent componentanalysis (ICA).
0196-2892/04$20.00 © 2004 IEEE

1966 IEEE TRANSACTIONS ON GEOSCIENCE AND REMOTE SENSING, VOL. 42, NO. 9, SEPTEMBER 2004
The paper is organized as follows. The mathematical formu-lation of the model, its numerical solution, and its validationwith experimental data are presented in Section II. Based onthis model, we propose in Section III a target identification pro-cedure (TIP) for the detection and classification of landmines.Section IV introduces the independent component analysis as adetection tool. In Section V, qualitative and quantitative compar-isons of the TIP- and ICA-based methods for landmine detectionare discussed. Finally, conclusions are drawn in Section VI.
II. MODEL DESCRIPTION
A. Mathematical Formulation
We present a 3-D thermal model for bare soils subject toknown boundary conditions where both the soil and the possibleburied targets will be modeled as isotropic solids. We also as-sume that the temporal variation of the moisture content duringthe time of analysis is negligible. This is a prototype model usedto illustrate the detection procedure proposed in this paper. Theoverall process is described by the time-dependent single-phase3-D heat equation [16]
(1)
where [kg/m is the density, [J/kg K] the specific heat,[W/mK] the thermal conductivity, [m /s] the thermal diffu-
sivity, and the distribution of temperatures inside the soil.In order to solve (1), the following boundary conditions have tobe taken into account:
for
for
in
(2)
where is the soil volume, the portion of the surface ac-cessible for measurements, and is the normal to the soil sur-face ; is the time interval of analysis, and
the temperature of the soil at a sufficiently deep depth.The first condition in (2) establishes the heat flux throughthe portion of the boundary of the soil accessible for measure-ments , while the exchange through the other boundaries isassumed to be null (second condition). The third and four con-ditions in (2) account, respectively, for the initial distribution oftemperatures in the soil and the so-called deep-ground condi-tion, which assumes that the temperature at a certain depth canbe supposed to be constant. The thermal flow on the surface isdriven by the convective and radiative heat transfer, and is in-troduced via a boundary condition at the soil–air interface. Wewrite
(3)
where is the net heat flux in the direction of the normal tothe soil surface accessible for measurements, is the incidentsolar radiation, is the heat transfer term due to radiation,and is the heat transfer due to convection. These termshave been extensively discussed in [17].
For the solution of the system of (1) and (2), we made useof numerical methods, particularly the finite difference method(FDM) [18], [19]. Under this approach, the 3-D soil volumecan be viewed as a set of parallel slices, each projected on atwo-dimensional processing layer consisting of a number ofprocessing elements. Thus, the precision of the simulations canbe adjusted by modifying the size of the network and/or the spa-tial discretization steps depending on the resolu-tion of the acquisition system. This solution, in its discrete na-ture, has an algorithmic form with a reduced connectivity thatmakes it suitable both for a computational solution or a hard-ware projection onto an array of distributed processing elementsas we showed in [20] and [21].
B. Initialization Considerations
Several parameters are to be considered for the simulation,mainly, the thermal diffusivity of soil and target, and the tem-perature distribution in the soil. As mentioned above, in thispaper we consider a bare soil with known thermal properties.In the case of the mine targets, we will assume that theirthermal evolution is driven by the thermal properties of theexplosive used, which is commonly TNT composition B-3 or,less frequently, Tetryl. For the experiments reported in thispaper, we used surrogated mines filled with a silicone rubber,the RTV3110 [22], a material with similar thermal propertiesto those of TNT m s [23].
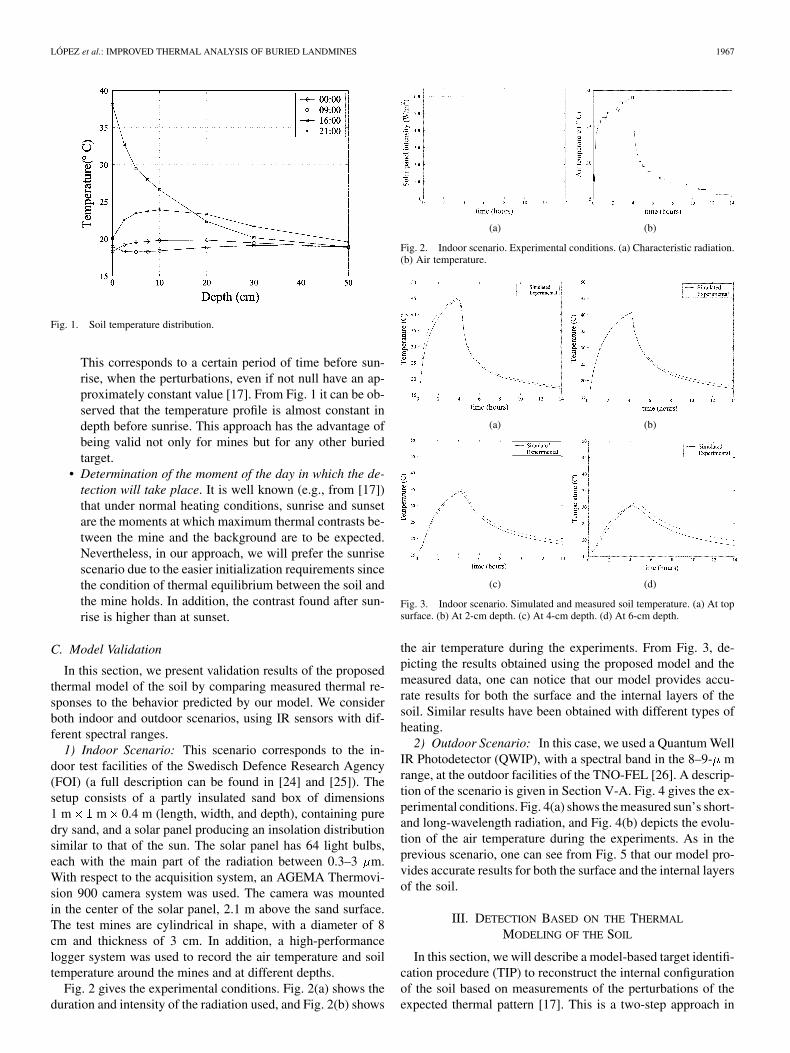
Following the third condition in (2), initial temperatureshould be attached to each node of the computational volume.This corresponds to the initial distribution of temperatures inthe soil. In our approach, initial temperatures on the top surfaceof the computational volume are estimated from the IR imageusing a pixel-to-node projection (ground-projected image).Note that the spatial discretization of the 3-D computationalvolume has to be adjusted to match the spatial resolution of theacquired IR image. Initial temperatures of the internal layersof the computational volume are estimated via soil tempera-ture measurement probes. As the IR image provides apparenttemperatures, and the probes measure real temperatures, wemake the assumption that, although the real and apparent dis-tributions are different in absolute value, they follow the samepattern, also known as the soil signature. Fig. 1 shows typicaldistributions of soil temperatures at different times of the day.The measured values (at different depths and day time) aremarked with symbols, while the solid lines connecting thesemeasurements give the expected temperature at any depth. Theapparent values given by the IR sensor (i.e., surface apparenttemperature) will be used to estimate, from the correspondingcurve at that given day time, the apparent soil temperaturedistribution.
Two other aspects should be addressed when dealing withsimulation/prediction of thermal behavior.
• Initial soil distribution in case of the presence of buriedobjects. An efficient solution consists of starting the sim-ulation at a time in which the presence of the target doesnot affect the soil signature; that is, when the target andthe background have reached a state of thermal equilib-rium, and the variation of the temperature in depth is small.
LÓPEZ et al.: IMPROVED THERMAL ANALYSIS OF BURIED LANDMINES 1967
Fig. 1. Soil temperature distribution.
This corresponds to a certain period of time before sun-rise, when the perturbations, even if not null have an ap-proximately constant value [17]. From Fig. 1 it can be ob-served that the temperature profile is almost constant indepth before sunrise. This approach has the advantage ofbeing valid not only for mines but for any other buriedtarget.
• Determination of the moment of the day in which the de-tection will take place. It is well known (e.g., from [17])that under normal heating conditions, sunrise and sunsetare the moments at which maximum thermal contrasts be-tween the mine and the background are to be expected.Nevertheless, in our approach, we will prefer the sunrisescenario due to the easier initialization requirements sincethe condition of thermal equilibrium between the soil andthe mine holds. In addition, the contrast found after sun-rise is higher than at sunset.
C. Model Validation
In this section, we present validation results of the proposedthermal model of the soil by comparing measured thermal re-sponses to the behavior predicted by our model. We considerboth indoor and outdoor scenarios, using IR sensors with dif-ferent spectral ranges.
1) Indoor Scenario: This scenario corresponds to the in-door test facilities of the Swedisch Defence Research Agency(FOI) (a full description can be found in [24] and [25]). Thesetup consists of a partly insulated sand box of dimensions1 m m 0.4 m (length, width, and depth), containing puredry sand, and a solar panel producing an insolation distributionsimilar to that of the sun. The solar panel has 64 light bulbs,each with the main part of the radiation between 0.3–3 m.With respect to the acquisition system, an AGEMA Thermovi-sion 900 camera system was used. The camera was mountedin the center of the solar panel, 2.1 m above the sand surface.The test mines are cylindrical in shape, with a diameter of 8cm and thickness of 3 cm. In addition, a high-performancelogger system was used to record the air temperature and soiltemperature around the mines and at different depths.
Fig. 2 gives the experimental conditions. Fig. 2(a) shows theduration and intensity of the radiation used, and Fig. 2(b) shows
(a) (b)
Fig. 2. Indoor scenario. Experimental conditions. (a) Characteristic radiation.(b) Air temperature.
(a) (b)
(c) (d)
Fig. 3. Indoor scenario. Simulated and measured soil temperature. (a) At topsurface. (b) At 2-cm depth. (c) At 4-cm depth. (d) At 6-cm depth.
the air temperature during the experiments. From Fig. 3, de-picting the results obtained using the proposed model and themeasured data, one can notice that our model provides accu-rate results for both the surface and the internal layers of thesoil. Similar results have been obtained with different types ofheating.
2) Outdoor Scenario: In this case, we used a Quantum WellIR Photodetector (QWIP), with a spectral band in the 8–9- mrange, at the outdoor facilities of the TNO-FEL [26]. A descrip-tion of the scenario is given in Section V-A. Fig. 4 gives the ex-perimental conditions. Fig. 4(a) shows the measured sun’s short-and long-wavelength radiation, and Fig. 4(b) depicts the evolu-tion of the air temperature during the experiments. As in theprevious scenario, one can see from Fig. 5 that our model pro-vides accurate results for both the surface and the internal layersof the soil.
III. DETECTION BASED ON THE THERMAL
MODELING OF THE SOIL
In this section, we will describe a model-based target identifi-cation procedure (TIP) to reconstruct the internal configurationof the soil based on measurements of the perturbations of theexpected thermal pattern [17]. This is a two-step approach in

1968 IEEE TRANSACTIONS ON GEOSCIENCE AND REMOTE SENSING, VOL. 42, NO. 9, SEPTEMBER 2004
(a) (b)
Fig. 4. Outdoor scenario. Experimental conditions. (a) Short- andlong-wavelength sun irradiance. (b) Air temperature.
(a) (b)
Fig. 5. Outdoor scenario. (Solid) Simulated and (dahsed) measured soiltemperature. (a) Distribution on the surface. (b) Distribution at 10 cm.
which the detection of the targets is followed by a classificationprocedure.
A. Detection Phase
The detection phase takes one IR snapshot and uses the modeldescribed in Section II to generate the expected thermal evolu-tion assuming that there are no buried objects. It then comparesexpected and measured sequences to put into evidence the pres-ence of buried targets. This comparison is not trivial. The moststraightforward approach, the thresholded subtraction of bothsequences, has the drawback of setting the threshold, which willvary not only for different image sequences, but it is also likelyto depend on the particular frame of the sequence, and on thecharacteristics of the measured data such as lighting conditionsand the nature and duration of the heating (see Section V-C).For this reason, the use of a reconfigurable structure, capable ofadapting to varying experimental conditions, is desirable.
Based on an early work [27], we propose the use of theso-called cellular neural (or nonlinear) networks (CNNs) [28].This processing paradigm has been successfully applied toimage processing tasks, and has among its main advantagesits reduced connectivity, which facilitates the interconnectionof several processing layers to form complex structures. Theconsidered topology is shown in Fig. 6. In order to account forthe thermal evolution in time, four input layersare considered, each of them receiving two input images, themeasured and modeled data of the inspected area,at a given time instance . The two other levels of processingcombine the output information of the four layers so that theglobal output of the network will be a single binary (B/W)image indicating the position of the possible mine targets.
Fig. 6. Proposed network topology for the neural network implementation ofthe detection phase of the TIP.
For the training, we used stochastic optimization methods,particularly genetic algorithms (GAs) in the way introducedin [27]. This supervised training requires the definition of anadequate training pattern that must reflect the actual condi-tions of the minefield and include different types of mines atdifferent depths of burial. These aspects will be discussed inSection V-B1 for the considered outdoor minefield scenario.
B. Classification Phase
The model described in Section II-A [(1) and (2)] can be ex-pressed as follows: given the boundary conditions, and a distri-bution of the model parameters within , find the resultingmeasurement set on . Mathematically, we have
(4)
Equation (4) is a general representation of a forward modelinvolving an operator , an idealized map, representing thephysical connection between the model and the measured data
being the distribution of parameters that gives rise tounder the application of the operator . An inverse problem ofthis will be the reconstruction of the original distribution of pa-rameters based on measurements subject to a measurementerror . This can be expressed as a best fit problem in whichthe functional to be minimized
(5)
represents the misfit between the simulated model and the mea-sured data. The minimization of this functional will lead to theextraction of the set of parameters . In our case, the soil’sthermal signature (given by ) is supposed to be known and isaffected by the presence of targets, placed at an unknown depth
with . Hence we have
(6)
In general, this reconstruction is not possible unless additionalinformation of the solution is incorporated in the model bymeans of the so-called regularization techniques [29]–[31]. Itis, however, possible to solve the inverse problem without the

LÓPEZ et al.: IMPROVED THERMAL ANALYSIS OF BURIED LANDMINES 1969
explicit use of a regularization strategy under proper initializa-tion conditions. Moreover, the long history of iteration methodsshows that many exhibit a self-regularization property.
Once the spatial position of the targets has been iden-tified, using the detection phase as described in Section III-A,our goal is to classify the (detected) targets into either mine orsoil categories; any target that fails to fit into these categorieswill be classified as unknown. Moreover, for the mine category,the depth of burial will be given. To do so, a classification mapwill be estimated by evaluating (5) (which expresses the de-viation between the observed IR data and the modeled data)using known parameter distributions . Equation (5) will beevaluated assuming that all the detected targets are mines, i.e.,
, buried at discrete depths
(7)
with the discretization step and the (considered) max-imum depth of burial.
Let us assume the following.
• Let , be the acquired IR sequence ofimages, being the total number of frames.
• Let be the modeled temperature image at time .is estimated by considering that all the detected
targets are landmines buried at the depth given by index.
Note that in the following we will concentrate only on thoseareas of the image that were marked as possible targets in thedetection phase of the TIP. The rest of the pixels will be auto-matically classified as Soil.
The obtention of the classification map for the detected tar-gets is done through the definition of a classification operatorwhich includes the following computations.
• For each time interval and burial depth, an error map is estimated
by evaluating (5) for each pixel position .• For each time interval , a global error map and a
global classification map are estimated iteratively bycomparing the error maps , as follows.1) Initialization step: For each pixel
( a predefined threshold error value); soil.2) Iterative update step: For each burial depth
and argmin (thecategory for which the error is smaller, i.e., the burialdepth). If , then is set to Un-known.
• Once and have been obtained, we combine all thesepartial maps ( , respectively ) into single ones ( , re-spectively ) in the following way.1) : Pixels classified as mines at any processing step are
kept in the final classification map. For the others, wekeep the category that appears more times.
2) . This is a very conserva-tive approach aiming to reduce the number of false neg-atives (failure to detect a buried mine) even at the costof increasing the false-alarm rate (FAR) of the system.
3) To find a tradeoff between the accuracy of the classi-fication and the number of false alarms, we define a
Fig. 7. Example of the operating principle of the classification operator �.
cutoff error, . If the entry on the error map, for apixel exceeds , the pixel will be automatically as-signed to the category of Unknown. is estimatedempirically.
An example of the classification process is outlined in Fig. 7for . In Fig. 7 (top), the inputs to the classification processare given, namely the mask (binary image) of the detected tar-gets, and the initial error (set to ) and classification maps. Asseen, the initial assumption is that all the scene belongs to theSoil class. The process works by generating a classification map,
, and an error map based on the error maps, . Bothand are updated for every possible value of . Note that thisupdate takes place only for the target pixels. For , corre-sponding to the hypothesis that the detected targets are placed onthe surface, the target on the top right is classified as a surfacemine (class depth “0”). The pixels of the target in the bottom,have been classified as surface mine (class depth “0”), exceptfor the left bottom corner pixel, classified as Unknown (U), sincethe value at this pixel exceeds the value of . For and
, the classification of the pixels of the upper target doesnot vary because is higher than in the case of , butfor the bottom target some pixels have smaller values andhence their classification varies.
IV. DETECTION BASED ON ICA
ICA, which is akin to PCA, is a method used to separate in-dependent sources out of measurements of mixtures of thesesources’s signals. Most currently used ICA algorithms [32] as-sume linear mixing, i.e., the measurement is a linear combina-
1970 IEEE TRANSACTIONS ON GEOSCIENCE AND REMOTE SENSING, VOL. 42, NO. 9, SEPTEMBER 2004
tion of the source signals, as shown by the generative linear ICAmodel
(8)
where is the vector of the observed signals, is called themixing matrix and are the independent source signals. Theadditive noise can be present in the model. Based on the as-sumption that the source signals are mutually statistically in-dependent, the solution is obtained in an unsupervised learningprocess, which finds the demixing matrix , such that
is an estimate of . The components of are required tobe as mutually independent as possible.
ICA has also been proposed as a generic statistical model forimages. In this case an image is modeled as
(9)
where , are referred to as ICA image basisfunctions, and , are statistically independentweighting components.
In this paper we follow the approach proposed in [33] forfilter-based texture segmentation. The basic idea is to generatea data dependent filter bank for landmine detection in dynamicthermography. The input thermal images are then filteredthrough the bank of filters, the resulting filtered images willhave high energy in regions corresponding to anomalies whichare tuned to the filter (mine). By thresholding the filtered image,one can detect the mines.
The filter bank consists of the ICA basis functions learnedfrom dynamic thermal images of land mines. We represent animage as a column vector by reshaping theimage matrix row-by-row into a single column. From (9), thebasis functions are the columns of the x matrix , and
. In our case we construct ICA basis functionsof size (m m), with , the columns , of in (9), are ofsize , with . This is also the case for the trainingdata . The training data are generated by extracting (m m)image patches, around a mine target, from the image set used fortraining the CNN (see the top row of Fig. 10). The estimation ofthe bank filters includes the following computations.
• Extract an image patch of size (m m) from the inputs,corresponding to mine images.
• Normalize training mine images and make them zeromean.
• Represent samples as columns and store in a matrix con-sisting of training vectors.
• The ensemble of training data are presented to the FastICA algorithm developed by Hyvärinen [34].
After convergence of the Fast ICA algorithm, the matrixhas been learned from available training data. Matrix is ob-tained by finding the pseudoinverse of . As a last step, thecolumns are reshaped into size (m m) toconstitute the bank filters.
After estimating the bank filters, the detection phase is as fol-lows.
• The input thermal images are filtered using the estimatedbank of filters.
(a) (b)
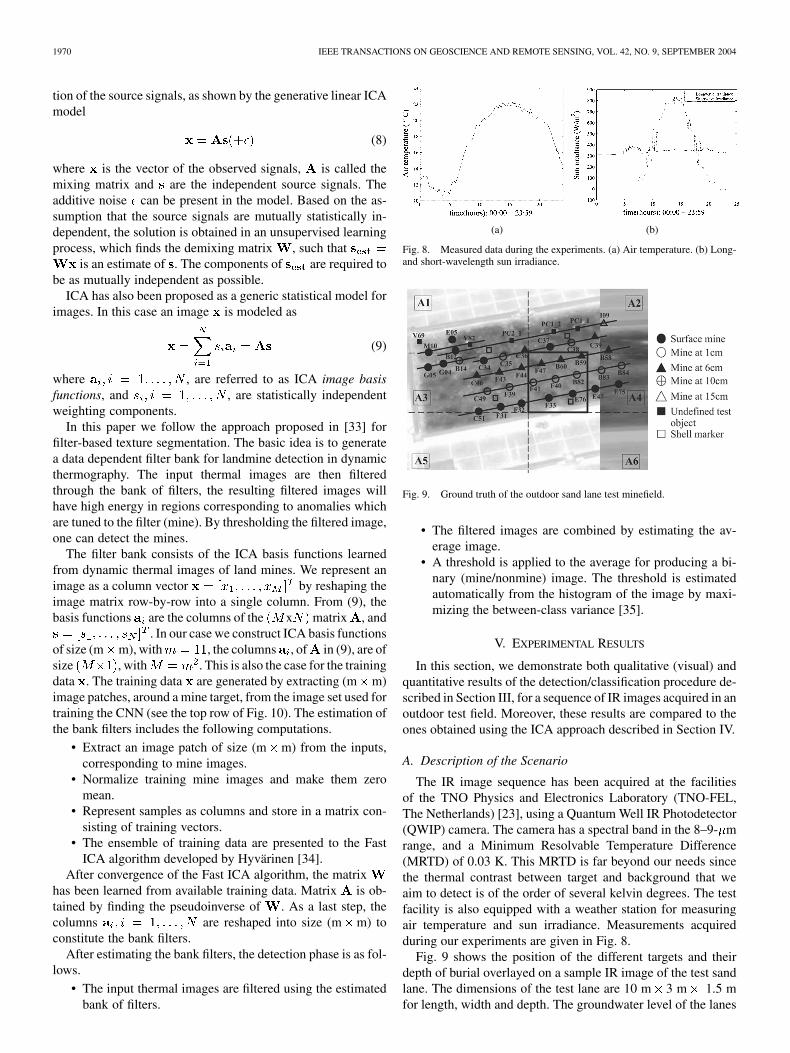
Fig. 8. Measured data during the experiments. (a) Air temperature. (b) Long-and short-wavelength sun irradiance.
Fig. 9. Ground truth of the outdoor sand lane test minefield.
• The filtered images are combined by estimating the av-erage image.
• A threshold is applied to the average for producing a bi-nary (mine/nonmine) image. The threshold is estimatedautomatically from the histogram of the image by maxi-mizing the between-class variance [35].
V. EXPERIMENTAL RESULTS
In this section, we demonstrate both qualitative (visual) andquantitative results of the detection/classification procedure de-scribed in Section III, for a sequence of IR images acquired in anoutdoor test field. Moreover, these results are compared to theones obtained using the ICA approach described in Section IV.
A. Description of the Scenario
The IR image sequence has been acquired at the facilitiesof the TNO Physics and Electronics Laboratory (TNO-FEL,The Netherlands) [23], using a Quantum Well IR Photodetector(QWIP) camera. The camera has a spectral band in the 8–9- mrange, and a Minimum Resolvable Temperature Difference(MRTD) of 0.03 K. This MRTD is far beyond our needs sincethe thermal contrast between target and background that weaim to detect is of the order of several kelvin degrees. The testfacility is also equipped with a weather station for measuringair temperature and sun irradiance. Measurements acquiredduring our experiments are given in Fig. 8.
Fig. 9 shows the position of the different targets and theirdepth of burial overlayed on a sample IR image of the test sandlane. The dimensions of the test lane are 10 m 3 m 1.5 mfor length, width and depth. The groundwater level of the lanes
LÓPEZ et al.: IMPROVED THERMAL ANALYSIS OF BURIED LANDMINES 1971
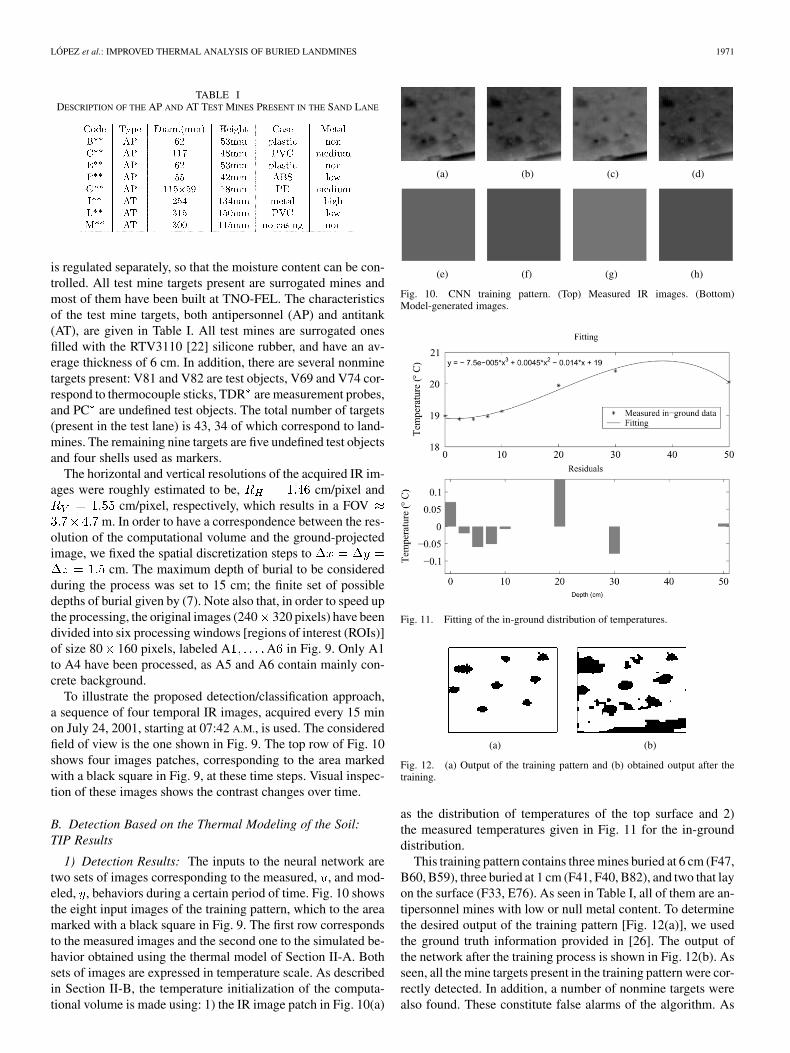
TABLE IDESCRIPTION OF THE AP AND AT TEST MINES PRESENT IN THE SAND LANE
is regulated separately, so that the moisture content can be con-trolled. All test mine targets present are surrogated mines andmost of them have been built at TNO-FEL. The characteristicsof the test mine targets, both antipersonnel (AP) and antitank(AT), are given in Table I. All test mines are surrogated onesfilled with the RTV3110 [22] silicone rubber, and have an av-erage thickness of 6 cm. In addition, there are several nonminetargets present: V81 and V82 are test objects, V69 and V74 cor-respond to thermocouple sticks, TDR are measurement probes,and PC are undefined test objects. The total number of targets(present in the test lane) is 43, 34 of which correspond to land-mines. The remaining nine targets are five undefined test objectsand four shells used as markers.
The horizontal and vertical resolutions of the acquired IR im-ages were roughly estimated to be, cm/pixel and
cm/pixel, respectively, which results in a FOVm. In order to have a correspondence between the res-
olution of the computational volume and the ground-projectedimage, we fixed the spatial discretization steps to
cm. The maximum depth of burial to be consideredduring the process was set to 15 cm; the finite set of possibledepths of burial given by (7). Note also that, in order to speed upthe processing, the original images (240 320 pixels) have beendivided into six processing windows [regions of interest (ROIs)]of size 80 160 pixels, labeled A A in Fig. 9. Only A1to A4 have been processed, as A5 and A6 contain mainly con-crete background.
To illustrate the proposed detection/classification approach,a sequence of four temporal IR images, acquired every 15 minon July 24, 2001, starting at 07:42 A.M., is used. The consideredfield of view is the one shown in Fig. 9. The top row of Fig. 10shows four images patches, corresponding to the area markedwith a black square in Fig. 9, at these time steps. Visual inspec-tion of these images shows the contrast changes over time.
B. Detection Based on the Thermal Modeling of the Soil:TIP Results
1) Detection Results: The inputs to the neural network aretwo sets of images corresponding to the measured, , and mod-eled, , behaviors during a certain period of time. Fig. 10 showsthe eight input images of the training pattern, which to the areamarked with a black square in Fig. 9. The first row correspondsto the measured images and the second one to the simulated be-havior obtained using the thermal model of Section II-A. Bothsets of images are expressed in temperature scale. As describedin Section II-B, the temperature initialization of the computa-tional volume is made using: 1) the IR image patch in Fig. 10(a)
(a) (b) (c) (d)
(e) (f) (g) (h)
Fig. 10. CNN training pattern. (Top) Measured IR images. (Bottom)Model-generated images.
Fig. 11. Fitting of the in-ground distribution of temperatures.
(a) (b)
Fig. 12. (a) Output of the training pattern and (b) obtained output after thetraining.
as the distribution of temperatures of the top surface and 2)the measured temperatures given in Fig. 11 for the in-grounddistribution.
This training pattern contains three mines buried at 6 cm (F47,B60, B59), three buried at 1 cm (F41, F40, B82), and two that layon the surface (F33, E76). As seen in Table I, all of them are an-tipersonnel mines with low or null metal content. To determinethe desired output of the training pattern [Fig. 12(a)], we usedthe ground truth information provided in [26]. The output ofthe network after the training process is shown in Fig. 12(b). Asseen, all the mine targets present in the training pattern were cor-rectly detected. In addition, a number of nonmine targets werealso found. These constitute false alarms of the algorithm. As

1972 IEEE TRANSACTIONS ON GEOSCIENCE AND REMOTE SENSING, VOL. 42, NO. 9, SEPTEMBER 2004
(a) (b)
(c) (d)
Fig. 13. TIP detection results. (a) A1. (b) A2. (c) A3. (d) A4.
we will see later in this section, the classification phase will sig-nificantly reduce the number of false alarms. With respect to thetraining, we used an elitist GA (that always keeps a copy of thebest individual in the next generation) with a population size of75 individuals, binary codification, mutation rate of ,two-point crossover with , tournament selection, anda maximum number of generations of . The GAstops when the maximum number of generations is met, theerror function is minimized, or the population standard devia-tion fitness drops below a certain level for a given number ofgenerations. In this case several GA simulations were run and,on average, only 20 iterations were needed to reach an error afterthe training, defined as the percentage of incorrect output pixels,of the 5%.
The detection results of the whole scenario of Fig. 9 areshown in Fig. 13. The eight mine targets present during thetraining phase (F33, E76, F40, F41, B82, B59, B60, and F47)were excluded from the analysis of the performance. Also,for evaluation purposes, isolated pixels, or groups of pixelsthat cannot correspond to mines, such as a one-pixel widthrow, were not taken into account. In Fig. 13, the mine targetsare marked with solid boxes, and nonmine targets (NMT) aremarked with dashed boxes. This marking was made manually,by comparing the positions of the ground truth (Fig. 9) and thedetected targets.
The performance of the detection phase will be expressed interms of the probability of detection, , and FAR
FAR
where is the number of mine targets detected and thetotal number of mines present, the number of nonminetargets detected, and the total number of targets found in thedetection phase. In this case , corresponding to 24 outof 26 mines correctly detected (excluding the eight mine targetsused in the training pattern). For the FAR, we find that a total
(a) (b)
(c) (d)
Fig. 14. TIP classification results. Final error map.
(a) (b)
(c) (d)
Fig. 15. TIP classification results. Final classification map (colorcorrespondence: Sand �20, surface-laid mine �40, buried mine�1–15,and unknown �25). (a) A1. (b) A2. (c) A3. (d) A4.
of 51 alarms occurred, excluding those of the training pattern.Hence, FAR .
2) Classification Results: The classification phase classifiesthe previously detected targets as Mine or Unknown. Moreover,for the Mine class, subcategories corresponding to the depth ofburial are produced. Fig. 14 shows the final error map obtainedusing the inverse-like procedure described in Section III-B. Notethat the entries on the error map, expressed in Celsius degrees,are shown only for the positions (pixels) of the detected targetsin Fig. 13. The final classification map is given in Fig. 15,where different colors are associated to the different categories:Sand Surface-laid mine , Buried mine – , and

LÓPEZ et al.: IMPROVED THERMAL ANALYSIS OF BURIED LANDMINES 1973
TABLE IICOMPARISON OF THE ACTUAL DEPTH OF BURIAL OF THE MINE TARGETS
PRESENT IN THE TEST MINEFIELD IN FIG. 9 WITH THE ESTIMATIONS
GIVEN BY THE CLASSIFICATION STAGE OF THE TIP
Unknown . Note that the category of a buried mine cor-responds to its burial depth. The results in Fig. 15 are obtainedfrom Fig. 14 using a cutoff error to decide wethera pixel will be classified as Unknown or not. Table II shows acompilation of the estimated and actual values of the depth ofburial for the mine targets for .
The performance of the classification operator is evaluated bymaking use of two properties, sensitivity and specificity [36]
SensitivityTP
TP FNSpecificity
TNTN FP
being TP the number of true positives, TN the number of truenegatives, FP the number of false positives, and FN the numberof false negatives. As seen in Table III, the performance de-pends strongly on the election of , being a tradeoff betweensensitivity and specificity, i.e., between the number of mine tar-gets correctly classified and the number of false alarms. In hu-manitarian operations, the stress is put on the correct locationof mines, while reducing the number of false alarms, althoughhighly desirable, is a secondary goal. The resulting empiricallyderived receiver operating characteristic (ROC) curve, a plot ofthe true positive rate against the false positive rate for the dif-ferent cutpoints of the diagnostic test, is plotted in Fig. 16. Thecloser the curve follows the left-hand border and then the topborder of the ROC space, the more accurate the test.
3) Global Performance of the TIP: The global performanceis obviously a function of the value of considered in the
TABLE IIIEFFECT OF e ON THE CLASSIFICATION OPERATOR
Fig. 16. ROC curve of the classification operator.
classification phase. Making use of a conservative approach,, we find that 24 mines were correctly detected and
classified over a total of 26, excluding the ones in the trainingset, thus making . At the same time,the number of false positives is 13 compared to the 27 foundafter the application of the detection operator alone, makingFAR . Again, the two nonmine targets in theoutput of the training set, NMT26 and NMT27, were excludedfrom the calculation. In conclusion, the addition of the classifi-cation stage served to reduce the FAR from 0.53 (when detectionalone was considered), to 0.25, without affecting the probabilityof detection.
C. Comparison
In this section, we compare the results of our method tothose obtained using the ICA approach described in Section IV.Fig. 17 shows the results of the ICA approach applied to the IRsequence used in Section V-B. In Fig. 17(a), the two reflectorsare detected; also some clutter is present, with lower intensity.In Fig. 17(b), the three mines are detected (including the deepI09 mine). However, some strong clutter remains. In Fig. 17(c),nine of the 13 present mines have been detected. Finally,Fig. 17(d) shows nine detected mines. The ones which are lostdue to too weak response are the B60 and B59 mines, both ata depth of 6 cm.

1974 IEEE TRANSACTIONS ON GEOSCIENCE AND REMOTE SENSING, VOL. 42, NO. 9, SEPTEMBER 2004
(a) (b)
(c) (d)
Fig. 17. ICA-based detection.
TABLE IVCOMPARISON OF THE PERFORMANCE OF THE DIFFERENT STRATEGIES
CONSIDERED: MODEL-BASED TIP AND ICA
Table IV shows the comparison between the number of minesdetected at different depths for each of the strategies consideredhere: the model-based TIP and the ICA. For the TIP, those minesincluded in the training pattern of the detection phase were notconsidered for the calculation of the performance. The proba-bility of detection and FAR in each case are also shown. As ob-served, the TIP clearly outperforms the ICA strategy in termsof probability of detection and reduced number of false alarms.The ICA, however, has the advantage over the TIP of its com-putational simplicity. In addition, it was capable of detecting themine buried at 15 cm, where the TIP was unsuccessful. This sug-gests that both methods could be used in conjunction in order toincrease the detection probability.
The overall conclusion will be that the detection of buriedplastic landmines at shallow depths using IR sensors is pos-sible, and provides excellent results in the case of the proposedTIP method. The results at deeper depths have to be regardedwith caution due to the reduced size of the test pool. Neverthe-less, it is precisely at shallow depths where there is a more dra-matic need of developing new efficient detection methods forplastic landmines. At deeper depths other technologies, partic-ularly radar-based sensors, can obtain satisfactory results. Animportant conclusion in this sense is that any realistic detectionsystem should involve the simultaneous use of different sensortechnologies.
VI. CONCLUSION
The detection of landmines from measured infrared imageshas been considered in this paper. A thermal model of the soilhas been proposed that takes into account the main physical phe-nomena occurring in the soil and at the soil–air interface. Theuse of this model lead to an improved thermal analysis of buriedlandmines, allowing us to determine which is the most appro-priate period of the day in terms of detection probability. Theproposed model has been used as the basis of a target identifica-tion procedure, aiming to both detect and classify the presenceof unexpected objects in the soil and estimating their depth ofburial. The proposed approach has been compared to ICA. Theresults show an improved performance in the probability of de-tection of landmines, and a reduction of the FAR, using the pro-posed approach.
ACKNOWLEDGMENT
The authors would like to acknowledge W. de Jong (TNOPhysics and Electronics Laboratory, The Netherlands) andS. Sjokvist (Swedish Defence Research Agency) for providingthe experimental data used in this paper as well as the technicaldetails regarding the test scenarios.
REFERENCES
[1] D. L. Balageas, J. C. Krapez, and P. Cielo, “Pulsed photothermal mod-eling of layered materials,” J. Appl. Phys., vol. 59, no. 2, Jan. 1986.
[2] V. Vavilov, X. Maldague, B. Dufort, F. Robitaille, and J. Picard,“Thermal nondestructive testing of carbon epoxy composites: Detailedanalysis and data processing,” NDT E Int., vol. 26, no. 2, pp. 85–95,1993.
[3] Y. A. Plotnikov and W. P. Winfree, “Thermographic imaging of defectsin anisotropic composites,” Rev. Progr. Quant. Nondestruct. Eval., vol.17, pp. 457–464, 1998.
[4] K. Watson, “Geological application of thermal infrared images,” Proc.IEEE, vol. 63, pp. 128–137, Jan. 1975.
[5] A. W. England, “Radiobrightness of diurnally heated, freezing soil,”IEEE Trans. Geosci. Remote Sensing, vol. 28, pp. 464–476, July 1990.
[6] A. W. England, J. F. Galantowiz, and M. S. Schretter, “The radiobright-ness thermal inertia measure of soil moisture,” IEEE Trans. Geosci. Re-mote Sensing, vol. 30, pp. 132–139, Jan. 1992.
[7] A. B. Kahle, “A simple thermal model of the earth’s surface for ge-ological mapping by remote sensing,” J. Geophys. Res., vol. 82, pp.1673–1680, 1997.
[8] Y. Liou and A. W. England, “A land surface process/radiobrightnessmodel with coupled heat and moisture transport for freezing soils,” IEEETrans. Geosci. Remote Sensing, vol. 36, pp. 669–677, Mar. 1998.
[9] P. Pregowski, W. Swiderski, R. T. Walczack, and K. Lamorski, “Buriedmine and soil temperature prediction by numerical model,” Proc. SPIE,vol. 4038, pp. 1392–1403, 2000.
[10] K. Khanafer and K. Vafai, “Thermal analysis of buried land mines overa diurnal cycle,” IEEE Trans. Geosci. Remote Sensing, vol. 40, pp.461–473, Feb. 2002.
[11] I. K. Sendur and B. A. Baertlein, “Numerical simulation of thermal sig-natures of buried mines over a diurnal cycle,” Proc. SPIE, pp. 156–167,2000.
[12] S. Batman and J. Goutsias, “Iterative morphological algorithms for au-tomated detection of landmines,” Proc. SPIE, vol. 4038, pp. 918–928,2000.
[13] A. Filippidis, L. C. Jain, and N. M. Martin, “Using genetic algorithmsand neural networks for surface land mine detection,” IEEE Trans.Signal Processing, vol. 47, pp. 176–186, Jan. 1999.
[14] M. Lundberg and I. Gu, “A 3D matched filter for detection of land minesusing spatio temporal thermal modeling,” in Proc. SPIE Aerosense 2000Conference, 2000.
[15] I. Y. Gu and T. Tjahjadi, “Detecting and locating landmine fields fromvehicle- and air-borne measured IR images,” Pattern Recognit., vol. 35,no. 12, pp. 3001–3014, 2002.

LÓPEZ et al.: IMPROVED THERMAL ANALYSIS OF BURIED LANDMINES 1975
[16] H. S. Carslaw and J. C. Jaeger, Conduction of Heat in Solids, 2nded. Oxford, U.K.: Oxford Univ. Press, 1959.
[17] P. López, H. Sahli, and D. Cabello, “Detection and classification of land-mines from infrared images,” in Proc. Int. Conf. Requirements Technolo-gies Detection, Removal and Neutralization of Landmines and UXO, vol.2, Brussels, Belgium, Sept. 2003, pp. 385–392.
[18] A. Bejan, Heat Transfer. New York: Wiley, 1993.[19] J. D. Hoffman, Numerical Methods for Engineers and Scientists. New
York: Marcel Dekker, 2001.[20] P. López, D. L. Vilariño, H. Sahli, M. Balsi, and D. Cabello, “CNN-
based 3D thermal modeling of the soil for antipersonnel mine detection,”in Proc. 7th IEEE Int. Workshop Cellular Neural Networks and TheirApplications, Frankfurt, Germany, July 22–24, 2002, pp. 307–314.
[21] F. Pardo, G. Doménech, R. Ruiz, D. Cabello, and P. López, “Proposalfor analog synthesis of a landmine detection system,” in Proc. SPIEConf. Smart Structures and Materials and Nondestructive Evaluationfor Health Monitoring and Diagnostics, San Diego, CA, Mar. 2–6, 2003.
[22] “Product Information for Silastic 3110 RTV Silicone Rubber,” DownCorning Europe, Brussels, Belgium, Tech. Rep. 61-143-01, 1981.
[23] W. de Jong, H. A. Lensen, and H. L. Janssen, “Sophisticated test facili-ties to detect land mines,” Proc. SPIE, vol. 3710, pp. 1409–1418, 1999.
[24] S. Sjokvist, M. Georgson, S. Ringberg, M. Uppsall, and D. Loyd,“Thermal effects on solar radiated sand surfaces containing landmines—A heat transfer analysis,” Computat. Methods Heat Transfer,vol. 5, pp. 177–187, June 1998.
[25] S. Sjokvist, “Heat transfer modeling and simulation in order to predictthermal signatures—The case of buried land mines,” M.S. thesis, Inst.Technol., Linkoping Univ., Linkoping, Sweden, 1999.
[26] W. de Jong and S. Sjokvist, “TNO-FEL/FOI multi spectral mine de-tection trial,” TNO Phys. Electron. Lab., FOI Swedish Defence Res.Agency, Linkoping, Sweden, Tech. Report 1.0, June 2002.
[27] P. López, D. L. Vilariño, V. M. Brea, and D. Cabello, “Robustness ori-ented design tool for multilayer DTCNN applications,” Int. J. CircuitTheory Appl., vol. 30, no. 2–3, pp. 195–210, Mar. 2002.
[28] L. O. Chua and L. Yang, “Cellular neural networks: Theory,” IEEETrans. Circuits Syst., vol. 35, pp. 1257–1272, Oct. 1988.
[29] A. Kirsch, An Introduction to the Mathematical Theory of Inverse Prob-lems of Applied Mathematical Sciences. New York: Springer-Verlag,1996, vol. 120.
[30] H. W. Engl, M. Hanke, and A. Neubauer, Regularization of Inverse Prob-lems. Amsterdam, The Netherlands: Kluwer, 1996.
[31] A. N. Tikhonov and V. Y. Arsenin, Solutions of Ill-Posed Prob-lems. New York: Wiley, 1977.
[32] P. Comon, “Independent component analysis, a new concept,” SignalProcess., vol. 36, pp. 287–314, 1994.
[33] R. Jenssen and T. Eltoft, “ICA filter bank for segmentation of texturedimages,” in Proc. Int. Workshop on Independent Component Analysisand Blind Signal Separation, Apr. 2003, pp. 827–832.
[34] A. Hyvärinen and E. Oja, “Independent component analysis: Algorithmsand applications,” Neural Networks, vol. 13, no. 4–5, pp. 411–430, 2000.
[35] P. Dulyakarn, Y. Rangsanseri, and P. Thitimajshima, “Histogram trans-formation based threshold selection for image segmentation,” in Proc.20th Asian Conf. Remote Sensing, Hong Kong, China, Nov. 22–25, 1999.
[36] J. A. Hanley and B. J. McNeil, “The meaning and use of the area under areceiver operating characteristic (ROC) curve,” Radiology, vol. 143, pp.29–36, Apr. 1982.
Paula López Martínez (S’02–M’03) was born inSan Sebastián, Spain, in 1975. She received theM.Sc. and Ph.D. degrees in physics in 1998 and2003, respectively, both from the University ofSantiago de Compostela, Santiago de Compostela,Spain.
Since June 2003, she has held a Postdoctoralposition at the Fraunhofer Institute for IntegratedCircuits, Erlangen, Germany. Her current re-search interest includes the design of analogue andmixed-signal integrated circuits for image processing
applications, and sensors. The focus of her research has been in the fields of thedesign and training of neural networks, circuit design, and image processingapplied to infrared images for the detection of shallowly buried objects usingdynamic thermography.
Luc van Kempen was born in Vilvoorde, Belgium, in1971. He received the M.S. degree in electrical engi-neering from Vrije Universiteit Brussel (VUB), Brus-sels, Belgium, in 1995. He is currently pursuing thePh.D. degree from VUB.
His research interests include radar imaging, elec-tromagnetics, tomography, and subsurface sensing.
Hichem Sahli (A’00–M’03) was born in Tunis,Tunisia, in 1960.
He is currently a Professor of image processingand computer vision with the Department ofElectronics and Information Processing, Vrije Uni-versiteit Brussel, Brussels, Belgium. He coordinatestwo research teams on computer vision and landminedetection. His research is focused on two broadareas, namely, inverse problems in vision, models forvision, and the development of algorithms for sceneinterpretation. The work conducted by his research
team is motivated by applications in the fields of imaging, computer vision,and autonomous navigation.
Diego Cabello Ferrer (M’96) was born in Granada,Spain, in 1955. He received the M.Sc. degree from theUniversity of Granada, in 1978, and the Ph.D. degreefrom the University of Santiago de Compostela, San-tiago de Compostela, Spain, in 1984, both in physics.
In 1997, he was appointed a Full Professor at theUniversity of Santiago de Compostela, and between1997 and 2002, he was the Elected Dean of the Fac-ulty of Physics. Since 2002, he has been the Headof the Department of Electronics and Computer Sci-ence, University of Santiago de Compostela. He has
been involved in the design of algorithms and mixed-signal circuit designs formultiple image processing applications. He has been supervisor of seven Ph.D.dissertations in these fields and has authored and coauthored more than 100 pa-pers in international journals and conference proceedings.
Dr. Cabello Ferrer was the Co-Recipient of the Best Paper Award at the 2003European Conference on Circuit Theory and Design.