Experimental study of water hammer in buried PVC and ...
60
Utah State University Utah State University DigitalCommons@USU DigitalCommons@USU Reports Utah Water Research Laboratory January 1972 Experimental study of water hammer in buried PVC and Experimental study of water hammer in buried PVC and Permastran pipes Permastran pipes Roland W. Jeppson Gordon H. Flammer Gary Z. Watters Follow this and additional works at: https://digitalcommons.usu.edu/water_rep Part of the Civil and Environmental Engineering Commons, and the Water Resource Management Commons Recommended Citation Recommended Citation Jeppson, Roland W.; Flammer, Gordon H.; and Watters, Gary Z., "Experimental study of water hammer in buried PVC and Permastran pipes" (1972). Reports. Paper 293. https://digitalcommons.usu.edu/water_rep/293 This Report is brought to you for free and open access by the Utah Water Research Laboratory at DigitalCommons@USU. It has been accepted for inclusion in Reports by an authorized administrator of DigitalCommons@USU. For more information, please contact [email protected].
-
Upload
khangminh22 -
Category
Documents
-
view
0 -
download
0
Transcript of Experimental study of water hammer in buried PVC and ...

Utah State University Utah State University
DigitalCommons@USU DigitalCommons@USU
Reports Utah Water Research Laboratory
January 1972
Experimental study of water hammer in buried PVC and Experimental study of water hammer in buried PVC and
Permastran pipes Permastran pipes
Roland W. Jeppson
Gordon H. Flammer
Gary Z. Watters
Follow this and additional works at: https://digitalcommons.usu.edu/water_rep
Part of the Civil and Environmental Engineering Commons, and the Water Resource Management
Commons
Recommended Citation Recommended Citation Jeppson, Roland W.; Flammer, Gordon H.; and Watters, Gary Z., "Experimental study of water hammer in buried PVC and Permastran pipes" (1972). Reports. Paper 293. https://digitalcommons.usu.edu/water_rep/293
This Report is brought to you for free and open access by the Utah Water Research Laboratory at DigitalCommons@USU. It has been accepted for inclusion in Reports by an authorized administrator of DigitalCommons@USU. For more information, please contact [email protected].

PRWG-1l3-1
EXPERIMENTAL STUDY OF WATER HAMMER
IN BURIED PVC AND PERMASTRAN@ PIPES
by
Roland W. Jeppson Gordon H. Flammer
Gary Z. Watters
Supported by
Johns - Manville Research & Engineering Center
Manville, New Jersey
Utah Water Research Laboratory College of Engineering Utah State University
Logan, Utah
April 1972
TABLE OF CONTENTS
INTRODUCTION
OBJECTIVES
EXPERIMENTAL APPARA TUS
Basic Flow System . Buried Pipe Conditions. Pressure and Wave Velocity Measurements. Recording System Capacitance Meter for Measuring Valve Closure
EXPERIMENTAL PROCEDURE
WATER HAMMER TESTS
TEST RESULTS
Pressure Wave Velocities Magnitude of Pressure Increases.
CONCLUSIONS .
REFERENCES
APPENDIX A - Computer Solution of Water Hammer.
APPENDIX B - Sample of Visicorder Charts •
ii
Page
1
3
4
4 7
9 11 13
15
17
19
27 32
38
48
49
54

LIST OF TABLES
Table Page
1 Re sults from density te sting of compacted fill 10
2 First series of tests on PVC pipe buried in fill • 20
3 Second series of tests on PVC pipe buried in fill. 21
4 Third series of tests on PVC pipe buried in fill . 22
5 First series of tests on PERMASTRAN® pipe buried 23
6 Second series of test on PERMASTRAN® pipe buried • 24
7 Test results from PERMASTRAN® pipe in unburied condition 25
iii

Figure
1
2
3
4
LIST OF FIGURES
Schematic diagram of the basic flow system
Dry density-moisture content curve for blow sand used as fill around the test pipe
Schematic diagram of the recording system.
Photographs of the testing area
5 Diagram showing sequence of water hammer test series .
6
7
8
9
10
11
12
13
14
15
16
17
18
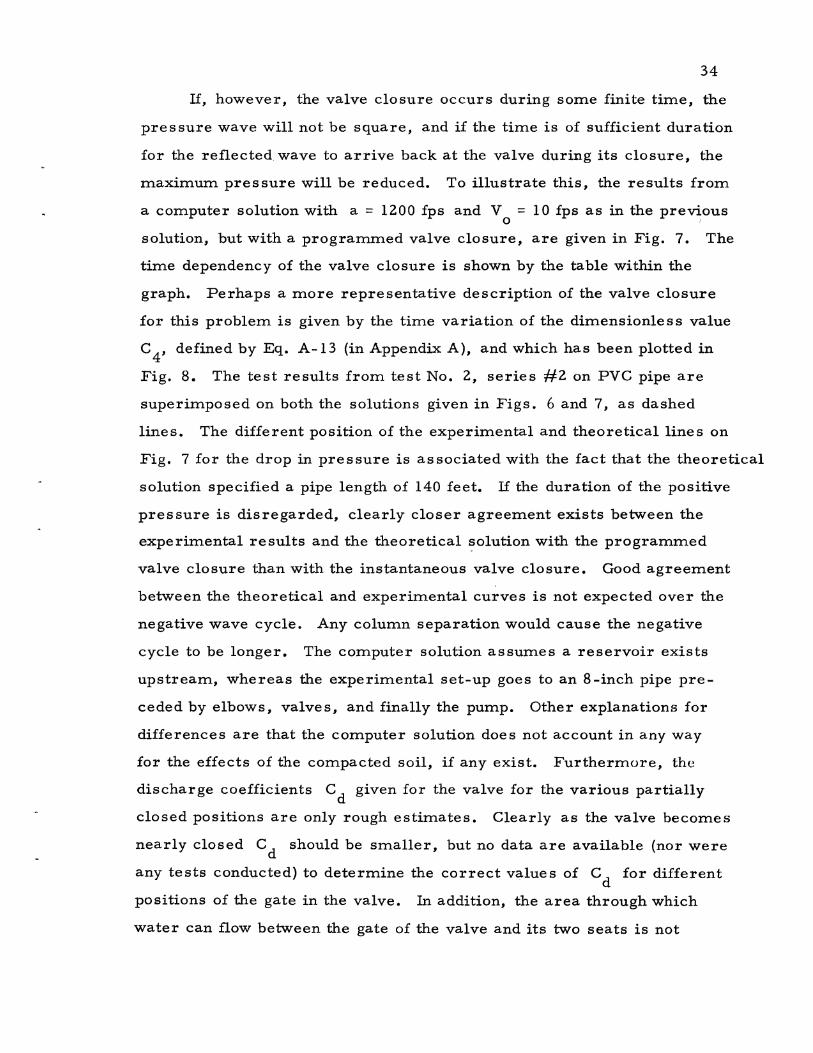
Water hammer pressure wave resulting from programmed valve closure.
Water hammer pressure wave resulting from programmed valve closure.
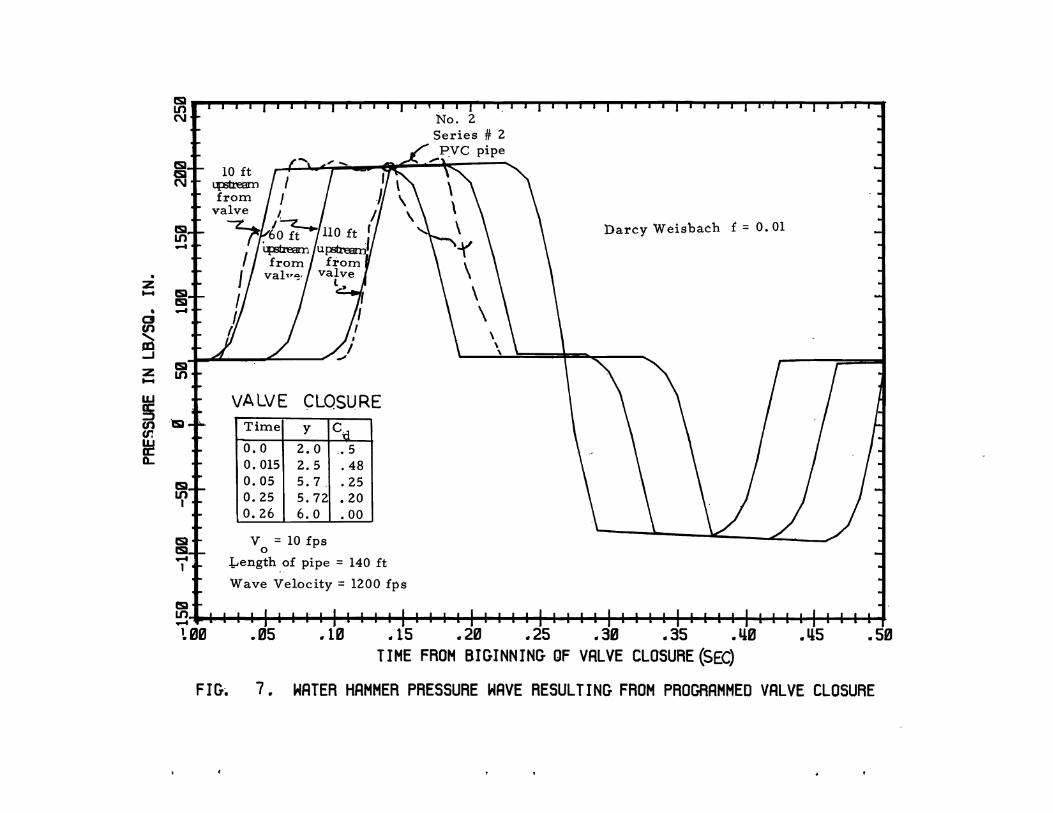
Valve closure characteristics used in computer solution of Figs. 7, 9, and lO
Water hammer pressure wave resulting from programmed valve closure.
Water hammer pressure wave resulting from programmed valve closure.
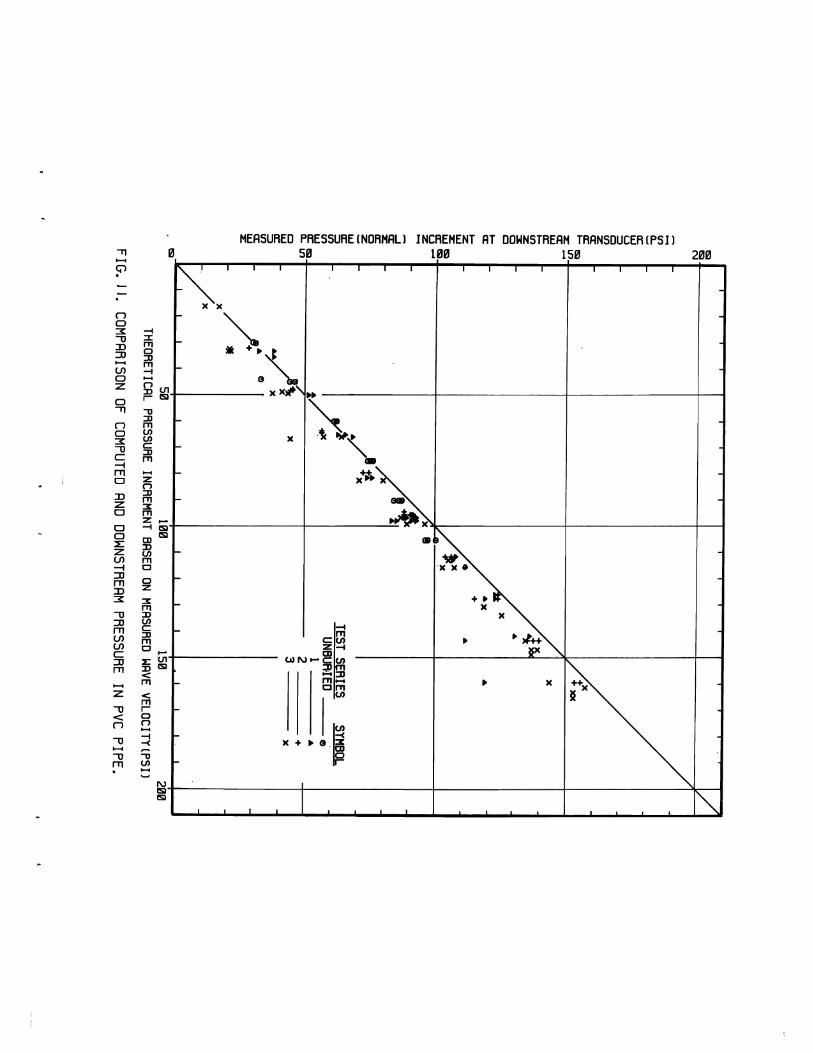
Comparison of computed and downstream pressure· in PVC pipe
Comparison of computed and upstream pre s sure in PVC pipe
Comparison of computed and peak downstream pressure in PVC pipe
Comparison of computed and peak upstream pressure in PVC pipe
Comparison of computed and downstream pressure in PERMAS'l'RAN@ pipe . . . . • .'. .
Comparison of computed and upstream pressure in PERMASTRAN@ pipe . . . . . . •
Comparison of computed and peak downstream pressure in PERMASTRAN® pipe
Comparison of computed and peak upstrcilTl"l pressure in PERMASTRAN® pipe
iv
Page
5
8
12
14
18
33
35
36
37
39
40
41
42
43
44
45
47

INTRODUCTION
The magnitude of pressure waves and their velocity. generated by
rapid changes in the flow conditions at a point such as the closure of a
valve, are well understood, and the theory to predict both the velocity
and the pressure of single waves is well developed (see Streeter and
Wylie, 1967). Such hydraulic transients are commonly referred to as
water hammer, since water is the fluid involved. Most of the earlier
tests of water hanuner pressures and velocity have been conducted in
pipes constructed of metal or concrete, the common material used for
construction of pipe. These materials are rigid compared to some of
the materials used in pipe construction today such as polyvinylchloride
(PVC).
Tests conducted late in 1969 by the Research and Engineering
Center of Johns-Manville Corporation cast doubt on the validity of
applying the classical water hammer equations to transient phenomena
in more flexible pipe such as PVC pipe. As a consequence of these
tests, Johns-Manville Corporation funded a laboratory study by the
Utah Water Research Laboratory to measure the magnitudes of water
hammer pressure waves, their velocities, as well as the expansion of
the pipe walls under these transient pres sures (see Watters, 1971).
These tests were conducted on both 4 inch and 6 inch PVC pipe with
initial velocitie s in the pipes ranging from 2 to 10 feet per second and
the results indicated agreement between actual pressure waves and
those predicted by the classical equations. The small discrepancy
between the two could easily be attributed to air entrainment or other
effects not accounted for by the theory. All of these tests were con
ducted with the pipe laying on the surface with only point supports to
prevent lateral buckling.
Because PVC pipe is flexible and because there is a relationship
between the pressure wave velocity and the flexibility of the pipe walls,

2
it appeared desirable to extend these tests to include water hammer in
these pipes commonly used under buried conditions. Under buried
conditions the pipe could draw on the resistance to compaction of the
soil and a smaller stretching of the pipe wall would be expected to occur
than under buried conditions. The soil effectively makes the pipe appear
to be more rigid. This greater resistance to stretching would lead to
larger wave velocities and larger pressure increments. Obviously, the
effect of the compacted soil would be greater for a more flexible pipe,
such as PVC pipe, than for rigid pipes made of steel, for instance.
The equation commonly used to predict pressure wave velocities
is (Streeter and Wylie, 1967, p. 4)
a :: 12 ~K7 p
~l +K D c Eel
(1 )
in which a is the wave velocity in fps, K is the bulk modulus of elas-3
ticity of the fluid in psi, p is the density of the fluid in slugs I it , E is
the modulus of elasticity of the pipe material in psi, D is the inside
diameter of the pipe in inches, e is the wall thickness in inches, and
c 1 is a coefficient to account for Poisson's ratio and pipe support effects.
For a thin-walled pipe (pipe diameter-to-thickness ratio Die greater
than 25) of fixed length and with expansion joints throughout c 1 :::.: 1.
For a pipe anchored throughout against axial movements c 1 :::.: I_fl 2
(jJ. is Poisson's ratio). If the pipe is prevented from slipping within
the soil, buried conditions would result in this latter condition of no
axial movement.
If the pipe does not meet the thin-walled criteria, the value of c 1
is given by
2e D c 1 :: D ( 1 +fl) + D+e (2 )

3
providing the pipeline has expansion joints throughout its length. If the
pipeline is anchored to prevent any axial movement, the equation which
gives c 1 is,
Z Ze D(I-1J: )
c 1 = D (1 + f.L) + D+ e (Za)
After knowing the pre s sure wave velocity, or computing it from
Eq. 1, the magnitude of the pressure increase of this wave for instan
taneous valve closure can be predicted from the equation,
(3a)
in which .6.P is the pressure increment in psf, V is the initial velocity o
in the pipe prior to valve closure, and the other terms are as previously
defined. Since V fa is small in comparison to 1, Eq. 3a is generally o
used as,
.6.P = pa V o
OBJECTIVES
(3b)
The water hammer testing program included series of tests on
6-inch Johns-Manville Class 160 R-T PVC pipe (rated at 150 psi). Also
similar series of tests were completed on Johns-Manville PERMASTRAN®
pipe (also rated at 150 psi), which ls an epoxy-fiber glass overwrapped
plastic pipe. These tests for both types of pipes were for buried con
ditions in which soil is well-compacted (approximately 90 percent of
modified proctor density). Since the previous tests (see Watters, 1971)
for unburied conditions used only PVC pipe, water hammer waves were
also measured in unburied PERMASTRAN<B> pipe. The objectives of the
study are:
1. To measure the pressure wave velocity in the buried pipes.

4
2. To measure the increases in pressure in the pipes due to the
pressure wave.
3. To compare the measured quantities from (1) and (2) with that
predicted from theory.
4. To evaluate the effects of the surrounding soil by comparing
the test results for buried conditions with those for unburied
conditions, and to determine whether these effects change
with. the passage of repeated pressure waves.
EXPERIMENTAL APPARATUS
The pipe was buried in a fine sandy silt material (referred to as
blow sand) in a 3 -it x 3 -ft channel in the hydraulic laboratory portion
of the Utah Water Research Laboratory. The components of the test
facility which were used for the tests and measurements were essentially
the same as those used in the earlier tests (Watters, 1971), but are
described below for completeness.
Basic Flow System
The flow system used to perform the tests is a closed-loop system,
depicted by the schematic diagram in Fig. 1. The pump which supplies
the water is a variable-speed, ten-stage vertical turbine pump capable
of heads up to 600 feet and flow rates up to 1000 gpm. The speed control
of the pump was adjusted so that the pressure in the pipe at the pump,
prior to the valve closure, was in the range of 25 to 50 psi. The higher
pressures were used for the larger velocities.
From the pump the water supply was directed to the pipe being
tested through a larger line which reduced to an 8 -inch pipe line several
feet in front of the test pipe. Several elbows and valves exist between
the pump and test pipe. The pipe being tested consisted of a 120 foot
section with two pressure transducers approximately 100 feet apart
inserted through the pipe walls. Immediately downstream from the

SUMP PUMP SUPPLY LINE ..
t ~ ~
~ ~ ~ PRESSURE
~ TRANSDUCER ~ ~ 100' ..... ~ PRESSURE
TRANSDUCER
... ~ 120' VENTURI METER TEST SECTION
J
FIG. 1. SCHEMATIC DIAGRAM OF THE BASIC FLOW SYSTEM. U1

6
second transducer the flow system contained a quick-closing 6-inch gate
valve. Downstream from this valve was a venturi meter connected to
two manometers, one containing a blue fluid with a specific gravity of
1. 65 and the other containing mercury. Below the venturi meter the
line contained the valve which was used in conjunction with the pump
pressure to control the flow rate and velocity in, the test pipe. The
venturi meter was calibrated in place during the tests described in the
last report, and since the piping immediately adjacent to the venturi
meter was the same in these tests as for the earlier tests, the earlier
calibration curve s were used.
The first quick-closing valve used was a 6-inch gate valve,
consisting of two gates separated by hinges at the top and wedges at
the bottom. Upon complete closure, the wedges hit the bottom and
were forced upward, thus spreading the two gates each against their
seats. This valve was powered by a 4-inch diameter air cylinder with
a 4-inch stroke. The air supply for the air cylinder came through a
solenoid air valve which was electronically controlled in coordination
with the recorder and other test equipment. During the first preliminary
tests this valve either failed to close completely or its closure time was
too long. Subsequently, an auxiliary air compressor was used to provide
air at 160 psi instead of the laboratory air supply which is approximately
80 psi. In addition, an air supply tank was added just in front of the
solenoid air valve to insure that an adequate volume of air was available.
The closure time was still too long, so the valve was dismantled and
inspected. It appeared that the inertia of the wedges due to the rapid
closure might have prematurely spread the two gates against their Beata
sufficiently tight to delay complete closure. Stays were then inserted
in the gates to prevent the wedges from spreading the gates further apart
than required for a snug fit between the seats. At the same time, two
small switches were placed on the housing of the valve and an arm was
attached to the stem of the valve. A voltage was placed across the

7
switches and the signal taken to a channel of the Visicorder. The closing
of the top switch indicat~d the beginning of valve closure, and after the
valve stem had moved 1/2 inch down the switch was again opened. When
the valve was 1/2 inch from being completely closed the lower switch
closed, and it opened again when the valve was completely closed. Data
from these switches made it possible to determine the time required by
the valve, respectively, to close the first 1/2 inch, the next 3 inches
and the final 1/2 inch. These data are given with the test results on
the PVC pipe. Before testing the PERMASTRAN® pipe, the switches
were replaced by a capacitance meter which provided a continuous
record of the valve closure vs. time.
The data obtained from the switches indicated that the valve closure
time s were too long for the last 1/2 inch of movement, particularly at
the higher initial flow velocities. Therefore, the double gated valve
was replaced with a single gate valve. The new valve also tended to
hesitate for O. 1 of a second or more during the last 1/2 inch of closure,
even at lower velocities. To speed up the closure time another solenoid
air valve, with large air passageways was inserted in the air line, but
with very little increase of closure speeds. Finally, the second valve
was again dismantled, grease fittings inserted through both sides of the
valve and a small groove machined in the seats of the valve as a passage
to carry the grease. When the valve was kept well lubricated its closure
times were acceptable as can be noted from the tabular test data, given
late r in this report.
Buried Pipe Conditions
Before installing the test pipe in the channel, approximately 6
inches of soil was placed in the bottom of the channel and compacted
to approximately 90 percent modified Proctor density. The pipe was
then placed on this fill. Additional soil was placed on top of the pipe
and compacted by a hand operated compacter in layers of approximately
3 inches, until the total depth of compacted soil above the pipe was

8
1 1/2 feet. Hand tamping of the soil immediately around the sides of the
pipe was used to help insure good compaction all around the pipe.
The depth of 1 1/2 feet of compacted soil above the pipe was
decided upon in consultation with Dr. Reynold Watkins, a soil mechanics
specialist at Utah State University. Dr. Watkins indicated that he did
not believe increasing the depth beyond this amount would increase
the support that the expanding pipe would receive from the fill materia1.
Furthermore, he indicated that should this depth provide a significantly
smaller amount of support than a deeper fill would, then this could be
determined upon completing some water hammer tests, and observing
whether any cracks occurred in the soil above the pipe. No such cracks
were observed, except when a section of pipe split open during a test
as described later. Therefore, it is believed that this placing of the
material adequately represents installations in which the pipe is buried
in well compacted fills.
Samples of the fill material were taken to the laboratory where
modified Proctor compaction tests were performed at different moisture
contents. The results from these tests are plotted on Fig. 2.
120
-M
~ - 115 :S -
105 5 25
Percent Moisture
Fig. 2. Dry density-moisture content c urVf! for blow Hand used as fill around the test pipe.

9
Sand cone tests were performed to- determine the density being
achieved in compacting the fill around and over the test pipe for the first
and second series of tests on the PVC pipe. The results from these tests
are contained in Table 1. The first compaction achieved densities about
90 percent of Proctor, and for the second compaction around 95 percent
of Proctor was achieved. The majority of the first compaction was
done by a vibratory-plate, power driven, hand-operated compacter.
The fill was compacted for the second series of tests primarily with a
vibra-hammer type, power driven, hand-operated compacter. Since
the vibra-hammer type compacter achieved greater densities, it was
used in compacting the fill for the two series of tests on the buried
PERMASTRAN@ pipe. The percent compaction being achieved, however,
was not determined for the two compactions burying the PERMASTRAN CS>
pipe. Since the moisture conditions of the soil were maintained near
optimum, it is believed that these compactions were above 90 percent
and probably greater than the second time the soil was compacted around
the PVC pipe.
Pressure and Wave Velocity Measurements
The pressure at the two points approximately 100 feet apart were
measured by two TYCO AB-200 strain-gage pressure transducers. The
gages were rated at 0-200 psi, but capable of pressures of 400 psi
without damage. The transducers were excited by the same specially
designed and built amplifiers that were used in the previous tests,
except that a different power supply was used which had 12 1/2 volts
instead of 10, and additional resistors were placed in the circuits to
provide for better balancing of the bridges. Therefore, the transducers
had to be calibrated again. Also, as described later, one of the trans
ducers failed and a new one was acquired to replace it requiring still
a diffe~ent calibration curve.
The signals from the transducers were transmitted to the recorder
and the record trace, in combination with the calibration curves (which \ ,

10 Table 1. Results from density testing of compacted fill
CaMP AC TION TESTS
F' t lrs compac 10n or es n t' f t ts a PVC pipe S econ d ~omp t'on for ac 1
Soil Sample: Silty Sand
Test No. : I-A
Location: 20' downstream of upperstream transducer
Date 12-23-71
Tested By: BSB & GRL
l. Wt Cant & Soil in 6.820 Ibs.
2. Wt Cant in Ibs. .726
3. Wt of Wet Soil 6.094 #1-#2 = in Ibs.
4. Vol of Test Hole .0543 #8/Density = Ft3
5. Wet Density #3/#4 = Ibs/ft3
112. 1
6. Wt Cant & Sand in 14.54 Ibs. BEFORE
7. Wt Cant & Sand in 9.70 Ibs. AFTER
8. Net Wt of Sand Used 4.84 (6-7)-(St of sand in .54 cone) in Ibs. 4.31
9. Wt Cant & Wet Soil 134. 10 in grams
10. Wt Cant & Dry Soil 123.50 in grams
11. Wt of Water 10.60 9-10 = wt in grams
12. Wt of Cant in grams 36.38
13. Wt of Dry Soil 87. 12 10-12 == wt in grams
14. % of Moisture - W 12.2% 11/13 = in%
15. Dry Density 3 99.9 5/(l+.!.,L )=lbs 1ft
100 16. % of Compaction 86%
# 15 /Proctor = %
Comments: Sand density == 79.4 Ibs/ft 3
Volume of Plate == 0.0067 ft3
Silty Sand I-B
60' beyond upper transducer
12-23-71
BSB & GRI
9.050
.690
8.360
.0715
117.0
13.83
7.63
6.20 .53
5.67
160.96
146.67
14.29
35.90
110.77
12.9%
103.7
90.1%
tests on PVC pipe
Silty Sand I-C tI-A II-B
10' beyond 30' beyond 70' beloVi upper Channel I Channel I transducer
12-24-71 1-21-72 1-21-72
BSB & GRL BSB BSB
7.980 9.085 8.375
.692 .737 .682
7.288 8.348 7.693
.0628 .0692 .0624
16.0 120.5 ~23.2
14.02 13.10 12.46
8.51 4. 18 4.09
5.51 8.92 8.37 .53 3.31 3.31
4.98 5.61 5.06
161. 86 190.64 \216.67
149. 13 176.30 199. 75
12. 73 14.34 16.92
37.04 36.00 36.51
112.09 140.30 163.24
11. 4% 10.2% 10.4%
104. 1 109.2 11. 5
90.6% 95% 96.9%
Sand dens lty - 81. 1 pef

11
were all linear at least over major ranges of pres sure), were used to
obtain the pressure. Measurement, from the recorder output, of the
time required for the pressure pulse to travel from the downstream
transducer to the upstream transducer, provided a value of the wave
velocity.
Recording System
The signals from the pressure transducers were recorded on a
Honeywell 1108 Visicorder. The Visicorder is a 24 channel light-beam
oscillograph, of which only four channels were used. A schematic \
diagram of the circuitry used for the tests is shown in Fig. 3. The
galvanometers in the Visicorder which deflect the recording light
beams respond to variations of current, whereas the signals from the
pressure transducers through the specially designed bridge amplifier
are voltage signals. These voltage signals were directed through a
galvanometer amplifier, which converted the voltage signals to current
signals, and this output was put directly into the Visicorder.
Both the Visicorder and the solenoid air valve used to operate the
quick closing pipe valve were operated by the same manual switch. When
this switch was first closed, the Visicorder started and, an instant later
after the recorder was up to full operating speed, current was directed
to the solenoid of the air valve to close the water valve downstream
from the test pipe. Two separate manually-operated switches were
used to turn off the Visicorder and open the valve.
As described later, it became desirable to measure the rate of
valve closure. This measurement was achieved by mounting two switche s
on the stationary support of the valve and attaching a trip arm to the
movable stem of the valve's gate. A voltage was placed across the
switches and connected to separate bridge amplifier channels. As the
valve closed, the trip arm mechanically activated the switches. Since
the trip arm on the stem was 1 /2 inch wide, this arrangement permitted

REMOTE ~I============~ SWITCH
HONEYWELL
VISICORDER
SOLENOID AIR VALVE
.5 IS
.. I 1 GALVANOMETER AMPUFIER
( " CHANNELS)
SWITCHE
"AIR LINES
(JUICK-CLOSING ~~f!iY BRIDGE AMPLIFIER VALVE (" CHANNELS)
UPSTREAM PRESSURE TR A NSDUCER-------..
TEST PIPE
\
DOWNSTREAM PRESSURE TRANSDUCER
FIG. 3 . SCHEMATIC DIAGRAM OF THE RECORDING SYSTEM.
\
I-' N

\
13
timing how long it took the valve to travel the first 1/2 inch, the next
3 inches and the final 1/2 inch. This switch arrangement is shown
on Fig. 3.
Capacitance Meter for Measuring Valve Closure
After thetests had been completed on the PVC pipe, it was decided
that a more complete recQrd of the, valve's closure times would be
desirable. It was subsequently found out to be unnecessary, because
shorter valve closure times actually occurred for these later tests.
The test results on the PERMASTRAN@ pipe, therefore, contain a more
complete record of valve closure characteristics. This record was
obtained by use of a "Decker Delta Unit Model 902-1," which is an
instrument designed to convert minute changes of capacitance into large
analogous output voltages. The changes in capacitance as the valve
moved were created by mounting two small plates of steel, each 2 inches
wide by 3 inches long and separated by about 1/2 inch on the stationary
support of the valve. Another steel plate 2 1/2 inches wide by 3 1/2
inches long was attached to the movable stem of the valve. The movable
plate had a clearance of approximately 3/16 inch from the stationary
plates. This plate arrangement constituted a variable capacitance under
valve movement. The resulting output voltage from the Decker Delta
unit was supplied to one of the channels of the bridge amplifier. The
device waS calibrated by placing the valve in a number of positions and
reading the voltage output on the meter on the unit. A continuous and
complete record of valve closure during a water hammer test was thereby
accomplished.
The photograph in Fig. 4a shows the valve assembly with a side view
of the plates which constitute the variable capacitance device. Also in
Fig. 4 photographs are given of the Visicorder (4-b), and the test lay-out
(4-c) and (4-d). Fig. 4-c shows the pipe after it has been buried. This
photograph, which was taken facing in the downstream direction, also'

(a) Valve assem.bly
(c) Channel containing buried pipe
(b) Visicorder used to obtain data charts
(d) Test pipe with fill excavated to pipe level
Fig. 4. photographs showing water ham.m.er test facilities.

15
shows the vibra-hammer compacter. Fig. 4-d shows the pipe after the
fill above it had been excavated.
EXPERIMENTAL PROCEDURE
For each test, the proper velocity was established in the test pipe
by opening or closing the flow-control valve downstream of the venturi
meter until the differential manometer showed the correct reading for
that given velocity. As the test velocity increased, it was necessary
to increase the speed of the variable speed pump so that the pressure
was maintained in the range of 25 to 50 psi. (The higher pressure was
used at higher velocities to prevent extensive column separation from
occurring.) Next the manual switch was pressed which turned on the
Visicorder and an instant later closed the quick closing valve. The
recorder was stopped after approximately 1 to 2 feet of record was
acquired, and then the valve was opened by pressing the appropriate
switches. From the Visicorder record from each test, the following
data were determined: (1) the time required for the pressure wave
to travel between the two pressure transducers, (2) the incremental
pressure in the pipe at the position of the downstream pressure trans
ducer, (3) the incremental pressure in the pipe at the position of the
upstream transducer, and (4) data giving the rate of valve closure.
Since the experimental equipment set-up was essentially the same
as for the earlier tests reported by Watters (1971), it was decided that
the tests on the PVC pipe would be performed, and then the calibration
of the pressure transducers verified before proceeding with the tests
on the PERMASTRAN® pipe. The last test completed on the PVC pipe
with an initial velocity of 10 fps caused the last section of pipe and one
transducer to fail. Consequently, the calibration of the downstream
transducer could not be verified. An examination of the failure indicated
that the pipe had split in a nearly axial direction over its full length, in a

16
position of approximately 150 from the bottom. In this position it was
most difficult to compact the fill and, consequently, the density was
probably less than that achieved at other locations around the pipe. The
expansion of the broken pipe caused the fill to have two parallel cracks
which were visible at the surface for the full length of the broken pipe
section.
It is not possible to determine the magnitude of pressure which
caused this rupture. Evidence indicates that the rupture occurred
sometime after the second pressure wave arrived at the downstream
transducer and after the Visicorder record had stopped. The second
positive pressure wave went slightly off the Visicorder record; and,
if the pressure transducer reading is still1inear in this range, the
pressure was approximately 260 psi (the pressure increment equals
210 psi). Prior to the valve closure the pressure at the pump, as
indicated by its gage was 50 psi, but after the valve was closed the
pressure at the pump increased to 255 psi as observed by an individual
standing by the pump. If the speed of the pump did not change with the
increased pressure, the pump characteristics would indicate if the
velocity in the pipe changed from 10 fps to 0 fps the pressure would
increase from 50 psi to approximately 200 psi. It is likely, however,
that a couple of reflected transient pressure waves combined to cause
an instantaneous pressure much higher than this. A. further indication
of this occurrence is that the downstream pressure transducer, which
was inserted in the pipe that broke, also failed.
To determine the nature of the failure, the transducer was Hcnt
to the TYCO Company for analysis. Since the transducer was inundated
under wet soil for several days due to the pipe failure, it was not known
whether excessive pressures or moisture caused the failure. Suspicion
of the latter was reinforced when the signal output ceased completely
upon oven drying the transducer for 48 hours. However, the TYCO
report indicated excess pressures caused the failure. In part, their

17
report reads: ''we find that both semiconductor gages are broken; also
the element is bent. This indicates a severe overload." The specifications
of the transducer which failed stated that it is rated for a O-ZOO psi range
and that no damage will result up to 400 psi. The specifications also
indicate that the transducer can withstand 1000 psi without bursting.
Consequently, the instantaneous local pressure very likely was well in
excess of 40:0 psi.
If as suggested above, the failure was cCl;used by the superposition
of two or more positive pressure waves, then conditions of this test were
precisely those needed for this to occur. During the other tests, this
combination did not occur, at least not until after viscous action had
, substantially reduced the peak pressure increments. Many sources of
reflections for pressure waves exist in the system in addition to the
valve at the downstream end. At the upstream end the test pipe is
preceded by an: 8-inch diameter pipe which causes partial reflection.
Several 900 elbows exist between this enlargement and the pump, which
would reflect the pressure wave partially. Fin.ally, the pump-sump
arrangement would cause a reflection. Since these several reflected
waves could travel with somewhat different velocities due to the local
condition at the time, it is not difficult to visualize how two or more
could easily combine instantaneously at a point.
WATER HAMMER TESTS
Six series of water hammer tests were 'completed (see ~g. 5),
plus a number of preliminary tests necessary for the adjustments to
achieve more satisfaotory valve closure times. Three Qf thes~ were
,for buried 6-inch PVC pipe, two for buried 6-inch PERMASTRAN<B>
pipe, and one .f.or' unburied 6-inch PERMASTRAN<B> pipe. Between the
fiHt two series of tests on the PVC pipe, and the first two series of
tests on the buried PERMASTRAN<B> pip~, the fill was 'excavated-to

compacted
test series # 1
10 10ID Velocity in fps
Time -
10
BURIED
PVC PIPE
test series # 2
Velocity in fps
Time -
BURIED
PERMASTRAN PIPE
compacted
test series # 1
222333 10 10 10
Velocity in fps
Time -
excavated & recompacted
test series # 2
Velocity in fps
Time
18
excavated & re compacted
test series # 3
Velocity in fps
Time -
UNBURIED PERMASTRAN PIPE
test series # 3
--~ Velocity in fps
Time
Fig. 5. Diagram showing sequence of water hammer test series.

19
the level of the bottom of the pipe and then again compacted around and
over the pipe to a depth of approximately 1 1/2 feet above the pipe.
The fill was not disturbed between the second and third series of tests
on the PVC pipe. The first series of tests in each pipe replicated the
measurements at each velocity three times before going to the next
higher velocity. The last series of tests in each buried pipe also started
with 1 or 2 fps, but increased the velocity by 1 fps increments for each
succeeding test to 10 fps. These 10 tests were then replicated three
times. The second series of tests in the PVC pipe started with 10 fps
and replicated this three times before decreasing the velocity by 1 fps
increments.
TEST RESULTS
The data obtained from the tests are summarized in Tables 2
through 7; for buried PVC pipe (Tables 2, 3, and 4), buried PERMASTRAN@
pipe (Tables 5 and 6) and the unburied PERMASTRAN@ pipe (Table 7).
The velocities given in the second columns of these tables represent
the initial velocities in the pipe prior to rapid valve closure. The
velocities of the pressure waves are given in column 4, and were
obtained by dividing the times in column 3 required for the wave to
travel the distance between pressure transducers by the transducer
spacing. This length equals 99.5 feet for the PVC pipe tests and
99. a feet for the PERMASTRAN@ pipe. The two pressure increments
given for each test, referred to as the "normal pressure increment"
and the "peak pressure increment, II were obtained from the Visicorder
charts as a judged mean high pressure for the former and the highest
peak for the latter. In the case of the peak pressure for some of the
tests, a much larger peak existed over a very small time interval in
the order of . 002 seconds. Since only a few of the tests exhibited this ,
very short high pressure, it is believed to be caused by a mechanical

TABLE 2. FIRST SERIES OF TESTS ON PVC PIPE BURIEO IN FILL
WAVE VELOCITY NORMAL PRESSURfSIPSIJ MAX IMUM PRESSURESI PSIl T I Mf F OR VA L VE TO HA Vf TES V TIME ,« F"T /S EC J DOWNSTREAM UPSTRE AM DOW NS TR E..A M UPS TRE AM MCVEO (SF:CONOSI NO. FPS SEC INOIVIO. AVE. INOIVIO AVE. INOrVrO. AV E. INOIVIO. AI/f. IND! VIO. AVE. 1/2IN 3112 IN II IN
1 7. .080 12111') 32.2 ?6.6 36.0 26.6 .010 .050 .060 ? ? • (J 80 1 ?liD :n.9 35.5 "4.5 36.4 .011 .063 .079 .~ 7 .015 1325 1210 31.9 ~6.0 35.5 32 .5 II 4.5 41.6 , 36.4 33.1 .011 .053 .079 4 J .080 1240 53.0 51.5 58.1 50.6 .0·14 .058 .117 '5 3 .080 1"'0 51.1 41.<1 5 fl. 8 41.'1 .0 III .058 .1211 h 3 .080 12110 1240 51.1 51.1 41.'1 49.1 56.8 51.1t 47.'1 48.8 .014 .058 .128 ..
" .081 1125 " 8.1 59.5 6 '1.1 5<1.5 .015 .056 .151 8 4 .082 1210 (; 2.5 (; ~. 'I 58 •. 1 63.'1 .015 .056 .151 'I 4 .082 1210 1215 65.3 65.3 65.1 63.0 70.0 69.1 65.1 63.0 .015 .051 .152
In 5 .082 1210 13.1 1 '1.1 15.5 1'1.1 .013 .053 .163 11 5 .082 1710 15.5 74.8 71.4 14.8 .013 .056 .183 12 5 .082 Ino 1210 13.1 14.3 12.'1 75.8 77 •. 4 76.8 72.'1 75.8 .013 .055 .180 13 6 .082 1710 85.0 6 '1.2 86.9 6'1.2 .013 .05'5 .288 14 6 .082 1210 83.1 (; 7.3 86.9 6 Q .? .013 .056 .291 15 6 .083 1195 1205 88.0 8'5.4 71.1 69.2 88.8 87.5 71.1 69.8 .0 I" .056 .296 1" 6 .083 1195 '<11.4 1 '1.3 '16.3 7<1.3 .01'1 .056 .200 ]7 6 .082 1210 90.7 65.4 94.4 65.4 .015 .052 .209 111 6 .U 82 17.10 1205 <I 2~5 91.5 6 '1.2 11.3 '14.11 <15.1 6 '1.2 7].3 .015 .052 .209 l~ 6 .0811 1180 9 n.1 6 '1.2 94.4 69.2 .013 .053 .211 ;on 6 .083 1 195 88.8 6 '1~ 2 94.4 11.1 .013 .053 .211 7.1 6 .0 R3 1195 11'10 88.8 89.4 17..'1 10 .11 94.4 9IJ .4 72.9 71.1 .014 .054 .239 77 6 .083 1195 88.8 11.1 94.4 71.1 .014 .054 .239 7~ 6 .084 118 O· 91.4 87.9 94. II 81.9 .008 .050 .108 74 ·6 .083 1195 11 QO 97..5 '10. 'I <15.4 84 .8 98 ... '15.7 ciS.1I 84.8 .0 Oil .050 .108 2<; 1 .0113 1195 106.5 'I a.l 111.4 9 '1.1 .008 .011(; .226 ?r.; 7 .084 1180 101.7 Q'l.1 111.4 101.0 .008 .046 .226 77 1 .084 1180 1185 10 1.7 101.3 102.1 100.1 11'3.3 1 12.1 10·2.8 101.0 .009 .046 .224 2!1 8 .0811 1180 11 '1.0 C!9.5 127..1\ 99.5 .008, .0411 .284 ?9 1\ .085 1170 122.8 In 5.8 128. " 1(15.8 .009 .03Q .289
.3n 11 .0811 1180 11 75 17. 2.8 1 ?l.5 108.5 . 104.6 12 f;. 5 1 2S.9 108.5 104.6 .009 .042 .2118 31 9 .085 1170 130.3 130.9 13 4.1 130.Q .009 .041 .267 ~7 Q .085 1170 13 6.0 17. 5.l 139. II 175.3 .009 .042 .266 ~~ 'I .084 !t80 1175 111.11 1;?,;.9 1'73.4 126 .5 11 €. 3 t'3rI.l 123.4 126 .s .00'1 .042 .268 3<; 10 .0811 1180 11 '1.0 1'75.3 122.11 17. 5. 3 .009 .0112 .?64 ~ In .0.811 1180 11 80 U9.0 119.U 11 5.9 - 1 2D.6 127..8 122.8 11 5.9 120.6 .009 .0115 .213

TABLE 3. SECOND SERIES OF TESTS ON PVC PIPE BURIED IN FILL
WAVE VELOCITY NORMAL PRfS'5URESIPSII MAl( IMUM PRESSURES(PS T 1 TIME F OR VALVE TO HA VE lEST V TIME (fT/SECI DOWNSTREAM UPSTREAM DOWNS TREA M UPS TRE AM HOVEn (SHONOS) Nfl. FPS SEC INnTVIO AVE. INOIVID. AV E. . TNDIVIO. AVE • I NOIV 10 AVE. INOIVIO AVE. 1/2IN 3112 IN 4 IN
1 10 .084 1180 155.6 111 0.2 111 6. 6 125. ~ .006 .046 .141 ? 10 .084 1180 153.3 157.1 1511.8 157.1 .009 .044 .103 ~ 10 .084 1180 lUlU 153.3 1511.1 149.6 1 ti9.0 157.8 1511 .1 14<1.6 144.0 .009 .041 .101 4 'I .084 1180 131.6 130.'3 111 2.1 no.'! .008 .040 .099 '> 'I .084 1180 H'l.8 17 'I. n 142. 1 .17.<1.0 .007 .04? .099 '5 'I .0811 118 U 13 5.3 17 9.0 14 2. i 129.0 .010 .042 .268 6 9 .084 1180 1180 139.8 1 :n!. 1 136.5 1 3t .,. 147.. 1 142.1 136.5 131.4 .008 .041 .092. 7 8 .084 1 180 11 5.0 ·11 '1.7 135.3 ·11 '1·.7 .008 .040 .085 q 8 .084 1180 174.0 121.2 126.3 127.2 .008 .042 .087 'I 8 .085 1170 1115 124.0 1 n.1l 173.11 123.4 176.3 129.3 123.4 123.4 .008 .042 .085
In 7 .084 1180 106.0 112.2 108 • ., 112.2 .007 .039 .082 11 7 .084 1180 ·103.7 11 4.1 108.2 11 4.1 .001 .040 .oao I? 7 .084 1180 1180 103.1 11l1i.'i 114.1 113 .• 4 108.2 HI8 .2 114.1 113.4 .0.07 .040 .0.Ji0 n 6 .0811 1180 90.2 '1'1.1 92.5 9 '1.1 .orn .040 .080 14 . 6 .0'l4 1180 81.9 9 '1.1 92.5 '19.1 .01}7 .039 .080 15 6 .085 1170 1175 87.9 8'l.7 97.2 9$.5 92.5 92.5 q7.2 98.5 .007 .031J OA1 11; 5 .08.4 1180- 711.4 80.11 16.1 80.4 .007 .038 .075 17 5 .0811 1180 72.2 81.5 76.7 81. I) .007 .039 .075 til 5 .084 1181l U80. 72.2 72.9 81.5 81.2 74. II 75.9- 81.5 81.2 .007 .039 .on 1'"
,. .083 1195 56.4 6 II. ~ 58.6 qll.3 .007 .0.39 .G75 7n II .083 1195 56.11 6 11.3 60.9 611.3 .007 .039 .07'7 21 4 .084 1180 1190 56." 56.11 6 2.8 63.8 58.6 5'1.11 f; 2.8 63.8 .007 .040- .011 1'7 ~ .083 1195 II 5.1 II 3.0 II 9.6 II 3.0 .007 .U41; .U:>1l 7': 3 .0811 1180 II 5.1 116.7 II 9.6 46.7 .007 .039 .075 ?II .3 .083 1195 11 qo 4 II. 2 l1li.8 47.5 45.8 II 7..4 118.9 II 7.5 45.8 .007 .041 .080 ?<; 2 .083 1195 28.4 32.9 38.3 32.'1 .007 .0311 .048 21'; 2 .083 119 I) 28.11 33.7 38.3 33.7 .004 .036 .046 ?7 2 .083 1195 1195 28.4 211.4 78.8 31.8 31.6 36.1 711 .8 31.8 .007 .038 .048
'.

natE 4 .. THIRD ~ERIE~ OF TESTS ON pvc PIP~ BURIED IN FILL
WAVE VELOCITY NORMAL PRESSURES(PSII MAXIMUM P.RESSURES(PSIt TIME F OR VALVE TO HAVE TEe; T V TIME (FT/SEC , DOWNSTREAM UPSTREAM oOWNSTREA M UPS TRE AM '10 VE 0 (SE C ON OS t NCI. FPS SEC INOIVIo. ~NoIVID. INoIVIO. I NOIV ID. INOIvIO. 3/21N -31-12 IN 4 IN
? 7 .082 1210 21.0 30.3 25.5 30.3 .00£ .043 .087 ~ 3 .082 1110 41.1 43.0 45.6 43.0 .008 .052 .107 4 4 .081 1225 f: 3. 9 5 q.S 6 S.4 Sq.8 .007 .048 .145 5 <; .-OSl 1225 79.8 67.3 84." 67.3 .006 .0 .. 6 .140 6 6 .0Sl 1225 95. S q3.5 100 ... 93.5 .007 .04a .132 7 7 .081 1225 10 7.2 115.'3 llt.8 115.'3 .008 .048 .130 ~ S .080 1240 175.5 123.4 13 0.0 - 123.4 .008 .04'3 .13" '3 9 .0 SI 1225 136.9 I" s.q 141.. ,,- 145.'3 .008 .049 .130
10 10 .081 1225 152.8 155.2 155.1 155.2 .OOS .0 .. 8 .136 _ 11 1 .081 1225 16.9 16.1 18:.2 1£.5 .008 .0"7 .0'36 I? 2 .080 1240 21." 31.0 25.5 31.0 .008 .0 .. 8 .096 13 ~ .0Sl 1725 .. 3. 3 54.2 5 <!I. 5 511.2 .007 .046 .095 14 4 .oso ] 2"0 44.3 56.1 53." 56 • .1 .007 .O"!, .093 J."i 5 .0Sl ]725 " 70.7 83.4 79.8 83.4 .007 .0 .. 5 .096 ]6 £ .0 SI 1225 8"9.0 99.1 100." '39.1 .008 .046 .099 17 7 .081 Ins 10 ~.6 117.8 111".8 117.8 .007 .046 .120 18 8 .082 1710 118.6 134.6 127.7 134.6 .007 .046 .12-2 19 q .082 1210 136. '3 IS 7..6 14-1." 152.6 .007 .0 .. 4 .121 :m iHI .082 1710 152.8 16? 7 159.7 162.7 .OOB .046 .123 7t 1 .OR2 ]111} 11." ] 5.0 1£:.0 15".0 .009 .04Q .091 I
17 , .0 SO" 1 ?"U 20.5 79.9 2 7.4 <'9.9 .008 .047 .095 73 3 .081 1725 3 7.4 I! 8.6 .. 3.-3 4,8.6 .007 .046 .095
I
7IJ 4 .081 1125 57.0 67.3 ;; 6.1 67.3 .008 .047 .097 I 7<; c; .n 81 1725 70.7 82.3 79. S 82.3 .0 os .048 ~098 2f; 6 .083 1195 86.7 In 1.1l 9 5. S 101.0 .008 .04e .121 77 7 .0143 1195 104.9 117.8 109.5 11 7.8 .009 .04" .124 211 8 .0 82 1'10 ~lS.6 1311.6 127.7 i34.6 .008 .048 .123 7."1 q .0 82 1210 13 9.1 157.6 1Il1.4 152.6 .007 .04'; .122 ~n 9 .0 SII liS a 13 4.6 123.4 13 9.1 123.4 .008 .04S .301 ~l 10 .083 119 !l 157.4 140.2 ,161.0 14 0.2 .D06 .047 .176 ~~ 10 .082 Ino 152. S 168.3 15 7.~ 1(; 8."5 .006 .045 .125 ~'! 10
I -.0 114 liS a 143.7 125.3 1Q S. "5 125.3 .00E; .046 .3011

TA!:!LE 5. FIRST ';[PIFe; "F TESTS ON D,DMASTRAN PIPE BURTfO
WAVI'" VfLC'CITY NnQMAL PRfSSURESIPSII TfO:: T V TIMf (F TIS EC I DOWNSTREAM UPSTREAM NO. FPC; ';[C. TN!1IVIO. AVE. INOIVIn. AVE. INOIVIn. AVE.
1 2 .f165 1"7 U 1I'i.ll 3 '1.0 ? ? • (J!iS 152 U II Ii. 7 41.7 ~ 7 .Oli~ 1 <;7U l~ ~5 II 5.n 41:. F. 4 1.7 40.8 <. , .06Q 1545 f,fJ .0 56.8 S 1 .0;3 I C07ll 71.7 (; 4.A
" ~ .1162 15'15 IS 70 r; 3.3 65.0 5 Ii.f' <;9.5 7 II • {J 1';2 IS'! ~ 76. ·7 7 ~. 7 ~ 4 .(16(; 14'l5 80.ll 61.7 ., II .065 1<;70 1 ~ ~" B 1.7 7<!.4 77.'1 6'1.11
In 5 .(166 11195 10 1.7 I! 6.U II 5 .ur,r; 111'l5 10 1.7 86.0 17 5 .065 1520 1< (15 10 1i.1 103.3 101.4 91 .1 13 6 .01;5 1520 17 <!. 6 11 'l. 7 1M 6 .00:;5 1""'0 17:1.3 171.5 IS 6 .065 15?0 1< 7U 13 0.4 I ?C!. 8 12"'.7 1 21 • ~ 16 7 .064 1 <;14 5 14 s.U 1'1 11.0 11 1 .061 1510 146.0 14 If.1l 18 7 .1I62 1595 1 <. 7U III <;.7 1 45. q III 4.n 144 .[1
1'l 8 .063 1 e70 11; r,. 3 166.4 7f1 8 .06'" 1595 II' h.D 166.4 21 >l .063 1510 1 r:; 75 11> 7.'" 1 6f. 5 166.4 11;6.Q 7? 'l .01;2 15'l5 III 3. 3 7~ q .061 1 (;20 18 5.1 187.1) 24 q .061 1 "2u IO:;)U 11\ 3.3 I ~4. 2 185.1 277.7
~i'XIMUM PRESSUREqPSTI DOW NS TR fA M UPSTRFAM
TNOIV 10. AVE. INOIvro. AVE. 4 R. 3 ~o.7
5 q. ~ 4? Ii
<; 4. ~ <;7.3 43.0 41.6 73.3 SB.f! II 4. 7 Ii ~.n 1~. n 17 .0 <; P .f\ 61. " 'l6. U 74. 'i
IOU. ~ 7 ... 8 10 7.1 '1'1.7 7F..7 75.3 10 1.1 I! 7.1 106.1 Aq.8
17 'l. ~ 1 17.5 10 3." 9~. 4 145.If 177.7 14 F.. 'I 13 7.0 146.9 1 41'.If 173.8 12f'.7 14 7. >l 14 ~ • q 147.5 14". 'l 14 7.5 11117 I; III r;.'l 145 ,q If. 1. R II' F.4 167.8 166.If 16 q. 7 1 1;8 .1 166.4 1 6F.If
IP 6. 1 lR I!. 'l 185.1 1 se;. 7 II! 7.0 187.'l
POSITIOt. OF .n 1 SEC .02 S[ C
3.2 ~.9
2.8 3.6 7.9 1.9 ~.Il 3.'1 ~.1 3.'1 ~.3 If.O 3.[1 3.'l 3.1 If.O 2.9 3.7
'.ll 3.9 3.1 3.9 ~.1 3.'l ~.u 3.8 3.1 4.0 3.1 4.1 ~.I 3.9 ~.I 1.1! 3 ,1 'I,D ~.1 l.'l 3.LJ ~.R
~.1 ~.8
3.1 3.9 ".1 l.'l ~.1 3.8
VALVr AT I INC HFS I .03 SE C .04 SF C .05 SfC
4.8 5.2 6.0 4.3 5.7 6.0 4.7 5.b 6.0 4.7 5.5 6.0 4.7 5.5 6.0 4.'1 5.9 6.0 4.7 6.0 6.0 4.8 5.8 6.0 4.2 5.If 6.0 If.8 5.8 6.0 4.7 5.6 6.0 4.6 5.7 6.0 4.7 5.5 6.0 4.8 6.0 6.0 5.1 6.0 6.0 4.7 5.'l 6.0 4.6 5.8 6.0 If, 8 co q h.n 4.7 5.6 6.0 4.7 5.6 6.0 4.5 <;.If h.n 4. Eo 5.6 6.0 If. 8 <;.6 6.0 4.6 5.4 6.0
N
""

TABLE 6. SECONO SERlE" aF TEST ON PERJoIASTRAN PIPE BURIED
W A V f V EL OC I TV NORMAL PRESSURESCPSII MAX IMUIY PRE SSURES (PSI I TEO; T V TIME CrT ISEC I OOWNSTPfAM UPSTREAM ~OWNSTREAM UPSTREAM POSITION· OF VALVE AT (INCHES) NO. FPS SfC. INrTVIO. INoIVIO. INOIVIO. INOIVII'l. HID IVro. .01 SEC .02 SEC .03 SE C .04 Sf C .05 SEC
1 1 .U64 1545 20.0 15.7 20.7 16.6 3.2 3.·5 4.2 5.1 6.0 ? ? .065 1520 4 0.7 38.5 46.7 38.8 3.2 4.1 4.9 5.7 6.0 ~ ~ .063 1570 57.0 54.6 69.3 57.0 3.2 3.9 4.7 5.5 6.0
" 4 .01;5 1520 80.1 77.3 10{).0 77.3 3.2 4.0 4.9 5.7 6.0 c; 5 .063 1570 106.0 In 3.4 125.7 104.2 3.3 4.2 5.1 5.7 6.0 c. 6 .063 1570 127.8 127.4 152.2 127.8 3.3 3.9 4.7 5.6 6.0 .., 7 .063 1570 146.6 139.0 147.2 IS 0.2 3.4 ... 2 5.1 5.8 6.0 8 8 .063 1510 167.2 167.9 168.4 169.1 3." ... 2 5.0 5.8 6.0 q q .063 1570 187.2 17 9.5 1'11.0 181.4 3 ... ... 2 5.0 5.8 6.0
lfl 10 .064 1545 204.6 207.7 3.4 4.1 4.'1 5.7 6.0 1l 1 .063 1570 ·20.0 16.6 :21.7 18.5 3.1 3.9 4.7 5.7 6.0 J;;> 2 .063 1570 4 0.7 38.8 50.0 39.8 3.3 4.2 5.1 6.0 6.0 n J .063 1570 55.7 54.6 63.3 56.4 3.3 .... 0 4.8 6.0 6.0 14 4 .063 1570 8003 81.4 101.7 83.2 3.7 ... 2 5.0 6.0 6.0 11) 5 .065 1520 10 5.0 10 1. 'I 126.7 102.3 3.3 ... 1 5.0 ·5.9 6.0 11; 6 .064 1545 127.5" 174.7 1" 8.11 127.11 3.3 4.1 5.1 6.0 6.0 17 7 .064 1545 143.6 111 o.q 143.9 111 1.3 3.5 ... 3 5.3 6.0 ,6.0 111 8 .064 15115 166.6 166.0 167.5 166.11 3.3 ... 2 5.0 6.0 6.0 1<1 q .0611 1<;45 186.6 179.5 187.2 181.4 3.4 11.2 5.0 6.0 6.0 7fJ 10 .063 1570 202.1 1'16.9 206.6 1'18.0 3.3 ... 2 5.2 5.7 6.0 n 1 .0r:;4 1545 20.0 16.6 21.7 17.0 3.3 4.3 5.2 6.0 6.0 77 2 .063 1<;7 0 II 3. 3 42.q 55.0 114.0 3.4 ... 3 5.2 6.0 6.0 7{ ~ .062 1595 5 h. 7 57.3 65.0 59.0 3.3 4.3 5.1 5.9 6.0 74 4 .063 1 <;70 7e.3 81.0 '18.3 82.0 3.3 ... 3 5.1 6.0 6.0 75 5 .063 1570 104.0 In 1.1 123.3 102.3 3.4 4.1 4.8 6.0 6.0 ;:or:; 6 .063 t 570 171.5 11 q. 7 111 3.3 120.0 3.5 ... 1 5.0 5.8 6.0 77 7 .063 1570 14 II. 5 1117.8 14 6.9 14 11.7 3r5 · ... 1 5.0 5.8 6.0 711 8 .063 1570 16 O. 3 162.1 167.1 162.5 3.3 3.9 5.0 5.8 6.0 7q q .063 1570 182.7 180.6 l~ 4.8 1~ <;. :3 .3.3 3.9 5.1 6.0 6.0 ~n 10 .063 1570 2CJ5.1 lqa .8 206.6 .?Q 0.7 3.3 ... 0 If. 7 5.7 6.0

TABLE 7. TEST PESULTS FQOM PERMASTP~N PIPE IN UNBURIED CONDITION
W A V E VEL OC TTY NORMAL PRfS~URES(PSII MAX IMUM PRE S SURE SI PS I) TES T V TIME 1FT/SEC) DOWNSTREAM UPS TRE AM DOWNSTREAM UPS TRE AM POSITION OF VALVE AT (INCHIS) NO. FPS SEC. INN V I D. INOIVID. INOIVID. INOIVIO. lNOIVIO.
~ .01 SEC .02 SEC .03 SE C .04 SEC .05 SEC
1 1 .065 1520 20.0 .0 21.7 20.0 2.8 3.5 4.2 5.1 5.7 ? 7. .065 1520 40.0 39.8 " 1.7 39.8 3.0 3.6 4.3 5.2 5.9 ~ 3 .065 1520 <; B. 3 56.4 61.7 56.4 3.0 3.6 4.3 5.2 5.9
" 4 .065 1520 78.3 76.2 81.7 78.6 3.7 4.1 4.8 5.9 6.0 C; 0:; .064 1545 10 1.7 '12.5 10 3.3 '12.5 3.1 4.0- 4.9 5.8 5.9 <; 6 .01;8 1455 123.0 173.5 124.5 123.5 3.2 4.0 4.8 5.7 6.0 7 7 .067 1475 140.9 139.0 Iii 3.9 139.0 3.0 3.9 4.7 5.4 5.8 g 8 .01';7 1475 161.8 152.5 166.3 152.5 3.1 3.9 4.6 5.4 5.7 '1 9 .067 1475 181.2 163.3 184.2 163.3 2.6 3 .. 6 4.3 5.1
~ 10 10 .067 1475 19 '1.1 167.9 20 2.1 167.9 2.7 3.6 4.4 5.2 5.7

vibra,tion of a pipe support. These very short severe pressures are
included in the peak pressures of those tests in which they occurred
26
and can be identified by noting the substantial difference from the normal
pressure.
In the process of obtaining the first series of test results, a number
of additional runs were obtained at V = 6 fps in attempting, with little o
improvement, to achieve faster valve closure. After completing this
first series of tests the valve was outfitted with grease fittings. Lubri
cating the seats of the valve did decrease the closure times substantially
for subsequent tests.
It should be noted that a substantial reduction in pressure occurred
between tests No. 32 and 33 of this first series (Table 2). It is not
possible to determine absolutely the cause of this reduction, but it is
believed to be associated with the valve not closing fast enough over the
last 1/2 inch of its travel. While the total closure time is essentially
the same for these two tests, the drop in pressure could be the result
of the valve "hanging-up" at the top of the last 1/2 inch in test No. ·33,
whereas in test No. 32 this "hang-up" occurred nearer the end of the
last 1/2 inch of travel. It should also be noted that the pressures in
this first series with V = 10 fps are too low and should be disregarded. o
Also during the second te st serie s on the PVC pipe with V = 10 fps o
the 8-inch steel pipe upstream from the test section split open at one
of the welded joints at an elbow, thus preventing the third replication
with V = 10 from being obtained. o
The fill material was removed and compacted again around and
above the pipe between the second and third series of tests (between the
time the data in Tables 3 and 4 were obtained) on the PVC pipe. The
pipe and transducer failure during the final test of the third series
prevented a planned fourth series of tests to be conducted in which the
velocities V were to begin with 10 fps and decrease in I fps increments. o

27
The fill was also excavated and compacted again around and over
thePERMASTRAN@ pipe between the first and second series of tests
using this pipe.
Measurements on the PVC pipe indicate the average inside diameter
equals 6.09 inches and that its wall thickness averages 0.276 inches.
The PERMASTRAN® pipe has an average inside diameter equal to
6.25 ipches and a wall thickness equal to 0.168 inches. In the case of
the PERMASTRAN® pipe, the same manometer readings were set to
establish the indicated integer values of velocities in Tables 5 through 7
as were set for the PVC pipe. These settings assumed that its inside
diameter equals 6.09 inches. Consequently, the actual velocities in
the PERMASTRAN® pipe are equal to the indicated amount multiplied 2
by (6.09/6.25) = .95. In all of the analyses or computations in these
analyses which are given later, the corrected velocities have been used.
Pressure Wave Velocities
In order to compute wave velocities, the modulus of elasticity and
Poisson's ratio for the pipe material must be known. These values were
supplied by Johns-Manville and are:
Modulus of elasticity, E = 500, 000 psi Poisson's ratio, jJ- = 0.46
for the PVC pipe and
Modulus of elasticity, E = 1,440,000 psi Poisson's ratio, jJ- = 0.52
for the PERMASTRAN® pipe.
The value for Poisson's ratio for the PERMASTRAN® pipe,
jJ- = 0.52, is larger than the theoretical maximum value of 0.5 for an
isotropic material of which PERMASTRAN@ is not. The. 52 value
may well be due to the fact that the glass fiber which is wrapped around
polyvinylchloride core in the manufacture of the PERMASTRAN@ pipe
occurs on the bias in two opposite directions, or to the method used to

28
determine Poisson's ratio.
It should be pointed out that the development of Eq. I assumes the
pipe wall consists of an isotropic material with a stress -strain diagram
defined by the modulus of elasticity and, therefore, the effects in Eq. 1
from the expansion of the pipe wall may not be adequate in describing
water hammer velocities in the PERMASTRAN® pipe.
Using the above values for E and f-L, the theoretical wave velocities
as computed by Eq. 1 using c I for the pipes anchored throughout against
axial movement are:
2 (a) PVC pipe - thin walled (c 1 = I - (.46) =. 788)
12 -V3 x 105/1. 94 a = ----------~----~~~------- = 1,395 fps
_ I +(3 x 10⁵) ( 6.09) (.788) 5 x 10⁵ 0.276
(b) PVC pipe - thick walled (c 1 = 2 (.276) (I + .46) 6.09
+ 6.09 (1 - (.46)2) = .887) 6.09 + .276
12-..) 3 x 10⁵/1. 94 a = --------~--------~~------- = 1,322 fps
1 +(3 x 10⁵) ( 6.09) (.887) 5 x 10⁵ 0.276
(c) PERMASTRAN® pipe - thin walled (c 1 2 = 1 - (.52) = .730)
12-J3x 105 /1.94
1 +/ 3 x. 105 \ (6.25) (. 730) \~4.4 x 10⁵) . 168
= 1,830 fps

29
(d) PERMASTRAN® pipe - thick walled (c i = 2 L ~~8) (1 + .52)
+ 6.25(1-(.52)2) ) - = • 792
6.25 + • 186
= 1,766 fps
3 x 10 . 6.25 ( 5) I )
+ 14. 4 x 10⁵ \. 168 (.792)
The wave velocities for the pipes computed under the assumption that
the ends are fixed but the pipe contains expansion joints throughout are:
(a) PVC pipe - thin walled (c I ::: 1)
12~3xI05/1.94 a = ----~------~~---- = 1,250 fps
1+ 3xIO 6.09 ( 5) ( ) 5xI050.276
(b) PVC pipe - thick walled (c i 2 (. 276) (1 + 46) + 6.09 109) = 6. 09 . 6. 09 + . 276 = •
a =
+ (3 x 10⁵ \ (6.09) (1. 09) 5 x 10⁵ / .276
= 1,202 fps
(c) PERMASTRAN® pipe - thin walled (c 1 = 1)
a = __ ~I~2~\_j~3~x~I~0_5~/~I~.k94~ __ = 1,595 fps
1 +( 3 x 10⁵
) (6.25) 14.4x 10⁵ . 168
\

30
(d) PERMASTRAN@ pipe - thick walled (c 1 == 2(6~~~) (1 + .52)
+ = 1.05 6.25 6) 6.25 + .168
a = = 1,557 fps
1+( 3xl05
)(6.25) (1.056) 14.4 x 10⁵ .168
While the diameter-to-wall thickness ratio is close to the limit for
thick-walled pipe in the case of the PVC pipe, clearly only the thin-walled
velocities apply, since in each case the computed thick-walled wave
velocities are less than the thin-walled values.
The pressure wave velocity in the unburied 6-inch PVC pipe, as
determined from the previous tests (see Watters, 1971, Table 4), was
,1120 fps. The average wave velocity from the first test series equals
1210 fps, for the second series equaJs 1185 fps, and for the third series
after the fill was compacted again equals 1215 fps. Furthermore, the
individual wave velocities in Tables 2, 3, and 4 show a slight decreasing
trend with the number of the test. This trend is most pronounced in
Table 2, in which the average of the first three tests (1270 fps) is
7.3 percent greater than the average of the final three tests of this
series (1180 fps). This slight decrease in wave velocity with number
of water hanuner waves which have preceded it in the pipe, represents
the decrease in support that the pipe receives from the surrounding soil.
It appears, however, that the trend is small enough to be of very little
importance.
The difference between the wave velocities in the unburied and
buried pipes represents the effects of the soil support. In the case of
the 6-inch PVC pipe this resistance to motion offered by the soil has

31
increased the wave velocity on the average of 7 percent (from 1120 fps
to 1210 fps), and when first compacted 12 percent.
The increase in velocity in buried over unburied PVC pipe is less
than the difference between the velocity computed by Eq. 1 for no axial
movement (1390 fps) and that computed for expansion joints throughout
(1250 fps). Consequently, it could be concluded that the major effect
from the compacted fill is to prevent axial movement of the pipe. Clearly,
the unburied pipe with an expansion joint which does not slip without
resistance, would be expected to give wave velocities between the com
puted values with and without axial restraint.
In the case of the more rigid PERMASTRAN® pipe, the effects
on the wave velocity of burying the pipe are even smaller (see Tables 5,
6, and 7). No decreasing wave velocity trend can be detected with the
number of the test in PERMASTRAN® pipe, and the average velocity
in the buried pipe is 3.5 percent greater than in the unburied pipe, a
difference which is of about the same order of magnitude to which the
velocity can be determined from the Visicorder charts. The conclusion,
therefore, is that burying PERMASTRAN@ pipe in a well compacted fill
has a minor effect on water hammer.
Of greater significance in the case of the PERMASTRAN ® pipe
is the difference between the theoretical velocity computed from Eq. 1
and the measured velocities. If the value for the axially restrained thin
walled pipe is used (1830 fps), the average measured velocity (1555 fps)
is 15 percent less than the computed. Entrained air in the water would
explain much of this difference. For example, the entrained air effect
might be assumed equal to the difference between the computed and average
measured velocity in the PVC pipe (1395 fps - 1200 fps = 195 fps). This
assumed difference of 195 fps in the wave velocities due to entrained air
is realistic. Using the theory presented by Olsen (1966) in Problem 2- (JO,
shows that approximately. 06 percent (volume basis) of air in wate r could
reduce the wave velocity by this amount. The remaining difference

32
between the theoretical and measured wave velocities in the PERMASTRAN@
pipe is then approximately 80 fps. A reduction of Poisson's ratio from
the given 0.52 to 0.46 would account for 60 fps of this 80 fps.
l0".agnitude of Pressure Increases
The development of Eqs. 1 and 2 assumes, among other things, that
the valve is closed during zero time. Due to physical limitations water
hammer waves always result from a time dependent closure of a valve,
but often the time of closure is rapid enough that the effect, for all
practical purposes, is identical to a zero time closure. As mentioned
earlier in the report, the first tests were conducted when the complete
closure of the valve occurred over too long a time increment, particularly
at the higher velocities. Much of the difference between the classical
squar~ water hammer wave pattern and the actual shape observed from
the Visicorder charts is due to the time dependent closure of the valve.
A computer program was developed to solve the water hammer
problem resulting from a programmed valve closure. A brief description
of the method of solution used in this program, as well as the means for
denoting the valve closure relationship, is given in Appendix A. The
solution obtained from this program under the assumption that the valve
closed very rapidly (i. e., within. 00001 seconds) with an initial velocity
V = 10 fps is plotted as the solid lines in Fig. 6. The slight difference o
from the vertical shown by these lines is not actual, but due to the time
interval At used in the solution (which, for this solution, is .008'1
seconds). The solution shows the complete change in pressure within
this time interval, and the plotting of the pressure curves simply con
nected pressure at consecutive time intervals by straight lines. A better
plotting would have constructed vertical lines midway between the time
intervals at which the pressure changed. This solution gives an increase
in pressure to 212 psi from 50 psi or 162 psi, which corresponds exactly
with that given by Eq. 3a.

z -. (3
en ....... aJ .....J
Z -
~rl~~~~~~~~~~~~~~~~~~~~~~~~~~~~~~~~~~~~~~~~~ ~
ISI-IlSI ~
lSI L/)
r ( ,
\
I
\ \
\
10 ft upstrea:m fro:m valve
60 ft upstream fro:m valve
110 ft upstrea:m fro:m valve
l\ "\ ~I
No. Z UJ a: :::l en lSI -Ien
Se:de~ II 2. PVC pipe
-UJ a: a...
ISIt" I.f') 'Valve Closure ti:me. t= O. 00001 seconds. I i. e. instantaneous
-" Darcy Weisbach f = 0.01
~t Wave Velocity a = 1200 fps
1 Length of pipe = 120 ft. -
t V = 10 fps l ~ I 10j I I I I I I I I I I I I I I I I I I I I I I I I I I I I I 1 I I I 1 1 1 I I 1 1.1 I 1 1 1 1 100 .05 .10 .15 .20 .25 .30' .35 .ij0 .ij5 .50
TIME FROM BIGINNING OF VALVE CLOSURE (SEC)
FIG. 6. WATER HAMMER fRESSURE WAVE RESULTING FROM PROGRAMMED VALVE CLOSURE
34
If, however, the valve closure occurs during some finite time, the
pressure wave will not be square, and if the time is of sufficient duration
for the reflected wave to arrive back at the valve during its closure, the
maximum pressure will be reduced. To illustrate this, the results from
a computer solution with a = 1200 fps and V = 10 fps as in the previous o '
solution, but with a programmed valve closure, are given in Fig. 7. The
time dependency of the valve closure is shown by the table within the
graph. Perhaps a more representative description of the valve closure
for this problem is given by the time variation of the dimensionless value
C 4' defined by Eq. A- 13 (in Appendix A), and which has been plotted in
Fig. 8. The test results from test No.2, series #2 on PVC pipe are
superimposed on both the solutions given in Figs. 6 and 7, as dashed
lines. The different position of the experimental and theoretical lines on
Fig. 7 for the drop in pressure is associated with the fact that the theoretical
solution specified a pipe length of 140 feet. If the duration of the positive
pressure is disregarded, clearly closer agreement exists between the
experimental results and the theoretical ~olution with the programmed
valve closure than with the instantaneous valve closure. Good agreement
between the theoretical and experimental curves is not expected over the
negative wave cycle. Any column separation would cause the negative
cycle to be longer. The computer solution assumes a reservoir exists
upstream, whereas the experimental set-up goes to an 8-inch pipe pre-
ceded by elbows, valves, and finally the pump. Other explanations for
differences are that the computer solution does not account in any way
for the effects of the compacted soil, if any exist. Furthermore, the
discharge coefficients Cd given for the valve for the various partially
closed positions are only rough estimates. Clearly as the valve becomes
nearly closed Cd should be smaller, but no data are available (nor were
any tests conducted) to determine the correct values of Cd for different
positions of the gate in the valve. In addition, the area through which
water can flow between the gate of the valve and its two seats is not
• z ..... • ~ ~ -l
Z .....
~ en (f1 lU
IE
~ • j. ,
~
.s. In
1St
VALVE CLOSURE Time y
0.0 2.0 0.015 2.5 0.05 5.7 . 0.25 5.72 0.26 6.0
v = 10 fps o
Cd ,. 5 .48 . 25 .20 .00
t-ength of pipe = 140 ft
Wave Velocity:: 1200 fps
Darcy Weisbach f = 0.01
~ "I III I I I I I I I I I I I I I I I I I I I I I I I I I I I I I I I I I I I I I I I I I I I I I , U'0 .05 .10 .15 .20 .25 .30 .35 .ij0 .ij5 .50
TIME FROM BIGINNING OF VALVE CLOSURE (SEC)
FIG~ 7. WATER HAMMER PRESSURE WAVE RESULTING FROM PROGRAMMED VALVE CLOSURE

1.0
f\ 'I-
U-.:t'·75
Q) ,... :j U)
o ..... U U) .5 U)
Q)
d o
.,-4
U)
s::: Q)
E ..... 25 ~
-~
~ ~
~
I-
I-
l-
I-
~
~ I
36
I I • I I • • I
0
0
-
" , -I !
-
· 0
\ 0
· · ·
I I o o .05 . 1 .15 .2 .25
Time (seconds)
Fig. 8. Valve closure characteristics used in computer solution of Figs. 7, 9, and 10.
described completely in the computations in the computer program.
Rather than attempting to obtain complete agreement between the com
puter solution and the measured pressure waves, the intent is to
demonstrate that measured pressure patterns are, in fact, in good
agreement with water hammer theory, providing this theory adequately
accounts for the physical influences.
The results from a computer solution with the same programmed
valve closure as was used to obtain the solution in Fig. 7, but /'0" which
the pipe is 20 feet shorter, is shown in Fig. 9. In thiR solution, on' y it
10-foot length of pipe exists between the upstream pressure-time wave
which is shown and the reservoir. Note that the peak pressure at this
point is considerably below the peak pressures further downstream. For

z .......
C!J en "-co -1
Z .......
UJ a: ::J en en UJ a: a...
~ .r-~~~~~~'-'-~~~~~~-r-r-r-r-r~~~~~~~~~~~~~~~~~~~~~~~~~'-~'-'-~~~ ~
~+ 10 ft ~
IS} If) .-4
IS} IS} .-4
IS} If)
IS} If)
I
IS} IS} .-4 I
lSI If) .-4
t 01Zl
Time y . Cd : 0.0 2.0 0.5 0.015 2.5 0.48 0.05 5.7 0.25 0.25 5.72 0.20 0.26 6.0 0.00
Darcy Weisbach f = 0.01 Wave Velocity a = 1200 fps Length of pipe = 120 ft
V 0 = 10 fps
.05 .10 .15 .20 .25 .30· .35 .4:0 TIME FROM BIGINNING OF VRLVE CLOSURE (SEC)
.45 .50
FIG. 9. WRTER HRMMER PRESSURE WRVE RESULTING FROM PROGRRMMED VRLVE CLOSURE

38
an instant valve closure this peak pressure would equal the downstream
peak pressure. Also in this solution the effects of completing closure
after the reflected wave has returned causes a complex pattern of waves
to occur after the initial positive wave.
Fig. 10 gives the results from a computer solution in which the
velocity in the pipe was specified as V = 6 fps, but valve closure o
characteristics remain as in the solution in Fig. 7. The maximum
pressure from this solution also agrees closely with the measured
pressures in the tests for which V = 6 fps in the PVC pipe. o
To provide an overview concerning the agreement of the measured
and theoretical pressure values, Figs. 11 through 18 have been prepared.
The first four of these figures (11-14) show the increases in pres sures
due to the water hammer as computed by Eq. 3 using the actual mea
sured velocity from each test against the measured pressures from the
test using the data obtained from tests on PVC pipe. The different
plotting symbols distinguish the test series from which the data were
obtained. In most cases the upstream normal and peak pressures were
recorded as being identical. The last four of these figures (15-18) con
sist of the similar plots constructed using the data from the tests on the
PERMASTRAN ® pipe.
CONCLUSIONS
In summary, the experimental test results of water hammer
pressure waves in both PVC and PERMASTRAN@ pipe arc in r(!at:wn
able agreement with those predicted by commonly used equations. In
both types of pipe the velocity of the pressure wave is less than that
predicted by theory. The difference is easily accounted for in PVC pipe
by entrained air, and for PERMASTRAN@ pipe, in which the difference
is greater, by perhaps a better definition of the material's Poisson's
ratio and modulus of elasticity. The measured pressure increases due

z ..... •
C3 (f)
" tIl -l
Z .....
,~ .... -P~~~~~~P-~~~~~ .... -P~~~~~~P-~~~~~ .. -P~~~~~~P-P-~~~~~-P-P~ N
ISl
~
ISl III -ISl ISl -ISl III
10 it upstream from valve
60 ft upstream from valve
VALVE CLOSU RE Time y Cd
UJ a::: => (f) ISl
0.0 2.0 0.5 (f)
~ Q..
ISl III I
ISl ISl -1
51
0.015 2.5 0.48
O.O~ 5.7 0.25 0.25 5.72 0.20 0.26 6.0 0.00 i
Darcy. Weisbach f = 0.01 Wave Velocity a = 1200 fps Length of pipe = 140 ft
V = 6 fps a
~ , 1 1 1 1 I 1.1 1 1 I 1 I 1 1 I 1 1 1 1 I I I 1 I I I 1 I 1 I I I I I I I 1 I I I I I I I I I I lit t00 .05 .10 .15 .20 .25 .30 .35 .ij0 .1l5 .50
TIME FROM BIGINNING OF VALVE 'CLOSURE (SEC)
FIG. 10. WATER HAMMER PRESSURE WAVE RESULTING FROM PROGRAMMED VALVE CLOSURE
-. n o 3: \l D :::n ...... (J) o z o
" n o 3:
" C -I m Cl
:D Z CJ
Cl o ~ z (J) -I :::D m :D 3:
\l :::n m lJ) (J) c :::n m ...... Z
\l < n \l ...... \l m
~
~ ::J: 1"1 Z ... -1151 III 151 D tn 1"1 o C Z
::J: 1"1 D tn c: ::D 1"1 c ....
'til 35151 < 1"1
~ r ~ .... -I -< --u tn ....
MEASUAED PAESSUAElNOAMAL) INCAEMENT AT DOWNSTAEAM TAANSDUCEAlPSI) 5fJ 1 fJfJ 15fJ 2fJfJ
K' I I I I I I
X x
f- '\. f- • +:\.
xx~,
~ f-
x .'tc ~.
'\. I-
.~~ ~x
.~ f- W 'x x. I-
+ . l- X
X
I- ; c:rn • • >1++ Z-I P t.\)N"'~(J) ~::D 1"1 .... • X ++x 01"1
.1_ If
x + f-
I
I':

.... en 0....
0: UJ U a en z
lSI lSI N
a: lSI 0:1/) ~-
ffi 0: ~ en 0.... :::l
~ a: ~ z UJ z::: UJISI 0: lSI uZ .... ...J a: z::: 15 z UJ 0: :::l en en UJ
1Et1J c UJ 0: :::l en a: UJ z:::
lSI
I
x x
x
x
+ ~
~X *II • xl +
* ..
/ m .. " Ix m :.--/.."X I .Ai
*1 I" .. /1 t .1 I x
I K
t
~/ x
TEST SERIES
&I~
UNBURIED SYMBOL
.r/ 1 -- e
2 ..
3 +
/ ..
x
sla 1 Iala ISla 21a1a THEORETICRL PRESSURE INCREMENT BRSED ON MERSURED WRVE VELocnnpSIl
FIG. I~. COMPARISON OF COMPUTED AND UPSTREAM PRESSURE IN PVC PIPE.

~
--en ~
~ a: lSI
~.~
ffi ~ en
I Ia: Iz I&JISI z:1SI I&J-
~ -i ~
! en
f~ c
i ~
lSI
I
--
--f-
r-
I-
V:X VA
" /~ .
f- II
V'. 5111
/
1/+\ ¥
/" + • •. xX /'! . • .
px __
-
TEST SERIES STMBOL I
UNBUAIED __ .. l 1 • r----4 2 + 3 x
.., I
I
1111111 15111 2111111
THEORETICAL PRESSURE INCREMENT BASED ON MEASURED WAVE VELocrTTtPSIl
FIG. 13. COMPARISON OF COMPUTED AND PEAK DOWNSTREAM PRESSURE IN PVC PIPE.

·1 -r - I ,l/I
... -en
I-
t-
~ I-~ X
~ ~ I 4 Xx
ens x~: I~ ~ +----~ z ~ I x ~ x + .... I- e+ A.t: !; A x ~
~ xx/ + ~ *x .... I- Y, .. z .. ~s / ~ z s ,lCx~ --.. ----1-----__ +---1 ~- ~I
~ ~ y.) IE et: ..
7 t A ~ I.~ x
~ x~ x ~s .. ______ --+ ____ _ CL. In ~". ffi • ~ .... m ~ • ~ / ..
• ..
i ~
I-
.. TEST SERIES UN~IED SYMBOL 1 -~.
2 .. 3 +
x
-
-
Vi, Ii s 58 1111 1511 2IIIiI
Tt£ORETICFL PAESSlI£ INCftEHENT BASED ON HEASlfIED WAVE VELOCnYlPSIl
FIG. 14. COMPARISON OF COMPUTED AND PEAK UPSTREAM PRESSURE IN PVC PIPE.

en IL
a: UJ u ::::l CJ en z: cr: a:
lSI tSI N
..... ISI %:1.1') cr: UJ a: ..... en ~ Cl CJ
..... cr: ..... z: UJ %: UJISI a:tSI u ..... z:
...J cr: %: a: Cl z: UJ a: ::::l en en UJ a: lSI ILI.I')
CJ UJ a: ::::l en cr: UJ %:
tSI
f-
f-
~
f-
I-
f-
V' l-
I I
:7 CJ
++ C!)
+. ...
+:11 ...
~ +
V
7 '++
*'// ... '"
. )'. ...
/ TEST SERI!;;~ .mtBOL
UNBURIED C!) vct:jl-1 ... 2 + '-----
~/ ~
/ I I I I
-
SIZI 1121121 15121 2121121
THEORETICAL PRESSURE INCREMENT BASED ON MEASURED WAVE VELOCrrr(PSI)
FIG. 15. COMPARISON OF COMPUTED AND DOWNSTREAM PRESSURE IN PERMASTRAN PIPE.

""T1 ..... p (1) . n o :x ~ JJ :::IJ ..... (J) o z .0 "'TI
n o :x -0 c -i m CJ
JJ Z CJ
C -0 (J) -i :::IJ m JJ :x -0 :::IJ m (J) (J) c ~ ..... Z
-0 m :::IJ :x JJ (J) -i :::IJ JJ Z
-0 ..... -0 m
III ~
*
-
.
~
MEASURED PRESSURElNORMAll INCREMENT AT UPSTREAM TRANSDUCERlPSIl 5111 1111£1 15111 2111111
I I I I
ft
"-
~ . ~.~ . ... •
~.:. + +
21 ~+i
" N~~
~ I ,
+ .. ~ .... •
19 .. ~ ~ ~

~ -~ a:: UJ u :::l c <n z
~ N
a: lSI a::1/'l 1- .....
:z:: a: UJ a:: I<n z ::s: o c Ia: I-z UJISI :Z::ISI UJ ..... a:: u z
~ UJ Q..
UJ a:: ~ <n UJ a:: lSI Q..I/'l
c UJ a:: ~ a: UJ :z::
lSI
+ ,
+ t
+
~
+ I!)
~+
~
~
I!)
~
+ ,t TE:;!T SERIES SIt160L I!)
UNBURIED-- I!)
1 ~
2 +
l ~ 1-
Sf2I lf2lf21 lSf2I 2f21f21 THEORETICAL PRESSURE INCREMENT BASED ON. MEASURED HAVE VELOCrrrlPSIJ
FIG. 17. COMPARISON OF COMPUTED AND PEAK DOWNSTREAM PRESSURE IN PERMASTRRN PIPE

.... If) IL
a: UJ U :::l Cl If)S ZL/) a: ..... a: I-
:z: a: UJ a: IIf) IL :::l
Ia: IZs ~S UJ ..... a: u Z
~
:.:: a: UJ IL
UJ a: :::l If) If) UJ a:s ILL/)
Cl UJ a: :::l If) a: UJ :z:
I + L/
r- + t/~ r- y./
+! ... (!)
+ (!)
.:~7 .. /'
.~ ... /'" TEST SERIES SntBOL
/~ UNBURIED -- (!)
1 ...
:/ 2 + - -
: l/ V
5121 1111121 15111 2111121
THEORETICAL PRESSURE INCREMENT BASED ON MEASURED WAVE VELOCITYlPSIJ
FIG. 18. COMPARISON OF COMPUTED AND PEAK UPSTREAM PRESSURE IN PERMASTRRN PIPE.

48
to water hamnwr also agree reasonably well with theoretical valueH.
The influence of burying the PVC pipe in a we L1 compacted fill
increases the velocity approximately 5 to 10 percent. The wave velocity
in buried PERMASTRAN® pipe is increased by approximately one-half
this amount, or from 2 to 5 percent.
REFERENCES
Olsen, Reuben M. (1966), Engineering Fluid Mechanics 2nd Ed. , International Textbook Co., Scranton, Penn.
Streeter, Victor L. and E. Benjamin Wylie (1967), Hydraulic Transients, McGraw-Hill Book Co., New York.
Watters, Gary Z. (1971), "The Behavior of PVC Pipe Under the Action of Water Hammer Pressure Waves," PRWG-93, Utah Water Research Laboratory, Utah State University, Logan, Utah.

•
49
APPENDIX A
COMPUTER SOLUTION OF WATER HAMMER
The computer program used to solve the water hammer problem
is based on the following assumptions:
1. The velocity of the pres sure wave, resulting from transient
flow conditions at a point, is a constant and known.
2. The average velocity of flow in the pipe is very small in
comparison with the velocity of the pressure wave.
3. The flow is described adequately by one-dimensional equations.
Under these assumptions, the unsteady continuity and momentum
equations can be combined to give the following equations which are in
a form for numerical solution by the method of characteristics
Streeter and Wylie, 1967, Chap.
.K.. dH + dV fV Ivi +
dt dt 2D a
.K.. dH + a dt
dx -dt
dV dt
dx dt
= a
+ fV Ivi 2D
= - a
3 ).
= 0 C+
= 0 C
(see
(A-I)
(A-2)
(A- 3)
(A-4)
2 in which g is the acceleration of gravity (Lit), a is the velocity of
the pressure wave (Lit), H is the hydraulic head (L), V is the
average velocity of flow in the pipe (Lit), D is the pipe diameter (L),
f is the Darcy- Weisbach friction factor, t is the time, and x is the
space coordinate in the direction of the pipe axis (L). Equation A-I
is valid only along the positive characteristic whose slope is defined
by Eq. A-2. Likewise, Eq. A-3 is valid only along the negative
characteristic defined by Eq. A -4.

•
50
Approximating the derivatives in Eqs. A- 1 through A-4. by
appropriate differences and combining the results lead to the following
com.m.only used finite. difference equations for advancing the flow
velocity and hydraulic head, respectively, through one time increment.
v.j + l 1/2 [v! I + v! I + ..&-
j H j ) _ f ~t (v j IV!-ll = (H. 1
1 1- 1+ a 1- i+l 2D i-I
+ j Ivt+ll) J 0 (A- I)) V. 1 = 1+
and
H~+l 1/2 [ j j a j Vj ) -.!.. f ~t (j I j I = Hi _l + Hit 1 + g (V. 1 2D Vi -1 Vi _1 1 1- it1 g
(A- 6)
in which the superscript j denotes the time step, i. e., j = t/~t + 1,
and the subscript i denotes the number of the x grid, i. e., i = x/ ~x + 1.
At the upstream end of the pipe (x = 0), the assumption has been
made that a reservoir exists. This assumption does not actually repre
sent the true conditions of the tests which consist of an 8 inch pipe
preceded by a number of bends, valves and transitions which eventually
lead to the pump which has different characteristic curves depending
upon its rotational speed. Because of the complexity of building all of
these features into the computer program, and also because the main
concern of the study is measurements of the pressure wave velocities
and maximum resulting pressure increases, the upstream reservoir
assumption has been used in the computer solution. The reservoir
condition leads to the finite difference equations:
H (constant) • o
(A·7)

..
51
(A-H)
At the down stream end of the pipe a programmed valve closure
condition has been used in the computer solutions. The times required
for the gate valve to move the first l/Z inch the next 3 inches and
finally the last 1/ Z inch were recorded for each of the tests carried
out on the buried PVC pipe. The rate of valve close was specified by
input data giving the position of the gate of the valve and the time at
which it had this position. The tests on the PERMASTRAN ® pipe
also gave data that fit well into this description. The valve was repre
sented by a circle sliding downward within a circle of the same diam.eter
(see Fig. A-I). With this representation, the area through which the
flow can pass is given by:
n Z 'lTDZ Av= Z (9-l/ZsinZ6)- 4 (A-9)
The angle 6 is related to the vertical position,of the valve Y by the
equation,
cos 6 = Y
- 1 n (A-IO)
Since the sam.e flow passes through the valve opening as through
the pipe imm.ediately upstream from the valve
YZ H j +l g N
Z 'lTD
4 (A- I I)
in which C ~ is the discharge coefficient for the valve in its position at
the tim.e corresponding to j and the subscript N denotes the end of
the pipe •
By dividing Eq. A-II by itself, but with j = I leads to the follow
ing equation:

,
Initial ,/ " - - - .... ......--- Position
/ " of Valve Gate / \
I \
I \
Valve ~,~
Gate
y = D (I + cos 9)
D
Fig. A-I. Schematic diagram of gate of valve moving down through valve opening.
52
C j + l = Vo 4
g +l H J 1 • (A-12)
H
in which
. (cj+l) ~j+l) C J+I_ d v 4 - 1 1·
Cd Av
Solving Eq. A-8 simultaneously with the finite difference equation
from Eq. A-I leads eventually to the following two equations:

53
(A-14)
and
(A-IS)
in which
...s... a
•

•
54
APPENDIX B
SAMPLE OF VISICORDER CHARTS
On the visicorder charts the time increment between consecutive
vertical lines is 0.01 seconds. The distance between consecutive
horizontal lines on the original charts equals O. 1 inch with each fifth
such line heavier to make 1/2 inch intervals •

•
•
t 1./ j , ,
Portion of Visi- .,corder chart from test no. 36 of first series on bur-ied PVC pipe (Table 2)_
++-I++P,l--~ . - . --- t-i";"~-
~III~~ Portion of Visi-::tde:~~ar: :ro::; ._\-_____ -:-~-_-_-.-_.~_-;~-.-~ _ : : _ first series on bur- '!
--'-l++J.Jf----,--- i e d PER M-o ~ ---\-+-------t-:-ASTRAN pipe'
_ ~: :' _ (Table 5). i _ ~
"'~III ,. 'I 'II I!" ,.' I! ' i I I II' I" I " ! I , . --, ,-T I r H j I ~: i! : ! : : , ' ,,' II ! 1
downstream transducer . upstream transducer I. I
''1'11'1'' ;'lll ~~. I '11'11"" 1·1 t! t ! I I! I III I I' i I
. I]": I'j'" , . ttt;· '~ I"~'.t , ! III ,I .lJ..i' I ! ", I
III t t t tIT iii ,I I ,I - . : I _ : I I_
I
I i , 1
: r'
- -It -
rllst \0 inch of valve CIOIft ~$ tlttl_
next 3~ inch of valve closure
last ~ inch of valve closure
---
Portion corder c
of Visi· hart from
29 of ries on VC pipe
test 00_
third ae boried P
(Tabl~ 4) -I-I
+--+~-j------------~~---
: : series on unbur-----·icd PERM-
- ASTRAN pipe : (Table 7).