Technical Failure of Medial Patellofemoral Ligament Reconstruction
Upload
khangminh22Category
view
1download
0
University of Tennessee, Knoxville University of Tennessee, Knoxville
TRACE: Tennessee Research and Creative TRACE: Tennessee Research and Creative
Exchange Exchange
Doctoral Dissertations Graduate School
5-2014
Dynamic Simulations and Data Mining of Single-Leg Jump Dynamic Simulations and Data Mining of Single-Leg Jump
Landing: Implications for Anterior Cruciate Ligament Injury Landing: Implications for Anterior Cruciate Ligament Injury
Prevention Prevention
Kristin Denise Morgan University of Tennessee - Knoxville, [email protected]
Follow this and additional works at: https://trace.tennessee.edu/utk_graddiss
Part of the Biomechanics and Biotransport Commons
Recommended Citation Recommended Citation Morgan, Kristin Denise, "Dynamic Simulations and Data Mining of Single-Leg Jump Landing: Implications for Anterior Cruciate Ligament Injury Prevention. " PhD diss., University of Tennessee, 2014. https://trace.tennessee.edu/utk_graddiss/2717
This Dissertation is brought to you for free and open access by the Graduate School at TRACE: Tennessee Research and Creative Exchange. It has been accepted for inclusion in Doctoral Dissertations by an authorized administrator of TRACE: Tennessee Research and Creative Exchange. For more information, please contact [email protected].
To the Graduate Council:
I am submitting herewith a dissertation written by Kristin Denise Morgan entitled "Dynamic
Simulations and Data Mining of Single-Leg Jump Landing: Implications for Anterior Cruciate
Ligament Injury Prevention." I have examined the final electronic copy of this dissertation for
form and content and recommend that it be accepted in partial fulfillment of the requirements
for the degree of Doctor of Philosophy, with a major in Biomedical Engineering.
Jeffrey A. Reinbolt, Major Professor
We have read this dissertation and recommend its acceptance:
William R. Hamel, J. A. M. Boulet, Songning Zhang
Accepted for the Council:
Carolyn R. Hodges
Vice Provost and Dean of the Graduate School
(Original signatures are on file with official student records.)

Dynamic Simulations and Data Mining of Single-Leg Jump Landing:
Implications for Anterior Cruciate Ligament Injury Prevention
A Dissertation Presented for the
Doctor of Philosophy
Degree
The University of Tennessee, Knoxville
Kristin Denise Morgan
May 2014

ii
Copyright © 2014 by Kristin Denise Morgan.
All rights reserved.

iii
DEDICATION
To my parents
Drs. Morris and Carolyn Morgan
And my brother
Eric Morgan
iv
ACKNOWLEDGEMENTS
First I would like to thank my adviser, Dr. Jeffrey A. Reinbolt, for giving me the
opportunity to purse my PhD in his laboratory. I was able to learn how to conduct research and
your guidance throughout this process was invaluable.
I would also like to thank Dr. Cyril J. Donnelly first and foremost for providing the data
for this research and for serving as another mentor. The trip to Australia would not have been
possible without your help and I am grateful for both the research experience and for introducing
me to Gil Weir, Natalie Smailes and Nev Pires. I learned a lot from them while I was there and
they really made me feel like I was home half way across the world.
To my fellow colleagues in RRG - Misagh Mansouri, Ashley Clark, Hoa Hoang, Taylor
Schlotman, Geena Doak, and Breanna Rhyne - thank you for making the last four years so
enjoyable. I am amazed that we were able to get so much work done while laughing. Thanks for
the memories.
I would like to acknowledge the Program for Excellence & Equity in Research (PEER)
for providing me with a support network here at UTK as I pursued my degree and for helping me
cultivate my professional development skills.
And finally I would like to thank my parents, Drs. Morris and Carolyn Morgan, and my
brother, Eric Morgan. I would not have been able to complete this without your support,
guidance, and encouragement. I am extremely grateful that you all are in my life.

v
ABSTRACT
It is estimated that 400,000 anterior cruciate ligament (ACL) injuries occur in the United
States each year with the cost of ACL reconstruction surgery and rehabilitation exceeding $1
billion annually. The majority of ACL injuries are non-contact injuries occurring during cutting
and jump landing movements. Because the majority of the injuries are non-contact injuries there
is the potential to develop programs to reduce the risk of injury. Given our understanding of the
joint kinematics and kinetics that place an individual at high risk for ACL, researchers have
developed neuromuscular training programs that focus on improving muscle function in order to
help the muscles support and stabilize the knee during the dynamic movements that increase the
strain on the ACL. Yet, despite the implementation of these neuromuscular-based ACL injury
training intervention programs ACL rates continue to rise. Thus the objective of this dissertation
is to determine the cause and effect relationship between joint biomechanics and muscle function
with respect ACL injury.
There are four studies in this dissertation. The first two studies rely heavily on the
development of subject-specific musculoskeletal models to analyze muscle contribution during
single-leg jump landing. These studies will generate forward dynamic simulations to estimate
muscle force production and contribution to movement. The results of these studies will aid in
the development of muscle-targeted ACL injury training intervention programs. The last two
studies will employ data mining techniques; such as, principal component analysis (PCA) and
wavelet analysis along with stability methods from control theory, to evaluate an individual’s
risk of ACL injury and determine how muscle function differs for individuals at varying levels of
injury risk. The goal will be to use this information to develop a more robust ACL injury
prescreening tool.

vi
The use of both dynamic simulations and data mining techniques provides a unique
approach to investigating the relationship between joint biomechanics and muscle function with
respect to ACL injury. And this approach has the potential to gain much needed insight about the
underlying mechanism of ACL injury and help progress ACL research forward.
vii
PREFACE
This dissertation presents four studies conducted using dynamic simulations, data mining
and wavelet analyses to develop more effective ACL injury intervention and prescreening
programs. Each chapter is writing as a separate technical paper and an overview of the goals and
methods employed in each study are provided. Additionally, each chapter provides an in-depth
discussion of the study findings and how these findings were used to answer the questions posed.
Chapter 6 provides a summary of the results of the four studies in the dissertation and delineates
how they were applied to develop better protocols for identifying individuals at risk for ACL
injury.
viii
TABLE OF CONTENTS
CHAPTER I INTRODUCTION .................................................................................................... 1
1.1 Literature Review.................................................................................................................. 1
1.1.1 Defining the Function of the Anterior Cruciate Ligament ............................................. 1
1.1.2 Cadaveric and In-vivo Analysis of ACL Strain ............................................................. 2
1.1.3 Kinematics and Kinetics: Biomechanical Assessment of ACL Injury Risk .................. 4
1.1.4 Electromyography (EMG): Bridging the Gap between Kinematics and Kinetics and
Muscle Function...................................................................................................................... 6
1.1.5 Computational Modeling: Utilizing Simulations to Assess Cause-Effect Relationship
in Human Movement ............................................................................................................ 10
1.2 OpenSim and Musculoskeletal Modeling Software ........................................................... 10
1.3 Overview and Specific Studies ........................................................................................... 11
1.3.1 Study 1: Elevated Gastrocnemius Forces Compensate for Decreased Hamstrings
Forces during the Weight-Acceptance Phase of Single-Leg Jump Landing: Implications for
ACL....................................................................................................................................... 13
1.3.2 Study 2: Assess How Individual Muscles Resist Elevated Knee Abduction Moment
during Single-Leg Jump Landing. ........................................................................................ 13
1.3.3 Study 3: Dynamic Knee Stability and Principal Component Analysis: Methodology
for Assessing Anterior Cruciate Ligament Injury Risk. ....................................................... 14
1.3.4 Study 4: Utilizing Stability and Wavelet Analyses to Detect Muscle Activation
Patterns Associated with ACL Injury Risk. .......................................................................... 14
1.4 References ........................................................................................................................... 16
CHAPTER II ELEVATED GASTROCNEMIUS FORCES COMPENSATE FOR DECREASED
HAMSTRINGS FORCES DURING THE WEIGHT-ACCEPTANCE PHASE OF SINGLE-LEG
JUMP LANDING: IMPLICATIONS FOR ACL INJURY RISK ................................................ 19
2.1 Abstract ............................................................................................................................... 20
2.2 Introduction ......................................................................................................................... 21
2.3 Methodology ....................................................................................................................... 23
2.3.1 Experimental Protocol and Data Collection ................................................................ 23
2.3.2 Subject-Specific Models and Simulations ................................................................... 25
2.3.3 Muscle Force Estimates during Single-leg Jump Landing .......................................... 27
2.4 Results ................................................................................................................................. 29
2.5 Discussion ........................................................................................................................... 39
2.6 References ........................................................................................................................... 46
2.7.1 Scaling.......................................................................................................................... 51
2.7.2 Inverse Kinematics (IK) ............................................................................................... 51
2.7.3 Residual Reduction Analysis (RRA) ........................................................................... 52
2.7.4 Computed Muscle Control (CMC) .............................................................................. 53
2.7.5 ACL Force Calculation ................................................................................................ 55
CHAPTER III ASSESS HOW INDIVIDUAL MUSCLES RESIST ELEVATED KNEE
ABDUCTION MOMENT DURING SINGLE-LEG JUMP LANDING ..................................... 56
3.1 Abstract ............................................................................................................................... 57
3.2 Introduction ......................................................................................................................... 58
3.3 Methodology ....................................................................................................................... 60
3.3.1 Experimental Protocol and Data Collection ................................................................ 60
3.3.2 Subject-Specific Models and Simulations ................................................................... 61
ix
3.3.3 Muscle Contribution to Knee Acceleration during Single-leg Jump Landing ............ 63
3.4 Results ................................................................................................................................. 65
3.5 Discussion ........................................................................................................................... 71
3.6 References ........................................................................................................................... 75
3.7 Appendix ............................................................................................................................. 78
3.7.1 Ground Reaction Force Decomposition....................................................................... 78
3.7.2 Foot-Ground Contact Model ........................................................................................ 78
CHAPTER IV Dynamic Knee Stability and Principal Component Analysis: Methodology for
Assessing Anterior Cruciate Ligament Injury Risk ...................................................................... 81
4.1 Abstract ............................................................................................................................... 82
4.2 Introduction ......................................................................................................................... 83
4.3 Methodology ....................................................................................................................... 85
4.3.1 Experimental Protocol and Data Collection ................................................................ 85
4.3.2 Subject-Specific Models and Simulations ................................................................... 86
4.3.3 Stability Analysis and Classification ........................................................................... 87
4.3.4 Principal Component Analysis and Muscle Activation Assessment ........................... 88
4.4 Results ................................................................................................................................. 90
4.5 Discussion ........................................................................................................................... 98
4.6 References ......................................................................................................................... 102
4.7 Appendix ........................................................................................................................... 105
4.7.1 Nyquist and Bode Stability Analysis ......................................................................... 105
CHAPTER V UTILIZING STABILITY AND WAVELET ANALYSES TO DETECT
MUSCLE ACTIVATION PATTERNS ASSOCIATED WITH ACL INJURY RISK .............. 107
5.1 Abstract ............................................................................................................................. 108
5.2 Introduction ....................................................................................................................... 109
5.3 Methodology ..................................................................................................................... 112
5.3.1 Experimental Protocol and Data Collection .............................................................. 112
5.3.2 Subject-Specific Models and Simulations ................................................................. 113
5.3.3 Stability Analysis and Classification ......................................................................... 114
5.3.4 Daubechies 4 Wavelet Transform Analysis ............................................................... 115
5.4 Results ............................................................................................................................... 116
5.5 Discussion ......................................................................................................................... 121
5.6 References ......................................................................................................................... 124
5.7 Appendix ........................................................................................................................... 127
5.7. 1 Daubechies 4 Wavelet Transform Generation .......................................................... 127
5.7.2 Hurst Exponent (H) Calculation ................................................................................ 127
5.7. 3 Order Recurrence Plots (ORPs) Analysis ................................................................. 128
CHAPTER VI CONCLUSION ................................................................................................. 129
6.1 Significance of Research................................................................................................... 129
6.2 Research Innovation.......................................................................................................... 130
6.3 Fundamental Contributions ............................................................................................... 131
6.4 Summary ........................................................................................................................... 134
6.5 Glossary ............................................................................................................................ 136
VITA ........................................................................................................................................... 140

x
LIST OF TABLES
Table 1. Mean maximum and minimum muscle force estimates for the individual muscles during
the weight-acceptance phase of single-leg jump landing for fourteen trials. ....................... 32
Table 2. Mean maximum and minimum muscle force estimates for the three muscle groups
during the weight-acceptance phase of single-leg jump landing for fourteen trials. ............ 34
Table 3. Comparison of time differences between peak vertical ground reaction force (GRF) and
maximum muscle force estimates for each muscle group during the weight-acceptance
phase of single-leg jump landing for fourteen participants. Positive time values indicate that
the muscle group reached maximum force after peak GRF was reached. ............................ 34
Table 4. Mean maximum ACL and muscle force estimates for the three muscle groups for when
the loading falls below and exceeds an ACL threshold cutoff value during the weight-
acceptance phase of single-leg jump landing. ....................................................................... 35
Table 5. Comparison of time differences between the maximum ACL force estimates during the
weight-acceptance phase of single-leg jump landing for the trials above and below potential
ACL injury threshold and the maximum vertical ground reaction force (vGRF). ............... 35
Table 6. Comparison of the mean maximum joint kinematics, kinetics and vertical ground
reaction force (GRF) for the fourteen trials during the weight-acceptance phase of single-leg
jump landing. ........................................................................................................................ 38
Table 7. Mean cumulative summation of individual muscle and net muscle contribution in the
frontal plane during the weight-acceptance phase of single-leg jump landing. .................... 70
Table 8. Mean cumulative summation of individual muscle and net muscle contribution in the
sagittal plane during the weight-acceptance phase of single-leg jump landing. ................... 70
Table 9. Mean cumulative summation of individual muscle and net muscle contribution in the
transverse plane during the weight-acceptance phase of single-leg jump landing. .............. 70
Table 10. Comparison of sagittal, frontal and transverse plane kinetics for the stable, marginally
stable and unstable participant groups. ................................................................................. 92
Table 11. Comparison of the number of frequencies and frequency range for the stable,
marginally stable and unstable participant groups computed from the stability frequency
analysis. ................................................................................................................................. 93
Table 12. Comparison of location, scale and threshold parameters from the 3-parameter
lognormal distribution plot for the stable, marginally stable and unstable groups. .............. 94
Table 13. Comparison of surface electromyography data between the stable, marginally stable
and unstable groups............................................................................................................... 96
Table 14. Comparison of sagittal, frontal and transverse plane kinetics for the stable, marginally
stable and unstable participant groups. ............................................................................... 118
Table 15. Mean Hurst exponent (H) calculated from the approximation 1 wavelets for the six
muscles surrounding the knee. ............................................................................................ 120
Table 16. Mean Hurst exponent (H) calculated from the approximation 2 wavelets for the six
muscles surrounding the knee. ............................................................................................ 120
Table 17. Mean Hurst exponent (H) calculated from the approximation 3 wavelets for the six
muscles surrounding the knee. ............................................................................................ 120

xi
LIST OF FIGURES
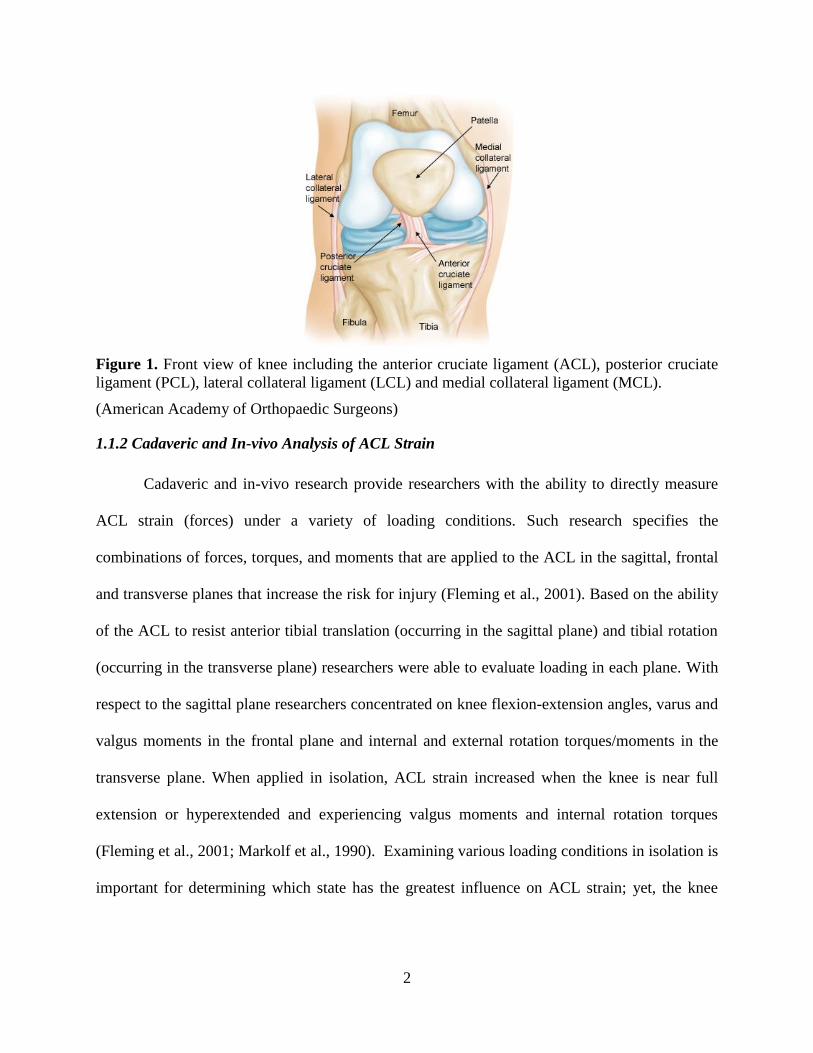
Figure 1. Front view of knee including the anterior cruciate ligament (ACL), posterior cruciate
ligament (PCL), lateral collateral ligament (LCL) and medial collateral ligament (MCL). ... 2
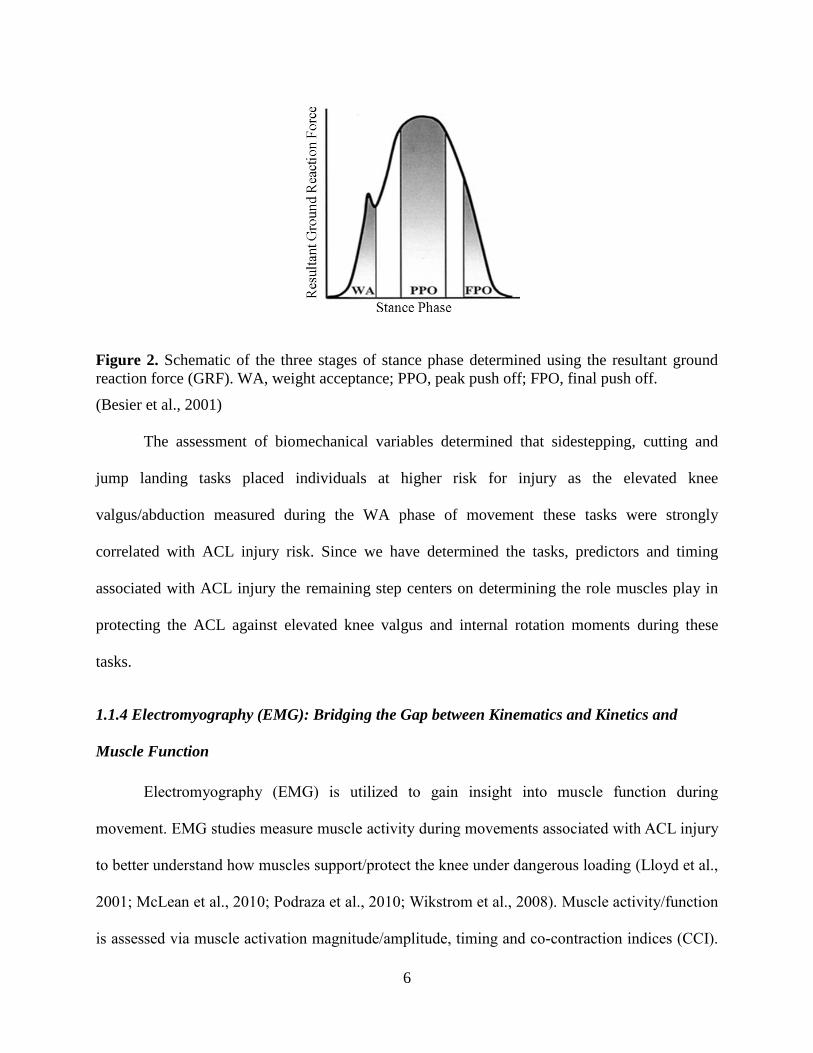
Figure 2. Schematic of the three stages of stance phase determined using the resultant ground
reaction force (GRF). WA, weight acceptance; PPO, peak push off; FPO, final push off. .... 6
Figure 3. Series of images showing one of the seven participants and his subject-specific model
performing the single-leg jump landing protocol: 1) jump from preferred leg; 2) attempt
contact with a football at approximately 90% of vertical jump height and randomly moved
relative to jump path; 3) contact force platform with the same leg used for jump. Three-
dimensional, 14-segment, 37 degree-of-freedom and 92 muscle-tendon actuated subject-
specific simulations were created in OpenSim 1.9.1 from the experimentally measured
kinematic and ground reaction force data to estimate the lower extremity muscle forces
during the weight-acceptance phase of the landing. ............................................................. 26
Figure 4. Vertical ground reaction force (vGRF) for an individual for a single-leg jump landing.
The black box represents the weight-acceptance phase of the landing. ............................... 27
Figure 5. Lower extremity muscles. a) The four quadriceps muscles. b) The hamstring muscles.
c) The gastrocnemii muscles. ................................................................................................ 28
Figure 6. Lower extremity muscle force estimates (normalized by peak isometric force, Fmax)
for muscles crossing the knee joint during the weight acceptance phase of single-leg jump
landing. Mean forces (solid line) and one standard deviation (gray area) for the fourteen
trials by the seven participants. Note, due to the force-velocity relationship of the muscle
model, some normalized force estimates are higher than 1 as a result of eccentric
contractions taking place....................................................................................................... 33
Figure 7. Comparison of the ACL force waveforms for two participants. The black waveform
represents the individual whose ACL force falls below the Woo et al. (1991) cadaveric
injury threshold and the red represents an individual whose ACL force exceeds the
threshold. ............................................................................................................................... 36
Figure 8. Comparison of lower extremity joint angles at different steps in the process of creating
a muscle-actuated dynamic simulation during the weight-acceptance phase of single-leg
jump landing for an example participant. The dashed-line represents the joint angles
calculated by inverse kinematics (IK), the solid line represents joint angles following
residual reduction analysis (RRA) to make the motion dynamically consistent with ground
reaction forces, and the dotted line represents joint angles from the muscle-actuated
simulation generated with computed muscle control (CMC). .............................................. 37
Figure 9. Comparison of experimental surface electromyography (sEMG) and simulated muscle
excitations during the weight-acceptance phase of single-leg jump landing for an example
participant. Experimental unfiltered full wave rectified (gray area) and filtered (solid line)
sEMG and simulated muscle excitations (dashed line) estimated during the weight
acceptance phase of single-leg jump landing. The experimental unfiltered full wave rectified
(gray area) and filtered (solid line) sEMG data are individually normalized to the maximum
recorded signal of each muscle over one of the landing trials. Simulated excitations (dashed
line) are defined to be between 0 (no excitation) and 1 (full excitation). ............................. 39
Figure 10. Schematic of Computed Muscle Control Algorithm. The schematic details the
proportional-derivative feedback controller that compares the desired and model motion at
the beginning of CMC. The optimization block represents the static optimization analysis

xii
from which the muscle activations generated there are used to produce the muscle force
from which forward dynamics computes the resulting model motion (Thelen et al., 2003,
2006). .................................................................................................................................... 54
Figure 11. Series of images for a subject-specific simulation during single-leg jump landing
using a musculoskeletal model with 37 degrees of freedom and 92 muscle-tendon actuators.
............................................................................................................................................... 63
Figure 12. Muscle contributions to experimentally measured knee frontal, sagittal and transverse
plane accelerations (shaded regions) for six muscles crossing the knee and the summation of
the contributions of the six muscles (solid lines) during the WA phase of single-leg jump
landing. Each subplot represents one individual whose waveform represents the data trends.
............................................................................................................................................... 66
Figure 13. Mean cumulative summations of muscle contributions for the six muscles crossing the
knee in the frontal plane for all participants. Each bar plot represents the mean cumulative
sum of the muscles contribution throughout the weight-acceptance phase of single-leg
landing computed from induced acceleration analysis. The error bars are the black lines, the
positive values indicate accelerations into adduction while the negative represent abduction
accelerations. ......................................................................................................................... 68
Figure 14. Mean cumulative summations of muscle contributions for the six muscles crossing the
knee in the sagittal plane for all participants. Each bar plot represents the mean cumulative
sum of the muscles contribution throughout the weight-acceptance phase of single-leg
landing computed from induced acceleration analysis. The error bars are the black lines, the
positive values indicate accelerations into extension while the negative represent flexion
accelerations. ......................................................................................................................... 68
Figure 15. Mean cumulative summations of muscle contributions for the six muscles crossing the
knee in the transverse plane for all participants. Each bar plot represents the mean
cumulative sum of the muscles contribution throughout the weight-acceptance phase of
single-leg landing computed from induced acceleration analysis. The error bars are the
black lines, the positive values indicate accelerations into internal rotation while the
negative represent external rotation accelerations. ............................................................... 69
Figure 16. Comparison of the model computed vertical ground reaction forces (black) and the
experimentally measured ground reaction forces (gray) for one participant during the
weight-acceptance phase of single-leg jump landing. .......................................................... 71
Figure 17. Five ground contact points (per foot) are defined by markers in OpenSim (Lin et al.,
2011). .................................................................................................................................... 79
Figure 18. Representation of the four phases of the foot-ground contact model. Here the circles
represent the five foot-ground contact points and the triangle is the center of pressure (Dorn
et al., 2012). .......................................................................................................................... 80
Figure 19. (a) Subject performing the experimental single-leg jump landing protocol in the
laboratory. (b) Simulation of single-leg jump landing task using a three-dimensional, 14-
segment 37 degrees-of-freedom (DoF) model. ..................................................................... 87
Figure 20. Mean sagittal, frontal and transverse plane knee kinematics (top row) and kinetics
(bottom row) of the stable (black dashed line), marginally stable (blue solid line) and
unstable (red triangle) groups based on frontal plane knee kinetics during the weight-
acceptance phase of single-leg jump landing. ....................................................................... 91
xiii
Figure 21. Comparison the first three principal components (PCs) for the stable (black dashed
line), marginally stable (blue solid line) and unstable (red triangles) groups during the
weight-acceptance phase of single-leg jump landing. .......................................................... 93
Figure 22. Three-parameter lognormal distribution plot of the stable, marginally stable and
unstable group frequencies and 95% confidence bounds for each fitted distribution line.
Although plotted on a logarithmic scale the data is the natural log of the frequency minus
the threshold and follows a normal distribution with mean (location) and standard deviation
(scale). ................................................................................................................................... 94
Figure 23. Comparison of the mean experimental surface electromyography (sEMG) data across
the stable, marginally stable and unstable groups for the six muscles crossing the knee
during the weight-acceptance phase of single-leg jump landing. Stability was based on
frontal plane knee kinetics. Experimental filtered sEMG data for the vastus medialis, vastus
lateralis, medial hamstring, lateral hamstrings, medial gastrocnemius and lateral
gastrocnemius are individually normalized to the maximum recorded signal of each muscle
over one of the landing trials. ............................................................................................... 95
Figure 24. Comparison of the first three principal components (PCs) for the experimental surface
electromyography (sEMG) data for six muscles crossing the knee during the weight-
acceptance phase of single-leg jump landing for the stable, marginally stable and unstable
groups based on frontal plane knee kinetics. ........................................................................ 97
Figure 25. Nyquist and Bode stability plots for stable and unstable joint biomechanics. a)
Nyquist stability plot for stable joint biomechanics. b) Nyquist stability plot for unstable
joint biomechanics. c) Bode gain and phase margin plots for a stable system. The phase
margin was +infinity and the gain margin was 149° at 6.14 rad/s. d) Bode gain and phase
margins plots for an unstable system. The phase margin was -20dB at 2.68rad/s and gain
margin was -90.2° at 25.6 rad/s. ......................................................................................... 106
Figure 26. (a) Subject performing the experimental single-leg jump landing protocol in the
laboratory. (b) Simulation of single-leg jump landing task using a three-dimensional, 14-
segment 37 degrees-of-freedom (DoF) model. ................................................................... 114
Figure 27. Mean sagittal, frontal and transverse plane knee kinetics (bottom row) of the stable
(black dashed line), marginally stable (blue solid line) and unstable (red triangle) groups
based on frontal plane knee kinetics during the weight-acceptance phase of single-leg jump
landing................................................................................................................................. 117
Figure 28. Comparison of a stable and unstable medial gastrocnemius muscle activation
waveforms for the weight-acceptance phase of single-leg jump landing. a) Compares the
raw muscle activation waveforms. b) Compares the Daubechies 4 approximation level 2
waveforms. c) Compares the Daubechies 4 detail level 2 waveforms. Stable waveforms
plotted in green and the unstable in blue. ........................................................................... 119
Figure 29. Order recurrence plots (ORPs) comparing the level 3 medial and lateral gastrocnemii
approximation wavelets of individuals in the stable, marginally stable and unstable groups.
............................................................................................................................................. 121

1
CHAPTER I
INTRODUCTION
1.1 Literature Review
1.1.1 Defining the Function of the Anterior Cruciate Ligament
The anterior cruciate ligament (ACL) is one of four ligaments in the knee. The three
additional ligaments are the posterior cruciate ligament (PCL), medial collateral ligament (MCL)
and the lateral collateral ligament (LCL). Together these ligaments function to stabilize the knee.
The MCL and LCL are aligned along the outside of the knee with the ACL and PCL
crisscrossing each other in the knee joint. The ACL connects the medial portion of the lateral
femoral condyle to the distal portion of the midtibial plateau (Whiting et al., 2008) (Fig. 1). This
orientation allows the ACL to resist anterior translation of the tibia with respect to the femur and
maintain rotational joint stability (Whiting et al., 2008). Thus, when the ACL tears, joint
(specifically rotational) stability is lost. ACL tears occur when the force/loads applied to the
ACL exceeds the ligament strength (tolerance) (Donnelly et al. 2012). It was the work of
previous researchers that determined the orientation and movements that placed the greatest
forces/loads on the ACL and increased its risk for injury.
2
Figure 1. Front view of knee including the anterior cruciate ligament (ACL), posterior cruciate
ligament (PCL), lateral collateral ligament (LCL) and medial collateral ligament (MCL).
(American Academy of Orthopaedic Surgeons)
1.1.2 Cadaveric and In-vivo Analysis of ACL Strain
Cadaveric and in-vivo research provide researchers with the ability to directly measure
ACL strain (forces) under a variety of loading conditions. Such research specifies the
combinations of forces, torques, and moments that are applied to the ACL in the sagittal, frontal
and transverse planes that increase the risk for injury (Fleming et al., 2001). Based on the ability
of the ACL to resist anterior tibial translation (occurring in the sagittal plane) and tibial rotation
(occurring in the transverse plane) researchers were able to evaluate loading in each plane. With
respect to the sagittal plane researchers concentrated on knee flexion-extension angles, varus and
valgus moments in the frontal plane and internal and external rotation torques/moments in the
transverse plane. When applied in isolation, ACL strain increased when the knee is near full
extension or hyperextended and experiencing valgus moments and internal rotation torques
(Fleming et al., 2001; Markolf et al., 1990). Examining various loading conditions in isolation is
important for determining which state has the greatest influence on ACL strain; yet, the knee
3
motion that leads to ACL injuries does not occur solely in one plane, thus researchers analyzed
the effect of combined loadings on the ACL in all three planes.
Such studies analyzed the combined effect knee flexion-extension angles and knee valgus
moments under compression; the combination of externally applied anterior-posterior shear
force, internal-external torques and varus-valgus moments during (20° of) flexion; and the
combination of anterior tibial force, varus-valgus moments and internal-external torques
(Fleming et al., 2001; Markolf et al., 1995; Withrow et al., 2006). The results of these studies
found that ACL strain increased nonlinearly with increasing anterior tibial force as the knee
neared full extension and the force in the ACL increased 30% when under the combined effect of
knee flexion and valgus loading than during flexion alone (Markolf et al., 1995; Withrow et al.,
2006). Fleming et al. (2001) observed an increase in ACL strain during small flexion angles and
valgus loading. The ACL force increased to 300N for the combined loading of internal rotation
and anterior tibial force when the knee was hyperextended, which was twice the force under the
same conditions for external tibial rotation. All of these studies showed that the ACL is under
increased strain and force when the knee is near full extension and experiencing valgus
(abduction) and internal rotation loading.
Cadaveric and in-vivo studies set the ground work for assessing load conditions that lead
to elevated ACL strain. However, cadaveric studies are limited by their inability to measure
strain in its natural environment surrounded by live, supporting musculature and in-vivo studies
are limited by the number of willing participants. Thus researchers were unable to directly
measure ACL strain during dynamic movements. They did nevertheless use the knowledge that
ACL strain increased during increasing valgus (abduction) and internal rotation moments when
4
the knee was hyperflexed or near full extension to investigate during which dynamic movements
(tasks) the knee was in these orientations and the ACL was greater risk of injury.
1.1.3 Kinematics and Kinetics: Biomechanical Assessment of ACL Injury Risk
Sports; such as, basketball, soccer, volleyball, Australian Rules Football, report high
incidences of ACL injury (Arendt et al., 1995; Cochrane et al., 2007; DeMorat 2004). During
these sports, running, cutting, sidestepping and landing are typical movements that all involve
rapid transition and/or decelerations of the body (Cochrane et al., 2007; DeMorat 2004). Thus
biomechanical researchers investigated joint kinematics and kinetics during these movements to
determine which were more likely to place elevated strain on the ACL. A comparison of running,
cutting and sidestepping tasks discovered that knee valgus and internal rotation moments were
larger during cutting and sidestepping tasks than running (Besier et al., 2001). Studies of single-
leg jump landing also reported increased valgus and internal rotation moments during the
movement (Chappell et al., 2007; Dempsey et al., 2012; Fagenbaum et al., 2003; Ford et al.,
2003). These results indicate that the sidestepping, cutting and single-leg jump landings may
place the ACL under greater loading (strain, forces) than the other sports tasks. To validate if the
biomechanical measurements assessed during these studies were indicative of increased ACL
injury risk, researchers compared joint biomechanics between individuals who had and had not
suffered an ACL injury and between female and male athletes, as females are more likely to tear
their ACLs than men (Arendt et al., 1995; Hewett et al., 1999; Hewett et al., 2005). Researchers
found that ACL sufferers exhibited significantly larger knee abduction angles 8° than non ACL
injury sufferers and significant higher knee abduction moments (45.3±28.5Nm) than non-
sufferers (18.5±15.6Nm) (Hewett et al., 2005). An investigation of female and male kinematics
and kinetics during sidestepping and jump landing tasks again observed higher knee abduction
5
angles and moments in females than males (Ford et al., 2003; Ford et al., 2010;, McLean et al.,
2005). One study found knee abduction moments in females (21.9±13.5Nm) were nearly twice
as large as in males (13.0±12.0Nm). These and other studies indicated that sidestepping and
jump landing tasks could place elevated strain on the ACL and it was also found that knee
valgus/abduction moments were a strong predictor of ACL injury in individuals (Hewett et al.,
2005; McLean et al. 2005).
With knee valgus/abduction moments identified as strong predictors of ACL injury and
the fact that elevated knee abduction moments in combination with internal rotation moments
and small knee flexion angles further increase strain on the ACL, Besier et al. (2001) decided to
analyze when during the movements these biomechanical variables were the largest. Besier et al.
(2001) divided the ground reaction force (GRF) profile measured during the sidestepping task
into three phases: weight acceptance (WA), peak push off (PPO) and finale push off (FPO). The
WA phase is defined as the time from the heel strike to the first trough, PPO is the time from
10% before and after peak GRF and the FPO is the last 15% of stance (Fig. 2) (Besier et al.,
2001). Peak knee valgus moments were significantly larger during the WA and FPO phases of
cutting and sidestepping than running and peak internal rotation moments were significantly
larger during the WA phase for sidestepping and cutting than running. Since peak knee valgus
and internal rotation moments are associated with increased ACL strain, it is possible to infer
that ACL injury is more likely to occur during the WA phase of movement.
6
Figure 2. Schematic of the three stages of stance phase determined using the resultant ground
reaction force (GRF). WA, weight acceptance; PPO, peak push off; FPO, final push off.
(Besier et al., 2001)
The assessment of biomechanical variables determined that sidestepping, cutting and
jump landing tasks placed individuals at higher risk for injury as the elevated knee
valgus/abduction measured during the WA phase of movement these tasks were strongly
correlated with ACL injury risk. Since we have determined the tasks, predictors and timing
associated with ACL injury the remaining step centers on determining the role muscles play in
protecting the ACL against elevated knee valgus and internal rotation moments during these
tasks.
1.1.4 Electromyography (EMG): Bridging the Gap between Kinematics and Kinetics and
Muscle Function
Electromyography (EMG) is utilized to gain insight into muscle function during
movement. EMG studies measure muscle activity during movements associated with ACL injury
to better understand how muscles support/protect the knee under dangerous loading (Lloyd et al.,
2001; McLean et al., 2010; Podraza et al., 2010; Wikstrom et al., 2008). Muscle activity/function
is assessed via muscle activation magnitude/amplitude, timing and co-contraction indices (CCI).
7
Muscle activation amplitude and timing relate muscle excitation coordination (temporal) patterns
to movement while CCI assesses the contribution of muscle groups to see how muscle groups
activate and co-contract to balance each other and stabilize the knee. How muscles function
during movement, such as landing, is important because muscles and ligaments are responsible
for the distribution of forces across the articular surface, which in this case is the knee (Lloyd et
al., 2001). Thus increased muscle force contribution could reduce the forces (taken up by)
exerted on the ligament and mitigate injury risk. Given that anterior tibial translation, small knee
flexion angles, elevated knee valgus/abduction and internal rotation moments are all associated
with ACL injury, researchers investigated muscle activation under these conditions to ascertain
how muscles function to support and stabilize the knee during these movements (dangerous
loading). Together the aforementioned metrics can be used to determine muscle contribution to
movement via muscle activation measurement(s).
Besier et al. (2003) and Wikstrom et al. (2008) investigated selective muscle activation
patterns during running, cutting, sidestepping and single-leg jump landing tasks. Besier et al.
(2003) observed that when grouping the muscles by function (i.e. knee flexor and extensor,
medial and lateral and internal-external rotators), an increase in their muscle activation was
correlated with an increase in valgus and internal rotation moments during the pre-planned as
opposed to unanticipated cutting and sidestepping tasks. This finding was believed to indicate
that muscles selectively activate to properly execute the task and protect the knee against
dangerous loadings. Wikstrom et al. (2008) examined how muscle activation patterns differ
during successful and failed jump landings. EMG data was collected for the vastus medialis,
semimbranosus, lateral gastrocnemius and tibialis anterior muscles 200 milliseconds (ms) pre
through 200ms post landing. The results showed that muscles activated earlier and exhibited
8
stronger preparatory and reactive amplitudes for successful landings as opposed to failed
landings. Additionally, muscles were found to activate in a different order for successful and
failed landings with muscles activating in the following order for successful landings: vastus
medialis, semimbranosus, lateral gastrocnemius and then the tibialis anterior muscle. The vastus
medialis and semimbranosus represent the quadriceps and hamstring muscles in this study. An
analysis of those two muscles showed that the vastus medialis activated 3ms before the
semimbranosus and that post landing the vastus medialis was slightly more activated than the
semimbranosus at 0.40 and 0.34, respectively. However, for the failed landings the
semimbranosus muscle activated 16ms before the vastus medialis and there was a slightly larger
discrepancy in reactive muscle activation amplitude with the vastus medialis producing 0.35
while the semimbranosus produced 0.27. This study like prior investigations highlighted that the
quadriceps and hamstring muscles are critical to supporting the knee during landing. And that to
successfully support the knee increased activation of the hamstring muscles could help
counterbalance the increased activation of the quadriceps muscles.
Previous cadaveric studies also indicated that strong quadriceps loading was found to
cause increased anterior tibial translation with respect to the femur and in turn contributed to
increased ACL injury (DeMorat 2004). This result focused attention on the relationship between
the quadriceps and hamstring muscles during different tasks to assess the relationship between
joint biomechanics and muscle activation (Malinzak et al., 2001). Analysis of muscle activation
during such events revealed that in populations at greater risk for ACL injury, individuals
displayed greater quadriceps muscle activation (Malinzak et al., 2001; Wojtys et al., 2002). The
greater the level of muscle activation of the quadriceps relative to the hamstrings leads to
enhanced knee joint instability (Malinzak et al., 2001). A more balanced co-contraction of these
9
muscles reduced anterior tibial translation and helped support the knee during valgus loading
(Lloyd et al., 2001; Wojyts et al., 2002). The balanced co-contraction during tasks typically
indicates an increase in hamstring muscle activity to counter the strongly activated quadriceps
muscles during tasks associated with ACL injury. Fujii et al. (2012) found that this increased
hamstring muscle activation was correlated with smaller peak internal tibial rotation angle during
single-leg jump landing. While studies have shown quadriceps-hamstring co-contraction are the
main contributors to stabilizing the knee during dynamic sports tasks associated with ACL
injury; Podraza et al. (2010) found that other muscles surrounding the knee may also function to
stabilize the knee and improve joint stiffness. Podraza et al. (2010) evaluated muscle activation
during single-leg landing task and concluded that in response to the dominant activation of the
quadriceps that it is possible that the soleus and gastrocnemius muscles may play a more
prominent role in countering the quadriceps activation than the hamstrings during landing. This
result suggests that greater concentration should be paid to the function of all of the muscles
surrounding the knee not just the quadriceps and hamstrings.
EMG is effective in evaluating muscle activity during dynamic movements but does not
yield information about a muscle’s relative contribution to movement, but computer simulations
may provide additional insights (Anderson et al., 2006). For example, algorithms (e.g., computed
muscle control) can estimate muscle forces required for the desired movement given kinematic
and kinetic data (Thelen et al., 2003). To determine individual muscles contribution to
movement, computational modeling that incorporates mathematical algorithms has and continues
to be used to analyze muscle function during dynamic movement (Hatze et al., 1976; Thelen et
al., 2003).
10
1.1.5 Computational Modeling: Utilizing Simulations to Assess Cause-Effect Relationship in
Human Movement
Computational modeling of human movement is used to relate various aspects of the
human biological system to movement. In previous decades, biomechanical models were
simplistic 1- and 2- dimensional models containing fewer body segments, degrees of freedom
and muscles for their analysis (Hatze et al., 1976; Hatze 1984; Hoy et al., 1990; Winter 1980).
The advancements in computer technology have led to the development of more complex
biomechanical models and more computationally efficient analyses (Pandy 2001).
Through computational modeling, researchers are able to develop subject-specific
simulations that relate joint kinematics and kinetics to muscle force production and function.
Unlike EMG analysis where muscle activation is linearly related to muscle force, simulations are
able to account for the musculotendon properties; such as, muscle activation and contraction
dynamics, force-length and force-velocity relationships and moment arms analysis to
appropriately model non-linear relationships between muscle activation and force production.
Such simulations are utilized to investigate the cause-and-effect relationship between joint
motion and muscle function (Dorn et al., 2012; Hamner et al., 2010; Liu et al., 2008; Thelen et
al., 2003;Thelen et al., 2006)
1.2 OpenSim and Musculoskeletal Modeling Software
Musculoskeletal modeling software programs allow users to select from a bank of models
and create subject-specific simulations to explore a variety of research questions. OpenSim is
such a software program that provides users with a mathematical and computational modeling
framework to analyze everything from designing prosthetic devices, to studying how they will
function in the body and assessing the outcomes of surgical procedures like tendon lengthening
11
in cerebral palsy patients. It is unique in that it is user friendly but also allows the user to increase
model complexity to answer difficult problems related to human movement.
This dissertation will use high quality experimental motion capture data of individuals
performing a single-leg jump landing protocol to conduct and evaluate simulation based research
of muscle contribution during these jump landings. This research is divided into four studies
introduced in the following section.
1.3 Overview and Specific Studies
Over 400,000 anterior cruciate ligament (ACL) injuries occur every year (Utturkar et al.
2013) in the United States costing $1.5 billion annually in ACL reconstruction and treatment
(Boden et al., 2000; Kao et al., 1995). Approximately 80% of ACL injuries are non-contact
injuries (Noyes et al., 1983), the majority of which occur during single-leg landings when the
knee is near full extension and externally valgus loaded (Cochrane et al., 2007; Koga et al., 2010;
Krosshaug et al., 2007). While clinical and experimental studies have well defined these
kinematic and kinetic characteristics of ACL injury, the mechanism behind ACL injury is not
well understood. Despite the implementation of ACL injury prevention programs, there has been
a 50% increase in ACL injuries reported over the last decade (Donnelly et al., 2012), Such
programs are aimed at altering muscle force and activation patterns to circumvent the ACL
injury mechanism; however, they are limited by their inability to assess individual muscle
function (e.g. force, activation) to resist excessive knee loading during movement. Our long-term
goal is to determine individual muscle function during jump landing in order to dramatically
reduce the rate of ACL injury through the implementation of muscle-targeted prevention
programs.

12
Musculoskeletal models and dynamic simulations have been used to determine individual
muscle contributions to pedaling, walking and running (Liu et al., 2006; Liu et al., 2008; Hamner
et al., 2010; Thelen et al., 2003); yet, none have assessed individual muscle contributions to jump
landing. Here muscle-actuated dynamic simulations will be used to determine the joint
accelerations induced by individual muscles, to identify the muscles that resist excessive knee
abduction moments in individuals at high risk of ACL injury. We hypothesize that increased
force generation of the quadriceps and medial and lateral gastrocnemius muscles will serve to
resist excessive knee abduction moments during single-leg jump landing and help mitigate ACL
injury risk after proposed muscle-targeted training intervention programs. The findings from the
dynamic simulations will be integrated with the findings from the data mining techniques to
identify individuals at risk for ACL injury. All of this information will then be utilized to design
muscle-targeted training intervention programs to reduce excessive knee abduction moments.
Each of the next four chapters of the dissertation will present four distinct studies
conducted using dynamic simulations, data mining and wavelet analyses to develop a protocol to
identify and train individuals at risk for ACL injury as highlighted above. Each chapter is written
as a separate technical paper and an overview of the goals and methods employed in each study
are provided below. In addition, each chapter includes an in-depth discussion of the proposed
methods and findings of each study and demonstrated how they were used to answer the
questions posed. Chapter 6 gives a summary of the results of the four studies in the dissertation
and delineates how they were applied to develop better protocols for identifying individuals at
risk for ACL injury.
13
1.3.1 Study 1: Elevated Gastrocnemius Forces Compensate for Decreased Hamstrings Forces
during the Weight-Acceptance Phase of Single-Leg Jump Landing: Implications for ACL
Goal: The purpose is to answer the following questions:
1) What are the individual muscle forces generated to successfully perform a single-leg
jump landing?
2) Which muscles serve as the main contributors for supporting the knee during landing?
Methods: To accomplish this study, subject-specific muscle-actuated simulations will
reproduce experimentally measured landing kinematics and kinetics of seven subjects.
For each simulation, individual muscles forces will be estimated using a computed
muscle control (CMC) during single-leg jump landing.
Significance: This investigation will clarify how individual muscles generate force to
dynamically support the knee during single-leg jump landing.
1.3.2 Study 2: Assess How Individual Muscles Resist Elevated Knee Abduction Moment
during Single-Leg Jump Landing.
Goal: The purpose is to address the questions:
1) Which muscle(s) produce the greatest acceleration to resist elevated knee abduction
moment?
Methods: The subject-specific muscle-actuated simulations and resulting muscle force
data from generated from CMC will serve as inputs for induced acceleration analysis to
quantify which muscles function to resist knee abduction moment during jump landing.
Significance: This work will enable researchers to determine which individual muscles
are specifically responsible for resisting knee abduction moment during single-leg jump
landing and how they can potentially reduce ACL injury risk.
14
1.3.3 Study 3: Dynamic Knee Stability and Principal Component Analysis: Methodology for
Assessing Anterior Cruciate Ligament Injury Risk.
Goal: The purpose is to address these questions:
1) What is dynamic knee stability?
2) What underlying muscle activation patterns are common amongst individuals at
elevated risk for ACL injury?
Methods: We will utilize Nyquist and Bode stability criterions, in conjunction with
principal component analysis, to explore the experimentally measured kinematic, kinetic
and surface EMG data for critical features and underlying muscle activation patterns that
may be associated with individuals at-risk for injury.
Significance: This work will provide us with ability to develop new metrics to identify
individuals at-risk for ACL injury and design muscle-targeted training programs.
1.3.4 Study 4: Utilizing Stability and Wavelet Analyses to Detect Muscle Activation Patterns
Associated with ACL Injury Risk.
Goal: The purpose of Study 4 is to answer the following questions:
1) What are unstable joint biomechanics?
2) What underlying muscle activation patterns are common amongst individuals at
elevated risk for ACL injury?
Methods: Stability and wavelet analysis will be employed to explore the experimentally
measured kinematic, kinetic and surface EMG data for critical features and underlying
muscle activation patterns that may be correlated with individuals at-risk for injury.
Significance: This work will identify muscle activation patterns specific to individuals
at-risk for ACL injury.

15
Together, these studies will determine the roles muscles play in supporting the knee and
direct future research for designing more effective training protocols. The mechanisms behind
ACL injury are exceptionally complex; yet, by isolating critical features and muscle activation
patterns common amongst individuals at elevated risk for ACL injury via principal component
and wavelet analysis it may indicate how muscles function differently to support the knee in
individuals at-risk for ACL injury. This knowledge is an important and necessary step toward
both understanding and designing muscle-targeted training protocols that reduce ACL injury
risk.
16
1.4 References
Anderson, F.C., Arnold, A. S., Pandy, M. G., Goldberg, S. R., Delp S. L., 2006. Simulations in
Walking. 3 ed, Wilkins.
Jolliffe, I.T., 2002. Principal Component Analysis, 2nd
Ed Springer, New York.
Arendt, E., Dick, R., 1995. Knee injury patterns among men and women in collegiate basketball
and soccer NCAA data and review of literature. The American Journal of Sports
Medicine 23, 694-701.
Besier, T. F., Lloyd, D. G., Cochrane, J. L., Ackland, T. R. 2001. External loading of the knee
joint during running and cutting maneuvers. Medicine and Science in Sports and
Exercise, 33(7), 1168-1175.
Besier, T.F., Lloyd, D.G., Ackland, T.R., 2003. Muscle activation strategies at the knee during
running and cutting maneuvers. Med. Sci. Sports Exerc. 35, 119-127.
Boden, B.P., Griffin, L.Y., Garrett, W.E., 2000. Etiology and prevention of noncontact ACL
injury Physician Sportsmed. 28, 53-60.
Chappell, J.D., Creighton, R.A., Giuliani, C., Yu, B., Garrett, W.E., 2007. Kinematics and
electromyography of landing preparation in vertical stop-jump: risks for noncontact
anterior cruciate ligament injury. Am. J. Sports Med. 35, 235-241.
Cochrane, J.L., Lloyd, D.G., Buttfield, A., Seward, H., McGivern, J., 2007. Characteristics of
anterior cruciate ligament injuries in Australian football. J. Sci. Med. Sport 10, 96-104.
DeMorat, G., 2004. Aggressive Quadriceps Loading Can Induce Noncontact Anterior Cruciate
Ligament Injury. Am. J. Sports Med. 32, 477-483.
Dempsey, A.R., Elliott, B.C., Munro, B.J., Steele, J.R., Lloyd, D.G., 2012. Whole body
kinematics and knee moments that occur during an overhead catch and landing task in
sport. Clin. Biomech. (Bristol, Avon) 27, 466-474.
Donnelly, C.J., Elliott, B.C., Ackland, T.R., Doyle, T.L., Beiser, T.F., Finch, C.F., Cochrane,
J.L., Dempsey, A.R., Lloyd, D.G., 2012. An anterior cruciate ligament injury prevention
framework: incorporating the recent evidence. Res. Sports Med. 20, 239-262.
Dorn, T.W., Y.C. Lin, and M.G. Pandy, 2012. Estimates of muscle function in human gait
depend on how foot-ground contact is modelled. Comput Methods Biomech Biomed
Engin. 15(6), 657-68.
Fagenbaum, R., Darling, W.G., 2003. Jump landing strategies in male and female college
athletes and the implications of such strategies for anterior cruciate ligament injury. Am.
J. Sports Med. 31, 233-240.
Fleming, B. C., Renstrom, P. A., Beynnon, B. D., Engstrom, B., Peura, G. D., Badger, G. J.,
Johnson, R. J., 2001.The effect of weightbearing and external loading on anterior cruciate
ligament strain. Journal of Biomechanics. 34, 163-170.
Ford, K. R., Shapiro, R., Myer, G. D., Van Den Bogert, A. J., & Hewett, T. E., 2010.
Longitudinal sex differences during landing in knee abduction in young athletes. Med Sci
Sports Exerc. 42(10),1923-31.
Ford, K.R., G.D. Myer, T.E. Hewett, 2003. Valgus knee motion during landing in high school
female and male basketball players. Med Sci Sports Exerc. 35(10), 1745-50.
Fujii, M., H. Sato, N. Takahira, 2012. Muscle activity response to external moment during
single-leg drop landing in young basketball players: The importance of biceps femoris in
reducing internal rotation of knee during landing. Journal of Sports Science & Medicine.
11, 255-259.

17
Hamner, S.R., Seth, A., Delp, S.L., 2010. Muscle contributions to propulsion and support during
running. J. Biomech. 43, 2709-2716.
Hatze, H., 1976. The Complete Optimization of Human Motion. Mathematical Biosciences. 28,
99-135.
Hatze, H.,1984. Quantitative Analysis, Synthesis and Optimization of Human Motion. Human
Movement Science. 3, 5-25.
Hewett, T.E., Myer, G.D., Ford, K.R., Heidt, R.S., Jr., Colosimo, A.J., McLean, S.G., van den
Bogert, A.J., Paterno, M.V., Succop, P., 2005. Biomechanical measures of neuromuscular
control and valgus loading of the knee predict anterior cruciate ligament injury risk in
female athletes: a prospective study. Am. J. Sports Med. 33, 492-501.
Hewett, T. E., Lindenfeld, T. N., Riccobene, J. V., & Noyes, F. R. (1999). The Effect of
Neuromuscular Training on the Incidence of Knee Injury in Female Athletes A
Prospective Study. The American Journal of Sports Medicine, 27(6), 699-706.
Hoy, M.G., F.E. Zajac, M.E. Gordon, 1990. A musculoskeletal model of the human lower
extremity: the effect of muscle, tendon, and moment arm on the moment-angle
relationship of musculotendon actuators at the hip, knee, and ankle. J. Biomech.
23(2), 157-69.
Kao, J. T., Giangarra, C. E., Singer, G., Martin, S., 1995. A comparison of outpatient and
inpatient anterior cruciate ligament reconstruction surgery. Arthroscopy: The Journal of
Arthroscopic & Related Surgery, 11(2), 151-156.
Koga, H., Nakamae, A., Shima, Y., Iwasa, J., Myklebust, G., Engebretsen, L., Bahr, R.,
Krosshaug, T., 2010. Mechanisms for noncontact anterior cruciate ligament injuries: knee
joint kinematics in 10 injury situations from female team handball and basketball. Am. J.
Sports Med. 38, 2218-2225.
Krosshaug, T., Nakamae, A., Boden, B.P., Engebretsen, L., Smith, G., Slauterbeck, J.R., Hewett,
T.E., Bahr, R., 2007. Mechanisms of anterior cruciate ligament injury in basketball: video
analysis of 39 cases. Am. J. Sports Med. 35, 359-367.
Liu, M. Q., Anderson, F. C., Schwartz, M. H., Delp, S. L., 2008. Muscle contributions to support
and progression over a range of walking speeds. J. Biomech, 41(15), 3243-
3252.
Liu, M. Q., Anderson, F. C., Pandy, M. G., Delp, S. L., 2006. Muscles that support the body also
modulate forward progression during walking. J. Biomech, 39(14), 2623-2630.
Lloyd, D.G., Buchanan, T.S., 2001. Strategies of muscular support of varus and valgus isometric
loads at the human knee. J. Biomech. 34, 1257-1267.
Malinzak, R. A., Colby, S. M., Kirkendall, D. T., Yu, B., Garrett, W. E., 200. A comparison of
knee joint motion patterns between men and women in selected athletic tasks. Clin
Biomechanics, 16(5), 438-445.
Markolf, K. L., Burchfield, D. M., Shapiro, M. M., Shepard, M. F., Finerman, G. A., Slauterbeck,
J. L., 1995. Combined knee loading states that generate high anterior cruciate ligament
forces. Journal of Orthopaedic Research, 13(6), 930-935.
Markolf, K. L., Gorek, J. F., Kabo, J. M., Shapiro, M. S.,1990. Direct measurement of resultant
forces in the anterior cruciate ligament. An in vitro study performed with a new
experimental technique. The Journal of Bone & Joint Surgery, 72(4), 557-567.
McLean, S.G., Huang, X., van den Bogert, A.J., 2005. Association between lower extremity
posture at contact and peak knee valgus moment during sidestepping: implications for
ACL injury. Clin. Biomech. (Bristol, Avon) 20, 863-870.

18
McLean, S.G., B. Borotikar, and S.M. Lucey, 2010. Lower limb muscle pre-motor time measures
during a choice reaction task associate with knee abduction loads during dynamic single
leg landings. Clin Biomech (Bristol, Avon). 25(6), 563-9.
Noyes, F. R., Matthews, D. S., Mooar, P. A., Grood, E. S., 1983. The symptomatic anterior
cruciate-deficient knee. Part II: the results of rehabilitation, activity modification, and
counseling on functional disability. The Journal of bone and joint surgery. American
volume, 65(2), 163.
Onyshko, S., and Winter, D. A., 1980. A mathematical model for the dynamics of human
locomotion. J. Biomech. 13(4), 361-368.
Pandy, M.G., 2001. Computer modeling and simulation of human movement. Annu Rev Biomed
Eng. 3, 245-73.
Podraza, J.T., White, S.C., 2010. Effect of knee flexion angle on ground reaction forces, knee
moments and muscle co-contraction during an impact-like deceleration landing:
implications for the non-contact mechanism of ACL injury. Knee 17, 291-295.
Thelen, D.G., Anderson, F.C., Delp, S.L., 2003. Generating dynamic simulations of movement
using computed muscle control. J. Biomech. 36, 321-328.
Thelen, D.G., Anderson, F.C., 2006. Using computed muscle control to generate forward
dynamic simulations of human walking from experimental data. J. Biomech. 39, 1107-
1115.
Utturkar, G. M., Irribarra, L. A., Taylor, K. A., Spritzer, C. E., Taylor, D. C., Garrett, W. E., and
DeFrate, L. E., 2013. The effects of a valgus collapse knee position on in vivo ACL
elongation. Annals of biomedical engineering, 41(1), 123-130.
Whiting, W.C. and R.F. Zernicke, Biomechanics of Musculoskeletal Injury. 2008, United States
of America: Human Kinetics.
Wikstrom, E.A., Tillman, M.D., Schenker, S., Borsa, P.A., 2008. Failed jump landing trials:
deficits in neuromuscular control. Scand. J. Med. Sci. Sports 18, 55-61.
Withrow, T. J., Huston, L. J., Wojtys, E. M., & Ashton-Miller, J. A., 2006. The effect of an
impulsive knee valgus moment on in vitro relative ACL strain during simulated jump
landing. Clin. Biomech. (Bristol, Avon), 21(9), 977-983.
Wojtys, E.M., Ashton-Miller, J.A., Huston, L.J., 2002. A gender-related difference in the
contribution of the knee musculature to sagittal-plane shear stiffness in subjects with
similar knee laxity. J. Bone Joint Surg. Am. 84-A, 10-16.
19
CHAPTER II
ELEVATED GASTROCNEMIUS FORCES COMPENSATE FOR
DECREASED HAMSTRINGS FORCES DURING THE WEIGHT-
ACCEPTANCE PHASE OF SINGLE-LEG JUMP LANDING:
IMPLICATIONS FOR ACL INJURY RISK
20
2.1 Abstract
Approximately 320,000 anterior cruciate ligament (ACL) injuries in the U.S. each year are non-
contact injuries, with most occurring during a single-leg jump landing or sidestepping sports
tasks when the knee is near full extension. To reduce ACL injury risk, one option deserving
further investigation is to improve muscle strength and/or activation patterns to support the knee
under elevated external loading. This study’s purpose was to characterize the relative force
production of muscles supporting the knee during the weight-acceptance (WA) phase of single-
leg jump landing and investigate the gastrocnemii forces compared to the hamstring forces.
Amateur male Western Australian Rules Football players completed a single-leg jump landing
protocol and seven participants were randomly chosen for further modeling and simulation. A
three-dimensional, 14-segment, 37 degree-of-freedom, 92 muscle-tendon actuated model was
created for each participant in OpenSim 1.9.1. Computed muscle control was used to generate 14
muscle-driven simulations, 2 trials per participant, of the WA phase of single-leg jump landing.
A one-way ANOVA and Tukey post-hoc analysis showed both the quadriceps and gastrocnemii
muscle force estimates were significantly greater than the hamstrings (p < 0.001). Elevated
quadriceps and gastrocnemii forces during landing may represent a generalized muscle support
strategy to: 1) produce a support moment in the stance limb and 2) increase knee joint stiffness,
protecting the knee and ACL from external knee loading and injury risk. These results not only
contribute to our understanding of muscle function during single-leg jump landing, but also serve
as the foundation for novel muscle-targeted training intervention programs to reduce ACL
injuries.
21
2.2 Introduction
Over 400,000 anterior cruciate ligament (ACL) injuries occur annually in the U.S.
(Utturkar et al., 2013) despite decades of research and development of injury prevention
protocols (Donnelly et al., 2012a). ACL healthcare costs the U.S. approximately $1.5 billion
annually (Boden et al., 2000; Kao et al., 1995). Approximately 80% of ACL injuries are non-
contact, with most occurring during single-leg jump landing or sidestepping sports tasks
(Cochrane et al., 2007; Koga et al., 2010; Krosshaug et al., 2007). During a single-leg jump
landing with the knee near full extension, the application of externally applied translational
forces coupled with valgus and internal rotation knee moments elevates the forces on the ACL to
injurious thresholds (>2000 N) greater than when these loads are applied in isolation (Hagood et
al., 1990; Markolf et al., 1995; Markolf et al., 1998; McLean et al., 2004; McLean et al., 2005,
2008; Podraza and White, 2010; Walla et al., 1985, Woo et al., 1991). There are effectively two
avenues to reduce ACL injury risk: 1) change an athlete’s technique to reduce joint loading
and/or 2) improve muscle strength and/or activation patterns to stabilize and support the knee
(Donnelly et al., 2012a). Most preventative training protocols focus on reducing externally
applied knee loads and/or increasing support of muscles crossing the knee when loading is
elevated to mitigate ACL strain and injury risk. With ACL injury rates increasing 50% over the
past decade (Donnelly et al., 2012a), it appears prevention research is not effectively translating
into injury prevention practice among heterogeneous community-level athletic populations
(Donnelly et al., 2012a).
The roles muscles play in stabilizing the knee during landing are not well understood. A
byproduct of the primary motor control task goal, which is to generate a support moment keeping
the center of mass (CoM) upright, is the co-contraction of the quadriceps and hamstrings
22
muscles, which is believed to be essential to stabilizing the knee during dynamic movements,
specifically with regard to ACL injury. However, recent literature has shown that the
gastrocnemii muscles may play an increased role in stabilizing the knee during landing
(Mokhtarzadeh et al., 2013; Podraza and White, 2010). In addition to small knee flexion angles
and elevated valgus and internal rotation moments, increased anterior tibial translation is also
associated with increased ACL injury risk (Hewett et al., 2007; Pflum et al., 2004; Podraza and
White, 2010). While increased quadriceps force increases anterior tibial translation, it has been
shown that hamstrings as well as the gastrocnemii and soleus muscles can reduce anterior tibial
translation and potentially reduce ACL injury risk (Fleming et al., 2001; Hewett et al., 2007;
Pflum et al., 2004; Podraza and White, 2010, Sherbondy et al., 2003). Furthermore, moderate
hamstrings activation compared to quadriceps activation has been linked to elevated knee valgus
and internal rotation moments which are often predictors of ACL injury risk (Donnelly et al.,
2012a; Hewett et al., 2006; Hewett et al., 2005; Wojtys et al., 2002). Thus, it is possible that
elevated gastrocnemii force could function to replace and/or work in conjunction with the
hamstrings to reduce harmful knee flexor-extensor imbalance and potential ACL injury risk.
There are limitations to using electromyography alone to determine biomechanical
factors elevating ACL injury risk. Surface electromyography (sEMG) has been used to estimate
muscle activation, where muscle force and function during sports tasks is then inferred (Besier et
al., 2003; Lloyd and Buchanan, 2001; Wikstrom et al., 2008). As the joint kinematics change
during these tasks, so does the force and moment generating capacity of the muscles to help
support the knee and ACL from external loading. Yet, sEMG measurements do not account for
muscle architecture, force-length-velocity relationships or muscle moment arm geometry during
dynamic movements. A gap exists in estimating muscle forces, and more importantly functions,
23
during these tasks. Muscle-actuated, forward dynamic simulation is an in-silico computational
tool bridging this gap, providing valuable insights into the roles individual muscles play during
dynamic movements (Seth et al., 2011; Thelen and Anderson, 2006; Thelen et al., 2003). This
tool has been used to analyze muscle contributions during dynamic movements such as walking,
cycling, running, sidestep cutting and landing tasks and, in combination with sEMG, may be
used to investigate single-leg jump landing (Arnold et al., 2007; Hamner et al., 2010; Laughlin et
al., 2011; Thelen et al., 2003; Weinhandl et al., 2013).
This study used dynamic simulation, in combination with motion capture data, to
investigate the important role lower limb muscles crossing the knee play in mitigating ACL
injury risk during single-leg jump landing. The objective of this work was to characterize the
force production of the muscles supporting the knee during the weight-acceptance (WA) phase
of single-leg jump landing. It is hypothesized that the gastrocnemii will produce forces
comparable to that of the hamstrings to counteract the quadriceps muscle forces to help support
and stabilize the knee. With this information, our understanding of muscle function in single-leg
jump landing will increase so researchers/clinicians may effectively target these muscles in
developing preventative training protocols to reduce ACL injury risk and see ACL focused
research translated into injury prevention practice.
2.3 Methodology
2.3.1 Experimental Protocol and Data Collection
Thirty-four Amateur male Western Australian Rules Football players were recruited to
perform a single-leg jump landing experimental protocol (Donnelly et al., 2012c). Seven
participants (age 20.7 ± 1.8 years; height 1.9 ± 0.1m; mass 87.8 ± 5.1 kg) were randomly selected
from the cohort and two trials per participant for a total of 14 experimental trials were chosen for
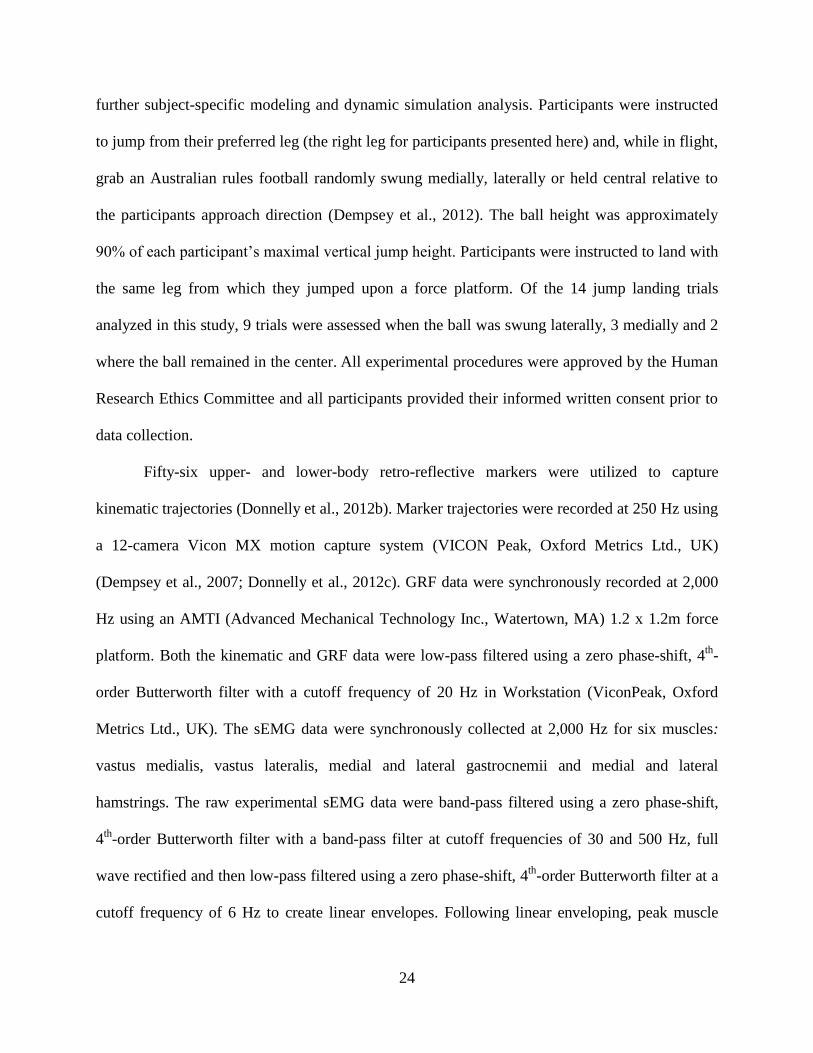
24
further subject-specific modeling and dynamic simulation analysis. Participants were instructed
to jump from their preferred leg (the right leg for participants presented here) and, while in flight,
grab an Australian rules football randomly swung medially, laterally or held central relative to
the participants approach direction (Dempsey et al., 2012). The ball height was approximately
90% of each participant’s maximal vertical jump height. Participants were instructed to land with
the same leg from which they jumped upon a force platform. Of the 14 jump landing trials
analyzed in this study, 9 trials were assessed when the ball was swung laterally, 3 medially and 2
where the ball remained in the center. All experimental procedures were approved by the Human
Research Ethics Committee and all participants provided their informed written consent prior to
data collection.
Fifty-six upper- and lower-body retro-reflective markers were utilized to capture
kinematic trajectories (Donnelly et al., 2012b). Marker trajectories were recorded at 250 Hz using
a 12-camera Vicon MX motion capture system (VICON Peak, Oxford Metrics Ltd., UK)
(Dempsey et al., 2007; Donnelly et al., 2012c). GRF data were synchronously recorded at 2,000
Hz using an AMTI (Advanced Mechanical Technology Inc., Watertown, MA) 1.2 x 1.2m force
platform. Both the kinematic and GRF data were low-pass filtered using a zero phase-shift, 4th
-
order Butterworth filter with a cutoff frequency of 20 Hz in Workstation (ViconPeak, Oxford
Metrics Ltd., UK). The sEMG data were synchronously collected at 2,000 Hz for six muscles:
vastus medialis, vastus lateralis, medial and lateral gastrocnemii and medial and lateral
hamstrings. The raw experimental sEMG data were band-pass filtered using a zero phase-shift,
4th
-order Butterworth filter with a band-pass filter at cutoff frequencies of 30 and 500 Hz, full
wave rectified and then low-pass filtered using a zero phase-shift, 4th
-order Butterworth filter at a
cutoff frequency of 6 Hz to create linear envelopes. Following linear enveloping, peak muscle
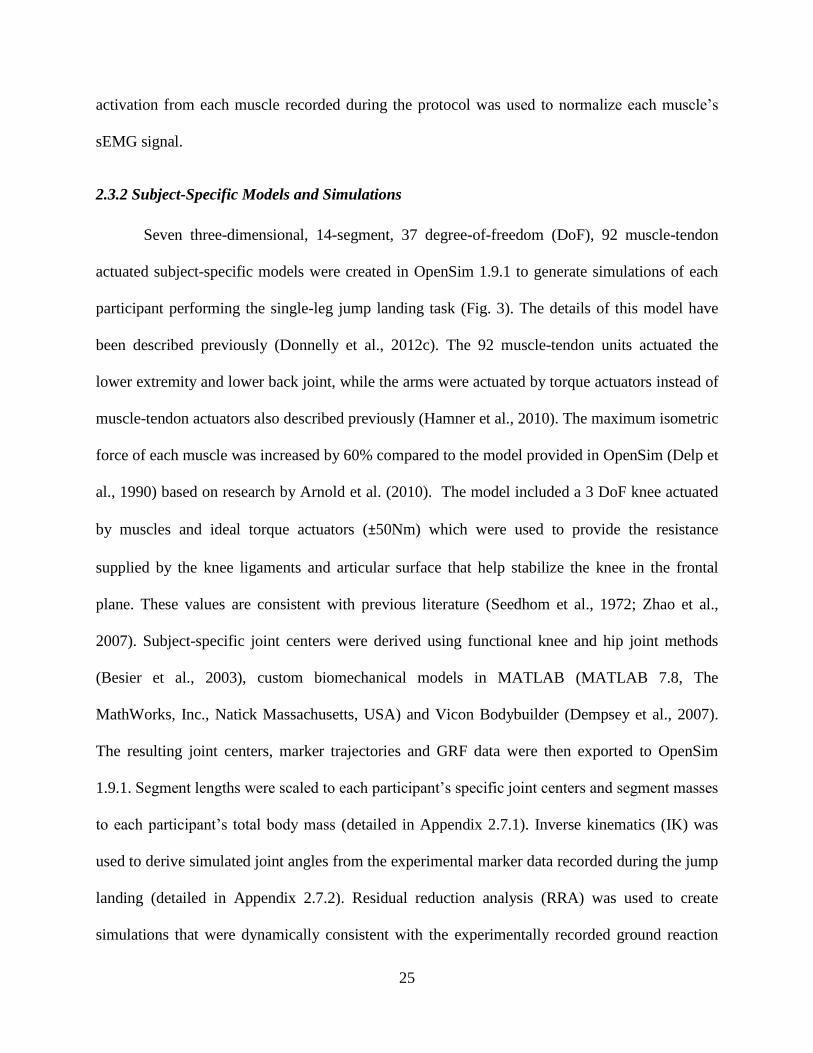
25
activation from each muscle recorded during the protocol was used to normalize each muscle’s
sEMG signal.
2.3.2 Subject-Specific Models and Simulations
Seven three-dimensional, 14-segment, 37 degree-of-freedom (DoF), 92 muscle-tendon
actuated subject-specific models were created in OpenSim 1.9.1 to generate simulations of each
participant performing the single-leg jump landing task (Fig. 3). The details of this model have
been described previously (Donnelly et al., 2012c). The 92 muscle-tendon units actuated the
lower extremity and lower back joint, while the arms were actuated by torque actuators instead of
muscle-tendon actuators also described previously (Hamner et al., 2010). The maximum isometric
force of each muscle was increased by 60% compared to the model provided in OpenSim (Delp et
al., 1990) based on research by Arnold et al. (2010). The model included a 3 DoF knee actuated
by muscles and ideal torque actuators (±50Nm) which were used to provide the resistance
supplied by the knee ligaments and articular surface that help stabilize the knee in the frontal
plane. These values are consistent with previous literature (Seedhom et al., 1972; Zhao et al.,
2007). Subject-specific joint centers were derived using functional knee and hip joint methods
(Besier et al., 2003), custom biomechanical models in MATLAB (MATLAB 7.8, The
MathWorks, Inc., Natick Massachusetts, USA) and Vicon Bodybuilder (Dempsey et al., 2007).
The resulting joint centers, marker trajectories and GRF data were then exported to OpenSim
1.9.1. Segment lengths were scaled to each participant’s specific joint centers and segment masses
to each participant’s total body mass (detailed in Appendix 2.7.1). Inverse kinematics (IK) was
used to derive simulated joint angles from the experimental marker data recorded during the jump
landing (detailed in Appendix 2.7.2). Residual reduction analysis (RRA) was used to create
simulations that were dynamically consistent with the experimentally recorded ground reaction
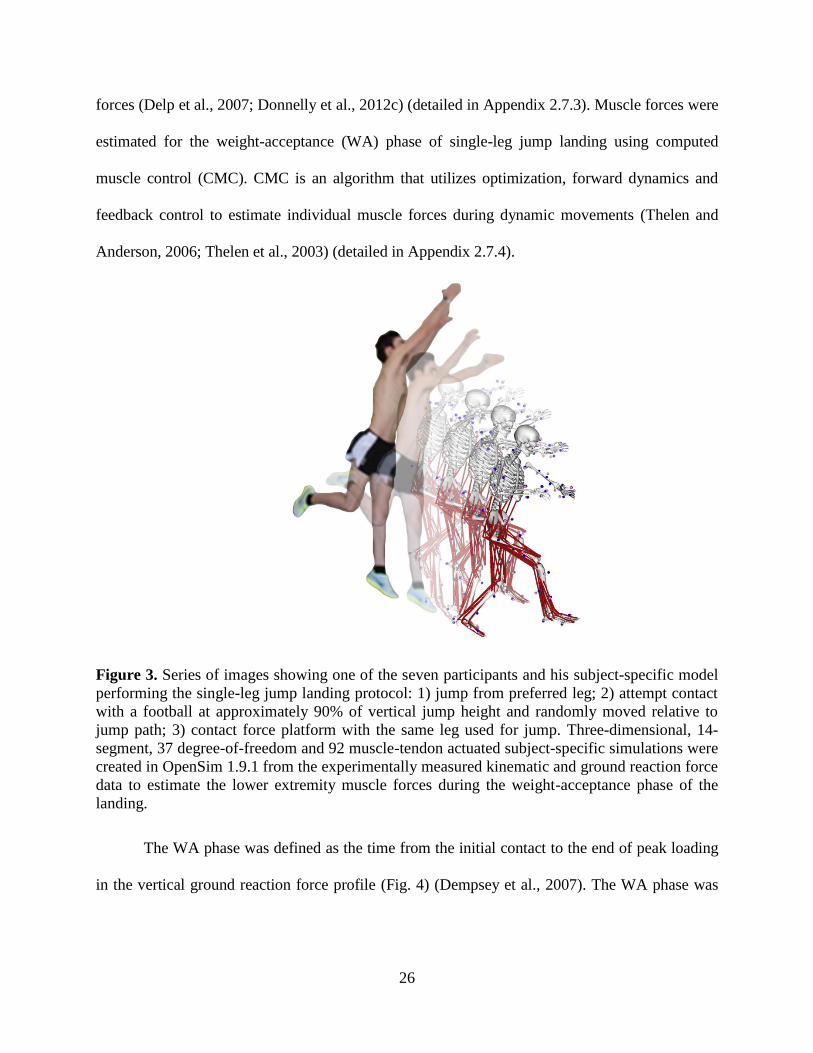
26
forces (Delp et al., 2007; Donnelly et al., 2012c) (detailed in Appendix 2.7.3). Muscle forces were
estimated for the weight-acceptance (WA) phase of single-leg jump landing using computed
muscle control (CMC). CMC is an algorithm that utilizes optimization, forward dynamics and
feedback control to estimate individual muscle forces during dynamic movements (Thelen and
Anderson, 2006; Thelen et al., 2003) (detailed in Appendix 2.7.4).
Figure 3. Series of images showing one of the seven participants and his subject-specific model
performing the single-leg jump landing protocol: 1) jump from preferred leg; 2) attempt contact
with a football at approximately 90% of vertical jump height and randomly moved relative to
jump path; 3) contact force platform with the same leg used for jump. Three-dimensional, 14-
segment, 37 degree-of-freedom and 92 muscle-tendon actuated subject-specific simulations were
created in OpenSim 1.9.1 from the experimentally measured kinematic and ground reaction force
data to estimate the lower extremity muscle forces during the weight-acceptance phase of the
landing.
The WA phase was defined as the time from the initial contact to the end of peak loading
in the vertical ground reaction force profile (Fig. 4) (Dempsey et al., 2007). The WA phase was
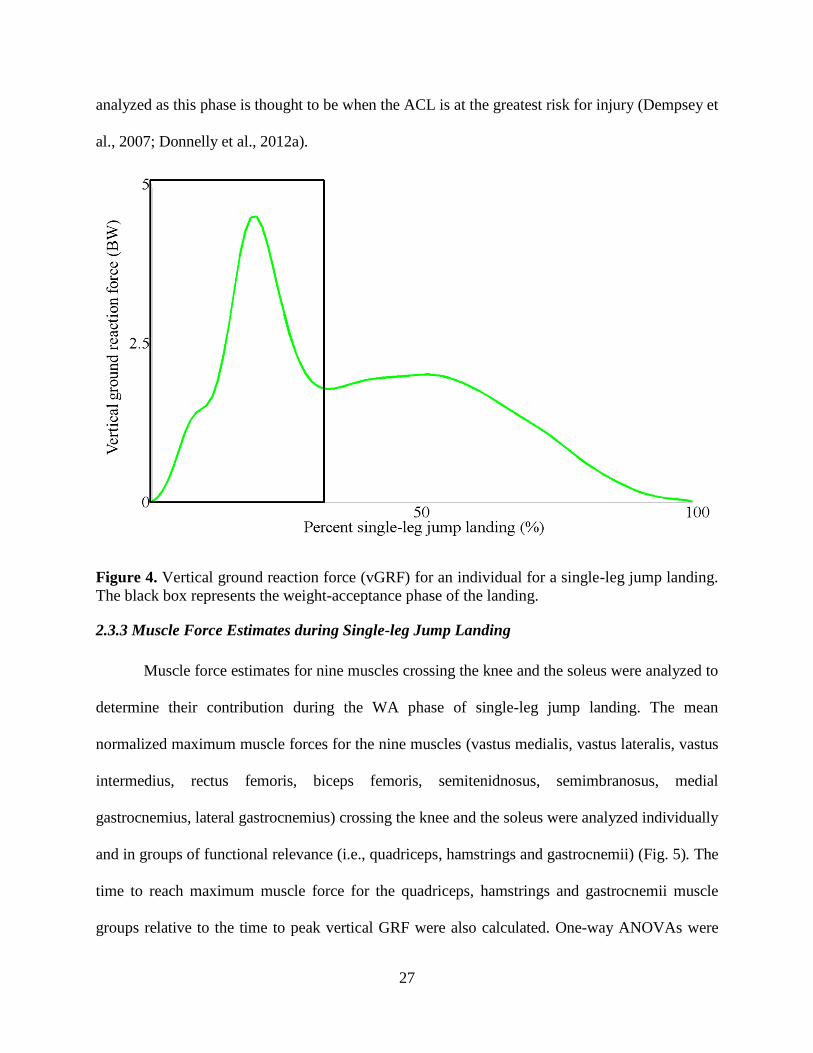
27
analyzed as this phase is thought to be when the ACL is at the greatest risk for injury (Dempsey et
al., 2007; Donnelly et al., 2012a).
Figure 4. Vertical ground reaction force (vGRF) for an individual for a single-leg jump landing.
The black box represents the weight-acceptance phase of the landing.
2.3.3 Muscle Force Estimates during Single-leg Jump Landing
Muscle force estimates for nine muscles crossing the knee and the soleus were analyzed to
determine their contribution during the WA phase of single-leg jump landing. The mean
normalized maximum muscle forces for the nine muscles (vastus medialis, vastus lateralis, vastus
intermedius, rectus femoris, biceps femoris, semitenidnosus, semimbranosus, medial
gastrocnemius, lateral gastrocnemius) crossing the knee and the soleus were analyzed individually
and in groups of functional relevance (i.e., quadriceps, hamstrings and gastrocnemii) (Fig. 5). The
time to reach maximum muscle force for the quadriceps, hamstrings and gastrocnemii muscle
groups relative to the time to peak vertical GRF were also calculated. One-way ANOVAs were

28
conducted to compare the mean individual maximum muscle force estimates, the means of each
muscle group and the mean time of the maximum force production with respect to the time to
peak vertical GRF. A Tukey post-hoc analysis was performed to determine if differences
observed in the one-way ANOVA analysis were significant (α = 0.05).
Figure 5. Lower extremity muscles. a) The four quadriceps muscles. b) The hamstring muscles.
c) The gastrocnemii muscles.
CMC computed muscle forces were then used to calculate the force in the ACL during
single-leg jump landing. The mean forces of the quadriceps, hamstrings and gastrocnemii muscle
groups were compared for the trials when the forces in the ACL fell below 2160±157N, a
threshold determined by Woo et al. (1991), to trials when the ACL forces exceeded this threshold.
A one-way ANOVA was conducted to compare the muscle group means for the aforementioned
conditions while a Tukey post-hoc analysis was conducted to determine the significance of the
observed differences between the two groups (α = 0.05). The time to maximum ACL force and
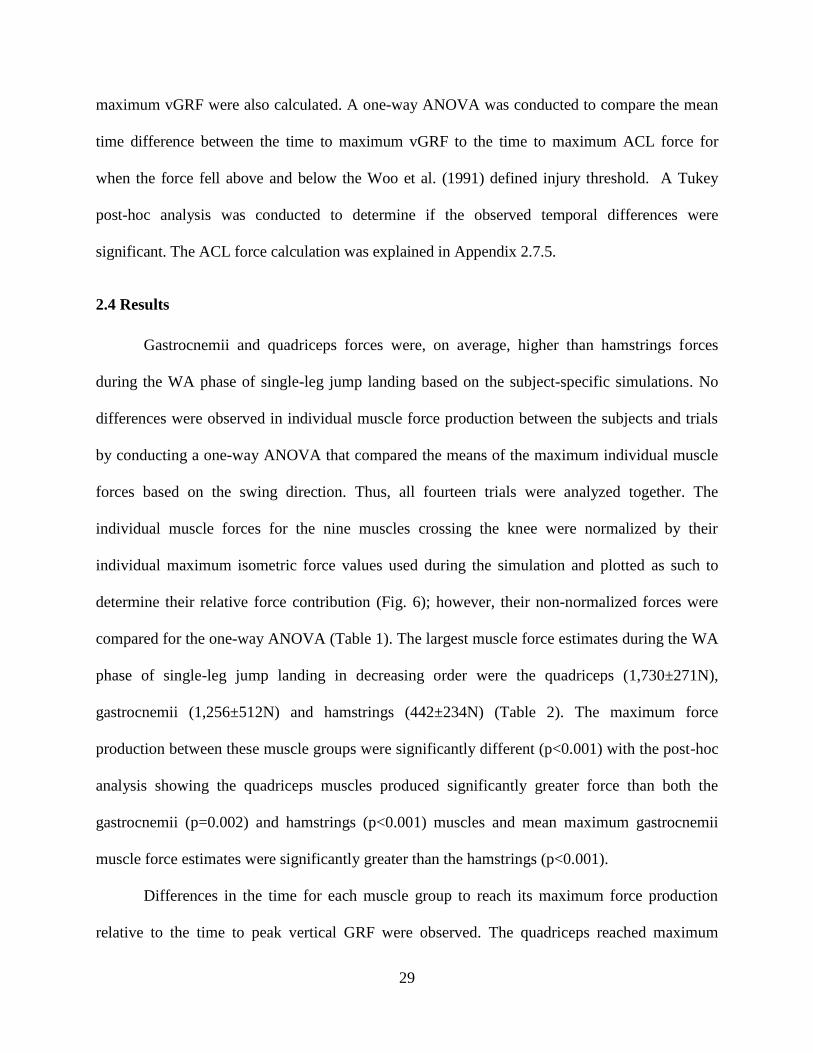
29
maximum vGRF were also calculated. A one-way ANOVA was conducted to compare the mean
time difference between the time to maximum vGRF to the time to maximum ACL force for
when the force fell above and below the Woo et al. (1991) defined injury threshold. A Tukey
post-hoc analysis was conducted to determine if the observed temporal differences were
significant. The ACL force calculation was explained in Appendix 2.7.5.
2.4 Results
Gastrocnemii and quadriceps forces were, on average, higher than hamstrings forces
during the WA phase of single-leg jump landing based on the subject-specific simulations. No
differences were observed in individual muscle force production between the subjects and trials
by conducting a one-way ANOVA that compared the means of the maximum individual muscle
forces based on the swing direction. Thus, all fourteen trials were analyzed together. The
individual muscle forces for the nine muscles crossing the knee were normalized by their
individual maximum isometric force values used during the simulation and plotted as such to
determine their relative force contribution (Fig. 6); however, their non-normalized forces were
compared for the one-way ANOVA (Table 1). The largest muscle force estimates during the WA
phase of single-leg jump landing in decreasing order were the quadriceps (1,730±271N),
gastrocnemii (1,256±512N) and hamstrings (442±234N) (Table 2). The maximum force
production between these muscle groups were significantly different (p<0.001) with the post-hoc
analysis showing the quadriceps muscles produced significantly greater force than both the
gastrocnemii (p=0.002) and hamstrings (p<0.001) muscles and mean maximum gastrocnemii
muscle force estimates were significantly greater than the hamstrings (p<0.001).
Differences in the time for each muscle group to reach its maximum force production
relative to the time to peak vertical GRF were observed. The quadriceps reached maximum
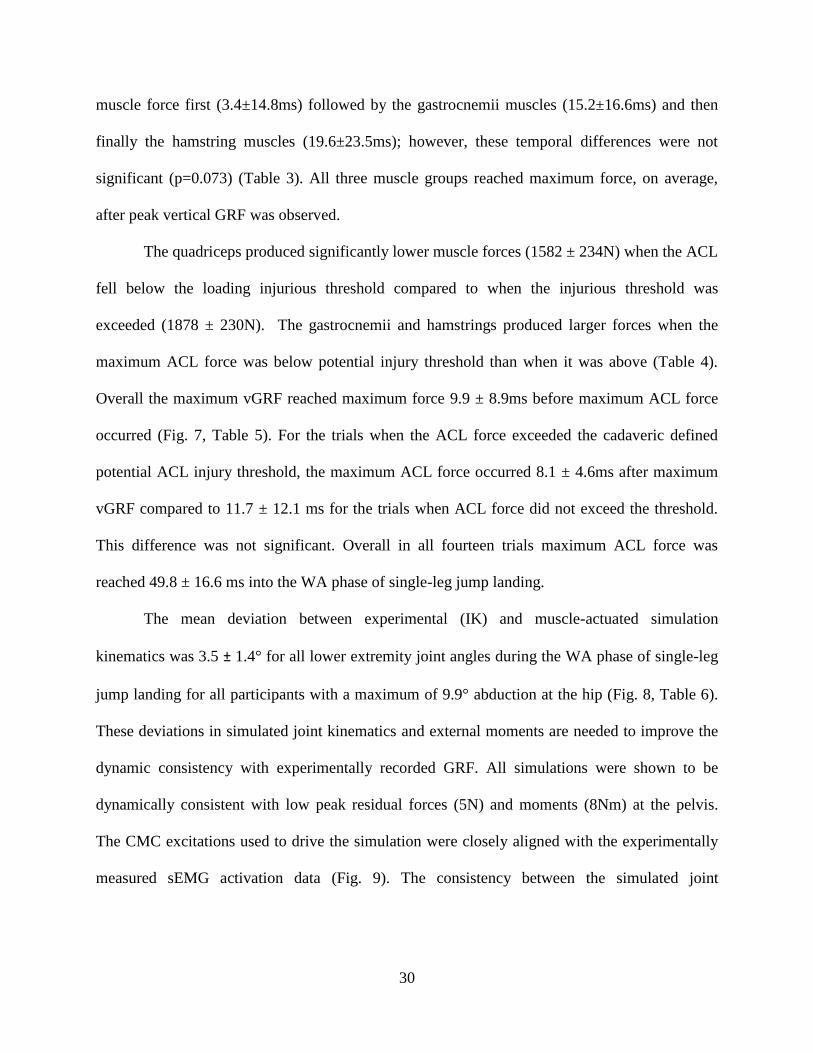
30
muscle force first (3.4±14.8ms) followed by the gastrocnemii muscles (15.2±16.6ms) and then
finally the hamstring muscles (19.6±23.5ms); however, these temporal differences were not
significant (p=0.073) (Table 3). All three muscle groups reached maximum force, on average,
after peak vertical GRF was observed.
The quadriceps produced significantly lower muscle forces (1582 ± 234N) when the ACL
fell below the loading injurious threshold compared to when the injurious threshold was
exceeded (1878 ± 230N). The gastrocnemii and hamstrings produced larger forces when the
maximum ACL force was below potential injury threshold than when it was above (Table 4).
Overall the maximum vGRF reached maximum force 9.9 ± 8.9ms before maximum ACL force
occurred (Fig. 7, Table 5). For the trials when the ACL force exceeded the cadaveric defined
potential ACL injury threshold, the maximum ACL force occurred 8.1 ± 4.6ms after maximum
vGRF compared to 11.7 ± 12.1 ms for the trials when ACL force did not exceed the threshold.
This difference was not significant. Overall in all fourteen trials maximum ACL force was
reached 49.8 ± 16.6 ms into the WA phase of single-leg jump landing.
The mean deviation between experimental (IK) and muscle-actuated simulation
kinematics was 3.5 ± 1.4° for all lower extremity joint angles during the WA phase of single-leg
jump landing for all participants with a maximum of 9.9° abduction at the hip (Fig. 8, Table 6).
These deviations in simulated joint kinematics and external moments are needed to improve the
dynamic consistency with experimentally recorded GRF. All simulations were shown to be
dynamically consistent with low peak residual forces (5N) and moments (8Nm) at the pelvis.
The CMC excitations used to drive the simulation were closely aligned with the experimentally
measured sEMG activation data (Fig. 9). The consistency between the simulated joint

31
kinematics, kinetics, and muscle excitations compared with the experimentally recorded data
suggests simulations of single-leg jump landing represented the experimental sport task.

32
Table 1. Mean maximum and minimum muscle force estimates for the individual muscles during the weight-acceptance phase of
single-leg jump landing for fourteen trials.
Participant Muscle Force (N)
Muscle
Value
1a
1b
2a
2b
3a
3b
4a
4b
5a
5b
6a
6b
7a
7b
Mean ±
StDev
Vastus
Medialis
Max
Min
2,895
452
3,144
72
3,273
101
3,136
64
2,495
71
2,511
73
3,125
682
1,893
503
2,670
184
1,961
137
1,270
73
1,388
72
1,629
229
3,424
88
2,488±734b
200±199
Vastus
Lateralis
Max
Min
1,065
101
683
117
696
34
706
59
1,136
111
2,251
133
226
97
1,995
98
220
121
1,188
281
676
128
2,645
131
1,599
317
254
137
1,096±770c,d,e,f
133±76
Vastus
Intermedius
Max
Min
1,978
78
242
83
1,155
101
1,375
75
1,202
81
1,276
91
2,347
80
271
83
1,359
65
1,177
39
1,612
888
2,494
99
2,251
69
2,476
103
1,515±731c,d,e
138±216
Rectus
Femoris
Max
Min
1,651
411
2,016
964
2,231
1098
1,972
899
2,098
197
2,499
1279
2,084
92
2,890
98
844
90
1,055
18
2,470
1489
408
155
689
203
2,605
867
1,822±778b,c
561±514
Medial
Gastrocnemius
Max
Min
1,746
151
2,344
125
928
80
3,174
84
732
283
1,332
247
2,561
650
2,115
482
3,076
171
1,098
351
378
176
154
41
692
117
1,745
314
1,577±975c,d
234±171
Lateral
Gastrocnemius
Max
Min
1,360
509
1,016
296
1,098
568
1,558
671
481
107
1,223
455
353
39
919
482
312
66
606
182
1,356
625
1,335
884
374
103
1,094
155
935±430d,e,f
367±267
Biceps Femoris
Longus
Max
Min
467
21
963
71
29
1
176
1
234
60
137
77
245
9
754
1
18
1
579
62
351
19
189
5
181
34
73
2
314±282f
26±29
Semimbranosus Max
Min
983
153
1,522
316
1,031
85
1,273
107
729
6
107
2
1,019
81
592
92
446
164
476
109
510
211
91
2
124
9
912
2
701±444e,f
96±93
Semitendinosus Max
Min
333
33
571
49
399
105
377
29
232
42
284
25
235
85
173
96
291
78
462
203
225
62
96
13
114
36
569
18
312±150f
62±50
Soleus Max Min
4,445
245
3,012
186
5,189
233
5,055
163
3,562
181
2,112
239
2,152
30
3,323
70
2,073
576
2,729
41
2,861
293
3,582
250
4,031
4
2,390
9
3,323±1049a
180±152
ANOVA identified a significant difference for the maximum values of the individual muscles (p < 0.001; n = 14).
Symbols a,b,c,d,e,f indicate Tukey’s adjusted post-hoc difference (α = 0.05) in mean maximum muscle force between the individual muscles. Muscles with the same letters are not significantly different
from each other. Conversely, if muscles do not share a letter, the means are significantly different.
Participant 1 jump landing trials are designated by 1a, 1b. Participant 2’s trials are 2a,2b etc.
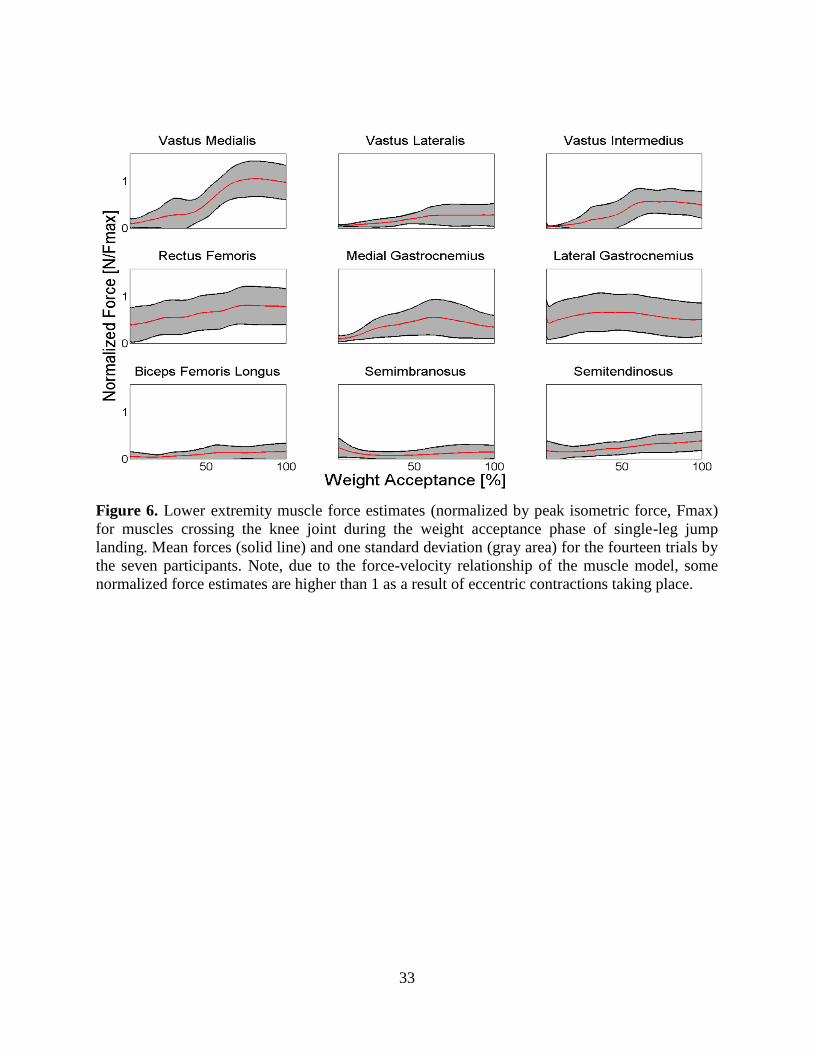
33
Figure 6. Lower extremity muscle force estimates (normalized by peak isometric force, Fmax)
for muscles crossing the knee joint during the weight acceptance phase of single-leg jump
landing. Mean forces (solid line) and one standard deviation (gray area) for the fourteen trials by
the seven participants. Note, due to the force-velocity relationship of the muscle model, some
normalized force estimates are higher than 1 as a result of eccentric contractions taking place.
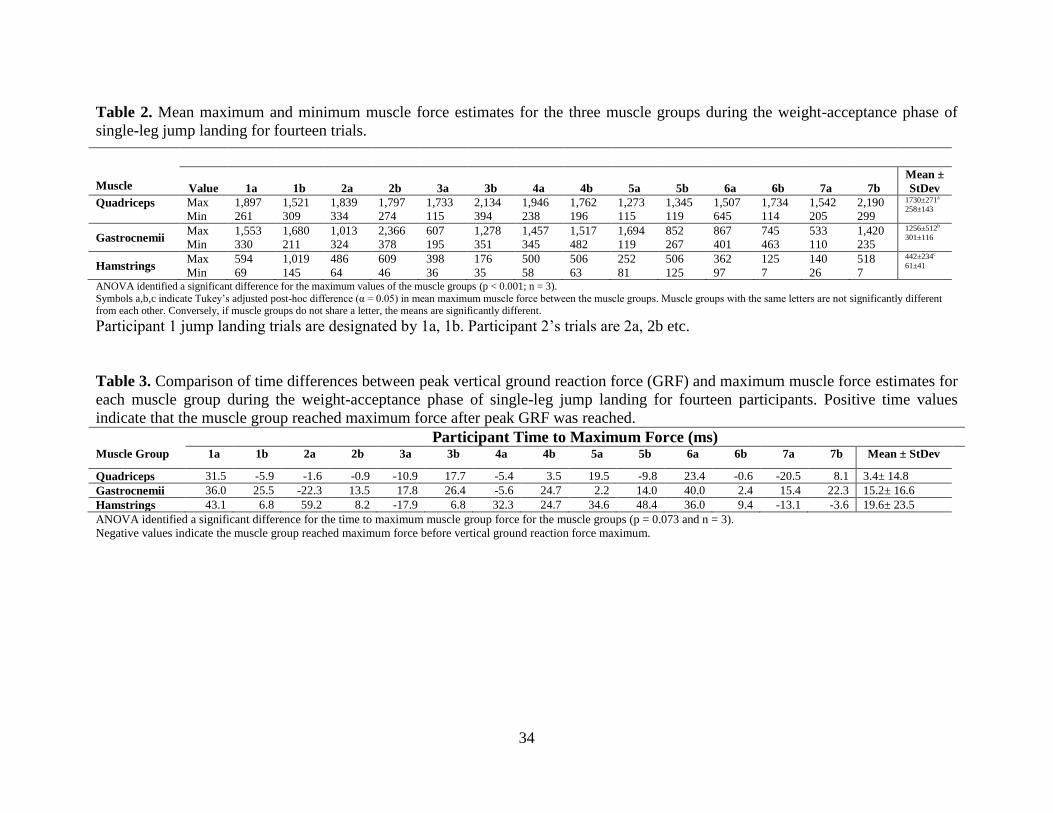
34
Table 2. Mean maximum and minimum muscle force estimates for the three muscle groups during the weight-acceptance phase of
single-leg jump landing for fourteen trials.
Muscle
Value
1a
1b
2a
2b
3a
3b
4a
4b
5a
5b
6a
6b
7a
7b
Mean ±
StDev Quadriceps
Max
Min
1,897
261
1,521
309
1,839
334
1,797
274
1,733
115
2,134
394
1,946
238
1,762
196
1,273
115
1,345
119
1,507
645
1,734
114
1,542
205
2,190
299
1730±271a
258±143
Gastrocnemii Max
Min
1,553
330
1,680
211
1,013
324
2,366
378
607
195
1,278
351
1,457
345
1,517
482
1,694
119
852
267
867
401
745
463
533
110
1,420
235
1256±512b
301±116
Hamstrings Max
Min
594
69
1,019
145
486
64
609
46
398
36
176
35
500
58
506
63
252
81
506
125
362
97
125
7
140
26
518
7
442±234c
61±41
ANOVA identified a significant difference for the maximum values of the muscle groups (p < 0.001; n = 3).
Symbols a,b,c indicate Tukey’s adjusted post-hoc difference (α = 0.05) in mean maximum muscle force between the muscle groups. Muscle groups with the same letters are not significantly different from each other. Conversely, if muscle groups do not share a letter, the means are significantly different.
Participant 1 jump landing trials are designated by 1a, 1b. Participant 2’s trials are 2a, 2b etc.
Table 3. Comparison of time differences between peak vertical ground reaction force (GRF) and maximum muscle force estimates for
each muscle group during the weight-acceptance phase of single-leg jump landing for fourteen participants. Positive time values
indicate that the muscle group reached maximum force after peak GRF was reached.
Participant Time to Maximum Force (ms) Muscle Group 1a 1b 2a 2b 3a 3b 4a 4b 5a 5b 6a 6b 7a 7b Mean ± StDev
Quadriceps 31.5 -5.9 -1.6 -0.9 -10.9 17.7 -5.4 3.5 19.5 -9.8 23.4 -0.6 -20.5 8.1 3.4± 14.8
Gastrocnemii 36.0 25.5 -22.3 13.5 17.8 26.4 -5.6 24.7 2.2 14.0 40.0 2.4 15.4 22.3 15.2± 16.6
Hamstrings 43.1 6.8 59.2 8.2 -17.9 6.8 32.3 24.7 34.6 48.4 36.0 9.4 -13.1 -3.6 19.6± 23.5
ANOVA identified a significant difference for the time to maximum muscle group force for the muscle groups (p = 0.073 and n = 3).
Negative values indicate the muscle group reached maximum force before vertical ground reaction force maximum.

35
Table 4. Mean maximum ACL and muscle force estimates for the three muscle groups for when
the loading falls below and exceeds an ACL threshold cutoff value during the weight-acceptance
phase of single-leg jump landing.
Maximum Force in ACL (N)
1661±557 3279±690
Below ACL Threshold Above ACL Threshold
Muscle Group Muscle Force (N) Muscle Force (N)
Quadriceps 1582±234a 1878 ±230
b
Gastrocnemii 1374±623 1138 ±383
Hamstrings 533±251 350 ±191 ANOVA identified a significant difference for the maximum values of the muscle groups (p < 0.001; n = 3).
Symbols a,b,c indicate Tukey’s adjusted post-hoc difference (α = 0.05) in mean maximum muscle force between the muscle groups. Muscle
groups with the same letters are not significantly different from each other. Conversely, if muscle groups do not share a letter, the means are
Table 5. Comparison of time differences between the maximum ACL force estimates during the
weight-acceptance phase of single-leg jump landing for the trials above and below potential ACL
injury threshold and the maximum vertical ground reaction force (vGRF).
Groups Time (ms)
Trials Below ACL Threshold 11.7 ± 12.1
Trials Above ACL Threshold 8.1 ± 4.6
ANOVA identified a significant difference for the time to maximum ACL force for trials above and below potential ACL injury threshold (p = 0.05 and n = 7).
Symbols a,b indicate Tukey’s adjusted post-hoc difference (α = 0.05) in mean time between maximum ACL force and vGRF were significant.
Groups with the same letters are not significantly different from each other. Conversely, if groups do not share a letter, the means are significantly
different.

36
Figure 7. Comparison of the ACL force waveforms for two participants. The black waveform
represents the individual whose ACL force falls below the Woo et al. (1991) cadaveric injury
threshold and the red represents an individual whose ACL force exceeds the threshold.
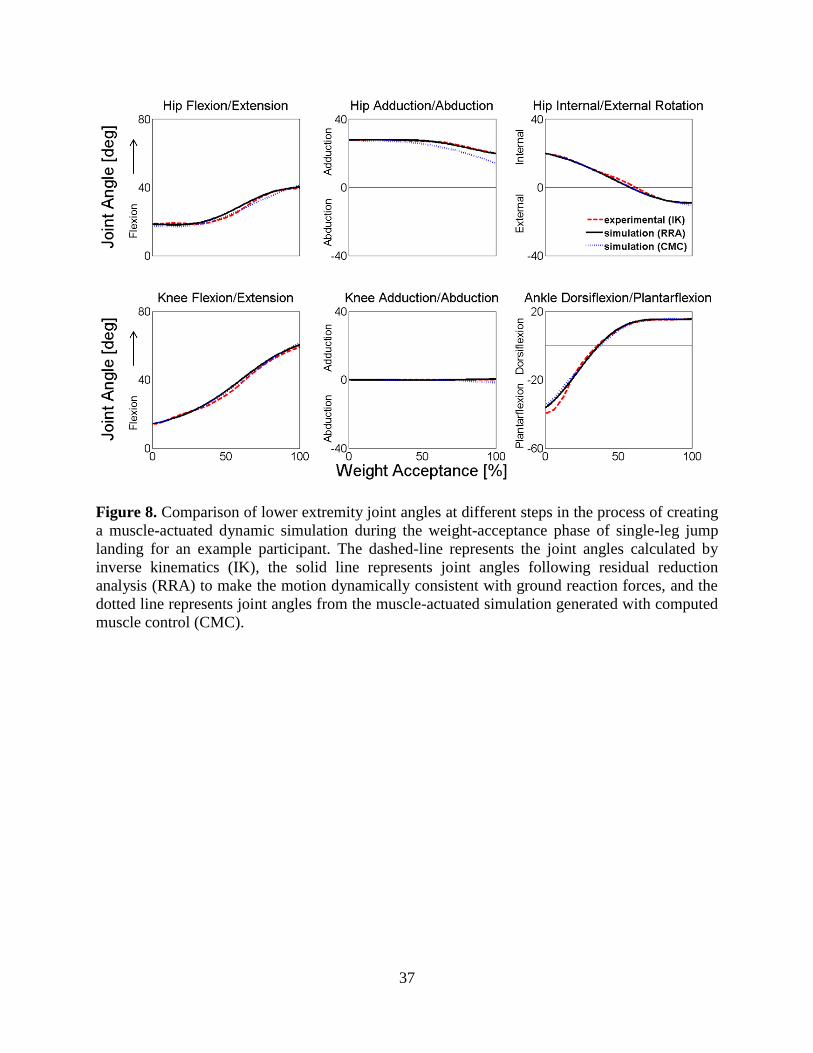
37
Figure 8. Comparison of lower extremity joint angles at different steps in the process of creating
a muscle-actuated dynamic simulation during the weight-acceptance phase of single-leg jump
landing for an example participant. The dashed-line represents the joint angles calculated by
inverse kinematics (IK), the solid line represents joint angles following residual reduction
analysis (RRA) to make the motion dynamically consistent with ground reaction forces, and the
dotted line represents joint angles from the muscle-actuated simulation generated with computed
muscle control (CMC).

38
Table 6. Comparison of the mean maximum joint kinematics, kinetics and vertical ground
reaction force (GRF) for the fourteen trials during the weight-acceptance phase of single-leg
jump landing.
Kinematics (degrees)
Hip flexion 22.3±15.6
Hip adduction 22.0±8.5
Hip internal rotation 12.9±15.1
Knee flexion 53.4±7.2
Knee adduction 0.5±1.3
Knee internal rotation 8.3±17.3
Ankle dorsiflexion 17.8±7.1
Joint moments (Nm/kg-m)
Hip extension 2.3±1.3
Hip abduction 0.8±0.8
Hip external rotation 0.6±0.2
Knee extension 3.1±0.6
Knee abduction 1.1±0.4
Knee internal rotation 0.1±0.1
Ankle plantarflexion 2.2±0.6
Ground Reaction Force (BW)
Vertical ground reaction force 4.3±0.6
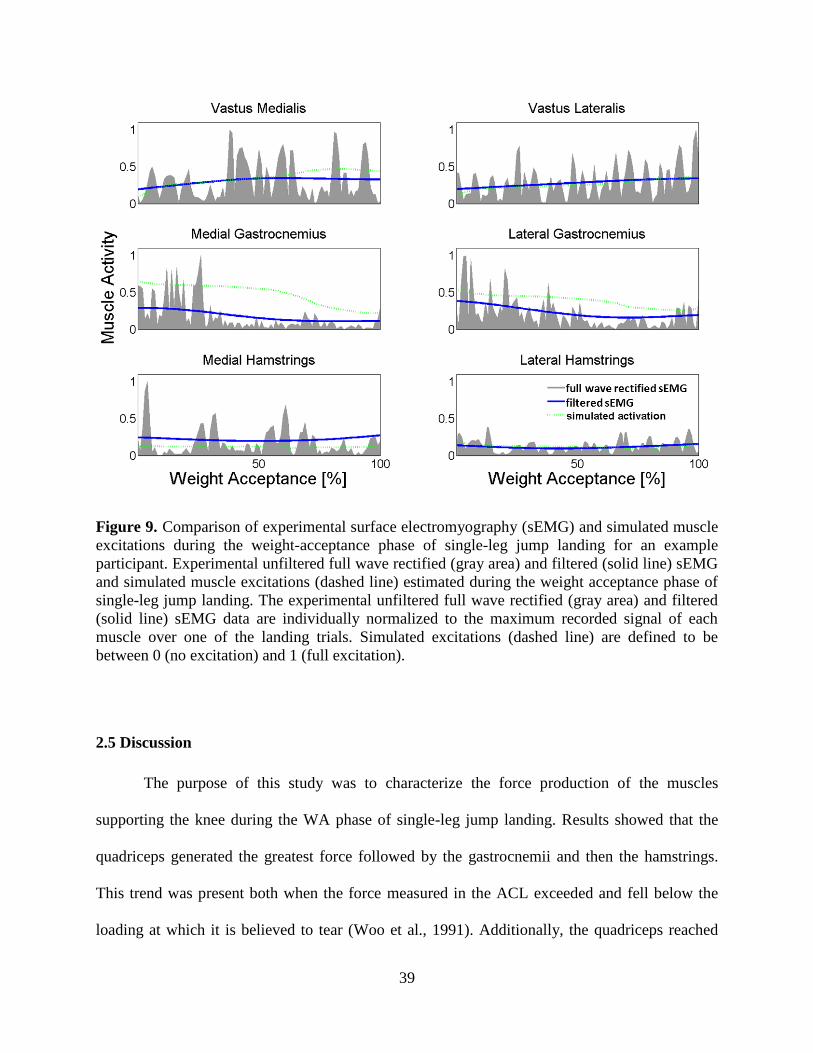
39
Figure 9. Comparison of experimental surface electromyography (sEMG) and simulated muscle
excitations during the weight-acceptance phase of single-leg jump landing for an example
participant. Experimental unfiltered full wave rectified (gray area) and filtered (solid line) sEMG
and simulated muscle excitations (dashed line) estimated during the weight acceptance phase of
single-leg jump landing. The experimental unfiltered full wave rectified (gray area) and filtered
(solid line) sEMG data are individually normalized to the maximum recorded signal of each
muscle over one of the landing trials. Simulated excitations (dashed line) are defined to be
between 0 (no excitation) and 1 (full excitation).
2.5 Discussion
The purpose of this study was to characterize the force production of the muscles
supporting the knee during the WA phase of single-leg jump landing. Results showed that the
quadriceps generated the greatest force followed by the gastrocnemii and then the hamstrings.
This trend was present both when the force measured in the ACL exceeded and fell below the
loading at which it is believed to tear (Woo et al., 1991). Additionally, the quadriceps reached

40
maximum force earlier than the gastrocnemii and hamstrings. Future research for effectively
designing preventative training protocols should consider targeting the strength and coordination
of these muscle groups, particularly the quadriceps and gastrocnemii, for injury prevention
practice among community-level athletic populations.
There are several possible biomechanical explanations for why each muscle group
crossing the knee produces force differently to stabilize and support the knee during singe-leg
jump landing. The co-contraction of the quadriceps, gastrocnemii and hamstrings is likely
utilized to improved joint stability and reduce the strain exerted on the ACL during single-leg
landing (Podraza and White, 2010; Riemann and Lephart, 2002). The comparisons of the muscle
forces for when ACL force fell above and below the dangerous loading threshold calculated by
Woo et al. (1991), found that the gastrocnemii and hamstring muscle forces were higher when
the force in the ACL was lower. And while both the force in gastrocnemii and hamstrings
increased, the force produced by the hamstrings was not enough to counterbalance the
quadriceps force and further support the role of the gastrocnemii to help stabilize the knee. These
results also support the notion that the primary motor control task during landing is to produce a
support moment capable of maintaining the center of mass (CoM) upright as the quadriceps and
gastrocnemii provide knee extension and ankle plantarflexion moments, respectively (Winter,
1980). These results suggest co-contraction between the quadriceps and gastrocnemii, not the
quadriceps and hamstrings, are the primary muscle groups used to stabilize and support the knee
from external joint loading during landing.
The hamstrings produced less maximum force and peaked later than the gastrocnemii
muscles. This finding adds to the clinical understanding of how muscles function to support the
knee during single-leg landing. Previous clinical research proposed hamstrings are activated to a
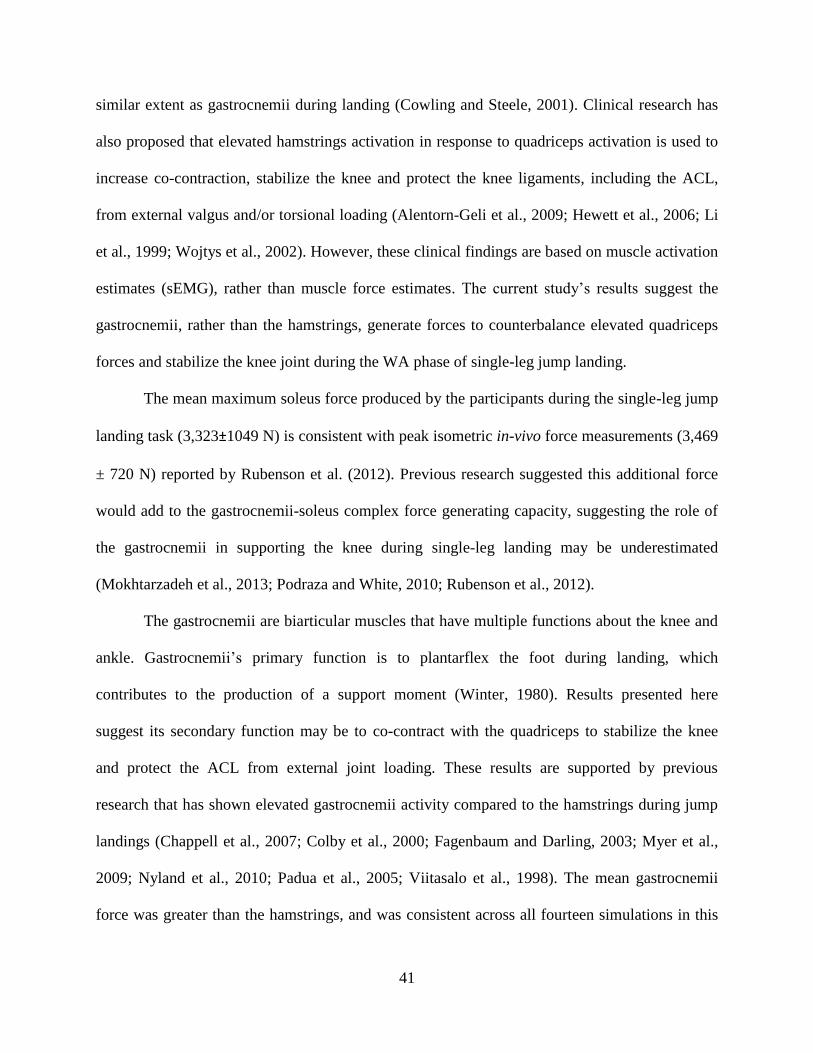
41
similar extent as gastrocnemii during landing (Cowling and Steele, 2001). Clinical research has
also proposed that elevated hamstrings activation in response to quadriceps activation is used to
increase co-contraction, stabilize the knee and protect the knee ligaments, including the ACL,
from external valgus and/or torsional loading (Alentorn-Geli et al., 2009; Hewett et al., 2006; Li
et al., 1999; Wojtys et al., 2002). However, these clinical findings are based on muscle activation
estimates (sEMG), rather than muscle force estimates. The current study’s results suggest the
gastrocnemii, rather than the hamstrings, generate forces to counterbalance elevated quadriceps
forces and stabilize the knee joint during the WA phase of single-leg jump landing.
The mean maximum soleus force produced by the participants during the single-leg jump
landing task (3,323±1049 N) is consistent with peak isometric in-vivo force measurements (3,469
± 720 N) reported by Rubenson et al. (2012). Previous research suggested this additional force
would add to the gastrocnemii-soleus complex force generating capacity, suggesting the role of
the gastrocnemii in supporting the knee during single-leg landing may be underestimated
(Mokhtarzadeh et al., 2013; Podraza and White, 2010; Rubenson et al., 2012).
The gastrocnemii are biarticular muscles that have multiple functions about the knee and
ankle. Gastrocnemii’s primary function is to plantarflex the foot during landing, which
contributes to the production of a support moment (Winter, 1980). Results presented here
suggest its secondary function may be to co-contract with the quadriceps to stabilize the knee
and protect the ACL from external joint loading. These results are supported by previous
research that has shown elevated gastrocnemii activity compared to the hamstrings during jump
landings (Chappell et al., 2007; Colby et al., 2000; Fagenbaum and Darling, 2003; Myer et al.,
2009; Nyland et al., 2010; Padua et al., 2005; Viitasalo et al., 1998). The mean gastrocnemii
force was greater than the hamstrings, and was consistent across all fourteen simulations in this
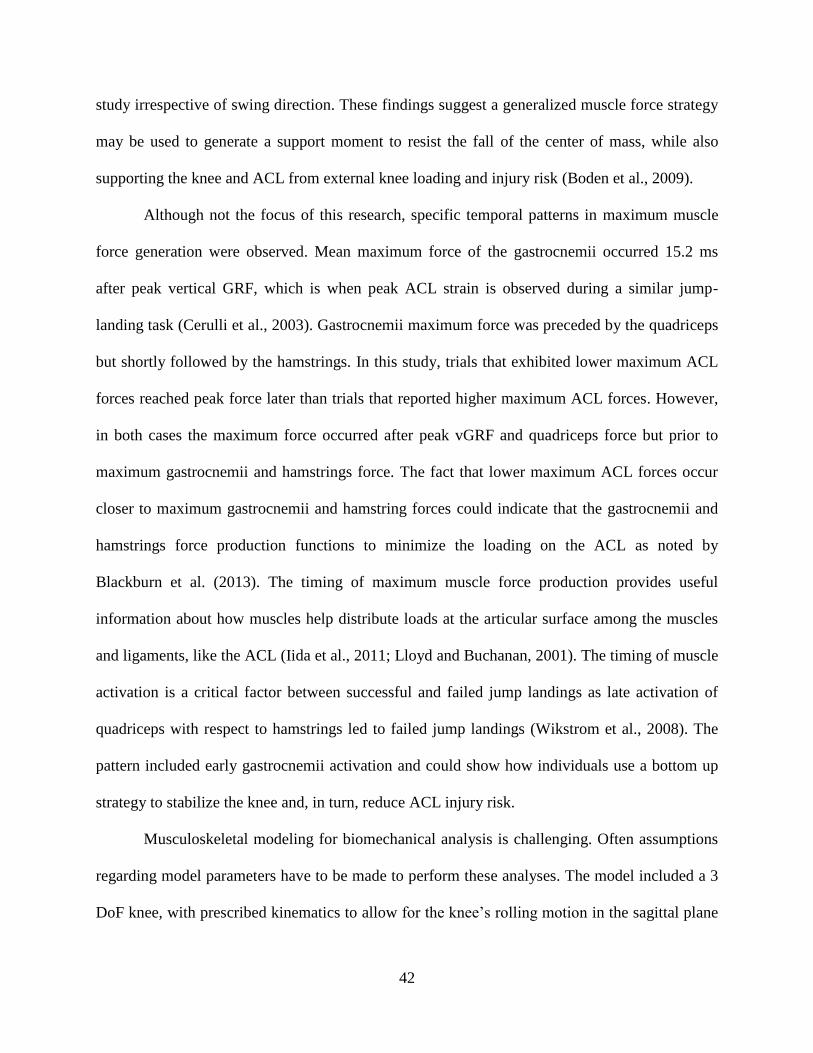
42
study irrespective of swing direction. These findings suggest a generalized muscle force strategy
may be used to generate a support moment to resist the fall of the center of mass, while also
supporting the knee and ACL from external knee loading and injury risk (Boden et al., 2009).
Although not the focus of this research, specific temporal patterns in maximum muscle
force generation were observed. Mean maximum force of the gastrocnemii occurred 15.2 ms
after peak vertical GRF, which is when peak ACL strain is observed during a similar jump-
landing task (Cerulli et al., 2003). Gastrocnemii maximum force was preceded by the quadriceps
but shortly followed by the hamstrings. In this study, trials that exhibited lower maximum ACL
forces reached peak force later than trials that reported higher maximum ACL forces. However,
in both cases the maximum force occurred after peak vGRF and quadriceps force but prior to
maximum gastrocnemii and hamstrings force. The fact that lower maximum ACL forces occur
closer to maximum gastrocnemii and hamstring forces could indicate that the gastrocnemii and
hamstrings force production functions to minimize the loading on the ACL as noted by
Blackburn et al. (2013). The timing of maximum muscle force production provides useful
information about how muscles help distribute loads at the articular surface among the muscles
and ligaments, like the ACL (Iida et al., 2011; Lloyd and Buchanan, 2001). The timing of muscle
activation is a critical factor between successful and failed jump landings as late activation of
quadriceps with respect to hamstrings led to failed jump landings (Wikstrom et al., 2008). The
pattern included early gastrocnemii activation and could show how individuals use a bottom up
strategy to stabilize the knee and, in turn, reduce ACL injury risk.
Musculoskeletal modeling for biomechanical analysis is challenging. Often assumptions
regarding model parameters have to be made to perform these analyses. The model included a 3
DoF knee, with prescribed kinematics to allow for the knee’s rolling motion in the sagittal plane

43
(Delp et al., 1990); however, the model did not include knee ligaments or an articular surface,
which can function to support the knee against external frontal plane knee moments. Using
OpenSim joints and actuators without implementation of complex contact model components,
there are three possible approaches to address this limitation: 1) lock frontal plane knee motion
(which is unrealistic as it assumes the knee only moves in two planes); 2) allow the knee to move
freely in the frontal plane similar to the hip (which is unrealistic as it fails to account for the
ligaments and articular surface that help support/resist motion in the frontal plane); and 3) allow
the knee to move in the frontal plane but use an ideal torque actuator to represent the ligaments
and articular surface supporting the knee against external frontal plane knee moments. This third
option was employed. Since the simulated muscle excitations were similar to experimentally
recorded excitations the inclusion of the ideal torque actuator did not significantly affect muscle
force results in this study. The torque actuator worked with and not against the muscles to help
stabilize the knee during landing as the model accurately tracked the frontal plane knee
kinematics.
The model’s maximum isometric muscle forces had to be uniformly increased 60% to
better represent the muscle architecture of a young healthy athletic adult male population
(Arnold et al., 2010; Lexell et al., 1988), since the baseline force values were derived from
elderly cadavers (Delp et al., 1990). While these increases in maximum isometric muscle force
were sufficient to facilitate the generation of accurate single-leg jump landing simulations, a
more universal method for adjusting muscle forces for varying populations may be necessary and
should be addressed in future research.
Despite these assumptions, the simulated kinematics, kinetics and muscle excitations
were comparable against experimental kinematic, kinetic and muscle activation estimates and

44
provided confidence that the results are representative of muscle forces during single-leg jump
landing.
This study investigated male muscle force estimates during single-leg jump landing with
implications for ACL injury risk despite the fact that females suffer ACL injuries at a
disproportionately higher rate than men (Hewett et al., 2006). Female’s tend to produce a smaller
knee flexor moment than men and this inability to counterbalance the quadriceps and reduce
anterior tibial translation may be the potential cause for this higher rate (Hewett et al., 2006;
Hewett et al., 1996). The males in this study demonstrated that elevated force production by the
gastrocnemius-soleus complex may be the way to address this muscle imbalance and resist
anterior tibial translation, a finding observed in the literature (Mokhtarzadeh et al., 2013; Podraza
and White, 2010). While female models would have different skeletal geometry and muscle
strength, the females (muscles) should have the same goal for muscle force production to
generate a moment to support the CoM, stiffen the knee and mitigate the loads on the ACL.
Since both males and females should have the same injury mechanism where the ACL ruptures
when the load is greater than the tissue tolerance, females may simply have a larger quadriceps
to gastrocnemii and hamstrings deficit which could be why they get injured more.
The combination of experimental and computational tools used in this study were capable
of producing fourteen independent dynamically consistent simulations of single-leg jump
landing, with a muscle force estimates supported by previous clinical (Chappell et al., 2007;
Colby et al., 2000; Nyland et al., 2010; Padua et al., 2005; Podraza and White, 2010) and in-
silico (Shin et al., 2007) research. These results indicate a strategy where quadriceps,
gastrocnemii, and hamstrings play different roles in supporting the knee and this information can

45
serve as the foundation for novel muscle-targeted training intervention programs to reduce ACL
injuries.

46
2.6 References
Alentorn-Geli, E., Myer, G.D., Silvers, H.J., Samitier, G., Romero, D., Lazaro-Haro, C., Cugat,
R., 2009. Prevention of non-contact anterior cruciate ligament injuries in soccer players.
Part 1: Mechanisms of injury and underlying risk factors. Knee Surg. Sports Traumatol.
Arthrosc. 17, 705-729.
Arnold, A.S., Schwartz, M.H., Thelen, D.G., Delp, S.L., 2007. Contributions of muscles to
terminal-swing knee motions vary with walking speed. J. Biomech. 40, 3660-3671.
Arnold, E.M., Ward, S.R., Lieber, R.L., Delp, S.L., 2010. A model of the lower limb for analysis
of human movement. Ann. Biomed. Eng. 38, 269-279.
Besier, T.F., Lloyd, D.G., Ackland, T.R., 2003. Muscle activation strategies at the knee during
running and cutting maneuvers. Med. Sci. Sports Exerc. 35, 119-127.
Blackburn, J. T., Norcross, M. F., Cannon, L. N., Zinder, S. M., 2013. Hamstrings stiffness and
landing biomechanics linked to anterior cruciate ligament loading. J of Ahletic Training.,
48(4).
Boden, B.P., Griffin, L.Y., Garrett, W.E., 2000. Etiology and prevention of noncontact ACL
injury Physician Sportsmed. 28, 53-60.
Boden, B.P., Torg, J.S., Knowles, S.B., Hewett, T.E., 2009. Video analysis of anterior cruciate
ligament injury: abnormalities in hip and ankle kinematics. Am. J. Sports Med. 37, 252-
259.
Cerulli, G., Benoit, D.L., Lamontagne, M., Caraffa, A., Liti, A., 2003. In vivo anterior cruciate
ligament strain behaviour during a rapid deceleration movement: case report. Knee Surg.
Sports Traumatol. Arthrosc. 11, 307-311.
Chappell, J.D., Creighton, R.A., Giuliani, C., Yu, B., Garrett, W.E., 2007. Kinematics and
electromyography of landing preparation in vertical stop-jump: risks for noncontact
anterior cruciate ligament injury. Am. J. Sports Med. 35, 235-241.
Cochrane, J.L., Lloyd, D.G., Buttfield, A., Seward, H., McGivern, J., 2007. Characteristics of
anterior cruciate ligament injuries in Australian football. J. Sci. Med. Sport 10, 96-104.
Colby, S., Francisco, A., Yu, B., Kirkendall, D., Finch, M., Garrett, W., Jr., 2000.
Electromyographic and kinematic analysis of cutting maneuvers. Implications for anterior
cruciate ligament injury. Am. J. Sports Med. 28, 234-240.
Cowling, E.J., Steele, J.R., 2001. Is lower limb muscle synchrony during landing affected by
gender? Implications for variations in ACL injury rates. J. Electromyogr. Kinesiol. 11,
263-268.
Delp, S.L., Anderson, F.C., Arnold, A.S., Loan, P., Habib, A., John, C.T., Guendelman, E.,
Thelen, D.G., 2007. OpenSim: open-source software to create and analyze dynamic
simulations of movement. IEEE Trans. Biomed. Eng. 54, 1940-1950.
Delp, S.L., Loan, J.P., Hoy, M.G., Zajac, F.E., Topp, E.L., Rosen, J.M., 1990. An interactive
graphics-based model of the lower extremity to study orthopaedic surgical procedures.
IEEE Trans. Biomed. Eng. 37, 757-767.
Dempsey, A.R., Elliott, B.C., Munro, B.J., Steele, J.R., Lloyd, D.G., 2012. Whole body
kinematics and knee moments that occur during an overhead catch and landing task in
sport. Clin. Biomech. (Bristol, Avon) 27, 466-474.
Dempsey, A.R., Lloyd, D.G., Elliott, B.C., Steele, J.R., Munro, B.J., Russo, K.A., 2007. The
effect of technique change on knee loads during sidestep cutting. Med. Sci. Sports Exerc.
39, 1765-1773.

47
Donnelly, C.J., Elliott, B.C., Ackland, T.R., Doyle, T.L., Beiser, T.F., Finch, C.F., Cochrane,
J.L., Dempsey, A.R., Lloyd, D.G., 2012a. An anterior cruciate ligament injury prevention
framework: incorporating the recent evidence. Res. Sports Med. 20, 239-262.
Donnelly, C.J., Elliott, B.C., Doyle, T.L.A., Finch, C.F., Dempsey, A.R., Lloyd, D.G., 2012b.
Changes in knee joint biomechanics following balance and technique training and a
season of Australian football. Br. J. Sports Med. 46, 917-922.
Donnelly, C.J., Lloyd, D.G., Elliott, B.C., Reinbolt, J.A., 2012c. Optimizing whole-body
kinematics to minimize valgus knee loading during sidestepping: implications for ACL
injury risk. J. Biomech. 45, 1491-1497.
Fagenbaum, R., Darling, W.G., 2003. Jump landing strategies in male and female college
athletes and the implications of such strategies for anterior cruciate ligament injury. Am.
J. Sports Med. 31, 233-240.
Fleming, B. C., Renstrom, P. A., Ohlen, G., Johnson, R. J., Peura, G. D., Beynnon, B. D.,
Badger, G. J., 2001. The gastrocnemius muscle is an antagonist of the anterior cruciate
ligament. J. Orthop. Res, 19, 1178-1184.
Giffin, J. R., Vogrin, T. M., Zantop, T., Woo, S. L., and Harner, C. D., 2004. Effects of
increasing tibial slope on the biomechanics of the knee. The American journal of sports
medicine, 32(2), 376-382.
Hagood, S., Solomonow, M., Baratta, R., Zhou, B.H., D'Ambrosia, R., 1990. The effect of joint
velocity on the contribution of the antagonist musculature to knee stiffness and laxity.
Am. J. Sports Med. 18, 182-187.
Hamner, S.R., Seth, A., Delp, S.L., 2010. Muscle contributions to propulsion and support during
running. J. Biomech. 43, 2709-2716.
Herzog, W., and Read, L. J., 1993. Lines of action and moment arms of the major force-carrying
structures crossing the human knee joint. Journal of anatomy, 182(Pt 2), 213-230.
Hewett, T.E., Myer, G.D., Ford, K.R., 2006. Anterior cruciate ligament injuries in female
athletes: Part 1, mechanisms and risk factors. Am. J. Sports Med. 34, 299-311.
Hewett, T.E., Myer, G.D., Ford, K.R., Heidt, R.S., Jr., Colosimo, A.J., McLean, S.G., van den
Bogert, A.J., Paterno, M.V., Succop, P., 2005. Biomechanical measures of neuromuscular
control and valgus loading of the knee predict anterior cruciate ligament injury risk in
female athletes: a prospective study. Am. J. Sports Med. 33, 492-501.
Hewett, T.E., Stroupe, A.L., Nance, T.A., Noyes, F.R., 1996. Plyometric training in female
athletes. Decreased impact forces and increased hamstring torques. Am. J. Sports Med.
24, 765-773.
Hewett, T. E., Shultz, S. J., Griffin, L. Y., 2007. Understanding and preventing non-contact ACL
injuries. eds. Human Kinetics, Champaign, IL.
Iida, Y., Kanehisa, H., Inaba, Y., Nakazawa, K., 2011. Activity modulations of trunk and lower
limb muscles during impact-absorbing landing. J. Electromyogr. Kinesiol. 21, 602-609.
Kao, J.T., Giangarra, C.E., Singer, G., Martin, S., 1995. A comparison of outpatient and
inpatient anterior cruciate ligament reconstruction surgery. Arthroscopy 11, 151-156.
Kernozek, T. W., and Ragan, R. J., 2008. Estimation of anterior cruciate ligament tension from
inverse dynamics data and electromyography in females during drop landing. Clinical
Biomechanics, 23(10), 1279-1286.

48
Koga, H., Nakamae, A., Shima, Y., Iwasa, J., Myklebust, G., Engebretsen, L., Bahr, R.,
Krosshaug, T., 2010. Mechanisms for noncontact anterior cruciate ligament injuries: knee
joint kinematics in 10 injury situations from female team handball and basketball. Am. J.
Sports Med. 38, 2218-2225.
Krosshaug, T., Nakamae, A., Boden, B.P., Engebretsen, L., Smith, G., Slauterbeck, J.R., Hewett,
T.E., Bahr, R., 2007. Mechanisms of anterior cruciate ligament injury in basketball: video
analysis of 39 cases. Am. J. Sports Med. 35, 359-367.
Laughlin, W.A., Weinhandl, J.T., Kernozek, T.W., Cobb, S.C., Keenan, K.G., O'Connor, K.M.,
2011. The effects of single-leg landing technique on ACL loading. J. Biomech. 44, 1845-
1851.
Lexell, J., Taylor, C.C., Sjostrom, M., 1988. What is the cause of the ageing atrophy?: Total
number, size and proportion of different fiber types studied in whole vastus lateralis
muscle from 15- to 83- year old men. J. Neurol. Sci. 84, 275-294.
Li, G., Rudy, T.W., Sakane, M., Kanamori, A., Ma, C.B., Woo, S.L., 1999. The importance of
quadriceps and hamstring muscle loading on knee kinematics and in-situ forces in the
ACL. J. Biomech. 32, 395-400.
Lloyd, D.G., Buchanan, T.S., 2001. Strategies of muscular support of varus and valgus isometric
loads at the human knee. J. Biomech. 34, 1257-1267.
Markolf, K.L., Burchfield, D.M., Shapiro, M.M., Shepard, M.F., Finerman, G.A., Slauterbeck,
J.L., 1995. Combined knee loading states generate high anterior cruciate ligament forces.
J. Orth. Res. 13, 930-935.
Markolf, K. L., Gorek, J. F., Kabo, J. M., and Shapiro, M. S., 1990. Direct measurement of
resultant forces in the anterior cruciate ligament. An in vitro study performed with a new
experimental technique. The Journal of Bone & Joint Surgery, 72(4), 557-567.
Markolf, K.L., Willems, M.J., Jackson, S.R., Finerman, G.A.M., 1998. In Situ Calibration
miniature sensors implanted into the Anterior Cruciate Ligament Part I: Strain
Measurements. J. Orth. Res. 16, 455-463.
McLean, S.G., Huang, X., Su, A., Van Den Bogert, A.J., 2004. Sagittal plane biomechanics
cannot injure the ACL during sidestep cutting. Clin. Biomech. (Bristol, Avon) 19, 828-
838.
McLean, S.G., Huang, X., van den Bogert, A.J., 2005. Association between lower extremity
posture at contact and peak knee valgus moment during sidestepping: implications for
ACL injury. Clin. Biomech. (Bristol, Avon) 20, 863-870.
McLean, S.G., Huang, X., van den Bogert, A.J., 2008. Investigating isolated neuromuscular
control contributions to non-contact anterior cruciate ligament injury risk via computer
simulation methods. Clin. Biomech. (Bristol, Avon) 23, 926-936.
Mokhtarzadeh, H., Yeow, C.H., Goh, J.C.H., Oetomo, D., Malekipour, F., Lee, P.V.S., 2013.
Contributions of the Soleus and Gastrocnemius muscles to the anterior cruciate ligament
loading during single-leg landing. J. Biomech. 46, 1913-1920.
Myer, G.D., Ford, K.R., Barber Foss, K.D., Liu, C., Nick, T.G., Hewett, T.E., 2009. The
relationship of hamstrings and quadriceps strength to anterior cruciate ligament injury in
female athletes. Clin. J. Sport Med. 19, 3-8.
Nyland, J., Klein, S., Caborn, D.N., 2010. Lower extremity compensatory neuromuscular and
biomechanical adaptations 2 to 11 years after anterior cruciate ligament reconstruction.
Arthroscopy 26, 1212-1225.

49
Padua, D.A., Carcia, C.R., Arnold, B.L., Granata, K.P., 2005. Gender differences in leg stiffness
and stiffness recruitment strategy during two-legged hopping. Journal of motor behavior
37, 111-125.
Pflum, M. A., Shelburne, K. B., Torry, M. R., Decker, M. J., Pandy, M. G., 2004. Model
prediction of anterior cruciate ligament force during drop-landings. Med. Sci. Sports
Exerc. 36, 1949-1958.
Podraza, J.T., White, S.C., 2010. Effect of knee flexion angle on ground reaction forces, knee
moments and muscle co-contraction during an impact-like deceleration landing:
implications for the non-contact mechanism of ACL injury. Knee 17, 291-295.
Riemann, B.L., Lephart, S.M., 2002. The Sensorimotor System, Part II: The Role of
Proprioception in Motor Control and Functional Joint Stability. Journal of athletic
training 37, 80-84.
Rubenson, J., Pires, N.J., Loi, H.O., Pinniger, G.J., Shannon, D.G., 2012. On the ascent: the
soleus operating length is conserved to the ascending limb of the force-length curve
across gait mechanics in humans. J. Exp. Biol. 215, 3539-3551.
Seedhom, B.B., Longton, E.B., Wright, V., Dowson, D., 1972. Dimensions of the Knee.
Radiographic autopsy study sizes require knee prosthesis. Ann. Rheum. Dis. 31, 54-58.
Seth, A., Sherman, M., Reinbolt, J.A., Delp, S.L., 2011. OpenSim: a musculoskeletal modeling
and simulation framework for in silico investigations and exchange. Proc Iutam 2, 212-
232.
Sherbondy, P. S. Queale, W. S., McFarland, E. G., Mizuno, Y., Cosgarea, A. J., 2003. Soleus
and gastrocnemius muscle loading decreases anterior tibial translation in anterior cruciate
ligament intact nad deficient knees. J. of Knee Surg. 16, 152.
Shin, C.S., Chaudhari, A.M., Andriacchi, T.P., 2007. The influence of deceleration forces on
ACL strain during single-leg landing: a simulation study. J. Biomech. 40, 1145-1152.
Thelen, D.G., Anderson, F.C., 2006. Using computed muscle control to generate forward
dynamic simulations of human walking from experimental data. J. Biomech. 39, 1107-
1115.
Thelen, D.G., Anderson, F.C., Delp, S.L., 2003. Generating dynamic simulations of movement
using computed muscle control. J. Biomech. 36, 321-328.
Utturkar, G. M., Irribarra, L. A., Taylor, K. A., Spritzer, C. E., Taylor, D. C., Garrett, W. E., and
DeFrate, L. E., 2013. The effects of a valgus collapse knee position on in vivo ACL
elongation. Annals of biomedical engineering, 41(1), 123-130.
Viitasalo, J.T., Salo, A., Lahtinen, J., 1998. Neuromuscular functioning of athletes and non-
athletes in the drop jump. Eur. J. Appl. Physiol. 78, 432-440.
Walla, D.J., Albright, J.P., McAuley, E., Martin, R.K., Eldridge, V., El-Khoury, G., 1985.
Hamstring control and the unstable anterior cruciate ligament-deficient knee. Am. J.
Sports Med. 13, 34-39.
Weinhandl, J.T., Earl-Boehm, J.E., Ebersole, K.T., Huddleston, W.E., Armstrong, B.S.,
O'Connor, K.M., 2013. Anticipatory effects on anterior cruciate ligament loading during
sidestep cutting. Clin. Biomech. (Bristol, Avon) 28, 655-663.
Wikstrom, E.A., Tillman, M.D., Schenker, S., Borsa, P.A., 2008. Failed jump landing trials:
deficits in neuromuscular control. Scand. J. Med. Sci. Sports 18, 55-61.
Winter, D.A., 1980. Overall Principle of Lower Limb Support During Stance Phase of Gait. 13,
923-927.

50
Wojtys, E.M., Ashton-Miller, J.A., Huston, L.J., 2002. A gender-related difference in the
contribution of the knee musculature to sagittal-plane shear stiffness in subjects with
similar knee laxity. J. Bone Joint Surg. Am. 84-A, 10-16.
Woo, S. L. Y., Hollis, J. M., Adams, D. J., Lyon, R. M., and Takai, S., 1991. Tensile properties
of the human femur-anterior cruciate ligament-tibia complex The effects of specimen age
and orientation. The American journal of sports medicine, 19(3), 217-225.
Zhao, D., Banks, S.A., D'Lima, D.D., Colwell, C.W., Jr., Fregly, B.J., 2007. In vivo medial and
lateral tibial loads during dynamic and high flexion activities. J. Orthop. Res. 25, 593-
602.

51
2.7 Appendix
2.7.1 Scaling
The objective of scaling is to develop a subject-specific model that has the same mass and
anthropometric measurements as the subject performing the experiment. This is achieved by first
obtaining the experimentally measured subjects mass and redistributing that mass amongst the
models’ body segments to replicate the subjects body mass (Delp et al., 2007). Then the generic
virtual markers on the OpenSim model are repositioned on the model based on the location of the
subjects’ experimental markers to identify the appropriate joint centers and define the correct
segment lengths (Delp et al., 2007). The marker locations from the subjects’ experimental static
pose is compared to the virtual marker locations in the models static pose to ensure a strong match
(i.e. minimal error) between the model and experimental marker sets. The error is the calculated
average of the distance between the two marker sets. The result is a model that closely matches
the subjects’ mass properties and segment dimensions.
2.7.2 Inverse Kinematics (IK)
Inverse kinematics is a process that derives the joint angles that the experimental marker
data record during movement. IK works by calculating the ideal location to place the model joint
coordinates (angles and position) to match the experimental joint coordinates at regular time
points throughout the movement. A weighted least square algorithm (Eq. 2.1) is utilized to reduce
these errors between the experimental exp
iX and model markers qX i and generalized
coordinates jexp q ,jq , where iw and jw are the user defined weightings (Delp et al., 2007).

52
(2.1) ker
2exp2
exp
min
smari coordsedunprescribj
jjjiii
q
qqwqxxw
exp
jj qq for all prescribed coordinates j
The weighting coefficients are adjusted to better track markers and coordinates the researchers
have the greatest confidence in. The result is model joint angles and positions that accurately track
the experimental movement.
2.7.3 Residual Reduction Analysis (RRA)
Residual reduction analysis employs a forward dynamics to create a simulation that
recreates the IK motion using torques actuators acting at/on the joints. The result is a dynamically
consistent model. A dynamically consistent model is one where the summation of the (derived)
model forces matches the experimentally measured GRFs, which are an accurate measurement of
the forces exerted on the ground by the individual. However, throughout model development,
assumptions are made to determine model marker placement/location, joint angles and joint
positions information that are used to derive model accelerations. This can cause errors to
accumulate causing the model forces to differ from the GRFs. To make the model forces equal the
GRFs, residual forces and torques are added to the model to match GRFs as shown in Equation
2.2 (Delp et al., 2007). Reserve actuators are used to generate the residual forces and torques.
There are six reserve actuators and they are represented by a 6 DoF (3 translational, 3 rotational)
joint that acts between the pelvis and the ground (Delp et al., 2007). An optimization algorithm is
employed to minimize the contribution of the reserve actuators as the reserve forces are phantom
forces that are added to ensure model forces equal experimentally measured GRFs (Delp et al.,
2007). The optimization function uses the relationship between the weighted iqw sum of the
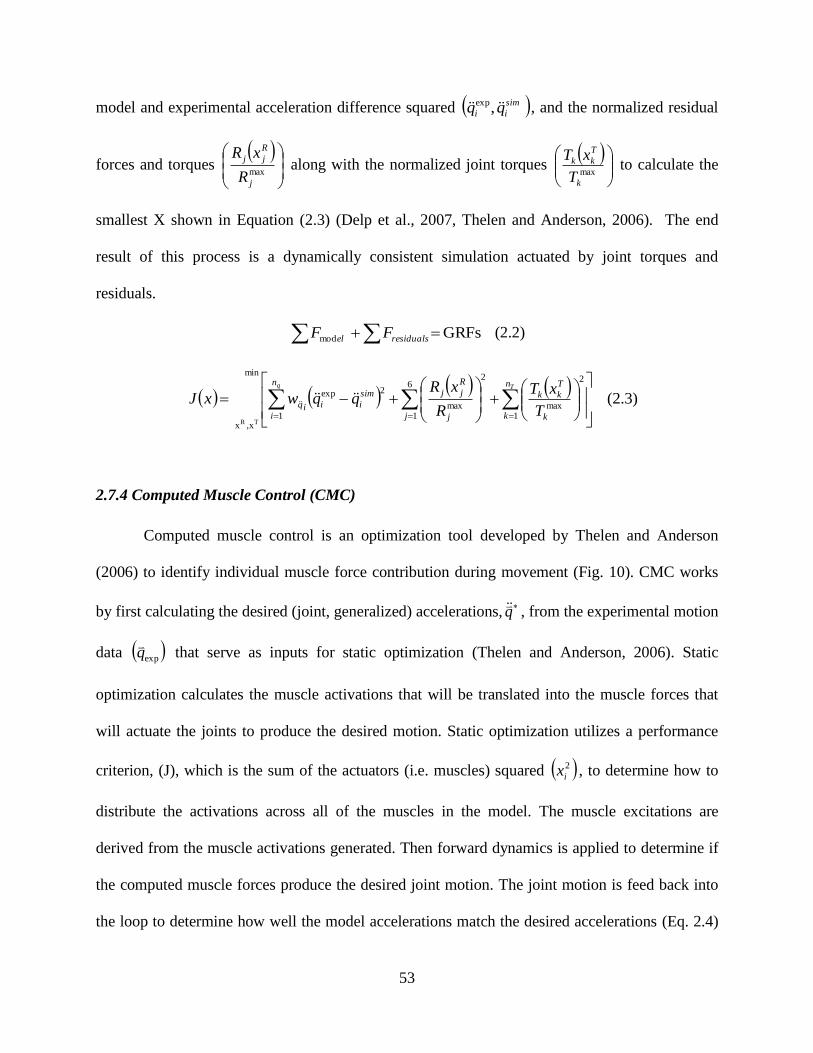
53
model and experimental acceleration difference squared ,exp sim
ii qq , and the normalized residual
forces and torques
max
j
R
jj
R
xR along with the normalized joint torques
max
k
T
kk
T
xT to calculate the
smallest X shown in Equation (2.3) (Delp et al., 2007, Thelen and Anderson, 2006). The end
result of this process is a dynamically consistent simulation actuated by joint torques and
residuals.
GRFs mod residualsel FF (2.2)
(2.3) 1
6
1 1
2
max
2
max
2exp
min
x,x TR
q Tn
i j
n
k k
T
kk
j
R
jjsim
iiiqT
xT
R
xRqqwxJ
2.7.4 Computed Muscle Control (CMC)
Computed muscle control is an optimization tool developed by Thelen and Anderson
(2006) to identify individual muscle force contribution during movement (Fig. 10). CMC works
by first calculating the desired (joint, generalized) accelerations, q
, from the experimental motion
data expq
that serve as inputs for static optimization (Thelen and Anderson, 2006). Static
optimization calculates the muscle activations that will be translated into the muscle forces that
will actuate the joints to produce the desired motion. Static optimization utilizes a performance
criterion, (J), which is the sum of the actuators (i.e. muscles) squared 2
ix , to determine how to
distribute the activations across all of the muscles in the model. The muscle excitations are
derived from the muscle activations generated. Then forward dynamics is applied to determine if
the computed muscle forces produce the desired joint motion. The joint motion is feed back into
the loop to determine how well the model accelerations match the desired accelerations (Eq. 2.4)
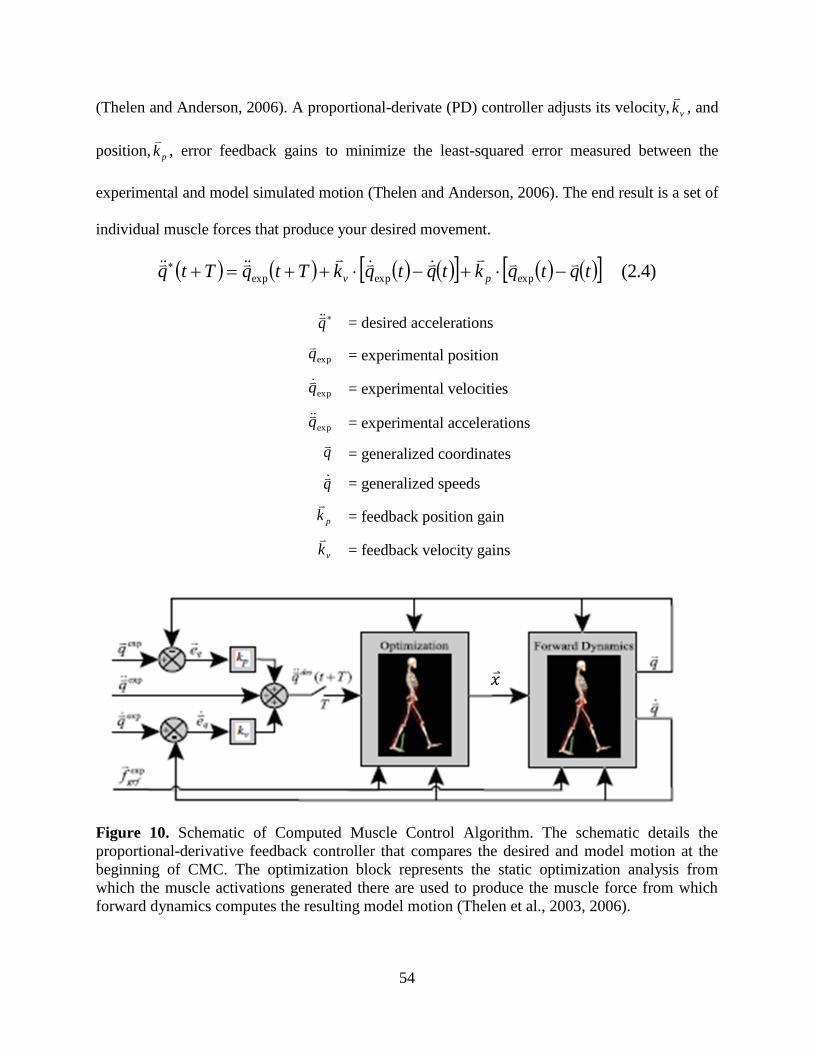
54
(Thelen and Anderson, 2006). A proportional-derivate (PD) controller adjusts its velocity, vk
, and
position, pk
, error feedback gains to minimize the least-squared error measured between the
experimental and model simulated motion (Thelen and Anderson, 2006). The end result is a set of
individual muscle forces that produce your desired movement.
(2.4) expexpexp tqtqktqtqkTtqTtq pv
q
= desired accelerations
expq
= experimental position
expq
= experimental velocities
expq
= experimental accelerations
q
= generalized coordinates
q
= generalized speeds
pk
= feedback position gain
vk
= feedback velocity gains
Figure 10. Schematic of Computed Muscle Control Algorithm. The schematic details the
proportional-derivative feedback controller that compares the desired and model motion at the
beginning of CMC. The optimization block represents the static optimization analysis from
which the muscle activations generated there are used to produce the muscle force from which
forward dynamics computes the resulting model motion (Thelen et al., 2003, 2006).
55
2.7.5 ACL Force Calculation
The following steps were used to calculate the force in the ACL (FACL) in this study. The
methodology was developed by Kernozek and Ragan (2008) and recently implemented by
Mokhtarzadeh et al., 2013. First Equation 2.5 is used to calculate the anterior-posterior shear
force in the ligament (Fligament). Here pat and ham are the quadriceps and hamstrings tendon
angles as a function of knee flexion angles, respectively. The equations for quadriceps and
hamstrings as a function of knee flexion angles were developed by Herzog and Read (1993). The
Fpat and Fham represent the quadriceps and hamstring force, respectively. OpenSim’s joint
reaction analysis was used to compute the tibio-femoral contact force (Ftf). The anterior-posterior
shear force F was calculated by adding an additional coordinate to the OpenSim model,
calculating anterior-posterior translation as a function of knee flexion angle and then performing
inverse dynamics to calculate F . Research by Giffin et al. (2004) and Kernozek and Ragan
(2008) determined that the posterior tibial slope angle tf to be 8.5°.
(2.5) sinsinsin ligamenthamhampatpattftf FFFFF
Once Fligament was calculated in Equation 2.5 it was used to calculate the force in the ACL
(FACL). Here knee is the knee flexion angle and F100 and F0 are forces in the ACL when 100N and
0N of anterior tibial force are applied to the ACL (Eq. 2.6). These values can be obtained from
Markolf et al. (1990 and 1995).
(2.6)
1000
0100kneeligament
kneekneeACL FF
N
FFF

56
CHAPTER III
ASSESS HOW INDIVIDUAL MUSCLES RESIST ELEVATED
KNEE ABDUCTION MOMENT DURING SINGLE-LEG JUMP
LANDING

57
3.1 Abstract
While the joint kinematics and kinetics associated with ACL injury are well understood,
the individual muscle contributions to ACL injury are not. Researchers have implemented ACL
injury training inter programs that measured muscle activation during dynamic movements like
cutting and jump landing; but, muscle activation does not imply its contribution to joint motion.
The purpose of this study was to determine the contribution of the six muscles crossing the knee
to frontal, sagittal and transverse plane knee acceleration during single-leg jump landing. We
believe that this information will provide better information about the cause-effect relationship
between joint motion and muscle function. The three-dimensional, 14-segment, 37 degree-of-
freedom, 92 muscle-tendon actuated models of amateur male Australian Rules Football players
performing a single-leg landing tasks from Chapter I were used in this analysis. Induced
acceleration analysis was performed to compute the individual muscle contribution to frontal,
sagittal and transverse knee accelerations during the single-leg landing task. A one-way ANOVA
and Tukey post-hoc analysis determined that the mean cumulative summation of the medial
gastrocnemius accelerations in the frontal plane were significantly larger than any other muscle
(p < 0.001). And the medial gastrocnemius along with the vastus medialis muscle provided the
largest contribution to accelerating the knee into adduction while the lateral gastrocnemius
accelerated the knee into abduction. In the sagittal plane, the medial and lateral vasti were the
strongest contributors to knee extension while the gastrocnemii were the strongest contributors to
knee flexion. The results determined that the medial gastrocnemii was the greatest contributor to
resisting knee abduction and knee extension and should be targeted in any ACL injury training
intervention program.
58
3.2 Introduction
Elevated knee abduction moment is a strong predictor of ACL injury (Hewett et al.,
2005). The elevated moment is believed to be a byproduct of poor knee extensor to knee flexor
muscle imbalance as stronger knee extensor-flexor muscle balance can help compress and in turn
stabilize the joint (Hewett et al, 2006; Markolf et al., 1978; Solomonow et al., 1987).
Researchers have focused on increasing hamstring (knee flexor) strength to oppose the dominant
quadriceps (knee extensor) activation strength prevalent in individuals at-risk for ACL injury;
but, the gastrocnemii muscles can also function as knee flexors and help oppose the quadriceps
muscles (Laundry et al., 2007; Laundry et al., 2009; Podraza et al., 2010). The results of the
previous study (Chapter II) found that the gastrocnemii muscles produced significantly greater
force than the hamstring muscles during the single-leg jump landing task. However, increased
force production by the gastrocnemii muscles does not validate their potential role as the primary
contributors to opposing the quadriceps and stabilizing and supporting the knee during landing.
ACL injury prevention programs are aimed at altering muscle force and activation patterns to
circumvent the ACL injury mechanism; however, they are limited by their inability to assess
individual muscle contributions to resist excessive knee loading during movement (Chappell et
al, 2008; Donnelly et al., 2012b; Hewett et al., 1999; Huston et al., 1996). This inability to
compute a muscles contribution to movement has limited the progress of the current ACL injury
research and highlights a need for a way to assess muscles contribution movement to address this
gap in ACL injury research.
Muscles accelerate joints and determining how they accelerate the knee during landing
may be the key to understanding ACL injury prevention. Induced acceleration analysis (IAA) is
a technique that determines the accelerations caused or “induced” by individual muscle forces
59
acting on a model (e.g., contribution of muscle forces to knee accelerations). IAA employs the
principle of dynamic coupling, which describes the interconnectedness of the body segments, to
deconstruct a muscles ability to actuate joints and body segments throughout the body. IAA has
been implemented to compute muscles’ contribution to supporting and propelling the center-of-
mass (CoM) forward during walking and running and here it will be utilized to evaluate
individual muscles contribution to knee motion during single-leg jump landing (Hamner et al.,
2010; Lin et al., 2011; Liu et al, 2006; Liu et al., 2008).
A muscles’ contribution to movement is dependent on first calculating the force an
individual muscle produces and then computing the muscle forces’ ability to accelerate (knee)
joint motion during landing. After assessing the individual muscle force production during
landing via CMC in Chapter II, the next step is to compute individual muscles ability to
accelerate the knee during landing. The objective of the present study is to assess muscle
contribution to frontal, sagittal and transverse plane knee accelerations and specifically
determine which muscles are responsible for resisting certain elevated knee abduction. Knee
abduction position observed during ACL injury is characterized as the medial collapse of the
knee (Utturkar et al., 2013). We hypothesize that in addition to increased medial and lateral
gastrocnemii muscle function, the medial quadriceps, hamstring and gastrocnemius muscles will
be the strongest contributors to accelerating the knee into adduction. This research should
provide additional insight about the causal relationship (i.e., muscle contributions to movement)
between muscle forces and joint biomechanics specifically with regard to ACL injury risk.

60
3.3 Methodology
3.3.1 Experimental Protocol and Data Collection
Amateur male Western Australian Rules Football players were recruited to perform a
single-leg jump landing experimental protocol (Donnelly et al., 2012c). Participants jumped and
landed on their preferred leg, which was the right leg for all individuals analyzed in this study.
While in flight, the participants were instructed to grab an Australian rules football randomly
swung medially, laterally or held central relative to the participants approach direction (Dempsey
et al., 2012). The ball height was approximately 90% of each participant’s maximal vertical jump
height. Participants landed their jump on a force platform. Of the fourteen trials generated by the
seven participants (age 20.7 ± 1.8 years; height 1.9 ± 0.1m; mass 87.8 ± 5.1 kg) during the CMC
analysis from Chapter II, eight trials were used for IAA as these trials model computed GRF
were consistent with the experimentally measured GRF. All experimental procedures were
approved by the University of Western Australia Human Research Ethics Committee and all
participants provided their informed written consent prior to data collection.
Three-dimensional kinematic marker trajectories, ground reaction forces (GRF) and
sEMG data from six muscles crossing the knee were recorded for each participant during the
experimental data collection. Fifty-six upper- and lower-body retro-reflective markers were
utilized to capture kinematic trajectories (Donnelly et al., 2012b). Marker trajectories were
recorded at 250 Hz using a 12-camera Vicon MX motion capture system (VICON Peak, Oxford
Metrics Ltd., UK) (Dempsey et al., 2007; Donnelly et al., 2012c). GRF data were synchronously
recorded at 2,000 Hz using an AMTI (Advanced Mechanical Technology Inc., Watertown, MA)
1.2 x 1.2m force platform. Both the kinematic and GRF data were low-pass filtered using a zero
phase-shift, 4th
-order Butterworth filter with a cutoff frequency of 20 Hz in Workstation

61
(ViconPeak, Oxford Metrics Ltd., UK). The sEMG data were synchronously collected at 2,000
Hz for six muscles: vastus medialis, vastus lateralis, medial and lateral gastrocnemii and medial
and lateral hamstrings. Eight surface muscles were measured with sEMG in total; however, this
study focused on the six muscles that crossed the knee for analysis. The raw experimental sEMG
data were band-pass filtered using a zero phase-shift, 4th
-order Butterworth filter with a frequency
band between 30 and 500 Hz, full wave rectified and then low-pass filtered using a zero phase-
shift, 4th
-order Butterworth filter with a cutoff frequency of 6 Hz to create linear envelopes.
Following linear enveloping, peak muscle activation from each muscle recorded during the three
landing conditions were used to normalize each muscle’s sEMG signal to 100% activation. The
result is a sEMG waveform from zero to full activation.
3.3.2 Subject-Specific Models and Simulations
Seven three-dimensional, 14-segment, 37 degree-of-freedom (DoF), 92 muscle-tendon
actuated subject-specific models were created in OpenSim 1.9.1 to generate simulations of each
participant performing the single-leg jump landing task (Fig. 11) . The details of this model have
been described previously (Donnelly et al., 2012c). The 92 muscle-tendon units actuated the
lower extremity and lower back joint, while the arms were actuated by torque actuators instead of
muscle-tendon actuators also described previously (Hamner et al., 2010). The maximum isometric
force of each muscle was increased by 60% compared to the model provided in OpenSim (Delp et
al., 1990) based on research by Arnold et al. (Arnold et al., 2010). The model included a 3 DoF
knee actuated by muscles and ideal torque actuators (±50Nm) which were used to provide the
resistance supplied by the knee ligaments and articular surface that help stabilize the knee in the
frontal plane. These values are consistent with previous literature (Seedhom et al., 1972; Zhao et
al., 2007). Subject-specific joint centers were derived using functional knee and hip joint methods
62
(Besier et al., 2003), custom biomechanical models in MATLAB (MATLAB 7.8, The
MathWorks, Inc., Natick Massachusetts, USA) and Vicon Bodybuilder (Dempsey et al., 2007).
The resulting joint centers, marker trajectories and GRF data were then exported to OpenSim
1.9.1. Segment lengths were scaled to each participant’s specific joint centers and segment masses
to each participant’s total body mass. Inverse kinematics (IK) was used to derive simulated joint
angles from the experimental marker data recorded during the jump landing. Residual reduction
analysis (RRA) was used to create simulations that were dynamically consistent with the
experimentally recorded ground reaction forces (Delp et al., 2007; Donnelly et al., 2012c). Muscle
forces were estimated for the weight-acceptance (WA) phase of single-leg jump landing using
computed muscle control (CMC). CMC is an algorithm that utilizes optimization, forward
dynamics and feedback control to estimate individual muscle forces during dynamic movements
(Thelen and Anderson, 2006; Thelen et al., 2003).

63
Figure 11. Series of images for a subject-specific simulation during single-leg jump landing
using a musculoskeletal model with 37 degrees of freedom and 92 muscle-tendon actuators.
The WA phase was defined as the time from the initial contact to the first trough in the
vertical ground reaction force profile (Dempsey et al., 2007). The WA phase was analyzed as this
phase is thought to be when the ACL is at the greatest risk for injury (Dempsey et al., 2007;
Donnelly et al., 2012a).
3.3.3 Muscle Contribution to Knee Acceleration during Single-leg Jump Landing
In IAA, GRF data is decomposed and the individual muscle forces contribution to joint
and body segments accelerations are calculated using the concept of dynamic coupling. The
dynamics that describe the relationship between the body segments is modeled via the equations
of motion (Eq. 3.1). The two main specifications of IAA involve the selection of the GRF
decomposition method and the foot-ground contact model. This study adopted the approach
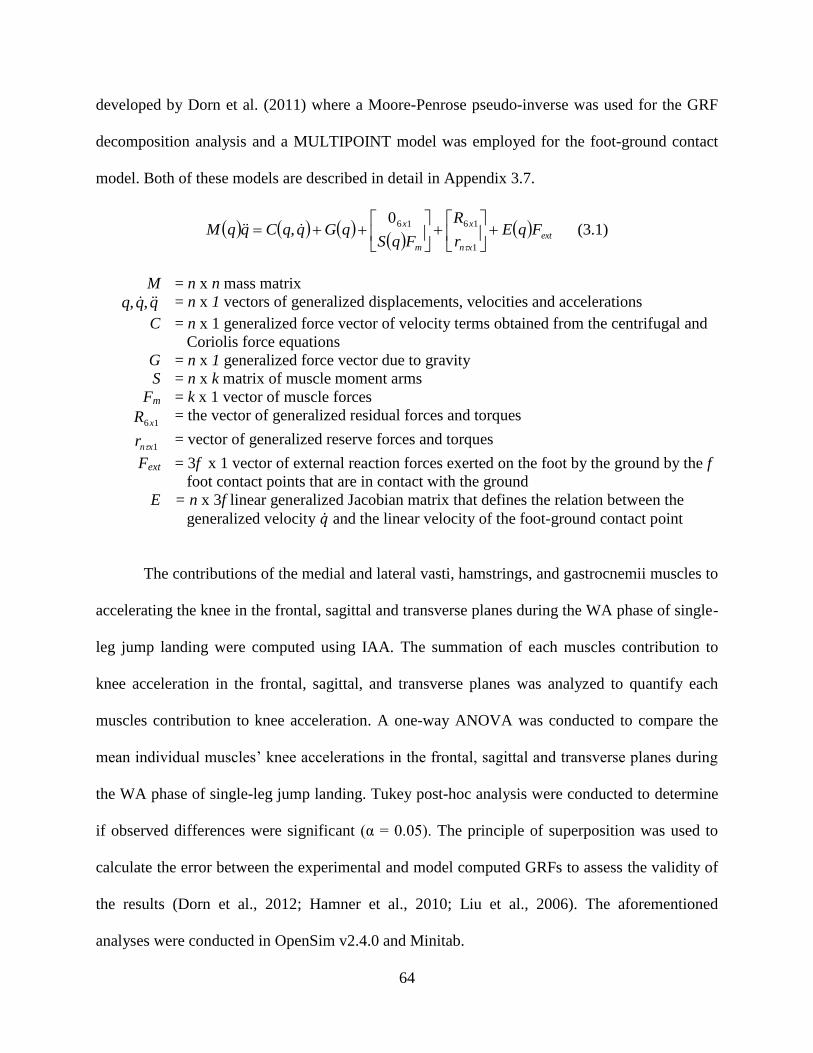
64
developed by Dorn et al. (2011) where a Moore-Penrose pseudo-inverse was used for the GRF
decomposition analysis and a MULTIPOINT model was employed for the foot-ground contact
model. Both of these models are described in detail in Appendix 3.7.
(3.1) 0
,1
1616
ext
xn
x
m
xFqE
r
R
FqSqGqqCqqM
M = n x n mass matrix
qqq ,, = n x 1 vectors of generalized displacements, velocities and accelerations
C = n x 1 generalized force vector of velocity terms obtained from the centrifugal and
Coriolis force equations
G = n x 1 generalized force vector due to gravity
S = n x k matrix of muscle moment arms
Fm = k x 1 vector of muscle forces
16xR = the vector of generalized residual forces and torques
1xnr = vector of generalized reserve forces and torques
Fext = 3f x 1 vector of external reaction forces exerted on the foot by the ground by the f
foot contact points that are in contact with the ground
E = n x 3f linear generalized Jacobian matrix that defines the relation between the
generalized velocity ̇ and the linear velocity of the foot-ground contact point
The contributions of the medial and lateral vasti, hamstrings, and gastrocnemii muscles to
accelerating the knee in the frontal, sagittal and transverse planes during the WA phase of single-
leg jump landing were computed using IAA. The summation of each muscles contribution to
knee acceleration in the frontal, sagittal, and transverse planes was analyzed to quantify each
muscles contribution to knee acceleration. A one-way ANOVA was conducted to compare the
mean individual muscles’ knee accelerations in the frontal, sagittal and transverse planes during
the WA phase of single-leg jump landing. Tukey post-hoc analysis were conducted to determine
if observed differences were significant (α = 0.05). The principle of superposition was used to
calculate the error between the experimental and model computed GRFs to assess the validity of
the results (Dorn et al., 2012; Hamner et al., 2010; Liu et al., 2006). The aforementioned
analyses were conducted in OpenSim v2.4.0 and Minitab.

65
3.4 Results
The muscular contributions to knee accelerations varied widely during the WA phase of
single-leg jump landing (Fig. 12). In the frontal plane, the muscles that displayed the greatest
contribution to knee adduction were the medial gastrocnemius and vastus medialis (Fig. 12a).
The lateral gastrocnemius and lateral hamstring produced the largest opposing accelerations as
they contributed to knee abduction. In the sagittal plane, the medial and lateral vasti and
hamstring muscles all contributed to knee extension while the medial and lateral gastrocnemii
functioned to flex the knee (Fig. 12b). The vastus medialis, medial hamstring and lateral
gastrocnemius were all shown to contribute to internal rotation at the knee with the lateral vasti
and hamstring muscles and medial gastrocnemius opposing internal rotation (Fig. 12c). These
trends were consistent across all subjects analyzed.
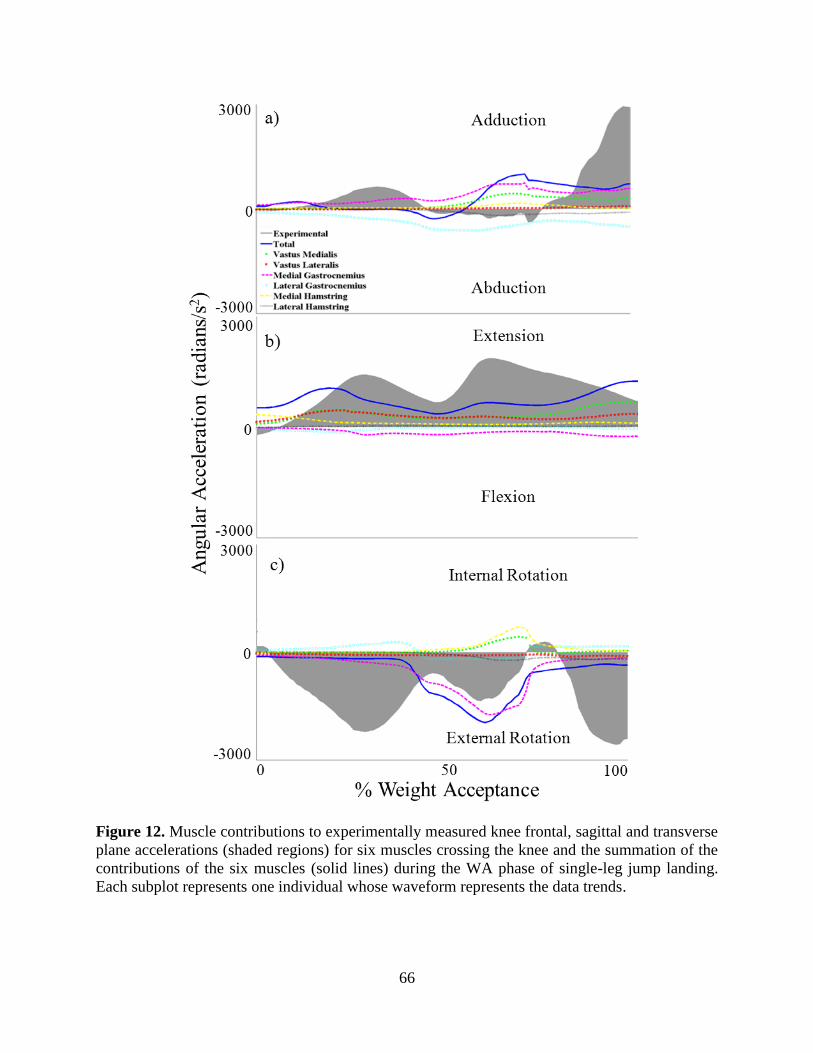
66
Figure 12. Muscle contributions to experimentally measured knee frontal, sagittal and transverse
plane accelerations (shaded regions) for six muscles crossing the knee and the summation of the
contributions of the six muscles (solid lines) during the WA phase of single-leg jump landing.
Each subplot represents one individual whose waveform represents the data trends.
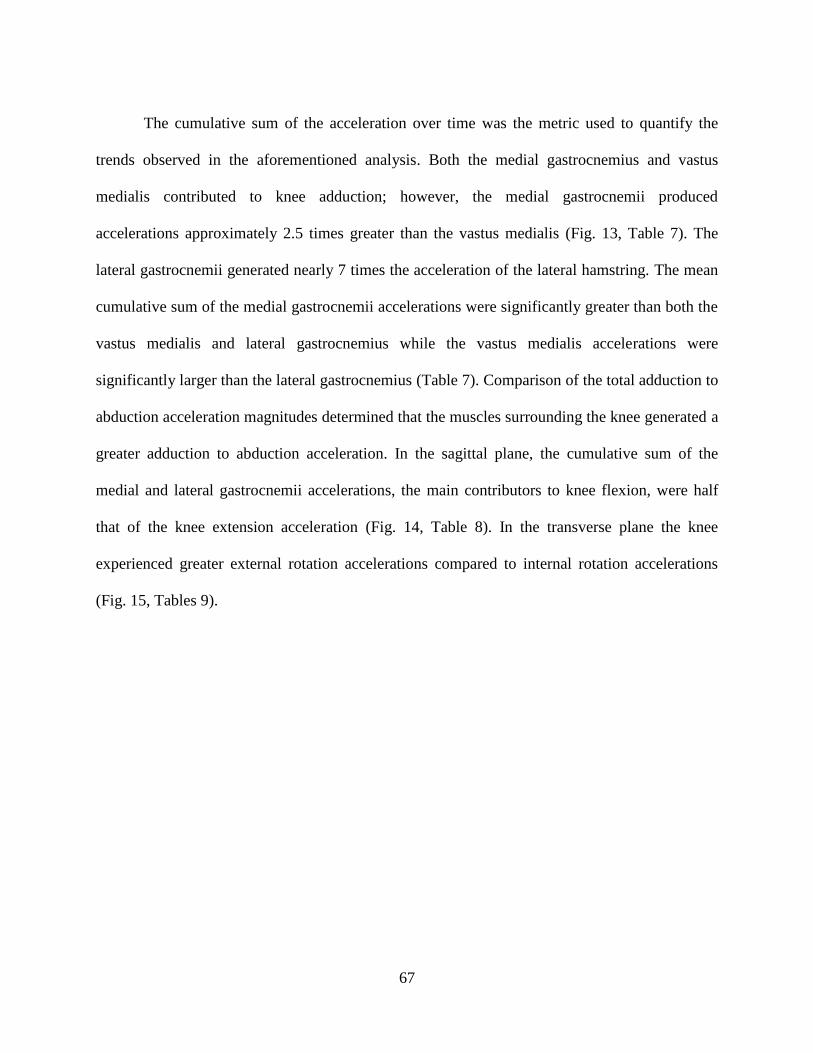
67
The cumulative sum of the acceleration over time was the metric used to quantify the
trends observed in the aforementioned analysis. Both the medial gastrocnemius and vastus
medialis contributed to knee adduction; however, the medial gastrocnemii produced
accelerations approximately 2.5 times greater than the vastus medialis (Fig. 13, Table 7). The
lateral gastrocnemii generated nearly 7 times the acceleration of the lateral hamstring. The mean
cumulative sum of the medial gastrocnemii accelerations were significantly greater than both the
vastus medialis and lateral gastrocnemius while the vastus medialis accelerations were
significantly larger than the lateral gastrocnemius (Table 7). Comparison of the total adduction to
abduction acceleration magnitudes determined that the muscles surrounding the knee generated a
greater adduction to abduction acceleration. In the sagittal plane, the cumulative sum of the
medial and lateral gastrocnemii accelerations, the main contributors to knee flexion, were half
that of the knee extension acceleration (Fig. 14, Table 8). In the transverse plane the knee
experienced greater external rotation accelerations compared to internal rotation accelerations
(Fig. 15, Tables 9).
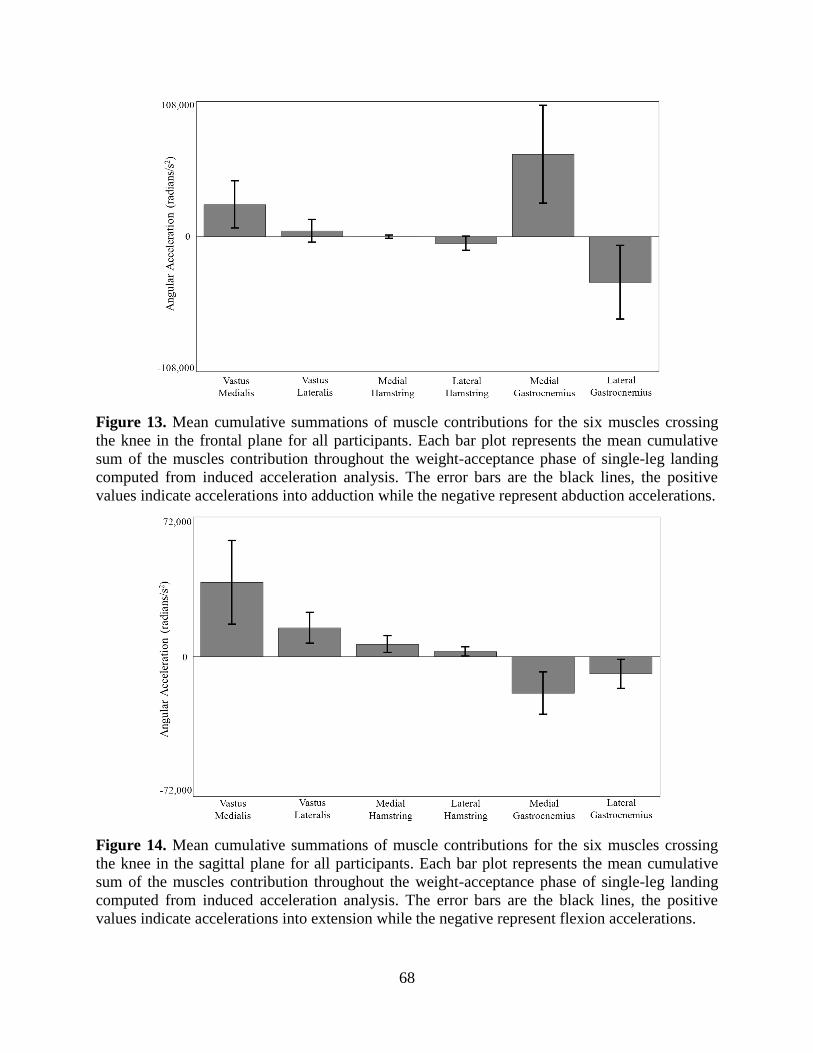
68
Figure 13. Mean cumulative summations of muscle contributions for the six muscles crossing
the knee in the frontal plane for all participants. Each bar plot represents the mean cumulative
sum of the muscles contribution throughout the weight-acceptance phase of single-leg landing
computed from induced acceleration analysis. The error bars are the black lines, the positive
values indicate accelerations into adduction while the negative represent abduction accelerations.
Figure 14. Mean cumulative summations of muscle contributions for the six muscles crossing
the knee in the sagittal plane for all participants. Each bar plot represents the mean cumulative
sum of the muscles contribution throughout the weight-acceptance phase of single-leg landing
computed from induced acceleration analysis. The error bars are the black lines, the positive
values indicate accelerations into extension while the negative represent flexion accelerations.

69
Figure 15. Mean cumulative summations of muscle contributions for the six muscles crossing
the knee in the transverse plane for all participants. Each bar plot represents the mean cumulative
sum of the muscles contribution throughout the weight-acceptance phase of single-leg landing
computed from induced acceleration analysis. The error bars are the black lines, the positive
values indicate accelerations into internal rotation while the negative represent external rotation
accelerations.
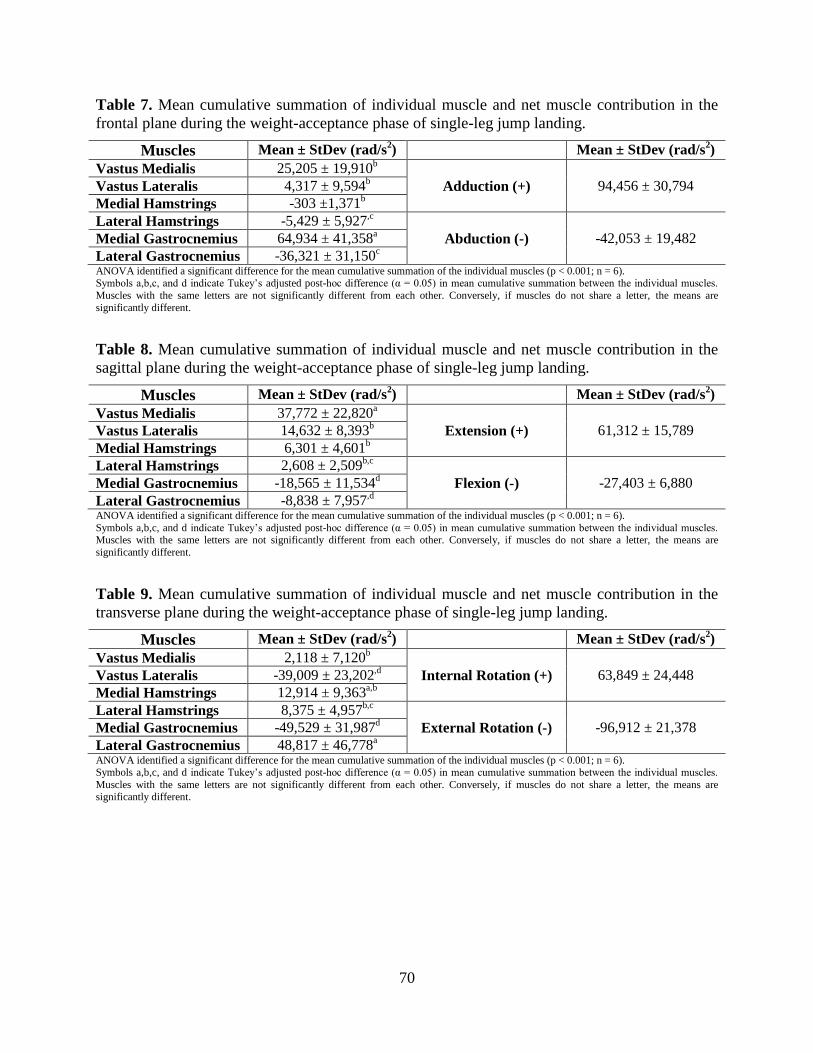
70
Table 7. Mean cumulative summation of individual muscle and net muscle contribution in the
frontal plane during the weight-acceptance phase of single-leg jump landing.
Muscles Mean ± StDev (rad/s2) Mean ± StDev (rad/s
2)
Vastus Medialis 25,205 ± 19,910b
Vastus Lateralis 4,317 ± 9,594b Adduction (+) 94,456 ± 30,794
Medial Hamstrings -303 ±1,371b
Lateral Hamstrings -5,429 ± 5,927,c
Medial Gastrocnemius 64,934 ± 41,358a Abduction (-) -42,053 ± 19,482
Lateral Gastrocnemius -36,321 ± 31,150c
ANOVA identified a significant difference for the mean cumulative summation of the individual muscles (p < 0.001; n = 6). Symbols a,b,c, and d indicate Tukey’s adjusted post-hoc difference (α = 0.05) in mean cumulative summation between the individual muscles.
Muscles with the same letters are not significantly different from each other. Conversely, if muscles do not share a letter, the means are
significantly different.
Table 8. Mean cumulative summation of individual muscle and net muscle contribution in the
sagittal plane during the weight-acceptance phase of single-leg jump landing.
Muscles Mean ± StDev (rad/s2) Mean ± StDev (rad/s
2)
Vastus Medialis 37,772 ± 22,820a
Vastus Lateralis 14,632 ± 8,393b Extension (+) 61,312 ± 15,789
Medial Hamstrings 6,301 ± 4,601b
Lateral Hamstrings 2,608 ± 2,509b,c
Medial Gastrocnemius -18,565 ± 11,534d Flexion (-) -27,403 ± 6,880
Lateral Gastrocnemius -8,838 ± 7,957,d
ANOVA identified a significant difference for the mean cumulative summation of the individual muscles (p < 0.001; n = 6).
Symbols a,b,c, and d indicate Tukey’s adjusted post-hoc difference (α = 0.05) in mean cumulative summation between the individual muscles. Muscles with the same letters are not significantly different from each other. Conversely, if muscles do not share a letter, the means are
significantly different.
Table 9. Mean cumulative summation of individual muscle and net muscle contribution in the
transverse plane during the weight-acceptance phase of single-leg jump landing.
Muscles Mean ± StDev (rad/s2) Mean ± StDev (rad/s
2)
Vastus Medialis 2,118 ± 7,120b
Vastus Lateralis -39,009 ± 23,202,d Internal Rotation (+) 63,849 ± 24,448
Medial Hamstrings 12,914 ± 9,363a,b
Lateral Hamstrings 8,375 ± 4,957b,c
Medial Gastrocnemius -49,529 ± 31,987d External Rotation (-) -96,912 ± 21,378
Lateral Gastrocnemius 48,817 ± 46,778a
ANOVA identified a significant difference for the mean cumulative summation of the individual muscles (p < 0.001; n = 6). Symbols a,b,c, and d indicate Tukey’s adjusted post-hoc difference (α = 0.05) in mean cumulative summation between the individual muscles.
Muscles with the same letters are not significantly different from each other. Conversely, if muscles do not share a letter, the means are significantly different.

71
A comparison of the experimental and model computed GRFs data showed that while
there were slight deviations between the two, the model computed GRFs followed the
experimental GRFs reasonable well (Fig. 16).
Figure 16. Comparison of the model computed vertical ground reaction forces (black) and the
experimentally measured ground reaction forces (gray) for one participant during the weight-
acceptance phase of single-leg jump landing.
3.5 Discussion
The objective of this study was to assess the contribution of the muscles surrounding the
knee in the frontal, sagittal and transverse planes with particular focus determining the muscles
that accelerate the knee into adduction. The results determined that the medial gastrocnemius
was the strongest contributor to knee adduction with the vastus medialis also serving to strongly
resist knee abduction. Conversely, the lateral gastrocnemius functioned to abduct the knee;
however, the total adduction accelerations were greater than the abduction accelerations. The
medial and lateral gastrocnemii muscles displayed strong contributions to knee accelerations in
all three planes with the medial and lateral quadriceps muscles only exerting strong contributions

72
to knee extension in the sagittal plane. The large gastrocnemii contributions to knee
accelerations, specifically, in comparison to the hamstring muscles, supports the current ACL
research that suggests the gastrocnemii should be the muscles targeted for injury prevention
programs (Mokhtarzadeh et al., 2013; Podraza et al., 2010; Nyland et al., 2010).
Muscle imbalance is often associated with joint instability (Hewett et al, 2006; Markolf et
al., 1978; Solomonow et al., 1987). However, muscle imbalance is not always a negative event.
In the sagittal plane, the quadriceps contribution to knee extension is greater than the
gastrocnemii muscles contribution to knee flexion. Unfortunately, the ACL is at greater risk for
injury when the knee is extended. Alternatively, the frontal plane medial-lateral gastrocnemii
imbalance resulted in a net gain in adduction acceleration. And the quadriceps imbalance in the
transverse plane produced a net external rotation acceleration. The ACL is not known to be at
risk when the knee is adducted and externally rotated (Markolf et al., 1995; Fleming et al., 2001;
Shin et al., 2011; Withrow et al., 2006). The quadriceps to gastrocnemii muscle imbalance is the
imbalance with the greatest link to potential ACL injury (Boden et al., 2009; Podraza et al. 2010;
Mokhtarzadeh et al., 2013). The results from this study suggest that that an increase in
gastrocnemii force production has the best chance of contributing to knee flexion acceleration
and opposing the quadriceps dominance observed here that is often associated with ACL injury.
The objective of this study was to obtain additional insight into the causal relationship
between muscle forces and joint biomechanics specifically with respect to ACL injury risk.
Given that elevated knee abduction is often associated with increased ACL injury risk, the results
of this study have shown that ACL injury training prevention programs should focus on
strengthening the medial gastrocnemius muscle. Researchers have implemented balance,
plyometric, resistance and neuromuscular ACL injury training programs; yet, no one type has

73
stood out as being effective (Hewett et al., 1999; Mandelbaum et al., 2005; Steffen et al., 2008;
Wedderkopp et al., 2003). A study by Donnelly et al. (2012b) found that routine Australian
Rules Football training was more effective than Australian Rules Football training in conjunction
with balance and technique training when comparing peak internal-external rotation and knee
valgus moments during running and sidestepping tasks. This indicates that the training the
muscles obtain playing the sport is adequate as it does not increasing ACL injury risk. Australian
Rules Football is a sport that involves a lot of sidestepping and jumping tasks, which are
gastrocnemii dependent movements. Thus ACL injury training prevention programs should
focus on putting the athlete’s through a series sidestepping, jumping and other gastrocnemii
dominant based tasks under unanticipated conditions to improve gastrocnemii strength and
muscle activation patterns under game like conditions. While these tasks also involve the lateral
gastrocnemius, which was found to abduct the knee, the medial gastrocnemius is larger than the
lateral gastrocnemius and produces greater force which resulted in the net adduction acceleration
of the knee which is a goal of ACL injury training prevention programs.
Comparison of the GRFs showed that the model GRF did not perfectly match the
experimentally recorded GRFs. The reason for this difference can be attributed to limitations in
the foot-ground contact model. Foot compression manifests as vertical translational during the
impact phase of landing. Neither this translation nor slipping is accounted for in the foot-ground
contact model (Dorn et al., 2012). Despite the inability to account for these events in the model,
the model GRFs exhibited the same shape of the experimental GRFs and thus we believe that the
trends observed in the data are representative of muscle contributions during single-leg jump
landing.
74
Based on these results, the medial gastrocnemius may be the best muscle to target for
ACL injury prevention programs since it can generate a large enough acceleration to oppose knee
abduction and internal rotation. The lateral gastrocnemius is useful as a knee flexor and in this
capacity could potentially resist the anterior translation of the tibia; however, its role in abducting
the knee may diminish the significance of the formers contribution to lowering ACL injury risk.
Additionally, it was understandable that the hamstrings produced the smallest contributions to
knee accelerations in all three planes as they produced significantly smaller maximum forces
than the quadriceps and gastrocnemii muscles based on the CMC results from Chapter II. While
the hamstrings are knee flexors and should serve to oppose the quadriceps muscles, it appears
that increasing the gastrocnemii strength may have a greater effect and should be targeted in
future ACL training intervention programs.
75
3.6 References
Arnold, E.M., Ward, S.R., Lieber, R.L., Delp, S.L., 2010. A model of the lower limb for analysis
of human movement. Ann. Biomed. Eng. 38, 269-279.
Besier, T.F., Lloyd, D.G., Ackland, T.R., 2003. Muscle activation strategies at the knee during
running and cutting maneuvers. Med. Sci. Sports Exerc. 35, 119-127.
Boden, B. P., Torg, J. S., Knowles, S. B., Hewett, T.E., 2009. Video analysis of anterior Cruciate
ligament injury abnormalities in hip and ankle kinematics. Am. J. Sports Med., 37(2),
252-259.
Chappell, J. D., Limpisvasti, O., 2008. Effect of a neuromuscular training program on the
kinetics and kinematics of jumping tasks. The American journal of sports medicine, 6(6),
1081-1086.
Delp, S.L., Loan, J.P., Hoy, M.G., Zajac, F.E., Topp, E.L., Rosen, J.M., 1990. An interactive
graphics-based model of the lower extremity to study orthopaedic surgical procedures.
IEEE Trans. Biomed. Eng. 37, 757-767.
Delp, S.L., Anderson, F.C., Arnold, A.S., Loan, P., Habib, A., John, C.T., Guendelman, E.,
Thelen, D.G., 2007. OpenSim: open-source software to create and analyze dynamic
simulations of movement. IEEE Trans. Biomed. Eng. 54, 1940-1950.
Dempsey, A.R., Lloyd, D.G., Elliott, B.C., Steele, J.R., Munro, B.J., Russo, K.A., 2007. The
effect of technique change on knee loads during sidestep cutting. Medicine & Science in
Sports & Exercise 39(10), 1765-73.
Dempsey, A.R., Elliott, B.C., Munro, B.J. Steele, J.R. and Lloyd, D.G., 2012. Whole body
kinematics and knee moments that occur during an overhead catch and landing task in
sport. Clinical Biomechanics 27, 466-74.
Donnelly, C.J., Elliott, B.C., Ackland, T.R., Doyle, T.L., Beiser, T.F., Finch, C.F., Cochrane,
J.L., Dempsey, A.R., Lloyd, D.G., 2012a. An anterior cruciate ligament injury prevention
framework: incorporating the recent evidence. Res. Sports Med. 20, 239-262.
Donnelly, C.J., Elliott, B.C., Doyle, T.L.A., Finch, C.F., Dempsey, A.R., Lloyd, D.G., 2012b.
Changes in knee joint biomechanics following balance and technique training and a
season of Australian football. Br. J. Sports Med. 46, 917-922.
Donnelly, C.J., Lloyd, D.G., Elliott, B.C., Reinbolt, J.A., 2012c. Optimizing whole-body
kinematics to minimize valgus knee loading during sidestepping: implications for ACL
injury risk. J. Biomech. 45, 1491-1497.
Dorn, T. W., Lin, Y. C., Pandy, M. G., 2012. Estimates of muscle function in human gait depend
on how foot-ground contact is modelled. Computer methods in biomechanics and
biomedical engineering, 15(6), 657-668.
Fleming, B. C., Renstrom, P. A., Beynnon, B. D., Engstrom, B., Peura, G. D., Badger, G. J.,
Johnson, R. J., 2001. The effect of weightbearing and external loading on anterior
cruciate ligament strain. J. Biomech, 34(2), 163-170.
Hamner, S.R., Seth, A., Delp, S.L., 2010. Muscle contributions to propulsion and support during
running. J. Biomech. 43, 2709-2716.
Hewett, T. E., Myer, G. D., Ford, K. R., 2006. Anterior cruciate ligament injuries in female
athletes part 1, mechanisms and risk factors. The American journal of sports medicine,
34(2), 299-311.
76
Hewett, T. E., Lindenfeld, T. N., Riccobene, J. V., Noyes, F. R., 1999. The Effect of
Neuromuscular Training on the Incidence of Knee Injury in Female Athletes A
Prospective Study. The American Journal of Sports Medicine, 27(6), 699-706.
Huston, L. J., Wojtys, E. M., 1996. Neuromuscular performance characteristics in elite female
athletes. The American journal of sports medicine, 24(4), 427-436.
Landry, S. C., McKean, K. A., Hubley-Kozey, C. L., Stanish, W. D., Deluzio, K. J., 2009.
Gender differences exist in neuromuscular control patterns during the pre-contact and
early stance phase of an unanticipated side-cut and cross-cut maneuver in 15–18 years
old adolescent soccer players. Journal of Electromyography and Kinesiology, 19(5),
e370-e379.
Landry, S. C., McKean, K. A., Hubley-Kozey, C. L., Stanish, W. D., Deluzio, K. J., 2007.
Neuromuscular and lower limb biomechanical differences exist between male and female
elite adolescent soccer players during an unanticipated side-cut maneuver. The American
journal of sports medicine, 35(11), 1888-1900.
Lin, Y. C., Kim, H. J., Pandy, M. G., 2011. A computationally efficient method for assessing
muscle function during human locomotion. International Journal for Numerical Methods
in Biomedical Engineering, 27(3), 436-449.
Liu, M. Q., Anderson, F. C., Schwartz, M. H., Delp, S. L., 2008. Muscle contributions to support
and progression over a range of walking speeds. J. Biomech. 41(15), 3243-3252.
Liu, M. Q., Anderson, F. C., Pandy, M. G., Delp, S. L.,2006. Muscles that support the body also
modulate forward progression during walking. J. Biomech., 39(14), 2623-2630.
Mandelbaum, B. R., Silvers, H. J., Watanabe, D. S., Knarr, J. F., Thomas, S. D., Griffin, L. Y.,
Kirkendall, D. T., Garrett, W., 2005. Effectiveness of a neuromuscular and
proprioceptive training program in preventing anterior cruciate ligament injuries in
female athletes 2-year follow-up. The american journal of sports medicine, 33(7), 1003-
1010.
Markolf, K.L., Burchfield, D.M., Shapiro, M.M., Shepard, M.F., Finerman, G.A., Slauterbeck,
J.L., 1995. Combined knee loading states generate high anterior cruciate ligament forces.
J. Orth. Res. 13, 930-935.
Markolf, K. L., Graff-Redford A, Amstutz H.C., 1978. In vivo knee stability: aquantitative
assessment using an instrumented clinical testing apparatus.J Bone Joint Surg Am. 60,
664-674.
Mokhtarzadeh, H., Yeow, C.H., Goh, J.C.H., Oetomo, D., Malekipour, F., Lee, P.V.S., 2013.
Contributions of the Soleus and Gastrocnemius muscles to the anterior cruciate ligament
loading during single-leg landing. J. Biomech. 46, 1913-1920.
Nyland, J., Klein, S., Caborn, D.N., 2010. Lower extremity compensatory neuromuscular and
biomechanical adaptations 2 to 11 years after anterior cruciate ligament reconstruction.
Arthroscopy 26, 1212-1225.
Podraza, J.T., White, S.C., 2010. Effect of knee flexion angle on ground reaction forces, knee
moments and muscle co-contraction during an impact-like deceleration landing:
implications for the non-contact mechanism of ACL injury. Knee 17, 291-295.
Seedhom, B.B., Longton, E.B., Wright, V., Dowson, D., 1972. Dimensions of the Knee.
Radiographic autopsy study sizes require knee prosthesis. Ann. Rheum. Dis. 31, 54-58.
Shin, C. S., Chaudhari, A. M., Andriacchi, T. P., 2011. Valgus plus internal rotation moments
increase anterior cruciate ligament strain more than either alone. Med. Sci. Sports Exerc,
43(8), 1484-1491.

77
Solomonow, M., Baratta, R., Zhou, B. H., Shoji, H., Bose, W., Beck, C., D'ambrosia, R.,1987.
The synergistic action of the anterior cruciate ligament and thigh muscles in maintaining
joint stability. The American journal of sports medicine, 15(3), 207-213.
Steffen, K., Myklebust, G., Olsen, O. E., Holme, I., Bahr, R., 2008. Preventing injuries in female
youth football – a cluster-randomized controlled trial. Scandinavian journal of medicine
& science in sports, 18(5), 605-614.
Thelen, D.G., Anderson, F.C., Delp, S.L., 2003. Generating dynamic simulations of movement
using computed muscle control. J. Biomech. 36, 321-328.
Thelen, D.G., Anderson, F.C., 2006. Using computed muscle control to generate forward
dynamic simulations of human walking from experimental data. J. Biomech. 39, 1107-
1115.
Utturkar, G. M., Irribarra, L. A., Taylor, K. A., Spritzer, C. E., Taylor, D. C., Garrett, W. E.,
DeFrate, L. E., 2013. The effects of a valgus collapse knee position on in vivo ACL
elongation. Annals of biomedical engineering, 41(1), 123-130.
Wedderkopp, N., Kaltoft, M., Holm, R., Froberg, K., 2003. Comparison of two intervention
programmes in young female players in European handball – with and without ankle disc.
Scandinavian journal of medicine & science in sports. 13(6), 371-375.
Withrow, T. J., Huston, L. J., Wojtys, E. M., Ashton-Miller, J. A., 2006. The effect of an
impulsive knee valgus moment on in vitro relative ACL strain during a simulated jump
landing. Clin. Biomech., 21(9), 977-983.
Zhao, D., Banks, S.A., D'Lima, D.D., Colwell, C.W., Jr., Fregly, B.J., 2007. In vivo medial and
lateral tibial loads during dynamic and high flexion activities. J. Orthop. Res. 25, 593-
602.

78
3.7 Appendix
3.7.1 Ground Reaction Force Decomposition
The Moore-Penrose pseudo-inverse method was employed to decompose the GRF. The
Moore-Penrose pseudo-inverse method is used in cases where there are multiple solutions to a
problem which can arise in an overdetermined system (Lin et al., 2011). This technique uses a
weighted least-squares optimization algorithm to compute the individual muscle contribution
during the desired task (Lin et al., 2011; Dorn et al., 2012). Equations 3.2-3.4 are involved with
the construction of the system matrices and calculating the inverse of these matrices which yield
the computed generalized joint accelerations q .
(3.2)
0
0
0 13
1
33
3
fx
ext
ffx
fxn
T KW
F
F
q
W
E
EW
M
(3.3) bF
qA
ext
(3.4) bAF
q
ext
M = mass matrix
E = jacobian matrix that maps the external foot contact point forces
extF = external foot contact point forces
q = generalized joint accelerations
W = foot contact point weighting matrix
K = foot point constraints
3.7.2 Foot-Ground Contact Model
Lin et al. (2011) and Dorn et al. (2012) modeled the foot-ground interaction using a five
contact point foot-ground model- two contact points were at the medial and lateral sides of the

79
mid calcaneus (heel), two at the first and fifth metatarsals junctions and one at the toe (Fig. 17).
Each contact point was modeled as a rigid contact (i.e. weld joint) leaving the foot unable to
accelerate in any direction. To eliminate these discontinuities that would occur when the foot is
not in contact with the ground Dorn et al. (2011) utilized a diagonal weight matrix that applied a
linear (foot) acceleration constraint to each contact point. These weightings varied from 0
(unconstrained) to 1 (fully constrained, rigidly constrained) based on the contact points location
to the center of pressure (CoP) (Dorn et al., 2012).
Figure 17. Five ground contact points (per foot) are defined by markers in OpenSim (Lin et al.,
2011).
The four phases encountered in this foot-ground contact model were model as a function of CoP
location. Phase 1 begins when the CoP lied behind the heel of the foot (i.e. behind A B heel axis).
During this phase the AB axis was modeled as a hinge joint and those points were fully
constrained. Phase 2 starts when the CoP lies closer to the heel axis within the posterior half of
the ABCD section of the foot. During this period, the AB points were again fully constrained
while the φ weighting function (Eq. 3.5) was applied to the CD points to model that transition
from Phase 1 to Phase 2. When Phase 3 commences, the CoP lies anteriorly in the ABCD section
closer to the fore-foot. Here 2(1-φ) was used to model the transition to Phase 3 on the AB points
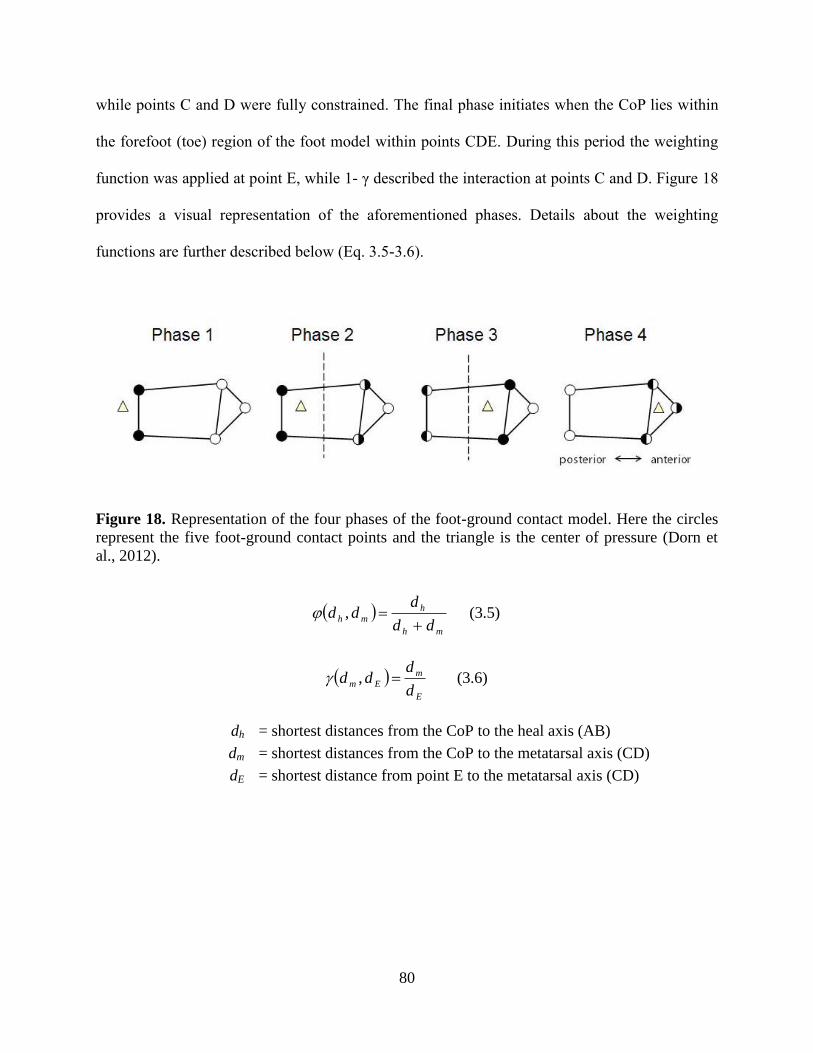
80
while points C and D were fully constrained. The final phase initiates when the CoP lies within
the forefoot (toe) region of the foot model within points CDE. During this period the weighting
function was applied at point E, while 1- γ described the interaction at points C and D. Figure 18
provides a visual representation of the aforementioned phases. Details about the weighting
functions are further described below (Eq. 3.5-3.6).
Figure 18. Representation of the four phases of the foot-ground contact model. Here the circles
represent the five foot-ground contact points and the triangle is the center of pressure (Dorn et
al., 2012).
(3.5) ,mh
h
mhdd
ddd
(3.6) ,E
m
Emd
ddd
dh = shortest distances from the CoP to the heal axis (AB)
dm = shortest distances from the CoP to the metatarsal axis (CD)
dE = shortest distance from point E to the metatarsal axis (CD)

81
CHAPTER IV
DYNAMIC KNEE STABILITY AND PRINCIPAL COMPONENT
ANALYSIS: METHODOLOGY FOR ASSESSING ANTERIOR
CRUCIATE LIGAMENT INJURY RISK
82
4.1 Abstract
Anterior cruciate ligament (ACL) injuries are common sports injuries, costing
the US economy roughly $1.5 billion per year. To reduce this burden, researchers generally
analyze an athlete’s joint motion and muscle activation during movements where non-contact
ACL injuries have been shown to occur to better understand the underlying mechanisms of ACL
injury. To assess an individual’s dynamic joint stability during the weight-acceptance phase of
single-leg jump landing, Nyquist and Bode stability criteria were applied to quantify frontal
plane knee stability. Principal component analysis (PCA), a statistical tool that analyzes multiple
waveforms to determine the source of variability between them, was used to analyze an athlete’s
joint motions and muscle activation waveform patterns to determine if individuals with stable,
marginally stable and unstable joint biomechanics adopted different motor recruitment strategies.
The unstable group’s maximum knee abduction moments were significantly greater than the
marginally stable and stable maximum knee abduction moments (p < 0.001). Additionally, a
frequency analysis quantified joint oscillations that were found to be associated with joint
instability. The PCA found that the unstable group muscle activations reported larger medial-
lateral and knee flexor-extensor muscle activation imbalances than the stable group. These
findings provided added insight into how muscles are used to support the knee during single-leg
landing and helped endorse the use of the Nyquist and Bode stability criteria and PCA as a
unique methodology for both screening individuals for ACL injury and designing muscle
targeted ACL injury prevention protocols to mitigate ACL injury risk.

83
4.2 Introduction
Anterior cruciate ligament (ACL) injuries are a common sports injury occurring in one in
every 3,000 individuals (Boden et al, 2000). An ACL injury results in a loss of (translational and
rotational) joint stability that is critical to the successful execution of dynamic movements like
single-leg jump landing; however, appropriate muscle activation has the capacity to reduce the
loads exerted on the ACL while supporting and stabilizing the knee (Donnelly et al, 2012; Lam
et al., 2009; Veltri et al., 1995). Researchers have implemented injury prevention protocols that
focused on altering muscle function; yet ACL injury rates continue to rise (Donnelly et al. 2012).
Therefore a better understanding of the relationship between joint stability and muscle function
is needed.
Dynamic knee stability assessments are used to determine an athlete’s return to sport post
ACL injury but dynamic stability assessments may be equally effective pre injury as the majority
of ACL injuries occur during dynamic movement (Lam et al., 2009). Since dynamic knee
stability is used as a metric to assess an individual’s ability to return to sport, it is possible that
researchers could develop a new metric to quantify dynamic knee stability to help screen
individuals for potential ACL injury risk. In the field of controls, stability is a quantifiable
measurement of the performance of dynamic systems where a stable system has a bounded input
and produces a bounded output (Dorf and Bishop, 2008). Nyquist and Bode stability criteria are
techniques that provide graphical and quantitative measures of dynamic stability (Dorf and
Bishop, 2008). These techniques have proven effective in assessing postural and aircraft stability
and were used to assess knee stability and potential ACL injury risk (Dorf and Bishop, 2008;
Haggerty et al., 2012; Hur et al. 2010; Sun et al., 2008). The interaction between the
musculoskeletal and neuromuscular systems can be modeled as a feedback control loop (Park et

84
al., 2004). Here the joint motion serves as the system input where the central nervous system
detects disturbances that elicit a response from muscles to stabilize the system. Once stability
groups are defined, we can address the systems response to joint instability by identifying how
muscle activation strategies vary amongst at-risk individuals.
Principal component analysis (PCA) is a valuable statistical analysis tool used to detect
the source of variability within a dataset (Daffertshofer et al, 2004). This method has been
successfully applied in clinical settings to 1) identifying differences in lifting kinematics and
kinetics between healthy individuals and lower back pain populations; 2) distinguishing between
frontal plane kinetics of male and female subjects during unanticipated cutting maneuvers; and
3) assessing the success of two total hip arthroplasty surgical approaches in restoring the normal
gait patterns post-surgery (Mantovani et al., 2012; O’Connor et al., 2009; Wrigley et al., 2006).
The success of PCA in these clinical applications provides a rationale for its use in identifying
specific muscle recruitment strategies specific to populations with stable, marginally stable and
unstable joint biomechanics.
This study employs classical control stability techniques along with PCA to quantify
dynamic joint stability and associated muscle function in individuals. This study has two
objectives. The first is to use Nyyquist and Bode stability criteria to identify individuals at
varying risk of ACL injury based on their dynamic knee stability. The second is determine
muscle activation strategies distinct to individuals with stable, marginally stable and unstable
joint biomechanics during the WA phase of single-leg jump landing. It is hypothesized that
unstable individuals will adopt a balanced co-contraction between the medial and lateral vasti,
hamstring and gastrocnemii muscles compared to the marginally stable and unstable groups. The
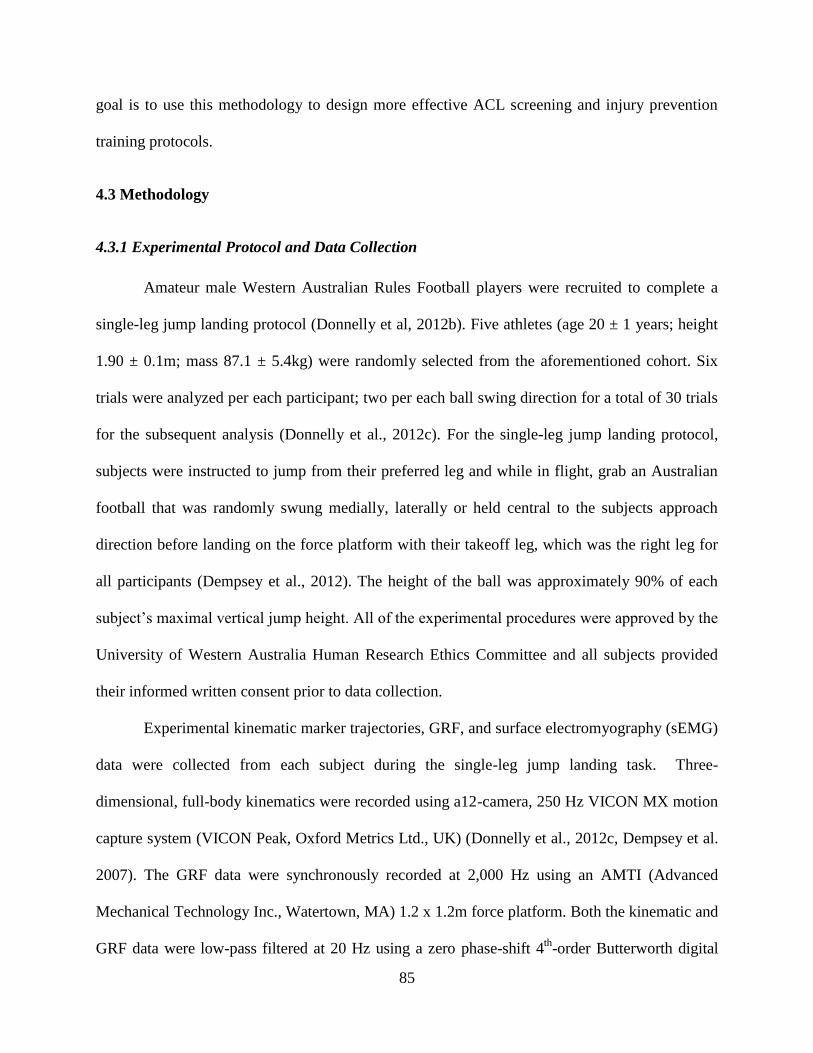
85
goal is to use this methodology to design more effective ACL screening and injury prevention
training protocols.
4.3 Methodology
4.3.1 Experimental Protocol and Data Collection
Amateur male Western Australian Rules Football players were recruited to complete a
single-leg jump landing protocol (Donnelly et al, 2012b). Five athletes (age 20 ± 1 years; height
1.90 ± 0.1m; mass 87.1 ± 5.4kg) were randomly selected from the aforementioned cohort. Six
trials were analyzed per each participant; two per each ball swing direction for a total of 30 trials
for the subsequent analysis (Donnelly et al., 2012c). For the single-leg jump landing protocol,
subjects were instructed to jump from their preferred leg and while in flight, grab an Australian
football that was randomly swung medially, laterally or held central to the subjects approach
direction before landing on the force platform with their takeoff leg, which was the right leg for
all participants (Dempsey et al., 2012). The height of the ball was approximately 90% of each
subject’s maximal vertical jump height. All of the experimental procedures were approved by the
University of Western Australia Human Research Ethics Committee and all subjects provided
their informed written consent prior to data collection.
Experimental kinematic marker trajectories, GRF, and surface electromyography (sEMG)
data were collected from each subject during the single-leg jump landing task. Three-
dimensional, full-body kinematics were recorded using a12-camera, 250 Hz VICON MX motion
capture system (VICON Peak, Oxford Metrics Ltd., UK) (Donnelly et al., 2012c, Dempsey et al.
2007). The GRF data were synchronously recorded at 2,000 Hz using an AMTI (Advanced
Mechanical Technology Inc., Watertown, MA) 1.2 x 1.2m force platform. Both the kinematic and
GRF data were low-pass filtered at 20 Hz using a zero phase-shift 4th
-order Butterworth digital
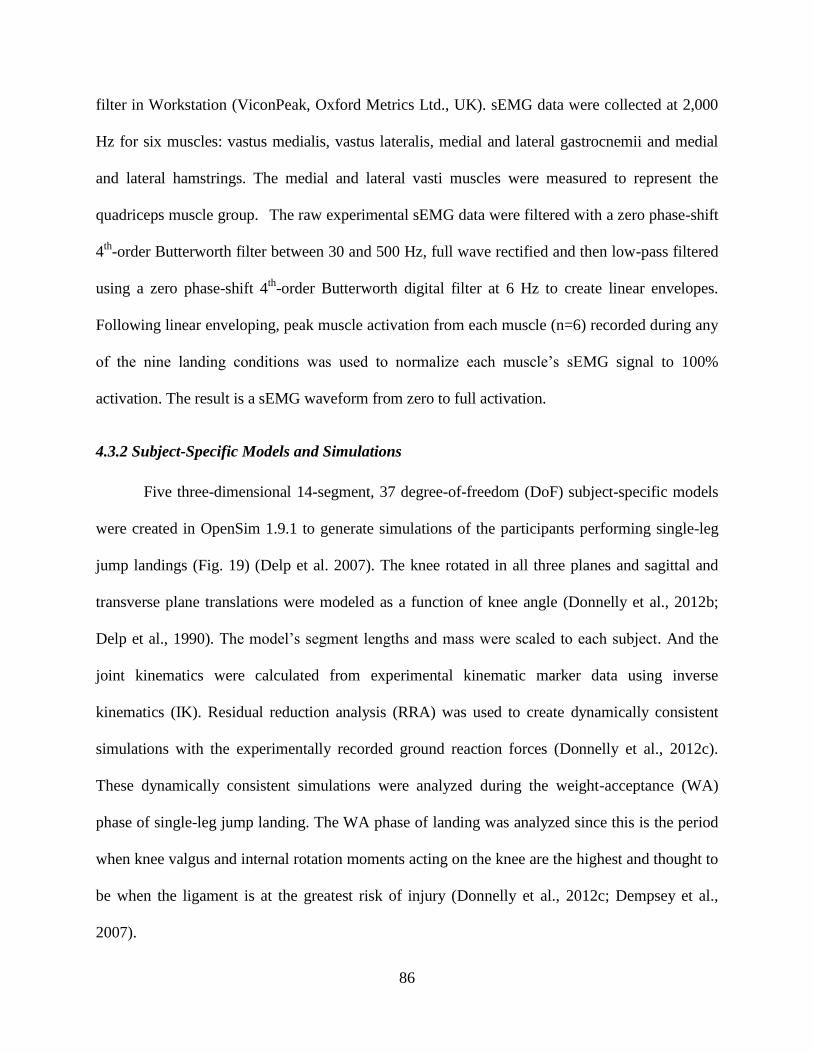
86
filter in Workstation (ViconPeak, Oxford Metrics Ltd., UK). sEMG data were collected at 2,000
Hz for six muscles: vastus medialis, vastus lateralis, medial and lateral gastrocnemii and medial
and lateral hamstrings. The medial and lateral vasti muscles were measured to represent the
quadriceps muscle group. The raw experimental sEMG data were filtered with a zero phase-shift
4th
-order Butterworth filter between 30 and 500 Hz, full wave rectified and then low-pass filtered
using a zero phase-shift 4th
-order Butterworth digital filter at 6 Hz to create linear envelopes.
Following linear enveloping, peak muscle activation from each muscle (n=6) recorded during any
of the nine landing conditions was used to normalize each muscle’s sEMG signal to 100%
activation. The result is a sEMG waveform from zero to full activation.
4.3.2 Subject-Specific Models and Simulations
Five three-dimensional 14-segment, 37 degree-of-freedom (DoF) subject-specific models
were created in OpenSim 1.9.1 to generate simulations of the participants performing single-leg
jump landings (Fig. 19) (Delp et al. 2007). The knee rotated in all three planes and sagittal and
transverse plane translations were modeled as a function of knee angle (Donnelly et al., 2012b;
Delp et al., 1990). The model’s segment lengths and mass were scaled to each subject. And the
joint kinematics were calculated from experimental kinematic marker data using inverse
kinematics (IK). Residual reduction analysis (RRA) was used to create dynamically consistent
simulations with the experimentally recorded ground reaction forces (Donnelly et al., 2012c).
These dynamically consistent simulations were analyzed during the weight-acceptance (WA)
phase of single-leg jump landing. The WA phase of landing was analyzed since this is the period
when knee valgus and internal rotation moments acting on the knee are the highest and thought to
be when the ligament is at the greatest risk of injury (Donnelly et al., 2012c; Dempsey et al.,
2007).
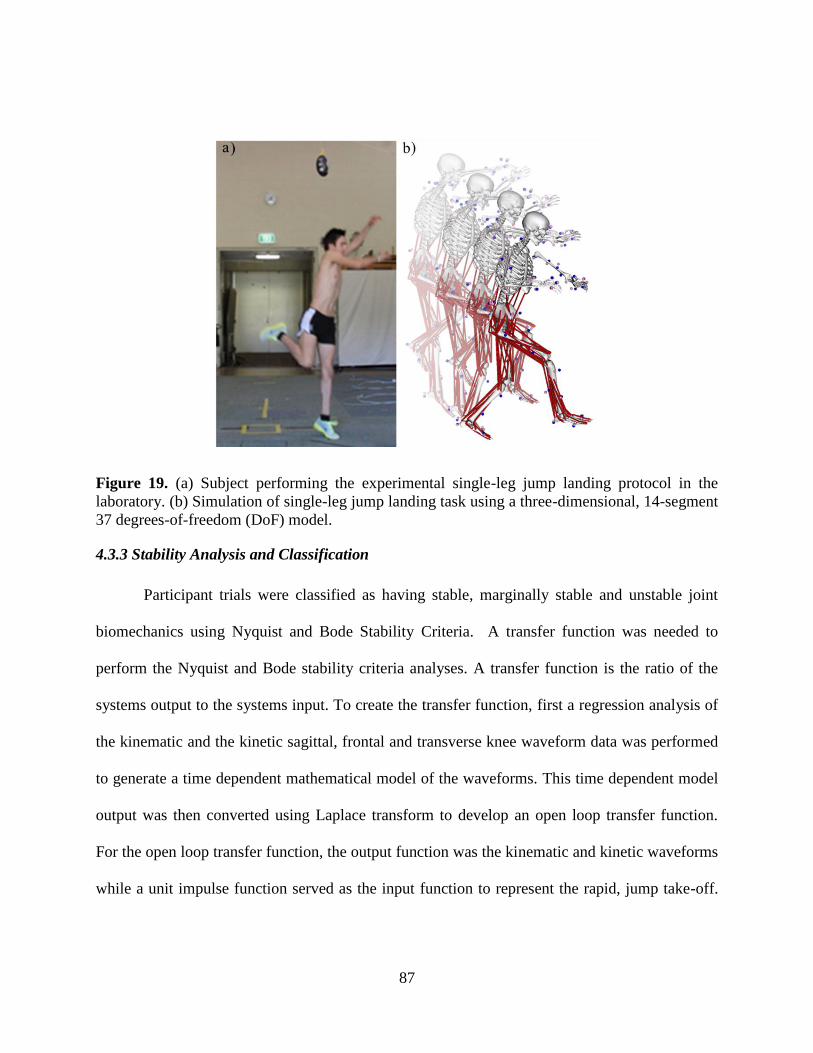
87
Figure 19. (a) Subject performing the experimental single-leg jump landing protocol in the
laboratory. (b) Simulation of single-leg jump landing task using a three-dimensional, 14-segment
37 degrees-of-freedom (DoF) model.
4.3.3 Stability Analysis and Classification
Participant trials were classified as having stable, marginally stable and unstable joint
biomechanics using Nyquist and Bode Stability Criteria. A transfer function was needed to
perform the Nyquist and Bode stability criteria analyses. A transfer function is the ratio of the
systems output to the systems input. To create the transfer function, first a regression analysis of
the kinematic and the kinetic sagittal, frontal and transverse knee waveform data was performed
to generate a time dependent mathematical model of the waveforms. This time dependent model
output was then converted using Laplace transform to develop an open loop transfer function.
For the open loop transfer function, the output function was the kinematic and kinetic waveforms
while a unit impulse function served as the input function to represent the rapid, jump take-off.
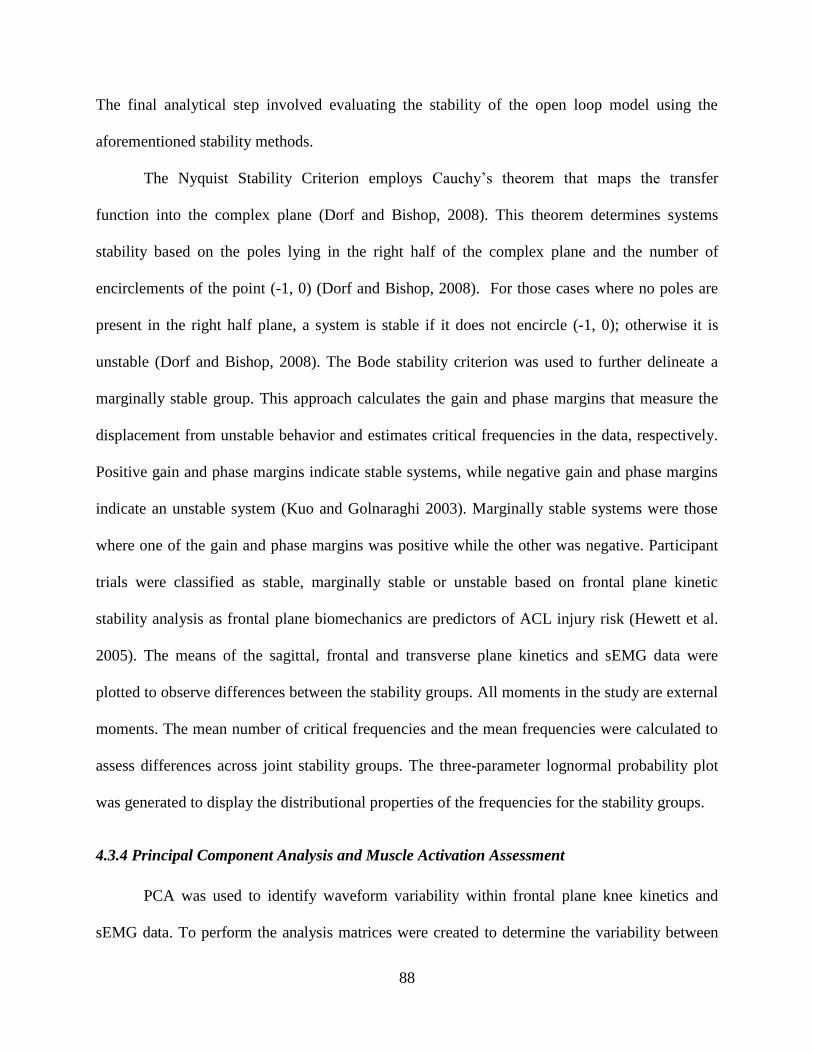
88
The final analytical step involved evaluating the stability of the open loop model using the
aforementioned stability methods.
The Nyquist Stability Criterion employs Cauchy’s theorem that maps the transfer
function into the complex plane (Dorf and Bishop, 2008). This theorem determines systems
stability based on the poles lying in the right half of the complex plane and the number of
encirclements of the point (-1, 0) (Dorf and Bishop, 2008). For those cases where no poles are
present in the right half plane, a system is stable if it does not encircle (-1, 0); otherwise it is
unstable (Dorf and Bishop, 2008). The Bode stability criterion was used to further delineate a
marginally stable group. This approach calculates the gain and phase margins that measure the
displacement from unstable behavior and estimates critical frequencies in the data, respectively.
Positive gain and phase margins indicate stable systems, while negative gain and phase margins
indicate an unstable system (Kuo and Golnaraghi 2003). Marginally stable systems were those
where one of the gain and phase margins was positive while the other was negative. Participant
trials were classified as stable, marginally stable or unstable based on frontal plane kinetic
stability analysis as frontal plane biomechanics are predictors of ACL injury risk (Hewett et al.
2005). The means of the sagittal, frontal and transverse plane kinetics and sEMG data were
plotted to observe differences between the stability groups. All moments in the study are external
moments. The mean number of critical frequencies and the mean frequencies were calculated to
assess differences across joint stability groups. The three-parameter lognormal probability plot
was generated to display the distributional properties of the frequencies for the stability groups.
4.3.4 Principal Component Analysis and Muscle Activation Assessment
PCA was used to identify waveform variability within frontal plane knee kinetics and
sEMG data. To perform the analysis matrices were created to determine the variability between
89
the stability groups amongst the aforementioned variables. In these matrices the rows were time
normalized to 101 points and the columns were of the kinetic and sEMG variables for the stable,
marginally stable, and unstable groups.
First the mean was subtracted from each observation for each variable. Next, the
covariance matrix was calculated from which the eigenvalue-eigenvector pairs were derived.
These eigenvalue-eigenvector pairs represent the PC loadings and principal components (PCs);
respectively. The PCs were placed in order from highest to lowest based on their associated
loadings. PC 1 represented the PC with the largest associated loading that accounted for the
greatest percentage of variance in the data. The first three PCs for each variable were assessed to
ensure that a minimum of 90% of the variance was explained with those PCs while also ensuring
a consistent comparison across groups (Jolliffe 2002). The PCs generated represent the data in the
new rotated space (Jolliffe 2002). These PCs are then used to observe the variations in the data
(Lee et al., 2010). Principal components for stable, marginally stable and unstable frontal plane
knee kinetics and sEMG data were plotted against each other to assess differences in amplitude,
phase shift and oscillatory behavior between the biomechanical waveforms. The stability and
PCA analyses were performed using Matlab (MATLAB R2012a, The MathWorks, Inc., Natick
Massachusetts, USA).
A one-way ANOVA was performed to compare mean joint and sEMG data maximums
and end of WA values across all three stability groups. A Fisher post-hoc analysis was conducted
to determine if observed differences were significant (α = 0.05). The aforementioned analyses
were performed in Minitab.
90
4.4 Results
Three participant trials were deemed to have stable frontal plane joint kinetics while
seventeen and ten were found to have marginally stable and unstable kinetics, respectively. In the
frontal plane, the unstable groups’ maximum abduction moment (1.74±0.82Nm/kg) was
significantly greater than the stable (0.48±0.35Nm/kg) and marginally stable groups
(1.20±0.53Nm/kg) (Fig. 20, Table 10). The stable group exhibited a consistently larger flexion
angle than the unstable group throughout the WA phase. In the transverse plane knee kinematic
deviations were largest at the beginning of WA but dropped to 5.9° at the end of WA.
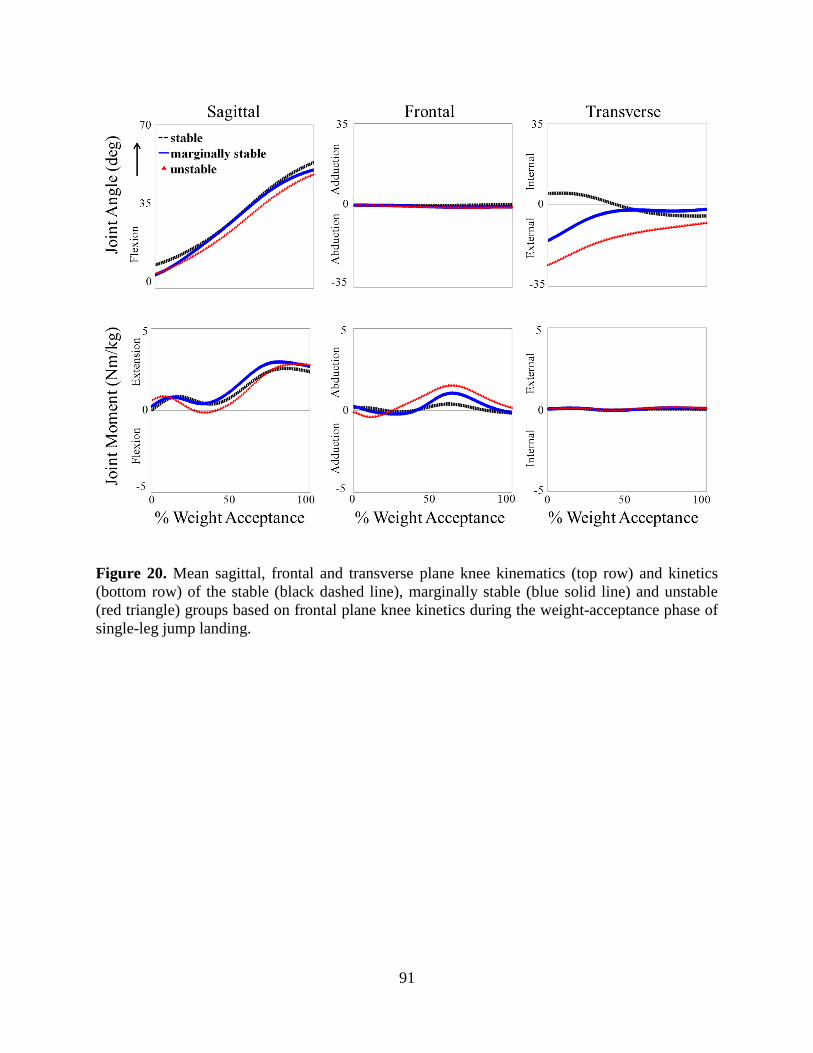
91
Figure 20. Mean sagittal, frontal and transverse plane knee kinematics (top row) and kinetics
(bottom row) of the stable (black dashed line), marginally stable (blue solid line) and unstable
(red triangle) groups based on frontal plane knee kinetics during the weight-acceptance phase of
single-leg jump landing.

92
Table 10. Comparison of sagittal, frontal and transverse plane kinetics for the stable, marginally
stable and unstable participant groups.
Stable Marginally Stable Unstable
Knee extension/flexion (Nm/kg)
Maximum extension (+) 2.71±0.36 3.09±0.60 2.93±0.52
Maximum flexion (-) -0.09±0.35 -0.16±0.54 -0.40±0.58
End WA of phase 2.36±0.68 2.68±0.65 2.78±0.51
Knee abduction/adduction (Nm/kg)
Maximum abduction (+) 0.48±0.35a 1.20±0.53
a 1.74±0.82
b
Maximum adduction (-) -0.34±0.07 -0.52±0.40 -050±0.40
End WA of phase -0.16±0.18 -0.12±0.37 0.17±0.52
Knee internal/external rotation (Nm/kg)
Maximum external rotation (+) 0.11±0.04 0.15±0.10 0.20±0.10
Maximum internal rotation (-) -0.07±0.09 -0.08±0.09 -0.04±0.06
End WA of phase 0.19±0.05 0.04±0.13 0.10±0.10 ANOVA identified a significant difference for the maximum and end of WA phase values of the individual knee kinetics (p < 0.001). Symbols a,b indicate Fisher’s adjusted post-hoc difference (α = 0.05) in mean kinetics estimates between the stability groups. Estimates with the
same letters are not significantly different from each other. Conversely, if estimates do not share a letter, the means are significantly different.
PC 1 detected the same amplitude differences in frontal plane kinetics that were also
observed when comparing the mean maximum abduction moments (Table 10) as the unstable
group reported a maximum abduction moment almost 5 times larger than the stable group (Fig.
21). PC 1 also exposed timing differences between the stability groups as the marginally stable
and unstable groups reached maximum adduction moment earlier than the stable group but
generated a delayed maximum abduction moment compared to the stable group. For PC 2 the
stable group exhibited minimal oscillatory behavior compared to the two other stability groups
having an overall decreasing slope (Fig. 21). The marginally stable and unstable groups both
displayed strong oscillatory behavior of seemingly similar amplitudes; however, their respective
waveforms were phase shifted 180°. PC 3 revealed oscillatory behavior in all three stability
groups with delayed peak moments for the stable group (Fig. 21).

93
Figure 21. Comparison the first three principal components (PCs) for the stable (black dashed
line), marginally stable (blue solid line) and unstable (red triangles) groups during the weight-
acceptance phase of single-leg jump landing.
The mean number of frequencies for the stable, marginally stable and unstable groups
was 9.7 ± 1.5 rad/s, 10.3 ± 1.3 rad/s and 10.8 ± 1.5 rad/s, respectively (Table 11). And the mean
frequency range for the stable group was 50.9 ± 27.5 rad/s, for the marginally stable group was
65.8 ± 40.0 rad/s and the unstable group was 58.9 ± 12.4 rad/s. The aforementioned differences
were not significant. The frequencies for the three stability groups follow a three-parameter
lognormal distribution with a scale parameter of approximately 1.2 (Table 12). The lower and
upper tail values for the marginally stable and unstable groups deviated from the fitted
distribution line and fall outside of the 95% confidence bounds (Fig. 22, Table 12).
Table 11. Comparison of the number of frequencies and frequency range for the stable,
marginally stable and unstable participant groups computed from the stability frequency analysis.
Frequency Stable Marginally Stable Unstable
Number of Frequencies 9.7 ± 1.5 10.3 ± 1.3 10.8 ± 1.5
Range 50.9 ± 27.5 65.8 ± 40.0 58.9 ± 12.4
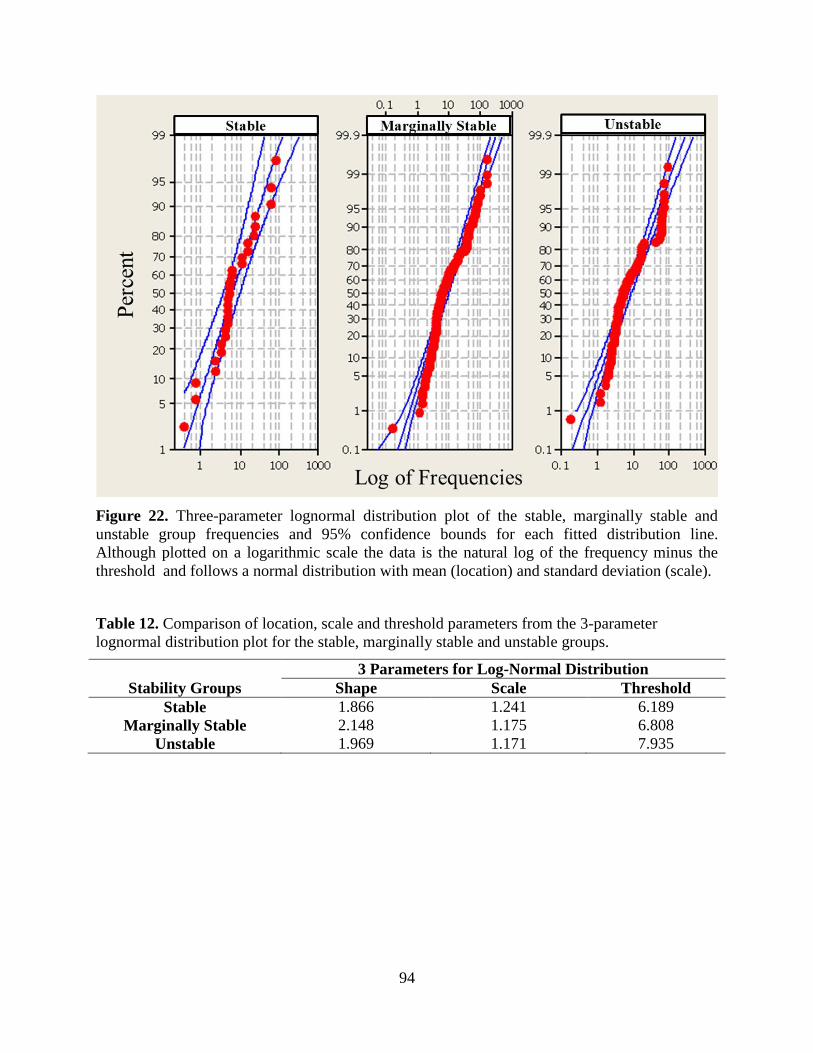
94
Figure 22. Three-parameter lognormal distribution plot of the stable, marginally stable and
unstable group frequencies and 95% confidence bounds for each fitted distribution line.
Although plotted on a logarithmic scale the data is the natural log of the frequency minus the
threshold and follows a normal distribution with mean (location) and standard deviation (scale).
Table 12. Comparison of location, scale and threshold parameters from the 3-parameter
lognormal distribution plot for the stable, marginally stable and unstable groups.
3 Parameters for Log-Normal Distribution
Stability Groups Shape Scale Threshold
Stable 1.866 1.241 6.189
Marginally Stable 2.148 1.175 6.808
Unstable 1.969 1.171 7.935

95
Mean normalized muscle activation of medial and lateral vasti, hamstring and
gastrocnemii muscles showed similar activation patterns across all stability groups (Fig. 23). The
medial and lateral gastrocnemii produced the strongest activation at initial contact while the
medial and lateral vasti had the greatest activation at the end of WA (Table 13). The medial and
lateral hamstrings produced slightly lower activations compared to the vasti and gastrocnemii
muscles. The most observable difference in muscle activation among stability groups was that
the vastus lateralis produced stronger activations than vastus medialis in the stable group while
the reverse was true for the marginally stable and unstable groups.
Figure 23. Comparison of the mean experimental surface electromyography (sEMG) data across
the stable, marginally stable and unstable groups for the six muscles crossing the knee during the
weight-acceptance phase of single-leg jump landing. Stability was based on frontal plane knee
kinetics. Experimental filtered sEMG data for the vastus medialis, vastus lateralis, medial
hamstring, lateral hamstrings, medial gastrocnemius and lateral gastrocnemius are individually
normalized to the maximum recorded signal of each muscle over one of the landing trials.
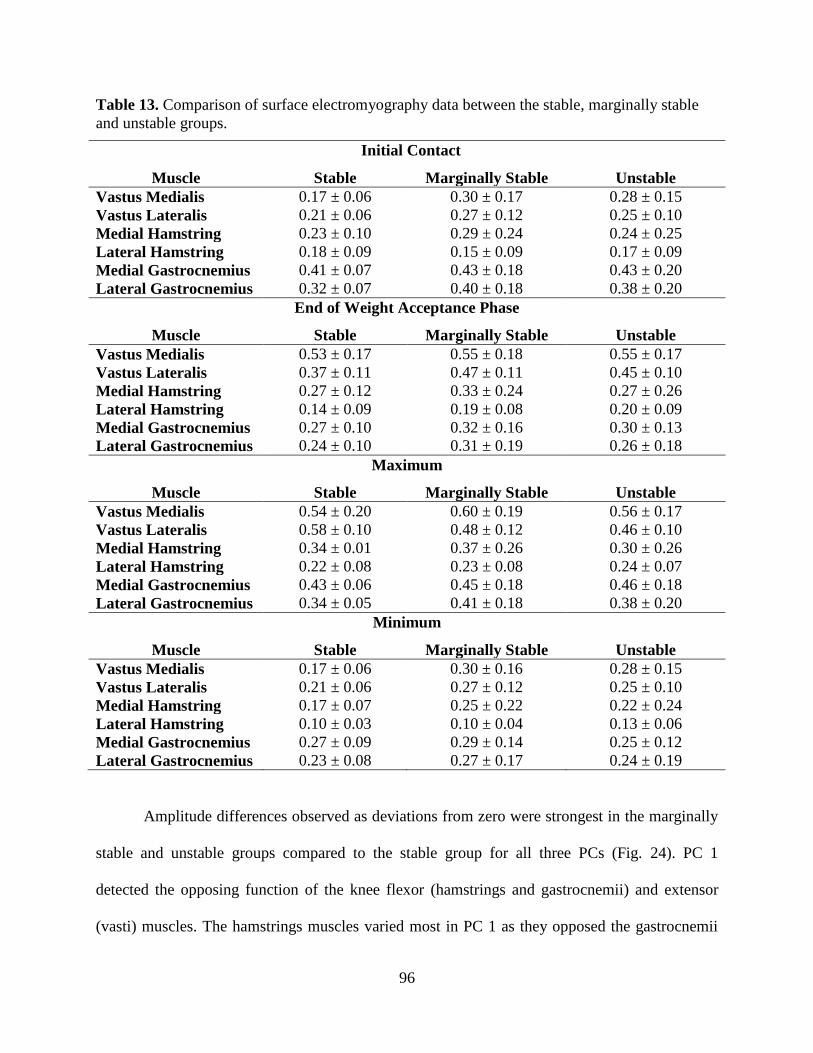
96
Table 13. Comparison of surface electromyography data between the stable, marginally stable
and unstable groups.
Initial Contact
Muscle Stable Marginally Stable Unstable
Vastus Medialis 0.17 ± 0.06 0.30 ± 0.17 0.28 ± 0.15
Vastus Lateralis 0.21 ± 0.06 0.27 ± 0.12 0.25 ± 0.10
Medial Hamstring 0.23 ± 0.10 0.29 ± 0.24 0.24 ± 0.25
Lateral Hamstring 0.18 ± 0.09 0.15 ± 0.09 0.17 ± 0.09
Medial Gastrocnemius 0.41 ± 0.07 0.43 ± 0.18 0.43 ± 0.20
Lateral Gastrocnemius 0.32 ± 0.07 0.40 ± 0.18 0.38 ± 0.20
End of Weight Acceptance Phase
Muscle Stable Marginally Stable Unstable
Vastus Medialis 0.53 ± 0.17 0.55 ± 0.18 0.55 ± 0.17
Vastus Lateralis 0.37 ± 0.11 0.47 ± 0.11 0.45 ± 0.10
Medial Hamstring 0.27 ± 0.12 0.33 ± 0.24 0.27 ± 0.26
Lateral Hamstring 0.14 ± 0.09 0.19 ± 0.08 0.20 ± 0.09
Medial Gastrocnemius 0.27 ± 0.10 0.32 ± 0.16 0.30 ± 0.13
Lateral Gastrocnemius 0.24 ± 0.10 0.31 ± 0.19 0.26 ± 0.18
Maximum
Muscle Stable Marginally Stable Unstable
Vastus Medialis 0.54 ± 0.20 0.60 ± 0.19 0.56 ± 0.17
Vastus Lateralis 0.58 ± 0.10 0.48 ± 0.12 0.46 ± 0.10
Medial Hamstring 0.34 ± 0.01 0.37 ± 0.26 0.30 ± 0.26
Lateral Hamstring 0.22 ± 0.08 0.23 ± 0.08 0.24 ± 0.07
Medial Gastrocnemius 0.43 ± 0.06 0.45 ± 0.18 0.46 ± 0.18
Lateral Gastrocnemius 0.34 ± 0.05 0.41 ± 0.18 0.38 ± 0.20
Minimum
Muscle Stable Marginally Stable Unstable
Vastus Medialis 0.17 ± 0.06 0.30 ± 0.16 0.28 ± 0.15
Vastus Lateralis 0.21 ± 0.06 0.27 ± 0.12 0.25 ± 0.10
Medial Hamstring 0.17 ± 0.07 0.25 ± 0.22 0.22 ± 0.24
Lateral Hamstring 0.10 ± 0.03 0.10 ± 0.04 0.13 ± 0.06
Medial Gastrocnemius 0.27 ± 0.09 0.29 ± 0.14 0.25 ± 0.12
Lateral Gastrocnemius 0.23 ± 0.08 0.27 ± 0.17 0.24 ± 0.19
Amplitude differences observed as deviations from zero were strongest in the marginally
stable and unstable groups compared to the stable group for all three PCs (Fig. 24). PC 1
detected the opposing function of the knee flexor (hamstrings and gastrocnemii) and extensor
(vasti) muscles. The hamstrings muscles varied most in PC 1 as they opposed the gastrocnemii
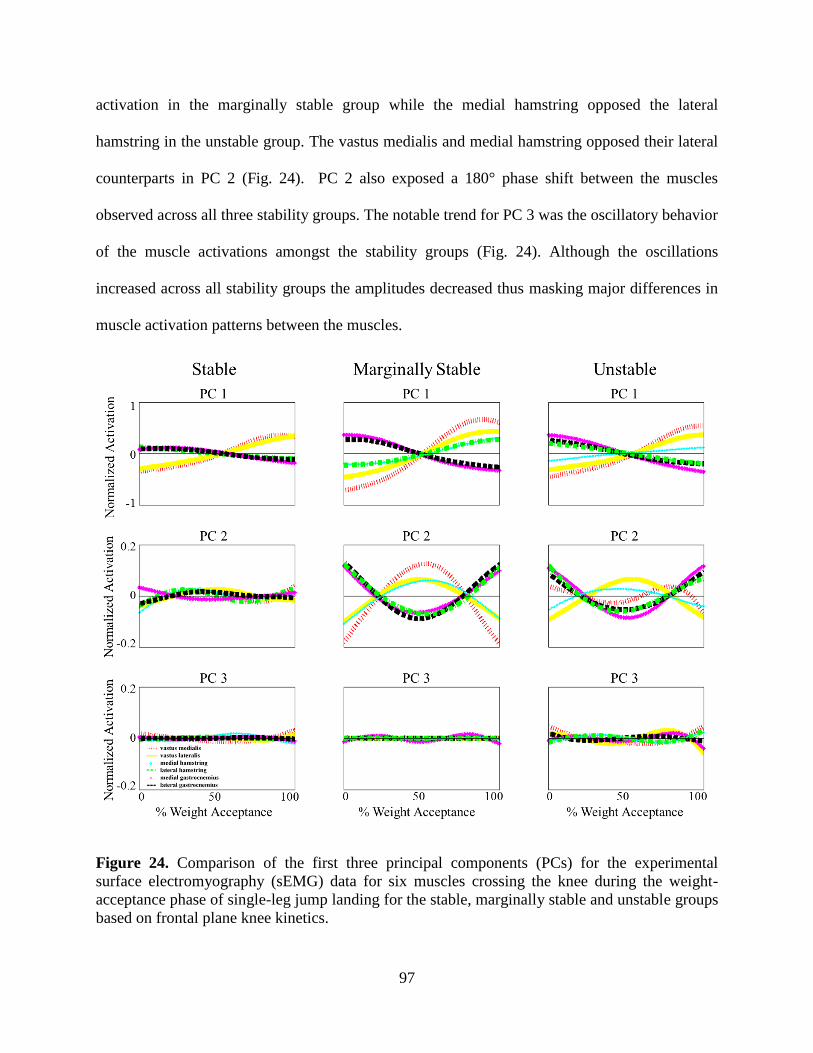
97
activation in the marginally stable group while the medial hamstring opposed the lateral
hamstring in the unstable group. The vastus medialis and medial hamstring opposed their lateral
counterparts in PC 2 (Fig. 24). PC 2 also exposed a 180° phase shift between the muscles
observed across all three stability groups. The notable trend for PC 3 was the oscillatory behavior
of the muscle activations amongst the stability groups (Fig. 24). Although the oscillations
increased across all stability groups the amplitudes decreased thus masking major differences in
muscle activation patterns between the muscles.
Figure 24. Comparison of the first three principal components (PCs) for the experimental
surface electromyography (sEMG) data for six muscles crossing the knee during the weight-
acceptance phase of single-leg jump landing for the stable, marginally stable and unstable groups
based on frontal plane knee kinetics.

98
4.5 Discussion
Both the stability and PCA analyses found the large maximum knee abduction moment
exhibited by the unstable group to be a significant factor associated with joint instability. The
mean maximum knee abduction moments generated by the unstable and marginally stable were
greater than abduction moments generated by individuals who have suffered an ACL injury thus
these individuals exhibited landing biomechanics that placed them at elevated risk for ACL
injury (Hewett et al., 2005). A secondary feature associated with joint instability was the
identification of potentially dangerous frontal plane frequencies. These frequencies represent the
oscillations or rapid transition between frontal plane adduction and abduction orientation during
landing. The probability plots showed that the upper and lower tail frequencies fell outside the
confidence bounds thus indicating that those frequencies may lead to greater frontal plane
instability. This oscillatory frontal plane behavior has been observed in at-risk biomechanics but
had not been quantified as in this study (Ford et al., 2006, Hewett et al., 2005, McLean et al.,
2004). ACL injuries are characterized by small knee flexion angles and increased knee abduction
(valgus) moment which were traits of the unstable group in this study (Cochrane et al., 2007,
Koga et al, 2010, Krosshau et al., 2007). These findings help support the use of these stability
techniques as a dynamic joint stability classification methodology.
Mean sEMG analysis found that greater vastus lateralis activation and a delayed
interaction between the vasti and gastrocnemii muscles as the strongest differences in muscle
activation between the stability groups. PC 2 detected both a medial-lateral vasti and hamstring
imbalance. Medial-lateral vasti and hamstring imbalance was found to contribute to elevated
abduction moments as shown by the elevated maximum abduction moments of the marginally
stable and unstable groups where the imbalance was the strongest. The knee flexor-extensor

99
imbalance observed in PC 1 corresponded to the differences in sagittal plane biomechanics
kinetics among the stability groups with the unstable group reporting smaller knee flexion angles
than the stable group. Research has shown that smaller knee flexion angles limit the medial vasti
and hamstring muscles ability to resist an external abduction moment (Lloyd and Buchanan et
al., 2001). The aforementioned muscle activation imbalances and their corresponding joint
biomechanics support that research. Moreover the alternating hamstring activation in the
marginally stable and unstable groups may reflect the role hamstrings play in joint stability
during landing, a common belief in ACL injury literature (Blackburn et al., 2013; Donnelly et al.,
2012; Lloyd & Buchanan 2001; Riemann and Lephart, 2002; Withrow et al., 2008). The
oscillatory behavior of all of the muscles in PC 3 matched the joint oscillations and frequencies
observed and quantified in the joint stability and PCA analyses (Figs. 18 and 21). During landing
muscles function as shock absorbers and PCA may have shown how muscles function to
dissipate the underlying joint oscillations (Yeow 2013; Zhang et al., 2000). The sEMG PCA
detected differences in amplitude, phase shift and oscillatory behavior in the muscles that were
attributed to differences in muscle activation strength, function and energy dissipation capacity.
These findings support a relationship between the musculoskeletal and neuromuscular systems
that were not obtained by analyzing mean sEMG data alone. Based on these results the muscle-
targeted training programs should focus on coordinating the activation between the knee flexor-
extensors and medial-lateral muscles with emphasis on the medial hamstring muscle.
The muscle activation patterns exhibited by the marginally stable and unstable groups
may be in response to altered landing kinematics and kinetics at initial contact. Although the
differences in sagittal, frontal and transverse plane joint kinematics and kinetics decreased
between the stability groups by the end of WA phase they were not equal. Thus the marginally
100
stable and unstable activation patterns were still not ideal. While greater muscle activation may
be needed to overcome initial unstable joint biomechanics it is possible that the muscle activation
prior to landing should be analyzed. Studies have analyzed jump landing motor strategies and
recognized that to execute a successful jump landing is dependent upon the muscle coordination
during all phases: take-off, flight and landing (Mrdakovic et al., 2008; Viitasalo et al., 1998;
Wikstrom et al., 2007). This information indicates that future work should investigate muscle
activation at take-off and flight as well.
Here the stability criteria determined that 33% of the trials performed showed unstable
motion; however, while current ACL injury rates are increasing they are not that high. In this
study, joint instability does not imply ACL injury but rather the potential for injury. Individuals
who consistently exhibit unstable joint biomechanics may be at elevated risk for ACL injury and
should be selected for muscle-targeted training protocols. Based on the present results, training
protocols should focus on coordinating both the strength and timing of the muscle activation with
emphasis on the hamstrings and vastus medialis muscles to be most effective.
PCA was used as an exploratory method to identify muscles important to stabilizing the
knee during landing. PCA is typically used on large datasets to identify key PCs that explain the
variability in the data. Although the sample size of 30 trials is relatively large for a
computational modeling study it is on the small side for PCA based studies. Furthermore, using
the stability techniques to divide the trials into groups produced a group of three trials. Small
groups are not desirable; yet, due to how the stability criteria are used it is impossible to predict
the distribution of trials into the stability groups regardless of how large the initial pool is.
Despite the small sample size, our test was successful in identifying differences in sagittal and
frontal plane kinetics at initial contact and differences in maximum knee abduction moment
101
between the unstable and stable groups considered to be at high and low risk for ACL injury
(Ford et al, 2010; Hewett et al, 2005).Thus we are confident the small group size had a minimal
influence on the results.
Our research fills the gap by quantifying dynamic knee stability with the coordinated
muscle function analysis. The stability groups classified using Nyquist and Bode stability criteria
displayed the same trends in frontal plane kinetics as the literature while quantifying oscillatory
behavior only previously described visually. PCA found that the unstable individuals have less
balanced co-contraction of their medial and lateral vasti, hamstring and gastrocnemii muscles.
Stable individuals have this balance and displayed how the hamstring and gastrocnemii muscles
both function to oppose the vasti muscles during the WA phase of landing. The ACL is a
dynamic knee stabilizer and these criteria provide a robust metric for assessing joint stability
during dynamic movement. Together with PCA this unique methodology provides additional
insight into the cause and effect relationship between the musculoskeletal and neuromuscular
systems that should be applied to developing ACL screening and muscle-targeted training
protocols for at-risk individuals.
102
4.6 References
Blackburn, J. T., Norcross, M. F., Cannon, L. N., Zinder, S. M., 2013. Hamstrings stiffness
and landing biomechanics linked to anterior cruciate ligament loading. Journal of Athletic
Training, 48(6).
Boden, B.P., Dean, G.S., Feagin, J.A. Jr., Garrett, W.E. Jr., 2000. Mechanisms of anterior
cruciate ligament injury. Orthopedics 23(6), 573-78.
Cochrane, J. L., Lloyd, D. G., Buttfield, A., Seward, H., & McGivern, J., 2007.
Characteristics of anterior cruciate ligament injuries in Australian football. Journal of
Science and Medicine in Sport, 10(2), 96-104.
Daffertshofer, A., Lamoth, C.J.C., Meijer, O.G., Beek, P.J., 2004. PCA in studying
coordination and variability: a tutorial. Clinical Biomechanics 19, 415-28.
Delp, S.L., Anderson, F.C., Arnold, A.S., Loan, P., Habib, A., John, C.T., Guendelman, E.,
Thelen, D.G., 2007. OpenSim: open-source software to create and analyze dynamic
simulations of movement. IEEE Transactions on Biomedical Engineering 54, 1940-50.
Dempsey, A.R., Lloyd, D.G., Elliott, B.C., Steele, J.R., Munro, B.J., Russo, K.A., 2007. The
effect of technique change on knee loads during sidestep cutting. Medicine & Science in
Sports & Exercise 39(10), 1765-73.
Dempsey, A.R., Elliott, B.C., Munro, B.J. Steele, J.R. and Lloyd, D.G., 2012. Whole body
kinematics and knee moments that occur during an overhead catch and landing task in
sport. Clinical Biomechanics 27, 466-74.
Donnelly, C. J., Elliott, B.C., Ackland, T.R., Doyle, T.L.A., Besier, T.F., Finch, C.F., Cochrane,
J.L., Dempsey, A.R., Lloyd, D.G., 2012. An anterior cruciate ligament injury prevention
framework: incorporating the recent evidence. Research in Sports Medicine: An
International Journal, 20:3-4, 239-62.
Donnelly, C.J., Elliott, B.C., Doyle, T.L.A., Finch, C.F., Dempsey, A.R., Lloyd, D.G., 2012c.
Changes in knee joint biomechanics following balance and technique training and a
season of Australian football. British Journal of Sports Medicine 46, 917-22.
Donnelly, C.J., Lloyd, D.G., Elliott, B.C., Reinbolt, J.A., 2012b. Optimizing whole-body
kinematics to minimize valgus knee loading during sidestepping: implications for ACL
injury risk. Journal of Biomechanics 45, 1491-97.
Dorf, R.C. and Bishop, R.H., 2008. Modern Control Systems. Upper Saddle River, NJ: Pearson
Prentice Hall.
Ford, K. R., Myer, G. D., Smith, R. L., Vianello, R. M., Seiwert, S. L., Hewett, T. E., 2006. A
comparison of dynamic coronal plane excursion between matched male and female
athletes when performing single leg landings. Clinical Biomechanics, 21(1), 33-40.
Ford, K. R., Shapiro, R., Myer, G. D., Van Den Bogert, A. J., Hewett, T. E., 2010. Longitudinal
sex differences during landing in knee abduction in young athletes. Medicine and Science
in Sports and Exercise, 42(10), 1923-31.
Haggerty, S., Jiang, L. T., Galecki, A., Sienko, K. H., 2012. Effects of biofeedback on
secondary-task response time and postural stability in older adults. Gait & Posture, 35(4),
523-528.
103
Hewett, T. E., Myer, G. D., Ford, K. R., Heidt, R. S., Colosimo, A. J., McLean, S. G., van den
Bogert, A. J., Paterno, M.V., Succop, P., 2005. Biomechanical measures of
neuromuscular control and valgus loading of the knee predict anterior cruciate ligament
injury risk in female athletes A prospective study. The American Journal of Sports
Medicine, 33(4), 492-501.
Hur, P., Duiser, B. A., Salapaka, S. M., Hsiao-Wecksler, E. T., 2010. Measuring robustness of
the postural control system to a mild impulsive perturbation. Neural Systems and
Rehabilitation Engineering, IEEE Transactions on, 18(4), 461-467.
Jolliffe, I.T., 2002. Principal Component Analysis, 2nd
Ed Springer, New York.
Koga, H., Nakamae, A., Shima, Y., Iwasa, J., Myklebust, G., Engebretsen, L., Bahr, R.,
Krosshaug, T., 2010. Mechanisms for noncontact anterior cruciate ligament injuries:
knee joint kinematics in 10 injury situations from female team handball and basketball. The
American Journal of Sports Medicine, 38, 2218-2225.
Krosshaug, T., Nakamae, A., Boden, B.P., Engebretsen, L., Smith, G., Slauterbeck, J.R.,
Hewett, T.E., Bahr, R., 2007. Mechanisms of anterior cruciate ligament injury in
basketball: video analysis of 39 cases. The American Journal of Sports Medicine, 35, 359-
367.
Kuo, B. C., and Golnaraghi, M. F.,2003. Automatic control systems (Vol. 4). New York:
John Wiley & Sons.
Lam, M., Daniel, T. F., Yung, P. S., Ho, E. P., Chan, W., Chan K., 2009. Knee stability
assessment on anterior cruciate ligament injury: Clinical and biomechanical approaches.
BMC Sports Medicine, Arthroscopy and Rehabilitation 1(1), 20-29.
Lee S., Zou, F. Wright, F.A. 2010. Convergence and prediction of principal component
scores in high-dimensional settings. The Annals of Statistics 38, 3605-29.
Lloyd, D. G., Buchanan, T. S., 2001. Strategies of muscular support of varus and valgus
isometric loads at the human knee. Journal of Biomechanics, 34(10), 1257-1267.
Mantovani, G., Lamontagne, M., Varin, D., Cerulli, G.G. Beaulé, P.E., 2012. Comparison of
total hip arthroplasty surgical approaches by principal component analysis. Journal of
Biomechanics 45, 2109-15.
McLean, S. G., Lipfert, S. W., van den Bogert, A. J., 2004. Effect of gender and defensive
opponent on the biomechanics of sidestep cutting. Medicine and Science in Sports and
Exercise, 36(6), 1008-1016.
Mrdakovic, V., Ilic, D. B., Jankovic, N., Rajkovic, Z., Stefanovic, D., 2008. Pre-activity
modulation of lower extremity muscles within different types and heights of deep jump.
Journal of Sports Science & Medicine, 7(2), 269-78.
O’Connor, K.M and Bottum, M.C., 2009. Differences in cutting knee mechanics based on
principal component analysis. Medicine & Science in Sports & Exercise 41(4), 867-78.
Park, S., Horak, F. B., Kuo, A. D., 2004. Postural feedback responses scale with biomechanical
constraints in human standing. Experimental Brain Research, 154(4), 417-427.
Riemann, B. L., and Lephart, S. M., 2002. The sensorimotor system, part II: the role of
proprioception in motor control and functional joint stability. Journal of Athletic
Training, 37(1), 80-84.
Sun, J., Chen, M., and Karimi, K. J., 2008. Aircraft power system harmonics involving single-
phase PFC converters. Aerospace and Electronic Systems, IEEE Transactions on, 44(1),
217-226.
104
Veltri, D.M., Deng, X.H., Torzilli, P.A., Warren, R.F., Maynard, M.J., 1995. The role of the
cruciate and posterolateral ligaments in stability of the knee: A biomechanical study.
American Journal of Sports Medicine 23(4), 436-43.
Viitasalo, J. T., Salo, A., Lahtinen, J., 1998. Neuromuscular functioning of athletes and non-
athletes in the drop jump. European Journal of Applied Physiology and Occupational
Physiology, 78(5), 432-440.
Wikstrom, E. A., Tillman, M. D., Schenker, S., Borsa, P. A., 2008. Failed jump landing
trials: deficits in neuromuscular control. Scandinavian Journal of Medicine & Science in
Sports, 18(1), 55-61.
Withrow, T. J., Huston, L. J., Wojtys, E. M., Ashton-Miller, J. A., 2008. Effect of varying
hamstring tension on anterior cruciate ligament strain during in vitro impulsive knee
flexion and compression loading. The Journal of Bone & Joint Surgery, 90(4), 815-823.
Wrigley, A.T., Wayne, J.A., Deluzio, K.J., Stevenson, J.M., 2006. Principal component analysis
of lifting waveforms. Clinical Biomechanics 21, 567-78.
Yeow, C. H., 2013. Hamstrings and quadriceps muscle contributions to energy generation and
dissipation at the knee joint during stance, swing and flight phases of level running. The
Knee, 20(2), 100-105.
Zhang, S. N., Bates, B. T., Dufek, J. S., 2000. Contributions of lower extremity joints to energy
dissipation during landings. Medicine and Science in Sports and Exercise, 32(4), 812-
819.

105
4.7 Appendix
4.7.1 Nyquist and Bode Stability Analysis
To evaluate knee stability in the sagittal, frontal and transverse planes, a regression
analysis utilizing Matlab polyfit and polyval commands were used to develop the time dependent
mathematical model to represent the joint kinematics and kinetic waveforms as a function of
time. Next the Laplace transform of the time dependent mathematical model was calculated. The
Laplace transform is a linear operator that converts the waveform from the time to frequency
domain. The open loop transfer function was derived using the kinematic and kinetic waveforms
as the output function and an impulse function as the input function. The transfer function served
as the inputs for the Nyquist and Bode Stability analyses. Figure 25 provides descriptive plots of
stable and unstable systems based on the Nyquist and Bode stability criteria. All of these
analyses were performed in Matlab (MATLAB R2012a, The MathWorks, Inc., Natick
Massachusetts, USA).
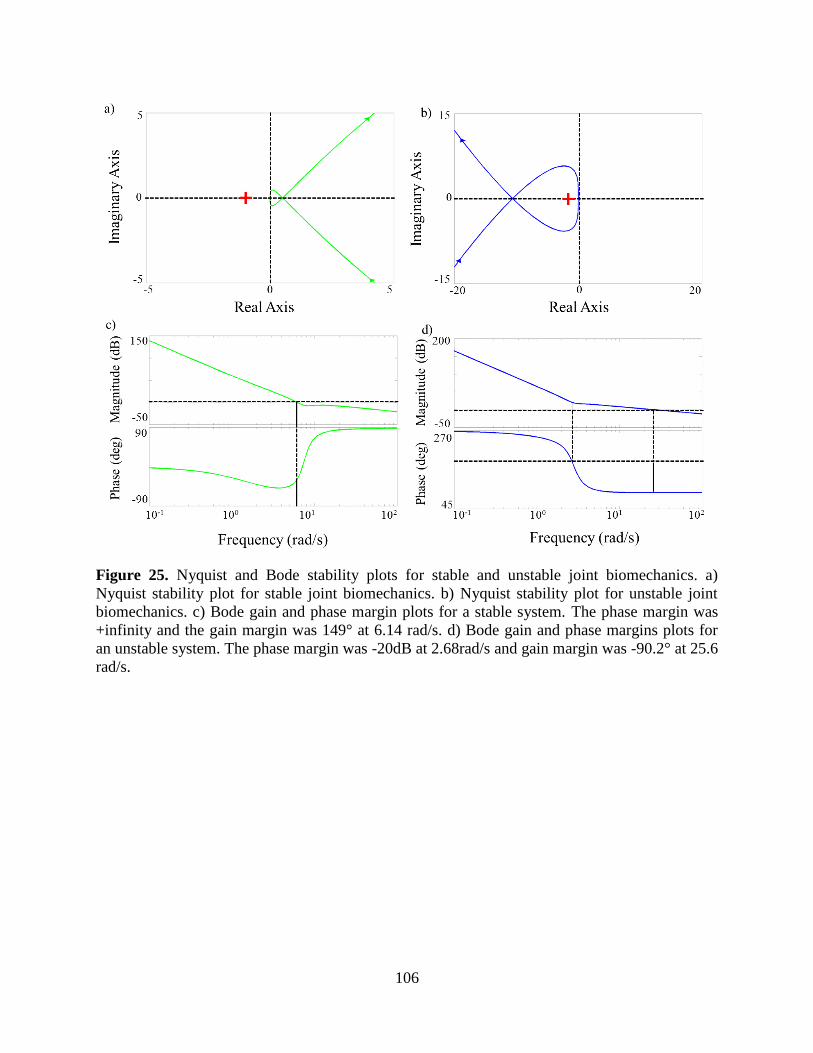
106
Figure 25. Nyquist and Bode stability plots for stable and unstable joint biomechanics. a)
Nyquist stability plot for stable joint biomechanics. b) Nyquist stability plot for unstable joint
biomechanics. c) Bode gain and phase margin plots for a stable system. The phase margin was
+infinity and the gain margin was 149° at 6.14 rad/s. d) Bode gain and phase margins plots for
an unstable system. The phase margin was -20dB at 2.68rad/s and gain margin was -90.2° at 25.6
rad/s.

107
CHAPTER V
UTILIZING STABILITY AND WAVELET ANALYSES TO
DETECT MUSCLE ACTIVATION PATTERNS ASSOCIATED
WITH ACL INJURY RISK
108
5.1 Abstract
An anterior cruciate ligament (ACL) tear is a common knee injury in sports and, despite
current prevention research, injury rates are sharply increasing. To better understand the
relationship between joint motion and muscle function this study will employ Nyquist and Bode
Stability criteria along with wavelet analysis to assess knee joint stability and detect muscle
activation strategies unique to individuals at varying risk of ACL injury. Frontal plane knee
kinetic data collected from male Australian Football players performing a single-leg jump
landing task was used to classify individuals as stable, marginally stable and unstable. The
surface EMG data collected during the landing task was analyzed using the Daubechies wavelet
analysis to identify muscle activation patterns. Patterns were detected using Hurst exponents and
Order Recurrence Plots. The maximum knee abduction moment produced by the unstable group
was significantly greater than the maximum knee abduction moments for the marginally stable
and unstable groups (p < 0.001). Furthermore, the medial and lateral gastrocnemii muscles for
the stable group exhibited different muscle activation patterns than the marginally stable and
unstable groups. These findings support the use of the Nyquist and Bode stability criteria as an
effective tool of assessing knee stability and that wavelet analysis as a valuable means of
assessing muscle function.
109
5.2 Introduction
Recent reports now state that approximately 400,000 anterior cruciate ligament (ACL)
injuries occur every year in the United States up from 250,000 seven years ago (Utturkar et al.,
2013, Griffin et al., 2006). The last decade has seen the implementation of balance, plyometric
and neuromuscular training yet these studies have yielded mixed results as indicated by the
increasing ACL injury rates (Chappell et al., 2008; Donnelly et al., 2012a; Myer et al., 2008;
Mykleburst et al., 2003). The dramatic increase in ACL injuries rates presents the opportunity for
unique approaches to be explored. This study will use techniques from engineering and
mathematics to develop a prescreening ACL injury tool and detect muscle activation patterns
distinct to individuals with varying risk of ACL injury.
Hausdorff et al. (2007) showed how heart rate outputs reflect the autonomic nervous
system regulation (stability) and demonstrated how stride interval could be used to reflect
neuromuscular control system stability. This is a simple but powerful way to show how a
waveform can be used to describe the performance of an entire system. In this study, frontal
plane knee moment waveforms were used to assess the performance of the knee (i.e. knee
stability) during single-leg jump landings. This study investigated the neuromuscular control
system by analyzing the relationship between knee stability and muscle activation patterns.
Deconstructing this relationship could be the key to determining the association between knee
joint motion and muscle function with respect to ACL injury.
Hewett et al. (2005) identified knee abduction moment as the strongest predictor of ACL
injury as dynamic valgus motion was greater in the ACL injured cohort thus relating dynamic
valgus to joint stability. While researchers agree that increasing dynamic valgus motion is linked
to joint instability, researchers have not agreed upon a value for which the knee joint instability
110
(i.e. peak knee abduction moment) puts individuals at risk for ACL injury (Hewett et al., 200;
Hewett et al., 2006; Ford et al., 2005; Ford et al., 2010). Control theory is a field that analyzes
system dynamics and stability. There stability is a quantifiable measurement of the performance
of dynamic systems (Dorf and Bishop, 2008). Nyquist and Bode stability criteria are used to
assess the system stability with applications ranging from aircraft to postural stability (Dorf and
Bishop, 2008; Hur et al., 2010; Haggerty et al., 2012; Sun et al., 2008). Here these criteria will be
used to assess dynamic frontal plane knee stability to classify the time varying frontal plane knee
moment waveforms as stable, marginally stable and unstable. The goal is to use the stability
criteria as a prescreening ACL injury tool where stable, marginally stable and unstable frontal
plane knee waveforms will identify individuals at low, moderate and high- risk for ACL injury.
The significance of using these criteria is that the individual’s stability is not based on one
discrete measurement but the entire frontal plane waveform. Furthermore, an individual’s
stability is not reliant on how their peak abduction moment (a discrete measurement) compares
to the peak abduction moments of individuals in a larger cohort performing the same task. Thus
an individual’s stability is not a relative measurement based on others’ performance.
In the neuromuscular system, the muscles function as dynamic stabilizers providing
dynamic restraint of a joint (Riemann and Lephart 2002). Thus it may be possible to deduce a
relationship between dynamic knee valgus (i.e. joint motion) and the dynamic knee stabilizers
(i.e. muscles). The idea is that once the knee joint motion is classified as stable, marginally stable
and unstable, we can analyze muscle activation data to determine if there are activation patterns
unique to individuals in these three stability groups. Patterns are prevalent in every aspect of
everyday life whether it is financial data or heart rhythms and wavelet analysis is an effective
method for identifying said patterns (Ramsey 1999; Chau 2001; Thomasson et al. 2001; Magdy

111
et al., 2013). Wavelet analysis is a preferred method of time series analysis over alternative
techniques; such as, Fourier analysis and autoregressive integrated moving average (ARIMA)
models, because wavelets preserve both the spatial and temporal components of the original
signal, whereas in the case of the Fourier analysis only the frequency component is retained
(Dillard 2010). Daubechies wavelet analysis was employed for its event detection and signal
discrimination capabilities (Chau 2001; Tamura et al., 1997; Wachowiak et al., 2000). Both the
wavelet approximation and detail waveforms will be investigated to detect patterns minimized
when EMG data is filtered both within and between the muscles. The Hurst exponent was used
to quantify patterns observed in the wavelet results. The Hurst exponent falls under the branch of
fractal analysis which analyzes the self-similarity property of time series data to determine if the
patterns observed in the data are regressing towards or deviating from a mean (Chau 2001;
Hausdorff et al., 1997; Hausdorff et al., 2007; Mitra et al., 2012). This technique has been used
in biomechanics and will be useful in detecting underlying trends in EMG data.
While the temporal plots of the wavelet analysis data will be examined to identify
abnormalities, an additional technique, Order Recurrence Plots (ORPs), will be used as a method
for visually observing the anomalies in the data captured by the Daubechies wavelet analysis.
ORPs are used to analyze dynamic systems where the focus is to distinguish between ordered
patterns or chaos in the data or determine the point of transition between ordered and chaotic
behavior (Marwan et al., 2007). Utilizing ORPs in combination with Daubechies wavelets will
allow us to further determine if there are any patterns in the Daubechies approximation and detail
data that can be associated with injury risk. In this study, Daubechies wavelet analysis and ORPs
were used to explore EMG data for muscle activity abnormalities in the six muscles surrounding
the knee.

112
This study has two objectives. The first is to utilize Nyquist and Bode stability criteria to
determine frontal plane knee stability to classify individuals as stable, marginally stable and
unstable. The second is to determine muscle activation patterns associated with frontal plane
knee joint instability. The results of the three previous Chapters (II-IV) suggest that medial-
lateral gastrocnemii imbalance could be related to frontal plane knee instability. Based on those
findings it is hypothesized that the Hurst exponent and ORP analysis of the Daubechies wavelet
will detect differences in medial-lateral muscle activation in the gastrocnemii muscles in the
unstable and marginally stable groups compared to the stable group. The overall goal of this
study is to use this information to develop an ACL injury prescreening tool.
5.3 Methodology
5.3.1 Experimental Protocol and Data Collection
Amateur male Western Australian Rules Football players were recruited to complete a
single-leg jump landing protocol (Donnelly et al, 2012b). Five athletes (age 20 ± 1 years; height
1.90 ± 0.1m; mass 87.1 ± 5.4kg) were randomly selected from the aforementioned cohort. Six
trials were analyzed per each participant; two per each ball swing direction for a total of 30 trials
for the subsequent analysis (Donnelly et al., 2012c). For the single-leg jump landing protocol,
subjects were instructed to jump from their preferred leg and while in flight, grab an Australian
football that was randomly swung medially, laterally or held central to the subjects approach
direction before landing on the force platform with their takeoff leg, which was the right leg for
all participants (Dempsey et al., 2012). The height of the ball was approximately 90% of each
subject’s maximal vertical jump height. All of the experimental procedures were approved by the
University of Western Australia Human Research Ethics Committee and all subjects provided
their informed written consent prior to data collection.
113
Experimental kinematic marker trajectories, GRF, and surface electromyography (sEMG)
data were collected from each subject during the single-leg jump landing task. Three-
dimensional, full-body kinematics were recorded using a12-camera, 250 Hz VICON MX motion
capture system (VICON Peak, Oxford Metrics Ltd., UK) (Donnelly et al., 2012c; Dempsey et al.
2007). The GRF data were synchronously recorded at 2,000 Hz using an AMTI (Advanced
Mechanical Technology Inc., Watertown, MA) 1.2 x 1.2m force platform. Both the kinematic and
GRF data were low-pass filtered at 20 Hz using a zero phase-shift 4th
-order Butterworth digital
filter in Workstation (ViconPeak, Oxford Metrics Ltd., UK). sEMG data were collected at 2,000
Hz for six muscles: vastus medialis, vastus lateralis, medial and lateral gastrocnemii and medial
and lateral hamstrings. The medial and lateral vasti muscles were measured to represent the
quadriceps muscle group. Wavelet analysis was performed on the raw experimental sEMG data.
5.3.2 Subject-Specific Models and Simulations
Five three-dimensional 14-segment, 37 degree-of-freedom (DoF) subject-specific models
were created in OpenSim 1.9.1 to generate simulations of the participants performing single-leg
jump landings (Fig. 26) (Delp et al. 2007). The knee rotated in all three planes and sagittal and
transverse plane translations were modeled as a function of knee angle (Donnelly et al., 2012b,
Delp et al., 1990). The model’s segment lengths and mass were scaled to each subject. The joint
kinematics were calculated from experimental kinematic marker data using inverse kinematics
(IK). Residual reduction analysis (RRA) was used to create dynamically consistent simulations
with the experimentally recorded ground reaction forces (Donnelly et al., 2012c). These
dynamically consistent simulations were analyzed during the weight-acceptance (WA) phase of
single-leg jump landing. The WA phase of landing was analyzed since this is the period when
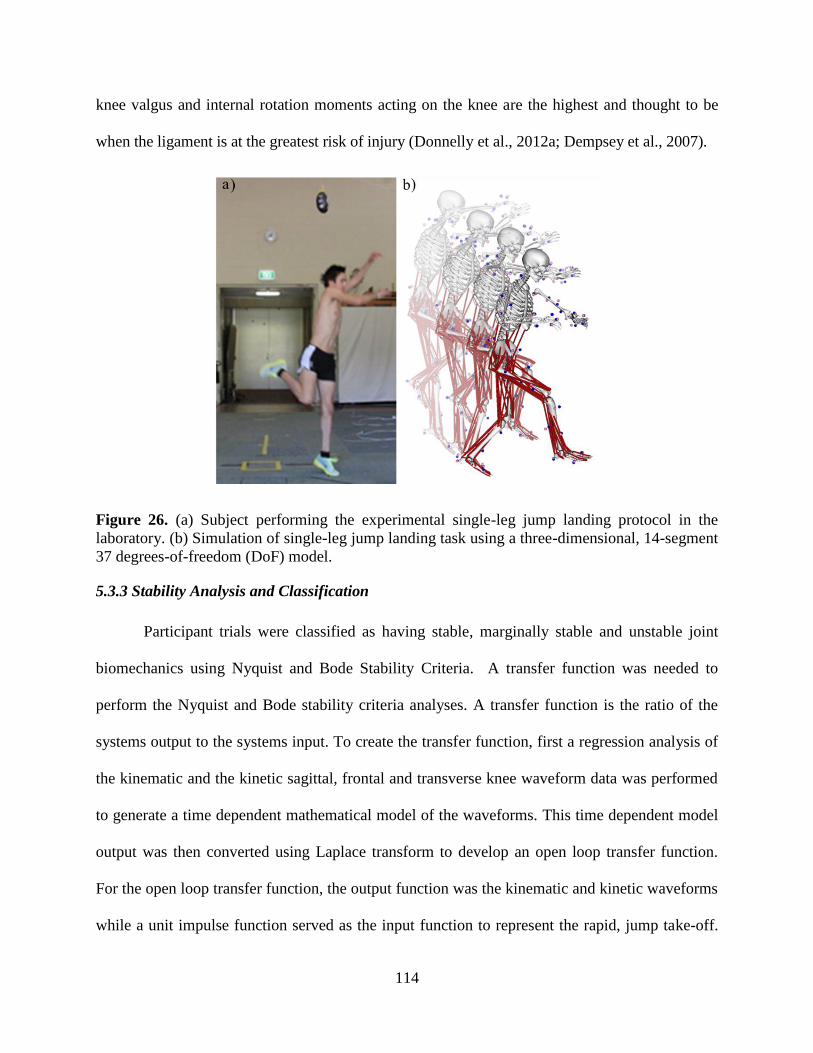
114
knee valgus and internal rotation moments acting on the knee are the highest and thought to be
when the ligament is at the greatest risk of injury (Donnelly et al., 2012a; Dempsey et al., 2007).
Figure 26. (a) Subject performing the experimental single-leg jump landing protocol in the
laboratory. (b) Simulation of single-leg jump landing task using a three-dimensional, 14-segment
37 degrees-of-freedom (DoF) model.
5.3.3 Stability Analysis and Classification
Participant trials were classified as having stable, marginally stable and unstable joint
biomechanics using Nyquist and Bode Stability Criteria. A transfer function was needed to
perform the Nyquist and Bode stability criteria analyses. A transfer function is the ratio of the
systems output to the systems input. To create the transfer function, first a regression analysis of
the kinematic and the kinetic sagittal, frontal and transverse knee waveform data was performed
to generate a time dependent mathematical model of the waveforms. This time dependent model
output was then converted using Laplace transform to develop an open loop transfer function.
For the open loop transfer function, the output function was the kinematic and kinetic waveforms
while a unit impulse function served as the input function to represent the rapid, jump take-off.
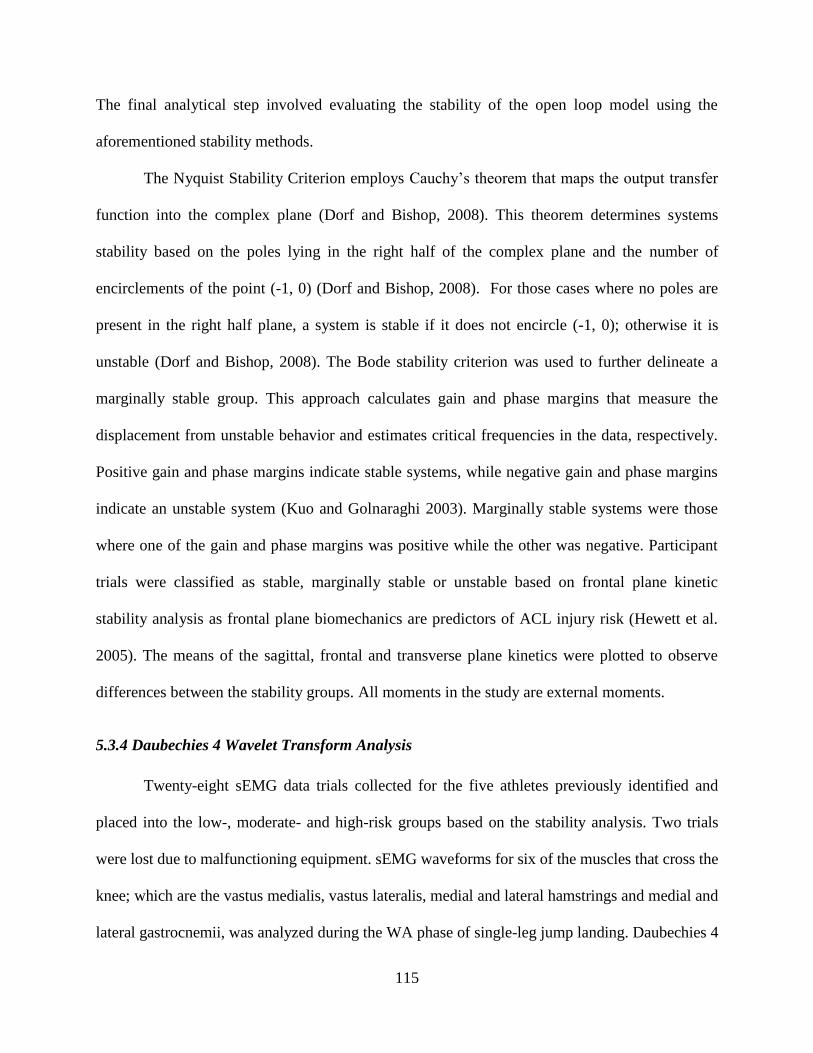
115
The final analytical step involved evaluating the stability of the open loop model using the
aforementioned stability methods.
The Nyquist Stability Criterion employs Cauchy’s theorem that maps the output transfer
function into the complex plane (Dorf and Bishop, 2008). This theorem determines systems
stability based on the poles lying in the right half of the complex plane and the number of
encirclements of the point (-1, 0) (Dorf and Bishop, 2008). For those cases where no poles are
present in the right half plane, a system is stable if it does not encircle (-1, 0); otherwise it is
unstable (Dorf and Bishop, 2008). The Bode stability criterion was used to further delineate a
marginally stable group. This approach calculates gain and phase margins that measure the
displacement from unstable behavior and estimates critical frequencies in the data, respectively.
Positive gain and phase margins indicate stable systems, while negative gain and phase margins
indicate an unstable system (Kuo and Golnaraghi 2003). Marginally stable systems were those
where one of the gain and phase margins was positive while the other was negative. Participant
trials were classified as stable, marginally stable or unstable based on frontal plane kinetic
stability analysis as frontal plane biomechanics are predictors of ACL injury risk (Hewett et al.
2005). The means of the sagittal, frontal and transverse plane kinetics were plotted to observe
differences between the stability groups. All moments in the study are external moments.
5.3.4 Daubechies 4 Wavelet Transform Analysis
Twenty-eight sEMG data trials collected for the five athletes previously identified and
placed into the low-, moderate- and high-risk groups based on the stability analysis. Two trials
were lost due to malfunctioning equipment. sEMG waveforms for six of the muscles that cross the
knee; which are the vastus medialis, vastus lateralis, medial and lateral hamstrings and medial and
lateral gastrocnemii, was analyzed during the WA phase of single-leg jump landing. Daubechies 4
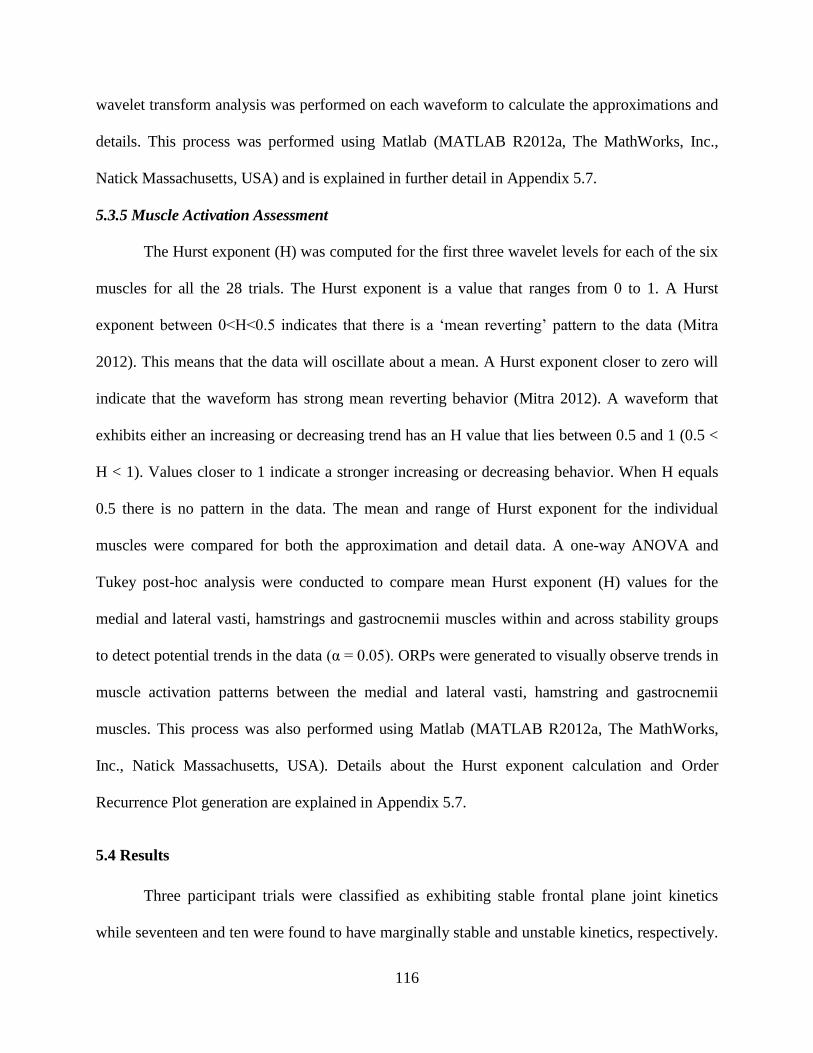
116
wavelet transform analysis was performed on each waveform to calculate the approximations and
details. This process was performed using Matlab (MATLAB R2012a, The MathWorks, Inc.,
Natick Massachusetts, USA) and is explained in further detail in Appendix 5.7.
5.3.5 Muscle Activation Assessment
The Hurst exponent (H) was computed for the first three wavelet levels for each of the six
muscles for all the 28 trials. The Hurst exponent is a value that ranges from 0 to 1. A Hurst
exponent between 0<H<0.5 indicates that there is a ‘mean reverting’ pattern to the data (Mitra
2012). This means that the data will oscillate about a mean. A Hurst exponent closer to zero will
indicate that the waveform has strong mean reverting behavior (Mitra 2012). A waveform that
exhibits either an increasing or decreasing trend has an H value that lies between 0.5 and 1 (0.5 <
H < 1). Values closer to 1 indicate a stronger increasing or decreasing behavior. When H equals
0.5 there is no pattern in the data. The mean and range of Hurst exponent for the individual
muscles were compared for both the approximation and detail data. A one-way ANOVA and
Tukey post-hoc analysis were conducted to compare mean Hurst exponent (H) values for the
medial and lateral vasti, hamstrings and gastrocnemii muscles within and across stability groups
to detect potential trends in the data (α = 0.05). ORPs were generated to visually observe trends in
muscle activation patterns between the medial and lateral vasti, hamstring and gastrocnemii
muscles. This process was also performed using Matlab (MATLAB R2012a, The MathWorks,
Inc., Natick Massachusetts, USA). Details about the Hurst exponent calculation and Order
Recurrence Plot generation are explained in Appendix 5.7.
5.4 Results
Three participant trials were classified as exhibiting stable frontal plane joint kinetics
while seventeen and ten were found to have marginally stable and unstable kinetics, respectively.
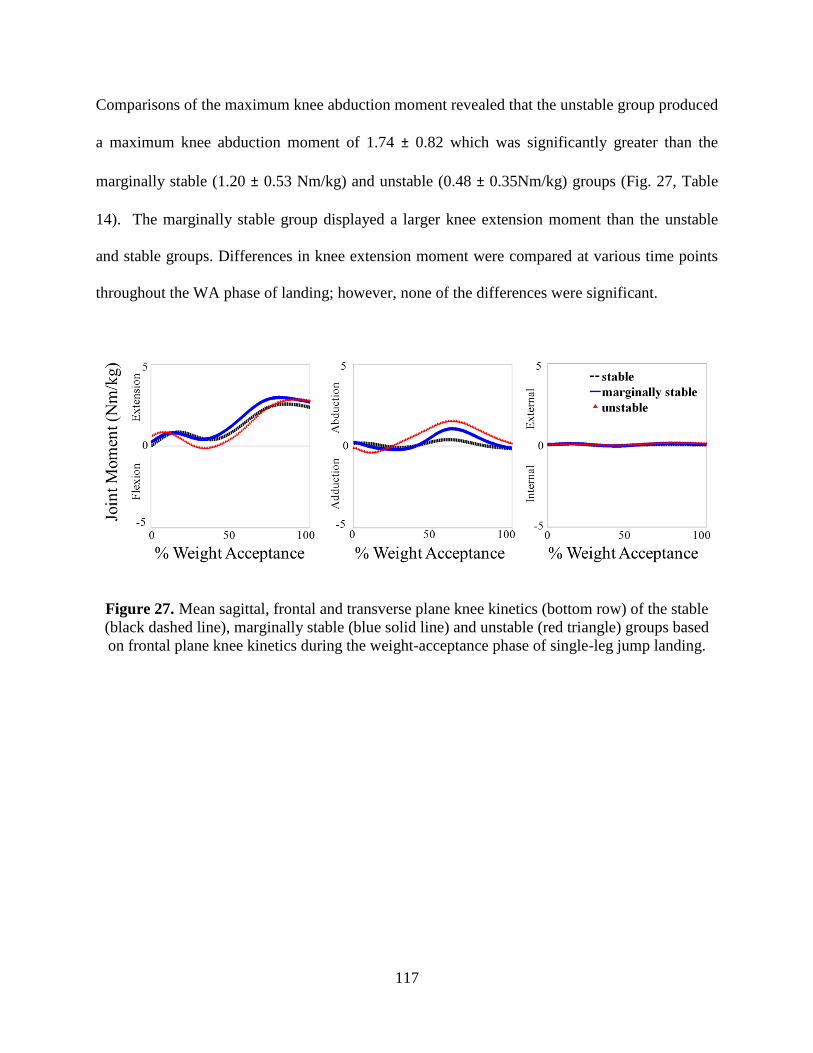
117
Comparisons of the maximum knee abduction moment revealed that the unstable group produced
a maximum knee abduction moment of 1.74 ± 0.82 which was significantly greater than the
marginally stable (1.20 ± 0.53 Nm/kg) and unstable (0.48 ± 0.35Nm/kg) groups (Fig. 27, Table
14). The marginally stable group displayed a larger knee extension moment than the unstable
and stable groups. Differences in knee extension moment were compared at various time points
throughout the WA phase of landing; however, none of the differences were significant.
Figure 27. Mean sagittal, frontal and transverse plane knee kinetics (bottom row) of the stable
(black dashed line), marginally stable (blue solid line) and unstable (red triangle) groups based
on frontal plane knee kinetics during the weight-acceptance phase of single-leg jump landing.

118
Table 14. Comparison of sagittal, frontal and transverse plane kinetics for the stable, marginally
stable and unstable participant groups.
Stable Marginally Stable Unstable
Knee extension/flexion (Nm/kg)
Maximum extension (+) 2.71±0.36 3.09±0.60 2.93±0.52
Maximum flexion (-) -0.09±0.35 -0.16±0.54 -0.40±0.58
End WA of phase 2.36±0.68 2.68±0.65 2.78±0.51
Knee abduction/adduction (Nm/kg)
Maximum abduction (+) 0.48±0.35a 1.20±0.53
a 1.74±0.82
b
Maximum adduction (-) -0.34±0.07 -0.52±0.40 -050±0.40
End WA of phase -0.16±0.18 -0.12±0.37 0.17±0.52
Knee internal/external rotation (Nm/kg)
Maximum external rotation (+) 0.11±0.04 0.15±0.10 0.20±0.10
Maximum internal rotation (-) -0.07±0.09 -0.08±0.09 -0.04±0.06
End WA of phase 0.19±0.05 0.04±0.13 0.10±0.10 ANOVA identified a significant difference for the maximums and end of WA phase values of the individual knee kinetics (p < 0.001). Symbols a,b indicate Fisher’s adjusted post-hoc difference (α = 0.05) in mean kinetics estimates between the stability groups. Estimates with the
same letters are not significantly different from each other. Conversely, if estimates do not share a letter, the means are significantly different.
The average Hurst exponent (H) was calculated was calculated for the first three levels
for both the approximation and detail wavelets (Fig. 28). The H value for all of the detail
wavelets were less than 0.5, which meant they exhibited mean reverting behavior making it
difficult to detect muscle activation trends. Thus we focused on the approximation waveforms
for the subsequent analysis. The first three approximation wavelet levels revealed that the trends
became more pronounced from level 1 to level 3 of the lateral muscles for the stable group
compared to the unstable group (Tables 15-17). For the level 3 approximation, the stable group
reported lower medial vasti, hamstring and gastrocnemii H values than their lateral counterparts
with the largest difference of 0.28 occurring between the vasti muscles. Both the marginally
stable and unstable groups reported larger H values for the vastus lateralis compared to the
vastus medialis; however, the opposite trend was reported for the hamstrings and gastrocnemii
muscles. Comparison of the H values between the six muscles for each approximation level for
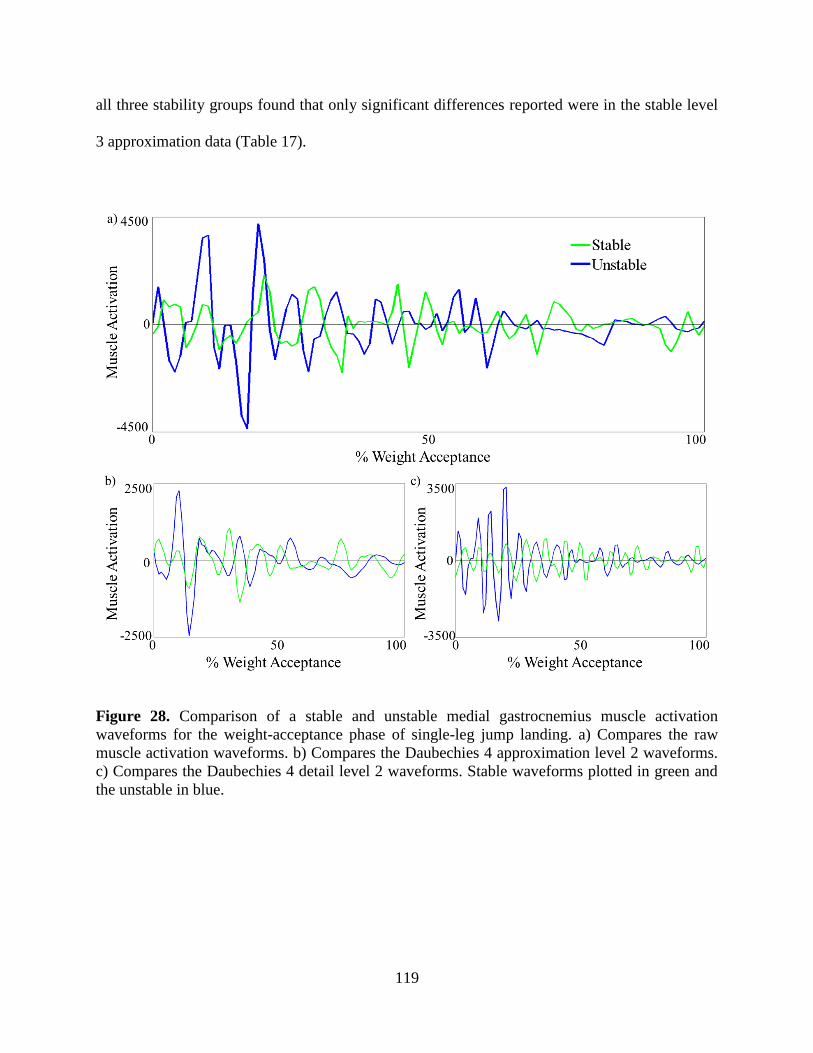
119
all three stability groups found that only significant differences reported were in the stable level
3 approximation data (Table 17).
Figure 28. Comparison of a stable and unstable medial gastrocnemius muscle activation
waveforms for the weight-acceptance phase of single-leg jump landing. a) Compares the raw
muscle activation waveforms. b) Compares the Daubechies 4 approximation level 2 waveforms.
c) Compares the Daubechies 4 detail level 2 waveforms. Stable waveforms plotted in green and
the unstable in blue.

120
Table 15. Mean Hurst exponent (H) calculated from the approximation 1 wavelets for the six muscles surrounding the knee.
Individual Muscles
Stability Groups
Vastus
Medialis
Vastus
Lateralis
Medial
Hamstring
Lateral
Hamstring
Medial
Gastrocnemius
Lateral
Gastrocnemius
Stable 0.56 ± --- 0.78 ± 0.19 0.69 ± 0.08 0.83 ± 0.13 0.53 ± --- 0.52 ± 0.01
Marginally Stable 0.67 ± 0.11 0.72 ± 0.12 0.74 ± 0.15 0.81 ± 0.19 0.69 ± 0.14 0.80 ± 0.15
Unstable 0.70 ± 0.12 0.72 ± 0.06 0.76 ± 0.15 0.67 ± 0.24 0.72 ± 0.15 0.76 ± 0.24 ANOVA identified a significant difference for the maximum values of the individual muscles (p < 0.001; n = 6).
Symbols a,b,c,d,e,f indicate Tukey’s adjusted post-hoc difference (α = 0.05) in mean maximum muscle force between the individual muscles. Muscles with the same letters are not significantly different from each other. Conversely, if muscles do not share a letter, the means are significantly different.
Table 16. Mean Hurst exponent (H) calculated from the approximation 2 wavelets for the six muscles surrounding the knee.
Individual Muscles
Stability Groups
Vastus
Medialis
Vastus
Lateralis
Medial
Hamstring
Lateral
Hamstring
Medial
Gastrocnemius
Lateral
Gastrocnemius
Stable 0.61 ± --- 0.79 ± 0.19 0.71 ± 0.04 0.84 ± 0.12 0.61 ± --- 0.57 ± 0.06
Marginally Stable 0.70 ± 0.06 0.73 ± 0.12 0.73 ± 0.14 0.78 ± 0.19 0.65 ± 0.13 0.77 ± 0.14
Unstable 0.70 ± 0.13 0.69 ± 0.05 0.73 ± 0.16 0.79 ± 0.16 0.72 ± 0.18 0.77 ± 0.22 ANOVA identified a significant difference for the maximum values of the individual muscles (p < 0.001; n = 6). Symbols a,b,c,d,e,f indicate Tukey’s adjusted post-hoc difference (α = 0.05) in mean maximum muscle force between the individual muscles. Muscles with the same letters are not significantly different
from each other. Conversely, if muscles do not share a letter, the means are significantly different.
Table 17. Mean Hurst exponent (H) calculated from the approximation 3 wavelets for the six muscles surrounding the knee.
Individual Muscles
Stability Groups
Vastus
Medialis
Vastus
Lateralis
Medial
Hamstring
Lateral
Hamstring
Medial
Gastrocnemius
Lateral
Gastrocnemius Stable 0.55 ± 0.03
b 0.83 ± 0.15
a,b 0.72 ± 0.12
a,b 0.90 ± 0.08
a 0.60 ± 0.08
b 0.67 ± 0.04
a,b
Marginally Stable 0.75 ± 0.01 0.72 ± 0.17 0.72 ± 0.17 0.79 ± 0.15 0.69 ± 0.14 0.85 ± 0.10
Unstable 0.70 ± 0.11 0.66 ± 0.10 0.74 ± 0.14 0.77 ± 0.19 0.69 ± 0.17 0.73 ± 0.19 ANOVA identified a significant difference for the maximum values of the individual muscles (p < 0.001; n = 6). Symbols a,b,c,d,e,f indicate Tukey’s adjusted post-hoc difference (α = 0.05) in mean H values between the individual muscles. Muscles with the same letters are not significantly different from each
other. Conversely, if muscles do not share a letter, the means are significantly different.

121
ORPs for the medial and lateral gastrocnemii muscles for the three stability groups
showed that the stable group displayed a larger, ordered, repeating checkerboard block pattern
compared to the marginally stable and unstable groups (Fig. 29). The unstable group displayed
small patterns accompanied with bowing or wavy behavior at multiple points throughout the
image.
Figure 29. Order recurrence plots (ORPs) comparing the level 3 medial and lateral gastrocnemii
approximation wavelets of individuals in the stable, marginally stable and unstable groups.
5.5 Discussion
The comparison of the maximum knee abduction moments between the stability groups
found the unstable group reported a significantly greater moment than the stable groups (Fig. 27,
Table 14). This finding is consistent with the literature as ACL injured populations produce
greater maximum knee abduction moments than uninjured populations (Hewett et al., 2005).
This agreement with the literature helps support the implementation of the Nyquist and Bode
stability criteria as a means for assessing knee stability.
The Hurst exponent analysis of the Daubechies 4 approximation and detail wavelets
identified differences in trend strength between the medial and lateral vasti, hamstring and
122
gastrocnemii muscles for all three stability groups across all three levels. The level 3 results
show that the stable group exhibits the largest differences in medial-lateral muscle imbalance for
all three muscle groups compared the two other stability groups. Furthermore, the marginally
stable and unstable groups display smaller differences in H values between the medial and lateral
vasti and hamstring muscles compared to the gastrocnemii muscles. This observation reflects
that the medial-lateral gastrocnemii imbalance may be more detrimental to frontal plane stability
than the medial-lateral vasti and hamstring imbalance as shown in Chapter III. These findings
also support the notion that greater emphasis should be placed on analyzing the role of the
gastrocnemii with regards to ACL injury (Mokhtarzadeh et al., 2013; Podraza et al., 2010;
Nyland et al., 2010). While the difference in mean H values was larger between the gastrocnemii
muscles in the stable compared to the unstable group, if one adds the standard deviation of each
value, the range of stable H values is much smaller than the unstable group. Thus it is reasonable
to assume that the differences in H values between the medial and lateral gastrocnemii for the
participants in the stable group may not be as dramatic as the differences for participants in the
unstable group.
The mean H-values were all greater than 0.5 indicates that the muscles were exhibiting
either an increasing or decreasing trend. ORPs were used to determine if the trends between the
medial and lateral muscles were in the same or opposing directions. The medial-lateral
gastrocnemii muscles displayed greater similarity than the in the marginally stable and unstable
groups. The larger checkerboard the ORP pattern produced is associated with more ordered data
while smaller grain like patterns are associated with more chaotic systems (Thomasson et al.,
2001). The bowing in ORPs indicates a change in the systems dynamics. The changing system
dynamics may relate to how amplitude and phase shift differences between the medial and lateral
123
gastrocnemii muscles approximation wavelets increases throughout the WA phase of landing for
individuals with unstable joint biomechanics. Since this bowing is present in the later stages of
the WA phase for the lateral gastrocnemius approximation wavelet for the unstable trial, it shows
how ORPs can detect time dependent changes in muscle activation wavelets that are associated
with increased ACL injury risk (Thomasson et al., 2001).
The Hurst exponent is an effective tool in detecting trends or patterns within waveforms
but it does not provide information about patterns or similarities between datasets. Future work
could investigate using tools like the kendall tau rank correlation coefficient as well to draw
relationships between datasets (Bolboaca and Jantschi 2006). However, using the Hurst exponent
in conjunction with ORPs enabled us to visually observe similarities amongst the muscles.
The study revealed that the medial and lateral gastrocnemii muscles in stable trials
exhibit similar and more ordered muscle activation patterns. These findings in conjunction with
the Nyquist and Bode stability criteria serve as a basis for the development of an ACL injury
prescreening tool that provides a robust metric for quantifying knee joint stability that is not
compared to and/or linked to the performance of another individual. Via these arrays of
approaches we have been able to quantify frontal plane knee stability, investigate muscle
activation and address strategies specific to each stability group. Future work should focus on
additional data mining methods.
124
5.6 References
Bolboaca, S. D., and Jantschi, L., 2006. Pearson versus Spearman, Kendall's tau correlation
analysis on structure-activity relationships of biologic active compounds. Leonardo
Journal of Sciences, 5(9), 179-200.
Chappell, J. D., and Limpisvasti, O., 2008. Effect of a neuromuscular training program
on the kinetics and kinematics of jumping tasks. The American Journal of Sports
Medicine, 36(6), 1081–1086.
Chau, T., 2001. A review of analytical techniques for gait data. Part 2: neural network and
wavelet methods. Gait & Posture, 13(2), 102-120.
Daubechies, I., 1990. The wavelet transform, time-frequency localization and signal analysis.
Information Theory, IEEE Transactions on, 36(5), 961-1005.
Delp, S.L., Loan, J.P., Hoy, M.G., Zajac, F.E., Topp, E.L., Rosen, J.M., 1990. An interactive
graphics-based model of the lower extremity to study orthopaedic surgical procedures.
IEEE Trans. Biomed. Eng. 37, 757-767.
Delp, S.L., Anderson, F.C., Arnold, A.S., Loan, P., Habib, A., John, C.T., Guendelman, E.,
Thelen, D.G., 2007. OpenSim: open-source software to create and analyze dynamic
simulations of movement. IEEE Trans. Biomed. Eng. 54, 1940-1950.
Dempsey, A.R., Lloyd, D.G., Elliott, B.C., Steele, J.R., Munro, B.J., Russo, K.A., 2007. The
effect of technique change on knee loads during sidestep cutting. Medicine & Science in
Sports & Exercise 39(10), 1765-73.
Dempsey, A.R., Elliott, B.C., Munro, B.J. Steele, J.R. and Lloyd, D.G., 2012. Whole body
kinematics and knee moments that occur during an overhead catch and landing task in
sport. Clinical Biomechanics 27, 466-74.
Dillard, B., 2010. Hey, who turned off the lights?, Chance, Springer. p. 28-37.
Donnelly, C.J., Elliott, B.C., Doyle, T.L.A., Finch, C.F., Dempsey, A.R., Lloyd, D.G., 2012a.
Changes in knee joint biomechanics following balance and technique training and a
season of Australian football. British Journal of Sports Medicine 46, 917-22.
Donnelly, C.J., Lloyd, D.G., Elliott, B.C., Reinbolt, J.A., 2012b. Optimizing whole-body
kinematics to minimize valgus knee loading during sidestepping: implications for ACL
injury risk. Journal of Biomechanics 45, 1491-97.
Dorf, R.C. and Bishop, R.H., 2008. Modern Control Systems. Upper Saddle River, NJ: Pearson
Prentice Hall.
Ford, K. R., Myer, G. D., Toms, H. E., and Hewett, T. E., 2005. Gender differences in the
kinematics of unanticipated cutting in young athletes. Med Sci Sports Exerc, 37(1), 124-
129.
Ford, K. R., Shapiro, R., Myer, G. D., Van Den Bogert, A. J., Hewett, T. E., 2010. Longitudinal
sex differences during landing in knee abduction in young athletes. Medicine and Science
in Sports and Exercise, 42(10), 1923-31.
Griffin, L. Y., Albohm, M. J., Arendt, E. A., Bahr, R., Beynnon, B. D., DeMaio, M., Dick, R.W.,
Engebretsen, L., Garrett, W. E., Hannafin, J. A., Hewett et al., Huston, L. J., Ireland, M.
L., Johnson, R. J., Lephart, S., Mandelbaum, B. R., Mann, B. J., Marks, P. H., Marshall,
S. W., Myklebust, G., Noyes, F.R., Powers, C., Shields Jr., C., Shultz, S.J., Silvers, H.,
Slauterbeck, J., Taylor, D. C., Teitz, C. C., Wojtys, E. M., Yu, B., 2006. Understanding
and Preventing Noncontact Anterior Cruciate Ligament Injuries A Review of the Hunt
Valley II Meeting, January 2005. Am. J. Sports Med. 34(9), 1512-1532.

125
Haggerty, S., Jiang, L. T., Galecki, A., Sienko, K. H., 2012. Effects of biofeedback on
secondary-task response time and postural stability in older adults. Gait & Posture, 35(4),
523-528.
Hausdorff, J. M., Mitchell, S. L., Firtion, R., Peng, C. K., Cudkowicz, M. E., Wei, J. Y., and
Goldberger, A. L., 1997. Altered fractal dynamics of gait: reduced stride-interval
correlations with aging and Huntington’s disease. Journal of Applied Physiology, 82(1),
262-269.
Hausdorff, J. M., 2007. Gait dynamics, fractals and falls: finding meaning in the stride-to-stride
fluctuations of human walking. Human movement science, 26(4), 555-589.
Hewett, T. E., Myer, G. D., Ford, K. R., Heidt, R. S., Colosimo, A. J., McLean, S. G., van den
Bogert, A. J., Paterno, M.V., Succop, P., 2005. Biomechanical measures of
neuromuscular control and valgus loading of the knee predict anterior cruciate ligament
injury risk in female athletes A prospective study. The American Journal of Sports
Medicine, 33(4), 492-501.
Hewett, T.E., Myer, G.D., Ford, K.R., 2006. Anterior cruciate ligament injuries in female
athletes: Part 1, mechanisms and risk factors. Am. J. Sports Med. 34, 299-311.
Hur, P., Duiser, B. A., Salapaka, S. M., Hsiao-Wecksler, E. T., 2010. Measuring robustness of
the postural control system to a mild impulsive perturbation. Neural Systems and
Rehabilitation Engineering, IEEE Transactions on, 18(4), 461-467.
Kuo, B. C., and Golnaraghi, M. F.,2003. Automatic control systems (Vol. 4). New York:
John Wiley & Sons.
Magdy, A., Saeb, M., Mohamed, A. B., and Khadragi, A.,2013. The Haar Wavelet Transform of
the DNA Signal Representation. World Academy of Science, Engineering and
Technology,73 667-673.
Marwan, N., Carmen Romano, M., Thiel, M., and Kurths, J., 2007. Recurrence plots for the
analysis of complex systems. Physics Reports, 438(5), 237-329.
Mitra, S. K., 2012. Is Hurst Exponent Value Useful in Forecasting Financial Time Series?. Asian
Social Science, 8(8).
Mokhtarzadeh, H., Yeow, C.H., Goh, J.C.H., Oetomo, D., Malekipour, F., Lee, P.V.S., 2013.
Contributions of the Soleus and Gastrocnemius muscles to the anterior cruciate ligament
loading during single-leg landing. J. Biomech. 46, 1913-1920.
Myer, G. D., Chu, D. A., Brent, J. L., and Hewett, T. E., 2008. Trunk and hip control
neuromuscular training for the prevention of knee joint injury. Clinics in Sports
Medicine, 27(3), 425-448.
Myklebust, G., Engebretsen, L., Braekken, I. H., Skjolberg, A., Olsen, O. E., and Bahr, R., 2003.
Prevention of anterior cruciate ligament injuries in female team handball players: A
prospective intervention study over three seasons. Clinical Journal of Sports Medicine,
13(2), 71–78.
Nyland, J., Klein, S., Caborn, D.N., 2010. Lower extremity compensatory neuromuscular and
biomechanical adaptations 2 to 11 years after anterior cruciate ligament reconstruction.
Arthroscopy 26, 1212-1225.
Todd Ogden.,1997. Essential wavelets for statistical applications and data analysis. Springer.
Podraza, J.T., White, S.C., 2010. Effect of knee flexion angle on ground reaction forces, knee
moments and muscle co-contraction during an impact-like deceleration landing:
implications for the non-contact mechanism of ACL injury. Knee 17, 291-295.
126
Ramsey, J. B., 1999. The contribution of wavelets to the analysis of economic and financial data.
Philosophical Transactions of the Royal Society of London. Series A: Mathematical,
Physical and Engineering Sciences, 357(1760), 2593-2606.
Riemann, B.L., Lephart, S.M., 2002. The Sensorimotor System, Part II: The Role of
Proprioception in Motor Control and Functional Joint Stability. Journal of athletic
training 37, 80-84.
Sun, J., Chen, M., and Karimi, K. J., 2008. Aircraft power system harmonics involving single-
phase PFC converters. Aerospace and Electronic Systems, IEEE Transactions on, 44(1),
217-226.
Tamura T, Sekine M, Ogawa M, Togawa T, and Fukui Y., 1997.Classification of acceleration
waveforms during walking by wavelet transform. Methods of Information in Medicine,
36, 356–359.
Thomasson, N., Hoeppner, T. J., Webber Jr, C. L., and Zbilut, J. P., 2001. Recurrence
quantification in epileptic EEGs. Physics Letters A, 279(1), 94-101.
Utturkar, G. M., Irribarra, L. A., Taylor, K. A., Spritzer, C. E., Taylor, D. C., Garrett, W. E., and
DeFrate, L. E., 2013. The effects of a valgus collapse knee position on in vivo ACL
elongation. Annals of biomedical engineering, 41(1), 123-130.
Wachowiak MP, Rash GS, Quesada PM, and Desoky AH., 2000. Wavelet based noise removal
for biomechanical signals: a comparative study. IEEE Transactions on Biomedical
Engineering 2000;47(3):360–8.
Walker, J.S., A primer on wavelets and their scientific applications. 2008: CRC Press.

127
5.7 Appendix
5.7. 1 Daubechies 4 Wavelet Transform Generation
Daubechies wavelet was developed by Ingrid Daubechies (1990). Daubechies 4
approximation (a) and detail (d) waveforms are generated by computing the scalar product of the
original waveform (f) with the scaling 1
mV and mother wavelet functions 1
mW , respectively
(Eqs. 5.1-5.2). The scaling and wavelet functions are expressed in terms of their Fourier
transforms (Eqs. 5.3.-5.4).
(5.1) ,...,,, 1
2/
1
3
1
2
1
1
1
2/
1
NN fVfVfVfVVfa
(5.2) ,...,,, 1
2/
1
3
1
2
1
1
1
2/
1
NN fWfWfWfWWfd
(5.3) 2
ˆ2
2
o
i
me
(5.4) 22
1ˆ
1
j
j
om
5.7.2 Hurst Exponent (H) Calculation
The Hurst exponent (H) calculation is a multistep process. First the time series mean and
standard are calculated and the former is subtracted from the waveform to create a mean adjusted
series. Next the cumulative deviate of this mean adjusted series is calculated and the series range
determined. A rescaled range is calculated using the series range and standard deviation results.
The log of the ratio of the rescaled range to standard deviation metric is plotted against the log of
the time series length. The slope of the resulting linear plot is the Hurst exponent (H) (Mitra
2012).
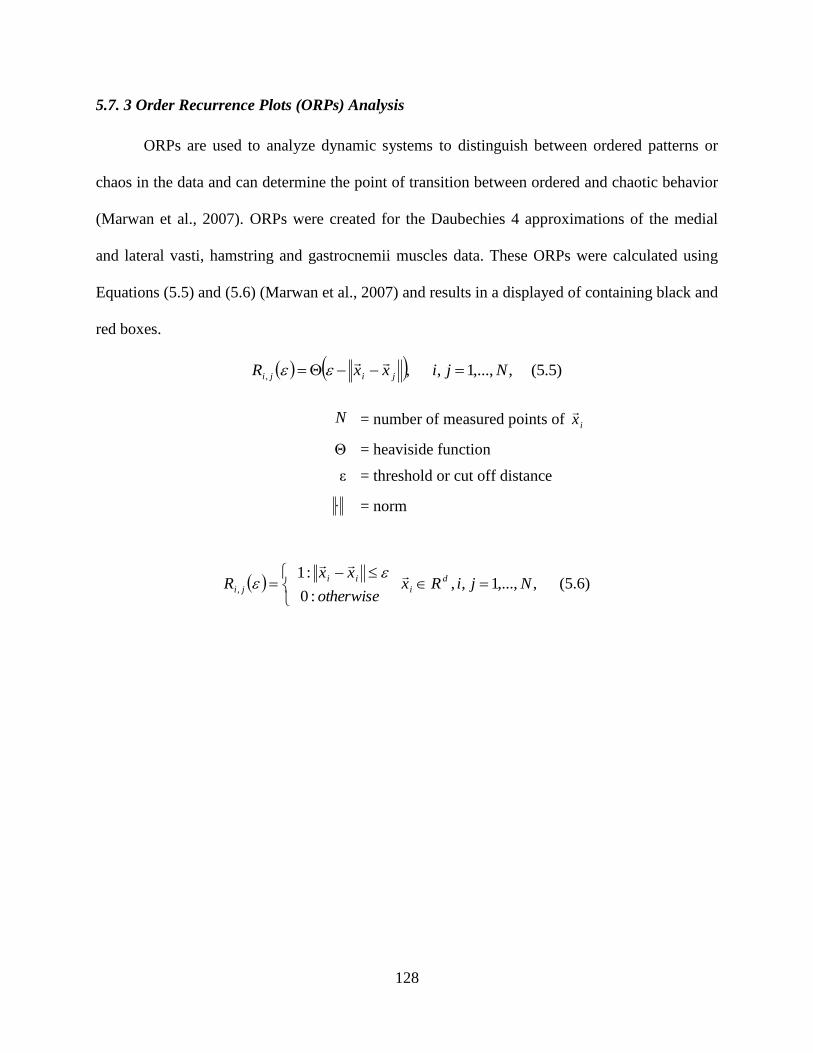
128
5.7. 3 Order Recurrence Plots (ORPs) Analysis
ORPs are used to analyze dynamic systems to distinguish between ordered patterns or
chaos in the data and can determine the point of transition between ordered and chaotic behavior
(Marwan et al., 2007). ORPs were created for the Daubechies 4 approximations of the medial
and lateral vasti, hamstring and gastrocnemii muscles data. These ORPs were calculated using
Equations (5.5) and (5.6) (Marwan et al., 2007) and results in a displayed of containing black and
red boxes.
(5.5) ,,...,1, ,, NjixxR jiji
N = number of measured points of ix
Θ = heaviside function
ε = threshold or cut off distance
= norm
(5.6) ,,...,1,, :0
:1 , NjiRx
otherwise
xxR d
i
ii
ji
129
CHAPTER VI
CONCLUSION
6.1 Significance of Research
Effective non-contact ACL injury intervention programs have the enormous potential to
drastically reduce the incidence of ACL injuries in active populations. However, improving the
effectiveness of training programs is challenging because the cause-effect relationship between
muscle function and joint biomechanics with respect to ACL injury is not well understood.
Dynamic simulations provide the capability to determine the functional roles of individual
muscles, which is essential to elucidating this relationship. Utilizing dynamic simulations helps
to determine the biomechanical factors that influence knee motion to discern the cause of ACL
injury. We anticipate that the insights gained from this work will provide new guidelines for
designing ACL injury prevention programs resulting in a significant drop in ACL injuries.
Models and computational tools developed will find broad applications. Numerous
studies have been performed to record neuromuscular excitation patterns, understand muscle
contraction dynamics, characterize musculoskeletal geometry, and quantify multijoint movement
kinematics. However, linking the detailed knowledge of these elements of the
neuromusculoskeletal system to create an integrated understanding of normal and disordered
movement remains a major challenge in the application of biomechanics to a wide range of
biomechanics problems and basic science research.
This work developed methodologies for interpreting the dynamic functions of muscles
during movement, generated novel data mining approaches to undercover the ACL injury
mechanism, and provided a general computational framework for pursuing further research. The
130
simulations were developed in freely available musculoskeletal modeling and simulation
software, which enables these results to be shared with other research groups. Over the past two
years, there have been over 60,000 downloads of models, simulations, and software from the
project’s website (see simtk.org/home/opensim) with over 9,000 active users of these freely
available biomechanics tools. This project adds to this development and will further highlight the
need for additional studies of the neuromuscular biomechanics of persons at high risk for ACL
injury.
6.2 Research Innovation
The principles that govern the relationships between muscles contributions and
purposeful movement in individuals during single-leg jump landings have not been uncovered.
For decades, experimental approaches have advanced our understanding of biomechanics.
However, the inability to experimentally measure muscle forces and identify the cause-effect
relationships (i.e. muscle contributions to movement) between muscle forces and joint
biomechanics has limited research progress. The difficulty in determining an individual muscles’
contribution to movement stems from the fact that muscles accelerate joints that they do not span
and body segments to which they are not attached. Thus to determine a muscles contribution to
movement required a novel approach driven by the use of a unique set of tools to accomplish this
task.
Muscle-actuated dynamic simulations provide a scientific framework, in combination
with complementing experimental approaches for estimating important variables and identifying
cause-and-effect relationships. In this study, muscle-actuated dynamic simulations, data mining
and motion capture analysis were used to bridge the gap in our understanding of human
movement.

131
This work advanced basic knowledge and understanding in this arena. It meshed the
experimental capabilities of physicians, physical therapist, and rehabilitation scientists with the
computer simulation capabilities of engineers, mathematicians, and computer scientist to address
important (biomechanical) research questions. An added benefit of this research was that the
development of subject-specific models was done using freely available open source software.
Such results that are readily shared will hopefully accelerate the understanding of the underlying
mechanisms behind injuries and movement disorders.
6.3 Fundamental Contributions
The objective of this research was to determine individual muscle force contribution to
single-leg jump landing, assess how muscles function to support the knee against elevated
abduction moment, identify individuals at risk for ACL injury and their associated muscle
function to develop a muscle-targeted training ACL injury prevention program to mitigate ACL
injury risk. The work presented here was able to accomplish all of these objectives.
Computed muscle control and induced acceleration analysis are techniques that have
been previously used to study muscle contribution to walking and running. However, the novelty
of their use in this work was in the development of the subject-specific models and application of
these tools to investigate ACL injury risk. Models have to be tailored based on the research
question being asked. Because ACL injuries are often the result of the combined loading of the
ligament in all three planes, the model had to include a knee that allowed for such movement.
Significant thought and time was spent adjusting this knee model to account for frontal plane
knee rotation while also including torque actuators to represent the ligament and muscle forces
that eliminated unrealistic joint motion in that plane. In addition, the decision to increase the
models muscle forces uniformly by 60% was significant because all too often muscle forces are

132
increased at random per the researcher’s discretion. This makes cross study comparisons of
muscle force generation results difficult. This is a legitimate problem in this research and
highlights a need for the development of an agreed upon standard for modifying maximum
isometric muscle force. Furthermore, the use of both CMC and IAA to investigate muscle
contributions in single-leg jump landings is relatively new; despite the fact that decades of
research has shown that nearly half of all non-contact injuries are the result of single-leg jump
landing (Cochrane et al., 2007; Laughlin et al., 2011; Mokhtarzadeh et al., 2013). The
implementation of these tools for investigating single-leg jump landing with respect to ACL
injury is an important step in ACL research. The results showed that greater emphasis should be
placed on gastrocnemii muscles for their role in supporting the knee during single-leg jump
landing and working to counterbalance the force produced by the quadriceps. More specifically,
IAA quantified that the medial gastrocnemii was the greatest contributor to resisting knee
abduction and internal rotation during single-leg jump landing while both the medial and lateral
gastrocnemii have the potential to increase knee flexion during landing all of which can reduce
ACL injury risk. These results suggest that the gastrocnemii play a significant role in stabilizing
and supporting the knee and help oppose the quadriceps. Such results may affect how researchers
develop ACL injury prevention programs and could potentially change the direction of ACL
research.
Data mining is a technique that draws from many different fields to detect patterns within
large datasets. Its name denotes the exploratory nature of this research area and it was used in
this work to explore and discover patterns within biomechanical data. Principal component and
wavelet analyses were used to identify critical features in surface EMG data associated with
133
potential ACL injury risk. PCA identified the gastrocnemii muscle activation as a source of
variability between stable and unstable individuals while wavelet analysis found that strong
muscle patterns between the gastrocnemii muscles were associated with individuals with stable
frontal plane joint kinetics. Neither of these findings would have been obtained without the
implementation of the Nyquist and Bode stability criteria. Drawing from control theory, these
techniques were able to effectively classify individuals as exhibiting stable, marginally stable
and unstable joint biomechanics with the potential to characterize these individuals as being at
low-, moderate- and high risk for ACL injury. The significance of using stability for this
application is that it provides researchers with a robust metric for classifying ACL injury risk
that is independent of others’ joint biomechanics. Thus a researcher could bring one individual
into their laboratory and after running a few trials could assess their risk for ACL injury that day
without having to perform the same test on a larger cohort of individuals to gain insight about
their risk for injury. This application of stability in this context has not been previously explored.
A seminal benefit of this work was that the classification of individuals into the stable,
marginally stable and unstable populations and its impact on devising muscle activation
strategies and/or patterns within these groups using PCA and wavelet analysis.
Musculoskeletal models and computational tools are critical in biomechanics research as
they allow researchers to evaluate the causal relationship between joint movement and muscle
function. The key contributions of this work was the creation of subject-specific dynamic
simulations that assessed individual muscles contribution to ACL injury while developing unique
methodologies for classifying joint stability and identifying muscle activation patterns distinct to
individuals at varying levels of ACL injury risk. Both of these contributions can be used to
134
develop more effective muscle-targeted ACL injury intervention and prescreening tools to help
reduce ACL injury rates.
6.4 Summary
All four studies found that the gastrocnemii muscles played a greater role in joint stability
than previously believed. The CMC analysis indicated that the gastrocnemii generated forces
comparable to the quadriceps muscles to help resist excessive sagittal plane motion while IAA
results found the medial gastrocnemii was the strongest contributor to flex and adduct the knee
which could help reduce the load exerted on the ACL. Similarly, the results of the data mining
studies concluded that gastrocnemii muscle activation variability was associated with joint
stability while the gastrocnemii muscles displayed comparable activation patterns in the stable
trials.
The results of these studies can be used to develop muscle-targeted ACL training
intervention and prescreening programs. The results of the dynamic simulation based studies
(Chapters II and III) can be used for the muscle targeted ACL training intervention program. And
the findings from the data mining studies (Chapters IV and V) could be used to develop an ACL
injury prescreening tool. The findings of the latter studies are more preliminary. The
development of an effective ACL injury prescreening could have a significant impact on
reducing ACL injury rates. The methodologies developed in this work have been successful in
quantifying joint stability and have begun to identify critical patterns within the muscles via the
Hurst exponent and ORPs. Additional work is still needed to define the exact combination of
Hurst exponents and/or exact pattern in the ORP that signals potential ACL injury. Future work
should focus on analyzing sEMG data using ORPs with a moving window to detect time
dependent ORP changes and their connection with muscle activations and joint stability.

135
This work was successful in investigating the relationship between joint biomechanics
and muscle function with respect to ACL injury and how these findings may have a significant
impact on ACL research.
136
6.5 Glossary
Abduction Movement where the limb moves away from the midline of the body.
Acceleration The rate of change of velocity. Measure of the change in a body’s
velocity.
Adduction Movement where the limb moves toward the midline of the body
Anterior Refers to the front of the body.
Anterior cruciate ligament It is one of four ligaments in the knee that connects the femur to the
tibia. It attaches from the anterior surface of the midtibial plateau to
the distal notch on the femur.
Biceps femoris longus One of the lateral hamstring muscles. It functions to flex the knee.
Bode stability criterion A technique used to assess the stability of a system. Stable systems
have positive gain and phase margins while unstable systems have
negative gain and phase margins.
Center of mass The point about which a body’s mass is equally distributed.
Computed muscle control An algorithm that uses optimization to estimate individual muscle
excitation during dynamic movements.
Condyle The round projection or prominence on a bone.
Daubechies wavelet A wavelet transform similar to the Haar wavelet that is generated by
calculating the scalar product of the running averages and differences
with the scaling signals and wavelets, respectively.
Degree of freedom A single coordinate of relative motion between two bodies. Such a
coordinate responds without constraint or imposed motion to
externally applied forces or torques. For translational motion, a DOF
is a linear coordinate along a single direction. For rotational motion, a
DOF is an angular coordinate about a single, fixed axis.
Distal The more distant of two or more objects with respect to the origin or
point of reference.
Dorsiflexion The motion that occurs when the toes move up toward the tibia.
Extension Movement that moves two limbs farther apart, increasing the angle
between them, which occurs in the sagittal plane.
External Rotation Motion that rotates away from the midline of the body.
Femur The bone that is located between the hip and knee joints.
137
Flexion Movement that moves two limbs closer together, reducing the angle
between them, which occurs in the sagittal plane.
Force An action or effect applied to the body that tends to produce
acceleration.
Force plate A transducer that is set in the floor to measure about some specified
point, the force and torque applied by the foot to the ground. These
devices provide measures of the three components of the resultant
ground reaction force vector and the three components of the resultant
torque vector.
Forward dynamics Utilizes know known forces and torques to calculate motion.
Frontal plane This is one of three planes used to divide and describe the body. This
plane separates the anterior and posterior sections of the body. Knee
adduction-abduction occurs in this plane.
Generalized coordinates A set of coordinates (or parameters) that uniquely describes the
geometric position and orientation of a body or system of bodies. Any
set of coordinates that are used to describe the motion of a physical
system.
Ground reaction force The force exerted by the ground that is equal and opposite to a force
applied to the ground by an impacting object (e.g. foot).
Haar wavelet A simple wavelet that is used to transform the data into two wavelets
that are half of the original signal called the trend and fluctuation to
analyze these wavelets for hidden patterns in the data.
Hurst exponent A metric for calculating the ‘self-similarity’ property of a time series.
Induced acceleration analysis Determines the accelerations caused or “induced” by individual
muscle forces acting on a model (e.g., contribution of muscle forces
to knee accelerations).
Inferior Refers to the lower or bottom half of a structure or body.
Injury Describes damage to the tissue caused by physical trauma.
Internal rotation Motion that rotates toward the midline of the body.
Inverse kinematics A process that derives joint angles from experimental marker data.
Joint stability The ability of a joint to resist dislocation and maintain an appropriate
functional position throughout its range of motion.
Kinematics Describes movement without regard to the forces involved.
Kinetics Describes movement with regard to the forces involved.

138
Knee adduction-abduction Motion of the long axis of the shank within the frontal plane as seen
by an observer positioned along the anterior-posterior axis of the
thigh.
Knee flexion-extension Motion of the long axis of the shank within the sagittal plane as seen
by an observer positioned along the medial-lateral axis of the thigh.
Knee internal-external rotation Motion of the medial-lateral axis of the shank with respect to the
medial-lateral axis of the thigh within the transverse plane as viewed
by an observer positioned along the longitudinal axis of the shank.
Laplace Transform Technique that converts a signal from the time to frequency domain.
Lateral Located away from the midline or center of the body.
Lateral gastrocnemius One of the muscles that makes up the calf muscle complex. It lies on
the lateral side of the posterior portion of the tibia. It functions to
plantarflex the foot and flex the knee.
Medial Refers to the midline or center of the body.
Medial gastrocnemius One of the muscles that makes up the calf muscle complex. It lies on
the medial side of the posterior portion of the tibia. It functions to
plantarflex the foot and flex the knee.
Moment The effect of a force that tends to rotate or bend a body or segment.
Newton Unit of force (N).
Nyquist stability criterion A technique used to assess the stability of a system. When there are
no poles in the right half plane systems are stable if (-1, 0) is not
encircled and unstable if (-1,0) is encircled.
Order recurrence plot Is a unique plot that displays the underlying behavior of a dynamical
system in phase space.
Plantarflexion The motion that occurs when the toes away from the tibia.
Posterior Refers to the back plane of the body.
Principal component analysis A statistical technique that reduces large high-dimensional datasets to
a smaller subset of orthogonal vectors called principal components to
identify patterns within the data.
Proximal The closer of two or more objects with respect to the origin or point
of reference.
Rectus femoris It is one of the quadriceps muscles that resides in the middle of the
thigh functions to extend the knee.
139
Residual reduction analysis A process that employs forward dynamics to create a simulation that
recreates the inverse kinematic motion using torques actuators acting
at/on the joints to create dynamically consistent models.
Sagittal plane One of three planes used to divide and describe the body. This plane
divides the right and left halves of the body. Knee flexion-extension
occurs in this plane.
Semimembranosus A medial muscle located in the hamstring. It is more medial than the
semitendinosus muscle. It functions to flex the knee.
Semitendinosus A medial muscle located next to the semimembranosus in the
hamstring. It functions to flex the knee.
Single-leg jump landing Describes when an individual lands solely on one leg after an initial
jump or hop.
Soleus It is one of the muscles that makes up the calf muscle. It functions to
plantarflex the foot.
Superior Refers to the upper or top half of a structure or body.
Tibia One of two bones located between the knee and ankle joint.
Transverse plane One of three planes used to divide and describe the body. This plane
dives the superior and inferior halves of the body. Knee internal-
external rotation occurs in this plane.
Torque The effect of a force that tends to cause a rotation or twisting about an
axis.
Valgus Medial deviation of a joint (e.g., knock-kneed).
Varus Lateral deviation of a joint (e.g., bowlegged).
Vastus Intermedius It is one of the quadriceps muscles. It stretches from the front to
lateral portion of the femur. It functions to extend the knee.
Vastus Lateralis It is the largest of the quadriceps (i.e. thigh) muscles. It is the most
lateral of the quadriceps muscles and functions to extend the knee.
Vastus Medialis It is the medial quadriceps muscle and functions to extend the knee.
Velocity The rate of change of position of an object.
Wavelets They are waveforms of varying duration, extracted from an original
signal, that retains hidden information or patterns that may not be
apparent in the original signal.
Weight-acceptance phase Defined as the time from the initial heel strike to the first trough in
the ground reaction force profile.
140
VITA
Kristin Denise Morgan was born March 19, 1985 in Albany, New York. She graduated
from Hampton Roads Academy, Newport News, Virginia in 2003. She received her Bachelors
of Science in Biomedical Engineering from Duke University, Durham, North Carolina in 2007, a
Master’s in Biomedical Engineering from Virginia Commonwealth University, Richmond,
Virginia in 2009, before pursuing her PhD at the University of Tennessee in 2010.
Copyright © 2022 FDOKUMEN