Ultrastructure of cementum and periodontal ligament after ...
Increased in-vivo tibiofemoral cartilage contact deformation inanterior cruciate ligament-deficiency
Samuel K. Van de Velde, MD, Jeffrey T. Bingham, MS, Ali Hosseini, MS, Michal Kozanek,MD, Louis E. DeFrate, ScD, Thomas J. Gill, MD, and Guoan Li, PhDSamuel K. Van de Velde, Jeffrey T. Bingham, Ali Hosseini, Michal Kozanek, Thomas J. Gill, andGuoan Li: Bioengineering Laboratory, Massachusetts General Hospital/Harvard Medical School,Boston, MA. Louis E. DeFrate: Orthopaedic Research Laboratories, Duke University MedicalCenter, Durham, NC.
AbstractObjective—To investigate the in-vivo cartilage contact biomechanics of the tibiofemoral jointfollowing anterior cruciate ligament (ACL) injury.
Methods—Eight patients with an isolated ACL injury in one knee and the contralateral sideintact participated in the study. Both knees were imaged using a specific MR sequence to createthree-dimensional knee models of bone and cartilage. Next, each patient performed a lunge asimages were recorded with a dual fluoroscopic system from 0° to 90° of flexion. The three-dimensional knee models and fluoroscopic images were used to reproduce the in-vivo kneeposition at each flexion angle. With these series of knee models, the location of tibiofemoralcartilage contact, size of contact area, cartilage thickness at the contact area, and magnitude ofcartilage contact deformation were compared between the intact and ACL-deficient knees.
Results—Rupture of the ACL changed the cartilage contact biomechanics from 0° to 60° offlexion in the medial knee compartment. The location of peak cartilage contact deformation on thetibial plateaus was more posterior and lateral; the contact area was smaller; the average cartilagethickness at the tibial cartilage contact area was thinner; and the resultant magnitude of cartilagecontact deformation was increased, compared with the contralateral knee. Similar changes wereobserved in the lateral compartment, with increased cartilage contact deformation from 0° to 30°of knee flexion in ACL deficiency.
Conclusion—ACL deficiency alters the in-vivo cartilage contact biomechanics, by shifting thecontact location to smaller regions of thinner cartilage, and increasing the magnitude of cartilagecontact deformation.
INTRODUCTIONMany experts have abandoned the long-held belief that knee osteoarthritis is astraightforward “wear and tear” disease of cartilage (1). Instead, the metabolic and structuralchanges of osteoarthritis are currently viewed as the adaptive response of synovial joints to avariety of genetic, constitutional, or biomechanical insults (2). Nevertheless, it remainswidely accepted that knee joint instability is an important risk factor in the aetiopathogenesisof the disease (3–5). The assumption that abnormal kinematics and consequent abnormalloading within the joint initiate knee osteoarthritis underlies much of current osteoarthritisresearch and orthopaedic practice: transection of the anterior cruciate ligament (ACL) is a
Correspondence to: Guoan Li, PhD, Bioengineering Laboratory, Massachusetts General Hospital/Harvard Medical School, 55 FruitStreet - GRJ 1215, Boston, MA 02114 ([email protected]), Tel: (617) 726-6472, fax: (617) 724-4392.
NIH Public AccessAuthor ManuscriptArthritis Rheum. Author manuscript; available in PMC 2010 December 1.
Published in final edited form as:Arthritis Rheum. 2009 December ; 60(12): 3693–3702. doi:10.1002/art.24965.
NIH
-PA Author Manuscript
NIH
-PA Author Manuscript
NIH
-PA Author Manuscript
well-established animal model to induce osteoarthritis (6,7); reconstruction of the rupturedACL has become one of the most frequent orthopaedic procedures in an attempt to restorenormal joint motion and prevent long-term complications (3); and a number of alignment-modifying therapeutic options, including bracing and osteotomy, might be used to alter therate of osteoarthritis progression (8). However, even though osteoarthritis is widely believedto result, in part, from local mechanical factors acting within the context of systemicsusceptibility, little is known regarding the extent of the mechanical alteration in the kneejoint following rupture of the ACL. In general, the changes in kinematics that are observedin unstable knee joints are very minimal – in the order of millimeters (9–11). Yet, theseminimal alterations in kinematics are believed to trigger the devastating destruction of thearticular cartilage.
Measuring the articular cartilage function in the human knee joint with an acceptableaccuracy is technically challenging. Cartilage morphology of the knee has been extensivelyinvestigated using both cadaveric and living knee specimens with various techniques, suchas needle probes, ultrasound, stereophotogrammetry and magnetic resonance (MR) imaging(12–18). Recently, several studies have presented data on tibiofemoral contact kinematics inliving subjects. Both open and closed MR imaging techniques have been used to determinetibiofemoral contact areas and locations for a variety of activities (19–21). Others have useda combination of either computer tomography (CT) or MR imaging with fluoroscopy toestimate cartilage contact locations during lunge in healthy (22,23) and ACL-deficient knees(24,25). In general, the cartilage contact location in these studies has been estimated basedon the closest interarticular distance between the bony surfaces of the tibiofemoral joint(24), or the centroid of the tibiofemoral cartilage contact area (25). While these previousstudies have provided valuable data on the cartilage contact location, essential in-vivocartilage contact biomechanics such as cartilage contact area, cartilage thickness, andcartilage contact deformation in a knee joint at risk for osteoarthritis remain unclear.
In this study, we hypothesized that rupture of the ACL changes the cartilage contactbiomechanics of the tibiofemoral joint, with a resultant increase in the magnitude ofcartilage contact deformation. We used a combined dual fluoroscopic and MR imagingtechnique to analyze the effects of ACL deficiency on the location of tibiofemoral cartilagecontact, the size of contact area, the cartilage thickness at the contact area, and themagnitude of cartilage contact deformation during in-vivo weight bearing knee flexion from0° to 90°.
PATIENTS AND METHODSPATIENT SELECTION
Eight patients (five males, three females; age range 19–38 years old) with complaints ofknee laxity were included in the study. The included patients had diagnosed acute, isolatedACL ruptures documented by clinical examination (8 mm Lachman with no end point, agrade 2 pivot shift measured by the same orthopaedic surgeon, average International KneeDocumentation Committee score 63.5 ± 8.7, average manual maximum injured-minus-intactknee displacement 4.2 ± 1.9 mm, measured with the KT-1000 arthrometer (MEDmetrics,San Diego, Ca) by the same physical therapist) and MR imaging. All patients had healthycontralateral knees. Patients had been injured within an average of 4.4 ± 3 months of testing.Injury to other ligaments, noticeable cartilage lesions, meniscal damage and injury to theunderlying bone were reasons for exclusion from the study. Five of these eight patients havebeen included in our previous studies of the six degrees-of-freedom tibiofemoral kinematics(9) and the motion of the tibiofemoral cartilage contact points in ACL deficiency (25).
Each patient signed a consent form that had been approved by our institutional review board.
Van de Velde et al. Page 2
Arthritis Rheum. Author manuscript; available in PMC 2010 December 1.
NIH
-PA Author Manuscript
NIH
-PA Author Manuscript
NIH
-PA Author Manuscript
IMAGING PROCEDUREMR and dual orthogonal fluoroscopic imaging techniques have been described in detail inprevious publications (9,25,26). In short, both the left and right knee were imaged with anMR scanner to create three-dimensional (3D) meshed models of the knees using a protocolestablished in our laboratory (9). To reduce the effects of load history on cartilage thickness,patients were asked to refrain from all strenuous activity such as lifting, running, stairclimbing for at least four hours prior to their visit, and to remain non-weight bearing forapproximately one hour prior to the MR imaging of the knee. Each patient was asked to laysupine with their knee in a relaxed, extended position while sagittal plane images wereacquired with a 3.0 Tesla MR scanner (Siemens, Malvern, PA). The MR scanner wasequipped with a surface coil and employed a 3D double echo water excitation sequence(field-of-view=16×16×12 cm, voxel resolution=0.31×0.31×1.00 mm, time of repetition(TR)=24 ms, time of echo (TE)=6.5 ms, and flip angle=25°). Each scan lasted forapproximately twelve minutes. The images were then imported into solid modeling software(Rhinoceros, Robert McNeel and Associates, Seattle, Wa) to construct 3D surface meshmodels of the tibia, fibula, femur and articulating cartilage. The meshes were assembledusing a point density of 80 vertices/cm2 and triangular facets with an average aspect ratio oftwo.
After the MR image-based computer models were constructed, both knees of each patientwere simultaneously imaged using two orthogonally placed fluoroscopes (OEC 9800; GE,Salt Lake City, UT) as the patient performed a single leg quasi-static lunge at 0°, 15°, 30°,60°, and 90° of flexion. At each flexion angle the patient was asked to pause for fiveseconds while simultaneous fluoroscopic images were taken. Throughout the experiment,the lower limb being tested supported the patient’s body weight, while the other limbprovided stability. The time elapsed between the MR scan and the lunge activity wasapproximately fifteen minutes.
Next, the fluoroscopic images were imported into solid modeling software and placed in theorthogonal planes based on the position of the fluoroscopes during the imaging of thepatient. Finally, the 3D MR image–based knee model of the patient was imported into thesame software, viewed from the two orthogonal directions corresponding to the orthogonalfluoroscopic setup used to acquire the images, and independently manipulated in six degreesof freedom inside the software until the projections of the model match the outlines of thefluoroscopic images. When the projections matched the outlines of the images taken duringin-vivo knee flexion, the model reproduced the in-vivo position of the knee. This system hasan error of less than 0.1 mm and 0.3° in measuring tibiofemoral joint translations androtations, respectively (9). When comparing the dual fluoroscopic model matchingtechnique with tantalum bead matching – a technique similar to RoentgenStereophotogrammetric Analysis, the difference between the two techniques in theproximodistal direction (i.e. analogous to the measured apparent penetration) was 0.075 ±0.13 mm (27).
DATA ANALYSISIn this study, cartilage thickness was calculated by finding the smallest Euclidian distanceconnecting a vertex of the articular surface to the cartilage-bone interface of the 3D surfacemesh models. The size of the contact area between the tibia and femur was determined bycomputing the area of tibial cartilage that intersected the femoral cartilage (26). Thecartilage contact deformation was then defined for each vertex of the articular surface meshas the amount of cartilage surface intersection (mm) (Figure 1) divided by the sum of thetibial and femoral cartilage surface thicknesses (mm), multiplied by 100 (26). In this study,cartilage contact location was defined as the location of peak cartilage deformation,
Van de Velde et al. Page 3
Arthritis Rheum. Author manuscript; available in PMC 2010 December 1.
NIH
-PA Author Manuscript
NIH
-PA Author Manuscript
NIH
-PA Author Manuscript

referenced to Cartesian coordinate systems on the tibial plateaus (Figure 2) (23,25,28). Theorigin of each coordinate system was located by the center of a circle, which was fit to theposterior edge of each tibial compartment. The anteroposterior (AP) and mediolateral (ML)axes split each tibial plateau into quadrants. In the anteroposterior direction, a locationanterior to the ML axis was considered positive. In the mediolateral direction, a locationlateral to the AP axis was considered positive.
In a recent study of the in-vivo cartilage contact deformation in the healthy humantibiofemoral joint, a lack of agreement of 14 ± 11% was found between the combined dualfluoroscopic – MR imaging technique and a silicone casting technique in calculating thecartilage contact area of 244 ± 131 mm2 (26). For the present study, we conducted anaccuracy and precision analysis of the tibiofemoral cartilage reconstructions in which themeasurement of cartilage thickness based on 3D MR image–based knee models wascompared to direct cartilage thickness measurement on calibrated digital images of cross-sections of cadaveric specimens, and repeatedly measured for intra- and interobserverprecision (see Appendix). The average absolute difference between the cartilage thicknessvalues based on the 3D MR image–based knee models and those captured from thecadaveric specimens was 0.04 ± 0.01 mm, and excellent intra- and interobserver precisionwas obtained.
A two-way repeated measures analysis of variance and the Student-Newman-Keuls post hoctest were used to determine statistically significant differences in location, contact area,thickness, and cartilage contact deformation between the intact contralateral knees and theACL-deficient knees at each flexion angle. Differences were considered significant at thelevel of p<0.05.
RESULTSLocation of cartilage contact
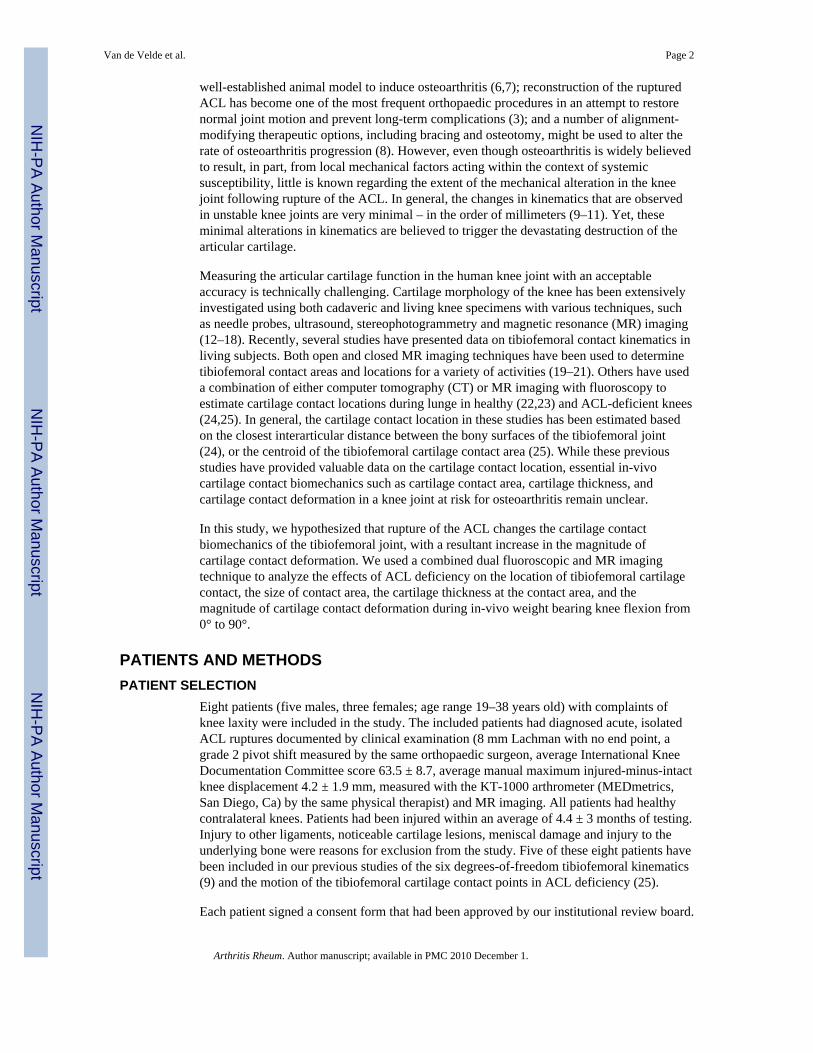
In general, the location of peak cartilage contact deformation on the tibial plateaus was moreposterior and lateral in the ACL-deficient knees, as compared with the healthy contralateralknees. In the medial compartment of the ACL-deficient knees, cartilage contact shiftedposteriorly by an average of 6.3 ± 0.7 mm at 0° and 15° of flexion (Figure 2A), and laterallyby an average of 4.7 ± 0.9 mm between 0° and 60° of flexion (Figure 2B), as compared withthe location in the intact knees. In the lateral compartment, cartilage contact shiftedposteriorly by an average of 3.6 ± 1.3 mm between 0° and 30° of flexion (Figure 2C), andlaterally by an average of 4.2 ± 0.6 mm between 0° and 60° of flexion (Figure 2D) followingrupture of the ACL.
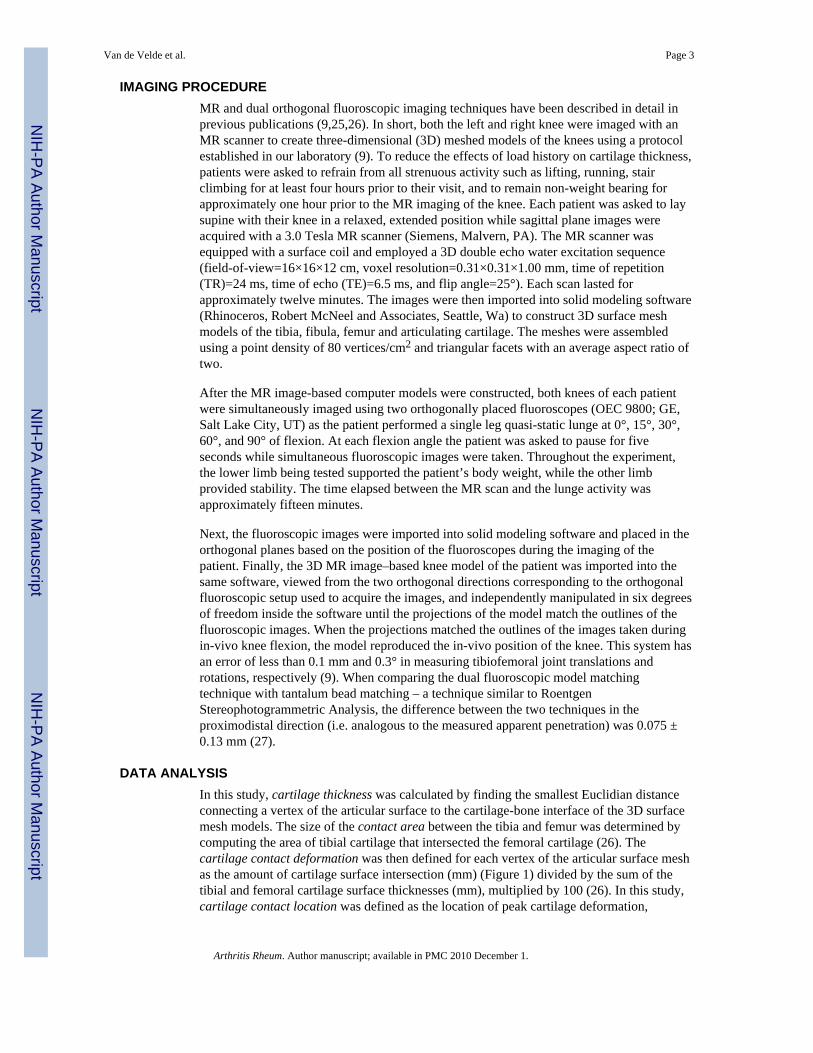
Size of contact areaIn the medial compartment, the cartilage contact area in the ACL-deficient knees wassignificantly smaller from 0° to 60° of flexion (p<0.05), compared with that in the intactknees (Figure 3A). The maximum decrease in cartilage contact area after ACL ruptureoccurred at 0° of flexion (314.4 ± 113.6 mm2 in the intact knee compared with 219.6 ± 69.4mm2 in the ACL-deficient knee, p=0.0025). In the lateral compartment, a decrease in contactarea in the ACL-deficient knees was observed at the lowest flexion angles (Figure 3B)(193.4 ± 75.2 mm2 and 180.0 ± 46.8 mm2 in the intact knee compared with 137.1 ± 64.1mm2 and 141.7 ± 48.7 mm2 in the ACL-deficient knee, at 0° and 15° of flexionrespectively).
Van de Velde et al. Page 4
Arthritis Rheum. Author manuscript; available in PMC 2010 December 1.
NIH
-PA Author Manuscript
NIH
-PA Author Manuscript
NIH
-PA Author Manuscript
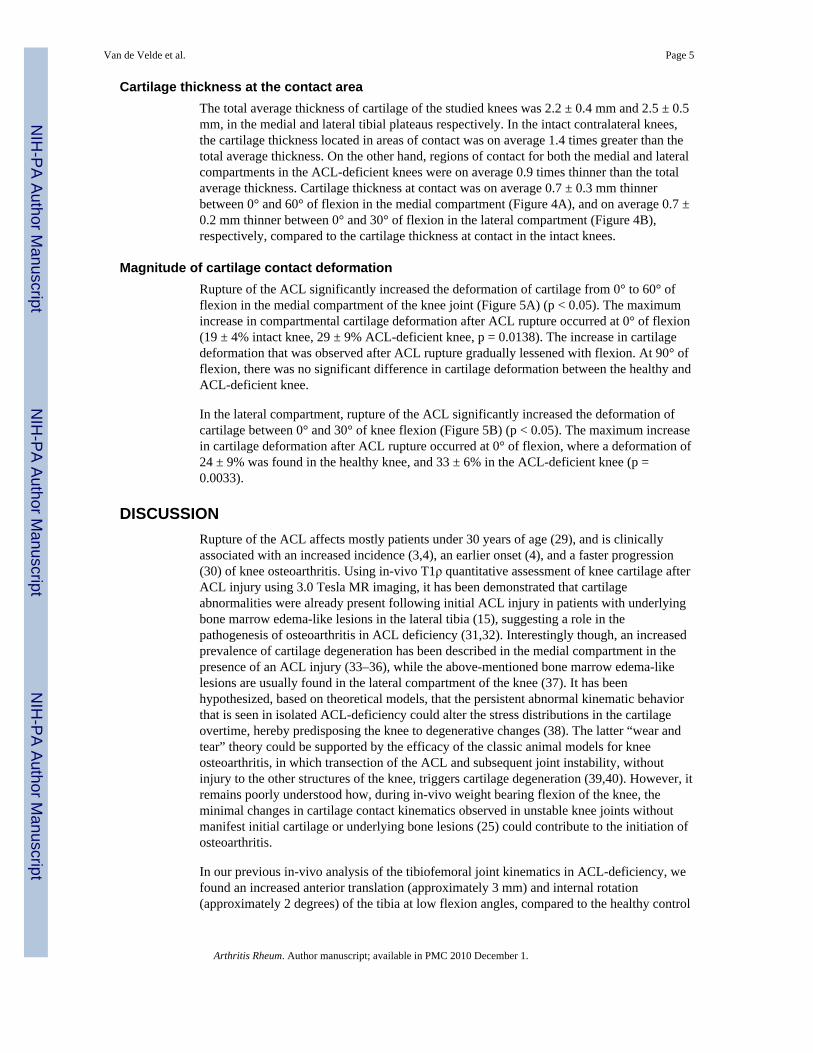
Cartilage thickness at the contact areaThe total average thickness of cartilage of the studied knees was 2.2 ± 0.4 mm and 2.5 ± 0.5mm, in the medial and lateral tibial plateaus respectively. In the intact contralateral knees,the cartilage thickness located in areas of contact was on average 1.4 times greater than thetotal average thickness. On the other hand, regions of contact for both the medial and lateralcompartments in the ACL-deficient knees were on average 0.9 times thinner than the totalaverage thickness. Cartilage thickness at contact was on average 0.7 ± 0.3 mm thinnerbetween 0° and 60° of flexion in the medial compartment (Figure 4A), and on average 0.7 ±0.2 mm thinner between 0° and 30° of flexion in the lateral compartment (Figure 4B),respectively, compared to the cartilage thickness at contact in the intact knees.
Magnitude of cartilage contact deformationRupture of the ACL significantly increased the deformation of cartilage from 0° to 60° offlexion in the medial compartment of the knee joint (Figure 5A) (p < 0.05). The maximumincrease in compartmental cartilage deformation after ACL rupture occurred at 0° of flexion(19 ± 4% intact knee, 29 ± 9% ACL-deficient knee, p = 0.0138). The increase in cartilagedeformation that was observed after ACL rupture gradually lessened with flexion. At 90° offlexion, there was no significant difference in cartilage deformation between the healthy andACL-deficient knee.
In the lateral compartment, rupture of the ACL significantly increased the deformation ofcartilage between 0° and 30° of knee flexion (Figure 5B) (p < 0.05). The maximum increasein cartilage deformation after ACL rupture occurred at 0° of flexion, where a deformation of24 ± 9% was found in the healthy knee, and 33 ± 6% in the ACL-deficient knee (p =0.0033).
DISCUSSIONRupture of the ACL affects mostly patients under 30 years of age (29), and is clinicallyassociated with an increased incidence (3,4), an earlier onset (4), and a faster progression(30) of knee osteoarthritis. Using in-vivo T1ρ quantitative assessment of knee cartilage afterACL injury using 3.0 Tesla MR imaging, it has been demonstrated that cartilageabnormalities were already present following initial ACL injury in patients with underlyingbone marrow edema-like lesions in the lateral tibia (15), suggesting a role in thepathogenesis of osteoarthritis in ACL deficiency (31,32). Interestingly though, an increasedprevalence of cartilage degeneration has been described in the medial compartment in thepresence of an ACL injury (33–36), while the above-mentioned bone marrow edema-likelesions are usually found in the lateral compartment of the knee (37). It has beenhypothesized, based on theoretical models, that the persistent abnormal kinematic behaviorthat is seen in isolated ACL-deficiency could alter the stress distributions in the cartilageovertime, hereby predisposing the knee to degenerative changes (38). The latter “wear andtear” theory could be supported by the efficacy of the classic animal models for kneeosteoarthritis, in which transection of the ACL and subsequent joint instability, withoutinjury to the other structures of the knee, triggers cartilage degeneration (39,40). However, itremains poorly understood how, during in-vivo weight bearing flexion of the knee, theminimal changes in cartilage contact kinematics observed in unstable knee joints withoutmanifest initial cartilage or underlying bone lesions (25) could contribute to the initiation ofosteoarthritis.
In our previous in-vivo analysis of the tibiofemoral joint kinematics in ACL-deficiency, wefound an increased anterior translation (approximately 3 mm) and internal rotation(approximately 2 degrees) of the tibia at low flexion angles, compared to the healthy control
Van de Velde et al. Page 5
Arthritis Rheum. Author manuscript; available in PMC 2010 December 1.
NIH
-PA Author Manuscript
NIH
-PA Author Manuscript
NIH
-PA Author Manuscript

knee (9). Similar findings have been well documented in the literature (10,11). ACLdeficiency also caused an increased medial tibial translation of approximately 1 mm. Thesechanges in the tibiofemoral kinematics after ACL injury were expected to lead to changes inthe tibiofemoral cartilage contact characteristics. Specifically, the medial shift of the tibiaafter ACL deficiency would alter the contact stress distributions in the tibiofemoral cartilagenear the medial tibial spine. Indeed, in the presence of ACL injury, the cartilage contactpoints not only shifted posteriorly –as was expected based on the increased anterior tibialtranslation- but also laterally on the surface of the tibial plateau (25). In the medialcompartment, the contact points shift toward the medial tibial spine, a region wheredegeneration is observed in patients with chronic ACL injuries (33). The question remainedas to whether the ~ 2mm shift in cartilage contact (determined based on the location of thecentroid of the cartilage contact area) to incongruent articular regions of the knee jointaffects the stress on the cartilage of the joint.
In the present study, we found a similar posterior and lateral shift in cartilage contactlocation on the surface of the tibial plateaus following ACL injury. However, whendetermining the location of cartilage contact based on the location where peak cartilagedeformation occurred, we found that the magnitude of the posterior and lateral shiftfollowing ACL rupture (~ 5 mm) was greater than was previously reported (25). A possibleexplanation for the discrepancy in the magnitude of shift based on measurementmethodology could be found in the regional variations in cartilage thickness. Whendetermining the cartilage contact location based on the closest interarticular distancebetween the bony surfaces of the tibiofemoral joint (24), or the centroid of the tibiofemoralcartilage contact area (25), regional variations in the thickness of underlying cartilage arenot taken into account. In the present study, the region of tibiofemoral cartilage contact wasnot only smaller following rupture of the ACL, but had also significantly thinner cartilage atcontact in both medial and lateral compartments, compared to the thickness at contact in theintact knees. In other words, the minimal shift in the location of the cartilage contact area aswas reported previously (25) to regions of thinner cartilage resulted in a considerable changein cartilage loading distribution within the knee joint. Finally, the posterior and lateral shiftof cartilage contact to thinner articular regions increased the magnitude of cartilagedeformation in those regions. The maximum relative increase in cartilage contactdeformation after ACL rupture occurred at full extension in the medial compartment, wherea deformation of 19 ± 4% was found in the healthy knees, and 29 ± 9% in the ACL-deficientknees, compared to 24 ± 9% and 33 ± 6% in the lateral compartment of the healthy andACL-deficient knees, respectively. The relatively greater increase of cartilage deformationin the medial compartment compared to the lateral compartment relates to the increaseddevelopment of osteoarthritis in the medial compartment of the knee joint, as was observedduring arthroscopic examination of 130 ACL-deficient patients (34).
LimitationsDue to the constraints of the imaging technique, motion and deformation of the meniscuswas not detectable in the fluoroscopic images. For the quantitative examination of theinteraction of molecular changes in the meniscus and adjacent cartilage in ACL deficiency,recent developments in MR imaging techniques, for instance T1ρ mapping, representpotential means (41). However, based on our previous validation of the imaging technique(26), the present limitation in meniscal examination by the dual fluoroscopic technique didnot affect the determination of cartilage-cartilage contact, as articular surface meshpenetration was only recorded at the location of in-vivo tibiofemoral cartilage contact.
An additional constraint of the present methodology is that any possible underlyingphysiochemical activities (e.g. cytokine elevation in the joint fluid (42)) which might occurin the knee joint following ACL rupture, could not be analyzed, thereby restricting the
Van de Velde et al. Page 6
Arthritis Rheum. Author manuscript; available in PMC 2010 December 1.
NIH
-PA Author Manuscript
NIH
-PA Author Manuscript
NIH
-PA Author Manuscript

formulation of an inclusive insight in the pathogenesis of osteoarthritis in knee jointinstability. In addition, regional variations in the mechanical properties of the articularcartilage were not taken into account when computing the cartilage contact deformation.This may be a limitation since in-vitro compression of tibial cartilage explants that wereobtained from distinct regions of the joint has demonstrated that chondrocytes displayedregion-specific baseline gene expression, and responded differently to in-vitro mechanicalloading (43).
Patients with discernible cartilage lesions on 3.0 Tesla MRI at 4.5 ± 3 months of injury wereexcluded from the study. However, with our methodology we were unable to appreciate theextent of potential cartilage softening that existed at the time of the analysis, thereby unableto resolve the “chicken-egg” issue. Were our measured deformation differentials attributableto the ACL-deficient knee cartilage being more compliant, rather than increased deformationbeing responsible for the subsequent degeneration onset? Future studies should follow ACL-deficient patients who are treated conservatively for longer periods using a methodologysimilar to that used in this pilot study, with baseline and follow-up imaging biomarkers, suchas T1ρ or delayed gadolinium-enhanced magnetic resonance imaging of cartilage.Tibiofemoral contact deformation and the health of the cartilage could therefore bemonitored with time to quantify any possible biomechanical relationships.
We only acquired data from one functional activity, namely a single leg lunge, using agoniometer to measure the flexion angle. Measurement of the forces and strains in humantissues is currently impracticable, which impedes the extrapolation of the current findings toother weightbearing activities. It is conceivable that the knee joint anteroposterior shearforces during the single leg lunge might be higher than during normal gait (44), thusexaggerating the measured articular surface engagement differentials. However, it wasfound that the magnitude of the anteroposterior shear forces increased with knee flexionduring the descent phase of a lunge performed with a 223-N (50-pound) barbell (45), andthat the knee forces were minimum in the functional range between 0° and 50° of kneeflexion (46). In the present study, the largest deformation differential was observed around0° of knee flexion. In future studies, other in-vivo activities such as walking, running, andstair climbing should be considered to construct a comprehensive insight in the effect ofACL deficiency on the cartilage during daily activities.
While performing the lunge activity, the patients were asked to pause for five seconds ateach flexion angle while simultaneous fluoroscopic images were taken. To the best of ourknowledge, the real-time in-vivo creep of tibiofemoral cartilage has not been studied at thispoint. Based on the in-vivo creep compression curves for ankle cartilage using similarmethodologies which showed that cartilage contact deformation continued to increaseduring the first 20 seconds of loading (47), it might be possible that the present data may bea conservative estimate of a potentially bigger differential if the patients were asked to pauselonger at each flexion angle.
It should be noted that no ground reaction forces were measured in this study to documentthat global knee joint loading was reproduced reproducibly for both the intact and ACL-deficient knee. The patient performed the lunge activity with full body weight on the testedlimb, while the untested limb was used for balance only, to ensure physiologic loadingconditions.
Finally, the present analysis compared tibiofemoral cartilage contact deformation of theACL-deficient and intact knees at each flexion angle, hereby ignoring potential interactionsamongst the measured cartilage deformation and various knee flexion angles. Futureresearch involving a larger study sample needs to be performed to confirm the present
Van de Velde et al. Page 7
Arthritis Rheum. Author manuscript; available in PMC 2010 December 1.
NIH
-PA Author Manuscript
NIH
-PA Author Manuscript
NIH
-PA Author Manuscript
findings. Nonetheless, we believe the current findings provided a comprehensible insight inthe changes in in-vivo tibiofemoral cartilage contact deformation following injury of theACL, and identified important directions for future research.
We found that rupture of the ACL alters the in-vivo cartilage contact biomechanics of thetibiofemoral joint, by shifting the cartilage contact location to smaller regions of thinnercartilage, and increasing the magnitude of cartilage contact deformation.
AcknowledgmentsGrant Support:
National Institutes of Health (NIH R01AR052408-02, NIH R21AR051078-01) (GL), the National Football LeagueCharities Foundation (TJG), and the Belgian American Educational Foundation (SKV)
REFERENCES1. Aspden RM, Scheven BA, Hutchison JD. Osteoarthritis as a systemic disorder including stromal cell
differentiation and lipid metabolism. Lancet. 2001; 357(9262):1118–1120. [PubMed: 11297982]2. Brandt, K.; Lohmander, L.; Doherty, M. The concept of osteoarthritis as failure of the diarthrodial
joint. In: Brandt, K.; Doherty, M.; Lohmander, L., editors. Osteoarthritis. Oxford: OxfordUniversity Press; 1998. p. 70-74.
3. Fithian DC, Paxton LW, Goltz DH. Fate of the anterior cruciate ligament-injured knee. Orthop ClinNorth Am. 2002; 33(4):621–636. v. [PubMed: 12528905]
4. Roos H, Adalberth T, Dahlberg L, Lohmander LS. Osteoarthritis of the knee after injury to theanterior cruciate ligament or meniscus: the influence of time and age. Osteoarthritis Cartilage. 1995;3(4):261–267. [PubMed: 8689461]
5. Felson DT, Lawrence RC, Dieppe PA, Hirsch R, Helmick CG, Jordan JM, et al. Osteoarthritis: newinsights. Part 1: the disease and its risk factors. Ann Intern Med. 2000; 133(8):635–646. [PubMed:11033593]
6. Marshall KW, Chan AD. Arthroscopic anterior cruciate ligament transection induces canineosteoarthritis. J Rheumatol. 1996; 23(2):338–343. [PubMed: 8882043]
7. Brandt KD, Myers SL, Burr D, Albrecht M. Osteoarthritic changes in canine articular cartilage,subchondral bone, and synovium fifty-four months after transection of the anterior cruciateligament. Arthritis Rheum. 1991; 34(12):1560–1570. [PubMed: 1747141]
8. Hunter DJ, Sharma L, Skaife T. Alignment and osteoarthritis of the knee. J Bone Joint Surg Am.2009; 91 Suppl 1:85–89. [PubMed: 19182031]
9. Defrate LE, Papannagari R, Gill TJ, Moses JM, Pathare NP, Li G. The 6 degrees of freedomkinematics of the knee after anterior cruciate ligament deficiency: an in vivo imaging analysis. Am JSports Med. 2006; 34(8):1240–1246. [PubMed: 16636348]
10. Georgoulis AD, Papadonikolakis A, Papageorgiou CD, Mitsou A, Stergiou N. Three-dimensionaltibiofemoral kinematics of the anterior cruciate ligament-deficient and reconstructed knee duringwalking. Am J Sports Med. 2003; 31(1):75–79. [PubMed: 12531761]
11. Logan M, Dunstan E, Robinson J, Williams A, Gedroyc W, Freeman M. Tibiofemoral kinematicsof the anterior cruciate ligament (ACL)-deficient weightbearing, living knee employing verticalaccess open "interventional" multiple resonance imaging. Am J Sports Med. 2004; 32(3):720–726.[PubMed: 15090390]
12. Shepherd DE, Seedhom BB. Thickness of human articular cartilage in joints of the lower limb.Ann Rheum Dis. 1999; 58(1):27–34. [PubMed: 10343537]
13. Jones G, Glisson M, Hynes K, Cicuttini F. Sex and site differences in cartilage development: apossible explanation for variations in knee osteoarthritis in later life. Arthritis Rheum. 2000;43(11):2543–2549. [PubMed: 11083279]
14. Ateshian GA, Soslowsky LJ, Mow VC. Quantitation of articular surface topography and cartilagethickness in knee joints using stereophotogrammetry. J Biomech. 1991; 24(8):761–776. [PubMed:1918099]
Van de Velde et al. Page 8
Arthritis Rheum. Author manuscript; available in PMC 2010 December 1.
NIH
-PA Author Manuscript
NIH
-PA Author Manuscript
NIH
-PA Author Manuscript

15. Bolbos RI, Ma CB, Link TM, Majumdar S, Li X. In vivo T1rho quantitative assessment of kneecartilage after anterior cruciate ligament injury using 3 Tesla magnetic resonance imaging. InvestRadiol. 2008; 43(11):782–788. [PubMed: 18923257]
16. Saadat E, Jobke B, Chu B, Lu Y, Cheng J, Li X, et al. Diagnostic performance of in vivo 3-T MRIfor articular cartilage abnormalities in human osteoarthritic knees using histology as standard ofreference. Eur Radiol. 2008; 18(10):2292–2302. [PubMed: 18491096]
17. Samosky JT, Burstein D, Eric Grimson W, Howe R, Martin S, Gray ML. Spatially-localizedcorrelation of dGEMRIC-measured GAG distribution and mechanical stiffness in the human tibialplateau. J Orthop Res. 2005; 23(1):93–101. [PubMed: 15607880]
18. Taylor C, Carballido-Gamio J, Majumdar S, Li X. Comparison of quantitative imaging of cartilagefor osteoarthritis: T2, T1rho, dGEMRIC and contrast-enhanced computed tomography. MagnReson Imaging. 2009
19. Freeman MA, Pinskerova V. The movement of the knee studied by magnetic resonance imaging.Clin Orthop Relat Res. 2003; (410):35–43. [PubMed: 12771815]
20. Hinterwimmer S, Gotthardt M, von Eisenhart-Rothe R, Sauerland S, Siebert M, Vogl T, et al. Invivo contact areas of the knee in patients with patellar subluxation. J Biomech. 2005; 38(10):2095–2101. [PubMed: 16084210]
21. Wretenberg P, Ramsey DK, Nemeth G. Tibiofemoral contact points relative to flexion anglemeasured with MRI. Clin Biomech (Bristol, Avon). 2002; 17(6):477–485.
22. Asano T, Akagi M, Tanaka K, Tamura J, Nakamura T. In vivo three-dimensional knee kinematicsusing a biplanar image-matching technique. Clin Orthop. 2001; (388):157–166. [PubMed:11451115]
23. Li G, DeFrate LE, Park SE, Gill TJ, Rubash HE. In vivo articular cartilage contact kinematics ofthe knee: an investigation using dual-orthogonal fluoroscopy and magnetic resonance image-basedcomputer models. Am J Sports Med. 2005; 33(1):102–107. [PubMed: 15611005]
24. Dennis DA, Mahfouz MR, Komistek RD, Hoff W. In vivo determination of normal and anteriorcruciate ligament-deficient knee kinematics. J Biomech. 2005; 38(2):241–253. [PubMed:15598450]
25. Li G, Moses JM, Papannagari R, Pathare NP, DeFrate LE, Gill TJ. Anterior cruciate ligamentdeficiency alters the in vivo motion of the tibiofemoral cartilage contact points in both theanteroposterior and mediolateral directions. J Bone Joint Surg Am. 2006; 88(8):1826–1834.[PubMed: 16882908]
26. Bingham JT, Papannagari R, Van de Velde SK, Gross C, Gill TJ, Felson DT, et al. In vivocartilage contact deformation in the healthy human tibiofemoral joint. Rheumatology (Oxford).2008; 47(11):1622–1627. [PubMed: 18775967]
27. Li G, Van de Velde SK, Bingham JT. Validation of a non-invasive fluoroscopic imaging techniquefor the measurement of dynamic knee joint motion. J Biomech. 2008; 41(7):1616–1622. [PubMed:18394629]
28. Li G, Park SE, DeFrate LE, Schutzer ME, Ji L, Gill TJ, et al. The cartilage thickness distribution inthe tibiofemoral joint and its correlation with cartilage-to-cartilage contact. Clin Biomech (Bristol,Avon). 2005; 20(7):736–744.
29. Griffin LY, Agel J, Albohm MJ, Arendt EA, Dick RW, Garrett WE, et al. Noncontact anteriorcruciate ligament injuries: risk factors and prevention strategies. J Am Acad Orthop Surg. 2000;8(3):141–150. [PubMed: 10874221]
30. Kannus P, Jarvinen M. Posttraumatic anterior cruciate ligament insufficiency as a cause ofosteoarthritis in a knee joint. Clin Rheumatol. 1989; 8(2):251–260. [PubMed: 2758771]
31. Hernandez-Molina G, Guermazi A, Niu J, Gale D, Goggins J, Amin S, et al. Central bone marrowlesions in symptomatic knee osteoarthritis and their relationship to anterior cruciate ligament tearsand cartilage loss. Arthritis Rheum. 2008; 58(1):130–136. [PubMed: 18163483]
32. Li X, Ma BC, Bolbos RI, Stahl R, Lozano J, Zuo J, et al. Quantitative assessment of bone marrowedema-like lesion and overlying cartilage in knees with osteoarthritis and anterior cruciateligament tear using MR imaging and spectroscopic imaging at 3 Tesla. J Magn Reson Imaging.2008; 28(2):453–461. [PubMed: 18666183]
Van de Velde et al. Page 9
Arthritis Rheum. Author manuscript; available in PMC 2010 December 1.
NIH
-PA Author Manuscript
NIH
-PA Author Manuscript
NIH
-PA Author Manuscript

33. Fairclough JA, Graham GP, Dent CM. Radiological sign of chronic anterior cruciate ligamentdeficiency. Injury. 1990; 21(6):401–402. [PubMed: 2125978]
34. Murrell GA, Maddali S, Horovitz L, Oakley SP, Warren RF. The effects of time course afteranterior cruciate ligament injury in correlation with meniscal and cartilage loss. Am J Sports Med.2001; 29(1):9–14. [PubMed: 11206263]
35. Amin S, Guermazi A, Lavalley MP, Niu J, Clancy M, Hunter DJ, et al. Complete anterior cruciateligament tear and the risk for cartilage loss and progression of symptoms in men and women withknee osteoarthritis. Osteoarthritis Cartilage. 2008; 16(8):897–902. [PubMed: 18203629]
36. Hill CL, Seo GS, Gale D, Totterman S, Gale ME, Felson DT. Cruciate ligament integrity inosteoarthritis of the knee. Arthritis Rheum. 2005; 52(3):794–799. [PubMed: 15751064]
37. Fowler PJ. Bone injuries associated with anterior cruciate ligament disruption. Arthroscopy. 1994;10(4):453–460. [PubMed: 7945643]
38. Andriacchi TP, Mundermann A, Smith RL, Alexander EJ, Dyrby CO, Koo S. A framework for thein vivo pathomechanics of osteoarthritis at the knee. Ann Biomed Eng. 2004; 32(3):447–457.[PubMed: 15095819]
39. Brandt KD. Transection of the anterior cruciate ligament in the dog: a model of osteoarthritis.Semin Arthritis Rheum. 1991; 21(3 Suppl 2):22–32. [PubMed: 1796303]
40. Lozano J, Saadat E, Li X, Majumdar S, Ma CB. Magnetic resonance T(1rho) imaging ofosteoarthritis: a rabbit ACL transection model. Magn Reson Imaging. 2008
41. Bolbos RI, Link TM, Benjamin Ma C, Majumdar S, Li X. T1rho relaxation time of the meniscusand its relationship with T1rho of adjacent cartilage in knees with acute ACL injuries at 3T.Osteoarthritis Cartilage. 2008
42. Cameron M, Buchgraber A, Passler H, Vogt M, Thonar E, Fu F, et al. The natural history of theanterior cruciate ligament-deficient knee. Changes in synovial fluid cytokine and keratan sulfateconcentrations. Am J Sports Med. 1997; 25(6):751–754. [PubMed: 9397261]
43. Bevill SL, Briant PL, Levenston ME, Andriacchi TP. Central and peripheral region tibial plateauchondrocytes respond differently to in vitro dynamic compression. Osteoarthritis Cartilage. 2008
44. Shelburne KB, Torry MR, Pandy MG. Muscle, ligament, and joint-contact forces at the kneeduring walking. Med Sci Sports Exerc. 2005; 37(11):1948–1956. [PubMed: 16286866]
45. Stuart MJ, Meglan DA, Lutz GE, Growney ES, An KN. Comparison of intersegmentaltibiofemoral joint forces and muscle activity during various closed kinetic chain exercises. Am JSports Med. 1996; 24(6):792–799. [PubMed: 8947402]
46. Escamilla RF. Knee biomechanics of the dynamic squat exercise. Med Sci Sports Exerc. 2001;33(1):127–141. [PubMed: 11194098]
47. Li G, Wan L, Kozanek M. Determination of real-time in-vivo cartilage contact deformation in theankle joint. J Biomech. 2008; 41(1):128–136. [PubMed: 17697682]
48. Raynauld JP, Kauffmann C, Beaudoin G, Berthiaume MJ, de Guise JA, Bloch DA, et al.Reliability of a quantification imaging system using magnetic resonance images to measurecartilage thickness and volume in human normal and osteoarthritic knees. Osteoarthritis Cartilage.2003; 11(5):351–360. [PubMed: 12744941]
APPENDIX. ACCURACY AND PRECISION OF TIBIOFEMORAL CARTILAGETHICKNESS MEASUREMENT BY 3T MR IMAGING
An assessment of the accuracy and precision of cartilage thickness measurement based on3D meshed knee models created with 3T MR images is critical for the appreciation ofbiomechanical parameters such as in-vivo cartilage contact deformation. In this validationstudy, we used calibrated digital images of a series of cadaveric cartilage cross-sections asthe gold standard, because the actual cartilage boundaries can be clearly delineated from thespecimens (Figure Appendix).
Two fresh frozen cadaver knee specimens (male, 48 years, right knee; female, 48 years, leftknee) were selected for this study. The specimens were stored at −20° C prior to the testing
Van de Velde et al. Page 10
Arthritis Rheum. Author manuscript; available in PMC 2010 December 1.
NIH
-PA Author Manuscript
NIH
-PA Author Manuscript
NIH
-PA Author Manuscript

and thawed at room temperature for 24 hours before the experiment was conducted.Discernable cartilage damage was ruled out in each specimen upon fluoroscopic, MRIexamination and visual inspection. Both knee specimens, with all the surrounding softtissues intact, were then imaged with a 3.0 Tesla MR scanner to create 3D meshed models ofthe respective tibias, femurs, and articulating cartilage layers using the protocol described inthe Patients and Methods section.
Following MR imaging, the knee specimens were stripped of all surrounding soft tissues anddisarticulated to leave only the individual bones and articular cartilage surfaces. The cadaverbones were successively installed with the shaft centered in a rigid cylinder, andosteotomized through the midsagittal planes of the articulating surfaces of the medial andlateral condyles. Between each individual osteotomy and subsequent digital image capturingof the pertinent cross-section, the specimens were wrapped in a moist dressing to preventdesiccating of the articular cartilage. In this manner, a total of eight cadaveric cartilagecross-sections could be measured (i.e. two cross-sections for each tibia and femur of the twoknee specimens). Digital images of the cross-sections were captured, and calibrated usingthe protocol designed in our laboratory to calibrate fluoroscopic images.
The next step was to determine the same cross-section of the respective tibial and femoralcartilage layers in the 3D surface mesh models. To do so, the osteotomized bones were CTscanned (LightSpeed Pro16, GE, Waukesha, WI) using high-resolution axial plane images.Images were obtained with a thickness of 0.625 mm and a gap of 0.625 mm, and with aresolution of 512 × 512 pixels. The CT images were then imported into Matlab(MathWorks, Natick, MA), and the contours of the osteotomized bones were digitizedwithin each CT image based on a modified Canny edge detection method combining pixelmagnitude to construct 3D anatomic mesh model of the osteotomized bones. Theosteotomized bony models were then mapped to the MR image based models of the kneespecimens using a customized code implemented in the Matlab based on the iterative closestpoint method. A plane was constructed along the cutting cross-section of the CT bonymodel. This plane was used to separate the MR image model at the location of theosteotomy.
Finally, the calibrated digital images that were captured of the cadaver cross-sections werematched to the respective cross-section planes of the MR image models. In this manner,cartilage thickness was measured at the same location on both the digital image and the MRimage model. Ten equally distributed locations on each of the eight cartilage cross-sectionswere measured and compared using a paired student t-test with significance level set atp<0.05.
For the first specimen, the average cartilage thickness values measured from the digitalimages versus MR image models were 2.03 ± 0.26 mm and 2.04 ± 0.27 mm (medial femoralcondyle, absolute difference 0.05 ± 0.03 mm, p=0.789); 2.00 ± 0.31 mm and 2.02 ± 0.30mm (lateral femoral condyle, absolute difference 0.05 ± 0.03 mm, p=0.527); 2.24 ± 0.51 mmand 2.26 ± 0.48 mm (medial tibial condyle, absolute difference 0.05 ± 0.03 mm, p=0.378);and 2.16 ± 0.98 mm and 2.18 ± 1.00 mm (lateral tibial condyle, absolute difference 0.04 ±0.03 mm, p=0.354), respectively.
For the second specimen, the average cartilage thickness values measured from the digitalimages versus MR image models were 2.15 ± 0.29 mm and 2.17 ± 0.30 mm (medial femoralcondyle, absolute difference 0.04 ± 0.03 mm, p=0.357); 2.52 ± 0.49 mm and 2.52 ± 0.48mm (lateral femoral condyle, absolute difference 0.03 ± 0.02 mm, p=0.826); 2.06 ± 0.22 mmand 2.04 ± 0.23 mm (medial tibial condyle, absolute difference 0.04 ± 0.01 mm, p=0.447);and 3.15 ± 0.81 mm and 3.17 ± 0.80 mm (lateral tibial condyle, absolute difference 0.03 ±
Van de Velde et al. Page 11
Arthritis Rheum. Author manuscript; available in PMC 2010 December 1.
NIH
-PA Author Manuscript
NIH
-PA Author Manuscript
NIH
-PA Author Manuscript

0.02 mm, p=0.521), respectively. The average absolute difference in cartilage thickness,measured at the ten locations along the eight section planes, between the direct measurementon the cadaveric specimens and the MR image based models was 0.04 ± 0.01 mm(corresponding to a 1.8 ± 1.6% difference). The above comparison demonstrated that theMR image based cartilage model was close to the actual cartilage, and sufficiently accuratefor the determination of cartilage contact deformation differentials between intact and ACL-deficient knee joints.
To test the intraobserver precision of the tibiofemoral cartilage thickness measurement usingthe abovementioned MRI protocol and computer modeling, the cartilage layers thatcorresponded to the cutting planes were independently digitized ten times, with one dayseparating each re-segmentation, by three observers. Cartilage thickness was determined atten equally distributed locations on each of the eight cartilage cross-sections. The analyseswere based on the maximum differences between the digitizations provided by eachobserver (results from largest value minus smallest value for each location). Theintraobserver precision was assessed with Pearson correlation coefficients and student t-testsof the paired differences of the observations. In this validation study, correlations betweenthe ten digitizations were excellent. The Pearson correlation coefficients for intraobserverprecision were >0.984 (P<0.0001) for each of the three readers at the measured locations.
Interobserver agreement was then assessed by determining whether significant differencesbetween the cartilage thickness measurements (the thickness values from the firstdigitization session were selected) made by the three observers existed, using the intra-classcorrelation (ICC) coefficients. Interobserver agreement was very high in this study, withICC coefficients ranging from 0.989 to 0.999 (p<0.0001). These data are consistent withvalues reported in the literature (48) and indicate that the cartilage thickness measurementbased on MR image based cartilage models could be performed with great precision.
Van de Velde et al. Page 12
Arthritis Rheum. Author manuscript; available in PMC 2010 December 1.
NIH
-PA Author Manuscript
NIH
-PA Author Manuscript
NIH
-PA Author Manuscript
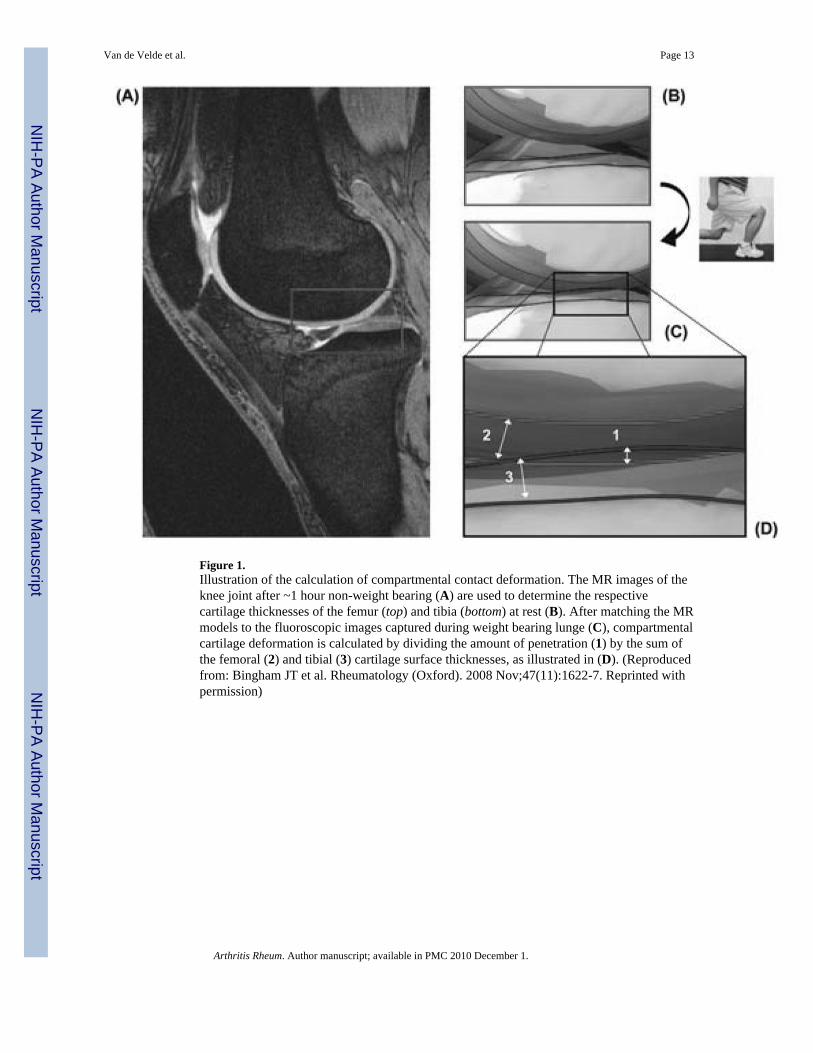
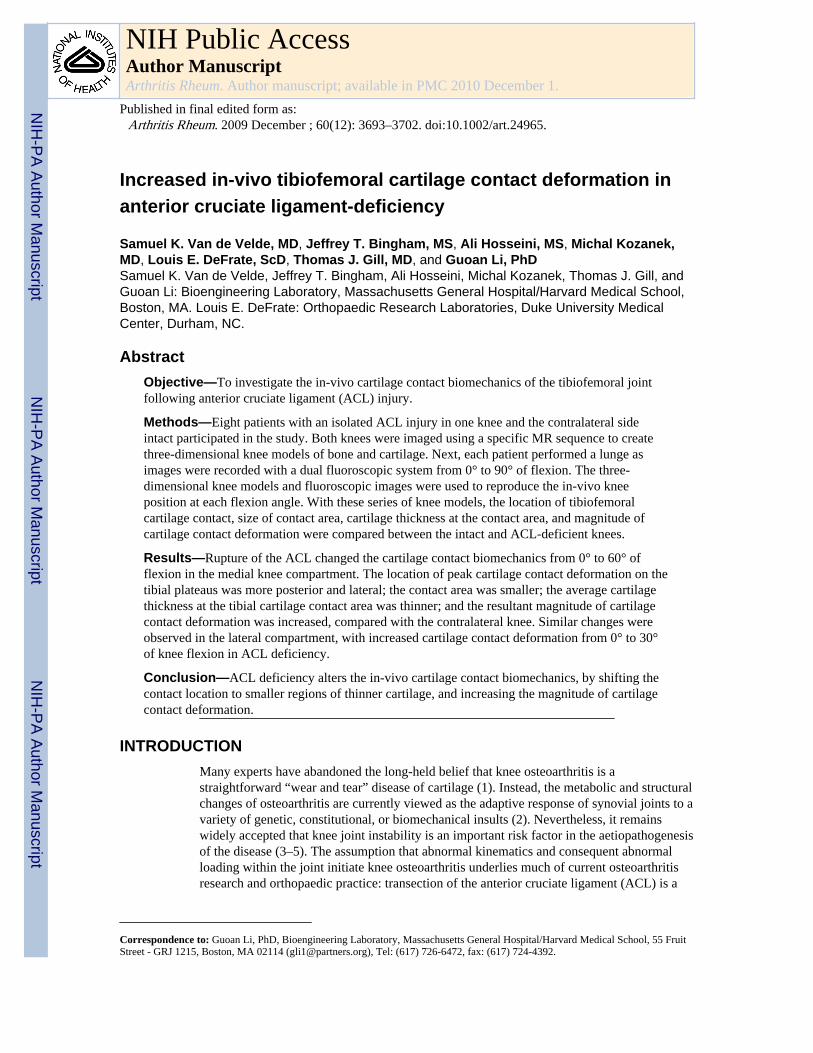
Figure 1.Illustration of the calculation of compartmental contact deformation. The MR images of theknee joint after ~1 hour non-weight bearing (A) are used to determine the respectivecartilage thicknesses of the femur (top) and tibia (bottom) at rest (B). After matching the MRmodels to the fluoroscopic images captured during weight bearing lunge (C), compartmentalcartilage deformation is calculated by dividing the amount of penetration (1) by the sum ofthe femoral (2) and tibial (3) cartilage surface thicknesses, as illustrated in (D). (Reproducedfrom: Bingham JT et al. Rheumatology (Oxford). 2008 Nov;47(11):1622-7. Reprinted withpermission)
Van de Velde et al. Page 13
Arthritis Rheum. Author manuscript; available in PMC 2010 December 1.
NIH
-PA Author Manuscript
NIH
-PA Author Manuscript
NIH
-PA Author Manuscript

Figure 2.Location of cartilage contact on the medial tibial plateau in the anteroposterior (A) andmediolateral (B) directions, and on the lateral tibial plateau in the anteroposterior (C) andmediolateral (D) directions, in the intact and ACL-deficient knees as a function of kneeflexion angle. Insert illustrates the Cartesian coordinate system for the tibial plateau. AP =anteroposterior, ML = mediolateral. (* Denotes p<0.05)
Van de Velde et al. Page 14
Arthritis Rheum. Author manuscript; available in PMC 2010 December 1.
NIH
-PA Author Manuscript
NIH
-PA Author Manuscript
NIH
-PA Author Manuscript

Figure 3.Cartilage contact area on the medial (A) and lateral (B) tibial plateaus in the intact and ACL-deficient knees as a function of knee flexion angle. (* Denotes p<0.05)
Van de Velde et al. Page 15
Arthritis Rheum. Author manuscript; available in PMC 2010 December 1.
NIH
-PA Author Manuscript
NIH
-PA Author Manuscript
NIH
-PA Author Manuscript

Figure 4.Thickness of cartilage in regions of contact for the medial (A) and lateral (B) tibial plateausin the intact and ACL-deficient knees as a function of knee flexion angle. Dashed linesindicate total average cartilage thickness. (* Denotes p<0.05)
Van de Velde et al. Page 16
Arthritis Rheum. Author manuscript; available in PMC 2010 December 1.
NIH
-PA Author Manuscript
NIH
-PA Author Manuscript
NIH
-PA Author Manuscript

Figure 5.Peak cartilage contact deformation in the medial (A) and lateral (B) tibiofemoralcompartments in the intact and ACL-deficient knees as a function of knee flexion angle. (*Denotes p<0.05)
Van de Velde et al. Page 17
Arthritis Rheum. Author manuscript; available in PMC 2010 December 1.
NIH
-PA Author Manuscript
NIH
-PA Author Manuscript
NIH
-PA Author Manuscript

Figure Appendix.Illustration of the comparison of direct measurement of cartilage thickness on cadavericcross-sections with that on MR image based models. The digital images of the cadaverosteotomies (a) were matched to the respective cross-section planes of the MR imagemodels (b). The black (bone mesh) and blue (cartilage mesh) lines on the digital imagesindicate the intersection of the cartilage mesh models with the digital image at the locationof osteotomy. Only two cross-sections are shown for illustrative purposes.
Van de Velde et al. Page 18
Arthritis Rheum. Author manuscript; available in PMC 2010 December 1.
NIH
-PA Author Manuscript
NIH
-PA Author Manuscript
NIH
-PA Author Manuscript
Copyright © 2022 FDOKUMEN