
Impedance spectroscopy and investigation of conduction mechanism in BaMnO3 nanorods
6
Impedance spectroscopy and investigation of conduction mechanism in BaMnO 3 nanorods Khizar Hayat a , M.A. Rafiq a,n , S.K. Durrani b , M.M. Hasan a a Nanostructured Materials and Devices Group, Department of Chemicals and Materials Engineering, Pakistan Institute of Engineering and Applied Sciences, P.O. Nilore, Islamabad 45650, Pakistan b Material Division, Pakistan Institute of Nuclear Science and Technology, P.O. Nilore, Islamabad 45650, Pakistan article info Article history: Received 2 August 2010 Accepted 21 September 2010 Keywords: BaMnO 3 nanorods n-type semiconductor Correlated barrier model Composite-hydroxide mediated method abstract BaMnO 3 nanorods were synthesized at 200 1C and atmospheric pressure using the composite- hydroxide mediated method. X-ray diffraction, scanning electron microscopy and energy dispersive X-ray spectroscopy were used to investigate the structure, size, morphology, phase purity and elemental composition of BaMnO 3 nanorods. Electrical characterization of BaMnO 3 pellet was performed at 300–400 K and in the frequency range 200 Hz–2 MHz. Temperature dependence of AC conductivity suggests that the BaMnO 3 pellet behaves as a semiconducting material and conduction across the pellet can be explained by the correlated barrier hopping model. Impedance analysis was performed using the equivalent circuit model (R 1 Q 1 C 1 )(R 2 C 2 ) and it suggests a single relaxation process in the BaMnO 3 pellet at a particular temperature. The analysis reveals that the BaMnO 3 pellet behaves like an n-type semiconductor material due to the presence of oxygen vacancies and some disorder. Modulus spectroscopy also supports the impedance results. & 2010 Elsevier B.V. All rights reserved. 1. Introduction In recent years, barium manganite (BaMnO 3 ), a perovskite- based material, has been studied extensively. BaMnO 3 properties can be tailored by doping different elements at barium (Ba) and/or manganese (Mn) lattice sites. By doping, this material has been investigated for its giant magnetoresistive effect, [1–6] antiferromagnetism, [7] high permittivity, [8] giant magneto- elastic coupling, [9] multiferroic behavior and large non-linear optical response [10–12]. Nanocrystalline BaMnO 3 has distinct physical and chemical properties as compared with bulk BaMnO 3 . Field effect transistors using one-dimensional nano-manganites can be easily fabricated for realization of highly sensitive magnetic nanosensors. Wang et al. [6] used BaMnO 3 nanorods to sense oxygen (O 2 ) gas. They found that BaMnO 3 nanorods display n-type semiconductor behavior as a result of oxygen vacancies. The nanorods show high gas sensitivity due to the small size and high specific surface area of nanorods. However, electrical properties of BaMnO 3 nanorods have not received much attention. Electrical properties are of extreme importance because understanding of electron transport helps us to find potential applications for such materials. In this paper we use the composite-hydroxide mediated (CHM) method to synthesize BaMnO 3 nanorods. Synthesis was performed at 200 1C and atmospheric pressure. Structural characterization of these nanorods was performed using X-ray diffraction (XRD) analysis and Scanning Electron Microscopy (SEM). Elemental information of synthesized samples was obtained using the Energy Dispersive X-ray (EDX) technique. The synthesized material was in the form of a powder and was converted to cylindrical pellets for electrical measurements. AC electrical measurements were performed using an Agilent E4980A LCR meter at temperatures from 300 to 400 K. The frequency of the AC signal was varied from 200 Hz to 2 MHz. Results of impedance analysis show that as prepared BaMnO 3 pellet behaves as an n-type semiconductor material. Further it was revealed that there is some disorder present in the BaMnO 3 pellet due to the presence of oxygen vacancies. The disorder decreased with increase in temperature of the pellet. Analysis of AC conductivity shows that the conduction mechanism in the BaMnO 3 pellet is thermally activated, which can be explained by the correlated barrier hopping (CBH) model. 2. Experimental details 2.1. Synthesis of BaMnO 3 nanorods BaMnO 3 nanorods were prepared by the composite-hydroxide mediated method. CHM is one of the simplest, most versatile and cost-effective approaches available for obtaining crystalline and chemically pure samples at low temperatures and atmospheric Contents lists available at ScienceDirect journal homepage: www.elsevier.com/locate/physb Physica B 0921-4526/$ - see front matter & 2010 Elsevier B.V. All rights reserved. doi:10.1016/j.physb.2010.09.026 n Corresponding author. Tel.: + 92 51 2208014; fax: + 92 51 2208070. E-mail address: [email protected] (M.A. Rafiq). Physica B 406 (2011) 309–314
Transcript of Impedance spectroscopy and investigation of conduction mechanism in BaMnO3 nanorods
Physica B 406 (2011) 309–314
Contents lists available at ScienceDirect
Physica B
0921-45
doi:10.1
n Corr
E-m
journal homepage: www.elsevier.com/locate/physb
Impedance spectroscopy and investigation of conduction mechanism inBaMnO3 nanorods
Khizar Hayat a, M.A. Rafiq a,n, S.K. Durrani b, M.M. Hasan a
a Nanostructured Materials and Devices Group, Department of Chemicals and Materials Engineering, Pakistan Institute of Engineering and Applied Sciences, P.O. Nilore, Islamabad
45650, Pakistanb Material Division, Pakistan Institute of Nuclear Science and Technology, P.O. Nilore, Islamabad 45650, Pakistan
a r t i c l e i n f o
Article history:
Received 2 August 2010
Accepted 21 September 2010
Keywords:
BaMnO3 nanorods
n-type semiconductor
Correlated barrier model
Composite-hydroxide mediated method
26/$ - see front matter & 2010 Elsevier B.V. A
016/j.physb.2010.09.026
esponding author. Tel.: +92 51 2208014; fax:
ail address: [email protected] (M.A. Rafiq)
a b s t r a c t
BaMnO3 nanorods were synthesized at 200 1C and atmospheric pressure using the composite-
hydroxide mediated method. X-ray diffraction, scanning electron microscopy and energy dispersive
X-ray spectroscopy were used to investigate the structure, size, morphology, phase purity and
elemental composition of BaMnO3 nanorods. Electrical characterization of BaMnO3 pellet was
performed at 300–400 K and in the frequency range 200 Hz–2 MHz. Temperature dependence of AC
conductivity suggests that the BaMnO3 pellet behaves as a semiconducting material and conduction
across the pellet can be explained by the correlated barrier hopping model. Impedance analysis was
performed using the equivalent circuit model (R1Q1C1)(R2C2) and it suggests a single relaxation process
in the BaMnO3 pellet at a particular temperature. The analysis reveals that the BaMnO3 pellet behaves
like an n-type semiconductor material due to the presence of oxygen vacancies and some disorder.
Modulus spectroscopy also supports the impedance results.
& 2010 Elsevier B.V. All rights reserved.
1. Introduction
In recent years, barium manganite (BaMnO3), a perovskite-based material, has been studied extensively. BaMnO3 propertiescan be tailored by doping different elements at barium (Ba) and/ormanganese (Mn) lattice sites. By doping, this material has beeninvestigated for its giant magnetoresistive effect, [1–6]antiferromagnetism, [7] high permittivity, [8] giant magneto-elastic coupling, [9] multiferroic behavior and large non-linearoptical response [10–12]. Nanocrystalline BaMnO3 has distinctphysical and chemical properties as compared with bulk BaMnO3.Field effect transistors using one-dimensional nano-manganitescan be easily fabricated for realization of highly sensitivemagnetic nanosensors. Wang et al. [6] used BaMnO3 nanorodsto sense oxygen (O2) gas. They found that BaMnO3 nanorodsdisplay n-type semiconductor behavior as a result of oxygenvacancies. The nanorods show high gas sensitivity due to thesmall size and high specific surface area of nanorods. However,electrical properties of BaMnO3 nanorods have not received muchattention. Electrical properties are of extreme importance becauseunderstanding of electron transport helps us to find potentialapplications for such materials.
In this paper we use the composite-hydroxide mediated (CHM)method to synthesize BaMnO3 nanorods. Synthesis was
ll rights reserved.
+92 51 2208070.
.
performed at �200 1C and atmospheric pressure. Structuralcharacterization of these nanorods was performed using X-raydiffraction (XRD) analysis and Scanning Electron Microscopy(SEM). Elemental information of synthesized samples wasobtained using the Energy Dispersive X-ray (EDX) technique.The synthesized material was in the form of a powder and wasconverted to cylindrical pellets for electrical measurements.AC electrical measurements were performed using an AgilentE4980A LCR meter at temperatures from 300 to 400 K. Thefrequency of the AC signal was varied from 200 Hz to 2 MHz.Results of impedance analysis show that as prepared BaMnO3
pellet behaves as an n-type semiconductor material. Further itwas revealed that there is some disorder present in the BaMnO3
pellet due to the presence of oxygen vacancies. The disorderdecreased with increase in temperature of the pellet. Analysis ofAC conductivity shows that the conduction mechanism in theBaMnO3 pellet is thermally activated, which can be explained bythe correlated barrier hopping (CBH) model.
2. Experimental details
2.1. Synthesis of BaMnO3 nanorods
BaMnO3 nanorods were prepared by the composite-hydroxidemediated method. CHM is one of the simplest, most versatile andcost-effective approaches available for obtaining crystalline andchemically pure samples at low temperatures and atmospheric
K. Hayat et al. / Physica B 406 (2011) 309–314310
pressure with few residual impurities, as compared with conven-tional high temperature solid-state reaction techniques [13]. Thesynthesis was performed by the following steps:
(i) 100 g of mixed hydroxides (NaOH/KOH¼51.5:48.5) wasplaced in a self-made 250 ml Teflon vessel with a cover to preventit from contamination. (ii) A mixture of BaCl2.2 H2O and MnO2,2 mmol each, was used as the raw material for the reaction.(iii) The raw material was placed on the top of the hydroxides inthe vessel. The vessel was then placed in a furnace preheated to200 1C. (iv) After the hydroxides were completely molten, thecovered vessel containing hydroxides was shaken thoroughly toensure uniformity of mixed reactants. (v) After 48 h of reaction,the vessel was taken out and cooled to room temperature in air.The solid product was dissolved in deionized water and stirred formore than 2 h to completely dissolve the hydroxides. The productwas filtered and washed with hot water to remove the hydroxidefrom the surface of the nanorods. The synthesized product wasdried at 110 1C overnight.
A cylindrical pellet of 10 mm diameter, 0.5 g mass andapproximately 1.95 mm thickness was prepared by uniaxialpressure in a hydraulic press at 5 ton load for 1 min. The greenpellet was sintered in air at a fixed temperature of 600 1C for 8 h.A constant heating rate of 5 1C/min was maintained during the
15 70
100
200
300
400
500
600
(302
)
(300
)
(220
)(2
12)
(103
)
(200
)
(110
)
(202
)(2
11)
(112
)
(102
)(2
01)
(002
)
∗
(101
)
Inte
nsity
20 25 30 35 40 45 50 55 60 652θ (degrees)
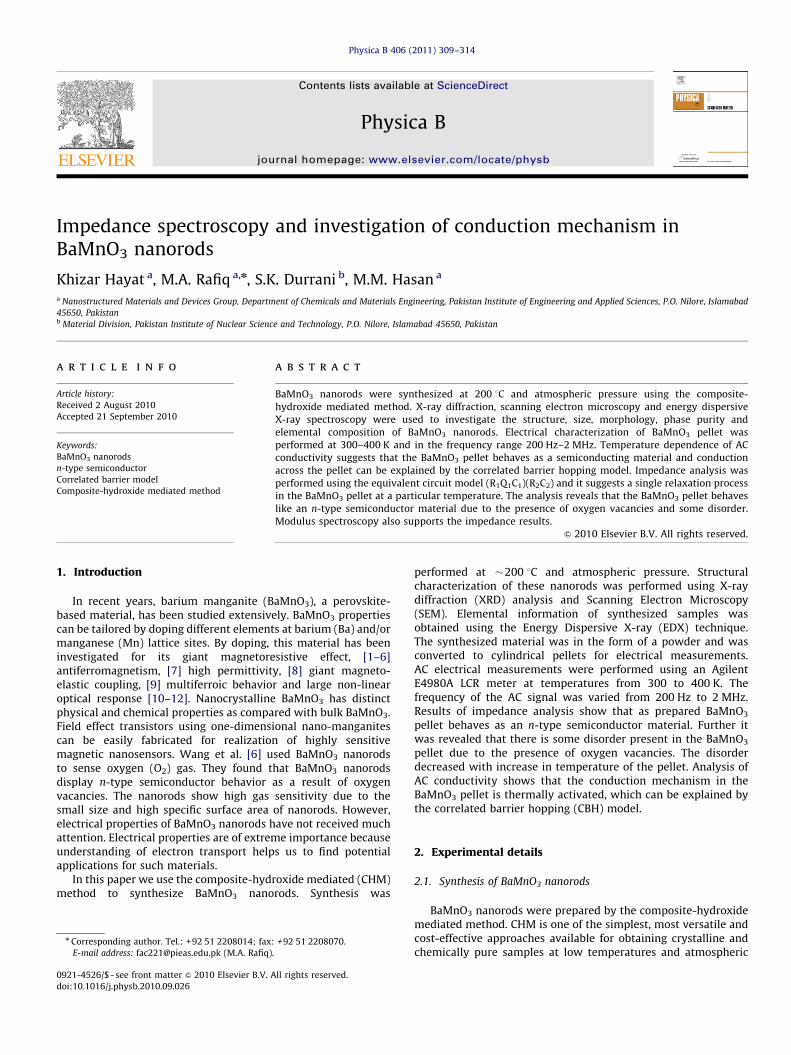
Fig. 1. XRD pattern of BaMnO3 nanorods.
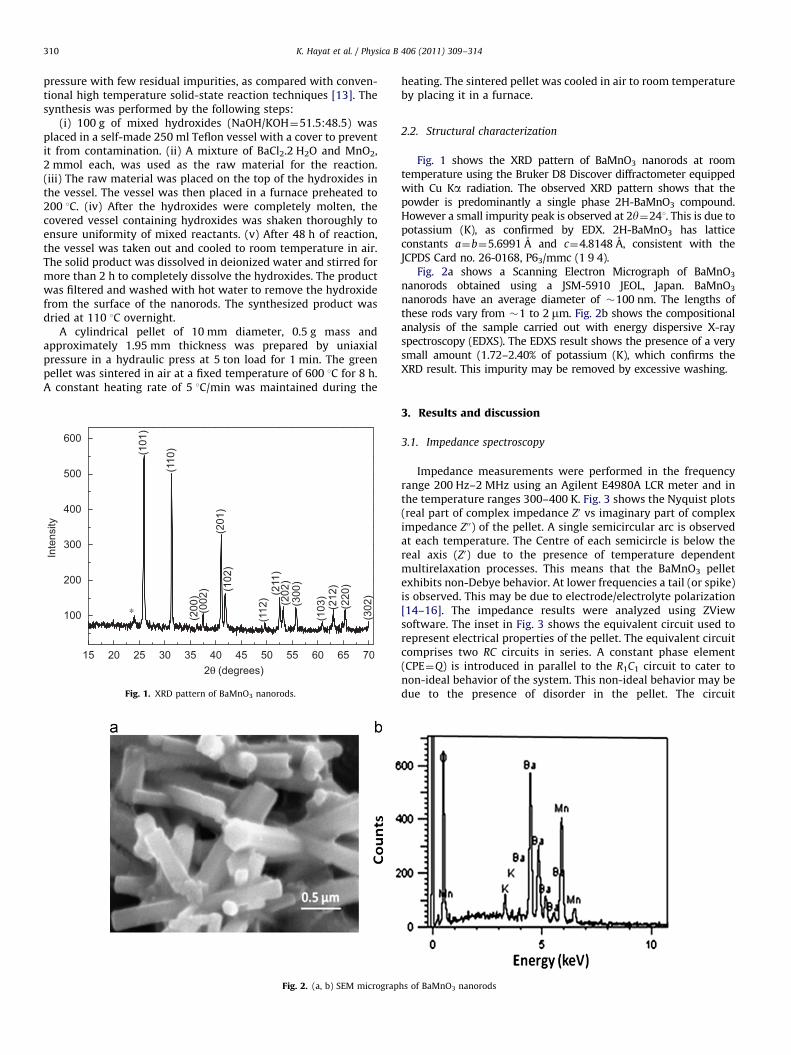
Fig. 2. (a, b) SEM micrograp
heating. The sintered pellet was cooled in air to room temperatureby placing it in a furnace.
2.2. Structural characterization
Fig. 1 shows the XRD pattern of BaMnO3 nanorods at roomtemperature using the Bruker D8 Discover diffractometer equippedwith Cu Ka radiation. The observed XRD pattern shows that thepowder is predominantly a single phase 2H-BaMnO3 compound.However a small impurity peak is observed at 2y¼241. This is due topotassium (K), as confirmed by EDX. 2H-BaMnO3 has latticeconstants a¼b¼5.6991 A and c¼4.8148 A, consistent with theJCPDS Card no. 26-0168, P63/mmc (1 9 4).
Fig. 2a shows a Scanning Electron Micrograph of BaMnO3
nanorods obtained using a JSM-5910 JEOL, Japan. BaMnO3
nanorods have an average diameter of �100 nm. The lengths ofthese rods vary from �1 to 2 mm. Fig. 2b shows the compositionalanalysis of the sample carried out with energy dispersive X-rayspectroscopy (EDXS). The EDXS result shows the presence of a verysmall amount (1.72–2.40% of potassium (K), which confirms theXRD result. This impurity may be removed by excessive washing.
3. Results and discussion
3.1. Impedance spectroscopy
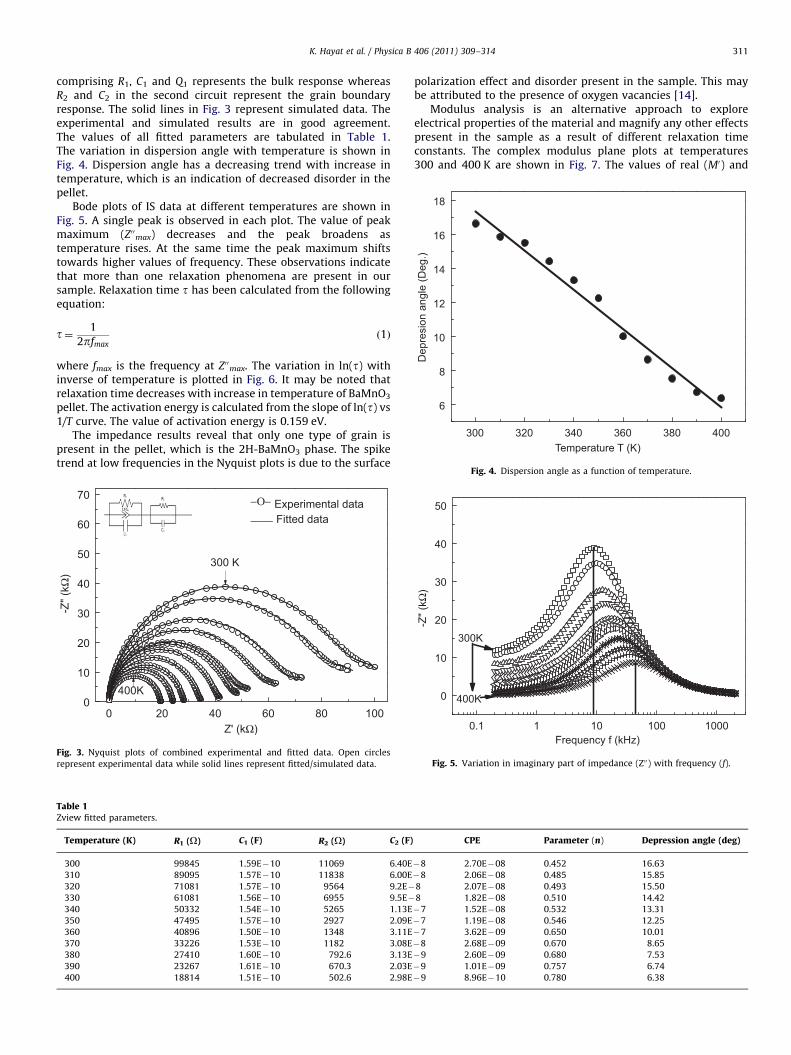
Impedance measurements were performed in the frequencyrange 200 Hz–2 MHz using an Agilent E4980A LCR meter and inthe temperature ranges 300–400 K. Fig. 3 shows the Nyquist plots(real part of complex impedance Z0 vs imaginary part of compleximpedance Z00) of the pellet. A single semicircular arc is observedat each temperature. The Centre of each semicircle is below thereal axis (Z0) due to the presence of temperature dependentmultirelaxation processes. This means that the BaMnO3 pelletexhibits non-Debye behavior. At lower frequencies a tail (or spike)is observed. This may be due to electrode/electrolyte polarization[14–16]. The impedance results were analyzed using ZViewsoftware. The inset in Fig. 3 shows the equivalent circuit used torepresent electrical properties of the pellet. The equivalent circuitcomprises two RC circuits in series. A constant phase element(CPE¼Q) is introduced in parallel to the R1C1 circuit to cater tonon-ideal behavior of the system. This non-ideal behavior may bedue to the presence of disorder in the pellet. The circuit
hs of BaMnO3 nanorods
300
6
8
10
12
14
16
18
Temperature T (K)
Dep
resi
on a
ngle
(Deg
.)320 340 360 380 400
K. Hayat et al. / Physica B 406 (2011) 309–314 311
comprising R1, C1 and Q1 represents the bulk response whereasR2 and C2 in the second circuit represent the grain boundaryresponse. The solid lines in Fig. 3 represent simulated data. Theexperimental and simulated results are in good agreement.The values of all fitted parameters are tabulated in Table 1.The variation in dispersion angle with temperature is shown inFig. 4. Dispersion angle has a decreasing trend with increase intemperature, which is an indication of decreased disorder in thepellet.
Bode plots of IS data at different temperatures are shown inFig. 5. A single peak is observed in each plot. The value of peakmaximum (Z00max) decreases and the peak broadens astemperature rises. At the same time the peak maximum shiftstowards higher values of frequency. These observations indicatethat more than one relaxation phenomena are present in oursample. Relaxation time t has been calculated from the followingequation:
t¼ 1
2pfmaxð1Þ
where fmax is the frequency at Z00max. The variation in ln(t) withinverse of temperature is plotted in Fig. 6. It may be noted thatrelaxation time decreases with increase in temperature of BaMnO3
pellet. The activation energy is calculated from the slope of ln(t) vs1/T curve. The value of activation energy is 0.159 eV.
The impedance results reveal that only one type of grain ispresent in the pellet, which is the 2H-BaMnO3 phase. The spiketrend at low frequencies in the Nyquist plots is due to the surface
00
10
20
30
40
50
60
70
300 K
-Z" (
kΩ)
400K
−Ο− Experimental data____ Fitted data
Z' (kΩ)20 40 60 80 100
Fig. 3. Nyquist plots of combined experimental and fitted data. Open circles
represent experimental data while solid lines represent fitted/simulated data.
Table 1Zview fitted parameters.
Temperature (K) R1 (O) C1 (F) R2 (O) C2 (F)
300 99845 1.59E�10 11069 6.40E
310 89095 1.57E�10 11838 6.00E
320 71081 1.57E�10 9564 9.2E�
330 61081 1.56E�10 6955 9.5E�
340 50332 1.54E�10 5265 1.13E
350 47495 1.57E�10 2927 2.09E
360 40896 1.50E�10 1348 3.11E
370 33226 1.53E�10 1182 3.08E
380 27410 1.60E�10 792.6 3.13E
390 23267 1.61E�10 670.3 2.03E
400 18814 1.51E�10 502.6 2.98E
polarization effect and disorder present in the sample. This maybe attributed to the presence of oxygen vacancies [14].
Modulus analysis is an alternative approach to exploreelectrical properties of the material and magnify any other effectspresent in the sample as a result of different relaxation timeconstants. The complex modulus plane plots at temperatures300 and 400 K are shown in Fig. 7. The values of real (M0) and
CPE Parameter (n) Depression angle (deg)
�8 2.70E�08 0.452 16.63
�8 2.06E�08 0.485 15.85
8 2.07E�08 0.493 15.50
8 1.82E�08 0.510 14.42
�7 1.52E�08 0.532 13.31
�7 1.19E�08 0.546 12.25
�7 3.62E�09 0.650 10.01
�8 2.68E�09 0.670 8.65
�9 2.60E�09 0.680 7.53
�9 1.01E�09 0.757 6.74
�9 8.96E�10 0.780 6.38
Fig. 4. Dispersion angle as a function of temperature.
0.1
0
10
20
30
40
50
400K
-Z" (
kΩ)
Frequency f (kHz)
300K
1 10 100 1000
Fig. 5. Variation in imaginary part of impedance (Z00) with frequency (f).

K. Hayat et al. / Physica B 406 (2011) 309–314312
imaginary (M00) components of the modulus are obtained from thefollowing expressions:
Mu¼oCoZ00 ð2Þ
M00 ¼oCoZu ð3Þ
2.4-12.8
-12.4
-12.0
-11.6
-11.2
-10.8
ln (τ
)
1000/T (K-1) 2.6 2.8 3.0 3.2 3.4
Fig. 6. Variation in relaxation time with inverse of temperature.
0.0 2.50.0
0.4
0.8
1.2
1.6
2.0
At 400 K
M'
M'’
At 300 K
0.5 1.0 1.5 2.0
Fig. 7. Variation in real (M0) and imaginary (M00) parts of complex modulus.
0.10
10
20
30
40
M'' at 300 K
M'' (
10-3
)
Frequency f (kHz)
-Z'' (
kΩ)
Z'' at 300 K
0.0
0.2
0.4
0.6
0.8
1.0
1 10 100 1000
Fig. 8. (a) Z00 and M00 with frequency at 300 K a
where Co¼ eoA/d is the geometrical capacitance of the emptycell.
The modulus plane plots also show a single semicircular arc atdifferent temperatures, which is the grain effect and also aconfirmation of the presence of the 2H-BaMnO3 phase in thepellet. The imaginary parts of impedance (Z00) and modulus (M00)are plotted against frequency at temperatures 300 and 400 K inFig. 8a and b, respectively. Ramzan and Brydson [17] reported thatthe misalignment of the peaks of Z00 and M00 as a function offrequency is due to the disorder present in the sample. Fig. 8ashows that at 300 K peaks are shifted further away from eachother, which is an indication of more disorder present in thesample, whereas in Fig. 8b at 400 K the peaks are less misalignedfrom each other as compared with the peaks in Fig. 8a. This showsthat disorder in the sample decreases with increase intemperature of the sample. This is also supported by dispersionangle in Fig. 4, which decreases with increase in temperature.
3.2. AC conductivity
AC conduction of the pellet has been investigated in thefrequency range 200 Hz–2MHz and at temperatures between 300and 400 K. Complex AC conductivity can be written as
s�ðoÞ ¼ suacðoÞþ js00acðoÞ ð4Þ
where s0ac(o) and s00ac(o) are the real and imaginary parts ofcomplex AC conductivity, respectively. The real part of complexAC conductivity is given by [18]
suac ¼Zu
Zu2þZ002
� �d
Að5Þ
where d is the thickness and A the cross-sectional area of thesample. In most disordered materials s0ac(o) at frequencies lessthan 10 MHz and temperatures greater than 150 K can bedescribed by the Jonscher power law (JPL) [19]
suacðoÞ ¼ soþBos ð6Þ
where o¼2jf is the angular frequency of applied AC voltage,so the DC conductivity, B ½ ¼ pN2e2=6kbT ð2pÞ� is a constant and thesymbols in this expression have their usual meanings. so and B
are independent of frequency and vary with temperature in theArrhenius manner. In Eq. (6) the exponent ‘s’ is a materialproperty and it can have any value between 0 and 1 [19].
Fig. 9 shows s0ac(o) as a function of frequency for the pellet attemperatures from 300 to 400 K. Here the measurements wereperformed with a temperature step of 10 K and at frequencies200 Hz–2 MHz. Two distinct regions can be identified from thefigure. At lower frequencies there is a plateau region and we name
0.10
2
4
6
8
10
Frequency f (kHz)
-Z'' (
kΩ)
0.0
0.2
0.4
0.6
0.8
1.0
M'' at 400 K
M'' (
10-3
) -Z'' at 400 K
1 10 100 1000
nd (b) Z00 and M00 with frequency at 400 K.

0.1
-3.6
-3.4
-3.2
-3.0
-2.8
-2.6
-2.4
300 K
400 K
Temperatureincreaseingtrend
log
σ (Ω
-m)-1
Frequency f (kHz)1 10 100 1000
Fig. 9. Frequency dependence of AC conductivity of a typical BaMnO3 pellet.
Fig. 10. Variation in exponent s with temperature.
300
0.40
0.42
0.44
0.46
0.48
0.50
0.52
0.54
Temperature T (K)
Wm
(eV
)
0
2
4
6
8
10
12
320 340 360 380 400
Rm
in (p
m)
Fig. 11. Binding energy (Wm) and minimum hopping distance (Rmin) as a function
of temperature
K. Hayat et al. / Physica B 406 (2011) 309–314 313
it as region 1. In this region the width of the plateau decreaseswith decrease in temperature, whereas there is a dispersionregion towards high frequencies and we name it as region 2.Glassy, crystalline (with ionic conduction) and a few semicon-ducting materials follow similar behavior [19].
The value of exponent ‘s’ is obtained from Fig. 9 at alltemperatures by fitting Eq. (6). The value of exponent ‘s’ as afunction of temperature is shown in Fig. 10. The exponent ‘s’decreases as temperature increases.
Our experimental results can be explained by the correlatedbarrier hopping (CBH) model. In this model conduction of carrierstakes place through the barriers separating the localized sites.Pike [20] proposed this model to explain the dielectric loss inscandium oxide films. Later Pollak and Pike [21] investigated ACconductivity of glasses due to atomic and electronic hoppingusing this model. Elliott [22] applied this model to AC loss inchalcogenide glasses and explained the results in terms ofelectron pairs hop between defects centers.
This model assumes that the charge carriers hop betweendefect centers over the potential barrier Wm separating them. Thebarrier height is correlated with separation R of the defect states.The CBH model predicts that the value of s decreases as
temperature increases and its value is given by
s¼ 1�6kbT
½Wm�kbT lnð1=otoÞ�ð7Þ
where kb is Boltzmann’s constant, T the temperature, to thecharacteristic relaxation time of the carriers and Wm the bindingenergy defined as the energy required to remove an electroncompletely from one site to another site.
For a small value of T
WmbkbT lnð1=otoÞ
and therefore Eq. (7) can be written as [23]
s¼ 1�6kbT
Wmð8Þ
The binding energy Wm was calculated by inserting values of ‘s’
and ‘T’ in Eq. (8). Variation in Wm with temperature is shown inFig. 11.
Wm is related to the minimum hopping distance Rmin by thefollowing expression:
Rmin ¼2e2
peeoWm
ð9Þ
where e is the dielectric constant and eo the permittivity of freespace. Fig. 11 also shows the minimum hopping distance variationwith temperature at 104 Hz. Fig. 11 shows that Wm decreases astemperature increases. This is because of the thermal activation ofcharge carriers.
Fig. 12 shows the Arrhenius plots at five different frequencies.AC conductivity of the pellet increases with increase intemperature at all frequencies. The reason for this behavior maybe thermally activated hopping of charge carriers betweendifferent localized states. Two different activation energies havebeen extracted at different temperature regions and are tabulatedin Table 2. It is worth mentioning that activation energies of bothtemperature regions decrease with increase in frequency due tothe trapping of charge carriers. This behavior is consistent withthe correlated barrier hopping model [24].
DC resistance of the pellet was determined from the IS data. DCconductivity has been calculated using the following equation:
sdc ¼d
RAð10Þ
where R is the bulk resistance, A the cross-sectional area of thepellets and d the thickness of the pellet. The Arrhenius plot of DC

2.4-8.5
-8.0
-7.5
-7.0
-6.5
-6.0
-5.5
-5.0
2 MHz
200 kHz
20 kHz2 kHz
log
[σ (Ω
-m)-1
]
1000/T (K-1)
200 Hz
2.6 2.8 3.0 3.2 3.4
Fig. 12. Variation in AC conductivity with inverse absolute temperature.
Table 2Variation in activation energy with frequency and temperature.
Sr. no. Frequency Activation energy DE (eV)
Temperatureregion 300–350 K
Temperatureregion 350–400 K
1 200 Hz 0.142 0.234
2 2 kHz 0.132 0.222
3 20 kHz 0.119 0.201
4 200 kHz 0.102 0.161
5 2 MHz 0.068 0.100
2.6-8.4
-8.1
-7.8
-7.5
-7.2
-6.9
-6.6
In σ
dc [×
10−3
S.m
-1]
1000/T (K)2.8 3.0 3.2 3.4
Fig. 13. Arrhenius plot of DC conductivity.
K. Hayat et al. / Physica B 406 (2011) 309–314314
conductivity is shown in Fig. 13. DC conductivity decreases astemperature increases. This is confirmation of the negativetemperature coefficient of resistance (NTCR)-type behavior of
the pellet. The activation energy obtained from Fig. 13 is 0.165 eV,which is in good agreement with the activation energy obtainedfrom relaxation time vs temperature curve as shown in Fig. 6.
4. Conclusions
The composite-hydroxide mediated (CHM) method was usedto synthesize BaMnO3 nanorods at �200 1C and atmosphericpressure. AC electrical measurements were performed using anAgilent E4980A LCR meter at temperatures 300–400 K. Frequencyof the AC signal was varied from 200 Hz to 2 MHz. Results ofimpedance analysis show that as prepared BaMnO3 pellet behavesas an n-type semiconductor material. Further it was revealed thatthere is some disorder present in the BaMnO3 pellet due to thepresence of oxygen vacancies. The disorder decreased with anincrease in temperature of the pellet. Analysis of AC conductivityshows that the conduction mechanism in the BaMnO3 pellet isthermally activated, which can be explained by the correlatedbarrier hopping (CBH) model.
Acknowledgments
We acknowledge the financial support of the Higher EducationCommission (HEC), Pakistan, through (5000) IndigenousPh.D. scholarship scheme in science and technology. We alsoacknowledge Centralized Resource Laboratory (CRL) at Universityof Peshawar, Pakistan, for their permission to use the SEM.
References
[1] R. Von Helmolt, J. Wecker, B. Holzapfel, L. Schultz, K. Samwer, Physical ReviewLetters 71 (1993) 2331.
[2] S. Jin, T.H. Tiefel, M. McCormack, R.A. Fastnacht, R. Ramesh, L.H. Chen, Science264 (1994) 413.
[3] M.B. Salamon, M. Jaime, Reviews of Modern Physics 73 (2001) 583.[4] J.C. Loudon, N.D. Mathur, P.A. Midgley, Nature 420 (2002) 797.[5] C. Renner, G. Aeppli, B.G. Kim, Y.A. Soh, S.W. Cheong, Nature 416 (2002) 518.[6] N. Wang, C.G. Hu, C.H. Xia, B. Feng, Z.W. Zhang, Y. Xi, Y.F. Xiong, Applied
Physics Letters 90 (2007).[7] J.M. Rondinelli, A.S. Eidelson, N.A. Spaldin, Physical Review B 79 (2009).[8] G.M. Keith, C.A. Kirk, K. Sarma, N.M. Alford, E.J. Cussen, M.J. Rosseinsky,
D.C. Sinclair, Chemistry of Materials 16 (2004) 2007.[9] S. Lee, A. Pirogov, M. Kang, K.-H. Jang, M. Yonemura, T. Kamiyama,
S.W. Cheong, F. Gozzo, N. Shin, H. Kimura, Y. Noda, J.G. Park, Nature 451(2008) 805.
[10] N.A. HillK., M. Rabe, Physical Review B 59 (1999) 8759.[11] T. Kimura, S. Kawamoto, I. Yamada, M. Azuma, M. Takano, Y. Tokura, Physical
Review B 67 (2003) 180401.[12] A. Sharan, J. Lettieri, Y. Jia, W. Tian, X. Pan, D.G. Schlom, V. Gopalan, Physical
Review B 69 (2004) 214109.[13] C.G. Hu, Y. Xi, H. Liu, Z.L. Wang, Journal of Materials Chemistry 19 (2009) 858.[14] E.J. Abram, D.C. Sinclair, A.R. West, Journal of Electroceramics 10 (2003) 165.[15] J.C. Dyre, Journal of Non-Crystalline Solids 88 (1986) 271.[16] H. Fjeld, D.M. Kepaptsoglou, R. Haugsrud, T. Norby, Solid State Ionics 181
(2010) 104.[17] M. Ramzan, R. Brydson, Sensors and Actuators A: Physical 118 (2005) 322.[18] N.V. Prasad, K. Srinivas, A.R. James, Ferroelectrics 282 (2003) 217.[19] J.P. Tiwari, K. Shahi, Philosophical Magazine 87 (2007) 4475.[20] G.E. Pike, Physical Review B 6 (1972) 1572.[21] M. Pollak, G.E. Pike, Physical Review Letters 28 (1972) 1449.[22] S.R. Elliott, Advances in physics 36 (1987) 135.[23] S.R. Lukic-Petrovic, F. Skuban, D.M. Petrovic, M. Slankamenac, Journal of
Non-Crystalline Solids, in Press, doi:10.1016/j.jnoncrysol.2010.05.009.[24] P.P. Sahay, S. Tewari, R.K. Nath, S. Jha, M. Shamsuddin, Journal of Materials
Science 43 (2008) 4534.