IMPACTS OF KOWASHE INDUSTRIAL AREA ON ...
72
REPUBLIC OF TURKEY BİNGÖL UNIVERSITY INSTITUTE OF SCIENCE IMPACTS OF KOWASHE INDUSTRIAL AREA ON GROUNDWATER POLLUTION IN SEMEL DISTRICT-DUHOK CITY-KURDISTAN REGION-IRAQ MASTER THESIS Niwar A. MOHAMMED HAMID SOIL SCIENCE AND PLANT NUTRITION SUPERVİSOR OF THESİS Assoc. Prof. Dr. Ali Rıza DEMİRKIRAN BİNGÖL-2017
-
Upload
khangminh22 -
Category
Documents
-
view
0 -
download
0
Transcript of IMPACTS OF KOWASHE INDUSTRIAL AREA ON ...
REPUBLIC OF TURKEY
BİNGÖL UNIVERSITY
INSTITUTE OF SCIENCE
IMPACTS OF KOWASHE INDUSTRIAL AREA ON
GROUNDWATER POLLUTION IN SEMEL DISTRICT-DUHOK
CITY-KURDISTAN REGION-IRAQ
MASTER THESIS
Niwar A. MOHAMMED HAMID
SOIL SCIENCE AND PLANT NUTRITION
SUPERVİSOR OF THESİS
Assoc. Prof. Dr. Ali Rıza DEMİRKIRAN
BİNGÖL-2017

REPUBLİC OF TURKEY
BİNGÖL UNİVERSİTY
İNSTİTUTE OF SCİENCE
IMPACTS OF KOWASHE INDUSTRIAL AREA ON
GROUNDWATER POLLUTION IN SEMEL DISTRICT-DUHOK
CITY-KURDISTAN REGION-IRAQ
MASTER’S THESIS
Niwar A. MOHAMMED HAMID
Institute Department: SOIL SCIENCE AND PLANT NUTRITION
This dissertation was accepted by the following committee on 10.07.2017 with the
vote unity
Assoc.Prof. Dr.
Ali Rıza DEMIRKIRAN
Assist.Prof. Dr.
Yasin DEMİR
Prof. Dr.
Ahmet ALP
Head of examining
committee
Member of examining
committee
Member of examining
committee
I confirm the result above
Prof. Dr. Ibrahim Y. ERDOGAN
Director of Institute

ii
ACKNOWLEDGEMENT
In the name of Allah, the Most Gracious and the Most Merciful
All praise be to God and to Him alone. All the ends of the nerve, the joints, limbs, organs
and faculty of the mine are indebted to God for all the good things he has given me to
enable me to successfully finish this letter. Words are insufficient to describe my
gratitude and appreciation to him in the whole process of preparing, compiling and
writing this letter. In moments of trouble, he led me, showed me what to do, removed all
the obstacles from and lit my way, inspired me, relaxed the arduous task of writing, and
gave me excess energy so I could stay until night after night and put down words on
paper. Without him, I was not able to do this arduous task. He is my world, always there
at every moment! What interests me is that he accepts this contribution of mine that
inspired me to write; help me by sending me various messenger at every crucial juncture.
Praise be to Allaah!
Special appreciation goes to my supervisor Assoc. Prof. Dr. Ali Rıza DEMİRKIRAN, for
his supervision and constant support. His invaluable help of constructive comments and
suggestions throughout the experimental and thesis works have contributed to the success
of this research. also, I would like to express my deep thank Mr. Mohammed Tahir S.
OBAIDELLAH director of Duhok environmental directorate which helps me to carry out
the experiment and my sincere appreciation goes to Mr. Hassan Ramadhan ABDO,
Laboratory's responsible that was very kindly helped me in laboratory work. and I would
never forget to appreciate and thank my parents who were always there for me and my
brothers and sisters. They were always supporting me and encouraging me with their best
wishes. Also not forgetting my wife for his love and care. I dedicate this work to my
mother and to my Dear father Mr. Abdulsetar M. Hamid IBRAHIM.
Niwar A. MOHAMMED HAMID
Bingöl 2017

iii
CONTENTS
ACKNOWLEDGEMENT ................................................................................................... ii
CONTENTS ...................................................................................................................... iii iii
LIST OF FIGURES .............................................................................................................. vi
LIST OF TABLES ............................................................................................................ vi viii
LIST OF SYMBOLS ........................................................................................................... ix
ÖZET ............................................................................................................................ xi
ABSTRACT ......................................................................................................................... xii
1. INTRODUCTION .......................................................................................................... 1 1
2. LITERATURE REVIEW ............................................................................................... 4 4
2.1. Importance of Groundwater ................................................................................... 9 4
2.2. Types of Rocks and Which Type Has The Properties To Hold Water ................... 9 4
2.3. Water Aquifers ....................................................................................................... 9 9
2.3.1. The Three Type of Aquifers ............................................................................. 12
2.3.1.1. Confined Aquifers ................................................................................. 14 12
2.3.1.2. Unconfined Aquifer .............................................................................. 14 13
2.3.1.3. Perched Aquifer .................................................................................... 14 14
2.4. Groundwater Pollution ........................................................................................... 9 15
2.4.1. Sources of Groundwater Pollution ................................................................... 16
2.4.2. Water Used By Industry ................................................................................... 16
2.4.3. Industerial As An Environmental Pressure ...................................................... 17
2.4.4. Bore Wells ........................................................................................................ 18
2.4.5. Contaminated Land ........................................................................................... 18
2.4.6. Heavy Metals .................................................................................................... 19

iv
3. MATERIAL AND METHODS ..................................................................................... 9 20
3.1 Site Description ....................................................................................................... 9 20
3.2. Material ..................................................................................................................... 22
3.3. Method ...................................................................................................................... 22
4. RESULTS AND DISCUSSION .................................................................................. 29 25
4.1. Effects Of Industrial Effluents On Some Physical And Chemical Properties
Of Ground Water .................................................................................................... 9 28
4.1.1. Temperature ...................................................................................................... 28
4.1.2. Turbidity ........................................................................................................... 28
4.1.3. Electrical Conductivity (EC) ............................................................................ 29
4.1.4. Total Dissolved Solid (TDS) ............................................................................ 30
4.1.5. pH ..................................................................................................................... 30
4.1.6. Total Hardness .................................................................................................. 31
4.1.7. Total Alkalinity ................................................................................................. 32
4.1.8. Dissolved Oxygen (DO) ................................................................................... 33
4.1.9. Calcium (Ca) ..................................................................................................... 33
4.1.10. Magnesium (Mg) ............................................................................................ 34
4.1.11. Potassium (K) ................................................................................................. 35
4.1.12. Sodium (Na) ................................................................................................... 35
4.2. The Quantity Of Soluble Salts ................................................................................ 9 36
4.2.1. Quantity Of Soluble Salts ................................................................................. 36
4.2.2. Sulfate (SO4) ..................................................................................................... 36
4.2.3. Chloride (Cl) ..................................................................................................... 37
4.2.4. Nitrate (NO3) .................................................................................................... 38
4.3. Contamination Of Groundwater By Heavy Metals ................................................ 9 39
4.3.1. Iron (Fe) ............................................................................................................ 39
4.3.2. Cadmium (Cd) .................................................................................................. 40
4.3.3. Lead (Pb) .......................................................................................................... 40
4.3.4. Zinc (Zn) ........................................................................................................... 41
4.3.5. Arsenic (As) ...................................................................................................... 42
4.3.6. Copper (Cu) ...................................................................................................... 43
4.3.7. Cobalt (Co) ....................................................................................................... 43
v
4.3.8. Manganese (Mn) ............................................................................................... 44
4.3.9. Nickel (Ni) ........................................................................................................ 45
4.3.10. Aluminum (Al) ............................................................................................... 46
4.3.11. Chromium (Cr) ............................................................................................... 46
4.4. Statistical Analysis ................................................................................................. 9 47
4.4.1. One-Sample Statistics ....................................................................................... 47
4.4.2. Correlation Matrix ............................................................................................ 49
5. CONCLUSION ............................................................................................................ 29 52
REFERENCES ................................................................................................................. 29 53
CURRICULUM VITAE .................................................................................................. 29 59
vi
LIST OF FIGURES
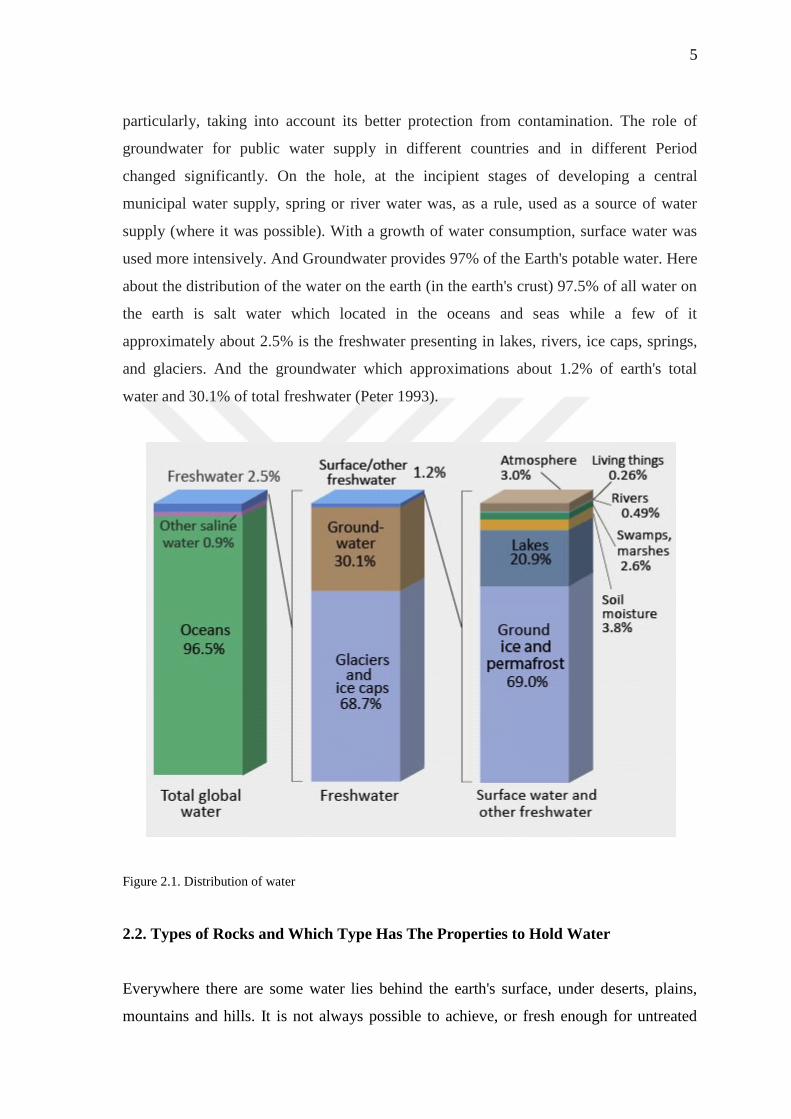
Figure 2.1. Distribution of water ........................................................................................................... 5
Figure 2.2. Location of groundwater ..................................................................................................... 7
Figure 2.3. Porosity and permeability of rocks ..................................................................................... 8
Figure 2.4. Water cycle (hydrological cycle) ........................................................................................ 10
Figure 2.5. Groundwater aquifers .......................................................................................................... 11
Figure 2.6. Confined aquifer ................................................................................................................. 13
Figure 2.7. Unconfined aquifer ............................................................................................................. 14
Figure 2.8. Perched aquifer ................................................................................................................... 14
Figure 3.1. Kowashe industrial area ...................................................................................................... 20
Figure 3.2. Study area location .............................................................................................................. 21
Figure 4.1. Water temperature of studied wells .................................................................................... 28
Figure 4.2. Turbidity of studied wells ................................................................................................... 29
Figure 4.3. Electrical conductivity of studied wells .............................................................................. 29
Figure 4.4. The concentration of total dissolved solid .......................................................................... 30
Figure 4.5. pH of the water studied wells .............................................................................................. 31
Figure 4.6. The concentration of total hardness .................................................................................... 32
Figure 4.7. The concentration of total alkalinity ................................................................................... 32
Figure 4.8. The concentration of dissolved oxygen .............................................................................. 33
Figure 4.9. The concentration of calcium .............................................................................................. 34
Figure 4.10. The concentration of magnesium ........................................................................................ 34
Figure 4.11. The concentration of potassium .......................................................................................... 35
Figure 4.12. The concentration of sodium ............................................................................................... 36
Figure 4.13. The concentration of sulfate ................................................................................................ 37
Figure 4.14. The concentration of chloride ............................................................................................. 37
Figure 4.15. The concentration of nitrate ................................................................................................ 38

vii
Figure 4.16. The concentration of iron ..................................................................................................... 39
Figure 4.17. The concentration of cadmium ............................................................................................. 40
Figure 4.18. The concentration of lead ..................................................................................................... 41
Figure 4.19. The concentration of zinc ..................................................................................................... 42
Figure 4.20. The concentration of arsenic ................................................................................................ 42
Figure 4.21. The concentration of copper ................................................................................................ 43
Figure 4.22. The concentration of cobalt ................................................................................................. 44
Figure 4.23. The concentration of manganese .......................................................................................... 45
Figure 4.24. The concentration of nickel .................................................................................................. 45
Figure 4.25. The concentration of aluminum ........................................................................................... 46

viii
LIST OF TABLES
Table 3.1. Wells specifications in studied area .................................................................................... 23
Table 3.2. Analytical methods and equipment used in the study by standard
APHA 2012 as a reference ............................................................................................... iii 24
Table 4.1. Water analysis of physico-chemical and heavy metal of studied
area ..................................................................................................................................... 25
Table 4.2. Water analysis of physico-chemical and heavy metal of studied
area ................................................................................................................................... 26
Table 4.3. Permissible level of drinking water WHO .......................................................................... 27
Table 4.4. The One-sample statistics of physiochemical parameters under
groundwater in Semel district-Duhok city ........................................................................... 48
Table 4.5. The significance analyses with one-sample statistics analyses of
physiochemical parameters by ANOVA ............................................................................. 49
Table 4.6. Correlation matrix of the 25 physico‐chemical parameters in Duhok
groundwaters ....................................................................................................................... 50
ix
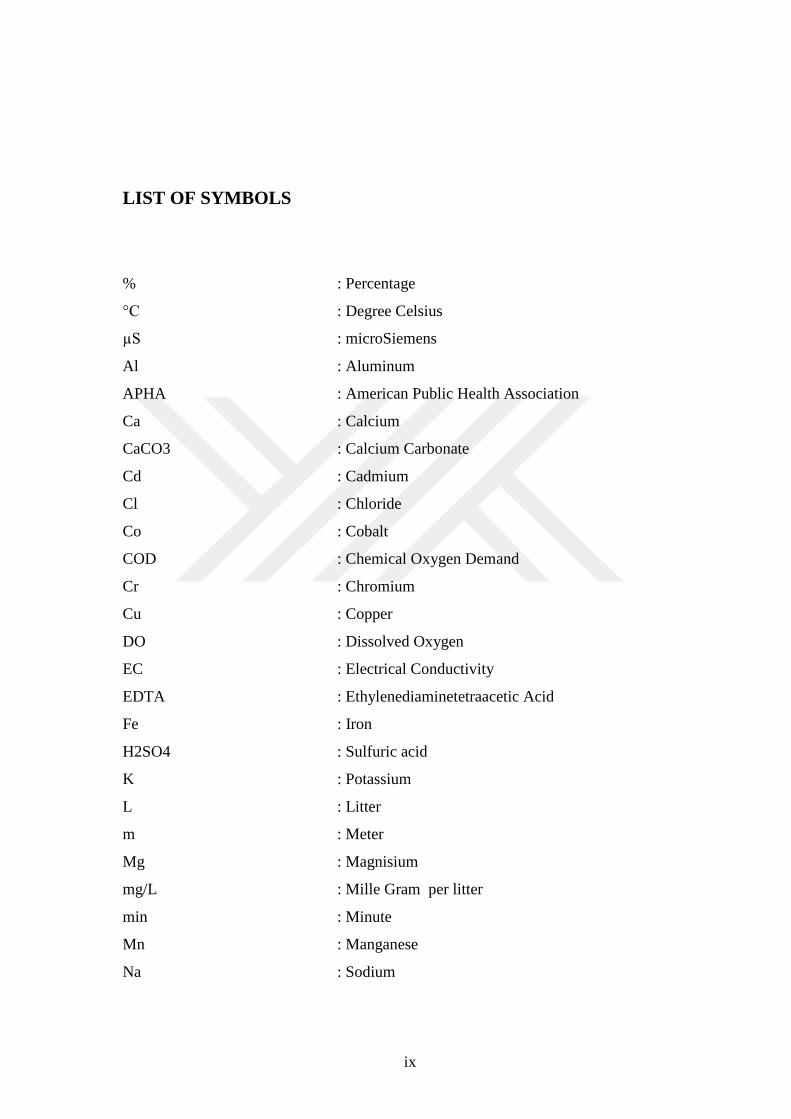
LIST OF SYMBOLS
% : Percentage
°C : Degree Celsius
µS : microSiemens
Al : Aluminum
APHA : American Public Health Association
Ca : Calcium
CaCO3 : Calcium Carbonate
Cd : Cadmium
Cl : Chloride
Co : Cobalt
COD : Chemical Oxygen Demand
Cr : Chromium
Cu : Copper
DO : Dissolved Oxygen
EC : Electrical Conductivity
EDTA : Ethylenediaminetetraacetic Acid
Fe : Iron
H2SO4 : Sulfuric acid
K : Potassium
L : Litter
m : Meter
Mg : Magnisium
mg/L : Mille Gram per litter
min : Minute
Mn : Manganese
Na : Sodium

x
Ni : Nickel
No3 : Nitrate
NTU : Nephelometric Turbidity Unit
P : Phosphorus
Pb : Lead
pH : Potential of Hydrogen
ppm : Part Per Million
TDS : Total Dissolved Solid
TH : Total Hardness
UV-VIS : Ultraviolet-Visible Spectrophotometry
WHO : World Health Organization
Zn : Zinc

xi
DUHOK ŞEHRİ (KÜRDİSTAN BÖLGESİ-IRAK) SEMEL
BÖLGESİNDEKİ KOWASHE ENDÜSTRİYEL ALANININ
YERALTI SUYU KİRLİLİĞİNİN İNCELENMESİ
ÖZET
Kuzey Irak bölgesi Duhok şehrindeki Semel semtine komşu olan aşağı Kowashe sanayi
bölgesinde on adet artezyen kuyusu seçilmiş ve bu kuyulardaki endüstriyel atık kirleticilerinin
etkileri incelenmiştir. Sonuçlar aşağıda özetlenmiştir: Sanayi bölgesi çevresinde dağılmış olan
artezyen kuyularının su sıcaklıkları 20-22 oC civarında değişmektedir. Bulanıklık 0,5-0,9 NTU
arasında değişir. EC 420-730 μS arasında bulunmuştur. TDS değerleri 278 mg / L ve 472 mg / L
(4. Lokasyon) arasında elde edilmiştir. Ölçülen pH’nın 7,3 (5.lokasyon) ile 7,7 (6. lokasyon)
arasında olduğu belirlenmiştir. En yüksek TH seviyesi Girash’da 404 mg / L olarak
kaydedilmiştir. Çözünebilir oksijen (DO), 1. lokasyonda en az (5,7 mg / L) ve 7. lokasyonda
maksimum olarak (8,54 mg / L) gözlenmiştir.
Ca içeriği, 67 mg / L'den (3. Lokasyon) 89 mg / L'ye (Sarshor'da) kadar değişmektedir. En yüksek
Mg içeriği 48 mg / L ile Girrash'ta kaydedilmiştir. K içeriğinin kayıt edilen yüksek içeriği 7 mg /
L'nin üzerindedir. 27 mg / L olarak kaydedilen Na’un maksimum seviyesi lokasyon 6’da
belirlenmiştir.
Anyon olarak SO4 iyonlarının içeriği 3. lokasyonda 2,8 mg / L olarak nispeten düşüktür, Girrash
bölgesinde ise 28,6 mg / L olarak yüksek düzeydedir. Klorür iyonu konsantrasyonu 1-5
arasındaki lokasyonlarda düşük, 6 ila 10 lokasyonları arasındaki bölgelerde yüksek seviyede olup,
Girrash lokasyonunda en yüksektir (30 mg / L). NO3 konsantrasyonu, 55,3 ml / L ile Girrish
mevkiinde en yüksek seviyede kaydedilmiştir ve bu değer içme suyu için güvenilir değildir.
Ağır metal olarak Fe elementinin yüksek seviyeleri, 3. ve 7. noktalarda 0,0162 mg / L olarak
kaydedilmiştir. Cd'un en yüksek değerleri 0,008451 mg / L ve 0,008391 mg / L olarak sırasıyla
lokasyon 1 ve 10'da kaydedilmiştir. Pb konsantrasyonu birinci lokasyonda en yüksek (0,00397
mg / L) ve onuncu lokasyonda en düşük (0,000718 mg / L) düzeydedir. Zn konsantrasyonu, 7.
lokasyonda 0,4212mg / L'ye ulaşmıştır. As konsantrasyonun en yüksek seviyesi 0,00185 mg / L
olarak (lokasyon 7) tespit edilmiştir. Yüksek bakır seviyesi 1,3761 mg / L ile birinci
lokasyondadır. Yüksek Kobalt konsantrasyonu 1. lokasyonda 0,000173mg / L olarak
bulunmuştur. Mn konsantrasyonunun en yüksek değeri 1. lokasyonda olup 0,0765mg / L'dir. Ni
konsantrasyonu 0,0717mg / L'ye olarak 2. Lokasyonda maksimum olmuştur. Al içeriği ise, 6.
lokasyonda 0,020555 mg / L olarak elde edilmiştir.
Anahtar Kelimeler: Yeraltı suları, kirlilik, endüstriyel alan, Semel, ağır metal.
xii
IMPACTS OF KOWASHE INDUSTRIAL AREA ON
GROUNDWATER POLLUTION IN SEMEL DISTRICT-DUHOK
CITY-KURDISTAN REGION-IRAQ
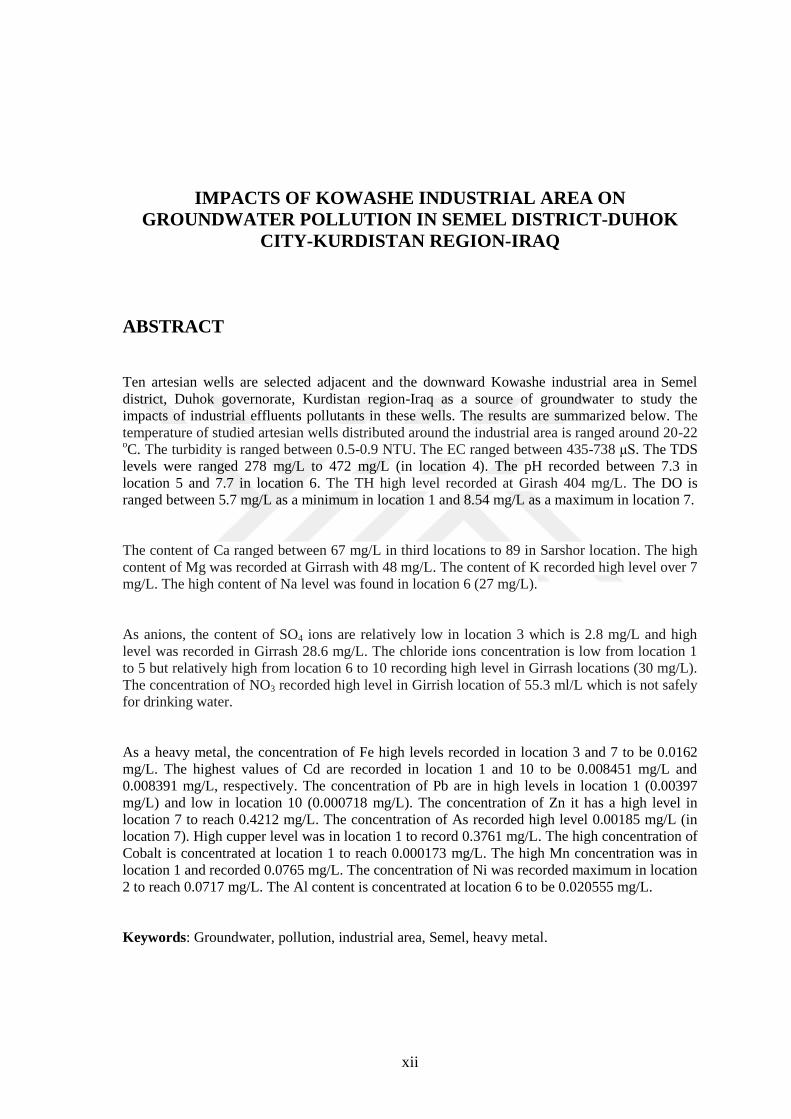
ABSTRACT
Ten artesian wells are selected adjacent and the downward Kowashe industrial area in Semel
district, Duhok governorate, Kurdistan region-Iraq as a source of groundwater to study the
impacts of industrial effluents pollutants in these wells. The results are summarized below. The
temperature of studied artesian wells distributed around the industrial area is ranged around 20-22
oC. The turbidity is ranged between 0.5-0.9 NTU. The EC ranged between 435-738 μS. The TDS
levels were ranged 278 mg/L to 472 mg/L (in location 4). The pH recorded between 7.3 in
location 5 and 7.7 in location 6. The TH high level recorded at Girash 404 mg/L. The DO is
ranged between 5.7 mg/L as a minimum in location 1 and 8.54 mg/L as a maximum in location 7.
The content of Ca ranged between 67 mg/L in third locations to 89 in Sarshor location. The high
content of Mg was recorded at Girrash with 48 mg/L. The content of K recorded high level over 7
mg/L. The high content of Na level was found in location 6 (27 mg/L).
As anions, the content of SO4 ions are relatively low in location 3 which is 2.8 mg/L and high
level was recorded in Girrash 28.6 mg/L. The chloride ions concentration is low from location 1
to 5 but relatively high from location 6 to 10 recording high level in Girrash locations (30 mg/L).
The concentration of NO3 recorded high level in Girrish location of 55.3 ml/L which is not safely
for drinking water.
As a heavy metal, the concentration of Fe high levels recorded in location 3 and 7 to be 0.0162
mg/L. The highest values of Cd are recorded in location 1 and 10 to be 0.008451 mg/L and
0.008391 mg/L, respectively. The concentration of Pb are in high levels in location 1 (0.00397
mg/L) and low in location 10 (0.000718 mg/L). The concentration of Zn it has a high level in
location 7 to reach 0.4212 mg/L. The concentration of As recorded high level 0.00185 mg/L (in
location 7). High cupper level was in location 1 to record 0.3761 mg/L. The high concentration of
Cobalt is concentrated at location 1 to reach 0.000173 mg/L. The high Mn concentration was in
location 1 and recorded 0.0765 mg/L. The concentration of Ni was recorded maximum in location
2 to reach 0.0717 mg/L. The Al content is concentrated at location 6 to be 0.020555 mg/L.
Keywords: Groundwater, pollution, industrial area, Semel, heavy metal.

1. INTRODUCTION
Before we begin to write this research, we have to understand to our sources of life on
this earth. The main source of life is the water. Water affects all sides of life directly or
indirectly. Without it, there will be no plants on land, no oxygen for the animals to take a
breath, and not the human and the planet look quite different from what you have seen do
today. Water is essential to keep people's bodies and the environment healthy and should
be respected and protected as the precious resource. Groundwater is therefore one of the
fundamental types of the hydrological cycle, which performs many functions in our daily
lives. Most of the earth's water is salt, about 97.5% of the total water on the earth is salt,
however, only 2.5% is freshwater, of all the waters of the earth and of those waters
groundwater is 1.2% of all water on the earth and about 30.1% of freshwater (Morgan
and Collins 2001).
Groundwater is underground water, underground in cracks, spaces or pores in the soil,
sand and fractures in rocks, which provide water cycle (hydrological cycle). The main
three types of rocks are known as sedimentary rocks, metamorphic rocks, and igneous
rocks, and the changes between them are related to how they are formed. Here
sedimentary rocks are the types which have the properties to hold water (USGS 2014).
In the aquifers ground water is stored and slowly moving from one side to another, layers
of sand, soil, and rocks. The aquifers usually contain sand, sandstone, and gravel or
fractured rock, such as basalt or limestone. Those materials have a permeability of
holding water because of large connected spaces of that material due to allowing water to
flow through. Water naturally transported to the surface of the aquifer through a spring or
can be discharged into streams and lakes. This water can also be pulled out from well
drilled into the aquifer; aquifers divided into three types:
Confined aquifer. Those in which there is an impermeable layer of dirt-rock, which
prevents the water from entering the aquifer from the ground surface of the soil directly
2
above. Instead, the water leaks into the confined aquifers farthest from where the
impermeable layer does not exist. Unconfined aquifer. That is the water that flows from
the surface of the earth directly into the aquifer. Perched aquifers. Perched aquifer is a
type of unconfined aquifer located above another aquifer is undivided because the water
infiltrating from the surface is restricted or "perched" on the confined superficial
groundwater (US EPA 2012).
The main type of contamination of ground water is known by industrial wastes, domestic
and agricultural activity in those types of pollution are a serious problem confronted by
developing countries. Industrial wastewater, sewage sludge and solid waste materials are
presently being discharged into the environment at random. These substances enter
subterranean aquifers, leading to pollution of irrigation and drinking water. These
substances enter subterranean aquifers, leading to contamination of irrigation and
drinking water (Forstner 1981). Over-reliance on groundwater has resulted in 66 million
people in 22 states being threatened by excessive fluoride and 10 million in arsenic
threats in six states (Gush 2007). As well, The excessive salinity are the serious problems,
especially in coastal areas, nitrates, iron and others (Desai 1990). Nearby 195,800 people
are affected by poor water quality due to chemical parameters (CPCB 1999).
It has been estimated that once the pollution enters the subsurface environment, it may
remain hidden for many years, becoming discrete over wide areas of groundwater aquifer
and rendering groundwater supply of non-potable groundwater and other uses. The rate of
depletion of groundwater levels and a worsening of groundwater quality is of instant
concern in main cities and towns of the country. The increased dependency on
groundwater has made water conservation improvement top importance in water
management studies. The challenge ahead is to provide water of the correct quality and
quantity at the right place and time. In the context of the above situation, the objective of
the present study was to analyze the physicochemical parameters and heavy metals of the
artesian wells of groundwater in the Kowashe industrial area to know the impact of
industrial and its environs. The evaluation of water quality index has been required
because of a large number of industries in the Kowashe study area. The influence on the
quality of groundwater on the quality of life of inhabitants in the villages nearby the
industrial area was evaluated based on the analysis of the WHO questionnaire.

3
When rainwater or surface water enters contaminated soil during leakage into the ground,
it can become contaminated and may transfer pollution from soil to groundwater.
Groundwater can also become polluted when liquid hazardous materials themselves are
severely reduced through the soil or rocks in groundwater. Some liquid hazardous
substances do not blend with the groundwater, but continue to rally within the soil or
bedrock. These common materials can performance as long-term sources of groundwater
contamination, where groundwater flows through or connects to soil or rocks.
Groundwater can become contaminated by two way point sources and non-point sources
(Adams and Foster 1992).
In the industrial water commonly used for cooling, cleaning, heating, cooling and
generating streams, like as solvent and transport of dissolved materials, and industrial
used water as an important part to product itself. The removal of water for the industry is
usually much greater than the amount already consumed (WWAP 2006).
Heavy metals are commonly present in groundwater at trace concentrations. The most
common sources of pollution include mining, urban and industrial wastes, agricultural
wastes, sewage sludge, fertilizers and fossil fuels. Heavy metals can be very toxic to
humans even at low concentrations, due to a tendency to bioaccumulation in the food
chain (Alloway and Jackson 1991).
The aim of this research is to:
The hazardous environmental effluent of industrial areas effluents on groundwater
pollution.
Selecting ten artisans well distributed downward and around the industrial area to
study the impacts on their physiochemical parameters and heavy metal contents.
To assess the influence of industrial pollutions on the quality parameters of
groundwater as physic-chemical properties like PH, Ec, TDS, alkalinity, and hardness.
To determine the quality of soluble salts as ions like nitrate, sulfate, and chloride
in these wells.
Focusing heavy metal accumulation in groundwater downward the watersheds of
these effluents in ten artesian wells distributed in the study area.
2. LITERATURE REVIEW
2.1. Importance of Groundwater
We may ask, why groundwater is important? Actually, it's the very important type of
water. Groundwater is extensively used in a variety of ways, like for industrial water
supply, residential water supply, crop irrigation, washing, cleaning, any place that well
water is used its water used for many purposes, but especially for 'drinking' cause
groundwater is the cleanest water we ever have. And most of it doesn’t need to be
cleaned or filtered. Farms, cities, and factories often depend on groundwater. The
temperature of groundwater is constant throughout the year, because of its properties that
stop at same temperature it can be used to cool houses in summer and heat them in
winter. In some parts, groundwater has become increasingly significant as a source of
heat for "heat pumps." Because of the little rain falls in some part of world , only
groundwater are the source of water. Without groundwater no one could live in those
places, and no plants would grow ( Bayer et al. 2006).
Groundwater, as a source of domestic and drinkable water supply, has some advantages
over surface one. It is, as a rule, characterized with a higher quality (availability of
components, necessary for human vital activities) and better protection from
contamination and evaporation. Groundwater resources, due to the availability of
adaptive capacity, are not subjected to multi annual and seasonal variations. In some
northern and arid zones, where surface water flows froze up or dry up in some periods of
a year, groundwater is the only water supply source. In many cases, it is possible to be
summarized ground water in the direct vicinity of a consumer. Putting well fields into
operation can be made slowly with the increasing growth of consumption, while hydro
technical constructing, for surface water use, needs usually large one-time expenses. All
the conditions mentioned predetermined a considerable increase of groundwater use for
the drinkable and domestic supply of the population, if compared with surface water,
5
particularly, taking into account its better protection from contamination. The role of
groundwater for public water supply in different countries and in different Period
changed significantly. On the hole, at the incipient stages of developing a central
municipal water supply, spring or river water was, as a rule, used as a source of water
supply (where it was possible). With a growth of water consumption, surface water was
used more intensively. And Groundwater provides 97% of the Earth's potable water. Here
about the distribution of the water on the earth (in the earth's crust) 97.5% of all water on
the earth is salt water which located in the oceans and seas while a few of it
approximately about 2.5% is the freshwater presenting in lakes, rivers, ice caps, springs,
and glaciers. And the groundwater which approximations about 1.2% of earth's total
water and 30.1% of total freshwater (Peter 1993).
Figure 2.1. Distribution of water
2.2. Types of Rocks and Which Type Has The Properties to Hold Water
Everywhere there are some water lies behind the earth's surface, under deserts, plains,
mountains and hills. It is not always possible to achieve, or fresh enough for untreated

6
use, and it is sometimes difficult to find or measure and describe. These waters may occur
near the surface of the earth, as in the marshes, or may lay hundreds of feet below the
surface of the earth, as in some dry areas of the west. Water at very shallow depths might
be just a little hours old at moderate profundity, it may be hundred years old and at great
deepness or after having flowed long distances from places of entry, water may be several
thousands of years old (Schön 2015).
Acknowledged of Groundwater by humans for many thousand of years. Many ancient
records show that humans have known for a long time that much of the water is contained
underground, but only recently have scientists and engineers learned how to estimate the
amount of ground water stored underground and have begun to document their great
potential for use. A projected one million cubic miles of the biosphere’s groundwater is
stored within one-half mile of the land surface. Only a part of this reservoir of ground
water, however, can be practicably appointed and complete available on a perennial basis
through wells and springs. The volume of groundwater storage is 30 times greater than
about 125045 cubic kilometers in all freshwater lakes and more than 1250 cubic
kilometers of water worldwide. It is difficult to visualize underground water. Some
people think that groundwater collects in underground lakes or movements into
underground rivers. In fact, ground water is simply subterranean water that completely
saturated pores or cracks in the soil and rocks (Jaeger 2009).
Groundwater is recharged through rainfall, and depending on local climate and geology,
water is distributed unequally in quantity and quality. When the rain falls or the snow
melts, some water evaporates, some of which are reflected in the plants, some movements
are by land and are collected in streams and some of his water sneak into the cracks or
pores of the soil and rocks. The major water entering the soil replaces water that has been
evaporated or used by plants during a former dry period. Between the surface of the earth
and the groundwater is the area called the unsaturated hydrologists. From this unsaturated
zone (the zone of aeration), at least there is usually a little water, commonly in smaller
openings of soil and rocks. Large openings usually contain air instead of water (Kitutu et
al. 2009).
After heavy rain, the area may be almost saturated; after a long dryish period, it may be
almost dry. Some water is formed in the unsaturated zone by molecular attraction, and

7
will not move towards or enter the well. Similar forces carry enough water in the spray
towel to make them feel moist after they have stopped drip after the water supply of the
plant and soil are satisfied, every excess water will sneak into the upper table water from
the area below the holes in the saturated rocks. Under the surface of the water, all
openings in the rocks are filled with water that is transported through the aquifer to the
waterways, springs or wells from which water is reserved. Deep recharge of aquifers is a
slow process because the groundwater slowly moves through the unsaturated area and the
hollow basin. The amount of recharge is also considered important (Wada et al. 2012).
Figure 2.2. Location of groundwater
The amount of water carried by a rock depends on the porosity of the rocks as an area of
pores between the grains of rocks or the cracks in the rocks that can be full with water.
For example, if grains of sand or gravel are all over the same size, or "well sorted", the
water-filled spaces between the grains signify a large quantity of the aquifer's size. If the
grains, however, are poorly organized, the spaces between large grains may be filled with
small grains instead of water. The sand and gravel water tanks, which contain well-sorted
granules, hold and transport large quantities of water from those aquifers containing low-
grade grains. If water is to move through rock, the pores necessity be connected to one
another. If the pore spaces are linked and large enough that water can move freely
through them, the rock is said to be permeable (Heidug and Wong 1996).

8
Rocks that produce large amount of water into springs or wells necessity have many
connected to spaces of creacks. Rocks that compress almost without pore spaces, such as
granite, may be absorbent if it contains enough large and related cracks or fractures.
Nearly all consolidated rock creations are broken by similar systems of cracks, called
joints. These joints are caused by stresses in the Earth's crust. In the first place, many
joints are capillary cracks, but tend to rise through the work of many physical and
chemical processes. Ice crystals made of water that freeze in the rocky cracks near the
earth's surface will cause the rocks to divide open. Heated by the Sun and cooling at night
cause increase and decrease that produce the same result. Water will enter the joints, and
may slowly dissolve the rock or erode weathered rock and thereby enlarge the openings
(Johnson and Morris 1962).
Figure 2.3. Porosity and permeability of rocks
For a land made of rocks. About Thousands of different types of rocks and minerals have
been found on the Earth. Most rocks on earth consist of only eight elements: oxygen,
silicon, calcium, aluminum, iron, magnesium, sodium and potassium. These elements are
common in a number of ways to make rocks that are very different. The main three types
of rocks are known as sedimentary rocks, metamorphic rocks, and igneous rocks, and the
changes between them are related to how they are formed.Sedimentary rocks are made up
of previously existing rocks. Weathering breaks the rocks into smaller bits and pieces.
Wind, water and ice carry these pieces and deposit them and accumulate in layers on the
surface of the earth. Metamorphic rocks form when rocks are exposed to high
temperature and pressure. The heat and pressure have changed dramatically from their
original shape. Huge rocks form when the rocks melt from the depth of the earth and cool

9
down and become solid. Chemical composition of magma and refrigeration The rate of
determination of the type of igneous rocks becomes. The igneous and metamorphic rocks
don't have the properties to hold water because of their formation, but the sedimentary
rocks can hold water cause this type of rocks have the porosity and permeability, unlike
others through their cracks, spaces, and breaks caused by weathering and erosion.
Sedimentary rocks become the most important type of rocks (Christopherson 2002).
2.3. Water Aquifers
The water available to planet Earth is the same water that has always been available and
the only water that ever will be available. Because water covers three-quarters of the
earth’s surface, it might appear that there is plenty to go around. In reality, however, we
have a limited amount of usable fresh water. If you think about it, water never stays in
one place for too long Water is always on the move, travel on an endless journey, patrol
between the earth and the sky. This is referred to as a hydrological cycle or cycle. The
hydrological cycle made up of those parts as a below:
Evaporation (and transpiration)
Condensation
Precipitation
Collection
*Evaporation: is when the sun temperatures up water in rivers or lakes or the ocean and
goes it into vapor or steam. The water steam or vapor leaves the river, lake or ocean and
turn into the air.
*Condensation: Water vapor in the air becomes cold and changes back into liquid,
forming clouds.
*Precipitation: This process occurs when so much water has reduced that the air cannot
hold it any longer. The clouds get heavy and water falls back to the earth in the form of
snow , hail, rain, sleet or.
*Collection: When waterfalls back to earth as precipitation, it may drop back in the
oceans, lakes or rivers or it may end up on land. When it ends up on land, it will either
soak into the earth and become part of the “ground water” that plants and animals use to
drink or it may run over the soil and collect in the rivers, lakes or oceans where the cycle
starts (Trenberth 2011).

10
Figure 2.4. Water cycle (hydrological cycle)
The water that leaks to the ground moves downward due to gravity, passing through the
pore spaces between the soil particles, until it reaches the depth of the soil where the
pores are already filled or saturated with water. When water enters the saturated zone, it
becomes part of groundwater. The soils of water or the composition of rocks capable of
producing enough water for human use are called aquifer. In aquifers, water can move
through cracks or fractures. Some types of foundation stone such as sandstone, can
absorb water such as sponge, other types of foundation such as no granite.
How quickly water passes through or infiltrates, the soil is a function of the size and
shape of the soil particles, a number of pore spaces between the particles, and whether the
pore areas are interconnected. For example, soils that contain primarily of larger sand and
gravel particles tend to have larger, interconnected pore spaces that allow water to flow
easily and relatively quickly. In contrast, some soils, such as silts and clays, have poorly
connected pore spaces, a soil structure which tends to slow down infiltration (Bredehoeft
and Pinder 1970).

11
Figure 2.5. Groundwater aquifers
When the water infiltrates into the water level, it begins to move with the flow of
groundwater, which tends to follow the slope, or downhill slope, the direction. Compared
to water in rivers and streams, groundwater is very, very slow, moving from a little part
of the foot daily in mud to up to 3-4 feet a day in sand and gravel. In time, ground water
"resurfaces"-perhaps when it intersects with a nearby water body, such as a stream, river,
lake, pond, or ocean; or perhaps when it emerges from the hills as a spring or as an object
emerges from a rocky formation on the side of the road. Groundwater is a large part of
the natural water cycle. Another way ground water resurfaces is when it is reserved from
the ground by way of a well. Wells are drilled and connected to capture groundwater and
pump it to the surface. In recent years, the term acetard has been formulated to
characterize a less permeable family in the stratigraphic chain. This beds can be
sufficiently permeable to transport water in significant quantities in the study of regional
groundwater flow, but its permeability is not sufficient to allow completion of the
production wells within it. Most geological layers are classified as aquifers or aquifers
(Freeze and Cherry 1979).

12
2.3.1. The Three Types of Aquifers
2.3.1.1. Confined Aquifers
The confined aquifer is overlain in a confined layer. Which are usually semi- pervious,
allowing for vertical flows between adjacent layers. Unless it is irrational abstraction, the
confined aquifers are under pressure; this means that the level of water in the piezometric
well will rise above the upper part of the aquifer. this means that the water level in a
piezometric well will rise above the top of the aquifer. The surface of the potentiometric
can be at the top of the sub-perivius layer, above that but under water table of the
unconfined aquifer covered, , above it but under the water table of the unconfined aquifer
covering it, or finally above the water table. A special case is when the potentiometric
surface is above the ground level, the well all-pervading the confined aquifer existence
artesian. The differences in the hydraulic head between the unconfined and the confined
aquifer lead to the vertical flows directed from the aquifer have an upper value for the
aquifer with a lower hydraulic header value. Vertical water transport is called leakage,
and therefore will be directed up or down.
The regional confined aquifer is recharged directly by precipitation in the area where the
aquifer exits, which has the same characteristics as the ungrouped aquifer, and another
source of recharge is infiltration in the area of agriculture similar to surface runoff born
on the slopes of the hill through rain Or melting snow. This groundwater is not confined
to the direct recharge area followed by the foundation stone is deepened, being covered
by impermeable or semi- pervious layers and became confined groundwater. There are
interesting relationships in this latter case between the confined aquifer and the coverage
of the non-confined aquifer. According to the head position with water, the vertical flows
are directed between the two layers down or upward.Thus the confined groundwater is
refilled by direct infiltration and filtration or by leakage. In the case of a multilayered
aquifer, depending on the value of water extraction, a confined layer can be recharged by
vertical flows coming from the underlying aquifers and overlying (Castany 1982).

13
Figure 2.6. Confined aquifer
2.3.1.2. Unconfined Aquifer
Is close to the land surface, being under the direct effect of the climatic factors
(precipitations fundamentally, but temperature also). The groundwater inconstancy
follow with a certain lag, dependent on the deepness and the nature of the unsaturated
zone, the variation of the fallen precipitations. The unconfined aquifers from the surface
of the water are spread to the base of the aquifer, which is characterized by impermeable
boundary. Most of the unconfined aquifers are formed by extremely permeable layers
(gravel, coarse or medium sand) and less permeable creations (silt or clay) Which does
not interrupt the hydraulic continuity of the permeable layers at the regional level.
Natural recharge of the unconfined aquifers is mostly due to the downward leakage (or
filtration) through the unsaturated zone of the excess water over passing the field capacity
of the soil. Recharge can also occur through upward leakage from underlying aquifers
(Castany 1968).
In irrigated areas, large amounts of water are currently exceeding field capacity
penetration. Losses from water supply or urban sewerage are another source of
groundwater recharge. Rivers generally depletion of aquifers, but in some cases they may
lose water that feeds aquifers; this occurs when the groundwater level is less valuable
than river water level or during floods when water flows into the floodplains. In arid
countries, some rivers completely seep into the bed river if formed by sand or gravel.
Many of the non-confined aquifers used for water supply are located in silt fans, which
have large thickness and contain significant water capacities; at the same time, due to

14
high values of hydraulic conductivity, they can convey water flow very quickly to a
spongy medium (Fetter 2001).
Figure 2.7. Unconfined aquifer
2.3.1.3. Perched Aquifer
Perched aquifers. Perched aquifer is a type of unconfined aquifer located above another
aquifer is undivided because the water infiltrating from the surface is restricted or "
perched " on the confined superficial groundwater (US EPA 2012).
Figure 2.8. Perched aquifer

15
2.4. Groundwater Pollution
How groundwater becomes polluted:
Groundwater contamination is nearly always the result of human activity. In areas where
population density is the high and human use of the land is intensive, ground water is
especially susceptible. Almost any activity whereby chemicals or wastes may be released
to the environment, either purposely or accidentally, has the possible to pollute ground
water. When ground water becomes polluted, it is difficult and expensive to clean up.
Ground water and surface water are connected and can be fully comprehended and
rationally managed only when that fact is acknowledged. If there is a water supply well
near a source of pollution, that well runs the risk of becoming polluted. If there is a
nearby river or stream, that water body may also become polluted by the groundwater
(Howard and Gelo 2002).
When ground water is polluted according to its physical, chemical and biological
properties, the pollutant released into the environment may move within the aquifer in the
same way that ground water moves. (Some contaminants, due to their physical or
chemical properties, do not always follow groundwater flow). It is possible to predict, to
some extent, the transport within the aquifer of those substances that move along with the
flow of groundwater. For example, both water and some contaminants flow in the
direction of the terrain from feeding areas to discharge areas. The porous and permeable
soils tend to convey water and confirm the types of contaminants relatively easily to the
aquifer below. Just as groundwater moves generally slowly, contaminants in
groundwater. Because of this slow movement, pollutants tend to remain concentrated in
the form of a column that flows on the same course of groundwater. The size and speed
of the column depends on the quantity and type of pollutant, its solubility and density,
and the velocity of the surrounding groundwater. Groundwater and pollutants can move
quickly through fractures in rocks. Broken rock is a unique problem in locating and
controlling contaminants because the fractions are randomly separated and do not follow
the parameters of the Earth's surface or the hydraulic gradient. Pollutants can also be
transferred to the groundwater system through total pores, root systems, animal burrows,
abandoned wells and other systems of holes and cracks that provide pathways to
contaminants. In general, the greater the distance between the source of pollution and the
source of groundwater, the greater the likelihood that natural processes will reduce the

16
effects of pollution. Processes such as oxidation, biological degradation (which makes
pollutants less toxic at times), and adsorption (binding of materials to soil molecules)
may take place in soil layers in the unsaturated area and reduce pollutant concentration
before reaching groundwater. Even contaminants that reach groundwater directly, without
passing through the unsaturated zone, can become less concentrated by dilution (mixing)
with groundwater. However, since groundwater typically moves gradually, contaminants
usually penetrate less than mixing in surface water (Kumar et al. 2005).
2.4.1. Sources of Groundwater Pollution
There are many different sources of groundwater contamination. Groundwater becomes
polluted when it is human, or originated by people, is dissolved or mixed in water that
recharges the aquifer. Examples include salt, petroleum products leaking from
underground storage tanks, nitrates from excessive use of chemical fertilizers or compost
in agricultural land, excessive application of chemical pesticides, leakage of liquids from
landfills and landfills, and accidental spills. Contamination also results from excess
natural iron, sulphides, manganese, and substances such as arsenic. Iron and manganese
are the most common natural pollutants. Another form of pollution is caused by
radioactive decay of uranium in the first place, making irradiated radon. Methane and
other gases sometimes cause problems. Sea water can also be found in groundwater and
is a common problem in coastal areas. This is referred to as salt water intrusion (Atmadja
et al. 2001).
2.4.2. Water Used By Industry
In the industrial water commonly used for cooling, cleaning, heating, cooling and
generating streams, like as solvent and transport of dissolved materials, and industrial
used water as an important part to product itself. The removal of water for the industry is
usually much greater than the amount already consumed (WWAP 2006). Following the
main growth of 1960 to 1980, water withdrawals for industry almost all over the world
have stabilized in Europe and are steadily increasing, but not as fast as they were in Asia.
And in areas where rare groundwater uses groundwater to meet industrial demand. While
it is often difficult to obtain specific data on the groundwater withdrawal of this industry,
it is clearly still a small fraction of that used in agriculture.

17
2.4.3. Industry As An Environmental Pressure
Of greater concern is the actual volume of groundwater that has been withdrawn by
industry and the potential negative impact of industry on the quality of the sub-surface
environment (WWAP 2006).
This is due to the fact that the balance between the volume of withdrawn water and the
much smaller volume that is already consumed becomes waste water or liquid waste to be
disposed of. Usually through one of the following actions (WWAP 2006).
• Direct disposal without treatment on land, or across streams, rivers and waterways
aquifers;
• Disposal of municipal sewage systems that may or may not include wastewater
treatment.
• Treatment of wastewater at the site before disposal by any of the above.
Management of these large amounts of wastewater is a main challenge for urban
authorities. While there is sometimes range for reclamation of industrial wastewater to
make it reusable within the industry itself or by other users, most wastes are returned
directly to the water cycle, often without adequate treatment. The volumes of these
wastes and the concentrations of the hazardous substances they contain, together with the
disposal of the underlying groundwater, are at risk of contamination (Morris et al 2003).
Therefore, in assessing industrial impacts, groundwater quality issues are likely to be
more dominant than quantity. The latter, which include recovery at the groundwater level
in response to the decline in industrial extraction or mining, is adequately addressed
through discussions on the effects of groundwater extraction in the associated information
sheets on agriculture and urbanization. This paper focuses on the effects of industrial and
mining activities on groundwater quality. For developed countries, the greatest concern is
often to deal with the residual effects of industrial heritage and mining in the last two
centuries. By contrast, the main concern for new industrialized countries and developing
countries may be the potential effects of rapidly growing, often unplanned and
unregulated industrial activities. Although they may be small in scale, they are widely
distributed in urban and peri-urban areas and are increasingly appearing in rural areas as

18
well. Their potential environmental impact may not yet be observed, nor is the risk posed
to groundwater (Olayinka and Alo 2004).
2.4.4. Bore Wells
Groundwater sources differ from other natural water sources, since the water cycle and
the aquifer are two systems inextricably linked with each other exerting continuous effect
on the other (Howell et al. 1993; Eyre et al. 1993). Described groundwater as the
underground water in the saturated rock area, i.e at a depth where the full space of the
rock is filled with water (Allenby et al. 1993; DLWC 1995). Ground water quality is of a
higher standard compared to surface waters because of its natural cleansing. Less
treatment is required where minimal treatment is a high preference (Reinhold 1992). Bore
wells are also popular in many of the rural communities in both developed and
developing countries, especially where the supply of treated tap water may not be feasible
(SIA 2000). It is primarily used for domestic consumption, agriculture, and industrial
activities. The application and usage depend on the nature and quality of the source
(NDOH 2000).
2.4.5. Contaminated Land
Groundwater may be adversely impacted if contaminants on land find their way into
groundwater. Industrial activity has left land contaminated with a variety of inorganic and
organic contaminants, frequently including heavy metals, hydrocarbons, and organic
solvents, which can lead to serious groundwater pollution. Today’s contaminated land
becomes tomorrow’s groundwater pollution problem. The historical problem is
widespread, but recent legislation governing industrial processes and emissions seeks to
reduce future contamination. The risk of groundwater contamination is increased where
the contaminant is mobile, by virtue of its solubility in water or its viscosity, and if there
is a pathway to groundwater. Having entered groundwater, the impact of a chemical will
depend on its toxicity and persistence. Some contaminants are therefore more likely to
impact on groundwater than others (Bardos 1994).
19
2.4.6. Heavy Metals
Heavy metals are commonly present in groundwater at trace concentrations. The most
common sources of pollution include mining, urban and industrial wastes, agricultural
wastes, sewage sludge, fertilizers and fossil fuels. Heavy metals can be very toxic to
humans even at low concentrations, due to a tendency to bioaccumulation in the food
chain (Alloway and Jackson 1991). However, high concentrations in aquifers are not
normally a problem as heavy metals are generally relatively insoluble in groundwater
under normal pH conditions (6.5 to 8.5), and are therefore immobile in most aquifers.
The greatest risk posed by heavy metal contamination is in shallow, acidic groundwater
(Tiller 1989).
Heavy metals are commonly present in groundwater at trace concentrations. The most
common sources of pollution include mining, urban and industrial wastes, agricultural
wastes, sewage sludge, fertilizers and fossil fuels. Heavy metals can be very toxic to
humans even at low concentrations, due to a tendency to bioaccumulation in the food
chain (Shashikanth et al. 2008).
Another hands Most of these metals especially Iron, manganese, chromium, and copper
in small amount are essential elements for most life systems on earth, because of their
participation in many important physiological processes within the biological bodies
including humans and animals. Although exceeds their level are related with an increased
risk for cancer, heart disease and another disease such as endocrine problem, arthritis,
diabetes and liver disease (Niederau et al. 1996).
3. MATERIAL AND METHOD
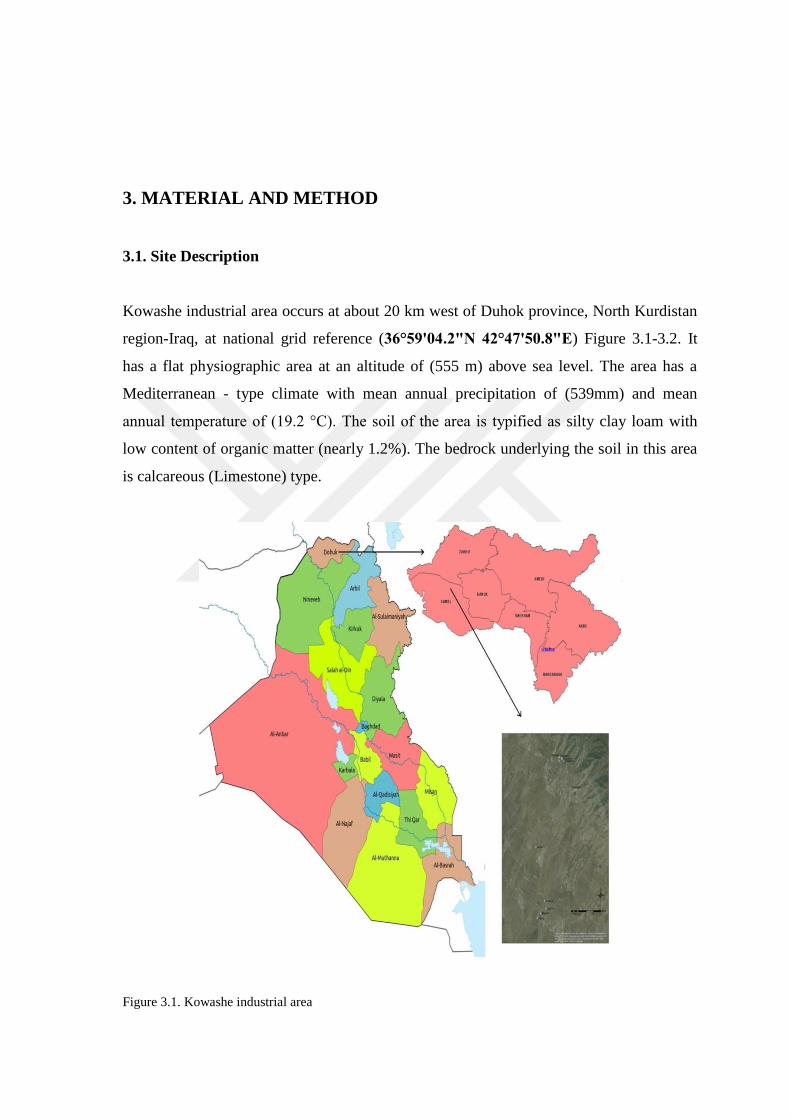
3.1. Site Description
Kowashe industrial area occurs at about 20 km west of Duhok province, North Kurdistan
region-Iraq, at national grid reference (36°59'04.2"N 42°47'50.8"E) Figure 3.1-3.2. It
has a flat physiographic area at an altitude of (555 m) above sea level. The area has a
Mediterranean - type climate with mean annual precipitation of (539mm) and mean
annual temperature of (19.2 °C). The soil of the area is typified as silty clay loam with
low content of organic matter (nearly 1.2%). The bedrock underlying the soil in this area
is calcareous (Limestone) type.
Figure 3.1. Kowashe industrial area

21
Figure 3.2. Study area location

22
3.2. Material
Ten artesian wells are selected around and downward Kowashe industrial area in Summel
District, Duhok governorate, Kurdistan region-Iraq regions as a source of groundwater to
study the impacts of industrial effluents pollutants in these wells and save in colored
buttol. Water samples were collected for physical and chemical analysis. We take water
from the artesian wells of groundwater and collect all the samples and Wells
Specifications in January 2017.The air temperature, water temperature, total dissolved
solid, electrical conductivity and pH were estimated on the spot at the time of sampling
while other parameters were estimated in Duhok environmental director laboratory and
others in the research center of Zakho university. Standard methods as prescribed by
(APHA 2012).
3.3. Method
The samples are collected and analyzed Ten representative artesian wells of groundwater,
samples are collect around and downward of industrial areas of Kowashe area. The
samples were analyzed for physicochemical analysis of the parameters Turbidity,Color,
Electrical Conductivity (EC), Total Dissolved Solids (TDS), pH and Dissolved Oxygen
(DO), Total Alkalinity, Sulphate (SO4), Chloride (Cl), Nitrate (NO3), Total Hardness
(TH), Calcium (Ca), Magnesium (Mg), Sodium (Na), Potassium(K), Chemical oxygen
demand (COD) and the trace elements iron (Fe), cadmium (Cd), lead (Pb), arsenic (As),
cobalt(Co), chromium(Cr), copper(Cu), manganese(Mn), Aluminium(Al) and zinc (Zn).
The analysis was carried out by using standard procedures (APHA 2012) and the results
were compared with the drinking water standards for health organization (WHO 2008). In
this study, and we used Microsoft Excel 2010 for creating a figure for parameters
concentration. And Statistical analysis with the objective of evaluating significant
differences among the stations for all water quality variables, data was analyzed using
one-way analysis of variance (ANOVA) at 0.05% level of significance. The second step
in factor analysis is the determination of the parameter correlation matrix. It is used to
account for the degree of mutually shared variability between individual pairs of water
quality variables.

23
Table 3.1. Wells specifications in studied area
No
Well name
X
Y
Static
Water
Level
(m)
Dynamic
Water
Level
(m)
Yield
(L/min)
Depth
(m)
Year
1 Kowashe S1 36.9974 42.7986 94 110 424 230 2005
2 Kowashe S2 36.997 42.8007 96 100 303 218 2005
3 Kowashe S3 36.9966 42.8015 88 111 409 220 2005
4 Kowahe S4 36.9954 428028 90 115 303 226 2005
5 Kowashe S5 36.9807 42.8149 74.4 98 409 195 2009
6 Girrash S6 36.9513 42.7461 13 68 170 200 2013
7 Marina S7 36.9146 42.7775 18 30 208 220 2016
8 Sarshor S8 36.9195 42.7861 42.7843 11 454 180 1975
9 Moqoble S9 36.9171 42.7807 14 93 303 200 2008
10 Tobzawa S10 36.9236 60 208 180 2009

24
Table 3.2. Analytical methods and equipment used in the study by standard APHA 2012 as a reference
Sl.
No. Parameter Method Instruments/Equipment
A. Physico-chemical
1 Tempretur Electrometric pH Meter
2 Turbidity Electrometric Turbidity Meter
3 Color Spectrophotomete Colorimeter
4 EC Electrometric Conductivity Meter
5 TDS Electrometric Conductivity/TDS Meter
6 pH Electrometric pH Meter
7 Total
Alkanity Titration by H2SO4
8 TH Titration by EDTA
9 Chloride Titration by AgNO3
10 Sulphate Turbidimetric Turbidity Meter
11 Nitrate Ultraviolet screening UV-VIS Spectrophotometer
12 Ca Titration by EDTA
13 Mg Titration by EDTA
14 K Flame emission Flame Photometer
15 Na Flame emission Flame Photometer
16 DO Electrometric DO Meter
17 COD Digestion followed by titration COD Digester
B. Heavy Metals
18 Fe
Digestion followed by Atomic
Spectrometry
Atomic Absorption
Spectrometer
19 Cd
20 Pb
21 Zn
22 As
23 Cu
24 Cr
25 Co
26 Mn
27 Ni
28 Al

4. RESULTS AND DISCUSSION
The water quality in terms of physic-chemical and heavy metal characteristic for the
ranged well water is summarized in Table 4.1 and 4.2. The interpretation of the results
was made with the aid of WHO potable water specifications.
Table 4.1 Water analysis of physico-chemical and heavy metal of studied area
Parameters Unit
Samples taking from this locations
Kowashe
S1
Kowashe
S2
Kowashe
S3
Kowashe
S4
Kowashe
S5
Temperature °C 21 20 20.1 20.7 20
Turbidity NTU 0.5 0.6 0.7 0.8 0.5
Electrical Conductivity μS 525 477 446 435 455
Total Dissolved Solid mg/L 336 305 285 278 291
pH
7.4 7.4 7.4 7.3 7.7
Sulfate mg/L 9.4 4.2 2.8 4.2 4.2
Chloride mg/L 12 12 8 12 10
Nitrate mg/L 9.7 8.7 5.5 5.2 5.1
Total Hardness mg/L 340 312 296 304 296
Total Alkalinity mg/L 194 194 180 188 196
Calcium mg/L 76 76 67 67 73
Magnesium mg/L 36 29 31 33 27
Potassium mg/L 0.2 0.9 0.7 0.7 0.8
Sodium mg/L 5 3 2 3 3
Dissolved Oxygen mg/L 5.7 8 6.4 6.45 8.54
Iron mg/L 0.015 0.008 0.016 0.013 0.01
Cadmium mg/L 0.008 0.002 0.004 0.005 0.003
Lead mg/L 0.004 0.004 0.004 0.003 0.002
Zinc mg/L 0.393 0.219 0.169 0.182 0.163
Arsenic mg/L 0.001 0.001 0.001 0.0007 0.001
Copper mg/L 0.376 0.225 0.227 0.216 0.209
Chromium mg/L Nill Nill Nill Nill Nill
Cobalt mg/L 0.0002 0.00004 Nill 0.000009 0.00005
Manganese mg/L 0.077 0.025 0.022 0.015 0.018
Nickel mg/L 0.017 0.072 0.061 0.061 0.047
Aluminum mg/L 0.007 0.008 0.007 0.006 0.009
Chemical Oxygen Demand Mg/L Low Low Low Low Low

26
Table 4.2. Water analysis of physico-chemical and heavy metal of studied area
Parameters Unit
Samples taking from this locations
Girrash
S6
Marina
S7
Sarshor
S8
Moqoble
S9
Tobzawa
S10
Temperature °C 22 19.9 20.3 20.5 20.1
Turbidity NTU 0.7 0.5 0.8 0.9 0.8
Electrical Conductivity μS 738 589 607 566 586
Total Dissolved Solid mg/L 472 377 388 362 375
pH
7.5 7.5 7.4 7.6 7.6
Sulfate mg/L 28.6 10.6 4.4 4.2 16
Chloride mg/L 30 24 20 28 38
Nitrate mg/L 55.3 22.7 19.8 12.1 9.7
Total Hardness mg/L 404 340 388 344 344
Total Alkalinity mg/L 232 308 210 188 194
Calcium mg/L 81 73 89 84 81
Magnesium mg/L 48 38 40 29 34
Potassium mg/L 7.2 0.9 0.7 2.1 1.2
Sodium mg/L 27 13 12 9 14
Dissolved Oxygen mg/L 8.44 8.5 8.15 7.6 7.2
Iron mg/L 0.007 0.016 0.01 0.006 0.006
Cadmium mg/L 0.003 0.003 0.003 0.002 0.008
Lead mg/L 0.002 0.004 0.002 0.002 0.0007
Zinc mg/L 0.128 0.421 0.145 0.109 0.108
Arsenic mg/L 0.0009 0.002 0.001 0.001 0.0008
Copper mg/L 0.206 0.295 0.244 0.213 0.213
Chromium mg/L Nill Nill Nill Nill Nill
Cobalt mg/L 0.0001 0.00004 0.00009 Nill 0.0001
Manganese mg/L 0.019 0.019 0.018 0.019 0.022
Nickel mg/L 0.041 0.044 0.044 0.055 0.0634
Aluminum mg/L 0.02 0.0145 0.0116 0.011 0.009
Chemical Oxygen demand mg/L Low Low Low Low Low

27
Table 4.3. Permissible level of drinking water WHO
Parameters Unit
Permissible level of drinking water
WHO
Maximum level
Temperature °C -
Turbidity NTU 5
Electrical Conductivity μS 1250
Total Dissolved Solid mg/L 1000
pH
6.5-8.5
Sulphate mg/L 250
Chloride mg/L 250
Nitrate mg/L 50
Total Hardness mg/L 100-500
Total Alkalinity mg/L 125-200
Calcium mg/L 75-200
Magnesium mg/L 30-150
Potassium mg/L 2-3
Sodium mg/L 200
Dissolved Oxygen mg/L 5
Iron mg/L 0.3
Cadmium mg/L 0.005
Lead mg/L 0.05
Zinc mg/L 3
Arsenic mg/L 0.01
Cupper mg/L 1
Chromium mg/L 0.05
Cobalt mg/L 0.005
Manganese mg/L 0.1
Nickel mg/L 0.1
Aluminum mg/L 0.1
Chemical Oxygen demand mg/L 10

28
4.1. Effects Of Industrial Effluents On Some Physical And Chemical Properties Of
Ground Water
4.1.1. Temperature
In the Figure 4.1 the temperature of studied artesian wells distributed around industrial
area are ranged around 20-22 °C, recording highly in Girrash 22 °C and Kowashe 1 wich
around 21 °C, this little increases in this two locations may attributed to the low depth of
wells or to the nature of limestone bedrocks of area that absorbs more heats.
Figure 4.1. Water temperature of studied wells
4.1.2. Turbidity
The turbidity of studied groundwater artesian wells are ranged between 0.5-0.9 NTU but
high turbidity recorded in locations 4,8,9 and 10 as shown in Figure 4.2 this relative high
levels of turbidity may be as a result of high clay content in the bottom of this wells a
muddy appearance of water when it pumped. Similar results have been obtained in other
studies (Balakrishnan et al. 2008).
18,5
19
19,5
20
20,5
21
21,5
22
22,5
1 2 3 4 5 6 7 8 9 10
Leve
l
Station
Tempreture °C
Tempretur °C

29
.
Figure 4.2. Turbidity of studied wells
4.1.3. Electrical Conductivity (EC)
The impact of health on humans for water consuming by high EC also includes upset of
salt and water balance and adverse impacts in certain myocardial and people with high
pressure of blood (Fatoki and Awofol 2003). The electrical conductivity of groundwater
influenced by industrials effects ranged between 420-730 μS recording a high level in 6
locations as shown in Figure 4.3, which is related to the high content of soluble salts like
Na and K 7-2mg/L and both Ca and Mg is indicated by high total alkalinity 232mg/L and
total dissolved solid TDS 472mg/L. The similar results were recorded in another study
(El-Sayed and Salem 2015).
Figure 4.3. Electrical conductivity of studied wells
0
0,2
0,4
0,6
0,8
1
1 2 3 4 5 6 7 8 9 10
Leve
l
Station
Turbidity NTU
Turbidity NTU
0
200
400
600
800
1 2 3 4 5 6 7 8 9 10
Leve
l
Station
EC μS
EC μS

30
4.1.4. Total Dissolved Solid (TDS)
The concentration of total dissolved solid is the fully melted minerals in the water.used
total dissolved solid as an indication of the general salinity nature of water. For any
purpose, the concentration of total dissolved solid is an essential parameter in drinking
water to determine the groundwater suitability. It is an important to classify groundwater
depending on its hydrochemical properties based total dissolved solid values. (Freeze and
Cherry 1979). The total dissolved solid where ranged 278mg/L in location 4 to 472mg/L
in Girrash as shown in Figure 4.4, the high TDS is related to its location that helps in high
contamination of industrial effluents in this area as well as the geomorphological features
of this village. Similar results have been obtained in other studies (Aydin 2007).
Figure 4.4. The concentration of total dissolved solid
4.1.5. pH
The value obtained from the pH is normal, as the pH in the water usually in the Kurdistan
region of Iraq is characterized by a shift towards the alkalie side of neutrality due to the
geological composition of the area which is mainly composed of CaCO3 .According to
WHO guidelines (WHO, 2008) for the pH of drinking water from 6.5 to 8.5. The pH of
studied locations are not highly influenced by industrial effluent seepage to groundwater
recorded between 7.3 in location 5 to 7.7 in location 6 as shown in Figure 4.5, these
returned to the high CaCo3 in limestone bedrocks of wells that give high puffery capacity
0
100
200
300
400
500
1 2 3 4 5 6 7 8 9 10
Leve
l
Station
TDS mg/L
TDS mg/L

31
to both soil and ground water pH. the similar results were recorded in another study
(Saravanakumar and Ranjith 2011).
Figure 4.5. pH of the water studied wells
4.1.6. Total Hardness
The adverse effects of water has no known impact of hardness; however, Some evidence
suggests its role in heart disease and inadequate water hard for domestic use (Schroeder
and Chron 1960). According to (Sawyer and McCarthy 1967), Hardness is commonly
classified, in terms of degree of hardness as poor: 0 to 75 mg/l, temperate: 75 mg/l to 150
mg/l, Hard: 150 mg/l to 300 mg/l, and very hard: above 300 mg/l. The total hardness
result from the dryland cations in the ground waters like Ca, Mg which prevent soap to
give the foam. The Total hardness is uniform in locations, but high level recorded at
Girash 404 mg/L as shown in Figure 4.6. This uniformity returned to the calcareous soils
and limestone bedrocks which contain high amounts of Ca. The similar results were
recorded in another study (Buridi et al. 2014). Higher degree of hardness is due to
disposing of sewage and untreated industrial effluents (Haniffa et al. 1994).
7
7,2
7,4
7,6
7,8
1 2 3 4 5 6 7 8 9 10 11
Leve
l
Station
pH
pH

32
Figure 4.6.The concentration of total hardness
4.1.7. Total Alkalinity
The bitter test of water indicates the large amount of alkalinity imparts. in studied area
indicate the large amount of total alkalinity. Figure 4.7, show the total alkalinity which
resulted from alkaline ions like K , Mg and Ca are also uniform in 10 locations except
location 6 and 7 which is recorded 232 and 308 mg/L respectively. In location 6,7 and 8
the concentration of alkalinity was above WHO range that is not safe for drinking water.
The amounts of alkaline cations in bedrock of this area are the reason on uniform
alkalinity that may be indicated in slide pH increase over 7 that ranged between 7.3 to
7.7. The similar results was recorded in other study (Sharma et al. 2013).
Figure 4.7. The concentration of total alkalinity
0
200
400
600
1 2 3 4 5 6 7 8 9 10
Leve
l
Station
TH mg/L
TH mg/L
0
100
200
300
400
1 2 3 4 5 6 7 8 9 10
Leve
l
Station
Total Alkanity mg/L
Total Alkanity mg/L

33
4.1.8. Dissolved Oxygen (DO)
The concentration of dissolved oxygen has high impact of groundwater quality by
adaptable valence state o trace metals and bacterial metabolism constraining of dissolved
organic species. For these details, the measurement of dissolved oxygen concentration
must be considered important in most water quality investigations. As shown in Figure
4.8, the dissolved oxygen is about homogeneous in all groundwater artesian well and
ranged between 5.7mg/L as minimum in location 1 and 8.54mg/L as maximum in
location 5, these ranges are near standards of drinking water , the relative low dissolved
oxygen is due to the deepness of these artesian well with 200m depth as ranges will
decrease the aeration of aquifers as a result of clayey nature of soils this area (Buridi et al.
2014; Adekunle et al. 2007).
Figure 4.8. The concentration of dissolved oxygen
4.1.9. Calcium (Ca)
One of the essential elements is Calcium to developing proper bone growth. In nature, it
is found in alkaline. Commonly groundwater contains calcium content, because most of
the rocks contain available calcium content and also have higher solubility. The content
of Ca uniform in selected studied the location and ranged between 67 mg/L in the third
location to 89 in Sarshor location. The limestone CaCO3 bedrocks are the reasons of high
Ca content in the water as shown in Figure 4.9. The similar results were recorded in
another study (Aghazadeh et al. 2010).
0
2
4
6
8
10
1 2 3 4 5 6 7 8 9 10
Leve
l
Station
DO mg/L
DO mg/L

34
Figure 4.9. The concentration of calcium
4.1.10. Magnesium (Mg)
Figure 4.10 show The content of Mg is slide variants with Ca in studied area because the
distributions of Mg is not equal in studied location and high level was recorded at
Girrash with 48 mg/L which indicates from high hardness and alkalinity associated with
this alkaline elements. Similar results have been obtained in other studies (Anwar et al.
2014)
Figure 4.10.The concentration of magnesium
0
20
40
60
80
100
1 2 3 4 5 6 7 8 9 10
Leve
l
Station
Ca mg/L
Ca mg/L
0
10
20
30
40
50
60
1 2 3 4 5 6 7 8 9 10
Leve
l
Station
Mg mg/L
Mg mg/L

35
4.1.11. Potassium (K)
Figure 4.11 shows the content of K in all locations is low and not exceeded than 2 mg/L
except Girrash location which records over 7 mg/L.This range is above the level of
concentration of Potassium that compared with the permission level of potassium which
is about 2-3 mg/l. Kidney failure is the greatest common cause of high potassium. When
kidneys fail or do not work properly, they cannot remove extra potassium from your
body. This can lead to the building of potassium. This significant increase in potassium in
this location gives another proof that this location is more exposed to both industrial
effluent and agricultural fertilizer pollutants. The main source of potassium in natural
freshwater is the temperament of rocks, but the increase in quantities of contaminated
water due to the disposal of sewage (Trivedy and Goel 1986). Similar results have been
obtained in other studies (Babir et al. 2016).
Figure 4.11. The concentration of potassium
4.1.12. Sodium (Na)
Sodium concentration is important in classifying irrigation water because sodium causes
an increase in the hardness of the soil because it tends to be absorbed by clay particles,
displacing magnesium and calcium ions, when high in irrigation water. This exchange
process reduces the permeability and results in soil with poor internal drainage (Tijani
1994). Figure 4.12 show the content of Na is low in location 1-5 and not exceed more
0
1
2
3
4
5
6
7
8
1 2 3 4 5 6 7 8 9 10
Leve
l
Station
K mg/L
K mg/L

36
than 5 mg/L, but it about doubles in location 7-10 that recorded 14 mg/L. The high Na
content again recorded in Girrash location 27 mg/L which exposed to induced pollution.
Similar results have been obtained in other studies (Sarada 2016).
Figure 4.12.The concentration of sodium
4.2. The Quantity of Soluble Salts
The solubility salts as ions like nitrate, sulfate, and chloride which carry negative charges
considered as a good indicator for groundwater pollution because it easily leached with
rain water to groundwater as a result of their repulsions with soil colloid that carries the
same negative charge.
4.2.1. Sulfate SO4
One of the essential parameters for determining the suitability of water is the sulfate
content in water for public and industrial supplies. The high sulfate concentration in
water can cause malfunctioning of the alimentary canal and shows he cathartic effect on
human beings (Lenin Sunder et al. 2008). Figure 4.13 shows the content of So4 ions
studied artesian wells are relatively low except in location 10 which is 16mg/L and high
level was recorded in Girrash 28.6 which indicate their close location to the point source
of effluents that determinate its quality indicators. Similar results have been obtained in
other studies (Aghazadeh et al. 2010).
0
5
10
15
20
25
30
1 2 3 4 5 6 7 8 9 10
Leve
l
Station
Na mg/L
Na mg/L

37
Figure 4.13. The concentration of sulfate
4.2.2. Chloride (Cl)
Figure 4.14 shows the chloride ions concentration are low in location 1-5 bur relatively
high in location 6-10 recording high level in Girrash locations 30mg/L. These relatively
high concentrations it may attributed to the salt contaminating nature of this location that
locate the down-word location of water runoff from bitter mountain. Nearly results have
been obtained in other studies (Balakrishnan et al. 2008).
Figure 4.14. The concentration of chloride
0
5
10
15
20
25
30
35
1 2 3 4 5 6 7 8 9 10
Leve
l
Station
Sulfate mg/L
Sulfate mg/L
0
10
20
30
40
1 2 3 4 5 6 7 8 9 10
Leve
l
Station
Chloride mg/L
Chloride mg/L

38
4.2.3. Nitrate NO3
The nitrate ions is probably the most concerned ions associated with drinking water
pollution as will know health damaging ions like methemoglobinemia and permeation of
carcinogenic and mutagenic nature amine. Figure 4.15 show the concentration of NO3 is
sure for drinking in location 1-5 and 10 but is not sure in locations 8,9 and 7 for drinking
for ruffians and children below on years. but the risk level pointed in Girrish location of
55.3 ml/L which is not saved for adults also and used for irrigation and cattle's drinking.
The Girrash location is more influenced by induced human pollution like industry and
high fertilization of wheat crops in fields around the well. Similar results have been
obtained in other studies (Sarada 2016).
Figure 4.15. The concentration of nitrate
0
10
20
30
40
50
60
1 2 3 4 5 6 7 8 9 10
Leve
l
Station
Nitrate mg/L
Nitrate mg/L

39
4.3. Contamination of Groundwater By Heavy Metals
The risks of heavy metal pollution in slightly alkaline soils are rare both in soil and
groundwater because the cationic heavy metal like Fe, Cd, Cu, Zn, Mn, Ni and Co
quickly precipitated at PH ranges between 6.5-8.5 so there are no public health issues are
identified in these alkaline soil all over the world . But the solubility of anions heavy
metal like As, Mo, Se, and B are increased in these soil sand the attention must payid to
those anionic metals.
4.3.1. Iron (Fe)
Biologically Iron is an essential element which is important to all organisms and existing
in hemoglobin system. Figure 4.16 show The concentration of iron is varied according to
the location where high levels recorded in location 1,3 and 7 to be 0.0162mg/L and low
levels recorded at location 9 and 10 to be 0.0056mg/L respectively. The variance of Fe
contents is attributed to the variance of mineralogical properties of aquifer bedrocks that
may contain a high level of hematite minerals. Similar results have been obtained in other
studies (Mukherjee et al. 2006).
Figure 4.16. The concentration of iron
0
0,005
0,01
0,015
0,02
1 2 3 4 5 6 7 8 9 10
Leve
l
Station
Fe mg/L
Fe mg/L

40
4.3.2. Cadmium (Cd)
As indicated by the Figure 4.17 the highest values of Cd are recorded in location 1 and 10
to be 0.008451mg/L that are in risky levels for human consumptions. The rest of wells
are on the safe levels for drinking water. high levels of Cd are well-known to cause
bones, swelling and pain because it replace Ca in bone tissues and cause severe pain in
joints (itai-itai) disease and also associated with kidney failure. The excess amounts of Cd
in 1 and 10 locations may be due to the dumping of solid waste in these two places like
car batteries and tires they contain a huge amount of Cd. The high concentration of
cadmium is dangerous, but cadmium in low amount taken over for a long period also
bioaccumulation in the body and cause serious illness (Sabhapandit P et al. 2011). The
similar results were recorded in another study (Babir et al. 2016).
Figure 4.17. The concentration of cadmium
4.3.3. Lead (Pb)
Lead is one of the potentially dangerous and possibly harmful contaminants. It has an
effect on humans and animals. The symptoms of lead poisoning usually develop slowly.
It prevents the formation of hemoglobin by interacting with the SH group and interfering
with many enzyme functions (Sabhapandit P et al. 2011). The concentration of lead as
shown in the Figure 4.18 is in high levels in location 1 then uniformly decreased to the
location 10 except a shifting in location 7 and ranged between 0.00397 and 0.000718
mg/L. The regression of head decreasing is obvious that the Pb pollutant plume is
0
0,002
0,004
0,006
0,008
0,01
1 2 3 4 5 6 7 8 9 10
Leve
l
Station
Cd mg/L
Cd mg/L

41
concentrated in location 1 which is near a point source of effluent discharge or may
attributed to the mineralogical properties of mountain area that may cause from uranium
disintegration series that lead to lead formation. The similar results were recorded in
another study (Mukherjee et al. 2006).
Figure 4.18. The concentration of lead
4.3.4. Zinc (Zn)
Figure 4.19 shows the concentration of Zn is studied wells that associated with Cd
because it has the same chemical behavior and may closely related with Cd
concentration, so it has a high level in location 6, but it increased in location 7 to reach
0.4212mg/L, not in 10 this case returned to that the pollutant plume of Zn is reached to
location 7 and may be moved to location 10 in a few years in the future. Zen is
considered a micronutrient necessary for plant growth because it contributes to the
formation of an enzyme which is essential for human health and zinc leakage may cause
prostate gland cancer, unlike a dam that has no beneficial role in both plant life and
causes serious diseases for humans. They cause a special type of dermatitis known as
(Zinc pox). The similar results were recorded in another study (Anwar et al. 2014).
0
0,001
0,002
0,003
0,004
0,005
1 2 3 4 5 6 7 8 9 10
Leve
l
Station
Pb mg/L
Pb mg/L

42
Figure 4.19. The concentration of zinc
4.3.5. Arsenic (As)
Drinking water is a well-recognized pathway to As exposure. It has been associated with
various forms of cancer, renal, central nervous system and cardiovascular disease in
humans (Ryan et al. 2000). The Figure 4.20 shows that the concentration of As is
relatively same in all studied well and have tendency to increase and concentrated in
location 1,3,7 and 8 and reach 0.001397mg/L although it not reached to risky levels but a
continues pollution of this area will lead to the increment of this very poisonous heavy
metals in drinking and consuming water for bathrooms will cause a skin cancer like well-
known skin cancer in Bangladesh caused by river polluted with this element, because
these areas contain a tannery factories that used a huge amount of As. Similar results
have been obtained in other studies (Balakrishnan et al. 2008).
Figure 4.20. The concentration of arsenic
0
0,1
0,2
0,3
0,4
0,5
1 2 3 4 5 6 7 8 9 10
Leve
l
Station
Zn mg/L
Zn mg/L
0
0,0005
0,001
0,0015
1 2 3 4 5 6 7 8 9 10
Leve
l
Station
As mg/L
As mg/L

43
4.3.6. Copper (Cu)
Copper is an essential element in human metabolism. Human copper is especially
required as a trace element in the formation of R.B.C and some enzymes. 0.05 m / L is
not generally considered toxic but more than 1.5 mg / L may cause disease and in
extreme cases liver damage (Marwari et al. 2012). Figure 4.21 shows that the chemical
behavior of this element is close to both Zn and Pb and even Fe. High level was pointed
in the center of pollution plume in location 1to record 0.3761mg/L and then decreased as
regression till location 6 then recording a shifting in location 7 that may be a center of
another pollution plume to be decreased to location 10. But Ca like Zn have a great role
in plant life and considered essential plant nutrient as it contributes in nitrogenize enzyme
which fixes atmospheric nitrogen besides another vital role in plant life . Similar results
have been obtained in other studies (Anwar et al. 2014).
Figure 4.21. The concentration of copper
4.3.7. Cobalt (Co)
Figure 4.22 show another evidence of the concentration of heavy metal plume is
concentrated at location 1 to reach 0.000173mg/L and moved toward location 6 to be
0.000134 and is probably no pollution by Co in both location 3 and 9. Cobalt enters
groundwater through effluents from industries that deal with corrosion and wear-resistant
alloys. Other sources of pollution are colors and dyes used for coloring glass, ceramic
0
0,05
0,1
0,15
0,2
0,25
0,3
0,35
0,4
1 2 3 4 5 6 7 8 9 10
Leve
l
Station
Cu mg/L
Cu mg/L

44
objects, lithium batteries, cobalt and permanent magnets. Oil-based industries are also the
cause of cobalt pollution in the environment (Kaur 2012).
Figure 4.22. The concentration of cobalt
4.3.8. Manganese (Mn)
Manganese is one of the most abundant minerals in the earth's crust and usually occurs
along with iron. The most abundant compounds of manganese are sulfide, oxide,
carbonate, and silicate. Manganese can form insoluble oxides that can lead to unwanted
deposits and color problems in distribution systems (APHA 2005). Figure 4.23 show that
the Mn concentration was at peak in the center of pollution plume in location 1 and
record 0.0765mg/L that gives a strong prove that this location is in the front of point
source of industrial effluents that contain various types of pollutant especially heavy
metals that moves by mass flow as pollution plume in heavy rainy seasons in winter and
spring. Mn like Cu and Zn considered essential plant nutrient as a constituent in enzyme
structure and its leakage in food may come to a health problem for a human being also.
Similar results have been obtained in other studies (Babir et al. 2016).
0
0,00005
0,0001
0,00015
0,0002
1 2 3 4 5 6 7 8 9 10
Leve
l
Station
Co mg/L
Co mg/L

45
Figure 4.23. The concentration of manganese
4.3.9. Nickel (Ni)
Figure 4.24 shows that the concentration of Ni was very from the rest of heavy metal and
concentrated at location 2 instead of location 1 to reach 0.0717mg/L then tend to decrease
to location 6 to reach 0.0413mg/L, and increased constantly to location 10 to be
0.0634mg/L. Similar results have been obtained in other studies (Gummadi et al. 2016).
Figure 4.24. The concentration of nickel
0
0,02
0,04
0,06
0,08
0,1
1 2 3 4 5 6 7 8 9 10
Leve
l
Station
Mn mg/L
Mn mg/L
0
0,01
0,02
0,03
0,04
0,05
0,06
0,07
0,08
1 2 3 4 5 6 7 8 9 10
Leve
l
Station
Ni mg/L
Ni mg/L
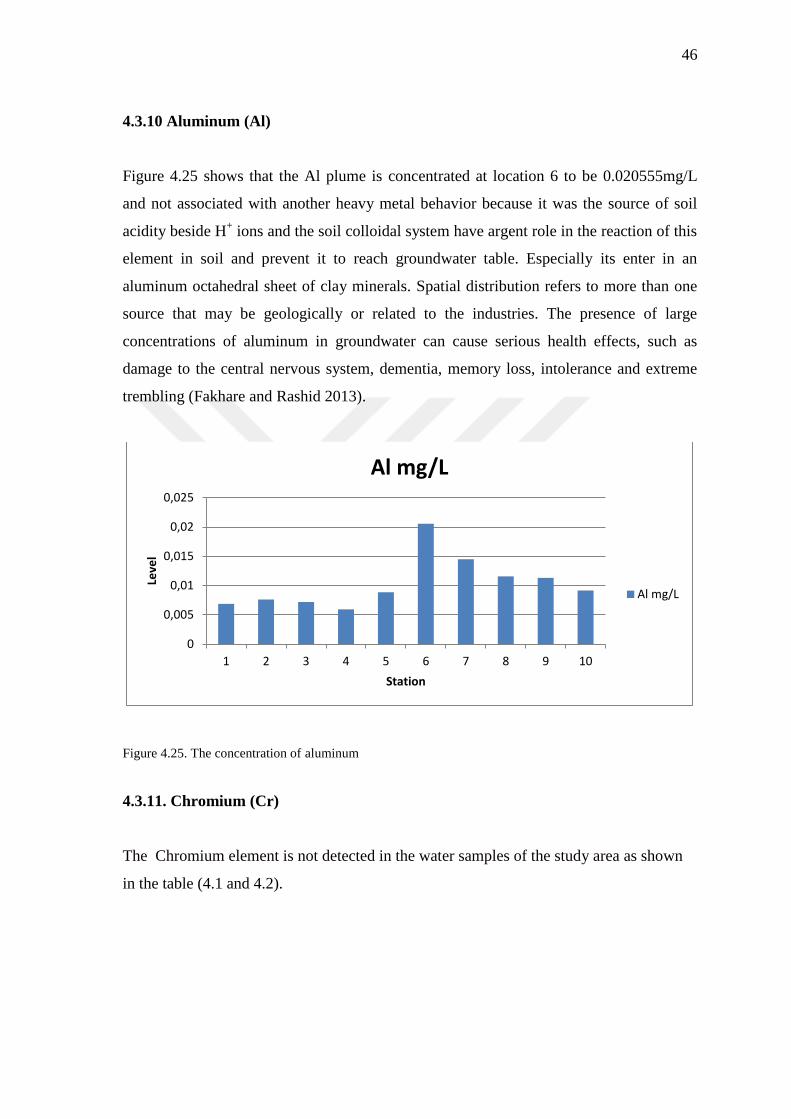
46
4.3.10 Aluminum (Al)
Figure 4.25 shows that the Al plume is concentrated at location 6 to be 0.020555mg/L
and not associated with another heavy metal behavior because it was the source of soil
acidity beside H+ ions and the soil colloidal system have argent role in the reaction of this
element in soil and prevent it to reach groundwater table. Especially its enter in an
aluminum octahedral sheet of clay minerals. Spatial distribution refers to more than one
source that may be geologically or related to the industries. The presence of large
concentrations of aluminum in groundwater can cause serious health effects, such as
damage to the central nervous system, dementia, memory loss, intolerance and extreme
trembling (Fakhare and Rashid 2013).
Figure 4.25. The concentration of aluminum
4.3.11. Chromium (Cr)
The Chromium element is not detected in the water samples of the study area as shown
in the table (4.1 and 4.2).
0
0,005
0,01
0,015
0,02
0,025
1 2 3 4 5 6 7 8 9 10
Leve
l
Station
Al mg/L
Al mg/L

47
4.4. Statistical Analysis
With the objective of evaluating significant differences among the stations for all water
quality variables, data was analyzed using one-way analysis of variance (ANOVA) at
0.05% level of significance.
The second step in factor analysis is the determination of the parameter correlation
matrix. It is used to account for the degree of mutually shared variability between
individual pairs of water quality variables. The correlation matrix with which we can
observe the relationship between parameters was obtained and tabulated in (Table 4.6).
4.4.1. One-Sample Statistics
The One-Sample Statistics of physicochemical parameters under groundwater in Semel
district-Duhok city studied are given in Tables 4.4 and 4.5 They provide a summary of
the mean, standard deviation and standard error mean values of 25 measured parameters
for ten stations’s data.
The all of data (Turbidity, Color, Electrical Conductivity, Total Dissolved Solids, pH and
Dissolved Oxygen,Total Alkalinity, Sulphate, Chloride, Nitrate, Total Hardness,
Calcium, Magnesium, Sodium, Potassium, Chemical oxigyn demand, iron, cadmium,
lead, arsenic, cobalt, chromium, copper, manganese, Aluminium and zinc) were
significantly affected according to the stations of groundwaters (*(P<0.05), ** (P<0.01)).

48
Table 4.4. The One-sample statistics of physiochemical parameters under groundwater in Semel district-
Duhok city
Parameters N (Station) Mean Std. Deviation Std. Error Mean
Temperature 10 20,4600 ,64498 ,20396
Turbidity 10 ,6800 ,14757 ,04667
EC 10 542,4000 94,34476 29,83443
TDS 10 346,9000 60,40686 19,10233
pH 10 7,4800 ,12293 ,03887
Sulphate 10 8,8600 8,07908 2,55483
Cl 10 19,4000 10,20022 3,22559
No3 10 15,3800 15,25180 4,82304
TH 10 336,8000 36,94079 11,68170
Total Alkalinity 10 208,4000 37,85117 11,96959
Ca 10 76,7000 7,13442 2,25610
Mg 10 34,5000 6,31137 1,99583
K 10 1,5400 2,04787 ,64759
Na 10 9,1000 7,79530 2,46509
DO 10 7,4980 1,01599 ,32128
Fe 10 ,0106 ,00419 ,00132
Cd 10 ,0042 ,00240 ,00076
Pb 10 ,0027 ,00105 ,00033
Zn 10 ,2040 ,11118 ,03516
As 10 ,0010 ,00048 ,00015
Cu 10 ,2427 ,05495 ,01738
Cr 10 ,0000 ,00000a ,00000
Co 10 ,0001 ,00006 ,00002
Mn 10 ,0256 ,01827 ,00578
Ni 10 ,0504 ,01537 ,00486
Al 10 ,0103 ,00451 ,00143
a. t cannot be computed because the standard deviation is 0.

49
Table 4.5. The significance analyses with one-sample statistics analyses of physiochemical parameters by
ANOVA
Test Value = 0
t df
Sig.
(2-tailed)
Mean
Difference
95% Confidence Interval
of the Difference
Lower Upper
Temperature 100,313 9 ,000** 20,46000 19,9986 20,9214
Turbidity 14,571 9 ,000** ,68000 ,5744 ,7856
EC 18,180 9 ,000** 542,40000 474,9098 609,8902
TDS 18,160 9 ,000** 346,90000 303,6875 390,1125
pH 192,421 9 ,000** 7,48000 7,3921 7,5679
Sulphate 3,468 9 ,007** 8,86000 3,0806 14,6394
Cl 6,014 9 ,000** 19,40000 12,1032 26,6968
No3 3,189 9 ,011*** 15,38000 4,4695 26,2905
TH 28,831 9 ,000** 336,80000 310,3741 363,2259
Total_Alkalinity 17,411 9 ,000** 208,40000 181,3229 235,4771
Ca 33,997 9 ,000** 76,70000 71,5963 81,8037
Mg 17,286 9 ,000** 34,50000 29,9851 39,0149
K 2,378 9 ,041* 1,54000 ,0750 3,0050
Na 3,692 9 ,005** 9,10000 3,5236 14,6764
DO 23,338 9 ,000** 7,49800 6,7712 8,2248
Fe 8,039 9 ,000** ,01065 ,0077 ,0136
Cd 5,550 9 ,000** ,00422 ,0025 ,0059
Pb 7,988 9 ,000** ,00265 ,0019 ,0034
Zn 5,803 9 ,000** ,20400 ,1245 ,2835
As 6,652 9 ,000** ,00102 ,0007 ,0014
Cu 13,967 9 ,000** ,24270 ,2034 ,2820
Co 3,253 9 ,010* ,00006 ,0000 ,0001
Mn 4,429 9 ,002** ,02558 ,0125 ,0386
Ni 10,369 9 ,000** ,05040 ,0394 ,0614
Al 7,245 9 ,000** ,01034 ,0071 ,0136
* (P<0.05), ** (P<0.01)
4.4.2. Correlation Matrix
The covariance matrix of the 25 analyzed variables was calculated from normalized data
by One-Sample Statistics method; therefore, it coincided with correlation matrix. High

50
and positive correlations with bold values were observed between chloride (Cl), sodium
(Na), potassium (K), sulfate (SO4), nitrate (NO3), magnesium (Mg), total hardness (TH),
and total dissolved salts (TDS), which are related to soluble salts in water and responsible
for water mineralization. Nitrate nitrogen is positively correlated with EC, TDS and
sulfate representing by infiltration from agricultural runoff. As a result, DO was
negatively correlated with cadmium. Some heavy metals like Pb-Fe, Zn-Fe, Zn-Pb, Cu-
Zn, Mn-Cu, Mn-Co were also positively correlated with each other, as the elements are
responsible from the industrial area near Duhok ground waters studied. In addition, Fe-
Ca, Pb-Cl, Ni-Cu, Ni-Co and Ni-Mn were negatively correlated with the between each
the characteristics (Table 4.6).
Table 4.6. Correlation matrix of the 25 physico‐chemical parameters in Duhok groundwaters
T Tur EC TDS pH So4 Cl No3 TH TA Ca Mg K
T 1
Tur .142 1
EC .584 .183 1
TDS .583 .182 1,000** 1
Ph -.179 -.086 .212 .214 1
So4 ,704* -.018 ,823** ,823** .192 1
Cl .226 .449 ,770** ,771** .432 ,654* 1
No3 ,728* .029 ,895** ,894** .051 ,847** .501 1
TH .606 .272 ,946** ,946** .023 ,681* ,650* ,823** 1
TA -.025 -.408 .481 .482 .088 .366 .308 .504 .348 1
Ca .200 .405 ,690* ,690* .284 .278 .620 .400 ,789** .033 1
Mg ,699* .036 ,839** ,838** -.229 ,784** .444 ,883** ,856** .500 .369 1
K ,788** .190 ,761* ,760* .180 ,833** .492 ,904** ,647* .202 .300 ,670* 1
Na .611 .195 ,971** ,971** .223 ,898** ,781** ,923** ,878** .488 .552 ,850** ,833**
DO -.109 -.110 .450 .450 .509 .246 .326 .479 .346 .530 .394 .200 .396
Fe -.211 -.537 -.412 -.412 -.464 -.339 -.622 -.255 -.377 .295 -,641* -.009 -.470
Cd .069 -.033 -.118 -.116 -.149 .147 .142 -.306 -.098 -.229 -.152 .017 -.312
Pb -.005 -,660* -.420 -.420 -.551 -.268 -,744* -.144 -.403 .171 -,635* -.085 -.254
Zn -.118 -,740* -.093 -.091 -.278 -.065 -.284 -.059 -.114 .582 -.321 .111 -.347
As -.054 -.040 .292 .293 -.477 .017 .115 .202 .336 .524 .134 .403 -.113
Cu .066 -.557 -.010 -.008 -.297 -.044 -.226 -.091 .063 .271 -.063 .170 -.356
Cr .c .c .c .c .c .c .c .c .c .c .c .c .c
Co .540 -.312 .561 .562 .020 .619 .268 .456 .610 .121 .421 .618 .296
Mn .238 -.463 -.082 -.080 -.199 .020 -.257 -.155 -.003 -.157 -.032 .035 -.242
Ni -.464 .450 -.346 -.347 -.013 -.279 .048 -.314 -.414 -.274 -.194 -.466 -.103
Al .564 .043 ,906** ,906** .256 ,776** .580 ,961** ,801** .593 .467 ,788** ,857**

51
Table 4.7. (Coıntinue): Correlation matrix of the 25 physico‐chemical parameters in Duhok groundwaters
Na DO Fe Cd Pb Zn As Cu Cr Co Mn Ni Al
Na 1
DO .468 1
Fe -.418 -.392 1
Cd -.107 -,734* .166 1
Pb -.446 -.319 ,752* -.038 1
Zn -.166 -.177 ,715* .239 ,732* 1
As .179 -.128 .461 .039 .343 .565 1
Cu -.145 -.442 .603 .482 .572 ,864** .547 1
Cr .c .c .c .c .c .c .c .c 1
Co .491 -.091 -.070 .461 -.035 .268 .117 .545 .c 1
Mn -.206 -.605 .333 .602 .464 .581 .206 ,863** .c ,656* 1
Ni -.240 .152 -.354 -.262 -.259 -.540 -.237 -,762* .c -,734* -,706* 1
Al ,925** ,644* -.299 -.426 -.261 -.094 .187 -.170 .c .337 -.289 -.264 1
T=Temprature, TUR=Turbidity, pH=Potential of Hydrogen, TDS=Total Dissolved Solid, TH= Total
Hardness, TA= Total Alkalinity, Cl= Chloride, SO4= Sulfate, NO3= Nitrate, Ca=Calcium, Mg=Magnesium,
Na=Sodium, K=Potassuim, DO=Dissolved Oxygen, Fe=Iron, Cd=Cadmium, Pb=Lead, Zn=Zinc,
Cu=Cobalt, Cr=Chromium, Co=Copper, Mn=Manganese, Ni=Nickel, Al=Aluminum, COD=Chemical
Oxygen Demand.
**: Correlation is significant at the 0.01 level (2-tailed)
*: Correlation is significant at the 0.05 level (2-tailed)
C: Cannot be computed because at least one of the variables is constant

5. CONCLUSIONS
1- The Girash (location 6) have recorded the high levels of temperature, EC, K and Na
and great levels of turbidity, chloride, total alkalinity and Ca because it locate the down
ward of the effluent collection in Valley ended near this well. The increase of previously
mentioned parameters gives non desirable taste and small at this water as mentioned by
local people in this area especially nitrates over 50 mg/L that is not saved for drinking
water according to WHO standard that should not exceed more than 50 mg/L to save for
drinking. And also Potassium over 7 mg/L that compared with the permission level of
potassium that should not exceed 2-3 mg/l.
2- The accumulation of heavy metal in Girrash well is very low comparing with the
other anions like NO3, CL, SO4 and element like Ca, Mg and Na. this fact is as an
excellent prove that the high soil pH over 7 and soil content of both CaCO3 and clay have
a great role to precipitate cationic heavy metal and render it an active in the soil and
prevent it to reach ground water unlike negative anions like NO3 that carry the same
negative charge of soil colloid to repulse and washed easily with seeping water to
percolate in groundwater.
3- In most cases, the accumulation of heavy metals pollution plume are in Kowashe
(location 1) and moved gradually toward the down ward well. Then is suspected another
pollution plume in location 7 and gradually distributed to the adjacent artesian wells.
4- There are no levels of heavy metals accumulations over standard WHO for drinking
water except cadmium in location 1, 4 and 10.
5- Due to our results the attention most pointed in future to this area and to banned the
excess use of such elements like As and Cd to prevent their accumulation in groundwater
from causing more human health defects.

REFERENCES
Adekunle IM, Adetunji MT, Gbadebo AM, and Banjoko OB (2007) Assessment of
groundwater quality in a typical rural settlement in Southwest Nigeria. International
journal of environmental research and public health 4(4): 307-318
Aghazadeh N and Asghar M (2010) Assessment of groundwater quality and its suitability
for drinking and agricultural uses in the Oshnavieh area, Northwest of Iran. Journal of
environmental protection 1(01): 30
Agrawal R (2009) Study of physico-chemical parameters of groundwater quality of dudu
town in rajasthan. Indian Journal of remote sensing 2(4): 969-971
Allenby G and Margaret M (1993) World, Environment and People. Science Press, NSW,
Australia
Anwar Khwaja M and Aggarwal V (2014) Analysis of groundwater quality using
statistical techniques: A case study of Aligarh city (India). International journal of
technical research and applications-ISSN : 2320-8163
APHA (2005) Standard methods for the examination of Water and Wastewater, 21st
edition, APHA, AWWA and WPCF, Washington DC
Apha AW (2012) Standard methods for the examination of water and wastewater 22rd
edition
Atmadja J and Amvrossios CB (2001) State of the art report on mathematical methods for
groundwater pollution source identification. Environmental forensics 2(3): 205-214
Aydin A (2007) The Microbiological and physico-chemical quality of groundwater in
West Thrace, Turkey. Polish Journal of Environmental Studies (16)3: 377-383
Babir GB and Sawsan MA (2016) Evaluation of water quality of Koi Sanjaq Basin, Erbil
Governorate Northern Iraq. Iraqi Journal of Science Vol. 57(1A): 194-208

54
Balakrishnan M, Antony SA, Gunasekaran S and Natarajan RK (2008) Impact of dyeing
industrial effluents on the groundwater quality in Kancheepuram (India). Indian Journal
of Science and technology 1(7): 1-8
Bardos P (1994) Current developments in contaminated land treatment technology in the
UK. Journal of the Institute of Water and Environmental Management 4(8): 402-408
Bayer P and Michael F (2006) Life cycle assessment of active and passive groundwater
remediation technologies. Journal of contaminant hydrology 83(3): 171-199
Bredehoeft JD and Pinder GF (1970) Digitalanalysis of area1 flow in multi-aquifer
ground water systems: A quasi three-dimensional model
Buridi KR and Rupa KG (2014) Study on Determination of Physicochemical Parameters
of Ground Water in Industrial Area of Pydibheemavaram, Vizianagaram District,
Andhrapradesh, India. Austin Journal of Public Health and Epidemiology 1(2): 1008
Castany G (1968) Prospection et exploitation des eaux souterraines. Dunod, Paris
Castany G (1982) Principes et méthodes de l'hydrogéologie. Dunod, Paris
Cherry John A (1979) Groundwater. Englewood Cliffs, NJ: Prentice-Hall
Christopherson RW (2002) Elemental Geasystem ((4th
ed): Upper saddle river, new
hersey, prentice hall
CPCB (1999)Water Quality status and statistics1996- 97.Central Pollution Control
Board, New Delhi
Desai B (1990) Pollution in India: Law and Enforcement, Lancers Books, New Delhi
El-Sayed, M and Salem WM (2015) Hydrochemical assessments of surface Nile water
and ground water in an industry area–South West Cairo. Egyptian Journal of
Petroleum 24(3): 277-288
Fakhare A and Rashid U (2013) Trace Elements in Groundwater of Hindon-Yamuna
Interfluve Region, Baghpat District, Western Uttar Pradesh, Journal of Geological
Society of India. Vol. (81): 422-428

55
Fetter CW (2001) Applied Hydrogeology. 4th Edition. Prentice Hall, New Jersey
Forstner UK and Witman GTW (1981) Metal pollution in the aquatic. Environment,
Springer-Verlag Berlin, Heidelberg, pp: 255
Freeze RA and Cherry JA (1979) Groundwater. Englewood Cliffs: Prentice Hall
Freeze RA and Cherry JA (1979) Groundwater. Prentice Hall, New Jersey, pp: 604
Sawyer GN and McCarthy DL (1967) Chemistry of Sanitary Engineers, 2nd ed, McGraw
Hill, New York pp: 518
Ghosh A (2007) Current Knowledge on the distribution of arsenic in groundwater in five
states of India. J. Environ. Sci. Health. Part A 42: 1-12
Gleick PH (1993) Water in crisis: a guide to the worlds fresh water resources
Gummadi VR and Kalpana P (2016) Assessment of Ground Water Quality in and around
Pydibhimavaram Industrial Area, AP, India. International Journal of Environmental
Science and Development 7(9): 703
Schroeder HAJ and Chron D (1960) 12: 586-591
Heidug WK and Wong SW (1996) Hydration swelling of water‐absorbing rocks: a
constitutive model. International journal for numerical and analytical methods in
geomechanics 20(6): 403-430
Howell D, Alexander J, Eyre D (1993) Water The Science. Water in Australia. Manging
Economic, Environmental and Community Reform. Edited by Micheal Jason and
Stephen Rix. Public Research Centre. Australia. http:// www.sciencedirect.com/science
Jaeger JC, Cook NG, and Zimmerman R (2009) Fundamentals of rock mechanics. John
Wiley and Sons
Johnson AI and Morris DA (1962) Physical and hydrologic properties of water-bearing
deposits from core holes in the Los Banos-Kettleman City area, California: U.S. Geol.
Survey open-file report pp: 182
56
Kitutu MG, Muwanga A, Poesen J and Deckers JA (2009) Influence of soil properties on
landslide occurrences in Bududa district, Eastern Uganda. African journal of agricultural
research 4(7): 611-620
Kumar DM and Shah T (2005) Groundwater Pollution and Contamination in India: The
Emerging Challenges. Available at http://www.iwmi.cgiar.org/iwmi-
tata/files/pdf/ground-pollute4_FULL_.pdf (accessed on 12 September)
Haniffa MA, Plartin P and Jeevaraj J (1994) Hydrological studies on the channels of
tamabarperani for the assessment of water quality. Indian journal of environmental
protection 14(11): 821-828
Kaur S (2012) Assessment of Heavy Metals in Summer and Winter Seasons in River
Yamuna Segment Flowing through Delhi, India. Journal of Environment and Ecology.
Vol. (3)
Marwari R and Khan TI (2012) Physiological and biochemical Adverse Effects of Heavy
Metals on Brassica oleracea Grown in Sanganer Area, India. Journal of Environ. Science
and Engg. Vol. 54(2): 249-259
Morris BL, Lawrence AR, Chilton PJ, Adams B, Calow R and Klinck BA (2003)
Groundwater and its susceptibility to degradation: A global assessment of the problems
and options for management. Early Warning and Assessment Report Series, RS, 03-3.
United Nations Environment Programme, Nairobi, Kenya
Mukherjee S and Prakash N (2006) Groundwater pollution and emerging environmental
challenges of industrial effluent irrigation in Mettupalayam Taluk, Tamil Nadu IWMI
Nabi QA (2005) Limnological and bacteriological study in some wells within Erbil city
Kurdistan region of Iraq. MSc. Thesis University of Salahaddin
NDOH:National Department of Health (2000) National Health Plan 2001-2010. Vol(3):
Part1. Published by Department of Health, Port Moresby, Papua New Guinea
Niederau C, Fischer R, Purschel A, Stremmel W, Haussinger D, and Strohmeyer, G
(1996) Long-term survival in patients with hereditary hemochromatosis.
Gastroenterology 110(4): 1107-1119
Olayinka KO and Alo BI (2004) Studies on industrial pollution in Nigeria: The effect of
textile effluents on the quality of groundwater in some parts of Lagos. Nigerian Journal of
Health and Biomedical Sciences 3(1): 44-50

57
Reinhold VN (1992) Ground water Treatment Technology, 2nd Ed. Evan K Nyer
Ryan PB, Huet N, Macintoshl DL (2000) Longitudinal Investigation of Exposure to
Arsenic, Cadmium, and Lead in Drinking Water. Env. Heal. Pers. 108: 731-735
Sabhapandit P and Mishra AK (2011) Physico- Chemical Characteristics of Ground and
Surface water in Gohpur Sub-Division of Sonitpur District, Assam (India) Journal of
Environmental Science and Engineering, Vol. 53(1): 89-96
Sarada P (2016) Assessment of Ground Water Quality of the First Industrial-Residential
Confluence Area of Visakhapatnam. No. FMRP - 4534/14 (SERO/UGC), LINK No.
4534
Saravanakumar K and Kumar RR (2011) Analysis of water quality parameters of
groundwater near Ambattur industrial area, Tamil Nadu, India. Indian Journal of Science
and Technology 4(5): 660-662.
Schön JH (2015) Physical properties of rocks: Fundamentals and principles of
petrophysics. (Vol. 65) Elsevier
Sharma M and Smita C (2013) Assessment of ground water quality in vicinity of
industries and along Yamuna river in Yamuna Nagar, Haryana, India. Asian Journal of
Science and Technology 4(10): 054-061
Shashikanth HM, Vijayakumar K and Vasanthkaumar B (2008) Environmental
Monitoring Assessment 138: 273-279
SIA: Bulletin (2000) Guidance on the Use of Rainwater Tanks - The Facts. Published by
Stormwater Industry Association Inc, Australia No 86
Sundar ML and Saseetharan MK (2008) Groundwater Quality in Coimbatore, Tamil
Nadu along Noyyal River, Journal of Environmental Science and Engineering, Vol 50(3):
187-190
Tijani MN (1994) Hydrogeochemical assessment of groundwater in Moro area, Kwara
State, Nigeria. Environmental Geology 24(3): 194-202
Tiller KG (1989) Heavy metals in soils and their environmental significance. Advances in
soil science 9:113-142

58
Trenberth KE (2011) Changes in precipitation with climate change. Climate Res (47):
123-138
Trivedy RK and Goel PK (1986) Chemical and Biological methods for water pollution
studies Environmental Publication, Karad
Wada Y, Van Beek LPH and Bierkens MFP (2012) Nonsustainable groundwater
irrigation: A global assessment. Water Resources Research 48, W00L06
WHO (2008) International Standard for drinking water, 3rd
edition, Geneva
WWAP (2006) Water: a shared responsibility. The United Nations World Water
Development Report 2. UNESCO, Paris and Berghahn Books, New York

CURRICULUM VITAE (CV)
Personal Date
Name: NIWAR A. MOHAMMED HAMID
Family Name: MOHAMMED HAMID
Address: Roxsar10
Postcode City: 42001,Dohuk/Semel
Nationality: Iraq/Kurd
Phone: +9647504151441
Email: [email protected]
Birth Date: 9.7.1990
Birth Place: Naynawa-Iraq
Marital Status: Married
Education
2011-2015: (Iraq) Bachelor of Science, Environmental Department /(University of Zakho)
Languages
Native language: Kurdish (Excellent)
Other LAnguages: Arabic ( Excellent)
English (Very Good)
Turkish (Fair)
Computer Skills
(Microsoft Windows, Microsoft Office, Adobe Photoshop, Remote Sensing, GIS )
Awards
One of the top students in getting new idea of environmental science department.