Evaluating the impacts of Tekes-funded projects: Differences between service- and industrial sectors
22
Evaluating the impacts of Tekes-funded projects: Differences between service- and industrial sectors Soile Kotala 1 , Jari Kuusisto 2 SC-Research ABSTRACT This paper presents the results from an impact evaluation of public funding for R&D projects in Finland. Tekes (Finnish funding Agency for Technology and Innovation) is the main public R&D and innovation funding organisation in Finland. It has established an ex-post monitoring system (EPM), which gathers information of all the funded projects’ effectiveness and their impacts. This paper compares the impacts of Tekes funding in service- and manufacturing related R&D projects. The key finding is that the projects do not differ in the overall effectiveness despite that service projects are on the average smaller in scale and scope. This inconsistency between inputs and outcomes is discussed in more detail in the paper. 1 FM Soile Kotala, researcher SC-Research Poutuntie 8, 62100 Lapua tel. +358 20 124 5287, +358 40 830 3986, +358 40 558 9421 [email protected] 2 Ph.D. Jari Kuusisto, director of technology tel. +358 20 124 5282, +358 40 830 3981, +358 45 678 7633 [email protected]
Transcript of Evaluating the impacts of Tekes-funded projects: Differences between service- and industrial sectors
Evaluating the impacts of Tekes-funded projects:
Differences between service- and industrial sectors
Soile Kotala1, Jari Kuusisto2 SC-Research
ABSTRACT
This paper presents the results from an impact evaluation of public funding for R&D projects in Finland. Tekes (Finnish funding Agency for Technology and Innovation) is the main public R&D and innovation funding organisation in Finland. It has established an ex-post monitoring system (EPM), which gathers information of all the funded projects’ effectiveness and their impacts. This paper compares the impacts of Tekes funding in service- and manufacturing related R&D projects. The key finding is that the projects do not differ in the overall effectiveness despite that service projects are on the average smaller in scale and scope. This inconsistency between inputs and outcomes is discussed in more detail in the paper.
1 FM Soile Kotala, researcher SC-Research Poutuntie 8, 62100 Lapua tel. +358 20 124 5287, +358 40 830 3986, +358 40 558 9421 [email protected] 2 Ph.D. Jari Kuusisto, director of technology tel. +358 20 124 5282, +358 40 830 3981, +358 45 678 7633 [email protected]
INTRODUCTION
Finnish funding Agency for Technology and Innovation (Tekes) is the main public funding organisation for research and development in Finland. Its primary objective is to promote the competitiveness of Finnish industry and the service sector. Tekes provides funds for industrial R&D as well as R&D carried out by the research organisations. In particular, Tekes seeks to promote innovative, risk-intensive projects. Overall Tekes has a budget of 500 million euros, and it provides funding for more than 2 000 projects annually.
Tekes has recently widened its scope from technology development towards wider innovation support that includes services. It has up-dated its vision, strategy and technology programmes. Also new financing criteria have been introduced so that they are better suitable for service development projects. Services were first recognised in Tekes mission statement in 1997; the primary objective of Tekes being ‘to boost the development of Finnish industry and the service sector by technological means and through innovation’. Since 2003, Tekes financing instruments have been equally available for the development of technological products and services. Tekes has also gradually shifted focus from supporting knowledge intensive services to broader approach for services development. In 2000, Tekes vision was up-dated so that knowledge intensive services were regarded as a new, growing business field alongside the strong Finnish industrial core clusters. In 2002, Tekes positioned knowledge intensive services as one of the four key application areas of it’s technology strategy. Since 2005 services in more general terms are seen as one of the focus areas. Now Tekes seeks to improve the quality and productivity of services as well as the creation of new service businesses. New service business models and innovative public services are promoted along with the investments in the development of service innovations. According to Tekes, ‘new service businesses can emerge as product-related services, as independent added-value services or as separate independent service concepts.’ Overall, the current focus has increased financing to services since 1996. In 2004, 20 per cent of Tekes’s clients were service businesses that received funding worth 55 million Euros. (Kuusisto et Kotala, 2004, 2007)
Tekes has legal obligation to evaluate its operations and to asses the effectiveness of it’s funding. Hence there has been an increasing need for impact related data. Tekes has responded this need by adopting a standard procedure of sending out self-evaluation questionnaires ex post facto to its client organisations. This ex-post monitoring system (EPM) is the last module of Tekes project monitoring system, which contains information over the whole life cycle of projects. The EPM questionnaires are being sent to all recipients of project funding, so the evaluation extends to the
entire R&D project base of Tekes. The request to respond to the EPM questionnaire is being sent out three calendar years after the project has been completed. According to Tekes, three years period appears to be the minimum time for monitoring the impacts of public funding. This time lag is also confirmed by several recent studies (e.g. Ali-Yrkkö et Maliranta, 2006), and can also be observed from the EPM data itself (Kotala et al., 2005). The EPM questionnaire contains questions, which seek to define the overall impact and effectiveness of funded projects and Tekes’s support in particular. The questionnaires were originally designed according to the methodology developed for evaluating the industrial and economic effects of the Eureka initiative (Pesonen, 2003). There are three types of EPM questionnaires aimed for:
1) Research projects implemented mainly by universities,
institutions of higher education or research institutions 2) Challenging R&D projects implemented mainly by large
companies 3) Development projects implemented by small and medium size
companies (SMEs) aiming to produce new products, services or processes.
All questionnaires follow basically the same format, although the
content of some questions may vary due to the different nature and goal setting of the projects. EPM data is entirely quantitative, since the questionnaires include mostly multiple choice questions. The data has been accumulated since 2002 and forms quite a unique data set. Over the course of five years of EPM (2002 – 2006), 5564 projects have responded, covering 66 per cent of projects during this period of time. The respond rate is very high considering that respondents have no obligation to participate the survey. Almost 80 per cent of the responds comes through electronic EPM web questionnaires.
This paper presents first of all, the statistical analysis of the grouping (or clustering) of Tekes-funded projects based on their overall success, impact and effectiveness (later referred as the Impact Grouping), which has been established from EPM data. To start with, the background and method of construction of the Impact Groups is presented. Secondly, the differences in the effectiveness of service- and manufacturing related projects3 are examined utilizing the Impact Groups. Subsequently, the differences are examined through more detailed analysis. The results indicate that the impacts of the projects are not directly related to the amount of project funding or e.g. the estimated challenge- and risk levels of the project.
3 Later on the terms ‘service projects’ and ‘industrial projects’ are being used.
ANALYSING THE OVERALL PROJECT EFFECTIVENESS: IMPACT GROUPS
The EPM data consists of project contact persons’ ratings of their overall success, impact and effectiveness, probed by EPM questionnaires. The analysis and grouping of Tekes-funded projects (the Impact Grouping) is based on the EPM data. Although the questionnaires contain a limited number of 11-12 main questions that are short and easy to answer, the EPM data as a whole is surprisingly rich and complex in nature. The Impact Grouping seeks to produce a simplified presentation of the key EPM data, bearing in mind that none of the relevant information should be lost.
The impact levels and additionality of Tekes support
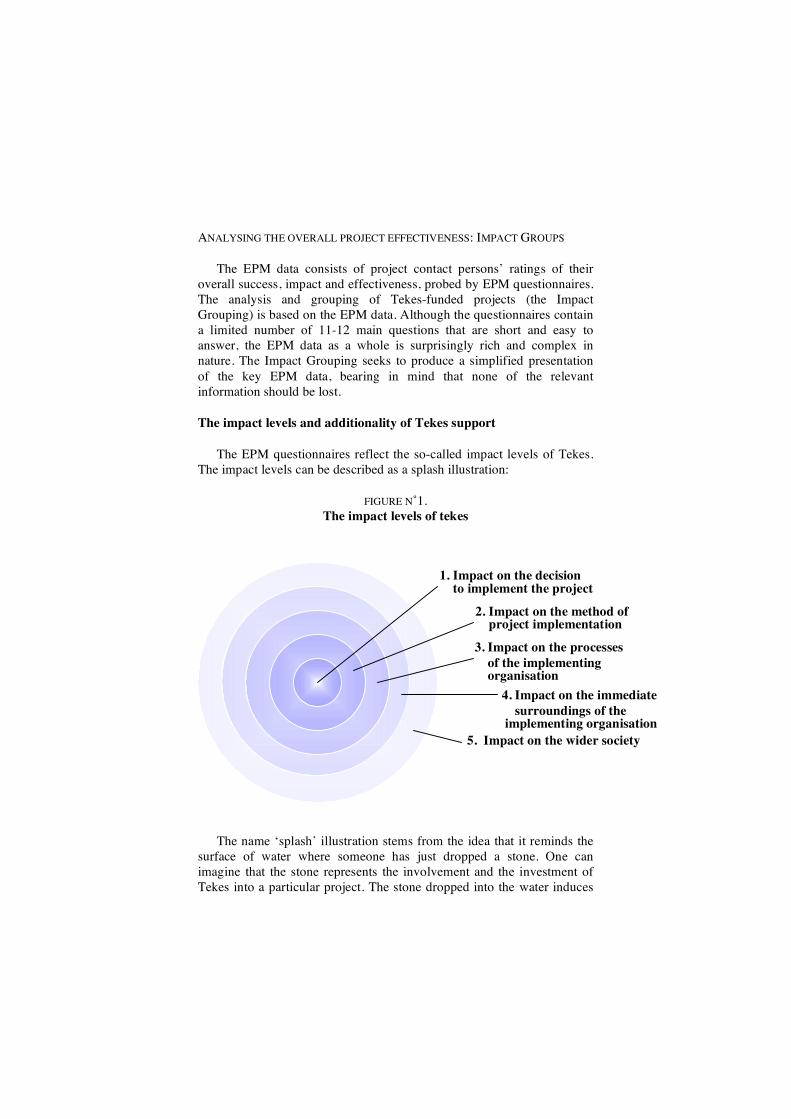
The EPM questionnaires reflect the so-called impact levels of Tekes. The impact levels can be described as a splash illustration:
FIGURE N˚1. The impact levels of tekes
The name ‘splash’ illustration stems from the idea that it reminds the
surface of water where someone has just dropped a stone. One can imagine that the stone represents the involvement and the investment of Tekes into a particular project. The stone dropped into the water induces
5. Impact on the wider society
4. Impact on the immediate surroundings of the implementing organisation
3. Impact on the processes of the implementing organisation
2. Impact on the method of project implementation
1. Impact on the decision to implement the project
expanding waves which represent the different impacts of public R&D funding. The impacts concern (1) the decision in the organisation that is responsible for carrying out the project (or does public involvement influence on the decision to carry out the project), (2) the public financier’s involvement and the investment on the method of implementation of the project. Later on public investment on a project might be seen as changes (3) in the processes of the realising organisation due to the implementation of the project, (4) in the immediate surroundings of the realising organisation and (5) wider in the society. The temporal order of the last three impacts may vary between projects though.
The impact levels are in many ways intertwined with the framework of additionality analysis. Additionalities are widely used in R&D evaluation practise (Luukonen, 2000) and can be distinguished into several different types of influence (Georghiou 1994, Georghiou et al. 2002, 2004, Luukkonen 2000, Pekkanen et al 2004):
− Input additionality, the influence of public R&D support on the
amount of private R&D in companies. − Output additionality, the influence of public support on the results
of R&D − Behavioural additionality, the difference in firm behaviour
resulting from the public support − Cognitive capacity additionality, the difference in the levels of
competence and knowledge resulting from the public support − Project additionality, the influence of public support on the
decision of implementing the project The first impact level refers to project additionality, which is the
additionality of public funding on behalf of a certain project (Luukkonen, 2000). The project is purely additional, if it would not have been carried out at all without public funding. This is somewhat critical question in measuring the effectiveness of public R&D funding, since there’s no point for granting public finance for the projects that could have been financed privately, for instance by other companies, private investors or the businesses themselves.
The second impact level refers to the way public financing has influenced on the implementation of the project. EPM questionnaires consider several ways Tekes may have influenced on the project implementation. For instance, Tekes may require some changes to be made to the timetable of the project, involvement of partners or international contacts of the project. These changes could be made during the project or during the application stage of the project. This impact level refers to behavioural additionality (Georghiou 1994, Georghiou et al.
2002, 2004), which in this context could further be labelled as project behavioural additionality, since the changes concern only behaviour related to the implementation of a particular project, not the overall firm behaviour. However, the changes in project implementation behaviour may well be reflected in the implementation behaviour of subsequent, similar kind projects.
Rest of the impact levels refer to output, behavioural as well as cognitive capacity additionalities. Behavioural changes within the (3) realising organisation could here be labelled as organisational behavioural additionality, since the project may have wider effects on the firm behaviour and these changes may turn out to be more long-lasting than in the actual project implementation phase (has the project effected for instance the amount of cooperation and subcontracting in a firm). Also output and cognitive capacity additionalities are covered within EPM questions pertaining to this impact level (EPM questions such as: has the project affected the competitive advantage of the organisation, has there been growth in the turnover of the company, in the number of employees, productivity, or increase in the levels of know-how and competence4).
Output and behavioural additionalities are somewhat processed within impact level referring to (4) the immediate surroundings of the realising organisation, which stands for the branch of business or research, business operations networks and innovation networks (EPM questions include e.g.: has there been an increase in the turnover growth, productivity, R&D- and investment activities in other companies).
Output and cognitive capacity additionalities are covered within impact level (5) wider in the society (e.g. as an improvement in public services, social services, national knowledge base, employment state and regional development) due to the implementation of the project.
The splash illustration only covers the assumed impacts of public R&D funding. It lacks the separation of public and private R&D-investments (of the organisation(s) implementing the project), which is referred as the input additionality. Also the illustration elides other possible ambient effects, which is because these effects are usually unknown, random and difficult to extrapolate. In addition to including questions related to impact levels of Tekes, the EPM questionnaires aim to measure the general success rate of the project and Tekes significance for the project.
4 Only in EPM questionnaire for research projects
Method of construction of the Impact Groups
Cluster analysis5 was used in composing the Impact Groups of projects. Data for the analysis was drawn from the project responses to EPM questionnaires. The purpose of the cluster analysis was (1) to create a simplified understanding of the effectiveness of Tekes funded projects and (2) to find out if there were any particular types of projects that have benefited from Tekes funding in different ways.
For cluster analysis, eight most relevant questions (containing several sub questions) were selected from the EPM questionnaires. These questions describe: (1) the general success of a project, (2) the significance of Tekes operations for the project, (3) the influence of Tekes funding on the decision whether, or not, to carry out the project, (4) Tekes influence on the way the project was carried out, (5&6) how the implementation of the project had influenced the processes in organisation, (7) in organisation’s immediate surroundings, and (8) in a wider society. The selected questions reflect the impact levels in the splash illustration. The project responses to these questions were ranked and summarized into seven variables used in cluster analysis. The variables were standardized so that their variation was on the same scale.
The cluster analysis was conducted in 2005, so that there were three years of EPM data available (2002 – 2004). Five Impact Groups of projects were constructed on the basis of the cluster analysis. Projects that responded during 2005-2006 were assigned into Impact Groups using Discriminant analysis6. Assigning a particular project into one of the groups provides that project responses to the critical eight most relevant questions were delivered. Variables, that were used in cluster analysis, were calculated in the same way for the new projects and they were also standardized7 for the discriminant analysis. The EPM questionnaires have remained essentially unchanged throughout the years, allowing a comparative analysis over time.
5 Cluster analysis seeks to classify individuals based on their homogeneity. The basic
aim is to find the ‘natural groupings’, if any, of a set of individuals. More formally, cluster analysis aims to allocate individuals to a set of mutually exclusive, exhaustive groups such that individuals within a group are similar to one another while individuals in different groups are dissimilar (Chatfield et Collins 1980).
6 Discriminant analysis is a statistical technique, which allows to consider several variables, when examining the differences between two or more groups of individuals (Klecka 1908).
7 to maintain the comparability of the variables.
The Impact Groups
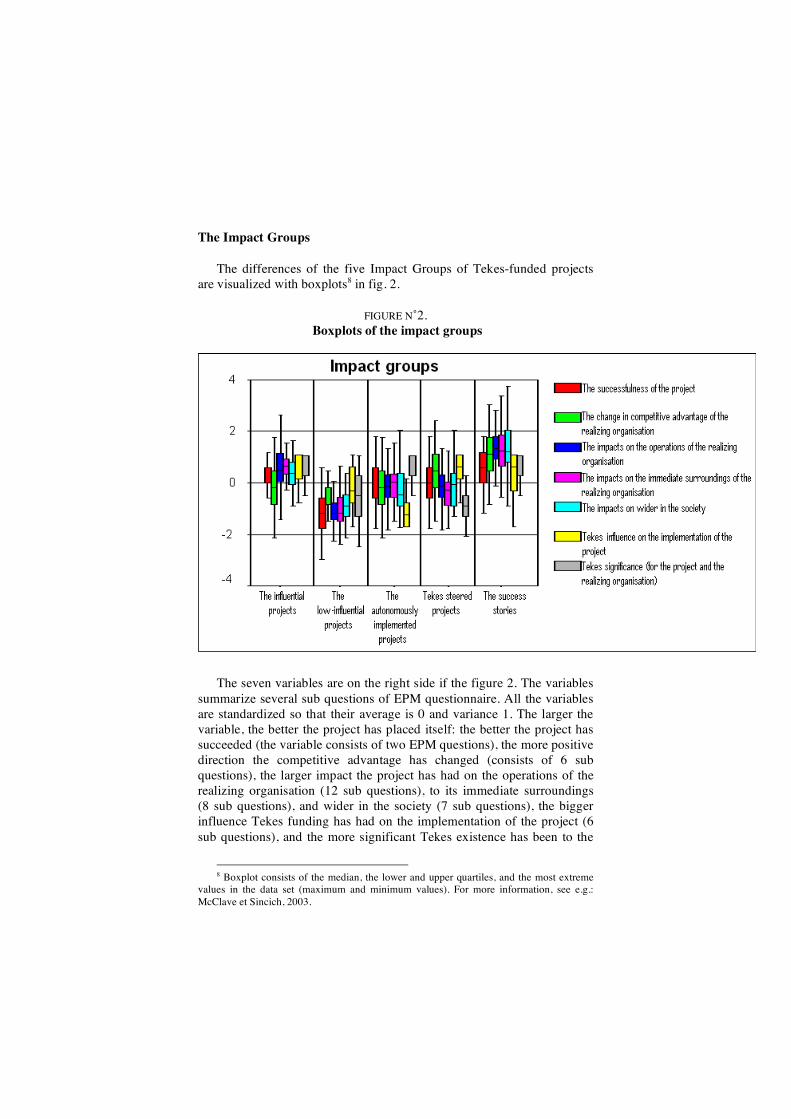
The differences of the five Impact Groups of Tekes-funded projects are visualized with boxplots8 in fig. 2.
FIGURE N˚2. Boxplots of the impact groups
The seven variables are on the right side if the figure 2. The variables
summarize several sub questions of EPM questionnaire. All the variables are standardized so that their average is 0 and variance 1. The larger the variable, the better the project has placed itself: the better the project has succeeded (the variable consists of two EPM questions), the more positive direction the competitive advantage has changed (consists of 6 sub questions), the larger impact the project has had on the operations of the realizing organisation (12 sub questions), to its immediate surroundings (8 sub questions), and wider in the society (7 sub questions), the bigger influence Tekes funding has had on the implementation of the project (6 sub questions), and the more significant Tekes existence has been to the
8 Boxplot consists of the median, the lower and upper quartiles, and the most extreme
values in the data set (maximum and minimum values). For more information, see e.g.: McClave et Sincich, 2003.
overall development in realizing organisation (2 questions). All other variables are summary variables except for last variable concerning Tekes’ significance, in which two questions have been multiplied.
As illustrated by the fig. 2, ‘Success stories’ clearly represents the best group of projects that are performing remarkably well. The second best group ‘Influential projects’ is on the average level in terms of variables measuring the general successfulness of the project and the change in competitive advantage, but is above the average level in terms of variables measuring the impacts on the operations of the realizing organisation, the immediate surroundings and wider in the society. ‘Low-influential projects’ is evidently inferior to other groups. In the near-by area of the average are Impact Groups called ‘Autonomously implemented projects’ and ‘Tekes steered projects’. These groups notably depart from the average only in terms of variables measuring the influence of Tekes funding on the implementation of the project and Tekes significance. Tekes influence on the implementation of ‘Autonomously implemented projects’ is low, while Tekes signifigance is high. The situation is the opposite in the case of ‘Tekes steered projects’. The boxplots help in profiling the Impact Groups:
‘Influential projects’ group contains projects that rank by most
variables at least on the second highest level. On the competitive advantage variable, the group is ranked in the middle level. Tekes significance for the implementation of the project and to the overall development of the realizing organisation is high. The general successfulness is on high level, as well as the variables that measure the impacts of the projects.
‘Low-influential projects’ contains the least successful projects.
However, this group can not be categorized as failures, since on the average these projects can be considered moderately successful. Low-influential projects have not had a large impact on the competitive advantage of the organisation. Also the impacts of projects on the operations of the organisation, to its immediate surroundings and wider in the society remain below the average, although the impacts are mainly positive. Tekes had not influenced much the implementation of these projects, also the significance of Tekes for the project and the overall development of the organisation were considered quite insignificant in comparison to the other groups. This group includes a large number of projects that would have been implemented even without Tekes funding.
‘Autonomously implemented projects’ embodies projects that had
succeeded well or at least moderately. The projects had had a positive impact to the competitive advantage and other operations of the
organisation, to it’s immediate surroundings and wider in the society. The impacts were on the average level compared to other groups. This Impact Group departs from the average on two variables: Tekes had not much influenced on the implementation of the project and Tekes’s significance was conceived as very high.
‘Tekes steered projects’ incorporates projects that rank on the
average level by almost all variables, and thus the group resembles ‘Autonomously implemented projects’. The differences between ‘Tekes steered projects’ and ‘Autonomously implemented projects’ appear on two variables: Tekes significance and Tekes influence on the project implementation. Tekes had influenced substantially more on the implementation of ‘Tekes steered projects’ than ‘Autonomously implemented projects’, whereas Tekes significance was considered to be lower in ‘Tekes steered projects’, in fact lowest of the Impact Groups.
‘Success stories’ includes the most successful projects. These projects
had a significant impacts on the competitive advantage and other operations of the organisation, to its immediate surroundings and wider in the society. On the average level was only Tekes influence on the implementation of the project. Tekes significance was rated high, as it is also in the case of ‘Influential projects’ and in ‘Autonomously implemented projects’.
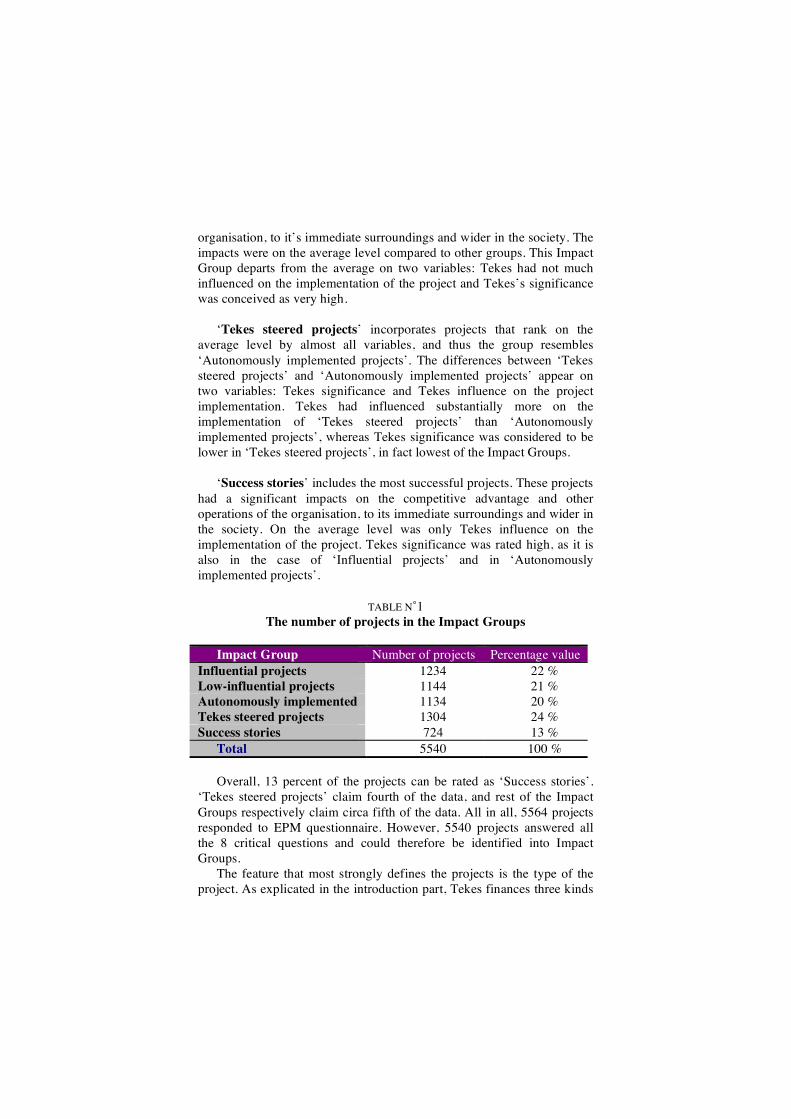
TABLE N˚1 The number of projects in the Impact Groups
Impact Group Number of projects Percentage value
Influential projects 1234 22 % Low-influential projects 1144 21 % Autonomously implemented 1134 20 % Tekes steered projects 1304 24 % Success stories 724 13 %
Total 5540 100 % Overall, 13 percent of the projects can be rated as ‘Success stories’.
‘Tekes steered projects’ claim fourth of the data, and rest of the Impact Groups respectively claim circa fifth of the data. All in all, 5564 projects responded to EPM questionnaire. However, 5540 projects answered all the 8 critical questions and could therefore be identified into Impact Groups.
The feature that most strongly defines the projects is the type of the project. As explicated in the introduction part, Tekes finances three kinds
of projects: (1) Research projects, (2) R&D projects and (3) development projects. Research projects are implemented mainly by universities, institutions of higher education or research institutions, challenging R&D projects are implemented mainly by large businesses and development projects by small and medium size businesses (SMEs) aiming to produce new products, services or processes. Development projects are usually smaller and less challenging.
TABLE N˚2. Project types
Project type Number of projects Percentage value
Research projects 2571 46 % R&D projects 1110 20 % Development projects 1859 34 %
Total 5540 100 % Research projects constitute almost half of the projects, and
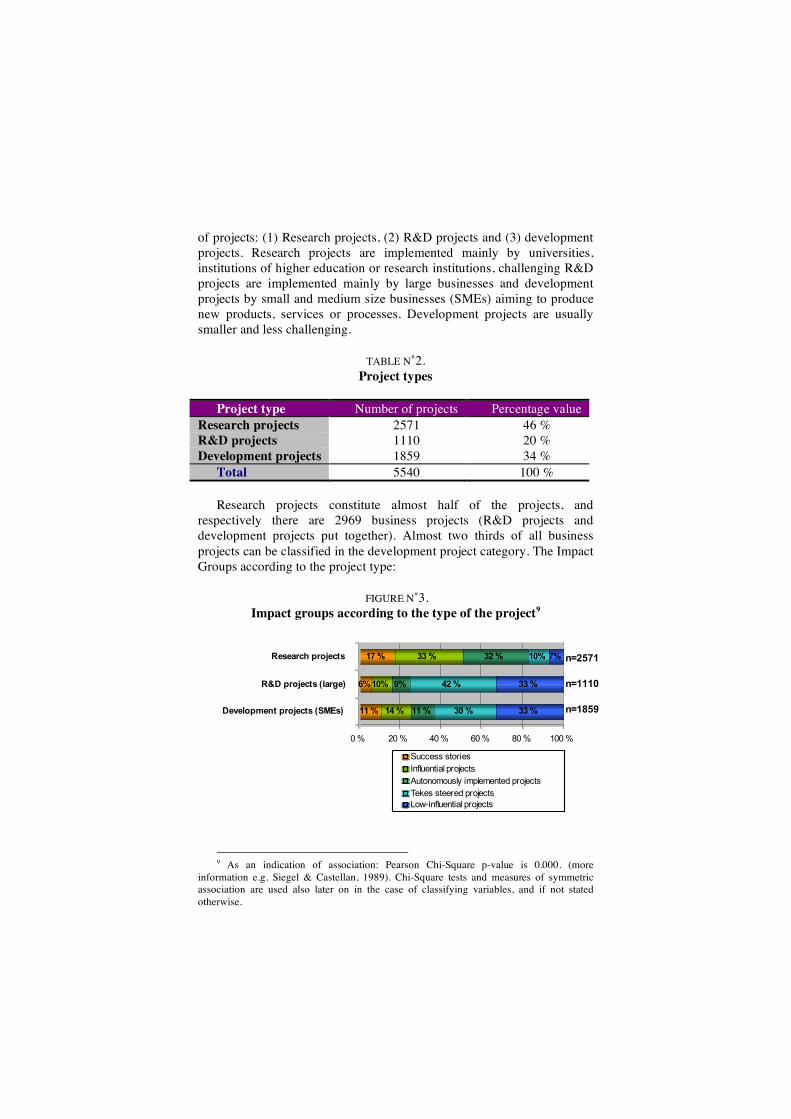
respectively there are 2969 business projects (R&D projects and development projects put together). Almost two thirds of all business projects can be classified in the development project category. The Impact Groups according to the project type:
FIGURE N˚3. Impact groups according to the type of the project9
11 %
17 %
14 %
33 %
11 %
32 %
30 %
42 %
33 %
33 %6%10% 9%
10% 7%
0 % 20 % 40 % 60 % 80 % 100 %
Development projects (SMEs)
R&D projects (large)
Research projects n=2571
n=1110
n=1859
Success stories
Influential projects
Autonomously implemented projects
Tekes steered projects
Low-influential projects
9 As an indication of association: Pearson Chi-Square p-value is 0.000. (more
information e.g. Siegel & Castellan, 1989). Chi-Square tests and measures of symmetric association are used also later on in the case of classifying variables, and if not stated otherwise.
Research projects differ markedly from projects implemented in the businesses. Most research projects are ranked as ‘Influential projects’, ‘Autonomously implemented projects’ and as ‘Success stories’. The common feature for these groups is that Tekes significance is considered to be very high (see fig.2). In contrast, business projects contain many ‘Low-influence projects’ and ‘Tekes steered projects’. Within these Impact Groups, Tekes significance is considered to be the lowest.
The high significance of Tekes funding within research projects is quite expected, since pure research projects are mainly based on public funding. Research projects also seem to be rated more successful and influential than typical business projects. An important difference between research projects and business projects is that there are no commercial risks involved in research projects. If the results of a research project are not what were expected, the project is not usually considered to be a failure. Instead, the project could be seen as a useful learning process, which can be helpful in directing lines for subsequent research projects. Hence, even if the research project turns out to be a failure or produces rather trivial research results, its impacts might be wide-ranging. Instead, business projects always include an element of commercial risk (Tekes being a risk financier), and usually the projects have a concrete, commercial objective which may be reached, or not. If that objective remains unattainable, it is common to conclude that the project was a failure and accordingly, also the impacts of the project remain insignificant.
Taking a closer look into the business projects alone, it can be seen, that ‘Tekes steered projects’ are more common within R&D projects and in turn, ‘Success stories’ and ‘Influential projects’ are more common within development projects. The following section clarifies in part the difference between these types of projects.
A COMPARISON BETWEEN SERVICE- AND INDUSTRIAL PROJECTS’ EFFECTIVENESS
An interesting perspective is to analyse the division of Impact Groups against the standard industrial classification (some classes combined). All research projects could be identified into a single class; research and business services. However, the main focus here is the company projects, therefore the research projects are excluded from further analyses.
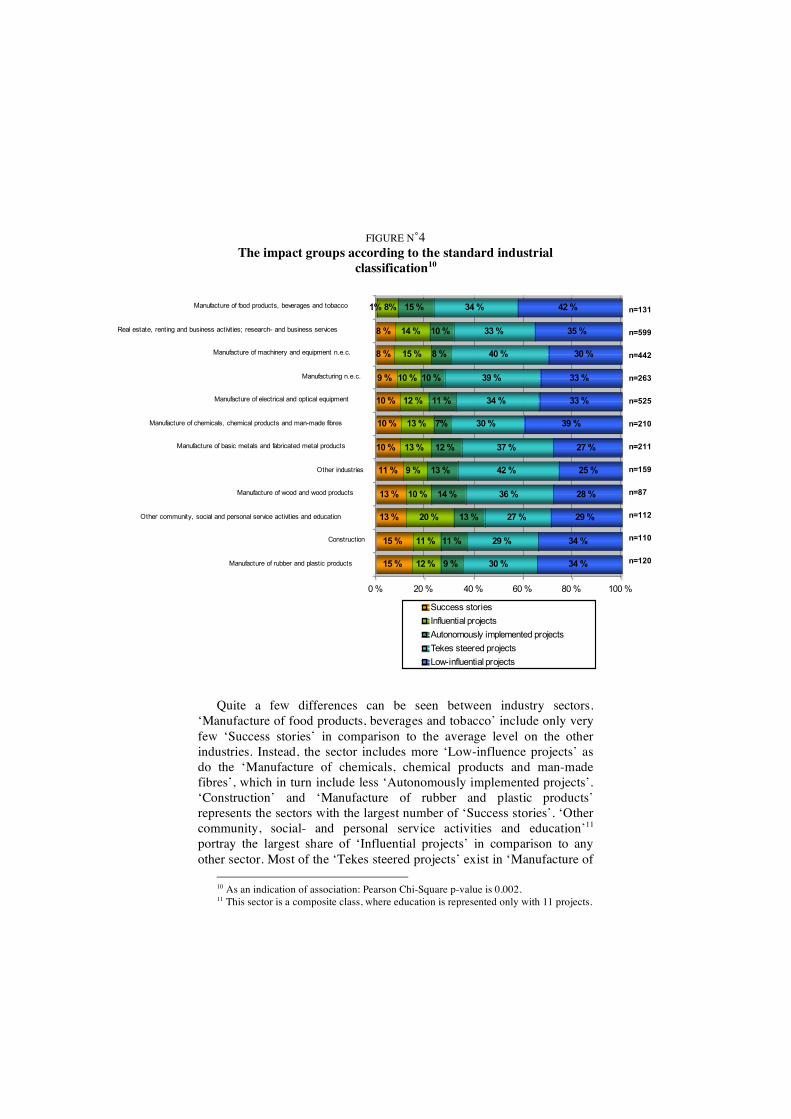
FIGURE N˚4 The impact groups according to the standard industrial
classification10
15 %
15 %
13 %
13 %
11 %
10 %
10 %
10 %
9 %
8 %
8 %
12 %
11 %
20 %
10 %
9 %
13 %
13 %
12 %
10 %
15 %
14 %
9 %
11 %
13 %
14 %
13 %
12 %
11 %
10 %
8 %
10 %
15 %
30 %
29 %
27 %
36 %
42 %
37 %
30 %
34 %
39 %
40 %
33 %
34 %
34 %
34 %
29 %
28 %
25 %
27 %
39 %
33 %
33 %
30 %
35 %
42 %1% 8%
7%
0 % 20 % 40 % 60 % 80 % 100 %
Manufacture of rubber and plastic products
Construction
Other community, social and personal service activities and education
Manufacture of wood and wood products
Other industries
Manufacture of basic metals and fabricated metal products
Manufacture of chemicals, chemical products and man-made fibres
Manufacture of electrical and optical equipment
Manufacturing n.e.c.
Manufacture of machinery and equipment n.e.c.
Real estate, renting and business activities; research- and business services
Manufacture of food products, beverages and tobaccon=131
n=599
n=442
n=263
n=525
n=210
n=211
n=159
n=87
n=112
n=110
n=120
Success stories
Influential projects
Autonomously implemented projects
Tekes steered projects
Low-influential projects
Quite a few differences can be seen between industry sectors.
‘Manufacture of food products, beverages and tobacco’ include only very few ‘Success stories’ in comparison to the average level on the other industries. Instead, the sector includes more ‘Low-influence projects’ as do the ‘Manufacture of chemicals, chemical products and man-made fibres’, which in turn include less ‘Autonomously implemented projects’. ‘Construction’ and ‘Manufacture of rubber and plastic products’ represents the sectors with the largest number of ‘Success stories’. ‘Other community, social- and personal service activities and education’11 portray the largest share of ‘Influential projects’ in comparison to any other sector. Most of the ‘Tekes steered projects’ exist in ‘Manufacture of
10 As an indication of association: Pearson Chi-Square p-value is 0.002. 11 This sector is a composite class, where education is represented only with 11 projects.
machinery and equipment’ and in ‘Other industries’. As the following analyses compare services to manufacturing sectors, it might be useful to bear in mind that services (as well as manufacturing) are very heterogeneous clusters and the differences within different service sectors can be large, as can be seen from the fig. 4.
The functions of the society are traditionally represented in terms of three broad sectors: Primary production, secondary production and services. Secondary production usually includes sectors ‘manufacturing’, ‘electricity, gas and water supply’ and ‘construction’. In the following analyses ‘manufacturing’ is combined with primary production (farming, fishing and mining12), and ‘electricity, gas and water supply’ and ‘construction’ are combined with services.13 The following analyses thus define service projects as projects implemented by businesses from sectors (in fig. 4.) ‘Real estate, renting and business activities; research- and business services’, ‘Other community, social and personal service activities’, ‘Construction’ and partly ‘Other industries’.
Out of 2969 business projects, service projects constitute 32 % (914 projects). Considering project types (explicated e.g. in table 2.), development projects make up over two thirds of service projects.
When service projects are compared with industrial (manufacturing related) projects, the Impact Group analysis does not bring any differences between these groups. Thus the general successfulness and effectiveness of projects implemented in service businesses appear to be at the same level as the projects implemented in manufacturing businesses. Even when examining the two different types of business projects - R&D projects and development projects – separately, the differences are still not very prominent (not statistically significantly), although in the case of R&D projects, service companies do include slightly more influential projects and success stories than do manufacturing companies.
In terms of the Impact Groups, or the overall successfulness and effectiveness of the projects, service- and industrial projects do not display statistically significant differences. However, quantitative differences can be found in single summary variables (presented in fig. 2) used in the Impact Grouping. Service projects seem to have bigger counts on summary variable that measures the impacts of the projects on the operations of the realizing organisation and in turn industrial projects have bigger counts on summary variable measuring the amount of Tekes influence on the implementation of the project. Thus public support for
12 Farming, fishing and mining constitute only 1,6 % of the manufacturing projects. 13 It can be argued that the sectors should be combined with manufacturing. The main
results of the study did not change even though after the experiment of joining ‘construction’ (110 projects) and ‘electricity, gas and water supply’ (45 projects) with manufacturing.
service projects has effected the entire business operations more and in more various ways than is the case of industrial projects. At the same time, Tekes funding seems to influence the implementation method of industrial projects more frequently than it does in the case of service projects.
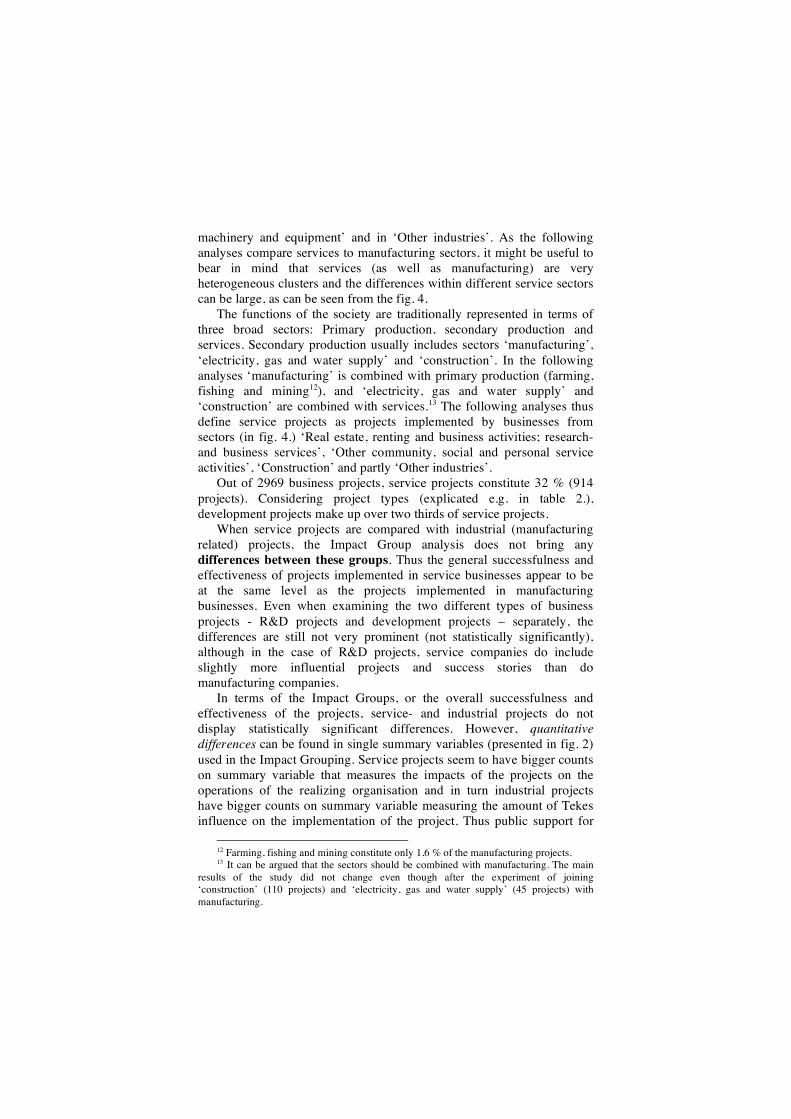
The qualitative differences between service and industrial projects, within above-mentioned variables, indicates that the quality and the sale of products (and services), the foundation of new areas of business or research and the sale of know-how and licences, have increased more in the case of service projects. In turn, cooperation with public sector research institutes and –organisations and subcontracting have increased more in the case of industrial projects. These differences are presented in the fig. 5 below.
FIGURE N˚5. Differences between service- and industrial projects’ impacts on
business operations
40%
58%52%
60%65%
72%
49%
64%
33%
52%
58%63%
0 %
20 %
40 %
60 %
80 %
Quality of
products
Sale of
products and
services
Foundation of
new areas of
business and
research
Sale of
knowhow and
licences
Cooperation
with public
research
institutions
Subcontracting
Service projects Industrial projects
The largest difference between service- and industrial projects appears to be in the sale of knowhow and licences. Over half of service projects (52 %) declare an increase in the sale of know-how and licences, whereas corresponding rate is only a third (33%) in industrial projects.14 An interesting difference between service- and industrial projects is that effects, which have increased more in the case of service projects (first four effects on the left in fig.5: from ‘Quality of products’ to ‘Sale of
14 If projects implemented by businesses from sectors ‘Construction’ and ‘Electricity,
gas and water supply’ were shifted from service projects to manufacturing projects, statistically significant differences would have been found also in the number of employees, which would have increased more within services.
knowhow and licences’), are related to output additionality15, whereas effects that increased most in the case of industrial projects (last two effects on the right in fig 5) can be defined as behavioural additionalities.
The R&D projects and development projects can also be investigated separately; In addition to differences described in the fig. 5, the foundation of new business units has increased more within service projects when considering the development projects alone. The differences relating to the sale of products and services are not evident (statistically significant). Within R&D projects, the above significant differences between service- and industrial projects are found only in the sale of know-how and licences, and in the foundation of new areas of business or research.
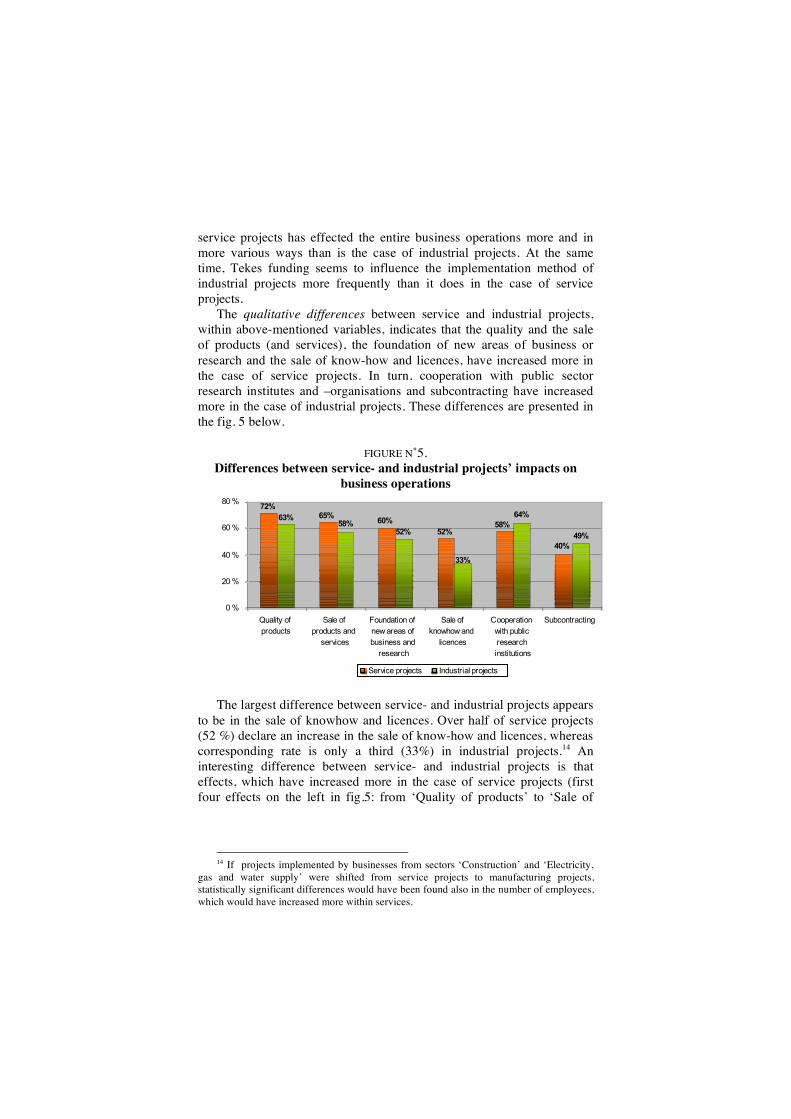
As stated earlier, in the case of all analysed business projects, Tekes funding had influenced on the implementation method of industrial projects more than in the case of service projects. The identified qualitative differences can be pin pointed around three key aspects: on the use of external resources, the number of collaborative partners in projects, and the level of challenge of projects. Differences can be seen most clearly, when examining the two business project types, development projects and R&D projects, separately.
FIGURE N˚6. The differences in the effect of Tekes funding on the implementation
method of service- and industrial projects
77 % 73 % 87 %84 % 77 % 82 %
0 %
20 %
40 %
60 %
80 %
100 %
Use of external resources Number of partners in
cooperation
Challenge of the project
Development projects R&D projects
Service projects Industrial projects
Tekes funding increases the use of external resources and the number
of partners in cooperation in industrial development projects more than in
15 ‘Foundation of new areas of business and research’ can be seen also as a behavioural
change.
the case of service development projects. In turn, it encourages service R&D projects to become more challenging, more than it does encourage in the case of industrial R&D projects. The percentage differences are quite small, but in the case of relatively large data set such as EPM, differences are statistically significant.
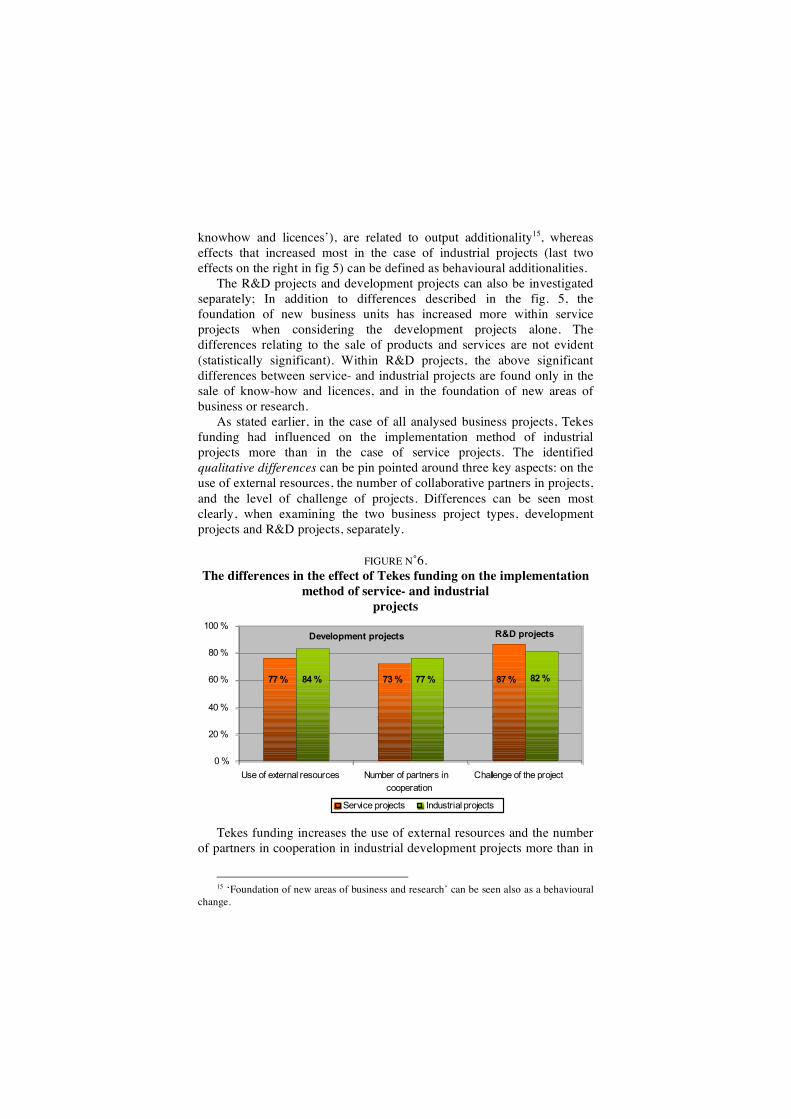
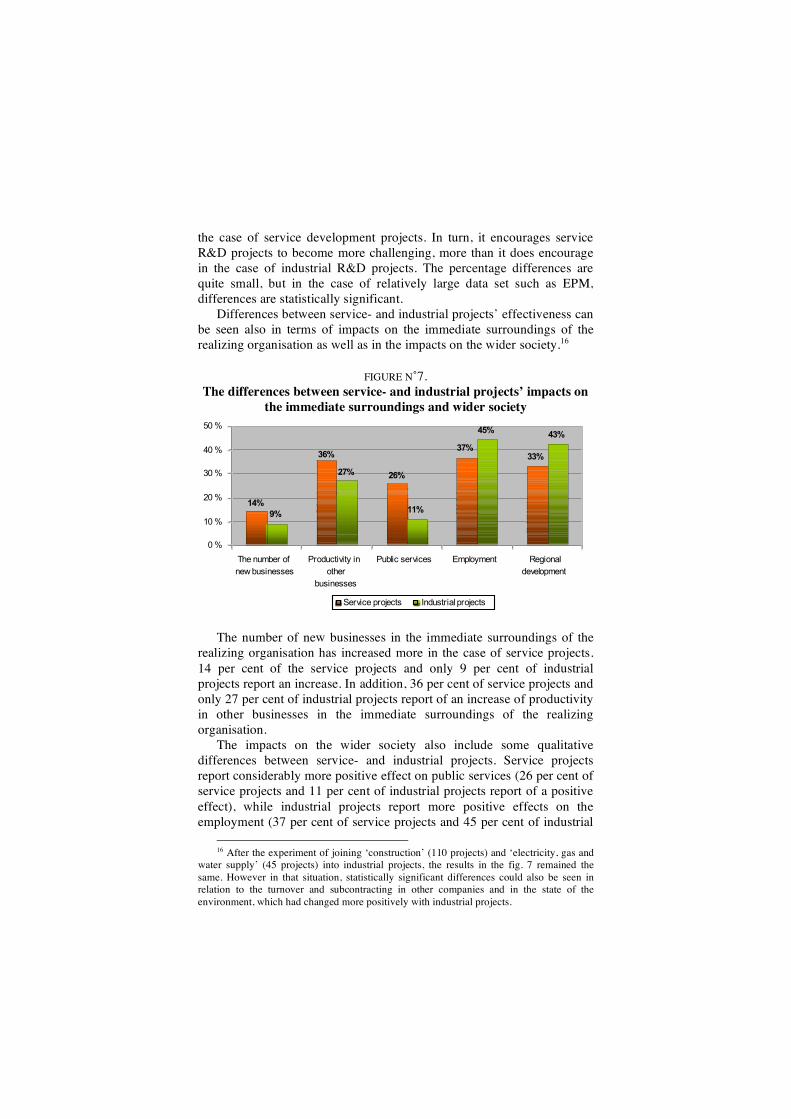
Differences between service- and industrial projects’ effectiveness can be seen also in terms of impacts on the immediate surroundings of the realizing organisation as well as in the impacts on the wider society.16
FIGURE N˚7. The differences between service- and industrial projects’ impacts on
the immediate surroundings and wider society
14%
36%
26%
37%
33%
9%
27%
11%
45%43%
0 %
10 %
20 %
30 %
40 %
50 %
The number of
new businesses
Productivity in
other
businesses
Public services Employment Regional
development
Service projects Industrial projects
The number of new businesses in the immediate surroundings of the
realizing organisation has increased more in the case of service projects. 14 per cent of the service projects and only 9 per cent of industrial projects report an increase. In addition, 36 per cent of service projects and only 27 per cent of industrial projects report of an increase of productivity in other businesses in the immediate surroundings of the realizing organisation.
The impacts on the wider society also include some qualitative differences between service- and industrial projects. Service projects report considerably more positive effect on public services (26 per cent of service projects and 11 per cent of industrial projects report of a positive effect), while industrial projects report more positive effects on the employment (37 per cent of service projects and 45 per cent of industrial
16 After the experiment of joining ‘construction’ (110 projects) and ‘electricity, gas and
water supply’ (45 projects) into industrial projects, the results in the fig. 7 remained the same. However in that situation, statistically significant differences could also be seen in relation to the turnover and subcontracting in other companies and in the state of the environment, which had changed more positively with industrial projects.
projects) and regional development (33 per cent of service projects and 43 % of industrial projects report of a positive effect).
DISCUSSION AND CONCLUSION
The analysis indicates that the type of the project (research projects / R&D projects / development project) is the single most significant issue determining into which Impact Group (reflecting the overall effectiveness of projects) the funded project will belong. Typically research projects are reported to be more successful and influential than business projects (development projects and R&D projects put together). However, this difference seems to be related to the different overall nature of the projects, including their different goal setting. The role of Tekes is in guiding and directing the project during the implementation phase is more eminent in R&D projects mainly implemented by large businesses than in the case of development projects implemented mainly by SMEs. However, R&D projects are more financially independent of Tekes than SMEs’ development projects.
Eliding research projects from the analysis, in the case of business projects there exists some differences between service and industrial manufacturing projects. Service projects are more often development projects in nature, thus more commonly implemented by SMEs. As service- and industrial projects were analysed within the Impact Groups, there were no clear differences between them, in neither type of the business projects.
On the background information level, service projects are more often performed in connection with technology programmes17 than industrial projects. In total, 52 per cent of service projects participate in a technology programme, whereas the corresponding figure for the industrial projects is only 41 per cent. Typically service projects are rated to be less challenging than the industrial projects.18 Also in a case of development projects, the technological risk of service projects is rated lower than in the case of industrial development projects. This is related to the fact that service projects may involve very limited amount of new technology development. However, service development projects involve
17 Technology programmes are used to promote development in specific sectors of
technology or industry, and to pass on results of the research work to business in an efficient way. The technology programmes are planned in cooperation by companies, research organisations and Tekes. The duration of the programmes ranges from three to five years. Half of the Tekes funding is channelled through technology programmes.
18 In the application phase, Tekes estimates the level of challenge and the possible risks of the project. The challenge and risk classifications have been only gradually taken into use since 2001, so the number of projects available for analyses varies around 500.
higher financial-, markets- and resources related risks than industrial development projects.
Tekes funding offer consists of grants, capital loans and industrial loans. These funding sources can cover certain percentage share of the eligible costs of a project. On average service projects receive clearly smaller amount of Tekes funding (150.000 Eur) than industrial projects do (200.000 Eur). Differences in Tekes funding between service and industrial projects can be seen both in the case of development projects and especially in R&D projects19, thus the type of the project alone does not explain the difference. Since Tekes funding level is lower in services, the projects are either smaller in terms of scale and scope than industrial projects, or industrial projects involve substantially more expensive new technology than in a case of service projects. Despite the various qualitative differences between service and industrial projects, the overall success and effectiveness of service and industrial projects is rather similar when the Impact Groups are concern.
Even if service projects are smaller in scale and scope, rated to be less challenging and receive less Tekes funding than industrial projects, the impacts and general successfulness and effectiveness of service projects seem to be on the same level, or even higher than comparable industrial projects. This is evident in both development projects and R&D projects cases. The presumption ’the bigger the inputs, the bigger the outputs’ does not hold true in this situation. The author can find not few possible hypotheses for consideration. Is it possible that
1) service project respondents have a genuine tendency to evaluate the project outcomes more positively than respondents in the case of industrial projects. After all the impacts of the projects are based on self-evaluation (EPM being a self-evaluation survey)
2) considering the relatively short period of time when public R&D funding has been available for services, lack of routine might explain the inconsistency between input and outputs. Perhaps service businesses lack the routine of applying public funding; hence they incorporate less challenging elements and overestimate the expenditures less than industrial manufacturing businesses, in relation to the true potential of the projects. Also public financiers might lack the routine of detecting the possible development trends for service projects.
3) regardless of the size of the project, they are rated to be strategically more important by the service businesses than projects within the analysed industrial firms (which may have several projects
19 The statistical significance of differences is tested with t-test and - since Tekes
funding was positively skewed and could not be corrected - also with non-parametric tests: Mann-Whitney, Moses, Kolmogorov-Smirnov and Wald-Wolfowitz, which all confirmed the results.
overlapping). Thus individual service projects are rated to have more significant impacts within the service business itself and also outside of the business.
4) the outcomes and impacts of service projects are more visible in three years time from project completion (when EPM questionnaires are sent) whereas impacts of industrial projects need more time to become to make an identifiable impact.
Some of the hypotheses can be further analysed here. Referring the last hypothesis (4), a study analysing the impact of R&D expenditure on the business productivity shows that R&D expenditures yield an economically and statistically significant impact in 3-5 year time. Hence, a window of almost 5 years is needed to capture the productivity impact of R&D (Ali-Yrkkö et Maliranta, 2006). However, this does not fully explain the results of this analysis, since the focus of EPM is wider than productivity alone. Argument 4 is to some extent confirmed by the fact that almost 11 per cent of industrial projects report in EPM data, that the commercialization has not materialized yet. The corresponding figure in service projects is only 7 per cent. However, this difference is too small to explain the difference between services and industrial manufacturing. The exclusion of these projects (in which the commercialization has not materialized yet) from the analysis does not change the key result: service and industrial projects’ share in the Impact Groups remain almost the same in both types of the business projects.
Considering the hypotheses (2) and (3); service businesses in general implement fewer and smaller projects. This situation is also confirmed by the statistics. Even if services are the dominant economic activity, they account only a relatively small share of officially recorded business expenditures on R&D in Finland (e.g. Hertog et al. 2006). Tekes is also one of the first agencies in Finland financing service related R&D and development projects. Thus the sources of external funding for services have been more limited in comparison to industrial R&D. This might lead into situation where only the very best service projects receive public funding. Hypotheses (2) and (3) might be accurate, however question remains, why should they be? As a conclusion: Statistical analysis of Tekes EPM data reveals an inconsistency between inputs and outcomes of service projects compared to industrial projects, and it is likely that all of the presented hypotheses can explain part of this inconsistency.
The qualitative analysis reveals that modifications and changes to the implementation of projects are greater in the case of industrial projects than with service projects (project behavioural additionality). Further on, in terms of project impacts on the processes of the realizing company, service projects have a greater effect on the outputs of the projects, whereas industrial projects modify more the firm behaviour, increasing subcontracting and cooperation with public research institutions
(organisational behavioural additionality). Thus the output additionality of the service projects seems higher, whereas the behavioural additionality of the industrial projects is more evident.
By and large, service projects are concentrated on organisational processes, whereas industrial projects are focussed on technology development. Therefore behavioural changes are expected to entail service projects by default. However, this is not evident in EPM data. It is worth considering how Tekes in part could influence the service projects to increase their behavioural additionality. Otherwise service projects already seem to outperform industrial projects in terms of effectiveness. It would also be useful to make sure that EPM questionnaires are equally suited for service projects and capture the different behavioural changes conceivable in service businesses, although it is possible that the behavioural changes are difficult to perceive and assign as an effect of a particular project in service businesses. That is because innovative service businesses are often in a state of constant gradual change; service innovations are incremental processes, interactive, non-technological and multi-dimensional (Metcalfe et Miles 2001, Kuusisto et Kotala 2004, de Vries 2006, Gallouj 2002, Kuusisto et Meyer 2003).
ACKNOWLEDGEMENTS
Acknowledgements to Tekes for funding and for an access to the EPM data. Special thanks to Eija Ahola and Pekka Pesonen for cooperation.
References
ALI-YRKKÖ (J.), MALIRANTA (M.), 2006, Impact of R&D on Productivity – Firm-level evidence from Finland, Discussion papers no. 1031, The Research Institute of the Finnish Economy, Etla, 2006
CHATFIELD (C.), COLLINS (A.J.), 1980, Introduction to multivariate analysis, London, Chapman and Hall Ltd
DEN HERTOG (P.) ET AL., 2006, Research and development needs of business related service firms, RESENER project, PREST Publications
DE VRIES (E.J.), 2006, “Innovation in services in networks of organizations and in the distribution of services”, Research Policy, 35
EVERITT (B.S.), 1974, Cluster analysis, London, Heinemann Educational Books Ltd
GALLOUJ (F.), 2002, Innovation in the service economy: The new wealth of nations, Edward Elgar Publishing Inc, Northampton
GEORGHIOU (L.), CLARYSSE (B.), STEURS (G.), BILSEN (V.), LAROSSE (J.), 2004, Making the difference: The Evaluation of behavioural additionality of R&D Subsidies, IWT-Studies 48, Innovation science technology

GEORGHIOU, L., 1994, Impact of the Framework Programme on European Industry, EUR 15907 EN, Office for Official Publications of the European Communities, Luxembourg.
GEORGHIOU (L.), RIGBY ( J.), CAMERON (H.) (EDS), 2002, Assessing the Socio-economic Impacts of the Framework Programme, PREST Publications
KLECKA (W.R.), 1980, Discriminant analysis, Newbury Park, Sage Publications, Inc
KOTALA (S.), KUUSISTO (J.), PESONEN (P.), AHOLA (E.), VERHELÄ (J), 2005, Lisäarvoa ja vaikuttavuutta tutkimus- ja tuotekehitysprojekteista. Tekes-hankkeiden jälkiraportointiprosessin tulokset. Unpublished report for Tekes.
KUUSISTO (J.), MEYER (M.), 2003, Insights into services and innovation in the knowledge intensive economy, Tekes Technology Review 134/2003, Helsinki
KUUSISTO (J.), KOTALA (S.), 2004, Policies and Programmes targeting Knowledge Intensive Services (KISA) in a Finnish Software Industry – A Working Paper for the OECD KISA Focus group. Synthesis report: Innovation and knowledge-intensive service activities, OECD 2006
KUUSISTO (J.), KOTALA (S.), 2007, “Mapping Innovation Policy in Services: Country report – Finland” Research performed for Innovation Policy Project in Services – IPPS 2006 – 2007
LUUKKONEN (T.), 2000, “Additionality of EU Framework Programmes”, Research Policy, 29
MCCLAVE (J.T.), SINCICH (T.), 2003, Statistics, 9th edition, New Jersey, Prentice-Hall, Inc
METCALFE (J.S.), MILES (I.) (eds.), 2001, Innovation systems in the service economy: Measurement and case study analysis, Kluwer academic publishers, London.
PEKKANEN (J.), RIIPINEN (T.), LEMINEN (S.), 2004, Innovaatio investointina, osa 2: Tekesin rahoituksen vaikutukset yritysten t&k-toimintaan –kyselytutkimuksen tulokset, Tekesin teknologiakatsaus 161/2004, Helsinki 2004
PESONEN (P.), 2003, “Analysis of the Ex-Post Project Monitoring at Tekes”, Fteval platform: Forschungs- und Technologieevaluierung, nro 19, May 2003
SIEGEL (S.), CASTELLAN (N.J.Jr.), 1989, Nonparametric statistics for the behavioral sciences, Singapore, McGraw-Hill Book Co