Fully Funded Pensions - Marquette Law Scholarly Commons
109
Marquette Law Review Marquette Law Review Volume 103 Issue 4 Summer 2020 Article 3 2020 Fully Funded Pensions Fully Funded Pensions Jonathan Barry Forman Follow this and additional works at: https://scholarship.law.marquette.edu/mulr Part of the Labor and Employment Law Commons, Law and Economics Commons, Legislation Commons, and the Social Welfare Law Commons Repository Citation Repository Citation Jonathan Barry Forman, Fully Funded Pensions, 103 Marq. L. Rev. 1205 (2020). Available at: https://scholarship.law.marquette.edu/mulr/vol103/iss4/3 This Article is brought to you for free and open access by the Journals at Marquette Law Scholarly Commons. It has been accepted for inclusion in Marquette Law Review by an authorized editor of Marquette Law Scholarly Commons. For more information, please contact [email protected].
-
Upload
khangminh22 -
Category
Documents
-
view
4 -
download
0
Transcript of Fully Funded Pensions - Marquette Law Scholarly Commons
Marquette Law Review Marquette Law Review
Volume 103 Issue 4 Summer 2020 Article 3
2020
Fully Funded Pensions Fully Funded Pensions
Jonathan Barry Forman
Follow this and additional works at: https://scholarship.law.marquette.edu/mulr
Part of the Labor and Employment Law Commons, Law and Economics Commons, Legislation
Commons, and the Social Welfare Law Commons
Repository Citation Repository Citation Jonathan Barry Forman, Fully Funded Pensions, 103 Marq. L. Rev. 1205 (2020). Available at: https://scholarship.law.marquette.edu/mulr/vol103/iss4/3
This Article is brought to you for free and open access by the Journals at Marquette Law Scholarly Commons. It has been accepted for inclusion in Marquette Law Review by an authorized editor of Marquette Law Scholarly Commons. For more information, please contact [email protected].
FORMAN_22MAY20.DOCX (DO NOT DELETE) 6/30/2020 12:11 PM
MARQUETTE LAW REVIEW Volume 103 Summer 2020 Number 4
FULLY FUNDED PENSIONS
JONATHAN BARRY FORMAN*
At retirement, workers want to have enough income to support themselves throughout their retirement years. In that regard, financial planners often suggest that retiring workers should aim to replace 70 to 80% of their annual preretirement earnings. Social Security benefits typically replace around 35% of the typical worker’s preretirement earnings, and the purpose of this Article is to show how pensions could and should be designed to replace, say, 40% of the typical worker’s preretirement earnings throughout her retirement years. In particular, because so many public and private pension plans are underfunded, this Article focuses on how to fully fund those pensions.
At the outset, Part II provides an overview of Social Security, pensions, annuities, and other lifetime income mechanisms. In particular, Part II explains how Social Security works, how traditional pensions work, and how newer 401(k) plans and individual retirement accounts (IRAs) work.
* Kenneth E. McAfee Centennial Chair in Law, University of Oklahoma; B.A. (Psychology)
1973, Northwestern University; M.A. (Psychology) 1975, University of Iowa; J.D. 1978, University of Michigan; M.A. (Economics) 1983, George Washington University. Professor in Residence at the Internal Revenue Service Office of Chief Counsel, Washington, D.C. for the 2009−2010 academic year. Member of the Board of Trustees of the Oklahoma Public Employees Retirement System, 2003−2011. Copyright © 2020, Jonathan Barry Forman. Thanks to Magali Barbieri, Jennifer Brown, Robert L. Brown, Clay Cprek, Kent Cprek, Michael Doran, Irena Dushi, Israel Goldowitz, Barry Kozak, Steve McElhaney, Amy B. Monahan, Michael J. Sabin, and Jordan Wybrant. Thanks also to the participants at a panel on Pensions and Longevity Risk, the Society of Actuaries’ 2020 Living to 100 Symposium, Orlando, FL, Jan. 14, 2020; a panel on Reaching Wellbeing: The Role of Employers and Government, Section on Employee Benefits and Executive Compensation, Annual Meeting of the Association of American Law Schools, Washington, DC, Jan. 2, 2020; the Wagner Law Group, Washington, DC, May 31, 2019; the Law and Society Association, Annual Meeting, Washington, DC, May 30, 2019; and the Eighth Annual Employee Benefits & Social Insurance Conference, Champaign, IL, Mar. 29, 2019. The coronavirus epidemic struck in the midst of the editorial process, and, in general, the author has not updated this Article to reflect any legislative changes that occurred after December 31, 2019 (or to take into account revised data or projections that became available after that date [e.g., increased pension underfunding that may have resulted from the decline in stock prices]).
FORMAN_22MAY20.DOCX (DO NOT DELETE) 6/30/2020 12:11 PM
1206 MARQUETTE LAW REVIEW [103:1205
Part III then focuses on funding issues for Social Security and pensions. In particular, Part III shows that the Social Security system is currently underfunded by at least $13.9 trillion, that state and local government pension plans are currently underfunded by at least $4.7 trillion, that the U.S. government’s civilian pensions are currently underfunded by at least $968 billion, and that the U.S. government’s military pensions are currently underfunded by at least $768 billion. Part III also shows that private-sector pensions are also severely underfunded. In that regard, traditional defined benefit pensions are currently underfunded by at least $553 billion. Moreover, Part III shows that most workers with 401(k) plans or individual retirement accounts (IRAs) are not saving anywhere near enough to have pensions that could replace 40% of their preretirement income; indeed, many workers have no retirement savings of any kind.
Part IV then looks at some basic compound-interest and pension mathematics, and Part V explains pension benefit accrual and funding in traditional defined benefit plans. First, Section V.A develops a model, traditional defined benefit plan; and Section V.B then shows how that model defined benefit plan could provide a typical retiree with a pension that would replace 40% of her preretirement earnings. Section V.C then uses that model defined benefit plan to explain and compare the various mechanisms that are currently used to fund such traditional pensions, including everything from the pay-as-you-go method to the principal actuarial cost methods that are used to prefund those traditional pensions.
Part VI then looks at benefit accrual and funding in defined contribution plans (and IRAs). Part VI develops two alternative model defined contribution plans that could replace 40% of a typical worker’s preretirement earnings. For these model plans, the idea is for the worker to save enough money in her individual account by age 65 so that she could then buy a lifetime annuity that would replace 40% of her preretirement earnings.
Part VII then expands the defined benefit and individual account models to address some of the most important problems of providing pensions in the real world, including, for example, the problem of postretirement inflation. Part VIII then offers some recommendations about how to redesign—and fully fund—Social Security and real-world defined benefit plans, defined contribution plans, and IRAs; and, finally, Part IX offers some concluding remarks.
FORMAN_22MAY20.DOCX (DO NOT DELETE) 6/30/2020 12:11 PM
2020] FULLY FUNDED PENSIONS 1207
I. INTRODUCTION ........................................................................................ 1209 II. AN OVERVIEW OF SOCIAL SECURITY, PENSIONS, AND OTHER LIFETIME INCOME MECHANISMS ........................................................ 1214
A. Social Security ........................................................................... 1214 1. An Overview of the Social Security System ........................ 1214 2. The Adequacy of Social Security Benefits .......................... 1217
B. Pension Plans and Individual Retirement Accounts ................... 1218 1. Pensions ............................................................................... 1218
a. Defined Benefit Plans ..................................................... 1220 b. Defined Contribution Plans ............................................ 1221 c. Hybrid Retirement Plans ................................................ 1223
2. Individual Retirement Accounts .......................................... 1224 3. Pension Coverage and Participation .................................... 1224
C. Annuities and Other Sources of Lifetime Income ...................... 1225 III. FUNDING ISSUES FOR SOCIAL SECURITY AND PENSIONS ..................... 1228
A. Retirement Savings Targets ....................................................... 1228 B. Fully Funded Pensions ............................................................... 1231 C. Social Security is Funded on a Pay-as-You-Go Basis ............... 1232 D. Many Pension Plans Are Underfunded ...................................... 1233
1. Defined Contribution Plans (and IRAs) ............................... 1233 2. Defined Benefit Plans .......................................................... 1234
a. Private-Sector Defined Benefit Plans ............................. 1235 i. Single-employer Plans .............................................. 1235 ii. Multiemployer Plans ............................................... 1236
b. Government Defined Benefit Plans ............................... 1237 IV. SOME BASIC PENSION ECONOMICS AND MATHEMATICS .................... 1238
A. Simple Present-Value and Future-Value Mathematics .............. 1238 B. The Mathematics of Converting a Lump Sum into an Annuity (and Vice Versa) ....................................................................... 1240
V. BENEFIT ACCRUAL AND FUNDING TRADITIONAL DEFINED BENEFIT PLANS .................................................................................................. 1242
A. The Model Defined Benefit Plan ............................................... 1242 1. Economic Assumptions ........................................................ 1244
a. Interest (Discount) Rate—5% ........................................ 1244 b. Inflation Rate—2.5% ..................................................... 1245 c. Salary Growth Rate—3.5% a Year ................................ 1245
2. Worker Assumptions ............................................................ 1245 a. Entry Age—25, Retirement Age 65, and a 40-year Career (from age 25 through age 64) ............................ 1245 b. Mortality Assumptions—A 20-year Retirement and Death at Age 85 ............................................................. 1248
FORMAN_22MAY20.DOCX (DO NOT DELETE) 6/30/2020 12:11 PM
1208 MARQUETTE LAW REVIEW [103:1205
c. Final Salary—$100,000 Leads to Starting Salary Around $26,000 ............................................................ 1249
3. Plan Design Assumptions .................................................... 1250 a. Benefit Based on Final Pay Rather than Final Average Pay ................................................................................ 1250 b. Annual Benefit Accrual Rate—1% ................................ 1250 c. Vesting Period—Immediate Vesting ............................. 1251 d. Benefit Form—A Fixed, Single-life Annuity ................ 1251 e. Annuity Factor—10........................................................ 1251
B. Benefit Accrual in the Model Defined Benefit Plan .................. 1252 C. Funding Methods for Traditional Defined Benefit Plans ........... 1258
1. The Unfunded Method: Pay as You Go (PAYG) ................ 1259 2. Prefunding Methods ............................................................. 1261
a. An Overview of Prefunding Methods ............................ 1262 b. The Traditional Unit Credit (TUC) Method .................. 1263 c. The Projected Unit Credit (PUC) Method ...................... 1268 d. The Entry Age Normal Cost Method ............................. 1272
i. The Entry Age Normal Cost Level-Dollar Method .. 1273 ii. The Entry Age Normal Cost Level-Percentage-of-
Salary Method ........................................................ 1275 iii. State and Local Pension Plans Now Use the Entry Age Normal Cost Method for Financial Reporting ............................................................... 1277
e. Comparing the Various Prefunding Methods as a Percentage of Current Salary ........................................ 1278
VI. BENEFIT ACCRUAL AND FUNDING FOR DEFINED CONTRIBUTION PLANS ................................................................................................. 1280
A. A Level-Percentage-of-Salary Model Defined Contribution Plan .................................................................................................. 1282
B. A Level-Dollar Model Defined Contribution Plan ..................... 1285 VII. BRINGING IN SOME REAL-WORLD CONSIDERATIONS ........................ 1287
A. Underfunding in the Real World ................................................ 1287 B. Cost-of-Living Adjustments (COLAs) ....................................... 1290
1. How Will Post-Retirement Inflation Affect a Level-Dollar Pension? .............................................................................. 1290
2. How Can a Cost-of-Living Adjustment (COLA) Maintain the Real Value of a Pension? .............................................. 1292 3. How Much Should Be Saved to Pay for that COLA? .......... 1292
C. Working Careers and Benefit Accumulation in the Real World ........................................................................................ 1293
1. Work Patterns in the Real World ......................................... 1294
FORMAN_22MAY20.DOCX (DO NOT DELETE) 6/30/2020 12:11 PM
2020] FULLY FUNDED PENSIONS 1209
2. The Current Pension System Does Not Provide for Universal Participation and Coverage ................................. 1295 3. Workers Do Not Always Accrue Significant Benefits on Every Job ............................................................................. 1295 4. Workers Do Not Always Vest in Their Accrued Benefits ... 1297 5. Retirees Do Not Always Annuitize Their Retirement Savings ................................................................................. 1298
D. Social Security Replacement Rates Vary with Lifetime Income ........................................................................................ 1298 E. Spousal Issues ............................................................................. 1301 F. Variability in Economic and Demographic Variables ................ 1303
VIII. OPTIONS FOR REFORM ....................................................................... 1305 A. Fully Fund Social Security ......................................................... 1305 B. Fully Fund Pensions for Virtually All Workers ......................... 1306
1. A Universal Pension System ................................................ 1307 2. Strengthening the Current Pension System .......................... 1310
IX. CONCLUSION ........................................................................................ 1311
I. INTRODUCTION At retirement, workers want to have enough income to support themselves
throughout their retirement years. In that regard, financial planners often suggest that retiring workers should aim to replace 70 to 80% of their annual preretirement earnings.1 Social Security benefits typically replace around 35% of the typical worker’s preretirement earnings.2 That leaves another 35 to 45%
1. Robert C. Lawton, This Is How Much Money You Need To Retire, FORBES (Aug. 26, 2018), https://www.forbes.com/sites/robertlawton/2018/08/26/this-is-how-much-money-you-need-to-retire/#7 299d62947cf [https://perma.cc/C2RE-A3WF] (cross-referencing a number of retirement savings targets). See infra Section III.A.
2. NAT’L ACAD. OF SOC. INS., SOCIAL SECURITY BENEFITS, FINANCES, AND POLICY OPTIONS: A PRIMER 6 (2019), https://www.nasi.org/sites/default/files/research/2019_Social_Security_Primer.pdf [https://perma.cc/H5SF-NBV9] (showing that the current Social Security system replaces 40% of the preretirement earnings of a worker with “medium” earnings); see also MICHAEL CLINGMAN, KYLE BURKHALTER, & CHRIS CHAPLAIN, OFFICE OF THE CHIEF ACTUARY, SOC. SEC. ADMIN., ACTUARIAL NOTE NO. 2019.9, REPLACEMENT RATES FOR HYPOTHETICAL RETIRED WORKERS 3–4 tbl.A (2019), https://www.ssa.gov/oact/NOTES/ran9/an2019-9.pdf [https://perma.cc/GW7N-M97F] (showing how replacement rates vary with preretirement earnings); CONG. BUDGET OFFICE, CBO’S 2019 LONG-TERM PROJECTIONS FOR SOCIAL SECURITY: ADDITIONAL INFORMATION tbl.B-8 (2019) [hereinafter CBO’S 2019 LONG-TERM PROJECTIONS], https://www.cbo.gov/system/files/2019-09/55590-CBO-longterm-projections-social-security.xlsx [https://perma.cc/CNB9-WXYX] (showing how replacement rates vary with preretirement earnings); PETER BRADY, KIMBERLY BURHAM, & SARAH
FORMAN_22MAY20.DOCX (DO NOT DELETE) 6/30/2020 12:11 PM
1210 MARQUETTE LAW REVIEW [103:1205
of preretirement earnings that needs to be financed through pensions and other savings. Other than home equity, most retirees have little in the way of other savings,3 and most retirees are reluctant to sell (or reverse mortgage) their homes to come up with extra retirement income—until they have to.4 Accordingly, this Article focuses quite simply on how pensions alone could and should be designed to replace, say, 40% of the typical worker’s preretirement earnings throughout her retirement years.5 In particular, this Article is concerned with how to fully fund those pensions. HOLDEN, INV. CO. INST., THE SUCCESS OF THE U.S. RETIREMENT SYSTEM 17−20 (2012), https://www.ici.org/pdf/ppr_12_success_retirement.pdf [https://perma.cc/K5A4-98UL] (showing how replacement rates vary with preretirement earnings).
3. See JOINT COMM. ON TAXATION, JCX-4-19, BACKGROUND DATA RELATING TO RETIREMENT INCOME 15−16 (2019), [hereinafter JCT, BACKGROUND DATA RELATING TO RETIREMENT INCOME], https://www.jct.gov/publications.html?func=download&id=5160&chk=5160&no_html=1 [https://perma.cc/F3FS-ZTV4] (showing how few elderly Americans have interest or dividend income); U.S. GOV’T ACCOUNTABILITY OFFICE, THE NATION’S RETIREMENT SYSTEM: A COMPREHENSIVE RE-EVALUATION IS NEEDED TO BETTER PROMOTE FUTURE RETIREMENT SECURITY 22 fig.2-1 (2017) [hereinafter GAO, THE NATION’S RETIREMENT SYSTEM], https://www.gao.gov/assets/690/687797.pdf [https://perma.cc/YMX4-JFGW] (showing that only 9% of the income of the elderly in 2015 came from home equity and non-retirement savings and investments).
4. See KARAN KAUL & LAURIE GOODMAN, URBAN INST., SENIORS’ ACCESS TO HOME EQUITY: IDENTIFYING EXISTING MECHANISMS AND IMPEDIMENTS TO BROADER ADOPTION 8 (2017), https://www.urban.org/sites/default/files/publication/88556/seniors_access_to_home_equity.pdf [https://perma.cc/9V43-9PH7].
5. To be sure, individuals can save for retirement outside of pensions, and some do. See infra note 39 and accompanying text. Of course, most individuals will want to take advantage of the tax benefits associated with pensions. See infra Section II.B. Accordingly, this Article makes the simplifying (and heroic) assumption that all retirement savings will take place in tax-favored pensions; but, of course, readers should understand that free-standing savings could easily serve as a substitute for pension savings. The focus of this Article is really on how much individuals need to save for retirement, and, for simplicity, the Article assumes that all of those savings will be held in tax-favored pensions.
Although programs like Medicare, Medicaid, and veterans’ benefits can be quite important for retirement income security, they are not addressed in this Article. See generally COMM. ON WAYS AND MEANS, U.S. HOUSE OF REPRESENTATIVES, GREEN BOOK: BACKGROUND MATERIAL AND DATA ON THE PROGRAMS WITHIN THE JURISDICTION OF THE COMMITTEE ON WAYS AND MEANS ch.2 (2018) [hereinafter WAYS AND MEANS COMMITTEE, GREEN BOOK], https://greenbook-waysandmeans.house.gov/2018-green-book [https://perma.cc/2HCL-MN4G]; Medicaid, MEDICAID.GOV, https://www.medicaid.gov/medicaid/index.html [https://perma.cc/J2CS-CUNC]; About VA Health Benefits, U.S. DEP’T OF VETERANS AFFAIRS, https://www.va.gov/health-care/about-va-health-benefits/ [https://perma.cc/L5F9-TJXQ].
Finally, while this Article has selected a 40% target replacement rate for pensions, the methodology used here means that proportionally larger or smaller replacement rates would result from proportionately larger or smaller plan contributions.
FORMAN_22MAY20.DOCX (DO NOT DELETE) 6/30/2020 12:11 PM
2020] FULLY FUNDED PENSIONS 1211
The term “pensions” is used here in its broadest sense to encompass both traditional monthly pensions and also newer types of pension plans such as 401(k) plans and even individual retirement accounts (IRAs).6 Pension plans generally fall into two broad categories based on the nature of the benefits provided: defined benefit plans and defined contribution plans. In a defined benefit plan, an employer promises workers a specific benefit at retirement.7 The default benefit for defined benefit plans is a retirement income stream in the form of an annuity for life (e.g., a monthly pension).8 For example, some defined benefit plans provide workers with an annual retirement benefit (B) equal to 2% times years of service (yos) times final average pay (fap) (B = 2% × yos × fap).9 Under that final-average-pay plan, a worker who retires after 30 years of service with final average pay of $100,000 would receive a pension of $60,000 a year for life ($60,000 = 2% × 30 yos × $100,000 fap).
To be sure, such generous traditional pension plans are uncommon today.10 Among other things, increased longevity has made such traditional pensions
6. See I.R.C. § 401(k) (2018). 7. See JOINT COMM. ON TAXATION, JCX-20-19, PRESENT LAW AND BACKGROUND RELATING
TO CHALLENGES IN THE RETIREMENT SYSTEM 9−10 (2019) [hereinafter JCT, PRESENT LAW AND BACKGROUND], https://www.jct.gov/publications.html?func=download&id=5186&chk=5186&no_html=1 [https://perma.cc/4KAV-M9UP].
8. In the United States, defined benefit plans are generally designed to provide annuities, i.e., “definitely determinable benefits . . . over a period of years, usually for life, after retirement.” 26 C.F.R. § 1.401-1(b)(1)(i) (2003).
9. For example, 2% is a common benefit accrual rate in many traditional state and local pension plans. See BUREAU OF LABOR STATISTICS, U.S. DEP’T OF LABOR, BULL. 2786, NATIONAL COMPENSATION SURVEY: RETIREMENT PLAN PROVISIONS IN STATE AND LOCAL GOVERNMENT IN THE UNITED STATES, 2016 tbl.12 (2017) [hereinafter NATIONAL COMPENSATION SURVEY, 2016], https://www.bls.gov/ncs/ebs/detailedprovisions/2016/ownership/govt/ebbl0060.pdf [https://perma.cc/LJE6-U9AQ]; Natalie Kramer & Jesus Ranon-Hernandez, State and Local Government Workers Preparing for Retirement: Do You Understand Your Plan Formula?, BEYOND THE NUMBERS, May 2018, at 1, 2.
In 2017, 63% of workers in private industry defined benefit plans were in plans with traditional plan formulas—with 32% using this type of final-average-pay formula. BUREAU OF LABOR STATISTICS, U.S. DEP’T OF LABOR, BULL. 2788, NATIONAL COMPENSATION SURVEY: HEALTH AND RETIREMENT PLAN PROVISIONS IN PRIVATE INDUSTRY IN THE UNITED STATES, 2017 tbl.10 (2018) [hereinafter NATIONAL COMPENSATION SURVEY, 2017], https://www.bls.gov/ncs/ebs/detailedprovisions/2017/ownership/private/health-retirement-private-benefits-2017.pdf [https://perma.cc/5S5C-HQ3U]. Of those plans using a final-average-pay-formula, the median annual benefit accrual rate was 1.60%. Id. at tbl.12.
10. See JOINT COMM. ON TAXATION, JCX-3-16, PRESENT LAW AND BACKGROUND RELATING TO TAX-FAVORED RETIREMENT SAVING AND CERTAIN RELATED LEGISLATIVE PROPOSALS 56, 57, 57 fig.2 (2016), https://www.jct.gov/publications.html?func=download&id=4865&chk=4865&no_html=1
FORMAN_22MAY20.DOCX (DO NOT DELETE) 6/30/2020 12:11 PM
1212 MARQUETTE LAW REVIEW [103:1205
more expensive.11 Still, the traditional defined benefit plan approach is a very useful way to think about providing workers with adequate incomes throughout their retirement years. Accordingly, this Article initially develops a simplified model defined benefit plan. More specifically, this Article’s model defined benefit plan would provide retired workers with a pension benefit equal to 1% times years of service times final pay (fp).12 Under that plan, a typical worker with 40 years of service—say from age 25 through age 64—would end up with a pension starting at age 65 equal to 40% of her preretirement earnings. For example, if a worker has final pay of $100,000, she would be entitled to a pension of $40,000 a year for life ($40,000 B = 1% × 40 yos × $100,000 fp).
Alternatively, in a typical defined contribution plan, the employer simply withholds a specified percentage of the worker’s compensation, which it
[https://perma.cc/G5BZ-YBMC]; see generally GEORGE A. MACKENZIE, THE DECLINE OF THE TRADITIONAL PENSION: A COMPARATIVE STUDY OF THREATS TO RETIREMENT SECURITY (2010); EDWARD A. ZELINSKY, THE ORIGINS OF THE OWNERSHIP SOCIETY: HOW THE DEFINED CONTRIBUTION PARADIGM CHANGED AMERICA (2007); William J. Wiatrowski, Changing Landscape of Employment-based Retirement Benefits, COMPENSATION & WORKING CONDITIONS ONLINE (Sept. 29, 2011), https://www.bls.gov/opub/mlr/cwc/changing-landscape-of-employment-based-retirement-benefits.pdf [https://perma.cc/H5LK-GWCS].
11. These days, a 65-year-old man can expect to live, on average, until age 84, and a 65-year-old woman can expect to live, on average, until age 86.5. Benefits Planner/Life Expectancy, SOC. SECURITY ADMIN., https://www.ssa.gov/planners/lifeexpectancy.html [https://perma.cc/G7EF-WCTG] [hereinafter SSA, Benefits Planner]. The joint life expectancy of a 65-year-old couple is even more remarkable. For example, there is a 50% chance that at least one 65-year-old spouse in a nonsmoking heterosexual couple in average health will live 27 years to age 92, a 25% chance that at least one will live 31 years to age 96, and a 10% chance that at least one will live 35 years to age 100. Calculations are from the Actuaries Longevity Illustrator, SOC’Y ACTUARIES & AM. ACAD. ACTUARIES, http://www.longevityillustrator.org/ [https://perma.cc/QFK6-85GB] (follow the “Get Started” hyperlink; Person 1 [Name: Man; Date of Birth: 12/17/1954; Age for Illustration to Start: 65; Gender: Male; Do you smoke?: No; General Health: Average]; Person 2 [Name: Woman; Date of Birth: 12/17/1954; Gender: Female; Do you smoke?: No; General Health: Average]; then select “View Results”); see also BD. OF TRS. OF THE FED. OLD-AGE AND SURVIVORS INS. AND FED. DISABILITY INS. TR. FUNDS, THE 2019 ANNUAL REPORT OF THE BOARD OF TRUSTEES OF THE FEDERAL OLD-AGE AND SURVIVORS INSURANCE AND FEDERAL DISABILITY INSURANCE TRUST FUNDS 95 tbl.V.A4 (2019), https://www.ssa.gov/OACT/TR/2019/tr2019.pdf [https://perma.cc/ER4T-SDUP] [hereinafter 2019 SOCIAL SECURITY TRUSTEES REPORT] (showing period life expectancies for men and women at birth and at age 65 from 1940 through 2095); SOC’Y OF ACTUARIES, LIFE EXPECTANCY IN 2019, at 1–3 [hereinafter LIFE EXPECTANCY IN 2019], https://www.soa.org/globalassets/assets/files/resources/research-report/2019/life-expectancy.pdf [https://perma.cc/FT36-ZZ3E] (showing life expectancies at ages 25 and 65 from a variety of sources). In short, many individuals and couples will need to plan for the possibility of retirements that can last for 30 years or more.
12. As more fully explained in Section V.A.3 infra, final pay is a simpler variable to model than final average pay.
FORMAN_22MAY20.DOCX (DO NOT DELETE) 6/30/2020 12:11 PM
2020] FULLY FUNDED PENSIONS 1213
contributes to an individual account for that worker.13 For example, contributions might be set at 5% of annual compensation. Under such a plan, a worker who earned $50,000 in a given year would have $2,500 contributed to her individual account ($2,500 = 5% × $50,000). Her benefit at retirement would be based on all such contributions plus investment earnings. Unlike defined benefit plans, defined contribution plans usually make distributions as lump sum or periodic distributions rather than as lifetime annuities.14 Of course, a retiree can use the balance in her defined contribution plan (or, alternatively, in her IRA) to buy an annuity. For example, consider a worker who retires after 40 years of service with a final salary of $100,000. To replace 40% of her preretirement earnings, she would need to accumulate enough in her individual account to be able to buy an annuity that would pay her $40,000 a year for life.
In short, both defined benefit plans and defined contribution plans could be designed to replace 40% of a worker’s preretirement earnings. In the real world, however, relatively few retirees will actually collect pension benefits that equal or exceed 40% of their preretirement earnings. At the outset, many workers are not even covered by pension plans of any kind. For example, in March of 2019, just 71% of private-sector workers had access to an employer-sponsored pension plan, and just 56% participated.15 However, even if a worker is covered by a pension of some kind, that worker may not end up with pension income that will replace 40% of her preretirement earnings; many pension plans are just not funded that well. All in all, providing adequate pensions is largely a problem of inadequate funding. Defined benefit plans or defined contribution plans could provide meaningful lifetime incomes for retirees, but contributions must be made at a high enough level to achieve that result.
The purpose of this Article is to show how to provide workers with fully funded pensions that would replace 40% of their preretirement earnings. At the outset, Part II provides an overview of Social Security, pensions, annuities, and
13. JCT, PRESENT LAW AND BACKGROUND, supra note 7, at 9. 14. See WILLIS TOWERS WATSON, INTERNATIONAL PENSION PLAN SURVEY REPORT 2019, at
3, 17 (2019), https://www.willistowerswatson.com/en-US/Insights/2020/01/2019-international-pension-plan [https://perma.cc/34MZ-55T6] (indicating that lump sum distributions “continue to be the most popular form of distribution” for defined contribution plans).
15. BUREAU OF LABOR STATISTICS, U.S. DEP’T OF LABOR, BULL. 2791, NATIONAL COMPENSATION SURVEY: EMPLOYEE BENEFITS IN THE UNITED STATES, MARCH 2019, at 3 tbl.2 (2019) [hereinafter NATIONAL COMPENSATION SURVEY, 2019], https://www.bls.gov/ncs/ebs/benefits/2019/employee-benefits-in-the-united-states-march-2019.pdf [https://perma.cc/WE9B-K559]; see generally Peter J. Brady & Steven Bass, Who Participates in Retirement Plans, 2016, INV. CO. INST., Aug. 2019, at 1, 17 fig.9.
FORMAN_22MAY20.DOCX (DO NOT DELETE) 6/30/2020 12:11 PM
1214 MARQUETTE LAW REVIEW [103:1205
other lifetime income mechanisms; Part III focuses on funding issues for Social Security and pensions; and Part IV looks at some basic pension mathematics.
Part V then explains pension benefit accrual and funding in defined benefit plans. First, Section V.A develops a model, traditional defined benefit plan; and Section V.B then shows how that model defined benefit plan could provide a typical retiree with a pension that would replace 40% of her preretirement earnings. Section V.C then uses that model defined benefit plan to explain and compare the various mechanisms that are currently used to fund such traditional pensions, including everything from the pay-as-you-go method to the principal actuarial cost methods that are used to prefund those traditional pensions.
Part VI then looks at benefit accrual and funding in defined contribution plans. Part VI develops two alternative model defined contribution plans that could replace 40% of a typical worker’s preretirement earnings. For these model defined contribution plans, the idea is for the worker to save enough money in her individual account by age 65 so that she could then buy a lifetime annuity that would replace 40% of her preretirement earnings.
Part VII then expands the defined benefit and defined contribution models to take into account some of the most important problems of providing pensions in the real world. Then, Part VIII offers some recommendations about how to redesign—and fully fund—Social Security and real-world defined benefit and defined contribution plans; and, finally, Part IX offers some concluding remarks.
II. AN OVERVIEW OF SOCIAL SECURITY, PENSIONS, AND OTHER LIFETIME INCOME MECHANISMS
Retirees can generally count on Social Security benefits to cover a significant portion of their retirement income needs. In addition, retirees use pensions, annuities, and a variety of other mechanisms to generate income in their retirement years. These are discussed in turn.
A. Social Security
1. An Overview of the Social Security System Social Security provides monthly cash benefits to retirees and their
families.16 A worker builds Social Security protection by working in employment that is covered by Social Security and paying the applicable
16. WAYS AND MEANS COMMITTEE, GREEN BOOK, supra note 5, at ch. 1.
FORMAN_22MAY20.DOCX (DO NOT DELETE) 6/30/2020 12:11 PM
2020] FULLY FUNDED PENSIONS 1215
payroll taxes.17 At retirement, disability, or death, monthly benefits are paid to insured workers and to their eligible dependents and survivors. While full retirement age was once age 65, it is currently age 66, and it is gradually increasing to age 67 for workers born after 1959 (who reach age 67 in or after 2027).18 In January of 2019, Social Security paid retirement benefits to almost 43.9 million retired workers, and the average monthly benefit paid to a retired worker was $1,463.97.19
Social Security retirement benefits are financed primarily through payroll taxes imposed on individuals working in employment or self-employment that is covered by the Social Security system.20 Workers over the age of 62 generally are entitled to Social Security retirement benefits if they have worked in covered employment for at least 10 years.21 Benefits are based on a measure of the worker’s earnings history in covered employment.22 The benefit formula is highly progressive,23 and, as a result, the Social Security benefits tend to favor
17. Around 94% of workers in paid employment or self-employment are covered by Social Security (around 175.3 million workers in 2018). SOC. SEC. ADMIN., 2019 SOCIAL SECURITY/SSI/MEDICARE INFORMATION 1 (2019), https://www.ssa.gov/legislation/2019%20Fact%20Sheet.pdf [https://perma.cc/8QU6-SCCY]. For various historical reasons, Social Security does not cover about one-fourth of public employees (i.e., certain state and local government workers and certain federal civilian workers that were hired before 1984). U.S. GOV’T ACCOUNTABILITY OFFICE, GAO-05-786T, SOCIAL SECURITY: COVERAGE OF PUBLIC EMPLOYEES AND IMPLICATIONS FOR REFORM 3 (2005), https://www.gao.gov/assets/120/111755.pdf [https://perma.cc/UEA4-VD3Q]; see also WILLIAM G. GALE, SARAH E. HOLMES, & DAVID C. JOHN, SOCIAL SECURITY COVERAGE FOR STATE AND LOCAL GOVERNMENT WORKERS: A RECONSIDERATION 123 (2015), https://www.brookings.edu/wp-content/uploads/2016/06/Download-the-paper-5.pdf [https://perma.cc/SSV6-LVAK].
18. Retirement Benefits Planner: Full Retirement Age, SOC. SECURITY ADMIN., http://www.socialsecurity.gov/retire2/retirechart.htm [https://perma.cc/4827-GV49] [hereinafter Retirement Benefits Planner].
19. SOC. SEC. ADMIN., MONTHLY STATISTICAL SNAPSHOT, JANUARY 2019, at tbl.2 (2019) [hereinafter MONTHLY STATISTICAL SNAPSHOT], https://www.ssa.gov/policy/docs/quickfacts/stat_snapshot/2019-01.pdf [https://perma.cc/XVM7-HG5W].
20. For 2020, employees and employers each pay a Social Security payroll tax of 6.2% on up to $137,700 of wages, for a combined Old-Age and Survivors and Disability Insurance (OASDI) rate of 12.4%. SOC. SEC. ADMIN., 2020 SOCIAL SECURITY CHANGES [hereinafter 2020 SOCIAL SECURITY CHANGES], https://www.ssa.gov/news/press/factsheets/colafacts2020.pdf [https://perma.cc/3NMZ-26VG]. Self-employed workers pay an equivalent OASDI tax of 12.4% on up to $137,700 of net earnings. Id.
21. 42 U.S.C. §§ 402(a), 414(a)(2) (2018). 22. Social Security Benefit Amounts, SOC. SECURITY ADMIN.,
http://www.ssa.gov/oact/cola/Benefits.html [https://perma.cc/P9S3-QREW]. 23. Benefits for retired workers are based on a measure of the worker’s earnings history in
covered employment known as the average indexed monthly earnings (AIME). Id.; Benefit
FORMAN_22MAY20.DOCX (DO NOT DELETE) 6/30/2020 12:11 PM
1216 MARQUETTE LAW REVIEW [103:1205
workers with low lifetime earnings relative to workers with higher lifetime earnings.24 These redistributive Social Security retirement benefits play an important role in reducing poverty among the elderly.25
Benefits may be increased or decreased for several reasons. Most importantly, benefits are indexed each year for inflation as measured by the consumer price index.26 Also, the retirement earnings test can reduce the monthly benefits of individuals who have not yet reached full retirement age but who continue to work after starting to draw Social Security retirement benefits.27
In addition, workers who retire before their full retirement age have their benefits actuarially reduced.28 On the other hand, benefits payable to workers who choose to retire after their full retirement age are actuarially increased (but Calculation Examples for Workers Retiring In 2020, SOC. SECURITY ADMIN., https://www.ssa.gov/oact/ProgData/retirebenefit1.html [https://perma.cc/MHZ6-EHVN]. The starting point for determining the worker’s AIME is to determine how much the worker earned each year through age 60. Once those benefit computation years and covered earnings for those years have been identified, the worker’s earnings are indexed for wage inflation, using the year the worker turns age 60 to index the earnings of prior years. The highest 35 years of earnings are then selected, and the other years are dropped out. The AIME is then computed as the average earnings for the remaining 35 years (420 months). The AIME is then linked by a progressive formula to the monthly retirement benefit payable to the worker at full retirement age, a benefit known as the primary insurance amount (PIA). For a worker turning 62 in 2020, the PIA equals 90% of the first $960 of the worker’s AIME, plus 32% of the AIME over $960 and through $5,785 (if any), plus 15% of the AIME over $5,785 (if any). Social Security Benefit Amounts, supra note 22; Primary Insurance Amount, SOC. SECURITY ADMIN., http://www.ssa.gov/oact/cola/piaformula.html [https://perma.cc/JAQ4-BY2B].
24. MICHAEL CLINGMAN, KYLE BURKHALTER, & CHRIS CHAPLAIN, OFFICE OF THE CHIEF ACTUARY, SOC. SEC. ADMIN., ACTUARIAL NOTE NO. 2018.7, MONEY’S WORTH RATIOS UNDER THE OASDI PROGRAM FOR HYPOTHETICAL WORKERS (2019), https://www.ssa.gov/oact/NOTES/ran7/an2018-7.pdf [https://perma.cc/T4L8-YV5A] (showing money’s worth ratios for various hypothetical workers).
25. KATHLEEN ROMIG, CTR. ON BUDGET & POLICY PRIORITIES, SOCIAL SECURITY LIFTS MORE AMERICANS ABOVE POVERTY THAN ANY OTHER PROGRAM 1 (2019), https://www.cbpp.org/research/social-security/social-security-lifts-more-americans-above-poverty-than-any-other-program [https://perma.cc/ZPF9-Y44A] (“Social Security lifts 15 million elderly Americans out of poverty.”); see also Bruce D. Meyer & Derek Wu, The Poverty Reduction of Social Security and Means-Tested Transfers passim (Nat’l Bureau of Econ. Research, Working Paper No. 24567, 2018), https://www.nber.org/papers/w24567.pdf [https://perma.cc/7TGX-3HJ4]; LIANA FOX, U.S. CENSUS BUREAU, P60-265, THE SUPPLEMENTAL POVERTY MEASURE: 2017, at 10 fig.8 (2018), https://www.census.gov/content/dam/Census/library/publications/2018/demo/p60-265.pdf [https://perma.cc/FM64-6888]; The Role of Benefits in Income and Poverty, NAT’L ACAD. OF SOC. INS., https://www.nasi.org/learn/socialsecurity/benefits-role [https://perma.cc/NE7C-PV97].
26. See 2020 SOCIAL SECURITY CHANGES, supra note 20. 27. 42 U.S.C. § 403(b) (2018). 28. Id. § 402(q).
FORMAN_22MAY20.DOCX (DO NOT DELETE) 6/30/2020 12:11 PM
2020] FULLY FUNDED PENSIONS 1217
only up to age 70).29 In effect, beneficiaries can buy additional annuity protection by delaying retirement.30 For example, consider various workers who retired in January 2020 with maximum taxable earnings since age 22. A worker retiring at age 62 then would get a starting benefit of $2,265 per month, while a worker retiring at 65 then would get $2,857 per month, and a worker retiring at age 70 then would get $3,790 per month.31
In addition to Social Security benefits, a means-tested Supplemental Security Income (SSI) program provides monthly cash benefits to certain low-income elderly, disabled, or blind Americans.32 In 2020, the maximum federal benefit for a single individual is $783 per month, and the maximum for a couple is $1,175 per month.33 In January of 2019, almost 2.3 million elderly Americans received SSI benefits from the federal government, and the average monthly benefit was $458.54.34
2. The Adequacy of Social Security Benefits Social Security is the most common source of income for households aged
65 or older. For example, in 2015, 84% of households aged 65 or older received Social Security benefits.35 Moreover, Social Security provided more than half
29. Id. § 402(w). 30. See Melissa A. Z. Knoll & Anya Olsen, Incentivizing Delayed Claiming of Social Security
Retirement Benefits Before Reaching the Full Retirement Age, 74 SOC. SECURITY BULL. 21, 39 (2014); Kenn Beam Tacchino, David A. Littell, & Bruce D. Schobel, A Decision Framework for Optimizing the Social Security Claiming Age, 28 BENEFITS Q. 40, 40–41 (2012).
31. Workers with Maximum-Taxable Earnings, SOC. SECURITY ADMIN., http://www.ssa.gov/oact/COLA/examplemax.html [https://perma.cc/92EC-UA8K].
32. WAYS AND MEANS COMMITTEE, GREEN BOOK, supra note 5, at ch.3. 33. SSI Federal Payment Amounts for 2020, SOC. SECURITY ADMIN.,
http://www.ssa.gov/oact/cola/SSI.html [https://perma.cc/6FEG-75HR]. 34. MONTHLY STATISTICAL SNAPSHOT, supra note 19, at tbl.3. 35. SOC. SEC. ADMIN., PUBL’N NO. 13-11785, FAST FACTS & FIGURES ABOUT SOCIAL
SECURITY, 2017, at 6 (2017), https://www.ssa.gov/policy/docs/chartbooks/fast_facts/2017/fast_facts17.pdf [https://perma.cc/36XC-E2WG] (a word of caution is in order here, as the Social Security Administration has since suspended publication of the relevant chart while the agency evaluates the adequacy of the chart’s data source) [hereinafter SSA, FAST FACTS 2017]; ADMIN. FOR CMTY. LIVING, U.S. DEP’T OF HEALTH & HUMAN SERVS., 2017 PROFILE OF OLDER AMERICANS 10 (2018), https://www.acl.gov/sites/default/files/Aging%20and%20Disability%20in%20America/2017OlderAmericansProfile.pdf [https://perma.cc/2XCG-8JY4]; see generally Irena Dushi, Howard M. Iams, & Brad Trenkamp, The Importance of Social Security Benefits to the Income of the Aged Population, 77 SOC. SECURITY BULL. 1 (2017); SOC. SEC. ADMIN., PUBL’N NO. 13-11785, FAST FACTS & FIGURES ABOUT SOCIAL SECURITY, 2019 (2019), https://www.ssa.gov/policy/docs/chartbooks/fast_facts/2019/fast_facts19.pdf [https://perma.cc/NMM5-RBU3]; SOC. SEC. ADMIN., PUBL’N NO. 13-11871, INCOME OF THE
FORMAN_22MAY20.DOCX (DO NOT DELETE) 6/30/2020 12:11 PM
1218 MARQUETTE LAW REVIEW [103:1205
of total income for 50% of aged beneficiary couples that year and 71% of total income for aged single beneficiaries.36 In 2014, only 43.8% of households received retirement benefits from sources other than Social Security, and only 61.8% received income from other assets.37
All in all, Social Security provided 33% of the personal income of households aged 65 or older in 2015.38 Earnings accounted for another 34% of their income, pensions accounted for another 20%, and asset income accounted for another 9%.39 Of course, as people age, their earnings decline, and their inflation-adjusted Social Security benefits become an even larger portion of their incomes.40 Still, as currently structured, Social Security alone cannot ensure that all Americans will have adequate incomes throughout their retirement years.
B. Pension Plans and Individual Retirement Accounts
1. Pensions The United States has a voluntary private pension system, and employers
can decide whether and how to provide pension benefits for their employees.41 However, when employers do provide pensions, those pensions are typically subject to regulation under the Employee Retirement Income Security Act of 1974 (ERISA).42 ERISA protects the pension benefits of most private-sector workers through sweeping participation,43 coverage,44 vesting,45 benefit POPULATION 55 OR OLDER, 2014 (2016), https://www.ssa.gov/policy/docs/statcomps/income_pop55/2014/incpop14.pdf [https://perma.cc/XX5A-5QD2].
36. SSA, FAST FACTS 2017, supra note 35, at 8 (again, caution is advised). 37. SOC. SEC. ADMIN., PUBL’N NO. 13-11727, INCOME OF THE AGED CHARTBOOK, 2014, at 8
(2016), https://www.ssa.gov/policy/docs/chartbooks/income_aged/2014/iac14.pdf [https://perma.cc/PAX2-9XKZ]; see also JCT, BACKGROUND DATA RELATING TO RETIREMENT INCOME, supra note 3, at 2−4 (showing income sources of the elderly).
38. SSA, FAST FACTS 2017, supra note 35, at 7 (again, caution is advised). 39. Id. 40. See Jonathan Barry Forman, Supporting the Oldest Old: The Role of Social Insurance,
Pensions, and Financial Products, 21 ELDER L.J. 375, 382–84 (2013). 41. See Jonathan Barry Forman & George A. (Sandy) Mackenzie, The Cost of “Choice” in a
Voluntary Pension System, N.Y.U. REV. OF EMP. BENEFITS & EXEC. COMP. 6-1, 6-3 to 6-5 (2013). 42. Pub. L. No. 93-406, 88 Stat. 829; see generally JCT, PRESENT LAW AND BACKGROUND,
supra note 7. 43. I.R.C. § 410(a) (2018); ERISA § 202, 29 U.S.C. § 1052 (2018). 44. I.R.C. § 410(b). 45. Id. § 411(a); ERISA § 203, 29 U.S.C. § 1053. A worker’s retirement benefit is said to be
vested when the worker has a nonforfeitable right to receive the benefit. For example, under the 5-
FORMAN_22MAY20.DOCX (DO NOT DELETE) 6/30/2020 12:11 PM
2020] FULLY FUNDED PENSIONS 1219
accrual,46 funding,47 and reporting rules.48 ERISA also created the Pension Benefit Guaranty Corporation (PBGC) to administer a plan termination insurance program that insures the benefits of workers in private-sector single-employer and multiemployer pension plans.49
The federal government uses two major approaches to encourage Americans to save for retirement.50 First, the government gives most pension plans favorable tax treatment.51 Basically, employer contributions to a pension are not taxable to the employee;52 the pension fund’s earnings on those contributions are tax-exempt;53 employees pay tax only when they receive distributions of their pension benefits;54 and the employer is allowed a current deduction for its contributions (within limits).55 Distributions from a pension plan generally may be rolled over tax-free to another pension plan or to an
year, cliff-vesting schedule, an employee who has completed at least 5 years of service must have a nonforfeitable right to 100% of her accrued benefits. Alternatively, under 3-to-7-year graded vesting, an employee must have a nonforfeitable right to 20% of her accrued benefit after 3 years of service, 40% after 4 years of service, and so on up to 100% after 7 years of service. ERISA only imposes minimum vesting requirements, and plans are free to use a faster vesting schedule.
46. I.R.C. § 411(b); ERISA § 204, 29 U.S.C. § 1054. 47. I.R.C. § 412; ERISA § 302, 29 U.S.C. § 1082. 48. See ERISA § 101, 29 U.S.C. § 1021 (requiring the plan administrator to provide a summary
plan description to plan participants and annual, terminal, and supplementary reports to the Secretary of Labor).
49. ERISA §§ 4001–4010, 29 U.S.C. §§ 1301–1311. A multiemployer plan is a defined benefit pension plan created through agreements between employers and a union. See JOINT COMM. ON TAXATION, JCX-30-18, PRESENT LAW AND BACKGROUND RELATING TO MULTIEMPLOYER DEFINED BENEFIT PLANS 53–56 (2018) [hereinafter JCT, PRESENT LAW RELATING TO MULTIEMPLOYER DEFINED BENEFIT PLANS], https://www.jct.gov/publications.html?func=startdown&id=5089 [https://perma.cc/BX6B-X5KD].
50. Forman & Mackenzie, supra note 41, at 6-17. 51. Id. at 6-17 to 6-18. 52. I.R.C. § 402. 53. I.R.C. § 501(a). Most pensions hold assets in a trust. I.R.C. § 401(a); A Guide to Common
Qualified Plan Requirements, INTERNAL REVENUE SERV., https://www.irs.gov/Retirement-Plans/A-Guide-to-Common-Qualified-Plan-Requirements [https://perma.cc/A22K-SREM]. “A trust is a medium under which the retirement plan assets are accumulated. The employer or employees, or both, contribute to the trust, which forms part of the retirement plan. The assets are held in the trust until distributed to the employees or their beneficiaries according to the plan’s provisions.” Id.
54. I.R.C. §§ 72(a), (f), 402(a); see generally INTERNAL REVENUE SERV., PUBL’N NO. 575, PENSION AND ANNUITY INCOME (2019), http://www.irs.gov/pub/irs-pdf/p575.pdf [https://perma.cc/VB9M-AN8S]. Contributions and benefits cannot exceed certain limits. See I.R.C. §§ 401(a)(17), 415.
55. I.R.C. § 404.
FORMAN_22MAY20.DOCX (DO NOT DELETE) 6/30/2020 12:11 PM
1220 MARQUETTE LAW REVIEW [103:1205
IRA.56 Second, the federal government gives employers a great deal of flexibility about designing their pension plans.57
a. Defined Benefit Plans In a defined benefit plan, an employer promises employees a specific
benefit at retirement, and the default benefit takes the form of an annuity for life.58 For example, a plan might provide that a worker’s annual retirement benefit (B) is equal to 2% times the number of years of service (yos) times final average pay (fap) (B = 2% × yos × fap).59 Under this plan, a worker who retired after 30 years of service with final average pay of $100,000 would receive a pension of $60,000 a year for life (i.e., $60,000 = 60% × $100,000 fap = 2% × 30 yos × $100,000 fap).60 The annual benefit for a participant in a defined benefit plan cannot exceed $230,000 in 2020.61 For married participants, defined benefit plans (and some defined contribution plans) are required to provide a qualified joint-and-survivor annuity (QJSA) as the normal benefit
56. I.R.C. § 402(c); JCT, PRESENT LAW AND BACKGROUND, supra note 7, at 20−21; Rollovers
of Retirement Plan and IRA Distributions, INTERNAL REVENUE SERV., https://www.irs.gov/retirement-plans/plan-participant-employee/rollovers-of-retirement-plan-and-ira-distributions [https://perma.cc/3872-BC8U].
57. Forman & Mackenzie, supra note 41, at 6-18. 58. See supra notes 7−9 and accompanying text. To provide that benefit, the employer typically
makes payments into a trust fund, contributed funds grow with investment returns, and eventually the employer withdraws funds from the trust fund to pay the promised benefits. See A Guide to Common Qualified Plan Requirements, supra note 53. Employer contributions are based on actuarial valuations, and the employer bears all of the investment risks and responsibilities. PENSIONS AND EMPLOYEE BENEFITS COMM., INT’L ACTUARIAL ASS’N, DEFINED BENEFIT PENSION PLAN FUNDING AND THE ROLE OF ACTUARIES 7–8 (2018) [hereinafter PENSIONS AND EMPLOYEE BENEFITS COMM., DEFINED BENEFIT PENSION PLAN FUNDING], https://www.actuaries.org/IAA/Documents/Publications/Papers/PEBC_Pension_Funding_Monograph_May2018.pdf [https://perma.cc/S8YD-3CKM].
59. The annual benefit accrual rate is 2%. 60. The benefit factor for this worker is 60%. Final average pay is often computed by averaging
the worker’s salary over the last 3 or 5 years prior to retirement. Alternatively, some plans use career-average compensation instead of final-average compensation. Under a career-average earnings formula, benefits are based on a percentage of an average of career earnings for every year of service by the employee. See William J. Wiatrowski, The Last Private Industry Pension Plans: A Visual Essay, MONTHLY LABOR REV. (Dec. 2012), https://www.bls.gov/opub/mlr/2012/12/art1full.pdf [https://perma.cc/J9UN-TR5Y].
61. I.R.C. §§ 401(a)(17), 415(b)(1)(A); I.R.S. Notice 2019-59, 2019-47 I.R.B. 1091 [hereinafter I.R.S. Notice 2019-59]. See INTERNAL REVENUE SERV., PUBL’N NO. 560, RETIREMENT PLANS FOR SMALL BUSINESS (SEP, SIMPLE, AND QUALIFIED PLANS) 15 (2019) [hereinafter IRS, RETIREMENT PLANS FOR SMALL BUSINESS], http://www.irs.gov/pub/irs-pdf/p560.pdf [https://perma.cc/Q5UW-PCPS].
FORMAN_22MAY20.DOCX (DO NOT DELETE) 6/30/2020 12:11 PM
2020] FULLY FUNDED PENSIONS 1221
payment, unless the spouse consents to another form of distribution.62 Defined benefit plans generally cannot make in-service distributions to a participant before age 59½.63
b. Defined Contribution Plans Under a typical defined contribution plan, the employer simply withholds
a specified percentage of the worker’s compensation, which it contributes to an individual investment account for the worker.64 For example, contributions might be set at 5% of annual compensation. Under such a plan, a worker who earned $50,000 in a given year would have $2,500 contributed to an individual investment account for her ($2,500 = 5% × $50,000). Her benefit at retirement would be based on all such contributions plus investment earnings. Defined contribution plans are also known as “individual account” plans because each worker has her own individual account, as opposed to defined benefit plans, where the plan’s assets are pooled for the benefit of all of the employees.65
Unlike defined benefit plans, defined contribution plans usually make distributions as lump sum or periodic distributions rather than as lifetime annuities.66 Indeed, relatively few defined contribution plans even offer annuity options, and, in any event, relatively few participants elect those annuity options.67 Many defined contribution plans also provide for loans to
62. I.R.C. § 401(a)(11); ERISA § 205, 29 U.S.C. § 1055 (2018). A QJSA is an immediate
annuity for the life of the pension plan participant and a survivor annuity for the life of the participant’s spouse. I.R.C. § 417(b); ERISA § 205(d)(1), 29 U.S.C. § 1055(d)(1).
63. I.R.C. § 401(a)(36) (as revised by the Further Consolidated Appropriations Act, 2020, Pub. L. No. 116-94, Division M—Bipartisan American Miners § 104). Certain defined benefit plans are permitted to make loans to participants, id., but hardly any of them do. See, e.g., EMP. BENEFITS SEC. ADMIN., U.S. DEP’T OF LABOR, PRIVATE PENSION PLAN BULLETIN 27 tbl.C5(a), 29 tbl.C5(b), 31 tbl.C5(c) (2019), https://www.dol.gov/sites/dolgov/files/EBSA/researchers/statistics/retirement-bulletins/private-pension-plan-bulletins-abstract-2017.pdf [https://perma.cc/XL6N-7L4D].
64. See JCT, PRESENT LAW AND BACKGROUND, supra note 7, at 9. 65. ERISA § 3(34), 29 U.S.C. § 1002(34). 66. See WILLIS TOWERS WATSON, supra note 14, at 17. 67. In 2016, for example, just 12% of private industry workers in savings and thrift plans had
annuities available to them. See NATIONAL COMPENSATION SURVEY, 2016, supra note 9, at tbl.20.
FORMAN_22MAY20.DOCX (DO NOT DELETE) 6/30/2020 12:11 PM
1222 MARQUETTE LAW REVIEW [103:1205
participants,68 and some plans can also provide in-service “hardship” distributions.69
There are a variety of different types of defined contribution plans, including money purchase pension plans, target benefit plans, profit-sharing plans, stock bonus plans, and employee stock ownership plans (“ESOPs”).70 Of particular importance, profit-sharing and stock bonus plans often include a feature that allows workers to choose between receiving cash currently or deferring taxation by placing the money in a retirement account, according to Internal Revenue Code Section 401(k).71 Consequently, these plans are usually called 401(k) plans, and they are the most popular type of retirement plan in the United States.72 The maximum annual amount of such elective deferrals that can be made by an individual in 2020 is $19,500, although workers over the age of 50 can contribute another $6,500 (for a total of up to $26,000).73 Also, since 2006, employers have been permitted to set up Roth 401(k) plans.74 Section 401(k) plans may be designed so that the employee automatically makes elective deferrals at a specified rate unless the employee elects otherwise.75 Such automatic enrollment features can lead to higher
68. I.R.C. § 72(p); JCT, PRESENT LAW AND BACKGROUND, supra note 7, at 31–33; Retirement
Topics - Plan Loans, INTERNAL REVENUE SERV., https://www.irs.gov/retirement-plans/plan-participant-employee/retirement-topics-loans [https://perma.cc/AUE5-G7RL]; see also JACK VANDERHEI, SARAH HOLDEN, LUIS ALONSO, & STEVEN BASS, EMP. BENEFIT RESEARCH INST., ISSUE BRIEF NO. 458, 401(K) PLAN ASSET ALLOCATION, ACCOUNT BALANCES, AND LOAN ACTIVITY IN 2016 (2018), https://www.ebri.org/docs/default-source/ebri-issue-brief/ebri_ib_458_k-update-10sept18.pdf?sfvrsn=bca4302f_4 [https://perma.cc/65CV-3VHD].
69. JCT, PRESENT LAW AND BACKGROUND, supra note 7, at 33. 70. See Six Ways to Save for Retirement, PROGRAM PERSPS., Mar. 2001, at 1, 2; EMP. BENEFITS
SEC. ADMIN., U.S. DEP’T OF LABOR, WHAT YOU SHOULD KNOW ABOUT YOUR RETIREMENT PLAN 36 (2017), https://www.dol.gov/sites/default/files/ebsa/about-ebsa/our-activities/resource-center/publications/what-you-should-know-about-your-retirement-plan.pdf [https://perma.cc/W7RQ-HJBP].
71. I.R.C. § 401(k). 72. BLS Examines Popular 401(k) Retirement Plans, PROGRAM PERSPS., Nov. 2010, at 1, 1. 73. I.R.C. § 402(g); I.R.S. Notice 2019-59, supra note 61, at 1091. There is also a limit on the
total annual contributions and additions that can go into a participant’s individual account (e.g., $57,000 in 2020). I.R.C. §§ 401(a)(17), 415; I.R.S. Notice 2019-59, supra note 61, at 1091; see also IRS, RETIREMENT PLANS FOR SMALL BUSINESS, supra note 61, at 15 (explaining the limit on the total annual contributions and other additions that can be made to a defined contribution plans).
74. I.R.C. § 402A. Contributions to these plans are not excludable, but neither the plan’s investment returns nor distributions are taxable. Id.
75. JCT, PRESENT LAW AND BACKGROUND, supra note 7, at 25.
FORMAN_22MAY20.DOCX (DO NOT DELETE) 6/30/2020 12:11 PM
2020] FULLY FUNDED PENSIONS 1223
participation rates, and automatically escalating the participants’ levels of contributions can lead to even greater retirement savings.76
c. Hybrid Retirement Plans So-called hybrid retirement plans mix the features of defined benefit and
defined contribution plans. For example, a cash balance plan is a defined benefit plan that looks like a defined contribution plan.77 Like other defined benefit plans, employer contributions to a cash balance plan depend on actuarial valuations, and the employer bears all of the investment risks.78 Like defined contribution plan, workers in cash balance plans have individual accounts (albeit hypothetical).79 For example, a simple cash balance plan might allocate 5% of salary to each worker’s account each year and credit the account with 5% interest on the balance in the account. Under such a plan, a worker who earned $50,000 in a given year would get an annual cash balance credit of $2,500 ($2,500 = 5% × $50,000), plus an interest credit equal to 5% of the balance in her hypothetical account as of the beginning of the year.
Similarly, a so-called “target benefit plan” is a defined contribution plan that looks like a defined benefit plan.80 A target benefit plan uses a defined benefit formula to establish a target benefit for each participant.81 The employer contributions for each participant are actuarially determined to achieve this goal, but the target benefit is not guaranteed.82 Instead, a worker’s ultimate retirement benefit is based on the actual balance in the worker’s individual account.83
76. See OECD, OECD PENSIONS OUTLOOK 2012, at 45–76 (2013), http://www.oecd-
ilibrary.org/finance-and-investment/oecd-pensions-outlook-2012_9789264169401-en [https://perma.cc/R9AL-HDE7]. Of note, the Pension Protection Act of 2006 made it easier for employers to include automatic enrollment features in pension plans. Pension Protection Act of 2006 § 902, Pub. L. No. 109-280, 120 Stat. 1033–39 (adding I.R.C. §§ 401(k)(13), 401(m)(12) & 414(w)).
77. See JCT, PRESENT LAW AND BACKGROUND, supra note 7, at 10; Jonathan Barry Forman & Amy Nixon, Cash Balance Pension Plan Conversions, 25 OKLA. CITY U. L. REV. 379, 380 (2000).
78. Forman & Nixon, supra note 77, at 387. 79. Id. 80. See JANA STEELE, ANGELA MASEROLLE, & MEL BARTLETT, C.D. HOWE INST.,
COMMENTARY NO. 411, TARGET-BENEFIT PLANS IN CANADA – AN INNOVATION WORTH EXPANDING 2 (2014), https://www.osler.com/uploadedFiles/Commentary_411.pdf [https://perma.cc/Y96T-X3WT].
81. Id. at 7. 82. Id. at 10. 83. Id. at 11.
FORMAN_22MAY20.DOCX (DO NOT DELETE) 6/30/2020 12:11 PM
1224 MARQUETTE LAW REVIEW [103:1205
2. Individual Retirement Accounts Favorable tax rules are also available for individual retirement accounts
(IRAs).84 Almost any worker can set up an IRA with a bank or other financial institution. In 2020, individuals without pension plans can contribute and deduct up to $6,000 to an IRA, although individuals over age 50 can contribute and deduct another $1,000 (for a total of up to $7,000); spouses can contribute and deduct similar amounts.85 Like private pensions, IRA earnings are tax-exempt, and distributions are taxable.86
Also, since 1998, individuals have been permitted to set up Roth IRAs.87 Unlike regular IRAs, contributions to Roth IRAs are not deductible. Instead, withdrawals are tax-free.88 Like regular IRAs, however, Roth IRA earnings are tax-exempt.89
3. Pension Coverage and Participation Pension coverage and participation rates are relatively low. At any point in
time, only about one out of two American workers has a pension plan.90 The probability of pension coverage is greater for older workers, for whites, for highly educated workers, for full-time workers, for higher-income workers, and for workers at larger firms.91 Participation in IRAs is even lower than participation in pensions. For example, while 36% of U.S. households had an IRA in mid-2019, only around 12% of households made contributions to their IRAs (in 2018).92
84. I.R.C. § 219 (2018); JCT, PRESENT LAW AND BACKGROUND, supra note 7, at 37–40. 85. I.R.S. Notice 2019-59, supra note 61, at 1091–92. 86. I.R.C. § 408. Also, a variety of simplified retirement plans allow self-employed workers to
contribute more than they could otherwise contribute to a regular IRA. See, e.g., IRS, RETIREMENT PLANS FOR SMALL BUSINESS, supra note 61, at 2 (explaining, inter alia, the operation of Simplified Employee Pensions [SEPs] and Savings Incentive Match Plans for Employees (SIMPLE IRAs)).
87. I.R.C. § 408A. 88. See JCT, PRESENT LAW AND BACKGROUND, supra note 7, at 39–40. 89. Id. 90. For example, in March of 2019, 71% of private-sector workers had access to ERISA
retirement plans, and 56% of them participated. NATIONAL COMPENSATION SURVEY, 2019, supra note 15, at tbl.2.
91. See CRAIG COPELAND, EMP. BENEFIT RES. INST., ISSUE BRIEF NO. 499, RETIREMENT PLAN PARTICIPATION AND CURRENT POPULATION SURVEY: CHECKING IN ON THE RETIREMENT PLAN PARTICIPATION AND RETIREE INCOME ESTIMATES 9 fig.5 (2019), https://www.ebri.org/content/current-population-survey-checking-in-on-the-retirement-plan-participation-and-retiree-income-estimates [https://perma.cc/H5AQ-XY8R].
92. Sarah Holden & Daniel Schrass, The Role of IRAs in U.S. Households’ Saving for Retirement, 2019, INV. CO. INST., Dec. 2019, at 1, 2, 6 fig.3, 18.
FORMAN_22MAY20.DOCX (DO NOT DELETE) 6/30/2020 12:11 PM
2020] FULLY FUNDED PENSIONS 1225
All in all, low participation rates in pension plans, in general, and low contribution rates to 401(k) plans, in particular, have led many analysts to wonder whether current and future generations of retirees will have adequate retirement incomes.93 In that regard, just 52.1% of families had any retirement accounts in 2016, and of those families who did have accounts then, the median value was just $60,000.94 That year, just 49.8% of families age 65−74 had retirement accounts, and the median value of those accounts was $126,000.95 Also, just 5% of elderly individuals in the lowest income quintile in 2018 had pension or IRA income that year, compared to 62.4% of individuals in the highest income quintile.96
C. Annuities and Other Sources of Lifetime Income In addition to Social Security, pensions, and IRAs, individuals can also save
money outside of the retirement system. In 2020, investment income is generally subject to federal income tax rates of up to 37%,97 but capital gains and dividends are generally taxed at a preferential tax rate of 0, 15, or 20%, depending on the income tax rate that would be assessed on the same amount
93. See U.S. GOV’T ACCOUNTABILITY OFFICE, GAO-16-408, RETIREMENT SECURITY: LOW
DEFINED CONTRIBUTION SAVINGS MAY POSE CHALLENGES 6 (2016), http://www.gao.gov/assets/680/676942.pdf [https://perma.cc/ZYA2-A5FZ] (finding that around 60% of all households had no defined contribution plan savings at all in 2013); JACK VANDERHEI, EMP. BENEFIT RESEARCH INST., ISSUE BRIEF NO. 475, RETIREMENT SAVINGS SHORTFALLS: EVIDENCE FROM EBRI’S 2019 RETIREMENT SECURITY PROJECTION MODEL® (2019), https://www.ebri.org/content/retirement-savings-shortfalls-evidence-from-ebri-s-2019-retirement-security-projection-model [https://perma.cc/K7B2-FDWV] (estimating that 40.6% of households with the head between 35 and 64 will run short of money in retirement and that the aggregate retirement deficit of this age cohort is $3.83 trillion); Andrew G. Biggs, Alicia H. Munnell, & Anqi Chen, Why Are 401(k)/IRA Balances Substantially Below Potential? 3, 13–14 (Ctr. for Ret. Res. at Boston College, Working Paper 2019-14, 2019), https://crr.bc.edu/wp-content/uploads/2019/11/wp_2019-14.pdf [https://perma.cc/WJ98-YKT2]; see generally ALICIA H. MUNNELL & ANNIKA SUNDEN, COMING UP SHORT: THE CHALLENGE OF 401(K) PLANS (2004).
94. FEDERAL RESERVE BOARD, 2016 SURVEY OF CONSUMER FINANCES CHARTBOOK 435−36 (2017), https://www.federalreserve.gov/econres/files/BulletinCharts.pdf [https://perma.cc/PP3D-CJDD].
95. Id. Also, 59.3% of families age 55−64 had retirement accounts, and the median value of those accounts was $120,000; and 40.8% of families age 75 and older had retirement accounts, and the median value of those accounts was also $120,000. Id.; see also U.S. GOV’T ACCOUNTABILITY OFFICE, GAO-15-419, RETIREMENT SECURITY: MOST HOUSEHOLDS APPROACHING RETIREMENT HAVE LOW SAVINGS 8, 10 (2015), https://www.gao.gov/assets/680/670153.pdf [https://perma.cc/T4L2-6BSA] (27% of households between age 55 and 64 and above had no retirement savings at all in 2013 and no defined benefit plan).
96. JCT, BACKGROUND DATA RELATING TO RETIREMENT INCOME, supra note 3, at 2−3. 97. I.R.C. § 1(j) (2018); Rev. Proc. 2019-44, 2019-47 I.R.B. 1093.
FORMAN_22MAY20.DOCX (DO NOT DELETE) 6/30/2020 12:11 PM
1226 MARQUETTE LAW REVIEW [103:1205
of ordinary income.98 There are also various tax advantages associated with investments in homes,99 state and local government bonds,100 annuities,101 and life insurance.102
In particular, annuities are another common way to provide lifetime income. For example, in December of 2018, for $100,000, a 65-year-old man could have purchased an immediate fixed (lifetime) annuity without inflation protection that paid around $6,660 a year.103 Because women tend to live longer than men,104 for $100,000, a 65-year-old woman could have purchased an immediate, level-payment (lifetime) annuity then that paid only around $6,324 a year.105
Inflation-adjusted annuities offer an even better way to hedge against living too long. With inflation-adjusted annuities, annual payments would start out almost 40% lower than fixed-payment (lifetime) annuities but, over a long life, would eventually end up higher. For example, if the hypothetical 65-year-old man in the last paragraph instead chose a lifetime annuity with a 3% annual escalator, the initial annual payment would be around $4,848, but, eventually, annual payments would exceed the $6,660 per year payments under the fixed-payment (lifetime) annuity.106
98. I.R.C. § 1(h). 99. For example, home mortgage interest is generally deductible, and gains from the sale of a
personal residence are often excludable. I.R.C. §§ 163(a), 121. 100. I.R.C. § 103 (interest exclusion). 101. Under I.R.C. § 72, the individual can exclude a fraction of each annuity payment from
income. That fraction (the “exclusion ratio”) is based on the amount of premiums or other after-tax contributions made by the individual. The exclusion ratio enables the individual to recover her own after-tax contributions tax free and to pay tax only on the remaining portion of benefits which represents income. The net effect is a deferral of taxation.
102. I.R.C. § 101(a) (exclusion for insurance proceeds paid by reason of the death of the insured).
103. Immediate Annuities Update, ANNUITY SHOPPER BUYER’S GUIDE, Jan. 2019, at 17 tbl.5 ($6,660 = 12 × an average payment of $555 per month).
104. See SSA, Benefits Planner, supra note 11. 105. Immediate Annuities Update, supra note 103, at 17 tbl.5 ($6,324 = 12 × an average payment
of $527 per month). Unfortunately, while ERISA-covered pension plans cannot discriminate based on gender, insurance companies can: insurance companies are allowed to price the annuities that they offer to men and women differently. Jonathan Barry Forman, Removing the Legal Impediments to Offering Lifetime Annuities in Pension Plans, 23 CONN. INS. L.J. 31, 61 (2016).
106. Immediate Annuities Update, supra note 103, at 17 tbl.5 (showing average payments to 65-year-old men with a 3%-cost-of-living adjustment of $404 per month in the first year of his retirement [$4,848 in the first year = 12 × an average payment of $404 per month]).
FORMAN_22MAY20.DOCX (DO NOT DELETE) 6/30/2020 12:11 PM
2020] FULLY FUNDED PENSIONS 1227
Another way retirees can protect against longevity risk is by purchasing longevity insurance.107 The typical approach is to buy a deferred income annuity at age 65 that starts making annual payments only if the annuitant lives past age 80 or 85. For example, in December of 2018, for $100,000, a 65-year-old man could have purchased a deferred income annuity that would pay around $22,953 a year when (and if) he turns age 80.108
Pertinent here, people hardly ever choose to buy annuities voluntarily.109 The demand for annuities is significantly lower than expected, and this shortfall has come to be known as the “annuity puzzle.”110
107. Forman, supra note 105, at 62; see generally Katherine G. Abraham & Benjamin H. Harris,
The Market for Longevity Annuities, 3 J. RETIREMENT 12 (2016). 108. Immediate Annuities Update, supra note 103, at 53 tbl.19. 109. See AM. ACAD. OF ACTUARIES, RISKY BUSINESS: LIVING LONGER WITHOUT INCOME FOR
LIFE, INFORMATION FOR CURRENT AND FUTURE RETIREES 1 (2015), http://actuary.org/files/Retiree_PreRetirees_IB_102215.pdf [https://perma.cc/T2NN-8Y3K]; J. MARK IWRY, WILLIAM GALE, DAVID JOHN, & VICTORIA JOHNSON, WHEN INCOME IS THE OUTCOME: REDUCING REGULATORY OBSTACLES TO ANNUITIES IN 401(K) PLANS 4 (2019), https://www.brookings.edu/wp-content/uploads/2019/07/ES_201907_IwryGaleJohnJohnson.pdf [https://perma.cc/4TS2-B5C8] (noting that fixed annuities constituted less than 2% of all retirement assets at the beginning of 2018).
110. See Shlomo Benartzi, Alessandro Previtero, & Richard H. Thaler, Annuitization Puzzles, 25 J. OF ECON. PERSPS. 143, 150 (2011).
FORMAN_22MAY20.DOCX (DO NOT DELETE) 6/30/2020 12:11 PM
1228 MARQUETTE LAW REVIEW [103:1205
III. FUNDING ISSUES FOR SOCIAL SECURITY AND PENSIONS The goal of retirement policy is to ensure that workers will have adequate
incomes throughout their retirement years. The first step is to determine a target level of retirement income. The second step is to design Social Security and pension systems that can produce that target level of retirement income, and the final step is to fund those systems. This Part starts this analysis by discussing retirement savings targets and by explaining the funding problems of the current Social Security and pension systems.
A. Retirement Savings Targets The principal goal of pension policy is to ensure that workers have adequate
incomes throughout their retirement years. Either implicitly or explicitly, most analysts adopt some kind of target replacement rate. For example, as this Article does, a common approach is to suggest that pensions and Social Security together should replace 70 or 80% of preretirement earnings (i.e., a replacement rate of 70 or 80%).111 The desired replacement rate is almost always assumed to be less than 100% because of the elimination of work-related expenses and because some preretirement income was devoted to saving for retirement.112
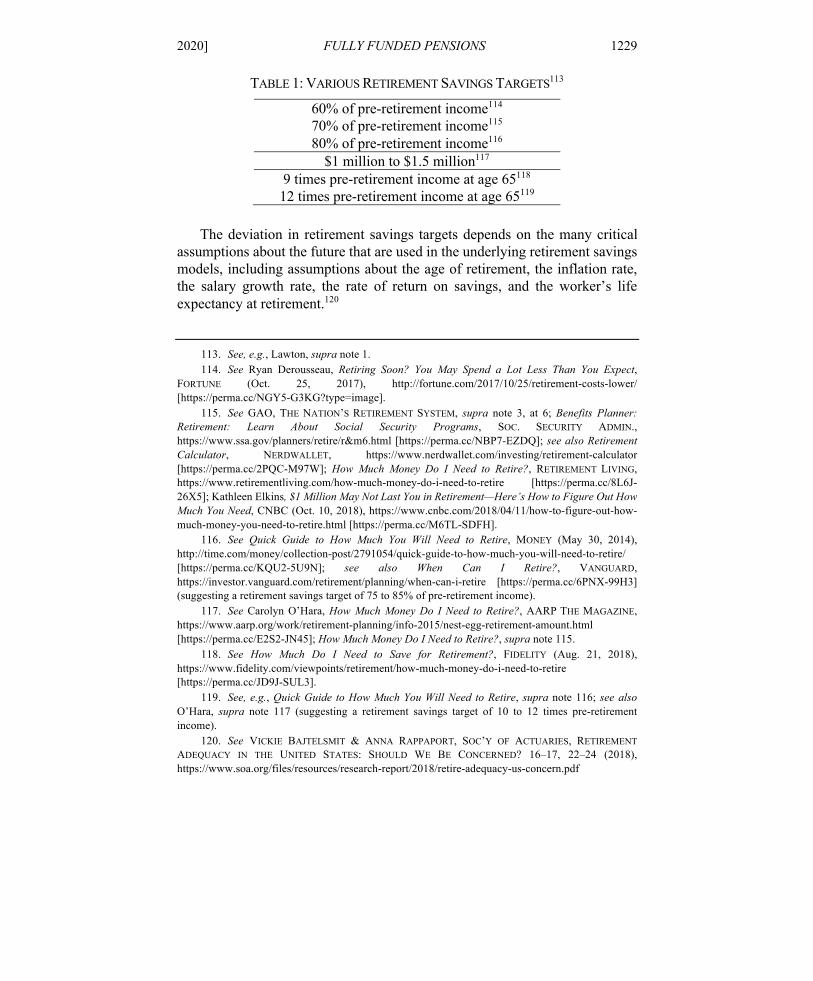
Sometimes, the retirement savings target is instead expressed as a target amount that needs to be saved by retirement—say a million dollars—or as some multiple of final pay—say, 10 times pre-retirement income. Table 1 shows a variety of these retirement savings targets.
111. GAO, THE NATION’S RETIREMENT SYSTEM, supra note 3, at 6 (“[R]etirees will need 70%
or more of pre-retirement earnings to live comfortably.”). The replacement rate (or replacement ratio) is the ratio of annual income in retirement to preretirement earnings. See also CONG. BUDGET OFFICE, MEASURING THE ADEQUACY OF RETIREMENT INCOME: A PRIMER 12 (2017), https://www.cbo.gov/system/files/115th-congress-2017-2018/reports/53191-retirementadequacy.pdf [https://perma.cc/PAS2-5Z7Q].
112. See, e.g., AON CONSULTING, 2008 REPLACEMENT RATIO STUDY 24 (2008), http://www.aon.com/about-aon/intellectual-capital/attachments/human-capital-consulting/RRStudy070308.pdf [https://perma.cc/8DYE-TW3Y] (estimating that required replacement rate ranged from 77% for a person earning $80,000 a year in 2008 to 94% for a person earning $20,000 that year; that is, somewhat higher replacement rates are needed for workers with lower lifetime earnings to maintain their preretirement standard of living than for those with higher lifetime earnings).
FORMAN_22MAY20.DOCX (DO NOT DELETE) 6/30/2020 12:11 PM
2020] FULLY FUNDED PENSIONS 1229
TABLE 1: VARIOUS RETIREMENT SAVINGS TARGETS113
60% of pre-retirement income114 70% of pre-retirement income115 80% of pre-retirement income116
$1 million to $1.5 million117 9 times pre-retirement income at age 65118 12 times pre-retirement income at age 65119
The deviation in retirement savings targets depends on the many critical
assumptions about the future that are used in the underlying retirement savings models, including assumptions about the age of retirement, the inflation rate, the salary growth rate, the rate of return on savings, and the worker’s life expectancy at retirement.120
113. See, e.g., Lawton, supra note 1. 114. See Ryan Derousseau, Retiring Soon? You May Spend a Lot Less Than You Expect,
FORTUNE (Oct. 25, 2017), http://fortune.com/2017/10/25/retirement-costs-lower/ [https://perma.cc/NGY5-G3KG?type=image].
115. See GAO, THE NATION’S RETIREMENT SYSTEM, supra note 3, at 6; Benefits Planner: Retirement: Learn About Social Security Programs, SOC. SECURITY ADMIN., https://www.ssa.gov/planners/retire/r&m6.html [https://perma.cc/NBP7-EZDQ]; see also Retirement Calculator, NERDWALLET, https://www.nerdwallet.com/investing/retirement-calculator [https://perma.cc/2PQC-M97W]; How Much Money Do I Need to Retire?, RETIREMENT LIVING, https://www.retirementliving.com/how-much-money-do-i-need-to-retire [https://perma.cc/8L6J-26X5]; Kathleen Elkins, $1 Million May Not Last You in Retirement—Here’s How to Figure Out How Much You Need, CNBC (Oct. 10, 2018), https://www.cnbc.com/2018/04/11/how-to-figure-out-how-much-money-you-need-to-retire.html [https://perma.cc/M6TL-SDFH].
116. See Quick Guide to How Much You Will Need to Retire, MONEY (May 30, 2014), http://time.com/money/collection-post/2791054/quick-guide-to-how-much-you-will-need-to-retire/ [https://perma.cc/KQU2-5U9N]; see also When Can I Retire?, VANGUARD, https://investor.vanguard.com/retirement/planning/when-can-i-retire [https://perma.cc/6PNX-99H3] (suggesting a retirement savings target of 75 to 85% of pre-retirement income).
117. See Carolyn O’Hara, How Much Money Do I Need to Retire?, AARP THE MAGAZINE, https://www.aarp.org/work/retirement-planning/info-2015/nest-egg-retirement-amount.html [https://perma.cc/E2S2-JN45]; How Much Money Do I Need to Retire?, supra note 115.
118. See How Much Do I Need to Save for Retirement?, FIDELITY (Aug. 21, 2018), https://www.fidelity.com/viewpoints/retirement/how-much-money-do-i-need-to-retire [https://perma.cc/JD9J-SUL3].
119. See, e.g., Quick Guide to How Much You Will Need to Retire, supra note 116; see also O’Hara, supra note 117 (suggesting a retirement savings target of 10 to 12 times pre-retirement income).
120. See VICKIE BAJTELSMIT & ANNA RAPPAPORT, SOC’Y OF ACTUARIES, RETIREMENT ADEQUACY IN THE UNITED STATES: SHOULD WE BE CONCERNED? 16–17, 22–24 (2018), https://www.soa.org/files/resources/research-report/2018/retire-adequacy-us-concern.pdf
FORMAN_22MAY20.DOCX (DO NOT DELETE) 6/30/2020 12:11 PM
1230 MARQUETTE LAW REVIEW [103:1205
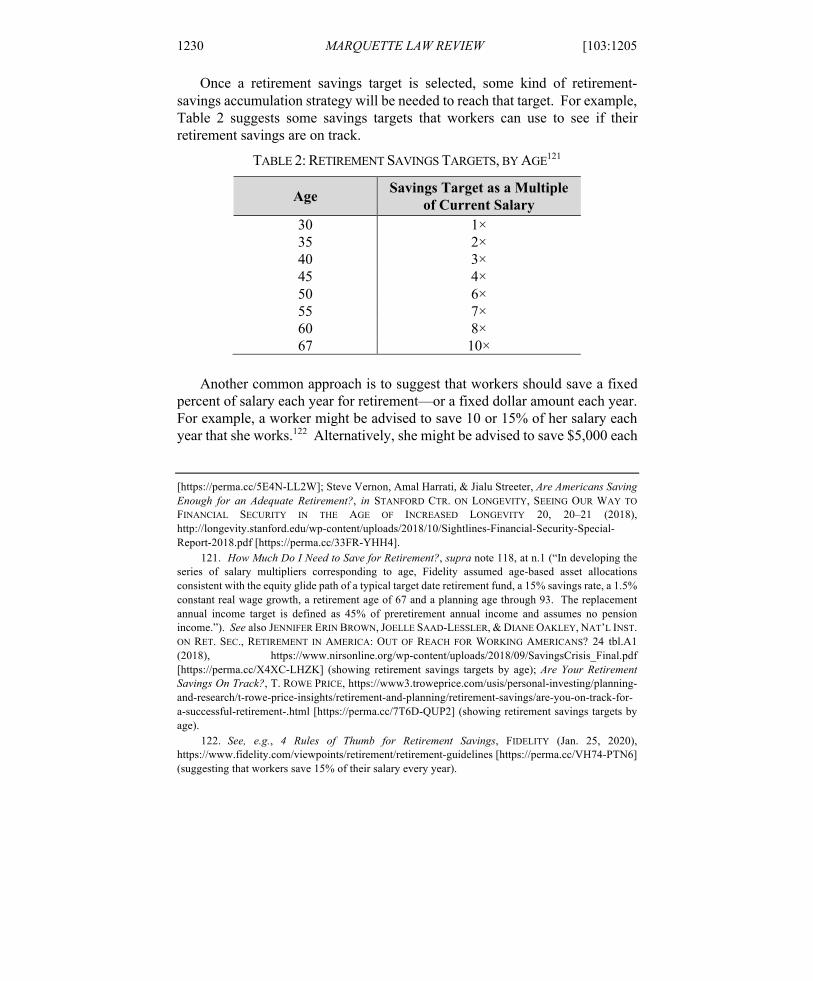
Once a retirement savings target is selected, some kind of retirement-savings accumulation strategy will be needed to reach that target. For example, Table 2 suggests some savings targets that workers can use to see if their retirement savings are on track.
TABLE 2: RETIREMENT SAVINGS TARGETS, BY AGE121
Age Savings Target as a Multiple of Current Salary
30 1× 35 2× 40 3× 45 4× 50 6× 55 7× 60 8× 67 10×
Another common approach is to suggest that workers should save a fixed
percent of salary each year for retirement—or a fixed dollar amount each year. For example, a worker might be advised to save 10 or 15% of her salary each year that she works.122 Alternatively, she might be advised to save $5,000 each
[https://perma.cc/5E4N-LL2W]; Steve Vernon, Amal Harrati, & Jialu Streeter, Are Americans Saving Enough for an Adequate Retirement?, in STANFORD CTR. ON LONGEVITY, SEEING OUR WAY TO FINANCIAL SECURITY IN THE AGE OF INCREASED LONGEVITY 20, 20–21 (2018), http://longevity.stanford.edu/wp-content/uploads/2018/10/Sightlines-Financial-Security-Special-Report-2018.pdf [https://perma.cc/33FR-YHH4].
121. How Much Do I Need to Save for Retirement?, supra note 118, at n.1 (“In developing the series of salary multipliers corresponding to age, Fidelity assumed age-based asset allocations consistent with the equity glide path of a typical target date retirement fund, a 15% savings rate, a 1.5% constant real wage growth, a retirement age of 67 and a planning age through 93. The replacement annual income target is defined as 45% of preretirement annual income and assumes no pension income.”). See also JENNIFER ERIN BROWN, JOELLE SAAD-LESSLER, & DIANE OAKLEY, NAT’L INST. ON RET. SEC., RETIREMENT IN AMERICA: OUT OF REACH FOR WORKING AMERICANS? 24 tbl.A1 (2018), https://www.nirsonline.org/wp-content/uploads/2018/09/SavingsCrisis_Final.pdf [https://perma.cc/X4XC-LHZK] (showing retirement savings targets by age); Are Your Retirement Savings On Track?, T. ROWE PRICE, https://www3.troweprice.com/usis/personal-investing/planning-and-research/t-rowe-price-insights/retirement-and-planning/retirement-savings/are-you-on-track-for-a-successful-retirement-.html [https://perma.cc/7T6D-QUP2] (showing retirement savings targets by age).
122. See, e.g., 4 Rules of Thumb for Retirement Savings, FIDELITY (Jan. 25, 2020), https://www.fidelity.com/viewpoints/retirement/retirement-guidelines [https://perma.cc/VH74-PTN6] (suggesting that workers save 15% of their salary every year).
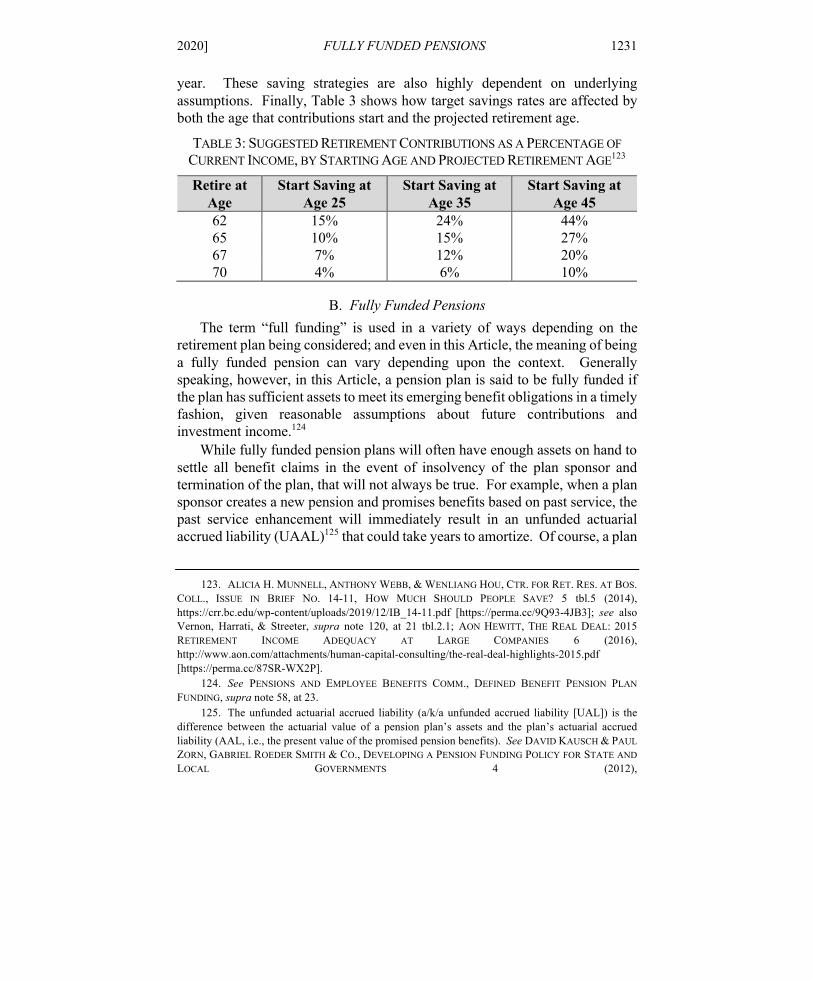
FORMAN_22MAY20.DOCX (DO NOT DELETE) 6/30/2020 12:11 PM
2020] FULLY FUNDED PENSIONS 1231
year. These saving strategies are also highly dependent on underlying assumptions. Finally, Table 3 shows how target savings rates are affected by both the age that contributions start and the projected retirement age.
TABLE 3: SUGGESTED RETIREMENT CONTRIBUTIONS AS A PERCENTAGE OF CURRENT INCOME, BY STARTING AGE AND PROJECTED RETIREMENT AGE123
Retire at Age
Start Saving at Age 25
Start Saving at Age 35
Start Saving at Age 45
62 15% 24% 44% 65 10% 15% 27% 67 7% 12% 20% 70 4% 6% 10%
B. Fully Funded Pensions The term “full funding” is used in a variety of ways depending on the
retirement plan being considered; and even in this Article, the meaning of being a fully funded pension can vary depending upon the context. Generally speaking, however, in this Article, a pension plan is said to be fully funded if the plan has sufficient assets to meet its emerging benefit obligations in a timely fashion, given reasonable assumptions about future contributions and investment income.124
While fully funded pension plans will often have enough assets on hand to settle all benefit claims in the event of insolvency of the plan sponsor and termination of the plan, that will not always be true. For example, when a plan sponsor creates a new pension and promises benefits based on past service, the past service enhancement will immediately result in an unfunded actuarial accrued liability (UAAL)125 that could take years to amortize. Of course, a plan
123. ALICIA H. MUNNELL, ANTHONY WEBB, & WENLIANG HOU, CTR. FOR RET. RES. AT BOS.
COLL., ISSUE IN BRIEF NO. 14-11, HOW MUCH SHOULD PEOPLE SAVE? 5 tbl.5 (2014), https://crr.bc.edu/wp-content/uploads/2019/12/IB_14-11.pdf [https://perma.cc/9Q93-4JB3]; see also Vernon, Harrati, & Streeter, supra note 120, at 21 tbl.2.1; AON HEWITT, THE REAL DEAL: 2015 RETIREMENT INCOME ADEQUACY AT LARGE COMPANIES 6 (2016), http://www.aon.com/attachments/human-capital-consulting/the-real-deal-highlights-2015.pdf [https://perma.cc/87SR-WX2P].
124. See PENSIONS AND EMPLOYEE BENEFITS COMM., DEFINED BENEFIT PENSION PLAN FUNDING, supra note 58, at 23.
125. The unfunded actuarial accrued liability (a/k/a unfunded accrued liability [UAL]) is the difference between the actuarial value of a pension plan’s assets and the plan’s actuarial accrued liability (AAL, i.e., the present value of the promised pension benefits). See DAVID KAUSCH & PAUL ZORN, GABRIEL ROEDER SMITH & CO., DEVELOPING A PENSION FUNDING POLICY FOR STATE AND LOCAL GOVERNMENTS 4 (2012),
FORMAN_22MAY20.DOCX (DO NOT DELETE) 6/30/2020 12:11 PM
1232 MARQUETTE LAW REVIEW [103:1205
sponsor could choose achieving solvency as its funding objective, in which case, that plan sponsor would always meet that funding objective if it immediately contributed enough to fully fund those past service credits.
Finally, in the real world, asset values will fluctuate as market conditions change. Consequently, the actual funding level of real-world defined benefit pension plans will typically fluctuate and almost never be exactly 100%.
C. Social Security is Funded on a Pay-as-You-Go Basis The Social Security system is underfunded. The Social Security system
operates largely on a pay-as-you-go basis (PAYG). Social Security benefits are primarily paid out of current-year Social Security payroll taxes,126 and the Social Security Trust Funds maintain only enough reserves to cover a few years of benefits. For example, in 2018, the Old-Age and Survivors Insurance Trust Fund received $715.9 billion in payroll tax contributions, paid out $844.9 billion in benefits, and had $2,797.9 billion on hand at the close of the year.127 Similarly, in 2018, the Disability Insurance Trust Fund received $169.2 billion in payroll tax contributions, paid out $143.7 billion in benefits, and had $97.1 billion on hand at the close of the year.128 The combined trust fund reserves are expected to be depleted in 2034.129
All in all, as of January 1, 2019, the unfunded liability of the Social Security system over the agency’s 75-year projection period was estimated to be $13.9 trillion, and that unfunded liability can also be expressed as 2.61% of taxable payroll or 0.9% of gross domestic product (GDP).130 Basically, to wipe out that deficit, it would take (1) an immediate and permanent payroll tax increase of 2.70% (to 15.10% of payroll); (2) an immediate and permanent 17% cut in benefits; or (3) some combination of these two approaches.131 While some members of Congress have recently introduced bills to reduce or eliminate the
https://www.nasra.org/files/Topical%20Reports/Funding%20Policies/GRSRR-Funding-Policy.pdf [https://perma.cc/7367-DJVJ].
126. See supra note 20 and accompanying text. 127. 2019 SOCIAL SECURITY TRUSTEES REPORT, supra note 11, at 6 tbl.II.B1. 128. Id. 129. Id. at 3; see generally Stephen C. Goss, The Future Financial Status of the Social Security
Program, 70 SOC. SECURITY BULL. 111 (2010) (explaining the financial status of the Social Security program).
130. 2019 SOCIAL SECURITY TRUSTEES REPORT, supra note 11, at 200 tbl.VI.F1. Over the infinite horizon, the unfunded obligation is estimated to be $34.3 trillion (4.1% of taxable payroll or 1.4% of GDP). Id.
131. Id. at 4−5.
FORMAN_22MAY20.DOCX (DO NOT DELETE) 6/30/2020 12:11 PM
2020] FULLY FUNDED PENSIONS 1233
Social Security system’s long-term insolvency,132 the prospects for enacting any significant legislation seem slim at this time.
D. Many Pension Plans Are Underfunded As already mentioned, a pension plan is said to be fully funded if the plan
has sufficient assets to meet its emerging benefit obligations in a timely fashion.133 Measured against that standard, many public and private pension plans are underfunded. Moreover, even if a pension plan is technically fully funded, the plan may not be generous enough to replace 40% of each worker’s preretirement earnings.
1. Defined Contribution Plans (and IRAs) The funding requirements for defined contribution plans are
straightforward: the plan sponsor meets the ERISA requirements by contributing what it promised to contribute.134 For example, a plan sponsor that promises to contribute 3% of compensation will meet its funding obligation when it deposits 3% of compensation into its workers’ individual accounts. That defined contribution plan is, technically speaking, “fully funded,” but, in operation, such a low level of contributions is unlikely to result in cumulative retirement savings that would replace 40% of a worker’s preretirement earnings.
Indeed, having a fully funded defined contribution plan is no guarantee that a retiree will actually have an adequate retirement income. After all, many workers do not participate in their employers’ defined contribution plans,135 and even among the workers that do participate, contribution rates are often
132. See Office of the Chief Actuary’s Estimates of Proposals to Change Social Security, SOC.
SECURITY ADMIN., https://www.ssa.gov/oact/solvency/index.html [https://perma.cc/23N5-PYXJ] [hereinafter SSA, Proposals to Change Social Security].
133. See supra note 124 and accompanying text. 134. In general, employers must follow the plan provisions. See generally A Guide to Common
Qualified Plan Requirements, supra note 53. The rules governing the timing of contributions can be complicated, but employee contributions are generally supposed to be sent to the plan on the earliest date that the deferrals can reasonably be segregated from the employer’s general assets, and employer contributions generally must be made by the due date of the employer’s income tax return. See 29 C.F.R. § 2510.3-102(a) (2004); Retirement Topics – Contributions, INTERNAL REVENUE SERV., https://www.irs.gov/retirement-plans/plan-participant-employee/retirement-topics-contributions [https://perma.cc/8AJB-979W]; 401(k) Plan Fix-It Guide - You Haven’t Timely Deposited Employee Elective Deferrals, INTERNAL REVENUE SERV., https://www.irs.gov/retirement-plans/401k-plan-fix-it-guide-you-have-not-timely-deposited-employee-elective-deferrals [https://perma.cc/G3MB-LBFJ].
135. See supra note 15 and accompanying text.
FORMAN_22MAY20.DOCX (DO NOT DELETE) 6/30/2020 12:11 PM
1234 MARQUETTE LAW REVIEW [103:1205
dismally low.136 Moreover, workers often lose valuable accrued benefits when they change jobs before vesting.137 In short, while defined contribution sponsors can meet their legal funding obligations by contributing what they say that they will, if contribution levels are too low, workers will not end up with adequately funded pensions when they retire. All in all, the defined contribution plans of most workers will not be able to provide them with adequate retirement income; in short, they are “underfunded” (at least in the colloquial sense of that word).
2. Defined Benefit Plans Defined benefit pension plan sponsors make benefit promises that can
extend many years into the future. Historically, some plans simply paid those liabilities on a pay-as-you-go-basis. The triumph of ERISA was that it required private pension plans to prefund their pensions (i.e., meet certain minimum funding standards).138 Generally accepted accounting principles now also require private companies and government entities to report how well they are
136. See Barbara A. Butrica, & Nadia S. Karamcheva, Automatic Enrollment, Employer Match
Rates, and Employee Compensation in 401(k) Plans, MONTHLY LABOR REV. (May 2015), https://www.bls.gov/opub/mlr/2015/article/pdf/automatic-enrollment-employer-match-rates-and-employee-compensation-in-401k-plans.pdf [https://perma.cc/USD9-5WX3].
137. See BUREAU OF LABOR STATISTICS, U.S. DEP’T OF LABOR, NEWS RELEASE, USDL-18-1500, EMPLOYEE TENURE IN 2018, at 2 (2018) [hereinafter EMPLOYEE TENURE IN 2018], https://www.bls.gov/news.release/pdf/tenure.pdf [https://perma.cc/R8S9-MRUV] (showing high levels of labor mobility: the median number of years that wage and salary workers had been with their current employer was 4.2 years in January of 2018). Meanwhile, employer contributions to defined contribution plans may not vest for 3 or more years. I.R.C. § 411(a) (2018); ERISA § 203, 29 U.S.C. § 1053 (2018); NATIONAL COMPENSATION SURVEY, 2017, supra note 9, at tbl.18 (showing the vesting rules used by savings and thrift plans in 2017); see also infra Section VII.C (discussing the impact of vesting rules on the benefit accruals of participants in defined benefit plans).
138. I.R.C. §§ 412, 430; ERISA §§ 302–03, 29 U.S.C. §§ 1082–83. For more information, see the author’s unattributed entry, Employee Retirement Income Security Act, ENCYCLOPEDIA OF AGING, https://www.encyclopedia.com/social-sciences-and-law/economics-business-and-labor/businesses-and-occupations/employee-retirement-income-security-act [https://perma.cc/3XEK-YMNS], stating:
One of the seminal events leading up to the passage of ERISA was the December 1963 shutdown of the Studebaker automobile company in South Bend, Indiana. Studebaker had promised its employees generous retirement benefits, but it had never adequately funded its plan. Consequently, the Studebaker plan was able to pay full retirement benefits only to its 3,600 retirees and to those active workers who had reached the permitted retirement age of sixty, while the company’s remaining 7,000 workers were left with little or nothing to show for their years of work.
FORMAN_22MAY20.DOCX (DO NOT DELETE) 6/30/2020 12:11 PM
2020] FULLY FUNDED PENSIONS 1235
funding their pension obligations.139 Nevertheless, many defined benefit plans are underfunded, and, in any event, relatively few workers will actually earn a significant defined benefit pension. In that regard, for example, defined benefit plans often use backloaded benefit formulas and have long vesting periods that penalize workers who change jobs frequently.140
a. Private-Sector Defined Benefit Plans All in all, the U.S. government estimated that private sector defined benefit
plans were underfunded by $553.8 billion at the end of 2018, and those plans were just 84% funded then.141
i. Single-employer Plans Single-employer defined benefit plans are required to make annual
contributions to their plans in accordance with certain minimum funding rules.142 Nevertheless, the average funded ratio for the 100 largest corporate defined benefit plan sponsors in 2018 was just 87.1%.143 In the event that an underfunded, single-employer defined benefit plan terminates (for example, because the employer goes out of business), the Pension Benefit Guaranty Corporation (PBGC) will pay annual pension benefits of up to $69,750 for a
139. The Financial Accounting Standards Board and Government Accounting Standards Board
provide detailed guidance about how to determine annual pension expenses and about how to report plan assets and liabilities. See infra notes 244 & 257 and accompanying texts.
140. See Elizabeth Bauer, Pension Plan 101: What Is Backloading And Why Does It Matter?, FORBES (Nov. 19, 2018), https://www.forbes.com/sites/ebauer/2018/11/19/pension-plan-101-what-is-backloading-and-why-does-it-matter/#5749c1bb2263 [https://perma.cc/7DTN-447C]; see also infra Section VII.C.
141. BD. OF GOVERNORS OF THE FED. RESERVE SYS., FINANCIAL ACCOUNTS OF THE UNITED STATES: FLOW OF FUNDS, BALANCE SHEETS, AND INTEGRATED MACROECONOMIC ACCOUNTS: FOURTH QUARTER 2018, at 96 tbl.L.118.b (2019) [hereinafter FINANCIAL ACCOUNTS OF THE UNITED STATES], https://www.federalreserve.gov/releases/z1/20190307/z1.pdf [https://perma.cc/5ZRG-3BXV] (0.839156 = 1.0 – ($553.8 billion claims of pension fund on sponsor / $3,443.1 billion pension entitlements [liabilities]).
142. I.R.C. §§ 412, 430; ERISA §§ 302–03, 29 U.S.C. §§ 1082–83. 143. ZORAST WADIA, ALAN H. PERRY, & CHARLES J. CLARK, MILLIMAN, 2019 CORPORATE
PENSION FUNDING STUDY 1 (2019), http://assets.milliman.com/ektron/2019-corporate-pension-funding-study.pdf [https://perma.cc/6KE6-WAEW].
FORMAN_22MAY20.DOCX (DO NOT DELETE) 6/30/2020 12:11 PM
1236 MARQUETTE LAW REVIEW [103:1205
65-year-old retiree in 2020.144 The PBGC paid over $6 billion in benefits to 932,000 retirees from failed single-employer pensions in fiscal year 2019.145
ii. Multiemployer Plans Multiemployer defined benefit pension plans are even more underfunded
than single-employer plans.146 For example, in 2015, multiemployer plans were only about 46% funded and had a total underfunded liability of $560.3 billion.147 In fiscal year 2019, the PBGC paid $160 million to provide benefits for 66,900 beneficiaries of around 89 insolvent multiemployer plans.148
In 2018, Congress created a Joint Select Committee on Solvency of Multiemployer Plans to try to solve the multiemployer funding problem, but that committee was not able to come up with a bipartisan solution.149 Many members of Congress are still working toward a solution.150 Of note, however,
144. Maximum Monthly Guarantee Tables, PENSION BENEFIT GUAR. CORP.,
https://www.pbgc.gov/wr/benefits/guaranteed-benefits/maximum-guarantee [https://perma.cc/AZE6-H67V] ($69,750 = 12 × $5,812.50 per month).
145. PENSION BENEFIT GUAR. CORP., ANNUAL REPORT 2019 1–2 (2019) [hereinafter PENSION BENEFIT GUAR. CORP. ANNUAL REPORT], https://www.pbgc.gov/sites/default/files/pbgc-fy-2019-annual-report.pdf?utm_medium=email&utm_source=govdelivery [https://perma.cc/C44Z-T56H].
146. See JCT, PRESENT LAW RELATING TO MULTIEMPLOYER DEFINED BENEFIT PLANS, supra note 49, at 53−56; JOHN J. TOPOLESKI, CONG. RES. SERV., REPORT NO. R45187, DATA ON MULTIEMPLOYER DEFINED BENEFIT (DB) PENSION PLANS 3 (2018), https://fas.org/sgp/crs/misc/R45187.pdf [https://perma.cc/ZR4B-FBDX].
147. TOPOLESKI, supra note 146, at 3 (0.4602 = $477.7 billion in assets /$1,038.0 billion owed participants). The PBGC’s multiemployer insurance program had a net deficit of $65,166 billion at the end of fiscal year 2019. PENSION BENEFIT GUAR. CORP. ANNUAL REPORT, supra note 145, at 26 tbl.; see also LADD PREPPERNAU, REX BARKER, KEVIN CAMPE, TIM CONNOR, STUART KLITERNICK, NINA LANTZ, & JOEL STEWART, MILLIMAN ANALYSIS SHOWS MULTIEMPLOYER PENSION FUNDED STATUS FALTERS IN 2018, at 1 (2019), http://assets.milliman.com/ektron/mpfs/Multiemployer_Pension_Funding_Study_20190521.pdf [https://perma.cc/N5WP-QJFT] (estimating that the aggregate funded status for multiemployer plans was 74% as of December 31, 2018—a shortfall of $176 billion).
148. PENSION BENEFIT GUAR. CORP. ANNUAL REPORT, supra note 145, at 3. 149. See MILLIMAN, MULTIEMPLOYER ALERT 1 (2019), https://millimanazurecdn-
test2.azureedge.net/-/media/milliman/importedfiles/uploadedfiles/insight/periodicals/mer/pdfs/multiemployer-alert-20190201.ashx [https://perma.cc/6QXL-XVLE].
150. See Hazel Bradford, Senate GOP Proposes Multiemployer Reform Bill, PENSIONS & INVS. (Nov. 20, 2019), https://www.pionline.com/legislation/senate-gop-proposes-multiemployer-reform-bill [https://perma.cc/4QM4-F9QY]; see generally CHARLES E. GRASSLEY & LAMAR ALEXANDER, MULTIEMPLOYER PENSION RECAPITALIZATION AND REFORM PLAN (2019), https://www.finance.senate.gov/imo/media/doc/2019-11-20%20Multiemployer%20Pension%20Recapitalization%20and%20Reform%20Plan%20White%20Paper.pdf [https://perma.cc/APC5-MBP8]; Hazel Bradford, Long Process Predicted for Multiemployer
FORMAN_22MAY20.DOCX (DO NOT DELETE) 6/30/2020 12:11 PM
2020] FULLY FUNDED PENSIONS 1237
the Further Consolidated Appropriations Act, 2020 recently authorized billions of dollars in present and future appropriations to bail out the underfunded United Mine Workers of America pension plan.151
b. Government Defined Benefit Plans Many governments also have defined benefit pension plans for their
employees. These plans are not covered by the ERISA funding rules, however,152 and most are underfunded.153 For example, the U.S. government’s civilian employee pension plans were underfunded by $968.1 billion in fiscal year 2018,154 and its military pensions were underfunded by $767.9 billion in fiscal year 2017.155 Similarly, the U.S. government estimated that state and local government pension plans were underfunded by $4.7 trillion at the end of
Reforms, PENSIONS & INVS. (July 22, 2019), https://www.pionline.com/legislation/long-process-predicted-multiemployer-reforms [https://perma.cc/26YQ-AKUN]; Rehabilitation for Multiemployer Pensions Act of 2019, H.R. 397, 116th Cong. (2019); see also John J. Topoleski, Cong. Res. Serv., Report No. R45311, Policy Options for Multiemployer Defined Benefit Pension Plans (2018), https://fas.org/sgp/crs/misc/R45311.pdf [https://perma.cc/8QSV-92T2]; CHARLES P. BLAHOUS III, MERCATUS CTR., AVERTING THE MULTIEMPLOYER PENSION SOLVENCY CRISIS (2018), https://www.mercatus.org/system/files/blahous-multiemployer-pension-crisis-mercatus-research-v1.pdf [https://perma.cc/FSB6-Y2S6].
151. Mary Williams Walsh, Congress Saves Coal Miner Pensions, but What About Others?, N.Y. TIMES (Dec. 24, 2019), https://www.nytimes.com/2019/12/24/business/coal-miner-pensions-bailout.html [https://perma.cc/M3Z2-MGLF]; Further Consolidated Appropriations Act, 2020, Pub. L. No. 116-94, Division M—Bipartisan American Miners; CONG. BUDGET OFFICE, CBO ESTIMATE FOR RULES COMMITTEE PRINT 116-44, THE FURTHER CONSOLIDATED APPROPRIATIONS ACT, 2020 (H.R. 1865) (2019), https://www.cbo.gov/system/files/2019-12/hr1865.pdf [https://perma.cc/HR5C-ZBBJ].
152. ERISA § 4(b)(1), 29 U.S.C. § 1003(b)(1) (2018). 153. See LISA SCHILLING & PATRICK WIESE, SOC’Y OF ACTUARIES, U.S. PUBLIC PENSION
CONTRIBUTION ANALYSIS 2 (2019), https://www.soa.org/Files/resources/research-report/2019/pension-plan-analysis.pdf [https://perma.cc/XD5K-LSUM] (finding that most of the plans studied received insufficient contributions to reduce their unfunded liabilities).
154. U.S. OFFICE OF PERS. MGMT., CIVIL SERVICE RETIREMENT AND DISABILITY FUND ANNUAL REPORT: FISCAL YEAR ENDED SEPTEMBER 30, 2018, at 20, 25, 25 tbl.1 (2019), https://www.opm.gov/about-us/budget-performance/other-reports/fy-2018-csrdf-annual-report.pdf [https://perma.cc/H6YK-XRTJ].
155. OFFICE OF THE ACTUARY, U.S. DEP’T OF DEFENSE, VALUATION OF THE MILITARY RETIREMENT SYSTEM AS OF SEPTEMBER 30, 2017, at 24 tbl.6A (2019), https://media.defense.gov/2019/Apr/26/2002122105/-1/-1/0/MRF%20VALRPT%202017%20[APRIL%202019]%20FINAL.PDF [https://perma.cc/Y4D7-NENV]; see also FINANCIAL ACCOUNTS OF THE UNITED STATES, supra note 141, at 98 tbl.L.119.b (showing that, in the aggregate, federal pensions were underfunded by $1,650.9 billion at the end of 2018).
FORMAN_22MAY20.DOCX (DO NOT DELETE) 6/30/2020 12:11 PM
1238 MARQUETTE LAW REVIEW [103:1205
2018 and were just 45% funded then,156 although other analysts estimate that the aggregate funding ratio for state and local government plans is around 72%.157
IV. SOME BASIC PENSION ECONOMICS AND MATHEMATICS
A. Simple Present-Value and Future-Value Mathematics To see if a pension is fully funded, one typically looks to see how the assets
in a pension plan compare with its liabilities. If the value of the assets in a plan is at least equal to the value of its accrued liabilities, we can say that the plan is fully funded. The value of assets typically involves a straightforward valuation. Determining a plan’s accrued liabilities at any point in time, however, often takes some simple calculations to determine.
At the outset, pension plans get assets from contributions (C), and as those contributions are invested, the plan earns interest and similar returns on its investments (I). The pension plan’s liabilities are the pension benefits that it will pay (B) and the expenses that it incurs to manage the plan (E). Basically, a pension plan is fully funded when:
C + I = B + E.158
156. See FINANCIAL ACCOUNTS OF THE UNITED STATES, supra note 141, at 100 tbl.L.120.b
(0.452812 = 1.0 − [$4.724.3 billion claims of pension fund on sponsor / $8,633.6 billion pension entitlements]); see also Janelle Cammenga, How Well-Funded Are Pension Plans in Your State?, TAX FOUND. (July 17, 2019), https://taxfoundation.org/state-pension-plan-funding-2019/ [https://perma.cc/58SG-ENFC] (includes a map).
157. JEAN-PIERRE AUBRY & CAROLINE V. CRAWFORD, CTR. FOR RET. RES. AT BOS. COLL., UPDATE ON THE FUNDED STATUS OF STATE AND LOCAL PENSION PLANS – FY 2018, at 1, 2 fig.1 (2019), https://slge.org/assets/uploads/2019/09/funding-brief-oct2019.pdf [https://perma.cc/3Y2A-D58D]; JEAN-PIERRE AUBRY, CAROLINE V. CRAWFORD, & KEVIN WANDREI, CTR. FOR RET. RES. AT BOS. COLL., STABILITY IN OVERALL PENSION PLAN FUNDING MASKS A GROWING DIVIDE 1, 2 (2018), http://crr.bc.edu/wp-content/uploads/2018/10/slp_62.pdf [https://perma.cc/S47B-S4QQ] (estimating that state and local government pension plans were 72% funded in fiscal year 2017); REBECCA A. SIELMAN, MILLIMAN, 2019 PUBLIC PENSION FUNDING STUDY 1–2 (2019), http://assets.milliman.com/ektron/2019_Public_Pension_Funding_Study.pdf [https://perma.cc/K34Q-4GSC] (estimating that the 100 largest public pension plans were 73.4% funded as of June 30, 2019).
158. NAT’L ASS’N OF STATE RET. ADM’RS, STATE AND LOCAL GOVERNMENT CONTRIBUTIONS TO STATEWIDE PENSION PLANS: FY 17, at 1 (2019) [hereinafter NASRA, STATE AND LOCAL GOVERNMENT CONTRIBUTIONS], https://www.nasra.org/files/Issue%20Briefs/NASRAADCBrief.pdf [https://perma.cc/6ZS6-8R85].
FORMAN_22MAY20.DOCX (DO NOT DELETE) 6/30/2020 12:11 PM
2020] FULLY FUNDED PENSIONS 1239
Expenses are usually trivial compared to benefits and can be ignored here,159 leaving the full funding formula as:
C + I = B. Analysts can use this formula to see how well funded a pension plan is at
any point in time—now or in the future. To be sure, most benefits will be paid in the future, and pension plans can collect a lot of contributions and earn a lot of investment income on plan assets between now and when those benefits are to be paid. Accordingly, to decide whether a plan is fully funded, analysts need to compare the future value of the plan’s assets with the future value of the pension plan’s liabilities. Alternatively, analysts can compare the present value of a plan’s assets with the present value of its liabilities, and this approach is what most analysts actually do. Either way, some mathematics is involved.160
At its simplest, suppose that a hypothetical employer promises to pay a current employee $10,000 in 10 years. That is a $10,000 future liability, and the question is how much should the employer set aside today in order to have enough to pay that accrued liability in 10 years. Certainly, $10,000 would be enough, but since any money that the employer sets aside today can be invested and earn interest for 10 years, the employer can set aside a much smaller amount today. For example, as more fully explained below, if the hypothetical employer can earn 5% interest over each of the next 10 years, then setting aside $6,139.13 today will be enough, as the present value of $10,000 in 10 years discounted at 5% is $6,139.13 today.161 In short, the employer has an accrued liability of $6,139.13, and setting that amount aside today would fully fund its obligation to pay that hypothetical employee $10,000 in 10 years (i.e., 100% funded). Here is the explanation.
Basically, present value is the reverse of compound interest. The compound interest formula to determine a future value (FV) is:
FV = P (1 + r)Y,
159. Of course, all plans should strive to minimize fees. See generally Jonathan Barry Forman,
The Future of 401(k) Plan Fees, N.Y.U. REV. OF EMP. BENEFITS & EXEC. COMP. 9-1 (2007) [hereinafter Forman, The Future of 401(k)].
160. Here is a very simple present value example. Suppose you have $1,000 today, and you can earn 5% annual interest on an investment. That means you can earn $50 interest in a year ($50 = 5% × $1,000), and if you made that investment and held it for one year, you would have $1,050 at the end of the year ($1,050 = $1,000 + $50), and the present value of the right to receive $1,050 in one year is $1,000. Similarly, if you kept your money in that investment for another year (two years total), it would grow to $1,102.50 ($1,102.50 = $1,050 + $52.50; $52.50 = 5% × $1,050); and the present value of the right to receive $1,102.50 in two years is $1,000.
161. See infra note 163 and accompanying text.
FORMAN_22MAY20.DOCX (DO NOT DELETE) 6/30/2020 12:11 PM
1240 MARQUETTE LAW REVIEW [103:1205
where P is the starting principal, r is the annual interest rate, and Y is the number of years invested.162 Thus, in the example, if the employer sets aside $6,139.13 today and earns 5% interest for 10 years, the employer will have $10,000 in 10 years to pay the employee, and we could say the employer’s liability is fully funded (i.e., 100% funded).163 If, instead, the employer only sets aside $4,000 today, we would say that the employer’s obligation is underfunded. On the other hand, if the employer sets aside $8,000 today, we would say that the obligation is overfunded.
If we know a future value, the compound interest formula can easily be rearranged to solve for the starting principal P, which we will now rename as Present Value (PV). Accordingly, the present value formula is:
PV = FV / (1 + r)Y,
and in the example, the present value of the right to receive $10,000 in 10 years is $6,139.13.164
B. The Mathematics of Converting a Lump Sum into an Annuity (and Vice Versa)
The mathematics of converting a lump sum into a lifetime annuity or pension is pretty straightforward. If an individual has a fixed principal sum to invest today and we know the interest rate that she can earn and how long she is expected to live, we can determine the annuity amount that that person (i.e., the annuitant) will receive each period.165 For example, if an individual has $100,000 to invest in an annuity today, can earn 5% interest per year, and can expect to receive 20 annual annuity payments (i.e., live for 20 years), a simple annuity calculator shows that each annual annuity payment would be
162. The usual convention is to use “r” for the interest rate rather than “i” for interest. This
simple formula assumes that interest is compounded just once a year, and a slightly more complicated formula can be used if interest is to be compounded more frequently. See Compound Interest Calculator, MONEYCHIMP, http://www.moneychimp.com/articles/finworks/fmfutval.htm [https://perma.cc/8JMW-E9F8].
163. $10,000 = FV = P (1 + r)Y = $6,139.13 × (1 + 0.05)10. 164. $6,139.13 = PV = FV / (1 + r)Y = $10,000 / (1 + 0.05)10. See Present Value Calculator,
MONEYCHIMP, http://www.moneychimp.com/calculator/present_value_calculator.htm [https://perma.cc/EX98-EHTG].
165. The general formula to solve for the periodic annuity amount is: w = [P(1 + r)Y - 1r ] / [(1 + r)Y − 1]
where P is the present value (= starting principal) of a stream of annual withdrawal amounts (w) given an interest rate (r) over a number of Years (Y). See Annuity, MONEYCHIMP, http://www.moneychimp.com/articles/finworks/fmpayout.htm [https://perma.cc/TM3F-GJ4T].
FORMAN_22MAY20.DOCX (DO NOT DELETE) 6/30/2020 12:11 PM
2020] FULLY FUNDED PENSIONS 1241
$8,024.26.166 Annuities (and pensions) typically make monthly payments, but the mathematical principles are the same for yearly or monthly payments.
By the same token, the mathematics of converting a lifetime annuity into a lump sum is also quite straightforward. Basically, a lump sum value is determined by converting a stream of projected future benefit payments into a present value.167 We just need to know the applicable interest rate and the number of future benefit payments that the annuitant expects to receive.168 The interest rate (also known as the discount rate) is the rate of return that can be earned on the investment, and it is determined by market forces. The number of future benefit payments that the individual is expected to receive is extrapolated from a mortality table. In the example, when the discount rate is 5%, the present value of a stream of 20 annual payments of $8,024.26 commencing one year from today is $100,000.169 In short, the present value of a 20-year, $8,024.26-per-year annuity is $100,000 (that is, when a 5% interest rate and a 20-year life expectancy are the correct actuarial assumptions).170
166. Annuity Calculator, MONEYCHIMP, http://www.moneychimp.com/calculator/annuity_calculator.htm [https://perma.cc/QL23-AXHF] (Starting Principal: $100,000.00; Growth Rate: 5%; Years to Pay Out: 20; Make payouts at the: end of each year; result is Annual Payout Amount = $8,024.26).
167. See, e.g., U.S. GOV’T ACCOUNTABILITY OFFICE, GAO-15-74, PRIVATE PENSIONS: PARTICIPANTS NEED BETTER INFORMATION WHEN OFFERED LUMP SUMS THAT REPLACE THEIR LIFETIME BENEFITS app. at 60 (2015), http://www.gao.gov/assets/670/668106.pdf [https://perma.cc/KQ9C-CTHU].
168. The general formula for the present value of a stream of annuity payments is: P = w[(1 + r)Y − 1] / [(1 + r)Yr]
where P is the present value (= starting principal) of a stream of annual withdrawal amounts (w) given an interest rate (r) over a number of Years (Y). See Annuity, MONEYCHIMP, supra note 165.
169. To check this result, see Present Value of an Annuity Calculator, MONEYCHIMP, http://www.moneychimp.com/calculator/present_value_annuity_calculator.htm [https://perma.cc/W58H-YL3H] (Annual Payout: $8,024.26; Growth Rate: 5%; Years to Pay Out: 20; Make payouts at the: end of each year; result is Present Value = $100,000.02; close enough!).
170. Note, actuaries do not determine the present value of a lifetime annuity by using life expectancy. Instead, each future annuity payment until the end of the mortality table is multiplied by the probability that the person will survive to receive that payment, and then those adjusted amounts are discounted to the present and summed. For example, in the Social Security Administration’s 2016 Period Life Table, a 65-year-old male has a death probability of 0.015808 (i.e., the probability of dying before he reaches age 66). Actuarial Life Table, SOC. SECURITY ADMIN. https://www.ssa.gov/oact/STATS/table4c6.html [https://perma.cc/N7WP-A4AL] (select the period life table for 2016). Consequently, his probability of living to age 66 and collecting an annual annuity payment then is 0.984192 (0.984192 = 1.0 − 0.015808). Accordingly, the expected value of the right to receive an annual annuity payment of, say, $10,000 at age 66 is $9,841.92 ($9,841.92 = 0.984192 × $10,000); and if the discount rate is 5%, then the present value (at age 65) of that $9,841.92 is $9,373.26 ($9,371 = $9,841.92 / 1.05). Like most current actuarial life tables, the Social Security Administration’s 2016 period life table assumes that the last survivor dies at age 120, and, accordingly,
FORMAN_22MAY20.DOCX (DO NOT DELETE) 6/30/2020 12:11 PM
1242 MARQUETTE LAW REVIEW [103:1205
V. BENEFIT ACCRUAL AND FUNDING TRADITIONAL DEFINED BENEFIT PLANS This Article develops several simplified model pension plans that are
designed to replace 40% of a typical worker’s preretirement earnings. These model pension plans are similar to—but less complicated than—real world pension plans. These model pension plans also rely on a variety of simplifying demographic and economic assumptions, and all the model pension plans focus on a single hypothetical worker. Using this approach makes it easier to focus on full funding issues without immediately getting bogged down in the cluttering details of real-world pension plans.171
A. The Model Defined Benefit Plan This Section develops a simplified model defined benefit plan that would
provide a typical worker with a pension benefit equal to 40% of her preretirement earnings. While there are many possible ways to design a model defined benefit plan that would provide a benefit equal to 40% of a worker’s preretirement earnings, this Article takes a simple and straightforward approach. Basically, under the model defined benefit plan, each worker will earn a pension benefit (B) equal to 1% times years of service (yos) times final pay (fp) (B = 1% × yos × fp). The model plan also assumes that the typical worker starts work at age 25, works from age 25 through age 64, and therefore earns a pension benefit equal to 1% of final pay in each of those 40 years. The model plan further assumes that the typical worker then retires at age 65 and goes on to collect a pension equal to 40% of her final pay from retirement at age 65 until her death at age 85. For example, if the hypothetical worker had final pay of $100,000, she would be entitled to a pension, starting at age 65, of $40,000 a year from age 65 through age 84 ($40,000 B = 1% × 40 yos × $100,000 fp). At the outset, Table 4 summarizes the key assumptions for the model defined benefit plan, and these assumptions are explained in turn.
death probabilities are provided for individuals through age 119. The present value of a $10,000 lifetime annuity equals the sum of the present value of the many expected future payments from age 65 (or age 66 if payments instead start then) to age 120. In the real world, insurance companies rely on actuarial present value determinations like this to determine the selling price for their annuity products.
171. In that regard, the design of any model pension plan is always somewhat arbitrary, and the economic and demographic assumptions that are used with a model pension plan can also seem somewhat arbitrary—even if each of those assumptions is quite defensible. As the focus of this Article is largely on the full funding of whatever pension benefits are promised, however, this Article’s analysis and ultimate recommendations are just not that dependent on the actual size or level of the promised pension benefits. In any event, many real-world complications are discussed in Part VIII, infra.
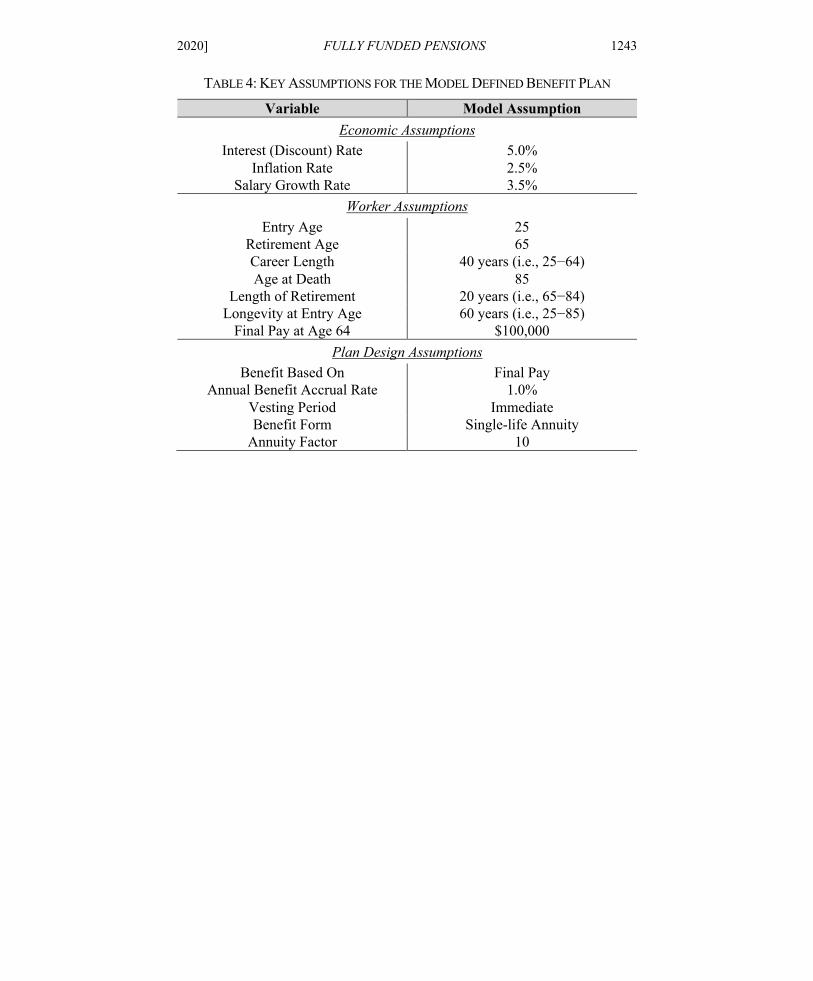
FORMAN_22MAY20.DOCX (DO NOT DELETE) 6/30/2020 12:11 PM
2020] FULLY FUNDED PENSIONS 1243
TABLE 4: KEY ASSUMPTIONS FOR THE MODEL DEFINED BENEFIT PLAN
Variable Model Assumption Economic Assumptions
Interest (Discount) Rate 5.0% Inflation Rate 2.5%
Salary Growth Rate 3.5% Worker Assumptions
Entry Age 25 Retirement Age 65 Career Length 40 years (i.e., 25−64) Age at Death 85
Length of Retirement 20 years (i.e., 65−84) Longevity at Entry Age 60 years (i.e., 25−85)
Final Pay at Age 64 $100,000 Plan Design Assumptions
Benefit Based On Final Pay Annual Benefit Accrual Rate 1.0%
Vesting Period Immediate Benefit Form Single-life Annuity
Annuity Factor 10
FORMAN_22MAY20.DOCX (DO NOT DELETE) 6/30/2020 12:11 PM
1244 MARQUETTE LAW REVIEW [103:1205
1. Economic Assumptions
a. Interest (Discount) Rate—5% The model defined benefit plan assumes that the annual interest rate is
5%.172 That means investments earn a 5% rate of return, and present values and liabilities are also discounted at a 5% rate.173
172. With respect to private-sector defined benefit plans, many Internal Revenue Service (IRS)
and PBGC pension calculations use a blended rate that is determined by applying an adjusted corporate bond-based yield curve. See, e.g., I.R.S. Notice 2007-81, 2007-44 I.R.B. 899; 26 C.F.R. § 1.430(h)(2)-1 (2014); Monthly Interest Rate Statement, PENSION BENEFIT GUAR. CORP., https://www.pbgc.gov/prac/interest/monthly [https://perma.cc/F64F-KHBK] (those IRS segment rates are “used to determine the variable-rate premium”). More specifically, the blended rate is based on a combination of segment rates that are promulgated by the IRS: the short term rate (for benefits that are payable within the first 5 years of calculation), the intermediate term rate (for benefits that are payable in the next 10 years of calculation, or years 5−15), and the long-term rate (for benefits that are payable in the years beyond year 15). See Minimum Present Value Segment Rates, INTERNAL REVENUE SERV., https://www.irs.gov/retirement-plans/minimum-present-value-segment-rates [https://perma.cc/PM7N-QD62]. For example, in January of 2020, the IRS segment rates were 1.91% for the first segment, 2.93% for the second segment, and 3.54% for the third segment. Id.; see also Funding Yield Curve Segment Rates, INTERNAL REVENUE SERV., https://www.irs.gov/retirement-plans/funding-yield-curve-segment-rates [https://perma.cc/BS9N-7DNC] (showing various funding yield curve segment rates); Pension Discount Yield Curve and Index Rates in US, MERCER, https://www.mercer.us/our-thinking/wealth/mercer-pension-discount-yield-curve-and-index-rates-in-us.html [https://perma.cc/YJ3M-93V2] (showing Mercer Index Rates for its large sample of private pension plans of 2.87% for the Retiree plan, 3.10% for the Mature plan, 3.23% for the Average plan, and 3.27% for the Young plan); WADIA, PERRY, & CLARK, supra note 143, at 1, 2 fig.2, 9 fig.16 (showing that the Milliman 100 largest pension plan sponsors used a 4.01% discount rate in 2018 and had an expected rate of return on assets of 6.6%); LISA SCHILLING, SOC’Y OF ACTUARIES, U.S. PENSION PLAN DISCOUNT RATE COMPARISONS 2009−2014, at 1–2 (2016), https://www.soa.org/Files/Research/Projects/research-2016-us-pension-plan-discount-rate-comparison.pdf [https://perma.cc/B7X2-M8YC] (showing discount rates for 2009−2014); LEON C. LABRECQUE, LUMP-SUM PENSIONS AND INTEREST RATES: HOW LUMP-SUMS CAN GO DOWN WHEN INTEREST RATES RISE 1–4 (2017), https://ljpr.com/wp-content/uploads/2015/07/Interest-Rates-and-Lump-Sums-APPROVED.pdf [https://perma.cc/23SQ-7GQ9] (explaining how interest rates and other factors can change the value of a lump-sum distribution).
With respect to public sector defined benefit plans, see NAT’L ASS’N OF STATE RET. ADM’RS, PUBLIC PENSION PLAN INVESTMENT RETURN ASSUMPTIONS 2 fig.2 (2019) [hereinafter NASRA, PUBLIC PENSION PLAN INVESTMENT], https://www.nasra.org/files/Issue%20Briefs/NASRAInvReturnAssumptBrief.pdf [https://perma.cc/B4L2-RCWD] (finding an average assumed nominal rate-of-return assumption of 7.36% (in 2017) in a survey of state and local pension plans).
173. Much has been written about the topic of discount rate, and it is not the author’s intention to wade into that discussion here (except to say that the author believes that the 7.36 average discount rates used by public sector pension plans seem to be way too high). See generally JOHN A. TURNER, HUMBERTO GODINEZ-OLIVARES, DAVID D. MCCARTHY, & MARIA DEL CARMEN BOADO-PENAS, SOC’Y OF ACTUARIES, DETERMINING DISCOUNT RATES REQUIRED TO FUND DEFINED BENEFIT
FORMAN_22MAY20.DOCX (DO NOT DELETE) 6/30/2020 12:11 PM
2020] FULLY FUNDED PENSIONS 1245
b. Inflation Rate—2.5% The model plan assumes that the annual inflation rate is 2.5%.174 The
inflation rate does not actually figure directly into the simple model pension plans created in this Article; nevertheless, it is an important economic variable. For example, given the nominal interest (discount) rate is assumed to be 5%, the real economic rate of return is 2.5% (2.5% real rate of return = 5% nominal interest rate – 2.5% inflation rate).175
c. Salary Growth Rate—3.5% a Year To calculate the value of a worker’s accrued pension benefit, one also needs
to make assumptions about how a worker’s salary will grow over the course of her career. The model pension plan assumes that each worker’s salary will grow by 3.5% every year.176 For example, if the salary of a worker in the current year is $30,000, the model plan assumes that it will be $31,050 next year ($31,050 = 1.035 × $30,000), and so on until retirement.
2. Worker Assumptions
a. Entry Age—25, Retirement Age 65, and a 40-year Career (from age 25 through age 64)
The model defined benefit plan assumes that the hypothetical worker starts working for her employer at age 25 and stays with that employer until retiring at age 65. In that regard, age 65 is the typical retirement age used in analyses
PLANS (2017), https://www.soa.org/Files/Research/Projects/determining-discount-rates.pdf [https://perma.cc/7K7T-PVLM] (discussing the appropriate discount rate); Craig Foltin, Dale L. Flesher, Gary J. Previts, & Mary S. Stone, State and Local Government Pensions at the Crossroads: Updating Accounting Standards Highlight the Challenges, CPA J. (Apr. 2017), https://www.cpajournal.com/2017/05/08/state-local-government-pensions-crossroads/ [https://perma.cc/MMP4-DGV2] (discussing the appropriate discount rate). In any event, choosing a different discount rate would not make much difference in this Article’s analysis and conclusions.
174. See 2019 SOCIAL SECURITY TRUSTEES REPORT, supra note 11, at 8, 98−100 (2.60% a year is the Social Security Administration’s intermediate inflation assumption. “The intermediate assumptions reflect the Trustees’ best estimates of future experience.”); see also NASRA, PUBLIC PENSION PLAN INVESTMENT, supra note 172, at 2 fig.2 (finding an average assumed inflation rate of 2.80% in a survey of 129 state and local pension plans).
175. The model pension plans do not provide cost-of-living adjustments (COLAs); however, the cost of providing a COLA is considered in Section VII.B infra.
176. See, e.g., 2019 SOCIAL SECURITY TRUSTEES REPORT, supra note 11, at 100−103 (1.21% is the Social Security Administration’s intermediate real-wage differential assumption, i.e., nominal wage growth is 3.81% = 1.21% real-wage differential + 2.60% inflation).
FORMAN_22MAY20.DOCX (DO NOT DELETE) 6/30/2020 12:11 PM
1246 MARQUETTE LAW REVIEW [103:1205
such as this,177 and it is not intended here to be a recommended retirement age. While most Americans do, in fact, retire by age 65,178 the full retirement age for Social Security is already age 66 and headed to age 67,179 and many analysts recommend that workers maximize their Social Security benefits by working until age 70 if they can.180 Pertinent here, ERISA generally defines the normal retirement age for pensions as age 65,181 and the required minimum distribution rules generally require pension plan participants to begin taking distributions soon after they reach age 72.182
Implicitly, the model defined benefit plan also assumes a 40-year working career with pension coverage. To be sure, many traditional pensions in the real world today assume that workers will retire after 30 years of service.183 Still, the 40-year career assumed here is reasonable given the longer lives and longer retirements that today’s workers should plan on having. In any event, the model has to start somewhere, and 40 years is a reasonable length for a career.184
177. JACK VANDERHEI, EMP. BENEFIT RESEARCH INST., ISSUE BRIEF NO. 473, HOW MUCH
WOULD IT TAKE? ACHIEVING RETIREMENT INCOME EQUIVALENCY BETWEEN FINAL-AVERAGE-PAY DEFINED BENEFIT PLAN ACCRUALS AND AUTOMATIC ENROLLMENT 401(K) PLANS IN THE PRIVATE SECTOR 8 (2019) [hereinafter VANDERHEI, HOW MUCH WOULD IT TAKE?], https://www.ebri.org/content/how-much-would-it-take-achieving-retirement-income-equivalency-between-final-average-pay-defined-benefit-plan-accruals-and-automatic-enrollment-401(k)-plans-in-the-private-sector [https://perma.cc/36QD-WQG2].
178. ALICIA H. MUNNELL, CTR. FOR RET. RES. AT BOSTON COLLEGE, ISSUE IN BRIEF NO. 11-11, WHAT IS THE AVERAGE RETIREMENT AGE? 1, 3, (2011), https://crr.bc.edu/wp-content/uploads/2011/08/IB_11-11-508.pdf [https://perma.cc/G2TD-F8S8].
179. See Retirement Benefits Planner, supra note 18. 180. See Knoll & Olsen, supra note 30, at 22. 181. More specifically, ERISA generally defines “normal retirement age” as the earlier of the
time specified in the plan or age 65. I.R.C. § 411(a)(8) (2018); ERISA § 3(24), 29 U.S.C. § 1002(24) (2018).
182. I.R.C. § 401(a)(9) (as revised by the Further Consolidated Appropriations Act, 2020, Pub. L. No. 116-94, Division O—Setting Every Community Up for Retirement Enhancement § 114).
183. For example, many plans permit employees with 30 years of service to retire even before they reach age 65. See, e.g., NATIONAL COMPENSATION SURVEY, 2016, supra note 9, at tbl.9.
184. Of note, the author is currently in his 42nd year as a full-time attorney since graduating law school in 1978 (at age 25), and he is currently in his 34th year as a professor at the University of Oklahoma College of Law.
FORMAN_22MAY20.DOCX (DO NOT DELETE) 6/30/2020 12:11 PM
2020] FULLY FUNDED PENSIONS 1247
To be sure, in the real world, very few employees actually work for 40 years before retiring,185 let alone for 40 years with the same employer.186 In planning for adequate retirement incomes, however, workers should want to earn some kind of pension benefits on almost every job they hold and certainly on almost every job they hold from age 25 until retirement. Making the assumption that the hypothetical employee works for a single employer throughout her career avoids the complexity of trying to consolidate pension benefits earned from multiple employers.187
185. Estimating the average career length of American men and women is a challenge. The U.S.’s Bureau of Labor Statistics stopped producing “worklife estimates” in 1986. Labor Force Statistics from the Current Population Survey, BUREAU OF LABOR STATISTICS, U.S. DEP’T OF LABOR, https://www.bls.gov/cps/lfcharacteristics.htm#worklife [https://perma.cc/4LXH-9LWF]; NATIONAL COMPENSATION SURVEY, 2016, supra note 9, at tbl.12. See generally BUREAU OF LABOR STATISTICS, U.S. DEP’T OF LABOR, BULL. NO. 2254, WORKLIFE ESTIMATES: EFFECTS OF RACE AND EDUCATION (1986), https://www.bls.gov/opub/reports/worklife-estimates/archive/worklife-estimates-1986.pdf [https://perma.cc/EWN4-TG39]. Since then, various forensic economists have developed worklife expectancy charts to help answer tort damages questions like “How much would a 40-year-old doctor killed in a car accident have earned over the rest of his then-expected working career?” See, e.g., Kurt V. Krueger & Frank Slesnick, Total Worklife Expectancy, 25 J. FORENSIC ECON. 51, 61 tbl.3 (2014) (estimating that 25-year-old males who were actively participating in the labor force would spend about 33.67 more years in the labor force, and active 25-year-old females would spend about 27.36 more years in the labor force).
Another approach for estimating average career length involves looking at Social Security records. In order to compute an individual’s Social Security benefits, the Social Security Administration reviews each worker’s earnings in covered employment. See supra note 23 and accompanying text. In that regard, one study used Social Security administrative data files to determine the median number of Social-Security-covered work years from ages 14−61 for a sample of birth cohort 1945 individuals who were newly eligible for retired worker benefits in 2007; it found that the median worker had around 36 years in covered employment (41 years for males and 31 years for females). Hilary Waldron, The Sensitivity of Proposed Social Security Benefit Formula Changes to Lifetime See Earnings Definitions, 72 SOC. SECURITY BULL. 1, 13 tbl.5 (2012). Pertinent here, 48% of women and 42% of men who claimed Social Security retired-worker benefits in 2013 were age 62. ALICIA H. MUNNELL & ANQI CHEN, CTR. FOR RET. RES. AT BOS. COLL., ISSUE IN BRIEF NO. 15-8, TRENDS IN SOCIAL SECURITY CLAIMING 1 (2015), http://crr.bc.edu/wp-content/uploads/2015/05/IB_15-8.pdf [https://perma.cc/95MW-ZLHR].
186. See, e.g., EMPLOYEE TENURE IN 2018, supra note 137, at 1–2 (showing that the median number of years that wage and salary workers had been with their current employer was about 4.2 years in January of 2018). The median job tenure is higher for older workers than younger workers. Id. at tbl.1 (showing that the median tenure of workers ages 55 to 64 was 10.1 years compared with just 2.8 years for workers ages 25 to 34).
187. As more fully explained in the discussion infra Section VIII.B, making it easier for workers to consolidate the benefits that they earn from working for multiple employers over the course of their careers could help them achieve higher retirement incomes. To be sure, workers can sometimes consolidate benefits through rollovers, but most analysts favor additional portability mechanisms. See generally COMMON WEALTH & ASPEN INST. FIN. SEC. PROGRAM, PORTABLE NON-EMPLOYER RETIREMENT BENEFITS: AN APPROACH TO EXPANDING COVERAGE FOR A 21ST CENTURY
FORMAN_22MAY20.DOCX (DO NOT DELETE) 6/30/2020 12:11 PM
1248 MARQUETTE LAW REVIEW [103:1205
b. Mortality Assumptions—A 20-year Retirement and Death at Age 85 The model defined benefit plan also assumes a 20-year retirement from age
65 through age 84—with death at age 85. Again, the model has to start somewhere, and a 20-year retirement is quite plausible. For example, according to the National Center for Health Statistics, the life expectancy of a 65-year-old in 2017 was 19.4 years (18.1 years for men and 20.6 years for women).188 To be sure, life expectancies are increasing, and today’s new entrants can expect to live even longer.189 While it might make sense to instead assume a slightly
WORKFORCE (2019), https://assets.aspeninstitute.org/content/uploads/2019/02/Portable-nonemployer-retirement-benefits.pdf?_ga=2.157195193.347029611.1551971220-935375820.1551971220 [https://perma.cc/2WN2-J84W].
188. NAT’L CTR. FOR HEALTH STATISTICS, CTR. FOR DISEASE CONTROL AND PREVENTION, U.S. DEP’T OF HEALTH AND HUM. SERVS., HEALTH, UNITED STATES, 2018 tbl.4 (2018), https://www.cdc.gov/nchs/data/hus/hus18.pdf [https://perma.cc/WE2S-YP2D] (on p. viii, click on Table 4); see, e.g., 2019 SOCIAL SECURITY TRUSTEES REPORT, supra note 11, at 95 tbl.V.A4; see also infra Table 12 (where columns 6 and 7 show the Social Security Administration’s similar estimates of period life expectancy in 2016 for males and females of various ages (e.g., 17.9-year period life expectancy for a 65-year-old man and 20.5-year period life expectancy for a 65-year-old woman)). Another source of slightly different life expectancy estimates is the HUMAN MORTALITY DATABASE, https://www.mortality.org/ [https://perma.cc/2FQL-FK48]. See generally Magali Barbieri, Investigating the Difference in Mortality Estimates between the Social Security Administration Trustees’ Report and the Human Mortality Database (Mich. Ret. Res. Ctr., Working Paper No. 2018-394, 2018), https://mrdrc.isr.umich.edu/publications/papers/pdf/wp394.pdf [https://perma.cc/ND3H-UYGV].
There are two types of life expectancy tables: cohort or period. A cohort life expectancy table presents the expected mortality experience of a particular age cohort—all persons who turned age 65 in 2016, for example—from then on, and a cohort table includes projected improvements in their life expectancy in the future. On the other hand, a period life expectancy table does not represent the mortality experience of an actual birth cohort; instead, the period life table presents what would happen to that cohort if it experienced throughout its entire life the mortality conditions that existed as of a particular point in time. For example, a period life table in 2017 assumes that a 65-year-old man will experience throughout his entire life the age-specific death rates that prevailed in the actual population in 2017. See Elizabeth Arias & Jiaquan Xu, United States Life Tables, 2017, NATIONAL VITAL STATISTICS REPORTS, June 24, 2019, at 1, 1 (showing period life expectancies). As health care improves and longevity increases, cohort life expectancies are generally longer than period life expectancies. At age 65, however, they are not all that different. For example, while the Social Security Trustees’ 2016 period life expectancy table shows a 17.9-year period life expectancy for a 65-year-old man and 20.5-year period life expectancy for a 65-year-old woman, its 2016 cohort life expectancy table shows an 18.8-year cohort life expectancy for a 65-year-old man and a 21.3-year cohort life expectancy for a 65-year-old woman. See 2019 SOCIAL SECURITY TRUSTEES REPORT, supra note 11, at 95 tbl.V.A4, 96 tbl.V.A5.
189. See, e.g., id. at 95 tbl.V.A4 (showing period life expectancies for men and women at birth and at age 65 from 1940 through 2095); id. at 96 tbl.V.A5 (showing cohort life expectancies at birth and at age 65 from 1940 to 2095).
FORMAN_22MAY20.DOCX (DO NOT DELETE) 6/30/2020 12:11 PM
2020] FULLY FUNDED PENSIONS 1249
longer retirement (i.e., death at an older age), a 20-year retirement is certainly plausible, and 20 is certainly an easy-to-work-with number.
Implicitly, the model defined benefit plan also ignores the reality that some 25-year-olds will not, in fact, live to age 65. In that regard, for example, extrapolating from the Social Security Administration’s 2016 Period Life Table, of 100,000 male live births, approximately 98,055 might be expected to survive to age 25, and of those survivors, approximately 79,893 (81.5%) might be expected to survive until age 65 (0.8147 = 79,893 / 98,055).190 Choosing to ignore employee deaths before retirement would not affect the benefit accrual of those workers who live to age 65 that are the focus of this Article; however, in passing, it is worth noting that those deaths of employees younger than age 65 usually reduce the funding obligations of real-world defined benefit plan sponsors as the accrued benefits of those who die before age 65 are typically forfeited.191
c. Final Salary—$100,000 Leads to Starting Salary Around $26,000 The model defined benefit plans also assumes that the hypothetical worker
has an easy-to-work-with final salary of $100,000 a year at age 64. Given the assumed salary growth rate of 3.5%, that $100,000 final salary leads to a plausible starting salary of around $26,141 ($26,141.25 = $100,000 / 1.03539).192
190. See Actuarial Life Table, supra note 170. Similarly, of 100,000 female live births, approximately 98,861 might be expected to survive to age 25. Of those survivors, 87,574 (88.6%) might be expected to survive until age 65 (0.8858 = 87,574 / 98,861). Id. The phrase “might be” is used with respect to these extrapolations, as this period life table is not quite the right resource for making such survival predictions.
191. In short, assuming that all 25-year-old workers live to age 65 is heroic. The model plan also ignores terminations. In the real world, however, plan sponsors often count on getting actuarial gains when at least some of their workforce leave when they have fewer years of service and lower salaries than they would have had if they had stayed until age 65. That is, as some workers die or leave before retirement, any given defined benefit plan sponsor can meet its funding obligations with lower contributions.
192. Excel was used to create most of the tables and figures in this article, but rounded numbers are usually used in this Article’s text and footnotes. As this footnote explains, that $26,141 starting salary is probably a little bit low, but it is directly tied to that $100,000 final salary number that will so greatly simplify many explanations and discussions in this Article. Pertinent here, in the fourth quarter of 2018, the Bureau of Labor Statistics reported that the median usual weekly earnings of full-time workers age 20 to 24 was $594 a week ($30,888 a year = 52 weeks × $594 median usual weekly earnings), and the median usual earnings for workers age 25 to 34 was $820 a week ($42,640 year = 52 weeks × $820 median usual weekly earnings). BUREAU OF LABOR STATISTICS, U.S. DEP’T OF LABOR, NEWS RELEASE, USDL-19-0077, USUAL WEEKLY EARNINGS OF WAGE AND SALARY WORKERS, FOURTH QUARTER 2018, at tbl.3 (2019), https://www.bls.gov/news.release/archives/wkyeng_01172019.pdf [https://perma.cc/QQ5Y-EJQB].
FORMAN_22MAY20.DOCX (DO NOT DELETE) 6/30/2020 12:11 PM
1250 MARQUETTE LAW REVIEW [103:1205
3. Plan Design Assumptions
a. Benefit Based on Final Pay Rather than Final Average Pay The model defined benefit plan uses final pay rather than final average pay.
Admittedly, most traditional plans in the real world use average pay over several final years,193 rather than basing the pension on the single final year, and the single-year approach for this model plan is the more expensive of the two possibilities; however, the single-year approach makes for less complicated discussions in this Article.
b. Annual Benefit Accrual Rate—1% The model defined benefit plan also assumes a 1%-per-year annual benefit
accrual rate. Historically, many traditional defined benefit plans provided higher annual benefit accrual rates (e.g., 2% over a 30-year career),194 and even today, 2% is a common annual benefit accrual rate in many state and local pension plans.195 On the other hand, the annual benefit accrual rate for most federal employees covered by the Federal Employees Retirement System (FERS) is now just 1%,196 down from 2% for most workers hired under the predecessor Civil Service Retirement System.197 In any event, the model defined benefit plan assumes a 1% annual benefit accrual rate, and that would result in a pension equal to 40% of final pay for a worker with a 40-year career.198 In short, the model defined benefit plan uses 1% over 40 years as a
193. See Wiatrowski, supra note 60, at 16. 194. See, e.g., Barbara A. Butrica, Howard M. Iams, Karen E. Smith, & Eric J. Toder, The
Disappearing Defined Benefit Pension and Its Potential Impact on the Retirement Incomes of Baby Boomers, 69 SOC. SECURITY BULL. 1, 1, 15 (2009); see also Richard Works, Trends in Employer Costs for Defined Benefit Plans, BEYOND THE NUMBERS, Feb. 2016, at 1, 7 (showing the average costs to employers per hour for providing their employees with defined benefit plan coverage).
195. See Kramer & Ranon-Hernandez, supra note 9, at 2. 196. KATELIN P. ISAACS, CONG. RES. SERV., 92-972, FEDERAL EMPLOYEES’ RETIREMENT
SYSTEM: SUMMARY OF RECENT TRENDS 1 (2018), https://fas.org/sgp/crs/misc/98-972.pdf [https://perma.cc/Q4YL-3K8Q]; FERS Information: Computation, U.S. OFFICE PERSONNEL MGMT., https://www.opm.gov/retirement-services/fers-information/ [https://perma.cc/83DD-7US7] (then, select the Computation hyperlink) (explaining that the Federal Employees Retirement System provides typical workers with a basic annuity of 1% of the employee’s high-3 average salary for each year of service).
197. CSRS Information, U.S. OFFICE PERSONNEL MGMT., https://www.opm.gov/retirement-services/csrs-information/ [https://perma.cc/2D4D-KRYB] (then, select the Computation hyperlink to see how benefits accrue over the course of a covered worker’s career).
198. Also, if a reader believes that a larger pension is needed for any reason, that higher pension could easily be created (1) by multiplying this Article’s 1%-per-year benefit accrual rate by a factor of, say, 1.5 or 2; or, alternatively, (2) by increasing the employee’s working career by, say, 5 years.
FORMAN_22MAY20.DOCX (DO NOT DELETE) 6/30/2020 12:11 PM
2020] FULLY FUNDED PENSIONS 1251
perfectly reasonable way to accrue retirement benefits today. In that regard, as longevity has increased, more workers can expect to make it to retirement, and they are likely to collect retirement benefits for many years.199
c. Vesting Period—Immediate Vesting The model defined benefit plan also implicitly assumes that there is no
vesting period. That is, a worker is eligible for a pension benefit, beginning at age 65, regardless of the number of years of her service.200
d. Benefit Form—A Fixed, Single-life Annuity The model defined benefit plan also assumes that the pension benefit takes
the form of a fixed, single-life annuity. As a result, the model avoids the complexities associated with joint-and-survivor annuities and cost-of-living adjustments (COLAs), although these variations are discussed in Part VII below.
e. Annuity Factor—10 When the hypothetical worker retires, the actuarial liability for the defined
benefit plan is the starting amount of the pension times an annuity factor.201 For simplicity, the model defined benefit plan assumes an easy-to-work-with annuity factor at age 65 of 10.202 Accordingly, if a 65-year-old retiree with a final salary of $100,000 wants to receive a life annuity of $40,000 a year, then the plan will need to have saved $400,000 for her ($400,000 = 10 × $40,000). Conversely, if the plan has saved $400,000 for a 65-year-old retiree, then it will
199. See 2019 SOCIAL SECURITY TRUSTEES REPORT, supra note 11, at 3–4. 200. In the real world, 5-year vesting periods are common, and employees who terminate before
vesting only get their own contributions back (if any), so the model plan is more generous in that regard. See I.R.C. § 411(a) (2018); ERISA § 203, 29 U.S.C. § 1053 (2018); see also supra note 45 and accompanying text.
201. The annuity factor is the expected present discounted value of the employee’s pension, adjusted to an initial pension amount of $1. Calculating the annuity factor is a standard exercise. See Jonathan Barry Forman & Michael J. Sabin, Tontine Pensions, 163 U. PA. L. REV. 755, 791 n.140 (2015).
202. See Table S – Based on Life Table 2000CM, INTERNAL REVENUE SERV., https://www.irs.gov/pub/irs-tege/sec_1_table_s_2009.xls [https://perma.cc/AER3-LWWB] (showing an annuity factor of 10.7925 for an individual age 65 and a 5.0% interest rate); see also Annuity Factor Calculator, SOC’Y ACTUARIES, https://afc.soa.org/#Calculator [https://perma.cc/LFY6-6XFD] (For a 65-year-old male, and a discount rate of 5% in 2020, the annuity factor for a single life annuity payable at the end of each month is calculated to be 12.1457; [12.8615 for a 65-year-old female]); VANDERHEI, HOW MUCH WOULD IT TAKE?, supra note 177, at 8 (using annuity factors of 11.61 for 65-year-old men and 12.34 for 65-year-old women).
FORMAN_22MAY20.DOCX (DO NOT DELETE) 6/30/2020 12:11 PM
1252 MARQUETTE LAW REVIEW [103:1205
be able to buy her a life annuity that pays her $40,000 a year ($40,000 = $400,000 / 10).203
B. Benefit Accrual in the Model Defined Benefit Plan This Section shows how benefits will accrue under the model defined
benefit plan for the hypothetical 25-year-old worker. At the outset, Column 1 of Table 5 shows the worker’s age (x)—from age 25 when she starts working to age 65 when she retires. Column 2 of Table 5 shows the hypothetical worker’s salary (Sx)—starting at $26,141 at age 25 and growing by 3.5% a year until it reaches $100,000 at age 64. Column 3 of Table 5 shows the hypothetical worker’s number of years of service completed by the end of each year (Yx)—starting at 1 year of service by the end of the year that she starts working (age 25) and increasing to 40 years of service by the end of the year that she turns age 64.
203. See discussion infra Section VII.B (explaining that if a defined benefit plan or annuity has
a cost-of-living adjustment (COLA), then the annuity factor would be larger, as more money would be needed at retirement to pay for larger benefits in the years subsequent to the year of retirement); see also Forman & Sabin, supra note 201, at 793–94 n.143.
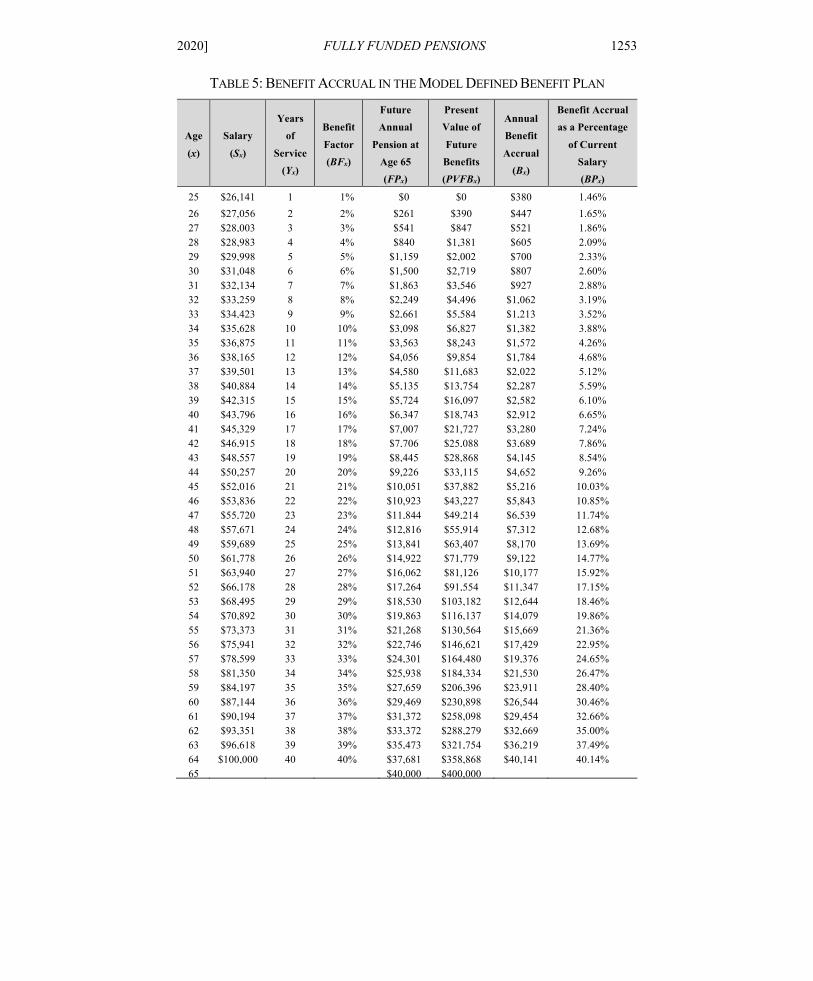
FORMAN_22MAY20.DOCX (DO NOT DELETE) 6/30/2020 12:11 PM
2020] FULLY FUNDED PENSIONS 1253
TABLE 5: BENEFIT ACCRUAL IN THE MODEL DEFINED BENEFIT PLAN
Age (x)
Salary (Sx)
Years of
Service (Yx)
Benefit Factor (BFx)
Future Annual
Pension at Age 65 (FPx)
Present Value of Future
Benefits (PVFBx)
Annual Benefit Accrual
(Bx)
Benefit Accrual as a Percentage
of Current Salary (BPx)
25 $26,141 1 1% $0 $0 $380 1.46% 26 $27,056 2 2% $261 $390 $447 1.65% 27 $28,003 3 3% $541 $847 $521 1.86% 28 $28,983 4 4% $840 $1,381 $605 2.09% 29 $29,998 5 5% $1,159 $2,002 $700 2.33% 30 $31,048 6 6% $1,500 $2,719 $807 2.60% 31 $32,134 7 7% $1,863 $3,546 $927 2.88% 32 $33,259 8 8% $2,249 $4,496 $1,062 3.19% 33 $34,423 9 9% $2,661 $5,584 $1,213 3.52% 34 $35,628 10 10% $3,098 $6,827 $1,382 3.88% 35 $36,875 11 11% $3,563 $8,243 $1,572 4.26% 36 $38,165 12 12% $4,056 $9,854 $1,784 4.68% 37 $39,501 13 13% $4,580 $11,683 $2,022 5.12% 38 $40,884 14 14% $5,135 $13,754 $2,287 5.59% 39 $42,315 15 15% $5,724 $16,097 $2,582 6.10% 40 $43,796 16 16% $6,347 $18,743 $2,912 6.65% 41 $45,329 17 17% $7,007 $21,727 $3,280 7.24% 42 $46,915 18 18% $7,706 $25,088 $3,689 7.86% 43 $48,557 19 19% $8,445 $28,868 $4,145 8.54% 44 $50,257 20 20% $9,226 $33,115 $4,652 9.26% 45 $52,016 21 21% $10,051 $37,882 $5,216 10.03% 46 $53,836 22 22% $10,923 $43,227 $5,843 10.85% 47 $55,720 23 23% $11,844 $49,214 $6,539 11.74% 48 $57,671 24 24% $12,816 $55,914 $7,312 12.68% 49 $59,689 25 25% $13,841 $63,407 $8,170 13.69% 50 $61,778 26 26% $14,922 $71,779 $9,122 14.77% 51 $63,940 27 27% $16,062 $81,126 $10,177 15.92% 52 $66,178 28 28% $17,264 $91,554 $11,347 17.15% 53 $68,495 29 29% $18,530 $103,182 $12,644 18.46% 54 $70,892 30 30% $19,863 $116,137 $14,079 19.86% 55 $73,373 31 31% $21,268 $130,564 $15,669 21.36% 56 $75,941 32 32% $22,746 $146,621 $17,429 22.95% 57 $78,599 33 33% $24,301 $164,480 $19,376 24.65% 58 $81,350 34 34% $25,938 $184,334 $21,530 26.47% 59 $84,197 35 35% $27,659 $206,396 $23,911 28.40% 60 $87,144 36 36% $29,469 $230,898 $26,544 30.46% 61 $90,194 37 37% $31,372 $258,098 $29,454 32.66% 62 $93,351 38 38% $33,372 $288,279 $32,669 35.00% 63 $96,618 39 39% $35,473 $321,754 $36,219 37.49% 64 $100,000 40 40% $37,681 $358,868 $40,141 40.14% 65 $40,000 $400,000
FORMAN_22MAY20.DOCX (DO NOT DELETE) 6/30/2020 12:11 PM
1254 MARQUETTE LAW REVIEW [103:1205
Column 4 of Table 5 then shows the hypothetical worker’s benefit factor (BFx) at the end of each year starting at 1% at the end of the year she starts working (age 25) and increasing to 40% by the end of the year in which she turns age 64 (BFx = 1% benefit accrual rate × Yx years of service).
Column 5 of Table 5 then shows the amount of the future annual pension that the hypothetical worker has earned and will receive at age 65 (FPx). When she starts working at age 25, she has not yet earned any pension benefits, and thus her future annual pension is $0 (FP25 = $0). After she completes a year of service during age 25, she will be entitled to a pension benefit starting at age 65 of $261 per year for life, and thus, at the beginning of age 26, her future annual pension is $261 ($261 FP26 = 1% BF25 × $26,141 S25 = FPx = BFx-
1 × Sx-1).204 Similarly, at the beginning of age 27, she will be entitled to a future pension of $541 per year ($541 FP27 = 2% BF26 × $27,056 S26), and so on until at age 65, she will have earned a pension of $40,000 per year ($40,000 FP65 = 40% BF64 × $100,000 S64).
Column 6 of Table 5 then shows the present value of the hypothetical worker’s future pension as of the beginning of each year (present value of future benefits [PVFBx]).205 The computation of the amounts in Column 6 involves several steps. For example, Column 5 shows that when the hypothetical worker turns age 26, she will be entitled to a pension starting at age 65 of $261 per year for life (FP26 = $261). Given that the assumed annuity factor at age 65 is 10, at age 65, the value of her right to receive that $261-a-year pension will be $2,610 then ($2,610 = 10 × $261 FP26). Of course, this 26-year-old will have to wait 39 years to get that pension (at age 65). Given the assumed discount rate of 5%, Column 6 shows that the value—when she turns age 26—of the right to a pension worth $2,610 at age 65 (i.e., her present value of future benefits) is $390 (PVFB26 = $390 = $2,610 / [1 + 0.05]39 = PV = FV / [1 + r]Y). All in all, Column 6 of Table 5 shows how the present value of the hypothetical worker’s future benefits will grow from $0 when she starts working at age 25 (PVFB25 = 0) to $400,000 at age 65 when she retires (PVFB65 = $400,000).206
Column 7 of Table 5 focuses on how and when the hypothetical worker earns that pension over the course of her career. More specifically, Column 7 shows how much of her pension she earns in each year that she works—i.e., her annual benefit accrual (Bx). For example, by working through age 25, the
204. For simplicity, Column 5 of Table 5 treats the pension benefit earned in a given year as if it accrued on the first day of the next year, i.e., after the year of service.
205. AM. ACAD. OF ACTUARIES, FUNDAMENTALS OF CURRENT PENSION FUNDING AND ACCOUNTING FOR PRIVATE SECTOR PENSION PLANS 5 (2004) [hereinafter FUNDAMENTALS OF CURRENT PENSION FUNDING], https://www.actuary.org/pdf/pension/fundamentals_0704.pdf [https://perma.cc/48A2-F236].
206. Note that $400,000 PVFB65 = 10 annuity factor × $40,000 FP65.
FORMAN_22MAY20.DOCX (DO NOT DELETE) 6/30/2020 12:11 PM
2020] FULLY FUNDED PENSIONS 1255
hypothetical worker earned a future pension worth $390 at the beginning of age 26 (PVFB26 = $390, Column 6 of Table 5). She really earned that future pension by working all through the prior year (age 25), and Column 7 estimates the value of that annual benefit accrual as of the midpoint of the year that she was age 25 (i.e., at the midpoint of the year that she worked to earn that portion of her pension, e.g., July 1 of the calendar year). Given the 5% assumed discount rate, the value of that $390 present value of future benefits six months earlier would be $380 (B25 = $380 = $390 PVFB26 / √1.05).207 Similarly, by working through age 26, her present value of future benefits as of the beginning of age 27 would be $847 (PVFB27 = $847 Column 6 of Table 5). That is an increase from age 26 to age 27 of $457 ($457 = $847 PVFB27 − $390 PVFB26), and the value of that $457 six months earlier (i.e., at the midpoint of the prior year) is $447 (B26 = $447).208 All in all, Column 7 of Table 5 shows how the hypothetical worker’s annual benefit accrual (Bx) will grow from $380 at age 25 (B25 = $380) to $40,141 at age 64 (B64 = $40,141).
In summary, Figure 1 shows how the hypothetical worker’s annual salary (Sx), annual benefit accrual (Bx), and present value of future benefits (PVFBx) will grow from age 25 until her retirement at age 65.
207. Here is the math: $380 B25 = $390 PVFB26 / √1.05. The factor √1.05 (i.e., 1.051/2) is used
here to model the interest that can be earned on a salary paid in installments throughout the year (e.g., monthly paychecks), and, conversely, the factor 1 / √1.05 is used to model a half-year discount rate (when needed in subsequent computations).
208. $447 B26 = $457 / √1.05 = ($847 PVFB27 − $390 PVFB26) / √1.05.
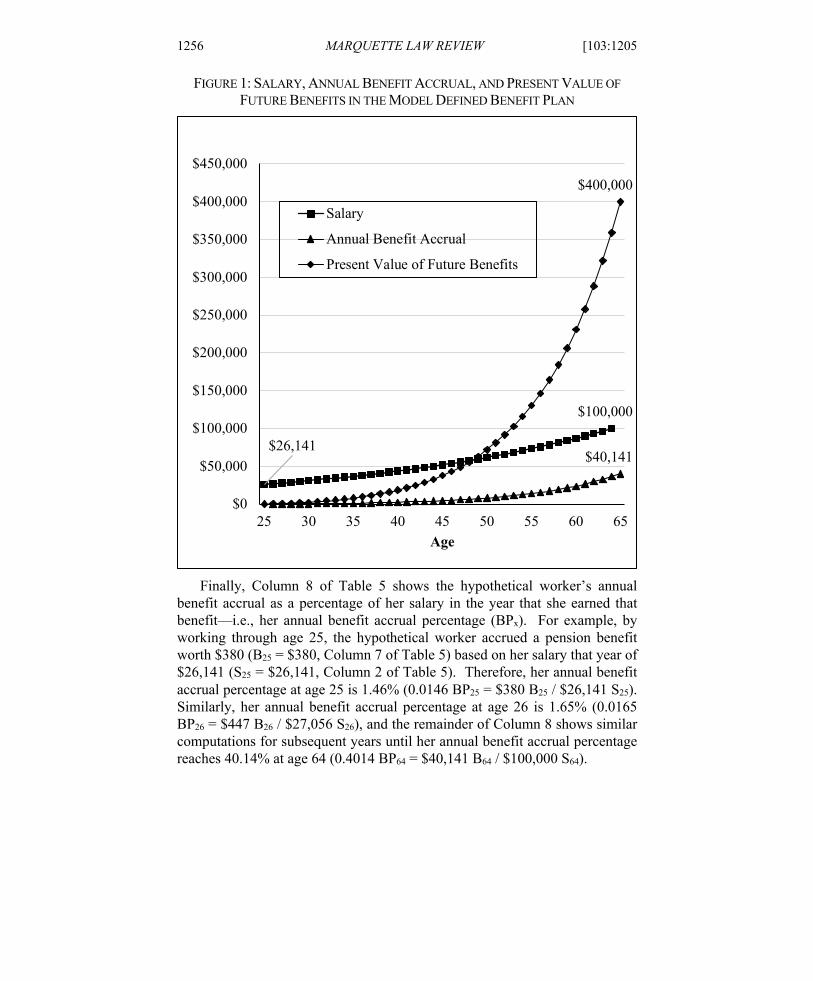
FORMAN_22MAY20.DOCX (DO NOT DELETE) 6/30/2020 12:11 PM
1256 MARQUETTE LAW REVIEW [103:1205
FIGURE 1: SALARY, ANNUAL BENEFIT ACCRUAL, AND PRESENT VALUE OF FUTURE BENEFITS IN THE MODEL DEFINED BENEFIT PLAN
Finally, Column 8 of Table 5 shows the hypothetical worker’s annual
benefit accrual as a percentage of her salary in the year that she earned that benefit—i.e., her annual benefit accrual percentage (BPx). For example, by working through age 25, the hypothetical worker accrued a pension benefit worth $380 (B25 = $380, Column 7 of Table 5) based on her salary that year of $26,141 (S25 = $26,141, Column 2 of Table 5). Therefore, her annual benefit accrual percentage at age 25 is 1.46% (0.0146 BP25 = $380 B25 / $26,141 S25). Similarly, her annual benefit accrual percentage at age 26 is 1.65% (0.0165 BP26 = $447 B26 / $27,056 S26), and the remainder of Column 8 shows similar computations for subsequent years until her annual benefit accrual percentage reaches 40.14% at age 64 (0.4014 BP64 = $40,141 B64 / $100,000 S64).
$26,141
$100,000
$40,141
$400,000
$0
$50,000
$100,000
$150,000
$200,000
$250,000
$300,000
$350,000
$400,000
$450,000
25 30 35 40 45 50 55 60 65Age
Salary
Annual Benefit Accrual
Present Value of Future Benefits
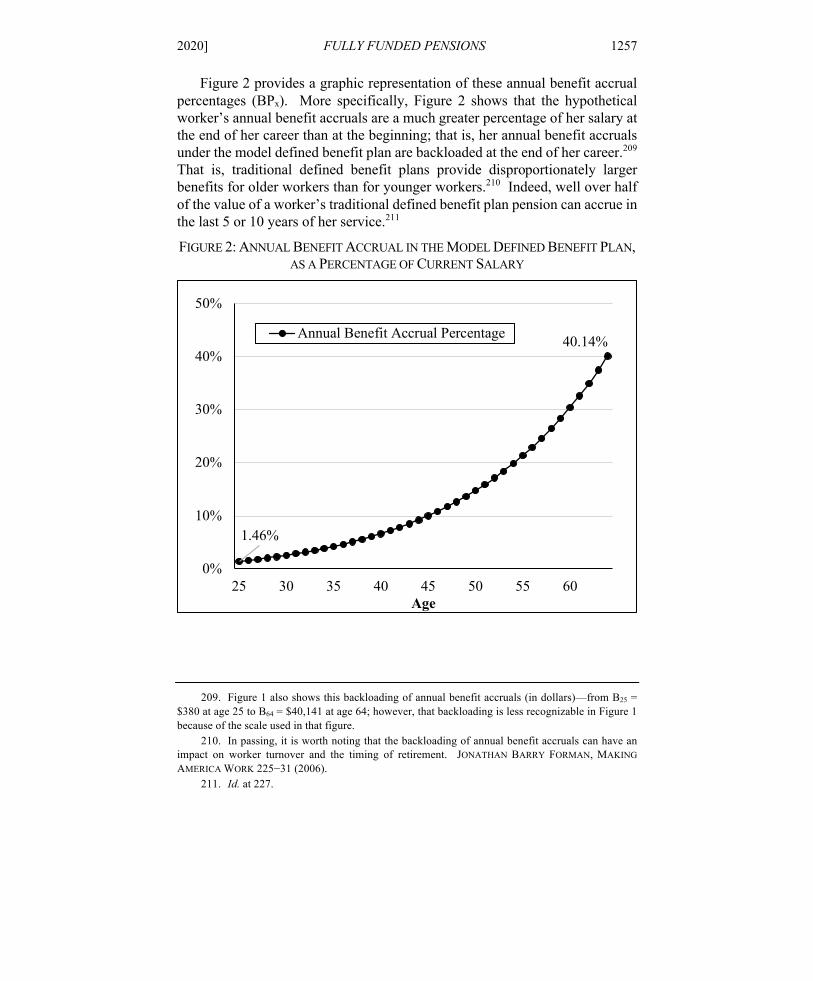
FORMAN_22MAY20.DOCX (DO NOT DELETE) 6/30/2020 12:11 PM
2020] FULLY FUNDED PENSIONS 1257
Figure 2 provides a graphic representation of these annual benefit accrual percentages (BPx). More specifically, Figure 2 shows that the hypothetical worker’s annual benefit accruals are a much greater percentage of her salary at the end of her career than at the beginning; that is, her annual benefit accruals under the model defined benefit plan are backloaded at the end of her career.209 That is, traditional defined benefit plans provide disproportionately larger benefits for older workers than for younger workers.210 Indeed, well over half of the value of a worker’s traditional defined benefit plan pension can accrue in the last 5 or 10 years of her service.211
FIGURE 2: ANNUAL BENEFIT ACCRUAL IN THE MODEL DEFINED BENEFIT PLAN, AS A PERCENTAGE OF CURRENT SALARY
209. Figure 1 also shows this backloading of annual benefit accruals (in dollars)—from B25 =
$380 at age 25 to B64 = $40,141 at age 64; however, that backloading is less recognizable in Figure 1 because of the scale used in that figure.
210. In passing, it is worth noting that the backloading of annual benefit accruals can have an impact on worker turnover and the timing of retirement. JONATHAN BARRY FORMAN, MAKING AMERICA WORK 225−31 (2006).
211. Id. at 227.
1.46%
40.14%
0%
10%
20%
30%
40%
50%
25 30 35 40 45 50 55 60Age
Annual Benefit Accrual Percentage
FORMAN_22MAY20.DOCX (DO NOT DELETE) 6/30/2020 12:11 PM
1258 MARQUETTE LAW REVIEW [103:1205
C. Funding Methods for Traditional Defined Benefit Plans Over the course of a 40-year career, the hypothetical worker covered by the
model defined benefit plan would earn the right to a pension that would pay her $40,000 a year from retirement at age 65 until her death at age 85, and that pension would be worth $400,000 at age 65 (Columns 5 and 6 of Table 5). The plan sponsor needs to pay those $40,000-a-year annual pension benefits as they become due, and this Section explains the basic methods that a plan sponsor could use to fund those future benefit payments.
In effect, this Section shifts from the perspective of the worker who has earned the pension benefits to the perspective of the plan sponsor who must pay those benefits. Put simply, the pension benefits accrued by a worker in a defined benefit plan are an accrued liability for the plan sponsor. For example, as the hypothetical worker’s present value of future benefits grows from $390 when she turns age 26 (PVFB26 = $390, Column 6 of Table 5) to $400,000 when she turns age 65 and retires (PVFB65 = $400,000, Column 6 of Table 5), the plan sponsor’s accrued liability (ALx) similarly grows from $390 when the hypothetical worker turned 26 (AL26 = $390) to $400,000 when she turns 65 and retires (AL65 = $400,000). In short, the plan sponsor’s accrued liability for any worker in any year is equal to the present value of the worker’s future pension benefits (that is, ALx = PVFBx). Of course, the total accrued liability of a plan sponsor in any particular real-world defined benefit plan would depend on the age and service characteristics of all of the employees covered by that plan. That total accrued liability of the plan sponsor to its workers is known as the plan sponsor’s accumulated benefit obligation (ABO);212 and, if a private-sector employer were to terminate its defined benefit plan,213 then the ABO is roughly equal to its termination liability.214
212. The accumulated benefit obligation is the approximate amount of a pension plan’s liability
at any particular point in time. Will Kenton, Defining Accumulated Benefit Obligation, INVESTOPEDIA (Mar. 12, 2018), https://www.investopedia.com/terms/a/accumulated-benefit-obligation.asp [https://perma.cc/955L-N7SF]; W. ASSET MGMT. CO., DERISKING YOUR PENSION PLAN, PART 1: PBO OR ABO FUNDING TARGET? 3 (2011), http://www.westernasset.com/common/pdfs/2011-05-derisking-your-pension-plan-part-1.pdf?srcid=WA_Investment_Report [https://perma.cc/5PTW-MPD3].
213. Employers can end their defined benefit plans through a process that is known as “plan termination.” How Pension Plans End, PENSION BENEFIT GUAR. CORP., https://www.pbgc.gov/about/pg/other/how-pension-plans-end [https://perma.cc/VTS4-S8J7].
214. FUNDAMENTALS OF CURRENT PENSION FUNDING, supra note 205, at 5; BOB COLLIE, RUSSELL INVS., A COMPARISON OF VARIOUS MEASURES OF PENSION LIABILITIES 2 (2015), https://www.nasra.org/files/Topical%20Reports/Actuarial/comparison-of-various-measures-of-pension-liabilities.pdf [https://perma.cc/52X5-WRLY]; see also LONIE HASSEL, PRACTICAL LAW CO., DEFINED BENEFIT PLANS: DISTRESS AND INVOLUNTARY TERMINATIONS 4 (2010),
FORMAN_22MAY20.DOCX (DO NOT DELETE) 6/30/2020 12:11 PM
2020] FULLY FUNDED PENSIONS 1259
To be sure, the determination of the amount of a plan sponsor’s accrued liability to its workers is independent of how and when that liability is to be funded,215 and this Section considers the whole range of possible funding methods.
1. The Unfunded Method: Pay as You Go (PAYG) Theoretically, one way that a plan sponsor can meet its obligation to pay
the pension benefits that it has promised to its workers is to simply pay the annual pension benefits as they become due—out of the plan sponsor’s then-current budgets. This is the pay-as-you-go (PAYG) method (a/k/a, the current disbursement method).216 Thus, under the PAYG method, the plan sponsor does not prefund its pension plan at all: the plan sponsor simply pays each retiree’s pension out of the plan sponsor’s then-current budget. In short, the plan is completely unfunded. Figure 3 shows how this PAYG method would work for the model defined benefit plan. The plan sponsor would make no contributions to its plan on behalf of the hypothetical worker as she works from age 25 through age 64; instead, the plan sponsor would simply pay her a $40,000-a-year pension from age 65 through age 84 (again assuming that she will die at age 85).
https://www.groom.com/wp-content/uploads/2017/09/862_Defined-Benefit-Plans-Distress-and-Involuntary-Terminations-9-502-5005.pdf [https://perma.cc/3ZSR-YGDS] (noting that “[t]ermination liability is the difference between the fair market value of plan assets on the date of plan termination and the value of the plan’s liabilities on the date of plan termination.”).
215. See, e.g., FINDLEY, GOVERNMENT PENSION PLANS IN FOCUS: IS THE PLAN ACTUARIALLY SOUND? 4 (2018), https://findley.com/wp-content/uploads/2018/10/GovtPensionPlaninFocus.pdf [https://perma.cc/PVD5-M37S].
216. See, e.g., Charles L. Trowbridge, Fundamentals of Pension Funding, in SOC’Y OF ACTUARIES, 50TH ANNIVERSARY MONOGRAPH, M-AV99-1, at 101, 103 (1999), https://www.soa.org/essays-monographs/50th-anniversary/ [https://perma.cc/P8DD-QHTS]. Trowbridge also calls this Class I funding. Id. at 103 (“No contributions are made to the plan beyond those immediately necessary to meet benefit payments falling due.”). Trowbridge distinguishes it from Class II funding that is not discussed in this Article. Id. (“If no funding whatsoever is contemplated for active lives, but if the present value of future pension benefits is contributed for each life as it reaches retirement, we have what has come to be known as ‘terminal’ funding.”).
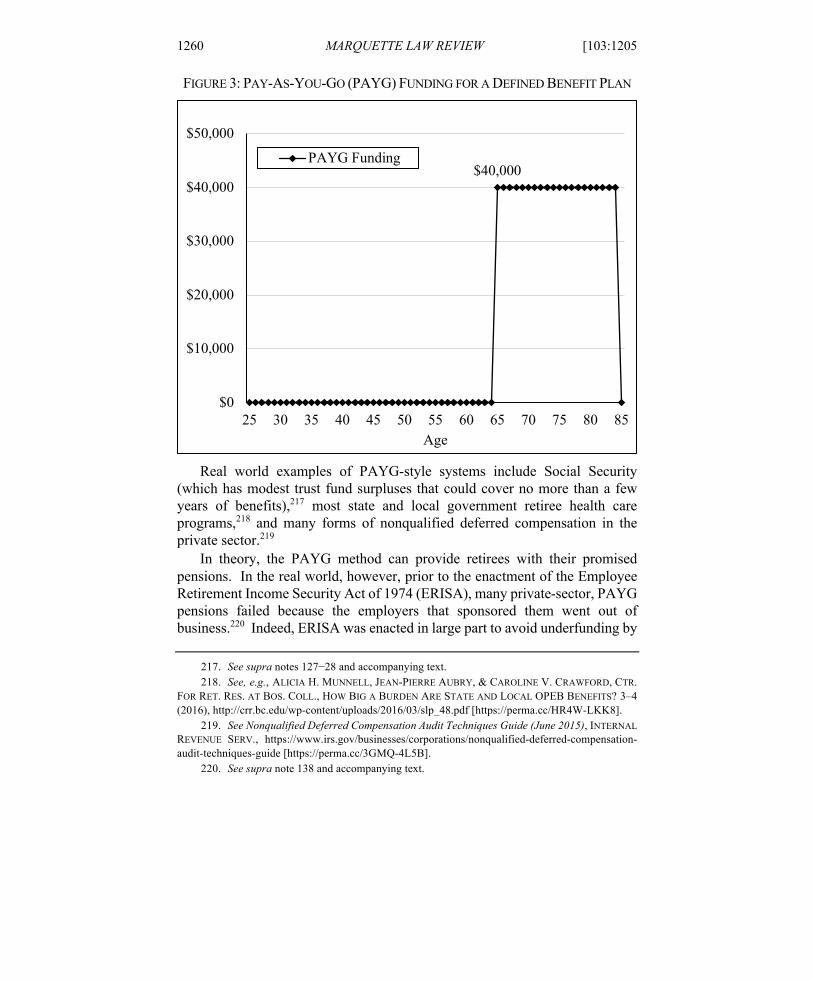
FORMAN_22MAY20.DOCX (DO NOT DELETE) 6/30/2020 12:11 PM
1260 MARQUETTE LAW REVIEW [103:1205
FIGURE 3: PAY-AS-YOU-GO (PAYG) FUNDING FOR A DEFINED BENEFIT PLAN
Real world examples of PAYG-style systems include Social Security
(which has modest trust fund surpluses that could cover no more than a few years of benefits),217 most state and local government retiree health care programs,218 and many forms of nonqualified deferred compensation in the private sector.219
In theory, the PAYG method can provide retirees with their promised pensions. In the real world, however, prior to the enactment of the Employee Retirement Income Security Act of 1974 (ERISA), many private-sector, PAYG pensions failed because the employers that sponsored them went out of business.220 Indeed, ERISA was enacted in large part to avoid underfunding by
217. See supra notes 127−28 and accompanying text. 218. See, e.g., ALICIA H. MUNNELL, JEAN-PIERRE AUBRY, & CAROLINE V. CRAWFORD, CTR.
FOR RET. RES. AT BOS. COLL., HOW BIG A BURDEN ARE STATE AND LOCAL OPEB BENEFITS? 3–4 (2016), http://crr.bc.edu/wp-content/uploads/2016/03/slp_48.pdf [https://perma.cc/HR4W-LKK8].
219. See Nonqualified Deferred Compensation Audit Techniques Guide (June 2015), INTERNAL REVENUE SERV., https://www.irs.gov/businesses/corporations/nonqualified-deferred-compensation-audit-techniques-guide [https://perma.cc/3GMQ-4L5B].
220. See supra note 138 and accompanying text.
$40,000
$0
$10,000
$20,000
$30,000
$40,000
$50,000
25 30 35 40 45 50 55 60 65 70 75 80 85Age
PAYG Funding
FORMAN_22MAY20.DOCX (DO NOT DELETE) 6/30/2020 12:11 PM
2020] FULLY FUNDED PENSIONS 1261
imposing prefunding discipline on private-sector plan sponsors.221 Basically, ERISA requires private-sector defined benefit plans to meet certain minimum funding requirements, and promised defined benefit plan pension benefits are also guaranteed, within limits, by the Pension Benefit Guaranty Corporation (PBGC).222 These ERISA funding requirements do not apply to state and local governmental plans,223 however, and most of those plans are underfunded.224
2. Prefunding Methods Most analysts believe that prefunding is one of the best ways to help ensure
that retirees will actually get their promised defined benefit plan pension benefits. The idea here is to make sure that the defined benefit plan accumulates enough money during each worker’s career so that the plan can pay that worker’s promised pension benefits throughout her retirement. For example, the model defined benefit plan should accumulate $400,000 by the time the hypothetical worker turns age 65 so that the plan can pay her a $40,000-a-year pension for 20 years, from age 65 through age 84 (still assuming that she will die at age 85) (PVFB65 = $400,000, Column 6 of Table 5; FP65 = $40,000, Column 5 of Table 5).225 This Section explains how various prefunding methods could accumulate that $400,000 over the course of her career.226
221. See supra note 138 and accompanying text. 222. ERISA § 4006, 29 U.S.C. § 1306 (2018). 223. ERISA § 4(b)(1), 29 U.S.C. § 1003(b)(1). 224. See supra notes 156–57 and accompanying text. 225. Recall that the model defined benefit plan assumes that the annuity factor is 10; that is, for
example, that $400,000 will buy an annuity of $40,000-a-year for 20 years. See supra Section V.A.3.e. 226. In passing, it should be acknowledged that fully funding pensions is not the only plausible
prefunding target. For example, in the public sector, many analysts suggest that plans are adequately funded if they are 80% funded. AM. ACAD. OF ACTUARIES, THE 80% PENSION FUNDING STANDARD MYTH 2 (2012), https://www.actuary.org/sites/default/files/files/80_Percent_Funding_IB_071912.pdf [https://perma.cc/CJW8-9RBT]; U.S. GOV’T ACCOUNTABILITY OFFICE, GAO-07-1156, STATE AND LOCAL GOVERNMENT RETIREE BENEFITS: CURRENT STATUS OF BENEFIT STRUCTURES, PROTECTIONS, AND FISCAL OUTLOOK FOR FUNDING FUTURE COSTS 30, 30 n.44 (2007), https://www.gao.gov/assets/270/267150.pdf [https://perma.cc/VJT7-5P4F] (noting that “[a] funded ratio of 80% or more is within the range that many public sector experts, union officials, and advocates view as a healthy pension system”).
Moreover, plans can be fiscally sustainable (i.e., require no outside funding) even if they never achieve full funding. JAMIE LENNEY, BYRON LUTZ, & LOUISE SHEINER, THE SUSTAINABILITY OF STATE AND LOCAL GOVERNMENT PENSIONS: A PUBLIC FINANCE APPROACH 6 (2019), https://www.brookings.edu/wp-content/uploads/2019/07/lenney_lutz_sheiner_MFC_Final.pdf [https://perma.cc/GY4B-GN7E]; see also Henning Bohn, Should Public Retirement Plans Be Fully Funded?, 10 J. PENSION ECON. & FIN. 195, 196 (2011).
FORMAN_22MAY20.DOCX (DO NOT DELETE) 6/30/2020 12:11 PM
1262 MARQUETTE LAW REVIEW [103:1205
a. An Overview of Prefunding Methods Basically, prefunding methods are designed to ensure that the plan sponsor
will have enough money set aside by retirement to pay all of the promised pension benefits. Theoretically, a plan sponsor could fully fund a worker’s pension the moment that she is hired. For example, as there should be $400,000 available when the hypothetical worker retires at age 65, the plan sponsor could set aside $56,818.27 at the moment she was hired at age 25,227 and that $56,818.27 would grow—for 40 years at 5% annual interest—to $400,000 when she turns age 65.228 Realistically, few employers would be prosperous enough to prefund their pensions in this way.229 In any event, the tax rules generally do not allow private employers to overfund their pension plans in this way.230
Instead, most plan sponsors use various actuarial cost methods to prefund future pension benefits over the course of their workers’ careers. Basically, these prefunding methods attempt to equitably allocate the cost of the future pension benefits to each year that those benefits are earned. More specifically, this Section outlines the principal actuarial methods by which the value of a worker’s future pension benefits is allocated to each year of service—the so-called normal cost for each year. Basically, the normal cost is the portion of the present value of the future benefits that is attributable to the current year of service under the applicable prefunding method, and it “is the current value of the compensation that is being deferred this year.”231 Normal cost is computed differently under the various actuarial cost methods.
227. See, e.g., Present Value Calculator, supra note 164 (Future Value = $400,000; Years = 40;
Discount Rate = 5%; result is Present Value = $56,818.27). 228. See, e.g., Compound Interest Calculator, supra note 162 (Current Principal = $56,818.27
annual Addition = $0, Years = 40, Interest Rate = 5%; Compound Interest = 1 time(s) annually; result is Future Value = $399,999.98; close enough!).
229. See FINDLEY, supra note 215, at 4. However, this fully prefunded approach might be exactly the approach used with respect to a bonus to be paid in a few years. For example, to entice a worker to leave a stable employment situation, a new start-up company might promise to pay the prospective employee a $300,000 bonus if the prospective employee will quit her job and come work for the start-up for 5 years: the prospective employee might demand that that bonus be set aside in a trust for her benefit. In that regard, if the employer put around $235,000 in a trust today, it should grow to $300,000 in 5 years. See, e.g., Present Value Calculator, supra note 164 (Future Value = $300,000; Years = 5; Discount Rate = 5%; result is Present Value = $235,057.85).
230. For example, there are a variety of limits on the deductibility of contributions to defined benefit plans. See I.R.C. §§ 404, 415 (2018); INTERNAL REVENUE SERV., INTERNAL REVENUE MANUAL § 4.72.15.3 (2017), https://www.irs.gov/irm/part4/irm_04-072-015#idm139904710374320 [https://perma.cc/RJ9H-WLRH].
231. FUNDAMENTALS OF CURRENT PENSION FUNDING, supra note 205, at 5.
FORMAN_22MAY20.DOCX (DO NOT DELETE) 6/30/2020 12:11 PM
2020] FULLY FUNDED PENSIONS 1263
Again, a bit of caution is in order. This Section looks at funding for a single worker’s pension benefits. In the real world, however, an employer typically thinks about funding a pension that covers its entire workforce. In that regard, Figure 1 and Figure 2 showed that an individual worker’s pension benefits under a traditional defined benefit plan accrue in a very backloaded way; that is, annual benefit accruals are often much greater at the end of her career than at the beginning. In looking at how to fund her pension benefits however, it is important to remember that the overall cost of funding an employer’s pension plan for its entire workforce is unlikely to increase so dramatically over time. If an employer has numerous workers with varying age and service records, the employer’s accruing pension liability can be quite flat over time—or just increase at roughly the same modest rate that wages increase (e.g., at the 3.5% salary growth rate in the model defined benefit plan). In effect, the low accruing pension liabilities associated with young and new employees will offset the much higher accruing pension liabilities associated with older and longer-serving employees. Mathematically speaking, the normal cost for funding the pension plan is an average of the normal costs associated with the individual employees. In short, while the normal cost of funding the pension of a single employee will typically increase dramatically over time, the employer’s normal cost for funding its pension plan will tend to increase quite modestly.232
b. The Traditional Unit Credit (TUC) Method At the outset, the classic approach for prefunding a traditional defined
benefit plan is the traditional unit credit (TUC) method.233 The idea here is to make contributions that are sufficient to cover the worker’s accruing benefit each year (i.e., the annual benefit accruals [Bx], Column 7 of Table 5), and Table 6 shows how this TUC method works. At the outset, Column 1 of Table 6 again shows the hypothetical worker’s age (x)—from age 25 when she starts working to age 65 when she retires, and Column 2 again shows her salary (Sx)—starting at $26,141 at age 25 and growing by 3.5% a year until it reaches $100,000 at age 64.
232. Of course, if the employer has a shrinking workforce (or closes its plan to new entrants),
plan costs could grow quite dramatically as the average age, service, and salary of the covered workers increase.
233. See Trowbridge, supra note 216, at 104; KAUSCH & ZORN, supra note 125, at 8.

FORMAN_22MAY20.DOCX (DO NOT DELETE) 6/30/2020 12:11 PM
1264 MARQUETTE LAW REVIEW [103:1205
TABLE 6: CONTRIBUTIONS UNDER THE TRADITIONAL UNIT CREDIT (TUC) METHOD
Age (x)
Salary (Sx)
Contributions (CTUCx)
Value of the Pension Assets at
the End of the Year (VTUCx)
Contributions as a Percentage of
Current Salary (CTUCPx)
25 $26,141 $380 $390 1.46% 26 $27,056 $427 $847 1.58% 27 $28,003 $480 $1,381 1.71% 28 $28,983 $538 $2,002 1.86% 29 $29,998 $603 $2,719 2.01% 30 $31,048 $674 $3,546 2.17% 31 $32,134 $754 $4,496 2.35% 32 $33,259 $842 $5,584 2.53% 33 $34,423 $941 $6,827 2.73% 34 $35,628 $1,049 $8,243 2.95% 35 $36,875 $1,170 $9,854 3.17% 36 $38,165 $1,304 $11,683 3.42% 37 $39,501 $1,452 $13,754 3.67% 38 $40,884 $1,615 $16,097 3.95% 39 $42,315 $1,797 $18,743 4.25% 40 $43,796 $1,997 $21,727 4.56% 41 $45,329 $2,219 $25,088 4.90% 42 $46,915 $2,465 $28,868 5.25% 43 $48,557 $2,736 $33,115 5.64% 44 $50,257 $3,036 $37,882 6.04% 45 $52,016 $3,367 $43,227 6.47% 46 $53,836 $3,733 $49,214 6.93% 47 $55,720 $4,138 $55,914 7.43% 48 $57,671 $4,584 $63,407 7.95% 49 $59,689 $5,076 $71,779 8.50% 50 $61,778 $5,619 $81,126 9.10% 51 $63,940 $6,219 $91,554 9.73% 52 $66,178 $6,880 $103,182 10.40% 53 $68,495 $7,609 $116,137 11.11% 54 $70,892 $8,412 $130,564 11.87% 55 $73,373 $9,298 $146,621 12.67% 56 $75,941 $10,275 $164,480 13.53% 57 $78,599 $11,350 $184,334 14.44% 58 $81,350 $12,535 $206,396 15.41% 59 $84,197 $13,840 $230,898 16.44% 60 $87,144 $15,278 $258,098 17.53% 61 $90,194 $16,860 $288,279 18.69% 62 $93,351 $18,602 $321,754 19.93% 63 $96,618 $20,519 $358,868 21.24% 64 $100,000 $22,630 $400,000 22.63% 65 (Annuity = $40,000/year)
FORMAN_22MAY20.DOCX (DO NOT DELETE) 6/30/2020 12:11 PM
2020] FULLY FUNDED PENSIONS 1265
Column 3 of Table 6 then shows the contributions that should be made under the TUC method. For example, when the hypothetical 25-year-old worker earns $26,141, she accrues a pension benefit with a present value of $380 (B25 = $380, Column 7 of Table 5, modeled as of the mid-point of the year). Therefore, under the TUC method, $380 would be the plan sponsor’s normal cost for that hypothetical 25-year-old worker’s first year of work, and that $380 is the amount that the plan sponsor should contribute to the plan that year on her behalf (CTUC25 = $380, Column 3 of Table 6).
In subsequent years, the plan sponsor needs to contribute enough to ensure that the plan always has enough assets on hand to cover the worker’s growing present value of future benefits (PVFBx, Column 6 of Table 5). Of course, prior contributions and the current year’s contribution will earn interest. Accordingly, after the first year, required TUC contributions will be lower than the worker’s subsequent annual benefit accruals. For example, by working through age 26, the hypothetical worker had an annual benefit accrual of $447 (B26 = $447, Column 7 of Table 5), but the plan sponsor need only contribute $427 (CTUC26 = $427, Column 3 of Table 6) because both the prior year’s contribution of $380 and this year’s contribution of $427 will earn 5% interest.234
Column 3 of Table 6 shows how those annual contributions will grow from $380 at age 25 (CTUC25 = $380) to $22,630 at age 64 (CTUC64 = $22,630),235 and Figure 4 provides a graphic representation of those TUC contributions over the course of the hypothetical worker’s 40-year career. Figure 4 shows clearly that under the TUC method, contributions are significantly backloaded; that is, contributions increase dramatically as the worker approaches retirement age.
234. $426.96 = $437.50 / √1.05; $437.50 = ($847 PVFB26 − $390 PVFB25) × 1.05. 235. The difference between annual benefit accruals and contributions under the traditional unit
credit method continues to grow each year until age 64 when the annual benefit accrual is $40,141 (B64 = $40,141, column 7 of Table 5) but the plan sponsor’s TUC contribution will be just $22,630 (CTUC64 = $22,630, column 3 of Table 6). Basically, if all prior contributions were timely made, then the plan would have already accumulated $358,868 by the time the hypothetical worker turned 64 (PVFB64 = $358,868, column 6 of Table 5 [and VTUC63 = $358,868, column 4 of Table 6]), and that $358,868 would earn $17,943 in interest that year ($17,943 = 0.05 × $358,868 PVFB64). As a total of $400,000 will be needed for her pension when she turns age 65, just $22,630 in contributions will be needed at age 64 ($22,630 = $23,189 / √1.05; $23,189 = $400,000 PVFB65 − $358,868 PVFB64) × 1.05.
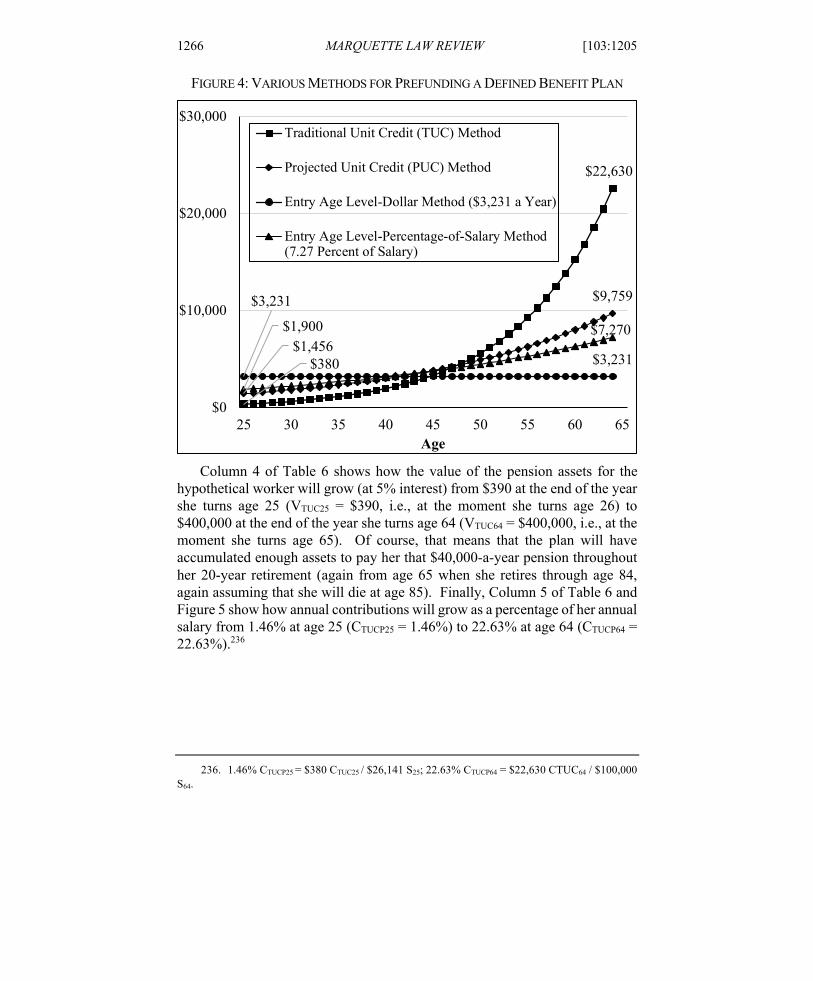
FORMAN_22MAY20.DOCX (DO NOT DELETE) 6/30/2020 12:11 PM
1266 MARQUETTE LAW REVIEW [103:1205
FIGURE 4: VARIOUS METHODS FOR PREFUNDING A DEFINED BENEFIT PLAN
Column 4 of Table 6 shows how the value of the pension assets for the
hypothetical worker will grow (at 5% interest) from $390 at the end of the year she turns age 25 (VTUC25 = $390, i.e., at the moment she turns age 26) to $400,000 at the end of the year she turns age 64 (VTUC64 = $400,000, i.e., at the moment she turns age 65). Of course, that means that the plan will have accumulated enough assets to pay her that $40,000-a-year pension throughout her 20-year retirement (again from age 65 when she retires through age 84, again assuming that she will die at age 85). Finally, Column 5 of Table 6 and Figure 5 show how annual contributions will grow as a percentage of her annual salary from 1.46% at age 25 (CTUCP25 = 1.46%) to 22.63% at age 64 (CTUCP64 = 22.63%).236
236. 1.46% CTUCP25 = $380 CTUC25 / $26,141 S25; 22.63% CTUCP64 = $22,630 CTUC64 / $100,000
S64.
$380
$22,630
$1,456
$9,759$3,231
$3,231
$1,900 $7,270
$0
$10,000
$20,000
$30,000
25 30 35 40 45 50 55 60 65Age
Traditional Unit Credit (TUC) Method
Projected Unit Credit (PUC) Method
Entry Age Level-Dollar Method ($3,231 a Year)
Entry Age Level-Percentage-of-Salary Method(7.27 Percent of Salary)
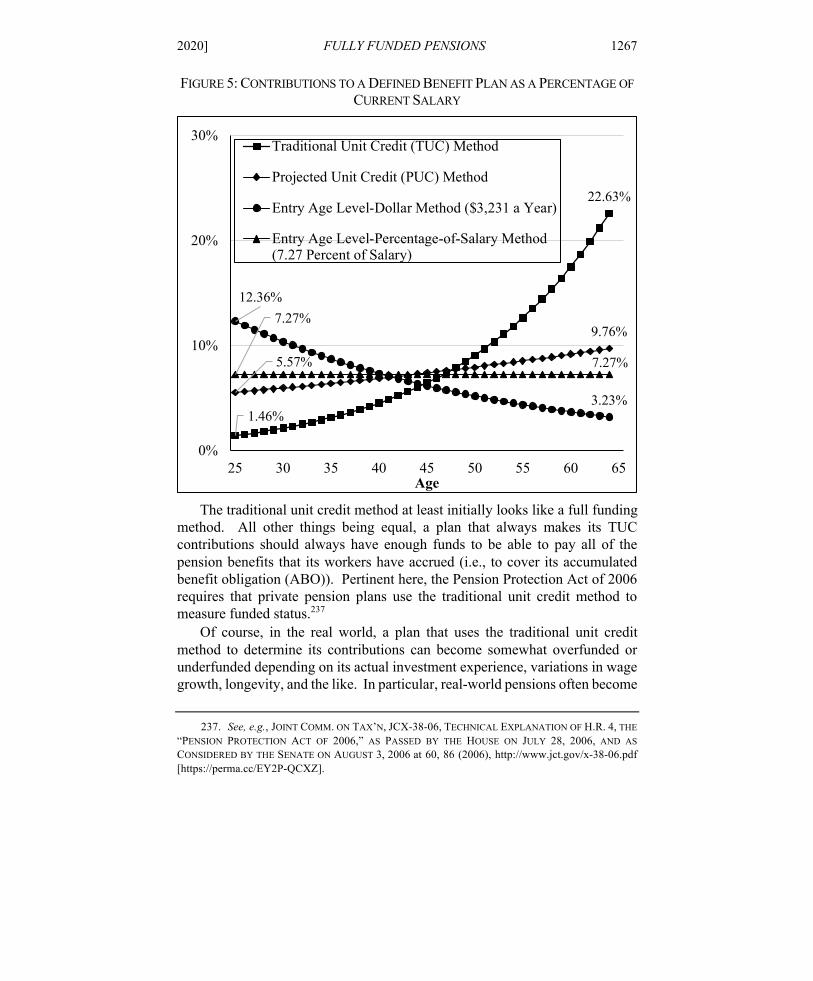
FORMAN_22MAY20.DOCX (DO NOT DELETE) 6/30/2020 12:11 PM
2020] FULLY FUNDED PENSIONS 1267
FIGURE 5: CONTRIBUTIONS TO A DEFINED BENEFIT PLAN AS A PERCENTAGE OF CURRENT SALARY
The traditional unit credit method at least initially looks like a full funding
method. All other things being equal, a plan that always makes its TUC contributions should always have enough funds to be able to pay all of the pension benefits that its workers have accrued (i.e., to cover its accumulated benefit obligation (ABO)). Pertinent here, the Pension Protection Act of 2006 requires that private pension plans use the traditional unit credit method to measure funded status.237
Of course, in the real world, a plan that uses the traditional unit credit method to determine its contributions can become somewhat overfunded or underfunded depending on its actual investment experience, variations in wage growth, longevity, and the like. In particular, real-world pensions often become
237. See, e.g., JOINT COMM. ON TAX’N, JCX-38-06, TECHNICAL EXPLANATION OF H.R. 4, THE “PENSION PROTECTION ACT OF 2006,” AS PASSED BY THE HOUSE ON JULY 28, 2006, AND AS CONSIDERED BY THE SENATE ON AUGUST 3, 2006 at 60, 86 (2006), http://www.jct.gov/x-38-06.pdf [https://perma.cc/EY2P-QCXZ].
1.46%
22.63%
5.57%
9.76%
12.36%
3.23%
7.27%
7.27%
0%
10%
20%
30%
25 30 35 40 45 50 55 60 65Age
Traditional Unit Credit (TUC) Method
Projected Unit Credit (PUC) Method
Entry Age Level-Dollar Method ($3,231 a Year)
Entry Age Level-Percentage-of-Salary Method(7.27 Percent of Salary)
FORMAN_22MAY20.DOCX (DO NOT DELETE) 6/30/2020 12:11 PM
1268 MARQUETTE LAW REVIEW [103:1205
underfunded when pension benefits are enhanced. When those enhancements have a retroactive effect, they immediately create an unfunded actuarial accrued liability (UAAL).238
More typically, however, real-world pensions become underfunded when they simply fail to make their so-called annual required contributions (ARCs).239 For example, New Jersey contributed an average of just 38% of its ARC to its pension plans over the 2001−2013 period, and Pennsylvania contributed an average of just 41.2% of its ARC over that period; and those funding shortfalls led to precipitous declines in the funding levels of the plans in those states.240 All in all, because the traditional unit credit method backloads contributions, employers with aging workforces can face significantly increasing contribution burdens over time that can make it especially difficult to meet their ongoing ARC and UAAL funding obligations.241
c. The Projected Unit Credit (PUC) Method Of course, there are a number of ways to reduce the backloading that is
inherent in the traditional unit credit (TUC) method (the method that makes normal cost contributions that merely cover annual benefit accruals). Basically, these approaches would require plan sponsors to make larger contributions earlier in each worker’s career.
For example, under the projected unit credit (PUC) method, plan sponsors make much larger normal cost contributions each year—contributions that are based on their workers’ projected final salaries and ultimate pensions, rather than on their current salaries and current annual benefit accruals (as under the TUC method).242 Rather than just funding the plan’s accumulated benefit obligation (ABO), the PUC method determines the amount that the plan currently needs to cover its projected benefit obligation (PBO).243 Pertinent
238. See supra note 125 and accompanying text. 239. KEITH BRAINARD & ALEX BROWN, NAT’L. ASS’N OF STATE RET. ADM’RS, THE ANNUAL
REQUIRED CONTRIBUTION EXPERIENCE OF STATE RETIREMENT PLANS, FY 01 TO FY 13, at 2 (2015), https://www.nasra.org/files/JointPublications/NASRA_ARC_Spotlight.pdf [https://perma.cc/7V6N-WNTB].
240. Id. at 2, 8. 241. See PGIM, LONGEVITY AND LIABILITIES: BRIDGING THE GAP 5 (2016),
https://www.prudential.com/media/managed/documents/rp/RP_Longevity_Liabilities.pdf [https://perma.cc/58VY-5PW6]; see also supra note 125 and accompanying text.
242. See, e.g., KAUSCH & ZORN, supra note 125, at 8−9. 243. See Daniel Liberto, Projected Benefit Obligation (PBO), INVESTOPEDIA (May 6, 2019),
https://www.investopedia.com/terms/p/pbo.asp [https://perma.cc/4YAB-UUBY]; see also FUNDAMENTALS OF CURRENT PENSION FUNDING, supra note 205, at 5–6 (explaining the projected unit credit cost method); W. ASSET MGMT. CO., supra note 212, at 2 (“So long as a plan is not hard-
FORMAN_22MAY20.DOCX (DO NOT DELETE) 6/30/2020 12:11 PM
2020] FULLY FUNDED PENSIONS 1269
here, the Financial Accounting Standards Board (FASB) requires companies to use the projected unit credit actuarial cost method to account for their accruing pension benefits for financial accounting purposes (i.e., for what they report to managers, shareholders, leaders, suppliers, tax authorities, and regulators).244
Recall that the annual benefit accrual for the hypothetical worker at age 25 was determined based on 1% of her then-final salary of $26,141; that is, by the beginning of the year that she turns age 26, she will be entitled to a pension of $261 a year starting at age 65 ($261 FP26 = 1% BF25 × $26,141 S25, Columns 5, 4, and 2 of Table 5, respectively). Under the PUC method, the plan instead views the worker as having earned a pension equal to 1% of her projected final salary of $100,000 (S64 = $100,000, Column 2 of Table 5); that is, at the beginning of the year that she turns age 26, the PUC method views her as having earned the right to $1,000 a year starting at age 65 ($1,000 = 1% × $100,000 S64), not just $261 a year under the TUC method. Therefore, in the early years of the hypothetical worker’s career, larger contributions are required under the PUC method than under the TUC method. For example, as more fully explained below, at age 26, the contribution that would be required by the PUC method would be roughly four times larger than the required contribution under the TUC method as $1,000 is roughly four times larger than $261 (3.8314 = $1,000 / $261).245
Table 7 and Figure 4 show how the PUC method works. Before exploring Table 7, however, it is worth noting that another way of viewing the PUC method is to understand that the hypothetical worker will have a final salary of $100,000 at age 64, and she will be entitled to a pension of $40,000 a year starting at age 65 ($40,000 FP65 = 40% BF64 × $100,000 S64, Columns 5, 4, and 2 of Table 5, respectively). In effect, the PUC method presumes that each year of her service will fund exactly one-fortieth of that ultimate $40,000-a-year pension, and $1,000 also equals $40,000 divided by 40 years of service ($1,000 = $40,000 FP65 / 40 Y64, Columns 5 and 3 of Table 5, respectively).
frozen, its eventual obligations are most accurately described by its PBO. Funding to an ABO target essentially ignores costs that eventually will have to be addressed. Also, it instills greater volatility in required cash contributions.”) (footnote omitted); see also Edspira, How to Calculate the Projected Benefit Obligation, YOUTUBE (Jan. 17, 2016), https://www.youtube.com/watch?v=wXORYv9C9Qk [https://perma.cc/X6SD-W4ZG].
244. Sylvester J. Schieber, The Evolution and Implications of Federal Pension Regulation, in THE EVOLVING PENSION SYSTEM: TRENDS, EFFECTS AND PROPOSALS FOR REFORM 11, 35–36 (William G. Gale, John B. Shoven, & Mark J. Warshawsky eds., 2005); Financial Accounting, BUS. DICTIONARY, http://www.businessdictionary.com/definition/financial-accounting.html [https://perma.cc/YX36-MQL4].
245. See infra note 246 and accompanying text.
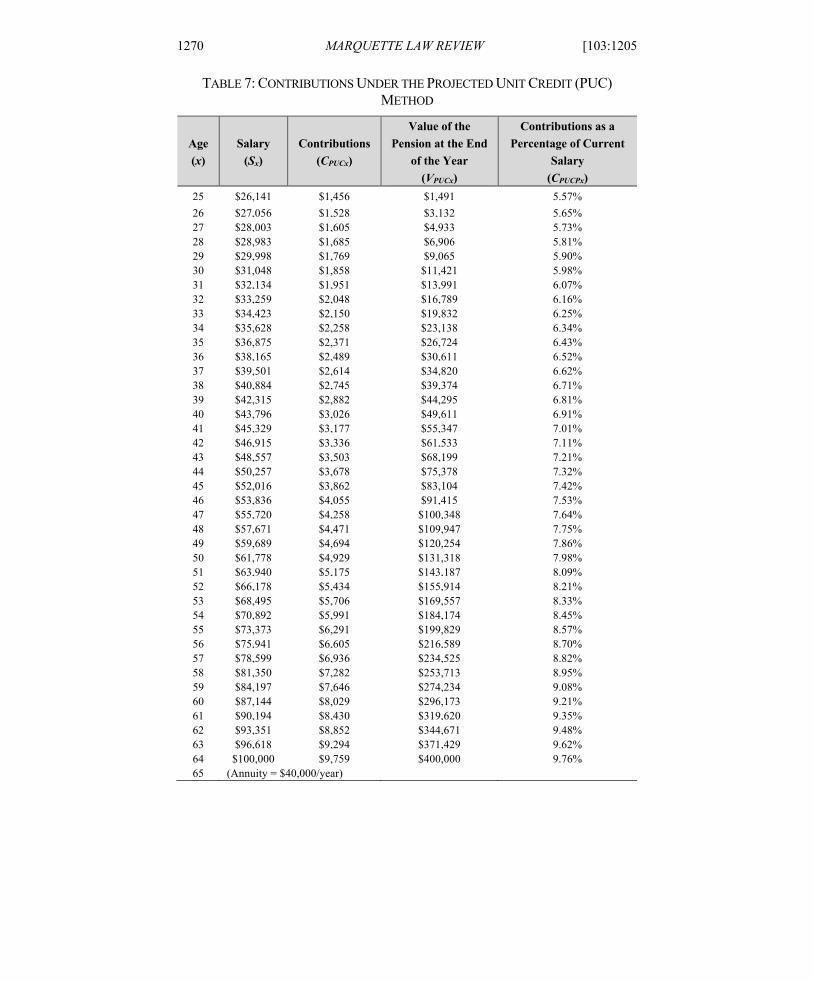
FORMAN_22MAY20.DOCX (DO NOT DELETE) 6/30/2020 12:11 PM
1270 MARQUETTE LAW REVIEW [103:1205
TABLE 7: CONTRIBUTIONS UNDER THE PROJECTED UNIT CREDIT (PUC) METHOD
Age (x)
Salary (Sx)
Contributions (CPUCx)
Value of the Pension at the End
of the Year (VPUCx)
Contributions as a Percentage of Current
Salary (CPUCPx)
25 $26,141 $1,456 $1,491 5.57% 26 $27,056 $1,528 $3,132 5.65% 27 $28,003 $1,605 $4,933 5.73% 28 $28,983 $1,685 $6,906 5.81% 29 $29,998 $1,769 $9,065 5.90% 30 $31,048 $1,858 $11,421 5.98% 31 $32,134 $1,951 $13,991 6.07% 32 $33,259 $2,048 $16,789 6.16% 33 $34,423 $2,150 $19,832 6.25% 34 $35,628 $2,258 $23,138 6.34% 35 $36,875 $2,371 $26,724 6.43% 36 $38,165 $2,489 $30,611 6.52% 37 $39,501 $2,614 $34,820 6.62% 38 $40,884 $2,745 $39,374 6.71% 39 $42,315 $2,882 $44,295 6.81% 40 $43,796 $3,026 $49,611 6.91% 41 $45,329 $3,177 $55,347 7.01% 42 $46,915 $3,336 $61,533 7.11% 43 $48,557 $3,503 $68,199 7.21% 44 $50,257 $3,678 $75,378 7.32% 45 $52,016 $3,862 $83,104 7.42% 46 $53,836 $4,055 $91,415 7.53% 47 $55,720 $4,258 $100,348 7.64% 48 $57,671 $4,471 $109,947 7.75% 49 $59,689 $4,694 $120,254 7.86% 50 $61,778 $4,929 $131,318 7.98% 51 $63,940 $5,175 $143,187 8.09% 52 $66,178 $5,434 $155,914 8.21% 53 $68,495 $5,706 $169,557 8.33% 54 $70,892 $5,991 $184,174 8.45% 55 $73,373 $6,291 $199,829 8.57% 56 $75,941 $6,605 $216,589 8.70% 57 $78,599 $6,936 $234,525 8.82% 58 $81,350 $7,282 $253,713 8.95% 59 $84,197 $7,646 $274,234 9.08% 60 $87,144 $8,029 $296,173 9.21% 61 $90,194 $8,430 $319,620 9.35% 62 $93,351 $8,852 $344,671 9.48% 63 $96,618 $9,294 $371,429 9.62% 64 $100,000 $9,759 $400,000 9.76% 65 (Annuity = $40,000/year)
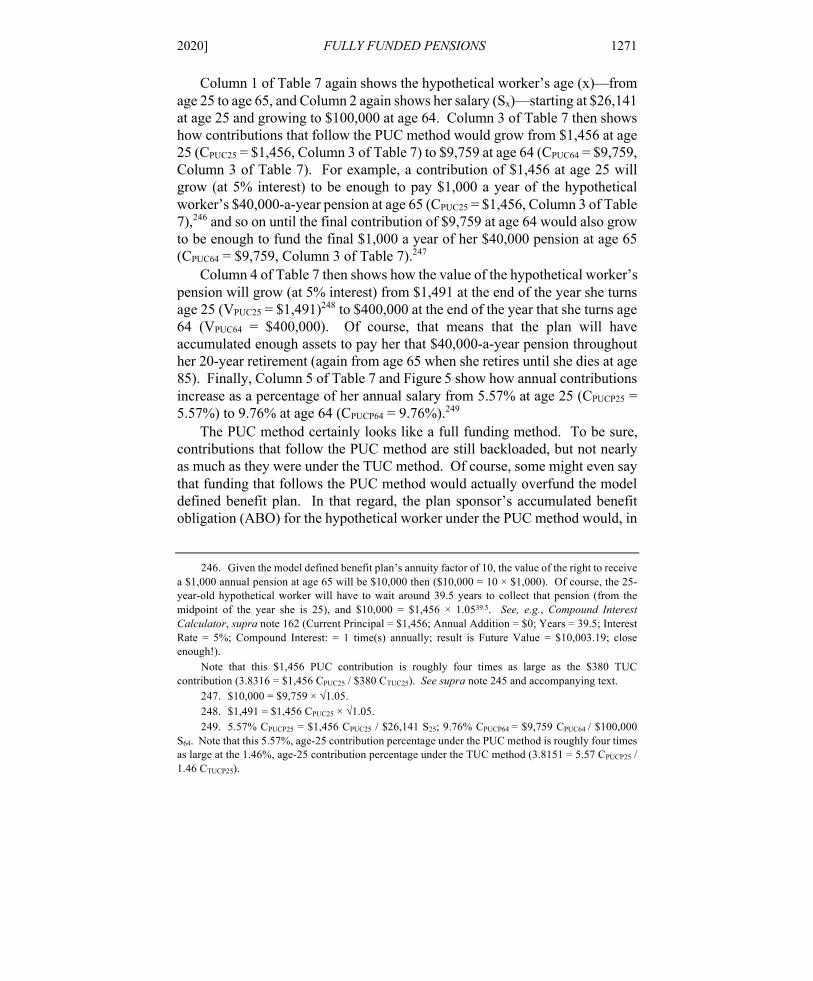
FORMAN_22MAY20.DOCX (DO NOT DELETE) 6/30/2020 12:11 PM
2020] FULLY FUNDED PENSIONS 1271
Column 1 of Table 7 again shows the hypothetical worker’s age (x)—from age 25 to age 65, and Column 2 again shows her salary (Sx)—starting at $26,141 at age 25 and growing to $100,000 at age 64. Column 3 of Table 7 then shows how contributions that follow the PUC method would grow from $1,456 at age 25 (CPUC25 = $1,456, Column 3 of Table 7) to $9,759 at age 64 (CPUC64 = $9,759, Column 3 of Table 7). For example, a contribution of $1,456 at age 25 will grow (at 5% interest) to be enough to pay $1,000 a year of the hypothetical worker’s $40,000-a-year pension at age 65 (CPUC25 = $1,456, Column 3 of Table 7),246 and so on until the final contribution of $9,759 at age 64 would also grow to be enough to fund the final $1,000 a year of her $40,000 pension at age 65 (CPUC64 = $9,759, Column 3 of Table 7).247
Column 4 of Table 7 then shows how the value of the hypothetical worker’s pension will grow (at 5% interest) from $1,491 at the end of the year she turns age 25 (VPUC25 = $1,491)248 to $400,000 at the end of the year that she turns age 64 (VPUC64 = $400,000). Of course, that means that the plan will have accumulated enough assets to pay her that $40,000-a-year pension throughout her 20-year retirement (again from age 65 when she retires until she dies at age 85). Finally, Column 5 of Table 7 and Figure 5 show how annual contributions increase as a percentage of her annual salary from 5.57% at age 25 (CPUCP25 = 5.57%) to 9.76% at age 64 (CPUCP64 = 9.76%).249
The PUC method certainly looks like a full funding method. To be sure, contributions that follow the PUC method are still backloaded, but not nearly as much as they were under the TUC method. Of course, some might even say that funding that follows the PUC method would actually overfund the model defined benefit plan. In that regard, the plan sponsor’s accumulated benefit obligation (ABO) for the hypothetical worker under the PUC method would, in
246. Given the model defined benefit plan’s annuity factor of 10, the value of the right to receive
a $1,000 annual pension at age 65 will be $10,000 then ($10,000 = 10 × $1,000). Of course, the 25-year-old hypothetical worker will have to wait around 39.5 years to collect that pension (from the midpoint of the year she is 25), and $10,000 = $1,456 × 1.0539.5. See, e.g., Compound Interest Calculator, supra note 162 (Current Principal = $1,456; Annual Addition = $0; Years = 39.5; Interest Rate = 5%; Compound Interest: = 1 time(s) annually; result is Future Value = $10,003.19; close enough!).
Note that this $1,456 PUC contribution is roughly four times as large as the $380 TUC contribution (3.8316 = $1,456 CPUC25 / $380 CTUC25). See supra note 245 and accompanying text.
247. $10,000 = $9,759 × √1.05. 248. $1,491 = $1,456 CPUC25 × √1.05. 249. 5.57% CPUCP25 = $1,456 CPUC25 / $26,141 S25; 9.76% CPUCP64 = $9,759 CPUC64 / $100,000
S64. Note that this 5.57%, age-25 contribution percentage under the PUC method is roughly four times as large at the 1.46%, age-25 contribution percentage under the TUC method (3.8151 = 5.57 CPUCP25 / 1.46 CTUCP25).
FORMAN_22MAY20.DOCX (DO NOT DELETE) 6/30/2020 12:11 PM
1272 MARQUETTE LAW REVIEW [103:1205
almost all years, be much less than the actual value of the plan’s assets. For example, imagine that the hypothetical worker quit right when she turned 26. She would then be entitled to a pension of $261 a year at age 65 under the model defined benefit plan (FP26 = $261, Column 5 of Table 5), and that pension would have a present value when she turns age 26 of $390 (PVFB26 = $390, Column 6 of Table 5). Nevertheless, a plan sponsor using the PUC method would have contributed $1,456 when she was age 25 (CPUC25 = $1,456, Column 3 of Table 7), and that $1,456 contribution would have grown to $1,491 by the time she turns age 26 (VPUC25 = $1,491, Column 4 of Table 7). Arguably, the pension would then be overfunded by $1,101 ($1,101 = $1,491 − $390).
d. The Entry Age Normal Cost Method The entry age normal cost method is another projected benefit obligation
(PBO) way for a plan sponsor to prefund the cost of a defined benefit plan over the careers of its workers.250 Once again, the actuary estimates the total projected pension at retirement. For example, the hypothetical worker is projected to receive a $40,000-a-year pension starting at age 65, and that pension will be worth $400,000 when she retires at age 65 (FP65 = $40,000, Column 5 of Table 5; PVFB65 = $400,000, Column 6 of Table 5). The actuary then calculates the actuarial present value of that future pension as of the worker’s entry date and allocates that cost to each year of service according to one of two methods: the level-dollar method or the level-percentage-of-salary method.
250. See, e.g., KAUSCH & ZORN, supra note 125, at 8−9.
FORMAN_22MAY20.DOCX (DO NOT DELETE) 6/30/2020 12:11 PM
2020] FULLY FUNDED PENSIONS 1273
i. The Entry Age Normal Cost Level-Dollar Method The entry age normal cost level-dollar method works like a fixed-rate, 30-
year home mortgage. This method allocates the pension costs in a constant dollar amount over all of the years of the worker’s service from her entry age until retirement.251 For example, in the model defined benefit plan, the plan sponsor will need to accumulate roughly $400,000 for the hypothetical worker by the time she turns age 65, and Table 8 shows how level-dollar contributions of $3,231-per-year on behalf of the hypothetical worker would grow to approximately $400,000 by the time she turns age 65.
251. Under the standard amortization method used for a typical 30-year mortgage, the monthly
payment remains constant: the portion of each payment applied to principal increases while the interest component declines. Of course, there are a variety of other types of mortgages that are not modeled here. For example, some borrowers enter into interest-only mortgage loans. See, e.g., Michele Lerner, What Is an Interest-Only Mortgage?, U.S. NEWS (Mar. 29, 2018), https://loans.usnews.com/what-is-an-interest-only-mortgage [https://perma.cc/R5YH-FXVX]. On the other hand, a borrower might enter into a mortgage where the principal payment remains constant while the interest portion declines over time. See, e.g., Joel Rosenberg, Level Principal Pay as an Alternative to Standard Amortization, PRECISION LENDER, https://explore.precisionlender.com/blog/level-principal-pay-as-an-alternative-to-standard-amortization-2 [https://perma.cc/4HMD-T5DM]. In such a level-principal-payment mortgage, monthly payments would decline over time. Id.
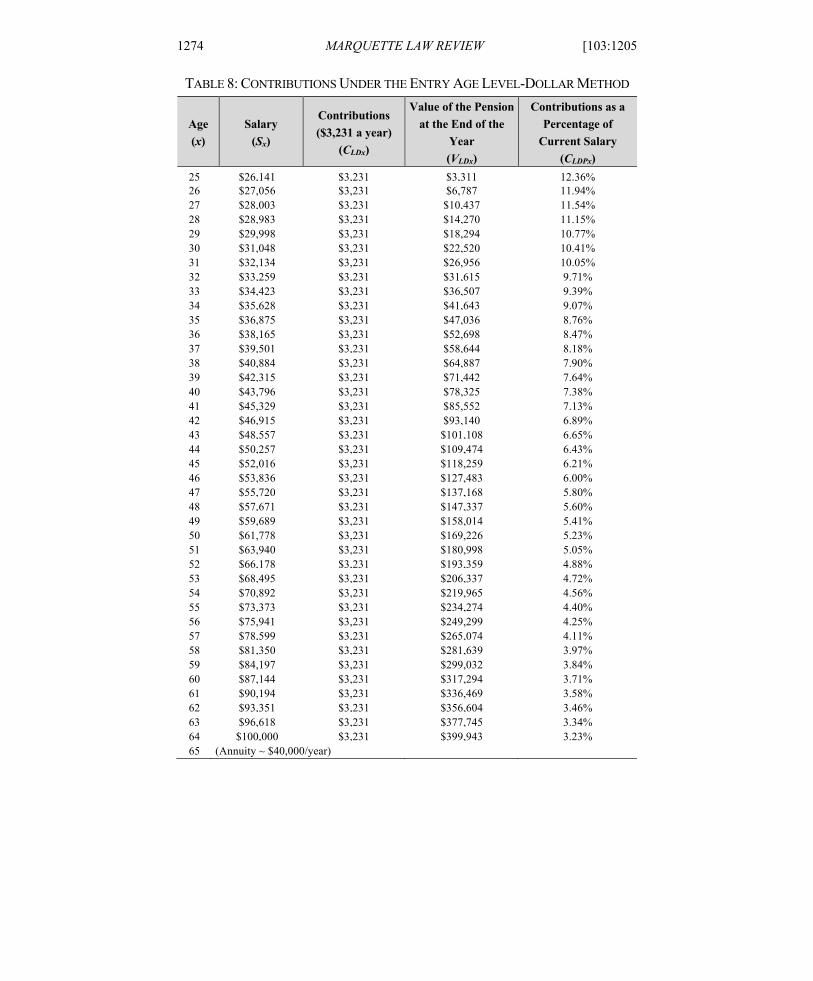
FORMAN_22MAY20.DOCX (DO NOT DELETE) 6/30/2020 12:11 PM
1274 MARQUETTE LAW REVIEW [103:1205
TABLE 8: CONTRIBUTIONS UNDER THE ENTRY AGE LEVEL-DOLLAR METHOD
Age (x)
Salary (Sx)
Contributions ($3,231 a year)
(CLDx)
Value of the Pension at the End of the
Year (VLDx)
Contributions as a Percentage of
Current Salary (CLDPx)
25 $26,141 $3,231 $3,311 12.36% 26 $27,056 $3,231 $6,787 11.94% 27 $28,003 $3,231 $10,437 11.54% 28 $28,983 $3,231 $14,270 11.15% 29 $29,998 $3,231 $18,294 10.77% 30 $31,048 $3,231 $22,520 10.41% 31 $32,134 $3,231 $26,956 10.05% 32 $33,259 $3,231 $31,615 9.71% 33 $34,423 $3,231 $36,507 9.39% 34 $35,628 $3,231 $41,643 9.07% 35 $36,875 $3,231 $47,036 8.76% 36 $38,165 $3,231 $52,698 8.47% 37 $39,501 $3,231 $58,644 8.18% 38 $40,884 $3,231 $64,887 7.90% 39 $42,315 $3,231 $71,442 7.64% 40 $43,796 $3,231 $78,325 7.38% 41 $45,329 $3,231 $85,552 7.13% 42 $46,915 $3,231 $93,140 6.89% 43 $48,557 $3,231 $101,108 6.65% 44 $50,257 $3,231 $109,474 6.43% 45 $52,016 $3,231 $118,259 6.21% 46 $53,836 $3,231 $127,483 6.00% 47 $55,720 $3,231 $137,168 5.80% 48 $57,671 $3,231 $147,337 5.60% 49 $59,689 $3,231 $158,014 5.41% 50 $61,778 $3,231 $169,226 5.23% 51 $63,940 $3,231 $180,998 5.05% 52 $66,178 $3,231 $193,359 4.88% 53 $68,495 $3,231 $206,337 4.72% 54 $70,892 $3,231 $219,965 4.56% 55 $73,373 $3,231 $234,274 4.40% 56 $75,941 $3,231 $249,299 4.25% 57 $78,599 $3,231 $265,074 4.11% 58 $81,350 $3,231 $281,639 3.97% 59 $84,197 $3,231 $299,032 3.84% 60 $87,144 $3,231 $317,294 3.71% 61 $90,194 $3,231 $336,469 3.58% 62 $93,351 $3,231 $356,604 3.46% 63 $96,618 $3,231 $377,745 3.34% 64 $100,000 $3,231 $399,943 3.23% 65 (Annuity ~ $40,000/year)
FORMAN_22MAY20.DOCX (DO NOT DELETE) 6/30/2020 12:11 PM
2020] FULLY FUNDED PENSIONS 1275
At the outset, Column 1 of Table 8 again shows the hypothetical worker’s age (x)—from age 25 to age 65, and Column 2 again shows her salary (Sx)—growing from $26,141 at age 25 to $100,000 at age 64. Column 3 of Table 8 then shows the required level-dollar contributions of $3,231 (CLDx = $3,231), and Figure 4 shows these $3,231-level-dollar contributions as a horizontal line.
Next, Column 4 of Table 8 shows how the value of the hypothetical worker’s pension at the end of each year will grow from $3,311 at the end of the year she turns age 25 (VLD25 = $3,311)252 to almost $400,000 at age 65 (VLD64 = $399,943). Finally, Column 5 of Table 8 and Figure 5 show how these contributions decrease from 12.36% of current salary at age 25 (CLDP25 = 12.36%) to just 3.23% of salary at age 64 (CLDP64 = 3.23%).253
ii. The Entry Age Normal Cost Level-Percentage-of-Salary Method Alternatively, the entry age normal cost method can be used to calculate
contributions as a level percentage of salary over the course of each worker’s career. For example, Table 9 shows how contributions equal to 7.27% of the hypothetical worker’s salary each year would grow to approximately $400,000 by the time she turns age 65.
252. $3,311 VLD25 = $3,231 CLD25 × √1.05. 253. 12.36% CLDCP25 = $3,231 CLD25 / $26,141 S25; 3.23% CLDP64 = $3,231 CLD64 / $100,000 S64.
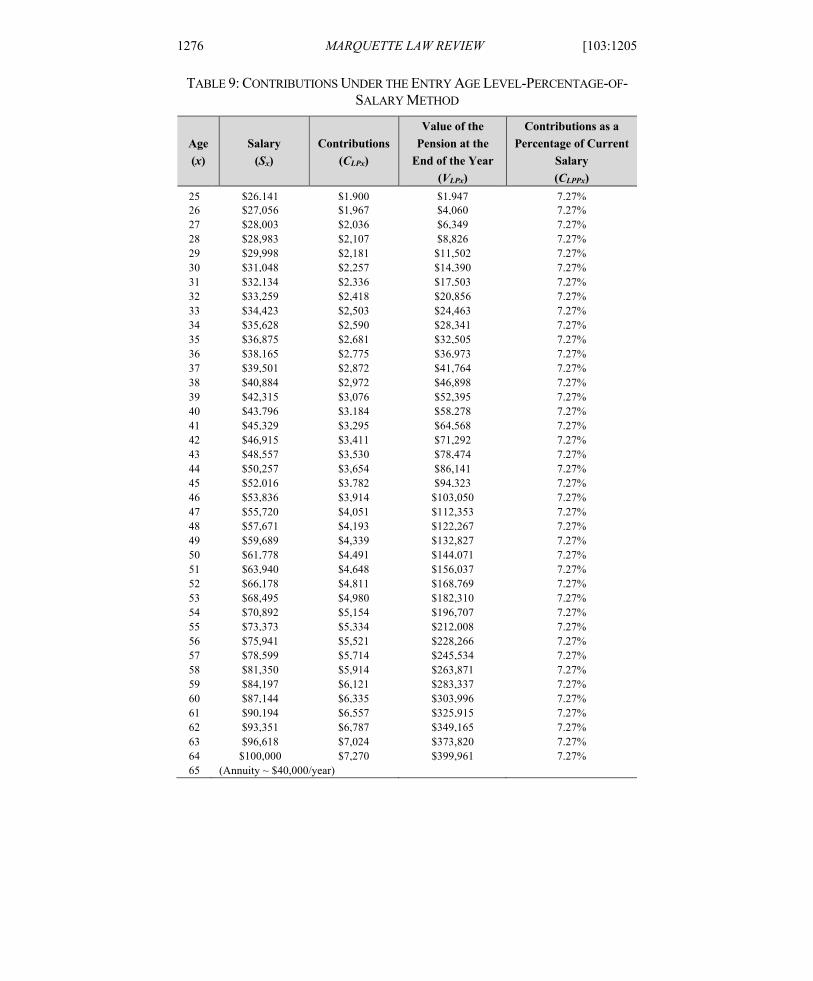
FORMAN_22MAY20.DOCX (DO NOT DELETE) 6/30/2020 12:11 PM
1276 MARQUETTE LAW REVIEW [103:1205
TABLE 9: CONTRIBUTIONS UNDER THE ENTRY AGE LEVEL-PERCENTAGE-OF-SALARY METHOD
Age (x)
Salary (Sx)
Contributions (CLPx)
Value of the Pension at the
End of the Year (VLPx)
Contributions as a Percentage of Current
Salary (CLPPx)
25 $26,141 $1,900 $1,947 7.27% 26 $27,056 $1,967 $4,060 7.27% 27 $28,003 $2,036 $6,349 7.27% 28 $28,983 $2,107 $8,826 7.27% 29 $29,998 $2,181 $11,502 7.27% 30 $31,048 $2,257 $14,390 7.27% 31 $32,134 $2,336 $17,503 7.27% 32 $33,259 $2,418 $20,856 7.27% 33 $34,423 $2,503 $24,463 7.27% 34 $35,628 $2,590 $28,341 7.27% 35 $36,875 $2,681 $32,505 7.27% 36 $38,165 $2,775 $36,973 7.27% 37 $39,501 $2,872 $41,764 7.27% 38 $40,884 $2,972 $46,898 7.27% 39 $42,315 $3,076 $52,395 7.27% 40 $43,796 $3,184 $58,278 7.27% 41 $45,329 $3,295 $64,568 7.27% 42 $46,915 $3,411 $71,292 7.27% 43 $48,557 $3,530 $78,474 7.27% 44 $50,257 $3,654 $86,141 7.27% 45 $52,016 $3,782 $94,323 7.27% 46 $53,836 $3,914 $103,050 7.27% 47 $55,720 $4,051 $112,353 7.27% 48 $57,671 $4,193 $122,267 7.27% 49 $59,689 $4,339 $132,827 7.27% 50 $61,778 $4,491 $144,071 7.27% 51 $63,940 $4,648 $156,037 7.27% 52 $66,178 $4,811 $168,769 7.27% 53 $68,495 $4,980 $182,310 7.27% 54 $70,892 $5,154 $196,707 7.27% 55 $73,373 $5,334 $212,008 7.27% 56 $75,941 $5,521 $228,266 7.27% 57 $78,599 $5,714 $245,534 7.27% 58 $81,350 $5,914 $263,871 7.27% 59 $84,197 $6,121 $283,337 7.27% 60 $87,144 $6,335 $303,996 7.27% 61 $90,194 $6,557 $325,915 7.27% 62 $93,351 $6,787 $349,165 7.27% 63 $96,618 $7,024 $373,820 7.27% 64 $100,000 $7,270 $399,961 7.27% 65 (Annuity ~ $40,000/year)
FORMAN_22MAY20.DOCX (DO NOT DELETE) 6/30/2020 12:11 PM
2020] FULLY FUNDED PENSIONS 1277
At the outset, Column 1 of Table 9 again shows the hypothetical worker’s age (x)—from age 25 to age 65, and Column 2 again shows her salary (Sx)—growing from $26,141 at age 25 to $100,000 at age 64. Next, Column 5 of Table 9 and Figure 5 show the 7.27 level-percentage-of-salary contribution rate (CLPPx = 7.27%).
Column 3 of Table 9 and Figure 4 then show how the actual dollar contributions will increase from $1,900 at age 25 (CLP25 = $1,900) to $7,270 at age 64 (CLP64 = $7,270).254 Basically, contributions will increase modestly over time—at the assumed 3.5% annual salary growth rate. Finally, Column 4 of Table 9 shows how the value of the hypothetical worker’s pension at the end of each year will grow from $1,947 at the end of the year she turns age 25 (VLP25
= $1,947)255 to almost $400,000 at age 65 (VLP64 = $399,961).
iii. State and Local Pension Plans Now Use the Entry Age Normal Cost Method for Financial Reporting
Like the PUC method, the entry age normal cost method is a projected benefit obligation (PBO) method. Since 2014, the Government Accounting Standards Board (GASB) has required state and local pensions to use the entry age normal cost method for financial reporting purposes (i.e., the entry age level-percentage-of-salary method).256 At the same time, however, GASB has clearly abandoned the traditional annual required contribution (ARC) standard.257 Instead, state and local governments are encouraged to develop their own formal funding policies separate from their financial reporting calculations.258
254. $1,900 CLP25 = 7.27% CLPP25 × $26,141 S25; $7,270 CLP64 = 7.27% CLPP64 × $100,000 S64. 255. $1,947 VLP25 = $1,900 CLP25 × √1.05. 256. Jason W. Chute, Stephanie H. McCulla, & Shelly Smith, Preview of the 2018
Comprehensive Update of the National Income and Product Accounts: Changes in Methods, Definitions, and Presentations, in 98 SURVEY OF CURRENT BUSINESS (2018), https://apps.bea.gov/scb/2018/04-april/pdf/0418-preview-2018-comprehensive-nipa-update.pdf [https://perma.cc/K834-5FTJ]; see also AUBRY & CRAWFORD, supra note 157, at 6–7.
257. See, e.g., Kim Nicholl & Paul Angelo, GASB Approves New Accounting Standards for Public Sector Pension Plans and Sponsoring Employers, SOC’Y OF ACTUARIES PENSION SECTION NEWSLETTER (Nov. 2012), https://www.soa.org/news-and-publications/newsletters/pension-section-news/2012/november/psn-2012-iss78/gasb-approves-new-accounting-standards-for-public-sector-pension-plans-and-sponsoring-employers/ [https://perma.cc/6725-D2B8]. Public pension plans now typically use an actuarially determined contribution (ADC) concept instead of an annual required contribution (ARC). NASRA, STATE AND LOCAL GOVERNMENT CONTRIBUTIONS, supra note 158, at 2.
258. Nicholl & Angelo, supra note 257.
FORMAN_22MAY20.DOCX (DO NOT DELETE) 6/30/2020 12:11 PM
1278 MARQUETTE LAW REVIEW [103:1205
Pertinent here, one significant response to the new GASB financial reporting standards was that the U.S. Department of Commerce’s Bureau of Economic Analysis changed the way that it estimates defined benefit pension liabilities and normal costs for state and local governments in its widely-used National Income and Product Accounts (NIPA).259 Basically, the Bureau of Economic Analysis shifted from using an ABO approach to a PBO approach for state and local pensions, and that change immediately increased the Federal Reserve Board’s estimate of total state and local unfunded pension liabilities by more than $2 trillion.260
e. Comparing the Various Prefunding Methods as a Percentage of Current Salary
Table 6 through Table 9 and Figure 4 show the annual dollar contributions that would be required under the various actuarial funding methods described here: (1) the traditional unit credit (TUC) method; (2) the projected unit credit (PUC) method; (3) the entry age level-dollar method; and (4) the entry age level-percentage-of-salary method. Also, Figure 5 shows those contributions as a percentage of current salary. A few observations are in order.
First, if a plan sponsor actually makes contributions that follow any of these four actuarial methods, the plan sponsor’s pension will be fully funded in the sense that it will have the $400,000 needed at age 65 to provide the promised,
259. Chute, McCulla, & Smith, supra note 256; Summary – Statement No. 67, GOVERNMENTAL
ACCT. STANDARDS BOARD (June 2012), https://www.gasb.org/jsp/GASB/Pronouncement_C/GASBSummaryPage&cid=1176160219444 [https://perma.cc/S5U7-HJ9T]; see Michael Caparoso, GASB 74/75: Calculation Specifics on Individual Entry Age Normal, PERISCOPE (May 2016), https://milliman-cdn.azureedge.net/-/media/milliman/importedfiles/uploadedfiles/insight/periodicals/peri/pdfs/gasb-7475-calculation-specifics-individual-entry-age-normal.ashx [https://perma.cc/C9NU-AYCW].
260. See Alex Tanzi, Fed Accounting Change Boosts Unfunded Pension Obligations, BLOOMBERG (Sept. 27, 2018), https://www.bnnbloomberg.ca/fed-accounting-change-boosts-unfunded-pension-obligations-1.1144231 [https://perma.cc/WL3B-G33K]; Rupert Hargreaves, Moody’s: Schools Suffer as Unfunded Pension Liabilities Grow, ETF TRENDS (Oct. 30, 2018), https://www.etftrends.com/advisor-solutions-channel/moodys-schools-suffer-unfunded-pension-liabilities-grow/ [https://perma.cc/J7ZF-W7TH]; see also FINANCIAL ACCOUNTS OF THE UNITED STATES, supra note 141, at 100 tbl.L.120.b (showing unfunded pension liabilities of $4.7 trillion at the end of 2018); EFA: State Pensions, BOARD OF GOVERNORS OF THE FEDERAL RESERVE SYSTEM, https://www.federalreserve.gov/releases/z1/dataviz/pension/ [https://perma.cc/2W47-JAWK]; Matthew Hoops, Paul Smith, & Irina Stefanescu, State and Local Pension Funding in the Enhanced Financial Accounts, FEDS NOTES (Feb. 5, 2016), https://www.federalreserve.gov/econresdata/notes/feds-notes/2016/state-and-local-pension-funding-in-the-enhanced-financial-accounts-20160205.html [https://perma.cc/9BV2-7DSC].
FORMAN_22MAY20.DOCX (DO NOT DELETE) 6/30/2020 12:11 PM
2020] FULLY FUNDED PENSIONS 1279
$40,000-a-year pension.261 Second, Figure 5 shows how backloaded such contributions would be under the traditional unit credit (TUC) method, with contributions growing as a percentage of salary from 1.46% of current salary when the hypothetical worker is age 25 to 22.63% of current salary when she is age 64. In that regard, it will likely be much more challenging for the plan sponsor to make the TUC-method annual required contributions at the end of the hypothetical worker’s career, and the plan may well become underfunded or even fail for that reason.
Contributions that follow the projected unit credit (PUC) method would be less backloaded. Because larger contributions would be made earlier in the hypothetical worker’s career, contributions at the end of her career would be less burdensome, topping out at just 9.76% of her age-64 salary. Of course, contributions that follow the projected unit credit method can be said to overfund the pension, as the current value of the plan’s assets will exceed the hypothetical worker’s present value of future benefits every year until age 65.262
Contributions that follow the entry age level-percentage-of-salary method are even less backloaded, if at all: contributions are a level 7.27% of current salary but do increase from $1,900 when the hypothetical worker is age 25 to $7,270 when she is 64 (Columns 5 and 3 of Table 9, respectively). While funding that follows this level-percentage-of-salary method also somewhat overfunds the model defined benefit plan from a termination liability standpoint, many believe that this is a very plausible way to ensure that full funding is achieved. In that regard, the entry age level-percent-of-salary method is fairly popular among plan sponsors, and it is the method that is preferred by the Government Accounting Standards Board (GASB) for state and local government pension plan financial reporting.263 In the real world, however, as we have seen, fully funded state and local government pension plans are uncommon.264
Finally, contributions that follow the entry age level-dollar method are actually frontloaded: level contributions of $3,231 per year fall as a percentage of current salary from 12.36% of current salary at age 25 to just 3.23% of
261. PVFB65 = $400,000, column 6 of Table 5; FP65 = $40,000, column 5 of Table 5. 262. That is, the plan’s assets would exceed the plan’s accumulated benefit obligation (i.e.,
termination liability) every year until age 65 when they would finally match up (i.e., at $400,000). For example, compare the hypothetical worker’s present value of future benefits (PVFBx in column 6 of Table 5) with the value of her pension at the end of the year (VPUCx in column 4 of Table 7).
263. See supra notes 256–57 and accompanying text. 264. See FINANCIAL ACCOUNTS OF THE UNITED STATES, supra note 141, at 100 tbl.L.120.b
(showing an aggregate unfunded liability for state and local plans of $4.7 trillion, as measured against the entry age normal cost actuarial method).
FORMAN_22MAY20.DOCX (DO NOT DELETE) 6/30/2020 12:11 PM
1280 MARQUETTE LAW REVIEW [103:1205
current salary at age 64 (Columns 3 and 5 of Table 8, respectively). Accordingly, funding based on the entry age level-dollar method would be more challenging in the early years of the hypothetical worker’s career, but funding would be much less challenging in the later years of her career. Like a fixed-rate, 30-year mortgage, the payments should get relatively easier to make as the years go by. As many homeowners appreciate, as time goes by, inflation invariably reduces the burden of level-dollar mortgage payments, and family income to cover those mortgage payments also tends to go up over the course of the mortgage.265 The real economic cost of level-dollar contributions to a defined benefit plan would also decline with inflation. Moreover, as the hypothetical worker’s salary and productivity are likely to increase over time,266 those level-dollar contributions should further shrink as a percentage of her current-year salary.267
VI. BENEFIT ACCRUAL AND FUNDING FOR DEFINED CONTRIBUTION PLANS Benefit accrual and funding for defined contribution plans is pretty
straightforward. The future benefit that a worker will get is based on the balance in her individual account at retirement, and the balance in her account is simply the sum of the contributions made to her account and the investment income earned on those contributions. To understand the funding needed in order for a defined contribution plan to provide meaningful retirement income to its participants, this Part develops two slightly different model defined contribution plans.
265. The text says “invariably” as inflation is virtually omnipresent. See, e.g., Consumer Price
Index, 1913−, FED. RES. BANK MINNEAPOLIS, https://www.minneapolisfed.org/community/financial-and-economic-education/cpi-calculator-information/consumer-price-index-and-inflation-rates-1913 [https://perma.cc/CM2T-NGCQ] (showing annual inflation since 1913); Consumer Price Index for All Urban Consumers: All Items in U.S. City Average, FED. RES. BANK OF ST. LOUIS, https://fred.stlouisfed.org/series/CPIAUCSL [https://perma.cc/D834-QQTW] (showing a graph of annual inflation from 1947 to the present). On the other hand, if deflation were instead the norm, over time borrowers would actually find it more difficult to make level-dollar payments, let alone increasing nominal-dollar payments that would be required if contributions followed one of the other actuarial funding methods.
266. See Nonfarm Business Sector: Real Output Per Hour of All Persons, FED. RES. BANK ST. LOUIS, https://fred.stlouisfed.org/series/OPHNFB?utm_source=series_page&utm_medium=related_content&utm_term=related_resources&utm_campaign=categories [https://perma.cc/59A8-GGNU] (showing how labor productivity generally grows over time).
267. Recall that the model assumes that inflation is 2.5% and that wage growth is 3.5%. See supra Section V.A.1. Implicitly, the model assumes that worker productivity grows faster than inflation.
FORMAN_22MAY20.DOCX (DO NOT DELETE) 6/30/2020 12:11 PM
2020] FULLY FUNDED PENSIONS 1281
Pertinent here, the economic and demographic assumptions used in this Part are the same ones that this Article used to develop the model defined benefit plan in Part V above. At the outset, the two model defined contribution plans developed in this Part again assume that the hypothetical worker wants her defined contribution plan to provide her with pension benefits that will replace around 40% of her final year’s salary. In that regard, the two model plans again assume that inflation is 2.5% each year, that the hypothetical worker starts working at age 25 with a salary of $26,141 a year, that her salary grows by 3.5% a year to $100,000 at age 64, that she retires at age 65, and that she goes on to live exactly 20 years and dies at age 85.268
Both model defined contribution plans developed in this Part are also designed to ensure that the hypothetical worker will accumulate around $400,000 by the time that she turns age 65. The two model defined contribution plans also adopt two more assumptions from Section V.A, but here those assumptions are heroic. First, the two model defined contribution plans heroically assume that the hypothetical worker can still earn a 5% rate of return on her investments—even though it is well-known that individual investors tend to earn lower rates of return on their investments than large, professionally-managed defined benefit plans.269 Second, the model defined contribution plans heroically assume that the hypothetical worker’s annuity factor is still 10 (i.e., that she can use $400,000 in retirement savings to buy a lifetime annuity that will pay her $40,000 a year over the course of her 20-year retirement)—even though it is well-known that individuals usually cannot buy annuities at the same, favorable group-annuity rates that large defined benefit pension plans can.270 In short, it might be more realistic if the two model defined contribution plans in this Part instead used a 4.5% rate-of-return assumption and an annuity factor assumption of 12 or 13.271 In short, individuals in defined contribution
268. See supra Section V.A and Table 4. 269. See supra Section V.A.1.a (interest rate = 5%); Forman, The Future of 401(k), supra note
159, at 9-6 to 9-7. 270. See supra Section V.A.3.e (annuity factor = 10); Forman, supra note 105, at 105−07. 271. See supra note 202 and accompanying text. Even higher annuity factors might be
appropriate for lifetime annuities purchased in the individual annuity marketplace. In that regard, the annuity factor for a lifetime annuity for a 65-year-old woman in the individual annuity market at the beginning of January of 2019 might be as high as 16, computed as follows. Recall that in December of 2018, for $100,000, a 65-year-old woman could have bought an immediate, fixed-payment (lifetime) annuity that would pay her around $6,324 a year. See supra note 103 and accompanying text. Consequently, an annuity that would pay her $40,000 a year would have cost around $633,000 ($632,511 = 6.32511 × $100,000; 6.32511 = $40,000 / $6,324), and, if it took her $633,000 to buy a $40,000-a-year lifetime annuity, then the appropriate annuity factor would be around 16 (15.825 = $633,000 / $40,000).
FORMAN_22MAY20.DOCX (DO NOT DELETE) 6/30/2020 12:11 PM
1282 MARQUETTE LAW REVIEW [103:1205
plans (and IRAs) will almost certainly need to save more each year and accumulate more savings by age 65 than plan sponsors will need to save for participants in defined benefit plans—say, 10 or 20% more.272 Nevertheless, using the same assumptions for both the model defined benefit plan and the model defined contribution plans discussed in this Article makes it much easier to compare the two types of plans and to generalize about how much savings are needed to fund pensions that will last for a lifetime.
A. A Level-Percentage-of-Salary Model Defined Contribution Plan Under the first model defined contribution plan, every year the plan sponsor
will contribute 7.27% of the hypothetical worker’s salary to the plan,273 and Table 10 shows how her benefits would accrue under this level-percentage-of-salary plan. While it would be simpler to discuss a model defined contribution plan with, say, a 7% contribution rate, the 7.27%-of-salary contribution rate was chosen because, as we saw in Section V.C.2.d above, the resulting contributions would grow (at 5% interest) to the almost $400,000 that would be needed at age 65 to provide the hypothetical worker with a $40,000-a-year annuity that would replace 40% of her $100,000 age-64 salary. Consequently, this model level-percentage-of-salary defined contribution plan mimics the entry age level-percentage-of-salary defined benefit plan described in Section V.C.2.d above (e.g., compare Table 10 with Table 9).
Similarly, the annuity factor for a lifetime annuity for a 65-year-old man in the individual annuity
market might be around 15, computed as follows. In December of 2018, for $100,000, a 65-year-old man could have bought an immediate, fixed-payment (lifetime) annuity that would pay him around $6,600 a year. See supra note 103 and accompanying text. Consequently, an annuity that paid him $40,000 a year would have cost around $600,601 ($600,601 = 6.00601 × $100,000; 6.00601 = $40,000 / $6,660), and, if it took him $600,601 to buy a $40,000-a-year lifetime annuity, then the appropriate annuity factor would be around 15 (15.015 = $600,601 / $40,000).
Of course, defined contribution plans could allow individual participants to invest in lifetime annuities throughout their careers, in which case those individual participants should be able to buy lifetime annuities earlier in their careers and at much more favorable group-like rates.
272. Also, recall that defined benefit plans in the real world can save on benefit costs because some workers leave or die before retirement. See supra note 191 and accompanying text.
273. The text says that the plan sponsor will make the contributions, but in reality it does not matter whether the contributions come from the plan sponsor, from the worker, or are split between the two. Thus, although the Article focuses on the design of employer-sponsored defined contribution plans, the defined contribution plan models are equally applicable to workers trying to provide for their own retirement income needs through 401(k) or IRA contributions.
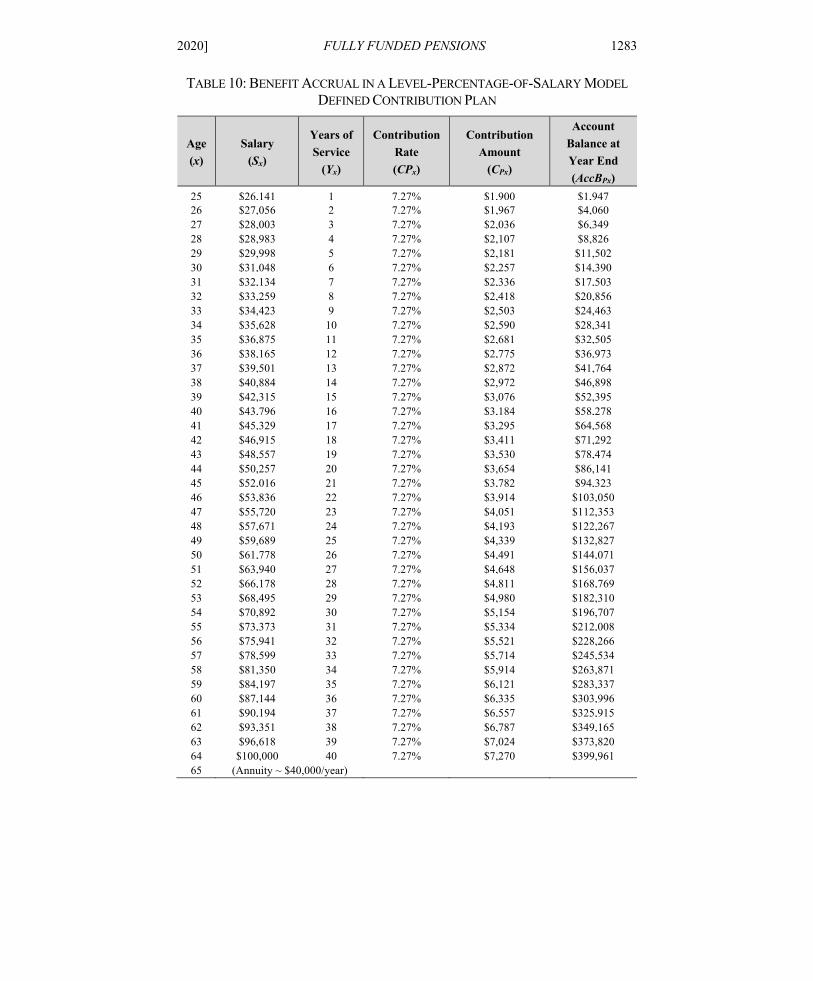
FORMAN_22MAY20.DOCX (DO NOT DELETE) 6/30/2020 12:11 PM
2020] FULLY FUNDED PENSIONS 1283
TABLE 10: BENEFIT ACCRUAL IN A LEVEL-PERCENTAGE-OF-SALARY MODEL DEFINED CONTRIBUTION PLAN
Age (x)
Salary (Sx)
Years of Service
(Yx)
Contribution Rate (CPx)
Contribution Amount
(CPx)
Account Balance at Year End (AccBPx)
25 $26,141 1 7.27% $1,900 $1,947 26 $27,056 2 7.27% $1,967 $4,060 27 $28,003 3 7.27% $2,036 $6,349 28 $28,983 4 7.27% $2,107 $8,826 29 $29,998 5 7.27% $2,181 $11,502 30 $31,048 6 7.27% $2,257 $14,390 31 $32,134 7 7.27% $2,336 $17,503 32 $33,259 8 7.27% $2,418 $20,856 33 $34,423 9 7.27% $2,503 $24,463 34 $35,628 10 7.27% $2,590 $28,341 35 $36,875 11 7.27% $2,681 $32,505 36 $38,165 12 7.27% $2,775 $36,973 37 $39,501 13 7.27% $2,872 $41,764 38 $40,884 14 7.27% $2,972 $46,898 39 $42,315 15 7.27% $3,076 $52,395 40 $43,796 16 7.27% $3,184 $58,278 41 $45,329 17 7.27% $3,295 $64,568 42 $46,915 18 7.27% $3,411 $71,292 43 $48,557 19 7.27% $3,530 $78,474 44 $50,257 20 7.27% $3,654 $86,141 45 $52,016 21 7.27% $3,782 $94,323 46 $53,836 22 7.27% $3,914 $103,050 47 $55,720 23 7.27% $4,051 $112,353 48 $57,671 24 7.27% $4,193 $122,267 49 $59,689 25 7.27% $4,339 $132,827 50 $61,778 26 7.27% $4,491 $144,071 51 $63,940 27 7.27% $4,648 $156,037 52 $66,178 28 7.27% $4,811 $168,769 53 $68,495 29 7.27% $4,980 $182,310 54 $70,892 30 7.27% $5,154 $196,707 55 $73,373 31 7.27% $5,334 $212,008 56 $75,941 32 7.27% $5,521 $228,266 57 $78,599 33 7.27% $5,714 $245,534 58 $81,350 34 7.27% $5,914 $263,871 59 $84,197 35 7.27% $6,121 $283,337 60 $87,144 36 7.27% $6,335 $303,996 61 $90,194 37 7.27% $6,557 $325,915 62 $93,351 38 7.27% $6,787 $349,165 63 $96,618 39 7.27% $7,024 $373,820 64 $100,000 40 7.27% $7,270 $399,961 65 (Annuity ~ $40,000/year)
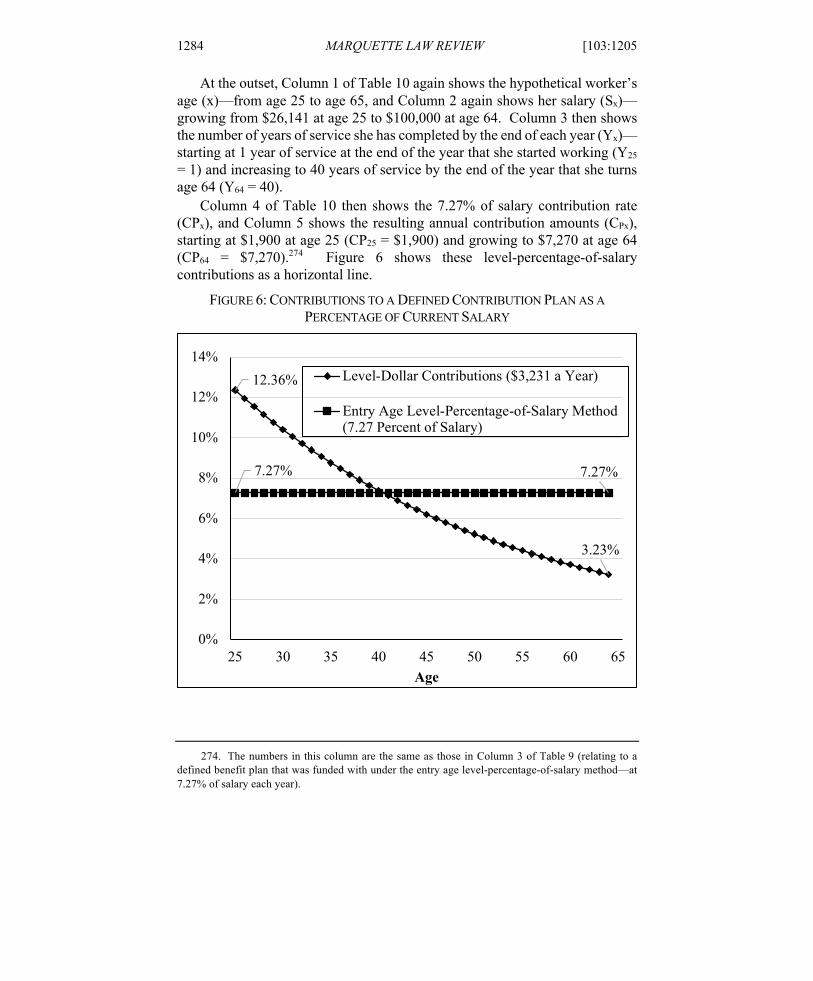
FORMAN_22MAY20.DOCX (DO NOT DELETE) 6/30/2020 12:11 PM
1284 MARQUETTE LAW REVIEW [103:1205
At the outset, Column 1 of Table 10 again shows the hypothetical worker’s age (x)—from age 25 to age 65, and Column 2 again shows her salary (Sx)—growing from $26,141 at age 25 to $100,000 at age 64. Column 3 then shows the number of years of service she has completed by the end of each year (Yx)—starting at 1 year of service at the end of the year that she started working (Y25 = 1) and increasing to 40 years of service by the end of the year that she turns age 64 (Y64 = 40).
Column 4 of Table 10 then shows the 7.27% of salary contribution rate (CPx), and Column 5 shows the resulting annual contribution amounts (CPx), starting at $1,900 at age 25 (CP25 = $1,900) and growing to $7,270 at age 64 (CP64 = $7,270).274 Figure 6 shows these level-percentage-of-salary contributions as a horizontal line.
FIGURE 6: CONTRIBUTIONS TO A DEFINED CONTRIBUTION PLAN AS A PERCENTAGE OF CURRENT SALARY
274. The numbers in this column are the same as those in Column 3 of Table 9 (relating to a
defined benefit plan that was funded with under the entry age level-percentage-of-salary method—at 7.27% of salary each year).
12.36%
3.23%
7.27% 7.27%
0%
2%
4%
6%
8%
10%
12%
14%
25 30 35 40 45 50 55 60 65Age
Level-Dollar Contributions ($3,231 a Year)
Entry Age Level-Percentage-of-Salary Method(7.27 Percent of Salary)
FORMAN_22MAY20.DOCX (DO NOT DELETE) 6/30/2020 12:11 PM
2020] FULLY FUNDED PENSIONS 1285
Finally, Column 6 of Table 10 shows the account balance at the end of the year (AccBPx) (i.e., the value of the pension at the end of the year). For simplicity, the model again treats annual contributions as made at the midpoint of the prior year, and given the assumed 5% interest rate, the initial age-25 contribution of $1,900 (CP25 = $1,900) would grow to $1,947 by the end of that year (AccBP25 = $1,947).275 Similarly, by working through age 26, the balance in the account of this hypothetical worker will grow to $4,060 by the end of that year (AccBP26 = $4,060, Column 6 of Table 10).276 At retirement, the balance in her account will grow to almost $400,000 (AccBP64 = $399,961, Column 6 of Table 10), and given the assumed annuity factor of 10, that balance could be used to buy her an annuity that would pay her almost $40,000 a year for life277—which is again roughly 40% of her $100,000 final salary at age 64.
B. A Level-Dollar Model Defined Contribution Plan Alternatively, under the second model defined contribution plan, every year
the plan sponsor will contribute $3,231 to the plan, and Table 11 shows how her benefits will accrue under this level-dollar plan. This time, that $3,231 annual contribution amount was chosen because, as we saw in Section V.C.2.d above, the resulting contributions would grow (at 5% interest) to almost $400,000 at age 65, and that sum could be used to buy her a $40,000-per-year annuity that would replace around 40% of her $100,000 salary at age 64. Thus, this model level-dollar defined contribution plan mimics the entry age level-dollar defined benefit plan described in Section V.C.2.d above (e.g., compare Table 11 with Table 8).
275. $1,947 AccBP25 = $1,900 CP25 × √1.05. 276. $4,060 AccBP26 = $1,947 AccBP25 × 1.05 + $1,967 CP26 × √1.05. 277. $39,996 = $399,961 AccBP64 / 10 annuity factor. See supra Section V.A.3.e.
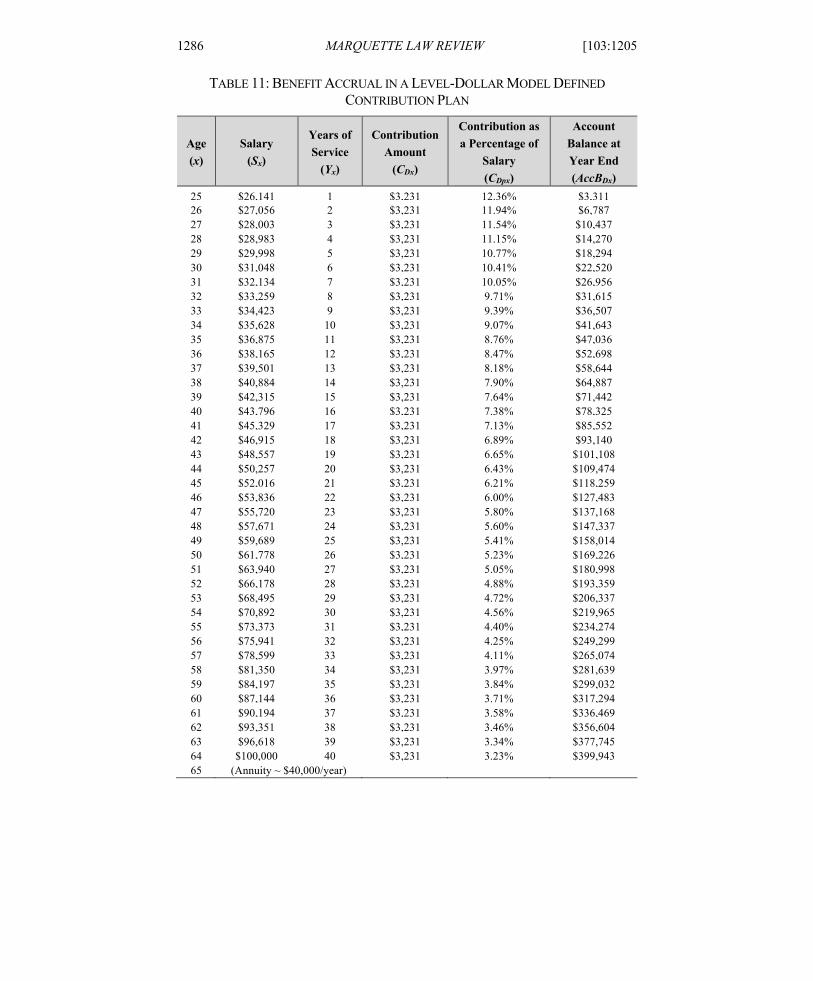
FORMAN_22MAY20.DOCX (DO NOT DELETE) 6/30/2020 12:11 PM
1286 MARQUETTE LAW REVIEW [103:1205
TABLE 11: BENEFIT ACCRUAL IN A LEVEL-DOLLAR MODEL DEFINED CONTRIBUTION PLAN
Age (x)
Salary (Sx)
Years of Service
(Yx)
Contribution Amount
(CDx)
Contribution as a Percentage of
Salary (CDpx)
Account Balance at Year End (AccBDx)
25 $26,141 1 $3,231 12.36% $3,311 26 $27,056 2 $3,231 11.94% $6,787 27 $28,003 3 $3,231 11.54% $10,437 28 $28,983 4 $3,231 11.15% $14,270 29 $29,998 5 $3,231 10.77% $18,294 30 $31,048 6 $3,231 10.41% $22,520 31 $32,134 7 $3,231 10.05% $26,956 32 $33,259 8 $3,231 9.71% $31,615 33 $34,423 9 $3,231 9.39% $36,507 34 $35,628 10 $3,231 9.07% $41,643 35 $36,875 11 $3,231 8.76% $47,036 36 $38,165 12 $3,231 8.47% $52,698 37 $39,501 13 $3,231 8.18% $58,644 38 $40,884 14 $3,231 7.90% $64,887 39 $42,315 15 $3,231 7.64% $71,442 40 $43,796 16 $3,231 7.38% $78,325 41 $45,329 17 $3,231 7.13% $85,552 42 $46,915 18 $3,231 6.89% $93,140 43 $48,557 19 $3,231 6.65% $101,108 44 $50,257 20 $3,231 6.43% $109,474 45 $52,016 21 $3,231 6.21% $118,259 46 $53,836 22 $3,231 6.00% $127,483 47 $55,720 23 $3,231 5.80% $137,168 48 $57,671 24 $3,231 5.60% $147,337 49 $59,689 25 $3,231 5.41% $158,014 50 $61,778 26 $3,231 5.23% $169,226 51 $63,940 27 $3,231 5.05% $180,998 52 $66,178 28 $3,231 4.88% $193,359 53 $68,495 29 $3,231 4.72% $206,337 54 $70,892 30 $3,231 4.56% $219,965 55 $73,373 31 $3,231 4.40% $234,274 56 $75,941 32 $3,231 4.25% $249,299 57 $78,599 33 $3,231 4.11% $265,074 58 $81,350 34 $3,231 3.97% $281,639 59 $84,197 35 $3,231 3.84% $299,032 60 $87,144 36 $3,231 3.71% $317,294 61 $90,194 37 $3,231 3.58% $336,469 62 $93,351 38 $3,231 3.46% $356,604 63 $96,618 39 $3,231 3.34% $377,745 64 $100,000 40 $3,231 3.23% $399,943 65 (Annuity ~ $40,000/year)
FORMAN_22MAY20.DOCX (DO NOT DELETE) 6/30/2020 12:11 PM
2020] FULLY FUNDED PENSIONS 1287
More specifically, Column 1 of Table 11 again shows the hypothetical worker’s age (x)—from age 25 to age 65; Column 2 again shows her salary (Sx)—growing from $26,141 at age 25 to $100,000 at age 64; and Column 3 of Table 11 again shows the number of years of service she has completed by the end of each year (Yx)—growing from 1 year of service by the end of the year that she started working (Y25 = 1) to 40 years of service by the end of the year that she turns age 64 (Y64 = 40).
Column 4 of Table 11 then shows the $3,231 annual contributions (CDx) made to her individual account.278 Column 5 of Table 11 and Figure 6 then show those annual contributions as a percentage of her annual salary (CDpx), starting at 12.36% at age 25 (CDp25 = 12.36%) and then falling to 3.23% at age 64 (CDp64 = 3.23%).279 Finally, Column 6 of Table 11 shows how the balance in her account will grow from $3,311 at the end of the year she turns age 25 (AccBD25 = $3,311) to almost $400,000 at the end of the year she turns age 64 (AccBD64 = $399,943). Given the assumed annuity factor of 10, that $399,943 balance could again buy her an annuity that would pay her almost $40,000 a year for life280—which is again roughly 40% of her $100,000 salary at age 64.
VII. BRINGING IN SOME REAL-WORLD CONSIDERATIONS The simple model defined benefit and defined contribution plans outlined
in Parts V and VI above would all provide the hypothetical worker with a pension starting at age 65 that would replace 40% of her preretirement earnings. So far, however, those model plans have failed to account for many real-world complications, and this Part addresses the most important of those complications.
A. Underfunding in the Real World The model pension plans described in Parts V and VI above are all designed
to provide pensions that would replace 40% of the preretirement earnings of workers, and they would largely succeed in that task. In the real world, however, relatively few retirees have pensions that replace 40% of their preretirement earnings. With respect to defined contribution plans, it is fairly easy to see that not many workers have 7.27% of their salaries saved for retirement over a 40-year career. In particular, many employers do not offer
278. The numbers in this column are the same as those in Column 3 of Table 8 (relating to a
defined benefit plan that was funded with under the entry age level-dollar method—at $3,231 each year).
279. These are computed as CDpx = CDx / Sx. 280. $39,994 = $399,943 AccBD64 / 10 annuity factor.
FORMAN_22MAY20.DOCX (DO NOT DELETE) 6/30/2020 12:11 PM
1288 MARQUETTE LAW REVIEW [103:1205
defined contribution plans, and many of those employers that do offer plans contribute just 3% of salary—or less.281 As a result, only a portion of workers ever manage to reach that 7.27%-of-salary contribution hurdle, let alone over 40 years of service.
As for traditional defined benefit plans, even if real-world defined benefit plans are designed to provide pensions that replace at least 40% of preretirement earnings, in practice, the results often fall short of that 40% target. Many of those shortfalls have to do with the fact that traditional defined benefit plans are backloaded (see, e.g., Figure 2 above), and, as more fully explained in Section VII.C.3 below, only workers who spend most of their careers with a single employer are likely to get pensions that replace at least 40% of their preretirement earnings.
Moreover, many defined benefit plans are underfunded and will not be able to pay their promised benefits in full. To be sure, traditional defined benefit plans that use the entry age normal cost level-percentage-of-salary method to determine their contributions—and, in fact, make their annual required contributions—should almost certainly be overfunded (absent extraordinarily adverse investment experience).282 However, defined benefit pension plans are not required to make contributions that follow the entry age normal cost level-percentage-of-salary method. While ERISA imposes minimum funding requirement on plan sponsors, those requirements are not all that demanding.283 In short, private employers are only expected to make contributions that are sufficient to cover each worker’s annual benefit accruals. For example, consider the hypothetical worker from Section V.A above. At age 25, she
281. See BUREAU OF LABOR STATISTICS, U.S. DEP’T OF LABOR, NEWS RELEASE, USDL-19-1002, EMPLOYER COSTS FOR EMPLOYEE COMPENSATION – MARCH 2019, at 4 tbl.1 (2019), https://www.bls.gov/news.release/archives/ecec_06182019.pdf [https://perma.cc/YZW3-6PD4] (showing that defined contribution plans were just 2.0% of the compensation of civilian workers in December 2018); VANGUARD, HOW AMERICA SAVES 2018, at 20−23 (2018), https://pressroom.vanguard.com/nonindexed/HAS18_062018.pdf [https://perma.cc/K6LV-D9G9] (discussing the range of employer contributions to defined contribution plans); G.E. Miller, Does your 401K Match Up Against the Averages?, 20 SOMETHING FINANCE (Jan. 4, 2020), https://20somethingfinance.com/401k-match/ [https://perma.cc/PH5M-494U] (noting that the average 401(k) match is around 3.5%); Tim Parker, What is a Good 401(k) Match?, INVESTOPEDIA (Nov. 10, 2019), https://www.investopedia.com/articles/personal-finance/120315/what-good-401k-match.asp [https://perma.cc/BM88-MAQS] (noting that “[t]he majority of companies offer some sort of matching contribution for an average of 2.7% of a person’s pay”); Eli R. Stoltzfus, Defined Contribution Retirement Plans: Who Has Them and What Do They Cost?, BEYOND THE NUMBERS, Dec. 2016, 1, 2, 5 tbl.2 (showing that just 44% of private-sector workers participated in defined contribution plans in March of 2016 and that employers spent an average of just $1.59 per hour worked on these plans).
282. See supra notes 256–57, 262 and accompanying text. 283. See supra note 138 and accompanying text.
FORMAN_22MAY20.DOCX (DO NOT DELETE) 6/30/2020 12:11 PM
2020] FULLY FUNDED PENSIONS 1289
accrued a pension benefit worth $380 (B25 = $380, Column 7 of Table 5). While the entry age normal cost level-percentage-of-salary method of prefunding her pension would require the plan sponsor to contribute $1,900 to the plan that year ($1,900 CLP25, Column 3 of Table 9), ERISA would only require the employer to contribute $380 that year, as would be required by the traditional unit credit (TUC) method ($380 CTUC25, Column 3 of Table 6).284 Moreover, if the plan sponsor falls behind in funding its plan, ERISA typically gives the plan sponsor 7 years to make up the shortfall.285 Making even these minimum contributions can be difficult for employers with aging or declining workforces as contribution burdens increase dramatically as workers complete more years of service (see Figure 2 above). Not surprisingly, in the real world many private-sector single-employer and multiemployer plans are underfunded.286 Moreover, as already mentioned, many federal and state and local government plans are also underfunded.287
284. Basically, ERISA allows plan sponsors to fund their plans using something like the TUC
method. To be sure, the Financial Accounting Standards Board (FASB) does require companies to use the projected unit credit (PUC) method, but only for financial accounting purposes (i.e., for what they report to managers, shareholders, leaders, supplies, tax authorities, and regulators). Schieber, supra note 244, at 35–36; BUSINESS DICTIONARY, supra note 244.
285. I.R.C. § 430(c)(2)(A) (2018); ERISA § 303(c)(2)(A), 29 U.S.C. § 1083(c)(2)(A) (2018). 286. See supra Section III.D. 287. See supra Section III.D.
FORMAN_22MAY20.DOCX (DO NOT DELETE) 6/30/2020 12:11 PM
1290 MARQUETTE LAW REVIEW [103:1205
B. Cost-of-Living Adjustments (COLAs) The model pension plans assumed that the typical retiree would collect a
level-dollar pension—throughout her retirement (e.g., $40,000-a-year over a 20-year retirement). In the real world, however, retirees face inflation, and that inflation will erode the real value of any level-dollar pension. This Section explains how greater savings would be needed to offset that postretirement inflation. In short, more money must be saved if the retiree wants to ensure that she will have a pension that does not decline in real value over time. In passing, it is worth recalling that Social Security benefits are adjusted for post-retirement inflation.288
1. How Will Post-Retirement Inflation Affect a Level-Dollar Pension? At the outset, Table 12 shows how inflation can erode the real value of any
level-dollar pension over time. Column 1 of Table 12 shows the retiree’s age (x) from age 65 through age 85 as this Article has so far modeled—and also through age 105 as, in the real world, many Americans will live past 100.289 In that regard, Columns 6 and 7 of Table 12 show the Social Security Administration’s estimates of period life expectancy in 2016 for males and females of various ages, respectively.290
288. See 2020 SOCIAL SECURITY CHANGES, supra note 20. 289. While the average life expectancy of a 65-year-old is around 20 years, many will live to be
100 or more. For example, the Social Security Administration’s 2016 period life table shows 994 live males at age 100 (compared with 79,893 living 65-year-old males out of 100,000 live births), and 2,892 live females at age 100 (compared with 87,574 living 65-year-old females out of 100,000 live births). Actuarial Life Table, supra note 170.
To be sure, the Social Security Administration’s 2016 period life table actually has entries through age 119 (i.e., that table assumes that the last survivor dies at age 120). Id. However, that level of detail is not necessary for the present discussion.
290. Id.
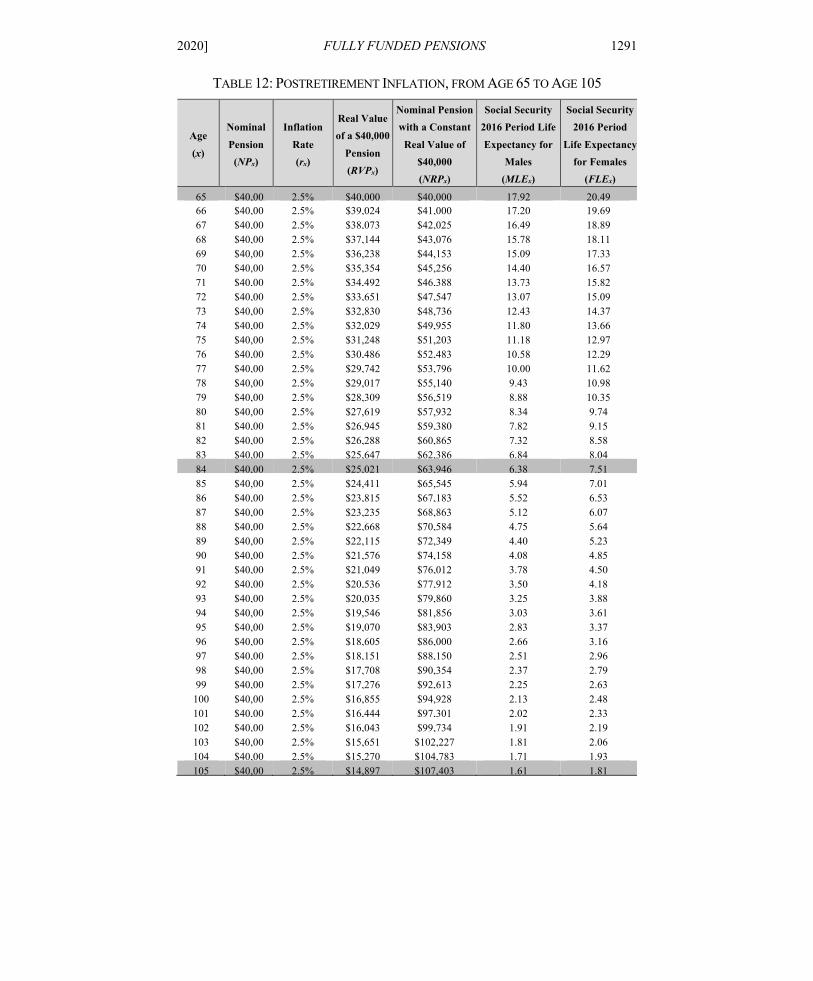
FORMAN_22MAY20.DOCX (DO NOT DELETE) 6/30/2020 12:11 PM
2020] FULLY FUNDED PENSIONS 1291
TABLE 12: POSTRETIREMENT INFLATION, FROM AGE 65 TO AGE 105
Age (x)
Nominal Pension
(NPx)
Inflation Rate (rx)
Real Value of a $40,000
Pension (RVPx)
Nominal Pension with a Constant
Real Value of $40,000 (NRPx)
Social Security 2016 Period Life Expectancy for
Males (MLEx)
Social Security 2016 Period
Life Expectancy for Females
(FLEx)
65 $40,00
2.5% $40,000 $40,000 17.92 20.49 66 $40,00
2.5% $39,024 $41,000 17.20 19.69
67 $40,00
2.5% $38,073 $42,025 16.49 18.89 68 $40,00
2.5% $37,144 $43,076 15.78 18.11
69 $40,00
2.5% $36,238 $44,153 15.09 17.33 70 $40,00
2.5% $35,354 $45,256 14.40 16.57
71 $40,00
2.5% $34,492 $46,388 13.73 15.82 72 $40,00
2.5% $33,651 $47,547 13.07 15.09
73 $40,00
2.5% $32,830 $48,736 12.43 14.37 74 $40,00
2.5% $32,029 $49,955 11.80 13.66
75 $40,00
2.5% $31,248 $51,203 11.18 12.97 76 $40,00
2.5% $30,486 $52,483 10.58 12.29
77 $40,00
2.5% $29,742 $53,796 10.00 11.62 78 $40,00
2.5% $29,017 $55,140 9.43 10.98
79 $40,00
2.5% $28,309 $56,519 8.88 10.35 80 $40,00
2.5% $27,619 $57,932 8.34 9.74
81 $40,00
2.5% $26,945 $59,380 7.82 9.15 82 $40,00
2.5% $26,288 $60,865 7.32 8.58
83 $40,00
2.5% $25,647 $62,386 6.84 8.04 84 $40,00
2.5% $25,021 $63,946 6.38 7.51
85 $40,00
2.5% $24,411 $65,545 5.94 7.01 86 $40,00
2.5% $23,815 $67,183 5.52 6.53
87 $40,00
2.5% $23,235 $68,863 5.12 6.07 88 $40,00
2.5% $22,668 $70,584 4.75 5.64
89 $40,00
2.5% $22,115 $72,349 4.40 5.23 90 $40,00
2.5% $21,576 $74,158 4.08 4.85
91 $40,00
2.5% $21,049 $76,012 3.78 4.50 92 $40,00
2.5% $20,536 $77,912 3.50 4.18
93 $40,00
2.5% $20,035 $79,860 3.25 3.88 94 $40,00
2.5% $19,546 $81,856 3.03 3.61
95 $40,00
2.5% $19,070 $83,903 2.83 3.37 96 $40,00
2.5% $18,605 $86,000 2.66 3.16
97 $40,00
2.5% $18,151 $88,150 2.51 2.96 98 $40,00
2.5% $17,708 $90,354 2.37 2.79
99 $40,00
2.5% $17,276 $92,613 2.25 2.63 100 $40,00
2.5% $16,855 $94,928 2.13 2.48
101 $40,00
2.5% $16,444 $97,301 2.02 2.33 102 $40,00
2.5% $16,043 $99,734 1.91 2.19
103 $40,00
2.5% $15,651 $102,227 1.81 2.06 104 $40,00
2.5% $15,270 $104,783 1.71 1.93
105 $40,00
2.5% $14,897 $107,403 1.61 1.81
FORMAN_22MAY20.DOCX (DO NOT DELETE) 6/30/2020 12:11 PM
1292 MARQUETTE LAW REVIEW [103:1205
Column 2 of Table 12 then shows that the nominal value of the hypothetical worker’s model pensions developed in Parts V and VI above would be $40,000 a year (NP65 = $40,000), and Column 3 then assumes that post-retirement inflation is 2.5% (the same as it was before retirement).291
Next, Column 4 of Table 12 shows how the real value of a level-dollar pension would decline throughout retirement. For example, while a nominal pension of $40,000 at age 65 (NP65 = $40,000, Column 2 of Table 12) would also have a real value of $40,000 at age 65 (RVP65 = $40,000, Column 4 of Table 12); a nominal pension of $40,000 at age 66 (NP66 = $40,000, Column 2 of Table 12) would be worth just $39,024 in real dollars at age 66 ($39,024 RVP66 = $40,000 / 1.025 = $40,000 / (1.000 + 0.025), Column 4 of Table 12). All in all, Column 4 shows how the real value of the hypothetical worker’s pension will decline from $40,000 (RVP65 = $40,000) at age 65 to just $25,021 at age 84 (RVP84 = $25,021), and to just $14,897 at age 105 (RVP105 = $14,897).
2. How Can a Cost-of-Living Adjustment (COLA) Maintain the Real Value of a Pension?
In order to ensure that a retiree’s pension maintains its real value throughout retirement, that pension should be adjusted for inflation each year. For example, if inflation is 2.5% at age 65, then the retiree will need a pension of $41,000 at age 66 for that pension to retain its real value ($41,000 = $40,000 × 1.025 = $40,000 × (1.000 + .025)). Accordingly, Column 5 of Table 12 shows how the hypothetical worker’s nominal pension should increase each year in order to maintain a constant real value of $40,000: starting at $40,000 at age 65 (NRP65 = $40,000), her pension should grow to $63,946 at age 84 (NRP84 = $63,946), and to $107,403 at age 105 (NRP105 = $107,403).
3. How Much Should Be Saved to Pay for that COLA? To be sure, with $400,000 saved for the hypothetical worker at age 65, she
could get an inflation-adjusted pension—but not one that would pay her $40,000 a year for life in real dollars. That is, an inflation-adjusted pension would cost more than $400,000—about 23% more according to the author’s estimate.292 In short, contributions would need to be roughly 23% higher. For
291. See supra Parts V and VI. 292. As a rough estimate, the author thought about this problem in the following way. The model
pensions in this Article all assumed that if there was $400,000 in retirement savings at age 65, then, given the annuity factor of 10, and 20-year retirement period, that $400,000 would generate 20 annual payments of $40,000. It turns out that the present value of those 20 $40,000 payments at age 65 at a 5% discount rate is $523,412. On the other hand, the present value at age 65 of the first 20 entries of column 5 of Table 12 at a 5% discount rate is $642,470; and $642,470 divided by $523,412 equals
FORMAN_22MAY20.DOCX (DO NOT DELETE) 6/30/2020 12:11 PM
2020] FULLY FUNDED PENSIONS 1293
example, since career-long contributions of 7.27% of payroll were enough to provide the hypothetical worker with a $40,000-a-year, level-dollar pension, then career-long contributions of around 9% of salary would be needed to instead provide her with an inflation-adjusted pension starting at $40,000 a year and growing to $63,946 at age 84 (8.94% = 1.23 × 7.27%). Alternatively, since level-dollar contributions of $3,231 were enough to provide her with that $40,000-a-year, level-dollar pension, then career-long contributions of around $4,000 a year would be needed to instead provide her with that inflation-adjusted pension ($3,974.13 = 1.23 × $3,231).
C. Working Careers and Benefit Accumulation in the Real World As Section V.A.2 above discussed, in the real world, not every worker
actually has a 40-year career. Moreover, even if a worker has a 40-year career, she may not actually accrue benefits under a pension in every one of those 40 years. Finally, even if a worker accrues benefits under a pension every one of those 40 years, she may not actually vest in all of those accrued benefits. Accordingly, if saving around 9% a year for retirement would provide a worker with a 40-year career with an inflation-adjusted pension that would replace 40% of her preretirement earnings,293 then workers who have shorter careers or accrue or vest in less retirement savings would need to save more than 9% of salary in the years that they do save for retirement. On the other hand, workers who accumulate retirement savings for more years—for example, because they do not retire until age 70—could have secure pensions even if they save less than 9% of salary in each year that they do work. 1.22747. Accordingly, if $400,000 would be enough to make those 20 payments of $40,000, then roughly 23% more retirement savings would be needed (at age 65) in order to make the first $40,000 pension payment and the next 19 inflation-adjusted pension payments in column 5 of Table 12 (0.22747 = 1.22747 – 1.0). (To be sure, the $523,412 present value does seem anomalous when compared with the $400,000 actually accumulated retirement savings for the model pensions in this Article; but, for simplicity, this Article assumed an annuity factor of 10 rather than actually generating a model-specific annuity factor based on the other economic and demographic assumptions. Moreover, for purposes of the 23% estimate computed in this footnote, all that matters are the relative values of the level-dollar pension and the 2.5%-inflation-adjusted pension, and the absolute values of the two pensions are irrelevant. Accordingly, if $400,000 would be enough for a $40,000-a-year level-dollar pension, then $491,000 would be enough for an inflation-adjusted pension starting at $40,000 at age 65 and growing to $63,946 at age 84 [$490,986 = 1.22746517 × $400,000 = $400,000 × $642,470 / $523,412]).
A proper estimate of the cost of a real-world COLA would require using real life expectancies instead of the assumed 20-year-certain retirement period assumed in this Article and would involve using an annuity factor that itself takes the cost-of-living adjustment rate into account. See Forman & Sabin, supra note 201, at 793–94 n.143.
293. See supra Section VII.B.3.
FORMAN_22MAY20.DOCX (DO NOT DELETE) 6/30/2020 12:11 PM
1294 MARQUETTE LAW REVIEW [103:1205
This Section highlights many real-world factors that impede the accumulation of sufficient retirement savings to ensure that every American retiree has a pension that would replace 40% of her preretirement earnings. In thinking about this problem, it can make sense to compare the current voluntary pension system with an imaginary universal pension system that would ensure that virtually every worker would accumulate meaningful retirement savings in every job she works. For example, one can imagine a simple system of individual retirement savings accounts added on top of the current Social Security system. Under such a universal pension system, an additional, say, 7 to 9% of payroll could be withheld from every worker’s paycheck and contributed to her individual account.294 In short, this Section highlights some of the ways that our current voluntary pension system falls short of that imaginary universal pension system and so cannot reasonably be expected to provide most Americans with lifetime pensions that will replace 40% of their preretirement earnings.
1. Work Patterns in the Real World As already mentioned, in the real world, relatively few employees actually
work for 40 years before retiring,295 let alone for 40 years with the same employer.296 Many workers come in and out of the workforce as they pursue higher education, raise children, take care of aging parents and partners, or change jobs. Many Americans also work part-time jobs for significant portions of their careers.297 In planning for adequate retirement incomes however,
294. See infra Section VIII.B.1 for a more detailed discussion of universal pension systems. 295. See supra note 185 and accompanying text. 296. See supra note 137 and accompanying text. 297. See BUREAU OF LABOR STATISTICS, U.S. DEP’T OF LABOR, NEWS RELEASE, USDL-19-
2105, THE EMPLOYMENT SITUATION—NOVEMBER 2019 tbl.A-9 (2019), https://www.bls.gov/news.release/pdf/empsit.pdf [https://perma.cc/K5GV-XQ8G] (showing that 27.6 million people worked part-time in November of 2019); Megan Dunn, Who Chooses Part-Time Work and Why?, MONTHLY LABOR REV. (Mar. 2018), https://www.bls.gov/opub/mlr/2018/article/who-chooses-part-time-work-and-why.htm [https://perma.cc/CD4H-B3S9] (explaining that many workers voluntarily choose to work part-time for noneconomic reasons, e.g., childcare problems and other family obligations); see also Rob Valletta & Catherine van der List, Involuntary Part-Time Work: Here to Stay?, FRBSF ECONOMIC LETTER 2015-9 (June 8, 2015), https://www.frbsf.org/economic-research/files/el2015-19.pdf [https://perma.cc/W689-2JLH] (discussing the increase in involuntary part-time work); Lonnie Golden, Still Falling Short on Hours and Pay, ECON. POL’Y INST. (Dec. 5, 2016), https://www.epi.org/publication/still-falling-short-on-hours-and-pay-part-time-work-becoming-new-normal/ [https://perma.cc/TAY9-L2F5] (explaining that employers are increasing their reliance on part-time workers and that an increasing number of workers are working part-time involuntarily, as employers have intentionally shifted to more intensive use of part-time employment). Pertinent here, to give more part-time employees the opportunity to save for retirement, Congress
FORMAN_22MAY20.DOCX (DO NOT DELETE) 6/30/2020 12:11 PM
2020] FULLY FUNDED PENSIONS 1295
workers should want to earn some kind of pension coverage in almost every job that they hold and certainly on almost every job from age 25 until retirement. Unfortunately, workers do not always accumulate meaningful retirement savings on every job.
2. The Current Pension System Does Not Provide for Universal Participation and Coverage
Private employers are not required to offer pension plans to their employees, and, as already mentioned, at any point in time only around 56% of private-sector workers are covered by a pension.298 Moreover, even if an employer does offer a plan, the employer does not have to cover all of its workers. Basically, in part to make plan administration relatively simple, ERISA allows plan sponsors to exclude many of their employees from participation and coverage. For example, employers do not always have to allow part-time workers or workers under the age of 21 to participate in their plans, nor do employers have to permit workers to participate until those workers have completed one year of service.299 Moreover, while employers must usually cover a large percentage of their full-time workers under the minimum coverage rules, they certainly do not have to cover them all.300
3. Workers Do Not Always Accrue Significant Benefits on Every Job Moreover, ERISA does not mandate any specific benefit levels for
participating employees, nor does it require that benefits accrue evenly over time.301 Indeed, as Figure 2 above showed, benefit accruals can be significantly backloaded in favor of long-service employees. Moreover, ERISA’s benefit
recently enacted legislation that will require 401(k) plans to permit participation by long-term, part-time employees. See infra note 299.
298. See NATIONAL COMPENSATION SURVEY, 2019, supra note 15, at 3 tbl.2. 299. See I.R.C. § 410(a) (2018); ERISA § 202, 29 U.S.C. § 1052 (2018). However, starting in
2021, 401(k) plans will generally have to permit participation by long-term, part-time employees who have worked at least 500 hours for 3 consecutive years (and have reached age 21). I.R.C. §§ 401(k)(2)(D), (k)(15) (as revised by the Further Consolidated Appropriations Act, 2020, Pub. L. No. 116-94, Division O—Setting Every Community Up for Retirement Enhancement § 112).
300. I.R.C. § 410(b). For example, an employer can satisfy the so-called percentage test if the plan covers just 70% of the employer’s nonhighly compensated workers. I.R.C. § 410(b)(1)(A). Under the alternative coverage tests, a plan sponsor can usually cover an even smaller percentage of its nonhighly compensated workers. See A Guide to Common Qualified Plan Requirements, supra note 53.
301. Jonathan Barry Forman, Pensions and Retirement, in 2 LABOR AND EMPLOYMENT LAW AND ECONOMICS OF THE ENCYCLOPEDIA OF LAW AND ECONOMICS 539, 549 (Kenneth G. Dau-Schmidt, Seth D. Harris, & Orly Lobel eds., 2d ed. 2009).
FORMAN_22MAY20.DOCX (DO NOT DELETE) 6/30/2020 12:11 PM
1296 MARQUETTE LAW REVIEW [103:1205
accrual rules allow employers to create benefit accrual formulas that result in even more backloading in favor of older and long-service employees.302
In particular, traditional defined benefit pension plans tend to penalize workers who change jobs frequently. For example, Table 13 shows the magnitude of these financial penalties by comparing the retirement benefits of four workers. These workers all have the same 40-year pay histories as the hypothetical worker used throughout this Article (3.5% annual pay increases starting at $26,141 and ending at $100,000), and all of their employers have the same final-average-pay pension plan (1% times years of service times then-final pay). The only difference among these workers is that the first worker spent her entire 40-year career with just one employer, while the other workers divided their careers among two or more employers. The worker who worked 40 years for a single employer (Worker No. 1) would receive a pension of $40,000 a year at retirement, but the worker who worked for 5 different employers (Worker No. 4) would receive pensions totaling just $24,853 a year. All in all, traditional final-average-pay defined benefit plans tend to penalize younger and mobile employees.303
302. See, e.g., I.R.C. § 411(b); ERISA § 204, 29 U.S.C. § 1054. 303. Forman, supra note 301, at 563−66; see WILLIAM J. WIATROWSKI, BUREAU OF LABOR
STATISTICS, U.S. DEP’T OF LABOR, RETIREMENT PLAN DESIGN AND THE MOBILE WORKFORCE 2 (2005), https://www.bls.gov/opub/mlr/cwc/retirement-plan-design-and-the-mobile-workforce.pdf [https://perma.cc/4RHJ-NKLT].
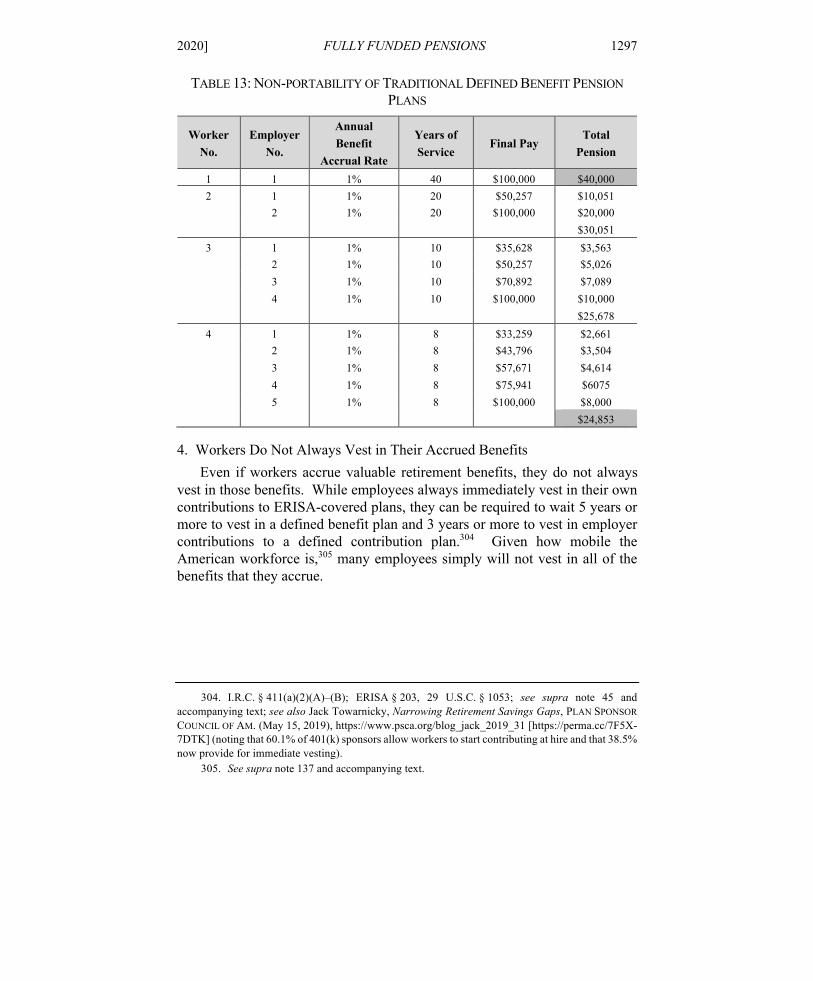
FORMAN_22MAY20.DOCX (DO NOT DELETE) 6/30/2020 12:11 PM
2020] FULLY FUNDED PENSIONS 1297
TABLE 13: NON-PORTABILITY OF TRADITIONAL DEFINED BENEFIT PENSION PLANS
Worker No.
Employer No.
Annual Benefit
Accrual Rate
Years of Service
Final Pay Total
Pension
1 1 1% 40 $100,000 $40,000 2 1 1% 20 $50,257 $10,051 2 1% 20 $100,000 $20,000 $30,051
3 1 1% 10 $35,628 $3,563 2 1% 10 $50,257 $5,026 3 1% 10 $70,892 $7,089 4 1% 10 $100,000 $10,000 $25,678
4 1 1% 8 $33,259 $2,661 2 1% 8 $43,796 $3,504 3 1% 8 $57,671 $4,614 4 1% 8 $75,941 $6075 5 1% 8 $100,000 $8,000 $24,853
4. Workers Do Not Always Vest in Their Accrued Benefits Even if workers accrue valuable retirement benefits, they do not always
vest in those benefits. While employees always immediately vest in their own contributions to ERISA-covered plans, they can be required to wait 5 years or more to vest in a defined benefit plan and 3 years or more to vest in employer contributions to a defined contribution plan.304 Given how mobile the American workforce is,305 many employees simply will not vest in all of the benefits that they accrue.
304. I.R.C. § 411(a)(2)(A)–(B); ERISA § 203, 29 U.S.C. § 1053; see supra note 45 and
accompanying text; see also Jack Towarnicky, Narrowing Retirement Savings Gaps, PLAN SPONSOR COUNCIL OF AM. (May 15, 2019), https://www.psca.org/blog_jack_2019_31 [https://perma.cc/7F5X-7DTK] (noting that 60.1% of 401(k) sponsors allow workers to start contributing at hire and that 38.5% now provide for immediate vesting).
305. See supra note 137 and accompanying text.
FORMAN_22MAY20.DOCX (DO NOT DELETE) 6/30/2020 12:11 PM
1298 MARQUETTE LAW REVIEW [103:1205
5. Retirees Do Not Always Annuitize Their Retirement Savings As already mentioned, while defined benefit plans typically provide
lifetime annuities as the default option for retirees,306 defined contribution plans usually provide lump sum distributions.307 While annuities hold at least some of their value over time, when retirees take lump sum distributions, it seems likely that they will dissipate those distributions over just a few years and not use them to generate retirement income that can last a lifetime. Defined contribution plans are particularly leaky: they often allow participants to withdraw all or a portion of their individual accounts when they change jobs, and many plans allow participants to borrow against their accounts.308 All in all, a significant portion of those premature distributions and loans will be dissipated before retirement.309
D. Social Security Replacement Rates Vary with Lifetime Income The model pensions developed in this Article assumed that Social Security
would replace around 35% of preretirement earnings for the typical worker, and that is a plausible rough estimate. In the real world, however, Social Security replaces a larger percentage of the preretirement earnings of workers with low lifetime earnings than it replaces for those with higher lifetime earnings.310 That suggests that in the real world, low-earners could save a lower percentage of their salaries and still be able to replace a total of 75% of their preretirement
306. See supra note 8 and accompanying text. 307. See WILLIS TOWERS WATSON, supra note 14, at 17. 308. See Reducing Retirement Savings Leakage, EMP. BENEFIT RES. INST. NOTES 1, 2 (Aug.
2016), https://www.ebri.org/docs/default-source/ebri-notes/ebri_notes_07-no9-aug16.pdf?sfvrsn=d1c5292f_0 [https://perma.cc/8SB7-7636]; U.S. GOV’T ACCOUNTABILITY OFFICE, GAO-19-179, RETIREMENT SAVINGS: ADDITIONAL DATE AND ANALYSIS COULD PROVIDE INSIGHT INTO EARLY WITHDRAWAL 3 (2019), https://www.gao.gov/assets/700/698041.pdf [https://perma.cc/APX2-BJHD]; U.S. GOV’T ACCOUNTABILITY OFFICE, GAO-09-715, 401(K) PLANS: POLICY CHANGES COULD REDUCE THE LONG-TERM EFFECTS OF LEAKAGE ON WORKERS’ RETIREMENT SAVINGS 12 (2009), https://web.archive.org/web/20191015130110/https://www.gao.gov/assets/300/294520.pdf [https://perma.cc/EH65-UTWH].
309. See The Impact of Leakages on 401(k) Accumulations at Retirement Age: Hearing on Lifetime Participation in Plans Before the ERISA Advisory Council of the U.S. Dep’t of Labor 9–11 (2014) (statement of Jack VanDerhei, Research Director, EBRI), https://www.dol.gov/sites/default/files/ebsa/about-ebsa/about-us/erisa-advisory-council/2014-facilitating-lifetime-plan-participation-vanderhei-06-17.pdf [https://perma.cc/7UAD-QQNB].
310. PETER J. BRADY, HOW AMERICA SUPPORTS RETIREMENT: CHALLENGING THE CONVENTIONAL WISDOM ON WHO BENEFITS 75 fig.2.10 (2016).
FORMAN_22MAY20.DOCX (DO NOT DELETE) 6/30/2020 12:11 PM
2020] FULLY FUNDED PENSIONS 1299
earnings.311 On the other hand, high-earners would need to save an even larger percentage of their salaries in order to replace a total of 75% of their preretirement earnings.
Figure 7 provides a graphic representation of this phenomenon.312 Figure 7 shows the Social Security replacement rates of various workers who were born in 1954 and turned age 65 in 2019, as estimated by the Chief Actuary of the Social Security Administration. Figure 7 also shows the implied retirement savings gaps that could be made up with a pension. For example, the first bar in Figure 7 shows that Social Security is currently replacing 73.5% of the preretirement earnings of workers with low lifetime earnings (scaled very-low lifetime earnings—career-average-earnings for 2018 equal to $12,959). That leaves those workers with an implied retirement savings gap of just 1.5% of preretirement earnings (1.5% = 75% of preretirement earnings target − 73.5% Social Security replacement rate). On the other hand, the third bar in Figure 7 shows that Social Security is currently replacing just 39.7% of the preretirement earnings of workers with average lifetime earnings (scaled medium earnings—career-average earnings for 2018 equal to $51,795); and they have an implied retirement savings gap of 35.3% (35.3% = 75% of preretirement earnings target – 39.7% Social Security replacement rate). Finally, Social Security is currently replacing just 26.1% of the preretirement earnings of workers with the highest lifetime earnings (steady maximum earnings—career-average earnings for 2018 equal to $127,061).313
311. See BRADY, BURHAM, & HOLDEN, supra note 2, at 18–19; see also BRADY, supra note 310, at 62−63.
312. Figure 7 is based on CLINGMAN, BURKHALTER, & CHAPLAIN, supra note 2, at 5−6 tbl.B. 313. To be sure, many analysts suggest that somewhat higher replacement rates are needed for
workers with lower lifetime earnings than for those with higher lifetime earnings. See, e.g., AON CONSULTING, supra note 112, at 24.
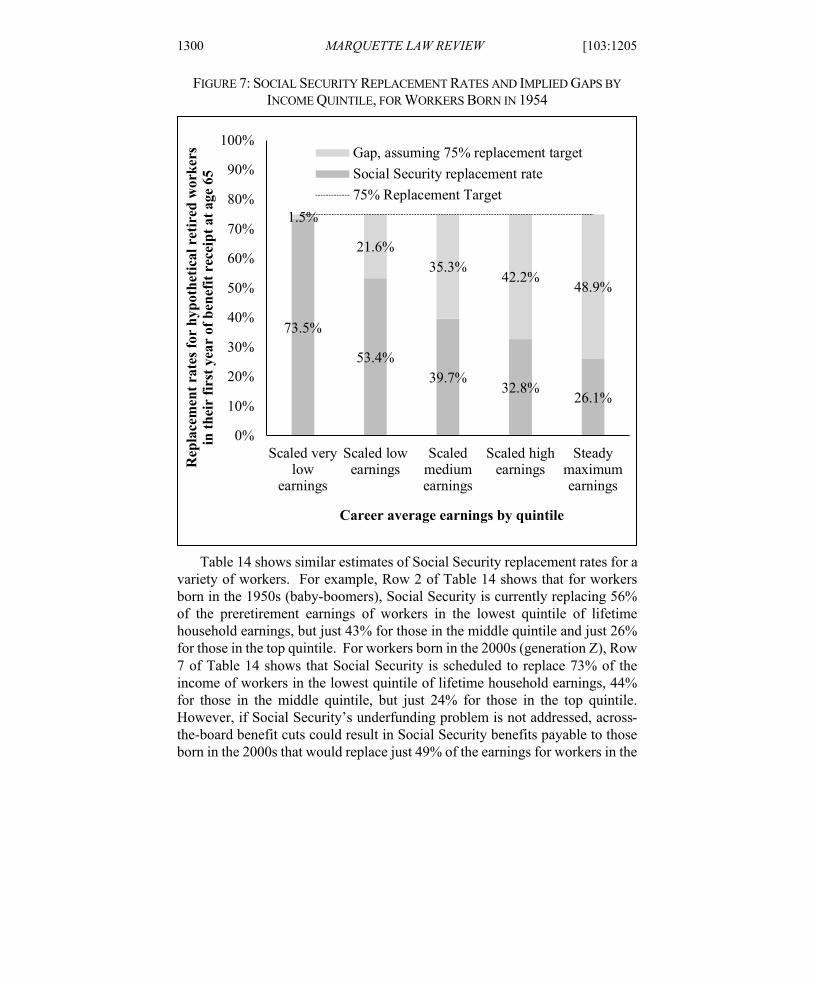
FORMAN_22MAY20.DOCX (DO NOT DELETE) 6/30/2020 12:11 PM
1300 MARQUETTE LAW REVIEW [103:1205
FIGURE 7: SOCIAL SECURITY REPLACEMENT RATES AND IMPLIED GAPS BY INCOME QUINTILE, FOR WORKERS BORN IN 1954
Table 14 shows similar estimates of Social Security replacement rates for a
variety of workers. For example, Row 2 of Table 14 shows that for workers born in the 1950s (baby-boomers), Social Security is currently replacing 56% of the preretirement earnings of workers in the lowest quintile of lifetime household earnings, but just 43% for those in the middle quintile and just 26% for those in the top quintile. For workers born in the 2000s (generation Z), Row 7 of Table 14 shows that Social Security is scheduled to replace 73% of the income of workers in the lowest quintile of lifetime household earnings, 44% for those in the middle quintile, but just 24% for those in the top quintile. However, if Social Security’s underfunding problem is not addressed, across-the-board benefit cuts could result in Social Security benefits payable to those born in the 2000s that would replace just 49% of the earnings for workers in the
73.5%
53.4%39.7%
32.8%26.1%
1.5%
21.6%35.3%
42.2%48.9%
0%
10%
20%
30%
40%
50%
60%
70%
80%
90%
100%
Scaled verylow
earnings
Scaled lowearnings
Scaledmediumearnings
Scaled highearnings
Steadymaximumearnings
Rep
lace
men
t rat
es fo
r hy
poth
etic
al r
etir
ed w
orke
rs
in th
eir
first
yea
r of
ben
efit
rece
ipt a
t age
65
Career average earnings by quintile
Gap, assuming 75% replacement targetSocial Security replacement rate75% Replacement Target
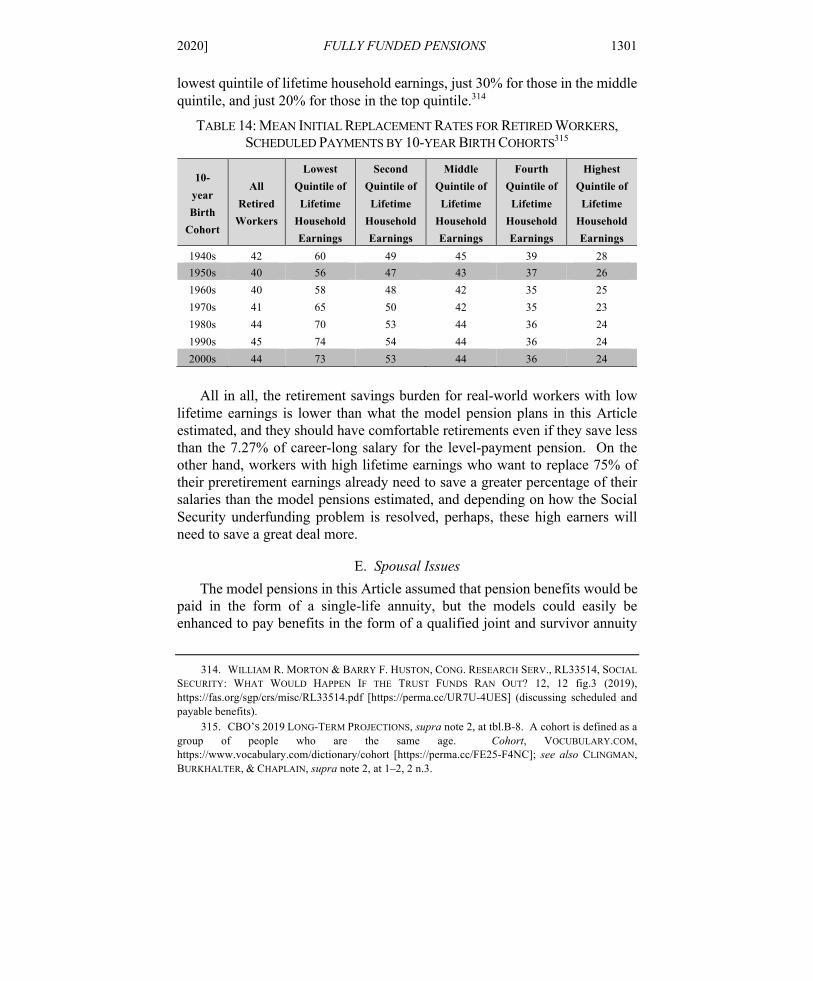
FORMAN_22MAY20.DOCX (DO NOT DELETE) 6/30/2020 12:11 PM
2020] FULLY FUNDED PENSIONS 1301
lowest quintile of lifetime household earnings, just 30% for those in the middle quintile, and just 20% for those in the top quintile.314
TABLE 14: MEAN INITIAL REPLACEMENT RATES FOR RETIRED WORKERS, SCHEDULED PAYMENTS BY 10-YEAR BIRTH COHORTS315
10-year Birth
Cohort
All Retired
Workers
Lowest Quintile of Lifetime
Household Earnings
Second Quintile of Lifetime
Household Earnings
Middle Quintile of Lifetime
Household Earnings
Fourth Quintile of Lifetime
Household Earnings
Highest Quintile of Lifetime
Household Earnings
1940s 42 60 49 45 39 28 1950s 40 56 47 43 37 26 1960s 40 58 48 42 35 25 1970s 41 65 50 42 35 23 1980s 44 70 53 44 36 24 1990s 45 74 54 44 36 24 2000s 44 73 53 44 36 24
All in all, the retirement savings burden for real-world workers with low
lifetime earnings is lower than what the model pension plans in this Article estimated, and they should have comfortable retirements even if they save less than the 7.27% of career-long salary for the level-payment pension. On the other hand, workers with high lifetime earnings who want to replace 75% of their preretirement earnings already need to save a greater percentage of their salaries than the model pensions estimated, and depending on how the Social Security underfunding problem is resolved, perhaps, these high earners will need to save a great deal more.
E. Spousal Issues The model pensions in this Article assumed that pension benefits would be
paid in the form of a single-life annuity, but the models could easily be enhanced to pay benefits in the form of a qualified joint and survivor annuity
314. WILLIAM R. MORTON & BARRY F. HUSTON, CONG. RESEARCH SERV., RL33514, SOCIAL SECURITY: WHAT WOULD HAPPEN IF THE TRUST FUNDS RAN OUT? 12, 12 fig.3 (2019), https://fas.org/sgp/crs/misc/RL33514.pdf [https://perma.cc/UR7U-4UES] (discussing scheduled and payable benefits).
315. CBO’S 2019 LONG-TERM PROJECTIONS, supra note 2, at tbl.B-8. A cohort is defined as a group of people who are the same age. Cohort, VOCUBULARY.COM, https://www.vocabulary.com/dictionary/cohort [https://perma.cc/FE25-F4NC]; see also CLINGMAN, BURKHALTER, & CHAPLAIN, supra note 2, at 1–2, 2 n.3.
FORMAN_22MAY20.DOCX (DO NOT DELETE) 6/30/2020 12:11 PM
1302 MARQUETTE LAW REVIEW [103:1205
(QJSA).316 As the joint life expectancy of a couple would be longer than that of a single participant,317 an actuarial reduction would be needed, and the QJSA would not replace 40% of preretirement earnings.318 At the same time, however, married couples are eligible for additional spousal benefits under Social Security that would often more than offset the actuarial reductions that can result from selecting QJSAs over a single-life annuities.319
Pertinent here, while a QJSA is the default form of benefit for defined benefit plans,320 the usual rule for defined contribution plans is instead that the balance in participant’s account is payable to the spouse at death.321 In short, the typical defined contribution plan participant is generally free to spend her defined contribution savings as she pleases and may not end up leaving anything behind for the benefit of her surviving spouse, let alone leaving her spouse a survivor annuity. The rules governing IRAs are even more relaxed: an individual with an IRA is free to spend the balance in her account as she wishes and, furthermore, is free to designate whoever she wants as her beneficiary.322 Congress could help protect nonemployee spouses by extending the QJSA regime to defined contribution plans and IRAs, or by requiring that
316. See supra note 62 and accompanying text. 317. See supra note 11 and accompanying text. 318. I.R.C. § 417(b)(2) (2018); ERISA § 205(d)(1)(B), 29 U.S.C. § 1055(d)(1)(B) (2018); see
also Donald Bell & Avy Graham, Surviving Spouse’s Benefits in Private Pension Plans, MONTHLY LABOR REV. (Apr. 1984), https://www.bls.gov/mlr/1984/04/art3full.pdf [https://perma.cc/72GP-B6BN]. For example, while a 65-year-old man could have purchased an immediate fixed (lifetime) annuity without inflation protection that paid around $6,660 a year for $100,000 in December of 2018, see supra note 103 and accompanying text, $100,000 would have gotten a couple (consisting of a 65-year-old male and a 60-year-old female) a joint-and-50%-survivor annuity that paid only around $6,168 a year. Immediate Annuities Update, supra note 103, at 25 tbl.11 ($6,168 = 12 × an average payment of $514 per month). That is around 8% less for this joint-and-survivor annuity (1.0798 = $6,660 / $6,168).
319. A retirement-age wife or husband of a retired worker can claim a monthly benefit equal to 50% of the worker’s primary insurance amount (PIA). 42 U.S.C. § 402 (2018). Consequently, a retired worker and retirement-age spouse can claim a monthly benefit equal to 150% of what the retired worker alone could claim. For example, if a retired worker could claim a benefit equal to $1,000 a month, a retired couple could claim a benefit of $1,500 a month. In addition, a retirement-age widow or widower of the worker is entitled to a monthly surviving spouse benefit equal to 100% of the worker’s PIA. For example, if a retired worker could claim a benefit of $1,000 a month (and a retired couple benefit of $1,500 a month), the surviving spouse could claim a benefit of $1,000 a month.
320. See I.R.C. § 401(a)(11); see also supra note 62 and accompanying text. 321. I.R.C. § 401(a)(11); ERISA § 205, 29 U.S.C. § 1055. 322. See Retirement Topics – Beneficiary, INTERNAL REVENUE SERV.,
https://www.irs.gov/retirement-plans/plan-participant-employee/retirement-topics-beneficiary [https://perma.cc/TX9S-B5CQ].
FORMAN_22MAY20.DOCX (DO NOT DELETE) 6/30/2020 12:11 PM
2020] FULLY FUNDED PENSIONS 1303
the nonemployee spouse consent to the cashing out of defined contribution plans and IRAs.323
F. Variability in Economic and Demographic Variables The model pensions developed in this Article could easily accommodate
simple alternative assumptions about economic and demographic variables. Modeling real-world fluctuations and variance in such variables as the interest rate and the inflation rate would be more challenging but is certainly possible. In this Section, however, the most important assumptions to reconsider are the ones that relate to mortality.
First, this Article assumed an annuity factor of 10 for both the model defined benefit plan and the model defined contribution plans, and that annuity factor is probably too low.324 It would be more realistic if the model plans instead used an annuity factor of 12 or 13.325 The model plans used an annuity factor of 10, largely because it is so easy to see the connection between $400,000 of retirement savings and a pension of $40,000 a year (i.e., $40,000 = $400,000 / 10). Mathematically, the higher the annuity factor, the more retirement savings that are needed in order to pay a given annual pension. For example, if the real-world annuity factor is actually 13—not 10—then a worker will need to save 30% more for retirement (130% = 1.3 = 13 / 10). In short, if the correct annuity factor is 13—not 10, then a typical worker will need to save $520,000 for retirement—not $400,000 (i.e., $40,000 = $520,000 / 13). That means that the typical worker should save around 9.45% a year as a level percentage of her salary each year for 40 years—not 7.27% (9.451 = 1.3 × 7.27); alternatively, she should save around $4,200 a year as a level dollar amount each year for 40 years—not $3,231 a year ($4,200.30 = 1.3 × $3,231). Accordingly, readers need to be a little bit cautious about the accuracy of the 7.27%-of-salary and the $3,231-a-year retirement savings targets.
Second, the model pensions in this Article assumed that all workers lived from age 25 to age 65. In fact, only around 85% of workers are likely to live from age 25 to age 65 and collect a pension.326 As those workers who die before 65 do not need pensions (ignoring any surviving spouse benefits), the actual cost of providing pensions for the surviving participants should be somewhat lower than what was estimated based on the model pensions. As already
323. See, e.g., S. 975, 116th Cong. § 205A (2019) (Women’s Retirement Protection Act
introduced by Senator Patty Murray [D-WA]). 324. See supra notes 202, 270−71 and accompanying text. 325. See supra notes 270−71 and accompanying text. 326. See supra note 190 and accompanying text.
FORMAN_22MAY20.DOCX (DO NOT DELETE) 6/30/2020 12:11 PM
1304 MARQUETTE LAW REVIEW [103:1205
mentioned, with defined benefit plans, any given plan sponsor’s aggregate funding obligation (i.e., contributions) would be lower because the accrued benefits of those who die before age 65 are typically forfeited.327 Participants in defined contribution plans (and IRAs) could also benefit from such mortality gains (i.e., save less) if, throughout their careers, they invested their individual accounts in lifetime annuities.328
Third, the model pensions could probably do a better job at estimating the costs of providing those pensions to those that live to age 65 and retire. For simplicity, the model pension plans estimated pension costs by modeling exactly 20 years’ worth of pension payments for the typical retiree—from age 65 through age 84 (with death at age 85). A more complicated model could estimate pension costs and outcomes based on the full range of retiree characteristics.329 In particular, life expectancy can vary dramatically with such demographic factors as gender, income, educational level, and race and Hispanic origin.330 For example, as already mentioned, women tend to live longer than men.331 Also, there is a growing gap in life expectancy between workers with low lifetime earnings and those with higher lifetime earnings.332 For example, studies have shown that lower-income men approaching retirement live, on average 3.6 to 12.7 fewer years than higher-income men (1.5 to 13.6 fewer years for women).333 Policymakers need to bear in mind that
327. See supra note 191 and accompanying text. 328. Individuals who invest in annuity-like products have mortality gains and losses depending
on when they die. Individuals who live longer than their peers get mortality gains from those who precede them, while individuals who die earlier than their peers suffer mortality losses. See David Blake, Annuity Markets: Problems and Solutions, 24 GENEVA PAPERS ON RISK & INS. 358, 371 (1999) (explaining that a mortality cross-subsidy “arises because some annuitants will die shortly after taking out an annuity thereby releasing a ‘mortality profit’ which insurance companies share with longer-surviving annuitants”).
329. See supra note 170 and accompanying text. 330. See, for example, the various sources at U.S. Department of Health and Human Services,
such as National Center for Health Statistics: Life Expectancy, CTRS. FOR DISEASE CONTROL & PREVENTION, http://www.cdc.gov/nchs/fastats/life-expectancy.htm [https://perma.cc/GZ2Q-4BK8].
331. See supra note 11 and accompanying text. 332. See KATELIN P. ISAACS & SHARMILA CHOUDHURY, CONG. RESEARCH SERV., R44846,
THE GROWING GAP IN LIFE EXPECTANCY BY INCOME: RECENT EVIDENCE AND IMPLICATIONS FOR THE SOCIAL SECURITY RETIREMENT AGE 9 (2017), https://fas.org/sgp/crs/misc/R44846.pdf [https://perma.cc/77EF-SCBP].
333. U.S. GOV’T ACCOUNTABILITY OFFICE, GAO-16-354, RETIREMENT SECURITY: SHORTER LIFE EXPECTANCY REDUCES PROJECTED LIFETIME BENEFITS FOR LOWER EARNERS 21−22 (2016), http://www.gao.gov/assets/680/676086.pdf [https://perma.cc/354H-JDZW]; Joyce Manchester, Vt. Legislative Joint Fiscal Office, Michael Simpson, Cong. Budget Office, & Geena Kim, Cong. Budget Office, Presentation to the 2014 Fall Research Conference of the Association of Public Policy and Management: Applications of Differential Mortality for Analyses of
FORMAN_22MAY20.DOCX (DO NOT DELETE) 6/30/2020 12:11 PM
2020] FULLY FUNDED PENSIONS 1305
some policies to encourage greater annuitization might have undesirable distributional consequences.
VIII. OPTIONS FOR REFORM How can we ensure that retirees will have fully funded pensions that will
provide them with adequate incomes throughout their retirement years? First, we should make sure that the Social Security system is fully funded. Second, we should make sure that virtually every retiree also has an inflation-adjusted pension that will replace a meaningful percentage of her preretirement earnings. These are discussed in turn.
A. Fully Fund Social Security First, we should make sure that the Social Security system is fully funded.
As explained in Section III.C above, the Social Security system operates largely on a pay-as-you-go basis (PAYG) and is currently underfunded by $13.9 trillion. The federal government should commit to eliminating that funding shortfall, and Table 15 shows how some representative changes to the Social Security system could reduce that shortfall. The Social Security Administration also routinely provides actuarial estimates of Social Security reform proposals.334 In that regard, for example, the recently-introduced Social Security 2100 Act would raise taxes enough to both expand benefits for many elderly Americans and also ensure that the Social Security system is solvent for the rest of the century.335
Social Security Policy Options 6 (Nov. 7, 2014), https://www.cbo.gov/sites/default/files/presentation/49659-presentation-differentialmortality.pdf [https://perma.cc/6QZT-Y33T].
334. SSA, Proposals to Change Social Security, supra note 132. 335. H.R. 860, 116th Cong. § 203 (2019) (introduced on Jan. 30, 2019 by Representative John
B. Larson [D-CT]); Letter from Stephen C. Goss, Chief Actuary, Soc. Sec. Admin., to John Larson, Chairman, Subcommittee on Soc. Sec., Richard Blumenthal, Senator, Chris Van Hollen, Senator, (Jan. 30, 2019), https://www.ssa.gov/oact/solvency/LarsonBlumenthalVanHollen_20190130.pdf [https://perma.cc/2HUU-TWPC]. But see Sylvester J. Schieber, Alice in Wonderland . . . or Is It Plunderland? The Generational Implications of Social Security Financing Policy and New Proposals to Expand Benefits, 7 J. RETIREMENT 8, 26 (2019) (criticizing the Social Security 2100 Act for shifting the costs of benefit increases to future generations). See generally BIPARTISAN POL’Y CTR., SECURING OUR FINANCIAL FUTURE: REPORT OF THE COMMISSION ON RETIREMENT SECURITY AND PERSONAL SAVINGS 78−100 (2016), https://bipartisanpolicy.org/wp-content/uploads/2016/06/BPC-Retirement-Security-Report.pdf [https://perma.cc/2BFS-V5PX] (making recommendations to strengthen Social Security’s finances); WILLIAM G. GALE, FISCAL THERAPY: CURING AMERICA’S DEBT ADDICTION AND INVESTING IN THE FUTURE 157−63 (2019) (endorsing the Bipartisan Policy Center recommendations).
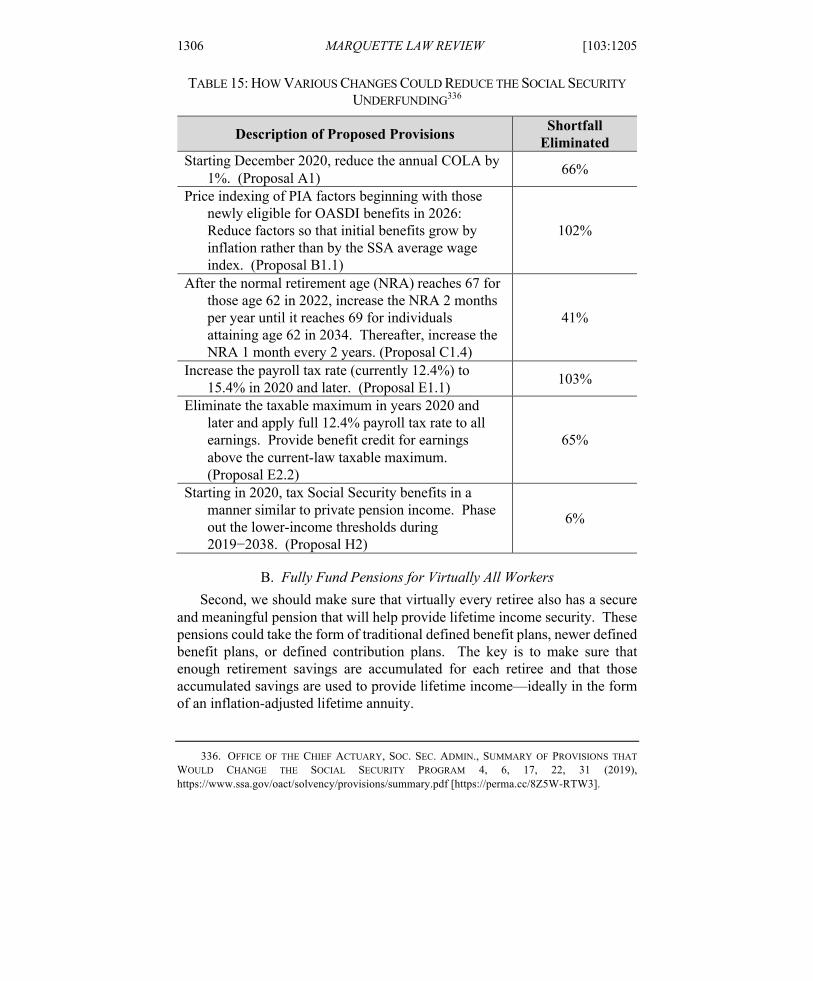
FORMAN_22MAY20.DOCX (DO NOT DELETE) 6/30/2020 12:11 PM
1306 MARQUETTE LAW REVIEW [103:1205
TABLE 15: HOW VARIOUS CHANGES COULD REDUCE THE SOCIAL SECURITY UNDERFUNDING336
Description of Proposed Provisions Shortfall Eliminated
Starting December 2020, reduce the annual COLA by 1%. (Proposal A1) 66%
Price indexing of PIA factors beginning with those newly eligible for OASDI benefits in 2026: Reduce factors so that initial benefits grow by inflation rather than by the SSA average wage index. (Proposal B1.1)
102%
After the normal retirement age (NRA) reaches 67 for those age 62 in 2022, increase the NRA 2 months per year until it reaches 69 for individuals attaining age 62 in 2034. Thereafter, increase the NRA 1 month every 2 years. (Proposal C1.4)
41%
Increase the payroll tax rate (currently 12.4%) to 15.4% in 2020 and later. (Proposal E1.1) 103%
Eliminate the taxable maximum in years 2020 and later and apply full 12.4% payroll tax rate to all earnings. Provide benefit credit for earnings above the current-law taxable maximum. (Proposal E2.2)
65%
Starting in 2020, tax Social Security benefits in a manner similar to private pension income. Phase out the lower-income thresholds during 2019−2038. (Proposal H2)
6%
B. Fully Fund Pensions for Virtually All Workers Second, we should make sure that virtually every retiree also has a secure
and meaningful pension that will help provide lifetime income security. These pensions could take the form of traditional defined benefit plans, newer defined benefit plans, or defined contribution plans. The key is to make sure that enough retirement savings are accumulated for each retiree and that those accumulated savings are used to provide lifetime income—ideally in the form of an inflation-adjusted lifetime annuity.
336. OFFICE OF THE CHIEF ACTUARY, SOC. SEC. ADMIN., SUMMARY OF PROVISIONS THAT
WOULD CHANGE THE SOCIAL SECURITY PROGRAM 4, 6, 17, 22, 31 (2019), https://www.ssa.gov/oact/solvency/provisions/summary.pdf [https://perma.cc/8Z5W-RTW3].
FORMAN_22MAY20.DOCX (DO NOT DELETE) 6/30/2020 12:11 PM
2020] FULLY FUNDED PENSIONS 1307
To be sure, there are many ways to increase the incomes of retirees. In particular, it would make sense to expand the Social Security and the Supplemental Security Income programs to ensure that all elderly Americans have enough retirement income to keep them out of poverty—or to replace even more preretirement earnings.337 In this Section, however, the focus is on how pensions could instead be used to provide additional retirement income—on top of Social Security. At the outset, building on the model pensions developed in Parts V and VI above, this Section shows how a universal pension system could be designed to replace, say, 40% of preretirement earnings. Finally, this Section also considers a variety of less extensive reform options that could help increase the number of retirees whose pensions would replace a meaningful percentage of their preretirement earnings.
1. A Universal Pension System As mentioned in Section VII.C above, one can imagine a universal pension
system consisting of a system of individual retirement savings accounts added on top of the current Social Security system. In 1981, for example, the President’s Commission of Pension Policy recommended adoption of a Minimum Universal Pension System (MUPS) that would have required all employers to contribute at least 3% of wages to private pensions for their workers.338 The simplest design for such a universal pension system would be to piggyback a system of individual retirement savings accounts onto the existing Social Security withholding system, and over the years, many analysts
337. See, e.g., MONIQUE MORRISSEY, ECON. POL’Y INST., STEADY CONTRIBUTIONS,
AFFORDABILITY, AND LIFETIME INCOME ARE THE BUILDING BLOCKS OF A RETIREMENT SYSTEM THAT WORKS FOR WORKING FAMILIES 5−11 (2019), https://www.epi.org/files/pdf/180680.pdf [https://perma.cc/25MN-VXFB]; Jonathan Barry Forman, Universal Pensions, 2 CHAP. L. REV. 95, 108−114 (1999).
338. PRESIDENT’S COMM’N ON PENSION POL’Y, COMING OF AGE: TOWARD A NATIONAL RETIREMENT INCOME POLICY 42–46 (1981); Report of the President’s Commission on Pension Policy: Executive Summary, 44 SOC. SECURITY BULL. 14, 14 (1981).
In the long run, such 3% add-on individual accounts could provide an annual retirement benefit equal to around 10 to 15% of preretirement earnings. From the hypotheticals in this Article, lifetime contributions of 3% of salary would lead to a pension that would replace around 16.5% of preretirement earnings (16.5062 = 40% × 3% / 7.27%), although it would take lifetime contributions of around 3.7% of salary for that pension to keep up with inflation (3.69% = 3% × 1.23); see also ADAM L. CARASSO & JONATHAN BARRY FORMAN, URBAN BROOKINGS TAX POL’Y CTR., DISCUSSION NO. 28, TAX CONSIDERATIONS IN A UNIVERSAL PENSION SYSTEM UPS) 7 (2007), https://www.urban.org/sites/default/files/publication/46936/411593-Tax-Considerations-in-a-Universal-Pension-System-UPS-.PDF [https://perma.cc/HLA2-PEGS] (estimating that a 3% universal pension system could replace an additional 14.4% of final wages for all men retiring at 65 [and 13.3% of final wages for all women]).
FORMAN_22MAY20.DOCX (DO NOT DELETE) 6/30/2020 12:11 PM
1308 MARQUETTE LAW REVIEW [103:1205
have recommended adding such individual accounts on top of the current Social Security system.339
These universal pension accounts could be held by the government or by large financial institutions. Either way, the funds should be invested well, and, at retirement, account balances should be paid out as lifetime annuities. Presumably, contributions to these universal pension accounts would be made with respect to every job of every worker in Social-Security-covered employment, and all contributions would vest immediately.
As the model pensions developed in Parts V and VI above showed, over a 40-year career, annual contributions of 7.27% of salary to such universal pension accounts would generate enough retirement savings to fund a level-dollar pension that would initially replace around 40% of preretirement earnings for the typical worker. Similarly, as the discussion of cost-of-living adjustments in Section VII.B above showed, contributions of 8.94% of salary would generate enough retirement savings to provide the typical worker with in an inflation-adjusted pension that would replace 40% of preretirement earnings in real dollars for life. The actual contribution rates might be set even lower as Social-Security-covered employment before age 25 and after age 64 would result in additional contributions to these individual retirement savings accounts.
In the present political climate, however, it seems unlikely that the federal government will enact a mandatory universal pension system, let alone a system that would require workers to contribute 7% of compensation (or more) to individual retirement savings accounts. Realistically, however, the federal government might create a voluntary universal pension system—one where workers are automatically enrolled unless they opt out.340 In that regard, a
339. See, e.g., Forman, supra note 337, at 108−12; TERESA GHILARDUCCI & TONY JAMES,
RESCUING RETIREMENT: A PLAN TO GUARANTEE RETIREMENT SECURITY FOR ALL AMERICANS 47 (2018) (calling for mandatory 3%-of-salary guaranteed retirement accounts); MORRISSEY, supra note 337, at 15−17 (endorsing guaranteed retirement accounts). See generally ALICIA H. MUNNELL, ANEK BELBASE, & GEOFFREY T. SANZENBACHER, CTR. FOR RET. RES. AT BOS. COLL., AN ANALYSIS OF RETIREMENT MODELS TO IMPROVE PORTABILITY AND COVERAGE 34−55 (2018), https://crr.bc.edu/wp-content/uploads/2018/03/Portability-and-coverage_Special-report.pdf [https://perma.cc/HG55-WQC6] (discussing mandatory and voluntary approaches for expanding coverage).
340. See, e.g., John A. Turner, Jules Lichtenstein, & Jennifer Erin Brown, Mandating Pension Auto-Enrollment in the United Kingdom: Implications for the United States, 6 J. RETIREMENT 82, 83, 85–86 (2018); JACK VANDERHEI, EMP. BENEFIT RESEARCH INST., ISSUE BRIEF NO. 484, ALTERNATIVE REALITIES: THE IMPACT OF EXTREME CHANGES IN DEFINED CONTRIBUTION PLANS ON RETIREMENT INCOME ADEQUACY IN AMERICA 12 (2019), https://www.ebri.org/content/alternative-realities-the-impact-of-extreme-changes-in-defined-
FORMAN_22MAY20.DOCX (DO NOT DELETE) 6/30/2020 12:11 PM
2020] FULLY FUNDED PENSIONS 1309
number of states are already creating such universal pension systems—at least for workers who are not already covered by an employer-sponsored pension.341
Contributions to these universal pension accounts could be automatically withheld from the salaries of every worker on every job, unless that worker opts out (i.e., automatic enrollment). Moreover, every worker should automatically be reenrolled each year, although each worker could again opt out (i.e., automatic reenrollment). Such automatic enrollment features would almost certainly lead to high participation rates—and to higher levels of retirement savings.342 These universal pension accounts could also be designed to invest in target-date funds and/or annuities, unless the worker elects otherwise (i.e., qualified default investment alternatives).343
Finally, these universal pension accounts could also be used to automatically combine each worker’s past pensions into a single account (i.e., auto-portability).344 With auto-portability, workers would be much less likely
contribution-plans-on-retirement-income-adequacy-in-america [https://perma.cc/X5BL-C8QM] (estimating how much more employees would save with a universal defined contribution plan scenario); SARAH HOLMES BERK, NAT’L ACAD. OF SOC. INS., CREATING A FEDERAL AUTO IRA AND ENHANCING SOCIAL SECURITY LONGEVITY DATA 4 (2019), https://www.nasi.org/sites/default/files/Federal%20auto%20IRA%20Holmes%20Berk(2).pdf [https://perma.cc/MAF8-56VN] (recommending a federal IRA with automatic enrollment [i.e., an “auto IRA”] to help workers without access to a 401(k) or similar retirement plan); see also WILLIAM G. GALE, SARAH E. HOLMES, & DAVID C. JOHN, RETIREMENT PLANS FOR CONTINGENT WORKERS: ISSUES AND OPTIONS 15–22 (2016), https://www.brookings.edu/wp-content/uploads/2016/09/rsp923paper1-1.pdf [https://perma.cc/UA6F-243C] (recommending restructuring retirement accounts so that they follow workers from job to job); JOHN N. FRIEDMAN, HAMILTON PROJECT, DISCUSSION PAPER 2015-5, BUILDING ON WHAT WORKS: A PROPOSAL TO MODERNIZE RETIREMENT SAVINGS 13–17 (2015), https://www.brookings.edu/wp-content/uploads/2016/06/friedman_modernize_retirement_savings_final.pdf [https://perma.cc/93GW-G7ZV] (recommending combining all of the various types of retirement accounts into a single Universal Retirement Saving Account).
341. See, e.g., State-Based Retirement Plans for the Private Sector, PENSION RTS. CTR., http://www.pensionrights.org/issues/legislation/state-based-retirement-plans-private-sector [https://perma.cc/75U4-E4BV]; AARP Public Policy Institute: State Retirement Savings Resource Center, AARP, https://www.aarp.org/ppi/state-retirement-plans.html [https://perma.cc/6LET-E7NV]; JACK VANDERHEI, EMP. BENEFIT RESEARCH INST., ISSUE BRIEF NO. 494, WHAT IF OREGONSAVES WENT NATIONAL: A LOOK AT THE IMPACT ON RETIREMENT INCOME ADEQUACY 1, 6 (2019), https://www.ebri.org/docs/default-source/ebri-issue-brief/ebri_ib_494_oregonsaves-31oct19.pdf?sfvrsn=8bd43c2f_6 [https://perma.cc/JPE4-7T43] (estimating that nationalizing the OregonSaves plan would reduce retirement savings shortfalls by 16.3%).
342. See, e.g., OECD, supra note 76, at 45–76. 343. Cf. I.R.C. § 404(c) (2018) (allowing 401(k) sponsors to choose qualified default investment
alternatives for workers who do not otherwise direct their own investments). 344. Cf. Brian Croce, Auto Portability Program Gets Thumbs up by Regulators, PENSIONS &
INVS. (July 31, 2019), https://www.pionline.com/regulation/auto-portability-program-gets-thumbs-
FORMAN_22MAY20.DOCX (DO NOT DELETE) 6/30/2020 12:11 PM
1310 MARQUETTE LAW REVIEW [103:1205
to dissipate pensions when they change jobs, and they would never lose a pension because they forgot about it: old pensions would automatically be combined into the worker’s new universal pension account. Thus, auto-portability would help reduce leakage and preserve retirement savings—for retirement purposes.345
2. Strengthening the Current Pension System Short of adopting add-on Social Security accounts or creating some other
form of universal pension accounts, there are many reforms that could increase the lifetime incomes of many retirees. In that regard, for example, the government could enact legislation to encourage workers to save more for retirement, to get better returns on their investments, to work longer, and to preserve their retirement savings until they retire.346
At the same time, the federal government needs to do more to ensure that private pensions are better funded. In the long run, it would make sense to toughen the minimum funding rules for defined benefit plans. For example, perhaps, defined benefit plans should be pushed towards faster prefunding methods: instead of just funding current benefit accruals (i.e., accumulated benefit obligation and termination liability), plan sponsors should be encouraged to fund their projected benefit obligations. For example, if plan sponsors were required to use the projected unit credit funding method or the entry age normal cost funding method, then virtually every worker’s accrued pension would be at least a little bit overfunded.347
In the short run, however, many single and multiemployer plans are currently underfunded, and it is not clear how those problems can be resolved. For example, the Pension Benefit Guaranty Corporation cannot afford to bail out all of the underfunded multiemployer plans, and while Congress recently bailed out the United Mineworkers of America’s pension fund, so far Congress has been unwilling to appropriate more funds for the rest of the underfunded multiemployer pension plans.348 Many state and local governments also need
regulators [https://perma.cc/V9MS-67NQ]; Auto Portability, RETIREMENT CLEARINGHOUSE, https://rch1.com/auto-portability [https://perma.cc/5YER-3PG3].
345. See JACK VANDERHEI, EMP. BENEFIT RESEARCH INST., ISSUE BRIEF NO. 489, THE IMPACT OF AUTO PORTABILITY ON PRESERVING RETIREMENT SAVINGS CURRENTLY LOST TO 401(K) CASHOUT LEAKAGE 1, 14–15 (2019), https://www.ebri.org/docs/default-source/ebri-issue-brief/ebri_ib_489_autoport-15aug19.pdf?sfvrsn=80723c2f_4 [https://perma.cc/AXC4-XHEY].
346. Forman, supra note 105, at 112−22. 347. See, e.g., supra note 262 and accompanying text. 348. See supra notes 146−51 and accompanying text.
FORMAN_22MAY20.DOCX (DO NOT DELETE) 6/30/2020 12:11 PM
2020] FULLY FUNDED PENSIONS 1311
to improve their pension funding policies and stop shifting the burden of pensions for today’s workers onto future generations of taxpayers.349
The federal government could also do more to mandate or at least encourage the annuitization of retirement savings.350 The federal government could even get into the market of selling annuities. For example, one recent proposal would allow workers to purchase additional Social Security retirement benefits on an actuarially fair basis.351
Other government efforts to expand participation and coverage could also increase retirement savings. In particular, toughening the minimum requirements for plan participation, coverage, and vesting should help mobile and part-time workers accumulate more savings for retirement.
Finally, Congress should do a better job promoting pension portability.352 Ideally, every worker should earn a pension benefit on virtually every job, and forfeitures should be extremely rare. When a worker leaves an employer, her accrued pension benefits should go with her to the next employer (or to a universal pension account). Moreover, the benefits that each worker earns should be based on her projected final pay so that her final pension would be just as large if she worked for ten different employers over the course of her career as if she worked for just one.353
IX. CONCLUSION American workers want to have meaningful incomes throughout their
retirement years. At the outset, this Article noted that Social Security benefits
349. See Jonathan Barry Forman & Michael J. Sabin, Full Funding of Traditional State and
Local Government Pensions: The Entry-Age-Service-Cost Method, 2019 N.Y.U. EMP. BENEFITS & EXEC. COMP. 11-1, 11-4, 11-35 (2019).
350. See, e.g., Forman, supra note 105, at 128−36. 351. Ian Ayres & Jacob Hacker, Social Security Plus, 26 ELDER L.J. 261, 268 (2019); see also
Margarida Correia, Thaler Pushing Retirement Idea, PENSIONS & INVS. (Apr. 29, 2019), https://www.pionline.com/article/20190429/PRINT/190429886/thaler-pushing-retirement-income-idea [https://perma.cc/R4JJ-EES2] (discussing Nobel laureate Richard H. Thaler’s recent proposal to allow workers to use a portion of their retirement savings to buy additional annuities from the Social Security Administration); Robert C. Merton & Arun Muraldihar, Time for Retirement ‘SeLFIES’?, RETIREMENT INCOME J. (Apr. 6, 2017), https://retirementincomejournal.com/article/time-for-retirement-selfies1/ [https://perma.cc/UN5V-8NWE] (describing Standard of Living Indexed, Forward-Starting, Income-Only Securities [SeLFIES]).
352. MUNNELL, BELBASE, & SANZENBACHER, supra note 339, at 20−28 (discussing various ways to promote portability). See generally COMMON WEALTH & ASPEN INST. FIN. SEC. PROGRAM, supra note 187.
353. See supra Section VII.C.3.
FORMAN_22MAY20.DOCX (DO NOT DELETE) 6/30/2020 12:11 PM
1312 MARQUETTE LAW REVIEW [103:1205
will replace around 35% of the typical worker’s preretirement earnings354 and that the typical worker will want to have a pension that would replace another 40% of preretirement earnings.355
This Article then developed several model pension plans and showed how those model pensions could replace 40% of preretirement earnings. More specifically, this Article showed that over a 40-year career from age 25 to age 65, annual contributions of around 7% of salary could generate enough retirement savings to fund a level-dollar pension that would initially replace around 40% of preretirement earnings. Similarly, this Article showed how contributions of around 9% of salary could generate enough retirement savings to fund an inflation-adjusted pension that would replace 40% of preretirement earnings in real dollars for life.
Finally, this Article offered some recommendations about how to improve the current pension system. In particular, this Article showed how a universal pension system could be designed to replace 40% of preretirement earnings for virtually every worker. The simplest approach would be to create a system of add-on Social Security accounts. Alternatively, the government could promote the creation of universal pension accounts. While the prospects for adopting any type of mandatory universal pension system are dim, the time is ripe for the federal government—or the states—to create a voluntary universal pension system—one where workers are automatically enrolled in individual pension accounts unless they opt out. Every worker should have an individual pension account to hold and invest her retirement savings, and, over time, those individual pension accounts would collect significant contributions, earn significant income, and ultimately pay meaningful pension benefits that would last a lifetime.
354. See BRADY, BURHAM, & HOLDEN, supra note 2, at 19. 355. See supra note 5 and accompanying text.