Identification of Pilot Tenders and Projects from Target Sectors ...
Upload
khangminh22Category
view
0download
0
Disclaimer excluding Agency responsibility Any dissemination of results must indicate that it reflects only the author's view and that the Agency is not responsible for any use that may be made of the information it contains
This project has received funding from the European Union’s Horizon 2020 research and innovation
programme under Grant Agreement No 727961
Prepared by: CERTH
Date: 29/5/2018
Project AGROinLOG “Demonstration of innovative integrated biomass logistics centres for the Agro-industry sector in Europe” Grant agreement: 727961 From November 2016 to April 2020
Basic analysis of targeted agricultural sectors D6.2.1 Country report Greece
D6.2.2 Country report Greece ii
Document:
D6.2.2 Basic analysis of targeted agricultural sectors – Country report Greece
Author:
Refere
R
Re
Re
CERTH Version: Final
Reference: AGROinLOG D6.2 Date: 29/05/18
DELIVERABLE FACTSHEET
Project start date: November 2016
Project website: www.agroinlog-h2020.eu
Deliverable number: D6.2.2
Deliverable title: Basic analysis of targeted agricultural sectors – country report Greece
Lead Partner: Wageningen Food & Biobased Research (WFBR)
Work Package no. and title: 6. Generic strategies for the development of future IBLCs
Task no. and title: 6.2 Basic analysis of targeted agricultural sectors
Version: final
Version Date: 29-05-2018
Diffusion list
Approvals
Company Author/s CERTH
Contributor INASO
Task Leader WFBR
WP Leader WFBR
Reviewer CIRCE
Documents history
Version Date Main modification Entity 1 30/08/2017 First draft CERTH 2 18/11/2017 Second draft (95%) CERTH 3 10/03/2018 Pre-Final (100%) CERTH
Review 10/04/2018 Version for review by CIRCE CERTH
Final 29/05/2018 Final CERTH
Dissemination level
X PU = Public
PP = Restricted to other programme participants (including the EC)
RE = Restricted to a group specified by the consortium (including the EC)
CO = Confidential, only for members of the consortium (including the EC)

D6.2.2 Country report Greece iii
Document:
D6.2.2 Basic analysis of targeted agricultural sectors – Country report Greece
Author:
Refere
R
Re
Re
CERTH Version: Final
Reference: AGROinLOG D6.2 Date: 29/05/18
DISCLAIMER OF WARRANTIES
“This project has received funding from the European Union’s Horizon 2020 research and innovation
programme under Grant Agreement No 727961”.”
This document has been prepared by AGROinLOG project partners as an account of work carried
out within the framework of the EC-GA contract no 727961.
Neither Project Coordinator, nor any signatory party of AGROinLOG Project Consortium Agreement,
nor any person acting on behalf of any of them:
(a) makes any warranty or representation whatsoever, express or implied,
(i). with respect to the use of any information, apparatus, method, process, or similar
item disclosed in this document, including merchantability and fitness for a
particular purpose, or
(ii). that such use does not infringe on or interfere with privately owned rights,
including any party's intellectual property, or
(iii). that this document is suitable to any particular user's circumstance; or
(b) assumes responsibility for any damages or other liability whatsoever (including any
consequential damages, even if Project Coordinator or any representative of a signatory
party of the AGROinLOG Project Consortium Agreement, has been advised of the possibility
of such damages) resulting from your selection or use of this document or any information,
apparatus, method, process, or similar item disclosed in this document.

D6.2.2 Country report Greece iv
Document:
D6.2.2 Basic analysis of targeted agricultural sectors – Country report Greece
Author:
Refere
R
Re
Re
CERTH Version: Final
Reference: AGROinLOG D6.2 Date: 29/05/18
ABBREVIATIONS
EBITDA: Earnings Before Interest, Taxes, Depreciation and Amortization
EBIT: Earnings Before Interest & Tax
GDP: Gross Domestic Product
ELSTAT: Hellenic Statistic Authority
HSI: Hellenic Sugar Industry
IBLC: Integrated biomass logistics centre
KEOSOE: Central Cooperative Union of Wine Products
OECD: Organisation For Economic Co-Operation and Development
OMWW: Olive Mill Waste Water
SPEL: Association of Olive Kernel Oil Producers of Greece
TPOMW: Two-phase olive mill waste
PARTNERS SHORT NAMES
CIRCE: Fundación CIRCE
WFBR: Wageningen Food & Biobased Research
ZLC: Fundación Zaragoza Logistics Centre
CERTH: Ethniko Kentro Erevnas Kai Technologikis Anaptyxis
RISE: RISE Research Institutes of Sweden AB
CREA: Consiglio per la Ricerca in Agricoltura e L'analisi dell' Economia Agraria
APS: Agroindustrial Pascual Sanz S.L
NUTRIA: Anonymi Biomichaniki Etairia Typopiisis Kai Emporias Agrotikon
LANTMÄNNEN: Lantmännen Ekonomisk Forening
Processum: RISE Processum AB
SCO-OPS: Cooperativas Agro-Alimentarias de España. Sociedad Cooperativa
INASO: Institouto Agrotikis Kai Synetairistikis Oikonomias INASO PASEGES
AESA: Agriconsulting Europe S.A
UCAB: Association Ukrainian Agribusinessclub
UBFME: University of Belgrade. Faculty of Mechanical Engineer

D6.2.2 Country report Greece v
Document:
D6.2.2 Basic analysis of targeted agricultural sectors – Country report Greece
Author:
Refere
R
Re
Re
CERTH Version: Final
Reference: AGROinLOG D6.2 Date: 29/05/18
EXECUTIVE SUMMARY
The current report investigates the following main agricultural sectors of the Greek economy: olive
oil, sugar industry, wine industry, grain supply chain and the vegetable oil extraction. Each sector
chapter consists of two main parts: i) general information on the sector, such as production process,
productivities, current state of the sector and degree of innovation and ii) opportunities of the IBLC
concept to be implemented on each sector/ existing agro-industries. IBLC is a concept that
diversifies regular activity of the agro-industry on both the input (feedstock) and output
(biocommodities, intermediates).
The olive oil and wine sectors are considered as the most important sectors for the Greek
agricultural economy not only because of their annual production but also because of the vast
amounts of by-products that both of them produce during their production process. These residues
can be used as feedstock for the production of solid biofuels (e.g. pellets from olive or wine
prunings), biochemicals from olive and wine by-products etc.
Furthermore, the sugar industry sector also generates residues and by-products, which can be used
as biomass feedstock – primarily, sugar beet pellets and molasses. The first, in particular, is used as
animal feed, whereas the second one is used as feedstock for the production of bioethanol.
Unfortunately, it should be mentioned that the sugar industry in Greece faces many challenges
considering its economic strength due to the economic crisis, thus, the quantities of the products
and by-products have been decreased for the last years.
Both, the vegetable oil extraction sector and the grain chain sector, produce significant amounts of
residues. These residues can be also used as feedstock for the production of solid biofuels (e.g.
straw pellets, briquettes.). However, a large portion of these by-products is used as raw material
for the feed and fodder sector or as bedding material. Another agricultural sector in Greece that
could be investigated regarding the IBLC concept implementation is the feed and fodder. However,
the scarcity of available statistical data and the difficulty to achieve communication with
stakeholders from this sector, made unfeasible to analyse this sector on the current report.
For a more detailed summary on every sector, Chapter 7 “Summary analysis of the country” can be
consulted, where all the information can be found.

D6.2.2 Country report Greece vi
Document:
D6.2.2 Basic analysis of targeted agricultural sectors – Country report Greece
Author:
Refere
R
Re
Re
CERTH Version: Final
Reference: AGROinLOG D6.2 Date: 29/05/18
TABLE OF CONTENTS
1 Introduction .................................................................................................................................................. 9
2 Olive Oil Sector ............................................................................................................................................ 11
2.1 Profile of the olive oil sector .................................................................................................................... 11
2.1.1 Production ..................................................................................................................................... 11
2.1.2 Volume of the sector .................................................................................................................... 14
2.1.3 State of the sector ........................................................................................................................ 16
2.1.4 Typical size of the companies ....................................................................................................... 18
2.1.5 Distinctive facilities of the sector ................................................................................................. 19
2.1.6 Degree of innovation .................................................................................................................... 20
2.2 Opportunities IBLC .................................................................................................................................... 20
2.2.1 Sector related residues ................................................................................................................. 20
2.2.2 Potential synergies & benefits ..................................................................................................... 23
2.2.3 Market developments .................................................................................................................. 24
2.2.4 Non-technical barriers .................................................................................................................. 25
3 Sugar Industry ............................................................................................................................................. 27
3.1 Profile of the sugar industry sector ......................................................................................................... 27
3.1.1 Production ..................................................................................................................................... 27
3.1.2 Volume of the sector .................................................................................................................... 28
3.1.3 State of the sector ........................................................................................................................ 29
3.1.4 Typical size of the companies ....................................................................................................... 31
3.1.5 Distinctive facilities of the sector ................................................................................................. 31
3.1.6 Degree of innovation .................................................................................................................... 32
3.2 Opportunities IBLC .................................................................................................................................... 33
3.2.1 Sector related residues ................................................................................................................. 33
3.2.2 Potential synergies & benefits ..................................................................................................... 34
3.2.3 Market developments .................................................................................................................. 34
3.2.4 Non-technical barriers .................................................................................................................. 34
4 Wine sector ................................................................................................................................................. 35

D6.2.2 Country report Greece vii
Document:
D6.2.2 Basic analysis of targeted agricultural sectors – Country report Greece
Author:
Refere
R
Re
Re
CERTH Version: Final
Reference: AGROinLOG D6.2 Date: 29/05/18
4.1 Profile of the wine sector ......................................................................................................................... 35
4.1.1 Production ..................................................................................................................................... 35
4.1.2 Volume of the sector .................................................................................................................... 37
4.1.3 State of the sector ........................................................................................................................ 39
4.1.4 Typical size of the companies ....................................................................................................... 39
4.1.5 Distinctive facilities of the sector. ................................................................................................ 40
4.1.6 Degree of innovation .................................................................................................................... 40
4.2 Opportunities IBLC .................................................................................................................................... 40
4.2.1 Sector related residues ................................................................................................................. 40
4.2.2 Potential synergies & benefits ..................................................................................................... 42
4.2.3 Market developments .................................................................................................................. 44
4.2.4 Non-technical barriers .................................................................................................................. 44
5 Grain chain .................................................................................................................................................. 45
5.1 Profile of the grain sector ......................................................................................................................... 45
5.1.1 Production ..................................................................................................................................... 45
5.1.2 Volume of the sector .................................................................................................................... 46
5.1.3 State of the sector ........................................................................................................................ 47
5.1.4 Typical size of the companies ....................................................................................................... 48
5.1.5 Distinctive facilities of the sector ................................................................................................. 49
5.1.6 Degree of innovation .................................................................................................................... 49
5.2 Opportunities IBLC .................................................................................................................................... 49
5.2.1 Sector related residues ................................................................................................................. 49
5.2.2 Potential synergies & benefits ..................................................................................................... 50
5.2.3 Market developments .................................................................................................................. 50
5.2.4 Non-technical barriers .................................................................................................................. 51
6 Vegetable oil extraction ............................................................................................................................... 52
6.1 Profile of the vegetable oil extraction sector .......................................................................................... 52
6.1.1 Production ..................................................................................................................................... 52
6.1.2 Volume of the sector .................................................................................................................... 53
6.1.3 State of the sector ........................................................................................................................ 54
6.1.4 Typical size of the companies ....................................................................................................... 55

D6.2.2 Country report Greece viii
Document:
D6.2.2 Basic analysis of targeted agricultural sectors – Country report Greece
Author:
Refere
R
Re
Re
CERTH Version: Final
Reference: AGROinLOG D6.2 Date: 29/05/18
6.1.5 Distinctive facilities of the sector ................................................................................................. 55
6.1.6 Degree of innovation .................................................................................................................... 56
6.2 Opportunities IBLC .................................................................................................................................... 56
6.2.1 Sector related residues ................................................................................................................. 56
6.2.2 Potential synergies & benefits ..................................................................................................... 57
6.2.3 Market developments .................................................................................................................. 57
6.2.4 Non-technical barriers .................................................................................................................. 58
7 Summary analysis of the country ................................................................................................................. 59
8 References .................................................................................................................................................. 68
9 Annex A. Consulted stakeholders ................................................................................................................ 72
D6.2.2 Country report Greece 9
Document:
D6.2.2 Basic analysis of targeted agricultural sectors – Country report Greece
Author:
Refere
R
Re
Re
CERTH Version: Final
Reference: AGROinLOG D6.2 Date: 29/05/18
1 INTRODUCTION
The current report constitutes part of the AGROinLOG project “Demonstration of innovative
integrated biomass logistics centers for the Agro-industry sector in Europe” (#727961) and is within
the scope of the Task 6.2 “Basic analysis of targeted agricultural sectors”. AGROinLOG supports the
demonstration of Integrated Biomass Logistic Centres (IBLC) for food and non-food products,
evaluating their technical, environmental and economic feasibility. This report aims at providing an
overview of the current state of the sectors and evaluating them with respect to the IBLC related
topics.
The following chains are considered in this report, due to their importance for the Greek agricultural
economy, the volume of residues and by-products produced every year and the opportunities they
represent to implement IBLC concepts: olive oil sector, sugar industry, wine sector and grain supply
chain. These sectors are also thought to have unexploited synergies in terms of underused
production, processing or storage capacities. In addition to the abovementioned sectors, the
vegetable oil extraction sector was investigated. However, due to lack of available data, the sector
is not described in the same detail as the other sectors.
A basic analysis, depending on the available public data sources (official statistics from the Hellenic
Statistical Authority and relevant Ministries, general information from different studies and papers,
webpages of main stakeholders and industries involved in the sectors), has been performed for
each sector. Moreover, additional information was gathered from the selected stakeholders in
order to have a clearer picture of the current state of each sector. More specifically the stakeholders
that were consulted are listed in Annex A.
More specifically on this report, basic information for each sector is analyzed. The analysis of each
sector is divided into two main parts:
One part regarding general information on the profile of the sector. Information about the
annual productivities, the production process, the volume, economic strength / state,
typical size of the companies, distinctive facilities and R&D activities of the sector are
presented.
Another part regarding the IBLC opportunities in each sector. Information is provided on
each sector’s residues, potential synergies of existing equipment during idle times, market
use of sector’s residues and non-technical barriers that can be encountered when the IBCL
concept will be implemented.
During the desk study performed in order to find data on the abovementioned Greek sectors,
several challenges were encountered due to the limited statistic data available on the residues of
the Greek sectors, economic data of the sectors etc. When applicable, in order to overcome
difficulties such as quantifying the amount of residues of each sector, worldwide literature and
scientific papers were used to estimate these amounts. In addition, difficulties were faced in

D6.2.2 Country report Greece 10
Document:
D6.2.2 Basic analysis of targeted agricultural sectors – Country report Greece
Author:
Refere
R
Re
Re
CERTH Version: Final
Reference: AGROinLOG D6.2 Date: 29/05/18
retrieving data of the sector from the stakeholders, since they could not be shared some detailed
data for confidentiality reasons.

D6.2.2 Country report Greece 11
Document:
D6.2.2 Basic analysis of targeted agricultural sectors – Country report Greece
Author:
Refere
R
Re
Re
CERTH Version: Final
Reference: AGROinLOG D6.2 Date: 29/05/18
2 OLIVE OIL SECTOR
2.1 Profile of the olive oil sector
2.1.1 Production
The main input for the olive oil sector is the fruit of the olive tree, while the main outcome are
various categories (based on quality) of olive oil. According to Annex I of the Community Regulation
865/04 "on the Common Organization of the Market in Olive Oil and Table Olives", ( EU Legislation,
2004) the quality categories of olive oil and olive-pomace oil authorized to be sold and marketed
within the Community are defined as follows (from highest to lowest quality ranking, IOC, 2017):
1) Virgin Olive Oil: olive oil obtained from the fruit solely by mechanical or other physical way
that do not lead to alterations in the oil.
Virgin Olive Oil is classified with the following names:
Extra Virgin Olive Oil: virgin olive oil which has a free acidity, expressed as oleic acid,
of not more than 0.8 grams per 100 grams and other characteristics that
correspond to the requirements of International Olive Council standards.
Virgin Olive Oil: virgin olive oil which has a free acidity, expressed as oleic acid, of
not more than 2 grams per 100 grams and other characteristics that correspond to
the requirements of International Olive Council standards.
Ordinary Virgin Olive Oil: virgin olive oil which has a free acidity, expressed as oleic
acid, of not more than 3.3 grams per 100 grams and other characteristics that
correspond to the requirements of International Olive Council standards.
2) Refined Olive Oil: olive oil obtained from virgin olive oils by refining methods, which do not
lead to alterations in the initial glyceridic structure. It has a free acidity, expressed as oleic
acid, of not more than 0.3 grams per 100 grams and other characteristics that correspond
to the requirements of International Olive Council standards (International Olive Council,
2006).
3) Olive Oil: olive oil consisting of refined olive oil and virgin olive oils. It has a free acidity,
expressed as oleic acid, of not more than 1 gram per 100 grams and other characteristics
that correspond to the requirements of International Olive Council standards.
4) Crude Pomace Oil: olive pomace oil whose characteristics correspond to the requirements
of International Olive Council standards. It is intended for refining for use for human
consumption, or it is intended for technical use.
5) Refined Pomace Oil: oil obtained from crude pomace oil by refining methods, which do not
lead to alterations in the initial glyceridic structure. It has a free acidity, expressed as oleic
acid, of not more than 0.3 grams per 100 grams and other characteristics that correspond
to the requirements of International Olive Council standards.
D6.2.2 Country report Greece 12
Document:
D6.2.2 Basic analysis of targeted agricultural sectors – Country report Greece
Author:
Refere
R
Re
Re
CERTH Version: Final
Reference: AGROinLOG D6.2 Date: 29/05/18
6) Pomace Oil: oil comprising the blend of refined olive pomace oil and virgin olive oils fit for
consumption as they are. It has a free acidity of not more than 1 gram per 100 grams and
other characteristics that correspond to the requirements of International Olive Council
standards.
After the harvesting, the olives are transported to the olive oil mill where oil is produced by cold or
hot pressing of the olive fruit. The mills carry out the first phase of olive oil production, which is
then either directly available for consumption in bulk or promoted to commercial enterprises for
resale in Greece or abroad, or is supplied to processing and/or standardization companies.
In general, there are three main types of olive oil mills depending on the production process:
a) Traditional olive mills, where hydraulic presses are used;
b) Three-phase centrifugal mills, where the extraction process produces olive oil, pomace
(~60% moisture content) and olive mill waste water (OMWW); and
c) Two-phase centrifugal mills, which produce olive oil and wet pomace (Two-Phase olive mill
waste/ TPOMW, ~70 % moisture content).
Between the two types of centrifugal extraction, two-phase mills are both more productive (in
terms of the amount of extracted olive oil) and more environmentally friendly. The main difference
is that two-phase mills require less water during the extraction process, leading to lower energy
costs, less water is wasted during the process and a higher extraction rate of olive oil (output/input
ratio around 20 % for two-phase and 18 % for three-phase mills) achieved. Overall, the average
processing cost of two-phase mills is about € 0.16 per kg of olive oil compared with € 0.19 per kg of
olive oil in three-phase mills (National Bank of Greece, 2015). Moreover, the higher concentration
of natural antacids enhances the quality of olive oil produced in two-phase mills and makes it more
resilient during storage.
Greek olive oil mills mostly use two-phase technology. The stakeholder of the Association of Olive
Kernel Oil Producers of Greece (SPEL) consulted estimates that there is a 60/40 split between the
two-phase and the three-phase systems in Greece. The promotion of two-phase mills is expected
to continue, aiming for higher productivity combined with improved environmental protection
(National Bank of Greece, 2015). The current trend in Greece is for three-phase olive mills to turn
into two-phase olive mills as there are corresponding legislations that support and push towards
this conversion.
Analytically the whole process of olive oil production, as it can been seen in Figure 1, is generally
the following:
Receiving the fruit: After harvest, the olives are transported to the mill, where they are
temporarily stored until they are processed.
Defoliation – Washing: Placement in a picking hopper of olives, transport by conveyor or
endless screw to a leaf removal, where leaves and other foreign bodies are removed and
then washed to remove other impurities.
Crack-milling of olives: Extrusion of the fruit and production of olive oil (or olive paste).

D6.2.2 Country report Greece 13
Document:
D6.2.2 Basic analysis of targeted agricultural sectors – Country report Greece
Author:
Refere
R
Re
Re
CERTH Version: Final
Reference: AGROinLOG D6.2 Date: 29/05/18
Malaxation: The olive oil is blended in softeners to achieve the merging of the oil traps into
larger drops of oil.
Extraction of olive oil: In the traditional process (hydraulic press), a liquid / water mixture
is first extracted, which is separated in a subsequent phase by centrifugation to obtain the
olive oil.
Three-phase centrifugation: In this step a significantly amount of hot water is inserted to
wash the oil. Separation of solid residue (olive cake) from the other two liquid phases occurs
in the decanter.
Vertical Centrifugation: The final separation of olive oil from the vegetation water.
Two-phase centrifugation: Same process as in three-phase centrifugation but the horizontal
centrifugation is performed without the addition of water. There are two output streams
as olive oil is separated from solid phase (TPOMW-wet pomace)
The olive mill wastes (pomace) are sent to pomace mills where further processing occurs for
retrieving edible pomace oil. Pomace mills are necessary steps in the olive oil value chain. They use
as raw material the crude olive cake produced by the olive mills, dry it and extract the residual oil
(usually using chemical solvents, such as hexane), known as pomace oil. Moreover, they produce
one or more solid biofuels originated from the stone, flesh and skin of the olive fruit (along with
some small quantity of residual oil). Depending on the process adopted, these can be olive stones
(mostly the pit part of the olive fruit), exhausted olive cake (mostly the flesh part of the olive fruit)
or “combined” fractions.
Concerning the pomace oil mills there are two main stages of pomace oil production:
Drying process: During the drying process, the olive pomace is propelled into large
cylindrical dryers, heated and rotated. With this procedure, the large amount of water is
reduced and the oil is easier to be removed.
Distillation process: The pure hexane (C6H14) is used for the distillation process of the olive
pomace, which literally "rinses" the oil from it. The oil-hexane mixture is then propelled
into special distillation tanks where the two components are completely separated. After
this stage, the pomace oil is ready for storage.
The whole process of oil production is depicted in Figure 1. The olive oil production processes are
presented in blue boxes, the main by-products of the whole olive oil chain are in red boxes and the
final edible products in the green boxes.

D6.2.2 Country report Greece 14
Document:
D6.2.2 Basic analysis of targeted agricultural sectors – Country report Greece
Author:
Refere
R
Re
Re
CERTH Version: Final
Reference: AGROinLOG D6.2 Date: 29/05/18
Figure 1. Schematic process of olive oil production in Greece. Source: (AOCS Lipid Library, 2017)
2.1.2 Volume of the sector
Greece is the third olive oil producer in the world, after Spain and Italy with a typical annual
production ranging from around 300 to over 400 kt (in a very productive year) of olive oil depending
on the olive oil year. Table 1 presents the olive oil production and cultivated areas of olive groves
from 2012 to 2014 (ELSTAT, 2014).
Table 1. Olive Oil Production and cultivated areas of olive groves from 2012-2014. Source: (ELSTAT, 2014)
Olive Oil Production and Cultivated Area (2012-2014)
2012 2013 2014
Olive Oil Production (kt) 331.9 291.4 251.4
Cultivated Area (103 x ha) 807 797 823
Table 2 shows the production of olive oil for year 2014 across the geographical regions of Greece.
The majority of olive oil is produced in Peloponnese, Crete and Western Greece (ELSTAT, 2014).

D6.2.2 Country report Greece 15
Document:
D6.2.2 Basic analysis of targeted agricultural sectors – Country report Greece
Author:
Refere
R
Re
Re
CERTH Version: Final
Reference: AGROinLOG D6.2 Date: 29/05/18
Table 2. Olive Oil Production based on geographical areas in Greece 2014. Source: (ELSTAT, 2014)
Olive Oil Production based on Geographic Regions for 2014
Olive Oil Production (kt) Percentage (%)
Peloponnese 78.3 31.2
Crete 60.7 24.1
Central Greece 28.9 11.5
Northern Greece 11.4 4.5
Western Greece 62.4 24.8
Aegean Islands 9.7 3.9
Total 251.4 100
The value of domestic olive oil production is estimated at around € 800 million contributing to 0.4
% of Greece’s GDP per year (average during 2010-2015), compared to 0.3 % of GDP for the Spanish
industry and 0.1 % for the Italian (National Bank of Greece, 2015). Furthermore, in the latest years,
the olive oil sector contributes more than 0.4 % on the domestic GDP (personal communication,
ELSAP, 2017). Olive oil is one of the most significant economic sectors in Greece. However,
according to the sector analysis of the National bank of Greece, olive oil production is expected to
decline to 280 kt in 2020 (National Bank of Greece, 2015).
Considering the organization of the sector, Greece has a high proportion of small (and largely
cooperative) mills that amount to 2,500 (National Bank of Greece, 2015). Stakeholders in the olive-
milling sector however indicate that the total number of olive mills in Greece may be even higher,
up to 4,000.
Table 3 provides the difference in the number of olive and pomace mills in the three main olive oil
producing countries in the EU: Spain, Italy and Greece (MoRE project, 2008). Greece has around 35
pomace mill facilities (according to the members’ directory of SPEL). Furthermore, according to
stakeholder’s feedback (personal communication, NUTRIA, 2017), in Greece there are 7 large scale
refineries and another 3-4 small scale companies that refine olive and pomace oil.
Table 3. Number of olive mills and pomace mills in the three main olive oil producing EU countries. Source (MoRE project,
2008)
Olive and pomace mills
Country Olive mills Pomace mills
Spain 1,722 50
Italy 4,743 40
Greece 2,500 35
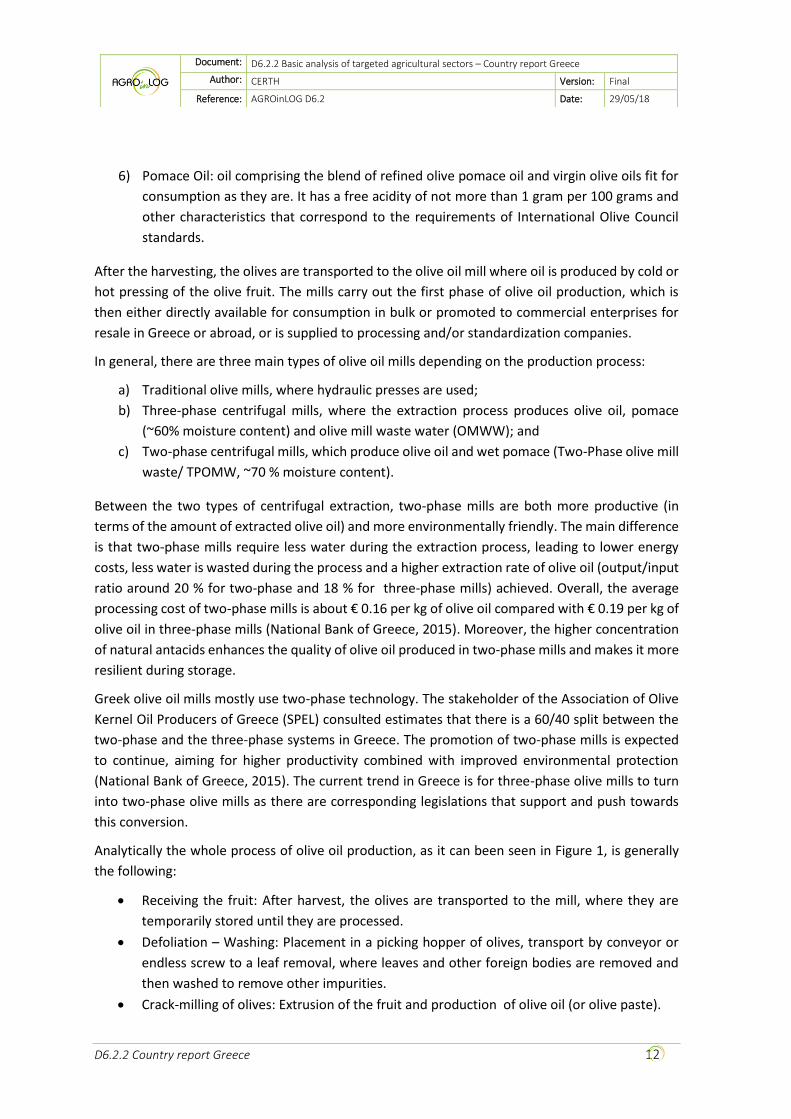
Figure 2 presents the geographical distribution of olive mills around Greece. The majority of olive
mills (36.5 %) are located in Peloponnese, whereas Crete follows with 23.3 % of the total national
olive mills.
D6.2.2 Country report Greece 16
Document:
D6.2.2 Basic analysis of targeted agricultural sectors – Country report Greece
Author:
Refere
R
Re
Re
CERTH Version: Final
Reference: AGROinLOG D6.2 Date: 29/05/18
Figure 2. Geographical distribution of olive mills in Greece. Source: (Prodosol, 2009)
2.1.3 State of the sector
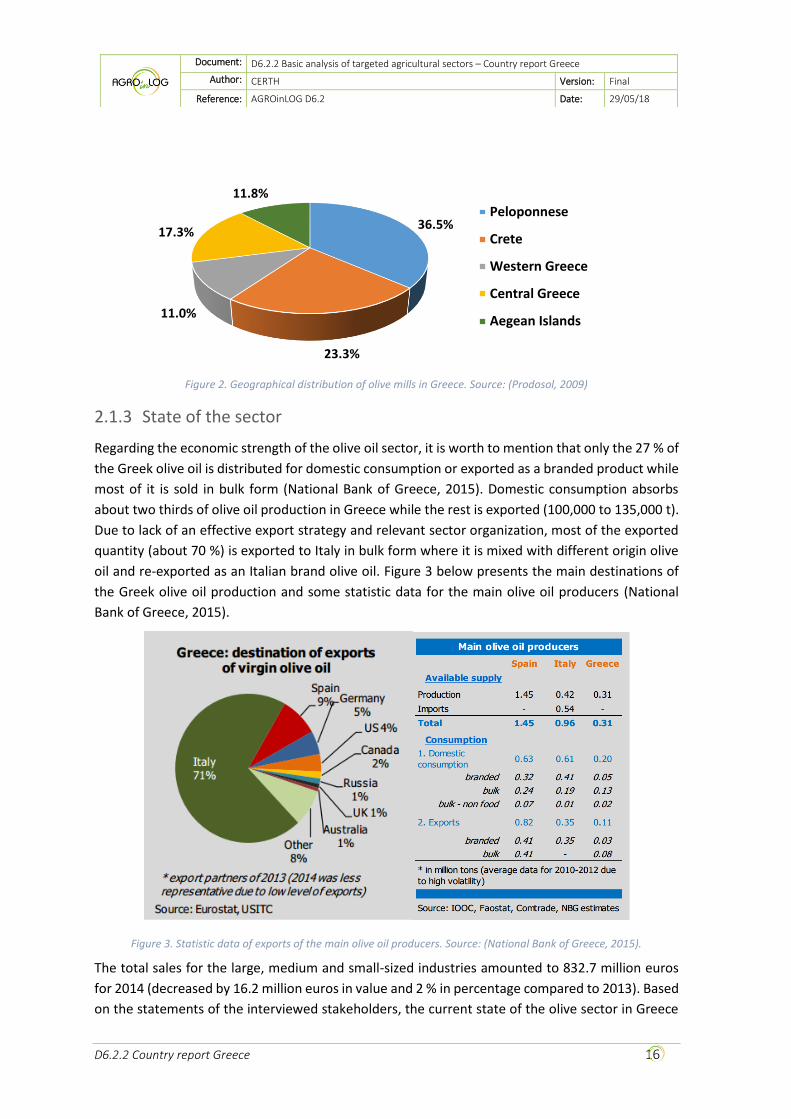
Regarding the economic strength of the olive oil sector, it is worth to mention that only the 27 % of
the Greek olive oil is distributed for domestic consumption or exported as a branded product while
most of it is sold in bulk form (National Bank of Greece, 2015). Domestic consumption absorbs
about two thirds of olive oil production in Greece while the rest is exported (100,000 to 135,000 t).
Due to lack of an effective export strategy and relevant sector organization, most of the exported
quantity (about 70 %) is exported to Italy in bulk form where it is mixed with different origin olive
oil and re-exported as an Italian brand olive oil. Figure 3 below presents the main destinations of
the Greek olive oil production and some statistic data for the main olive oil producers (National
Bank of Greece, 2015).
Figure 3. Statistic data of exports of the main olive oil producers. Source: (National Bank of Greece, 2015).
The total sales for the large, medium and small-sized industries amounted to 832.7 million euros
for 2014 (decreased by 16.2 million euros in value and 2 % in percentage compared to 2013). Based
on the statements of the interviewed stakeholders, the current state of the olive sector in Greece
36.5%
23.3%
11.0%
17.3%
11.8%
Peloponnese
Crete
Western Greece
Central Greece
Aegean Islands

D6.2.2 Country report Greece 17
Document:
D6.2.2 Basic analysis of targeted agricultural sectors – Country report Greece
Author:
Refere
R
Re
Re
CERTH Version: Final
Reference: AGROinLOG D6.2 Date: 29/05/18
is in good weather after the very low productivities and profits of years 2011-2014. Table 4
summarizes the financial figures for the olive oil sector industries for 2011-2014.
Table 4. Consolidated financial figures of olive oil and pomace industries. Source: (inr.gr, 2014)
Consolidated financial figures of olive oil and pomace industries for 2011-2014
2011 (k€) 2012 (k€) 2013 (k€) 2014 (k€)
Total assets 684,773 948,911 917,652 942,892
Sales 631,721 837,686 848,844 832,679
Gross profit 95,929 125,327 140,338 133,394
EBITDA 51,305 64,512 74,536 66,920
Net profit 5,206 6,011 13,437 10,527
Table 5 presents the economic sizes of the top ten industries of the olive sector in Greece based on
the sales (inr.gr, 2014). The main business line of most of these industries is the standardization of
olive oil (and pomace oil) and the marketing of olive oil products; ELSA S.A. is the only company on
the list whose primary activity is the operation of pomace mills.
Table 5. Economic size of the ten biggest Olive Oil Industries in Greece, mainly standardization industries. Source: (inr.gr,
2014)
Economic Size Of The Biggest Olive Oil Industries In Greece, 2014
Company Name Location Total Assets (k€) Sales (k€) EBITDA (k€)
INTERCOMM FOODS S.A.
AGRICULTURAL PRODUCTS Larisa 70,154 77,556 10,951
MINERVA S.A. OIL OPERATIONS Athens 70,265 75,798 2,757
KORE S.A. OLIVE PRODUCTS –
FOODSTUFFS Athens 45,370 65,549 2,813
DEAS S.A. OLIVE - AGRICULTURAL
PRODUCTS Chalkidiki 39,213 37,904 6,496
NUTRIA S.A. STANDARDIZATION OF
AGRICULTURAL PRODUCTS Fthiotida 33,458 36,948 1,537
KONSTANTOPOULOS OLYMP S.A.
OLIVE PROCESSING Katerini 32,229 34,793 5,928
AGROVIM Messinia 14,796 28,874 1,057
AGROTIKI S.A. OIL OPERATIONS Attiki 22,160 17,108 -791
ELANTHI S.A. FOODSTUFFS Attiki 23,738 7,837 1,977
ELSAP S.A. OIL OPERATIONS Argolida 19,334 3,026 -844
Furthermore, Table 6 presents ten pomace mills in Greece with the highest sales for year 2011.

D6.2.2 Country report Greece 18
Document:
D6.2.2 Basic analysis of targeted agricultural sectors – Country report Greece
Author:
Refere
R
Re
Re
CERTH Version: Final
Reference: AGROinLOG D6.2 Date: 29/05/18
Table 6. Economic size of the ten biggest Pomace Mills in Greece based on sales. Source: (inr.gr, 2014)
Economic Size Of The Biggest Pomace mills in Greece, 2014
Company Name Location Total Assets (k€)
Sales (k€)
EBITDA
(k€)
AGROTIKI SINETAIRISTIKI RETHIMNOU
S.A. (A.S.E.A.R.)1 Rethimno 18,074 9,838 583
PIRINAS S.A. Messinia 3,421 3,741 444
ELSAP S.A. Argolida 19,334 3,026 -844
CHATZELIS K. S.A. Lakonia 3,420 2,846 220
ILEIA OIL MILLS Ilia 5,198 2,182 94
MESSINIAKI Messinia 4,547 2,024 -27
EAIOURGIKI VOIOTIAS
PYRINELAIOURGEIO S.A. Voiotia 3,630 1,598 131
ELEOURGIKI KENTRIKIS ELLADAS S.A.
(EL.K.E.) Lamia 6,438 1,587 97
KOUFAKI AFOI ELAIOURGIAI
ARGONAUPLIAS Argolida 2,826 1,564 208
ELAIOURGIAI MAGNISIAS MICHAIL
KOUFAKIS Magnisia 2,474 1,384 -601
1A.S.E.A.R. produces and trades feed and fodder, apart from pomace oil
2.1.4 Typical size of the companies
The typical size of the Greek companies in this sector differs from the Spanish or the Italian ones.
In Greece, olive mills are mostly owned by cooperatives controlled by farm owners (50 % of oil olive
production). Greek olive mills are relatively small and thus they lack economies of scale and access
to international distribution networks. Greek olive mills have an average annual capacity of 200-
230 t of olive oil compared with 120 t in Italy and 750 t in Spain. Regarding the size of the pomace
mill, a typical pomace mill in Greece has a capacity of treating around 450-500 t pomace /day
(personal communication, ELSAP, 2017).
There is no exact data about the amount of workers that are employed in the olive sector in Greece.
The stakeholder interviewed stated that a typical olive mill has 5-6 employees, all of them seasonal
employees (personal communication, Agios Konstantinos Cooperative, 2017). Assuming that in
Greece, there are 2,500 olive mills and considering a typical size of them, the total amount of
seasonal employees working in olive mills is around 15,000. Furthermore, the stakeholder from the
pomace oil sector estimated that in each pomace mill there are 5-6 permanent workers and around
25 seasonal workers during the olive oil production period (personal communication, SPEL, 2017).
Thus, it is estimated that in the 35 pomace mills in Greece, there are employed 210 permanent
workers and 875 seasonal workers. Moreover, Figure 4 presents the labour force productivity in
the Greek olive sector, regarding the farming and harvesting of olives. Based on this figure, the
labour productivity in Greece is estimated at 19 t of olives per employee according to the statistical

D6.2.2 Country report Greece 19
Document:
D6.2.2 Basic analysis of targeted agricultural sectors – Country report Greece
Author:
Refere
R
Re
Re
CERTH Version: Final
Reference: AGROinLOG D6.2 Date: 29/05/18
data from the National Bank of Greece (National Bank of Greece, 2015). Taking into consideration
that a typical annual production of olives in Greece is 2,646,000 t, it is estimated that the seasonal
employees working in the farming/ harvesting of olives amount to 140,000 workers.
Figure 4. Labour Force Productivity. Source: (National Bank of Greece, 2015)
2.1.5 Distinctive facilities of the sector
The facilities that are used for the olive oil and the pomace oil production are in full operation
during the months from September to March with the exception of a few areas (e.g. Corfu) where
the olive season is larger due to local peculiarities. In some cases, during summer months, pomace
mills operate with edible olives, that have been expired, and extract pomace oil from them
(personal communication, Loukision Cooperative, 2017). In overall, there is a lot of idle time for
implementing an IBLC concept in the olive oil sector. Facilities such as storage areas, dryers,
centrifuges or purification systems can also be used for different purposes. For example, the
storage areas can be used in order to store prunings or mulched material from olive or vine prunings
that are produced from the olive trees or vineyards of the nearby areas.
Moreover, the centrifuges and the purification systems can be used from the vegetable oil
extraction sector in order to extract their main products. Furthermore, dryers used in pomace mills,
can find various applications during their idle times like drying other materials such as olive
prunings, cereals etc.
From the interview with the representative of Association of Olive Kernel Oil Producers of Greece
(SPEL), he stated that the facilities of pomace mills could be exploited during idle times and treat
other raw materials such as alfalfa, clover etc. However, investments on the modifications of
current equipment and/or purchase of new equipment would be essential for such
implementation. For example, she stated that a pomace mill in Messologi, Western Greece, during
its idle months, it treats alfalfa. This feedstock has a similar moisture content with two-phase

D6.2.2 Country report Greece 20
Document:
D6.2.2 Basic analysis of targeted agricultural sectors – Country report Greece
Author:
Refere
R
Re
Re
CERTH Version: Final
Reference: AGROinLOG D6.2 Date: 29/05/18
pomace, around 80 %. Thus, when the pomace mill does not operate with pomace, it dries alfalfa
and packages it.
2.1.6 Degree of innovation
As mentioned before, about 40 % of the olive oil mills in Greece use the three-phase centrifugation
method for the extraction of olive oil. However, more and more olive oil mills have the tendency to
change their process from the three-phase to the more sustainable two-phase centrifugation.
Two-phase centrifugation is the best solution in the olive oil process treatment, because it is more
eco-friendly than the three-phase system (by saving water, reducing the volume of liquid waste,
etc.) and for that reason it is proposed for the new olive oil industries. Moreover, the two-phase
centrifugation advantages over the three-phase are the following:
It produces much smaller quantity of olive oil wastes than the three-phase system.
The quality of the virgin olive oil that is produced by the two-phase is better than that of
the three-phase system, mainly regarding the content in polyphenols and antioxidants.
The two-phase systems do not require additional quantities of water to produce the olive
oil paste by reducing the operating cost of the installation.
The energy demand of the two-phase systems is smaller, due to the lower amount of olive
paste that is going to be processed.
In the two-phase systems, no extra centrifuge is required for the treatment of the extra
produced fluids because they are recycled.
Concerning all the above properties of the two-phase centrifugation method, the latest prevailing
tendency in Greece is the alteration of the remaining three-phase centrifugation systems to two-
phase systems in the olive oil mills. This trend does not occur only because of the advantages of
two-phase over three-phase technology but also because of the national legislation that forces olive
mills to this change.
The interviewed stakeholder mentioned that there are some olive companies that invest in R&D
activities, however it is a minority. Furthermore, he stated that because the olive sector industries
(mainly pomace mills) are out of the development law and national grants, the R&D activities are
very limited.
2.2 Opportunities IBLC
2.2.1 Sector related residues
The three-phase olive mills during the extraction process of the oil produce, apart from the olive
oil, two residue streams, an aqueous solution with a solid content of no more than 6 % called olive
oil waste water and the olive pomace which is a solid stream residue. The latter is sent to pomace
mills for further processing whereas the olive wastewater is disposed. In case of the two-phase olive
mills, there are two output streams, one stream of olive oil and another with the two-phase olive

D6.2.2 Country report Greece 21
Document:
D6.2.2 Basic analysis of targeted agricultural sectors – Country report Greece
Author:
Refere
R
Re
Re
CERTH Version: Final
Reference: AGROinLOG D6.2 Date: 29/05/18
mill waste (TPOMW), a solid stream residue with high moisture (~70-80 %) that is sent to pomace
mills for further processing. Pomace mills have as input the residues produced from the olive mills.
Pomace mills, after extracting the pomace oil from the pomaces, they produce one or more solid
biofuels originated from the stone, flesh and skin of the olive fruit. Depending on the process
adopted, these can be olive stones (mostly the pit part of the olive fruit), exhausted olive cake
(mostly the flesh part of the olive fruit) or “combined” fractions.
Table 7 presents some estimated values of the wastes produced in the olive mills and pomace mills.
It should be noted that for the estimation of the annual produced products and residues it was
assumed that the annual olives production for olive oil in Greece is 1,571 kt (value for year 2014,
Eurostat, 2014) and also that the 60 % of the olive mills in Greece use the two-phase technology.
From the above percentages, we can assume that the input for the mills that use the two-phase
technology is 942.6 kt olives and 628.4 kt olives for the ones that use the three-phase technology.
In Table 7 a clearer picture of the mass balance of the products/ residues along the olive and
pomace mills is depicted.
Table 7. Mass balance of olive and pomace mill products estimated based on year 2014 olives production
Estimated Olive and Pomace Mills Products and Residues for 2014
Oliv
e M
ill
Procedure Two-Phase (60%) Three-Phase
(40%)
Olive Fruits Input (kt) 942.6 628.4
Olive Oil Production (kt) a 188.5 125.7
Olive Mill Residues
Olive Mill Waste Water
(ML)b - 345.6 - 439.8
Olive Pomace (kt), sent to
pomace mills c 754.0 d 314.2 e
Po
mac
e M
ill
Pomace Mill Products
Pomace Oil (kt) 10 3.6
Exhausted Olive Cake (kt) 273.8 f 173.8 f
Exhausted Olive Cake (kt -
available to the market after
covering own consumptions
of pomace mills)
70.0 65.0
a 20% of live fruit is converted into olive oil; b Retrieved from
https://www.agroenergy.gr; c 80% of olive fruit is converted into pomace in two-
phase mills, 50% in three-phase mills; d 68% wt moisture and 5% wt d.b. oil content; e 52% wt moisture and 3% wt d.b. oil content; f 15% wt moisture and 1% wt d.b. oil
content. Source of all values: Communication with Greek stakeholder, SPEL

D6.2.2 Country report Greece 22
Document:
D6.2.2 Basic analysis of targeted agricultural sectors – Country report Greece
Author:
Refere
R
Re
Re
CERTH Version: Final
Reference: AGROinLOG D6.2 Date: 29/05/18
Apart from the above-mentioned residues, the olive sector produces prunings. Currently, in Greece,
there are two ways that olive prunings are treated. The most frequent use is that of burning them
in open fires and thus, having negative impact on the environment and increasing the risk of fires.
The other way, less used, is to mulch the prunings onto the soil of the olive groves. Currently, there
are no recent national surveys based on field data regarding the availability of APPR biomass in
Greece. The standard reference study for prunings from olive groves derives from a study of
Apostolakis et al. from as back as 1987. This study presents residue-to-product ratios (RPR) for the
prunings produced from various types of permanent crops in Greece. The statistical data of crop
productivity on which the pruning results are based dates from 1980. Another, way to estimate the
pruning potential is via the biomass supply tool developed in the FP7 S2Biom project. This tool
forecasts the pruning potential from permanent crops for 2020 and for all the EU-28 countries. The
evaluation is based on applying country specific residue-to-surface ratios (RSRs) for certain tree
crop types (olive, vineyards, citrus and fruit trees) to projections of the surface area used for the
cultivation of these crops, as taken from the CAPRI model. Moreover, a third method for estimating
the olive pruning potential at national level was performed via Biomasud Plus H2020 project and
CERTH calculations. In this method, the pruning potential estimation is based on RPR from various
references. The calculations for this method is based on the productivities of the crops in year 2014.
The moisture considered in all methods is 35 % wt for olive prunings. The olive pruning potential is
presented in Table 8 based on these methods.
Table 8. Potentials (kt of dry matter per year) for olive prunings in Greece according to several data sources
Potentials for olive prunings (kt of dry matter per year)
Source Reference Year Methodology Olive Prunings
Apostolakis et al. 1980 RPR + national production statistics 1,135
Biomasud Plus 2014 - // - 1,718
S2Biom 2020 RSR + CAPRI surface projections 1,165
From the three methods, the national pruning potential is estimated in a range of 1.13-1.72 dry Mt.
Finally, in the framework of uP_running project (Grant Agreement No 691748) on-field
measurements of olive pruning production were performed in several olive groves around Greece.
Based on these on-field measurements, Apostolakis et al. and Biomasud’s RSR values are more in
line with the RSR values found from the on-field measurements for olive trees.
In addition, another residue deriving from the olive sector is that of olive stones. Olive stones
amount to 8.3 % of the weight of the olive fruit (dry basis) (Rodero et al., 2017). However, actual
production volumes depend on the production systems employed. Only a limited number of
companies in Greece perform the separation of olive stones from the olive cake. The stones
typically end up in the exhausted olive cake produced by the pomace mills. Based on some initial
discussions with such producers, CERTH estimates that the volume of production of separated olive
stones in Greece is around 5,000 – 7,000 t.
Finally, another residue related to the olive oil sector is that of the olive leaves that remain
unexploited. The olive leaves can be retrieved either during the harvesting of olives or during the

D6.2.2 Country report Greece 23
Document:
D6.2.2 Basic analysis of targeted agricultural sectors – Country report Greece
Author:
Refere
R
Re
Re
CERTH Version: Final
Reference: AGROinLOG D6.2 Date: 29/05/18
preparation of olives prior to the olive oil extraction. Olive leaves are rich in phenolic compounds
that can be exploited in pharmaceutical or cosmetics industry.
2.2.2 Potential synergies & benefits
The residues from three-phase olive mills are wet pomace and OMWW (olive mill wastewater). Wet
pomace is sent to pomace mills for further exploitation whereas the OMWW have to be disposed.
OMWW possesses a double nature. It is a strong pollutant and at the same time a possible source
of valuable components, such as polyphenols, flavonoids, anthocyanins, inorganic trace elements,
etc., that could be isolated. Several treatment options have been considered including physical,
physicochemical, biological, thermal technologies and combinations thereof, as well as other
combined approaches that could improve decontamination efficiency.
Physical treatment, which involves the separation of different phases through mechanical
means. When used, so far, the physical treatment of OMWW is unable to reduce alone the
organic load and toxicity of the wastes to acceptable limits.
Physicochemical treatment, which involves the use of additional chemicals for their
neutralization, flocculation, precipitation, adsorption, chemical oxidation and ion
exchange.
Biological treatment, which involves the use of microorganisms in order to break down
biodegradable chemical species, which are present in OMWW, is considered
environmentally friendly and effectively in cost. The actual type of microorganisms
depends on the treatment option, i.e. anaerobic or aerobic.
Thermal treatment involves the concentration of OMWW by reducing their water content
and total volume (Prodosol, 2017).
Olive mill wastes contain an important amount of phenolic compounds, such as the exhausted olive
cake from the two or three-phase pomace. In this sense, wet pomace after being treated in the
pomace mills to produce pomace oil, can be used to extract the phenolic compounds (mainly
hydroxytyresol). These phenols can find several applications in cosmetics, pharmaceuticals or as
anti-oxidants. However, to perform such processes, additional investments are needed for the
pomace mills.
Moreover, the olive prunings as residues of the olive sector can be exploited. They can be used as
raw material for the production of pellets or as fuel for covering the energy demands of the mills.
However, new investments are needed for the harvesting equipment of the pruning. Continuously,
dryers that exist in the pomace mills can be used in order to dry the prunings before exploited,
offering a synergy in the iddle times of the pomace mills.
Finally, Fernández (Fernandez-Bolanos, 2006) proposed a technological scheme (as seen in Figure
5) in order to exploit all the valuable compounds found in the olive wastes of two-phase mills.
According to his strategy-technology, valuable phenols, chemical, bioethanol, biofuel etc. can be
retrieved from the olive mill wastes. Thus, this is an example of the integrated valorisation of agro

D6.2.2 Country report Greece 24
Document:
D6.2.2 Basic analysis of targeted agricultural sectors – Country report Greece
Author:
Refere
R
Re
Re
CERTH Version: Final
Reference: AGROinLOG D6.2 Date: 29/05/18
residues in an existing agro-industry by expanding traditional processes with additional biorefinery
steps.
Figure 5. Strategy for an integral recovery and revalorization of olive mill waste- alperujo (TPOMW). Source: (Fernandez-Bolanos, 2006)
2.2.3 Market developments
Usually the exhausted olive cake and olive stones, produced from the pomace mills as by-products,
are sold as a fuel in the solid fuel market. Olive stones are much better fuel than exhausted olive
cake due to lower moisture and ash content. However, in practice, the separation of olive stones
by the Greek mills is rare. In most cases, all solid by-products end up in a single fraction, which is
marketed as “pirinoksilo”, as it is known in Greek. The exhausted olive cake is mainly used as fuel
for covering the own consumptions of the pomace mill. In addition, exhausted olive cake is used as
fuel for space heating in the residential sector. It contributed to 2.34 % (ELSTAT, 2013) of the
biomass consumption for residential heating. In 2017, the market price for the exhausted olive cake
was in the range of 70 €/t (VAT included). However, the exhausted olive cake is exclusively
consumed in rural areas as in urban areas its odour causes complaints. A specific requirement that
legislation imposes on exhausted olive cake and relative fractions used for non-industrial
applications in Greece is that their oil content should not exceed 2 % wt on a dry basis (Ministerial
Decree 198/2013).

D6.2.2 Country report Greece 25
Document:
D6.2.2 Basic analysis of targeted agricultural sectors – Country report Greece
Author:
Refere
R
Re
Re
CERTH Version: Final
Reference: AGROinLOG D6.2 Date: 29/05/18
On the other hand, the OMWW can be used on soils and crops as a fertiliser, due to the organic
matter and nutrients contained that could improve arid soils. However, the properties of soil (e.g.
texture, nutrient, organic matter content and productivity) can be damaged due to the continuous
application. OMWW can also be used as feedstock for biogas production. Almost 80 % of organic
compounds in OMWW are suitable for anaerobic digestion. Theoretically, a yield of 37 m3 of
methane per m3 of OMWW could be achieved (Tsagaraki, 2005). Potential feedstock for biogas
production is also the TPOMW. In the frameworks of AGROinLOG project, the biogas production
from the exhausted olive cake from TPOMW, via anaerobic digestion will be investigated.
In addition, both TPOMW and OMWW have the ability to be transformed into products for its use
in the pharmaceutics industry as well as in the food industry, by recovery of antioxidants. The olive
fruit is rich in simple and complex water-soluble compounds with potential antioxidant properties.
The most important of them are polyphenols, flavonoids, anthocyanins, tannins, oleanolic acid and
maslinic acid. Polyphenols in olive wastes have shown to be antioxidant, antibiotic, antimicrobial,
and antifungal activity. Formulas of these olive-derived substances can be used as nutrition
supplements or skin cosmetics. Due to their antimicrobial properties, they are also used as
antimicrobial agents in detergents and rinsing and cleaning agents. Hydroxytyrosol is the most
active component of them and it can be used as a food preservative and in pharmacology and
cosmetology in topical preparations with anti-aging and anti-inflammatory action. Oleanolic acid
regulates cholesterol levels in blood and balances body weight. Maslinic acid has been widely
investigated during the last years and it seems to possess anti-inflammatory and antihistaminic
activity. It also could be used in pharmacology as an inhibitor of AIDS virus (Tsagaraki, 2005).
Another interesting market for the olive residues is the animal feed industries. The exhausted olive
cakes can be used in animal feeding, as they are rich in oil, carbohydrates, and proteins.
Finally, olive prunings can be used for producing pellets or chips that can be sold as solid biofuels
or used directly for power and/or heat production in plants. An example is Fiusis power plant,
located in Puglia, Italy. Fiusis is a small-scale power plant (1 MWe) producing electricity exclusively
from olive tree prunings. It is considered the first plant of its kind to use exclusively olive prunings
as a fuel source (Up_running project). In addition, other products can be produced from olive
prunings such as particle boards used in the construction sector. Another residue that could be
exploited from the olive sector is that of leaves. Leaves also contain a high amount of phenolic
compounds. However, the extraction of phenols and the exploitation of leaves for added value
products has to be further investigated.
2.2.4 Non-technical barriers
According to the information received from the interview with the stakeholder (personal
communication, SPEL, 2017) one non-technical issue that has emerged these years is the reluctant
behaviour of the Greek citizens regarding the potential exploitation of the current facilities (olive
and pomace mills) for other activities during their idle periods. In many regions, most of the citizens
are against to the current operation of the pomace mills because of the odour and smoke (due to
the high moisture of the feedstock) that comes out of the pomace mills. Thus, the stakeholder

D6.2.2 Country report Greece 26
Document:
D6.2.2 Basic analysis of targeted agricultural sectors – Country report Greece
Author:
Refere
R
Re
Re
CERTH Version: Final
Reference: AGROinLOG D6.2 Date: 29/05/18
consulted is pessimistic about how residents will accept continuous operations of such facilities by
implementing the IBLC concept. Furthermore, the stakeholder stated that the fact that pomace
mills are constantly absent from national funding and support schemes makes it difficult for
themselves to invest on such implementations. Continuously, some additional barriers were
identified regarding the exploitation of residues of the olive chain. The synergy of launching the
exhausted olive cake, as a residue from the pomace mill, in the residential solid fuel market for
consumption in urban areas would find several barriers such as its high ash content and intense
odour. Finally, another barrier/ problem of the sector is that due to the production of olives which
is climate-dependent, technologies for exploiting by-products and residues of the oil sector have
not yet been developed.

D6.2.2 Country report Greece 27
Document:
D6.2.2 Basic analysis of targeted agricultural sectors – Country report Greece
Author:
Refere
R
Re
Re
CERTH Version: Final
Reference: AGROinLOG D6.2 Date: 29/05/18
3 SUGAR INDUSTRY
3.1 Profile of the sugar industry sector
3.1.1 Production
The main product in this sector is sugar, which is contained in the beet. A sugar factory's task
consists in extracting sugar out of the beet with a chemical transformation.
Mainly the beet contains (Figure 6):
14-17 % sugar
76-78 % water
4-5 % insoluble dry ingredients (marc)
2-3 % soluble dry ingredients (nitrogenous and non-nitrogenous organic and inorganic
components).
Figure 6. Main ingredients of a sugar beet. Source: (Hellenic Sugar Industry)
The insoluble dry ingredients called marc (consisting of cellulose, lignin, pectine, pentozane),
consist the main component of the by-product called pulp (fresh or dry, or in compressed form as
pellets). The soluble dry ingredients, after removing approx. 1/3 of the juice in the purification
stage, are found again in the molasses, where they bind also a part of sugar.
The sugar production is a fairly complicated process. The industrial production in Greece follows
the stages below:
1. Acceptance, washing and beets cutting: Beets are carried over from a collection point that
ranges up to 70 km around the sugar factory.
2. Diffusion: Diffusion is the process where the sugar contained in the bits is received. This
process is based on the principle of osmosis. The sugared juice is collected at one edge,
while the diffused bits, called pulp, are recovered at the other edge and are used after a
compression and possible drying as cattle feed.

D6.2.2 Country report Greece 28
Document:
D6.2.2 Basic analysis of targeted agricultural sectors – Country report Greece
Author:
Refere
R
Re
Re
CERTH Version: Final
Reference: AGROinLOG D6.2 Date: 29/05/18
3. Pre-liming, liming: The sugared juice derived from diffusion contains 12-13 % sugar and -
85 % foreign materials called non-sugars. A portion of these foreign materials is removed.
4. Saturation (carbonation): Carbon dioxide is introduced into the limed juice where the
sugar-lime breaks down and a sediment of calcium carbonate is formed.
5. Filtration: The sediment of calcium carbonate lays down on the filters. The sweet juice is
clear and contains ~1.6 % non-sugars, ~12 % sugar and ~86 % water (thin) juice.
6. Evaporation: In order to remove the water, wherein sugar is dissolved, the thin juice gets
through a stage of successive evaporation.
7. Crystallization: The juice is condensed to an increasing extent in apparatuses operating
under vacuum. It thereby reaches a stage of super-saturation (Hellenic Sugar Industry,
2009).
The whole production process is shown in Figure 7.
Figure 7. Main stages of the sugar production process. Source: (Hellenic Sugar Industry, 2009)
3.1.2 Volume of the sector
The Hellenic Sugar Industry SA (HSI) is the sole sugar producer in Greece. The main activity of the
company is the production and trade of sugar, as well as the trade of its by-products. The company
produces white crystal sugar whereas in the course of production, a set of by-products is also being
produced which, following a proper processing, are made available in the market. In concrete
terms, the products produced and traded by the company are as follows:
White crystal sugar
Molasses
Sugar-beet pulp pellets
Fresh pulp
Beet seed
For many years, the HSI has been producing at its 5 factories all the amount of sugar needed to
cover all domestic needs (320,000 t/year). For this production, the company supported the
cultivation of hundreds of thousands acres (about 450,000) with contracts with over 6,000

D6.2.2 Country report Greece 29
Document:
D6.2.2 Basic analysis of targeted agricultural sectors – Country report Greece
Author:
Refere
R
Re
Re
CERTH Version: Final
Reference: AGROinLOG D6.2 Date: 29/05/18
producers for the production of sugar beet. However, in February 2006, EU agriculture ministers
approved a radical reform of the sugar sector in the EU and all EU countries have been forced to
reduce their production of sugar by at least 50 %. For Greece, the new ceiling amounts to 158,702
t/year. As part of the implementation of the regulation, farmers were compensated not to grow
beets, and the industries were compensated by stopping their operation and dismantling
productive sugar refineries. All of this finally has led to an intense fluctuation of the sugar
production due to the unstable number of beet growers as it can be seen in Table 9 for the last
years.
Table 9. Beet growers, cultivated area and sugar production from 2010-2014. Source: (private communication, HIS, 2017)
Beet growers, cultivated area and sugar production in Greece for years 2010-2014
Year of production Beet growers Cultivated area (ha) Sugar Production (kt)
2010 4,144 13,367 77,2
2011 2,133 5,791 38,3
2012 3,100 9,309 54,7
2013 1,875 5,799 40,2
2014 2,360 7,400 53,4
3.1.3 State of the sector
As mentioned above, HSI is the only sugar producer in Greece and since 2010 it has regained a large
part of the internal market which had been lost, because of the economic problems during the past
few years. HSI also owns two factories in Serbia where around 60,000 t of sugar is produced (in
2008). In this framework, the company exports important quantities to Bulgaria with sugar from
the neighbouring factory of Orestias. The by-products of sugar, like molasses and sugar beet pellets,
cover the needs of industries and cattle-breeders in the internal market while the additional
quantity is exported to the countries of the European Union or even to Third Countries (Hellenic
Sugar Industry). In the following Table 10 HSI sugar sales from year 2004/2005 until 2008/2009 are
shown.
Table 10. Sugar sales from 2004 to 2009 Source: (Hellenic Sugar Industry, 2009)
Sugar Sales from 2004 to 2009
2004/2005
(t)
2005/2006
(t)
2006/2007
(t)
2007/2008
(t)
2008/2009
(t)
Yearly production 259,500 310,178 184,806 78,388 157,375
Production sugar sales 155,549 346,307 247,840 88,215 169,783
Importation sugar sales 75,051 58,579 65,712 82,052 56,729
Total sales
H.S.I. 230,600 404,886 313,552 170,267 226,512

D6.2.2 Country report Greece 30
Document:
D6.2.2 Basic analysis of targeted agricultural sectors – Country report Greece
Author:
Refere
R
Re
Re
CERTH Version: Final
Reference: AGROinLOG D6.2 Date: 29/05/18
Despite the fact that white crystal sugar is the staple of the company, in order to cover any
additional demand, sugar is also imported from the EU countries. Moreover, the company is
engaged in producing beet seed out of sugar beets which, after a proper processing, is being sold
to the beet-growers while some quantity is being exported to seed producing companies abroad.
In Table 11 the economic analysis of the years 2006-2009 regarding the production and trading of
the company is shown. For the period 2006-2009, 89.77 % of the total sales of HSI came from selling
products of own production, whereas only the 10.23 % of these total sales came from trading
goods. The total sales of sugar amounted to 88.19 % of the total sales (Hellenic Sugar Industry,
2009).
Table 11. Economic analysis of the last year's production in the Hellenic Sugar Industry. Source: (Hellenic Sugar Industry,
2009).
Economic analysis of Hellenic Sugar Industry, 2006-2009
Products: 2006/07 (M€) 2007/08 (M€) 2008/09 (M€) Three-year Total
(M€)
Sugar 150.9 66.9 84.6 302.4
Molasses 6.9 5.4 5.1 17.5
Dry pulp 8.7 6.0 4.4 19.2
Fresh pulp 1.1 0.8 0.8 2.7
Beets Seeds 0.9 0.9 1.4 3.2
Services
(sprayings) 3.2 1.3 1.9 4.0
Other services 0.4 0.5 0.7 1.6
Sales of other
materials 2.6 2.6 4.0 9.2
Imported goods: 2006/07 (M€) 2007/08 (M€) 2008/09 (M€) Three-year Total
(M€)
Sugar 29.9 44.9 42.8 117.6
Molasses 0.3 0.9 0.8 2.1
Seeds 0 1.1 1.0 2.1
Total 205.2 131.5 147.7 484.4
As it can be concluded from the economic data of the three years (2006-2009), HSI has a downturn.
Despite its tries to remain the main sugar producer in Greece, the Hellenic Sugar Industry is
becoming year by year even more unable to respond to the national needs. Reason for this is the
fact that farmers prefer other intensive crops (cotton, corn, sunflower, etc.), which (mainly cotton)
enjoy higher subsidies from beet growing.
From interviews with a Hellenic Sugar Industry stakeholder, the bad weather in which the sugar
sector is in Greece can be justified from 2014 year’s production numbers. In 2014, the annual
turnover amounted to 90.6 M€ with an annual sugar production of 53,400 t coming from a
cultivated area of 7.400 ha of sugar beets. Furthermore, according to the stakeholder the current
year (2017) is the worst year regarding production of sugar and selling it. Indicatively, the market

D6.2.2 Country report Greece 31
Document:
D6.2.2 Basic analysis of targeted agricultural sectors – Country report Greece
Author:
Refere
R
Re
Re
CERTH Version: Final
Reference: AGROinLOG D6.2 Date: 29/05/18
value of sugar for the last production year is only at 315 €/t. This shows that the last year was the
worst production year of all times.
3.1.4 Typical size of the companies
Before it was decided to close the Larissa and Xanthi factories, HSI used to have two fully equipped
units (the first in Xanthi and the second one in Larissa), and three sugar factories (Plati, Serres,
Orestias) as well as one seed processing factory. Both of the two equipped units are now out of
order and only the second unit in Larissa is used from the company as a beet gathering area and
packaging unit. On the other hand, only the two sugar factories in Plati and Orestias are in full
function, with the Plati sugar factory to have a daily beets processing capacity of 8,000 t and a
potential of sugar output at 100,000 t per year. Continuously, the sugar factory in Orestias has a
daily beets processing capacity of 5,400 t and around 70,000 t sugar output per year. The sugar
factory in Serres has not been completely shut down but its operation is suspended. Every year, the
board decides whether the sugar factory in Serres will work or not (personal communication,
Hellenic Sugar Industry, 2017). According to the feedback from the stakeholder, the amount of
permanent workers that are employed in the Hellenic Sugar Industry are around 220 people and
around 280 more employees in the two subsidiaries companies in Serbia. The workforce is doubled
during the production months (September to January) by hiring seasonal employees.
The geographical breakdown of the company's operating units is shown in Figure 8.
Figure 8. Geographical breakdown of the sugar units in Greece. Source: (Hellenic Sugar Industry, 2009)
3.1.5 Distinctive facilities of the sector
The sugar facilities are in full operation from September to January. Many times, the operation
starts from August. The rest of the year, maintenance of the equipment and facilities occurs in order
Central Services
Sugar Factory
Seed treatment plant
Distribution Network
Electromechanical construction unit

D6.2.2 Country report Greece 32
Document:
D6.2.2 Basic analysis of targeted agricultural sectors – Country report Greece
Author:
Refere
R
Re
Re
CERTH Version: Final
Reference: AGROinLOG D6.2 Date: 29/05/18
for the facilities to be ready and deal with the next year’s import of raw material. The equipment
and the plant maintenance process takes too long (personal communication, Hellenic Sugar
Industry, 2017). However, there is still idle time for implementing IBLC concept. This is justified by
last year’s production period (2017) which took place from September until only October.
However, there are facilities that can find further use in other biomass-treating processes such as
storage areas, feed handling, dryers, evaporators, or pelletizer for producing pellets from different
kind of biomass feedstock. Due to the complexity of sugar production process, it is uncertain
whether an equipment within the production chain can be exploited by itself.
Furthermore, the current sugar facilities operate with HACCP (Hazard Analysis and Critical Control
Points) for food safety and as a result, it is important to know the raw material that will be used in
the above mentioned facilities and harmonize their use with the current operations rules of the
facility.
3.1.6 Degree of innovation
Research in combination with continuous quality control and genetic improvement were main
activities of the company. Hellenic Sugar Industry is the sole producer in Greece giving special
emphasis to the support of all its productive procedures through the most modern technological
advances.
One of the most remarkable programs of the company was the Genetic improvement for the
creation of new sugar beet varieties acclimatized to the agro-climatic peculiarities of Greece. The
extensive research program concerned all the sectors of relevant interest and all levels (plant-
tissue-cell-chromosome-gene). Basic directions of the research aimed at the creation of
appropriate genetic material, including endurance to biotic and abiotic factors, upgraded quality
and optimum productive potential (Hellenic Sugar Industry, 2009).
Moreover, research in seed production and in seed technology aims to provide support in the whole
sugar sector and especially the sectors of seed production and seed treatment, by increasing the
company’s revenue. Mainly the research comprises the following objects:
Agronomic practice aiming at maximizing the production and optimizing the quality of the
produced seed.
Methodology and evaluation of the seed quality.
Evaluation of the technical and pelletizing materials and investment practices of the seed
(Hellenic Sugar Industry, 2009)
However, nowadays, the stakeholder from the Greek sugar sector stated that R&D activities are not
performed or supported due to the bad economic situation the company is in.

D6.2.2 Country report Greece 33
Document:
D6.2.2 Basic analysis of targeted agricultural sectors – Country report Greece
Author:
Refere
R
Re
Re
CERTH Version: Final
Reference: AGROinLOG D6.2 Date: 29/05/18
3.2 Opportunities IBLC
3.2.1 Sector related residues
As it was mentioned above, the sugar production is a fairly enough complicated process. Taking
into consideration that the cultivated area of sugar beets in Greece amounts to 9,309 hectares (in
2012-2013) (CEFS Sugar Statistics, 2013), the main by-products derived from the sugar process are
molasses and beet residues, which are ranged as it is shown below:
Molasses: It contains about 50 % sugar and is used as a substrate for fermentation
processes for the production of alcohol, food or feed, citric acid, glutamic acid, amino acids
(e.g. lysine) as well as feed additives. 2-4 % of beet production.
Sugar-beet pulp pellets: A portion of the fresh pulp is not available directly for animal feed,
but after it is driven for drying. The product resulting from drying is called pastry pie or dry
pulp and is an excellent feed. It is marketed as produced or in the form of compressed
particles as pellets. 2-4 % of beet production.
Fresh pulp: The product resulting from the "recent beans" of the beets when the sugar
which is contained into them has been extracted and called "extracted particles". The
"extracted particles" are pressed to remove most of the water and sugar that they contain
and the resulting product is called fresh pulp and sold as animal feed. Production depends
on demand (Hellenic Sugar Industry).
From data taken from CEFS sugar statistical 2013 report, the annual beet production for the year
2013 amounted to 1,411,840 t. This estimation was made knowing that the annual sugar production
was 158,126 t for this year and additionally that a percentage of 11-12 % is referred to the produced
sugar. Continuously, it is worth to mention that during the collection process of the sugar beets
another main residue derives and can be also estimated in the below table, the beet leaves which
can be used as substrate for biogas production. Taking into consideration that the Product/Residue
ratio is 2.51 (Apostolakis M., 1987) the produced amount of beet leaves was estimated for the year
2013. From the above, the estimated quantities of by-products are presented in Table 12.
Table 12. Main sugar residues and by-products.
By-products of sugar process production (2013)
Main sugar residues and by-products Produced amount, kt/year
Molasses1 19.5
Sugar-beet pulp pellets2 28.2
Fresh pulp1 24.8
Beet leaves3 562.5
1 Source: (Cefs Sugar Statistics, 2013) 2 Estimated amount with the 2% of beet production (Hellenic Sugar Industry, 2009) 3Source: (Apostolakis M., 1987)

D6.2.2 Country report Greece 34
Document:
D6.2.2 Basic analysis of targeted agricultural sectors – Country report Greece
Author:
Refere
R
Re
Re
CERTH Version: Final
Reference: AGROinLOG D6.2 Date: 29/05/18
3.2.2 Potential synergies & benefits
As it is mentioned above, the working months of the sugar industry in Greece is during September-
January. Thus, there are many months where the equipment stays idle.
All the above-mentioned by-products, resulting from the production of sugar, cover the needs of
industries and cattle-breeders in the internal market. Molasses is used as a raw material to produce
alcohol, yeasts and cattle feed. Sugar beet pulp pellets is cattle feed, just like the fresh pulp, and is
prepared by dry pulp (by-product of sugar) with the addition of molasses. Nutrica 135 is a sort of
cattle feed which is used for fattening the calves and is prepared with dry pulp and molasses, with
an addition of trace elements and vitamins.
Figure 9 presents a typical scheme of the sugar process production and the final use of its by-
products and wastes.
Figure 9. Schematic representation of the sugar production process and the use of its by-products. Source: (Giovanni Di Nicola, 2011)
3.2.3 Market developments
Most of the by-products produced during the sugar production process are already used in the
market such as animal feed. It is worth to mention that molasses can be used as a raw material for
the production of bioethanol. In Greece, there is no data available that confirms this exploitation.
3.2.4 Non-technical barriers
No specific barriers were arisen for the development of the IBLC concept in the sugar sector in
Greece apart from the bad financial state of the sector. The IBLC could probably enhance the sector
and push it to new markets and operations.

D6.2.2 Country report Greece 35
Document:
D6.2.2 Basic analysis of targeted agricultural sectors – Country report Greece
Author:
Refere
R
Re
Re
CERTH Version: Final
Reference: AGROinLOG D6.2 Date: 29/05/18
4 WINE SECTOR
4.1 Profile of the wine sector
4.1.1 Production
The primary feedstock for the wine production is grapes and the end products are wines of different
variety. The main steps for the winemaking (which are presented in Figure 10) are the following
(Recchia, Daou et al., 2009):
Harvest: The grape clusters are cut from the vineyard and placed in bins or boxes and then
transferred to larger containers for transport to the winery.
Break: The grapes are crushed and their stem is extracted at the same time by a crusher
consisting of a perforated cylinder with rotating blades.
The separation of the juice: The crushed grapes are placed in a cylinder, and the tube being
inflated presses the grapes against the sides of the rotating cylinder and causes the juice to
be extracted through the perforations.
The processing of must: White musts are often turbid and it is necessary to settle the
suspended particles to separate them.
Fermentation: During this process, the grape juice (sugars present in the must) transforms
into an alcoholic beverage.
Processing after fermentation: With suitable composition of the must, yeast type,
temperature and other factors, the alcoholic fermentation stops when the available
amount of sugar that can be fermented becomes too low.
Mineral fermentation: In malonic lactic fermentation, malic acid degrades into lactic acid
and carbon dioxide. Fermentation is caused by enzymes produced by certain lactic acid
bacteria.
Separation: Some wines expel part of them very quickly, and the extra wine remains almost
shiny. Removal of the waste material during maturation is called separation.
Refining: A process in which a material that helps to separate wine is added. The main
processes involved are adsorption, chemical reaction and adsorption and possibly physical
motion.
Filtration: The original filters were made up of the rough fabric-covered holes through
which the wine was poured.
Centrifugation: Centrifugation, or high speed rotation, used to separate musts, is also
applied to wines that are difficult to separate by other means.
Cooling: Temperature reduction often prevents yeast growth and carbon dioxide
production, which tends to keep yeast cells inhibited.
Exchange: Another method to stabilize the tartrate is to pass a part of the wine through a
device called ion exchanger.

D6.2.2 Country report Greece 36
Document:
D6.2.2 Basic analysis of targeted agricultural sectors – Country report Greece
Author:
Refere
R
Re
Re
CERTH Version: Final
Reference: AGROinLOG D6.2 Date: 29/05/18
Heating: Pasteurization at 70 to 82 °C can also be used to precipitate proteins, but in
modern practice this process is rarely adopted to help in the separation.
Furthermore, in most wineries another process is also followed in order to reuse the main by-
products coming out from the winemaking procedure. This process concerns the part of the wine
distillery. The feedstock for the distillery process is the grape marc. This is the residue from the
pressing of the grapes and the removal of most of the juice destined for the production of wine. As
a raw material it is also used for vinegar production and a very small percentage for pure and
aromatic wines.
The process of distillery starts with the stirrer and heating of the marc in order to export the
distillate. After the marc’s heating, the vapors are collected into the distillation vessel where the
distillate is separated from undesirable ingredients. Next, the distillate’s alcoholic strength is
checked by a special system and finally it is directed to the collection tanks. The final distillate’
alcoholic strength is 75 % vol. Mixing and dilution tanks follows in order to obtain the required
alcoholic strength (40 % vol) and desirable organoleptic characteristics.
Figure 10 below presents the above mentioned steps for the winemaking procedure and Figure 11
shows the main process stages of a wine distillery. More specifically it presents the main distillery
process procedure of the Lafazanis winery, one of the biggest winery-distillery in Greece. Most of
the Greek wineries include the distillery procedure in order to use all the residues produced by the
winemaking process; there are also wineries and distilleries that are operated as separated units.
Figure 10. The main stages of the winemaking process. Source: (Food info)

D6.2.2 Country report Greece 37
Document:
D6.2.2 Basic analysis of targeted agricultural sectors – Country report Greece
Author:
Refere
R
Re
Re
CERTH Version: Final
Reference: AGROinLOG D6.2 Date: 29/05/18
Figure 11. Distillery process. Source: (Lafazanis winery)
4.1.2 Volume of the sector
The wine sector in Greece, as director of KEOSOE (Central Cooperative Union of Wine Products)
stated, is estimated to consist of 1,100 wineries, 40 cooperatives and around 100 distilleries
producing more than 7,000 labels. Greece produces 34 PDO (Protected Destination of Origin) labels
and 120 PGI (Protected Geographical Indication) labels. According to the statistical data from the
Ministry of Agriculture the total wine volume for the wine-growing period of 2015-2016 was
2,458,421 hl of wine, from which 745,809 hl were red wine and the rest 1,712,612 hl were white
wines. Moreover, in order to understand the volume of this sector, Table 13 presents the total wine
production in accordance with the total vine cultivated area in Greece.
Table 13. Annual wine production from 2011 to 2016. Source: (KEOSOE)
Wine production from 2011 to 2016
2011/2012 2012/2013 2013/2014 2014/2015 2015/2016
Total cultivated area (ha)
66,473 65,330 65,020 64,048 62,723
Total wine production (1,000
hl) 2,660 3,050 3,268 2,750 2,458
Figure 12 shows a clearer picture about the wine production in Greece. The most productive region
in Greece is Peloponnese with a percentage of 29.30 % of domestic wine production and then
follows Attica and Central Greece with a percentage of 20.16 % of the domestic wine production.
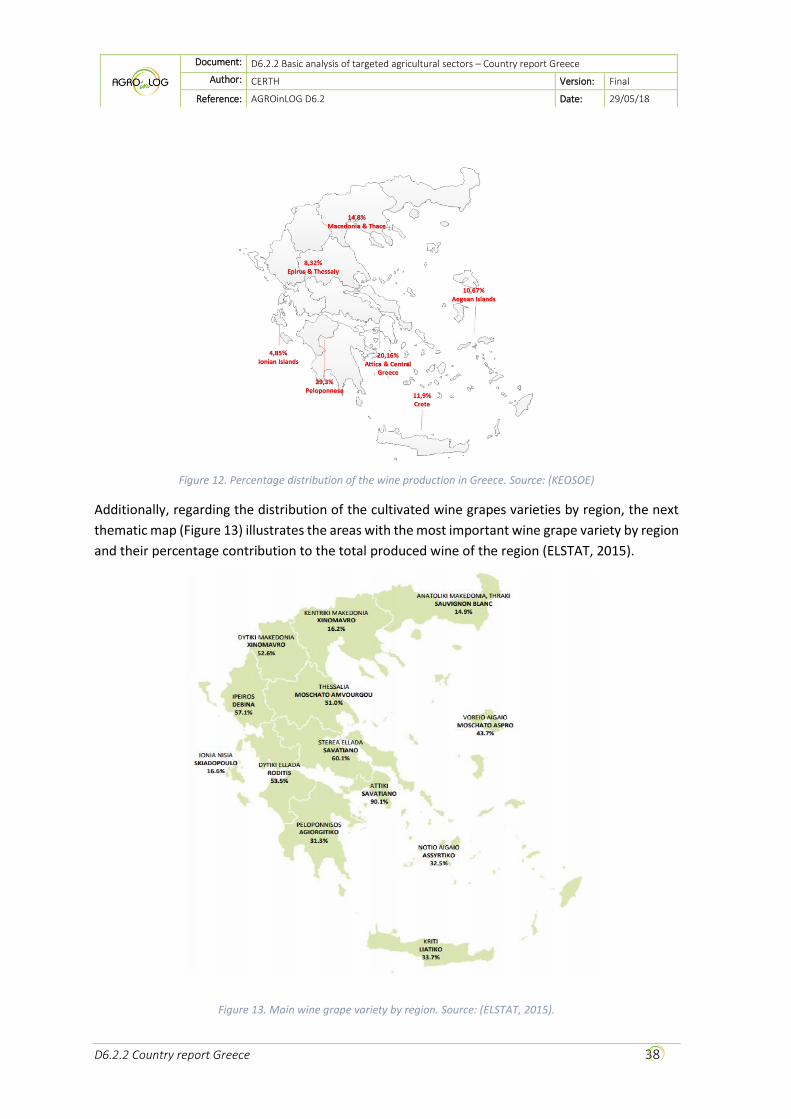
D6.2.2 Country report Greece 38
Document:
D6.2.2 Basic analysis of targeted agricultural sectors – Country report Greece
Author:
Refere
R
Re
Re
CERTH Version: Final
Reference: AGROinLOG D6.2 Date: 29/05/18
Figure 12. Percentage distribution of the wine production in Greece. Source: (KEOSOE)
Additionally, regarding the distribution of the cultivated wine grapes varieties by region, the next
thematic map (Figure 13) illustrates the areas with the most important wine grape variety by region
and their percentage contribution to the total produced wine of the region (ELSTAT, 2015).
Figure 13. Main wine grape variety by region. Source: (ELSTAT, 2015).

D6.2.2 Country report Greece 39
Document:
D6.2.2 Basic analysis of targeted agricultural sectors – Country report Greece
Author:
Refere
R
Re
Re
CERTH Version: Final
Reference: AGROinLOG D6.2 Date: 29/05/18
4.1.3 State of the sector
The wine sector in Greece has a significant role in the economy of Greece. Apart from the
employment positions that it offers, the wine sector has one of the highest turnovers in agro-
industries. Table 14 presents an overview of the annual turnover of wine sector during the last
years, 2011-2014 (inr.gr, 2014). For 2017, the annual turnover of wine sector was estimated at 380
M€ (personal communication, KEOSOE, 2017)
Table 14. Annual Turnover of Wine Sector in Greece. Source: (inr.gr, 2014)
Annual Turnover of Wine Sector in Greece
2011 2012 2013 2014
Turnover (M€) 200 197 180 181
Moreover, the Greek wine sector has significant imports and exports. For example, in 2015-2016
the imports of wine were rising at 208,952 hl with a value of 33 M€ and the exports were rising at
301,253hl, with a value of 74 M€.
Table 15 presents the main wineries based on their annual sales for year 2014.
Table 15. Economic size of the biggest Wineries in Greece. Source: (inr.gr, 2014)
Economic Size Of The Biggest Wine Companies In Greece
NAME LOCATION TOTAL ASSETS
(M€)
SALES (M€) EBITDA (M€)
TSADALIS S.A. Chalkidiki 83 31 4
GREEK WINE CELLARS-
KOURTAKIS S.A. Markopoulo 34 26 0,8
CAVINO Aigio 22 17 0,9
BOUTARI S.A. Naoussa, Crete,
Santorini, Kilkis 46 12 -0,1
KOUTSODIMOS S.A. Nemea 5 6 0,6
TSAKTSARLIS- GEROVASILEIOU
S.A. (VIVLIA CHORA) Kavala 11 6 1
LAZARIDI S.A.
Drama 36 6 0,5
4.1.4 Typical size of the companies
The total annual production capacity of a typical winery in Greece reaches 4,000 t of wine per year
(Lafazanis winery). Although, it is worth to mention that the total annual production capacity of the
biggest winery in Greece is 20 thousand hl (in wine and spirits).
Moreover, according to the feedback from the stakeholders the amount of permanent workers that
are employed in the whole wine sector are around 24,300 employees.

D6.2.2 Country report Greece 40
Document:
D6.2.2 Basic analysis of targeted agricultural sectors – Country report Greece
Author:
Refere
R
Re
Re
CERTH Version: Final
Reference: AGROinLOG D6.2 Date: 29/05/18
4.1.5 Distinctive facilities of the sector.
The facilities that are used in this sector are in full operation during the months from October to
February. The rest of the year, the facilities operate for the marketing of the wines (packaging,
bottling and trade). Unfortunately, due to the complexity of wine production process these facilities
cannot be used for every other procedure. Perhaps, the centrifugators and the distillation
equipment that are used in the distillery process can also be used in other industries whose finally
products are distillates like beer or other alcoholic industries. Furthermore, the storage facilities
that are used in this sector can possibly store other material during idle months for the wineries.
4.1.6 Degree of innovation
Unfortunately, the stakeholder from the Greek wine sector stated that during the last years, due to
the economic crisis, there is no currently interest for innovation/ R&D actions. He stated that most
facilities in the wine sector do not operate with the state of the art machinery but they are trying
to catch up with the latest developed technologies.
However, large wineries in Greece use the latest/ state of the art technologies for the production
of wine. A minority of wineries have some R&D activities. For example, one of the biggest winery in
Greece (Lafazanis) develops a new innovative technique in the field (precision agriculture), in order
to maximize the productivity of grapes, by means of biological cultivation.
4.2 Opportunities IBLC
4.2.1 Sector related residues
The main solid by-products and residues produced in modern winery industries include: the grape
pomace (marc), the grape stalk, the wine lees and the winery wastewater (vinasse). Moreover, the
main by-products coming from the grape pomace are: the seeds and the skins left after the
crushing, draining and pressing stages of wine production. Grape marc is commonly processed to
produce alcohol and tartaric acid, which results in a new lignocellulosic by-product, spent grape
marc. The wine lees are accumulated in the bottom of grape juice or wine fermentation tanks. The
distillation of the alcohol from low-quality wine, wine lees and grape marc produces a large quantity
of a viscose and acidic wastewater known as vinasse. In many wineries, an aerobic depuration
process is operated after the distillation to treat the winery effluents such as vinasse and winery
wastewater, therefore, generating waste biosolids. A large proportion of the wastewater comes
from cleaning and cooling processes (Poonam Singh nee’ Nigam, 2009).
Wine cellars by-products (such as the dried grape marc, lees and vinasses) and residues (such as
the grape stalks) can be used for energy purposes. Figure 14 presents an estimation for the amounts
and compounds of the most generated (in terms of amount of kg) by-product in winemaking.

D6.2.2 Country report Greece 41
Document:
D6.2.2 Basic analysis of targeted agricultural sectors – Country report Greece
Author:
Refere
R
Re
Re
CERTH Version: Final
Reference: AGROinLOG D6.2 Date: 29/05/18
Figure 14. Winemaking by-products. Source: (Oliveira, 2014)
According to these estimations (from Figure 14) and assuming that 1 liter of wine corresponds to
1.2 kg of grapes, the estimated by-products of the wine sector are presented in Table 16.
Table 16. Greek primary wine industry by-product estimation for 2015-2016.
Greek wine industry by-product estimation (2015-
2016)
Material kt/ year
Grape for wine production 295
Ml/ year
Wine 245.8
By-products kt/ year or Ml/year
Stalks (kt/year) 8.8
Grape marc (kt/year) 35.4
Lees (kt/year) 14.7
Wastewater (Ml/year) 487

D6.2.2 Country report Greece 42
Document:
D6.2.2 Basic analysis of targeted agricultural sectors – Country report Greece
Author:
Refere
R
Re
Re
CERTH Version: Final
Reference: AGROinLOG D6.2 Date: 29/05/18
Another main residue that derives from the wine sector is that of vine prunings. Vine prunings, as
in the case of olive prunings, are not exploited. When pruning is performed, the most common
practices followed for these residues is burning them in open fires, which contributes negatively to
the environment, and mulching of this biomass in order to incorporate it into the soil as fertilizer.
However, these residues can be exploited in different ways, mainly in the energy sector.
As in the case of olive prunings, there are no recent national surveys based on field data regarding
the availability of vine prunings in Greece. Like in the olive sector, three methods estimate the
potential of vine prunings. The methods are described in paragraph 2.2.1 “Sector related residues”
of olive oil sector. The moisture considered in all methods is 40 % wt for vine prunings. The vine
pruning potential is presented in Table 17 based on these methods.
Table 17. Potentials (kt of dry matter per year) for vine prunings in Greece according to several data sources.
Potentials for olive prunings (kt of dry matter per year)
Source Reference Year Methodology Vine Prunings
Apostolakis et al. 1980 RPR + national production statistics 566
Biomasud Plus 2014 - // - 398
S2Biom 2020 RSR + CAPRI surface projections 93
From the three methods, the national annual pruning potential is estimated in a range of 93-566
dry kt. Finally, in the framework of uP_running project (Grant Agreement No 691748) on-field
measurements of vine pruning production were performed in several vineyards around Greece.
Based on these on-field measurements, S2Biom’s RSR values are more in line with the RSR values
found from the on-field measurements for vine prunings.
4.2.2 Potential synergies & benefits
In the wine sector, several papers present the potential of using wastes from wine distilleries for
the production of energy and biobased products.
Zacharof (Zacharof, 2016) investigated the valorization of winery wastes and their exploitation as
feedstock to produce platform chemicals, biofuels, and energy. The paper proposes schemes to be
applied in wineries at industrial scale in order to further use the wastes that are generated.
Both the solid and the liquid winery wastes can be used successfully as feedstock for the production
of high value chemicals. This can be achieved either in a conventional chemical-biochemical
biorefinery (wine lees, vinasses, grape marc) (Figure 15) or in green biorefinery (leafs, grape
pomace) (Figure 16) or in a lignocellulosic biorefinery (stalks, peels, seeds, trimming vine shots,
pips, pomace) (Figure 17).

D6.2.2 Country report Greece 43
Document:
D6.2.2 Basic analysis of targeted agricultural sectors – Country report Greece
Author:
Refere
R
Re
Re
CERTH Version: Final
Reference: AGROinLOG D6.2 Date: 29/05/18
Figure 15. The chemical-biochemical biorefinery assortment applied to winery waste. Source: (Zacharof, 2016)
Figure 16. The green biorefinery assortment applied to winery waste. Source: (Zacharof, 2016)
Figure 17. The Lignocellulosic Feedstock (LFC) Biorefinery assortment applied to winery waste. Source: (Zacharof, 2016)

D6.2.2 Country report Greece 44
Document:
D6.2.2 Basic analysis of targeted agricultural sectors – Country report Greece
Author:
Refere
R
Re
Re
CERTH Version: Final
Reference: AGROinLOG D6.2 Date: 29/05/18
4.2.3 Market developments
The winery residues (wine lees, grape marc, vinasses and wine leaves) can be used as feedstock to
produce platform chemicals such as lactic acid, extract polyphenols (e.g. resveratrol) to be used in
cosmetics, biofuels including ethanol, enzymes, chemical intermediates, and energy through
pyrolysis and anaerobic digestion.
From the communucation with the stakeholder of the Greek wine sector, he stated that from the
wineries residues, the grape marc is currently used in the market as fertilizer. It is not eligible for
the production of animal feed due to the odor.
Furthermore, there are several ways to exploit the wastes from wineries. For example, an
Australian company Australian Tartaric Products (ATP, 2015) collects wastes from local wineries,
distills them to make grape spirit and extract tartaric acid which is used again in the wine industry.
Continuously, the company generates steam by burning the grape wastes in a biomass boiler and
sells the excess of electricity generated, after covering its own power consumptions.
In addition, the vine prunings can be used in order to produce pellets or chips for solid biofuels
market or they can be used directly as feedstock for power and/or heat plants. Such is the case of
Pelets de la Mancha. This company, which is located near the town of Socuéllamos in Spain,
manufactures solid bio-fuels in pellet and chip exclusively form from vineyard prunings and sell its
products either to public or private companies which use pellet for heating purposes as well as
industrials units, or to large companies that produce power from biomass. Moreover, the pellets
can be used in buildings with a high heating demand (where medium sized boilers above 200 kW
can be installed) and the chips can be used for heating use and industrial use in small/medium/large
enterprises (uP_running). Additionally, another recorded case is according to Corona & Nicole
(Corona et al., 2010), Settesoli -a huge winery in Italy- which decided to construct a biomass energy
plant of 1 MWe that would use as feedstock the vine canes from pruning, along with pomaces and
wastes from the winemaking process.
4.2.4 Non-technical barriers
No specific barriers were found regarding the implementation of the IBLC concept to the wine
sector apart from the fact that economic crisis has made most of the companies turn into
themselves, unable to invest or be “open” to new innovative ideas or investments. Another main
barrier is the lack of knowledge of the sector’s stakeholders on the exploitation of agro-residues.

D6.2.2 Country report Greece 45
Document:
D6.2.2 Basic analysis of targeted agricultural sectors – Country report Greece
Author:
Refere
R
Re
Re
CERTH Version: Final
Reference: AGROinLOG D6.2 Date: 29/05/18
5 GRAIN CHAIN
5.1 Profile of the grain sector
5.1.1 Production
The most important grains that are cultivated in Greece are wheat, both soft and durum, barley,
oats, rye and maize (grown alone and grown with beans and other crops). Cereals are the most
important category of plants grown for human nutrition. From cereals one of the basic types of
human food, bread, is produced as well as raw materials for the food industry, fodder, etc.
The production process, that follows the harvest of wheat, has the following stages and it is
presented in Figure 18 (Greek Flour Millers Association):
1. Receipt and storage - The wheat is received from ships and trucks. Cereals undergo
meticulous sample checking, in order to verify the quality of the product. Upon unloading,
the wheat is weighed and is subjected to an initial mechanical cleaning to remove
impurities.
2. Cleaning - Before being milled, the wheat must be fully cleaned from any impurities and
wetted to the desired level for milling. The impurities that may be present in wheat are:
grains of other cereals, straw, paper, stones, sand, dust, glass, metal. Impurities are
separated from the wheat mechanically based on:
Size
Shape
Specific gravity
Magnetism
3. Wetting - The wheat's moisture content must be kept at certain levels in order to achieve
the best possible separation of the flour from the bran. The amount of added moisture and
the residence time of the wheat before milling depends on its hardness, climatic conditions
and the moisture specifications of the finished product. The wetting of wheat allows a more
efficient separation of bran from the endosperm and the appropriate degree of softness of
the interior grain to achieve good performance during milling.
4. Milling - The milling process aims to remove the endosperm (flour) from the bark (bran) of
wheat. This is accomplished through a gradual milling process, carried out with the help of
rollers and consisting of three steps:
The breaking system (which separates and removes the endosperm from the bran
in relatively large pieces).
The scraping system (which removes small pieces of bran and germ, which are
attached to the endosperm).
The reduction system (which mills the endosperm into flour).
5. Mixing - Mixing allows the creation of a large number of products, homogenising different
flour and auxiliary materials at the desired ratio.

D6.2.2 Country report Greece 46
Document:
D6.2.2 Basic analysis of targeted agricultural sectors – Country report Greece
Author:
Refere
R
Re
Re
CERTH Version: Final
Reference: AGROinLOG D6.2 Date: 29/05/18
6. Special Processing - Special processing consists of:
Drying
Separation of proteins
Heat treatment of bran and milling fractions
7. Storage and Packaging - The flour created by milling is transferred into storage silos. From
there, the flour will be taken to a control screen, a packaging device, a metal detector and
finally a palletising device.
8. Quality Control - The quality control of the flour begins with the control of the received
wheat, continues in the various stages of milling and ends with the control of the final
product. The quality control ensures that the flour has the best qualities, while also
performing tests to verify that the grains are free of harmful toxins, pesticides or other
harmful microorganisms.
Figure 18. Overview of the grain production process. Source: (Greek Flour Millers Association)
5.1.2 Volume of the sector
According to the annual cereal balance for the production period 2015/2016, the total amount of
the cereal production in Greece was 3,183,756 t in a cultivated area of 926,965 hectares. In Table
18 the cereal balance is presented for the economic year 2015/2016.
CultivationAnd
Harvest
Transport to Mills
CleaningGrain
Receiving and storage
Milling Wetting
Quality Control
Storage and Packaging
Special Processing
Mixing
Bakeries

D6.2.2 Country report Greece 47
Document:
D6.2.2 Basic analysis of targeted agricultural sectors – Country report Greece
Author:
Refere
R
Re
Re
CERTH Version: Final
Reference: AGROinLOG D6.2 Date: 29/05/18
Table 18. Production of Grain in Greece. Source: (Ministry of Agriculture, 2016).
Cereal Balance 2015/2016
Initial stocks
(t)
Using production
(t)
Area
(ha)
Yield
(t/ha)
Human
consumption
Soft wheat 80,000 352,975 154,843 2.28 615,000
Durum
wheat 80,000 785,657 332,525 2.36 671,000
Barley 6,000 353,886 154,112 2.30 5,000
Maize 170,000 1,542,304 152,047 10.14 5,000
Rye 2,500 22,974 15,715 1.46 3,000
Sorghum 800 10,274 2,861 3.59 100
Oats 5,000 83,058 96,013 0.87 500
Triticale 2,500 31,989 18,888 1.69 200
Rest 1,500 639 234 2.73 300
Total cereal 348,300 3,183,756 926,965 3.43 1,300,100
5.1.3 State of the sector
Grain chain consists one of the most important sector in Greek economy with serious imports as well as exports quantities as it can be seen in the Table 19.
Table 19. Total imports and exports of grain chain in Greece. Source: (Ministry of Agriculture, 2016).
Grain Chain Imports/ Exports 2015/2016
Total imports (t) Total Exports (t)
Soft wheat 907,773 11,607
Durum wheat 181,248 205,528
Barley 105,715 748
Maize 484,123 25,685
Rye 1,349 71
Sorghum 552 21
Oats 10,328 48
Triticale 84 28
Rest 15,183 80
Total cereal 1,706,355 243,817
Moreover, Table 20 presents an overview of the annual turnover of grain sector during the last
years (2011-2014).
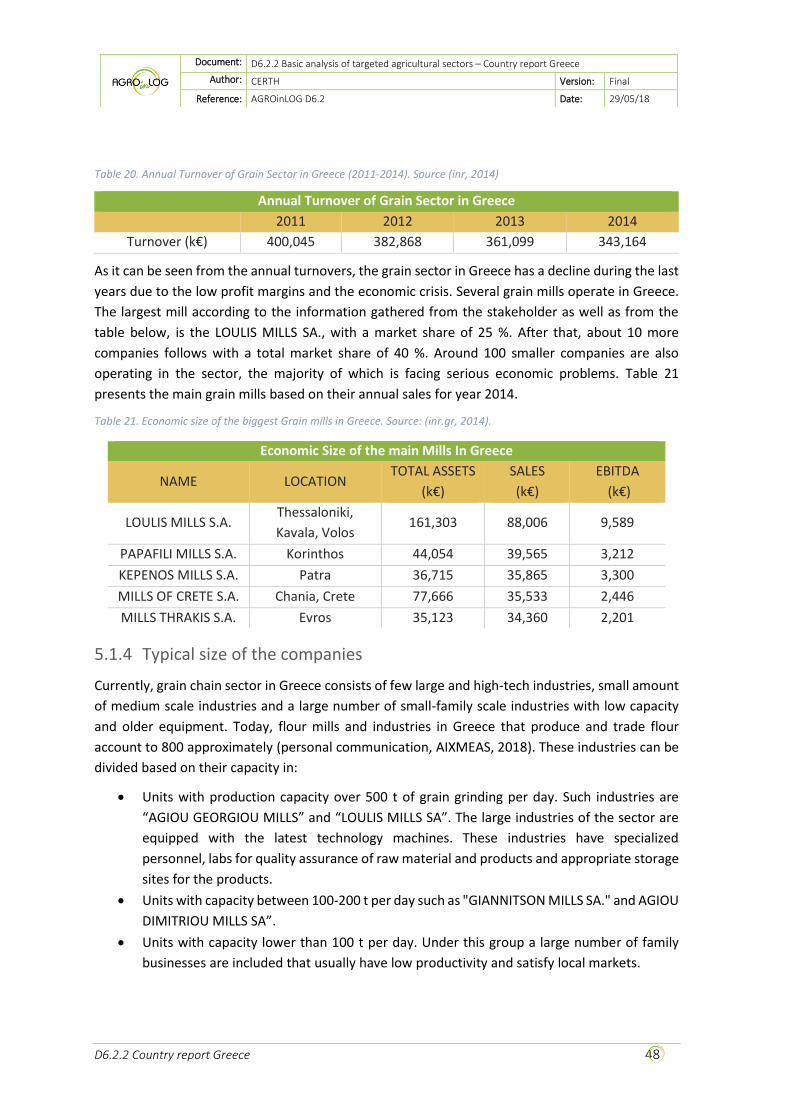
D6.2.2 Country report Greece 48
Document:
D6.2.2 Basic analysis of targeted agricultural sectors – Country report Greece
Author:
Refere
R
Re
Re
CERTH Version: Final
Reference: AGROinLOG D6.2 Date: 29/05/18
Table 20. Annual Turnover of Grain Sector in Greece (2011-2014). Source (inr, 2014)
Annual Turnover of Grain Sector in Greece
2011 2012 2013 2014
Turnover (k€) 400,045 382,868 361,099 343,164
As it can be seen from the annual turnovers, the grain sector in Greece has a decline during the last
years due to the low profit margins and the economic crisis. Several grain mills operate in Greece.
The largest mill according to the information gathered from the stakeholder as well as from the
table below, is the LOULIS MILLS SA., with a market share of 25 %. After that, about 10 more
companies follows with a total market share of 40 %. Around 100 smaller companies are also
operating in the sector, the majority of which is facing serious economic problems. Table 21
presents the main grain mills based on their annual sales for year 2014.
Table 21. Economic size of the biggest Grain mills in Greece. Source: (inr.gr, 2014).
Economic Size of the main Mills In Greece
NAME LOCATION TOTAL ASSETS
(k€)
SALES
(k€)
EBITDA
(k€)
LOULIS MILLS S.A. Thessaloniki,
Kavala, Volos 161,303 88,006 9,589
PAPAFILI MILLS S.A. Korinthos 44,054 39,565 3,212
KEPENOS MILLS S.A. Patra 36,715 35,865 3,300
MILLS OF CRETE S.A. Chania, Crete 77,666 35,533 2,446
MILLS THRAKIS S.A. Evros 35,123 34,360 2,201
5.1.4 Typical size of the companies
Currently, grain chain sector in Greece consists of few large and high-tech industries, small amount
of medium scale industries and a large number of small-family scale industries with low capacity
and older equipment. Today, flour mills and industries in Greece that produce and trade flour
account to 800 approximately (personal communication, AIXMEAS, 2018). These industries can be
divided based on their capacity in:
Units with production capacity over 500 t of grain grinding per day. Such industries are
“AGIOU GEORGIOU MILLS” and “LOULIS MILLS SA”. The large industries of the sector are
equipped with the latest technology machines. These industries have specialized
personnel, labs for quality assurance of raw material and products and appropriate storage
sites for the products.
Units with capacity between 100-200 t per day such as "GIANNITSΟN MILLS SA." and AGIOU
DIMITRIOU MILLS SA”.
Units with capacity lower than 100 t per day. Under this group a large number of family
businesses are included that usually have low productivity and satisfy local markets.

D6.2.2 Country report Greece 49
Document:
D6.2.2 Basic analysis of targeted agricultural sectors – Country report Greece
Author:
Refere
R
Re
Re
CERTH Version: Final
Reference: AGROinLOG D6.2 Date: 29/05/18
According to stakeholder feedback, around 3,000 permanent and seasonal employees, apart from
the grain farmers, can be found in the whole grain chain sector.
5.1.5 Distinctive facilities of the sector
Unfortunately, the grain facilities are in full operation during the whole year, usually this refers to
large companies of the sector, and as a result all the equipment is used for the production purposes.
However, most of the grain chain sector companies possess numerous storage silos, in order to
store the annual cereal production for their clients. These silos can be used for storing different
kind of products when they are low on cereals.
5.1.6 Degree of innovation
According to the agronomist of the LOULIS MILLS SA., the large companies of this sector invest into
innovative ideas considering the waste management of their residues or the use of them into
renewable energy. Indicatively, LOULIS MILLS SA does not appear to have any residue during the
whole year as they manage and exploit them for their energy purposes (e.g. for heating purposes
during the procedure process of their main products).
Furthermore, companies in the grain sector invest in technologies in order to be able to produce
“functional” products, meaning products with better quality, with no diseases, without gluten etc.
5.2 Opportunities IBLC
5.2.1 Sector related residues
The primary biomass residue, which is produced by the cereal production, is mostly straw with
smaller biomass components such as chaffs. Usually producers leave the straw on the field with the
aim to incorporate it into the soil as a natural fertilizer or they collect it in order to use it for livestock
bedding. This biomass is identified as having most potential when used for ethanol production.
Residues are also derived from the industrial processing (milling and grinding) of the cereals. Today,
the majority of these residues is used in animal fodder. A typical cereal flour plant in Greece
produces almost 50,000 t of by-products each year and sell them either in bulk form or in packages
as animal feed.
However, the evaluation of the quantities and geographical distribution of this category of residue
is complicated because of the different processing technologies, the size and location of the
processing plants and the characteristics of the final products. Furthermore, there is no official data
on the production of agro-industrial products at regional level in Greece that could facilitate the
estimation of the residues produced. Therefore, it is necessary to follow different methodologies,
according to the availability of data for each type of residue. For this reason, in order to estimate
the cereal residues quantities for the economic year 2015/2016, above mentioned amounts of
cereals and the product/residue ratio which is found in literature (OECD, 2004), are used. The
calculated quantities of the cereal residues, deriving from grain crops, are shown in Table 22.

D6.2.2 Country report Greece 50
Document:
D6.2.2 Basic analysis of targeted agricultural sectors – Country report Greece
Author:
Refere
R
Re
Re
CERTH Version: Final
Reference: AGROinLOG D6.2 Date: 29/05/18
Table 22. Grain crop residues studied for Greece sector.
Cereal Residues Quantities for the economic year 2015/2016
Moisture
(%)1
Production (t)2 Product/Residue
ratio1
Residues (t) Type of
residues
Soft wheat 15 352,975 1.00 352,975 straw
Durum wheat 15 785,657 1.00 785,657 straw
Barley 15 353,886 1.24 285,392 straw
Maize 60
1,542,304 1.42 1,086,130 stalks
50 3.75 411,281 cobs
Oats 15 83,058 1.27 65,400 straw
1 Source:(OECD,2004) 2 Source: (Ministry of Agriculture, 2016).
5.2.2 Potential synergies & benefits
Mainly the straws produced as residues from cereals can find various applications. Straws can be
used as raw material for energy purposes such as pellets or for the production of bio-chemicals and
biofuels. Unfortunately, the existing facilities cannot cover the needs for the exploitation of this
biomass. New technologies should be adopted in order for the grain mills to be able to process the
generated residues.
5.2.3 Market developments
Cereals, are a major source of agricultural waste in many countries. As it was mentioned above the
most common residue of the grain chain sector, straw, can be utilized as raw material in order to
attain bio-energy markets through the production of solid bio-fuels (in the shape of pellets perhaps)
or by directly using it. These agro-residues can be exploited in energy plants with the aim to produce
energy from the straw combustion. This idea could open new roads in the bio-energy markets but
so far it consists difficult the start –up of this business line (especially in Greece) due to the difficult
economy situation as well as to the prices variability of this sector.
However, grain chain residues can be used for cattle feed, fertilizers as well as in compost
production and this leads to the development of new markets. Already, these operations are
followed in some countries (e.g. Vietnam) but due to the low finance sources, there are problems
regarding the waste management. Nevertheless, it is worth to show a typical scheme of the
available exploitation paths of grain residues that could be the pioneer for a new market business
line in the existing agro-industries.

D6.2.2 Country report Greece 51
Document:
D6.2.2 Basic analysis of targeted agricultural sectors – Country report Greece
Author:
Refere
R
Re
Re
CERTH Version: Final
Reference: AGROinLOG D6.2 Date: 29/05/18
Figure 19. Typical management practice model of straw utilization. Source: (Dang Khanh, 2010)
5.2.4 Non-technical barriers
The main barrier, according to the interviewed stakeholder, is that eventually there are no idle
times for the available equipment and the amount of by-products produced are totally consumed
either as animal feed or for energy purposes.
Another barrier, mentioned by the sector’s stakeholder (personal communication, AIXMEAS, 2018)
is that it would be difficult for the farmers to give their agricultural residues (e.g. straw) to the IBLC
as they incorporate them on their fields, giving organic matter to the soil. Thus, the farmer needs
something else to replace the agro-residue and give the organic matter to his soil. As a result, the
stakeholder stated that in order for the exploitation of agro-residues in the grain chain to be
feasible, a synergy must be established between the grain farmers and the IBLC or end user. The
farmers will have to take something in exchange of the agro-residues (straws), for example some
money, in order to buy bacteria or the appropriate material to increase the organic matter of his
soil.
D6.2.2 Country report Greece 52
Document:
D6.2.2 Basic analysis of targeted agricultural sectors – Country report Greece
Author:
Refere
R
Re
Re
CERTH Version: Final
Reference: AGROinLOG D6.2 Date: 29/05/18
6 VEGETABLE OIL EXTRACTION
6.1 Profile of the vegetable oil extraction sector
6.1.1 Production
There are several vegetable oil extraction industries in Greece. Vegetable oil is extracted from
various primary feedstock like cotton seeds, soya, sunflower, etc. Apart from vegetable oils, other
products derive from these crops like seeds and fats that are used in animal feed. Vegetable oil is
used either for edible use or for the production of bio-diesel.
One of the main companies in the vegetable oil extraction sector in Greece is SOYA Mills with
several units across Greece. SOYA Mills produces and exports seed oils such as sunflower oil,
soybean oil, rapeseed oil and proteins derived from processing oilseeds. In its main processing unit
there are two modern processing units which undergo the following procedures:
Oilseed Processing Unit: Oilseeds (such as soybeans, rapeseeds, sunflower beans) are
crushed to produce edible oil and protein meal. Incoming oilseeds, received by vessels, are
transported to silos for storage. From there, they are forwarded to the pre-treatment plant.
The process begins by cleaning the seeds to remove impurities. Next, they are cracked and
dried, before they are formed into flakes, which are to be pressed crushed at the next stage.
The cake produced is then subjected to an extraction process in order to remove any
remaining oil. Before its storage, the protein meal is passed through a process of improving
its nutritional value and digestibility. The other product resulting from the aforementioned
treatment is crude vegetable oil.
Crude Vegetable Oil Processing Unit: In order for crude oils to become edible, they ought
to undergo a multi-stage process: Degumming, refining, bleaching and deodorization. In
degumming, phosphatides (lecithin) are being removed by means of centrifugation. The
refining process removes free fatty acids from the oil. Bleaching removes the pigments and
various other impurities oil. Finally, the deodorization process removes volatiles through a
distillation column.
The main overview of SOYA Mills processing procedures is presented in Figure 20 and the main
stages that are followed during the vegetable oil extraction process are shown in Figure 21.

D6.2.2 Country report Greece 53
Document:
D6.2.2 Basic analysis of targeted agricultural sectors – Country report Greece
Author:
Refere
R
Re
Re
CERTH Version: Final
Reference: AGROinLOG D6.2 Date: 29/05/18
Figure 20. Overview of SOYA MILLS S.A. processing of oilseeds plant. Source: (SOYA MILLS S.A)
Figure 21. Main stages of the vegetable oil extraction process. Source: (madehow.com)
6.1.2 Volume of the sector
According to ELSTAT, a general view of the sector relevant to the productivity and cultivated area
of the seed plants that can be used in vegetable oil extraction are presented in the following Table
23. The table shows the total seed production for the year 2014 (not only used for vegetable oil
production).

D6.2.2 Country report Greece 54
Document:
D6.2.2 Basic analysis of targeted agricultural sectors – Country report Greece
Author:
Refere
R
Re
Re
CERTH Version: Final
Reference: AGROinLOG D6.2 Date: 29/05/18
Table 23. Production of Seed plants in Greece, 2014. Source: (ELSTAT, 2014).
Seed production in Greece, 2014
Production (t) Cultivated areas
(ha) Oil content (%)
Seed Cotton 820,275 276,194 15-25
Sesame 187 184 50-60
Sunflower 192,227 76,381 35-52
Sorghum Broom 371
76 - Seed 101
Groundnuts 2,693 757 25-30
Sugar beets 455,973 7,127
Soya Seed 7,846 2,809 18-24
Rapeseed 8,173 4,623 30-50
Maize 1,861,149 167,364 3
Total 3,348,995 535,515 -
Moreover, the production of vegetable oils in Greece from different seeds is presented in Table 24
(Fediol, 2016) for the years 2014, 2015, 2016. The vegetable oil production in Greece these years
remains almost stable.
Table 24. Production of Vegetable oils in Greece for 2014-2016. Source: (Fediol, 2016)
Vegetable oil Production, 2014-2016
2014 (kt) 2015 (kt) 2016 (kt)
Groundnut 4 4 4
Soya 50 50 61
Rape 9 7 7
Sunflower 45 48 38
Cotton 24 19 21
Maize germ - 14 5
Total 132 143 136
Furthermore, there are 3 large scale vegetable oil extraction industries in Greece as well as a few
industries of smaller scale (personal communication, NUTRIA, 2017).
6.1.3 State of the sector
The vegetable oil sector in Greece is relatively small compared to other EU countries. According to
the production, imports, exports and consumption of vegetable oils (Table 25) the shape of the
sector can be characterized stable as no major growth or decline appears in the latest years.

D6.2.2 Country report Greece 55
Document:
D6.2.2 Basic analysis of targeted agricultural sectors – Country report Greece
Author:
Refere
R
Re
Re
CERTH Version: Final
Reference: AGROinLOG D6.2 Date: 29/05/18
Table 25. Imports/ Exports and consumption of Vegetable oils in Greece. Source: (Fediol, 2016).
Vegetable oil Imports, Exports, Consumption in Greece
2014 (kt) 2015 (kt) 2016 (kt)
Imports 242 239 232
Exports 29 30 26
Domestic Consumption 345 353 342
In Table 26, the economic data of the most important vegetable oil production and standardization
companies are concentrated. SOYA MILLS as well as SOYA ELLAS has the leading role in the Greek
vegetable oil economy.
Table 26.Economic size of the most important Vegetable oil extraction and standardization companies in Greece. Source: (inr, 2014).
Economic Size of the main Vegetable oil extraction companies In Greece, 2014
Company Name Location Total Assets
(k€)
Sales (k€) EBITDA (k€)
SOYA ELLAS Evia 104,465 233,320 12,969
SOYA MILLS S.A. Korinthos 120,587 210,276 11,733
PETTAS N.P. Patra 11,649 126,619 12,355
MINERVA S.A. Viotia 70,265 75,798 2,757
AGROINVEST Fthiotida 118,929 92,096 9,181
XAIOTOGLOU Thessaloniki 177,732 83,791 10,174
EGNATIA S.A. Evros 5,473 2,928 154
6.1.4 Typical size of the companies
A typical Greek company that produces cotton oil is KAFANTARIS- PAPAKOSTAS S.A. Ginning & Oil
Mills. They produce refined, bleached, deodorized cotton seed oil. The process they follow is by
refining, bleaching and deodorizing neutral cotton seed oil. Neutral cotton seed oil is produced by
pressing of cotton seeds. The annual production of the company is 2,000 t of seed oil.
A typical vegetable oil refinery can operate 300-400 t of seeds/ day (personal communication,
NUTRIA, 2018).
6.1.5 Distinctive facilities of the sector
Vegetable oil industries mainly operate from September to April. The operation of the facilities
depends on the feedstock these facilities use. For example, facilities that operate with sunflower,
operate from September to April as mentioned above. However, facilities that use soya as
feedstock, which is imported mainly in all periods, operate all year (personal communication,
NUTRIA, 2018).
Some facilities of this sector can be also utilized for other purposes. Because of the similarities that
are noticed among the vegetable oil extraction sector and olive oil sector, during the crushing and
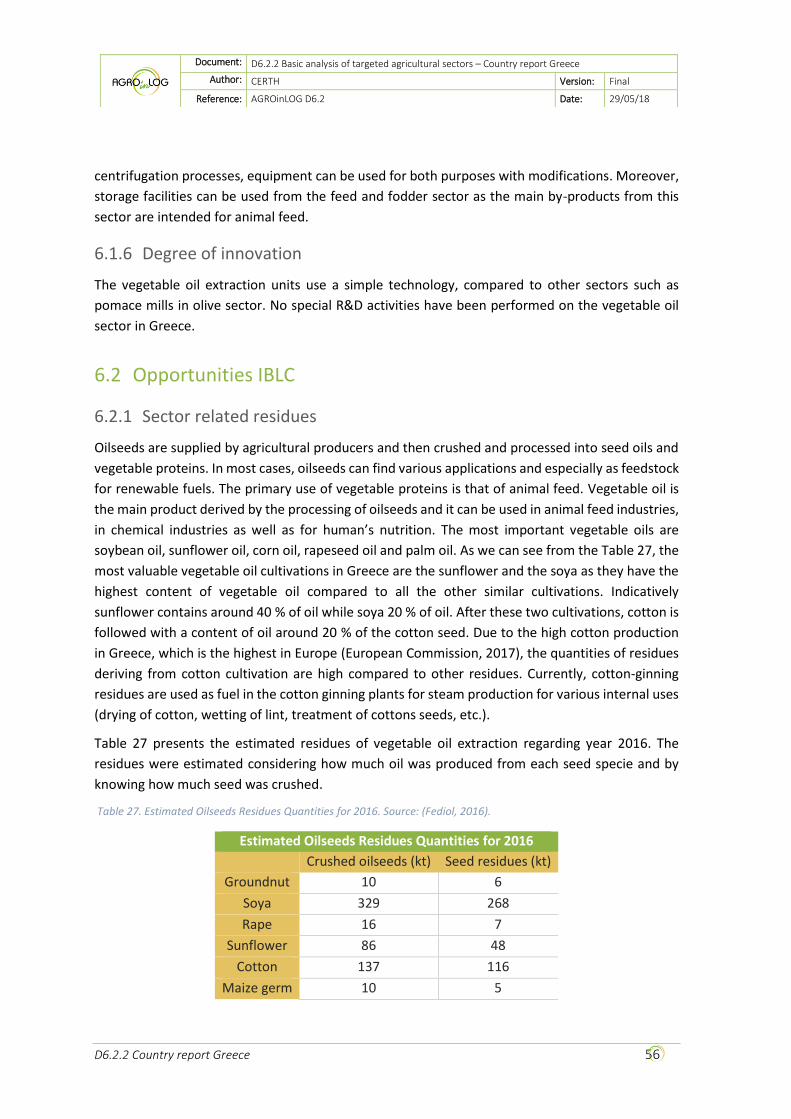
D6.2.2 Country report Greece 56
Document:
D6.2.2 Basic analysis of targeted agricultural sectors – Country report Greece
Author:
Refere
R
Re
Re
CERTH Version: Final
Reference: AGROinLOG D6.2 Date: 29/05/18
centrifugation processes, equipment can be used for both purposes with modifications. Moreover,
storage facilities can be used from the feed and fodder sector as the main by-products from this
sector are intended for animal feed.
6.1.6 Degree of innovation
The vegetable oil extraction units use a simple technology, compared to other sectors such as
pomace mills in olive sector. No special R&D activities have been performed on the vegetable oil
sector in Greece.
6.2 Opportunities IBLC
6.2.1 Sector related residues
Oilseeds are supplied by agricultural producers and then crushed and processed into seed oils and
vegetable proteins. In most cases, oilseeds can find various applications and especially as feedstock
for renewable fuels. The primary use of vegetable proteins is that of animal feed. Vegetable oil is
the main product derived by the processing of oilseeds and it can be used in animal feed industries,
in chemical industries as well as for human’s nutrition. The most important vegetable oils are
soybean oil, sunflower oil, corn oil, rapeseed oil and palm oil. As we can see from the Table 27, the
most valuable vegetable oil cultivations in Greece are the sunflower and the soya as they have the
highest content of vegetable oil compared to all the other similar cultivations. Indicatively
sunflower contains around 40 % of oil while soya 20 % of oil. After these two cultivations, cotton is
followed with a content of oil around 20 % of the cotton seed. Due to the high cotton production
in Greece, which is the highest in Europe (European Commission, 2017), the quantities of residues
deriving from cotton cultivation are high compared to other residues. Currently, cotton-ginning
residues are used as fuel in the cotton ginning plants for steam production for various internal uses
(drying of cotton, wetting of lint, treatment of cottons seeds, etc.).
Table 27 presents the estimated residues of vegetable oil extraction regarding year 2016. The
residues were estimated considering how much oil was produced from each seed specie and by
knowing how much seed was crushed.
Table 27. Estimated Oilseeds Residues Quantities for 2016. Source: (Fediol, 2016).
Estimated Oilseeds Residues Quantities for 2016
Crushed oilseeds (kt) Seed residues (kt)
Groundnut 10 6
Soya 329 268
Rape 16 7
Sunflower 86 48
Cotton 137 116
Maize germ 10 5

D6.2.2 Country report Greece 57
Document:
D6.2.2 Basic analysis of targeted agricultural sectors – Country report Greece
Author:
Refere
R
Re
Re
CERTH Version: Final
Reference: AGROinLOG D6.2 Date: 29/05/18
Furthermore, it is worth to mention that apart from the residues generated from seed crushing,
there are also residues generated during the harvesting of seeds from the crops. These residues are
agro-residues like straws, stalks etc. that can be exploited for energy or fuel use. Table 28 presents
the estimated agro-residues generated from all the fields containing the corresponding crop used
for the vegetable oil extraction in Greece. As a result, the table presents the potential of agro-
residues of all the crops, not only the crops used for vegetable oil extraction but also for other
sectors (e.g. grain-chain). The following quantities are estimated taking into consideration the RPR
ratio and the seed crop production for 2014, as mentioned on Table 23.
Table 28. Estimated Field Residues Quantities for vegetable oil crops in Greece for 2014. Source: (Stephanie Searle, 2013)
Estimated Field Residues Quantities for Vegetable oil crops, 2014
Moisture (%) Seed
production (kt)
Residue to
Product Ratio
(RPR)
Field Residues (kt)
Groundnut1 15 2.7 2.5 7
Soya2 15 7.8 2.5 20
Rape2 15 8.2 1.08 9
Sunflower straw3 40 192.2 2 384
Cotton stalks3 45 820.3 2 1,641
Maize stalks3 60 1,861.2 0.7 1,303 1 Source: (Gunther et al., 2007) 2 Source: (Stephanie Searle et al., 2013) 3 Source: (OECD, 2004)
6.2.2 Potential synergies & benefits
Most of the residues produced during the crushing of oil seeds and extraction of oil, are used as
feed and fodder. However, residues such as the husk of the oil seed can be used for different
purposes and in different forms. In its primary form, it can be used as fuel in bioenergy plants, as
well as for residential heating needs. In Greece and especially in Northern Greece there are several
farmers or producers that prefer to use this type of biomass for heating purposes. However, due to
technical problems when combusting it and its high logistic costs, sometimes this type of biomass
must be transformed in different forms, like pellets. Because of the density of pellets, this format
of biomass is much more easily transported or treated, thus leading not only to the reduction of
the transportation costs but also it opens new markets for this kind of biomass.
6.2.3 Market developments
As it was abovementioned, the use of the husk that is annually produced in pellet form can help in
the development of new markets for these by-products. These residues can be used for heat or
electricity production. An indicative example consists a 1 MWe CHP plant in Greece (Biomasud plus,
2016) that uses residues from cotton seed as raw material to produce energy. Furthermore, pellets

D6.2.2 Country report Greece 58
Document:
D6.2.2 Basic analysis of targeted agricultural sectors – Country report Greece
Author:
Refere
R
Re
Re
CERTH Version: Final
Reference: AGROinLOG D6.2 Date: 29/05/18
coming from seed residues such as husks are sold in the fossil fuel markets as fuel for residential
heating.
6.2.4 Non-technical barriers
The limited amount of seed cultivations in Greece along with the skepticism of Greek residents
regarding the consumption of agro-residues as fuels in their houses instead of the “known” fossil
fuels may create barriers for the current sector. The scarcity of available data and lack of
communication among the stakeholder involved in the value chain makes it difficult to identify any
further barriers.

D6.2.2 Country report Greece 59
Document:
D6.2.2 Basic analysis of targeted agricultural sectors – Country report Greece
Author:
Refere
R
Re
Re
CERTH Version: Final
Reference: AGROinLOG D6.2 Date: 29/05/18
7 SUMMARY ANALYSIS OF THE COUNTRY
Table 29. Summary sector “Olive Oil Mills”
Olive Oil Sector
Profile
Production The main input product in this section is the fruit of the olive tree.
In Greece there are two main types of olive oil mills:
a) two-phase centrifugal mills and
b) three-phase centrifugal mills
Greek olive oil mills mostly use two-phase technology (60 %) rather
than the three-phase technology (40 %).
Olive mills’ residues (pomace) are sent to pomace mills for pomace
oil extraction and other by-products.
Volume of the sector Greek annual production ranges from 300,000 to over 400,000 t of
olive oil per year. In 2014, the production of olive oil was at 241,400
t.
Total cultivated area in Greece is around 0.8 million hectares of olive
groves.
The value of the produced olive oil is estimated at 800 M€ and
contributes at 0.4 % of the national GDP (2010-2015). The recent
years, the sector contributes more than 0.4 % of the GDP.
31.2 % of the total olive oil produced in Greece comes from
Peloponnese, 24.8 % from Western Greece and 24.1 % from Crete.
2,500 olive mills, 35 pomace mills in Greece, 7 large scale and 3-4
small scale oil refineries. 36.5 % of olive mills in Peloponnese, 23.3
% of olive mills in Crete.
State of the sector Only the 27 % of the Greek olive oil is distributed for domestic
consumption and the rest (70 %) is exported (100,000 to 135,000 t).
The total sales for economic year 2014 amounted to 832.7 million
euros, 16.2 million euros lower than the previous year.
After the historical low productivities/ sales of olive oil of years
2011-2014, current year (2017) has increased productions and
sales.
Typical size of the
companies
In Greece, olive mills are mostly owned by cooperatives controlled
by farm owners.
An average capacity for a typical Greek olive oil mill ranges between
200-230 t of olive oil production per year. A typical pomace mill has
a capacity to treat 450-500 t of pomace/day.
Around 15,000 seasonal workers in olive mills. Around 210
permanent workers and 875 seasonal workers in pomace mills.

D6.2.2 Country report Greece 60
Document:
D6.2.2 Basic analysis of targeted agricultural sectors – Country report Greece
Author:
Refere
R
Re
Re
CERTH Version: Final
Reference: AGROinLOG D6.2 Date: 29/05/18
Around 140,000 seasonal workers in farming and harvesting
activities of olives.
Distinctive facilities
of the sector
Operation from September to March for olive and pomace mills.
Pomace mills larger than olive mills and more sophisticated. Better
candidates for IBLC implementation. Several facilities could be
available for implementing IBLC concept such as dryers, centrifuges
and storage areas.
Facilities could be exploited in idle times with other raw material as
alfalfa, clover etc., however additional equipment is needed.
Degree of innovation In Greece there is a tendency to change the three-phase to two-
phase centrifugation as it is eco-friendlier and due to national
legislation.
Sector trying to keep up with the state-of-art technologies.
However, R&D activities are performed by the minority of
companies. Pomace mills are absent from national development
and funding schemes.
Opportunities for IBLCs
Sector related
residues
Three-phase annual productions→ Olive Pomace: 314.2 kt, Olive Oil
Waste Water: 345-440 Ml (year 2014 estimations).
Two-phase annual productions→ Olive Pomace: 754 kt, Olive Oil
Waste Water: 0 (year 2014 estimations).
Greece produced 14 kt pomace oil, 135 kt exhausted olive cake
available in the market (year 2014 estimations).
Estimated olive pruning production: 1.13-1.72 dry Mt.
Olive stones.
Olive leaves.
Potential synergies &
benefits
Several treatment options are proposed in order to improve the
decontamination efficiency of the OMWW.
Synergies with olive prunings, exhausted olive cake are feasible.
Market
developments
Exhausted olive cake and olive stones can be sold in solid fuel
market.
Phenols from exhausted olive cake (and leaves) can be used in
pharmaceutics industry, food industry.
Exhausted olive cake can be used in animal feed industries as well
as the biogas industry.
Reuse of OMMW as fertiliser due to the organic matter and
nutrients contained that could improve arid soils.
Olive prunings can find various applications such as production of
pellets, particle boards or as fuel in power plants.
Non-technical
barriers
Unwillingness of Greek citizens to have the pomace mills continue
their operations during their idle times. They are unhappy with the

D6.2.2 Country report Greece 61
Document:
D6.2.2 Basic analysis of targeted agricultural sectors – Country report Greece
Author:
Refere
R
Re
Re
CERTH Version: Final
Reference: AGROinLOG D6.2 Date: 29/05/18
existing pomace mills facilities when operating due to odours and
smoke (optical disturbance).
Pomace mills are absent of national funding schemes, thus lack of
funds for implementing new business concepts.
Difficulty of the solid fuel market to absorb exhausted olive cake as
fuel for residential heating due to intense odours.
The production of olives and pomace as well, is climate-dependent.
As a result, technologies for exploiting by-products and residues of
the oil production process have not been yet developed.
Table 30. Summary sector “Sugar Industry”
Sugar Industry
Profile
Production In Greece, sugar is produced primarily from sugar beet.
A tonne of sugar beet yields on average 17 % of its mass in sugar.
Most of the by-products (molasses, sugar beet) are used in feed
and fodder.
Volume of the sector HSI (Hellenic Sugar Industry) is the only sugar producer in Greece.
In 2014, 53.4 kt sugar were produced from 2,360 beet growers.
Total cultivated land (2014): 7,400 ha.
The EU has put a production limit at 158,702 t of sugar/ year.
Intense fluctuation of the sugar production due to the unstable
number of beet growers.
State of the sector In 2014, the annual turnover amounted to 90.6 M€ with an annual
sugar production of 53,400 t.
The economic strength of the industry continuously decreasing
due to low production (lowest in years) and the high production
costs.
Farmers prefer other intensive crops (cotton, corn, sunflower,
etc.), which (mainly cotton) enjoy higher subsidies from beet-
growing.
According to the stakeholder the current year (2017) is the worst
year regarding production of sugar and the market value of sugar
for the last production year is only at 315 €/t.
Typical size of the companies
Two sugar factories are still in use: i) Plati factory with capacity
outputs around 100,000 t of sugar per year and ii) Orestias factory
with capacity outputs around 60,000 t of sugar per year.
A third sugar factory in Serres (Northern Greece) with suspended
operation. Every year the board of HSI decides whether it will
work.

D6.2.2 Country report Greece 62
Document:
D6.2.2 Basic analysis of targeted agricultural sectors – Country report Greece
Author:
Refere
R
Re
Re
CERTH Version: Final
Reference: AGROinLOG D6.2 Date: 29/05/18
Distribution Network unit in Larisa (Thessaly region) with a beet
gathering area and packaging unit.
In the factories of the Hellenic Sugar Industry are employed 220
people and around 280 more employees in the two subsidiaries
companies in Serbia. The workforce is doubled during the
production months (September to January) by hiring seasonal
employees.
Distinctive facilities of the sector
Operation from September to January. Many times the campaign
starts from August. The rest of the year, maintenance of the
equipment and facilities are carried out in order for the facilities
to be ready and deal with the next import of products.
Several idle equipment to implement IBLC concept such as storage
areas, feed handling, evaporators, dryers, pelletizers.
Current sugar factories operate with HACCP, attention is needed
to the raw material that will be used in the idle equipment (food
safety).
Degree of innovation Research for the genetic improvement and creation of new sugar beet varieties acclimatized to the agro-climatic peculiarities of Greece.
Due to the economic crisis, investments on innovation are minimal.
Opportunities for IBLCs
Sector related residues
Molasses: 2-4 % of beet production.
Sugar-beet pulp pellets: 2-4 % of beet production.
Estimated annual beet production for the year 2013 around to
1,411,840 tMolasses: 19.5 kt/year, Sugar beet pellets: 28.2
kt/year, Fresh pulp: 24.8 kt/year, Beet Leaves: 562.5 kt/year.
Potential synergies & benefits
All the by-products resulting from the production of sugar cover the needs of industries and cattle-breeders in the internal market.
Molasses are used as a raw material to produce alcohol, yeasts and cattle feed. Sugar beet pulp pellets used as cattle feed.
Market developments
Current by-products are used mainly in animal feed.
Molasses can be used as feedstock for ethanol production or
biogas.
Non-technical barriers
The current state of the sector is at bad weather (lowest production in recent years).
The economic crisis makes it difficult for investments to be performed.

D6.2.2 Country report Greece 63
Document:
D6.2.2 Basic analysis of targeted agricultural sectors – Country report Greece
Author:
Refere
R
Re
Re
CERTH Version: Final
Reference: AGROinLOG D6.2 Date: 29/05/18
Table 31. Summary sector “Wine”
Wine sector
Profile
Production The primary feedstock for the wine production is grapes and the end
products are wines of different variety.
The main by-products (grape marc) from the winemaking procedure
are used as raw material for the distillery process or vinegar
production.
Volume of the sector In the wine-growing period of 2015-2016 the total wine production
was 2,458,421 hl, 745,809 hl were red wine and the rest 1,712,432
hl were white wine.
For the period 2015-2016 the total cultivated area was 62,723
hectares.
The wine sector in Greece is estimated to consist of 1,100 wineries,
40 cooperatives and around 100 distilleries producing more than
7,000 labels.
Greece produces 34 PDO (Protected Destination of Origin) labels
and 120 PGI (Protected Geographical Indication) labels.
29.3% of the wine production comes from the region of
Peloponnese while 20.16 % of the wine production comes from
Attica and Central Greece.
State of the sector The annual turnover for the 2017 economic year was 380 M€.
In 2015-2016 the imports of wine were estimated at 33,863,007 €
while the exports were 73,700,095 €.
Typical size of the
companies
Total annual production capacity of the biggest winery in Greece
reaches 2 million litres.
Around 24,300 permanent workers are employed in the whole wine
sector.
Distinctive facilities
of the sector
Operation from October to February. The rest of the year, the
facilities operate for the marketing of the wines (packaging, bottling
and trade).
Due to the complexity of process, perhaps equipment such as
centrifuges, distillation columns and storage facilities can find
further application.
Degree of innovation Typical wineries do not operate with the state of the art machinery
but they are trying to catch up with the latest developed
technologies. Large wineries use the state of the art technology.
Due to economic crisis, the sector does not invest much on
innovation during last years.

D6.2.2 Country report Greece 64
Document:
D6.2.2 Basic analysis of targeted agricultural sectors – Country report Greece
Author:
Refere
R
Re
Re
CERTH Version: Final
Reference: AGROinLOG D6.2 Date: 29/05/18
Opportunities for IBLCs
Sector related
residues
The main solid by-products and residues from the winery
production are grape stalk, grape marc, wine lees and winery sludge
(biosolids).
Moreover, vineyard prunings consist a potential residue for the
wine sector as well as the wastewaters coming from cleaning and
wine production processes.
Estimated annual by-products for 2015-2016:
o Grape stalks → 8.8 kt
o Grape marc → 35.4 kt
o Grape lees → 14.7 kt
o Wastewater → 487 Ml
o Estimated wine pruning production: 93-566 dry kt
Leaves from vines.
Potential synergies &
benefits
Use the wastes from wine distilleries as feedstock to produce
platform chemicals, biofuels, and energy and fertiliser.
Market
developments
Winery wastes can be used as feedstock to produce platform
chemicals such as lactic acid, extract polyphenols (e.g. resveratrol)
to be used in cosmetics, biofuels including ethanol, enzymes,
chemical intermediates, and energy through pyrolysis and
anaerobic digestion.
Grape marc can be used as fertilizer.
Vine prunings can be used as feedstock for energy plants or solid
biofuels (pellets).
Non-technical
barriers
Economic crisis has isolated companies for expanding their business
plans.
Lack of knowledge for exploiting agro-residues.
Table 32. Summary sector “Grain Chain”
Grain Chain Sector
Profile
Production The most important grains that are cultivated in Greece are wheat,
both soft and durum, barley, oats, rye and maize.
By-products potentially suitable as biomass feedstock are
generated during grain production, as well as during grain
processing by industries.
Volume of the sector The annual cereal production for the period 2015/2016 in Greece
was 3,183,756 t.
The cultivated area of cereals in Greece is 926,965 hectares.
Total imports for 2015-2016: 1,706,355 t.
Total exports for 2015-2016: 243,817 t.

D6.2.2 Country report Greece 65
Document:
D6.2.2 Basic analysis of targeted agricultural sectors – Country report Greece
Author:
Refere
R
Re
Re
CERTH Version: Final
Reference: AGROinLOG D6.2 Date: 29/05/18
State of the sector The annual turnover for the year 2014 was 343,164 k€
Greek grain sector has a decline during the last years due to the low
profit margins and the economic crisis that Greece is facing with.
Typical size of the companies
Around 800 flour mills and industries in Greece that produce and
trade flour.
According to stakeholder feedback, around 3,000 permanent and
seasonal employees, apart from the grain farmers, can be found in
the whole grain chain sector.
The largest mill in Greece has a market share of 25 %.
Distinctive facilities of the sector
Operation during the whole year.
Facilities like silos can be used to store different feedstock (e.g.
wood chips) when there is availability.
Degree of innovation Sector invests in waste-management for zero-waste strategies.
Large companies exploit the produced residues to cover own energy needs.
Companies in the grain sector invest in technologies in order to be able to produce “functional” products, meaning products with better quality, with no diseases, without gluten etc.
Opportunities for IBLCs
Sector related residues
Main by-products during crops production: straws, stalks, stubble,
corncobs, bran and husk.
50,000 t of by-products each year produced by a typical cereal
industry in Greece.
Estimated annual agro-residues (2015-2016)
o Soft wheat straw → 352,975 t
o Durum wheat straw → 785,657 t
o Barley straw→ 285,392 t
o Maize stalks→ 1,086,130 t
o Maize cobs→ 411,281 t
o Oats →65,400 t
Potential synergies & benefits
Most agro-residues produced are totally consumed either as animal
feed or for energy exploitation.
Market developments
Straw can be used as raw material for pellets, bio-chemicals or biofuels.
Non-technical barriers
No idle times for the available equipment and the amount of by-
products produced are totally consumed either as animal feed or
for energy exploitation.
Difficult for the farmers to give their agricultural residues (e.g.
straw) to the IBLC as they incorporate them on their fields, adding
organic matter to the soil. A synergy must be established between
the grain farmers and the IBLC/ end user in order for the farmers to

D6.2.2 Country report Greece 66
Document:
D6.2.2 Basic analysis of targeted agricultural sectors – Country report Greece
Author:
Refere
R
Re
Re
CERTH Version: Final
Reference: AGROinLOG D6.2 Date: 29/05/18
get something in exchange of the agro-residues, e.g. money to buy
bacteria/ materials to increase the organic matter of their soils.
Table 33. Summary sector "Vegetable Oil Extraction"
Vegetable Oil Extraction
Profile
Production Vegetable oil is extracted from various primary feedstock like cotton
seeds, soya, sunflower, etc.
Vegetable oil is used for edible use or for the production of
biodiesel.
Apart from vegetable oils, other products derive from these crops
like seeds and fats that are used in animal feed.
Volume of the sector In 2014 around 132 kt of vegetable oil was produced.
In 2015 around 143 kt of vegetable oil was produced.
In 2016 the production fell at 136 kt of vegetable oil.
Three large scale vegetable oil extraction industries in Greece and
some few more small-scale industries.
State of the sector The vegetable oil sector in Greece is relatively small compared to other EU countries.
For the last three years the sector can be characterized as stable.
Typical size of the companies
A Greek company that produces cotton oil has an annual production
of 2,000 t seed oil.
A typical vegetable oil company can operate 300-400 t of seeds/
day.
Distinctive facilities of the sector
Operation from September to April. If feedstock is imported, the
facility may operate all year.
Some equipment similar to the olive oil sector.
Centrifuges, storage facilities, crushers can find various applications.
Degree of innovation The vegetable oil extraction units use a simple technology,
compared to pomace mills. No special R&D activities are performed
on the vegetable oil sector in Greece.
Opportunities for IBLCs
Sector related residues
The primary use of vegetable proteins is that of animal feed.
Seed residues from crushing (2016):
o groundnut →6 kt
o soya →268 kt
o rape → 7 kt
o sunflower → 48 kt
o cottonseed →116 kt
o maize→ 5 kt
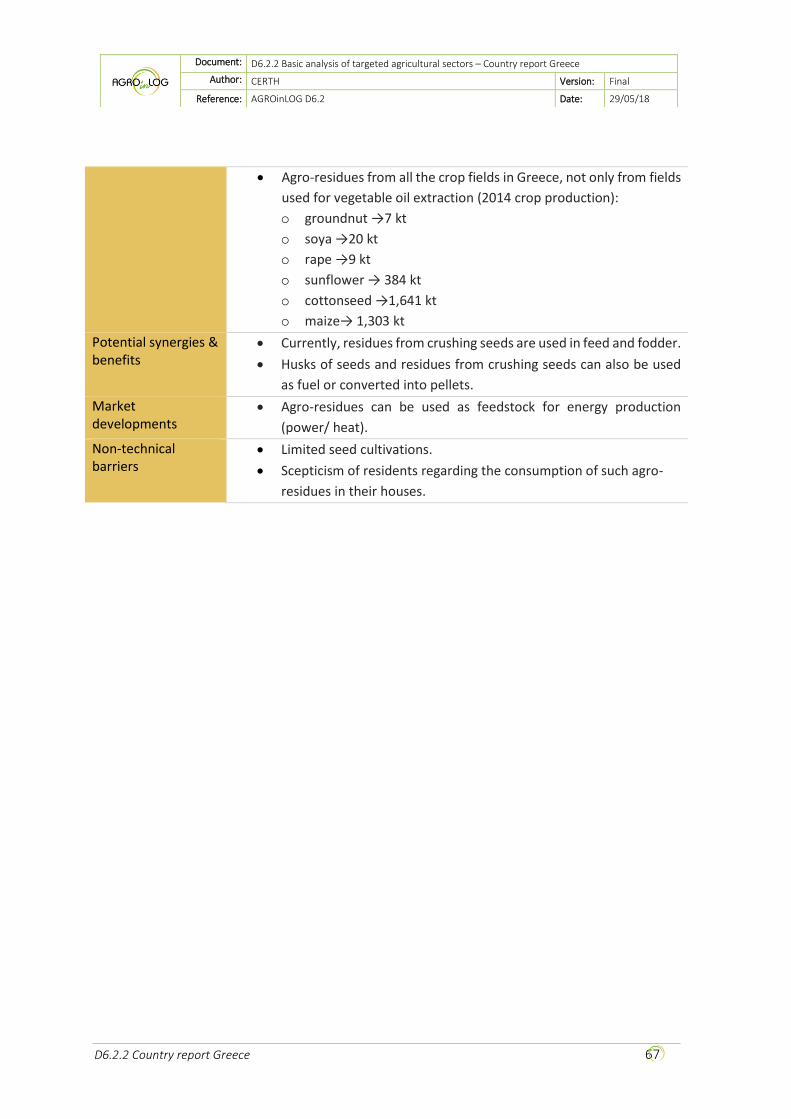
D6.2.2 Country report Greece 67
Document:
D6.2.2 Basic analysis of targeted agricultural sectors – Country report Greece
Author:
Refere
R
Re
Re
CERTH Version: Final
Reference: AGROinLOG D6.2 Date: 29/05/18
Agro-residues from all the crop fields in Greece, not only from fields
used for vegetable oil extraction (2014 crop production):
o groundnut →7 kt
o soya →20 kt
o rape →9 kt
o sunflower → 384 kt
o cottonseed →1,641 kt
o maize→ 1,303 kt
Potential synergies & benefits
Currently, residues from crushing seeds are used in feed and fodder.
Husks of seeds and residues from crushing seeds can also be used
as fuel or converted into pellets.
Market developments
Agro-residues can be used as feedstock for energy production
(power/ heat).
Non-technical barriers
Limited seed cultivations.
Scepticism of residents regarding the consumption of such agro-
residues in their houses.

D6.2.2 Country report Greece 68
Document:
D6.2.2 Basic analysis of targeted agricultural sectors – Country report Greece
Author:
Refere
R
Re
Re
CERTH Version: Final
Reference: AGROinLOG D6.2 Date: 29/05/18
8 REFERENCES
AGROENERGY, 2017. Utilization of over-produced, residual and olive oil wastes. Available online at:
http://www.agroenergy.gr/node/242 (Accessed at 20/12/2017).
Alburquerque, J., J. Gonzálvez, D. Garcıa and J. Cegarra, 2004. Agrochemical characterisation of
“alperujo”, a solid by-product of the two-phase centrifugation method for olive oil extraction.
Bioresource technology, Vol. 91, No.2, pp.195-200.
AOCS Lipid Library, 2017. Available online at:
http://www.lipidlibrary.aocs.org/OilsFats/content.cfm?ItemNumber=40333 (Accessed at
20/11/2017).
Apostolakis M, Sooter C, 1987. The biomass potential from agricultural and forest residues. ELKEPA.
In Greek.
ATTIKA E. C.B.O.,2012. Report of the Olive Oil – Pomace Oil sector in Greece.
Biomasud Plus, H2020 project. Developing the sustainable market of residential Mediterranean
solid biofuels. Available online at: http://www.biomasudplus.eu/enGB/ (Accessed at 20/11/2017).
Biomasud Plus, 2016. DLV 2.1. Residential heating biofuels market state of the art. Report of
Greece. Available online at: http://biomasudplus.eu/wp-content/uploads/2017/09/D2.1-
Market_report_Consolitated-6.pdf (Accessed at 20/11/2017).
Corona Giuseppe, Giulia Nicoletti, 2010. Renewable energy from the production residues of
vineyards and wine: evaluation of a business case. New Medit, Vol. 9, No.4, pp. 41-47.
Dang Khanh, Nguyen Hong Thanh, 2010. Management of Agricultural Waste and potential for
cobenefits. Presentation. Available online at:
http://www.iges.or.jp/en/archive/wmr/pdf/activity100728/15KhanhDay1Session5.pdf (Accessed
at 20/10/2017)
ELSTAT (Hellenic Statistical Authority), 2013. Development of detailed statistics on Energy
consumption in households-2011/2012: Quality report. Grant Agreement Eurostat n°
30304.2010.002-2010.373. Available online at:
http://www.ec.europa.eu/eurostat/cros/system/files/SECH_final_report_Greece.pdf (Accessed at
20/11/2017).
ELSTAT (Hellenic Statistical Authority), 2014. Industrial plants. Areas and production by Region and
Regional Units.
ELSTAT (Hellenic Statistical Authority), 2014. Production of other by-products, by Region and
Regional Unit.

D6.2.2 Country report Greece 69
Document:
D6.2.2 Basic analysis of targeted agricultural sectors – Country report Greece
Author:
Refere
R
Re
Re
CERTH Version: Final
Reference: AGROinLOG D6.2 Date: 29/05/18
ELSTAT (Hellenic Statistical Authority), 2015. Agriculture Statistics. Available online at:
http://www.statistics.gr/documents/20181/1800d348-ef0f-45da-9816-d187b54c387c. (Accessed
at 20/10/2017).
ELSTAT (Hellenic Statistical Authority), 2015. PRESS RELEASE. VINEYARD SURVEY. Available online
at: http://www.statistics.gr/documents/20181/568433a5-0e7b-4b45-aa3e-b7d12b03e41e
(Accessed at 20/10/2017).
EU legislation, 2004. Common organisation of the market in olive oil and table olives. Available
online at: https://eur-lex.europa.eu/legal-
content/EN/TXT/HTML/?uri=LEGISSUM:l11090&from=EN (Accessed at 7/5/18).
Eurostat, 2014. Agricultural Products Crops, olives for oil. Available online at:
http://ec.europa.eu/eurostat/statistics-explained/index.php/Agricultural_production_-
_crops#Olives (Accessed at 20/10/17).
European Commission, 2017. Agriculture and rural development, cotton. Available online at:
https://ec.europa.eu/agriculture/cotton_en (Accessed at 7/5/18).
Fediol, 2016. Available online at: http://www.fediol.be (Accessed at 15/10/2017).
Fernández-Bolaños, J., G. Rodríguez, R. Rodríguez, R. Guillén & A. Jiménez, 2006. Extraction of
interesting organic compounds from olive oil waste. Grasas y Aceites, Vol.57, No.1, pp.95-106.
Food info. The steps of winemaking. Available online at: http://www.food-
info.net/uk/products/wine/prod.htm (Accessed at 15/10/2017).
Giovanni Di Nicola, Eleonora Santecchia, Giulio Santori and Fabio Polonara, 2011. Advances in the
Development of Bioethanol: A Review. Biofuel's Engineering Process Technology.
Greek Flour Millers Association. Available online at: http://www.flourmillers.gr/en/production-
process, (Accessed at 20/9/2017).
Günther Fischer, Eva Hizsnyik, Sylvia Prieler, Harrij van Velthuizen, 2007. Assessment of biomass
potentials for biofuel feedstock production in Europe: Methodology and results.
Hellenic Sugar Industry, 2009. General company information. Available online at:
http://www.ebz.gr/profile_en.htm (Accessed at 15/10/2017).
Hellenic Sugar Industry, 2009. Industrial production. Available online at:
http://www.ebz.gr/profile_en.htm (Accessed at 15/10/2017).
Hellenic Sugar Industry, 2009. Main activities. Available online at:
http://www.ebz.gr/profile_en.htm (Accessed at 15/10/2017).
Hellenic Sugar Industry, 2009. Products. Available online at: http://www.ebz.gr/profile_en.htm
(Accessed at 15/10/2017).
ICAP Group, 2011. Sector analysis for olive oil and pomace oil in Greece.
ICAP Group, 2013. Sector analysis for Vegetable oil –Margarine in Greece.

D6.2.2 Country report Greece 70
Document:
D6.2.2 Basic analysis of targeted agricultural sectors – Country report Greece
Author:
Refere
R
Re
Re
CERTH Version: Final
Reference: AGROinLOG D6.2 Date: 29/05/18
inr.gr, 2014. Economic Data for industries in the olive sector. Available online at:
http://www.inr.gr/?p=a2097 . (Accessed at 20/10/2017)
inr.gr, 2014. Economic Data for industries in the vine sector. Available online at:
http://www.inr.gr/?p=a1075 . (Accessed at 20/10/2017).
inr.gr, 2014. Economic Data for industries in the grain sector. Available online at:
http://www.inr.gr/?p=a1076 (Accessed at 5/10/2017).
International Olive Council (IOC), Designations and definitions of olive oils. Available online at:
www.internationaloliveoil.org/estaticos/view/83-designations-and-definitions-of-olive-oils
(Accessed at 10/10/2017).
International Olive Council (IOC), 2006. QUALITY MANAGEMENT GUIDE FOR THE OLIVE OIL
INDUSTRY: OLIVE OIL MILLS. Available online at:
www.internationaloliveoil.org/estaticos/view/222-standards. (Accessed at 7/5/2018).
KEOSOE. Annual wine production. Available online at:
https://www.keosoe.gr/statistikaelladas/paragogi (Accessed at 15/10/2017).
Lafazanis Winery. Distillery process. Available online at: https://lafazanis.gr/en/distillery/ (Accessed
at 9/10/2017).
Ministerial Decree 198/2013. Solid biofuels for non-industrial use: requirements and testing
methods. Government Gazette Issue Β΄2499/4-10-2013. In Greek.
Ministry of Agriculture, 2016. Production of Grain in Greece for the economic year 2015-2016.
Available online at:
http://www.minagric.gr/images/stories/docs/agrotis/Dimitriaka/isoz_sitira2015_2016.pdf
(Accessed at 9/10/2017).
MoRE project, 2008. Deliverable 3.1: One joint report for the 5 Regional “state of the art” reports
from each involved area describing the current olive-milling residues market (with a focus on energy
uses. Available online at: http://www.ec.europa.eu/energy/intelligent/projects/sites/iee-
projects/files/projects/documents/m.o.r.e._regional_situation_olive_milling_residues_market_en
.pdf (Accessed at 11/10/2017).
National Bank of Greece, 2015. Report on Olive Oil: Establishing the Greek brand.
Oliveira Margarida, Duarte Elizabeth, 2014. Integrated approach to winery waste: waste generation
and data consolidation. Frontiers of Environmental Science & Engineering 10, (1)
OECD, Organisation For Economic Co-Operation and Development, 2004. Biomass and Agriculture:
Sustainability, Markets and Policies. pp. 366-368.
Poonam Singh nee; Nigam, Ashok Pandey, 2009. Biotechnology for Agro-Industrial Residues
Utilisation. Springer.
Prodosol, 2009. Waste management of the Olive Oil Wastes. Available online at:
http://www.prosodol.gr/?q=node/211 (Accessed at 10/10/2017).

D6.2.2 Country report Greece 71
Document:
D6.2.2 Basic analysis of targeted agricultural sectors – Country report Greece
Author:
Refere
R
Re
Re
CERTH Version: Final
Reference: AGROinLOG D6.2 Date: 29/05/18
Prodosol, 2009. Statistic Data for Greece. Available online at:
http://www.prosodol.gr/sites/prosodol.gr/files/Statistics%20for%20Greece_0.pdf (Accessed at
7/10/2017).
Recchia, L., M. Daou, M. Rimediotti, E. Cini and M. Vieri, 2009. New shredding machine for recycling
pruning residuals. Biomass and Bioenergy, Vol.33, No.1, pp.149-154.
Rodero, P., Esteban L., 2017. The olive oil industry: Main by-products and their characteristics as
fuels. Presentation from the Biomasud project (SOE2/P2/E414).
Sandra Pedisić, Zoran Zorić, Zdenka Pelaić, Verica Dragović-Uzelac, 2015. Wine industry by-
products: Polyphenols and antioxidant activity of grape seed extracts. Available online at:
http://www.bioactive--winewaste.com.
Soya Mills. Available online at: https://www.soya-mills.gr/en/. (Accessed at 7/10/2017).
Stephanie Searle and Chris Malins, 2013. Availability of Cellulosic residues and wastes in the EU.
The International Council on Clean Transportation.
S2Biom, FP7 project. Biomass Supply Tool. Available online at:
http://s2biom.alterra.wur.nl/web/guest/biomass-supply.
Tataridis P., Nerantzis E.T., 2006. Integrated Enology-Utilization of winery by-products into high
added value products. e-Journal of Science & Technology (e-JST). Vol.1, No.3, pp.79-89.
Tsagaraki E., Harris N. Lazarides and Konstantinos B. Petrotos, 2005. Chapter 8: Olive Mill
Wastewater Treatment. Utilization of By-Products and Treatment of Waste in the Food Industry,
Springer, pp. 133-157.
Up_running, H2020 Project. Take-off for sustainable supply of woody biomass from agrarian
pruning and plantation removal. Available online at: http://www.up-running.eu/.
Zacharof, M.-P., 2016. Grape Winery Waste as Feedstock for Bioconversions: Applying the
Biorefinery Concept. Waste and Biomass Valorization, Vol. 8, Issue 4, p. 1011-1025.

D6.2.2 Country report Greece 72
Document:
D6.2.2 Basic analysis of targeted agricultural sectors – Country report Greece
Author:
Refere
R
Re
Re
CERTH Version: Final
Reference: AGROinLOG D6.2 Date: 29/05/18
9 ANNEX A. CONSULTED STAKEHOLDERS
The following stakeholders were consulted:
the executive director of KEOSOE (Central Cooperative Union of Wine Products) for the
wine sector,
the president of SPEL (Association of Olive Kernel Oil Producers of Greece), who provided
data for the pomace mills as well as for the olive oil sector,
the quality assurance manager of ELSAP S.A. (pomace mill in Nafplio, Southern Greece) who
provided data on pomace mills as well as for the olive oil sector,
the president of Agricultural Cooperative of Loukision (Central Greece) and owner of an
olive mill,
the president of Agricultural Cooperative of Agios Konstantinos (Central Greece), who
provided data for the olive oil sector,
the agronomist of LOULIS MILLS S.A., one of the most important Greek company in the
grain chain sector,
the president of AIXMEAS Agricultural Cooperative (Central Greece) who provided data for
the grain sector,
the representative of the Hellenic Sugar Industry who provided a clearer picture of the
current state of the sugar sector in Greece and ,
the financial manager of NUTRIA, an olive oil refinery plant that produces standardized
olive oil, pomace oil and seed oils, who provided information on the vegetable oil extraction
sector
Copyright © 2022 FDOKUMEN