Prevalence of wide area impacts downwind of freeways under pre-sunrise stable atmospheric conditions
49
Prevalence of Wide Area Impacts Downwind of Freeways under Pre-sunrise Stable Atmospheric Conditions Wonsik Choi a , Meilu He a,e , Vincent Barbesant b , Kathleen H. Kozawa c , Steve Mara c , Arthur M. Winer d , and Suzanne E. Paulson a* a Department of Atmospheric and Oceanic Sciences, 405 Hilgard Ave., University of California, Los Angeles, CA 90095-1565, USA. Email: [email protected], [email protected], [email protected]. b Department of Mechanics, Ecole Polytechnique, 91128 Palaiseau Cedex, France. Email: [email protected] c Research Division, California Air Resources Board, 1001 I St., Sacramento, CA 95814, USA. Email: [email protected], [email protected]. d Environmental Health Sciences Department, School of Public Health, 650 Charles E. Young Drive South, University of California, Los Angeles, CA 90095-1772, USA. Email: [email protected]. e Now at: Department of Mechanical and Aeronautical Engineering, Clarkson University, Potsdam, NY, USA Atmospheric Environment Revised: July 19, 2012 1
-
Upload
independent -
Category
Documents
-
view
3 -
download
0
Transcript of Prevalence of wide area impacts downwind of freeways under pre-sunrise stable atmospheric conditions

Prevalence of Wide Area Impacts Downwind of Freewaysunder Pre-sunrise Stable Atmospheric Conditions
Wonsik Choia, Meilu Hea,e, Vincent Barbesantb, Kathleen H. Kozawac,Steve Marac, Arthur M. Winerd, and Suzanne E. Paulsona*
aDepartment of Atmospheric and Oceanic Sciences, 405 HilgardAve., University of California, Los Angeles, CA 90095-1565, USA.Email: [email protected], [email protected],[email protected] of Mechanics, Ecole Polytechnique, 91128 Palaiseau Cedex, France. Email: [email protected] Division, California Air Resources Board, 1001 I St., Sacramento, CA 95814, USA. Email: [email protected], [email protected] Health Sciences Department, School of Public Health, 650 Charles E. Young Drive South, University of California, Los Angeles, CA 90095-1772, USA. Email: [email protected] at: Department of Mechanical and Aeronautical Engineering, Clarkson University, Potsdam, NY, USA
Atmospheric Environment
Revised: July 19, 2012
1

*Please address correspondence regarding this manuscript to: Suzanne E. Paulson, Department of Atmospheric and Oceanic Sciences, 405 Hilgard Ave., University of California, Los Angeles, CA 90095-1565, USA. Phone: (310)206-4442. Fax: (310)206-5219. Email: [email protected].
2

Abstract
In urban areas, a large fraction of the population typically
lives within 1.5 – 2 km of a freeway. In an earlier study, Hu et
al. (2009) showed that in the pre-sunrise hours, with stable,
nocturnal meteorological conditions, the vehicle-related
pollution from a freeway in southern California extended more
than 2 km downwind. This was in striking contrast to earlier
studies in the U.S. and Australia showing that during the daytime
pollutant concentrations extended no more than ~300 m downwind of
major roadways. The present study was designed to explore the
variability of the large downwind pollutant impact zone observed
by Hu et al. (2009) in the pre-sunrise hours on a wider
geographic scale. An instrumented mobile platform was employed to
measure vehicle-related pollutant concentrations on transects
running upwind and downwind of four freeways in the coastal,
central and eastern areas of the California South Coast Air Basin
(SoCAB) during the pre-sunrise period (04:30-06:30). Extended
freeway plumes were observed for ultrafine particles (UFP),
nitric oxide and particle-bound polycyclic aromatic hydrocarbons
(PAH), at all four sites during stable pre-sunrise periods. Plume
3
1
2
3
4
5
6
7
8
9
10
11
12
13
14
15
16
17
18
19
20

lengths were measured to be ~2 km or more with a dilution rate
coefficient about a factor of ten lower than commonly observed
for daytime. An average of 39 and 19% (±8–9%) of freeway plume
peak concentrations of UFP, respectively remained 500 and 1500 m
downwind from the freeways for the four transects studied here.
Because a large fraction of UFP and other vehicle related
pollutants typically penetrate into indoor environments, and
nocturnal surface inversions are widespread across the globe, our
findings have significant implications for more extensive human
exposures to vehicle-related pollutants than previously indicated
based on daytime measurements of roadway plumes.
Keywords: ultrafine particles; traffic emissions; freeway plume extension; human
exposure; plume decay rates; emissions reduction
1. Introduction
A number of epidemiological studies have shown that exposure
to elevated levels of fresh vehicular emissions causes adverse
human health effects, including asthma, cardiovascular disease,
and adverse birth outcomes (Hoek et al., 2010; Penttinen et al.,
4
1
2
3
4
5
6
7
8
9
10
11
12
13
14
15
16
17
18
19

2001; Pope et al., 2002). Fresh vehicular emissions contain a
wide range of particle- and gas-phase species. Because such
emissions are emitted and diluted together, their individual
impacts are difficult to separate. Ultrafine particles (UFP)
appear to have the potential to be a 'causative agent' in fresh
vehicular emissions responsible for degrading health in a variety
of ways. For example, recent results of a European expert panel
elicitation study on UFP health effects suggested a high
likelihood of an association between UFP exposure and
cardiovascular or respiratory hospital admissions (Hoek et al.,
2010).
As toxicological and epidemiological data related to UFP have
developed, so has instrumentation for high time resolution
monitoring of UFP and related pollutants. UFP are an attractive
tracer for fresh emissions because they typically exhibit the
highest dynamic concentration range of the combustion-related
primary pollutants, a by-product of their short lifetimes
(Capaldo and Pandis, 2001), resulting in a relatively low urban
background.
5
1
2
3
4
5
6
7
8
9
10
11
12
13
14
15
16
17
18
19

The results from these health studies are useful because a
large fraction of households are located near freeways. For
example, Brugge et al. (2007) estimated about 11% of US
households are located within 100 m of 4-lane highways. And, in a
highly urbanized area such as the California South Coast Air
Basin (SoCAB), as much as 50% of the population lives within 1.5
km of freeways (Polidori et al., 2009). For these reasons,
numerous air quality studies have been conducted near major roads
and freeways. Karner et al. (2010) synthesized the findings from
41 near-roadway monitoring studies published between 1978 and
2008. The studies collectively examined concentration–distance
relationships for 14 pollutants with experiments conducted during
both daytime and the evening, a period when vigorous atmospheric
turbulence enhances the dilution/dispersion of emitted pollutants
in a relatively deep, unstable convective boundary layer. In
these studies, essentially all pollutants decayed to background
levels 115570 m away from the edge of road. Some pollutants
quickly decreased within 150 m followed by a gradual decay toward
background (CO and UFP number concentrations), another group
decayed consistently throughout the entire distance range
6
1
2
3
4
5
6
7
8
9
10
11
12
13
14
15
16
17
18
19
20

(benzene and NO2), while PM10 and PM2.5 showed no trend with
distance (Karner et al., 2010). The trends all likely resulted
from the interplay between urban background concentrations,
emissions from traffic, other emissions sources, and aerosol size
distribution dynamics.
To date, however, only a small handful of near-roadway studies
have been conducted under the stable nocturnal conditions
generally encountered at night or especially in the early morning
hours before and shortly after sunrise. Under those conditions,
weak turbulence and a stratified boundary layer significantly
suppress dispersion processes, leading to an extension of
freeway/roadway plumes. Zhu et al. (2006) sampled at six fixed
locations within 500 m downwind of a freeway and found that
nighttime number concentrations of UFP ([UFP]) reached 80% of
daytime peak values in West Los Angeles with just 25% of daytime
traffic volumes on the I-405 freeway. To map highly resolved
spatial and temporal variations in [UFP] over longer distances
downwind of a freeway in Santa Monica, California under stable
pre-sunrise conditions, Hu et al. (2009) were the first to report
a much wider impact area of elevated [UFP] (more than 2 km 7
1
2
3
4
5
6
7
8
9
10
11
12
13
14
15
16
17
18
19
20

downwind). However, the generality of this result for other
roadways and locations, as well as the major factors determining
the spatial scales of extended plumes in the early morning near
major roads, remained to be determined.
The objectives of the present study are to: (1) investigate
the generality of the Hu et al. (2009) results; (2) investigate
variability of pollutant plumes under stable meteorological
conditions during the early morning hours in inland and coastal
areas of the SoCAB; (3) identify the major factors contributing
to the extension of freeway plumes in the pre-sunrise period; and
(4) assess how freshly-emitted UFP evolve in their
characteristics during transport downwind. The present paper
focuses on objectives (1) and (2) while a separate paper will
discuss objectives (3) and (4).
2. Methods
2.1 Sampling areas and transects
For the pre-sunrise measurements, four sampling routes
("transects") were chosen, each aligned as close to perpendicular
8
1
2
3
4
5
6
7
8
9
10
11
12
13
14
15
16
17
18
19

as possible to straight sections of freeway. They were
themselves roughly perpendicular to prevailing winds, and away
from interchanges with other freeways or major arterials. Each
transect followed quiet, residential streets as much as possible.
None of the chosen transects had direct freeway access, which
greatly reduces interference from local high-emitting vehicles.
Locations were chosen perpendicular to: the 101 freeway in
Downtown Los Angeles (DoLA), the 91 freeway in Paramount, the I-
110 freeway in Carson, and the I-210 in Claremont (Fig. 1). DoLA
is highly urbanized area, Paramount and West Carson are semi-
urban, and Claremont is a suburban inland area at the foot of the
San Gabriel Mountains.
The DoLA transect, near downtown Los Angeles, along N.
Coronado St. is a small two lane street, and runs north–south in
direction. The entire upwind and first 1500m of downwind area is
residential. The farthest 1500–2200 m on the downwind side
traverses a commercial district with tall buildings. The
Paramount transect is located 11 km from the coast in a flat area
of the coastal plain and is surrounded entirely by residential
areas. The Carson transect is also on the coastal plain, ~ 6 km
9
1
2
3
4
5
6
7
8
9
10
11
12
13
14
15
16
17
18
19
20

northwest of the Ports of Los Angeles and Long Beach. The
transect is mostly surrounded by residential areas, but the
upwind and downwind ends (> 850 m from the freeway) are adjacent
to industrial/commercial areas. We did not find evidence of
pollutant emissions from these industrial areas in our
measurements as would be expected particularly in the pre-sunrise
hours. Finally, the Claremont transect is located in an inland
valley, ~70 km from the coast at the foot of steeply rising San
Gabriel Mountains, and is entirely surrounded by quiet
residential areas.
The DoLA transect is crossed by several arterial streets
downwind of the freeways: Temple St., Beverly Blvd., 3rd St., 6th
St., and Wilshire Blvd. The Carson, Paramount and Claremont
transects each are crossed by just one or two major streets:
Figueroa St. and Main St. for the Carson transect, Artesia Blvd.
for the Paramount transect, and Foothill Blvd. for the Claremont
transect. However, only small numbers of vehicles were observed
on the cross streets during the pre-sunrise measurement periods.
Nonetheless, to avoid possible interference from local vehicular
emissions on these cross streets, data obtained in the vicinity
10
1
2
3
4
5
6
7
8
9
10
11
12
13
14
15
16
17
18
19
20

(several tens meters on the downwind side) of these streets were
excluded from our analyses.
2.2 Instrumentation, sampling, and data analysis
The mobile platform (MP) used in this study, a Toyota RAV4
electric sub-SUV with no pollution of its own, was equipped with
a suite of fast response instruments for various air pollutants.
These included UFP size distributions and number concentrations,
nitric oxide (NO), carbon monoxide (CO), particle-bound
polycyclic aromatic hydrocarbon (PB-PAH), particulate matter with
aerodynamic diameters less than 2.5 m (PM2.5), and black carbon
(BC) (Table 2). Particle and gas instruments (FMPS, CPC, and
DustTrak PM2.5) were calibrated by their respective manufacturers
just before field measurements began. Calibration checks for gas-
instruments were also conducted before each sampling campaign.
Flow and zero checks were conducted on a daily basis. More
detailed information about calibration and flow checks is
available in Hu et al. (2009), Kozawa et al. (2009), and
Westerdahl et al. (2005). Data were recorded using a data-logger
11
1
2
3
4
5
6
7
8
9
10
11
12
13
14
15
16
17
18

(Eurotherm Chessell Graphic DAQ Recorder) with 1 second time
resolution.
Measurements were conducted during the pre-sunrise period
(04:30 – 06:30) for the four transects described above. For the
DoLA, Paramount, and Carson transects, sampling was conducted in
the winter-to-spring seasons (January to March), and for the
Claremont transect, sampling occurred in the transition period
between spring and summer (May to June) in 2011. Of the total 25
measurement days, 5 days of data were excluded in this analysis
due to inconsistent wind directions (e.g., opposite direction to
normal days) or to inclement weather conditions (fog/rain). With
the exception of stop signs and traffic lights, the mobile
platform was driven at consistent speeds (~ 10 to 15 mph) over
each transect.
The instruments employed have different response times due to
the characteristics of the instruments themselves, as well as
differences in inlet length and flow rates. Furthermore, response
times sometimes varied slightly from day to day. To account for
any differences, measurement data were synchronized on a daily
12
1
2
3
4
5
6
7
8
9
10
11
12
13
14
15
16
17
18
19

basis using a time-lag correlation method using the equation
below (Eq. 1):
r=1
Tσaσb∫t0
t0+T (a(t)−a ) (b(t+τ)−b)dt Eq. (1)
where a and b are simultaneously measured species, t is time,
is a time-lag applied to time series in b, is the standard
deviation for the two pollutants a and b, and T is the number of
data points in the time-series. For two co emitted vehicle
related pollutants a and b, the instruments for a and b should
respond in concert and be well correlated with each other if the
instrumental response times are identical. The best estimate of
the difference in response time between instruments due to all
factors combined corresponds to the with the maximum
correlation coefficient. The ultrafine particle number
concentration measured with the CPC or FMPS was used as the
reference because these instruments have the fastest response
times (~1 s), resulting in the clearest and sharpest responses to
vehicular sources. Several smoke tests were also conducted to
measure the response times of instruments from the inlet of the
sampling manifold (Table 2). When the correlation between
13
1
2
3
4
5
6
7
8
9
10
11
12
13
14
15
16
17
18

ultrafine particles and other specific species was poor (usually
because there was no clear freeway peak for a pollutant which was
sometimes the case for the DustTrack PM measurements and
occasionally for other pollutants), averaged smoke test results
were applied to synchronize the instrumental response times.
High emitters encountered on transects confound extraction of
the freeway plume shape and extent, so it is desirable to remove
their signatures from the data. After the measurement data were
synchronized, a running low 25% quantile method was applied to
remove the local impacts of individual high-emission vehicles
encountered on a transect. The window sizes of the running low
25% quantile were 53 s (26 s before and after the center data
point) when the distance from a freeway was farther than 1 km, 31
s (15 s before and after) for distances from a freeway between
300 m to 1 km, and 3 s (1 s before and after) within 300 m of a
freeway. This method successfully removed the short-lived,
individual, local, high- emitting vehicle effects without
altering remaining data. We additionally examined any remaining
local effects, particularly near freeways, by reviewing video and
14
1
2
3
4
5
6
7
8
9
10
11
12
13
14
15
16
17
18
19

audio records to verify proximity of high emitting vehicles
before removing corresponding data.
Distances from the freeways were computed using the mobile
platform position data recorded every second by a Garmin GPSMAP
and the latitude/longitude information of the center of freeway
obtained from Google Earth software. Traffic flow data were
collected for the 101 (DoLA), 91 (Paramount), I-110 (Carson), and
I-210 (Claremont) freeways from the Freeway Performance
Measurement System (PeMS) operated by the Institute of
Transportation at University of California, Berkeley. Data were
obtained from the freeway sensors located 100 m northeast of the
DoLA transect (VDS ID: 717452, 34.075 N/118.273 W), 550 m east
of the Paramount transect (VDS ID: 765467, 33.877 N/118.150 W),
850 m south of the Carson transect (VDS ID:763522, 33.811
N/118.287 W), and 60 m east of the Claremont transect (VDS
ID:767984, 34.120 N/117.728 W).
A balloon tether sonde (SmartTetherTM, Anasphere Inc.) was
used to probe the vertical temperature, humidity and wind
gradients to determine atmospheric stability. Vertical profiles
15
1
2
3
4
5
6
7
8
9
10
11
12
13
14
15
16
17
18
19

(up to ~ 100 m a.g.l.) for temperature, humidity and winds were
obtained on a daily basis (about 30 minutes before the MP
measurements) near the transects (560 m away from the Downtown LA
transect, 1.2 km from the Paramount transect, 3.7 km from the
Carson transect, and 3.8 km from the Claremont transect). It was
not possible to launch the balloon immediately adjacent to the
transects due to air safety regulations (balloon launches are
prohibited within 5 miles of any airport) as well as the
requirement for adequate open space to launch a balloon.
3. Results and Discussions
3.1 Meteorology and traffic flow
Surface meteorological data were collected with a 2D sonic
anemometer and temperature/humidity sensors on the MP (Table 2),
before and after every transect run for ~5 minutes. The averaged
surface meteorology for each transect is summarized in Table 3.
The mean temperature ranged from 8 – 12 C and relative humidity
from 67 – 82 % during the measurement periods. Although the
measurements in Claremont were conducted May through June, the
16
1
2
3
4
5
6
7
8
9
10
11
12
13
14
15
16
17
18
19

mean temperature and humidity were similar to those for other
transects. The daily mean wind speeds were less than 1 ms-1 for
all four transects indicating calm and stable conditions during
the pre-sunrise period.
The usual prevailing wind direction was approximately
perpendicular to the freeway for the DoLA, Paramount, and Carson
transects with mean directions in the 73 – 82 range relative to
the freeways (90 being normal to the freeway orientation). For
the Claremont transect, winds were more askew to the freeway with
a mean direction of 58. Winds for this transect were the least
variable, however, due to the adjacent mountains to the north
which produce a strong, thermally-induced, mountain-valley wind
system.
Static atmospheric stability can be represented with a
vertical potential temperature gradient (d/dz > 0 for stable,
d/dz ~ 0 for neutral, and d/dz < 0 for unstable). During the
measurement periods, d/dz was slightly positive for all
transects representing slightly stable conditions. The vertical
temperature gradient was highest near the Claremont transect
17
1
2
3
4
5
6
7
8
9
10
11
12
13
14
15
16
17
18
19

(1.23 ×10⁻² Km-1) although the differences by location were not
significant.
Mobile platform measurements were conducted during the period
of sharply increasing traffic flow on the freeways due to the
onset of the morning commute. The mean traffic flows on the
freeway in the vicinity of the transects during the measurement
period were 800, 1,000, 630, and 470 vehicles per 5 minutes on
the 101 (DoLA), 91 (Paramount), I-110 (Carson), and I-210
freeways (Claremont), respectively. The fleet mixes on the
transects were not characterized in detail, however they were
not obviously different from one another. Truck flows accounted
for a small fraction of the total traffic flows, falling in a
similar range for all transects (2.4 to 6%, Table 3, PeMS). The
differences in truck contribution should result in moderate
differences in mixed-fleet emission rates for each transect, as
well as between our measurements and those in the liturature.
3.2 Prevalence of a wide UFP impact area downwind of freeways under stable
conditions
18
1
2
3
4
5
6
7
8
9
10
11
12
13
14
15
16
17
18
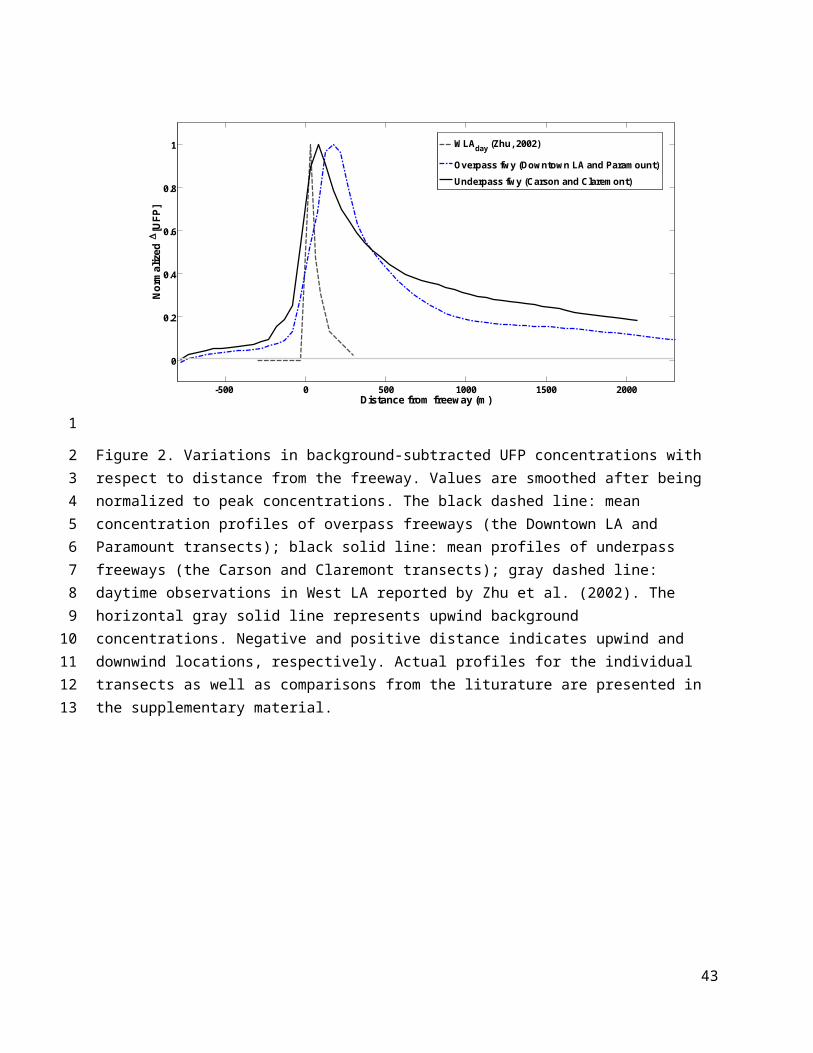
Figures 2 and S1 shows the normalized average profiles of
background-subtracted UFP concentrations with distance from the
freeway. Profiles have been normalized to peak concentrations.
This normalization allows us to clearly see how far downwind
freeway emissions impact adjacent areas and directly compare
decay of freeway plumes.
Interesting features are observed in the variations in UFP
concentrations with distance from freeways. First, significant
extensions of freeway plumes compared to daytime length were
observed at all sites during the pre-sunrise period, an
observation that is consistent with the results reported by Hu et
al. (2009) for Santa Monica. Our results confirm that pre-sunrise
(or nocturnal) extension of freeway plumes far downwind is a
general phenomenon, at least from the coastal plain to the inland
valleys in the SoCAB. Second, in many cases, UFP concentrations
did not return to the upwind background concentrations at 2 km or
more downwind, indicating plume impacts could extend farther than
2 km, although it is difficult to completely rule out potential
influence of local sources at extended distances. In addition, it
appears that UFP concentrations farther than 1 km downwind decay
19
1
2
3
4
5
6
7
8
9
10
11
12
13
14
15
16
17
18
19
20

much more slowly and are often gradually stabilized above the
upwind background concentrations. This observation suggests that
freeway emissions might increase the background concentrations in
the downwind areas by up to 10 – 30% of the peak concentrations
(Fig. 2 and Fig. S1 in the supplementary material).
We note that the Hu et al. (2009) averaged downwind
concentration profile appears to decay more rapidly starting at
~1200 m. We believe the new data presented here are more
representative. The shape of the curve in Hu et al. (2009) was
somewhat influenced by an artifact resulting from averaging
several days with higher concentrations on which the sampling
route extended only 1200 m south of the freeway with several
lower concentration days on which the sampling route was extended
to 2500 m.
3.3 Comparisons of UFP concentrations at various downwind distances between
locations in SoCAB
In Fig. 3, the spatial distributions of UFP number
concentrations with downwind distance from the freeways measured
in 2011 are summarized and compared with those of the previous
20
1
2
3
4
5
6
7
8
9
10
11
12
13
14
15
16
17
18
19

studies conducted in West LA and Santa Monica (Hu et al., 2009b;
Zhu et al., 2002; Zhu et al., 2006). Background upwind UFP
concentrations were low in Claremont (5,300 particlescm-3), and
much higher in the other three areas (15,000, 19,000, and 16,000
particlescm-3 in DoLA, Paramount, and Carson, respectively).
These latter levels are comparable to the winter background level
in Santa Monica in 2008 while the summer background UFP
concentration in Santa Monica (7,000 particlescm-3) was similar
to that of Claremont.
The net UFP due to freeway emissions, [UFP], defined as the
difference between the peak and background concentrations (the
concentration measured on the upwind portion of the transect),
also varied significantly by location. In this study, [UFP]
values were 1.9, 4.0, 4.1, and 2.7×10⁴ particlescm-3 in DoLA,
Paramount, Carson, and Claremont, respectively, which are
comparable to the summer season value in Santa Monica in 2008
(3.5×10⁴ particlescm-3; Hu et al., 2009) and 2–4 times lower than
the winter season Santa Monica value (7.9×10⁴ particlescm-3; Hu
et al., 2009). Nighttime [UFP] in West LA in 2005 reported by Zhu
et al. (2006) was about 3–5 times higher (1.1×10⁵ particlescm-3).
21
1
2
3
4
5
6
7
8
9
10
11
12
13
14
15
16
17
18
19
20

These differences are likely to be attributable to both
differences in traffic flows, vehicle fleet mix and resulting
emission rates on the freeways as well as differences in freeway
geography and orientation (discussed below).
The relationship between the daily [UFP] and traffic flows on
the freeways during the measurement periods falls into two
distinct groups; freeways that pass over the transect (DoLA and
Paramount) and those passing under the transect (Carson and
Claremont) (Fig. 4). Within each group, it appears [UFP]
increases with traffic flow. The linear fit results for overpass
and underpass freeways are shown in Eq. (2) and (3),
respectively:
Δ [UFP ]=31×(Trafficflow )+2700 (r2=0.27 ) (overpass freeways ) Eq. (2)
Δ [UFP ]=56×(Trafficflow )+5600 (r2=0.42 ) (underpass freeways ) Eq. (3)
These relationships also show that [UFP] is larger for underpass
freeways and better correlated with the traffic flow. When the
mobile platform crosses over a freeway (gray squares in Fig. 4),
the instruments immediately experience a freeway plume freshly
emitted from below. In contrast, it takes time for a freshly
emitted plume to reach the ground when the freeway source is
22
1
2
3
4
5
6
7
8
9
10
11
12
13
14
15
16
17
18

elevated above the transects by 8 m. In the latter case, the
mobile platform encounters a somewhat aged and diluted freeway
plume (black circles in Fig.4) with a less intense peak. In
addition, the relationship between the peak concentrations and
traffic flows is expected to be more scattered for overpass
freeways because, while a plume is diluted somewhat before
reaching the ground, it is also more affected by atmospheric
stability and turbulence intensity at that moment. Consistent
with this, the UFP peak appeared ~ 65 m from the center of the
freeway for the underpass freeways (Carson and Claremont).
Conversely, for the overpass freeway UFP peak distances were ~
150 m from the centerline of the freeway for DoLA and ~ 230 m for
Paramount as shown in Figs. 2 and S1. Moreover, the ratio of the
[UFP]peak (particlescm-3) to the traffic flow (vehicles5min-1) was
greater for the underpass freeway transects, 66 (Carson) and 58
(Claremont) than for the overpass freeway transects, 24 (DoLA)
and 39 (Paramount). This also supports the influence of freeway
geography on UFP and other primary pollutant spatial
distributions. However, in the previous study of the Stewart St.
transect across the I-10 freeway in Santa Monica (Hu et al.,
23
1
2
3
4
5
6
7
8
9
10
11
12
13
14
15
16
17
18
19
20

2009), the response of [UFP]peak to traffic flow was closer to that
of the underpass freeways in the present study despite the I-10
freeway crossing over the transect (horizontal bars in Fig. 4).
This might be explained by the downwind topography of the Santa
Monica transect as the transect reaches the same elevation as the
freeway at ~70 m downwind. Thus, the plume center line can
directly reach the ground as in the underpass freeway case. A
significant difference in [UFP]peak response to traffic flow (gray
cross in Fig. 4) was found for the West LA transect studied by
Zhu et al. (2006). This difference may result from differences in
a number of factors including atmospheric stability and winds
associated with time of day (evening vs. early morning), vehicle
types/driving patterns on the I-405 freeway, and different
instrumentation.
3.4 Comparisons of plume decay rates near freeways
The impact distance of freeway plumes on downwind areas is of
great interest for both human exposure assessments and dispersion
model applications. However, direct comparisons of decay rates
are difficult because of varying peak and background
24
1
2
3
4
5
6
7
8
9
10
11
12
13
14
15
16
17
18
19

concentrations. To reduce the effects of varying peak and
background concentrations, we normalized [UFP] to the peak
concentration as shown in Fig 2. If we assume dilution is the
major process decreasing pollutant concentrations with distance
(Jacobson and Seinfeld, 2004; Kumar et al., 2011; Zhang et al.,
2004) and other processes are negligible, we can describe the
temporal evolution of UFP using Eq. 4 which describes an air
parcel released from the freeway in a Lagrangian system (Dillon
et al., 2002):
d ([UFP ]t−[UFP]bkgnd)dt
=−K(t)⋅([UFP]t−[UFP]bkgnd) Eq. (4)
([UFP(x) ]−[UFP ]bkgnd)([UFP ]peak−[UFP ]bkgnd)
=e−K(x)⋅x Eq. (5)
where [UFP]t and [UFP]bkgnd are UFP concentrations at time t and the
upwind background, respectively, and K(t) is the time-dependent
rate of entrainment of background air in the plume. Integrating
Eq. (4) and assuming consistent wind speed and direction normal
to the freeway (air travel distance, x=U×t, where U is mean wind
speed), we can convert the time basis to air parcel travel
distance (K(x) = K(t)/U) to yield Eq. (5). Note that the left hand
25
1
2
3
4
5
6
7
8
9
10
11
12
13
14
15
16

side of Eq. (5) is the background-subtracted [UFP] at downwind
distance x, normalized to [UFP]peak at the peak (this is the y-axis
in Fig 2). We also assume K is constant with distance, an
assumption that should break down as a plume disperses farther
downwind due to the increases in the vertical length scale of the
plume. The length scale of our analysis is constrained to within
700 m downwind from the freeway after which Eq. (5) no longer
describes the plume shapes well.
The resulting exponential fits successfully describe the
observations for all transects in the present and previous
studies, with r2 values of 0.93 – 0.96 (this work), 0.91 – 0.99
(Santa Monica; Hu et al., 2009), and 0.77 (daytime West LA (WLA);
Zhu et al., 2002) (Fig. 5). The entrainment rate constant, K(x),
estimated from the fits were 2.2(±0.1)×10-3 (DoLA), 3.3(±0.1)×10-3
(Paramount), 2.3(±0.1)×10-3 (Carson), 1.7(±0.04)×10-3 (Claremont),
1.4(±0.03)×10-3 (Winter Santa Monica), 2.1(±0.1)×10-3 (Summer
Santa Monica), and 2.0(±0.1)×10-2 m-1 (daytime WLA). Consistent
with Hu et al. (2009)'s conclusion, the daytime K(x) in WLA
reported by Zhu et al. (2002) is higher by a factor of 6 – 14
26
1
2
3
4
5
6
7
8
9
10
11
12
13
14
15
16
17
18
19

than the pre-sunrise K(x), and pre-sunrise K(x) does not appear to
indicate a clear seasonal variation.
3.5 Variations in size distribution of UFP with downwind distance from freeways
Averaged size distributions of particle number concentrations
with distance downwind from the freeways were obtained using a
fast mobility particle sizer (FMPS) (Fig.6). The mean size
distributions (for number concentrations) for all transects had
similar features: (1) the dominant peak appeared at 11 nm
diameter, (2) a distinct secondary peak appeared around 34 nm
diameter, and (3) two shoulder peaks were observed at 17 nm and
52 nm. Similar four-mode size distributions were observed near
the I-405 freeway (Zhang et al., 2004; Zhu et al., 2002) although
the exact peaks were slightly shifted, perhaps due to differences
in instrumentation and wind conditions. The low levels of
particles less than 20 nm in diameter in upwind background size
distributions clearly indicates that UFP smaller than 20 nm in
diameter are attributable to fresh emissions from freeway
vehicles. It is also apparent that particles in the 11 nm mode
decline much faster than those in the 34 nm or 52 nm mode.
27
1
2
3
4
5
6
7
8
9
10
11
12
13
14
15
16
17
18
19

Although the particle number in all size bins decreased with
distance, the decay rates decrease as particle size increases
resulting in a shifting size distribution (Fig. 6). By 500 m
downwind, about 90% of the smallest particles (5.6 – 7.5 nm)
disappeared (not shown), whereas 70%, 63%, 37% and 18% of
particles in the 9 – 12 nm (mode 1), 15 – 21 nm (mode 2), 27 – 37
nm (mode 3), and 49 – 65 nm (mode 4) size bins disappeared,
respectively. Consequently, the contributions of these four size
bins to the total UFP number decreased at mode 1 (20% 12%) and
2 (13% 10%) and increased at mode 3 (9% 12%) and 4 (7%
12%) (Fig. 7).
As expressed in Eq. (4), the decay rates of particle numbers
from dilution result from both the entrainment coefficient (K)
and the particle number gradient between a plume and surrounding
background ([UFP]). Although it is reasonable to assume the same
K can be applied to particles in modes 1 – 4 (Zhang et al., 2004),
[UFP] varied significantly among size modes ([UFP] were inversely
related to size) possibly causing changes in dilution rates for
different modes. However, this hypothesis does not exclude the
possibility that other particle dynamics, such as
28
1
2
3
4
5
6
7
8
9
10
11
12
13
14
15
16
17
18
19
20

evaporation/condensation, coagulation, and/or dry deposition,
contribute to the spatial variations in UFP near the freeway
under calm and stable pre-sunrise conditions.
3.6 Concentration variations in other pollutants with distance downwind from the
freeways
A summary of concentrations of other pollutants at several
downwind distances from freeway peaks is shown in Table 4.
Concentration profiles of NO and PB-PAH, pollutants
simultaneously measured with UFP, showed clear and significant
freeway emissions (Fig. 8). Although the upwind background
concentrations of NO and PB-PAH ranged widely (0.7 to 75 ppb and
0.6 to 26 ngm-3 for NO and PB-PAH, respectively), the difference
between the peak and background concentrations ([NO]peak) was much
narrower (23 to 63 ppb and 23 to 31 ng m-3 for NO and PB-PAH,
respectively). Because concentrations normalized to the
background are strongly influenced by the background levels, the
difference between the plume and background appears to be more
representative of fresh freeway emissions. For example, the
ratios of NO peak concentration to the background for the Carson
29
1
2
3
4
5
6
7
8
9
10
11
12
13
14
15
16
17
18
19

and Claremont transects are 1.8 and 33, respectively, while
[NO]peak for the Carson transect (63 ppb) is three times bigger
than that for the Claremont transect (23 ppb), much more
consistent with the difference in freeway traffic flows for the
Carson transect (Table 3).
The dilution rate coefficients, K(x) for NO estimated with Eq.
(5) were 3.0(±4%)×10-3 (DoLA), 2.7(±3%)×10-3 (Paramount),
2.5(±4%)×10-3 (Carson), and 3.2(±2%)×10-3 (Claremont), similar to
the dilution rates for UFP (above). K(x) values for PB-PAH were
similar to those for NO and UFP, at 2.7(±4%)×10-3 (DoLA),
2.7(±3%)×10-3 (Paramount), 2.9(±4%)×10-3 (Carson), and 2.2(±3%)×10-
3 (Claremont). The K(x) value for NO for Claremont is
significantly higher than those for UFP and PB-PAH. This may
result from the extremely low concentration of background NO
which, in turn, may result from higher nighttime ozone levels for
that transect facilitating chemical NO loss with ozone. The
surface ozone levels from California Air Resource Board
monitoring sites were 23 (±6) ppb in the near Claremont site
(Glendora-Laurel), whereas ranged 0 – 4 ppb in the near the other
three transects during the measurement periods (CARB, 2011). The
30
1
2
3
4
5
6
7
8
9
10
11
12
13
14
15
16
17
18
19
20

very low upwind background levels of traffic-related pollutants
on the Claremont transect (Table 4) is likely due to the
mountainous unpopulated upwind area. In the mountainous area
(Lake Gregory) ozone concentrations were 44 (±15) ppb during the
measurement periods, supporting this hypothesis.
CO and PM2.5 are relatively long-lived pollutants and have
higher urban backgrounds. As a result, freeway peaks are less
pronounced; freeway peaks for CO and PM2.5 were ~51% and ~25%
higher for CO and PM2.5, respectively, compared to a factor of > 2
– 3 for NO and PB-PAH (Table 4).
3.7 Evidence for dropping emissions factors over time
Background-corrected peak UFP values ([UFP]peak) investigated
here in late winterspring and early summer are similar to those
measured in the summer in Santa Monica by Hu et al. (2009).
Traffic flows on the freeways in the present study were higher
than those reported by Hu et al. (2009) (470–1,020 vs. 340
veh5min-1 in Santa Monica). In addition, the averaged nighttime
(23:00–4:00) [UFP]peak observed by Zhu et al. (2006) in West Los
Angeles in the winter of 2005 showed the highest value of 1.1×10⁵
31
1
2
3
4
5
6
7
8
9
10
11
12
13
14
15
16
17
18
19

particlescm-3 despite experiencing the lowest mean traffic flows
(221 veh5min-1). Although differences in atmospheric stability
and winds likely play a role, these observations suggest that
vehicular emissions of UFP have been decreased since 2005 in the
SoCAB. However, additional measurements under similar conditions
should be conducted for a definitive conclusion.
4.0 Conclusions and Exposure implications
Significant extensions of freeway plumes (~ 2 km)
particularly for UFP, NO, and PB-PAH were observed for all four
sites throughout the SoCAB during the stable pre-sunrise periods.
In addition to extending much further than daytime plumes which
generally extend 150 – 300 m, early morning plumes are also
characterized by a dilution rate coefficient that is about a
factor of ten lower than commonly observed for daytime. An
average of 39 and 19% (±8–9%) of freeway plume peak
concentrations of UFP, respectively, remained 500 and 1500 m
downwind from the freeways for the four transects studied here.
Traffic volumes on freeways increase sharply during the early
morning (~5:00–8:00). Pollutants continue to accumulate, and
32
1
2
3
4
5
6
7
8
9
10
11
12
13
14
15
16
17
18
19

increase until the breakup of the nocturnal boundary layer. The
timing of the breakup varies, but it commonly begins to degrade
in the first hour or so after sunrise. Because winter sunrises
are later, they tend to trap more of the morning rush hour
emissions, and result in higher levels of accumulated pollutants.
Consistent with this, Hu et al. (2009) reported UFP
concentrations in the winter that were higher by more than a
factor of two compared to summer measurements. Consequently, more
people are exposed to elevated pollutant concentrations during
the pre-sunrise periods in the winter (Hu et al., 2009; Figure
3). We note that the measurements reported here were made toward
the early portion of the morning rush hour period, in an effort
to avoid excessive traffic on surface streets which confounds the
detection of the freeway plume. As a result, the absolute
concentrations we report here are below the maximum pollutant
concentrations that develop slightly later in the morning.
While 4.4% of the SoCAB population lives within 100 m of
freeways, 50% of the SoCAB population lives within 1.5 km of
freeways (Polidori et al., 2009). Because particle concentrations
can be several times greater in the pre-sunrise and early 33
1
2
3
4
5
6
7
8
9
10
11
12
13
14
15
16
17
18
19
20

morning, exposures in this period can dominate total daily
exposure depending on individual time-activity patterns. A much
greater population of downwind residents may be exposed to
vehicle-related pollutants during the early morning hours,
because people are generally in their homes in the early morning,
and penetration of outdoor UFP and related pollutants is
reasonably efficient, although infiltration factors for outdoor
pollutants are strongly influenced by house characteristics as
well as air-exchange rates and indoor deposition rates (e.g.,
Long et al., 2001; Zhu et al., 2005). A more quantitative
evaluation of the exposure implications of our findings is
desirable.
Acknowledgements
The authors gratefully acknowledge support for this study by
the California Air Resources Board, Contract No. 09-357. We also
thank Southern California Edison (SCE) for the use of electric
charging facility and for providing security, James Murakami at
UCLA for assistance with local meteorological characteristics and
34
1
2
3
4
5
6
7
8
9
10
11
12
13
14
15
16
17
18
19

data, and Dr. Sioutas' group at University of Southern California
for the use of particle instrumentation unit (PIU) and electric
charging facility.
References
Brugge, D., Durant, J.L., Rioux, C., 2007. Near-highway pollutants in motor vehicle exhaust: A review of epidemiologic evidence of cardiac and pulmonary health risks. Environmental Health 6: 23.
Capaldo, K., Pandis, S., 2001. Lifetimes of ultrafine diesel aerosol, Report for the University of Minnesota and the coordinating research council under the E-43 project diesel aerosol sampling methodology. Carnegie Mellon University, Pittsburgh, PA.
CARB, 2011. Quality Assurance Air Monitoring Site Information http://www.arb.ca.gov/qaweb/siteinfo.php.
Dillon, M.B., Lamanna, M.S., Schade, G.W., Goldstein, A.H., Cohen, R.C., 2002. Chemical evolution of the Sacramento urban plume: Transport and oxidation. Journal of Geophysical Research-Atmospheres 107.
Hoek, G., Boogaard, H., Knol, A., De Hartog, J., Slottje, P., Ayres, J.G., Borm, P., Brunekreef, B., Donaldson, K., Forastiere,F., Holgate, S., Kreyling, W.G., Nemery, B., Pekkanen, J., Stone,V., Wichmann, H.E., Van der Sluijs, J., 2010. Concentration Response Functions for Ultrafine Particles and All-Cause Mortality and Hospital Admissions: Results of a European Expert Panel Elicitation. Environmental Science & Technology 44, 476-482.
Hu, S.S., Fruin, S., Kozawa, K., Mara, S., Paulson, S.E., Winer, A.M., 2009. A wide area of air pollutant impact downwind of a
35
1
2
3
4
5
6789
1011121314
1516
17181920
2122232425262728
2930

freeway during pre-sunrise hours. Atmospheric Environment 43, 2541-2549.
Jacobson, M.Z., Seinfeld, J.H., 2004. Evolution of nanoparticle size and mixing state near the point of emission. Atmospheric Environment 38, 1839-1850.
Karner, A.A., Eisinger, D.S., Niemeier, D.A., 2010. Near-Roadway Air Quality: Synthesizing the Findings from Real-World Data. Environmental Science & Technology 44, 5334-5344.
Kozawa, K.H., Fruin, S.A., Winer, A.M., 2009. Near-road air pollution impacts of goods movement in communities adjacent to the Ports of Los Angeles and Long Beach. Atmospheric Environment 43, 2960-2970.
Kumar, P., Ketzel, M., Vardoulakis, S., Pirjola, L., Britter, R.,2011. Dynamics and dispersion modelling of nanoparticles from road traffic in the urban atmospheric environment-A review. J. Aerosol. Sci. 42, 580-603.
Long, C.M., Suh, H.H., Catalano, P.J., Koutrakis, P., 2001. Usingtime- and size-resolved particulate data to quantify indoor penetration and deposition behavior. Environmental Science & Technology 35, 2089-2099.
Penttinen, P., Timonen, K.L., Tiittanen, P., Mirme, A., Ruuskanen, J., Pekkanen, J., 2001. Ultrafine particles in urban air and respiratory health among adult asthmatics. European Respiratory Journal 17, 428-435.
Polidori, A., Fine, P.M., Wilson, S., Koch, M., Ayers, E., 2009. Effect of proximity to a freeway with heavy-duty diesel traffic on the ambient concentrations of criteria and air toxic pollutants, 2009 National Ambient Air Monitoring Conference. the US Environment Protection Agency, Nashville, TN.
Pope, C.A., Burnett, R.T., Thun, M.J., Calle, E.E., Krewski, D., Ito, K., Thurston, G.D., 2002. Lung cancer, cardiopulmonary mortality, and long-term exposure to fine particulate air
36
12
345
678
9101112
13141516
17181920
21222324
2526272829
303132

pollution. Jama-Journal of the American Medical Association 287, 1132-1141.
Westerdahl, D., Fruin, S., Sax, T., Fine, P.M., Sioutas, C., 2005. Mobile platform measurements of ultrafine particles and associated pollutant concentrations on freeways and residential streets in Los Angeles. Atmospheric Environment 39, 3597-3610.
Zhang, K.M., Wexler, A.S., Zhu, Y.F., Hinds, W.C., Sioutas, C., 2004. Evolution of particle number distribution near roadways. Part II: the 'road-to-ambient' process. Atmospheric Environment 38, 6655-6665.
Zhu, Y.F., Hinds, W.C., Kim, S., Sioutas, C., 2002. Concentrationand size distribution of ultrafine particles near a major highway. Journal of the Air & Waste Management Association 52, 1032-1042.
Zhu, Y.F., Hinds, W.C., Krudysz, M., Kuhn, T., Froines, J., Sioutas, C., 2005. Penetration of freeway ultrafine particles into indoor environments. J. Aerosol. Sci. 36, 303-322.
Zhu, Y.F., Kuhn, T., Mayo, P., Hinds, W.C., 2006. Comparison of daytime and nighttime concentration profiles and size distributions of ultrafine particles near a major highway. Environmental Science & Technology 40(8), 2531-2536.
37
12
3456
789
10
11121314
151617
18192021
22
23

Table 1. Summary of the location of sampling transects and freeways, and measurement periods.
Transectstreet
Location
Freeway(Lat./Lon.)
Freeway over/undertransect
Distancefromcoast
/ length
Sampling period Refs
Constitution
West LA I-405(34.060N
/118.455W
)
Over-pass
~ 7 km /0.3 kmup-
0.5 kmdown-wind
9 days for Maythrough July,2001 (daytime)7 days for
February, 2005(Nighttime)
Zhu etal.
(2002)Zhu etal.
(2006)Stewart Santa
MonicaI-10
(34.026N/
118.463W)
Over-pass
~ 4 km1 km up-2.6 km
down-wind
3/7, 3/12, 3/182008 (Winter)6/30, 7/2 2008
(Summer)
Hu etal.
(2009)
Coronado Downtown LA
101(34.074N
/118.272W
)
Over-pass
~ 22 km1.2 kmup-
2.2 kmdown-wind
2/24, 3/9,3/14, 3/17
2011
thisstudy
Obispo Paramount
91(33.877N
/118.156W
)
Over-pass
~ 13 km2 km up-1.8 km
down-wind
1/27, 2/1,3/10, 3/18 2011
228th WestCarson
I-110(33.819N
/118.287W
)
Under-pass
~ 6 km1.3 kmup-
2.2 kmdown-wind
1/21, 2/3/ 3/8,3/11, 3/29 2011
Mountain Claremont
I-210(34.120N
/117.729W
)
Under-pass
~ 70 km0.8 kmup-
2.6 kmdown-wind
5/19, 5/24,5/25, 5/26,6/1, 6/2, 6/7
2011
Table 2. Monitoring instruments on the mobile platform operational
during the PSR measurements.
38
12
3
4
5
Instrument Measurement Parameter
Responsetimea
(Inlet torecord)
TSI Portable CPC, Model3007 UFP Count (10 nm-1m) 4 s
TSI FMPS, Model 3091 UFP Size (5.6-560 nm) 9 sTSI DustTrak, Model
8520 PM2.5 Mass 5 s
EcoChem PAS 2000 Particle-bound PAH 10 s
Teledyne API Model 300E CO 21 s
LI-COR, Model LI-820 CO2 7 s
Teledyne-API Model 200E NO 22 sVaisala SonicAnemometer and
Temperature/RH sensor
Surface winds, temperature,and relative humidity (RH) -
Garmin GPSMAP 76CS Distance and relative speed -
SmartTetherTM Vertical profiles oftemperature, RH, and winds -
a. Response time is an averaged value for smoke test results
39
1
2

Table 3. Surface meteorology, vertical temperature gradients, and
traffic flows on the freeway during the measurement periods.
Transect Samplingtime
Temp.(C)
RH(%)
Windspeed(ms-1)
Winddirectio
nrelative
tofreewayd
()
d/dz(×10-2
Km-1)
Traffic flow(truck flow)
on thefreewaysduring
measurements(veh5min-1)
West LAa
(daytime)10:30 –16:00
34b - 1 – 2e 78( >62%) f
- 979
West LAb
(night2001)
23:00 –04:00
10 - < 1e ~ 35 - 221
SantaMonica(summer2008)c
04:00 –06:30
17 86 0.9 47 - 340
SantaMonica(winter2008)c
06:00 –07:30
11 69 0.7 49 - 715
DoLA 05:00 –06:30
12 77 0.7 73 0.73 797 ± 215(48 ± 6)
Paramount 05:00 –06:30
10 76 0.5 82 0.67 1020 ± 112(24 ± 4)
WestCarson
05:00 –06:30
8 67 0.6 76 0.40 627 ± 136(24 ± 10)
Claremont 04:30 –06:00
8 82 0.6 58 1.23 465 ± 79(23 ± 4)
a. Zhu et al. (2002).b. Zhu et al. (2006).c. Hu et al. (2009).d. Wind direction is relative to the freeway direction. 90 is normal
and 0 is parallel to the freeway.e. Mostly wind speeds were 1-2 ms-1 for daytime measurements and
below 1 ms-1 at night. f. More than 62% of observations were recorded with this value with
an interval of 22.5.
40
1
2
3456789
101112

Table 4. Mean concentrations in the upwind area, at the plume peak
location, and 300m, 500m, and 1500m downwind from the peak of NO, PB-
PAH, CO, and PM2.5. Background-subtracted concentrations at the peak
location are also provided.
Species Transect
Background
Conc.
PeakConc.
[C]pea
ka
Conc.at 300mdownwindb
Conc.at 500mdownwindb
Conc.at 1500mdownwind
b
NO(ppb)
DoLA 28.8 69.7 40.9 47.7 43.8 40.0Paramount 59.6 120.4 60.8 98.2 84.7 47.0
WestCarson 75.4 138.3 62.9 109.6 93.8 99.0
Claremont 0.7 23.4 22.7 9.2 6.7 2.2
PB-PAH(ngm-
3)
DoLA 14.0 37.2 23.2 25.9 24.3 16.8Paramount 25.8 52.7 26.9 41.6 35.1 19.1
WestCarson 13.2 44.0 30.7 28.6 26.8 22.6
Claremont 0.6 23.6 23.0 11.5 9.8 5.3
CO(ppm)
DoLA 1.14 1.65 0.51 1.33 1.36 1.12Paramount 1.19 2.01 0.83 1.59 1.29 0.76
WestCarson 1.17 2.02 0.85 1.69 1.61 1.37
Claremont 0.55 0.64 0.09 0.55 0.54 0.51
PM2.5
(gm-
3)
DoLA 15.6 18.4 2.8 16.5 16.1 16.0Paramount 24.0 29.9 5.9 27.23 25.2 21.2
WestCarson 11.5 15.4 3.9 13.7 12.8 12.3
Claremont 10.0 12.2 2.2 11.2 10.9 10.1a. Background subtracted concentration at the freeway peak
location.b. Concentrations at the downwind distance from the freeway peak
position. Corresponding UFP data is shown in Figure 3.
41
1
2
3
4
56789

Zhu et al. (2006)
H u et al. (2009)
DoLA
Param ount
Carson
Clarem ont
Figure 1. Map of transects where pre-sunrise measurements were conducted in the South California Air Basin (SoCAB). Yellow circles indicate the location of transects in this study and green squares denote the location of previous studies conducted by Zhu et al. (2002;2006) in West LA and Hu et al. (2009) in Santa Monica. Google Earth map.
42
12345678
-500 0 500 1000 1500 2000
0
0.2
0.4
0.6
0.8
1No
rmalize
d [UFP
]
Distance from freew ay (m )
W LAday (Zhu, 2002)
Overpass fw y (Dow ntow n LA and Param ount)Underpass fw y (Carson and Clarem ont)
Figure 2. Variations in background-subtracted UFP concentrations with respect to distance from the freeway. Values are smoothed after being normalized to peak concentrations. The black dashed line: mean concentration profiles of overpass freeways (the Downtown LA and Paramount transects); black solid line: mean profiles of underpass freeways (the Carson and Claremont transects); gray dashed line: daytime observations in West LA reported by Zhu et al. (2002). The horizontal gray solid line represents upwind background concentrations. Negative and positive distance indicates upwind and downwind locations, respectively. Actual profiles for the individual transects as well as comparisons from the liturature are presented in the supplementary material.
43
1
23456789
10111213

UFP number conc. (103 cm
-3)
0
10
20
30
40
50
60
70100150200
Peak conc.
Conc. at 300 m dow nw ind
Background conc.
S Mwinter(2008) a
S Msummer(2008) a
WLAnight(2005) b
WLAday(2001) c
DoLA(2011)
Paramount(2011) Carson
(2011)
Claremont(2011)
0
2e+4
4e+4
6e+4
8e+4
1e+5Peak conc.
Conc. at 300m downwindConc. at 500m downwindConc. at 1500m downwindBackground
W LA (2001c; 2005b) SM (2008)aand this study
Figure 3. Concentrations of UFP (# cm-3) observed at several distances from the freeway. Top and bottom horizontal bars denote peakplume concentration and the upwind background concentration, respectively. The horizontal lines of the box (from the top) representthe concentrations at 300m, 500m, and 1500m, respectively, downwind from the freeway. For Zhu et al. (2002; 2006), top and bottom horizontal bars denote the freeway peak and upwind concentrations, andgreen crosses denote the concentrations at 300m downwind. We note thatthe measurements in this study were made earlier in the morning than those of Hu et al. (2009), and thus somewhat lower absolute concentrations are expected, although many other factors also play a role. aHu et al. (2009); bZhu et al. (2006); cZhu et al. (2002).
44
1
23456789
10111213

Figure 4. Background subtracted peak UFP concentrations ([UFP]) as a function of traffic flow on freeways. Black circles denote daily average data for the DoLA and Paramount transects, where the freeway passes over the transect, and gray squares represent data for the Carson and Claremont transects, where the freeway passes under the transect. Gray and black dashed lines are linear fits for gray squaresand black circles, respectively. Black and gray thick horizontal bars are the averaged values observed for the 2008 Santa Monica winter and summer seasons, respectively (Hu et al., 2009). The cross shows the averaged nighttime data for the 2005 West LA winter night period (Zhu et al., 2006).
45
1
23456789
101112

0 100 200 300 400 500 600 7000
0.2
0.4
0.6
0.8
1
Distance from the peak (m )
Norm
alize
d [UFP
]SM w inter (Hu, 2009)FitSM (w inter)SM sum m er (Hu, 2009)FitSM (sum m er)W LAday (Zhu, 2002)FitW LA (day)DoLAFitDoLAParam ountFitParam ountCarsonFitCarsonClarem ontFitClarem ont
Figure 5. Normalized [UFP] with downwind distance from the freeway and exponential fits. SM: Santa Monica (black cross and x) and WLA: West LA (gray asterisk). Symbols indicate observations for each transect and the line with the same color as a symbol shows an exponential fit to those symbols.
46
1
23456

10 20 40 60 80100 200 300 5000
1
2
3
4
5
Particle diam eter (nm )
dN/dlog(D
p) (10
4 # cm
-3)
10 20 40 60 80100 200 300 5000
2
4
6
8
10
Particle diam eter (nm )
dN/dlog(D
p) (10
4 # cm
-3)
10 20 40 60 80100 200 300 5000
2
4
6
8
10
Particle diam eter (nm )
dN/dlog(D
p) (10
4 # cm
-3)
10 20 40 60 80100 200 300 5000
1
2
3
4
Particle diam eter (nm )
dN/dlog(D
p) (10
4 # cm
-3)
at peak300m dow nwind from the peak500m dow nwind from the peak1500m dow nwind from the peakUpwind background
(a)
(c)
(b)
(d)
DoLA
Param ount
Clarem ontCarson
Figure 6. Size distributions of UFP number concentrations at the peak location (black solid line), 300 m (light purple), 500 m (green), and 1500 m (gray solid line) downwind from the peak as well as averaged upwind background (gray dotted line) for the (a) DoLA, (b) Paramount, (c) Carson, and (d) Claremont transects.
47
1
23456

DoLA Param ount Carson Clarem ont
Number c
oncentratio
ns (# / cm
3 )
0
5000
10000
15000
20000
25000 8.7 11.6 nm15.4 20.5 nm27.4 36.5 nm48.7 64.9 nm
12%
15%
9%
10%
13%10%
14%20%
6%
15%
13%
4%
11%
12%
11%
9%
14%
6%
12%
52%
12%
11%29%
23%
8%
13%
53%13%
13%19%
At peak location
500 m dow nw ind from peak
10%
9%
13%
6%
11%
9%
Figure 7. Number concentrations (particlescm-3) in four size-segregated bins (8.7 – 11.6 nm, 15.4 – 20.5 nm, 27.4 – 36.5 nm, and 48.7.4 – 64.9 nm), where mode-like peaks appeared in the mean size distributions (Fig. 6). Their contributions to the total number concentrations are shown inside the bars (%). Left stacks for each transect are for the peak location of the plume and right stacks are for 500 m downwind from the peak.
48
1
2345678

(a)
(b)
-500 0 500 1000 1500 20000
10
20
30
40
50
60
Distance from freew ay (m )
[PB-PAH] (ng
m-3)
DoLALong BeachCarsonClarem ont
-500 0 500 1000 1500 20000
30
60
90
120
150
Distance from freew ay (m )
[NO] (ppb)
DoLAParam ountCarsonClarem ont
Figure 8. Averaged spatial variations in (a) [NO] and (b) [PB-PAH] near the freeways for the DoLA (black solid line), Paramount (black dash-dotted line), Carson (gray solid line), and Claremont transects (gray dashed line).
49
1
2345