How Stable Is Stable? Function versus Community Composition
8
APPLIED AND ENVIRONMENTAL MICROBIOLOGY, 0099-2240/99/$04.0010 Aug. 1999, p. 3697–3704 Vol. 65, No. 8 Copyright © 1999, American Society for Microbiology. All Rights Reserved. How Stable Is Stable? Function versus Community Composition ANA FERNA ´ NDEZ, 1,2 SUIYING HUANG, 1 SHERRY SESTON, 1,3 JIAN XING, 1,4 ² ROBERT HICKEY, 1,4,5 CRAIG CRIDDLE, 1,4 ‡ AND JAMES TIEDJE 1,3 * Center for Microbial Ecology, 1 Department of Microbiology, 3 and Department of Civil and Environmental Engineering, 4 Michigan State University, East Lansing, Michigan 48824, EFX Systems, Lansing, Michigan 48910, 5 and Ca ´tedra de Microbiologı ´a, Facultad de Quı ´mica, Universidad de la Repu ´blica, C. de Correo 1157, Montevideo, Uruguay 2 Received 20 January 1999/Accepted 25 May 1999 The microbial community dynamics of a functionally stable, well-mixed, methanogenic reactor fed with glucose were analyzed over a 605-day period. The reactor maintained constant pH and chemical oxygen demand removal during this period. Thirty-six rrn clones from each of seven sampling events were analyzed by amplified ribosomal DNA restriction analysis (ARDRA) for the Bacteria and Archaea domains and by sequence analysis of dominant members of the community. Operational taxonomic units (OTUs), distinguished as unique ARDRA patterns, showed reproducible distribution for three sample replicates. The highest diversity was observed in the Bacteria domain. The 16S ribosomal DNA Bacteria clone library contained 75 OTUs, with the dominant OTU accounting for 13% of the total clones, but just 21 Archaea OTUs were found, and the most prominent OTU represented 50% of the clones from the respective library. Succession in methanogenic populations was observed, and two periods were distinguished: in the first, Methanobacterium formicicum was dominant, and in the second, Methanosarcina mazei and a Methanobacterium bryantii-related organism were dominant. Higher variability in Bacteria populations was detected, and the temporal OTU distribution sug- gested a chaotic pattern. Although dominant OTUs were constantly replaced from one sampling point to the next, phylogenetic analysis indicated that inferred physiologic changes in the community were not as dramatic as were genetic changes. Seven of eight dominant OTUs during the first period clustered with the spirochete group, although a cyclic pattern of substitution occurred among members within this order. A more flexible community structure characterized the second period, since a sequential replacement of a Eubacterium-related organism by an unrelated deep-branched organism and finally by a Propionibacterium-like species was ob- served. Metabolic differences among the dominant fermenters detected suggest that changes in carbon and electron flow occurred during the stable performance and indicate that an extremely dynamic community can maintain a stable ecosystem function. Understanding the factors that determine ecosystem stabil- ity has been one of the main challenges for ecologists for many years. Knowledge of the conditions that affect stability is needed to determine the effects of external parameters on habitats and is valuable for environmental management and biotechnological applications. Nevertheless, definitions of eco- system stability are not precise and in many cases are refer- enced either to measurable parameters describing the function of the whole system or to the community composition (15). Most of the studies performed on microbial population dynam- ics have focused on the detection of a shift in bacterial popu- lations when an open ecosystem is exposed to a natural distur- bance, such as seasonal changes (12, 33), or to an artificial perturbation (2, 4, 11, 12). However, one of the main questions that still remains unanswered is whether, in undisturbed eco- systems, functional stability implies a persistent community. In the present study, a methanogenic bioreactor was chosen as the ecosystem to address this question. The reactor had expe- rienced the same controlled environmental parameters for 1,505 days, and functional stability after day 400 was confirmed by a constant performance with respect to chemical oxygen demand (COD) reduction, pH, and methane production (39). Methanogenic ecosystems constitute a bacterial food chain where three trophic levels can be distinguished as fermentable substrates are anaerobically degraded in the absence of in- organic electron acceptors. The concerted activity of ferment- ing populations, acetogenic hydrogen-producing bacteria, and methanogens is required for the complete degradation of glu- cose to CH 4 and CO 2 (40). Disturbances in populations from one trophic level affect the entire community and cause an imbalance that is reflected in the bioreactor performance by accumulation of intermediates, pH changes, or reduced effi- ciency (28). Because of the limitations of culture methods, it has not been possible to retrieve most of the bacteria present in com- plex communities (1) to elucidate microbial community struc- ture. Molecular methods, particularly those involving the 16S rRNA gene, are currently widely used to suggest the identity of uncultured microorganisms. Comparison of PCR-amplified 16S ribosomal DNA (rDNA) sequences complemented with screening strategies such as restriction profile analysis (21, 37) constitutes a rapid method that provides improved but not complete information on microbial community composition. The aim of this work was to evaluate how stable the micro- bial community was over a nearly 2-year period (day 900 to day 1505) in a methanogenic reactor operated under constant con- ditions and exhibiting stable performance. Populations from Bacteria and Archaea domains were analyzed by amplified * Corresponding author. Mailing address: Center for Microbial Ecology, Michigan State University, East Lansing, MI 48824. Phone: (517) 353-9021. Fax: (517) 353-2917. E-mail: [email protected]. ² Present address: Global Remediation Technologies, Traverse City, MI 49684. ‡ Present address: Department of Civil and Environmental Engi- neering, Stanford University, Stanford, CA 94305. 3697
-
Upload
arciprestedehita -
Category
Documents
-
view
2 -
download
0
Transcript of How Stable Is Stable? Function versus Community Composition
APPLIED AND ENVIRONMENTAL MICROBIOLOGY,0099-2240/99/$04.0010
Aug. 1999, p. 3697–3704 Vol. 65, No. 8
Copyright © 1999, American Society for Microbiology. All Rights Reserved.
How Stable Is Stable?Function versus Community Composition
ANA FERNANDEZ,1,2 SUIYING HUANG,1 SHERRY SESTON,1,3 JIAN XING,1,4† ROBERT HICKEY,1,4,5
CRAIG CRIDDLE,1,4‡ AND JAMES TIEDJE1,3*
Center for Microbial Ecology,1 Department of Microbiology,3 and Department of Civil and Environmental Engineering,4
Michigan State University, East Lansing, Michigan 48824, EFX Systems, Lansing, Michigan 48910,5 and Catedra deMicrobiologıa, Facultad de Quımica, Universidad de la Republica, C. de Correo 1157, Montevideo, Uruguay2
Received 20 January 1999/Accepted 25 May 1999
The microbial community dynamics of a functionally stable, well-mixed, methanogenic reactor fed withglucose were analyzed over a 605-day period. The reactor maintained constant pH and chemical oxygendemand removal during this period. Thirty-six rrn clones from each of seven sampling events were analyzed byamplified ribosomal DNA restriction analysis (ARDRA) for the Bacteria and Archaea domains and by sequenceanalysis of dominant members of the community. Operational taxonomic units (OTUs), distinguished asunique ARDRA patterns, showed reproducible distribution for three sample replicates. The highest diversitywas observed in the Bacteria domain. The 16S ribosomal DNA Bacteria clone library contained 75 OTUs, withthe dominant OTU accounting for 13% of the total clones, but just 21 Archaea OTUs were found, and the mostprominent OTU represented 50% of the clones from the respective library. Succession in methanogenicpopulations was observed, and two periods were distinguished: in the first, Methanobacterium formicicum wasdominant, and in the second, Methanosarcina mazei and a Methanobacterium bryantii-related organism weredominant. Higher variability in Bacteria populations was detected, and the temporal OTU distribution sug-gested a chaotic pattern. Although dominant OTUs were constantly replaced from one sampling point to thenext, phylogenetic analysis indicated that inferred physiologic changes in the community were not as dramaticas were genetic changes. Seven of eight dominant OTUs during the first period clustered with the spirochetegroup, although a cyclic pattern of substitution occurred among members within this order. A more flexiblecommunity structure characterized the second period, since a sequential replacement of a Eubacterium-relatedorganism by an unrelated deep-branched organism and finally by a Propionibacterium-like species was ob-served. Metabolic differences among the dominant fermenters detected suggest that changes in carbon andelectron flow occurred during the stable performance and indicate that an extremely dynamic community canmaintain a stable ecosystem function.
Understanding the factors that determine ecosystem stabil-ity has been one of the main challenges for ecologists for manyyears. Knowledge of the conditions that affect stability isneeded to determine the effects of external parameters onhabitats and is valuable for environmental management andbiotechnological applications. Nevertheless, definitions of eco-system stability are not precise and in many cases are refer-enced either to measurable parameters describing the functionof the whole system or to the community composition (15).Most of the studies performed on microbial population dynam-ics have focused on the detection of a shift in bacterial popu-lations when an open ecosystem is exposed to a natural distur-bance, such as seasonal changes (12, 33), or to an artificialperturbation (2, 4, 11, 12). However, one of the main questionsthat still remains unanswered is whether, in undisturbed eco-systems, functional stability implies a persistent community. Inthe present study, a methanogenic bioreactor was chosen asthe ecosystem to address this question. The reactor had expe-rienced the same controlled environmental parameters for1,505 days, and functional stability after day 400 was confirmed
by a constant performance with respect to chemical oxygendemand (COD) reduction, pH, and methane production (39).
Methanogenic ecosystems constitute a bacterial food chainwhere three trophic levels can be distinguished as fermentablesubstrates are anaerobically degraded in the absence of in-organic electron acceptors. The concerted activity of ferment-ing populations, acetogenic hydrogen-producing bacteria, andmethanogens is required for the complete degradation of glu-cose to CH4 and CO2 (40). Disturbances in populations fromone trophic level affect the entire community and cause animbalance that is reflected in the bioreactor performance byaccumulation of intermediates, pH changes, or reduced effi-ciency (28).
Because of the limitations of culture methods, it has notbeen possible to retrieve most of the bacteria present in com-plex communities (1) to elucidate microbial community struc-ture. Molecular methods, particularly those involving the 16SrRNA gene, are currently widely used to suggest the identity ofuncultured microorganisms. Comparison of PCR-amplified16S ribosomal DNA (rDNA) sequences complemented withscreening strategies such as restriction profile analysis (21, 37)constitutes a rapid method that provides improved but notcomplete information on microbial community composition.
The aim of this work was to evaluate how stable the micro-bial community was over a nearly 2-year period (day 900 to day1505) in a methanogenic reactor operated under constant con-ditions and exhibiting stable performance. Populations fromBacteria and Archaea domains were analyzed by amplified
* Corresponding author. Mailing address: Center for MicrobialEcology, Michigan State University, East Lansing, MI 48824. Phone:(517) 353-9021. Fax: (517) 353-2917. E-mail: [email protected].
† Present address: Global Remediation Technologies, Traverse City,MI 49684.
‡ Present address: Department of Civil and Environmental Engi-neering, Stanford University, Stanford, CA 94305.
3697
rDNA restriction analysis (ARDRA). The composition of theformer group varied considerably while the latter group wasmore stable, but a shift in the latter coincided with a major shiftin the Bacteria community members.
MATERIALS AND METHODS
Control and operation of the reactor. A 1.5-liter continuously stirred tankreactor, described previously (39), was operated anaerobically at 35°C for 1,500days. The substrate (glucose) was supplied in a 2-day cycle: 16 g/liter one day and0 g/liter the following day. A constant dilution rate (0.1 day21) was maintained,and steady state was achieved after day 400. No perturbations were appliedduring this period except for an accidental temperature drop to room tempera-ture during 1 day (day 977) and an increase in glucose feeding for 1 day (day983). Performance was monitored with effluent COD and volatile fatty acids,methane production, and pH measurement (39).
Extraction and purification of total genomic DNA. Samples (10 ml) werecollected from the continuously stirred tank reactor after manual shaking, im-mediately concentrated by centrifugation at 6,000 3 g for 15 min, washed with asolution of 0.9 g of NaCl per liter, and frozen at 220°C. Cells were resuspendedin 3 ml of a high-salt lysis buffer (1 M NaCl, 5 mM MgCl2, and 10 mM Tris [pH8.0]) to reduce shearing of DNA (3) and vortexed to homogenize the samples.Suspended cells were passed three times through a French press at a pressure of15,000 lb/in2. This procedure gave a high DNA yield, and it is particularly criticalfor the difficult-to-lyse methanogenic bacteria (3).
Lysate was diluted 1:5 in TE buffer (10 mM Tris [pH 8.0], 1 mM EDTA [pH8.0]) to a final volume of 15 ml. Deproteinization was achieved by addition ofsodium dodecyl sulfate (2% [wt/vol]) and proteinase K (50 mg/ml) (BoehringerMannheim, Indianapolis, Ind.) and incubation at 65°C for 2 h. After cooling,nucleic acids were extracted by adding 10 ml of phenol-chloroform (50/50 ratio)followed by centrifugation at 3,000 3 g for 20 min. After a second extraction with10 ml of chloroform, nucleic acids were precipitated overnight with 10 ml ofice-cold isopropanol at 220°C. The precipitate was washed with 70% (vol/vol)ice-cold ethanol and dissolved in 400 ml of warm (50°C) deionized water. Thesolution was incubated for 2 h at 37°C with DNAse-free (27) RNase A (Boehr-inger Mannheim) at a final concentration of 1.2 mg/ml. After protein extractionwith 500 ml of chloroform and centrifugation at 14,000 3 g for 10 min, DNA wasprecipitated by addition of a 1/10 volume of 3 M sodium acetate and ice-coldethanol to a final concentration of 70% (vol/vol). DNA was dissolved in deion-ized water, and its purity and concentration were checked by spectrophotometry.DNA was purified with Wizard Plus miniprep columns (Promega, Madison,Wis.).
ARDRA. Amplification of 16S rDNA from purified genomic DNA from eachsample was carried out with primers for the Bacteria and Archaea domains. TheBacteria clone library was prepared from amplification products produced with aforward primer which corresponds to nucleotide positions 19 to 38 (59-AGAGTTTGATCCTGGCTCAG-39; primer A) of the Escherichia coli rRNA and areverse primer which corresponds to the complement of positions 1581 to 1541(59-AAGGAGGTGATCCAGCCGCA-39; primer H) (34). All primers were syn-thesized with an Applied Biosystems DNA synthesizer at the MacromolecularStructure and Sequencing Facility, Michigan State University. Amplification wasdone in a 25-ml reaction volume containing 100 ng of DNA, 0.5 mM (each)primer, 0.2 mM (each) deoxynucleoside triphosphate, 1.5 mM MgCl2, 0.2 mg ofbovine serum albumin per ml, 2.5 ml of 103 Taq buffer, and 4 U of Taq DNApolymerase (Perkin-Elmer Cetus, Norwalk, Conn.) (21). PCR amplification wasperformed in an automated thermal cycler (Model 9600; Perkin-Elmer) with aninitial denaturation (94°C for 5 min) followed by 30 cycles of denaturation (94°Cfor 1 min), annealing (55°C for 1 min), and extension (72°C for 3 min) and asingle final extension (72°C for 7 min).
The Archaea clone library was prepared from amplification products producedwith a forward primer which corresponds to nucleotide positions 19 to 38 (59-TAAGCCATGCRAGTCGAAYG-39; primer 69F) of the E. coli rRNA (18) anda reverse primer which corresponds to the complement of positions 1581 to 1541(59-[C/T]CCGGCGTTGA[A/C]TCCAATT-39; primer 958R) (9). Amplificationwas optimized by checking different conditions with Methanosarcina barkeri(ATCC 43241) and Methanobrevibacter smithii (ATCC 35061) DNA as positivecontrols and DNA of several isolates from this reactor belonging to the Bacteriadomain as negative controls. The following modifications of the previous condi-tions were used: 1.75 mM MgCl2, 35 cycles, and an annealing temperature of52°C for 1 min. The products were electrophoresed on a 1% agarose gel toevaluate the quality and concentration of the amplified fragments.
All amplicons were cloned with the TA cloning kit (Invitrogen, Carlsbad,Calif.) according to the manufacturer’s instructions. Direct amplification of plas-mid DNA from positive clones was accomplished with the following conditions:initial denaturation (92°C for 2 min) followed by 35 cycles of denaturation (94°Cfor 30 s), annealing (67°C for 1 min), and extension (72°C for 3 min) and a singlefinal extension (72°C for 7 min). Primers were 59-GCCGCCAGTGTGCTGGAATT-39 (TAf) and 59-TAGATGCATGCTCGAGCGGC-39 (TAr) (43). The fi-nal reaction volume was 20 ml, and modifications of the above Bacteria 16SrDNA amplification conditions were 1.2 mM MgCl2, and 3 U of Taq. Thefragment size of these amplicons was checked by electrophoresis in 1% agarose.
PCR products (16 ml) of the right size (1,500 bp for Bacteria and 900 bp forArchaea) were digested simultaneously for 12 h with two restriction enzymes(HaeIII and HhaI; Gibco BRL, Gaithersburg, Md.) according to the manufac-turer’s specifications. The restriction fragments from each clone were separatedby electrophoresis on a 3.5% (wt/vol) MetaPhor agarose gel (FMC, Indianapolis,Ind.) in fresh 13 Tris-borate-EDTA buffer at 4 V/cm in a cold room andobserved after staining with ethidium bromide. Restriction patterns were nor-malized and compared with GelCompar software (version 3.1; Applied Maths,Kortrijk, Belgium). Pattern clustering was done by the unweighted pair groupmethod with averages with application of the Dice coefficient. A maximumtolerance for band position of 3.0% 6 0.5% was used, and each specific patternwas defined as an operational taxonomic unit (OTU). Thirty-six ARDRA pat-terns were analyzed for each sample, and frequencies were calculated as thepercentages of the clones showing the same OTU. OTU labeling includes thedomain A (Archaea) and E (Bacteria, formerly Eubacteria), and the OTU relativeabundance in the respective library expressed in roman numerals, e.g., AO-I,dominant OTU in the Archaea library.
Sequencing and sequence analysis. The 16S rDNA gene fragments were am-plified for sequencing directly from whole cells containing the correct plasmidand insert with the TA cloning kit (Invitrogen). The amplicons were then purifiedwith Microcon-100 spin columns (Millipore Corp.). Sequences were obtained viathe dye terminator method by the Michigan State University DNA SequencingFacility with modified versions of previously described sequencing primers tar-geting conserved regions of the 16S rRNA gene (35, 36, 38, 42). Alignment ofsequences, mask construction, and chimera check were performed with softwareprovided by the Ribosomal Database Project (20). Dendrograms were con-structed with PAUP (31) and MacClade 3.0 (19) software.
Nucleotide sequence accession numbers. The sequences determined in thisstudy have been deposited in the GenBank database under accession no.AF149878 to AF149893.
RESULTS
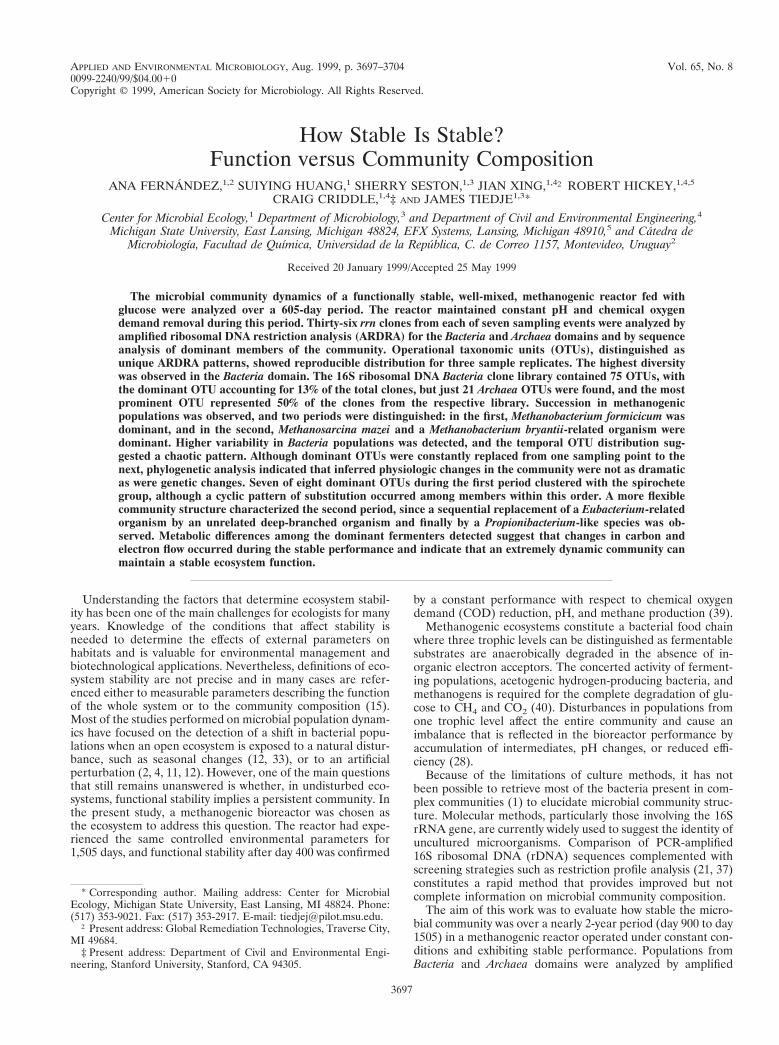
Reactor performance. The methanogenic reactor exhibited aconstant performance as measured by effluent pH and CODremoval from day 900 through day 1505, the period in whichthe community composition was studied (Fig. 1). The pH wasin the range of 6.85 to 7.07, and the COD removed was be-tween 89 and 99% until the reactor began to fail on day 1491.
ARDRA reproducibility. Three samples (A, B, and C) froma similar reactor were taken simultaneously and analyzed sep-arately. DNA extraction, Bacteria 16S rDNA amplification,cloning, and restriction analysis were applied to DNA fromeach replicate, and OTU profiles from the replicates werecompared. The three replicates showed a similar richness.Twenty-one OTUs were detected in samples B and C, and 22OTUs were detected in sample A (Fig. 2).
Clone distribution in the different OTUs was also very sim-ilar among the replicates. Patterns were organized in threegroups according to their presence and abundance in each
FIG. 1. Functional performance of the methanogenic reactor during the 605-day period of the community structure study. The reactor was operated for 1,505days, steady state was achieved at day 400, and the community analysis study wasstarted at day 900.
3698 FERNANDEZ ET AL. APPL. ENVIRON. MICROBIOL.

replicate. The first group included OTUs common to all thesamples (I, II, III, IV, and V). These represented 52.7% of thetotal clones analyzed in sample A and 55.5% of the total clonesanalyzed in samples B and C. The pattern distribution withinthis group was consistent in all the samples: the dominantOTU (I) had a frequency of 13.9% in sample A and of 16.7%in samples B and C. The distribution of the rarest pattern (V)was 5.5% in replicates A and C and 8.3% in replicate B(Fig. 2).
The second group comprised less than 14% of the clonesanalyzed in any sample. It contained OTUs which were ob-served twice (frequency, 5.5%) in the same sample but wereundetected in other samples (VI, VII, and VIII) and OTUswhich were observed once in two of three samples (IX, X, andXI) (Fig. 2). Finally, the third group comprised the uniqueOTUs: those that were observed just once in a sample andwere not detected in any other sample. The rare OTUs, whichconstituted a significant fraction of the community, repre-sented 30.5% (sample C), 33.3% (sample B), and 38.9% (sam-ple A) of the total clones. These results imply that in thiscommunity, the proportion of rare OTUs detected was consis-tent among the replicates (Fig. 2). Based on these results,ARDRA reproducibility was assumed for (i) pattern distribu-
tion and identity of the most abundant OTUs (frequency equalto or higher than 8.3%) and (ii) proportion of rare patterns.
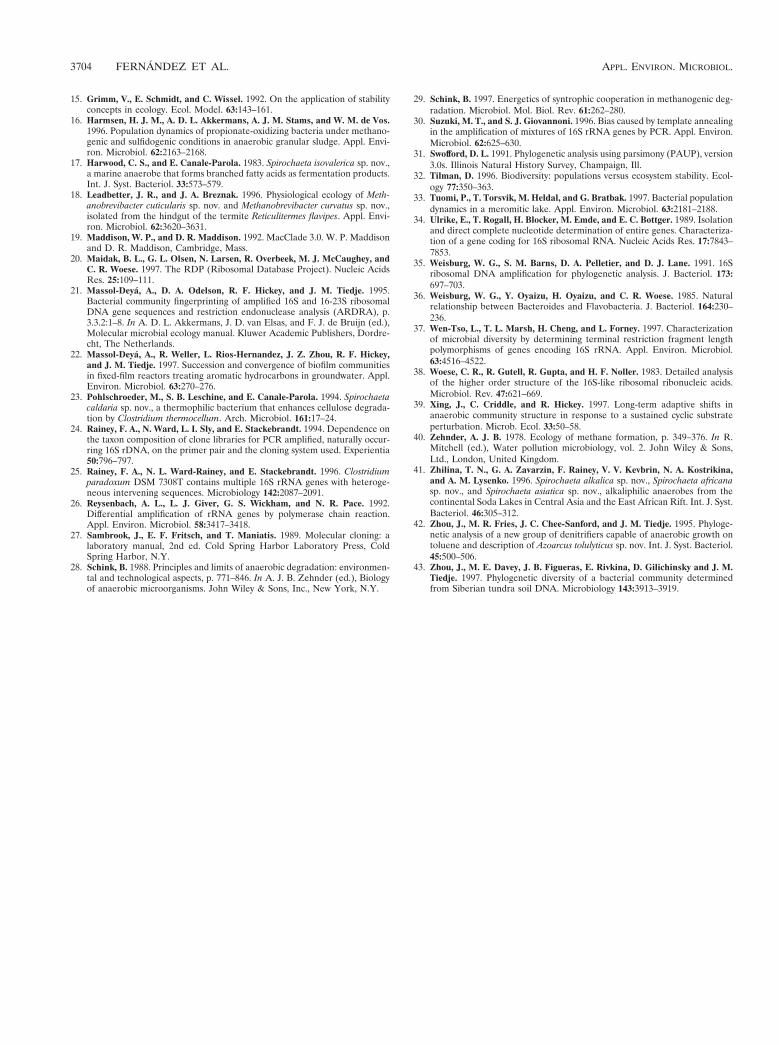
Archaea and Bacteria clone distribution. The reactor wassampled seven times during 605 days of steady-state operationfor ARDRA. Archaea and Bacteria from 36 clones for eachsampling point resulted in 252 clones analyzed from each do-main. The diversity of Archaea and Bacteria populations isdescribed on the basis of the total number of OTUs detected(richness) and the number and distribution of clones showingthe same OTU (evenness). Higher richness in the Bacteriapopulations was detected; 75 OTUs were found in this domain,whereas only 21 Archaea OTUs appeared during the sameperiod (Fig. 3). Clone distribution data also shows that diver-sity was higher in Bacteria populations. The three most fre-quent OTUs accounted for 80% of the clones in the Archaealibrary but for only 32% of the clones in the Bacteria library. Inaddition, the number of unique OTUs in both domains wassignificantly different: 5 and 17% for Archaea and Bacteria,respectively (Fig. 3).
Archaea population dynamics. Changes in the Archaea pop-ulations were observed by comparing ARDRA pattern fre-quencies during the course of reactor operation. Seven sam-ples were taken at time intervals ranging from 33 days to 289days. Archaea population succession was observed, and tworemarkably different periods were distinguished (Fig. 4). Thefirst period, from day 900 to day 1325, was characterized by lowdiversity due to the prevalence of the OTU AO-I (representingbetween 72 and 94% of the clones) and by the small proportionof different OTUs (less than seven OTUs at any samplingpoint). A notable shift was observed between days 1325 and1427. Three codominant OTUs (AO-II, AO-III, and AO-IV)now accounted for 69% of the clones, and their frequencieswere quite constant between days 1437 and 1505 (Fig. 4). Thehighest diversity during this interval was observed immediatelyafter the shift, at day 1437, when 12 different patterns weredetected.
Population succession could be recognized in samples takencloser to the population shift that occurred after day 1325.Dominant patterns from one period were present in a lowfrequency in the other period. Nevertheless, differences in per-sistence were observed: two prevalent OTUs (AO-II and AO-IV) from the second period were detected for up to 460 daysbefore they became dominant, but the dominant OTU in thefirst period (AO-I) was quickly displaced; it was undetectableby day 1470 after the community shift (Fig. 4). These results
FIG. 2. Bacteria ARDRA pattern distribution in three samples processedseparately. OTUs were defined by restriction with two enzymes. Unique OTUs(14, 12, and 11 in replicates A, B, and C, respectively) appeared once in this clonelibrary.
FIG. 3. OTU distribution in Archaea and Bacteria domains detected in the methanogenic reactor during 605 days of stable performance.
VOL. 65, 1999 HOW STABLE IS STABLE? 3699
suggest that dominant OTUs from the second period had ahigher fitness for the operational conditions.
Bacteria population dynamics. The Bacteria community wasmore variable than the Archaea community, as would be ex-pected because of the higher diversity detected in this domain(Fig. 3). Rapid changes occurred, and no long periods of par-ticular OTU persistence could be distinguished (Fig. 5). Fur-ther, almost no trends in population succession could be de-tected, even in a period as short as 33 days. Dominance was notmaintained by any OTU except for OTU EO-I, which predom-inated on days 900 and 1036 but was undetectable betweenthese dates and after day 1036. Some dominant OTUs (EO-II,EO-III, EO-IV, EO-V, and EO-VII) were detected sporadi-cally at low frequency (Fig. 5).
The diversity, measured as the ARDRA profile richness, wasalso chaotic. The total number of OTUs at each sampling pointranged between 8 and 24 with a mean of 13. The highestdiversity was detected at day 977, when 24 OTUs were ob-served and the three most abundant profiles accounted for only27.8% of the clones. However, dominance was observed at theclosest sampling dates: 77 days before and 59 days after, EO-IOTU represented 44.4 and 47.2% of the total clones, respec-tively. Subsequently, similar or more gradual evenness wasmaintained, and one OTU (day 1437) or two OTUs (days 1325,1470, and 1505) represented more than 40% of the clones. Thelowest diversity was observed concomitant with the shift inArchaea populations, at day 1437, when the OTU EO-II ac-counted for 80.5% of the clones and only eight OTUs (EO-II,EO-IV, and six unique OTUs) were distinguished (Fig. 5).
Phylogenetic analysis of dominant OTUs. rRNA sequenceand phylogenetic analysis was performed on the two mostabundant OTUs from each sampling point that exhibited afrequency equal to or higher than 8.3%, a value determinedfrom the replication study. Several clones with identical
ARDRA profiles from the two domains were sequenced, andthe sequences were compared (data not shown). A higherprobability of sequence divergence between clones in the sameOTU was expected for the Archaea domain because a shorterfragment (900 bp) was amplified. However, 100% sequencesimilarity was found in the seven ARDRA patterns analyzedfrom the dominant Archaea OTU (AO-I). The remaining pat-terns analyzed (three of EO-I, two of EO-V, and two of AO-III) showed minor sequence divergence (0.5% or lower).These results demonstrate that, although only two restrictionenzymes were used, rRNA diversity was not underestimated byARDRA.
(i) Archaea populations. Two of four dominant OTUs fromthis domain were characterized phylogenetically by partial se-quencing of 16S rDNA. The sequence of AO-I, dominantduring the first period of reactor operation, was 100% similarto the 16S rDNA sequence of Methanobacterium formicicum,and the sequence of AO-II, the most frequent OTU in thesecond period, exhibited a 99.7% similarity to the Methano-sarcina mazei sequence. This shift in dominance revealed animportant metabolic change, since a hydrogen- and formate-utilizing methanogen was replaced by a methylotrophic meth-anogen. The two codominant profiles during the second period(AO-III and AO-IV) were closely related to each other bysequence (99.7% similarity), indicating that subtle sequencedifferences were detected by ARDRA. The sequence of thisOTU was 8.0% dissimilar to the closest known methanogen,Methanobacterium bryantii.
(ii) Bacteria populations. Most of the 12 sequences of Bac-teria OTUs were not closely related to sequences of otherknown organisms (Fig. 6). The high diversity detected byARDRA in this domain was quite apparent since severalOTUs exhibited a high degree of sequence similarity.
The organization of OTUs according to their sequence sim-
FIG. 4. Dynamics of distribution of Archaea OTUs in the methanogenic reactor. OTUs were defined by ARDRA with two restriction enzymes, and frequencydistribution was calculated over 36 clones analyzed from each sample. Unique OTUs appeared once in the entire clone library.
3700 FERNANDEZ ET AL. APPL. ENVIRON. MICROBIOL.

ilarity showed four main clusters revealing an interesting tem-poral pattern. Six of seven dominant and codominant OTUs inthe first period clustered within the spirochete phylum. Each ofthe remaining three clusters corresponded mostly to OTUsoccurring at one of the three sampling dates during the secondperiod. One cluster with OTU EO-II includes bacteria belong-ing to the Eubacterium genus. The coexistent OTUs EO-VIIand EO-X showed 0.5% sequence divergence and were relatedto the Propionibacterium genus. The rrn sequence of the thirdcluster was 20% dissimilar to that of any known division. Itincluded the simultaneously occurring OTUs EO-III andEO-IV with 100% (partial) sequence similarity and OTUEO-VI (97.9% similar to the former), the dominant non-spi-rochete-related OTU present in the first period.
The spirochete cluster showed three main similarity groups(Fig. 6). OTU EO-I was closely related to the Spirochaeta sp.strain Antarctic, which belongs to the cluster of spirochetes ofmarine origin (group 3). The remaining two groups branchedwithin the Treponema-spirochete cluster and showed a 15%sequence dissimilarity to group 3 spirochetes. Group 1 spiro-chetes, whose closest relative is a thermophilic spirochete, Spi-rochaeta caldaria, included OTUs EO-XIV, EO-XI, and EO-IX. The group 2 spirochetes, which had sequences 4%divergent from those of group 1, included OTUs EO-VIII andEO-V.
DISCUSSION
Ecosystem stability encompasses a broad spectrum of defi-nitions, which resolve into two components: the measurablefunctional properties of the ecosystem and the populationcomposition. Currently, stability is more commonly measuredby the dynamics of a property of the whole ecosystem whileinformation about population stability is often dismissed. How-ever, population persistence is the most important property for
ecosystem stability since it is closely related to fitness of indi-viduals, and it is the fitness parameters that provide the infor-mation needed to manage natural communities (15). The re-lation between ecosystem stability and population stability hasrecently been studied most intensively in grassland plots. Pop-ulation variability, caused by interspecific competition, pro-duced compensatory effects over the total community, increas-ing ecosystem stability as measured by primary production(32). The results from our work indicate that an extremelydynamic community sustains a functionally stable ecosystem.Our data showed that prevalent members and diversity, withinboth Archaea and Bacteria domains, changed dramatically evenover short periods, 3.3 retention times. These results indicatedthat functional parameters like pH and COD are inadequate toreveal community structure variations.
Direct correlation between OTU distribution and speciesdistribution is uncertain because of multiple-copy rRNA genes(10, 25) and PCR and cloning biases (8, 24, 26, 30). Despitethese limitations, molecular methods can reveal the presenceof microorganisms that are undetectable by classical cultiva-tion techniques. In our case, this approach was particularlyvaluable since most of the sequences of dominant OTUs cor-respond to difficult-to-cultivate microorganisms, like spiro-chetes. Furthermore, the effects of these biases are minimizedwhen relative changes are studied in the same ecosystem andwhen the ARDRA profile distribution replicates, as was thecase in this study.
Diversity in the whole Bacteria community was considerablyhigher than that among Archaea in our reactor. Likewise, ex-tremely high diversity in the Bacteria domain has been ob-served in a fluidized bed reactor treating vinasse (14). In thatstudy, 16S rDNA sequence analysis of 460 clones revealed thepresence of 133 OTUs, with the most frequent OTU repre-senting less than 5% of the clones. On the other hand, the
FIG. 5. Dynamics of distribution of Bacteria OTUs in the methanogenic reactor. OTUs were defined by ARDRA with two restriction enzymes, and frequencydistribution was calculated over 36 clones analyzed from each sample. Unique OTUs appeared once in the entire clone library.
VOL. 65, 1999 HOW STABLE IS STABLE? 3701

Archaea domain revealed low variability, with six OTUs foundafter analysis of 98 clones, three of them representing 95% ofthe total clones (14). Most of the energy available in metha-nogenesis from glucose is spent during the first step of degra-dation (29). Consequently, higher yields in bacteria from thistrophic level can be expected; hence, replacement among pop-ulations and higher diversity would be more feasible. Althoughsyntrophism contributed to the carbon and electron flow in ourreactor, especially during the second period when the mainfermenters were butyrate or propionate producers, acetogenichydrogen-producing bacteria were not detected. This is to bepredicted, however, since they constitute a small fraction of thecommunity in anaerobic reactors (14, 16, 28) and would not beexpected given the size of our Bacteria clone library.
Our finding is in contrast to temporal population constancythat has been observed in other microbial environments evenwhen they are disturbed. Populations from several fluidizedbed reactors treating aromatic hydrocarbons converged to thesame climax community irrespective of seeding, time of start-up, or substrate, and they remained stable for a 4-month pe-riod (22). It is likely that the strong selection pressure providedby related substrates and the biofilm formation contributedconsiderably to stabilizing the community in these reactors.Additionally, seasonal permanence of dominant cyanobacte-rial populations from a hot spring microbial mat was measuredby denaturing gradient gel electrophoresis, but the authorssuggested that minor population changes might have beenundetected (12). Both of these habitats had a stable physicalmatrix, while ours did not.
The fluctuations of dominant populations observed in ourreactor indicate that a climax community was not achieved inthe 900 days previous to the community analysis study. Due tothe constancy of the environmental parameters and functionalperformance throughout the analysis period, it may be rea-soned that population succession was driven by the interactionsamong the members of the community. Three main trophiclevels are recognized in methanogenic reactors fed with a fer-mentable substrate (40). Microorganisms in these groups arestrongly interrelated, and an imbalance at any level could causea failure that would be reflected in the reactor function (28).Stable performance implies steady-state production and con-sumption of metabolites along the trophic chain; consequently,a population shift at one trophic level would likely require aconcerted change in the remaining populations to maintain thesteady state. Subsequent changes in populations could becaused by variations in particular metabolites as well as theirrates of production or consumption.
Phylogenetic analysis revealed that the genetic changes de-tected by ARDRA suggested metabolic variations in the com-munity. However, if similar physiology is assumed for phylo-genetically related taxa, the metabolic variation was lessdramatic than were the genetic changes observed. Figure 7summarizes the phylogenetic affiliation of dominant membersof the community and the functional performance of our re-actor. Two periods were distinguished based on the communitycomposition in both domains during the 605 days of reactoroperation. The first period, days 900 to 1325, was characterizedby the persistence and prevalence of Methanobacterium for-micicum and alternating ribotypes belonging to the spirochetecluster. During the second period, days 1437 to 1505, the mainmembers of the Archaea community were Methanosarcinamazei and a Methanobacterium bryantii-related OTU. Monthlysubstitution of metabolically different fermentative bacteriacharacterized this period. This suggests a strong dependencebetween the Bacteria and the Archaea members of the com-munity. However, the methanogenic groups present in thesecond period were metabolically more versatile, and there-
FIG. 6. Phylogram of representative Bacteria 16S rDNA cloned genes fromthe methanogenic reactor. A distance matrix was calculated by the maximum-likelihood method with the region of the 16S rRNA gene corresponding to E. colipositions 111 through 465. The phylogram shown was constructed from thisdistance matrix by the neighbor-joining method. Parsimony bootstrap valuesfrom 100 bootstrap replicates are shown on each node. Values below 50 are notshown. The scale bar represents an estimated 10% difference in nucleotidesequence.
FIG. 7. Summary of functional performance and community dynamics in themethanogenic reactor. Coexistence of dominant OTUs of the Archaea and Bac-teria domains is shown. Phylogenetic affiliations of the OTUs are indicated in theleft column. Sampling dates for community structure analysis are indicated byarrows.
3702 FERNANDEZ ET AL. APPL. ENVIRON. MICROBIOL.

fore, the dependence among members from the two trophiclevels was likely more moderate.
Although it is not possible to infer whether the driving forcebehind the community shift resides in one particular trophiclevel, it seems that, to achieve stability, a given arrangementamong populations is more important than any one specificpopulation. On the other hand, coexistence of the highestdiversity in the Archaea domain with the lowest diversity in theBacteria domain argues against the notion that increased di-versity at one trophic level necessarily favors increased diver-sity for a functionally linked trophic level.
Figure 7 shows that two levels of population change can bediscerned among the Bacteria 16S rDNA-defined populations:a first level where taxa from different genera (Spirochaeta,Eubacterium, and Propionibacterium) alternated in dominanceand a second level where a succession within the Spirochaeta-related cluster occurred. The latter is a cyclic pattern of pop-ulation substitution among group 3 spirochetes and group 1and group 2 spirochetes. The dominant spirochetes (group 3)at days 900 and 1036 were undetected at day 977, and theprevalent OTUs in days 977 (group 1) and 1325 (group 2) wererare at day 1036.
The order Spirochaetales constitutes an expanded phyloge-netic group exhibiting an rrn range of relatedness of 81.3 to96.4% among its members (41). However, succession and co-existence of very closely related members of this order (group1 and group 2 spirochetes) were observed in our reactor. Thissituation has been reported for other bacteria in natural envi-ronments, and it has been suggested that highly related popu-lations could coexist by adaptation to environmental parame-ters (12).
Prevalence of spirochetes constitutes an unusual communitystructure for methanogenic bioreactors. Although spirocheteshave been detected at a low frequency in an anaerobic reactor(14), dominance has been observed in only a few environ-ments, notably the termite hindgut (5). All isolated spirochetesferment glucose mainly to acetate, H2, and CO2, along withlesser and variable amounts of ethanol or lactate depending onthe species (7, 23, 41). In the presence of powerful hydrogenscavengers, like methanogens, it would be expected that mostof the electron flow would be routed to H2, and thus acetateand CO2 production would be favored at the expense of lactateor ethanol. Since methanogenic substrates would be produceddirectly from glucose, syntrophic bacteria would have an insig-nificant role, and the food chain would be completed with justtwo trophic levels. Although this particular electron flow hasbeen proposed for natural environments where the energyinput is low (28), to our knowledge it has not been describedfor methanogenic reactors.
Some spirochetes exhibit interesting strategies of survivalduring starvation that could explain their success in our reac-tor. The presence of purine interconversion enzymes (6) andthe ability to ferment amino acids to obtain energy for func-tions other than growth (17) enhance their capability to survivelow levels of available nutrients such as intermittent substratefeeding.
It is remarkable that a single simple substrate can maintainsuch a high population diversity. Presumably, the source of theemergent microorganisms is from within the reactor, sincemost of the prevalent microorganisms found are unlikely en-vironmental contaminants. In addition, it is improbable thatinvaders could overgrow the dominant microorganisms presentat such high density.
Considering that this reactor is a chemostat, it could beassumed that the transiently dominant populations grew at sub-dominant levels. Population redundancy, particularly among
glucose fermenters, indicates that selection by competitiveexclusion was precluded and suggests that a great variety ofmicroniches subsisted. While spatial heterogeneity could beneglected, other factors like use of energy sources other thanglucose, differences in kinetic parameters for substrate degra-dation, and differences in species capability to survive in thecyclic feed-starve cycle evidently created sufficient niche diver-sity to support the microbial diversity observed. Xing et al. (39)previously showed that this feeding regimen caused a shift inthe predominant glucose fermentative bacterial ribotypes andin the entire-community morphotypes compared to those of amother reactor constantly receiving the same average amountof glucose per day.
The results of the present work have shown that functionalstability does not imply community stability and that an ex-tremely dynamic community can be developed in a simpleecosystem. The large number and diversity of minority popu-lations likely contribute significantly to these dynamics.
ACKNOWLEDGMENTS
We thank Klaus Nusslein for assistance with ARDRA and SyedHashsham for running the reactor during the last period.
This work was supported by NSF grant no. DEB 9120006 to theCenter for Microbial Ecology. A.F. was partially supported by an OASgrant and by the Comision Sectorial de Investigacion Cientıfica, Uni-versidad de la Republica, Uruguay.
REFERENCES
1. Amann, R. I., W. Ludwig, and K. H. Schleifer. 1995. Phylogenetic identifi-cation and in situ detection of individual microbial cells without cultivation.Microbiol. Rev. 59:143–169.
2. Atlas, R. M., A. Horowitz, M. Krichevsky, and A. K. Bej. 1991. Response ofmicrobial populations to environmental disturbance. Microbiol. Ecol. 22:249–256.
3. Bateson, M. M., and D. M. Ward. 1996. Methods for extracting DNA frommicrobial mats and cultivated microorganisms: high molecular weight DNAfrom French press lysis, p. 1.1.4:1–7. In A. D. L. Akkermans, J. D. van Elsas,and F. J. de Bruijn (ed.), Molecular microbial ecology manual. KluwerAcademic Publishers, Dordrecht, The Netherlands.
4. Borneman, J., and E. C. Triplett. 1997. Molecular microbial diversity in soilsfrom eastern Amazonia: evidence for unusual microorganisms and microbialpopulation shifts associated with deforestation. Appl. Environ. Microbiol.63:2647–2653.
5. Breznak, J. A. 1984. Hindgut spirochetes of termites and Cryptocercuspunctulatus, p. 67–70. In N. R. Krieg and J. G. Holt (ed.), Bergey’s manualof systematic bacteriology, vol. 1. The Williams & Wilkins Co., Baltimore,Md.
6. Canale-Parola, E., and G. W. Kidder. 1982. Enzymatic activities for inter-conversion of purines in spirochetes. J. Bacteriol. 152:1105–1110.
7. Canale-Parola, E. 1984. Spirochaeta, p. 39–46. In N. R. Krieg and J. G. Holt(ed.), Bergey’s manual of systematic bacteriology, vol. 1. The Williams &Wilkins Co., Baltimore, Md.
8. Chandler, D. P., J. K. Fredrickson, and J. Brockman. 1997. Effect of PCRtemplate concentration on the composition and distribution of total com-munity 16S rDNA clone libraries. Mol. Ecol. 6:475–482.
9. DeLong, E. F. 1992. Archaea in coastal marine environments. Proc. Natl.Acad. Sci. USA 89:5685–5689.
10. Farrelly, V., F. A. Rainey, and E. Stackebrandt. 1995. Effect of genome sizeand rrn gene copy number on PCR amplification of 16S rRNA genes from amixture of bacterial species. Appl. Environ. Microbiol. 61:2798–2801.
11. Ferris, M. J., S. C. Nold, N. P. Revsbech, and D. M. Ward. 1997. Populationstructure and physiological changes within a hot spring microbial mat com-munity following disturbance. Appl. Environ. Microbiol. 63:1367–1374.
12. Ferris, M. J., and D. M. Ward. 1997. Seasonal distributions of dominant 16SrRNA-defined populations in a hot spring microbial mat examined by de-naturing gradient gel electrophoresis. Appl. Environ. Microbiol. 63:1375–1381.
13. Fries, M. R., G. D. Hopkins, P. L. McCarty, L. J. Forney, and J. M. Tiedje.1997. Microbial succession during a field evaluation of phenol and toluene asthe primary substrates for trichloroethene cometabolism. Appl. Environ.Microbiol. 63:1515–1522.
14. Godon, J. J., E. Sumstein, P. Dabert, F. Habouzit, and R. Moletta. 1997.Molecular microbial diversity of an anaerobic digestor as determined bysmall-subunit rDNA sequence analysis. Appl. Environ. Microbiol. 63:2802–2813.
VOL. 65, 1999 HOW STABLE IS STABLE? 3703
15. Grimm, V., E. Schmidt, and C. Wissel. 1992. On the application of stabilityconcepts in ecology. Ecol. Model. 63:143–161.
16. Harmsen, H. J. M., A. D. L. Akkermans, A. J. M. Stams, and W. M. de Vos.1996. Population dynamics of propionate-oxidizing bacteria under methano-genic and sulfidogenic conditions in anaerobic granular sludge. Appl. Envi-ron. Microbiol. 62:2163–2168.
17. Harwood, C. S., and E. Canale-Parola. 1983. Spirochaeta isovalerica sp. nov.,a marine anaerobe that forms branched fatty acids as fermentation products.Int. J. Syst. Bacteriol. 33:573–579.
18. Leadbetter, J. R., and J. A. Breznak. 1996. Physiological ecology of Meth-anobrevibacter cuticularis sp. nov. and Methanobrevibacter curvatus sp. nov.,isolated from the hindgut of the termite Reticulitermes flavipes. Appl. Envi-ron. Microbiol. 62:3620–3631.
19. Maddison, W. P., and D. R. Maddison. 1992. MacClade 3.0. W. P. Maddisonand D. R. Maddison, Cambridge, Mass.
20. Maidak, B. L., G. L. Olsen, N. Larsen, R. Overbeek, M. J. McCaughey, andC. R. Woese. 1997. The RDP (Ribosomal Database Project). Nucleic AcidsRes. 25:109–111.
21. Massol-Deya, A., D. A. Odelson, R. F. Hickey, and J. M. Tiedje. 1995.Bacterial community fingerprinting of amplified 16S and 16-23S ribosomalDNA gene sequences and restriction endonuclease analysis (ARDRA), p.3.3.2:1–8. In A. D. L. Akkermans, J. D. van Elsas, and F. J. de Bruijn (ed.),Molecular microbial ecology manual. Kluwer Academic Publishers, Dordre-cht, The Netherlands.
22. Massol-Deya, A., R. Weller, L. Rios-Hernandez, J. Z. Zhou, R. F. Hickey,and J. M. Tiedje. 1997. Succession and convergence of biofilm communitiesin fixed-film reactors treating aromatic hydrocarbons in groundwater. Appl.Environ. Microbiol. 63:270–276.
23. Pohlschroeder, M., S. B. Leschine, and E. Canale-Parola. 1994. Spirochaetacaldaria sp. nov., a thermophilic bacterium that enhances cellulose degrada-tion by Clostridium thermocellum. Arch. Microbiol. 161:17–24.
24. Rainey, F. A., N. Ward, L. I. Sly, and E. Stackebrandt. 1994. Dependence onthe taxon composition of clone libraries for PCR amplified, naturally occur-ring 16S rDNA, on the primer pair and the cloning system used. Experientia50:796–797.
25. Rainey, F. A., N. L. Ward-Rainey, and E. Stackebrandt. 1996. Clostridiumparadoxum DSM 7308T contains multiple 16S rRNA genes with heteroge-neous intervening sequences. Microbiology 142:2087–2091.
26. Reysenbach, A. L., L. J. Giver, G. S. Wickham, and N. R. Pace. 1992.Differential amplification of rRNA genes by polymerase chain reaction.Appl. Environ. Microbiol. 58:3417–3418.
27. Sambrook, J., E. F. Fritsch, and T. Maniatis. 1989. Molecular cloning: alaboratory manual, 2nd ed. Cold Spring Harbor Laboratory Press, ColdSpring Harbor, N.Y.
28. Schink, B. 1988. Principles and limits of anaerobic degradation: environmen-tal and technological aspects, p. 771–846. In A. J. B. Zehnder (ed.), Biologyof anaerobic microorganisms. John Wiley & Sons, Inc., New York, N.Y.
29. Schink, B. 1997. Energetics of syntrophic cooperation in methanogenic deg-radation. Microbiol. Mol. Biol. Rev. 61:262–280.
30. Suzuki, M. T., and S. J. Giovannoni. 1996. Bias caused by template annealingin the amplification of mixtures of 16S rRNA genes by PCR. Appl. Environ.Microbiol. 62:625–630.
31. Swofford, D. L. 1991. Phylogenetic analysis using parsimony (PAUP), version3.0s. Illinois Natural History Survey, Champaign, Ill.
32. Tilman, D. 1996. Biodiversity: populations versus ecosystem stability. Ecol-ogy 77:350–363.
33. Tuomi, P., T. Torsvik, M. Heldal, and G. Bratbak. 1997. Bacterial populationdynamics in a meromitic lake. Appl. Environ. Microbiol. 63:2181–2188.
34. Ulrike, E., T. Rogall, H. Blocker, M. Emde, and E. C. Bottger. 1989. Isolationand direct complete nucleotide determination of entire genes. Characteriza-tion of a gene coding for 16S ribosomal RNA. Nucleic Acids Res. 17:7843–7853.
35. Weisburg, W. G., S. M. Barns, D. A. Pelletier, and D. J. Lane. 1991. 16Sribosomal DNA amplification for phylogenetic analysis. J. Bacteriol. 173:697–703.
36. Weisburg, W. G., Y. Oyaizu, H. Oyaizu, and C. R. Woese. 1985. Naturalrelationship between Bacteroides and Flavobacteria. J. Bacteriol. 164:230–236.
37. Wen-Tso, L., T. L. Marsh, H. Cheng, and L. Forney. 1997. Characterizationof microbial diversity by determining terminal restriction fragment lengthpolymorphisms of genes encoding 16S rRNA. Appl. Environ. Microbiol.63:4516–4522.
38. Woese, C. R., R. Gutell, R. Gupta, and H. F. Noller. 1983. Detailed analysisof the higher order structure of the 16S-like ribosomal ribonucleic acids.Microbiol. Rev. 47:621–669.
39. Xing, J., C. Criddle, and R. Hickey. 1997. Long-term adaptive shifts inanaerobic community structure in response to a sustained cyclic substrateperturbation. Microb. Ecol. 33:50–58.
40. Zehnder, A. J. B. 1978. Ecology of methane formation, p. 349–376. In R.Mitchell (ed.), Water pollution microbiology, vol. 2. John Wiley & Sons,Ltd., London, United Kingdom.
41. Zhilina, T. N., G. A. Zavarzin, F. Rainey, V. V. Kevbrin, N. A. Kostrikina,and A. M. Lysenko. 1996. Spirochaeta alkalica sp. nov., Spirochaeta africanasp. nov., and Spirochaeta asiatica sp. nov., alkaliphilic anaerobes from thecontinental Soda Lakes in Central Asia and the East African Rift. Int. J. Syst.Bacteriol. 46:305–312.
42. Zhou, J., M. R. Fries, J. C. Chee-Sanford, and J. M. Tiedje. 1995. Phyloge-netic analysis of a new group of denitrifiers capable of anaerobic growth ontoluene and description of Azoarcus tolulyticus sp. nov. Int. J. Syst. Bacteriol.45:500–506.
43. Zhou, J., M. E. Davey, J. B. Figueras, E. Rivkina, D. Gilichinsky and J. M.Tiedje. 1997. Phylogenetic diversity of a bacterial community determinedfrom Siberian tundra soil DNA. Microbiology 143:3913–3919.
3704 FERNANDEZ ET AL. APPL. ENVIRON. MICROBIOL.