Climatology of aerosol composition (organic versus inorganic) at nonurban sites on a west-east...
15
Climatology of aerosol composition (organic versus inorganic) at nonurban sites on a west-east transect across Europe C. A. Pio, 1 M. Legrand, 2 T. Oliveira, 1 J. Afonso, 1 C. Santos, 1 A. Caseiro, 1,4 P. Fialho, 3 F. Barata, 3 H. Puxbaum, 4 A. Sanchez-Ochoa, 4 A. Kasper-Giebl, 4 A. Gelencse ´r, 5 S. Preunkert, 2 and M. Schock 6 Received 15 September 2006; revised 11 December 2006; accepted 6 July 2007; published 1 September 2007. [1] In the framework of the European CARBOSOL project (Present and Retrospective State of Organic versus Inorganic Aerosol over Europe: Implications for Climate), atmospheric aerosol was continuously sampled for 2 years at six sites along a west-east transect extending from Azores, in the mid-Atlantic Ocean, to K-Puszta (Hungary), in central Europe. Aerosols were analyzed for 210 Pb, inorganic ions, elemental (EC) and organic (OC) carbon, water soluble organic carbon (WSOC), macromolecular type (humic-like) organic substances (HULIS), C 2 –C 5 diacids, cellulose, and levoglucosan. Pooled aerosol filters were also used for the identification of different families of organic compounds by gas chromatography/mass spectrometry, GC/MS, as well as 14 C determinations. The data resulted in a climatological overview of the aerosol composition over Europe in the various seasons, from west to east, and from the boundary layer to the free troposphere. The paper first summarizes the characteristics of the sites and collected samples and then focuses on the aerosol mass partitioning (mass closure, inorganic versus organic, EC versus OC, water soluble versus insoluble OC), giving an insight on the sources of carbonaceous aerosol present in rural and natural background areas in Europe. It also introduces the main role of other companion papers dealing with CARBOSOL aerosol data that are also presented in this issue. Citation: Pio, C. A., et al. (2007), Climatology of aerosol composition (organic versus inorganic) at nonurban sites on a west-east transect across Europe, J. Geophys. Res., 112, D23S02, doi:10.1029/2006JD008038. 1. Introduction [2] Atmospheric aerosols influence climate directly through scattering and absorbing radiation, and indirectly by acting as condensation nuclei for clouds, with modifi- cation of the clouds optical properties and lifetime, probably resulting in a negative forcing. Furthermore, aerosols have deleterious health effects as they often contain toxins and/or carcinogens that contribute to cardiopulmonary diseases and mortality [Pope, 2000; Po ¨schl, 2005]. [3] Model estimates of the global cooling due to man- made aerosols suggest that anthropogenic aerosols could counterbalance the warming due to growing levels of greenhouse gases by some 30%, possibly up to 50–80% [Charlson et al., 1992; Penner et al., 1994; Jacobson, 2001; Bellouin et al., 2005]. Thus aerosols may have weakened the rate of the global warming during the last century [Andreae et al., 2005]. However, numerous uncertainties still exist in estimating the climatic impact of aerosols, which is thought to be larger over industrialized regions [Menon, 2004]. This is mostly because the spatial distribu- tion of aerosols is very heterogeneous, requiring numerous investigations in time and space to serve as inputs and constraints for climate models. [4] The most important inorganic aerosol component in terms of radiative forcing is sulfate which has well known optical properties. The sources of sulfate are rather well quantified and SO 2 anthropogenic emissions are well docu- mented, at least for the regions of interest in this study (western and central Europe) [Lefohn et al., 1999; van Aardenne et al., 2001]. The present-day spatial distribution of sulfate is documented throughout Europe at numerous low-level sites, as well as at some sites located above 1000 m. Current evaluations of the present-day direct radiative forcing by sulfate over Europe are in self agreement, within a factor of 2, with the main uncertainties related to the assumed sulfate distribution which depends on deployed chemistry-transport schemes, the assumption on size distri- JOURNAL OF GEOPHYSICAL RESEARCH, VOL. 112, D23S02, doi:10.1029/2006JD008038, 2007 Click Here for Full Articl e 1 Centre for Environmental and Marine Studies and Department of Environment, University of Aveiro, Aveiro, Portugal. 2 Laboratoire de Glaciologie et Ge ´ophysique de l’Environnement, Centre National de la Recherche Scientifique, Saint Martin d’He ´res, France. 3 Department of Agrarian Sciences, University of the Azores, Angra do Heroı ´smo, Portugal. 4 Institute for Chemical Technologies and Analytics, Vienna University of Technology, Vienna, Austria. 5 Air Chemistry Group at the Hungarian Academy of Sciences, University of Pannonia, Veszpre ´m, Hungary. 6 Institut fu ¨r Umweltphysik, Universita ¨t Heidelberg, Heidelberg, Germany. Copyright 2007 by the American Geophysical Union. 0148-0227/07/2006JD008038$09.00 D23S02 1 of 15
-
Upload
unigranrio -
Category
Documents
-
view
1 -
download
0
Transcript of Climatology of aerosol composition (organic versus inorganic) at nonurban sites on a west-east...

Climatology of aerosol composition (organic versus inorganic) at
nonurban sites on a west-east transect across Europe
C. A. Pio,1 M. Legrand,2 T. Oliveira,1 J. Afonso,1 C. Santos,1 A. Caseiro,1,4 P. Fialho,3
F. Barata,3 H. Puxbaum,4 A. Sanchez-Ochoa,4 A. Kasper-Giebl,4 A. Gelencser,5
S. Preunkert,2 and M. Schock6
Received 15 September 2006; revised 11 December 2006; accepted 6 July 2007; published 1 September 2007.
[1] In the framework of the European CARBOSOL project (Present and RetrospectiveState of Organic versus Inorganic Aerosol over Europe: Implications for Climate),atmospheric aerosol was continuously sampled for 2 years at six sites along a west-easttransect extending from Azores, in the mid-Atlantic Ocean, to K-Puszta (Hungary),in central Europe. Aerosols were analyzed for 210Pb, inorganic ions, elemental (EC) andorganic (OC) carbon, water soluble organic carbon (WSOC), macromolecular type(humic-like) organic substances (HULIS), C2–C5 diacids, cellulose, and levoglucosan.Pooled aerosol filters were also used for the identification of different families of organiccompounds by gas chromatography/mass spectrometry, GC/MS, as well as 14Cdeterminations. The data resulted in a climatological overview of the aerosol compositionover Europe in the various seasons, from west to east, and from the boundary layer to thefree troposphere. The paper first summarizes the characteristics of the sites andcollected samples and then focuses on the aerosol mass partitioning (mass closure,inorganic versus organic, EC versus OC, water soluble versus insoluble OC), giving aninsight on the sources of carbonaceous aerosol present in rural and natural backgroundareas in Europe. It also introduces the main role of other companion papers dealingwith CARBOSOL aerosol data that are also presented in this issue.
Citation: Pio, C. A., et al. (2007), Climatology of aerosol composition (organic versus inorganic) at nonurban sites on a west-east
transect across Europe, J. Geophys. Res., 112, D23S02, doi:10.1029/2006JD008038.
1. Introduction
[2] Atmospheric aerosols influence climate directlythrough scattering and absorbing radiation, and indirectlyby acting as condensation nuclei for clouds, with modifi-cation of the clouds optical properties and lifetime, probablyresulting in a negative forcing. Furthermore, aerosols havedeleterious health effects as they often contain toxins and/orcarcinogens that contribute to cardiopulmonary diseases andmortality [Pope, 2000; Poschl, 2005].[3] Model estimates of the global cooling due to man-
made aerosols suggest that anthropogenic aerosols could
counterbalance the warming due to growing levels ofgreenhouse gases by some 30%, possibly up to 50–80%[Charlson et al., 1992; Penner et al., 1994; Jacobson, 2001;Bellouin et al., 2005]. Thus aerosols may have weakenedthe rate of the global warming during the last century[Andreae et al., 2005]. However, numerous uncertaintiesstill exist in estimating the climatic impact of aerosols,which is thought to be larger over industrialized regions[Menon, 2004]. This is mostly because the spatial distribu-tion of aerosols is very heterogeneous, requiring numerousinvestigations in time and space to serve as inputs andconstraints for climate models.[4] The most important inorganic aerosol component in
terms of radiative forcing is sulfate which has well knownoptical properties. The sources of sulfate are rather wellquantified and SO2 anthropogenic emissions are well docu-mented, at least for the regions of interest in this study(western and central Europe) [Lefohn et al., 1999; vanAardenne et al., 2001]. The present-day spatial distributionof sulfate is documented throughout Europe at numerouslow-level sites, as well as at some sites located above 1000m.Current evaluations of the present-day direct radiativeforcing by sulfate over Europe are in self agreement, withina factor of 2, with the main uncertainties related to theassumed sulfate distribution which depends on deployedchemistry-transport schemes, the assumption on size distri-
JOURNAL OF GEOPHYSICAL RESEARCH, VOL. 112, D23S02, doi:10.1029/2006JD008038, 2007ClickHere
for
FullArticle
1Centre for Environmental and Marine Studies and Department ofEnvironment, University of Aveiro, Aveiro, Portugal.
2Laboratoire de Glaciologie et Geophysique de l’Environnement,Centre National de la Recherche Scientifique, Saint Martin d’Heres, France.
3Department of Agrarian Sciences, University of the Azores, Angra doHeroısmo, Portugal.
4Institute for Chemical Technologies and Analytics, Vienna Universityof Technology, Vienna, Austria.
5Air Chemistry Group at the Hungarian Academy of Sciences,University of Pannonia, Veszprem, Hungary.
6Institut fur Umweltphysik, Universitat Heidelberg, Heidelberg,Germany.
Copyright 2007 by the American Geophysical Union.0148-0227/07/2006JD008038$09.00
D23S02 1 of 15
bution and the degree of internal or external mixing[Boucher et al., 1998]. Much larger uncertainties exist inevaluating the indirect effect [Penner et al., 1998; Lohmannet al., 2000; Menon, 2004].[5] Although carbonaceous particles are now recognized,
together with sulfate, as major components of fine aerosol[Heintzenberg, 1989; Zappoli et al., 1999], there is a largeuncertainty on their sources (biogenic versus anthropogenic,primary versus secondary), their complex chemical natureand optical properties [Gelencser, 2004]. Total carbon inatmospheric aerosol can be routinely determined. Analyticalmethods are able to differentiate between organic (OC, ascattering material), and elemental carbon (EC), or blackcarbon (BC), a light absorbing material with a graphite-typecrystalline structure. Usually the term BC is used formeasurements based purely on optical methods, while ECis associated with thermal analytical methods and thedirect determination of carbon [Gelencser, 2004]. The splitbetween OC and EC is rather arbitrary and has been asubject of controversy for the last decades [Schmid et al.,2001]. EC lies generally in the submicron range whereasOC exhibits a wider size distribution, which remains poorlydocumented. The hygroscopic properties of OC and EC arenot well established, although laboratory studies havesuggested hydrophobic behavior for fresh particles andenhancement of hygroscopicity after contact with oxidants[Gelencser, 2004]. Bulk OC can be divided into watersoluble (WSOC) and water insoluble (WinOC) parts. Thehygroscopic properties of bulk OC are widely unknownalthough some WSOC species like dicarboxylic acids areknown to be very hygroscopic [Saxena et al., 1995].[6] In the existing data, EC and OC are mainly separated
as carbonaceous fractions, and only very recent studiesstarted to discriminate WSOC and WinOC. On the otherhand, organic speciation using recent analytical methodshave failed to assign more than 15% of total carbon toindividual organic compound classes such as n-alkanes,carboxylic acids, terpenoids, etc. [Alves et al., 2002; Pioet al., 2001]. It seems that failure in organic speciationresults from the fact that most OC in aerosol is contained inoligomeric or polymeric matter. Spectroscopic data onWSOC fraction shows that its properties present largesimilarities to those of terrestrial or aquatic humic andfulvic acids, and recently it was demonstrated that theywere made up of similar structural units [Simoneit andMazurek, 1982]. Another important fraction was shown toconsist of other biopolymers such as cellulose [Puxbaumand Tenze-Kunit, 2003]. Given that, the organic oligomersand polymers may constitute a major part of OC, but theirorigins are still an open question.[7] Until now most of the research on carbonaceous
aerosol has been focused on urban areas, where trafficrepresents a main source of pollution, or on areas highlyimpacted by biomass burning. In contrast, only a fewstudies have investigated remote, rural or semirural environ-ments, and most of them were restricted to short-timecampaigns (see Putaud et al. [2004] for a recent reviewfocused on Europe).[8] This paper gives an overview of the network sampling
scheme deployed to measure inorganic and carbonaceousaerosol constituents at rural and background sites in Europe,in the framework of the European CARBOSOL project
[Legrand and Puxbaum, 2007]. It focuses on major frac-tions of aerosol, namely the rather well-known inorganicions, EC and OC, and its different subfractions versusvolatility, and the water soluble organic fraction. Theclimatology of these aerosol fractions is discussed, withbackup of information from 210Pb, to highlight the effect ofcontinentality along the west to east transect, as well as thevertical mixing, particularly at mountain sites. The paperalso introduces several companion papers of this issuededicated to more specific organic species investigated inparallel during the CARBOSOL project.
2. Sampling
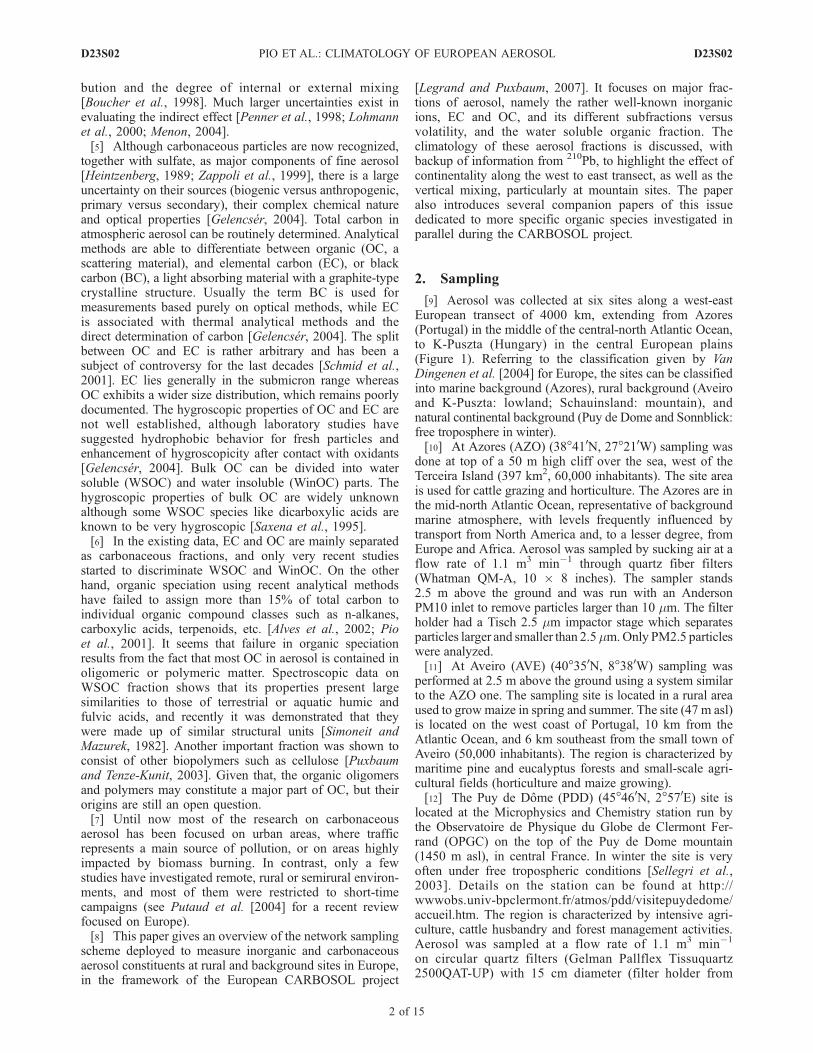
[9] Aerosol was collected at six sites along a west-eastEuropean transect of 4000 km, extending from Azores(Portugal) in the middle of the central-north Atlantic Ocean,to K-Puszta (Hungary) in the central European plains(Figure 1). Referring to the classification given by VanDingenen et al. [2004] for Europe, the sites can be classifiedinto marine background (Azores), rural background (Aveiroand K-Puszta: lowland; Schauinsland: mountain), andnatural continental background (Puy de Dome and Sonnblick:free troposphere in winter).[10] At Azores (AZO) (38�410N, 27�210W) sampling was
done at top of a 50 m high cliff over the sea, west of theTerceira Island (397 km2, 60,000 inhabitants). The site areais used for cattle grazing and horticulture. The Azores are inthe mid-north Atlantic Ocean, representative of backgroundmarine atmosphere, with levels frequently influenced bytransport from North America and, to a lesser degree, fromEurope and Africa. Aerosol was sampled by sucking air at aflow rate of 1.1 m3 min�1 through quartz fiber filters(Whatman QM-A, 10 � 8 inches). The sampler stands2.5 m above the ground and was run with an AndersonPM10 inlet to remove particles larger than 10 mm. The filterholder had a Tisch 2.5 mm impactor stage which separatesparticles larger and smaller than 2.5mm.Only PM2.5 particleswere analyzed.[11] At Aveiro (AVE) (40�350N, 8�380W) sampling was
performed at 2.5 m above the ground using a system similarto the AZO one. The sampling site is located in a rural areaused to grow maize in spring and summer. The site (47 m asl)is located on the west coast of Portugal, 10 km from theAtlantic Ocean, and 6 km southeast from the small town ofAveiro (50,000 inhabitants). The region is characterized bymaritime pine and eucalyptus forests and small-scale agri-cultural fields (horticulture and maize growing).[12] The Puy de Dome (PDD) (45�460N, 2�570E) site is
located at the Microphysics and Chemistry station run bythe Observatoire de Physique du Globe de Clermont Fer-rand (OPGC) on the top of the Puy de Dome mountain(1450 m asl), in central France. In winter the site is veryoften under free tropospheric conditions [Sellegri et al.,2003]. Details on the station can be found at http://wwwobs.univ-bpclermont.fr/atmos/pdd/visitepuydedome/accueil.htm. The region is characterized by intensive agri-culture, cattle husbandry and forest management activities.Aerosol was sampled at a flow rate of 1.1 m3 min�1
on circular quartz filters (Gelman Pallflex Tissuquartz2500QAT-UP) with 15 cm diameter (filter holder from
D23S02 PIO ET AL.: CLIMATOLOGY OF EUROPEAN AEROSOL
2 of 15
D23S02

Digitel). The air inlet is located 6 m above the ground andequipped with a heated rain/snow shelter (Digitel) which hasa cutoff size of 10 mm.[13] The Schauinsland (SIL) (47�550N, 07�540E) sam-
pling site is located at the Global Atmosphere Watch(GAW) station run by the German Federal EnvironmentalAgency (http://www.empa.ch/gaw/gawsis/reports.asp?StationID=93). The station is on a mountain ridge (1205 m asl)in the Black Forest (southwestern Germany). It is sur-rounded by coniferous forests (50%), meadows (40%)and some agricultural fields (10%). The city of Freiburg islocated in the Rhine valley at 12 km southwest from thesite. The station is usually situated above the ground-level atmospheric inversion layer of the densely populatedRhine Valley. However, during summer, strong thermalconvections may transport air masses from the Rhine valleyto the SIL station. Aerosol was sampled at a flow rate of0.9 m3 min�1 on circular quartz filters (Gelman PallflexTissuquartz 2500QAT-UP) with a diameter of 15 cm. Theair inlet, similar to the PDD one, was located at 4 m abovethe ground.[14] The Sonnblick (SBO) (47�030N, 12�570E) site is the
Sonnblick Observatory (SBO) operated by the CentralInstitute for Meteorology and Geodynamics. It is locatedon a mountain peak (3106 m asl) in the main ridge of theAustrian Alps and is frequently above the atmosphericmixing layer [Kasper and Puxbaum, 1998]. The observa-tory is supplied with electricity and has no local sources ofexhaust fumes. More details on SBO can be found at http://www.amap.no/envinet/site.cfm?SiteID=4. Atmosphericaerosol was sampled with a high-volume sampler (Digitel)at a flow rate of 0.5 m3 min�1 on quartz fiber (GelmanPallflex Tissuquartz 2500QAT-UP) 15 cm diameter filters.The sampler is set up on the roof platform of the observa-tory and is equipped with a PM2.5 inlet.
[15] At K-Puszta (KPZ) (46�580N, 19�350E) aerosols werecollected at the station run by the Hungarian MeteorologicalService and the University of Veszprem, as part of the GAWand EMEP (Convention on Long-range Transboundary AirPollution) (http://www.nilu.no/projects/ccc/sitedescriptions/hu/index.html) networks. The site is in the middle ofthe Hungarian Plain, 60 km southeast from Budapest(1.9million inhabitants). The largest nearby town (Kecskemet,110,000 inhabitants) is located 15 km southeast from thestation. The sampling site is surrounded by forests (62%coniferous trees) interspersed with clearings. Aerosol wassampled at a flow rate of 0.6 m3 min�1 (Sierra-Andersenimpactor) on quartz fiber filters (Whatman QM-A) of 20 �25 cm size. The sampler is located at 7 m above ground andwas configured to remove particles larger than 2 mm.[16] As above mentioned, in contrast to AZO, AVE, SBO
and KPZ where a PM 2–2.5 inlet was deployed, at SIL andPDD a PM 10 inlet was used. That has to be kept in mindwhen comparing data related to coarse particles. Neverthe-less, a size distribution study carried in different types of airmasses at PDD have shown that, except during sporadicSaharan dust event, the aerosol mass (organic and inorganic)is mainly present below 3 mm [Sellegri et al., 2003].[17] Samples were collected, almost continuously, during
2 full years at each site. At AZO, AVE and KPZ, samplingwas initiated beginning of July 2003. At the remaining sitessampling started in October of the same year. At AVE andSIL no weekly samples were lost. At other sites, such asAZO, several samples could not be collected properly,mainly in winter, as result of equipment breakdown associ-ated with bad weather conditions and electricity supplyfailures. The 538 weekly aerosol filters collected at the sixsites were analyzed for inorganic ions, EC and OC, WSOC,HULIS, C2-C5 dicarboxylic acids, cellulose, and levoglu-cosan. Except at AZO all filters were investigated for210Pb. Weekly filter samples, collected from July 2002 to
Figure 1. Location of the six CARBOSOL sites in Europe.
D23S02 PIO ET AL.: CLIMATOLOGY OF EUROPEAN AEROSOL
3 of 15
D23S02
September 2003, were pooled monthly (86 samples) for theidentification of different class species (alkanes, aldehydes,ketones, alcohols, acids, and aromatics) by GC/MS. Withthe exception of AZO, 65 weekly aerosol filters collected atthe 5 other sites were selected, by considering their seasonand 210Pb levels as related to the continentality of thesampled air mass (total of 13 single filters and 5 pooledsamples) for 14C determinations. Additional measurementsincluded a few size-segregated sampling with a high-volume impactor at AVE and KPZ.[18] To collect enough material for conducting all analy-
sis, even at remote oceanic and mountain sites, weeklysampling was applied to avoid problems related to detectionlimits of the deployed analytical methods. Because of thelong sampling period, alteration of aerosol may haveoccurred on filters during sampling in relation to eitherthe organic or inorganic constituents of aerosol. During thelong sampling period it is probable that filtered organicparticulate matter suffers chemical transformation resultingin partial oxidation of the more thermodynamically unstableorganic species, as result of attack by strong oxidants, such asozone, over the filter. This has to be taken into account in theinterpretation of the results. Also condensation/volatilizationprocesses may happen into and from the deposited particlesand on reactive sites on filter quartz fibers. Therefore resultsfor semivolatile compounds, such as low ring number PAHs(poli-aromatic hydrocarbons) and ammonium nitrate, haveto be regarded with precaution.[19] It can, however, been assumed that, during sampling,
equilibrium between gas and particulate phase wouldgovern the behavior of the filtered aerosol similarly to whathappens in the atmosphere. Furthermore the large mass ofparticles collected would reduce potential adsorption ofsemivolatile organic and inorganic compounds on activesites of the quartz fibers surface, as result of their rapidsaturation.[20] To reduce contamination by organic material, quartz
filters for PDD, SIL and SBO were prefired in factory,whereas for AZO, AVE and KPZ, filters were pretreated byheating in a furnace during several hours at 500–700�C inlaboratory. After that, filters were wrapped in thermallytreated and cleaned aluminum foil.[21] After sampling, filter samples were folded in two,
with the exposed side face to face, wrapped in aluminumfoil and immediately transported to the laboratory in chargeof the sampling site, where they were stored at �20�C.Batches of sampled filters and filter blanks were dividedinto several fractions, enclosed into heated treated alumi-num cylinders, and sent by express mail to the variouslaboratories participating in the analytical work.
3. Analytical Methods
[22] Filter samples were analyzed at the University ofAveiro (OC, EC, and GC/MS analysis), Laboratory of Glaci-ology in Grenoble (inorganic ions and light carboxylates),Technical University of Vienna (levoglucosan, cellulose andHULIS), University of Veszprem (WSOC and HULIS), andUniversity of Heidelberg (210Pb and 14C). In this paperdetails are given on the analysis of major organic fractions(EC, OC, and WSOC) and inorganic ions, whereas for
specific organic compounds more details can be found incorresponding dedicated papers of this issue.
3.1. OC and EC
[23] Using thermal methods, the various carbon fractionsare volatilized by applying sequential heating at increasedtemperatures. Separation between OC and EC is achievedby initially heating an exposed filter punch under an inertatmosphere, to evaporate first the OC fraction. The remain-ing fraction is sequentially evaporated/burnt under a gasflow containing O2. This last carbon fraction contains initialEC plus OC that has pyrolyzed during heating under aninert atmosphere, called pyrolytic carbon (PC). The inter-ference between PC and EC can be controlled by continu-ous evaluation of the blackening of filter using a laser beamand a photodetector, measuring either the filter surface lightreflectance or the filter light transmittance. Usually, charringcontrol by transmittance results in lower EC values than byreflectance [Chow et al., 2001]. That is because reflectanceonly detects charring at the filter surface, while transmit-tance also detects charring in the filter fiber structure.However, even charring control by transmittance can pro-duce quite different results, depending mainly on themaximum temperature of the heating step under the inertatmosphere. For instance, methodologies, such as theNIOSH (National Institute for Occupational Safety andHealth) method, that preheat the filter under He at 900�C,have a tendency to result in lower EC values than methodsthat have a maximum temperature step at 550–600�C[Chow et al., 2001]. This has to be kept in mind whendiscussing EC/OC data.[24] The OC/EC analysis were done with a thermal-
optical technique [Pio et al., 1994; Castro et al., 1999]based on the concept proposed by Huntzicker et al. [1982].The system includes a quartz tube with two heating zones, alaser, and a nondispersive infrared (NDIR) CO2 analyzer.Filter samples are first exposed to HCl vapors for severalhours to remove carbonates. The filter is then transferredwithin the first heating zone, which can be heated up to900�C. The second heating zone, filled with cupric oxide(CuO), is maintained at 700�C. Quantitative combustion ofvolatilized carbon to CO2 is achieved in the second heatingzone, where O2 is added. The control of the heatingprogram permits separation of OC into different subfrac-tions, according to their volatility. During heating, theblackness of the filter is monitored by measuring lighttransmittance through the filter sample with a pulsed laserbeam. The analyzer is daily calibrated with standard atmos-pheres and filters impregnated with known amounts ofpotassium phthalate.[25] The program used to analyze the CARBOSOL
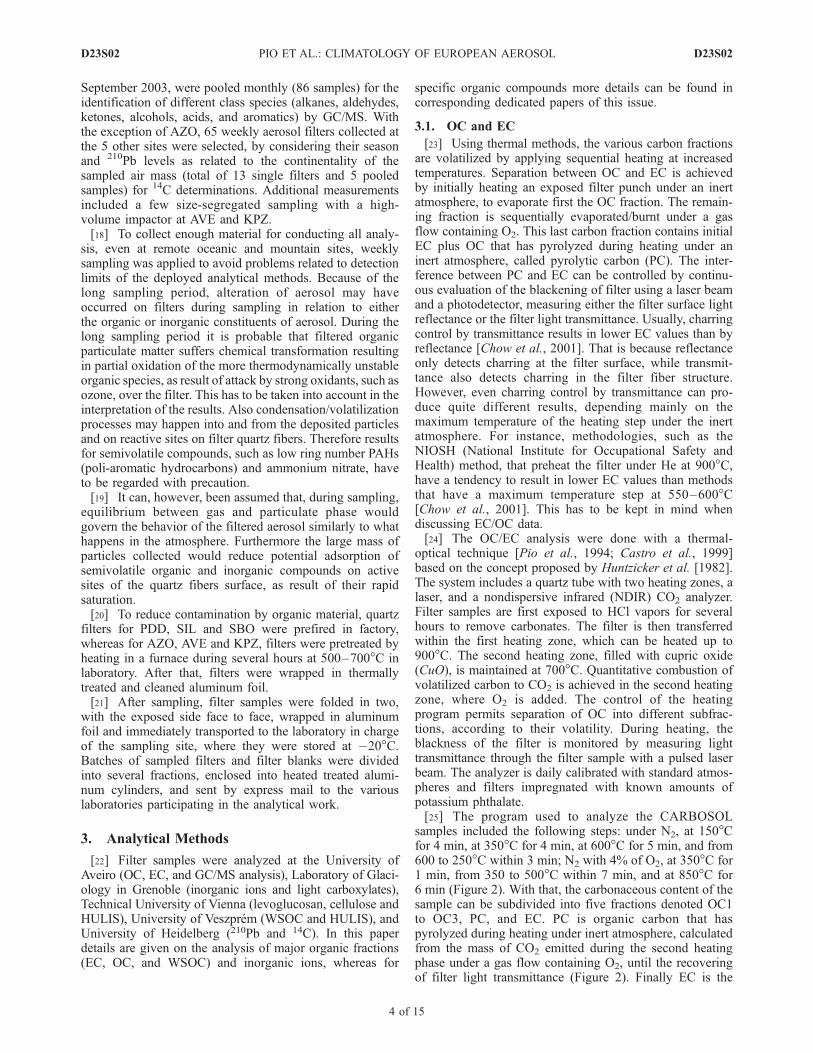
samples included the following steps: under N2, at 150�Cfor 4 min, at 350�C for 4 min, at 600�C for 5 min, and from600 to 250�C within 3 min; N2 with 4% of O2, at 350�C for1 min, from 350 to 500�C within 7 min, and at 850�C for6 min (Figure 2). With that, the carbonaceous content of thesample can be subdivided into five fractions denoted OC1to OC3, PC, and EC. PC is organic carbon that haspyrolyzed during heating under inert atmosphere, calculatedfrom the mass of CO2 emitted during the second heatingphase under a gas flow containing O2, until the recoveringof filter light transmittance (Figure 2). Finally EC is the
D23S02 PIO ET AL.: CLIMATOLOGY OF EUROPEAN AEROSOL
4 of 15
D23S02
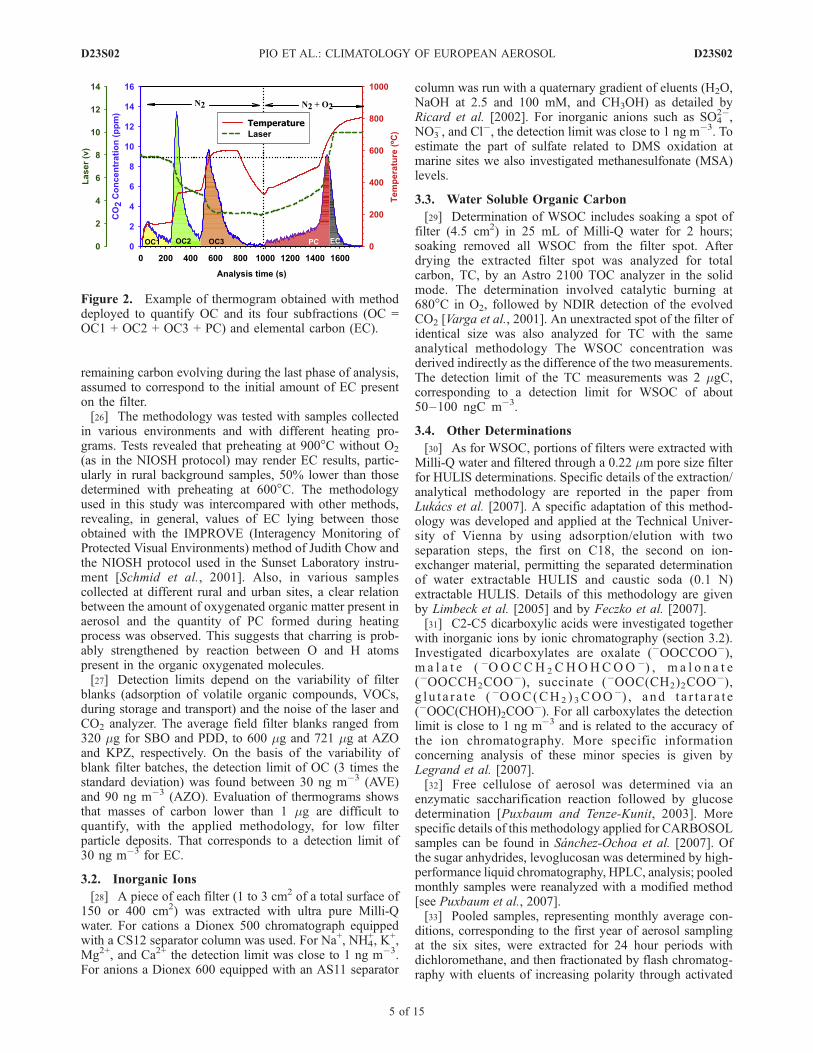
remaining carbon evolving during the last phase of analysis,assumed to correspond to the initial amount of EC presenton the filter.[26] The methodology was tested with samples collected
in various environments and with different heating pro-grams. Tests revealed that preheating at 900�C without O2
(as in the NIOSH protocol) may render EC results, partic-ularly in rural background samples, 50% lower than thosedetermined with preheating at 600�C. The methodologyused in this study was intercompared with other methods,revealing, in general, values of EC lying between thoseobtained with the IMPROVE (Interagency Monitoring ofProtected Visual Environments) method of Judith Chow andthe NIOSH protocol used in the Sunset Laboratory instru-ment [Schmid et al., 2001]. Also, in various samplescollected at different rural and urban sites, a clear relationbetween the amount of oxygenated organic matter present inaerosol and the quantity of PC formed during heatingprocess was observed. This suggests that charring is prob-ably strengthened by reaction between O and H atomspresent in the organic oxygenated molecules.[27] Detection limits depend on the variability of filter
blanks (adsorption of volatile organic compounds, VOCs,during storage and transport) and the noise of the laser andCO2 analyzer. The average field filter blanks ranged from320 mg for SBO and PDD, to 600 mg and 721 mg at AZOand KPZ, respectively. On the basis of the variability ofblank filter batches, the detection limit of OC (3 times thestandard deviation) was found between 30 ng m�3 (AVE)and 90 ng m�3 (AZO). Evaluation of thermograms showsthat masses of carbon lower than 1 mg are difficult toquantify, with the applied methodology, for low filterparticle deposits. That corresponds to a detection limit of30 ng m�3 for EC.
3.2. Inorganic Ions
[28] A piece of each filter (1 to 3 cm2 of a total surface of150 or 400 cm2) was extracted with ultra pure Milli-Qwater. For cations a Dionex 500 chromatograph equippedwith a CS12 separator column was used. For Na+, NH4
+, K+,Mg2+, and Ca2+ the detection limit was close to 1 ng m�3.For anions a Dionex 600 equipped with an AS11 separator
column was run with a quaternary gradient of eluents (H2O,NaOH at 2.5 and 100 mM, and CH3OH) as detailed byRicard et al. [2002]. For inorganic anions such as SO4
2�,NO3
�, and Cl�, the detection limit was close to 1 ng m�3. Toestimate the part of sulfate related to DMS oxidation atmarine sites we also investigated methanesulfonate (MSA)levels.
3.3. Water Soluble Organic Carbon
[29] Determination of WSOC includes soaking a spot offilter (4.5 cm2) in 25 mL of Milli-Q water for 2 hours;soaking removed all WSOC from the filter spot. Afterdrying the extracted filter spot was analyzed for totalcarbon, TC, by an Astro 2100 TOC analyzer in the solidmode. The determination involved catalytic burning at680�C in O2, followed by NDIR detection of the evolvedCO2 [Varga et al., 2001]. An unextracted spot of the filter ofidentical size was also analyzed for TC with the sameanalytical methodology The WSOC concentration wasderived indirectly as the difference of the two measurements.The detection limit of the TC measurements was 2 mgC,corresponding to a detection limit for WSOC of about50–100 ngC m�3.
3.4. Other Determinations
[30] As for WSOC, portions of filters were extracted withMilli-Q water and filtered through a 0.22 mm pore size filterfor HULIS determinations. Specific details of the extraction/analytical methodology are reported in the paper fromLukacs et al. [2007]. A specific adaptation of this method-ology was developed and applied at the Technical Univer-sity of Vienna by using adsorption/elution with twoseparation steps, the first on C18, the second on ion-exchanger material, permitting the separated determinationof water extractable HULIS and caustic soda (0.1 N)extractable HULIS. Details of this methodology are givenby Limbeck et al. [2005] and by Feczko et al. [2007].[31] C2-C5 dicarboxylic acids were investigated together
with inorganic ions by ionic chromatography (section 3.2).Investigated dicarboxylates are oxalate (�OOCCOO�),m a l a t e ( �OOCCH 2 CHOHCOO �) , m a l o n a t e(�OOCCH2COO�), succinate (�OOC(CH2)2COO�),g l u t a r a t e (�OOC(CH2 ) 3COO�) , a nd t a r t a r a t e(�OOC(CHOH)2COO
�). For all carboxylates the detectionlimit is close to 1 ng m�3 and is related to the accuracy ofthe ion chromatography. More specific informationconcerning analysis of these minor species is given byLegrand et al. [2007].[32] Free cellulose of aerosol was determined via an
enzymatic saccharification reaction followed by glucosedetermination [Puxbaum and Tenze-Kunit, 2003]. Morespecific details of this methodology applied for CARBOSOLsamples can be found in Sanchez-Ochoa et al. [2007]. Ofthe sugar anhydrides, levoglucosan was determined by high-performance liquid chromatography, HPLC, analysis; pooledmonthly samples were reanalyzed with a modified method[see Puxbaum et al., 2007].[33] Pooled samples, representing monthly average con-
ditions, corresponding to the first year of aerosol samplingat the six sites, were extracted for 24 hour periods withdichloromethane, and then fractionated by flash chromatog-raphy with eluents of increasing polarity through activated
Figure 2. Example of thermogram obtained with methoddeployed to quantify OC and its four subfractions (OC =OC1 + OC2 + OC3 + PC) and elemental carbon (EC).
D23S02 PIO ET AL.: CLIMATOLOGY OF EUROPEAN AEROSOL
5 of 15
D23S02

silica gel (230–400 mesh) under N2 flow, resulting into fivefractions (aliphatics, aromatics, aldehydes and ketones,alcohols, and acids). Further details of the method andanalytical protocol are given by Oliveira et al. [2007].Each of the five fractions was analyzed by GC/MS, afterderivatization for alcohols and acids, with the aim ofidentifying and quantifying nonvolatile particulate tracerorganic species.[34] 210Pb was analyzed in all individual filter samples by
g-spectrometry following the procedure ofWagenbach et al.[1988]. Disregarding errors in the sampling volume, theoverall analytical uncertainty was found to be controlled bythe statistical counting error and ranged from 5% at moun-tain sites during background conditions, to 3% at continen-tal low-elevation sites.14C analyses were performed on13 individual samples selected from PDD and SIL sitesby season and the continental air mass influence (asindicated by the respective 210Pb level). Additional radio-carbon results were obtained on 5 composite filter samplesfrom AVE, KPZ and SBO, mainly distinguished by winterand summer season, respectively. After removal of partic-ulate carbonates by exposition to an atmosphere with HClvapors, carbonate-free filters were burned in a dynamic gasstream, followed by accelerator mass spectrometry of pro-duced graphite targets at University of Vienna (VERA) toyield (standard) pmC (percent modern carbon) values of thetotal organic carbon content with typical relative uncertain-ties ranging between 5 and 10%.
4. Results and Discussion
[35] In this paper summer refers to months from April toSeptember, and winter to the 6 remaining months of theyear. All concentrations are reported at standard conditions(0�C and one atmosphere) to account for dilution withaltitude.
4.1. Background Information on Sampling SitesDerived From Radioisotopes and Air Mass Origins atthe Sites
[36] CARBOSOL sites include the oceanic site of AZO,two surface sites located at the Atlantic coast (AVE) and inthe central European plains (KPZ), and three mountain siteslocated at 1200–1450 m (SIL and PDD) and 3100 m (SBO)elevation.[37] Within the CARBOSOL network, concurrent analyses
of the 210Pb variability were mainly aimed at assessingseasonal changes and systematic intersite differences presentin the chemical data, in terms of vertical air mass exchangeintensity and mean accumulation of continental (gaseous)emissions with altitude and increasing distance to theAtlantic coast, respectively [Hammer et al., 2007]. Theaerosol borne 210Pb is produced at a fixed conversion rateof 18% per day from its radioactive precursor gas 222Rn,which in turn is emitted from the soil at an almost spatio-temporal uniform rate. Thus 210Pb may be used as surrogatespecies for a natural secondary aerosol body of solelycontinental sources origin, which spatiotemporal variabilityare mainly governed by air mass transport and the relevantcontinental catchment areas. It is expected, therefore, that anapparent close covariance of 210Pb with chemical aerosolcomponents may be driven by these issues.
[38] AZO is located in the middle of the north AtlanticOcean and collected aerosol represents here the backgroundmarine atmosphere, with levels influenced frequently bylong-range transport from North America, with less frequentadvections from Europe and North Africa [Honrath et al.,2004]. As expected 210Pb exhibits low values in AZOcompared to others CARBOSOL sites (Table 1).[39] AVE is located at the western European Atlantic
coast and is under the influence of air masses travelingfrom the ocean, having a relatively mild climate. However,during CARBOSOL, the site was also frequently underinfluence of air masses having a recent continental origin, asclearly revealed by concurrent 210Pb measurements showingweekly atmospheric activities significantly above thoseexpected for typical marine situations. 210Pb average valuesmeasured in AVE (Table 1) are similar to multiannualaverage values at other coastal areas of the Iberian Peninsula(0.54 mBq m�3 in Malaga [Duenas et al., 2005], 0.62 mBqm–3 in Granade [Camacho-Garcıa, 2000]). Furthermore the210Pb record at AVE does not reveal weekly samplingperiods which would have clearly stood out as influencedonly by pristine marine air; hence continental sources areexpected to substantially contribute to the atmospheric loadat AVE.[40] 210Pb overall means at surface sites of AVE and KPZ
differ significantly because of continental accumulation.However, no definitive seasonal cycles of 210Pb appearsto be developed at AVE and only a rather subdued one isfound at (the much less continuously sampled) KPZ site.Stable conditions primarily developing during the winterhalf year are admittedly less sensitively seen by weeklyenhanced 210Pb levels than by its locally produced 222Rn-precursor gas. Indeed, hourly resolved 222Rn monitoring atthe AVE (not shown) revealed clearly higher activitiesduring fall and winter, associated with substantial sourcecontributions from emissions into the local boundary layer.Therefore at least part of the enhanced winter levels ofchemical species observed at the low-elevation AVE andKPZ sites are driven by the reduced vertical mixing inten-sity during that season.[41] As indicated by the seasonal 210Pb means (Table 1),
regular seasonal cycles (summer maxima) are clearly seen atthe mountain sites PDD, SIL and SBO, revealing systematicactivity differences associated with the continentality andthe altitude of the sites.
4.2. Contribution of Organics, Versus Inorganics, toPM2.5 Aerosol Mass
[42] To evaluate the relative abundance of organic matterwith respect to inorganic ions present in aerosol collected atthe CARBOSOL sites, we report in Figure 3 seasonalaveraged levels of EC, total mass of particulate organicmatter (denoted OM) and total mass of water solubleinorganic ions (denoted WSII). Common values availablein the literature to convert OC into OM range between 1.2and 1.6 [Hughes et al., 1998; Turpin et al., 2000], up to 2 ormore [Turpin and Lim, 2001]. During CARBOSOL, ele-mental analysis were performed in WSOC aerosol collectedat AVE indicating values of 1.7 in winter and 1.9 in summer[Duarte, 2006]. Considering the mean ratio of WSOC toOC of �56% at Aveiro (see section 4.5), the factor used toconvert OC into OM would not exceed 1.6 at this site.
D23S02 PIO ET AL.: CLIMATOLOGY OF EUROPEAN AEROSOL
6 of 15
D23S02

Although this ratio would vary over time and from site tosite, because of lack of more information, a constant valueof 1.6 was used here to calculate OM at all sites.[43] The total PM2.5 mass was determined at AVE, by
filter weighting at 50% relative humidity, showing anannual mean value of 23 mg m�3, a value which lies inthe range of those observed by Van Dingenen et al. [2004]at rural (9 to 20 mg m�3) and near-city (20 to 25 mg m�3)sites in Europe. Annual mean total PM10 mass at AVE(�37 mg m�3) is close to typical values observed at nearcity sites in Europe (28 to 37 mg m�3 [Van Dingenen et al.,2004]). The noncarbonated total carbonaceous mass (ECplus OM) contributes on a yearly basis to 41% of the PM2.5aerosol mass at AVE, in good agreement with the averagedvalue previously derived for European urban backgroundand rural sites (31% [Putaud et al., 2004]). At AVE,carbonaceous aerosol dominates the PM2.5 mass duringwinter (51%) whereas its contribution is weakened in
summer (29%). As seen in Figure 4 the mass of analyzedinorganic ions (WSII) plus the carbonaceous matter (ECplus OM) represents on average 70% of the PM2.5 aerosolmass at AVE. The remaining fraction of the PM2.5 mass,accounting here for 30%, is generally attributed to waterbounded to hygroscopic inorganic and organic material. At50% relative humidity, atmospheric aerosol can contain upto 30% of water. Given the relative large amount of sea-saltaerosol, sulfate, nitrate and WSOC at AVE the hygroscop-icity of the aerosol may explain the differences betweenidentified and total mass of PM2.5 [Harrison et al., 2003].[44] One part of the nonidentified material can also result
from the presence of unidentified species (water-insolubledust material) or from an underestimation of the factor usedto convert OC into OM. It can be emphasized that Putaud etal. [2004] applying a factor of 1.4 to convert OC into OM,obtained an unidentified fraction of 20% of PM2.5 inEurope. A crude estimate of the mass of mineral dustpresent in the European atmosphere can be derived as 4.5 timesthe non-sea-salt calcium (nss-Ca2+) level [Putaud et al.,2004]. The level of nss-Ca2+ is close to 140 ng m�3 and95 ng m�3 at AVE in summer and winter, respectively(section 4.3.3). On this basis, we can conclude that the totalmineral dust cannot account for more than 1 to 3% of thePM2.5 mass, since a significant fraction of mineral dust hasbeen identified (a fraction of Mg2+ and SO4
2�, for instance,see section 4.3.3).[45] Apart from AVE, total PM2.5 or PM10 masses were
not investigated at other continental CARBOSOL sites. Atthese sites the evaluation of the absolute contributions oforganic matter and inorganic ions to the total PM2.5 masswas thus not possible, but the relative contribution of OMand total inorganic ions can be still examined. The OM/WSII ratios reported in Table 1 indicate that, except at themarine site of AZO where inorganic ions largely exceedthe organic matter, OM is similar to total inorganic ions inthe studied European atmosphere. As seen in Figure 5, thedominant presence of ions with respect to OM, in Azores, isrelated to a decrease of OM, as well as a still large level ofinorganic ions related to sea salt but also non-sea-salt sulfate
Table 1. Summer (S) and Winter (W) Averaged Levels at the
CARBOSOL Sites of 210Pb, Total Organic Mass (OM), Total
Water Soluble Inorganic Ions (WSII) and Mass Ratio Between OM
and WSII
Site 210Pb, mBq/m3 OM, ng/m3 WSII, ng/m3(OM)/WSII,
ng/ng
AZO S 0.32 610 5200 0.19AZO W 0.23a 430 9100 0.09AVE S 0.53 4900 7400 0.72AVE W 0.53 11900 5900 2.23PDD S 0.47 3800 3700 1.20PDD W 0.25 1260 2200 0.80SIL S 0.62 5400 6800 0.98SIL W 0.43 2200 4600 0.66SBO S 0.49 2200 2300 1.16SBO W 0.32 770 920 1.13KPZ S 0.77 7800 6900 1.20KPZ W 0.84 11800 15100 0.99
aNo fully continuous data set.
Figure 3. Mean summer (S) and winter (W) levels of EC,OM, and total water soluble inorganic ions (WSII) at the sixCARBOSOL sites. At AZO, AVE, SBO, and KPZ a PM2.5 inlet was used, and at PDD and SIL a PM 10 inlet was used.
Figure 4. Weekly distribution of the PM2.5 mass alongwith the contribution of noncarbonated total carbonaceousmass (EC + OM) and inorganic mass (WSII) over 2 years atAVE.
D23S02 PIO ET AL.: CLIMATOLOGY OF EUROPEAN AEROSOL
7 of 15
D23S02

(see section 4.3.2). Since we found that over continentalEurope most of OC is water soluble (see section 4.5) it canbe concluded that in addition to sulfate, OC aerosol has tobe also considered in discussing the role of cloud nucleationparticles on climate there. At continental sites the OM andWSII masses remain rather similar, at least in summer(Table 1). In the following we examine and discuss theobserved spatiotemporal variations in the load and compo-sition of the inorganic (section 4.3) and organic fractions(section 4.4) of aerosol collected at the six CARBOSOLsites.
4.3. Seasonal and Spatial Variations of the InorganicAerosol Load and Composition
[46] Summer and winter levels of inorganic ions at theCARBOSOL sites are summarized in Figure 5. The sum ofions was subdivided into five key fractions: nitrate, ammo-nium, sea salt, fraction of sulfate not related to sea salt and
mineral dust (nss-ndust-SO42�), and others (calculated by
subtracting the four preceding fractions to the sum of ions).4.3.1. Sea Salt[47] Because of the presence of a leachable fraction of Na
in mineral dust aerosol, evaluation of the sea-salt masscannot be conducted in the same way at continental sitesand marine sites like AZO. Considering the mass ratio of Cato Na in seawater (0.038) and that continental aerosolcontains far more calcium than leachable sodium [Legrandet al., 2002], examination of Na+ and Ca2+ levels reported inTable 2 indicates that at AZO and AVE, where sodiumdominates calcium, sodium can be used as an unambiguoustracer of the sea-salt aerosol. At these two sites, the massfraction of sea salt was therefore calculated by adding tosodium, chloride and the sea-salt contributions of magne-sium, calcium, potassium and sulfate, as follows:
Sea salt½ � ¼ Naþ½ � þ Cl�½ � þ 0:12 Naþ½ �þ 0:038 Naþ½ � þ 0:038 Naþ½ � þ 0:25 Naþ½ � ð1Þ
with 0.12, 0.038, and 0.25 being the mass ratios in seawaterof magnesium to sodium, calcium to sodium, as well aspotassium to sodium and sulfate to sodium, respectively.[48] As seen in Table 2, the observed levels of Cl� at the
two marine sites in winter are close to the expected levelsconsidering the mass ratio of Cl� to Na+ in seawater (1.8).Conversely note that a depletion of chloride relative tosodium can be observed in summer. At these sites, Mg2+
appears to be mostly related to sea-salt aerosol, whereas alarge fraction of Ca2+ and K+ are present in excess withrespect to sea salt.[49] At KPZ, SIL, and PDD, calcium levels are similar, or
higher than those of sodium, suggesting a significant pres-ence of aerosols related to soil emissions, and equation (1)does not remain valid since the observed sodium level therecannot be attributed to sea salt only. Since magnesium isthe second more abundant cation in sea-salt aerosol, wetentatively estimated its fraction related to dust input; to dothis we examined the relationship between Mg2+ and Ca2+
at these sites in summer, a season during which sea-saltinput would be minimum and dust input maximum. Aconsistent relationship between magnesium and calcium isobserved at the three sites, with a slope of the linearrelationship varying from 0.10 at KPZ and PDD, to 0.13
Figure 5. Mean summer (S) and winter (W) levels of non-sea-salt nondust sulfate, nitrate, ammonium, sea salt, andother ions at the six CARBOSOL sites. At AZO, a fewsamples containing very high sodium content werediscarded since they give too high uncertainty in calculatingnon-sea-salt sulfate. At AZO, AVE, SBO, and KPZ a PM2.5 inlet was used, and at PDD and SIL a PM 10 inlet wasused.
Table 2. Seasonally Averaged Concentrations of Sodium, Sea-Salt Sodium (Nam+ ), Chloride, as Well as Magnesium, Calcium, and
Potassium Cations and Their Non-Sea-Salt Contributionsa
Sites Na+ Nam+ Cl� Mg2+ nss-Mg2+ Ca2+ nss-Ca2+ K+ nss-K+ nss-ndust-K+
AZO S 1160 1160 1290 144 ns 88 45 62 18 15AZO W 2400 2400 4100 270 ns 113 27 100 12 10AVE S 400 400 87 52 ns 158 142 158 142 125AVE W 340 340 560 47 ns 107 94 230 210 200PDD S 130 81 22 29 19 170 �170 57 54 37PDD W 95 64 29 15 7.5 72 �72 29 26 21SIL S 240 113 57 51 37 350 �350 119 115 77SIL W 156 116 79 29 15 151 �151 61 57 44SBO S 21 <21b 16 29b 310b 34 �34b
SBO W 12 <12b 5 12b 133b 13 �13b
KPZ S 79 48 21 63 58 530 �530 173 172 110KPZ W 116 76 230 31 22 197 �197 330 320 300
aUnit is ng m�3; ns, nonsignificant.bSee text.
D23S02 PIO ET AL.: CLIMATOLOGY OF EUROPEAN AEROSOL
8 of 15
D23S02

at KPZ. On this basis we estimated the sea-salt fraction ofmagnesium (Mgm
2+) by subtracting 0.12 times the Ca2+ levelto the Mg2+ level. The sea-salt fraction of sodium (Nam
+ ) isthereafter estimated by dividing Mgm
2+ by the seawatermagnesium to sodium ratio (0.12). At these three sitesthe sea-salt fraction was estimated as follows:
Sea salt½ � ¼ Namþ½ � þ Cl�½ � þ 0:12 Nam
þ½ �þ 0:038 Nam
þ½ � þ 0:038 Namþ½ � þ 0:25 Nam
þ½ �; ð2Þ
with [Nam+ ] = ([Mg2+] � 0.12 [Ca2+])/0.12.
[50] Surprisingly at SBO the Ca2+ level is some ten timeshigher than the Na+ one (Table 2). Furthermore, whereas thesodium level at SBO is five times lower than at PDD,calcium and magnesium exhibit no decrease between thetwo sites. It is very likely that the construction activitiesusing concrete, a material rich in calcium, that took place atSBO during the CARBOSOL project have led to contami-nation of aerosol samples. Anyway, the low level of sodiumat SBO (12 to 20 ng m�3) indicates that the sea-saltcontribution is very low at this site and, as an upper limit,we have applied equation (1) to estimate its contributionthere.[51] As expected, sea salt dominates inorganic ions pres-
ent in PM2.5 aerosol at the marine site of AZO in winter(94%) and to a lesser extent in summer (64%) (Figure 5). Atthe coastal site of AVE sea salt is less abundant than at AZOin PM2.5 aerosol and its contribution to total inorganic ionsis reduced (9 and 18% in summer and winter, respectively).At continental sites the contribution of sea salt to inorganicions present in PM2.5 aerosol does not exceeds 5%(Figure 5). At PDD and SIL, its contribution in PM 10 aerosolis 5% and 4%, respectively. This increasing contribution ofsea salt from KPZ to SIL and PDD may reflect a largerinput of sea salt in western Europe than in central Europe,though the size fraction of sampled aerosol is not the sameat three sites.4.3.2. Non-Sea-Salt, Nondust, Sulfate, Ammonium,and Nitrate[52] The non-sea-salt fraction of sulfate is calculated by
subtracting the sulfate sea-salt fraction taken as 0.25 timesthe sea-salt fraction of sodium. As seen in Table 3 the sea-salt sulfate contribution is large at AZO (19% and 59% of
total sulfate in summer and winter, respectively) andbecomes weaker at more continental sites including AVE(2 and 4% in summer and winter, respectively). At conti-nental sites another nonsubmicrometer fraction of sulfate,related to mineral dust (gypsum), has to be considered. Incrustal rock and average soils a mass ratio of sulfate tocalcium of 0.05 has been proposed by Mason and Moore[1984]. On this basis, we estimated the contribution of dustto sulfate by applying a sulfate to nss-Ca2+ ratio of 0.05(Table 3).[53] At continental sites, nss-ndust-SO4
2� represents from20% of the (WSII + EC+ OM) mass, at KPZ, to 24%, atSBO. Although it is clear that nss-ndust-SO4
2� is mainlyrelated to anthropogenic SO2 emissions in continentalEurope, the oxidation of marine DMS emissions fromphytoplankton has to be considered at the marine sites ofAVE and AZO. Aiming to evaluate this biogenic sulfatefraction, we report in Table 3 MSA levels at AZO and AVE.Under analytical IC conditions used in this study, the MSApeak however is not always adequately separated fromthe pyruvate peak. Given the low level of pyruvic acidobserved in aerosols over the Pacific ocean by using GC-MS analysis (0.2 ng m�3 [Kawamura and Usukura, 1993]and 0.13 ng m�3 [Sempere and Kawamura, 2003]) we can,nevertheless, assume that at these sites, where biogenicsulfate is expected to be significant, the several tens ofng m�3 reported in Table 3 as MSA are correct. In winter itis also likely that MSA levels are still correct at the remotemarine site of AZO. The situation is less clear at AVEregarding the large levels of OM observed at that season(Table 1). To evaluate the biogenic fraction of sulfate weused the relationship between the ratio of MSA to nssSO4
and air temperature observed by Bates et al. [1992] in theremote south Pacific ocean (MSA/nssSO4
2� (in %) = �1.5 T(in �C) + 42.2). Given the mean surface air temperature atthe AZO (18�C) a MSA to nssSO4
2� molar ratio of 15% isexpected for the biogenic sulfate fraction. This value is
Table 3. Seasonally Averaged Concentrations of Sulfate, Non-
Sea-Salt Sulfate, Non-Sea-Salt and Nondust Sulfate, MSA, and
Biogenic Sulfatea
Sites SO42� nss-SO4
2� nss-ndust-SO42� MSA SO4
2�bio
AZO S 1540 1260 1250 40 270AZO W 890 370 365 6 32AVE S 4540 4440 4430 72 480AVE W 2200 2100 2100 nd 0PDD S 1800 1780 1780 nd 0PDD W 780 760 760 nd 0SIL S 3040 3010 2990 nd 0SIL W 1480 1450 1440 nd 0SBO S 960 960 960 nd 0SBO W 380 380 380 nd 0KPZ S 3880 3870 3850 nd 0KPZ W 4890 4870 4860 nd 0
aUnit is ng m�3. At AZO, a few samples containing very high sodiumcontent were discarded since they give too high uncertainty in calculatingnon-sea-salt sulfate. nd, not determined.
Figure 6. Non-sea-salt sulfate (nss-SO42�) versus MSA
levels (in ng m�3), at Azores in summer. Solid circlesindicate the lower envelope of the correlation between thetwo species which leads to a MSA to nss-SO4
2� mass ratioclose to 15% (see text).
D23S02 PIO ET AL.: CLIMATOLOGY OF EUROPEAN AEROSOL
9 of 15
D23S02

consistent with the slope of the lower envelope of therelationship observed between NssSO4
2� and MSA levelsat AZO in summer (Figure 6) and was here used as a crudeestimate to calculate biogenic sulfate fraction at AZO andAVE. This biogenic fraction ranges from 10 to 17% of totalsulfate in summer at AVE and AZO, respectively (Table 3).In winter the biogenic fraction accounts for only 4% of totalsulfate at AZO and was assumed to be null at AVE,considering the possible overlaps of pyruvic acid there.[54] The level of Elemental Carbon strongly decreases
fromAVE toAZO (from 1000 ngm�3 to 43 ngm�3, Table 4),whereas anthropogenic sulfate is only decreased by afactor of 5 (Table 3). Assuming that most of EC presentat AZO is long-range transported from continents, therelatively low decrease of anthropogenic sulfate betweenAVE and AZO remains difficult to explain by the ongoingoxidation of SO2 during the transport from continents andsuggests the existence of another source for this species atAZO. A possible source of sulfate, which may becomesignificant with respect to present-day SO2 emissions fromcontinents, is SO2 emission by ship traffic. To investigatethis possibility we used the transport-chemistry EMEPmodel to simulate sulfate concentrations over Europe for2002, with and without ship emissions taken into account.The results were analyzed at 40�N 20�W (i.e., at an equaldistance between AVE and AZO) (unpublished results).The simulated nss-SO4
2� levels (1040 ng m�3 in summer,300 ng m�3 in winter) are very consistent with AZOobservations (Table 3) and confirm the significance ofbiogenic sulfate in summer (370 ng m�3 compared to 270
ng m�3 measured at AZO, Table 3). Furthermore, it appearsthat the contribution of ship traffic (420 ± 180 ng m�3) atthis location is an important source of sulfate which exceedsthose related to long-range transport from continents par-ticularly in summer (185 ± 205 ng m�3).[55] The concentrations of NH4
+, another ion stronglyinfluenced by anthropogenic activities, are strongly de-creased from 1200 ng m�3 at AVE, to 105 ng m�3 atAZO (Figure 5). At continental sites NH4
+ represents �10%of the (WSII + EC+ OM) mass (see Figures 3 and 5). Atsurface continental sites, in contrast to ammonium whichexhibits rather similar levels in summer and winter, NO3
�
shows a strong winter maximum when low temperaturespromote gas to particle conversion of semivolatile NH4NO3
aerosol.4.3.3. Other Ions[56] In addition to the preceding ions (sea-salt, non-sea-
salt and nondust sulfate, ammonium and nitrate) other ionscontribute to a few percents of the (EC + OM +WSII) mass.They are present at larger levels at continental sites, partic-ularly at the surface, than at AZO (Figure 5). They includecations not related to sea salt, and the mineral dust fractionof sulfate. A dominant fraction of these ions is related tomineral dust, except for potassium. Indeed, as seen inFigure 7, a large part of K+ is present in the submicrometersizes and thus cannot be attributed to mineral dust. Thoughtto be mainly related to wood burning [see Puxbaum et al.,2007] this fraction was estimated by subtracting first thesea-salt contribution, using the mass ratio of K+/Na+ inseawater (0.038) and marine sodium levels. Since dustmaterial contains leachable potassium we also have toconsider this fraction to evaluate potassium related to woodburning. In contrast to the marine input, the amount ofleachable potassium present in dust is variable. We thereforeexamined the relationship between K+ and Ca2+ at conti-nental sites in summer when input from sea salt and woodburning are expected to be minimal and dust input maximal.The slope of the lower envelope of the relationship observedbetween K+ and Ca2+ in summer (not shown) is 0.16 atKPZ, 0.12 at SIL and 0.09 at PDD. On the basis of that, wecorrected potassium from the dust contribution at all sites byusing non-sea-salt calcium at AVE and AZO and totalcalcium at other sites, and assuming a mean K+/Ca2+ ratioof 0.12. Note that this value is consistent with the ratio ofK+ to Ca2+ seen in coarse particles at KPZ (Figure 7). Inspite of the crude estimate used in evaluating the potassiumdust contribution, the correction does not exceed 35% oftotal potassium at continental sites (Table 2). Highest levelsof nss-non-dust-K+ are seen at surface continental sites inwinter, where they represent a half of the part of other ions.In summer the other ions are dominated by nss-Ca2+ asresult of a higher contribution of mineral dust at that season.
4.4. Seasonal and Spatial Variability of OC and EC
[57] The carbonaceous matter increases by a factor of 20from the remote oceanic site of AZO to continental areas ofAVE and KPZ, and intermediate levels are found at moun-tain sites (Figure 3).[58] Except at AZO, there is a clear seasonal cycle of OC
and EC at all sites. Carbonaceous matter is twice moreabundant in winter than in summer at the low-level conti-nental sites of AVE and KPZ (Table 4). Reversely OC and
Figure 7. Mass size distribution of potassium, calciumand sulfate in a sample collected at KPZ between 29 Marchand 4 April 2004. The y axis refers to dC/dlogD.
D23S02 PIO ET AL.: CLIMATOLOGY OF EUROPEAN AEROSOL
10 of 15
D23S02

EC levels are 2 to 3 times higher during summer than winterat mountain sites. This different seasonal cycle betweensurface and mountain sites reflects the different transportand dispersion of emissions. As already learned from radio-isotopes (section 4.1), higher levels in winter at AVE andKPZ are presumably related to higher emissions at locallevel with much more limited dispersion during these coldmonths. The high carbonaceous aerosol levels in summer atthe mountain sites partly reflect the efficient upward trans-port from the polluted boundary layer during summer, asclearly indicated by the 210Pb seasonality (Table 1).[59] There are some differences in the relative abundance
of OC and EC from site to site. That may result from thedifferent size cutoffs used in the CARBOSOL campaign;being OC more distributed in larger particle than EC. Thiswould lead to a somehow higher OC/EC ratio at PDD andSIL than at the other sites, only as result of samplingmethodology. While at AZO and AVE the OC/EC ratiodoes not change significantly from winter to summer, thereis a relative enrichment in OC with respect to EC in summerat KPZ, PDD and SIL (Table 4). At all sites the OC/EC ratiois much higher than the values considered previously, usinga similar analytical technique, for primary emissions of OC(primary OC/EC = 1.1) [Castro et al., 1999; Carvalho et al.,2006]. The ratio of 1.1 was derived from minimum ob-served during winter at Portuguese and British urban sites.OC present in excess, with respect to this ratio, wasconsidered by Castro et al. [1999] as having a secondaryorigin from gas-particle conversion. This assumption isbased on the idea that only direct emissions of OC andEC from cars and other urban primary sources were presentin the atmosphere and that during transport from urbanareas, gas-particle conversion of VOCs happened, addingsecondary OC to the primary aerosol. If this approach wasapplied to our data the percentage of secondary OC wouldbe, at all sites, 62% to 81% in winter, and 74% to 86% insummer. At AVE, surprisingly there are higher percentagesof secondary OC in winter than in summer. A possibleexplanation is the existence of primary emissions of carbo-naceous aerosols containing a higher OC/EC ratio. Severalstudies [Cachier et al., 1989; Castro, 1997; Cabada et al.,2002; Park et al., 2003; Cao et al., 2005; Yang et al., 2005]have shown that biomass burning usually leads to higherOC/EC emission ratios. Direct emissions from wood burn-ing during winter for home heating are then a good reasonto explain the high OC/EC values seen in winter at AVE. In
Azores the high OC/EC values may result of secondaryproduction from gas to particle conversion of VOCs duringlong-range transport of polluted air masses from continentalareas, or be related to direct emission of hydrophobicorganic compounds, accumulated on the ocean surfacelayer, with sea spray [O’Dowd et al., 2004].[60] In the CARBOSOL project, the study of several
tracers of primary emissions, such as levoglucosan andcellulose, and of biogenic recent formation such as 14C,permitted to estimate accurately the origins of the carbona-ceous atmospheric aerosol. Using this tracer data and amethodology detailed in section 4.6 of this paper, Gelencseret al. [2007] calculated the secondary formation of OC in asubset of summer and winter pooled samples at the fivecontinental CARBOSOL sites. Application of the OC/ECfactor of 1.1 to the same summer and winter subset ofsamples used by Gelencser et al. [2007], leads to animportant overestimation of secondary OC in winter sam-ples at low land sites of AVE and KPZ, because of theinterference effect of biomass burning emissions. However,the results are quite similar between both methodologies atall sites during summer, suggesting that the simple use ofOC/EC factor of 1.1 to estimate secondary carbon aerosolformation in rural and remote European areas, in summerconditions, is adequate. The results are also rather similar inwinter high-altitude sites located away from fresh residen-tial biomass burning emissions. This may be due to a morerapid removal of hydrophilic biomass burning carbon emis-sions by clouds and rain, resulting in a relative enrichmentin the free troposphere of more hydrophobic fossil fuelburning particulate emissions.[61] The nature of particulate organic matter can be
evaluated from the inspection of the carbon mass thermalevolution during analysis. Table 4 shows that at all sites theOC1 (the OC fraction evaporated at temperatures up to150�C) represents 5 to 9% of OC, indicating a weakcontribution of semivolatile organic species to the carbona-ceous aerosol load (although some semivolatile OC mayhave been charred during the heating process). This findinglikely suggests that no significant absorption occurred onaerosol filters during sampling. During the analysis most ofOC evolves at temperatures above 350�C (Table 4). At themost remote sites of AZO and SBO the largest fraction ofOC comes out as OC3, whereas at all other locations morethan 50% of OC results from charring during analysis.
Table 4. Seasonal Means of the Levels of TC, EC and OC, the EC to OC Ratio, and the Contributions of OC1, OC2, OC3, and PC to
OC, in Aerosol Collected at the Six CARBOSOL Sites
Sites TC, ngC m�3 EC, ngC m�3 OC, ngC m�3 OC/EC, ng/ng OC1/OC, % OC2/OC, % OC3/OC, % PC/OC, %
AZO S 430 47 380 12.3 8 29 50 16AZO W 310 39 270 15.0 7 27 51 13AVE S 3700 650 3100 5.2 7 19 21 54AVE W 8800 1340 7500 5.6 8 19 20 53PDD S 2600 260 2400 10.6 5 21 21 52PDD W 970 185 790 5.6 6 24 26 45SIL S 3700 350 3400 11.1 7 21 20 51SIL W 1590 220 1370 6.4 5 19 24 53SBO S 1610 230 1380 7.9 5 28 36 31SBO W 550 66 480 11.2 9 26 38 30KPZ S 5600 690 4900 8.0 3 20 26 51KPZ W 8900 1570 7400 4.9 7 17 19 57
D23S02 PIO ET AL.: CLIMATOLOGY OF EUROPEAN AEROSOL
11 of 15
D23S02

[62] Given the weekly sampling period, it may be ques-tioned if either species existed already in the atmosphere inan oxidized state or if the oxidation occurred on filter duringsampling. Of course both processes may happen but the factthat the fraction of PC does not change significantly fromsummer to winter and is much lower at remote than at morepolluted sites (Table 4) suggests that aerosol already existsin the atmosphere in an oxidized form. The existence ofhigh percentages of PC at most polluted rural areas and theabsence of decreasing PC levels during colder monthsindicates that photochemical processes acting on VOCs orparticulate organics, are not the only responsible for thepresence of polar organic matter in the aerosol. If theseprocesses were predominant, the fractional amount of PCwould be higher in summer than in winter at all sites andalso higher at more remote sites where aerosol have beenlong-range transported, having a longer time to becomemore oxidized. The much lower relative contribution of PCin aerosol at Azores indicates different characteristics andorigin of the organic matter at this oceanic remote site. Thehigher PC levels and constant PC fraction during winter inless remote continental sites are a strong indication of theprimary origin of an important part of the polar oxygenatedorganic aerosol mass.
4.5. Water Soluble Organic Carbon
[63] As seen in Table 5, a large fraction of OC is watersoluble at all sites. WSOC contains the more oxygenatedand polar fraction of particulate organic carbon. The WSOCincludes numerous classes of polar species, from sugars,alcohols, acids and aldehydes, to macromolecular speciesreferred as Humic Like Substances (HULIS) [Decesari etal., 2001]. At Aveiro, the WSOC extracts were analyzed forelemental composition and average atomic ratios forC:H:O:N of 16:22:9:1 and 30:39:13:1 are calculated forsummer and winter, respectively [Duarte, 2006]. From thatit can be concluded that the WSOC is highly oxidized,especially in summer, and contains an important number ofnitrogen associated groups.[64] Usually it is assumed that WSOC represents organic
compounds that result from the atmospheric oxidation ofVOCs and gas-particle conversion (secondary OC). Oxy-genation of particulate OCmay also happen in the particulatephase (in the atmosphere or on filters during sampling) byreaction of strong oxidants such as ozone or peroxide radicals
[Gelencser, 2004]. As a result of these processes the fractionof WSOC in OC is usually minimum in urban locations nearfossil fuel sources (�20%) and increases at more remotelocations during aging of aerosol [Ruellan and Cachier,2001; Carvalho, 2003; Poschl, 2005; Yu et al., 2005].[65] Information on organic aerosol with regard to its
water solubility is sparse in Europe. As far as we know, ourdata are the most extensively available for nonurban sites inEurope. They show that, at all sites, most of organic carbonis water soluble (from 50% to 80% of OC, see Table 5), thelowest values being seen at coastal sites. These values are inagreement with other studies carried out at background andrural sites in Europe. Zappoli et al. [1999] observed WSOCfractions of 52–83% of OC at three nonurban sites (includ-ing KPZ) in Europe. Krivacsy et al. [2001] measured valuesof 40, 60 and 65% in PM2.5 aerosol samples collectedduring summer at Mace Head (Ireland, coastal background),Jungfraujoch, (Switzerland, background, mountain), andK-Puszta, respectively. Fractions of WSOC of the order of12 to 49% of OC were found in PM10 at urban areas inPortugal, Spain and UK and of 39% on a Finnish forestduring summer [Carvalho, 2003]. One year of measure-ments performed by Carvalho [2003] in Azores revealed anaverage WSOC contribution of 36% to OC, for submicrom-eter aerosol, and 29% to OC in supermicrometer particles(1–10 mm).[66] The levels of WSOC follow the seasonal change of
OC at CARBOSOL sites and there is no clear seasonalvariability in the fraction of OC that is water soluble.WSOC concentrations are higher in summer for remotemarine and mountain sites and higher in winter for surfaceAVE and KPZ sites (Table 5). This leads to possibledifferent origins of WSOC depending of the season, withsummer values probably resulting from photochemicaloxidation processes and winter values resulting from directemissions of oxygenated particulate organics from sourcessuch as biomass burning (see Puxbaum et al. [2007], andGelencser et al. [2007], to confirm the strong contributionof biomass burning to the carbonaceous aerosol in winter).[67] Complete identification and quantification of indi-
vidual organic species is impossible since an importantfraction of OM has a chemical signature similar to humicspecies. In spite of their abundance in the atmosphere, theorigin of these macromolecules is not yet well understood(see further discussions by Lukacs et al. [2007]) but we
Table 5. Seasonal Variations of Organic Carbon, Water Soluble Organic Carbon (WSOC), HULIS, Sum of
Dicarboxylic Acids, Total Cellulose and Levoglucosan, at the Six CARBOSOL Sitesa
Sites OC, ngC m�3WSOC,ngC m�3
HULIS,ngC m�3
Diacids,ngC m�3
Total Cellulose,ngC m�3
Levoglucosan,ngC m�3
AZO S 380 211 105 28 9 1AZO W 270 181 87 12 6 4AVE S 3100 1800 940 109 23 34AVE W 7500 3700 2900 94 41 430PDD S 2400 1540 480 93 50 5PDD W 790 610 370 34 16 10SIL S 3400 2700 680 159 84 8SIL W 1370 1020 570 51 27 14SBO S 1380 840 360 49 24 2SBO W 480 350 179 nd 15 4KPZ S 4900 3400 950 111 107 29KPZ W 7400 5800 4400 123 66 260
and, not determined.
D23S02 PIO ET AL.: CLIMATOLOGY OF EUROPEAN AEROSOL
12 of 15
D23S02

emphasize here their important contribution to WSOC.Although the mass concentrations of HULIS cannot beused easily into mass closure calculations [Lukacs et al.,2007] Table 5 permits to conclude that carbon associatedwith HULIS constitute a large fraction of WSOC at all sites,particularly in winter at continental sites (possible as high as80% at AVE, SBO and KPZ). This finding is important forthe climate, given the light-absorbing properties of HULIS.The dominant presence of HULIS in winter aerosol inEurope will be discussed in details by Lukacs et al.[2007] and strongly points out the role of wood burning.
4.6. Complementary Information Found inCompanion Papers in This Issue
[68] In addition to the preceding climatology of majorfractions of aerosol in Europe (inorganic versus organic, ECversus OC, WSOC versus OC) additional discussions onsources of more specific organic species were made duringthe CARBOSOL project.[69] As already mentioned the large presence of HULIS
observed in the European atmosphere may resolve a largefraction of unexplained mass of OM in the atmosphere. Theultimate origin of this compound class has not been iden-tified yet. Although biomass burning is a probable primarysource [Zappoli et al., 1999; Mayol-Bracero et al., 2002],most recent studies line up strong experimental evidence fortheir secondary formation, too [Graber and Rudich, 2006].The CARBOSOL climatology of HULIS is evaluated inview to their possible source apportionment in two com-panion papers [Lukacs et al., 2007; Feczko et al., 2007].The spatiotemporal variation of HULIS together with otheraerosol constituents like levoglucosan, in combination withinvestigations of the size distribution helped to test thehypotheses proposed for HULIS formation.[70] Better defined than HULIS are C2–C5 dicarboxylic
acids (oxalic, malonic, succinic, malic, tartaric, and glutaric)that are still significant contributors to WSOC (from 3 to7% at continental sites and up to 14% at AZO in summer,Table 5). The climatology of C2–C5 dicarboxylic acids inEurope is discussed by Legrand et al. [2007] versusenvironmental conditions at sites (marine versus continen-tal, rural versus forested, boundary layer versus free tropo-sphere, winter versus summer). Continental surface sitesseem in winter to be influenced by primary C2–C5 emis-sions from regional vehicular traffic and wood burningplumes, and secondary aqueous production of C2 fromaldehydes formed by the rapid oxidation of toluene andethene emitted by cars. In summer, these polluted plumesare more efficiently dispersed from the boundary layer andemissions from larger scale become important. It is shownthat they include successive aqueous decarboxylations ofglutaric acid formed by terpene oxidation and aqueousproduction of C2 from aldehydes formed by oxidation ofisoprene. Finally diacids present at the Azores are not onlyrelated to long-range transport from continents but also to insitu productions from precursors emitted by the marinebiosphere (particulate unsaturated fatty acids and ethene)in summer.[71] Levoglucosan has been previously shown to be
associated with burning of biomass, being emitted predom-inantly by combustion of wood as result of thermal break-down of cellulose at high temperatures [Fraser and
Lakshmanan, 2000]. Stable in the atmosphere for more than10 days it is thus a good candidate to trace back contributionof biomass burning to the atmospheric organic aerosol load.Using the climatology of levoglucosan and other potentialtracers of wood burning (nss-ndust-K+, for instance) spe-cific treatment and calculation of biomass burning contri-bution to the carbonaceous aerosol is presented in anotherpaper [Puxbaum et al., 2007]. It is shown that, surprisingly,high relative concentrations of biomass smoke in OM(20–68%) were observed for winter conditions at allCARBOSOL sites.[72] As seen in Table 5, cellulose, an organic aerosol
component introduced in the atmosphere as a result ofresuspension of plant debris, is present at a few tens ofngC m�3 and represents a significant fraction of WinOC.Detailed evaluation of cellulose climatology and productionprocesses is given in another paper [Sanchez-Ochoa et al.,2007]. Since cellulose (and related material) is consideredrather long-lived with respect to atmospheric oxidationprocesses, it may become enriched on the route to back-ground regions, which may explain the observed higherrelative levels at mountain sites compared to the lowlandsites.[73] The organic aerosol is composed by an enormous
amount of compounds that it is not yet possible to identifyand quantify totally with the existing analytical techniques.The most common analytical methods involve extractionwith solvents and measurements with GC/MS. Pooledsamples representing monthly average conditions during1 year of CARBOSOL sampling were extracted withdichloromethane and analyzed for tracer organic com-pounds by GC/MS. More than 200 compounds were iden-tified and quantified, including 24 alkanes, 33 polyaromatichydrocarbons, 23 aldehydes, 27 ketones, 23 alcohols, and50 organic acids. Specific discussion and interpretation ofGC/MS results are given by Oliveira et al. [2007]. Here weonly emphasize that the identified and quantified organicspecies represent only from 2% to 4% of OM.[74] Finally, on the basis of the 2-year comprehensive
data set here obtained, seasonal source apportionment ofPM2.5 aerosol was attempted for the CARBOSOL sites[Gelencser et al., 2007]. The methodology combines radio-carbon measurements with bulk measurements of OC, EC,levoglucosan and cellulose and emission factors forfossil fuel burning in road tunnels and in domestic biomassburning. The approach was to lump source types of (EC +OC) into primary emissions from fossil fuel combustionand biomass burning, primary bioaerosol, and secondaryorganic aerosol from precursors emitted by fossil and non-fossil-fuel sources. It is found that while fossil-relatedEC predominates throughout the year at all sites, thesources of OC are primarily non-fossil-fuel and markedlydiffer from summer to winter. In winter biomass burningprimary emission is the main source whereas in summersecondary production from non-fossil-fuel precursors becomespredominant.
5. Conclusions
[75] Present-day climatology of aerosol acquired duringCARBOSOL shows that, except at the Azores where
D23S02 PIO ET AL.: CLIMATOLOGY OF EUROPEAN AEROSOL
13 of 15
D23S02

inorganic material dominates, similar amounts of organicand inorganic matter are found in the nonurban Europeanatmosphere. This extensive data set for nonurban environ-ment also permits characterization of OC aerosol withregard to water solubility, showing that most (50–80%) ofOC is water-soluble. CARBOSOL results suggest that, inaddition to sulfate, OC has to be considered, as well, indiscussing the role of clouds on climate over Europe.During summer a large fraction of OC is found to besecondary. However, in winter, principally at lowland sites,quite substantial amounts of organic matter seem to have aprimary origin in biomass burning.
[76] Acknowledgments. This work was financed by European Com-mission through the Project CARBOSOL (EVK2-2001-113). We are grate-ful for the logistical support by the Federal German Environmental Agencyand for the invaluable help by the staff of the Schauinsland stationconcerning filter samplings. We also gracefully acknowledge the PortugueseFoundation for Science and Technology, for the scholarship given toT. Oliveira and for financial support through the Research Unit CESAM(Centre for Environmental and Marine Studies).
ReferencesAlves, C., A. Carvalho, and C. Pio (2002), Mass balance of organic carbonfractions in atmospheric aerosols, J. Geophys. Res., 107(D21), 8345,doi:10.1029/2001JD000616.
Andreae, M. O., C. D. Jones, and P. M. Cox (2005), Strong present-dayaerosol cooling implies a hot future, Nature, 435, 1187–1190.
Bates, S. T., J. A. Calhoun, and P. K. Quinn (1992), Variations in themethanesulfonate to sulfate molar ratio in submicrometer marine aerosolparticles over the South Pacific ocean, J. Geophys. Res., 97, 9859–9865.
Bellouin, N., O. Boucher, J. Haywood, and M. S. Reddy (2005), Globalestimate of aerosol direct radiative forcing from satellite measurements,Nature, 438, 1138–1141.
Boucher, O., et al. (1998), Intercomparison of models representing directshortwave radiative forcing by sulfate aerosols, J. Geophys. Res., 103,16,979–16,998.
Cabada, J., S. Pandis, and A. Robinson (2002), Sources of atmosphericcarbonaceous particulate matter in Pittsburgh, Pennsylvania, J. Air WasteManage., 52, 732–741.
Cachier, H., M. P. Bremond, and P. Buat-Menard (1989), Carbonaceousaerosols from different tropical biomass burning sources, Nature, 340,371–373.
Camacho-Garcıa, A. (2000), Factores condicionantes de la radiactividadmedioambiental en areas del S. E., Peninsular, Ph.D. thesis, Univ. ofGranada, Granada, Spain.
Cao, J. J., J. C. Chow, S. C. Lee, Y. Li, S. W. Chen, Z. S. An, K. Fung, J. G.Watson, C. S. Zhu, and S. X. Liu (2005), Characterization and sourceapportionment of atmospheric organic and elemental carbon during falland winter of 2003 in Xi’an, China, Atmos. Chem. Phys. Disc., 5, 3561–3593.
Carvalho, A. (2003), Characterization of atmospheric carbonaceous aero-sols: Secondary and water soluble compounds, Ph.D. thesis, Univ. ofAveiro, Aveiro, Portugal.
Carvalho, A., C. Pio, C. Santos, and C. Alves (2006), Particulate carbon inthe atmosphere of a Finnish forest and a German anthropogenically in-fluenced grassland, Atmos. Res., 80, 133–150.
Castro, L. M. (1997), Composition and origin of particulate pollutants in acoastal atmosphere, Ph.D. thesis, Univ. of Aveiro, Aveiro, Portugal.
Castro, L., C. Pio, R. Harrison, and D. Smith (1999), Carbonaceous aerosolin urban and rural European atmospheres: Estimation of secondary or-ganic carbon concentrations, Atmos. Environ., 33, 2771–2781.
Charlson, R. J., S. E. Schwartz, J. M. Hales, R. D. Cess, J. A. Coakley Jr.,J. E. Hansen, and D. J. Hofmann (1992), Climate forcing by anthropo-genic aerosols, Science, 255, 423–430.
Chow, J., J. Watson, D. Crow, D. Lowenthal, and T. Merrifield (2001),Comparison of IMPROVE and NIOSH carbon measurements, AerosolSci. Technol., 34, 23–34.
Decesari, S., M. C. Facchini, E. Matta, F. Lettini, M. Mircea, S. Fuzzi,E. Tagliavini, and J.-P. Putaud (2001), Chemical features and seasonalvariation of fine aerosol water-soluble organic compounds in the Po Valley,Italy, Atmos. Environ., 35, 3691–3699.
Duarte, R. M. (2006), Mass balance and characterization of organic matterin atmospheric aerosols, Ph.D. thesis, Univ. of Aveiro, Aveiro, Portugal.
Duenas, C., M. C. Fernandez, J. Carretero, E. Liger, and S. Canete (2005),Deposition velocities and washout ratios on a coastal site (southeasternSpain) calculated from 7Be and 210Pb measurements, Atmos. Environ.,39, 6897–6908.
Feczko, T., H. Puxbaum, A. Kasper-Giebl, M. Handler, A. Limbeck,A. Gelencser, C. Pio, S. Preunkert, and M. Legrand (2007), Determinationof water and alkaline extractable atmospheric humic-like substances withthe TU Vienna HULIS-analyser in samples from six background sites inEurope, J. Geophys. Res., doi:10.1029/2006JD008331, in press.
Fraser, M. P., and K. Lakshmanan (2000), Using levoglucosan as a mole-cular marker for the long-range transport of biomass combustion aero-sols, Environ. Sci. Technol., 34, 4560–4564.
Gelencser, A. (2004), Carbonaceous Aerosol, Ser. Atmos. and Oceanogr.Sci. Libr., vol. 30, 350 pp., Springer, New York.
Gelencser, A., B. May, D. Simpson, A. Sanchez-Ochoa, A. Kasper-Giebl,H. Puxbaum, C. Pio, and M. Legrand (2007), Source apportionment ofPM2.5 organic aerosol over Europe: Primary/secondary, natural/anthro-pogenic, and fossil/biogenic origin, J. Geophys. Res., doi:10.1029/2006JD008094, in press.
Graber, E. R., and Y. Rudich (2006), Atmospheric HULIS: How humic-likeare they? A comprehensive and critical review, Atmos. Chem. Phys., 6,729–753.
Hammer, S., D. Wagenbach, S. Preunkert, C. Pio, and F. Meinhardt (2007),Observations of 210Pb within CARBOSOL: A diagnostic tool for asses-sing the spatiotemporal variability of related chemical aerosol species?,J. Geophys. Res., doi:10.1029/2006JD008065, in press.
Harrison, R. M., A. M. Jones, and R. G. Lawrence (2003), A pragmaticmass closure model for airborne particulate matter at urban backgroundand roadside sites, Atmos. Environ., 37, 4927–4933.
Heintzenberg, J. (1989), Fine particles in the global troposphere, a review,Tellus, Ser. B, 41, 149–160.
Honrath, R. E., R. C. Owen, M. Val Martyn, J. S. Reid, K. Lapina, P. Fialho,M. P. Dziobak, J. Kleissl, and D. L. Westphal (2004), Regional and hemi-spheric impacts of anthropogenic and biomass burning emissions on sum-mertime CO and O3 in the North Atlantic lower free troposphere,J. Geophys. Res., 109, D24310, doi:10.1029/2004JD005147.
Hughes, L. S., G. R. Cass, J. Gone, M. Ames, and I. Lomez (1998),Physical and chemical characterisation of atmospheric ultrafine particlesin the Los Angeles area, Environ. Sci. Technol., 32, 1153–1161.
Huntzicker, J., R. Johnson, J. Shah, and R. Cary (1982), Analysis of organicand elemental carbon in ambient aerosols by a thermal-optical method, inParticulate Carbon: Atmospheric Lyfe Cycle, edited by D. Wolff andR. Klimisch, pp. 79–88, Plenum, New York.
Jacobson, M. Z. (2001), Strong radiative heating due to the mixing state ofblack carbon in atmospheric aerosols, Nature, 409, 695–697.
Kasper, A., and H. Puxbaum (1998), Seasonal variation of SO2, HNO3,NH3 and selected aerosol components at Sonnblick (3106 m a.s.l.),Atmos. Environ., 32, 3925–3939.
Kawamura, K., and K. Usukura (1993), Distributions of lowmolecular weightdicarboxylic acids in the north Pacific aerosol samples, J. Oceanogr., 49,271–283.
Krivacsy, Z., A. Hoffer, T. Sarvari, D. Temesi, U. Baltensperger, S. Nyeki,E. Weingartner, S. Kleefeld, and S. G. Jennings (2001), Role of organicand black carbon in the chemical composition of atmospheric aerosols atEuropean background sites, Atmos. Environ., 35, 6231–6244.
Lefohn, A., J. Husar, and R. Husar (1999), Estimating historical anthropo-genic global sulphur emission patterns for the period 1850–1990, Atmos.Environ., 33, 3435–3444.
Legrand, M., and H. Puxbaum (2007), Introduction of the CARBOSOLproject: Present and Retrospective State of Organic versus InorganicAerosol over Europe, J. Geophys. Res., doi:10.1029/2006JD008271, inpress.
Legrand, M., S. Preunkert, D. Wagenbach, and H. Fischer (2002), Season-ally resolved Alpine and Greenland ice core records of anthropogenicHCl emissions over the 20th century, J. Geophys. Res., 107(D12), 4139,doi:10.1029/2001JD001165.
Legrand, M., S. Preunkert, T. Oliveira, C. Pio, S. Hammer, A. Gelencser,A. Kasper-Giebl, and P. Laj (2007), Origin of C2-C5 dicarboxylic acids inthe European atmosphere inferred from year-round aerosol study con-ducted at a west-east transect, J. Geophys. Res., doi:10.1029/2006JD008019, in press.
Limbeck, A., M. Handler, B. Neuberger, B. Klatzer, and H. Puxbaum(2005), Carbon-specific analysis of humic-like substances in atmosphericaerosol and precipitation samples, Anal. Chem., 77, 7288 – 7293,doi:10.1021/ac050953l.
Lohmann, U., J. Feichter, J. Penner, and R. Leaitch (2000), Indirect effect ofsulfate and carbonaceous aerosols: A mechanistic treatment, J. Geophys.Res., 105, 12,193–12,206.
Lukacs, H., A. Gelencser, H. Puxbaum, C. Pio, M. Legrand, A. Caseiro,A. Limbeck, and S. Preunkert (2007), Seasonal trends and possible sources
D23S02 PIO ET AL.: CLIMATOLOGY OF EUROPEAN AEROSOL
14 of 15
D23S02

of brown carbon based on two-year aerosol measurements at six sites inEurope, J. Geophys. Res., doi:10.1029/2006JD008151, in press.
Mason, B., and C. B. Moore (1984), Principles of Geochemistry, JohnWiley, Hoboken, N. J.
Mayol-Bracero, O. L., P. Guyon, B. Graham, G. Roberts, M. O. Andreae,S. Decesari, M. C. Facchini, S. Fuzzi, and P. Artaxo (2002), Water-solubleorganic compounds in biomass burning aerosols over Amazonia:2. Apportionment of the chemical composition and importance of the poly-acidic fraction, J. Geophys. Res., 107(D20), 8091, doi:10.1029/2001JD000522.
Menon, S. (2004), Current uncertainties in assessing aerosol effects onclimate, Annu. Rev. Environ. Resour., 29, 1–30.
O’Dowd, C.,M. C. Facchini, F. Cavalli, D. Ceburnis,M.Mircea, S. Decesari,S. Fuzzi, Y. J. Yoon, and J.-P. Putaud (2004), Biogenically driven organiccontribution to marine aerosol, Nature, 431, 676–680.
Oliveira, T. S., C. A. Pio, C. A. Alves, A. J. D. Silvestre, M. Evtyugina, J. V.Afonso, P. Fialho, M. Legrand, H. Puxbaum, and A. Gelencser (2007),Seasonal variation of particulate lipophilic organic compounds at non-urban sites in Europe, J. Geophys. Res., doi:10.1029/2007JD008504, inpress.
Park, R. J., D. J. Jacob, M. Chin, and R. V. Martin (2003), Sources ofcarbonaceous aerosols over the United States and implications fornatural visibility, J. Geophys. Res., 108(D12), 4355, doi:10.1029/2002JD003190.
Penner, J. E., R. J. Charlson, J.M.Hales, N. Laulainen, R. Leifer, T. Novakov,J. A. Ogren, L. F. Radke, S. E. Schwartz, and L. Travis (1994), Quantifyingand minimizing uncertainty of climate forcing by anthropogenic aerosols,Bull. Am. Meteorol. Soc., 75, 375–400.
Penner, J. E., C. C. Chuang, and K. Grant (1998), Climate forcing bycarbonaceous and sulfate aerosols, Clim. Dyn., 14, 839–851.
Pio, C., L. Castro, and M. Ramos (1994), Differentiated determinationof organic and elemental carbon in atmospheric aerosol particles by athermal-optical method, in Proceedings of the Sixth European Sympo-sium on Physico-Chemical Behaviour of Atmospheric Pollutants, editedby G. Angeletti and G. Restelli, Rep. EUR 15609/2 EN, pp. 706–711,Dir. Gen. for Sci., Res., and Dev., Eur. Comm., Brussels.
Pio, C., C. Alves, and A. Duarte (2001), Identification, abundance andorigin of atmospheric particulate matter in a Portuguese rural area, Atmos.Environ., 35, 1365–1375.
Pope, C. A. (2000), Review: Epidemiological basis for particulate air pollu-tion health standards, Aerosol Sci. Technol., 32, 4–14.
Poschl, U. (2005), Atmospheric aerosols: Composition, transformation, cli-mate and health effects, Angew. Chem. Int. Ed., 44, 7520–7540.
Putaud, J.-P., et al. (2004), A European aerosol phenomenology—2:Chemical characteristics of particulate matter at kerbside, urban, ruraland background sites in Europe, Atmos. Environ., 38, 2579–2595.
Puxbaum, H., and M. Tenze-Kunit (2003), Size distribution and seasonalvariation of atmospheric cellulose, Atmos. Environ., 37, 3693–3699.
Puxbaum, H., A. Caseiro, A. Sanchez-Ochoa, A. Kasper-Giebl, M. Claeys,A. Gelencser, M. Legrand, S. Preunkert, and C. A. Pio (2007), Levoglu-cosan levels at background sites in Europe for assessing the impact ofbiomass combustion on the European aerosol background, J. Geophys.Res., doi:10.1029/2006JD008114, in press.
Ricard, V., J.-L. Jaffrezo, V.-M. Kerminen, R. E. Hillamo, M. Sillanpaa,S. Ruellan, C. Liousse, and H. Cachier (2002), Two years of continuousaerosol measurements in northern Finland, J. Geophys. Res., 107(D11),4129, doi:10.1029/2001JD000952.
Ruellan, S., and H. Cachier (2001), Characterization of fresh particulatevehicular exhaust near a Paris high flow road, Atmos. Environ., 35, 453–468.
Sanchez-Ochoa, A., A. Kasper-Giebl, H. Puxbaum, A. Gelencser, M. Legrand,and C. A. Pio (2007), Concentration of atmospheric cellulose: A proxy forplant debris across a west-east transect over Europe, J. Geophys. Res., 112,D23S08, doi:10.1029/2006JD008180.
Saxena, P., L. M. Hildeman, P. H. McMurry, and J. H. Seinfeld (1995),Organics alter hygroscopic behavior of atmospheric particles, J. Geophys.Res., 100(D9), 18,755–18,770.
Schmid, H., et al. (2001), Results of the ‘‘carbon conference’’ internationalaerosol carbon round robin test stage I, Atmos. Environ., 35, 2111–2121.
Sellegri, K., P. Laj, F. Peron, R. Dupuy, M. Legrand, S. Preunkert, J.-P.Putaud, H. Cachier, and G. Ghermandi (2003), Mass balance of freetropospheric aerosol at the Puy de Dome (France) in winter, J. Geophys.Res., 108(D11), 4333, doi:10.1029/2002JD002747.
Sempere, R., and K. Kawamura (2003), Trans-hemispheric contribution ofC2–C10 a, w-dicarboxylic acids, and related polar compounds to water-soluble organic carbon in the western Pacific aerosols in relation tophotochemical oxidation reactions, Global Biogeochem. Cycles, 17(2),1069, doi:10.1029/2002GB001980.
Simoneit, B. R. T., and M. A. Mazurek (1982), Organic matter of thetroposphere—II, Natural background of biogenic lipid matter in aerosolsover the rural western United States, Atmos. Environ., 16, 2139–2159.
Turpin, B. J., and H.-J. Lim (2001), Species contributions to PM2.5 massconcentrations: Revisiting common assumptions for estimating organicmass, Aerosol Sci. Technol., 35, 602–610.
Turpin, B. J., P. Saxena, and E. Andrews (2000), Measuring particulateorganics in the atmosphere: Problems and prospects, Atmos. Environ.,34, 2983–3013.
van Aardenne, J., F. Dentener, J. Olivier, C. Goldewijk, and J. Lelieveld(2001), A 1� � 1� resolution data set of historical anthropogenic trace gasemissions for the period 1890–1990, Global Biogeochem. Cycles, 15,909–928.
Van Dingenen, R., et al. (2004), A European aerosol phenomenology—1:Physical characteristics of particulate matter at kerbside, urban, rural andbackground sites in Europe, Atmos. Environ., 38, 2561–2577.
Varga, B., G. Kiss, I. Ganszky, A. Gelencser, and Z. Krivacsy (2001),Isolation of water-soluble organic matter from atmospheric aerosol,Talanta, 55, 561–572.
Wagenbach, D., U. Gorlach, K. Moser, and K. O. Munnich (1988), CoastalAntarctic aerosol: the seasonal pattern of its chemical composition andradionuclide content, Tellus, Ser. B, 40, 426–436.
Yang, F., K. He, B. Ye, X. Chen, L. Cha, S. H. Cadle, T. Chan, and P. A.Mulawa (2005), One-year record of organic and elemental carbon in fineparticles in downtown Beijing and Shanghai, Atmos. Chem. Phys. Disc.,5, 217–241.
Yu, L. E., M. L. Shulman, R. Kopperud, and L. M. Hildemann (2005), Fineorganic aerosols collected in humid, rural location (Great Smoky Moun-tains, Tennessee, USA): Chemical and temporal characteristics, Atmos.Environ., 39, 6037–6050.
Zappoli, S., et al. (1999), Inorganic, organic and macromolecular compo-nents of fine aerosol in different areas of Europe in relation to their watersolubility, Atmos. Environ., 33, 2733–2743.
�����������������������J. Afonso, A. Caseiro, T. Oliveira, C. A. Pio, and C. Santos, Centre for
Environmental and Marine Studies and Department of Environment,University of Aveiro, 3810-193 Aveiro, Portugal. ([email protected])F. Barata and P. Fialho, Department of Agrarian Sciences, University of
the Azores, Terra Cha, Angra do Heroısmo 9701-851, Portugal.A. Gelencser, Air Chemistry Group at the Hungarian Academy of
Sciences, University of Pannonia, Egyetem u. 10, 8200 Veszprem, Hungary.A. Kasper-Giebl, H. Puxbaum, and A. Sanchez-Ochoa, Institute for
Chemical Technologies and Analytics, Vienna University of Technology,A-1040 Vienna, Austria.M. Legrand and S. Preunkert, Laboratoire de Glaciologie et Geophysique
de l’Environnement, Centre National de la Recherche Scientifique, F-38402Saint Martin d’Heres, France.M. Schock, Institut fur Umweltphysik, Universitat Heidelberg, D-60120
Heidelberg, Germany.
D23S02 PIO ET AL.: CLIMATOLOGY OF EUROPEAN AEROSOL
15 of 15
D23S02