Prezi versus PowerPoint
10
Prezi versus PowerPoint: The effects of varied digital presentation tools on students’ learning performance Pao-Nan Chou a, * , Chi-Cheng Chang b, ** , Pei-Fen Lu c a Department of Education, National University of Tainan, Tainan, Taiwan b Department of Technology Applications and Human Resource Development, National Taiwan Normal University, Taipei, Taiwan c Anping Elementary School, Tainan, Taiwan article info Article history: Received 22 December 2014 Received in revised form 20 October 2015 Accepted 22 October 2015 Available online 26 October 2015 Keywords: Digital presentation tool Slide format and design Instructional media in the classroom Instructional media evaluation Media selection strategy abstract This study investigated the effect of varied digital presentation tools (PowerPoint and Prezi) on the learning performance of students. The research focus was to evaluate how different presentation technologies used by class instructors affect the knowledge acqui- sition of students. A quasi experimental pre- and post-test control group design was adopted to fulfill the research purpose. The educational experiment was completed within 4 weeks. The participants were 78 fifth-grade students from a public elementary school in Taiwan. Students from three classes were divided into three treatment groups: PowerPoint instruction, Prezi instruction, and traditional instruction. Two quizzes (formative evalua- tion) directly related to learning units were administered to assess the immediate learning outcomes of the students after class. A learning achievement test (summative evaluation) was developed to measure the basic geographical knowledge of the students in a social science class. Two weeks after the summative evaluation was completed, the same learning achievement test with different item numbers (delayed summative evaluation) was employed to assess the long-term learning effects of the students. The results showed that Prezi was a more effective instructional medium for knowledge acquisition compared with traditional instruction. PowerPoint demonstrated instructional effectiveness on only the long-term learning retention of the students compared with traditional instruction. However, no significant difference was observed among the three types of tests in Prezi and PowerPoint instruction. © 2015 Elsevier Ltd. All rights reserved. 1. Introduction and literature review 1.1. PowerPoint use in the classroom PowerPoint, developed by Microsoft, is a computer application used for displaying specific digital content to target au- diences. School instructors widely adopt PowerPoint for classroom instruction because of its instructional effectiveness (Pippert & Moore, 1999). From an instructor's perspective, PowerPoint enables instructors to expend additional time on teaching content displayed on slides and the learning interaction of students by avoiding writing lengthy imparted * Corresponding author. ** Corresponding author. E-mail addresses: [email protected] (P.-N. Chou), [email protected] (C.-C. Chang), [email protected] (P.-F. Lu). Contents lists available at ScienceDirect Computers & Education journal homepage: www.elsevier.com/locate/compedu http://dx.doi.org/10.1016/j.compedu.2015.10.020 0360-1315/© 2015 Elsevier Ltd. All rights reserved. Computers & Education 91 (2015) 73e82
-
Upload
khangminh22 -
Category
Documents
-
view
1 -
download
0
Transcript of Prezi versus PowerPoint
Computers & Education 91 (2015) 73e82
Contents lists available at ScienceDirect
Computers & Education
journal homepage: www.elsevier .com/locate/compedu
Prezi versus PowerPoint: The effects of varied digitalpresentation tools on students’ learning performance
Pao-Nan Chou a, *, Chi-Cheng Chang b, **, Pei-Fen Lu c
a Department of Education, National University of Tainan, Tainan, Taiwanb Department of Technology Applications and Human Resource Development, National Taiwan Normal University, Taipei, Taiwanc Anping Elementary School, Tainan, Taiwan
a r t i c l e i n f o
Article history:Received 22 December 2014Received in revised form 20 October 2015Accepted 22 October 2015Available online 26 October 2015
Keywords:Digital presentation toolSlide format and designInstructional media in the classroomInstructional media evaluationMedia selection strategy
* Corresponding author.** Corresponding author.
E-mail addresses: [email protected] (P.-
http://dx.doi.org/10.1016/j.compedu.2015.10.0200360-1315/© 2015 Elsevier Ltd. All rights reserved.
a b s t r a c t
This study investigated the effect of varied digital presentation tools (PowerPoint andPrezi) on the learning performance of students. The research focus was to evaluate howdifferent presentation technologies used by class instructors affect the knowledge acqui-sition of students. A quasi experimental pre- and post-test control group design wasadopted to fulfill the research purpose. The educational experiment was completed within4 weeks. The participants were 78 fifth-grade students from a public elementary school inTaiwan. Students from three classes were divided into three treatment groups: PowerPointinstruction, Prezi instruction, and traditional instruction. Two quizzes (formative evalua-tion) directly related to learning units were administered to assess the immediate learningoutcomes of the students after class. A learning achievement test (summative evaluation)was developed to measure the basic geographical knowledge of the students in a socialscience class. Two weeks after the summative evaluation was completed, the samelearning achievement test with different item numbers (delayed summative evaluation)was employed to assess the long-term learning effects of the students. The results showedthat Prezi was a more effective instructional medium for knowledge acquisition comparedwith traditional instruction. PowerPoint demonstrated instructional effectiveness on onlythe long-term learning retention of the students compared with traditional instruction.However, no significant difference was observed among the three types of tests in Preziand PowerPoint instruction.
© 2015 Elsevier Ltd. All rights reserved.
1. Introduction and literature review
1.1. PowerPoint use in the classroom
PowerPoint, developed by Microsoft, is a computer application used for displaying specific digital content to target au-diences. School instructors widely adopt PowerPoint for classroom instruction because of its instructional effectiveness(Pippert & Moore, 1999). From an instructor's perspective, PowerPoint enables instructors to expend additional time onteaching content displayed on slides and the learning interaction of students by avoiding writing lengthy imparted
N. Chou), [email protected] (C.-C. Chang), [email protected] (P.-F. Lu).

P.-N. Chou et al. / Computers & Education 91 (2015) 73e8274
knowledge on blackboards (Daniels, 1999). Regarding the learning performance of students, Roblyer and Doering (2010)asserted that multimedia elements such as video, audio, and hyperlink documents embedded in PowerPoint slides effi-ciently present learningmaterials, which attracts the attention of learners and stimulates their thinking process (Clark, 2008).
The PowerPoint design principle establishes an organizational structure in slides, in which a bulleted presentation ofinstructional material summarizes the main ideas of instructors in a well-ordered manner (Susskind, 2005, 2008). However,such a systematic feature yielded several negative comments from school educators. For example, Tufte (2003) ferventlycriticized the use of PowerPoint in classroom, arguing that the cognitive style of PowerPoint transformed instructors intoauthoritarians who completely controlled and presented students with limited content condensed into slides. During thislinear-based presentation, crucial information is scattered on different slides (Tufte, 2006), and thus, forming concept re-lationships is difficult (Reed, 2006). However, robust experimental research has yet to confirm this claim.
Previous empirical studies evaluating the effects of PowerPoint on student learning have reported two divergent findings.In the first research camp, Bartsch and Cobern (2003) investigated the effects of three types of instruction presentation(overhead transparencies, PowerPoint consisting of text only, and PowerPoint consisting of multimedia elements) on thelearning performance of students and observed no significant difference among three experimental groups. Apperson, Laws,and Scepansky (2008) examined the instructional effectiveness of two types of instruction (traditional instruction andPowerPoint) and reported that PowerPoint instruction did not improve the learning achievements of students. In anotherresearch camp, Erdemir (2011) compared the instructional effects between traditional instruction and PowerPoint pre-sentations and indicated that student participants who received PowerPoint instruction enhanced their learning achieve-ments in physics. Although inconsistent results have been reported in those studies, compared with traditional instruction,students assigned to PowerPoint groups showed learning preferences for PowerPoint.
1.2. Prezi use in the classroom
Constructed on cloud computing technologies, Prezi is a Web 2.0 tool that enables users to create online presentations.Prezi was launched in 2009, and is regarded as innovative freeware for potentially replacing the role of PowerPoint, which hasdominated the presentation market. The major features of Prezi are an infinite canvas and nonlinear presentation style. Theinfinite canvas is a large blank workspace in which various concept blocks form presentation slides. The nonlinear presen-tation style is a function of user-defined paths for illustrating the relationship among slides by zooming (Good & Bederson,2002) and panning screen animations (Bean, 2012). As a web-based application, Prezi provides users with a learning op-portunity to collaboratively edit slides online with their peers (Perron & Steaens, 2010).
From an educational perspective, the Prezi design principle can be explained using two instructional theories. First, thescenario of user-established relationships among various slides (or concept blocks) is extremely similar to concept maps,which systematically organize different graphic concepts by linking words or phrases (Novak & Gowin, 1984). Second, thenonlinear presentation style precisely depicts the essence of elaboration theory (i.e. one of instructional design principles),which provides a detailed guidance for instructional sequences. In general, presentation sequences in learning materials,which may influence student learning, can be topical or spiral sequencing (Reigeluth, 1999). For example, depending on thepreferences and experiences of users, user-defined paths in Prezi can display slides in topical or spiral sequencing. In addition,slides can be presented in a holistic (all slides) or specific (one slide) angle of view. However, most studies on Prezi topics havetended to focus on innovative parts and have disregarded theoretical foundations.
Because Prezi is an emerging learning technology, few empirical studies have evaluated the instructional effectiveness ofPrezi. However, the findings of previous studies show positive outcomes for Prezi use in the classroom. For example,Ballentine (2012) instructed students to use Prezi to document their game design and indicated that Prezi might benefitstudents in game planning. Conboy, Fletcher, Russell, and Wilson (2012) interviewed students on their opinions regardingPrezi use. Most of the students reported that Prezi was an effective learning tool for enhancing their learning process. Brockand Brodahl (2013) conducted a cultural comparison between the United States and Norway regarding Prezi application ingroup projects and determined that Prezi changed the traditional thinking process of students in preparing presentationslides. Virtanen, Myll€arniemi, and Wallander (2013) surveyed the experiences of college students in using Prezi in theclassroom and indicated that students reported that Prezi might improve their learning outcomes. Although Prezi instructionyields positive outcomes, lacking experimental reports is a major weakness in previous research.
1.3. PowerPoint versus Prezi on student learning
A major difference between PowerPoint and Prezi is the slide presentation style. User-defined sequencing (nonlinear) inPrezi challenges the linear-structured format of PowerPoint. Nevertheless, both PowerPoint and Prezi are technology hubs inwhich several multimedia elements can be embedded (Perron& Steaens, 2010). According toMayer's (2005) cognitive theoryof multimedia learning, when students receive those two types of digital presentation (PowerPoint and Prezi), multimediafunctions combining text with pictorial components may enable students to acquire class knowledge in an efficient manner.In the current study, slides designed in PowerPoint and Prezi both share this theoretical assumption.
The cognitive theory of multimedia learning asserts that learners may actively select limited information through twosensory memories: verbal and pictorial models (Mayer, 2009). Multimedia technologies serve as effective learning tools thatenable learners to meaningfully organize and integrate received information with prior knowledge between working

P.-N. Chou et al. / Computers & Education 91 (2015) 73e82 75
memory and long-termmemory (Clark&Mayer, 2011). For instance, in the current study, multimedia elements such as videoclips or flash animations embedded in PowerPoint and Prezi slides may play a crucial role in selecting, organizing, andintegrating class knowledge imparted by instructors.
Because both PowerPoint and Prezi are digital presentation tools, scholars have begun comparing the effects of the twocomputer applications on student learning. Casteleyn and Mottart (2012) analyzed high school students instructed usingPowerPoint and Prezi and observed no significant difference in the learning outcomes of students between two experimentalgroups. Casteleyn, Mottart, and Valcke (2013) designed a computer-based training program in which college studentsreceived two types (PowerPoint and Prezi) of pre-recorded presentation material (e-lecture) in computer laboratories. Theresults revealed no significant difference in knowledge acquisition between PowerPoint and Prezi groups. Although thereported findings of previous studies are consistent, some parts in research design remain questionable. For instance, inCasteleyn et al. (2013), the instructional method was not conducted in a real learning environment. Furthermore, in Casteleynand Mottart (2012) and Casteleyn et al. (2013), no traditional instruction groups (with no presentation tools) have beenestablished.
1.4. The purpose of the study
Based on the aforementioned discussion, this study investigated the effects of two digital presentation tools (PowerPointand Prezi) on the learning performances of students. The research focus was to evaluate how different presentation tech-nologies used by class instructors affect the knowledge acquisition of students. An educational experiment was conducted atone elementary school in which students in three fifth-grade classes received different types of presentation material(PowerPoint, Prezi, and Blackboard) designed by one class instructor. One major research question is presented as follows:
C Did significant differences exist in the scores on various tests (formative and summative evaluation, and delayedsummative evaluation) among elementary school students receiving different types of presentation material?
According to the research question, the following research hypothesis was formulated:
C A significant difference exists in the scores on different tests among elementary school students receiving differenttypes of presentation materials.
1.5. Significance of this study
In the current research design, this study applied an experimental method to examine the instructional effectiveness oftwo digital presentation tools combined with traditional instruction in a real-world setting instead of a computer laboratory.The students receiving real classroom instruction provided vivid information on knowledge acquisition. The learning per-formance yielded in classrooms was evaluated at three levels: formative, summative, and delayed summative tests. Such asystematic assessment design can be used to examine the effects of instructional media, from immediate learning responsesto long-term learning retention.
The major difference between two digital presentation tools (Prezi and PowerPoint) in the study was the presentationstyle (non-linear V.S. linear) used in learningmaterials rather than technologies themselves. From an educational perspective,a non-linear method in Prezi slides, which combine two instructional design principles (i.e. concept map and learningsequence), offers the instructor a novel way to develop well-organized course materials. In contrast, a linear method inPowerPoint often enables the instructor to create less relevance slides with a focus on linear-thinking. Since instructioncontent in three experimental treatments were designed and taught by the same instructor, the type of presentation ma-terials that meet the learning needs of students can clearly be determined.
2. Research method
2.1. Research design
In this study, a quasi experimental pre- and post-test control group design was adopted to examine the effects of the twopresentation tools on the learning performance of students. The independent variable was the type of presentation materialdesigned byone class instructor. The dependent variablewas the learning achievements of students in social science, includingformative and summative, as well as delayed summative evaluations. Table 1 presents the research design of this study.
Before the experiment was implemented, the student participants' final scores for social science class for the previousacademic year were collected as the pre-test measure to examine the starting learning behaviors (i.e., prior knowledge) of thelearners in social science. The rationale of using the type of pre-test measurewas that course contents regarding social sciencein different academic years were closely related. The social science scores of the previous academic year might be an indicatorthat showed learners’ prior knowledge on current learning materials.
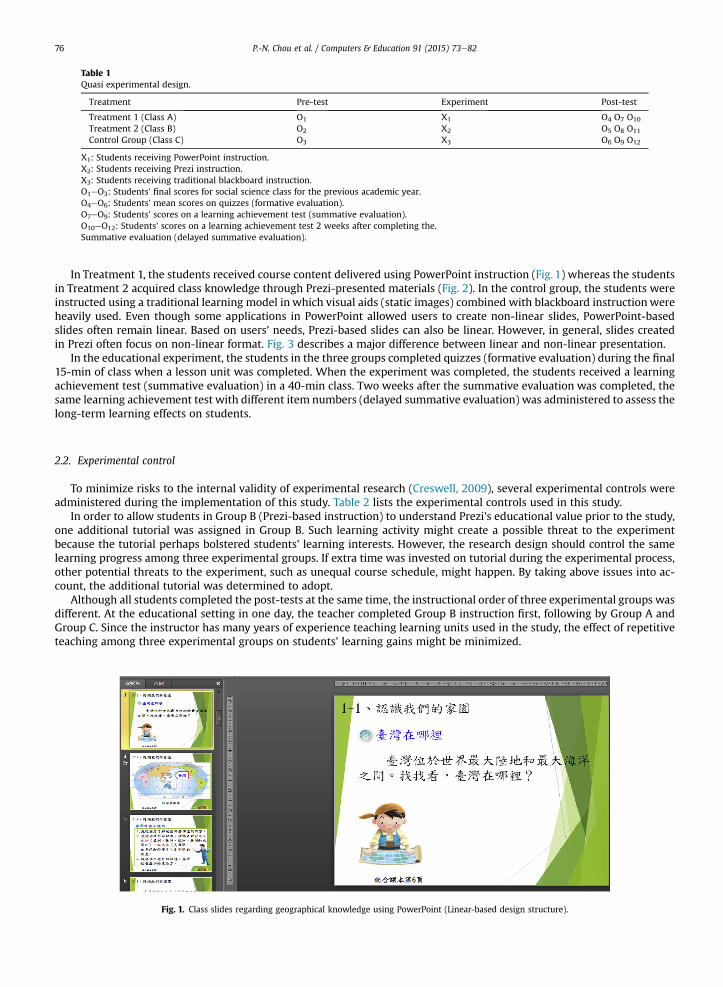
Table 1Quasi experimental design.
Treatment Pre-test Experiment Post-test
Treatment 1 (Class A) O1 X1 O4 O7 O10
Treatment 2 (Class B) O2 X2 O5 O8 O11
Control Group (Class C) O3 X3 O6 O9 O12
X1: Students receiving PowerPoint instruction.X2: Students receiving Prezi instruction.X3: Students receiving traditional blackboard instruction.O1eO3: Students' final scores for social science class for the previous academic year.O4eO6: Students' mean scores on quizzes (formative evaluation).O7eO9: Students' scores on a learning achievement test (summative evaluation).O10eO12: Students' scores on a learning achievement test 2 weeks after completing the.Summative evaluation (delayed summative evaluation).
P.-N. Chou et al. / Computers & Education 91 (2015) 73e8276
In Treatment 1, the students received course content delivered using PowerPoint instruction (Fig. 1) whereas the studentsin Treatment 2 acquired class knowledge through Prezi-presented materials (Fig. 2). In the control group, the students wereinstructed using a traditional learning model in which visual aids (static images) combined with blackboard instructionwereheavily used. Even though some applications in PowerPoint allowed users to create non-linear slides, PowerPoint-basedslides often remain linear. Based on users’ needs, Prezi-based slides can also be linear. However, in general, slides createdin Prezi often focus on non-linear format. Fig. 3 describes a major difference between linear and non-linear presentation.
In the educational experiment, the students in the three groups completed quizzes (formative evaluation) during the final15-min of class when a lesson unit was completed. When the experiment was completed, the students received a learningachievement test (summative evaluation) in a 40-min class. Two weeks after the summative evaluation was completed, thesame learning achievement test with different item numbers (delayed summative evaluation) was administered to assess thelong-term learning effects on students.
2.2. Experimental control
To minimize risks to the internal validity of experimental research (Creswell, 2009), several experimental controls wereadministered during the implementation of this study. Table 2 lists the experimental controls used in this study.
In order to allow students in Group B (Prezi-based instruction) to understand Prezi's educational value prior to the study,one additional tutorial was assigned in Group B. Such learning activity might create a possible threat to the experimentbecause the tutorial perhaps bolstered students' learning interests. However, the research design should control the samelearning progress among three experimental groups. If extra time was invested on tutorial during the experimental process,other potential threats to the experiment, such as unequal course schedule, might happen. By taking above issues into ac-count, the additional tutorial was determined to adopt.
Although all students completed the post-tests at the same time, the instructional order of three experimental groups wasdifferent. At the educational setting in one day, the teacher completed Group B instruction first, following by Group A andGroup C. Since the instructor has many years of experience teaching learning units used in the study, the effect of repetitiveteaching among three experimental groups on students’ learning gains might be minimized.
Fig. 1. Class slides regarding geographical knowledge using PowerPoint (Linear-based design structure).
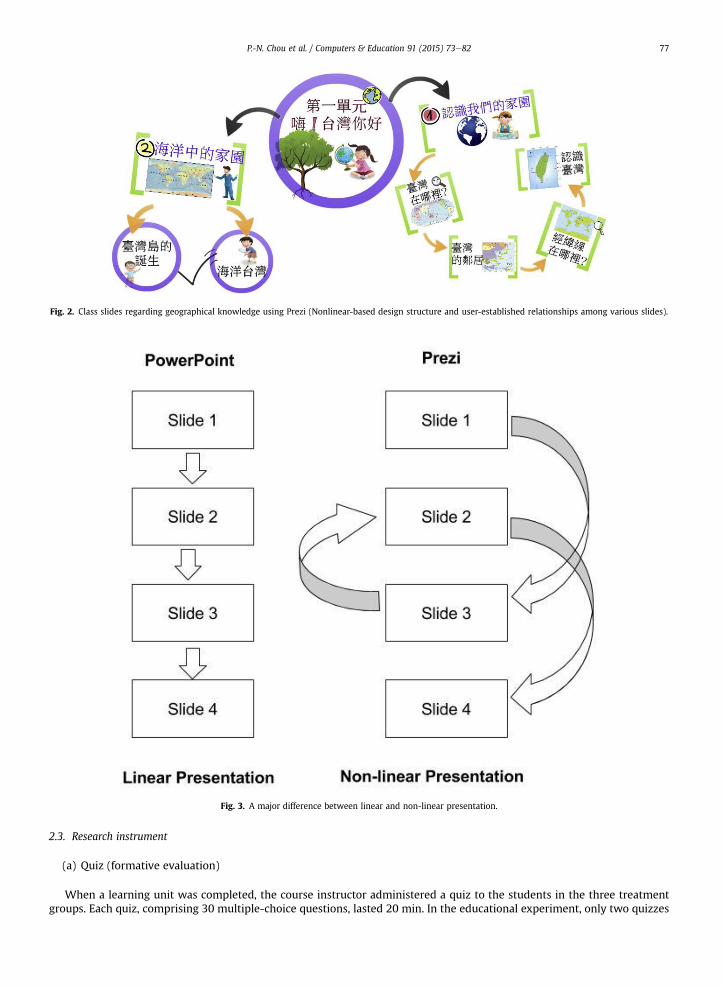
Fig. 2. Class slides regarding geographical knowledge using Prezi (Nonlinear-based design structure and user-established relationships among various slides).
Fig. 3. A major difference between linear and non-linear presentation.
P.-N. Chou et al. / Computers & Education 91 (2015) 73e82 77
2.3. Research instrument
(a) Quiz (formative evaluation)
When a learning unit was completed, the course instructor administered a quiz to the students in the three treatmentgroups. Each quiz, comprising 30 multiple-choice questions, lasted 20 min. In the educational experiment, only two quizzes

Table 2Experimental controls.
Potential threat Measure
Class instructor The instructor imparting course contents in three treatment groups was the same personClass time Each treatment group received the same class timeLearning contents The learning materials covered the same instructional knowledgeClass setting Three treatment groups received instruction in similar physical classroomsTest implementation Post-tests were administered in the same school daySlide design All slides created by one class instructor. In order to ensure the content consistency between Prezi and
PowerPoint, three experienced school instructors were invited to check the slide design.
P.-N. Chou et al. / Computers & Education 91 (2015) 73e8278
were implemented. The test items in the quizzes were primarily obtained from a test bank in the school. In this study, thecomputing of formative evaluation was to add the scores of the students on each quiz.
(b) Learning achievement test I (summative evaluation)
An achievement test was developed tomeasure the students’ understanding of geographical knowledge in a social scienceclass. The test comprises 2 true-or-false,11multiple-choice and 4 integration questions (31 sub-test items). High scores on thetest indicated high learning achievements of the students. The score range of the test was between 1 and 44. Fig. 4 shows atest item from the integration question.
Three procedures were adopted to ensure the reliability and validity of the test. First, three expert instructors in socialscience examined the contents of the original 63 test items (12 true-or-false, 18 multiple-choice, and 4 integration questionswith 33 sub questions). Unclear question descriptions were removed at this stage. Second, the original test was administeredto 76 fifth-grade students who had learned the test knowledge before. Subsequently, the item discrimination analysis resultrevealed that the discrimination index of 19 items was below 0.2, which is regarded as a standard number in selectingappropriate test items (Aiken & Groth-Marnat, 2006). The number of test items was reduced to 44. Finally, the reliability testwas performed to identify the reliability of the test. Overall, the reliability coefficient was 0.92.
(c) Learning achievement test II (delayed summative evaluation)
The test items were identical to those of the learning achievement test I. However, to avoid students becoming familiarwith the test items, different item numbers were allocated to the questions.
The implementation of the three aforementioned types of test is shown in Table 3.
2.4. Participants
This study adopted convenience sampling to select three target classes at a public elementary school in Taiwan. Overall, 78fifth-grade students voluntarily participated in the educational experiment (Class A: 24; Class B: 27; Class C: 27). Since theclass design in the school adopted a normal distribution, groups’ academic aptitudes in three classes were similar. Thestudents in all of the classes were familiar with PowerPoint instruction because school instructors often used PowerPoint todeliver their lessons. The students in Class B received a 30-min tutorial on perceiving Prezi slides before the experiment wasimplemented. Table 4 presents the profiles of the participants.
Fig. 4. Test item from the integration question (Geographical identification of one river).
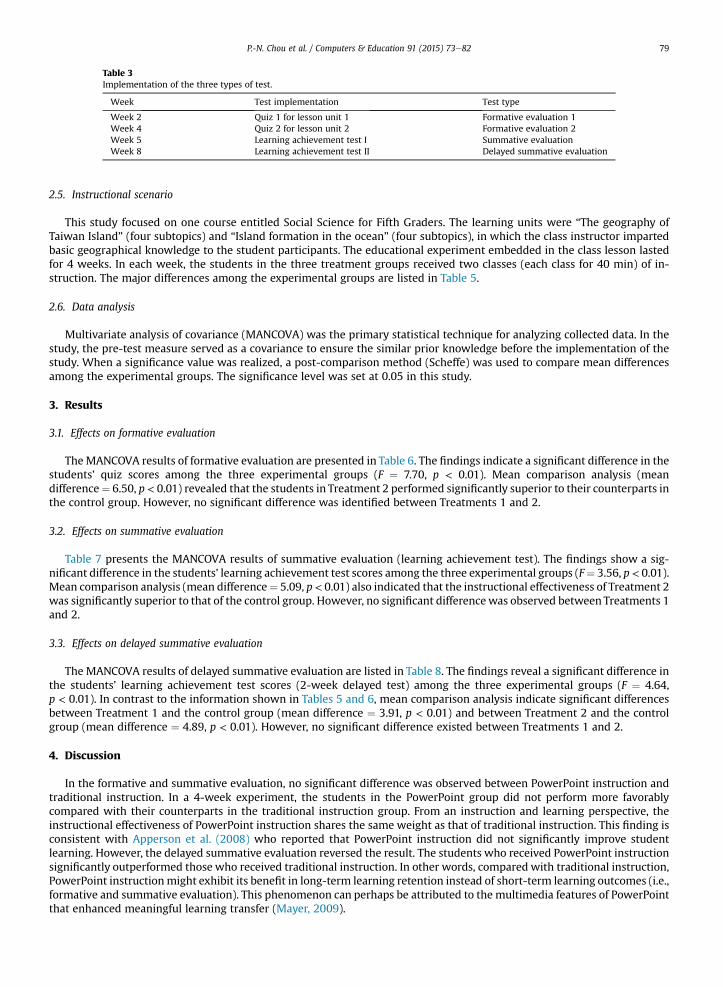
Table 3Implementation of the three types of test.
Week Test implementation Test type
Week 2 Quiz 1 for lesson unit 1 Formative evaluation 1Week 4 Quiz 2 for lesson unit 2 Formative evaluation 2Week 5 Learning achievement test I Summative evaluationWeek 8 Learning achievement test II Delayed summative evaluation
P.-N. Chou et al. / Computers & Education 91 (2015) 73e82 79
2.5. Instructional scenario
This study focused on one course entitled Social Science for Fifth Graders. The learning units were “The geography ofTaiwan Island” (four subtopics) and “Island formation in the ocean” (four subtopics), in which the class instructor impartedbasic geographical knowledge to the student participants. The educational experiment embedded in the class lesson lastedfor 4 weeks. In each week, the students in the three treatment groups received two classes (each class for 40 min) of in-struction. The major differences among the experimental groups are listed in Table 5.
2.6. Data analysis
Multivariate analysis of covariance (MANCOVA) was the primary statistical technique for analyzing collected data. In thestudy, the pre-test measure served as a covariance to ensure the similar prior knowledge before the implementation of thestudy. When a significance value was realized, a post-comparison method (Scheffe) was used to compare mean differencesamong the experimental groups. The significance level was set at 0.05 in this study.
3. Results
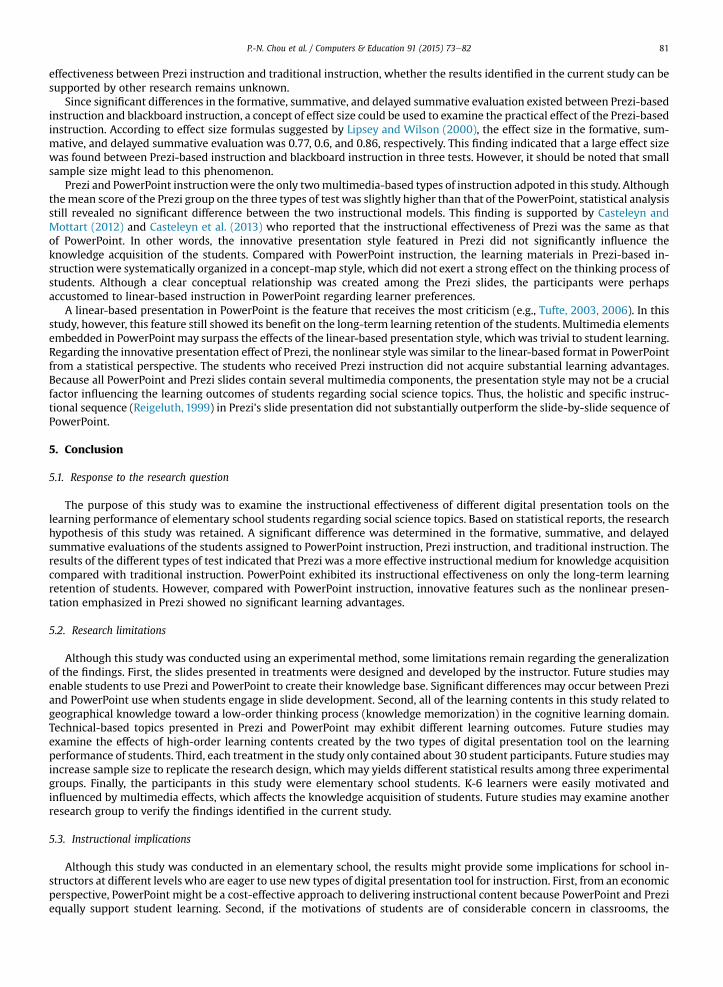
3.1. Effects on formative evaluation
TheMANCOVA results of formative evaluation are presented in Table 6. The findings indicate a significant difference in thestudents’ quiz scores among the three experimental groups (F ¼ 7.70, p < 0.01). Mean comparison analysis (meandifference¼ 6.50, p < 0.01) revealed that the students in Treatment 2 performed significantly superior to their counterparts inthe control group. However, no significant difference was identified between Treatments 1 and 2.
3.2. Effects on summative evaluation
Table 7 presents the MANCOVA results of summative evaluation (learning achievement test). The findings show a sig-nificant difference in the students’ learning achievement test scores among the three experimental groups (F¼ 3.56, p < 0.01).Mean comparison analysis (mean difference¼ 5.09, p< 0.01) also indicated that the instructional effectiveness of Treatment 2was significantly superior to that of the control group. However, no significant differencewas observed between Treatments 1and 2.
3.3. Effects on delayed summative evaluation
The MANCOVA results of delayed summative evaluation are listed in Table 8. The findings reveal a significant difference inthe students’ learning achievement test scores (2-week delayed test) among the three experimental groups (F ¼ 4.64,p < 0.01). In contrast to the information shown in Tables 5 and 6, mean comparison analysis indicate significant differencesbetween Treatment 1 and the control group (mean difference ¼ 3.91, p < 0.01) and between Treatment 2 and the controlgroup (mean difference ¼ 4.89, p < 0.01). However, no significant difference existed between Treatments 1 and 2.
4. Discussion
In the formative and summative evaluation, no significant difference was observed between PowerPoint instruction andtraditional instruction. In a 4-week experiment, the students in the PowerPoint group did not perform more favorablycompared with their counterparts in the traditional instruction group. From an instruction and learning perspective, theinstructional effectiveness of PowerPoint instruction shares the same weight as that of traditional instruction. This finding isconsistent with Apperson et al. (2008) who reported that PowerPoint instruction did not significantly improve studentlearning. However, the delayed summative evaluation reversed the result. The students who received PowerPoint instructionsignificantly outperformed those who received traditional instruction. In other words, compared with traditional instruction,PowerPoint instructionmight exhibit its benefit in long-term learning retention instead of short-term learning outcomes (i.e.,formative and summative evaluation). This phenomenon can perhaps be attributed to the multimedia features of PowerPointthat enhanced meaningful learning transfer (Mayer, 2009).

Table 4Profiles of the research participant.
Class Experiment Number of studenta
Class A PowerPoint instruction 24Class B Prezi instruction 27Class C Blackboard instruction 27
a Students who missed either quizzes or learning achievement tests were eliminated from further statisticalanalysis.
Table 5Comparisons among the experimental groups.
Group PowerPoint instruction (Treatment 1) Prezi instruction (Treatment 2) Blackboard instruction(control group)
Major features inpresentation
1 Linear-based presentation in slides2 Slide-by-slide sequence
1 Non-linear presentation in slides2 Holistic and specific slide presentation through
zooming in and out animations
No slides used
Instructional design Static images, video clips, flash animationembedded in slides
Static images, video clips, flash animation embedded inslides
Visual aids (static image) onthe blackboard
Table 6MANCOVA results of formative evaluation.
Source SS DF MF F Scheffe's mean comparison
Between 570.61 2 285.31 6.70** Treatment 2 > Control**Within 3149.89 74 42.57Total 3720.50 76
Note: Treatment 1 (M: 38.33/SD: 1.35), Treatment 2 (M: 41.42/SD: 1.26), Control (M: 34.92/SD: 1.26).**p < 0.01.
Table 7MANCOVA results of summative evaluation.
Source SS DF MF F Scheffe's mean comparison
Between 351.26 2 175.63 3.56** Treatment 2 > Control**Within 3650.23 74 49.33Total 4001.49 76
Note: Treatment 1 (M: 29.32/SD: 1.45), Treatment 2 (M: 31.48/SD: 1.35), Control (M: 26.39/SD: 1.36).**p < 0.01.
Table 8MANCOVA results of delayed summative evaluation.
Source SS DF MF F Scheffe's mean comparison
Between 355.01 2 177.51 4.64** Treatment 1 > Control*Within 2831.23 74 38.26 Treatment 2 > Control**Total 3186.24 76
Note: Treatment 1 (M: 30.95/SD: 1.28), Treatment 2 (M: 31.93/SD: 1.19), Control (M: 27.04/SD: 1.20).*p < 0.05 **p < 0.01.
P.-N. Chou et al. / Computers & Education 91 (2015) 73e8280
Regardless of the type of evaluation, a significant difference was observed between Prezi instruction and traditional in-struction. Regarding knowledge acquisition, the students who received Prezi instruction significantly outperformed theircounterparts who received traditional instruction. In other words, innovative features in Prezi slides stimulated theknowledge transfer of the students from immediate learning responses (formative evaluation) to long-term learningretention (delayed summative evaluation). This finding perhaps can be attributed to the novelty effect (Burke & James, 2008)of Prezi, which aroused the learning motivations and interests of the students, resulting in enhanced learning performance.Furthermore, the learningmaterials in the Prezi's slides were designed by several multimedia features, which probably addedsome influence on student learning (Mayer, 2009). Other possible factors, such as material presentation methods (Reigeluth,1999), can also lead to significant learning gains. However, because no previous studies have compared instructional
P.-N. Chou et al. / Computers & Education 91 (2015) 73e82 81
effectiveness between Prezi instruction and traditional instruction, whether the results identified in the current study can besupported by other research remains unknown.
Since significant differences in the formative, summative, and delayed summative evaluation existed between Prezi-basedinstruction and blackboard instruction, a concept of effect size could be used to examine the practical effect of the Prezi-basedinstruction. According to effect size formulas suggested by Lipsey and Wilson (2000), the effect size in the formative, sum-mative, and delayed summative evaluation was 0.77, 0.6, and 0.86, respectively. This finding indicated that a large effect sizewas found between Prezi-based instruction and blackboard instruction in three tests. However, it should be noted that smallsample size might lead to this phenomenon.
Prezi and PowerPoint instructionwere the only twomultimedia-based types of instruction adpoted in this study. Althoughthemean score of the Prezi group on the three types of test was slightly higher than that of the PowerPoint, statistical analysisstill revealed no significant difference between the two instructional models. This finding is supported by Casteleyn andMottart (2012) and Casteleyn et al. (2013) who reported that the instructional effectiveness of Prezi was the same as thatof PowerPoint. In other words, the innovative presentation style featured in Prezi did not significantly influence theknowledge acquisition of the students. Compared with PowerPoint instruction, the learning materials in Prezi-based in-structionwere systematically organized in a concept-map style, which did not exert a strong effect on the thinking process ofstudents. Although a clear conceptual relationship was created among the Prezi slides, the participants were perhapsaccustomed to linear-based instruction in PowerPoint regarding learner preferences.
A linear-based presentation in PowerPoint is the feature that receives the most criticism (e.g., Tufte, 2003, 2006). In thisstudy, however, this feature still showed its benefit on the long-term learning retention of the students. Multimedia elementsembedded in PowerPoint may surpass the effects of the linear-based presentation style, which was trivial to student learning.Regarding the innovative presentation effect of Prezi, the nonlinear style was similar to the linear-based format in PowerPointfrom a statistical perspective. The students who received Prezi instruction did not acquire substantial learning advantages.Because all PowerPoint and Prezi slides contain several multimedia components, the presentation style may not be a crucialfactor influencing the learning outcomes of students regarding social science topics. Thus, the holistic and specific instruc-tional sequence (Reigeluth, 1999) in Prezi's slide presentation did not substantially outperform the slide-by-slide sequence ofPowerPoint.
5. Conclusion
5.1. Response to the research question
The purpose of this study was to examine the instructional effectiveness of different digital presentation tools on thelearning performance of elementary school students regarding social science topics. Based on statistical reports, the researchhypothesis of this study was retained. A significant difference was determined in the formative, summative, and delayedsummative evaluations of the students assigned to PowerPoint instruction, Prezi instruction, and traditional instruction. Theresults of the different types of test indicated that Prezi was a more effective instructional medium for knowledge acquisitioncompared with traditional instruction. PowerPoint exhibited its instructional effectiveness on only the long-term learningretention of students. However, compared with PowerPoint instruction, innovative features such as the nonlinear presen-tation emphasized in Prezi showed no significant learning advantages.
5.2. Research limitations
Although this study was conducted using an experimental method, some limitations remain regarding the generalizationof the findings. First, the slides presented in treatments were designed and developed by the instructor. Future studies mayenable students to use Prezi and PowerPoint to create their knowledge base. Significant differences may occur between Preziand PowerPoint use when students engage in slide development. Second, all of the learning contents in this study related togeographical knowledge toward a low-order thinking process (knowledge memorization) in the cognitive learning domain.Technical-based topics presented in Prezi and PowerPoint may exhibit different learning outcomes. Future studies mayexamine the effects of high-order learning contents created by the two types of digital presentation tool on the learningperformance of students. Third, each treatment in the study only contained about 30 student participants. Future studies mayincrease sample size to replicate the research design, which may yields different statistical results among three experimentalgroups. Finally, the participants in this study were elementary school students. K-6 learners were easily motivated andinfluenced by multimedia effects, which affects the knowledge acquisition of students. Future studies may examine anotherresearch group to verify the findings identified in the current study.
5.3. Instructional implications
Although this study was conducted in an elementary school, the results might provide some implications for school in-structors at different levels who are eager to use new types of digital presentation tool for instruction. First, from an economicperspective, PowerPoint might be a cost-effective approach to delivering instructional content because PowerPoint and Preziequally support student learning. Second, if the motivations of students are of considerable concern in classrooms, the
P.-N. Chou et al. / Computers & Education 91 (2015) 73e8282
innovative features emphasized in Prezi may arouse the learning interests of students, leading them to pay additionalattention to learning materials. Finally, compared with PowerPoint instruction, traditional instruction remains valuable informative and summative evaluation. Under the condition of limited technology resources, traditional instruction is analternative method to replace the role of PowerPoint.
References
Aiken, L. R., & Groth-Marnat, G. (2006). Psychological testing and assessment (12th ed.). Boston, MA: Allyn and Bacon.Apperson, J. M., Laws, E. L., & Scepansky, J. A. (2008). An assessment of student preferences for PowerPoint presentation structure in undergraduate courses.
Computers & Education, 50, 148e153.Ballentine, B. (2012). High concept and design documentation: using Prezi for undergraduate game design. In Professional Communication Conference (IPCC)
(pp. 1e5). Orlando, FL: IEEE.Bartsch, R. A., & Cobern, K. M. (2003). Effectiveness of PowerPoint presentations in lectures. Computers & Education, 41(1), 77e86.Bean, J. (2012). Presentation software supporting visual design_displaying spatial relationships with a zooming user interface. In Professional Communi-
cation Conference (IPCC) (pp. 1e6). Orlando, FL: IEEE.Brock, S., & Brodahl, C. (2013). A tale of two cultures: cross cultural comparison in learning the Prezi presentation software tool in the US and Norway.
Journal of Information Technology Education: Research, 12, 95e119.Burke, L. A., & James, K. E. (2008). PowerPoint-based lectures in business education: an empirical investigation of student-perceived novelty and effec-
tiveness. Business Communication Quarterly, 71(3), 277e296.Casteleyn, J., & Mottart, A. (2012). Presenting material via graphic organizers in science classes in secondary education. Procedia e Social and Behavioral
Sciences, 69, 458e466.Casteleyn, J., Mottart, A., & Valcke, M. (2013). The impact of graphic organisers on learning from presentations. Technology, Pedagogy and Education, 22(3),
283e301.Clark, J. (2008). PowerPoint and pedagogy: maintaining student interest in university lectures. College Teaching, 56(1), 39e45.Clark, R. C., & Mayer, R. E. (2011). E-Learning and the science of instruction (3rd ed.). San Francisco, CA: Pfeiffer.Conboy, C., Fletcher, S., Russell, K., & Wilson, M. (2012). An evaluation of the potential use and impact of Prezi, the zooming editor software, as a tool to
facilitate learning in higher education. Innovations in Practice, 7, 31e45.Creswell, J. W. (2009). Research design: Qualitative, quantitative, and mixed methods approaches (3rd ed.). Thousand Oaks, CA: Sage.Daniels, L. (1999). Introducing technology in the classroom: PowerPoint as a first step. Journal of Computing in Higher Education, 10(2), 42e56.Erdemir, N. (2011). The effect of PowerPoint and traditional lectures. Journal of Turkish Science Education, 8(3), 176e189.Good, L., & Bederson, B. B. (2002). Zoomable user interfaces as a medium for slide show presentations. Information Visualization, 1(1), 35e49.Lipsey, M. W., & Wilson, D. (2000). Practical meta-analysis. Thousand Oaks, CA: Sage.Mayer, R. E. (2005). Cognitive theory of multimedia learning. In R. E. Mayer (Ed.), The Cambridge handbook of multimedia learning (pp. 31e48). New York, NY:
Cambridge University Press.Mayer, R. E. (2009). Multimedia learning. New York, NY: Cambridge University Press.Novak, J. D., & Gowin, D. B. (1984). Learning how to learn. NY: Cambridge University Press.Perron, B. E., & Steaens, A. (2010). A review of a presentation technology: Prezi. Research on Social Work Practice, 1e2.Pippert, T. D., & Moore, H. A. (1999). Multiple perspectives on multimedia in the large lecture. Teaching Sociology, 27(2), 92e109.Reed, S. K. (2006). Cognitive architectures for multimedia learning. Educational Psychologist, 41(2), 87e98.Reigeluth, C. M. (1999). The elaboration theory: guidance for scope and sequence decisions. In C. M. Reigeluth (Ed.), Instructional design theories and models:
A new paradigm of instructional theory (Vol. II, pp. 425e453). Mahwah, NJ: Lawrence Erlbaum Associates.Roblyer, M. D., & Doering, A. H. (2010). Integrating educational technology into teaching (5th ed.). Boston, MA: Allyn and Bacon.Susskind, J. E. (2005). PowerPoint's power in the classroom: enhancing students' self-efficacy and attitudes. Computers & Education, 45(2), 203e215.Susskind, J. E. (2008). Limits of PowerPoint's power: enhancing students' self-efficacy and attitudes but not their behavior. Computers & Education, 50(4),
1228e1239.Tufte, E. R. (2003). PowerPoint is evil. Retrieved from Wired: http://archive.wired.com/wired/archive/11.09/ppt2.html.Tufte, E. R. (2006). The cognitive style of PowerPoint: Pitching out corrupts within. Cheshire, CT: Graphics Press.Virtanen, P., Myll€arniemi, J., & Wallander, H. (2013). Diversifying higher education: facilitating different ways of learning. Campus-Wide Information Systems,
30(3), 201e211.