PowerPoint プレゼンテーション
73
0
-
Upload
khangminh22 -
Category
Documents
-
view
3 -
download
0
Transcript of PowerPoint プレゼンテーション

0
1
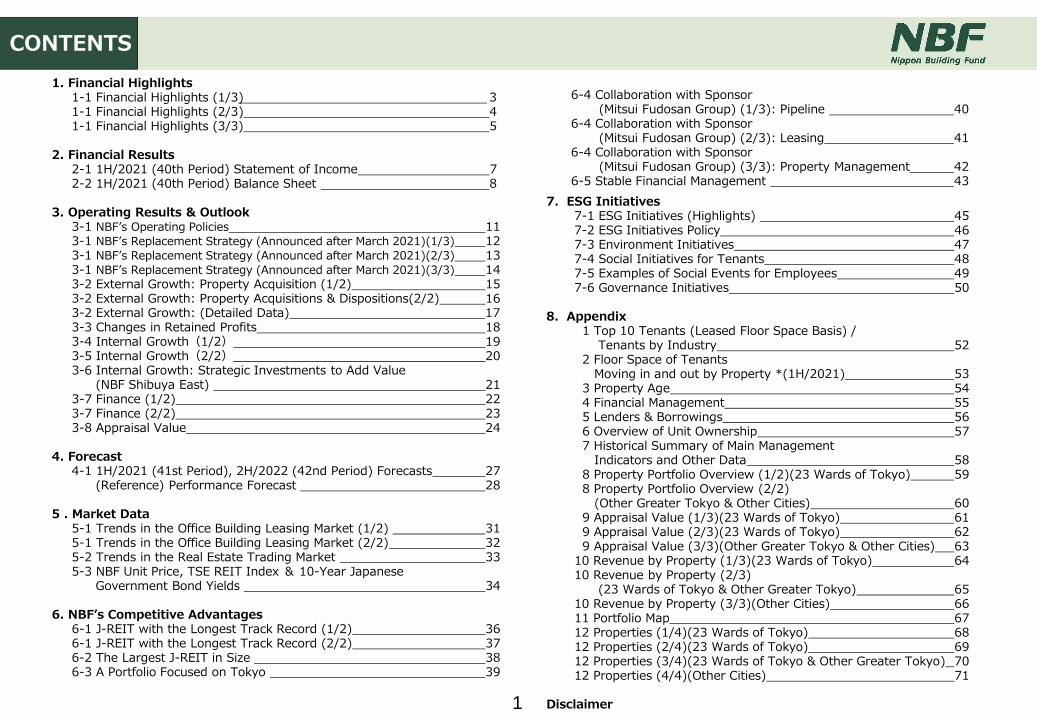
1. Financial Highlights 1-1 Financial Highlights (1/3) 31-1 Financial Highlights (2/3) 41-1 Financial Highlights (3/3) 5
2. Financial Results 2-1 1H/2021 (40th Period) Statement of Income 72-2 1H/2021 (40th Period) Balance Sheet 8
3. Operating Results & Outlook3-1 NBF’s Operating Policies 113-1 NBF’s Replacement Strategy (Announced after March 2021)(1/3) 123-1 NBF’s Replacement Strategy (Announced after March 2021)(2/3) 133-1 NBF’s Replacement Strategy (Announced after March 2021)(3/3) 143-2 External Growth: Property Acquisition (1/2) 153-2 External Growth: Property Acquisitions & Dispositions(2/2) 163-2 External Growth: (Detailed Data) 173-3 Changes in Retained Profits 183-4 Internal Growth(1/2) 193-5 Internal Growth(2/2) 203-6 Internal Growth: Strategic Investments to Add Value
(NBF Shibuya East) 213-7 Finance (1/2) 223-7 Finance (2/2) 233-8 Appraisal Value 24
4. Forecast4-1 1H/2021 (41st Period), 2H/2022 (42nd Period) Forecasts 27
(Reference) Performance Forecast 28
5 . Market Data5-1 Trends in the Office Building Leasing Market (1/2) 315-1 Trends in the Office Building Leasing Market (2/2) 325-2 Trends in the Real Estate Trading Market 335-3 NBF Unit Price, TSE REIT Index & 10-Year Japanese
Government Bond Yields 34
6. NBF’s Competitive Advantages6-1 J-REIT with the Longest Track Record (1/2) 366-1 J-REIT with the Longest Track Record (2/2) 376-2 The Largest J-REIT in Size 386-3 A Portfolio Focused on Tokyo 39
7. ESG Initiatives7-1 ESG Initiatives (Highlights) 45 7-2 ESG Initiatives Policy 467-3 Environment Initiatives 477-4 Social Initiatives for Tenants 487-5 Examples of Social Events for Employees 497-6 Governance Initiatives 50
8. Appendix1 Top 10 Tenants (Leased Floor Space Basis) /
Tenants by Industry 522 Floor Space of Tenants
Moving in and out by Property *(1H/2021) 533 Property Age 544 Financial Management 555 Lenders & Borrowings 566 Overview of Unit Ownership 577 Historical Summary of Main Management
Indicators and Other Data 588 Property Portfolio Overview (1/2)(23 Wards of Tokyo) 598 Property Portfolio Overview (2/2)
(Other Greater Tokyo & Other Cities) 609 Appraisal Value (1/3)(23 Wards of Tokyo) 619 Appraisal Value (2/3)(23 Wards of Tokyo) 629 Appraisal Value (3/3)(Other Greater Tokyo & Other Cities) 63
10 Revenue by Property (1/3)(23 Wards of Tokyo) 6410 Revenue by Property (2/3)
(23 Wards of Tokyo & Other Greater Tokyo) 6510 Revenue by Property (3/3)(Other Cities) 6611 Portfolio Map 6712 Properties (1/4)(23 Wards of Tokyo) 6812 Properties (2/4)(23 Wards of Tokyo) 6912 Properties (3/4)(23 Wards of Tokyo & Other Greater Tokyo) 7012 Properties (4/4)(Other Cities) 71
Disclaimer
6-4 Collaboration with Sponsor (Mitsui Fudosan Group) (1/3): Pipeline 40
6-4 Collaboration with Sponsor(Mitsui Fudosan Group) (2/3): Leasing 41
6-4 Collaboration with Sponsor (Mitsui Fudosan Group) (3/3): Property Management 42
6-5 Stable Financial Management 43
CONTENTS

2
1. Financial Highlights

3
Financial Highlights (1/3)1-1
Actual Forecast
1H/2021(40th Period)
2H/2021(41st Period)
1H/2022(42nd Period)
PoP Change
Total operating revenues 46,213 million yen +4,465 million yen +10.7% 50,396 million yen 50,777 million yen
Operating income 22,778 million yen +4,066 million yen +21.7% 22,375 million yen 24,277 million yen
Operating income
(excl. profits and losses from dispositions)
21,291 million yen +3,968 million yen +22.9% 19,679 million yen 17,252 million yen
Net income 21,427 million yen +4,154 million yen +24.0% 21,003 million yen 22,926 million yen
Net income (excl. profits and losses from
dispositions)19,940 million yen +4,055 million yen +25.5% 18,308 million yen 15,901 million yen
DPU (yen) 11,684 yen +684 yen +6.2% 11,500 yen 12,500 yen
Units issued and outstanding at the Period end 1,652,500 1,652,500 1,652,500
Average occupancy rate during the Period 97.8% -1.0% 96.7% 97.5%
-
DPU: Forecast (announced February 2021) ¥11,350 + ¥334

4
Financial Highlights (2/3)1-1
(As of June 30, 2021)
Total assetsUnrealized gain
on appraisal valueLocation
Average Occupancy
Rate during
the Period Note 1
1,367.5 billion yen 297.3 billion yen23 wards of Tokyo: 82.7%
Central 5 wards of Tokyo: 55.9%97.8%
LTVLong-term fixed-rate
debt ratio
Average
interest rateAverage maturity
42.2% 95.1% 0.47% 6.08 years
Market cap NAV per unit Note 2
1,145.1 billion yen 573,646 yen
Asset
Debt
Equity
Note 1: Average occupancy rate during the period: weighted average of
month-end occupancy rate on a floor space basis
Note 2: NAV per unit: (Unitholders’ capital at period end + Reserve for
advanced depreciation in the next period (reserve - reversal)
+ Unrealized gain or loss on appraisal value at period end)
÷ Units issued and outstanding at period end

5
545,190
558,516 566,917 572,136
564,249 573,646
350,000
400,000
450,000
500,000
550,000
600,000
2H/'18
35th
Period
1H/'19
36th
Period
2H/'19
37th
Period
1H/'20
38th
Period
2H/'20
39th
Period
1H/'21
40th
Period
(yen)
0 0
10,28310,560
11,011 10,986 11,000
11,684
6,000
7,000
8,000
9,000
10,000
11,000
12,000
13,000
2H/'18
35th
Period
1H/'19
36th
Period
2H/'19
37th
Period
1H/'20
38th
Period
2H/'20
39th
Period
1H/'21
40th
Period
(yen)
0
1-1 Financial Highlights (3/3)
NBF’s basic policy is to pursue growth in unitholder value through mid-to-long-term stable
growth of our DPU and increasing our NAV per unit.
Distributions per Unit (DPU) NAV per Unit
Two decades track record of stable distributions per unit and NAV per unit

6
2. Financial Results 【Definition of Term】
Fiscal period Terms Definitions Property Name
1H 2021 (40th Period) – Actual
(Properties at period end: 75)
Properties acquired 2H 2020 (39th Period): 3 properties acquired and 1 additional property1H 2021 (40th Period): 2 properties acquired and 1 additional property
Osaki Bright Tower (39th Period acquisition)Nagoya Mitsui Main Bldg. (39th Period acquisition)Nagoya Mitsui New Bldg. (39th Period acquisition)NBF Ogawamachi Bldg. (39th Period additional acquisition)Shinjuku Mitsui Building (40th Period acquisition)GranTokyo South Tower (40th Period acquisition)Ueno East Tower (40th Period additional acquisition)
Properties disposed of2H 2020 (39th Period): 1 property disposed1H 2021 (40th Period): 2 properties disposed
NBF Shinkawa Bldg.(East Building & Residential Tower) 50% (39st Period disposition)NBF Shinkawa Bldg.(East Building & Residential Tower) 50% (40th Period disposition)NBF Minami-Aoyama Bldg. (40th Period disposition)
Existing properties 70 properties owned as of June 30, 2021 (40th Period end) excluding above -
2H 2021 (41st Period) –Forecast
(Properties at period end: 73)
Properties acquired 1H 2021 (40th Period): 2 properties acquired and 1 additional property2H 2021 (41st Period): 1 property acquisition planned
Shinjuku Mitsui Bldg. (40th Period acquisition)GranTokyo South Tower (40th Period acquisition)Ueno East Tower (40th Period additional acquisition)IIDABASHI GRAND BLOOM(Acquisition planned in 41st Period)
Properties disposed of1H 2021 (40th Period): 2 properties disposed2H 2021 (41st Period): 3 properties dispositions planned
NBF Shinkawa Bldg.(East Building & Residential Tower) 50% (40th Period disposition)NBF Minami-Aoyama Bldg. (40th Period disposition)NBF Ochanomizu Bldg. (disposition planned in 41st Period)Nakano Nakanosakaue Sunbright Twin (disposition planned in 41st Period)NBF Unix Bldg. (disposition planned in 41st Period)
Existing properties 70 properties planned to be owned as of December 31, 2021 (41st Period end) excluding above
-
1H 2022 (42nd Period) –Forecast
(Properties at period end: 72)
Properties acquired 2H 2021 (41st Period): 1 property acquisition planned IIDABASHI GRAND BLOOM(Acquisition planned in 41st Period)
Properties disposed of2H 2021 (41st Period): 3 properties dispositions planned1H 2022 (42nd Period): 1 property disposition planned
NBF Ochanomizu Bldg.(disposition planned in 41st Period)Nakano Nakanosakaue Sunbright Twin (disposition planned in 41st Period)NBF Unix Bldg. (disposition planned in 41st Period)Sun Mullion NBF Tower (disposition planned in 42nd Period)
Existing properties 71 properties planned to be owned as of June 30, 2022 (42nd Period end) excluding above -

7
● Summary of PoP Change
【Reference】
(million yen)
2-1 1H/2021 (40th Period) Statement of Income(million yen)
NOI from property leasing activities 26,319 30,872 4,553 17.3%
Operating income(excl. profits and losses from dispositions)
17,323 21,291 3,968 22.9%
Net income(excl. profits and losses from dispositions)
15,884 19,940 4,055 25.5%
2H/2020 1H/2021 PoP Change
(39th Period) (40th Period) Amount Percentage
Total operating revenues 41,747 46,213 4,465 10.7%
Operating revenues 40,359 44,688 4,329 10.7%
Rental revenues 36,622 41,571 4,948 13.5%
Other revenues related to property leasing 3,736 3,117 -618 -16.6%
Profits from dispositions 1,388 1,524 136 9.8%
Total operating expenses 23,035 23,435 399 1.7%
Operating expenses 21,220 21,215 -5 -0.0%Rental expenses(excl. depreciation and amortization) 14,039 13,816 -223 -1.6%
Depreciation and amortization 7,181 7,399 218 3.0%
Loss from dispositions - 38 38 -
Asset management fees 1,543 1,779 236 15.3%
Selling, general and administrative expenses 271 401 130 48.0%
Operating Income 18,712 22,778 4,066 21.7%
Net non-operating income and expenses -1,438 -1,350 88 -6.1%
Non-operating income 2 7 4 -
Non-operating expenses 1,441 1,357 -83 -5.8%
Ordinary income 17,274 21,428 4,154 24.0%
Extraordinary income (loss) - - - -
Income before income taxes 17,274 21,428 4,154 24.0%
Income taxes 0 0 0 -
Net income 17,273 21,427 4,154 24.0%
Provision of reserve for advanced depreciation - 2,119 2,119 -
Provision of reversal for advanced depreciation 903 - -903 -
Payment of dividends 18,177 19,307 1,130 6.2%
Distribution per unit (JPY) 11,000 11,684 684 6.2%
Average Occupancy rate during the Period(%) 98.8 97.8 -1.0 -
Units issued and outstanding at period end 1,652,500 1,652,500 - -
Total operating revenues +4,465
Rental revenues +4,948
Properties replacement* +5,262
Existing properties -313
Other revenues related to property leasing
-618
Incidental income (seasonal factors, etc.) -165
Other income (termination fees, etc.) -501
Profits from dispositions +136
Operating income +4,066
Properties replacement* +4,123
Existing Properties +212
Profits and losses from dispositions +98
Asset management fees /Selling, general and administrative expenses
-366
Non-operating income and expenses +88
Non-operating expenses -83
Interest expense +145
Absence of new investment unit issuance costs incurred in the previous period
-238
*Including NBF Hatchobori Terrace

8
●Summary of PoP Change
2-2 1H/2021 (40th Period) Balance Sheet
December 31,2020(39th Period end)
June 30,2021(40th Period end)
PoP Change
Amount Percentage
Current assets 134,904 45,324 -89,580 -66.4%
Cash and cash equivalents 133,731 44,075 -89,655 -67.0%
Other current assets 1,172 1,248 75 6.4%
Fixed assets 1,062,324 1,259,846 197,522 18.6%
Tangible fixed assets 1,018,377 1,215,913 197,535 19.4%
Intangible fixed assets 35,806 35,786 -19 -0.1%
Investments and other assets 8,139 8,145 5 0.1%
Deferred assets 207 218 10 5.2%
Total assets 1,197,435 1,305,388 107,952 9.0%
Assets (million yen)
Liabilities and Net Assets
December 31,2020(39th Period end)
June 30,2021(40th Period end)
PoP Change
Amount Percentage
Current liabilities 60,106 40,577 -19,528 -32.5%
Short-term borrowings 10,000 - -10,000 -
Long-term borrowings due within one year
35,000 25,000 -10,000 -28.6%
Investment corporation bonds due within one year
- - - -
Other current liabilities 15,106 15,577 471 3.1%
Long-term liabilities 470,708 594,940 124,231 26.4%
Investment corporation bonds 52,000 57,000 5,000 9.6%
Long-term borrowings 362,500 468,500 106,000 29.2%
Security deposits received 56,208 69,440 13,231 23.5%
(Interest-bearing debt) (459,500) (550,500) (91,000) (19.8%)
Total liabilities 530,814 635,517 104,702 19.7%
Net assets 666,620 669,870 3,250 0.5%
Unitholders‘ capital 642,044 642,044 - -
Retained earnings 24,576 27,826 3,250 13.2%
Reserve for advanced depreciation 7,302 6,398 -903 -12.4%
Undistributed earnings 17,274 21,427 4,153 24.0%
Total net assets 666,620 669,870 3,250 0.5%
Total liabilities and net assets 1,197,435 1,305,388 107,952 9.0%
Total assets: +107,952
Current assets - 89,580
Cash and cash equivalents - 89,655
Fixed assets +197,522
3 property acquisitions in 40th Period
+233,422
2 property dispositionsin 40th Period
-35,759
Capital expenditures +6,777
Depreciation and amortization -7,399
Other +481
Total liabilities: +104,702
Interest-bearing borrowings +91,000
Short-term borrowings -10,000
Long-term borrowings +96,000
Investment corporation bonds +5,000
Total net assets: +3,250
Retained earnings +3,250
Provision of reserve for advanced depreciation
-903
Undistributed earnings +4,153
(million yen)

9
《MEMO》

10
3. Operating Results & Outlook
11
NBF’s Operating Policies
Leverage our outstanding portfolio and the strengths of our sponsor to adapt flexibly to market changes.
Internal Growth/Office Leasing Market
Current Office Leasing Market
• Vacancy rate and average rent reflect economic stagnation
• Companies are exploring new work styles given mandatory teleworking etc.
• Normalization of leasing market is delayed due to the state of emergency
Future Office Leasing Market
• Employees returning to offices after vaccination
• Economic rebound expected after state of emergency rescinded
• Adapting to changes in corporate office use post COVID-19
• Tenant requirements for high-grade office space in central Tokyo remains unchanged
Current Office Trading Market
• Interest rates and transaction yields remain low
• Strong demand from overseas investors and private placement funds
• Property disposals due to corporate restructuring
Future Office Trading Market
• Transaction yields will remain low due to the ongoing low interest rate environment and strong demand centered on by overseas investors
• The market is heating up due to the strong demand from buyers and an increase in sales of head office buildings as corporate restructuring and work style reform progress.
External Growth/Office Trading Market
3-1
(200)
(100)
0
100
200
300
400
2016 2017 2018 2019 2020 2021 2022
Disposition price(¥229.2 billion)
Acquisition price(¥513.4 billion)
NBF’s Occupancy Rate Outlook
• We expect the occupancy rate to take longer to recover than previously assumed due to factors including the extended states of emergency.
• Occupancy rate should bottom in December 2021 (41st Period) as we leverage strengths such as our excellent portfolio and Mitsui Fudosan’s marketing capabilities.
NBF’s External Growth Strategy
[NBF’s Projected Occupancy Rate]
Pivot to external growth to drive distribution growth
• Improve portfolio performance and drive distribution growth with aggressive external growth
• Book unrealized gains, improve NAV, provide returns to unitholders and increase internal reserves
[Actual & Planned Acquisitions & Dispositions (2016-2022)]
(billion yen)
38thPeriod
39thPeriod
40thPeriod
41stPeriod
42ndPeriod
Move forward with portfolio replacement strategy
*We expect replacement since 2016 to total over ¥700 billion (forecast)
99.4%
98.8%
97.8%
96.7%
97.5%
95%
96%
97%
98%
99%
100%
1H/'20 2H/'20 1H/'21 2H/'21 1H/'22

12
*Improved CO2 emission intensity
Replacement Strategy Outcomes
NBF Ochanomizu Bldg.
NBF Unix Bldg.
NBF Minami-Aoyama Bldg.
Sun MullionNBF Tower
Nakanosakaue Sunbright Twin
Ueno East Tower(acquired additional 40%)
IIDABASHI GRAND BLOOM
Property acquisitions(Total: ¥91.0 billion)
Property disposals(Total: ¥107.0 billion)
Improved Capital Efficiency
+ ¥16.0 billion
Higher NOI
+ ¥316 million
Improved NAV
+ ¥22,059/unit
Improved Environmental Performance*
Book Unrealized Gains (Unitholder Returns)
Profit on Dispositions: 40th Period
5,000
7,000
9,000
11,000
13,000
1H/'2140th Period
2H/'2141st Period
1H/'2242nd Period
Profit on Dispositions: 41st Period
Profit on Dispositions: 42nd Period
¥1.4 billion ¥2.6 billion ¥7.0 billion
⇩
Retained profits: ¥2.0 billion
0
⇩Retained profits: ¥2.2 billion
Allocated for distributions¥0.6 billion¥420/unit
Allocated for distributions¥4.7 billion¥2,877/unit
(yen)
● Distributions
Lower Portfolio Age
23 7
Property dispositions
Property acquisitions
Improved NOI Yield
3.0% 3.6%
74Kg-CO2/㎡
47Kg-CO2/㎡
¥11,500
¥12,500
3-1
Property dispositions
Property acquisitions
Property dispositions
Property acquisitions
years years
(forecast) (forecast)
NBF’s Replacement Strategy (Announced after March 2021)(1/3)
¥11,684

13
Property Age 23 years
Total acquisition price ¥107.0 billion
Total appraisal value ¥76.3 billion
Unrealized loss -¥20.5 billion
NOI ¥2,950 million
NOI yield 3.0%
CO₂ emission intensity 74kg-CO₂/㎡
Capital recovery of ¥16.0 billion
Improved capital efficiency
Improvedeffective NOI and
NOI yield
Lowered portfolio age
NAV improved to ¥22,059/unit
Ueno East TowerIIDABASHI GRAND
BLOOMNBF Ochanomizu
Bldg.NBF Unix Bldg.
NBF Minami-Aoyama Bldg.
Sun MullionNBF Tower
Property Acquisitions: ¥91.0 Billion (Total) Property Disposals: ¥107.0 Billion (Total)
Improved portfolio performance with replacements totaling ¥198 billion (total acquisitions and dispositions)
3-1
Nakanosakaue Sunbright Twin
5 Property Dispositions2 Property Acquisitions
Property Age 7 years
Total acquisition price ¥91.0 billion
Total appraisal value ¥99.2 billion
Unrealized gain ¥8.2 billion
NOI ¥3,266 million
NOI yield 3.6%
CO₂ emission intensity 47kg-CO₂/㎡
Improved environmental performance
NBF’s Replacement Strategy (Announced after March 2021)(2/3)

14
(million yen)
Transaction price Appraisal value Unrealized gains NOI NOI yield Property AgeCO₂ emission
intensity
Total property acquisitions 91,000 99,200 8,200 3,266 3.6% 7 years 47kg CO2/㎡
Total property dispositions 107,000 76,340 -20,540 2,950 3.0% 23 years 74kg CO2/㎡
Difference +16,000 - +28,740 +316 - - -
① Recovered capital and improved capital efficiency: Capital recovery of ¥16.0 billion
② Improved NAV (incl. increase in unrealized gains): NAV increase of ¥22,059/unit
③ Improved NOI and NOI yield: Increase of ¥316 million in NOI
④ Lowered portfolio age: Acquired newer and disposed of older properties
⑤ Improved environmental performance: Lowered CO2 emission intensity
Effects of Portfolio Replacement
① ③② ④
NAV Improvement(breakdown of +¥22,059/unit)(yen)
3-1
⑤
2H/’2039th period
Increase in unrealized gains
on portfolio
Increase in retained profits
1H/’2140th period
Increase in unrealized gains
on portfolio
Increase in retained profits
After portfolio replacement
NBF’s Replacement Strategy (Announced after March 2021)(3/3)
15
3-2 External Growth: Property Acquisition (1/2)
IIDABASHI GRAND BLOOM
High-grade mixed-use commercial and office building
Location Fujimi, Chiyoda-ku, Tokyo
Planned acquisition date September 30, 2021
Planned acquisition price ¥77.6 billion
Appraisal value(As of June 30, 2021)
¥84.9 billion
Completion April 2014
Seller Mitsui Fudosan Co., Ltd.
Total floor space Approx. 36,989 tsubo(12,280.29㎡)
Interest acquiredOffice Approx. 38%
Commercial space Approx.84%
NOI yield(Appraisal NOI/acquisition price)
3.5%
Property Features
WORKSTYLING Iidabashi
• On the 2nd floor of IIDABASHI
GRAND BLOOM (Office lobby floor)
• Adapting to diverse office needs of
local residential areas
Rare mixed-use redevelopment property including commercial facilities• A large-scale office building with 30 floors above ground, standard floor area of
approximately 805 tsubo(2,659.66㎡), ceiling height of 2,800mm, and 100mm
OA floors.
• Highly competitive property with BCP measures such as a 72-hour emergency
generator and a fully stocked emergency warehouse of approximately 100㎡
• Iidabashi Sakura Terrace, commercial area in the low part of the property, with
mainly restaurants that meets the needs of the workers and local residents
Developed for environmental responsibility• LED lighting and solar panels in the lower part installed
• Good environmental performance (CO2 emission intensity of 48kg-CO2/㎡)
Good access to major areas of Tokyo• 1-minute walk from JR Iidabashi station, 5 lines available including Tokyo Metro
and Toei Oedo subway, good access to major areas in central Tokyo
Location
Specifications
Environmental Responsibility
16
External Growth: Property Acquisitions & Dispositions (2/2)
Shinjuku Mitsui Bldg.
LocationNishi Shinjuku,
Shinjuku-ku, Tokyo
Acquisition date January 8, 2021
Acquisition price ¥170.0 billion
Appraisal value(As of August 31, 2020)
¥173.0 billion
Completion September 1974
Seller Mitsui Fudosan Co., Ltd.
NOI yield(Appraisal NOI/acquisition price)
4.2%
3-2
Location Shinkawa, Chuo-ku, Tokyo
Disposition date Dec. 25, 2020 March 31, 2021
Disposition price ¥5.95 billion ¥5.95 billion
Gain on disposition ¥1.38 billion ¥1.52 billion
Appraisal value(As of June 30, 2020)
¥10.16 billionLocationMarunouchi,
Chiyoda-ku, Tokyo
Acquisition date January 8, 2021
Acquisition price ¥47.0 billion
Appraisal value(As of August 31, 2020)
¥48.5 billion
Completion October 2007
Seller Mitsui Fudosan Co., Ltd.
NOI yield(Appraisal NOI/acquisition
price)3.0%
LocationMinami Aoyama,Minato-ku, Tokyo
Disposition date March 25, 2021
Disposition price ¥31.6 billion
Loss on disposition -¥30 million
Appraisal value(As of December 31, 2020)
¥20.3 billion
Location Ueno, Taito-ku, Tokyo
Acquisition date March 29, 2021
Acquisition price ¥13.4 billion
Appraisal value(As of January 31, 2021)
¥14.3 billion
Completion December 2015
Seller Shimizu Corporation
NOI yield(Appraisal NOI/acquisition price)
4.2%
GranTokyo South Tower
Ueno East Tower (acquired additional 40%)
NBF Shinkawa Bldg.(East Bldg. & Residential Tower)
■ 1H 2021(40th Period)Property Acquisitions
■ 1H 2021 (40th Period)Property Dispositions
NBF Minami-Aoyama Bldg.
17
Property Acquisitions
3-2 External Growth(Detailed Data)
Property Dispositions
Property Acquisitions• Property age is a weighted average based on acquisition price (as of
June 30, 2021)• Unrealized gain or loss: appraisal value - acquisition price• NOI
Ueno East Tower: Equivalent to 40% of the 39th Period (2H 2020) results + 40th Period (1H 2021) resultsAppraisal NOI used for IIDABASHI GRAND BLOOM
• NOI yield: NOI / acquisition price• CO2 emission intensity is the actual data for 2020, and the total is a
weighted average.IIDABASHI GRAND BLOOM is based on the data received from the seller
Property Dispositions• Property age is a weighted average based on initial acquisition price
(as of June 30, 2021)• Unrealized gain or loss: appraisal value - book value• NOI
39th Period (2H 2020) results + 40th Period (1H 2021) results* NBF Minami-Aoyama Building NOI is annualized as 39th Period
(2H 2020) results x 2 • NOI yield: NOI / book value (as of June 30, 2021)• CO2 emission intensity is actual value data for 2020, and the total is
a weighted average value.
NBF Minami-Aoyama Bldg.
NBF Ochanomizu Bldg.
Nakanosakaue Sunbright Twin
NBF Unix Bldg.Sun MullionNBF Tower
Total
Location Minato-ku, Tokyo Chiyoda-ku, Tokyo Nakano-ku, TokyoFukushima, Fukushima
PrefectureOsaka, Osaka Prefecture -
Disposition date March 2021 August 2021 September 2021 September 2021 January 2022 -
Property age 26 years 12 years 25 years 27 years 25 years 23 years
Disposition price ¥31.6 billion ¥16.1 billion ¥40.0 billion ¥4.9 billion ¥14.4 billion ¥107.0 billion
Book value¥31.5 billion
(As of Dec. 31, 2020)¥19.3 billion
(As of June 30, 2021)¥35.9 billion
(As of June 30, 2021)¥2.7 billion
(As of June 30, 2021)¥7.4 billion
(As of June 30, 2021)¥96.8 billion
Appraisal value¥20.3 billion
(As of Dec. 31, 2020)¥14.3 billion
(As of June 30, 2021)¥31.5 billion
(As of June 30, 2021)¥3.3 billion
(As of June 30, 2021)¥6.8 billion
(As of June 30, 2021)¥76.3 billion
Unrealized gain or loss -¥11.1 billion -¥5.0 billion -¥4.4 billion ¥0.6 billion -¥0.5 billion -¥20.5 billion
NOI ¥532 million ¥451 million ¥1,206 million ¥310 million ¥449 million ¥2,950 million
NOI yield 1.7% 2.3% 3.4% 11.5% 6.0% 3.0%
CO₂ emission intensity 63kg-CO₂/㎡ 80kg-CO₂/㎡ 93kg-CO₂/㎡ 53kg-CO₂/㎡ 54kg-CO₂/㎡ 74kg-CO₂/㎡
Ueno East Tower(acquired additional 40%)
IIDABASHIGRAND BLOOM
Total
Location Taito-ku, Tokyo Chiyoda-ku, Tokyo -
Acquisition date March 2021 September 2021 -
Property age 6 years 7 years 7 years
Acquisition price ¥13.4 billion ¥77.6 billion ¥91.0 billion
Appraisal value¥14.3 billion
(As of Jan. 31, 2021)¥84.9 billion
(As of June 30, 2021)¥99.2 billion
Unrealized gain or loss ¥0.9 billion ¥7.3 billion ¥8.2 billion
NOI ¥566 million ¥2,700 million ¥3,266 million
NOI yield 4.2% 3.5% 3.6%
CO₂ emission intensity 43kg-CO²/㎡ 48kg-CO²/㎡ 47kg-CO²/㎡

18
3-3 Changes in Retained Profits
Policy for Using Gain on Transfer and Retained Profits Previously: Used when large tenants moved out, the event of a disaster, selling properties with unrealized losses, PO during the period, etc.Future: In addition to the above, NBF will use a portion of gains on disposition to partially fund stable distributions.
●Retained Profits
0
3,000
6,000
9,000
12,000
15,000
2H/'1529th
Period
1H/'1936th
Period
2H/'1937th
Period
1H/'2038th
Period
2H/'2039th
Period
1H/'2140th
Period
2H/'2141st
Period
1H/'2242ndPeriod
Prior period balance Retained profits
478
(million yen)
Reversal: 370
Reversal: 903
2,119
2,000
2,269
41st PeriodGain (loss) on
disposition
Nakanosakaue Sunbright Twin ¥3.9 billion
NBF Ochanomizu Bldg. (-¥3.2 billion)
NBF Unix Bldg. ¥2.0 billion
Total gain (loss) on transfer ¥2.6 billion
Retained profits ¥2.0 billion
Distribution ¥0.6 billion
40th PeriodGain (loss) on
disposition
NBF Shinkawa Bldg. ¥1.5 billion
NBF Minami-Aoyama Bldg. (¥30 million)
Total gain (loss) on transfer ¥1.4 billion
Retained profits ¥2.1 billion
42nd PeriodGain (loss) on
disposition
Sun Mullion NBF Tower ¥7.0 billion
Retained profits ¥2.2 billion
Distribution ¥4.7 billion
Retained Profits (Forecast): ¥12,788 million
(Forecast) (Forecast)

19
-2.0-2.5
-0.9-1.6 -1.4
-2.5-1.6
-2.8-3.4 -3.7
-4.2
2.3 2.41.5 1.7
1.3
2.51.7
0.7
2.4
3.6
4.9
98.7 98.899.3 99.5 99.5 99.4 99.4
98.897.8
96.7
97.5
80.0
90.0
100.0
-10.0
-5.0
0.0
5.0
10.0
15.0
1H/'1732nd
Period
2H/'1733rd
Period
1H/'1834th
Period
2H/'1835th
Period
1H/'1936th
Period
2H/'1937th
Period
1H/'2038th
Period
2H/'2039th
Period
1H/'2140th
Period
2H/'2141st
Period
1H/'2242nd
Period
(%)(%)
Move out rate Move in rate
Large tenant move outs 期中平均稼働率
Occupancy rate in the 97%-98%
range
Note 1: The percentage of floor space of tenants moving out divided by average of total rentable area at the end of each month (excluding serviced apartments and housing)Note 2: The percentage of floor space of tenants moving in divided by average of total rentable area at the end of each month (excluding serviced apartments and housing)Note 3: Average occupancy rate during the period–weighted average of month-end occupancy rate on a floor space basis
Internal Growth(1/2)
●Average occupancy rate during the period, and the percentage of floor space of tenants moving in and out
(Actual)
3-4
Note 3
Note 2Note 1
(Forecast) (Forecast)
*Average occupancy rate and percentage of floor space of tenants moving in and out during 2H 2021 (41st Period) and 1H 2021 (42nd Period) are current forecast figures. Actual data may vary due to changes in the situation.
*
*
Assumptions about the rate of moving in and out are conservative,
occupancy rate will bottom in 2H 2021
Avg. occupancy rate during period
20
-4.0
-3.0
-2.0
-1.0
0.0
1.0
2.0
3.0
4.0
1H/'17
32nd
Period
2H/'17
33rd
Period
1H/'18
34th
Period
2H/'18
35th
Period
1H/'19
36th
Period
2H/'19
37th
Period
1H/'20
38th
Period
2H/'20
39th
Period
1H/'21
40th
Period
2H/'21
41st
Period
1H/'22
42nd
Period
3-5 Internal Growth(2/2)
(%)
● Breakdown of PoP Change in Rental Revenues from Existing Properties (rent revisions and replacement, etc.)
(Forecast) (Forecast)(Actual)
Rent revision Replacement, etc.
Rent revision + Replacement, etc. Large tenant move out
Decrease in rental revenues due to large tenant move outs will bottom in 1H 2022
Bottom in 1H 2022
21
3-6 Internal Growth: Strategic Investments to Add Value (NBF Shibuya East)
Strategically add value with a focus on high-potential properties to consistently provide choice office space
NBF Shibuya East
Location
Floor area
Structure
Completion
Nearby stations
Shibuya 3-Chome, Shibuya-ku, Tokyo
7,615.76m2 (Approx. 2,304 tsubo)
B2/8F
1992.1 (29 years)
Shibuya Station 7-minute walk
Strengths Issues
• Conveniently located within a 10-minute walk from JR Shibuya Station
• Calm environs with greenery that is rare in the Shibuya area
• Ongoing renovation of appearance and facilities
• Universal design initiatives
• Building management that leverages strengths
Designate as a strategic investment property
Compare strengths and issues with nearby competing propertiesVerify investment effectiveness and payback period
■ Universal design and entrance renovation with natural elements
■ Common area renovation with greenery
■ Effective use of surplus space to create relaxing spaces
Workspace on the rooftopMultipurpose rooftop space
Elevator hall Spaces designed with plants
Sloped approach to entrance Renovated entrance
22
0.58%
0.86%
1.01%0.19% 0.25% 0.24% 0.40%
0.34%
0.36%
0.41%
0.45%
0.53%
0.65%0.65%
0.65%
0.70% 0.91% 0.89% 1.00%
0
10
20
30
40
50
60
2021 2022 2023 2024 2025 2026 2027 2028 2029 2030 2031 2032 2033 2034 2035 2036 2037 2038 2046
●Financial Data
• Borrowing capacity is approx. ¥92 billion with LTV at 46.0%
3-7 Finance (1/2)
●Debt Maturity Diversification
(As of June 30, 2021)(billion yen)
Long-term borrowings
Investment corporation bonds
Funding procured in 1H 2021 (40th Period)
●New Funding and Repayment
Repayment Overview
Repayment total 27,000 million yen
Averageinterest rate
0.85%
Average maturity 7.9 years
New Funding Overview
Total Funding
128,000 million yen
Average interest rate
0.40%
Average maturity
9.0 years
1H/2021 (40th Period) Long-Term Borrowings & Investment Corporation Bonds
Diversified maturities, stabilized funding, lowered cost of funding
2H/2020(39th Period)
1H/2021(40th Period)
PoPChange
LTV 38.4% *42.2% +3.8pt
Long-Term Fixed-Rate Debt Ratio
91.7% 95.1% +3.4pt
Average Interest Rate 0.50% 0.47% -0.03pt
Average Maturity(Long-Term Interest-
Bearing Debt)5.35 years 6.08 years
+0.73years
23
3-7 Finance (2/2)
• Long-term borrowings
• Investment corporation bonds (green bonds)
Financing Date Lender Amount Term
(Years)Fixed/
FloatingInterest
Rate
2021/1/7
Sumitomo Mitsui Banking 10,000
7.0
Fixed
0.320%
MUFG Bank 5,000Norinchukin Bank 5,000Hachijuni Bank 1,000Gunma Bank 1,000
Mitsui Sumitomo Insurance 1,000Sumitomo Mitsui Trust Bank 10,000
9.0 0.400%MUFG Bank 5,000
Bank of Fukuoka 2,000Daishi Hokuetsu Bank 2,000
Mizuho Bank 5,000 9.5 0.425%Sumitomo Mitsui Banking 20,000
10.00.450%
Mizuho Bank 10,000MUFG Bank 5,000
Shinkin Central Bank 5,000Development Bank of Japan 3,000
Shinsei Bank 1,000 10.1Sumitomo Life Insurance 5,000
11.0 0.500%Yamaguchi Bank 1,000
Sumitomo Life Insurance 5,000 15.0 0.700%
2021/2/26 MUFG Bank4,000 5.0 0.180%6,000 10.0 0.450%
2021/3/30 Taiju Life Insurance 2,000 10.8 0.491%*2021/4/30 Iyo Bank 1,000 7.0 0.320%2021/5/28 Chugoku Bank 2,000 7.0 0.320%
2021/6/30
Sumitomo Mitsui Banking 1,000 8.0 0.350%
MUFG Bank2,000 7.6 0.335%3,000 9.0 0.400%
Total - 123,000 9.2 - 0.414%
Date Issue AmountTerm
(Years)
Fixed or
Variable
Interest
rate
2021/3/22 No. 20 unsecured bonds 5,000 5.0 Fixed 0.150%
Long-term debt + investment corporation bonds
128,000 9.0 - 0.404%
2H/2021 1H/2021 PoPChange(39th Period end) (40th Period end)
Short-Term Borrowings 10,000 0 -10,000
Long-Term Borrowings(floating-rate)
28,000 27,000 -1,000
Long-Term Borrowings(fixed-rate)
369,500 466,500 +97,000
Investment Corporation Bonds
52,000 57,000 +5,000
Total 459,500 550,500 +91,000
(As of June 30, 2021)
Reference: Funds procured in 2H 2021(41st Period)
Date Lender AmountTerm
(Years)
Fixed or
Variable
Interrest
rate
2021/7/9 Taiyo Life Insurance1,500 8.0
Fixed
0.350%
1,500 11.0 0.500%
2021/7/16 Sumitomo Life Insurance 5,000 15.0 0.700%
(Million yen)
(Million yen)
●Credit Ratings
●Interest-Bearing Debt● Long-Term Interest-Bearing Debt Procured in 1H/2021 (40th Period)
Credit Rating Agency
Credit Ratings Remarks
JCR Long-Term Issuer Rating: AA+ Outlook: Stable
R&I Issuer Rating: AA Outlook: Stable
S&PLong-Term Corporate Rating: A+Short-Term Corporate Rating: A-1
Outlook: Stable
(Million yen)
(Million yen)
(*Rounded down to the 3rd decimal place)

24
3-8 Appraisal Value
2H/2020(39th Period end)
1H/2021(40thPeriod end)
PoPChange
Number of properties 74 properties 75 properties +1 property
Appraisal value 1,338.1 billion yen 1,548.7 billion yen +210.6 billion yen
Book value 1,054.1 billion yen 1,251.4 billion yen +197.2 billion yen
Unrealized gain 283.9 billion yen 297.3 billion yen +13.4 billion yen
2H/2020(39th Period end)
1H/2021(40thPeriod end)
Down 0 11
Same 71 59
Up 0 3
2H/2020(39th Period end)
1H/2021(40thPeriod end)
Down 17 23
Same 45 36
Up 9 14
Direct Return Cap Rate
●Appraisal Value
●Changes by Properties (PoP)
(Properties) Appraisal Value (Properties)
●Appraisal Value & Book Value
600
800
1,000
1,200
1,400
1,600
2H/'18
35th
Period
1H/'19
36th
Period
2H/'19
37th
Period
1H/'20
38th
Period
2H/'20
39th
Period
1H/'21
40th
Period
Book value Appraisal value
(billion yen)

25
《MEMO》

26
4. Forecast

27
41st period 42nd period
Total operating revenues +4,182 +381
Rental revenues -864 -1,048
Properties Replacement* +244 -134
Existing Properties -1,107 -913
Other revenues related to property leasing
+601 +374
Incidental income (seasonal factors, etc.) +589 -346
Other income(termination fee etc) -70 +742
Profits from dispositions +4,445 +1,054
Operating income -403 +1,902
Properties Replacement* -66 +434
Existing Properties -1,598 -2,887
Profits and Losses from dispositions +1,209 +4,328
Asset management fees / Selling, general and
administrative expenses+51 +26
Non-operating income and expenses -21 +20
Non-operating expenses +16 -20
Interest expense +13 -20
4-1 1H/2021 (41st Period), 2H/2022 (42nd Period) Forecasts
NOI from property leasing activities 30,872 29,264 -1,608 -5.2% 26,858 -2,406 -8.2%
Operating income(excluding profits and losses from dispositions) 21,291 19,679 -1,612 -7.6% 17,252 -2,427 -12.3%
Net income(excluding profits and losses from dispositions) 19,940 18,308 -1,633 -8.2% 15,901 -2,407 -13.1%
科 目
1H/2021 2H/2021PoP Change
1H/2022PoP Change
(Actual) (Forecast) (Forecast)
(40th Period) (41st Period) Amount Percentage (42nd Period) Amount Percentage
Total operating revenues 46,213 50,396 4,182 9.1% 50,777 381 0.8%
Operating revenues 44,688 44,425 -263 -0.6% 43,751 -673 -1.5%
Rental revenues 41,571 40,706 -864 -2.1% 39,658 -1,048 -2.6%
Other revenues related to property leasing 3,117 3,719 601 19.3% 4,093 374 10.1%
Profits from dispositions 1,524 5,970 4,445 - 7,025 1,054 17.7%
Total operating expenses 23,435 28,020 4,485 19.6% 26,499 -1,521 -5.4%
Operating expenses 21,215 22,616 1,401 6.6% 24,396 1,779 7.9%
Rental expenses(excl. depreciation and amortization) 13,816 15,161 1,345 9.7% 16,893 1,732 11.4%
Depreciation and amortization 7,399 7,455 56 0.8% 7,503 47 0.6%
Losses from dispositions 38 3,274 3,236 - - -3,274 -
Asset management fees 1,779 1,760 -19 -1.1% 1,802 42 2.4%
Selling, general and administrative expenses 401 368 -32 -8.2% 299 -68 -18.7%
Operating income 22,778 22,375 -403 -1.8% 24,277 1,902 8.5%
Net non-operating income and expenses -1,350 -1,371 -21 1.6% -1,351 20 -1.5%
Non-operating income 7 2 -4 - 2 - -
Non-operating expenses 1,357 1,374 16 1.2% 1,354 -20 -1.5%
Ordinary income 21,428 21,003 -424 -2.0% 22,926 1,922 9.2%
Extraordinary income (loss) - - - - - - -
Income before income taxes 21,428 21,003 -424 -2.0% 22,926 1,922 9.2%
Income taxes 0 0 0 - 0 0 -
Net income 21,427 21,003 -423 -2.0% 22,926 1,922 9.2%
Provision of reserve for advanced depreciation 2,119 2,000 -119 -5.6% 2,269 269 13.5%
Payment of dividends 19,307 19,003 -304 -1.6% 20,656 1,652 8.7%
Distribution per unit (JPY) 11,684 11,500 -184 -1.6% 12,500 1,000 8.7%
Average occupancy rate during the Period(%)
97.8 96.7 -1.1 - 97.5 0.8 -
Units issued and outstanding at period end 1,652,500 1,652,500 - - 1,652,500 - -
(million yen)
●Summary of PoP Change
【Reference】
Forecasts for the periods ending December 31, 2021 (41st Period) and June 30, 2022
(42nd Period) are calculated using current assumptions. Actual results may vary if
conditions change. In addition, distributions are not guaranteed.
(million yen)
*Including NBF Hatchobori Terrace

28
(Reference) Performance Forecast
DPU
1H/’22 42ndPeriod
2H/’21 41st
Period
(yen)
1H/’2140th
Period
Target stable growth in DPU by deploying gains on transfers to supplement internal growth.
Gain on disposition– retained profits
Internal growth
Internal growth
External growth External
growth
Other
Other
0
Property tax(on properties acquired in 2021
and change in tax standard)
Gain on disposition– retained profits
29
《MEMO》

30
5. Market Data
31
●Market Rents for Office Buildings in Tokyo Business Districts* (Average Asking Rent & Average Vacancy Rate)
Source: Compiled by asset management company using data from Miki Shoji Co., Ltd.
5-1 Trends in the Office Building Leasing Market (1/2)
0.00
1.00
2.00
3.00
4.00
5.00
6.00
7.00
8.00
9.00
10.00
'02.1 '03.1 '04.1 '05.1 '06.1 '07.1 '08.1 '09.1 '10.1 '11.1 '12.1 '13.1 '14.1 '15.1 '16.1 '17.1 '18.1 '19.1 '20.1 '21.1
10,000
15,000
20,000
25,000
Average asking rent (left scale)
Average vacancy rate (right scale)
*Chiyoda-ku, Chuo-ku, Minato-ku, Shinjuku-ku, and Shibuya-ku
(Yen/tsubo) (%)
(‘03.6.8) (‘08.8) (‘12.6)8.57% 9.43%22,901yen
(‘04.10)
17,526yen
(‘13.12)
16,207yen
(‘07.11)2.49%
(’21.7)
6.28 %
(’21.7)
21,045 yen
Vacancy rate in Tokyo business district in July 2021 was 6.28%, asking rents was ¥21,045
'21.7
(‘20.7)
23,014yen
(‘20.2)1.49%
32
(Forecast)
72
91
125
216
121
77
154
119
65
86 85
117
175
58
87
10997
69
141
85
179
6149
145
93
120
0
50
100
150
200
250
300
'00 '01 '02 '03 '04 '05 '06 '07 '08 '09 '10 '11 '12 '13 '14 '15 '16 '17 '18 '19 '20 '21 '22 '23 '24 '25
●New Supply of Large-Scale Office Buildings* in the 23 Wards of Tokyo
*Large-scale office buildings have at least 10,000 ㎡ of gross office space.
Historical average (1986-2020)1.05 million m2/year
(gross floor space basis)
5-1 Trends in the Office Building Leasing Market (2/2)
(10 thousand m2)Source: Compiled by asset management company using data from Mori Building Co., Ltd. as of May 27, 2021
Average of 0.94 million m2/year(gross floor space basis)
from 2021 onward

33
●Benchmark YieldsNote 1 for Office Buildings in Prime AreasNote 2
Source: Compiled by asset management company from data published by Japan Real Estate Institute
●Real Estate Trading Value (Office Buildings)
Source: Compiled by asset management company from data published by Japan Real Estate Institute
Note 1:Benchmark yield (net cash flow basis): Yield by application and region based on capitalization rates assessed by Japan Real Estate Institute.Note 2:Office buildings in prime areas: Properties in Marunouchi, Otemachi in Chiyoda-ku that are at least five years old with 20,000 tsubo or more and have standard floor space of 500 tsubo or more.
0
500
1,000
1,500
2,000
2,500
2001 2002 2003 2004 2005 2006 2007 2008 2009 2010 2011 2012 2013 2014 2015 2016 2017 2018 2019 2020 2021
First half Second half
5-2 Trends in the Real Estate Trading Market
3.5 3.5 3.5 3.4 3.4 3.4 3.4 3.4 3.3 3.23.0 2.9 2.8 2.8 2.7 2.6 2.6 2.5 2.4 2.3 2.2 2.2 2.2 2.2
2.0 %
3.0 %
4.0 %
(Billion yen)
34
0
1,000
2,000
3,000
4,000
0
300,000
600,000
900,000
1,200,000
'01.9 '02.9 '03.9 '04.9 '05.9 '06.9 '07.9 '08.9 '09.9 '10.9 '11.9 '12.9 '13.9 '14.9 '15.9 '16.9 '17.9 '18.9 '19.9 '20.9
NBF unit price (left scale) TSE REIT Index (right scale)
●NBF Unit Price & TSE REIT Index
●10-Year Japanese Government Bond Yields
'01.9 '02.9 '03.9 '04.9 '05.9 '06.9 '07.9 '08.9 '09.9 '10.9 '11.9 '12.9 '13.9 '14.9 '15.9 '16.9 '17.9 '18.9 '19.9 '20.9
-1.00%
0.00%
1.00%
2.00%
3.00%
(yen)(pt)
5-3 NBF Unit Price, TSE REIT Index & 10-Year Japanese Government Bond Yields
'21.6
'21.6

35
6. NBF’s Competitive Advantages
6-1 J-REIT with the Longest Track Record6-2 The Largest J-REIT in Size6-3 A Portfolio Focused on Tokyo6-4 Collaboration with Sponsor (Mitsui Fudosan Group)
・Pipeline・Leasing・Property Management
6-5 Stable Financial Management
36
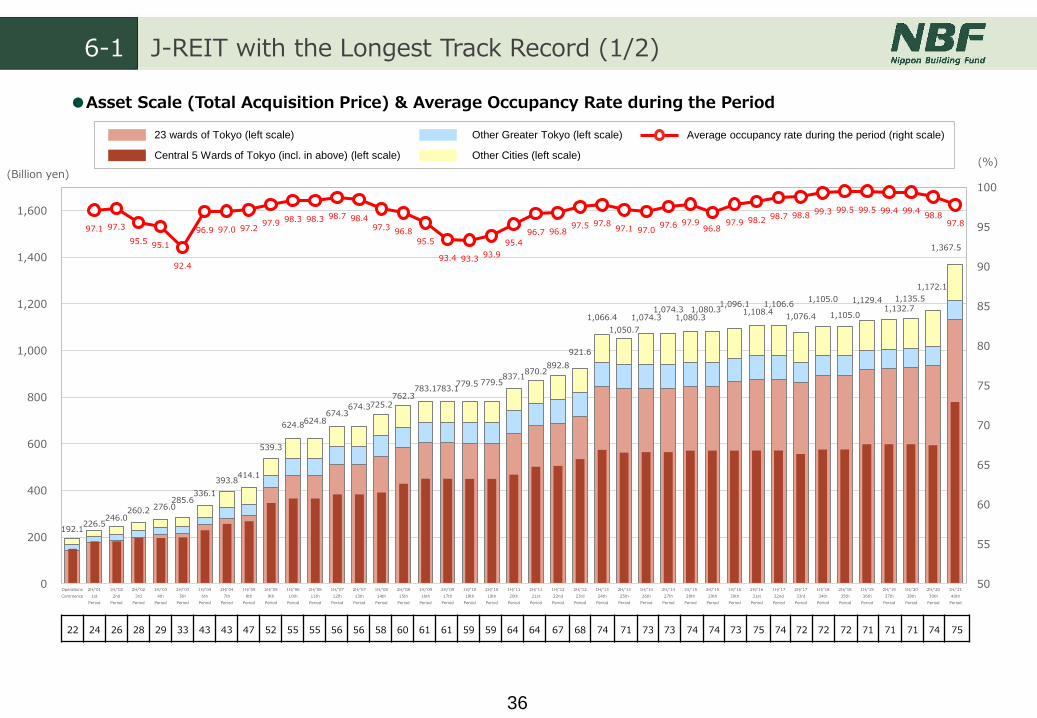
192.1226.5
246.0260.2 276.0
285.6336.1
393.8414.1
539.3
624.8624.8674.3
674.3725.2762.3
783.1783.1779.5 779.5
837.1870.2
892.8
921.6
1,066.4
1,050.7
1,074.31,074.3
1,080.31,080.3
1,096.11,108.4
1,106.6
1,076.4
1,105.0
1,105.0
1,129.41,132.7
1,135.5
1,172.1
1,367.5
97.1 97.3
95.5 95.1
92.4
96.9 97.0 97.2 97.9 98.3 98.3 98.7 98.4
97.3 96.8
95.5
93.4 93.3 93.9
95.4
96.7 96.8 97.5 97.8
97.1 97.0 97.6 97.9
96.8 97.9 98.2 98.7 98.8 99.3 99.5 99.5 99.4 99.4
98.8 97.8
50
55
60
65
70
75
80
85
90
95
100
0
200
400
600
800
1,000
1,200
1,400
1,600
Operations
Commence
2H/'01
1st
Period
1H/'02
2nd
Period
2H/'02
3rd
Period
1H/'03
4th
Period
2H/'03
5th
Period
1H/'04
6th
Period
2H/'04
7th
Period
1H/'05
8th
Period
2H/'05
9th
Period
1H/'06
10th
Period
2H/'06
11th
Period
1H/'07
12th
Period
2H/'07
13th
Period
1H/'08
14th
Period
2H/'08
15th
Period
1H/'09
16th
Period
2H/'09
17th
Period
1H/'10
18th
Period
2H/'10
19th
Period
1H/'11
20th
Period
2H/'11
21st
Period
1H/'12
22nd
Period
2H/'12
23rd
Period
1H/'13
24th
Period
2H/'13
25th
Period
1H/'14
26th
Period
2H/'14
27th
Period
1H/'15
28th
Period
2H/'15
29th
Period
1H/'16
30th
Period
2H/'16
31st
Period
1H/'17
32nd
Period
2H/'17
33rd
Period
1H/'18
34th
Period
2H/'18
35th
Period
1H/'19
36th
Period
2H/'19
37th
Period
1H/'20
38th
Period
2H/'20
39th
Period
1H/'21
40th
Period
22 24 26 28 29 33 43 43 47 52 55 55 56 56 58 60 61 61 59 59 64 64 67 68 74 71 73 73 74 74 73 75 74 72 72 72 71 71 71 74 75
6-1 J-REIT with the Longest Track Record (1/2)
●Asset Scale (Total Acquisition Price) & Average Occupancy Rate during the Period
(%)Other Cities (left scale)
Other Greater Tokyo (left scale)23 wards of Tokyo (left scale) Average occupancy rate during the period (right scale)
Central 5 Wards of Tokyo (incl. in above) (left scale)
(Billion yen)

37
274,984 255,090
581,646
389,663
573,646
0
200,000
400,000
600,000
2H/'01
1st
Period
1H/'02
2nd
Period
2H/'02
3rd
Period
1H/'03
4th
Period
2H/'03
5th
Period
1H/'04
6th
Period
2H/'04
7th
Period
1H/'05
8th
Period
2H/'05
9th
Period
1H/'06
10th
Period
2H/'06
11th
Period
1H/'07
12th
Period
2H/'07
13th
Period
1H/'08
14th
Period
2H/'08
15th
Period
1H/'09
16th
Period
2H/'09
17th
Period
1H/'10
18th
Period
2H/'10
19th
Period
1H/'11
20th
Period
2H/'11
21st
Period
1H/'12
22nd
Period
2H/'12
23rd
Period
1H/'13
24th
Period
2H/'13
25th
Period
1H/'14
26th
Period
2H/'14
27th
Period
1H/'15
28th
Period
2H/'15
29th
Period
1H/'16
30th
Period
2H/'16
31st
Period
1H/'17
32nd
Period
2H/'17
33rd
Period
1H/'18
34th
Period
2H/'18
35th
Period
1H/'19
36th
Period
2H/'19
37th
Period
1H/'20
38th
Period
2H/'20
39th
Period
1H/'21
40th
Period
Note 1: Historical data for the 25th Period, the six months ended December 31, 2013, and before are adjusted for the two-for-one investment unit split. Figures are rounded down to the nearest yen.Note 2: NAV per unit = (Unitholders’ capital at period end + Reserve for advanced depreciation in the next period (reserve - reversal) + Unrealized gain or loss on appraisal value at period end)
÷ Units issued and outstanding at period end
6-1 J-REIT with the Longest Track Record (2/2)
9,513
8,001
8,126
7,683
7,291 7,592
8,645 8,446 8,523
9,695 9,612
9,904
10,064
11,274
11,126 10,887
9,836
8,562
7,747
7,569 7,600 7,740 7,877
8,427 8,645
8,152
7,681 7,787 8,036
8,397 8,867 9,129 9,370 9,650
10,283 10,560
11,011 10,986
11,000
11,684
0
3,000
6,000
9,000
12,000
2H/'01
1st
Period
1H/'02
2nd
Period
2H/'02
3rd
Period
1H/'03
4th
Period
2H/'03
5th
Period
1H/'04
6th
Period
2H/'04
7th
Period
1H/'05
8th
Period
2H/'05
9th
Period
1H/'06
10th
Period
2H/'06
11th
Period
1H/'07
12th
Period
2H/'07
13th
Period
1H/'08
14th
Period
2H/'08
15th
Period
1H/'09
16th
Period
2H/'09
17th
Period
1H/'10
18th
Period
2H/'10
19th
Period
1H/'11
20th
Period
2H/'11
21st
Period
1H/'12
22nd
Period
2H/'12
23rd
Period
1H/'13
24th
Period
2H/'13
25th
Period
1H/'14
26th
Period
2H/'14
27th
Period
1H/'15
28th
Period
2H/'15
29th
Period
1H/'16
30th
Period
2H/'16
31st
Period
1H/'17
32nd
Period
2H/'17
33rd
Period
1H/'18
34th
Period
2H/'18
35th
Period
1H/'19
36th
Period
2H/'19
37th
Period
1H/'20
38th
Period
2H/'20
39th
Period
1H/'21
40th
Period
(Yen)
●Distributions per Unit (Note 1)
●NAV per Unit (Notes 1 and 2)
(Yen)

38
0
100
200
300
400
500
600
700
800
900
1,000
1,100
1,200
Office buildings19.9%
Diversified and hybrid47.0%
Commercial facilities 4.5%
Residentia 7.0%
Logistics 18.1%
Ratio of J-REITs by Type
0
200
400
600
800
1,000
1,200
1,400
1,600
Residential14.0%
Commercial Facilities 16.5%
Logistics 18.5%
Hotel 7.8%
Others 1.3%
Office buildings 40.5%
●Acquisition Price
●Market Capitalization
Source: Compiled by asset management company using publicly available information
Source: Compiled by asset management company using data published by QUICK Corp.
(As of June 30, 2021)
NBF
NBF
1,367.5 billion yen
1,145.1 billion yen(Billion yen)
(Billion yen)
J-REIT Total Acquisition Price… 20,831.1 billion yen
J-REIT Total Market Capitalization… 17,528.7 billion yen
Ratio of Assetsby Type
6-2 The Largest J-REIT in Size
Hotel and healthcare 3.5%
Healthcare 1.3%

39
Central 5 Wards of Tokyo
23 Wards of Tokyo
Other Greater Tokyo Other Cities
6-3 A Portfolio Focused on Tokyo
GranTokyo South Tower
(Chiyoda-ku, Tokyo)Central 5 Wards
of Tokyo
764.1 billion yen(55.9%)
Other Greater Tokyo82.6 billion yen
(6.0%)
Other Cities153.9 billion yen
(11.3%)
1,367.5billion yen
75 properties
23 Wards of Tokyo1,131.0 billion yen
(82.7%)
Shinjuku Mitsui Bldg.
(Shinjuku-ku, Tokyo)
Roppongi T-CUBE
(Minato-ku, Tokyo)
Celestine Shiba Mitsui Bldg.
(Minato-ku, Tokyo)
Gate City Ohsaki
(Shinagawa-ku, Tokyo)
NBF Osaki Bldg.
(Shinagawa-ku, Tokyo)
Shin Kawasaki Mitsui
Bldg.
(Kawasaki City,
Kanagawa)
Yokohama ST Bldg.
(Yokohama City,
Kanagawa)
Sumitomo Mitsui Banking
Nagoya Building
(Nagoya City, Aichi)
Nakanoshima
Central Tower
(Osaka City, Osaka)
(As of June 30, 2021)
● Investment Ratio by Area(Acquisition price basis)
40
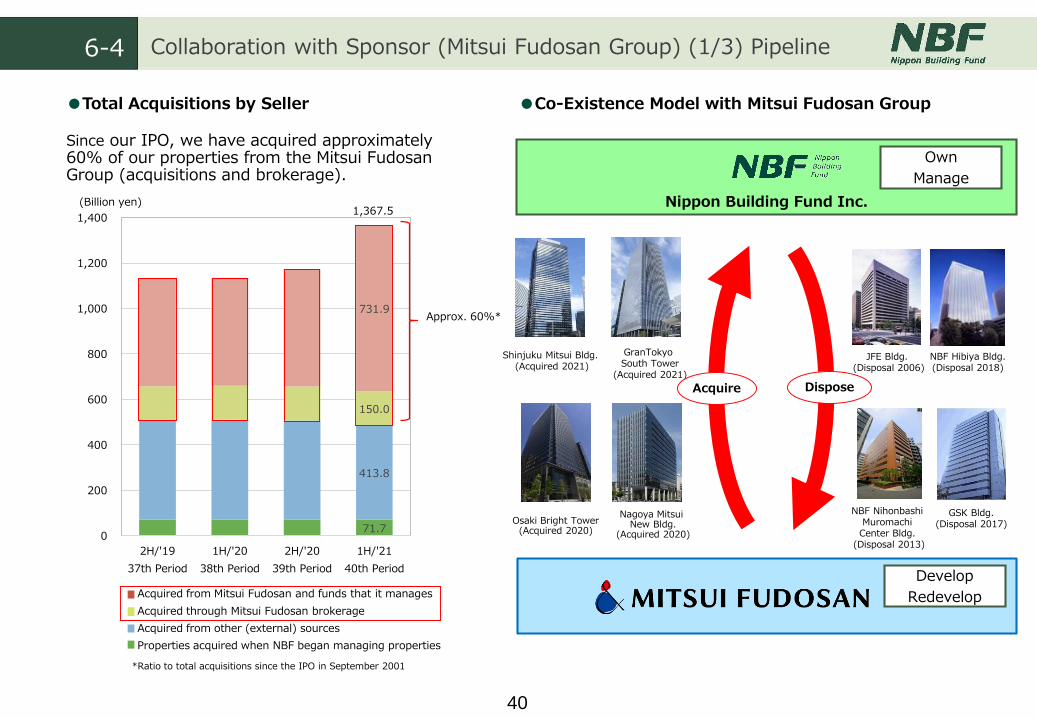
71.7
413.8
150.0
731.9
0
200
400
600
800
1,000
1,200
1,400
2H/'19
37th Period
1H/'20
38th Period
2H/'20
39th Period
1H/'21
40th Period
1,367.5Nippon Building Fund Inc.
Shinjuku Mitsui Bldg.(Acquired 2021)
Osaki Bright Tower(Acquired 2020)
6-4 Collaboration with Sponsor (Mitsui Fudosan Group) (1/3) Pipeline
GranTokyoSouth Tower
(Acquired 2021)
Nagoya Mitsui New Bldg.
(Acquired 2020)
JFE Bldg. (Disposal 2006)
NBF Nihonbashi Muromachi
Center Bldg. (Disposal 2013)
GSK Bldg.(Disposal 2017)
NBF Hibiya Bldg.(Disposal 2018)
●Total Acquisitions by Seller
Since our IPO, we have acquired approximately 60% of our properties from the Mitsui Fudosan Group (acquisitions and brokerage).
(Billion yen)
Approx. 60%*
Acquired from Mitsui Fudosan and funds that it manages
Acquired through Mitsui Fudosan brokerage
Acquired from other (external) sources
Properties acquired when NBF began managing properties
*Ratio to total acquisitions since the IPO in September 2001
●Co-Existence Model with Mitsui Fudosan Group
Own
Manage
DisposeAcquire
Develop
Redevelop
41
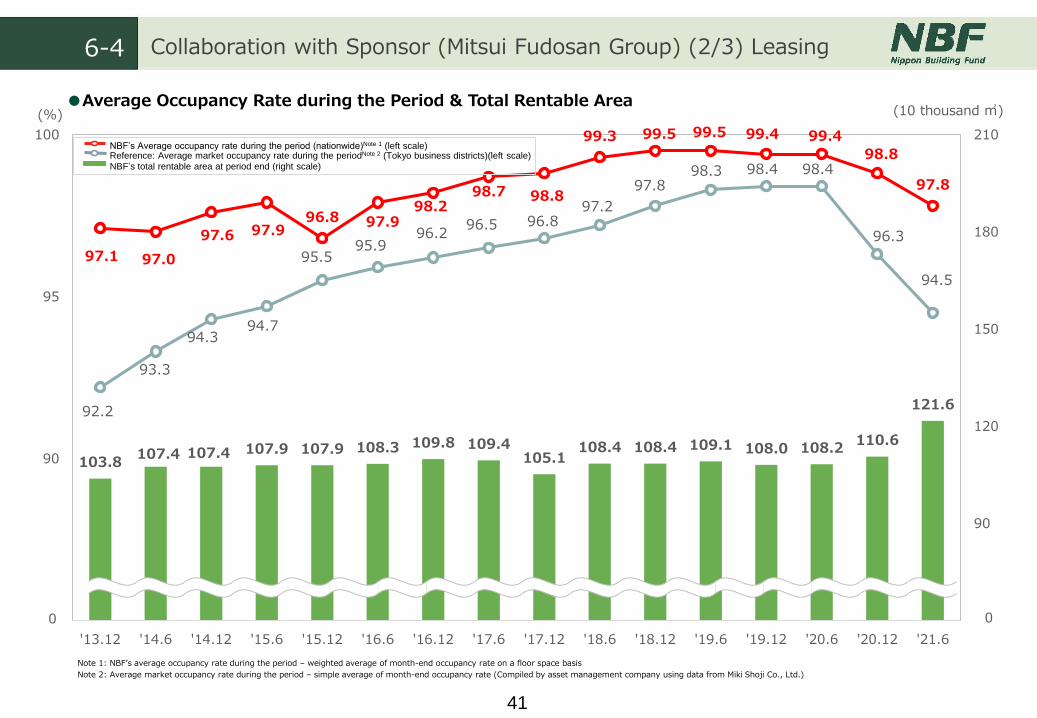
103.8107.4 107.4 107.9 107.9 108.3 109.8 109.4
105.1108.4 108.4 109.1 108.0 108.2
110.6
121.6
97.1 97.0
97.6 97.9 96.8 97.9
98.2 98.7 98.8
99.3 99.5 99.5 99.4 99.4
97.8
92.2
93.3
94.3 94.7
95.5 95.9
96.2 96.5 96.8
97.2
97.8 98.3 98.4 98.4
96.3
94.5
60
90
120
150
180
210
85
90
95
100
'13.12 '14.6 '14.12 '15.6 '15.12 '16.6 '16.12 '17.6 '17.12 '18.6 '18.12 '19.6 '19.12 '20.6 '20.12 '21.6
●Average Occupancy Rate during the Period & Total Rentable Area
Note 1: NBF’s average occupancy rate during the period – weighted average of month-end occupancy rate on a floor space basis
Note 2: Average market occupancy rate during the period – simple average of month-end occupancy rate (Compiled by asset management company using data from Miki Shoji Co., Ltd.)
6-4 Collaboration with Sponsor (Mitsui Fudosan Group) (2/3) Leasing
(%) (10 thousand ㎡)
00
98.8NBF’s total rentable area at period end (right scale)
NBF’s Average occupancy rate during the period (nationwide)Note 1 (left scale)Reference: Average market occupancy rate during the periodNote 2 (Tokyo business districts)(left scale)

42
2,965 2,746
4,416
3,361
4,399 4,973
5,971
6,777
41.2 38.9
62.2
46.5
60.9
69.4
83.1 91.6
0
1,000
2,000
3,000
4,000
5,000
6,000
7,000
8,000
9,000
0
10
20
30
40
50
60
70
80
90
100
2H/'17
33rd
1H/'18
34th
2H/'18
35th
1H/'19
36th
2H/'19
37th
1H/'20
38th
2H/'20
39th
1H/'21
40th
6-4Collaboration with Sponsor (Mitsui Fudosan Group) (3/3) Property Management
(%)
●Support from both Nippon Building Fund Management and NBF Office Management
NBFOM Strengths and Features
●Strong relationships with existing tenants
NBFOM is NBF’s dedicated PM company. It builds relationships with existing tenants, supports high occupancy rates by managing properties and communicating with tenants, and negotiate terms with tenants when renewing contracts.
MBFOM uses the Mitsui Fudosan Group’s management and operating expertise. It builds the NBF brand by executing unified management and operation for all NBF properties.
Based on the strategies planned by NBFM, makes additional investment and performs LCC construction and other work to improve competitiveness together with NBFM.
●Fully leverages Mitsui Fudosan Group expertise
●Execution of strategic property maintenance plan
・Ratio of Capex to Depreciation and Amortization(Actual)
(million yen)
Capex (right scale)
Capex/Depreciation and amortization (left scale)
Nippon Building Fund
(Employees:39) (Employees:84)
(Main Sponsor)
Asset Management
Fully leverage Mitsui Fudosan’s human resources and expertise
Nippon Building Fund Management
(NBFM)
Property Management
(As of June 30.2021)
(NBFOM)

43
40.8 40.9 40.8 41.7 41.6 41.738.4
42.2
95.2 93.3 92.6 92.9 93.5 93.6
91.7
95.1
0
10
20
30
40
50
60
70
80
90
100
2H/'17
33rd
Period
1H/'18
34th
Period
2H/'18
35th
Period
1H/'19
36th
Period
2H/'19
37th
Period
1H/'20
38th
Period
2H/'20
39th
Period
1H/'21
40th
Period
●Average Maturity (Long-Term Interest-Bearing Debt)●LTV & Long-Term Fixed-Rate Debt Ratio
●Average Interest Cost on Debt
6-5 Stable Financial Management
Target : 90% or higher for the long-term fixed-rate debt ratio
(%)
0.86 0.71 0.69 0.62 0.57 0.54 0.50 0.47
0.00
1.00
2.00
2H/'17
33rd
Period
1H/'18
34th
Period
2H/'18
35th
Period
1H/'19
36th
Period
2H/'19
37th
Period
1H/'20
38th
Period
2H/'20
39th
Period
1H/'21
40th
Period
(%)
5.22 5.60
5.24 5.54 5.53 5.62 5.35
6.08
0
1
2
3
4
5
6
7
2H/'17
33rd
Period
1H/'18
34th
Period
2H/'18
35th
Period
1H/'19
36th
Period
2H/'19
37th
Period
1H/'20
38th
Period
2H/'20
39th
Period
1H/'21
40th
Period
(years)
Target : 36%-46% for LTV
44
7. ESG Initiatives
(NBF and NBFM)

45
7-1 Status of ESG Initiatives (Highlights)
Support for and Participation in International Initiatives (TCFD and CDP)
Added to MSCI Japan ESG Select Leaders Index
Issued Green Bonds
Obtained a Third-party Environmental Performance Guarantee
Began Using Green Power
• Added to MSCI Japan ESG Select Leaders Index in May 2021
• In February 2021, we endorsed the Task Force on TCFD(Climate-related Financial Information Disclosure) and set long-
term environmental performance objectives as key performance indicators.
• Participated in the CDP Climate Change Program in July 2021
• Obtained a third-party guarantee from Deloitte Tohmatsu Sustainability Co., Ltd. for some of the environmental
performance data for December 2020.
• Started purchasing non-fossil electricity at 12 portfolio properties
• NBF issued its first green bond in March 2021
Issue amount: ¥5.0 billion
Term: 5 years
Interest rate: 0.15%
Specific use of Proceeds : Purchase of green eligible assetsOsaki Bright Tower Nagoya Mitsui New Bldg. Nagoya Mitsui Main Bldg.
No. 20 Unsecured Bonds (Green Bonds)Green Eligible Assets
* Japan’s Government Pension Investment Fund has also selected MSCI Japan ESG Select Leaders Index as its ESG index for managing funds.
* Non-fossil electricity is not derived from fossil fuels such as natural gas, coal, and petroleum.

46
7-2 ESG Initiatives Policy
Basic Approach
Endorsed and Participating in International Initiatives
Added to MSCI Japan ESG Select Leaders
Index
Task Force on Climate-related Financial Information Disclosure
CDP Climate Change Program
Received GRESB Evaluation for 6th Consecutive Year
Established Green Bond Framework
Acquired Green Building Certification
• DBJ Green Building Certification 3 stars or higher
• 5 star, 4 star or 3 star in BELS certification• S, A or B + rank in CASBEE certification
Asset Criteria
2H 2019 1H 2020 2H 2020 1H 2021
Number of certified properties 38 38 41 43
Total floor area of certified properties 1,158,809㎡ 1,161,207㎡ 1,209,736㎡ 1,424,256㎡
Percentage certified (building basis) 53.5% 53.5% 55.4% 57.3%
Percentage certified (floor space basis) 69.5% 69.5% 70.3% 74.4%
Acquisition of Green Building Certification
NBF’s basic approach is to obtain the following external evaluations and certifications, and
to support and participate in international initiatives.
※
* Addition of NBF to the MSCI Japan ESG Select Leaders Index (MSCI Index) and the use of the MSCI logo, trademarks, service marks and index names in this presentation do not constitute an endorsement, sponsorship, guarantee or promotion of MSCI or its affiliates on the part of NBF.
The MSCI Index is the exclusive property of MSCI, and MSCI, MSCI Index and MCSI logo are trademarks and service marks of MSCI or its affiliates.
5-Star Real estate Evaluation Disclosure Evaluation A
NBF recognizes that consideration for ESG is an important issue in real estate investment management. Based on the Mitsui Fudosan Group’s Group Environmental Policy and Policy for Social Contribution Initiatives, NBF manages assets with due consideration for reducing environmental load, improving safety and security, improving comfort, and collaborating with relevant actors.

47
0
5
10
15
20
25
30
35
40
0
2,000
4,000
6,000
8,000
10,000
12,000
14,000
2H/'1835th
Period
1H/'1936th
Period
2H/'1937th
Period
1H/'2038th
Period
2H/'2039th
Period
1H/'2140th
Period
2H/'2141st
Period
1H/'2242ndPeriod
2H/'2243rd
Period
1H/'2344th
Period
【Planned】Cumulative No. of properties
【Actual (for 35th and 38th periods) and Forecasted (for 44th and after)】 Cumulative No. of properties
【Planned】Annual CO2 emmissions from lightning of 37 properties
【Actual】Annual CO2 emmissions from lightning of 37 properties
7-3 Environment Initiatives
• All executives and employees of the asset management company promote ESG and create an internal system that ensures the PDCA cycle is implemented.
• We aim to reduce energy-derived CO² emissions by 40% or more (basic unit) by 2030 with 2013 as the baseline.* • In addition to new measures such as the introduction of green power and the installation of solar panels, we will take conventional
measures such as promoting LED conversion, property replacement for high environmental performance, replacing air conditioners, and introducing equipment with excellent environmental performance.
*Includes total annual energy consumption in CO2 emission reduction targets
Initiatives to Improve Environmental Performance
LED Lighting Promotion Plan
• Subject properties: 37 properties (tenant and common area)• Subject period: 2H 2018 (35th Period) to 1H 2023 (44th Period)
Approx. 60% reduction
(ton-CO²/ year)
Properties Converted to LED and CO² Emissions
(Properties)
Initiatives to Promote Green Power
Promotion of LED Lighting in Tenant Areas and Common Areas
*Expected data after the 41st Period*The COVID-19 pandemic caused fewer people to be at companies and is a special factor impacting results for the 40th Period.
lobby(Roppongi T-CUBE)
Tenant area(Gate City Ohsaki)
tenant area(Sumitomo Densetsu Bldg.)
• NBF began purchasing certified feed-in tariff non-fossil power from TEPCO Energy Partners Co., Ltd. in June 2021.• Non-fossil power is used in common areas to reduce CO2 emissions.

48
7-4 Social Initiatives for Tenants
Implementation of initiatives for tenants and communities
Safe, secure operations
COVID-19 Countermeasures(Shinjuku Mitsui Bldg. No.2)
Comfortable work environment (Shinjuku Mitsui Bldg. No.2)● Renovation of common space in consideration of various work styles
Installation of high-performance air purifiers Installation of thermometers at the entrance to common areas
Customer satisfaction events for tenants
●Customer satisfaction events for tenants
Non-contact event (photo contest)
Installation of security gate at entrance to tenant area
Disaster Center visualization
Dedicated tenant lounge Ramps for wheelchairs and strollers
Beer making and hop cultivation event
Seasonal event (Tanabata)
Invitation to suggest beer names
Security/disaster prevention equipment (Shinjuku Mitsui Bldg.)

49
7-5 Examples of Social Events for Employees(Asset management company: Nippon Building Fund Management Ltd.)
Office BGMOpen cafeteria space
• Established telework rules(all employees including contract employees)
• Encouraged staggered commuting• On call at home, salary compensation for shortened hours• Attendance rate control
Support for Employees during COVID-19 Pandemic
Initiatives for Employees
• Implemented COVID-19 vaccinations(all employees including contract employees)
• Periodic PCR testing (all employees, including contract employees and seconded employees)
• Installed acrylic partitions in open spaces• Regularly disinfected doorknobs• Installed disinfectant and space disinfectant deodorizers
(Ziaino)• Thorough social distancing (1m with mask)• Expanded web conference system• Introduced electronic approval system
A Safe Work Environment
Health and Comfort Initiatives (Wellness)
Comfortable Office Space
• Use of shared offices (Work Styling)• Improved flex system and telework system• Improved PC environment in consideration of work efficiency
(applicants)• Created open space and cafeteria space and provided office
coffee service• Provided office BGM
• Participation in events to maintain good health
Regular PCR tests (applicants) Installed space disinfectant deodorizers (Ziaino)
Mitsui Fudosan’s & Well service aims to support the physical and mental health of office workers and corporate health through health programs that add color to everyday life under the theme of energizing workers from the city and office buildings.
& Well health management support service
Work space with greenery
• We started using the & Well health management support service of Mitsui Fudosan Co., Ltd. for all employees to maintain and improve the physical and mental health of executives and employees, raise awareness, and promote communication between executives and employees.
• In June 2021, we participated in a walking event with other companies participating in & Well.【 walking event 】

50
7-6 Governance Initiatives
Real Estate Asset
Management Team I
7-6 Governance Initiatives
Real Estate Asset
Management Team II
Flow chart for making decisions on acquisition and disposition of assets under management
Board of Directors of NBF Board of Directors of NBFM
Deliberation by the Compliance Committee
• Check compliance, including various risks and illegalities, using a real estate process check sheet.
• Confirm with third-party experts as necessary.
• Compliance Officer checks compliance prior to the Investment Review Meeting and may order to modify or turn down the agenda as necessary.
• Compliance Officer chairs the Compliance Committee.
• The Compliance Committee confirms compliance concerning the deliberated. Matters, and may
order to make corrections if judged necessary and suspend the matter until such corrections are
made.
• Adoption of deliberated matters requires , in principle , at least two-thirds of Committee members
present in favor , including outside committee members.
• Compliance Officer chairs the Compliance Committee.• The Compliance Committee confirms compliance concerning the deliberated matters, and
may order to make corrections if judged necessary and suspend the matter until such corrections are made.
• Adoption of deliberated matters requires, in principle, at least two-thirds of committee members present in favor, including outside committee members.
• Make final confirmation on whether doubts exist or not regarding compliance.
• Report on the transaction.
NBFM has established a governance structure such as with its Compliance Committee, Risk Management Meeting,Investment Review Meeting and Executive Board, and endeavors to thoroughly implement risk management and compliance inits operations and improve corporate governance on an ongoing basis.
• Report on the transaction.• Upon transacting with Interested Parties, etc., deliver
“deliver restatement on a case possibly involving a conflictof interest” pursuant to internal rules, prior to thetransaction. In addition, also deliver the written statementpursuant to the Investment Trust Act after the transaction.When conducting a transaction of a certain materiality,obtain approval from the Board of Directors of NBFpursuant to the Investment Trsuts Act, after NBFM hascompleted all approval procedures
Original proposal by Investment & Finance Group
Prior checking by Compliance Officer
Deliberation by the Investment Review Meeting
Deliberation by Executive Board
Decision by CEO
Organizational Chart
General Meetingof
Shareholders
Auditor
ComplianceCommittee
Risk ManagementMeeting
Board of Directors
CEO
Executive Board
Compliance Officer
InvestmentReview Meeting
Investment &Finance Group
CorporateOperation Group
Accounting Auditor
Real estateInvestment
Team
FinancialTeam
RiskManagement& Compliance
Team
CorporatePlanning &
AdministrationTeam
51
8. Appendix
52
Tenant Name Leased PropertyLeased Areas
(㎡)
Ratio of TotalRentableArea (%)
1. Mitsui Fudosan Co., Ltd.1Shinjuku Mitsui Bldg.& 22 other properties
411,069 34.8
2. Sony Group CorporationNBF Osaki Bldg.& 1 other property
75,057 6.3
3. Hitachi Real Estate Partners, Ltd.Ueno East Tower
& 7 other properties40,459 3.4
4. transcosmos inc.NBF Shibuya Garden Front
& 3 other properties25,285 2.1
5. Hakuhodo DY Holdings Inc.Toyosu Garden Front
& 1 other property21,121 1.8
6. Aflac Life Insurance Japan Ltd.Chofu South Gate Bldg.
& 3 other properties15,260 1.3
7. AXA Life Insurance Co., Ltd.NBF Platinum Tower
& 2 other properties15,130 1.3
8. FUJIFILM Business Innovation Corp. Nakanosakaue Sunbright Twin 14,243 1.2
9. Softbank Group CorporationNBF Toyosu Canal Front & 1 other property
13,842 1.2
10. Sumitomo Mitsui Construction Co., Ltd. River City M-SQUARE 11,952 1.0
1 Top 10 Tenants (Leased Floor Space Basis) /Tenants by Industry
●Top 10 Tenants (Leased Floor Space Basis) ●Tenants by Industry2
1 Mitsui Fudosan Co., Ltd. generally subleases the properties noted in the table that it leases from NBF, although it uses some of the floor space itself.
Mitsui Fudosan pays rent to NBF after deducting a fixed percentage of the rent it receives from sublease tenants (some of the leased properties
are excluded).
2 The asset management company has classified the type of industry based on the industry classification codes of the Securities Identification
Code Committee. Industry classification includes sublease tenants.
(As of June 30, 2021)
Real estate
11.4%
Electrical
equipment
11.4%Information &
Communications
10.0%
Machinery 3.0%
Banking 2.8%
Tenant companies
1,606Construction 5.6%
Pharmaceuticals 2.4%
Insurance 6.8%
Retail 3.5%
Wholesale 8.4%
Other 8.5%
Warehousing &Transportation 2.0%
Service 22.2%Other Other financial industry 2.0%
53
-1,500
-500
500
1,500
2,500
Shin
juku
Mitsu
i Bld
g.
Roppongi T
-CUBE
Gra
nTokyo
South
Tow
er
Nish
i-Shin
juku
Mitsu
i Bld
g.
Celestin
e Shib
a M
itsui B
ldg.
NBF S
hin
agaw
a T
ow
er
Shib
a N
BF T
ow
er
NBF P
latin
um
Tow
er
NBF M
inam
i-Aoya
ma B
ldg.
NBF C
OM
ODIO
Shio
dom
e
G-B
ASE T
AM
ACHI
Tora
nom
on K
oto
hira
Tow
er
NBF O
chanom
izu B
ldg.
NBF S
hib
uya
Gard
en Fro
nt
NBF G
inza
Street B
ldg.
Shin
juku
Mitsu
i Bld
g. N
o.2
Kow
a N
ishi-S
hin
bash
i Bld
g. B
River C
ity M-S
QUARE
NBF T
ora
nom
on B
ldg.
Shin
bash
i M-S
QUARE
NBF A
LLIANCE
Yotsu
ya M
edica
l Bld
g.
NBF S
hib
uya
East
NBF S
hib
ako
uen
Bld
g.
NBF T
aka
naw
a B
ldg.
NBF A
kasa
ka S
anno S
quare
NBF K
andasu
dach
o B
ldg.
NBF O
gaw
am
ach
i Bld
g.
Sum
itom
o D
ensetsu
Bld
g.
NBF H
igash
i-Gin
za S
quare
Panaso
nic T
okyo
Shio
dom
e Bld
g.
Nih
onbash
i Kabuto
-cho M
-SQ
UARE
NBF H
atch
obori T
errace
Ryu
kaku
san B
ldg.
Jingum
ae M
-SQ
UARE
NBF O
saki B
ldg.
Gate C
ity Ohsa
ki
Naka
nosa
kaue S
unbrig
ht T
win
NBF T
oyo
su C
anal F
ront
Uen
o E
ast T
ow
er
NBF T
oyo
su G
ard
en Fro
nt
Osa
ki Brig
ht C
ore -
Brig
ht P
laza
Naka
meg
uro
GT T
ow
er
Osa
ki Brig
ht T
ow
er
NBF U
eno B
ldg.
NBF Ikeb
uku
ro E
ast
Hig
ash
i Gota
nda S
quare
Toyo
-cho C
enter B
ldg.
NBF Ikeb
uku
ro T
ow
er
NBF Ikeb
uku
ro C
ity Bld
g.
Chofu
South
Gate B
ldg.
Shin
-Kaw
asa
ki Mitsu
i Bld
g.
Yoko
ham
a S
T B
ldg.
Para
le Mitsu
i Bld
g.
Tsu
kuba M
itsui B
ldg.
S-in
o O
miya
North
Win
g
NBF U
raw
a B
ldg.
NBF M
atsu
do B
ldg.
Sapporo
L-Pla
za
NBF S
apporo
Min
am
i Nijo
Bld
g.
NBF U
nix B
ldg.
NBF N
iigata
Teleco
m B
ldg.
Sum
itom
o M
itsui B
ankin
g N
agoya
Bld
g.
Nagoya
Mitsu
i New
Build
ing
Nagoya
Mitsu
i Main
Build
ing
NBF N
agoya
Hiro
koji B
ldg.
Aqua D
ojim
a N
BF T
ow
er
Naka
nosh
ima C
entra
l Tow
er
Shin
anobash
i Mitsu
i Bld
g.
Saka
isuji-H
onm
ach
i Cen
ter Bld
g.
Sun M
ullio
n N
BF T
ow
er
NBF H
irosh
ima T
atem
ach
i Bld
g.
Hiro
shim
a Fu
kuro
mach
i Bld
g.
NBF M
atsu
yam
a N
ichig
in-m
ae B
ldg.
Haka
ta G
ion M
-SQ
UARE
NBF K
um
am
oto
Bld
g.
(tsubo)
2 Floor Space of Tenants Moving in and out by Property *(1H/2021)
Floor space of tenants moving out(3.4%)
Increase in floor space of existing tenants(0.5%)Floor space of tenants moving in(2.0%)
Number in parenthesis is an average of total rentable area at the end of each month
*Serviced apartments and housing are excluded from the area of tenants moving in and out.
23 Wards of Tokyo Other GreaterTokyo Other Cities
-5,000

54
8.7%
43.9%
47.3%
15.9%
41.7%
42.4%
2H/2020(39th Period end)
1H/2021(40th Period end)
Average Property Age
23.2 years
3 Property Age
Average Property Age
20.0 years
10 years or less11-20 yearsOver 20 years

55
4 Financial Management
73.5
66.7
65.2
79.1
75.7
65.6
85.8
83.1
80.8
95.2 95.1
86.7
87.3 87.0
82.3
84.8
92.9 95.2
97.5
97.7 94.2
92.2
95.0
94.7
99.6
96.4
97.7
96.5 95.2
93.8 94.0
92.5
95.2 93.3 92.6 92.9
93.5
93.6
91.7
95.1
30.7
36.0 38.0
41.9 43.3
50.8
41.7
44.4 45.6
37.5 37.3
41.4 40.5 38.7
41.6 43.2 43.2 43.1 42.5 42.6
44.2 42.9
44.4 45.2 43.8 43.1
41.9 41.9 41.3 42.1 41.9 41.5 40.8 40.9 40.8 41.7 41.6 41.7
38.4
42.2
0
10
20
30
40
50
60
70
80
90
100
0
50
100
150
200
250
300
350
400
450
500
550
600
2H/'01
1st
Period
1H/'02
2nd
Period
2H/'02
3rd
Period
1H/'03
4th
Period
2H/'03
5th
Period
1H/'04
6th
Period
2H/'04
7th
Period
1H/'05
8th
Period
2H/'05
9th
Period
1H/'06
10th
Period
2H/'06
11th
Period
1H/'07
12th
Period
2H/'07
13th
Period
1H/'08
14th
Period
2H/'08
15th
Period
1H/'09
16th
Period
2H/'09
17th
Period
1H/'10
18th
Period
2H/'10
19th
Period
1H/'11
20th
Period
2H/'11
21st
Period
1H/'12
22nd
Period
2H/'12
23rd
Period
1H/'13
24th
Period
2H/'13
25th
Period
1H/'14
26th
Period
2H/'14
27th
Period
1H/'15
28th
Period
2H/'15
29th
Period
1H/'16
30th
Period
2H/'16
31st
Period
1H/'17
32nd
Period
2H/'17
33rd
Period
1H/'18
34th
Period
2H/'18
35th
Period
1H/'19
36th
Period
2H/'19
37th
Period
1H/'20
38th
Period
2H/'20
39th
Period
1H/'21
40th
Period
(%)
Market cap
at period
end
(Billion yen)
138.9 155.5 174.6 184.4 193.1 220.9 318.7 364.7 420.6 563.9 802.6 868.6 797.5 677.5 530.0 447.6 382.7 381.5 451.4 454.7 364.4 472.6 547.4 794.4 847.0 835.9 852.8 756.8 814.7 893.7 913.5 810.4 778.0 902.2 975.6 1,042.0 1,122.5 866.9 988.1 1,145.1
Borrowings (left scale) Long-term fixed-rate debt ratio (right scale)
Investment corporation bonds (left scale) LTV (Interest-bearing debt to total assets) (right scale)
(Billion yen)

56
5 Lenders & Borrowings
(27 companies ) (28 companies )
Lender2H/2020 1H/2021 Repayment
MethodOther
39th Period End 40th Period End
Short-TermBorrowings
Sumitomo Mitsui Banking Corporation 10,000 -
Subtotal 10,000 -
Development Bank of Japan Inc. 76,500 79,500
Lump sumrepayment
ondue date
Unsecured,unguaranteed,ranked pari
passu
MUFG Bank,LTD. 64,000 79,000
Sumitomo Mitsui Banking Corporation 37,000 67,000
Sumitomo Mitsui Trust Bank, Ltd. 39,000 44,000
Sumitomo Life Insurance Company 30,000 40,000
Mizuho Bank, Ltd. 25,000 40,000
Shinkin Central Bank 30,000 35,000
The Norinchukin Bank 12,000 17,000
Mizuho Trust & Banking Co., Ltd. 14,000 14,000
Taiju Life Insurance Company Ltd. 11,000 11,000
The Bank of Fukuoka, Ltd. 8,000 10,000
Nippon Life Insurance Company 9,000 9,000
Long-Term Daishi Hokuetsu Bank, Ltd. 4,000 6,000
Borrowings The Yamaguchi Bank, Ltd. 4,000 5,000
(contract basis) Daido Life Insurance Company 4,000 4,000
Taiyo Life Insurance Company 4,000 4,000
The 77 Bank, Ltd. 4,000 4,000
The Hachijuni Bank, Ltd. 3,000 4,000
The Iyo Bank, Ltd. 3,000 3,000
The Chugoku Bank, Ltd. 3,000 3,000
Meiji Yasuda Life Insurance Company 3,000 3,000
The Yamanashi Chuo Bank, Ltd. 3,000 3,000
The Joyo Bank, Ltd. 2,000 2,000
The Chiba Bank, Ltd. 2,000 2,000
Shinsei Bank, Ltd. 1,000 2,000
Resona Bank, Ltd. 1,000 1,000
The Gunma Bank, Ltd. - 1,000
Mitsui Sumitomo Insurance Group - 1,000
The Hiroshima Bank, Ltd. 1,000 -
Subtotal 397,500 493,500
Total 407,500 493,500
(Million yen)
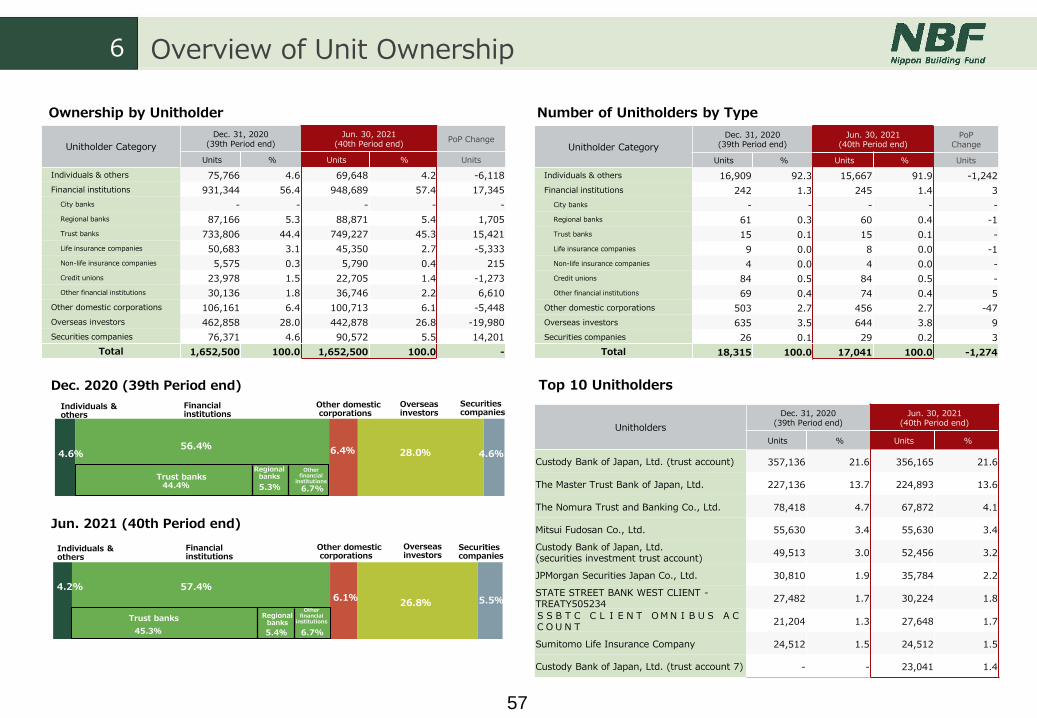
57
6 Overview of Unit Ownership
Unitholder Category
Dec. 31, 2020(39th Period end)
Jun. 30, 2021(40th Period end)
PoP Change
Units % Units % Units
Individuals & others 75,766 4.6 69,648 4.2 -6,118
Financial institutions 931,344 56.4 948,689 57.4 17,345
City banks - - - - -
Regional banks 87,166 5.3 88,871 5.4 1,705
Trust banks 733,806 44.4 749,227 45.3 15,421
Life insurance companies 50,683 3.1 45,350 2.7 -5,333
Non-life insurance companies 5,575 0.3 5,790 0.4 215
Credit unions 23,978 1.5 22,705 1.4 -1,273
Other financial institutions 30,136 1.8 36,746 2.2 6,610
Other domestic corporations 106,161 6.4 100,713 6.1 -5,448
Overseas investors 462,858 28.0 442,878 26.8 -19,980
Securities companies 76,371 4.6 90,572 5.5 14,201
Total 1,652,500 100.0 1,652,500 100.0 -
Unitholder Category
Dec. 31, 2020(39th Period end)
Jun. 30, 2021(40th Period end)
PoP Change
Units % Units % Units
Individuals & others 16,909 92.3 15,667 91.9 -1,242
Financial institutions 242 1.3 245 1.4 3
City banks - - - - -
Regional banks 61 0.3 60 0.4 -1
Trust banks 15 0.1 15 0.1 -
Life insurance companies 9 0.0 8 0.0 -1
Non-life insurance companies 4 0.0 4 0.0 -
Credit unions 84 0.5 84 0.5 -
Other financial institutions 69 0.4 74 0.4 5
Other domestic corporations 503 2.7 456 2.7 -47
Overseas investors 635 3.5 644 3.8 9
Securities companies 26 0.1 29 0.2 3
Total 18,315 100.0 17,041 100.0 -1,274
Unitholders
Dec. 31, 2020(39th Period end)
Jun. 30, 2021(40th Period end)
Units % Units %
Custody Bank of Japan, Ltd. (trust account) 357,136 21.6 356,165 21.6
The Master Trust Bank of Japan, Ltd. 227,136 13.7 224,893 13.6
The Nomura Trust and Banking Co., Ltd. 78,418 4.7 67,872 4.1
Mitsui Fudosan Co., Ltd. 55,630 3.4 55,630 3.4
Custody Bank of Japan, Ltd. (securities investment trust account)
49,513 3.0 52,456 3.2
JPMorgan Securities Japan Co., Ltd. 30,810 1.9 35,784 2.2
STATE STREET BANK WEST CLIENT -TREATY505234
27,482 1.7 30,224 1.8
SSBTC CLIENT OMNIBUS ACCOUNT
21,204 1.3 27,648 1.7
Sumitomo Life Insurance Company 24,512 1.5 24,512 1.5
Custody Bank of Japan, Ltd. (trust account 7) - - 23,041 1.4
Ownership by Unitholder
Jun. 2021 (40th Period end)
Dec. 2020 (39th Period end)
Number of Unitholders by Type
Top 10 Unitholders
Individuals & others
Financialinstitutions
Other domesticcorporations
Overseas investors
4.6%56.4% 6.4% 28.0% 4.6%
Trust banksRegional
banks
44.4%
Other financial
institutions
5.3% 6.7%
Securities companies
Individuals & others
Financialinstitutions
Other domesticcorporations
Overseas investors
4.2% 57.4%6.1%
26.8% 5.5%
Trust banks Regional banks
45.3%
Other financial
institutions
5.4% 6.7%
Securities companies

58
7 Historical Summary of Main Management Indicators and Other Data
Note 1: NOI from property leasing activities does not include such items as gain or loss on sale of investment properties.
Note 2: NOI yield = NOI from properties held at beginning of period/Period-end book value of properties held at beginning of period x 2
Note 3: FFO = Net income + Depreciation and amortization – Gain or loss on sale of investment properties
Note 4: AFFO = FFO – Capital expendituresNote 5: FFO per unit = FFO/Weighted average number of
units issued and outstanding during the periodNote 6: NAV per unit = (Unitholders’ capital at period
end + Reserve for advanced depreciation in the next period (reserve - reversal) + Unrealized gain or loss on appraisal value at period end) ÷Units issued and outstanding at period end
Note 7: Figures in parentheses are annualized from monthly data.
Note 8: DSCR = (Operating income - Gain or loss on sale of investment properties + Depreciation and amortization)/Interest expense
36th Period 37th Period 38th Period 39th Period 40th Period
1H/2019 2H/2019 1H/2020 2H/2020 1H/2021
Operating revenues (Million yen) 38,529 39,134 38,591 41,747 46,213
Leasing revenues (Million yen) 38,050 39,134 38,591 40,359 44,688
Profits from dispositions (Million yen) 478 - - 1,388 1,524
NOI from leasing activities Note 1 (Million yen) 25,148 25,815 25,592 26,319 30,872
NOI yield Note 2 % 5.04 5.09 5.03 5.08 5.10
Income before income taxes (Million yen) 15,391 15,548 15,513 17,274 21,428
Net income (Million yen) 15,390 15,547 15,512 17,273 21,427
FFO Note 3 (Million yen) 22,132 22,768 22,680 23,066 27,340
AFFO Note 4 (Million yen) 18,771 18,369 17,706 17,094 20,562
Depreciation and amortization (Million yen) 7,221 7,221 7,167 7,181 7,399
Profits/losses from dispositions (Million yen) - - - - 38
Capital expenditures (Million yen) 3,361 4,399 4,973 5,971 6,777
Total assets (Million yen) 1,043,765 1,042,753 1,044,475 1,197,435 1,305,388
Interest-bearing debt (Million yen) 435,750 433,500 435,500 459,500 550,500
Net assets (Million yen) 541,338 541,975 541,940 666,620 669,870
Payment of dividends (Million yen) 14,910 15,547 15,512 18,177 19,307
Units issued and outstanding (period end) (Units) 1,412,000 1,412,000 1,412,000 1,652,500 1,652,500
Net assets per unit (JPY) 383,384 383,835 383,810 403,401 405,368
Distributions per unit (JPY) 10,560 11,011 10,986 11,000 11,684
FFO per unit Note 5 (JPY) 15,674 16,125 16,062 15,338 16,544
NAV per unit Note 6 (JPY) 558,516 566,917 572,136 564,249 573,646
ROA Note 7 (%) 1.49 (2.98) 1.49 (2.98) 1.49 (2.97) 1.54 (3.08) 1.71 (3.42)
ROE Note 7 (%) 2.85 (5.69) 2.87 (5.75) 2.86 (5.72) 2.86 (5.72) 3.21 (6.41)
LTV (ratio of interest-bearing debt to total assets) (%) 41.7 41.6 41.7 38.4 42.2
DSCR Note 8 (Times) 17.3 18.4 19.7 21.1 22.0
Payout ratio (%) 96.8 100.0 99.9 105.2 90.1
Operating days in the period (Days) 181 184 182 184 181
Investment properties (period end) (Properties) 71 71 71 74 75
Number of tenants (period end) (Properties) 1,483 1,472 1,464 1,551 1,606
Total rentable area (period end) (㎡) 1,091,311 1,080,595 1,082,105 1,106,692 1,216,543
Average occupancy rate during the period (%) 99.5 99.4 99.4 98.8 97.8

59
● 23 Wards of Tokyo
8 Property Portfolio Overview (1/2)(23 Wards of Tokyo)
Property NameTotal
RentableArea (㎡)
Total LeasedArea (㎡)
(incl. subleases)
Occupancy Rate at End of
Period (%)
Total Number
of Tenants
PML (%)
Shinjuku Mitsui Bldg. 102,718 99,686 97.0 89 1.3
Roppongi T-CUBE 34,740 19,147 55.1 52 1.6
GranTokyo South Tower 10,955 10,113 92.3 3 1.0
Nishi-Shinjuku Mitsui Bldg. 33,558 33,206 99.0 49 1.9
Celestine Shiba Mitsui Bldg. 38,011 38,011 100.0 9 1.9
NBF Shinagawa Tower 22,803 22,803 100.0 11 1.7
Shiba NBF Tower 24,730 24,730 100.0 27 2.3
NBF Platinum Tower 33,503 32,903 98.2 10 1.6
NBF COMODIO Shiodome 20,538 19,646 95.7 16 7.3
G-BASE TAMACHI 12,481 11,733 94.0 9 1.2
Toranomon Kotohira Tower 16,848 16,848 100.0 28 1.6
NBF Ochanomizu Bldg. 6,627 6,627 100.0 6 5.8
NBF Shibuya Garden Front 16,516 16,516 100.0 1 3.4
NBF Ginza Street Bldg. 3,440 3,440 100.0 1 8.2
Shinjuku Mitsui Bldg. No.2 14,828 14,321 96.6 47 1.7
Kowa Nishi-Shinbashi Bldg. B 10,347 10,234 98.9 20 2.0
River City M-SQUARE 16,261 16,261 100.0 7 4.0
NBF Toranomon Bldg. 10,089 9,972 98.8 12 8.4
Shinbashi M-SQUARE 5,390 5,390 100.0 9 2.6
NBF ALLIANCE 4,033 3,648 90.5 6 7.3
Yotsuya Medical Bldg. 7,481 7,415 99.1 41 5.6
NBF Shibuya East 4,999 4,641 92.8 5 4.4
NBF Shibakouen Bldg. 7,084 7,084 100.0 19 5.9
NBF Takanawa Bldg. 10,450 10,060 96.3 14 5.3
NBF Akasaka Sanno Square 5,258 5,258 100.0 6 9.9
Property NameTotal
RentableArea (㎡)
Total LeasedArea (㎡)
(incl. subleases)
Occupancy Rate at End of
Period (%)
Total Number
of Tenants
PML (%)
NBF Kandasudacho Bldg. 4,470 4,470 100.0 9 3.7
NBF Ogawamachi Bldg. 5,340 5,340 100.0 18 4.2
Sumitomo Densetsu Bldg. 5,971 5,971 100.0 1 5.2
NBF Higashi-Ginza Square 4,871 4,287 88.0 6 3.1
Panasonic Tokyo Shiodome Bldg. 4,577 4,577 100.0 1 1.6
Nihonbashi Kabuto-cho M-SQUARE 3,298 3,298 100.0 2 6.4
NBF Hatchobori Terrace 5,270 5,270 100.0 1 3.5
Ryukakusan Bldg. 5,332 5,332 100.0 15 4.4
Jingumae M-SQUARE 7,213 7,213 100.0 7 3.5
NBF Osaki Bldg. 74,425 74,425 100.0 2 0.9
Gate City Ohsaki 41,881 40,834 97.5 70 1.5
Nakanosakaue Sunbright Twin 32,533 32,533 100.0 20 1.4
NBF Toyosu Canal Front 36,654 36,654 100.0 15 4.2
Ueno East Tower 28,711 28,711 100.0 1 1.8
NBF Toyosu Garden Front 28,299 28,299 100.0 4 3.5
Osaki Bright Core - Bright Plaza 14,174 14,092 99.4 19 2.2
Nakameguro GT Tower 21,423 20,533 95.8 17 1.2
Osaki Bright Tower 6,070 6,043 99.6 11 0.9
NBF Ueno Bldg. 8,504 8,504 100.0 6 1.9
NBF Ikebukuro East 11,073 11,073 100.0 20 2.8
Higashi Gotanda Square 6,166 5,941 96.3 15 2.0
Toyo-cho Center Bldg. 11,294 11,294 100.0 1 5.6
NBF Ikebukuro Tower 5,642 5,642 100.0 17 3.9
NBF Ikebukuro City Bldg. 5,127 5,127 100.0 9 9.9
23 wards of Tokyo(49 properties)
852,008 825,157 96.8 784 -

60
8 Property Portfolio Overview (2/2)(Other Greater Tokyo & Other Cities)
●Other Greater Tokyo ●Other Cities
Property NameTotal
RentableArea (㎡)
Total LeasedArea (㎡)
(incl. subleases)
Occupancy Rate at End of
Period (%)
Total Number
of Tenants
PML (%)
Sapporo L-Plaza 11,396 11,396 100.0 14 0.3
NBF Sapporo Minami Nijo Bldg. 5,351 5,351 100.0 3 1.0
NBF Unix Bldg. 13,384 13,295 99.3 50 2.7
NBF Niigata Telecom Bldg. 10,192 9,983 97.9 31 4.9
Sumitomo Mitsui Banking Nagoya Bldg.
17,658 17,624 99.8 11 3.9
Nagoya Mitsui New Building 11,222 11,119 99.1 26 2.5
Nagoya Mitsui Main Building 12,989 12,015 92.5 65 3.7
NBF Nagoya Hirokoji Bldg. 9,876 9,876 100.0 23 7.1
Aqua Dojima NBF Tower 21,958 20,478 93.3 44 3.8
Nakanoshima Central Tower 17,291 16,924 97.9 28 3.2
Shinanobashi Mitsui Bldg. 25,314 25,240 99.7 59 5.3
Sakaisuji-Honmachi Center Bldg.
23,230 23,128 99.6 53 3.8
Sun Mullion NBF Tower 14,954 14,954 100.0 29 1.8
NBF Hiroshima Tatemachi Bldg.
5,567 5,567 100.0 30 4.3
Hiroshima Fukuromachi Bldg. 3,927 3,927 100.0 16 3.5
NBF Matsuyama Nichigin-mae Bldg.
5,984 5,984 100.0 21 4.0
Hakata Gion M-SQUARE 14,328 14,150 98.8 20 0.0
NBF Kumamoto Bldg. 7,931 7,931 100.0 14 3.0
Other Cities (18 properties) 232,550 228,941 98.4 537 -
Total (75 properties) 1,216,543 1,182,147 97.2 1,606 1.4
Property NameTotal
RentableArea (㎡)
Total LeasedArea (㎡)
(incl. subleases)
Occupancy Rate at End of
Period (%)
Total Number
of Tenants
PML (%)
Chofu South Gate Bldg. 13,762 13,762 100.0 1 4.3
Shin-Kawasaki Mitsui Bldg. 39,837 37,656 94.5 22 2.2
Yokohama ST Bldg. 20,087 19,752 98.3 97 1.7
Parale Mitsui Bldg. 12,545 12,455 99.3 30 2.8
Tsukuba Mitsui Bldg. 16,833 15,598 92.7 56 0.5
S-ino Omiya North Wing 20,698 20,601 99.5 41 1.9
NBF Urawa Bldg. 3,455 3,455 100.0 12 10.2
NBF Matsudo Bldg. 4,770 4,770 100.0 26 7.8
Other Greater Tokyo(8 properties)
131,986 128,049 97.0 285 -
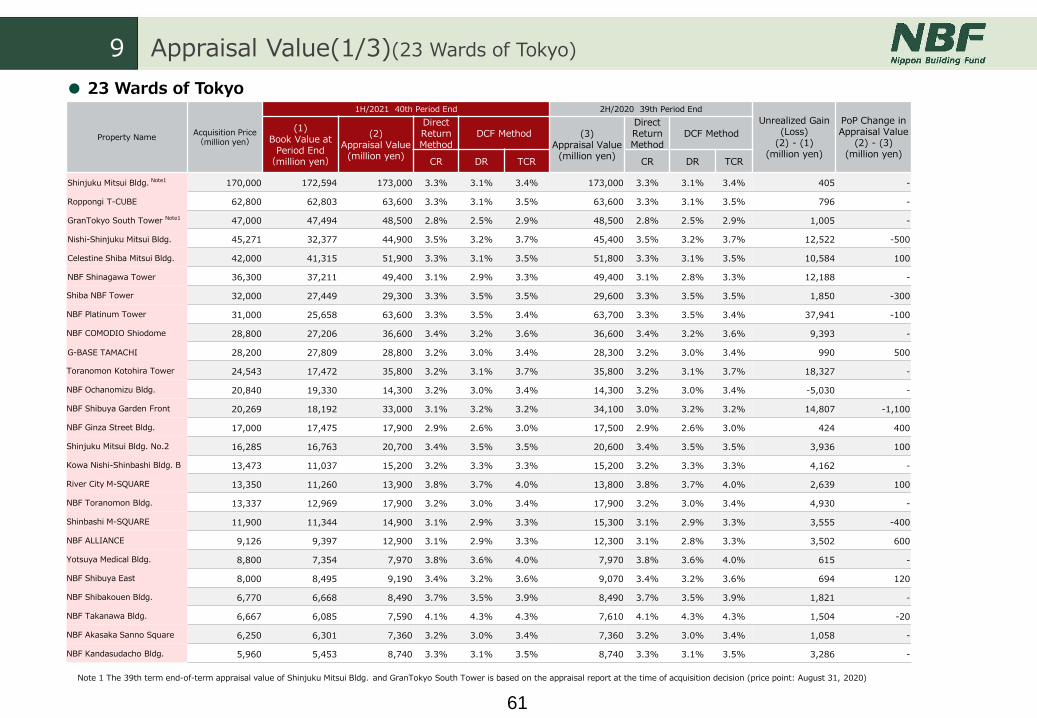
61
● 23 Wards of Tokyo
9 Appraisal Value(1/3)(23 Wards of Tokyo)
Property NameAcquisition Price(million yen)
1H/2021 40th Period End 2H/2020 39th Period End
Unrealized Gain (Loss)
(2) - (1)(million yen)
PoP Change in Appraisal Value
(2) - (3)(million yen)
(1)Book Value at
Period End(million yen)
(2)Appraisal Value
(million yen)
Direct Return Method
DCF Method (3)Appraisal Value
(million yen)
Direct Return Method
DCF Method
CR DR TCR CR DR TCR
Shinjuku Mitsui Bldg. Note1 170,000 172,594 173,000 3.3% 3.1% 3.4% 173,000 3.3% 3.1% 3.4% 405 -
Roppongi T-CUBE 62,800 62,803 63,600 3.3% 3.1% 3.5% 63,600 3.3% 3.1% 3.5% 796 -
GranTokyo South Tower Note1 47,000 47,494 48,500 2.8% 2.5% 2.9% 48,500 2.8% 2.5% 2.9% 1,005 -
Nishi-Shinjuku Mitsui Bldg. 45,271 32,377 44,900 3.5% 3.2% 3.7% 45,400 3.5% 3.2% 3.7% 12,522 -500
Celestine Shiba Mitsui Bldg. 42,000 41,315 51,900 3.3% 3.1% 3.5% 51,800 3.3% 3.1% 3.5% 10,584 100
NBF Shinagawa Tower 36,300 37,211 49,400 3.1% 2.9% 3.3% 49,400 3.1% 2.8% 3.3% 12,188 -
Shiba NBF Tower 32,000 27,449 29,300 3.3% 3.5% 3.5% 29,600 3.3% 3.5% 3.5% 1,850 -300
NBF Platinum Tower 31,000 25,658 63,600 3.3% 3.5% 3.4% 63,700 3.3% 3.5% 3.4% 37,941 -100
NBF COMODIO Shiodome 28,800 27,206 36,600 3.4% 3.2% 3.6% 36,600 3.4% 3.2% 3.6% 9,393 -
G-BASE TAMACHI 28,200 27,809 28,800 3.2% 3.0% 3.4% 28,300 3.2% 3.0% 3.4% 990 500
Toranomon Kotohira Tower 24,543 17,472 35,800 3.2% 3.1% 3.7% 35,800 3.2% 3.1% 3.7% 18,327 -
NBF Ochanomizu Bldg. 20,840 19,330 14,300 3.2% 3.0% 3.4% 14,300 3.2% 3.0% 3.4% -5,030 -
NBF Shibuya Garden Front 20,269 18,192 33,000 3.1% 3.2% 3.2% 34,100 3.0% 3.2% 3.2% 14,807 -1,100
NBF Ginza Street Bldg. 17,000 17,475 17,900 2.9% 2.6% 3.0% 17,500 2.9% 2.6% 3.0% 424 400
Shinjuku Mitsui Bldg. No.2 16,285 16,763 20,700 3.4% 3.5% 3.5% 20,600 3.4% 3.5% 3.5% 3,936 100
Kowa Nishi-Shinbashi Bldg. B 13,473 11,037 15,200 3.2% 3.3% 3.3% 15,200 3.2% 3.3% 3.3% 4,162 -
River City M-SQUARE 13,350 11,260 13,900 3.8% 3.7% 4.0% 13,800 3.8% 3.7% 4.0% 2,639 100
NBF Toranomon Bldg. 13,337 12,969 17,900 3.2% 3.0% 3.4% 17,900 3.2% 3.0% 3.4% 4,930 -
Shinbashi M-SQUARE 11,900 11,344 14,900 3.1% 2.9% 3.3% 15,300 3.1% 2.9% 3.3% 3,555 -400
NBF ALLIANCE 9,126 9,397 12,900 3.1% 2.9% 3.3% 12,300 3.1% 2.8% 3.3% 3,502 600
Yotsuya Medical Bldg. 8,800 7,354 7,970 3.8% 3.6% 4.0% 7,970 3.8% 3.6% 4.0% 615 -
NBF Shibuya East 8,000 8,495 9,190 3.4% 3.2% 3.6% 9,070 3.4% 3.2% 3.6% 694 120
NBF Shibakouen Bldg. 6,770 6,668 8,490 3.7% 3.5% 3.9% 8,490 3.7% 3.5% 3.9% 1,821 -
NBF Takanawa Bldg. 6,667 6,085 7,590 4.1% 4.3% 4.3% 7,610 4.1% 4.3% 4.3% 1,504 -20
NBF Akasaka Sanno Square 6,250 6,301 7,360 3.2% 3.0% 3.4% 7,360 3.2% 3.0% 3.4% 1,058 -
NBF Kandasudacho Bldg. 5,960 5,453 8,740 3.3% 3.1% 3.5% 8,740 3.3% 3.1% 3.5% 3,286 -
Note 1 The 39th term end-of-term appraisal value of Shinjuku Mitsui Bldg. and GranTokyo South Tower is based on the appraisal report at the time of acquisition decision (price point: August 31, 2020)

62
9 Appraisal Value(2/3)(23 Wards of Tokyo)
Property NameAcquisition Price(million yen)
1H/2021 40th Period End 2H/2020 39th Period End
Unrealized Gain (Loss)
(2) - (1)(million yen)
PoP Change in Appraisal Value
(2) - (3)(million yen)
(1)Book Value at
Period End(million yen)
(2)Appraisal Value
(million yen)
Direct Return Method
DCF Method (3)Appraisal Value
(million yen)
Direct Return Method
DCF Method
CR DR TCR CR DR TCR
NBF Ogawamachi Bldg. 5,420 5,487 7,000 3.5% 3.3% 3.7% 7,000 3.5% 3.3% 3.7% 1,512 0
Sumitomo Densetsu Bldg. 5,365 4,737 6,030 3.8% 4.0% 4.0% 6,070 3.8% 4.0% 4.0% 1,292 -40
NBF Higashi-Ginza Square 5,200 4,241 8,270 3.5% 3.3% 3.7% 8,270 3.5% 3.3% 3.7% 4,028 0
Panasonic Tokyo Shiodome Bldg. 5,075 4,774 5,980 3.2% 3.0% 3.4% 5,960 3.2% 3.0% 3.4% 1,205 20
Nihonbashi Kabuto-cho M-SQUARE 4,850 4,368 5,420 3.4% 3.2% 3.6% 5,420 3.4% 3.2% 3.6% 1,051 0
NBF Hatchobori Terrace 4,528 4,706 5,930 3.8% 3.7% 4.0% 5,690 3.9% 3.7% 4.0% 1,223 240
Ryukakusan Bldg. 4,050 4,148 4,820 3.8% 3.6% 4.0% 4,960 3.8% 3.6% 4.0% 671 -140
Jingumae M-SQUARE Note13,700 2,898 4,970 3.5% 3.3% 3.8% 4,970 3.5% 3.3% 3.8% 2,071 0
NBF Osaki Bldg. 66,660 62,576 84,100 3.3% 3.1% 3.5% 86,600 3.2% 3.0% 3.4% 21,523 -2,500
Gate City Ohsaki 57,281 48,242 71,100 3.4% 3.2% 3.6% 71,100 3.4% 3.2% 3.6% 22,857 0
Nakanosakaue Sunbright Twin 41,230 35,914 31,500 3.7% 3.3% 3.9% 31,400 3.7% 3.3% 3.9% -4,414 100
NBF Toyosu Canal Front 35,200 27,751 38,600 3.7% 3.5% 3.9% 38,600 3.7% 3.4% 3.9% 10,848 0
Ueno East Tower Note2
35,000 33,814 38,500 3.5% 3.3% 3.7%22,600 3.6% 3.4% 3.8%
4,685 1,600 (Additional acquisition) 14,300 3.8% 3.6% 4.0%
NBF Toyosu Garden Front 25,018 21,686 29,800 3.8% 3.6% 4.0% 29,800 3.8% 3.6% 4.0% 8,113 0
Osaki Bright Core - Bright Plaza
24,380 23,840 25,500 3.2% 3.0% 3.4% 25,000 3.2% 3.0% 3.4% 1,659 500
Nakameguro GT Tower 23,856 16,392 23,000 3.5% 3.6% 3.7% 23,000 3.5% 3.6% 3.7% 6,607 0
Osaki Bright Tower 13,970 14,015 14,200 3.2% 3.0% 3.4% 14,200 3.2% 3.0% 3.4% 184 0
NBF Ueno Bldg. 10,400 8,546 9,840 3.7% 3.5% 3.9% 9,840 3.7% 3.4% 3.9% 1,293 0
NBF Ikebukuro East 8,630 9,031 13,500 4.0% 3.8% 4.2% 13,500 4.0% 3.8% 4.2% 4,468 0
Higashi Gotanda Square 8,350 7,218 8,620 3.5% 3.3% 3.7% 8,620 3.5% 3.3% 3.7% 1,401 0
Toyo-cho Center Bldg. 7,800 8,594 8,810 3.8% 3.6% 4.0% 8,810 3.8% 3.6% 4.0% 215 0
NBF Ikebukuro Tower 4,695 4,048 5,760 3.9% 3.7% 4.1% 5,750 3.9% 3.7% 4.1% 1,711 10
NBF Ikebukuro City Bldg. 4,428 4,014 5,890 3.8% 3.6% 4.0% 5,890 3.8% 3.6% 4.0% 1,875 0
23 wards of Tokyo(49 properties)
1,131,028 1,048,574 1,292,580 3.4% - - 1,293,290 3.4% - - 244,005 -710
Note 1 NBF subleases the land for Jingumae M-SQUARE. Therefore, data in the CR column are discount rates for direct capitalization using the inwood method. Data in the DR column are discount rates foryears one through ten. Data in the TCR column are resale discount rates (from year 11 to contract expiration).
Note2 The appraisal value of Ueno East Tower at the 39th period end is stated in the upper row existing equity (60%) and the lower row additional acquisition (40%, price point: January 31, 2021).

63
●Other Greater Tokyo / Other Cities
9 Appraisal Value(3/3)(Other Greater Tokyo & Other Cities)
Property NameAcquisition Price(million yen)
1H/2021 40th Period End 2H/2020 39th Period End
Unrealized Gain (Loss)
(2) - (1)(million yen)
PoP Change in Appraisal Value
(2) - (3)(million yen)
(1)Book Value at
Period End(million yen)
(2)Appraisal
Value(million yen)
Direct Return Method
DCF Method (3)Appraisal Value (million yen)
Direct Return Method
DCF Method
CR DR TCR CR DR TCR
Chofu South Gate Bldg. 9,320 7,833 9,950 4.6% 4.4% 4.8% 9,940 4.6% 4.4% 4.8% 2,116 10
Shin-Kawasaki Mitsui Bldg. 25,820 21,599 23,300 4.6% 4.4% 4.8% 23,700 4.6% 4.4% 4.8% 1,700 -400
Yokohama ST Bldg. 13,529 12,356 17,100 3.8% 3.9% 4.0% 17,100 3.8% 3.9% 4.0% 4,743 0
Parale Mitsui Bldg. 3,800 3,025 4,790 4.3% 4.1% 4.5% 4,600 4.4% 4.2% 4.6% 1,764 190
Tsukuba Mitsui Bldg. 8,875 6,931 8,490 4.8% 4.6% 5.0% 8,680 4.8% 4.6% 5.0% 1,558 -190
S-ino Omiya North Wing 16,816 13,016 22,600 4.2% 4.3% 4.4% 22,600 4.2% 4.3% 4.4% 9,583 0
NBF Urawa Bldg. 2,000 1,743 2,210 4.5% 4.3% 4.7% 2,160 4.6% 4.4% 4.8% 466 50
NBF Matsudo Bldg. 2,455 2,200 2,520 4.6% 4.6% 4.8% 2,520 4.6% 4.6% 4.8% 319 0
Other Greater Tokyo(8 properties)
82,616 68,708 90,960 4.4% - - 91,300 4.4% - - 22,251 -340
Sapporo L-Plaza 4,404 2,894 7,890 4.3% 4.4% 4.5% 7,890 4.3% 4.4% 4.5% 4,995 0
NBF Sapporo Minami Nijo Bldg. 1,870 1,568 1,490 4.8% 4.6% 4.9% 1,510 4.8% 4.6% 4.9% -78 -20
NBF Unix Bldg. 4,028 2,704 3,390 5.4% 5.4% 5.6% 3,390 5.4% 5.4% 5.6% 685 0
NBF Niigata Telecom Bldg. 3,957 3,272 2,750 5.2% 5.0% 5.4% 2,750 5.2% 5.0% 5.4% -522 0
Sumitomo Mitsui Banking Nagoya Bldg. 14,900 14,460 16,700 4.1% 3.9% 4.3% 16,700 4.2% 4.0% 4.4% 2,239 0
Nagoya Mitsui New BuildingNote113,200 13,383 13,600 3.8% 3.6% 4.0% 13,500 3.7% 3.5% 3.9% 216 100
Nagoya Mitsui Main Building Note113,050 13,365 13,400 4.2% 3.9% 4.3% 13,300 4.2% 3.9% 4.3% 34 100
NBF Nagoya Hirokoji Bldg. 7,232 6,157 6,790 4.1% 3.9% 4.3% 6,790 4.2% 4.0% 4.4% 632 0
Aqua Dojima NBF Tower 17,810 15,094 20,500 3.7% 3.5% 3.9% 19,800 3.8% 3.6% 4.0% 5,405 700
Nakanoshima Central Tower 14,900 13,538 18,900 3.4% 3.5% 3.6% 18,900 3.4% 3.5% 3.6% 5,361 0
Shinanobashi Mitsui Bldg. 14,400 10,461 13,800 4.4% 4.2% 4.6% 13,600 4.5% 4.3% 4.7% 3,338 200
Sakaisuji-Honmachi Center Bldg. 12,700 12,901 14,300 4.0% 3.8% 4.2% 14,400 4.1% 3.9% 4.3% 1,398 -100
Sun Mullion NBF Tower 10,500 7,447 6,850 4.2% 4.3% 4.4% 6,800 4.2% 4.3% 4.4% -597 50
NBF Hiroshima Tatemachi Bldg. 2,930 2,552 2,530 4.9% 5.0% 5.1% 2,530 4.9% 5.0% 5.1% -22 0
Hiroshima Fukuromachi Bldg. 2,215 1,688 2,340 4.8% 4.9% 5.0% 2,520 4.8% 4.9% 5.0% 651 -180
NBF Matsuyama Nichigin-mae Bldg. 3,310 2,810 3,830 5.6% 5.4% 5.8% 3,830 5.6% 5.4% 5.8% 1,019 0
Hakata Gion M-SQUARE 8,000 6,277 12,100 4.4% 4.2% 4.6% 11,700 4.5% 4.3% 4.7% 5,822 400
NBF Kumamoto Bldg. 4,500 3,539 4,090 5.4% 5.2% 5.6% 4,040 5.5% 5.3% 5.7% 550 50
Other Cities (18 properties) 153,908 134,120 165,250 4.5% - - 163,950 4.5% - - 31,129 1,300
Total 1,367,552 1,251,402 1,548,790 3.5% - - 1,548,540 3.5% - - 297,387 250
Note1 Appraisal value of the Nagoya Mitsui New Building & Nagoya Mitsui Main Building as of the 38th Period end is the appraisal value as of Aug 31,2020, when NBF decided to acquire the property.

64
●23 Wards of Tokyo
10 Revenue by Property (1/3)(23 Wards of Tokyo)
(million yen)
Shinjuku Mitsui Bldg.
Roppongi T-CUBE
GranTokyoSouth Tower
Nishi-Shinjuku
Mitsui Bldg.
Celestine Shiba Mitsui
Bldg.
NBFShinagawa
Tower(Note1)
Shiba NBF Tower
NBF Platinum
Tower
NBF Minami-Aoyama
Bldg.
NBF COMODIO Shiodome
G-BASETAMACHI
ToranomonKotohiraTower
NBF Ochanomizu
Bldg.
NBF Shibuya
Garden Front(Note1)
NBF Ginza Street
Bldg.(Note1)
Shinjuku Mitsui Bldg.
No.2
Kowa Nishi-
ShinbashiBldg. B
River City M-SQUARE
Operating revenues 4,812 1,342 1,006 1,283 1,470 998 1,410 239 871 588 936 304 597 404 597
Rental revenues 4,542 1,284 828 1,250 1,380 953 1,335 211 822 560 904 278 557 374 559
Other revenues 270 58 178 33 90 44 74 28 49 28 32 25 39 30 38
Operating expenses 894 643 237 554 606 680 541 139 358 267 487 164 415 211 323
Property taxes - 175 - 140 151 57 91 45 64 48 35 22 72 54 57
Expenses: 787 293 144 206 301 312 281 62 167 83 318 54 155 86 153
Water, lighting and heating expenses 223 58 11 - 88 41 69 13 34 22 41 15 22 21 28
Building maintenance costs 455 206 37 195 202 91 135 17 59 21 93 20 71 33 81
Office management fees 3 3 54 3 3 46 68 10 43 29 3 14 27 18 27
Repair expenses 91 22 39 5 6 38 4 10 24 8 23 1 26 5 15
Other expenses 13 2 2 2 1 93 3 10 5 1 157 1 6 8 1
Depreciation and amortization 106 174 93 207 153 311 168 30 126 135 133 86 187 69 111
Leasing income 3,917 698 769 729 864 619 317 868 100 513 320 449 140 497 275 182 192 274
Net operating income 4,024 873 862 937 1,018 799 628 1,037 130 639 455 582 227 588 280 369 262 386
NBF Toranomon
Bldg
ShinbashiM-SQUARE
NBF ALLIANCE
YotsuyaMedical Bldg.
NBF Shibuya East
NBF Shibakouen
Bldg.
NBF Takanawa
Bldg.
NBF AkasakaSannoSquare
NBF Kandasudacho Bldg.
NBF Ogawamachi
Bldg.
Sumitomo Densetsu
Bldg.(Note1)
NBF Higashi-
Ginza Square
Panasonic Tokyo
ShiodomeBldg.
(Note1)
NihonbashiKabuto-choM-SQUARE
(Note1)
NBFShinkawa
Bldg.
NBF Hatchobori
Terrace(Note1)
RyukakusanBldg.
JingumaeM-SQUARE
Operating revenues 463 369 271 233 183 278 287 200 201 199 182 2 164 374
Rental revenues 441 355 261 213 171 245 261 182 189 197 166 1 151 358
Other revenues 22 14 9 19 11 33 25 17 12 2 15 1 13 16
Operating expenses 204 156 111 123 132 142 137 107 100 239 87 219 102 297
Property taxes 85 38 32 24 18 26 26 36 14 24 17 6 21 13
Expenses: 75 69 54 62 69 47 60 39 32 183 45 138 43 213
Water, lighting and heating expenses 15 11 6 16 6 13 20 8 7 - 8 5 13 12
Building maintenance costs 36 22 12 36 15 17 20 16 13 30 20 6 19 22
Office management fees 21 18 13 3 8 13 14 9 10 3 8 3 7 14
Repair expenses - 16 18 3 37 1 1 0 0 149 3 123 0 2
Other expenses 1 0 3 3 0 1 2 4 0 0 4 0 3 161
Depreciation and amortization 42 49 24 36 44 68 50 31 53 32 24 74 37 71
Leasing income 258 212 159 109 50 136 149 93 100 -40 91 95 86 69 -216 -212 62 77
Net operating income 301 262 184 145 94 205 200 124 154 -8 134 120 107 100 -142 -163 99 148

65
●Other Greater Tokyo
●23 Wards of Tokyo
10 Revenue by Property (2/3)(23 Wards of Tokyo)
(million yen)
(million yen)
Chofu South Gate Bldg.
(Note1)
Shin-Kawasaki
Mitsui Bldg.
Yokohama ST Bldg.
Parale Mitsui Bldg.
Tsukuba Mitsui Bldg.
S-ino Omiya North Wing
NBF Urawa Bldg.
NBF Matsudo Bldg.
Operating revenues 1,059 691 304 428 827 104 120
Rental revenues 965 626 293 393 752 90 106
Other revenues 93 64 10 35 74 13 14
Operating expenses 667 387 138 312 393 47 67
Property taxes 87 52 27 25 50 6 7
Expenses: 334 164 74 111 257 22 32
Water, lighting and heating expenses 83 40 39 33 36 6 7
Building maintenance costs 139 65 28 53 53 9 15
Office management fees 51 39 3 20 42 5 5
Repair expenses 55 13 1 0 124 1 2
Other expenses 4 5 1 3 1 0 1
Depreciation and amortization 245 171 36 175 84 17 27
Leasing income 139 392 303 165 115 434 57 52
Net operating income 261 637 474 202 291 518 74 80
NBF Osaki Bldg.(Note1)
Gate City Ohsaki
Nakanosakaue Sunbright
Twin
NBF ToyosuCanal Front
Ueno East Tower
(Note1)
NBF ToyosuGarden Front
Osaki Bright Core - Bright
Plaza
NakameguroGT Tower
Osaki Bright Tower(Note1)
NBF Ueno Bldg.
NBF Ikebukuro
East
Higashi GotandaSquare
Toyo-choCenter Bldg.
(Note1)
NBF Ikebukuro
Tower
NBFIkebukuroCity Bltg.
Operating revenues 2,104 1,052 1,040 823 657 912 299 410 222 192 177
Rental revenues 1,898 1,007 933 751 609 832 277 384 219 175 163
Other revenues 206 44 106 72 47 80 21 25 3 17 14
Operating expenses 882 593 440 374 330 455 185 182 129 105 79
Property taxes 183 125 71 55 60 101 23 24 25 14 16
Expenses: 449 250 217 172 111 216 73 80 39 48 37
Water, lighting and heating expenses 82 42 72 62 18 49 17 15 - 10 8
Building maintenance costs 279 120 90 64 85 156 38 40 33 24 15
Office management fees 3 48 50 39 3 3 13 20 3 9 8
Repair expenses 71 35 2 3 3 6 1 0 0 3 4
Other expenses 12 4 2 1 0 0 1 2 1 1 0
Depreciation and amortization 250 217 150 147 158 138 89 77 65 41 26
Leasing income 1,028 1,222 459 600 373 449 326 456 191 113 227 92 127 87 98
Net operating income 1,431 1,472 676 750 585 596 485 594 264 202 305 158 169 129 124

66
●Other Cities
10 Revenue by Property(3/3)(Other Cities)
(million yen)
Sapporo L-Plaza
NBF Sapporo Minami Nijo
Bldg.
NBF Unix Bldg.
NBF Niigata Telecom
Bldg.
Sumitomo Mitsui
Banking Nagoya Bldg.
Nagoya Mitsui New
Building
Nagoya Mitsui Main
Building
NBF Nagoya Hirokoji Bldg.
Aqua DojimaNBF Tower
NakanoshimaCentral Tower
ShinanobashiMitsui Bldg.
Sakaisuji-Honmachi
Center Bldg.
Sun Mullion NBF Tower
NBF Hiroshima Tatemachi
Bldg.
Hiroshima Fukuromachi
Bldg.
NBF Matsuyama
Nichigin-maeBldg.
Hakata GionM-SQUARE
NBF Kumamoto
Bldg.Total
Operating revenues 358 109 272 194 653 425 480 248 646 583 588 549 356 129 103 167 462 188 44,688
Rental revenues 290 95 241 170 577 397 442 226 578 521 533 493 314 114 94 144 417 171 41,571
Other revenues 68 13 31 23 75 27 37 22 68 62 55 55 41 15 8 22 44 16 3,117
Operating expenses 158 125 154 114 328 188 171 140 414 342 286 338 251 81 50 101 219 108 21,215
Property taxes 19 12 27 18 67 42 55 28 76 59 64 63 35 14 8 8 24 11 3,615
Expenses: 106 91 83 57 148 97 101 61 159 139 124 159 95 33 23 49 101 40 10,200
Water, lighting and heating expenses 30 12 31 19 39 23 19 16 49 33 45 36 26 9 6 9 34 11 2,164
Building maintenance costs 55 17 37 25 72 69 68 18 65 65 69 71 48 15 8 22 39 19 4,583
Office management fees 16 4 12 8 30 3 3 12 30 27 3 24 16 5 4 7 23 9 1,426
Repair expenses 1 55 0 0 4 1 7 12 7 7 5 13 3 1 1 6 3 - 1,364
Other expenses 1 1 2 2 2 0 2 0 6 5 0 13 1 0 1 2 0 0 661
Depreciation and amortization 32 22 43 38 112 48 14 50 178 143 97 116 120 34 19 44 92 56 7,399
Leasing income 200 -16 118 80 324 236 309 107 232 240 301 210 104 48 52 65 243 80 23,473
Net operating income 232 5 161 118 436 285 323 158 410 384 399 326 224 82 72 110 336 136 30,872
Note1: Only leasing income and net operating income data are available.NBF has not received consent from tenants or co-owners of these properties to disclose rental revenue and is therefore unable to disclose it.

67
11 Portfolio Map

68
13
Roppongi T-CUBE
Location1-1, Roppongi3-chome,
Minato-ku, Tokyo
Site Area 6,053.62㎡
Floor area of building
60,978.17㎡
Structure B1/27F
Completion Sep. 30, 2003
Nishi-Shinjuku Mitsui Bldg.
Location24-1, Nishi-Shinjuku
6-chome,
Shinjuku-ku, Tokyo
Site Area 10,014.02㎡
Floor area of building
84,634.02㎡
Structure B2/27F
Completion Apr. 28, 1999
Celestine Shiba Mitsui Bldg.
Location23-1, Shiba 3-chome,
Minato-ku, Tokyo
Site Area 7,679.46㎡
Floor area of building
59,918.71㎡
Structure B2/17F
Completion Apr. 1, 2002
NBF Shinagawa Tower
Location16-5, Konan 2-chome,
Minato-ku, Tokyo
Site Area 20,476.14㎡
Floor area of building
222,346.26㎡
Structure B3/33F
Completion Apr. 1, 2003
NBF COMODIO Shiodome
Location14-1, Higashi-Shinbashi
2-chome, Minato-ku, Tokyo
Site Area 3,862.61㎡
Floor area of building
28,796.14㎡
Structure B1/9F
Completion Jul. 10, 2006
NBF Platinum Tower
Location17-3, Shirokane1-chome,
Minato-ku, Tokyo
Site Area 4,373.93㎡
Floor area of building
48,762.65㎡
Structure B2/26F
Completion Nov. 21, 2005
Shiba NBF Tower
Location1-30, ShibaDaimon
1-chome, Minato-ku, Tokyo
Site Area 6,471.72㎡
Floor area of building
44,437.17㎡
Structure B3/18F
Completion Oct. 1, 1986
Toranomon Kotohira Tower
Location2-8, Toranomon1-chome,
Minato-ku,Tokyo
Site Area 2,291.42㎡
Floor area of building
29,353.21㎡
Structure B3/26F
Completion Nov. 13, 2004
NBF Ochanomizu Bldg.
Location
3-11, 31, 32, 34, 35, 36 Kandasurugadai2-chome,
Chiyoda-ku, Tokyo
Site Area 1,767.94㎡
Floor area of building
9,258.36㎡
Structure B1/11F
Completion Mar. 26, 2009
NBF Shibuya Garden Front
Location 25-18, 26-3, Shibuya
3-chome, Shibuya-ku, Tokyo
Site Area 3,750.71㎡
Floor area of building
NBF Shibuya Garden Front:22,393.57㎡, NBF Shibuya Garden Front Annex:256.97㎡
Structure
NBF Shibuya Garden Front:B1/14F,NBF Shibuya Garden Front Annex: 1F
Completion Sep. 30, 2003
NBF Ginza Street Bldg.
Location7-5, Ginza 5-chome,
Chuo-ku, Tokyo
Site Area 426.60㎡
Floor area of building
3,408.79㎡
Structure B1/10F
Completion Jun. 12, 1990
Expansion: Sep. 30, 1997
Shinjuku Mitsui Bldg. No.2
Location2-11, Nishi-Shinjuku
3-chome, Shinjuku-ku, Tokyo
Site Area 2,980.64㎡
Floor area of building
27,685.90㎡
Structure B4/18F
Completion Oct. 19, 1983
River City M-SQUARE
Location1-6, Tsukuda 2-chome,
Chuo-ku, Tokyo
Site Area 4,808.71㎡
Floor area of building
26,439.03㎡
Structure B1/8F
Completion Jan. 15, 2010
NBF Toranomon Bldg.
Location6-21, Nishi-Shinbashi1-chome, Minato-ku, Tokyo
Site Area 1,804.45㎡
Floor area of building
18,082.47㎡
Structure B5/9F
Completion Apr. 17, 1963
Expansion: Apr. 25, 1971
Kowa Nishi-Shinbashi Bldg. B
Location14-1, Nishi-Shinbashi
2-chome, Minato-ku, Tokyo
Site Area 2,449.40㎡
Floor area of building
20,180.42㎡
Structure B2/16F
Completion Aug. 29, 1994
Shinbashi M-SQUARE
Location10-6, Shinbashi1-chome,
Minato-ku, Tokyo
Site Area 920.32㎡
Floor area of building
7,259.01㎡
Structure B1/11F
Completion Oct. 31, 2011
NBF ALLIANCE
Location2-1, Minami-Aoyama
5-chome, Minato-ku, Tokyo
Site Area 1,673.27㎡
Floor area of building
6,214.73㎡
Structure B1/5F
Completion Jan. 25, 1989
G-BASE TAMACHI
Location 29-11,Shiba
5-chome, Minato-ku,Tokyo
Site Area 2,445.37㎡
Floor area of building
17,764.27㎡
Structure 18F
Completion Jan. 10, 2018
9Shinjuku Mitsui Bldg.
LocationNishi-Shinjuku 2-1-1, Shinjuku-ku, Tokyo
Site area 14,449.38㎡
Floor area of building
179,696.87㎡
Structure B3/56F
Completion Sep. 30, 1974
GranTokyo South Tower
LocationMarunouchi 1-9-2, Chiyoda-ku, Tokyo
Site area 20,778.92㎡
Floor area of building
137,662.87㎡
Structure B4/42F
Completion Oct. 10, 2007
1
2
113
124
5
6
7
8
10
13
15
14
7
16
18
4 8
17
19
Properties (1/4)(23 Wards of Tokyo)12
20

69
NBF Toyosu Canal Front
Location6-52, Toyosu 5-chome,
Koto-ku, Tokyo
Site Area 14,335.60㎡
Floor area of building
46,002.37㎡
Structure 11F
Completion Sep. 7, 2004
NBF Toyosu Garden Front
Location6-15, Toyosu 5-chome,
Koto-ku, Tokyo
Site Area 12,551.33㎡
Floor area of building
35,621.93㎡
Structure 9F
Completion Sep. 7, 2007
Gate City Ohsaki
Location11-1, 2, 6, Osaki 1-chome,
Shinagawa-ku, Tokyo
Site Area 42,509.31㎡
Floor area of building
287,349.75㎡
Structure B4/24F
Completion Jan. 6, 1999
Nakanosakaue Sunbright Twin
Location46-1, 4, Honcho 2-chome,
Nakano-ku, Tokyo
Site Area 10,331.90㎡
Floor area of building
SunbrightTwin:63,396.95㎡SunbrightAnnex:2,463.94㎡
Structure
Sunbright Twin: B2/30F,Sunbright Annex: B1/5F
Completion Sep. 30, 1996
Jingumae M-SQUARE
Location4-16, Jingumae 1-chome,
Shibuya-ku, Tokyo
Site Area 2,543.35㎡
Floor area of building
10,123.45㎡
Structure B1/10F
Completion Feb. 27, 2009
NBF Osaki Bldg.
Location10-1, Osaki 2-chome,
Shinagawa-ku, Tokyo
Site Area 16,558.52㎡
Floor area of building
123,603.89㎡
Structure B2/25F
Completion Feb. 24, 2011
Nihonbashi Kabuto-cho M-SQUARE
Location1-4, NihonbashiKabutocho,
Chuo-ku, Tokyo
Site Area 808.05㎡
Floor area of building
5,053.97㎡
Structure B1/8F
Completion Jun. 15, 2009
Ryukakusan Bldg.
Location5-12, Higashi-Kanda 2-chome,
Chiyoda-ku, Tokyo
Site Area 1,545.95㎡
Floor area of building
10,073.78㎡
Structure B1/9F
Completion Nov. 30, 1991
Panasonic Tokyo Shiodome Bldg.
Location5-1, Higashi-Shinbashi
1-chome, Minato-ku, Tokyo
Site Area 19,708.36㎡
Floor area of building
263,035.06㎡
Structure B4/43F
Completion Jan. 9, 2003
NBF Ogawamachi Bldg.
Location3-1, Kanda-Ogawamachi
1-chome, Chiyoda-ku, Tokyo
Site Area 1,114.85㎡
Floor area of building
8,350.32㎡
Structure B1/10F
Completion Oct. 27, 1986
Sumitomo Densetsu Bldg.
Location12-15, Mita 3-chome,
Minato-ku, Tokyo
Site Area 1,458.95㎡
Floor area of building
9,185.13㎡
Structure B1/12F
Completion Jun. 27, 1991
NBF Higashi-Ginza Square
Location13-14, Tsukiji 1-chome,
Chuo-ku, Tokyo
Site Area 940.09㎡
Floor area of building
7,152.99㎡
Structure B1/9F
Completion Feb. 28, 2005
NBF Kandasudacho Bldg.
Location3-1, Kandasudacho
2-chome, Chiyoda-ku, Tokyo
Site Area 730.71㎡
Floor area of building
5,930.20㎡
Structure 9F
Completion Jul. 30, 2013
NBF Takanawa Bldg.
Location3-13, Takanawa 1-chome,
Minato-ku, Tokyo
Site Area 2,618.77㎡
Floor area of building
12,847.59㎡
Structure 9F
Completion Nov. 26, 1987
NBF Akasaka Sanno Square
Location2-12, Akasaka 2-chome
Minato-ku, Tokyo
Site Area 926.63㎡
Floor area of building
7,427.94㎡
Structure B1/8F
Completion Sep. 7, 1989
NBF Shibuya East
Location3-5, Shibuya 3-chome,
Shibuya-ku, Tokyo
Site Area 1,418.21㎡
Floor area of building
7,615.76㎡
Structure B2/8F
Completion Jan. 31, 1992
NBF Shibakouen Bldg.
Location2-18, Shiba 3-chome,
Minato-ku, Tokyo
Site Area 1,895.59㎡
Floor area of building
11,661.69㎡
Structure B2/12F
Completion Aug. 17, 1990
NBF Hatchobori TerraceLocation 31-1, 31-7, 20-15,
Shinkawa 2-chome, Chuo-ku, Tokyo
Site Area 1,532.18㎡
Floor area of building
8,352.69㎡
Structure B1/10F
Completion Nov. 30, 1989
Ueno East Tower
Location16-1, Higashi-Ueno 2-chome,
Taito-ku, Tokyo
Site Area 3,508.73㎡
Floor area of building
41,180.99㎡
Structure B2/25F
Completion Dec. 7, 2015
Yotsuya Medical Bldg.Location 20, Samoncho,
Shinjuku-ku, Tokyo
Site Area 2,062.40㎡
Floor area of building
9,722.22㎡
Structure B1/11F
Completion May 20, 2004
22 30
33 37
23
26
27
34 3838
24 28
35
40
31
25 29
32 36
39
21
Properties (2/4) (23 Wards of Tokyo)12

70
Chofu South Gate Bldg.Location 48-26, Kojimacho
2-chome, Chofu, Tokyo
Site Area 3,400.82㎡
Floor area of building
22,788.71㎡
Structure B1/11F
Completion Oct. 26, 2007
Shin-Kawasaki Mitsui Bldg.
Location1-2, Kashimada 1-chome,
Saiwai-ku, Kawasaki,Kanagawa
Site Area 19,478.07㎡
Floor area of building
138,485.98㎡
Structure B2/32F
Completion May 22, 1989
NBF Matsudo Bldg.
Location18-4, Hon-cho, Matsudo,
Chiba
Site Area 1,064.25㎡
Floor area of building
6,386.17㎡
Structure 8F
Completion Aug. 6, 1992
NBF Ikebukuro Tower
Location33-8, Higashi-Ikebukuro
1-chome, Toshima-ku,Tokyo
Site Area 994.03㎡
Floor area of building
7,981.88㎡
Structure 13F
Completion Apr. 8, 1993
Higashi Gotanda Square
Location10-2, Higashi-Gotanda
2-chome, Shinagawa-ku,Tokyo
Site Area 3,788.02㎡
Floor area of building
27,564.04㎡
Structure B2/16F
Completion Apr. 30, 2009
Toyo-cho Center Bldg.Location 3-2, Toyo 2-chome,
Koto-ku,Tokyo
Site Area 5,700.14㎡
Floor area of building
19,033.93㎡
Structure B1/5F
Completion Mar. 18, 1994
NBF Ueno Bldg.
Location24-11, Higashi-Ueno
4-chome, Taito-ku, Tokyo
Site Area 2,405.22㎡
Floor area of building
15,467.77㎡
Structure B2/13F
Completion Jan. 5, 2010
NBF Ikebukuro East
Location4-3, Higashi-Ikebukuro
3-chome, Toshima-ku,Tokyo
Site Area 2,027.19㎡
Floor area of building
15,727.15㎡
Structure B1/14F
Completion Feb. 16, 1993
Tsukuba Mitsui Bldg.
Location6-1, Takezono 1-chome,
Tsukuba, Ibaraki
Site Area 6,280.82㎡
Floor area of building
26,266.10㎡
Structure B2/19F
Completion Mar. 14, 1990
S-ino Omiya North WingLocation 10-16, Sakuragi-cho
1-chome, Omiya-ku,Saitama, Saitama
Site Area
Office building:3,083.98㎡,Administrativebuilding:2,366.04㎡
Floor area of building
Office building:30,227.21㎡,Administrativebuilding:385.79㎡
Structure
Office building: B1/20F,Administrative building: B2F
Completion Feb. 20, 2004
Yokohama ST Bldg.
Location11-15, Kitasaiwai1-chome,
Nishi-ku, Yokohama,Kanagawa
Site Area 6,348.45㎡
Floor area of building
42,568.77㎡
Structure B2/18F
Completion Oct. 31, 1987
Parale Mitsui Bldg.Location 8, Higashidacho,
Kawasaki-ku, Kawasaki,Kanagawa
Site Area 5,673.25㎡
Floor area of building
50,934.97㎡
Structure B1/22F
Completion Oct. 16, 1990
NBF Urawa Bldg.
Location2-5, Higashi-Takasagocho,
Urawa-ku, Saitama,Saitama
Site Area 1,005.16㎡
Floor area of building
5,090.72㎡
Structure B1/8F
Completion Jun. 20, 1990
Properties (3/4) (23 Wards of Tokyo & Other Greater Tokyo)12
Osaki Bright Tower
Location6-1, Kita-Shinagawa5-chome
Shinagawa-ku, Tokyo
Site Area 7,813.22㎡
Floor area of building
89,234.27㎡
Structure B2/31F
Completion Apr. 1, 2015
NBF Ikebukuro City Bldg.
Location17-8, Higashi-Ikebukuro
1-chome, Toshima-ku,Tokyo
Site Area 857.54㎡
Floor area of building
6,747.21㎡
Structure B1/9F
Completion Feb. 26, 1993
Nakameguro GT TowerLocation 1-1, Kami-Meguro
2-chome, Meguro-ku, Tokyo
Site Area 6,971.15㎡
Floor area of building
56,171.33㎡
Structure B3/25F
Completion Mar. 25, 2002
Osaki Bright Core - Bright PlazaLocation Bright Core:
5-15, Kita-Shinagawa 5-chome,Shinagawa-ku, Tokyo
Bright Plaza:4-1, Kita-Shinagawa 5-chome,Shinagawa-ku, Tokyo
Site AreaBright Core:5,811.01㎡Bright Plaza:3,711.54㎡
Floor area of building
Bright Core:42,929.11㎡Bright Plaza:4,084.84㎡
StructureBright Core: B2/20FBright Plaza: 2F
Completion Apr. 1, 2015
46
49
53
5643 47
50
44 48
54
51
45
52
55
41
42
57
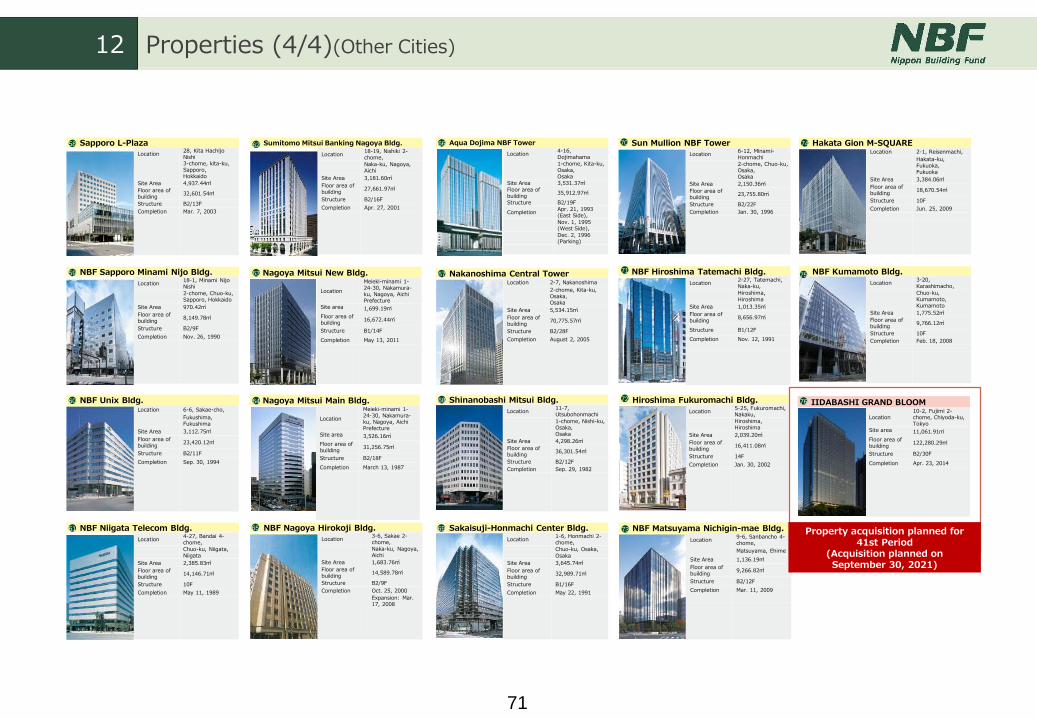
71
Sapporo L-Plaza
Location28, Kita Hachijo Nishi3-chome, kita-ku, Sapporo,Hokkaido
Site Area 4,937.44㎡
Floor area of building
32,601.54㎡
Structure B2/13F
Completion Mar. 7, 2003
Sumitomo Mitsui Banking Nagoya Bldg.
Location18-19, Nishiki 2-chome,
Naka-ku, Nagoya, Aichi
Site Area 3,181.60㎡
Floor area of building
27,661.97㎡
Structure B2/16F
Completion Apr. 27, 2001
Shinanobashi Mitsui Bldg.
Location11-7, Utsubohonmachi
1-chome, Nishi-ku, Osaka,Osaka
Site Area 4,298.26㎡
Floor area of building
36,301.54㎡
Structure B2/12F
Completion Sep. 29, 1982
Hiroshima Fukuromachi Bldg.
Location5-25, Fukuromachi, Nakaku,
Hiroshima, Hiroshima
Site Area 2,039.20㎡
Floor area of building
16,411.08㎡
Structure 14F
Completion Jan. 30, 2002
NBF Sapporo Minami Nijo Bldg.
Location18-1, Minami NijoNishi
2-chome, Chuo-ku,Sapporo, Hokkaido
Site Area 970.42㎡
Floor area of building
8,149.78㎡
Structure B2/9F
Completion Nov. 26, 1990
NBF Nagoya Hirokoji Bldg.
Location3-6, Sakae 2-chome,Naka-ku, Nagoya, Aichi
Site Area 1,683.76㎡
Floor area of building
14,589.78㎡
Structure B2/9F
Completion Oct. 25, 2000
Expansion: Mar. 17, 2008
Sakaisuji-Honmachi Center Bldg.
Location1-6, Honmachi 2-chome,
Chuo-ku, Osaka, Osaka
Site Area 3,645.74㎡
Floor area of building
32,989.71㎡
Structure B1/16F
Completion May 22, 1991
NBF Matsuyama Nichigin-mae Bldg.
Location9-6, Sanbancho 4-chome,
Matsuyama, Ehime
Site Area 1,136.19㎡
Floor area of building
9,266.82㎡
Structure B2/12F
Completion Mar. 11, 2009
NBF Unix Bldg.Location 6-6, Sakae-cho,
Fukushima, Fukushima
Site Area 3,112.75㎡
Floor area of building
23,420.12㎡
Structure B2/11F
Completion Sep. 30, 1994
Hakata Gion M-SQUARELocation 2-1, Reisenmachi,
Hakata-ku, Fukuoka,Fukuoka
Site Area 3,384.06㎡
Floor area of building
18,670.54㎡
Structure 10F
Completion Jun. 25, 2009
Sun Mullion NBF Tower
Location6-12, Minami-Honmachi
2-chome, Chuo-ku, Osaka,Osaka
Site Area 2,150.36㎡
Floor area of building
23,755.80㎡
Structure B2/22F
Completion Jan. 30, 1996
Aqua Dojima NBF Tower
Location4-16, Dojimahama
1-chome, Kita-ku, Osaka,Osaka
Site Area 3,531.37㎡Floor area of building
35,912.97㎡
Structure B2/19F
CompletionApr. 21, 1993 (East Side),
Nov. 1, 1995 (West Side),Dec. 2, 1996 (Parking)
NBF Niigata Telecom Bldg.
Location4-27, Bandai 4-chome,
Chuo-ku, Niigata, Niigata
Site Area 2,385.83㎡
Floor area of building
14,146.71㎡
Structure 10F
Completion May 11, 1989
Nakanoshima Central TowerLocation 2-7, Nakanoshima
2-chome, Kita-ku, Osaka,Osaka
Site Area 5,534.15㎡
Floor area of building
70,775.57㎡
Structure B2/28F
Completion August 2, 2005
NBF Hiroshima Tatemachi Bldg.
Location2-27, Tatemachi, Naka-ku,
Hiroshima, Hiroshima
Site Area 1,013.35㎡
Floor area of building
8,656.97㎡
Structure B1/12F
Completion Nov. 12, 1991
NBF Kumamoto Bldg.
Location3-20, Karashimacho,
Chuo-ku, Kumamoto,Kumamoto
Site Area 1,775.52㎡
Floor area of building
9,766.12㎡
Structure 10F
Completion Feb. 18, 2008
Properties (4/4)(Other Cities)12
Nagoya Mitsui New Bldg.
Location
Meieki-minami 1-24-30, Nakamura-ku, Nagoya, Aichi Prefecture
Site area 1,699.19㎡
Floor area of building
16,672.44㎡
Structure B1/14F
Completion May 13, 2011
Nagoya Mitsui Main Bldg.
Location
Meieki-minami 1-24-30, Nakamura-ku, Nagoya, Aichi Prefecture
Site area 3,526.16㎡
Floor area of building
31,256.75㎡
Structure B2/18F
Completion March 13, 1987
IIDABASHI GRAND BLOOM
Location10-2, Fujimi 2-chome, Chiyoda-ku, Tokyo
Site area 11,061.91㎡
Floor area of building
122,280.29㎡
Structure B2/30F
Completion Apr. 23, 2014
Property acquisition planned for 41st Period
(Acquisition planned on September 30, 2021)
61
6771
58
64 68 72
59
736965
60
66 70 7462
63 75
76

72
This English language notice is a translation of the Japanese language Investor Presentation dated August 17, 2021 and was
prepared solely for the convenience of, and reference by, overseas investors.
Neither NBF nor Nippon Building Fund Management, Ltd. makes any warranties as to its accuracy or completeness.
These materials are intended to provide information, and are not a solicitation or recommendation to purchase securities or
financial instruments or engage in transactions of any kind. Please consult with a securities company regarding the purchase
of NBF units or investment corporation bonds. The information provided in these materials does not constitute the disclosure
or asset management reports required under the Financial Instruments and Exchange Act or laws relevant to investment trusts
or investment corporations.
Nippon Building Fund Inc. and Nippon Building Fund Management Ltd. have exercised due care in providing these materials
but do not guarantee the accuracy, validity, or completeness of information, whether created by Nippon Building Fund Inc.,
Nippon Building Fund Management Ltd., or third parties.
This document contains forward-looking statements and information that are not historical or current facts. Forward-looking
statements and information are assumptions and judgments based on information available to Nippon Building Fund Inc. and
Nippon Building Fund Management Ltd. when preparing this document or as of the date otherwise stated. Forward-looking
statements and information are premised on the Nippon Building Fund Inc.’s investment plan, applicable laws and regulations,
market environment, interest rate environment, operating realities and the other facts as of the document date, and do not
reflect or take into consideration subsequent change. These statements and information involve known and unknown risks,
uncertainties and assumptions. Our future performance could materially differ from those set out in these forward-looking
statements.
The content of these materials is subject to change without notice. Nippon Building Fund Inc. and Nippon Building Fund
Management Ltd. do not undertake and will not undertake to release revisions of forward-looking statements to reflect future
events or circumstances or of any other statements or information contained herein.
Duplication or use for other purposes of these materials without the prior consent of Nippon Building Fund Inc. and Nippon
Building Fund Management Ltd. is prohibited.
Disclaimer