Differences in the cellular composition of small versus large ...
14
REPRODUCTION © 2016 Society for Reproduction and Fertility DOI: 10.1530/REP-16-0216 ISSN 1470–1626 (paper) 1741–7899 (online) Online version via www.reproduction-online.org RESEARCH Differences in the cellular composition of small versus large uterine fibroids Sarah J Holdsworth-Carson 1, *, Dong Zhao 1,2, *, Leonie Cann 1 , Sophie Bittinger 3 , Cameron J Nowell 4 and Peter A W Rogers 1 1 Department of Obstetrics and Gynaecology, University of Melbourne, Gynaecology Research Centre, Royal Women’s Hospital, Parkville, Victoria, Australia, 2 Department of Minimally Invasive Gynecologic Surgery, Shanghai First Maternity and Infant Hospital, Tongji University School of Medicine, Shanghai, People’s Republic of China, 3 Department of Anatomical Pathology, Royal Women’s Hospital, Parkville, Victoria, Australia, and 4 Monash Institute of Pharmaceutical Sciences, Monash University, Parkville, Victoria, Australia Correspondence should be addressed to P A W Rogers; Email: [email protected] *(S J Holdsworth-Carson and D Zhao contributed equally to this work) Abstract Uterine fibroids are clonally derived from a single cell; however, despite being monoclonal, the cellular phenotypes that make up uterine fibroids are heterogeneous consisting of predominantly smooth muscle cells (SMC) and fibroblasts. This raises the question as to when clonal cell differentiation occurs during fibroid development, and does this information provide clues about possible mechanisms regulating the growth process that leads to fibroids of symptom-causing size? This study investigated the differences in the cellular composition of fibroids by immunohistochemistry (IHC). A tissue microarray (n = 21 hysterectomy cases) was used for the investigation of large uterine fibroids and normal myometrium. An investigation of small fibroids (≤ 5mm) used a separate group of samples (n = 7 hysterectomy cases, total of n = 17 fibroids). A panel of cell phenotypic markers was selected based on our previous in situ investigations and included aldehyde dehydrogenase 1 (ALDH1A1) and vimentin for different fibroblast sub-populations, smooth muscle actin (SMA) as a marker for SMCs, CD31 for endothelial cells and CD45 for leucocytes. Proliferating cell nuclear antigen (PCNA) was also studied to identify proliferating cells. The cellular composition of small fibroids differs significantly from large fibroids. Small fibroids are more cellular (increased cells/mm 2 ) than large fibroids, have more blood vessels and also have a higher ratio of SMC to fibroblasts than large fibroids. Large fibroids have more cell proliferation (measured by PCNA) and fewer leucocytes (measured by CD45) than adjacent myometrium, whereas small fibroids are less proliferative and have similar number of leucocytes to myometrium. Different cellular composition between fibroids of different sizes may provide important clues as to the mechanisms that drive fibroid growth. Reproduction (2016) 152 467–480 Introduction Uterine fibroids (leiomyoma) are benign monoclonal tumours of the myometrium. Despite being monoclonal in origin, fibroid tumours contain cells of different phenotypes, predominantly smooth muscle cells (SMC) and fibroblasts (Holdsworth-Carson et al. 2014a,b). However, it is not known when clonal cell differentiation occurs during fibroid development, or what mechanisms are responsible for controlling it. Uterine fibroids generate a significant healthcare and quality of life burden. An improved understanding of the cellular mechanisms that drive fibroid growth is a prerequisite for developing better medical therapies for the millions of women who suffer from the symptoms of fibroids. The prevalence of uterine fibroids is high, found in 60–80% of women and symptomatic in 20–50% of women (reviewed by Owen & Armstrong 2015). Common symptoms associated with uterine fibroids include pressure symptoms, pelvic pain, heavy vaginal bleeding and anaemia. In the USA, the direct and indirect healthcare costs associated with uterine fibroids are estimated to be between $5.9 and $34.4 billions annually, with significant portions of this cost attributed to surgical management, obstetric complications and lost work-hours (Cardozo et al. 2012). Factors determining whether a woman will develop fibroid- related symptoms are poorly understood. Larger fibroids (≥50 mm) are more likely to be associated with more severe symptoms and greater odds of having a hysterectomy (Weber et al. 1997, Bachmann Downloaded from Bioscientifica.com at 02/12/2022 08:43:21AM via free access
-
Upload
khangminh22 -
Category
Documents
-
view
0 -
download
0
Transcript of Differences in the cellular composition of small versus large ...
REPRODUCTION
© 2016 Society for Reproduction and Fertility DOI: 10.1530/REP-16-0216ISSN 1470–1626 (paper) 1741–7899 (online) Online version via www.reproduction-online.org
RESEARCH
Differences in the cellular composition of small versus large uterine fibroids
Sarah J Holdsworth-Carson1,*, Dong Zhao1,2,*, Leonie Cann1, Sophie Bittinger3, Cameron J Nowell4 and Peter A W Rogers1
1Department of Obstetrics and Gynaecology, University of Melbourne, Gynaecology Research Centre, Royal Women’s Hospital, Parkville, Victoria, Australia, 2Department of Minimally Invasive Gynecologic Surgery, Shanghai First Maternity and Infant Hospital, Tongji University School of Medicine, Shanghai, People’s Republic of China, 3Department of Anatomical Pathology, Royal Women’s Hospital, Parkville, Victoria, Australia, and 4Monash Institute of Pharmaceutical Sciences, Monash University, Parkville, Victoria, Australia
Correspondence should be addressed to P A W Rogers; Email: [email protected]
*(S J Holdsworth-Carson and D Zhao contributed equally to this work)
Abstract
Uterine fibroids are clonally derived from a single cell; however, despite being monoclonal, the cellular phenotypes that make up uterine fibroids are heterogeneous consisting of predominantly smooth muscle cells (SMC) and fibroblasts. This raises the question as to when clonal cell differentiation occurs during fibroid development, and does this information provide clues about possible mechanisms regulating the growth process that leads to fibroids of symptom-causing size? This study investigated the differences in the cellular composition of fibroids by immunohistochemistry (IHC). A tissue microarray (n = 21 hysterectomy cases) was used for the investigation of large uterine fibroids and normal myometrium. An investigation of small fibroids (≤ 5mm) used a separate group of samples (n = 7 hysterectomy cases, total of n = 17 fibroids). A panel of cell phenotypic markers was selected based on our previous in situ investigations and included aldehyde dehydrogenase 1 (ALDH1A1) and vimentin for different fibroblast sub-populations, smooth muscle actin (SMA) as a marker for SMCs, CD31 for endothelial cells and CD45 for leucocytes. Proliferating cell nuclear antigen (PCNA) was also studied to identify proliferating cells. The cellular composition of small fibroids differs significantly from large fibroids. Small fibroids are more cellular (increased cells/mm2) than large fibroids, have more blood vessels and also have a higher ratio of SMC to fibroblasts than large fibroids. Large fibroids have more cell proliferation (measured by PCNA) and fewer leucocytes (measured by CD45) than adjacent myometrium, whereas small fibroids are less proliferative and have similar number of leucocytes to myometrium. Different cellular composition between fibroids of different sizes may provide important clues as to the mechanisms that drive fibroid growth.Reproduction (2016) 152 467–480
10.1530/REP-16-0216
Introduction
Uterine fibroids (leiomyoma) are benign monoclonal tumours of the myometrium. Despite being monoclonal in origin, fibroid tumours contain cells of different phenotypes, predominantly smooth muscle cells (SMC) and fibroblasts (Holdsworth-Carson et al. 2014a,b). However, it is not known when clonal cell differentiation occurs during fibroid development, or what mechanisms are responsible for controlling it. Uterine fibroids generate a significant healthcare and quality of life burden. An improved understanding of the cellular mechanisms that drive fibroid growth is a prerequisite for developing better medical therapies for the millions of women who suffer from the symptoms of fibroids.
The prevalence of uterine fibroids is high, found in 60–80% of women and symptomatic in 20–50% of women (reviewed by Owen & Armstrong 2015). Common symptoms associated with uterine fibroids include pressure symptoms, pelvic pain, heavy vaginal bleeding and anaemia. In the USA, the direct and indirect healthcare costs associated with uterine fibroids are estimated to be between $5.9 and $34.4 billions annually, with significant portions of this cost attributed to surgical management, obstetric complications and lost work-hours (Cardozo et al. 2012). Factors determining whether a woman will develop fibroid-related symptoms are poorly understood. Larger fibroids (≥50 mm) are more likely to be associated with more severe symptoms and greater odds of having a hysterectomy (Weber et al. 1997, Bachmann
Downloaded from Bioscientifica.com at 02/12/2022 08:43:21AMvia free access
S J Holdsworth-Carson, D Zhao and others468
Reproduction (2016) 152 467–480 www.reproduction-online.org
et al. 2011, Baird et al. 2015). Regression of fibroids following menopause or treatments that reduce ovarian hormone production demonstrates the dependency of fibroid growth on steroid hormones (Maruo et al. 2004, Moravek et al. 2015). Reducing the size of large symptom-causing fibroids by surgical, radiological and hormonal treatments provides symptomatic control. However, the frequency of recurrence is high, and it is currently estimated that 10% of women who undergo a myomectomy will go on to have a hysterectomy within 5–10 years (Singh & Belland 2015).
The growth properties of uterine fibroids vary widely. Although fibroid size and location within the uterus are not predictive of growth rates, median fibroid growth rate is approximately 9% over 6 months (Peddada et al. 2008). Higher growth rates of small- (<20 mm diameter) and average-sized (20–50 mm) fibroids relative to large uterine fibroids (>50 mm) have been reported in pre-menopausal women (David et al. 2014). Furthermore, large fibroid tumours (≥50 mm) are less likely to demonstrate short-term variability in growth rates compared with smaller fibroids (Baird et al. 2011). Fibroids can spontaneously shrink in both cycling and post-menopausal women (Peddada et al. 2008), and post-partum events are hypothesized to contribute to fibroid regression (Laughlin et al. 2010). Over a 6-month period, a study of >260 tumours observed spontaneous regression in 7% of fibroids (Peddada et al. 2008). As a whole, the growth properties of fibroids are complex, and it remains to be determined how and why some uterine fibroids bypass negative growth control mechanisms while others remain quiescent or regress.
Recent work by us and others have established that the cellular phenotypes of uterine fibroids are heterogeneous (Koumas et al. 2001, Moore et al. 2010, Zhao & Rogers 2013, Holdsworth-Carson et al. 2014a,b). Studying the different cellular populations present within fibroids confirms the phenotypic plasticity of these cells and the dynamic nature of commonly used cell markers. For example, smooth muscle cells (SMC) are abundant in fibroids and stain positive for smooth muscle actin (SMA); however, phenotypically SMA-positive SMC can be substantially different (including smooth muscle, vascular SMC and pericytes) (Uhlen et al. 2015). Fibroblasts are another abundant cell type present in uterine fibroids. Phenotypically dissimilar fibroblast populations can be identified using different combinations of common cell markers (CD90, vimentin and aldehyde dehydrogenase 1 (ALDH1A1)) (Holdsworth-Carson et al. 2014b). Populations of fibroid-derived somatic stem cells have also been identified in uterine fibroids (Ono et al. 2012). Therefore, although fibroids are clonal and derived from a single cell, these clonal cells differentiate into multiple different cell sub-populations as the fibroid grows (Holdsworth-Carson et al. 2014b). It is not known at what stage cellular
differentiation occurs during fibroid development, or what mechanisms regulate the process.
The aim of this study is to analyse the cellular heterogeneity of small and large uterine fibroids using a panel of common cell markers (Holdsworth-Carson et al. 2014b): aldehyde dehydrogenase 1 (ALDH1A1) and vimentin for different fibroblasts populations, smooth muscle actin (SMA) for the broad identification of SMC, CD31 for endothelial cells and CD45 for leucocytes. Proliferating cell nuclear antigen (PCNA) marker was studied for proliferating cells. We also addressed the effect of menstrual cycle stage, menopause status and fibroid pathology sub-type (typical non-degenerative fibroids, hyaline degeneration and cellular leiomyoma) on cellular composition. We hypothesized that the cellular composition of large uterine fibroids will be different to that of small fibroids, potentially reflecting more advanced cellular differentiation in the larger tumours. Understanding the different cellular composition between fibroids of different sizes may provide important clues as to the mechanisms that drive fibroid growth. Knowledge of cellular heterogeneity may also help to explain differences in the growth patterns and symptomology of individual uterine fibroids.
Materials and methods
Case selection, tissue collection and tissue microarray
Myometrium and fibroid tissues were collected from patients undergoing hysterectomy following informed consent (n = 28).
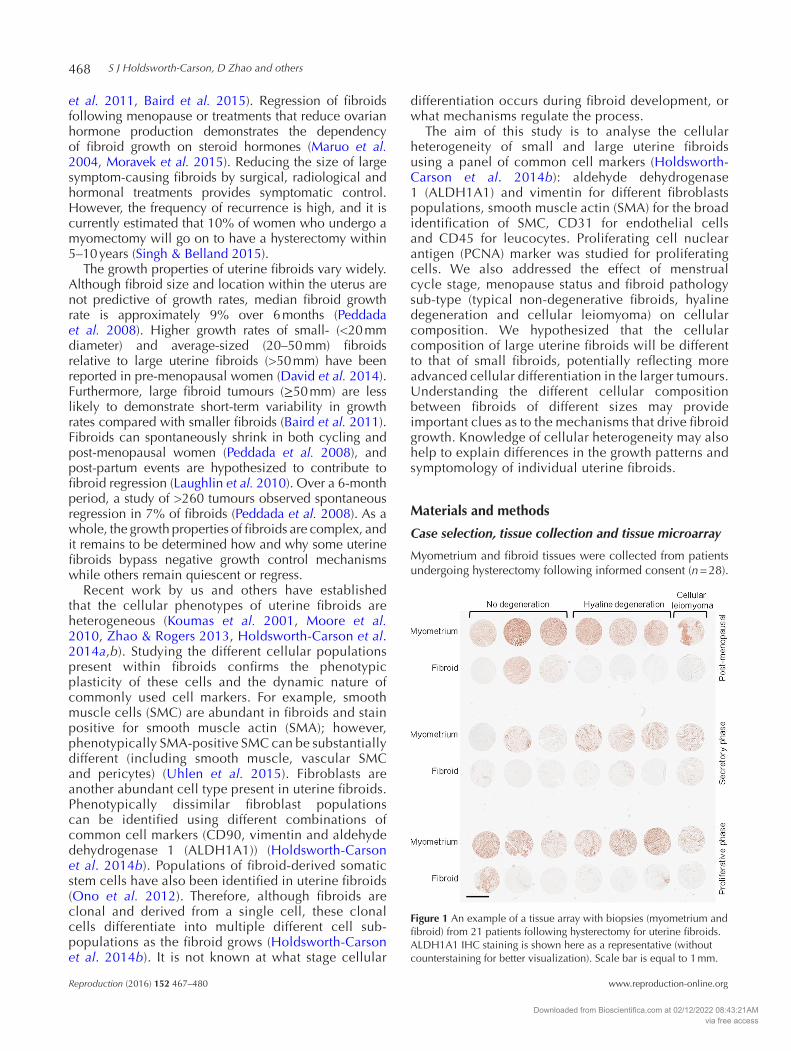
Figure 1 An example of a tissue array with biopsies (myometrium and fibroid) from 21 patients following hysterectomy for uterine fibroids. ALDH1A1 IHC staining is shown here as a representative (without counterstaining for better visualization). Scale bar is equal to 1 mm.
Downloaded from Bioscientifica.com at 02/12/2022 08:43:21AMvia free access
Small vs large uterine fibroids 469
www.reproduction-online.org Reproduction (2016) 152 467–480
Ethics approval was obtained from Monash Medical Centre Human Research Ethics Committee and the Royal Women’s Hospital Human Research Ethics Committee. Detailed clinical and menstrual histories were obtained at the time of consent with menstrual cycle stage and fibroid pathology determined by hospital pathology services. Patients were classified as pre- or post-menopausal and menstrual cycle stage as proliferative, secretory or inactive. We did not specifically exclude women on hormone therapy from this study (self-reported). Fibroid sub-types were categorized by pathology as those ‘typical’ in appearance with no degeneration, those with hyaline degeneration (with an evidence of necrosis) or those with cellular leiomyoma (where cellularity was greater than the surrounding myometrium and lacked necrosis). Myometrium was obtained at least 2 cm from adjacent fibroid tissue. If more than one large fibroid was identified per uteri, a fibroid sample
was taken from the body of the largest fibroid. Myometrium and fibroid tissue were immediately fixed in formalin overnight and transferred into phosphate-buffered saline (PBS) before paraffin embedding for immunohistochemistry (IHC).
To examine myometrium and large fibroids, we generated a tissue microarray as a resource to rapidly analyse a large number of samples. The microarray consisted of n = 21 hysterectomy cases with representative cylindrical cores measuring 0.6 mm diameter, with two cores per patient (one from the centre of the fibroid and one from the myometrium) (Fig. 1). These cylindrical cores were obtained from individual formalin-fixed paraffin-embedded tissue blocks. Each core was positioned into the centre of a recipient tissue microarray block for subsequent embedding. The microarray paraffin block was sectioned (3 µm) and H&E stained to ensure that the cores were representative of the original tissue paraffin block.
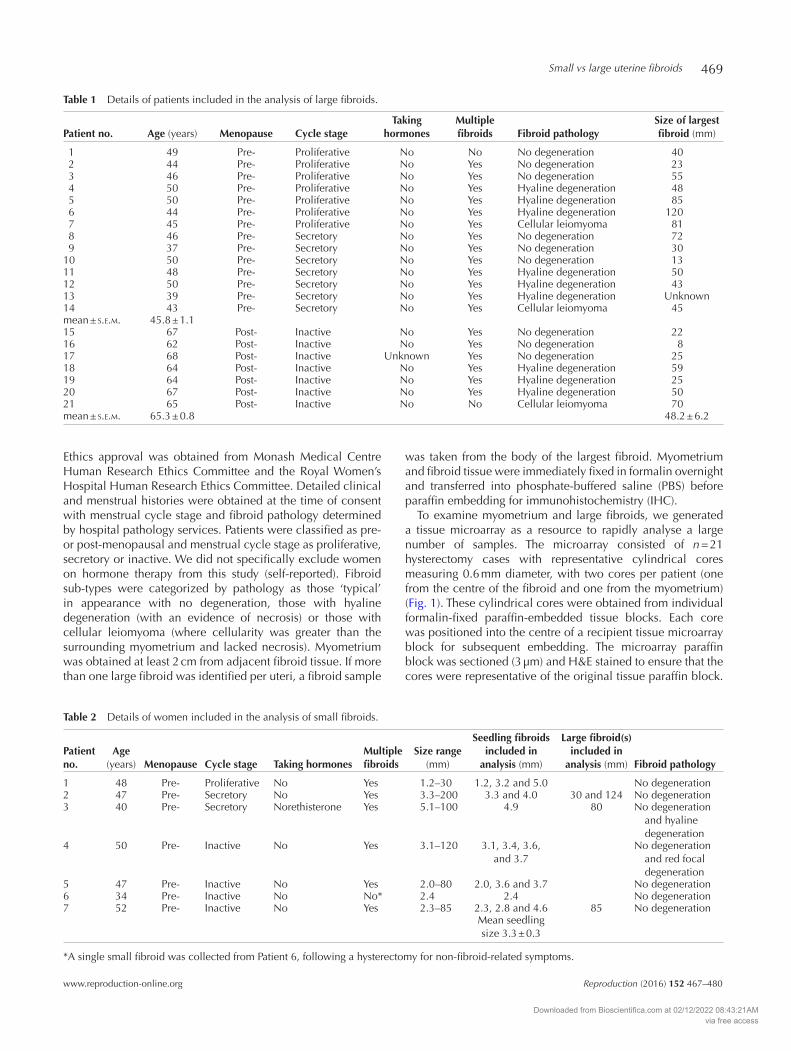
Table 1 Details of patients included in the analysis of large fibroids.
Patient no. Age (years) Menopause Cycle stageTaking
hormonesMultiple fibroids Fibroid pathology
Size of largest fibroid (mm)
1 49 Pre- Proliferative No No No degeneration 40 2 44 Pre- Proliferative No Yes No degeneration 23 3 46 Pre- Proliferative No Yes No degeneration 55 4 50 Pre- Proliferative No Yes Hyaline degeneration 48 5 50 Pre- Proliferative No Yes Hyaline degeneration 85 6 44 Pre- Proliferative No Yes Hyaline degeneration 120 7 45 Pre- Proliferative No Yes Cellular leiomyoma 81 8 46 Pre- Secretory No Yes No degeneration 72 9 37 Pre- Secretory No Yes No degeneration 3010 50 Pre- Secretory No Yes No degeneration 1311 48 Pre- Secretory No Yes Hyaline degeneration 5012 50 Pre- Secretory No Yes Hyaline degeneration 4313 39 Pre- Secretory No Yes Hyaline degeneration Unknown14 43 Pre- Secretory No Yes Cellular leiomyoma 45mean ± s.e.m. 45.8 ± 1.115 67 Post- Inactive No Yes No degeneration 2216 62 Post- Inactive No Yes No degeneration 817 68 Post- Inactive Unknown Yes No degeneration 2518 64 Post- Inactive No Yes Hyaline degeneration 5919 64 Post- Inactive No Yes Hyaline degeneration 2520 67 Post- Inactive No Yes Hyaline degeneration 5021 65 Post- Inactive No No Cellular leiomyoma 70mean ± s.e.m. 65.3 ± 0.8 48.2 ± 6.2
Table 2 Details of women included in the analysis of small fibroids.
Patient no.
Age (years) Menopause Cycle stage Taking hormones
Multiple fibroids
Size range (mm)
Seedling fibroids included in
analysis (mm)
Large fibroid(s) included in
analysis (mm) Fibroid pathology
1 48 Pre- Proliferative No Yes 1.2–30 1.2, 3.2 and 5.0 No degeneration2 47 Pre- Secretory No Yes 3.3–200 3.3 and 4.0 30 and 124 No degeneration3 40 Pre- Secretory Norethisterone Yes 5.1–100 4.9 80 No degeneration
and hyaline degeneration
4 50 Pre- Inactive No Yes 3.1–120 3.1, 3.4, 3.6, and 3.7
No degeneration and red focal degeneration
5 47 Pre- Inactive No Yes 2.0–80 2.0, 3.6 and 3.7 No degeneration6 34 Pre- Inactive No No* 2.4 2.4 No degeneration7 52 Pre- Inactive No Yes 2.3–85 2.3, 2.8 and 4.6 85 No degeneration
Mean seedling size 3.3 ± 0.3
*A single small fibroid was collected from Patient 6, following a hysterectomy for non-fibroid-related symptoms.
Downloaded from Bioscientifica.com at 02/12/2022 08:43:21AMvia free access
S J Holdsworth-Carson, D Zhao and others470
Reproduction (2016) 152 467–480 www.reproduction-online.org
Table 1 lists the details of the patients included in the tissue microarray. All women in this group underwent hysterectomy for fibroid-related symptoms.
The tissue microarray was used as a baseline for the investigation of large uterine fibroids. To investigate small ‘seedling’ fibroids, a separate cohort of women undergoing hysterectomy at the Royal Women’s Hospital (Parkville, Victoria, Australia) were recruited (n = 7). In this study, we restricted our evaluation of seedlings to small fibroids ≤5 mm (Cramer et al. 2009). Table 2 lists the details of women included in the analysis of small fibroids. Multiple small fibroids (≤5 mm) and adjacent normal myometrium were collected from these women. A single small fibroid (2.4 mm) was collected from Patient 6 (Table 2*) who underwent a hysterectomy for non-fibroid-related symptoms. Large fibroids were also obtained from each patient when available. A pathologist independently confirmed the presence of all small ‘seedling’ fibroids using H&E-stained paraffin sections.
Immunohistochemistry (IHC)
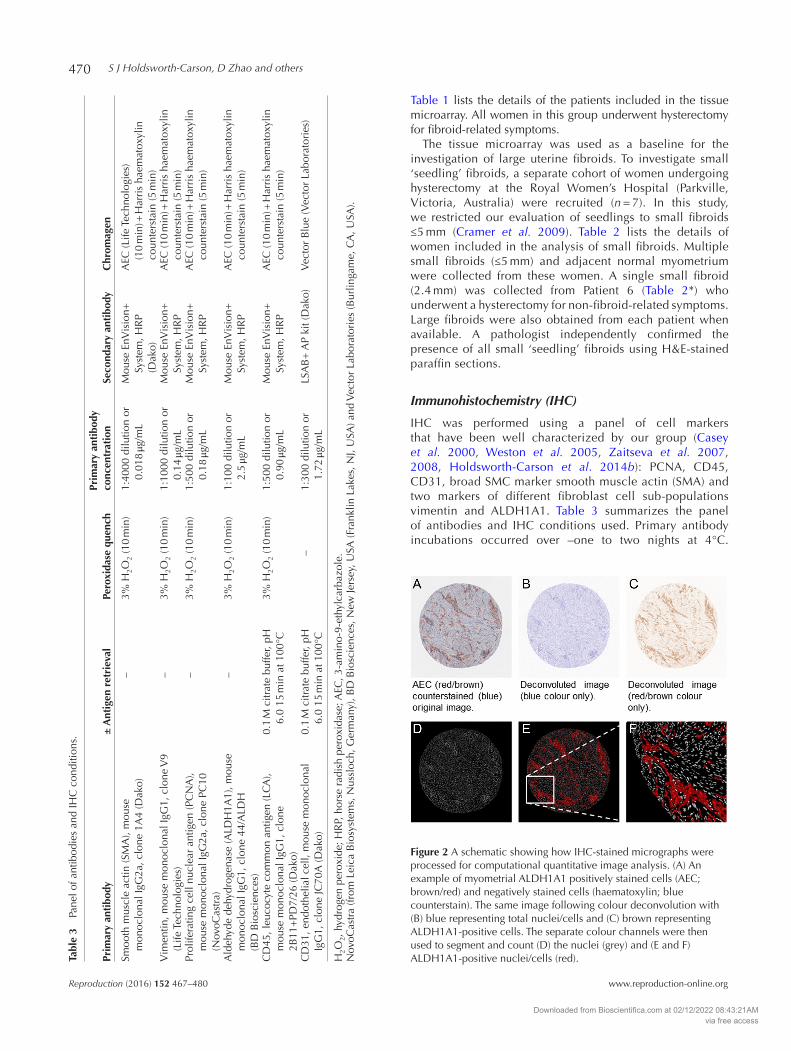
IHC was performed using a panel of cell markers that have been well characterized by our group (Casey et al. 2000, Weston et al. 2005, Zaitseva et al. 2007, 2008, Holdsworth-Carson et al. 2014b): PCNA, CD45, CD31, broad SMC marker smooth muscle actin (SMA) and two markers of different fibroblast cell sub-populations vimentin and ALDH1A1. Table 3 summarizes the panel of antibodies and IHC conditions used. Primary antibody incubations occurred over –one to two nights at 4°C.
Tabl
e 3
Pane
l of a
ntib
odie
s an
d IH
C c
ondi
tions
.
Prim
ary
anti
body
± A
ntig
en r
etri
eval
Pero
xida
se q
uenc
hPr
imar
y an
tibo
dy
conc
entr
atio
nSe
cond
ary
anti
body
Chr
omag
en
Smoo
th m
uscl
e ac
tin (S
MA
), m
ouse
m
onoc
lona
l IgG
2a, c
lone
1A
4 (D
ako)
–3%
H2O
2 (1
0 m
in)
1:40
00 d
ilutio
n or
0.
018
μg/m
LM
ouse
EnV
isio
n+
Syst
em, H
RP
(Dak
o)
AEC
(Life
Tec
hnol
ogie
s)
(10
min
) + H
arri
s ha
emat
oxyl
in
coun
ters
tain
(5 m
in)
Vim
entin
, mou
se m
onoc
lona
l IgG
1, c
lone
V9
(Life
Tec
hnol
ogie
s)–
3% H
2O2
(10
min
)1:
1000
dilu
tion
or
0.14
μg/m
LM
ouse
EnV
isio
n+
Syst
em, H
RP
AEC
(10
min
) + H
arri
s ha
emat
oxyl
in
coun
ters
tain
(5 m
in)
Prol
ifera
ting
cell
nucl
ear
antig
en (P
CN
A),
mou
se m
onoc
lona
l IgG
2a, c
lone
PC
10
(Nov
oCas
tra)
–3%
H2O
2 (1
0 m
in)
1:50
0 di
lutio
n or
0.
18 μg
/mL
Mou
se E
nVis
ion+
Sy
stem
, HR
PA
EC (1
0 m
in) +
Har
ris
haem
atox
ylin
co
unte
rsta
in (5
min
)
Ald
ehyd
e de
hydr
ogen
ase
(ALD
H1A
1), m
ouse
m
onoc
lona
l IgG
1, c
lone
44/
ALD
H
(BD
Bio
scie
nces
)
–3%
H2O
2 (1
0 m
in)
1:10
0 di
lutio
n or
2.
5 μg
/mL
Mou
se E
nVis
ion+
Sy
stem
, HR
PA
EC (1
0 m
in) +
Har
ris
haem
atox
ylin
co
unte
rsta
in (5
min
)
CD
45, l
euco
cyte
com
mon
ant
igen
(LC
A),
mou
se m
onoc
lona
l IgG
1, c
lone
2B
11+
PD7/
26 (D
ako)
0.1
M c
itrat
e bu
ffer,
pH
6.0
15 m
in a
t 100
°C3%
H2O
2 (1
0 m
in)
1:50
0 di
lutio
n or
0.
90 μg
/mL
Mou
se E
nVis
ion+
Sy
stem
, HR
PA
EC (1
0 m
in) +
Har
ris
haem
atox
ylin
co
unte
rsta
in (5
min
)
CD
31, e
ndot
helia
l cel
l, m
ouse
mon
oclo
nal
IgG
1, c
lone
JC70
A (D
ako)
0.1
M c
itrat
e bu
ffer,
pH
6.0
15 m
in a
t 100
°C–
1:30
0 di
lutio
n or
1.
72 μg
/mL
LSA
B+
AP
kit (
Dak
o)V
ecto
r B
lue
(Vec
tor
Labo
rato
ries
)
H2O
2, h
ydro
gen
pero
xide
; HR
P, h
orse
rad
ish
pero
xida
se; A
EC, 3
-am
ino-
9-et
hylc
arba
zole
.N
ovoC
astr
a (fr
om L
eica
Bio
syst
ems,
Nus
sloc
h, G
erm
any)
, BD
Bio
scie
nces
, New
Jers
ey, U
SA (F
rank
lin L
akes
, NJ,
USA
) and
Vec
tor
Labo
rato
ries
(Bur
linga
me,
CA
, USA
).
Figure 2 A schematic showing how IHC-stained micrographs were processed for computational quantitative image analysis. (A) An example of myometrial ALDH1A1 positively stained cells (AEC; brown/red) and negatively stained cells (haematoxylin; blue counterstain). The same image following colour deconvolution with (B) blue representing total nuclei/cells and (C) brown representing ALDH1A1-positive cells. The separate colour channels were then used to segment and count (D) the nuclei (grey) and (E and F) ALDH1A1-positive nuclei/cells (red).
Downloaded from Bioscientifica.com at 02/12/2022 08:43:21AMvia free access
Small vs large uterine fibroids 471
www.reproduction-online.org Reproduction (2016) 152 467–480
Following nuclei counterstaining (note that CD31 IHC was not counterstained), slides were mounted with Faramount (Dako). IHC images were acquired on an Aperio ScanScopeXT system (Aperio, Vista, CA, USA) at the Melbourne Health Tissue Bank (Royal Melbourne Hospital, Parkville, Victoria, Australia).
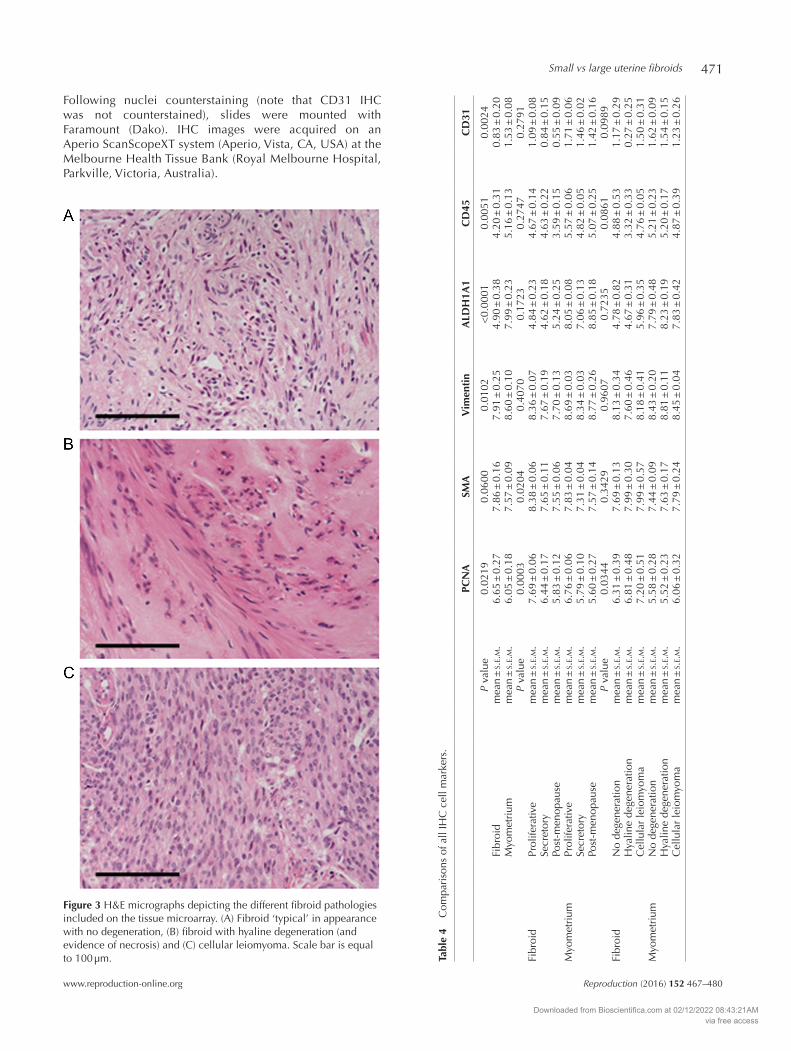
Figure 3 H&E micrographs depicting the different fibroid pathologies included on the tissue microarray. (A) Fibroid ‘typical’ in appearance with no degeneration, (B) fibroid with hyaline degeneration (and evidence of necrosis) and (C) cellular leiomyoma. Scale bar is equal to 100 µm. Ta
ble
4 C
ompa
riso
ns o
f all
IHC
cel
l mar
kers
.
PCN
ASM
AV
imen
tin
ALD
H1A
1C
D45
CD
31
P va
lue
0.02
190.
0600
0.01
02<
0.00
010.
0051
0.00
24Fi
broi
dm
ean
± s.
e.m.
6.65
± 0
.27
7.86
± 0
.16
7.91
± 0
.25
4.90
± 0
.38
4.20
± 0
.31
0.83
± 0
.20
Myo
met
rium
mea
n ±
s.e.m.
6.05
± 0
.18
7.57
± 0
.09
8.60
± 0
.10
7.99
± 0
.23
5.16
± 0
.13
1.53
± 0
.08
P va
lue
0.00
030.
0204
0.40
700.
1723
0.27
470.
2791
Fibr
oid
Prol
ifera
tive
mea
n ±
s.e.m.
7.69
± 0
.06
8.38
± 0
.06
8.36
± 0
.07
4.84
± 0
.23
4.67
± 0
.14
1.09
± 0
.08
Secr
etor
ym
ean
± s.
e.m.
6.44
± 0
.17
7.65
± 0
.11
7.67
± 0
.19
4.62
± 0
.18
4.63
± 0
.22
0.84
± 0
.15
Post
-men
opau
sem
ean
± s.
e.m.
5.83
± 0
.12
7.55
± 0
.06
7.70
± 0
.13
5.24
± 0
.25
3.59
± 0
.15
0.55
± 0
.09
Myo
met
rium
Prol
ifera
tive
mea
n ±
s.e.m.
6.76
± 0
.06
7.83
± 0
.04
8.69
± 0
.03
8.05
± 0
.08
5.57
± 0
.06
1.71
± 0
.06
Secr
etor
ym
ean
± s.
e.m.
5.79
± 0
.10
7.31
± 0
.04
8.34
± 0
.03
7.06
± 0
.13
4.82
± 0
.05
1.46
± 0
.02
Post
-men
opau
sem
ean
± s.
e.m.
5.60
± 0
.27
7.57
± 0
.14
8.77
± 0
.26
8.85
± 0
.18
5.07
± 0
.25
1.42
± 0
.16
P va
lue
0.03
440.
3429
0.96
070.
7235
0.08
610.
0989
Fibr
oid
No
dege
nera
tion
mea
n ±
s.e.m.
6.31
± 0
.39
7.69
± 0
.13
8.13
± 0
.34
4.78
± 0
.82
4.88
± 0
.53
1.17
± 0
.29
Hya
line
dege
nera
tion
mea
n ±
s.e.m.
6.81
± 0
.48
7.99
± 0
.30
7.60
± 0
.46
4.67
± 0
.31
3.32
± 0
.33
0.27
± 0
.25
Cel
lula
r le
iom
yom
am
ean
± s.
e.m.
7.20
± 0
.51
7.99
± 0
.57
8.18
± 0
.41
5.96
± 0
.35
4.76
± 0
.05
1.50
± 0
.31
Myo
met
rium
No
dege
nera
tion
mea
n ±
s.e.m.
5.58
± 0
.28
7.44
± 0
.09
8.43
± 0
.20
7.79
± 0
.48
5.21
± 0
.23
1.62
± 0
.09
Hya
line
dege
nera
tion
mea
n ±
s.e.m.
5.52
± 0
.23
7.63
± 0
.17
8.81
± 0
.11
8.23
± 0
.19
5.20
± 0
.17
1.54
± 0
.15
Cel
lula
r le
iom
yom
am
ean
± s.
e.m.
6.06
± 0
.32
7.79
± 0
.24
8.45
± 0
.04
7.83
± 0
.42
4.87
± 0
.39
1.23
± 0
.26
Downloaded from Bioscientifica.com at 02/12/2022 08:43:21AMvia free access
S J Holdsworth-Carson, D Zhao and others472
Reproduction (2016) 152 467–480 www.reproduction-online.org
Image analysis
Quantitative image analysis was performed as described previously (Holdsworth-Carson et al. 2015). Briefly, the colour deconvolution tool in Fiji (Schindelin et al. 2012) was used on scanned image files to separate the haematoxylin (blue nuclei/cells) from the AEC (3-amino-9-ethylcarbazole) (brown/red)-stained areas. Positive and negative channels were used in the cell scoring module of MetaMorph (Meta Imaging Series 7.7; Molecular Devices, Sunnyvale, CA, USA) to count positive and negative cells (Fig. 2). PCNA-, SMA-, vimentin-, ALDH1A1- and CD45-stained cells were expressed as the number of positive cells/mm2. CD31 is a marker of vessel walls, which are generally continuous and uninterrupted; thus, it was not possible to count the number of cells.
CD31 IHC was not counterstained; therefore, CD31 was expressed as a percentage of CD31 staining/mm2. Using counterstained images, the overall number of cells (per unit area mm2) was assessed for myometrium relative to fibroid tissue (large and small). The ratio of SMA to fibroblast markers (vimentin and ALDH1A1) was calculated from the number of positive cells/mm2 data.
Statistical analysis
Statistical analysis was performed using SAS 9.2 (SAS Institute, Inc, Cary, NC, USA), IBM SPSS Statistics Version 22 (IBM) or GraphPad Prism Version 5.04. To make data homogeneous, IHC quantification values were log transformed. For analysis of large fibroid vs myometrium, a mixed-effect model with tissue
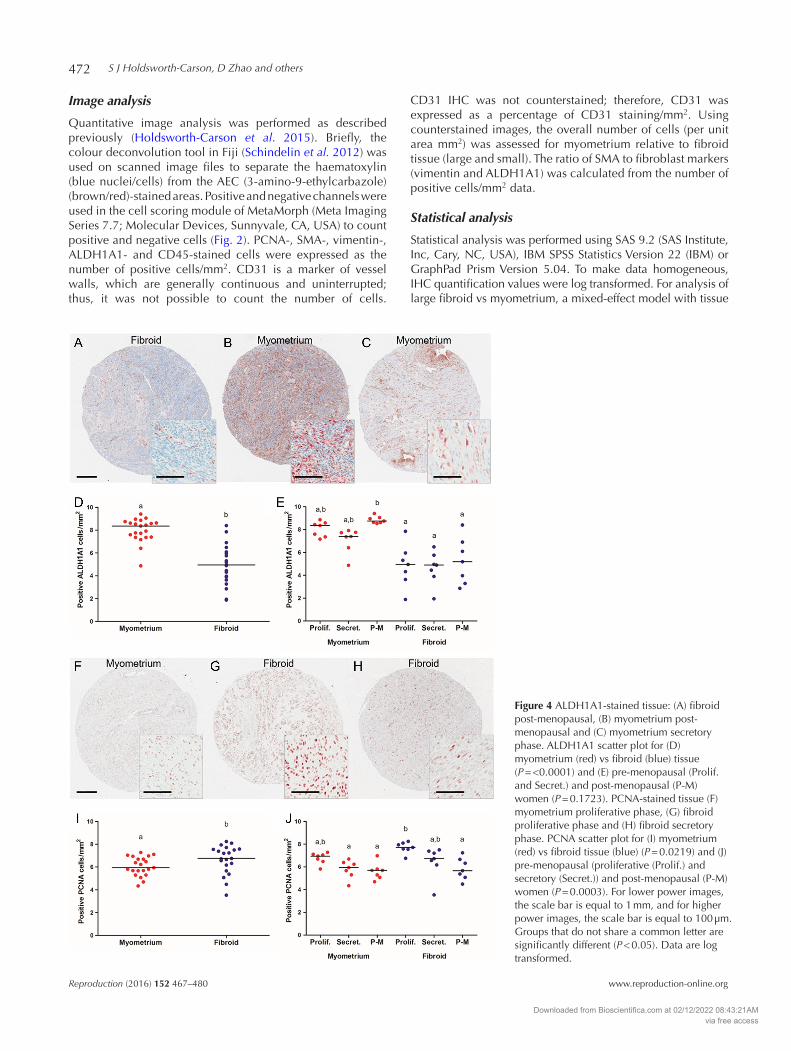
Figure 4 ALDH1A1-stained tissue: (A) fibroid post-menopausal, (B) myometrium post-menopausal and (C) myometrium secretory phase. ALDH1A1 scatter plot for (D) myometrium (red) vs fibroid (blue) tissue (P = <0.0001) and (E) pre-menopausal (Prolif. and Secret.) and post-menopausal (P-M) women (P = 0.1723). PCNA-stained tissue (F) myometrium proliferative phase, (G) fibroid proliferative phase and (H) fibroid secretory phase. PCNA scatter plot for (I) myometrium (red) vs fibroid tissue (blue) (P = 0.0219) and (J) pre-menopausal (proliferative (Prolif.) and secretory (Secret.)) and post-menopausal (P-M) women (P = 0.0003). For lower power images, the scale bar is equal to 1 mm, and for higher power images, the scale bar is equal to 100 µm. Groups that do not share a common letter are significantly different (P < 0.05). Data are log transformed.
Downloaded from Bioscientifica.com at 02/12/2022 08:43:21AMvia free access
Small vs large uterine fibroids 473
www.reproduction-online.org Reproduction (2016) 152 467–480
type (myometrium and fibroid), menopause status (post- and pre-menopause (proliferative and secretory phases)) and fibroid pathology sub-type (no degeneration, hyaline degeneration or cellular leiomyoma) as fixed effects and patient identifier number as random effect term was fitted. Interaction terms were not significant, and the final model included the following main effect terms only, tissue type, post- and pre-menopause status, and fibroid pathology. An ANOVA (Kruskal–Wallis test) was also performed separately for ALDH1A1 data.
Multiple fibroids that share a uterus demonstrate heterogeneity (Zhao & Rogers 2013). Therefore, for the evaluation of small fibroids, we treated the transformed data from each fibroid as a single data value. Small fibroid data (IHC quantitative data and number of cell/mm2) were compared using one-way ANOVA followed by a post hoc analysis (Tukey’s). Transformed data for SMA:fibroblast marker ratios were normalized to the mean ratio of myometrium before data were compared by ANOVA (Kruskal–Wallis test). All data were considered significant at a P value less than 0.05.
Results
Analysis of large fibroids
Table 1 lists the details of patients included in the analysis of large fibroids. The mean diameter of large fibroids was 48.2 ± 6.2 mm (range 8 – 120 mm). Pre-menopausal women had a mean age of 45.8 ± 1.1 years and post-menopausal women 65.3 ± 0.8 years. The tissue microarray included fibroids histopathologically diagnosed as typical non-degenerative fibroids (9/21 or 42.9%), fibroids with hyaline degeneration present (9/21 or 42.9%) and 14.3% (3/21) of fibroids were diagnosed as phenotypically cellular (Fig. 3).
Following quantitative image analysis, several comparisons were made for all IHC cell markers. Table 4 lists all of the P values and mean ± s.e.m. for the para-meters tested: fibroid vs myometrium, post-menopausal vs pre-menopausal (proliferative or secretory) status and fibroid pathology. When comparing tissue type (fibroid vs myometrium), 4/5 cell phenotype markers were significantly different (vimentin, ALDH1A1, CD45 and CD31) (Table 4). ALDH1A1 was considerably decreased in large fibroids compared with myometrium (P = <0.0001) (Fig. 4A–D and Table 4). Immunoreactive vimentin, CD45 and CD31 were also significantly reduced in large fibroids relative to myometrium (P = 0.0102, P = 0.0051 and P = 0.0024 respectively), whereas SMA was unchanged (Table 4). Cell proliferation marker PCNA was increased in large fibroids compared with myometrium (P = 0.0219) (Fig. 4F–J and Table 4).
Menopause and cycle stage status was significantly different for SMA phenotype (P = 0.0204) (Table 4). In contrast, levels of vimentin, ALDH1A1, CD45 and CD31 were not significantly affected by menopause status or cycle stage. We observed that ALDH1A1 in myometrial tissues from post-menopausal women was increased (Fig. 4B, C and E). Using the mixed-effect model of
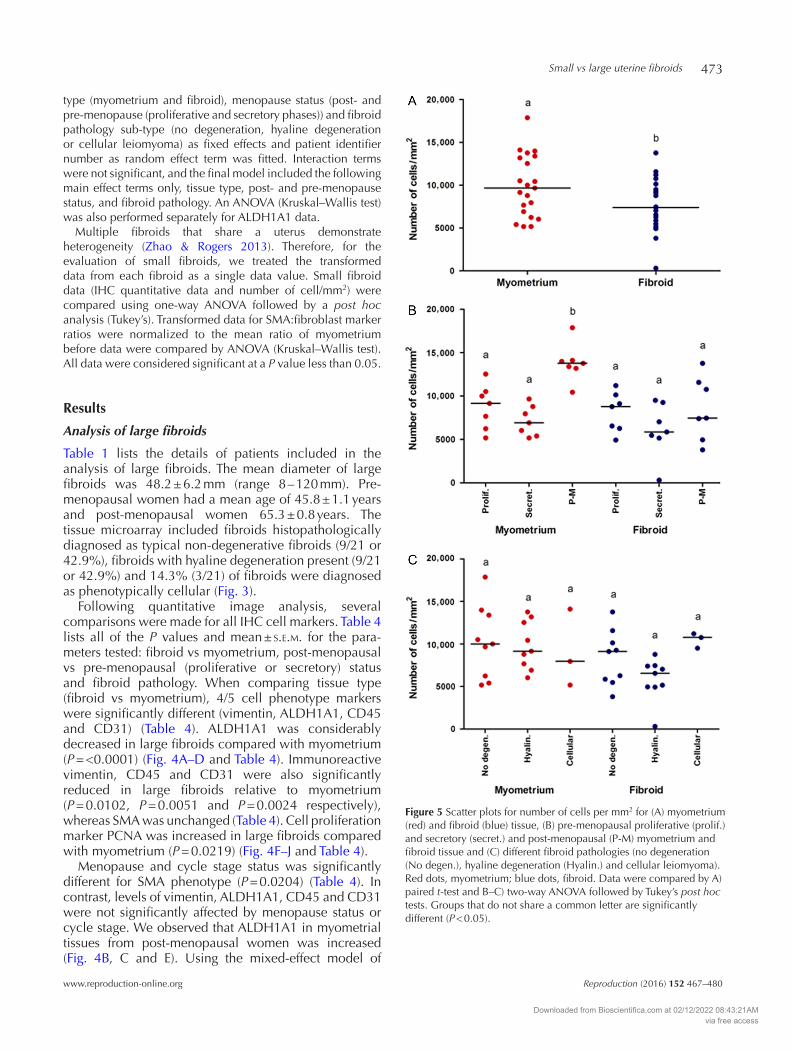
Figure 5 Scatter plots for number of cells per mm2 for (A) myometrium (red) and fibroid (blue) tissue, (B) pre-menopausal proliferative (prolif.) and secretory (secret.) and post-menopausal (P-M) myometrium and fibroid tissue and (C) different fibroid pathologies (no degeneration (No degen.), hyaline degeneration (Hyalin.) and cellular leiomyoma). Red dots, myometrium; blue dots, fibroid. Data were compared by A) paired t-test and B–C) two-way ANOVA followed by Tukey’s post hoc tests. Groups that do not share a common letter are significantly different (P < 0.05).
Downloaded from Bioscientifica.com at 02/12/2022 08:43:21AMvia free access
S J Holdsworth-Carson, D Zhao and others474
Reproduction (2016) 152 467–480 www.reproduction-online.org
statistical analyses, the effect of menopause status and cycle stage was not statistically different for ALDH1A1 (P = 0.1723) (Table 4). However, when analysis was limited to tissue type and menopause status (proliferative, secretory and post-menopausal) only, ALDH1A1 increased significantly in myometrium from post-menopausal women compared with fibroid (proliferative,
secretory and post-menopausal) (P = <0.0001; non-parametric ANOVA with Kruskal–Wallis).
Cell proliferation (PCNA) was also significantly different for cycle stage and menopause status (P = 0.0003). Fibroids from pre-menopausal women, during the proliferative phase, were increased for PCNA positivity relative to myometrium (secretory
Table 5 Analysis of cell density.
Cell density (cells/mm2)P value 0.0144
Fibroid mean ± s.e.m. 7586.22 ± 675.29Myometrium mean ± s.e.m. 9900.20 ± 780.75
P value 0.0003Fibroid Proliferative mean ± s.e.m. 8142.51 ± 585.58
Secretory mean ± s.e.m. 6087.58 ± 1167.97Post-menopause mean ± s.e.m. 8528.57 ± 1372.95
Myometrium Proliferative mean ± s.e.m. 8750.87 ± 968.31Secretory mean ± s.e.m. 7132.42 ± 652.61Post-menopause mean ± s.e.m. 13,817.31 ± 823.40
P value 0.2969Fibroid No degeneration mean ± s.e.m. 8362.12 ± 1078.37
Hyaline degeneration mean ± s.e.m. 5842.89 ± 818.32Cellular leiomyoma mean ± s.e.m. 10,488.47 ± 507.86
Myometrium No degeneration mean ± s.e.m. 10,245.63 ± 1431.43Hyaline degeneration mean ± s.e.m. 9828.99 ± 939.30Cellular leiomyoma mean ± s.e.m. 9077.55 ± 2640.08
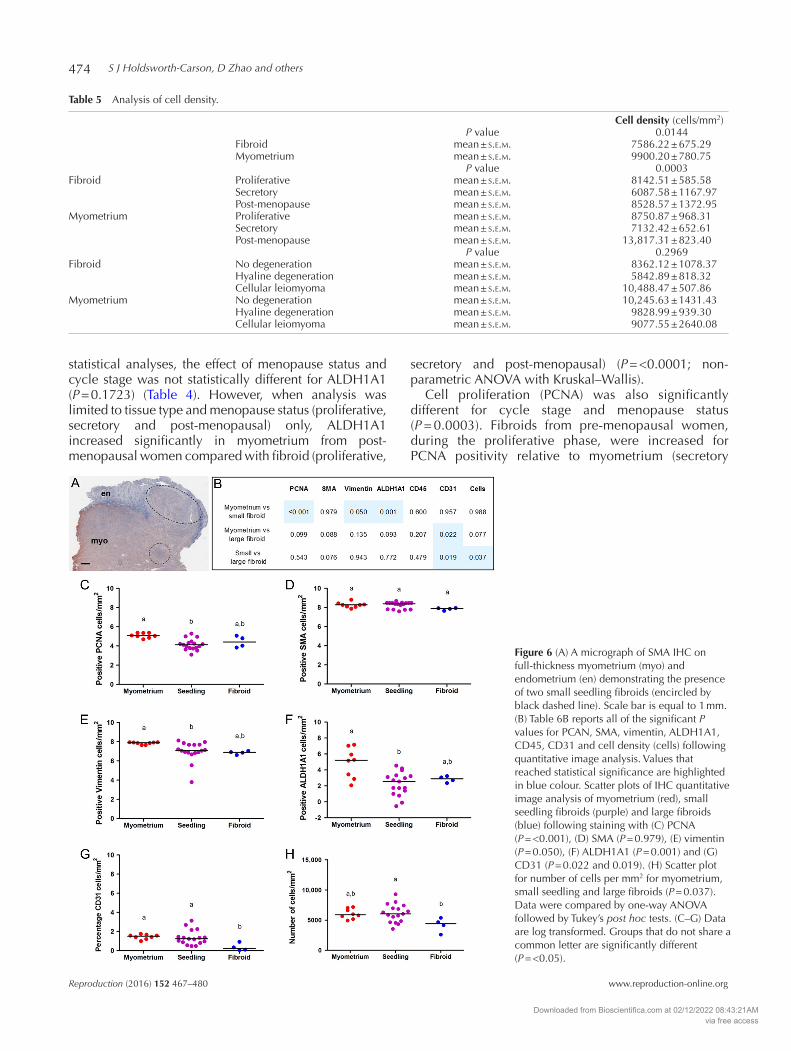
Figure 6 (A) A micrograph of SMA IHC on full-thickness myometrium (myo) and endometrium (en) demonstrating the presence of two small seedling fibroids (encircled by black dashed line). Scale bar is equal to 1 mm. (B) Table 6B reports all of the significant P values for PCAN, SMA, vimentin, ALDH1A1, CD45, CD31 and cell density (cells) following quantitative image analysis. Values that reached statistical significance are highlighted in blue colour. Scatter plots of IHC quantitative image analysis of myometrium (red), small seedling fibroids (purple) and large fibroids (blue) following staining with (C) PCNA (P = <0.001), (D) SMA (P = 0.979), (E) vimentin (P = 0.050), (F) ALDH1A1 (P = 0.001) and (G) CD31 (P = 0.022 and 0.019). (H) Scatter plot for number of cells per mm2 for myometrium, small seedling and large fibroids (P = 0.037). Data were compared by one-way ANOVA followed by Tukey’s post hoc tests. (C–G) Data are log transformed. Groups that do not share a common letter are significantly different (P = <0.05).
Downloaded from Bioscientifica.com at 02/12/2022 08:43:21AMvia free access
Small vs large uterine fibroids 475
www.reproduction-online.org Reproduction (2016) 152 467–480
and post-menopausal) and fibroid (post-menopausal) (Fig. 4F–H and J).
Three fibroid pathologies were represented on the tissue microarray: ‘typical’ no degeneration, hyaline degeneration and cellular leiomyoma (Fig. 3). SMA, vimentin, ALDH1A1, CD45 and CD31 were not significantly changed by the type of fibroid pathology (Table 4). Only PCNA staining was significantly altered by fibroid pathology, specifically elevated in cases with cellular leiomyoma present (P = 0.0344) (Table 4).
Counterstained nuclei were used to perform an overall analysis of cell density per unit area. Overall, fibroids demonstrated reduced cell density compared with myometrium (P = 0.0144) (Fig. 5A and Table 5). The effect of cycle stage and post-menopausal status on cell density was highly significant (P = 0.0003) (Fig. 5B and Table 5). Specifically, post-menopausal myometrium had significantly elevated cell density (Fig. 5B and Table 5). In contrast, fibroid pathology did not significantly have an impact on the number of cells/mm2 (P = 0.2969) (Fig. 5C and Table 5).
Analysis of small fibroids
A second group of women were recruited for evaluation of small ‘seedling’ fibroids (measuring ≤5 mm) (Table 2). Four out of seven women had histopathologically inactive endometrium. Patients 4 to 7 (Table 2) were documented as pre-menopausal and free from hormones (self-reported), as they were entering peri-menopause (age range 34–52 years) and/or were uninformed about the type of medication (i.e. synthetic hormone therapy) they were currently taking. Most of the women (6/7) had multiple fibroids, with an overall size range of approximately 1–200 mm. Figure 6A illustrates the presence of two individual seedling fibroids existing within close proximity to each other. The average diameter of a seedling fibroid was 3.3 ± 0.3 mm. When available, large fibroids were also collected from this cohort of women (Table 2). Fibroid pathology was heterogeneous in this group, and fibroids were mostly ‘typical’ and non-degenerative; however, Patients 3 and 4 also had fibroids of a degenerative sub-type.
Using quantitative image analysis following IHC, cell proliferation marker PCNA significantly reduced in seedling fibroids relative to normal myometrium (seedling 4.14 ± 0.14 and myometrium 5.10 ± 0.09 cells/mm2 (log transformed), P = <0.001) (Fig. 6B–C). In contrast, no significant difference was detected for PCNA in large fibroids compared with myometrium or small fibroids (P = 0.099).
Phenotypic markers for fibroblasts, vimentin and ALDH1A1 were also significantly reduced in seedling fibroids compared with matched myometrium (vimentin: seedling 7.01 ± 0.25 and myometrium 7.85 ± 0.04 cells/mm2 (log transformed), P = 0.050; ALDH1A1: seedling 2.26 ± 0.35 and myometrium
4.87 ± 0.67 cells/mm2 (log transformed), P = 0.001) (Fig. 6B and E–F). No significant changes were detected for vimentin or ALDH1A1 in large fibroids compared with myometrium or small fibroids (P = 0.135 and P = 0.093 respectively) (Fig. 6B); however, there was only n = 4 large fibroids for analysis in this cohort.
CD31 expression was significantly higher in seedling fibroids and myometrium compared with large fibroids (myometrium 1.45 ± 0.09, seedling 1.38 ± 0.19 and large fibroid 0.36 ± 0.20 percentage of cells/mm2 (log transformed), P = 0.022 and 0.019) (Fig. 6B and G). Using counterstained nuclei to count total cells (per mm2), we found that seedling fibroids had significantly increased cell density compared with large fibroids (seedling 6122.94 ± 363.00 and large fibroid 4209.50 ± 588.94 cells/mm2, P = 0.037) (Fig. 6B and H). SMA and CD45 did not demonstrate any significant differences between myometrium, seedling fibroids or large fibroids (Fig. 6B).
To determine whether small and large fibroids differed in the proportion of cells that were positive for SMC and fibroblast markers, we analysed the ratio of
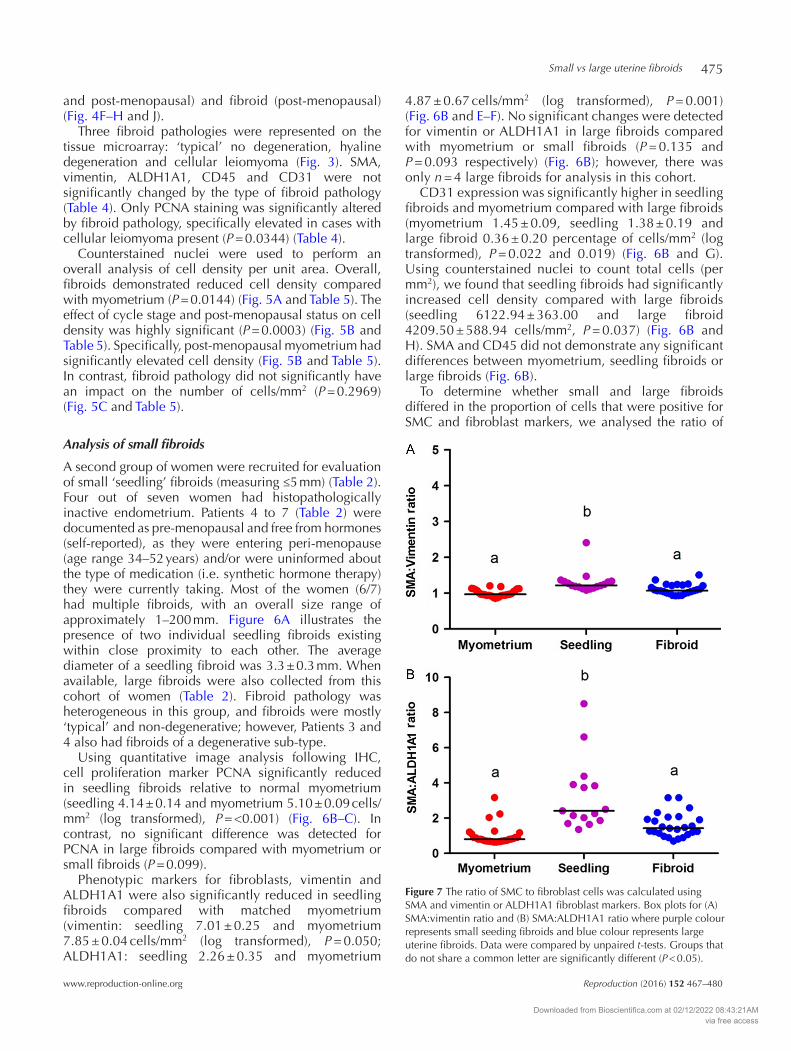
Figure 7 The ratio of SMC to fibroblast cells was calculated using SMA and vimentin or ALDH1A1 fibroblast markers. Box plots for (A) SMA:vimentin ratio and (B) SMA:ALDH1A1 ratio where purple colour represents small seeding fibroids and blue colour represents large uterine fibroids. Data were compared by unpaired t-tests. Groups that do not share a common letter are significantly different (P < 0.05).
Downloaded from Bioscientifica.com at 02/12/2022 08:43:21AMvia free access

S J Holdsworth-Carson, D Zhao and others476
Reproduction (2016) 152 467–480 www.reproduction-online.org
SMA to fibroblast markers vimentin and ALDH1A1. Two fibroblast cell markers were used due to the presence of more than one type of fibroblast population in fibroids. Ratio calculations allowed us to combine the data from the tissue microarray (myometrium and large fibroids) with the cohort of patients with small fibroid (myometrium n = 28, seedling fibroid n = 17 and large fibroid n = 25). Seedling fibroids had a significantly elevated SMA:vimentin ratio (myometrium 1.00 ± 0.02, seedling 1.31 ± 0.07 and large fibroid 1.11 ± 0.03 (log transformed), P = <0.0001) (Fig. 7A) and an increased SMA:ALDH1A1 ratio (myometrium 1.00 ± 0.10, seedling 3.26 ± 0.52 and large fibroid 1.59 ± 0.14 (log transformed), P = <0.0001) (Fig. 7B) compared with large fibroids and myometrium. There was no significant difference in SMC:fibroblast ratio when comparing myometrium with large fibroids (Fig. 7).
Discussion
The cellular composition of uterine fibroids consists of predominantly clonal SMCs and fibroblasts (Holdsworth-Carson et al. 2014b). In this study, we have shown for the first time that the cellular composition of small fibroids (≤5 mm diameter) differs significantly from that of large fibroids. When compared with each other, small fibroids are more cellular than large fibroids and have more blood vessels. Small fibroids also have a higher ratio of SMC to fibroblasts than large fibroids. Large fibroids have more cell proliferation (as measured by PCNA) and fewer leucocytes (as measured by CD45) than adjacent myometrium, whereas small fibroids are less proliferative and have similar number of leucocytes than adjacent myometrium. Our findings provide further insight into the cellular heterogeneity of benign uterine fibroids and support the concept that cellular differentiation of clonal cells that make up the fibroid continues over time as fibroid size increases.
Increased cellularity of seedling fibroids relative to large fibroids is most likely due to the increased abundance of ECM in larger fibroids (and thus reduced cell density). Flake and coworkers have previously demonstrated that as the collagen matrix increased in large fibroids, microvessel density decreased, which resulted in persistent separation of fibroid cells from their blood supply, giving rise to interstitial ischaemia (Flake et al. 2013). Our data show that CD31 staining, and presumably blood vessel density, is not reduced in seedling fibroids, which in turn suggests that ischaemia may not be as common within seedling fibroids compared with large fibroids.
The different cellular characteristics of small fibroids compared with large ones raise questions about possible mechanisms that might be at play during clonal expansion of a single myometrial cell to form a large fibroid. Resident myometrial SMCs normally move
through a programmed pattern of different phenotypes during gestation and then return to quiescence post-partum (Shynlova et al. 2009). Early pregnancy is associated with a rapid period of endocrine-controlled myometrial SMC proliferation (Shynlova et al. 2006). At mid-gestation, myometrial SMC proliferation subsides and the cells become more hypertrophic, associated with an increase in ECM synthesis (Shynlova et al. 2009). It is possible that the increased SMC:fibroblast ratio of seedling fibroids in some way reflects the early pregnancy myometrial proliferative phase. A subsequent switch to a more synthetic state could result in cells generating aberrant ECM networks, with further pathophysiological stimulation of cell proliferation leading to fibroid growth. Leppert and coworkers similarly believe that fibroid cells undergo progressive phenotypic shifts leading to altered growth in response to disordered extracellular signals and speculate that persisting myofibroblasts, which fail to undergo apoptosis, may be responsible (Leppert et al. 2006). This remains to be confirmed, as myofibroblasts do not appear to be a major cell population of fibroids compared with SMC or fibroblasts (Holdsworth-Carson et al. 2014b). Targeting of SMC plasticity and phenotypic adaptation could be a novel approach for the treatment of fibroids.
One possible explanation for the increased SMC:fibroblast ratio in seedling fibroids is that fewer SMC have differentiated into fibroblasts than in larger fibroids or myometrium. Whether such a transformation is regulated by a discrete trigger for cellular differentiation is an important question for understanding the mechanisms that drive fibroid growth. SMC can acquire fibroblast-like features that are associated with pathological conditions (Hayashi et al. 1998). For example, prostatic SMC undergo progressive morphological changes during tumour development and also take on fibroblast-like characteristics (Foster 2000, Taboga et al. 2008). SMCs can also undertake clonal expansion and differentiate into macrophage-like cells during atherosclerotic lesion formation (Feil et al. 2014). It has recently been hypothesized that the pathological environment regulates SMC transcription and gene expression mechanisms, ultimately leading to the changes in SMC phenotype (Scirocco et al. 2016). One possible scenario may include selective pressures in the fibroid’s microenvironment, which trigger some sub-clones to survive and expand to form large fibroids, whereas other sub-clones remain dormant (reviewed by Greaves & Maley 2012). Alternatively, given sufficient time to allow for growth, cells may transition stochastically between phenotypic states eventually evolving towards an equilibrium of heterogeneous cells (Gupta et al. 2011). The SMC:fibroblast ratio of large fibroids and myometrium was similar, although whether due to similar mechanistic processes or not is unknown at this stage.
Downloaded from Bioscientifica.com at 02/12/2022 08:43:21AMvia free access
Small vs large uterine fibroids 477
www.reproduction-online.org Reproduction (2016) 152 467–480
The different cellular characteristics detected between small and large fibroids may provide important clues as to the mechanisms that lead to uterine fibroid growth and the phases of SMC differentiation. Several plausible mechanistic pathways exist; for example, SMC proliferative events of early pregnancy are associated with the altered expression of insulin-like growth factor (IGF) family proteins under the control of the PI3K-Akt-mTOR signalling pathway (reviewed by Shynlova et al. 2009). The PI3K-Akt-mTOR pathway is active in proliferating cultures of uterine SMCs (Varghese et al. 2013). In disease progression, vascular SMCs change their phenotype from a differentiated to a de-differentiated state and lose the expression of SMC-specific markers (including SMA) and take on a fibroblast-like appearance (Hayashi et al. 1998, 1999). The PI3K-Akt signalling pathway is required for maintenance of vascular SMC-differentiated phenotype, whereas activation of an alternative pathway, ERK and p38MAPK, leads to SMC de-differentiation (Hayashi et al. 1999). Another potential mechanistic path involves mechanical signals that may be generated by the growing fibroid. Mechanical signals influence gene expression, cell morphology, cytoskeletal reorganization and cell differentiation (Zheng et al. 2014). Adherent cells sense mechanical tension and multiple intracellular signalling pathways are triggered leading to an autocrine loop; fibroblasts are stimulated to produce collagen, and TGF-β is induced by the tension and in turn activates collagen synthesis (Zheng et al. 2014). TGF-β signalling plays pivotal roles in SMC differentiation during development as well as phenotypic switching in disease states and can activate several signalling pathways (including MAPK and PI3K) (reviewed by Guo & Chen 2012). TGF-β levels have been hypothesized to play a role in governing the ratio of SMC to fibroblasts in prostatic stroma (Peehl & Sellers 1997).
Steroid hormones play a significant role in uterine fibroid growth, senescence and regression. We do not have longitudinal data on the fibroids included in this study; therefore, we have no way of knowing whether the small fibroids examined are developmentally small or have undergone regression. Oestrogen enhances the expression of many genes believed to play a role in fibroid growth (growth factors, collagens and oestrogen/progesterone receptors) (reviewed by Moravek et al. 2015). PCNA staining was higher in large fibroids compared with myometrium; this increase was associated with the proliferative phase of the menstrual cycle. A PCNA cycle stage effect has been observed earlier (Kayisli et al. 2007). We also demonstrated an increase in SMA in association with proliferative phase fibroids. Addition of E2 to cultured uterine fibroid cells increases PCNA protein expression (Shimomura et al. 1998). To support a role
for oestrogen, our results showed that fibroid PCNA levels drop significantly post-menopause. Menopause also had a great impact on fibroid cell density, where myometrium from post-menopausal women demonstrated increased cellularity. This may be due to loss of ECM once oestrogen stimulation ceases. We have previously shown that myometrial microvascular density also increases following menopause (Weston et al. 2005). It has been shown that drug-induced (GNRH agonist) menopause can increase myometrial cellularity (Weeks et al. 1999). Collectively, these data confirm the important relationship between steroid hormones and fibroid pathophysiology.
Myometrium from post-menopausal women exhibited increased ALDH1A1 expression. ALDH1A1 belongs to the retinoic acid (RA) pathway, which is known to be altered in fibroids (Catherino & Malik 2007, Zaitseva et al. 2007, Holdsworth-Carson et al. 2014a). Some RA pathway components are responsive to oestrogen, including cellular retinoic acid-binding protein 2 (CRABP2) (Li & Ong 2003), retinoid X receptor alpha (RXRα) and peroxisome proliferator-activated receptor gamma (PPARγ) (Tsibris et al. 1999). Our results suggest that in a low-oestrogen environment (post-menopause), the myometrium up-regulates ALDH1A1 expression. This is supported by the observation that E2 administration to ovariectomized rats reduced uterine ALDH1a1 expression (Li et al. 2004). Oestrogen functions via oestrogen receptors (ERα or ERβ), and there is a positive correlation between shrinkage rate of symptomatic fibroids after menopause and ER expression (Kasai et al. 2012). It is interesting that ALDH1A1-positive mammary stem cells are negative for ER expression (Honeth et al. 2014). Conversely, in large fibroids, where oestrogen and ER levels are higher relative to myometrium (Sumitani et al. 2000, Li & McLachlan 2001), ALDH1A1 is down-regulated, and consequently, RA levels may also be reduced. A reduction in RA could lead to lower activation of RXR and RARs, thereby inhibiting processes such as apoptosis and promoting cellular proliferation mechanisms (Catherino & Malik 2007, Zaitseva et al. 2007). There are no data yet for ALDH1A1, PCNA or SMA expression in small fibroids at different stages of menstrual cycle to determine whether they respond similarly to steroid hormones as do large fibroids. A larger subset of women, pre and post-menopause, is necessary to evaluate oestrogen effects on small seedling fibroids.
There were a number of significant differences in cell markers between large fibroids and normal matched myometrium. Thus, irrespective of cycle stage or fibroid pathology, PCNA, vimentin, ALDH1A1, CD45 and CD31 were all significantly different in large fibroids compared with myometrium. Some of these observations have been reported previously; for example, PCNA (Shimomura et al. 1998, Maruo et al. 2000,
Downloaded from Bioscientifica.com at 02/12/2022 08:43:21AMvia free access
S J Holdsworth-Carson, D Zhao and others478
Reproduction (2016) 152 467–480 www.reproduction-online.org
Dixon et al. 2002, Kayisli et al. 2007), ALDH1A1 (Zaitseva et al. 2007, 2008, Holdsworth-Carson et al. 2014b), CD45 (Chang et al. 2010) and CD31 (Casey et al. 2000). Following analysis of three common fibroid pathologies, ‘typical’ with no degeneration, hyaline degeneration and cellular leiomyoma, it was apparent that the type of fibroid does not have a great impact on cellular phenotypes. Although these findings are useful for distinguishing cellular characteristics between large uterine fibroids and normal myometrium, our more novel findings with respect to large fibroids come from our work examining their difference relative to small seedling fibroids.
In conclusion, we have shown that the cellular composition of small fibroids (≤5 mm diameter) differs significantly from that of larger fibroids. Small fibroids are more cellular than large fibroids, have more blood vessels and also have a higher ratio of SMC to fibroblasts than large fibroids. Large fibroids have more cell proliferation (as measured by PCNA) and fewer leucocytes (as measured by CD45) than adjacent myometrium, whereas small fibroids are less proliferative and have similar number of leucocytes than adjacent myometrium. Future research studies need to be performed in larger cohorts of women to (1) determine at what point during a small fibroids lifespan the ‘switch’ occurs, which triggers cell differentiation and fibroid proliferation and (2) to determine what mechanism(s) are responsible for controlling this system in small fibroids. The different cellular compositions we have identified between fibroids of different sizes may provide important clues as to the mechanisms that drive fibroid growth. Cellular heterogeneity may also help to explain differences in the growth patterns and symptomology of individual uterine fibroids.
Declaration of interest
The authors declare that there is no conflict of interest that could be perceived as prejudicing the impartiality of the research reported.
Funding
This work was supported by the National Health and Medical Research Council (606613 to P A W R) and the National Natural Science Foundation of China (NSFC81471436 to D Z). S J H-C is supported by the J.N Peters Bequest Fellowship (University of Melbourne).
Acknowledgements
The authors acknowledge Dr Qin Zhou, Department of Biostatistics, School of Public Health, Fudan University (Shanghai, China), for their support with statistical analysis. The authors also thank the research nurses Nancy Taylor, Frances Walker, Lee Ann Mahoney, Lorraine Thompson and
Ranita Charitra for tissue collection and finally thank all the women who kindly donated their tissue to this study.
ReferencesBachmann GA, Bahouth LA, Amalraj P, Mhamunkar V, Hoes K &
Ananth CV 2011 Uterine fibroids: correlations of anemia and pain to fibroid location and uterine weight. Journal of Reproductive Medicine 56 463–466.
Baird DD, Garrett TA, Laughlin SK, Davis B, Semelka RC & Peddada SD 2011 Short-term change in growth of uterine leiomyoma: tumor growth spurts. Fertility and Sterility 95 242–246. (doi:10.1016/ j.fertnstert.2010.05.011)
Baird DD, Saldana TM, Shore DL, Hill MC & Schectman JM 2015 A single baseline ultrasound assessment of fibroid presence and size is strongly predictive of future uterine procedure: 8-year follow-up of randomly sampled premenopausal women aged 35–49 years. Human Reproduction 30 2936–2944. (doi:10.1093/humrep/dev235)
Cardozo ER, Clark AD, Banks NK, Henne MB, Stegmann BJ & Segars JH 2012 The estimated annual cost of uterine leiomyomata in the United States. American Journal of Obstetrics and Gynecology 206 211.e1–211.e9. (doi:10.1016/j.ajog.2011.12.002)
Casey R, Rogers PAW & Vollenhoven BJ 2000 An immunohistochemical analysis of fibroid vasculature. Human Reproduction 15 1469–1475. (doi:10.1093/humrep/15.7.1469)
Catherino WH & Malik M 2007 Uterine leiomyomas express a molecular pattern that lowers retinoic acid exposure. Fertility and Sterility 87 1388–1398. (doi:10.1016/j.fertnstert.2006.11.093)
Chang HL, Senaratne TN, Zhang L, Szotek PP, Stewart E, Dombkowski D, Preffer F, Donahoe PK & Teixeira J 2010 Uterine leiomyomas exhibit fewer stem/progenitor cell characteristics when compared with corresponding normal myometrium. Reproductive Sciences 17 158–167. (doi:10.1177/1933719109348924)
Cramer SF, Mann L, Calianese E, Daley J & Williamson K 2009 Association of seedling myomas with myometrial hyperplasia. Human Pathology 40 218–225. (doi:10.1016/j.humpath.2008.07.004)
David M, Adams L & Stupin JH 2014 Natural size development of myomata – ultrasound observational study of 55 premenopausal patients. Geburtshilfe Frauenheilkd 74 75–80. (doi:10.1055/s-0033-1351072)
Dixon D, Flake G, Moore A, He H, Haseman J, Risinger J, Lancaster J, Berchuck A, Barrett C & Robboy S 2002 Cell proliferation and apoptosis in human uterine leiomyomas and myometria. Virchows Archiv 441 53–62. (doi:10.1007/s00428-001-0568-7)
Feil S, Fehrenbacher B, Lukowski R, Essmann F, Schulze-Osthoff K, Schaller M & Feil R 2014 Transdifferentiation of vascular smooth muscle cells to macrophage-like cells during atherogenesis. Circulation Research 115 662–667. (doi:10.1161/CIRCRESAHA.115.304634)
Flake GP, Moore AB, Flagler N, Wicker B, Clayton N, Kissling GE, Robboy SJ & Dixon D 2013 The natural history of uterine leiomyomas: morphometric concordance with concepts of interstitial ischemia and inanosis. Obstetrics & Gynecology International 2013 1–9. (doi:10.1155/2013/285103)
Foster CS 2000 Pathology of benign prostatic hyperplasia. Prostate 45 4–14. (doi:10.1002/1097-0045(2000)45:9+<4::AID-PROS3>3.0.CO;2-Q)
Greaves M & Maley CC 2012 Clonal evolution in cancer. Nature 481 306–313. (doi:10.1038/nature10762)
Guo X & Chen S-Y 2012 Transforming growth factor-β and smooth muscle differentiation. World Journal of Biological Chemistry 3 41–52. (doi:10.4331/wjbc.v3.i3.41)
Gupta PB, Fillmore CM, Jiang G, Shapira SD, Tao K, Kuperwasser C & Lander ES 2011 Stochastic state transitions give rise to phenotypic equilibrium in populations of cancer cells. Cell 146 633–644. (doi:10.1016/j.cell.2011.07.026)
Hayashi KI, Saga H, Chimori Y, Kimura K, Yamanaka Y & Sobue K 1998 Differentiated phenotype of smooth muscle cells depends on signaling pathways through insulin-like growth factors and phosphatidylinositol 3-kinase. Journal of Biological Chemistry 273 28860–28867. (doi:10.1074/jbc.273.44.28860)
Hayashi KI, Takahashi M, Kimura K, Nishida W, Saga H & Sobue K 1999 Changes in the balance of phosphoinositide 3-kinase/protein
Downloaded from Bioscientifica.com at 02/12/2022 08:43:21AMvia free access
Small vs large uterine fibroids 479
www.reproduction-online.org Reproduction (2016) 152 467–480
kinase B (Akt) and the mitogen-activated protein kinases (ERK/p38MAPK) determine a phenotype of visceral and vascular smooth muscle cells. Journal of Cell Biology 145 727–740. (doi:10.1083/jcb.145.4.727)
Holdsworth-Carson SJ, Zaitseva M, Girling JE, Vollenhoven BJ & Rogers PA 2014a Common fibroid-associated genes are differentially expressed in phenotypically dissimilar cell populations isolated from within human fibroids and myometrium. Reproduction 147 683–692. (doi:10.1530/REP-13-0580)
Holdsworth-Carson SJ, Zaitseva M, Vollenhoven BJ & Rogers PA 2014b Clonality of smooth muscle and fibroblast cell populations isolated from human fibroid and myometrial tissues. Molecular Human Reproduction 20 250–259. (doi:10.1093/molehr/gat083)
Holdsworth-Carson SJ, Craythorn RG, Winnall WR, Dhaliwal K, Genovese R, Nowell CJ, Rogers PAW, de Kretser DM, Hedger MP & Girling JE 2015 Follistatin is essential for normal postnatal development and function of mouse oviduct and uterus. Reproduction, Fertility and Development 27 985–999. (doi:10.1071/rd13372)
Honeth G, Lombardi S, Ginestier C, Hur M, Marlow R, Buchupalli B, Shinomiya I, Gazinska P, Bombelli S, Ramalingam V et al. 2014 Aldehyde dehydrogenase and estrogen receptor define a hierarchy of cellular differentiation in the normal human mammary epithelium. Breast Cancer Research 16 R52. (doi:10.1186/bcr3663)
Kasai M, Ichimura T, Kawamura N, Sumikura T, Matsuda M, Asano C, Sumi T & Ishiko O 2012 Prediction of the shrinking rate of uterine leiomyoma nodules using needle biopsy specimens. Fertility and Sterility 98 440–443. (doi:10.1016/j.fertnstert.2012.05.013)
Kayisli UA, Berkkanoglu M, Kizilay G, Senturk L & Arici A 2007 Expression of proliferative and preapoptotic molecules in human myometrium and leiomyoma throughout the menstrual cycle. Reproductive Sciences 14 678–686. (doi:10.1177/1933719107305866)
Koumas L, King AE, Critchley HO, Kelly RW & Phipps RP 2001 Fibroblast heterogeneity: existence of functionally distinct Thy 1(+) and Thy 1(−) human female reproductive tract fibroblasts. American Journal of Pathology 159 925–935. (doi:10.1016/S0002-9440(10)61768-3)
Laughlin SK, Herring AH, Savitz DA, Olshan AF, Fielding JR, Hartmann KE & Baird DD 2010 Pregnancy-related fibroid reduction. Fertility and Sterility 94 2421–2423. (doi:10.1016/j.fertnstert.2010.03.035)
Leppert PC, Catherino WH & Segars JH 2006 A new hypothesis about the origin of uterine fibroids based on gene expression profiling with microarrays. American Journal of Obstetrics and Gynecology 195 415–420. (doi:10.1016/j.ajog.2005.12.059)
Li S & Mclachlan JA 2001 Estrogen-associated genes in uterine leiomyoma. Annals of the New York Academy of Sciences 948 112–120. (doi:10.1111/j.1749-6632.2001.tb03992.x)
Li X-H & Ong D 2003 Cellular retinoic acid-binding protein II gene expression is directly induced by estrogen, but not retinoic acid, in rat uterus. Journal of Biological Chemistry 278 35819–35825. (doi:10.1074/jbc.M302551200)
Li XH, Kakkad B & Ong DE 2004 Estrogen directly induces expression of retinoic acid biosynthetic enzymes, compartmentalized between the epithelium and underlying stromal cells in rat uterus. Endocrinology 145 4756–4762. (doi:10.1210/en.2004-0514)
Maruo T, Matsuo H, Samoto T, Shimomura Y, Kurachi O, Gao Z, Wang Y, Spitz IM & Johansson E 2000 Effects of progesterone on uterine leiomyoma growth and apoptosis. Steroids 65 585–592. (doi:10.1016/S0039-128X(00)00171-9)
Maruo T, Ohara N, Wang J & Matsuo H 2004 Sex steroidal regulation of uterine leiomyoma growth and apoptosis. Human Reproduction Update 10 207–220. (doi:10.1093/humupd/dmh019)
Moore AB, Yu L, Swartz CD, Zheng XL, Wang L, Castro L, Kissling GE, Walmer DK, Robboy SJ & Dixon D 2010 Human uterine leiomyoma-derived fibroblasts stimulate uterine leiomyoma cell proliferation and collagen type I production, and activate RTKs and TGF beta receptor signaling in coculture. Cell Communication and Signaling 8 10. (doi:10.1186/1478-811X-8-10)
Moravek MB, Yin P, Ono M, Coon JS V, Dyson MT, Navarro A, Marsh EE, Chakravarti D, Kim JJ, Wei J-J et al. 2015 Ovarian steroids, stem cells and uterine leiomyoma: therapeutic implications. Human Reproduction Update 21 1–12. (doi:10.1093/humupd/dmu048)
Ono M, Qiang W, Serna VA, Yin P, Coon JS V, Navarro A, Monsivais D, Kakinuma T, Dyson M, Druschitz S et al. 2012 Role of stem cells in human uterine leiomyoma growth. PLoS ONE 7 e36935. (doi:10.1371/journal.pone.0036935)
Owen C & Armstrong AY 2015 Clinical management of leiomyoma. Obstetrics and Gynecology Clinics of North America 42 67–85. (doi:10.1016/j.ogc.2014.09.009)
Peddada SD, Laughlin SK, Miner K, Guyon J-P, Haneke K, Vahdat HL, Semelka RC, Kowalik A, Armao D, Davis B et al. 2008 Growth of uterine leiomyomata among premenopausal black and white women. PNAS 105 19887–19892. (doi:10.1073/pnas.0808188105)
Peehl DM & Sellers RG 1997 Induction of smooth muscle cell phenotype in cultured human prostatic stromal cells. Experimental Cell Research 232 208–215. (doi:10.1006/excr.1997.3525)
Schindelin J, Arganda-Carreras I, Frise E, Kaynig V, Longair M, Pietzsch T, Preibisch S, Rueden C, Saalfeld S, Schmid B et al. 2012 Fiji: an open-source platform for biological-image analysis. Nature Methods 9 676–682. (doi:10.1038/nmeth.2019)
Scirocco A, Matarrese P, Carabotti M, Ascione B, Malorni W & Severi C 2016 Cellular and molecular mechanisms of phenotypic switch in gastrointestinal smooth muscle. Journal of Cellular Physiology 231 295–302. (doi:10.1002/jcp.25105)
Shimomura Y, Matsuo H, Samoto T & Maruo T 1998 Up-regulation by progesterone of proliferating cell nuclear antigen and epidermal growth factor expression in human uterine leiomyoma. Journal of Clinical Endocrinology & Metabolism 83 2192–2198. (doi:10.1210/jc.83.6.2192)
Shynlova O, Oldenhof A, Dorogin A, Xu Q, Mu J, Nashman N & Lye SJ 2006 Myometrial apoptosis: activation of the caspase cascade in the pregnant rat myometrium at midgestation. Biology of Reproduction 74 839–849. (doi:10.1095/biolreprod.105.048124)
Shynlova O, Tsui P, Jaffer S & Lye SJ 2009 Integration of endocrine and mechanical signals in the regulation of myometrial functions during pregnancy and labour. European Journal of Obstetrics, Gynecology, and Reproductive Biology 144 S2–S10. (doi:10.1016/j.ejogrb.2009.02.044)
Singh SS & Belland L 2015 Contemporary management of uterine fibroids: focus on emerging medical treatments. Current Medical Research and Opinion 31 1–12. (doi:10.1185/03007995.2014.982246)
Sumitani H, Shozu M, Segawa T, Murakami K, Yang HJ, Shimada K & Inoue M 2000 In situ estrogen synthesized by aromatase P450 in uterine leiomyoma cells promotes cell growth probably via an autocrine/intracrine mechanism. Endocrinology 141 3852–3861. (doi:10.1210/en.141.10.3852)
Taboga SR, Scortegagna E, Siviero MP & Carvalho HF 2008 Anatomy of smooth muscle cells in nonmalignant and malignant human prostate tissue. Anatomical Record 291 1115–1123. (doi:10.1002/ar.20728)
Tsibris JCM, Porter KB, Jazayeri A, Tzimas G, Nau H, Huang H, Kuparadze K, Porter GW, O’brien WF & Spellacy WN 1999 Human uterine leiomyomata express higher levels of peroxisome proliferator-activated receptor γ, retinoid x receptor α, and all-trans retinoic acid than myometrium. Cancer Research 59 5737–5744.
Uhlen M, Fagerberg L, Hallstrom BM, Lindskog C, Oksvold P, Mardinoglu A, Sivertsson A, Kampf C, Sjostedt E, Asplund A et al. 2015 Proteomics. Tissue-based map of the human proteome. Science 347 1260419. (doi:10.1126/science.1260419)
Varghese BV, Koohestani F, Mcwilliams M, Colvin A, Gunewardena S, Kinsey WH, Nowak RA, Nothnick WB & Chennathukuzhi VM 2013 Loss of the repressor REST in uterine fibroids promotes aberrant G protein-coupled receptor 10 expression and activates mammalian target of rapamycin pathway. PNAS 110 2187–2192. (doi:10.1073/pnas.1215759110)
Weber AM, Mitchinson AR, Gidwani GP, Mascha E & Walters MD 1997 Uterine myomas and factors associated with hysterectomy in premenopausal women. American Journal of Obstetrics and Gynecology 176 1213–1219. (doi:10.1016/S0002-9378(97)70337-5)
Weeks AD, Wilkinson N, Arora DS, Duffy SR, Wells M & Walker JJ 1999 Menopausal changes in the myometrium: an investigation using a GnRH agonist model. International Journal of Gynecological Pathology 18 226–232. (doi:10.1097/00004347-199907000-00007)
Weston GC, Cattrall F, Lederman F, Vollenhoven BJ & Rogers PAW 2005 Differences between the pre-menopausal and post-menopausal
Downloaded from Bioscientifica.com at 02/12/2022 08:43:21AMvia free access

S J Holdsworth-Carson, D Zhao and others480
Reproduction (2016) 152 467–480 www.reproduction-online.org
uterine fibroid vasculature. Maturitas 51 343–348. (doi:10.1016/ j.maturitas.2004.08.017)
Zaitseva M, Vollenhoven BJ & Rogers PAW 2007 Retinoic acid pathway genes show significantly altered expression in uterine fibroids when compared with normal myometrium. Molecular Human Reproduction 13 577–585. (doi:10.1093/molehr/gam040)
Zaitseva M, Vollenhoven BJ & Rogers PAW 2008 Retinoids regulate genes involved in retinoic acid synthesis and transport in human myometrial and fibroid smooth muscle cells. Human Reproduction 23 1076–1086. (doi:10.1093/humrep/den083)
Zhao D & Rogers PAW 2013 Is fibroid heterogeneity a significant issue for clinicians and researchers? Reproductive BioMedicine Online 27 64–74. (doi:10.1016/j.rbmo.2013.04.001)
Zheng L-H, Cai F-F, Ge I, Biskup E & Cheng Z-P 2014 Stromal fibroblast activation and their potential association with uterine fibroids (Review). Oncology Letters 8 479–486. (doi:10.3892/ol.2014.2225)
Received19 April 2016First decision 13 May 2016Revised manuscript received 10 July 2016Accepted 15 August 2016
Downloaded from Bioscientifica.com at 02/12/2022 08:43:21AMvia free access