Stable carbon and nitrogen isotopic composition of diet and hair of Gidra‐speaking Papuans
33
Stable Carbon and Nitrogen Isotopic Composition of Benthic and Pelagic Organic Matter in Lakes of the McMurdo Dry Valleys, Antarctica JENNIFER LAWSON 1,? , PETER T. DORAN 1 , FABIEN KENIG 1 , DAVID J. DES MARAIS 2 and JOHN C. PRISCU 3 1 Department of Earth and Environmental Sciences, University of Illinois at Chicago, Chicago, Illinois 60607-7059, USA; 2 NASA Ames Research Center, Moffett Field, California 94035, USA; 3 Department of Land Resources and Environmental Sciences, Montana State University at Bozeman, Bozeman, Montana 59717-3120, USA Abstract. The perennially ice-covered lakes in the McMurdo Dry Valleys, Antarctica, are part of the coldest and driest ecosystem on earth. To understand lacustrine carbon and nitrogen cycling in this end-member ecosystem, and to define paleolimnological proxies for ice-covered lakes, we measured the stable carbon and nitrogen isotopic composition of particulate organic matter (POM) and benthic organic matter (BOM) within the lakes of Taylor Valley. The d 13 C com- positions of seasonally ice-free edges of the lakes (moats) are enriched relative to under-ice organic matter. Thus, the organic carbon isotopic composition of buried sediments may be a proxy for sample position within the lake. In the moats, d 13 C values are governed by limited CO 2 diffusion across benthic cyanobacterial cell membranes. During a high glacial melt (2001–2002) season, both d 13 C POM and d 13 C BOM in the moats were more depleted than during previous low melt years. We propose that this occurred in response to higher [CO 2 ] (aq) and/or reduced growth rates resulting from turbidity-induced light limitation. Though moats and under-ice environ- ments are usually poorly connected, during the 2001–2002 season, the enrichment of the d 13 C POM values at 6 m depth in the stream-proximal sites relative to deep-profile sites implies enhanced connectivity between these environments. The d 13 C compositions of BOM and POM profiles in Lake Hoare and Lake Fryxell indicate that these lakes are dominated by benthic productivity. In contrast, in Lake Bonney, the similarity of the d 13 C values of BOM and POM indicates the pelagic component dominance in the carbon cycle. Key words: carbon stable isotope, nitrogen stable isotope, organic matter, limnology, Antarctica, dry valleys, Taylor Valley 1. Introduction Stable isotopic carbon and nitrogen compositions of organic matter (OM) have been widely used to trace biogeochemical processes in lacustrine and marine environments (e.g., Hedges et al., 2001; Lehmann et al., 2002; Meyers ? Author for correspondence, E-mail: [email protected] Aquatic Geochemistry 10: 269–301, 2004. Ó 2004 Kluwer Academic Publishers. Printed in the Netherlands. 269
-
Upload
independent -
Category
Documents
-
view
0 -
download
0
Transcript of Stable carbon and nitrogen isotopic composition of diet and hair of Gidra‐speaking Papuans
Stable Carbon and Nitrogen Isotopic
Composition of Benthic and Pelagic Organic
Matter in Lakes of the McMurdo Dry
Valleys, Antarctica
JENNIFER LAWSON1,?, PETER T. DORAN1, FABIEN KENIG1,DAVID J. DES MARAIS2 and JOHN C. PRISCU3
1Department of Earth and Environmental Sciences, University of Illinois at Chicago, Chicago,
Illinois 60607-7059, USA; 2NASA Ames Research Center, Moffett Field, California 94035, USA;3Department of Land Resources and Environmental Sciences, Montana State University at
Bozeman, Bozeman, Montana 59717-3120, USA
Abstract. The perennially ice-covered lakes in the McMurdo Dry Valleys, Antarctica, are part of
the coldest and driest ecosystem on earth. To understand lacustrine carbon and nitrogen cycling
in this end-member ecosystem, and to define paleolimnological proxies for ice-covered lakes, we
measured the stable carbon and nitrogen isotopic composition of particulate organic matter
(POM) and benthic organic matter (BOM) within the lakes of Taylor Valley. The d13C com-
positions of seasonally ice-free edges of the lakes (moats) are enriched relative to under-ice
organic matter. Thus, the organic carbon isotopic composition of buried sediments may be a
proxy for sample position within the lake. In the moats, d13C values are governed by limited CO2
diffusion across benthic cyanobacterial cell membranes. During a high glacial melt (2001–2002)
season, both d13CPOM and d13CBOM in the moats were more depleted than during previous low
melt years. We propose that this occurred in response to higher [CO2](aq) and/or reduced growth
rates resulting from turbidity-induced light limitation. Though moats and under-ice environ-
ments are usually poorly connected, during the 2001–2002 season, the enrichment of the d13CPOM
values at 6 m depth in the stream-proximal sites relative to deep-profile sites implies enhanced
connectivity between these environments. The d13C compositions of BOM and POM profiles in
Lake Hoare and Lake Fryxell indicate that these lakes are dominated by benthic productivity. In
contrast, in Lake Bonney, the similarity of the d13C values of BOM and POM indicates the
pelagic component dominance in the carbon cycle.
Key words: carbon stable isotope, nitrogen stable isotope, organic matter, limnology,
Antarctica, dry valleys, Taylor Valley
1. Introduction
Stable isotopic carbon and nitrogen compositions of organic matter (OM)have been widely used to trace biogeochemical processes in lacustrine andmarine environments (e.g., Hedges et al., 2001; Lehmann et al., 2002; Meyers
? Author for correspondence, E-mail: [email protected]
Aquatic Geochemistry 10: 269–301, 2004.
� 2004 Kluwer Academic Publishers. Printed in the Netherlands.269

and Eadie, 1993; Quay et al., 1986). The isotopic compositions of particulateand sedimentary OM are useful in assessing their origins and studying carboncycling in lake systems (e.g., Gu et al., 1996; Hecky et al., 1993; LaZerte,1983; Ostrom et al., 1998; Quay et al., 1992). Besides the importance ofknowing the origin of OM carbon and nitrogen to understand modernecosystem structure and function, the isotopic signature of carbon andnitrogen accumulating in sediments can also provide powerful proxies forpaleolimnological reconstruction (e.g., Harvey et al., 1995; Henrichs andDoyle, 1986; Macko and Ostrom, 1994; Meyers and Eadie, 1993; Meyers andIshiwatari, 1993).
Antarctic lakes of the McMurdo Dry Valleys (MDVs) represent one of thecoldest ecosystems on earth (Doran et al., 2002a; Fountain et al., 1999). Inthese extreme environments, the constraints imposed on carbon and nitrogenisotopic signatures of lake OM transformations by minimal stream input,closed lake basins, permanent lake ice-covers, and strong salinity stratifica-tion have not been thoroughly studied. The physical limnology of theseice-covered lakes are considerably different from well-studied mid- andlow-latitude lakes (e.g., Brenner et al., 1999; McKenzie, 1980).
The distribution and isotopic composition of organic carbon and nitrogenin soils of the dry valleys have been investigated to characterize allochtho-nous inputs to the lakes and provenance of soil OM (Burkins et al., 2000;Fritsen et al., 2000). Studies of carbon and nitrogen isotopic chemistry ofOM in the MDV lakes have predominantly focused on Lake Hoare (Bishopet al., 2001; Doran et al., 1998; Neumann et al., 1998; Wharton et al., 1993).In Lake Hoare, the carbon isotopic composition of microbial mats, sedi-ments, and dissolved inorganic carbon (DIC) have indicated that diffusionlimitation of CO2 across cell membranes is a major control of the isotopiccomposition of benthic organic matter (BOM), while in deeper zones, there ispreferential uptake of 12C due to supersaturation of [CO2](aq), approachingfull expression of the ribulose-1,5-bisphosphate carboxylase (RUBISCO)enzyme (Doran et al., 1998).
In this paper we characterize the d13C and d15N of various OM poolsin four MDV lakes, as well as associated d13C of DIC in the lake waterto better understand OM transformations in these systems. These resultsrefine our knowledge of carbon and nitrogen flow in these lake ecosystemsand provide a calibrated sediment signature for future paleoenvironmentalwork.
2. Environmental Setting and Character of Taylor Valley Lakes
Taylor Valley (TV) is one of the MDVs of east Antarctica (Figure 1). In thispolar desert, valley bottom mean annual precipitation is less than 10 cm andmean annual temperatures range from )14.8 to )30 �C (Doran et al., 2002b).
270 JENNIFER LAWSON ET AL.

Despite these extremes, liquid water is present throughout the year inice-covered lakes and during the summer months, glacial melt water feedsephemeral streams that supply the lakes.
We focus on four main lakes in TV: Lake Fryxell, Lake Hoare, East LakeBonney (ELB), and West Lake Bonney (WLB). Distinguishing physical andchemical parameters of each lake are presented in Table I and Figures 2–4.The two lobes of Lake Bonney are dealt with separately since they are geo-chemically and biologically distinct, being only connected though their sur-face waters at a shallow (12 m) channel (Spigel and Priscu, 1998). These lakeshave no surface outflows, and are permanently covered by 3–6 m of ice. Thewater columns maintain their stratification year-round, a result of the wind-shielding effect of the ice-cover, low advective stream flow, and strongchemical gradients (Spigel and Priscu, 1998).
During most austral summers, edges of the lakes melt out creating ice-freemoats that can be up to 3% of the lake surface area (Wharton et al., 1986)and are larger near stream mouths (Miller and Aiken, 1996), and smaller inareas of the lakes where the lake bed drops off steeply from the shore (e.g.,
Figure 1. Map of Taylor Valley showing all major landscape units (http://huey.colo-
rado.edu).
ANTARCTIC LACUSTRINE STABLE ISOTOPES 271

much of WLB and ELB). Although there is hydrologic exchange between themoat and under-ice environments, as evidenced by their common level in thelate summer, exchange must be limited, as reflected by various geochemicalsignatures. For example, isolation of the lakes from the atmosphere is indi-cated by very old ages (low 14C abundance) of DIC (Doran et al., 1999), andsupersaturation of trapped dissolved gases which accumulate throughphysical and biological processes (Andersen et al., 1998; Neumann et al.,1998; Priscu et al., 1998; Wharton et al., 1986, 1987). Yet, in deep waters ofLakes Fryxell and Hoare, some exchange with the atmosphere is indicated bypresence of anthropogenic 3H (Miller and Aiken, 1996) and chlorofluoro-carbon compounds (Tyler et al., 1998).
Local glaciers supply meltwater to the lakes, either directly or via streams,during an 8–12 week period during the austral summer. Meltwater to LakeFryxell basin is stream dominated with a smaller direct glacier meltwatercomponent (McKnight and Andrews, 1993a). Lake Hoare receives mostmeltwaters from direct glacial melt off Canada Glacier or from AndersenCreek, whose source is Canada Glacier (McKnight and Andrews, 1993b). Asmaller lake to the west, Lake Chad, also drains into Lake Hoare during highlake stands (McKnight and Andrews, 1993b). WLB receives its freshwaterdirectly from Taylor Glacier and its alpine streams, while ELB, the only lakenot directly in contact with a glacier, receives most of its water from WLBthrough theBonney narrows and fromPriscu Stream (Spigel andPriscu, 1998).
All the lakes have fresh surface waters and saline bottom waters, theexception being Lake Hoare, which is fresh throughout its water column
Table I. Physical and chemical characteristics of Taylor Valley Lakes
Lake
Fryxell
Lake
Hoare
East
Lake Bonney
West
Lake Bonney
Maximum depth (m) 20 34 40 40
Maximum length (km) 5.8 4.2 4.8 2.6
Maximum width (km) 2.1 1 0.9 0.9
Surface area (SA) (m2 · 106) 7.08 2.9 3.32 0.99
Volume (V) (m3 · 106) 53.4 24.2 72.4 17.4
SA:V (m)1) 0.13 0.12 0.05 0.06
Average ice thickness (m) 3.3–4.5 3.1–5.5 3–4.5 2.8–4.5
CO2(aq) equilibrium deptha 0 mb 10 m 10 m 10 mc
Depth of PPR max 5 and 9 m 6 m 12 m 13 m
aBelow this depth water is saturated in CO2. Water below chemoclines is highly supersaturated in
CO2 and shows no seasonal variation, except in Lake Hoare. Data from Neumann et al. (2001).bAll depths in Lake Fryxell are saturated with respect to CO2.cEquilibrium depth shifts to 6 m later in summer season.
Note: data from http://huey.colorado.edu.
272 JENNIFER LAWSON ET AL.
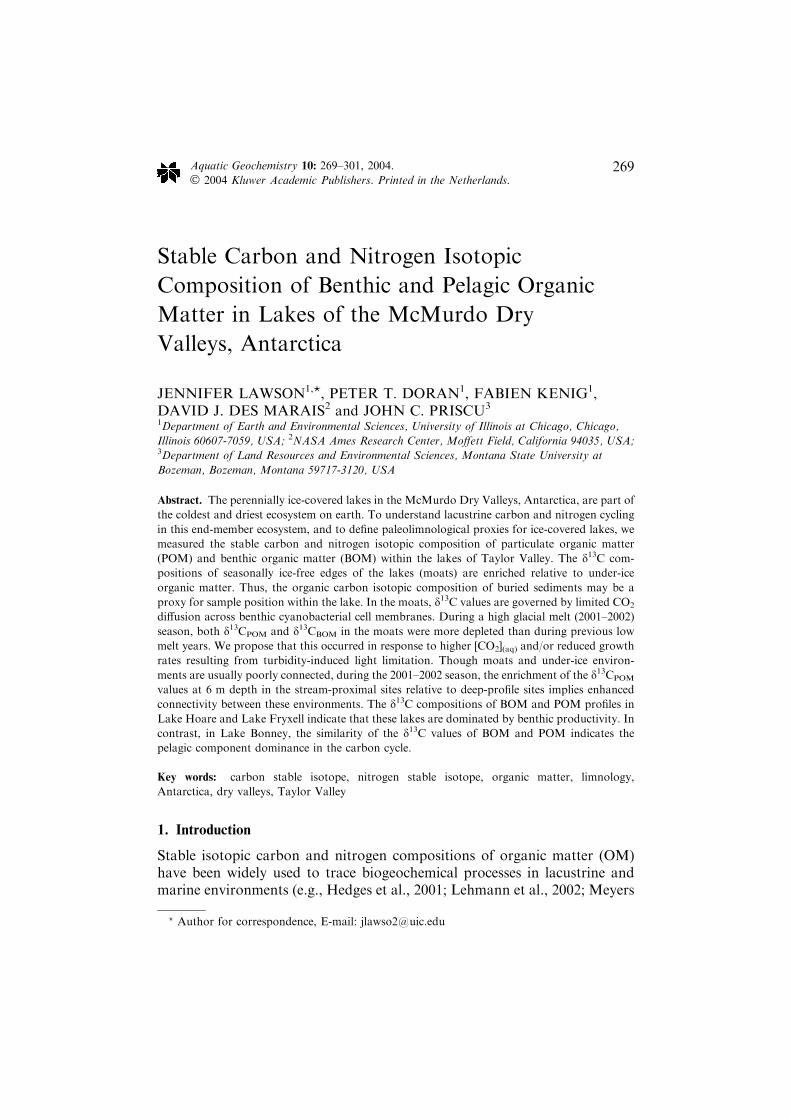
Figure
2.Tem
perature,conductivity,pH
anddissolved
oxygen
profiles.TheDO,pH
(pH
scale)andtemperature
profiles(�C)are
meanvalues
from
theMcM
LTER
data
set(http://huey.colorado.edu)from
1993to
2000.Conductivitydata
(mS/cm)forthesametime-series
are
provided
byJ.
C.Priscu,unpublished
data.
ANTARCTIC LACUSTRINE STABLE ISOTOPES 273

(Spigel and Priscu, 1998). ELB and WLB have hypersaline bottom waters,and Lake Fryxell’s bottom waters below 9.5 m are brackish (Figure 2). Thelate Quaternary glacial history of TV has played a critical role in shaping thesalinity profile of the lakes. About 12.7–23.8 kyr BP the valley was inundatedby Glacial Lake Washburn (Hall et al., 2000; Hendy, 2000a), which wasformed by damming of the eastern end of the valley by the Ross Ice Shelf.Washburn lake levels fluctuated significantly following the last glacial max-imum, and ultimately drained following the Ross Ice Shelf retreat approxi-mately 8.3 kyr BP (Hall and Denton, 2000a, b). Lake levels in the dry valleyshave continuously changed being mostly at or below current levels sinceabout 8 kyr BP (Doran et al., 2004). Of particular note is a severe cold anddry period about 1.2 kyr BP when Lakes Bonney and Fryxell were drawndown to small brine ponds, before being refilled with fresh glacial melt,contributing to the strong salinity gradient we see today (Lyons et al., 1998).
Figure 3. (a) Photosynthetically active radiation (PAR) for Taylor Valley lakes. Lines for
each of lake represent the average of the three profiles with the highest average radiation in
a record of summer PAR from 1993 to 2000. All profiles meeting these criteria fell in
December. The amount of ambient surface light penetrating the ice-cover to reach 5 m
depth in the water column is shown in the box. Each profile chosen for this comparison did
not have a corresponding surface PAR measurement resulting in the different sample sizes
in the box. (b) Primary productivities (PPR) for Taylor Valley lakes. Lines for each lake
represent the 1993–2000 averages during the month of December. Figure 3a and b show
ELB (closed square), WLB (open square), Lake Fryxell (closed circle), and Lake Hoare
(open circle).
274 JENNIFER LAWSON ET AL.

Figure 4. Sample locations and bathymetry of each lake. Black, grey, and open dots
represent samples collected in 1999–2000, 2000–2001, and 2001–2002 field seasons,
respectively. The grey dots located in the center basins of Lake Fryxell, Lake Hoare, ELB,
and WLB, represent the POM profile sampling localities and are labeled A, B, and C. The
significance of this nomenclature is made clear in Figure 5.
ANTARCTIC LACUSTRINE STABLE ISOTOPES 275
The difference in salinity between these two lakes is believed to be relatedto differential frequency of desiccation/salt deflation events (Lyons et al.,1999, 1998); deflation presumably happened less frequently in Lake Bonney.Lake Hoare is believed to have dried up completely during the 1.2 kyr BPdrawdown, the salts deflated, and freshwater reintroduced to the basincreating the relatively fresh water column of today. Loss of ice-cover andwind-driven mixing of TV lakes has almost certainly contributed to theircurrent physiochemical state, but presently, little is known about theice-cover history.
When perennial ice-cover is present, sediments can be blown across thelake cover or trapped on the ice surface. During the summer, trappedsediments get warmed by the sun and melt into the ice. The dynamics ofsediment movement within the ice-cover have been thoroughly described byseveral authors (Adams et al., 1998; Andersen et al., 1993; Hendy, 2000b;McKay et al., 1985; Priscu, 1998) and will not be repeated here. As such,differences in the sediment load of the ice-covers, in conjunction with icethickness and bubble density, are likely responsible for the variable lightregimes in the lake water columns (Figure 3a). Lake Bonney has thinnerand cleaner ice-covers, while Lake Hoare and Lake Fryxell have thicker ice-covers (Doran et al., 2002b) containing a higher sediment concentration(Konley, 2002).
Benthic microbial mats in Taylor Valley lake moats are primarily com-posed of cyanobacteria (Hawes and Schwarz, 1999; Wharton et al, 1983).These mats are generally thinner than their under-ice counterparts and followthe contours of the sediment and rocks in the moats (Hawes and Schwarz,1999). Deeper under-ice microbial mats consist primarily of cyanobacteriaalong with several species of pennate diatoms and heterotrophic bacteria,although their macromorphology differs as controlled by the unique phys-iochemical parameters in each lake (Wharton et al., 1983). Of note, is the lackof photoautotrophic mat growth below �20 m in Lake Bonney (Priscu, 1992;Wharton, 1983).
The TV lakes’ current light regime and water column stratification con-strain the distribution of photoautotrophy. For instance, in the deepest partof ELB, a nutrient rich pool of high salinity water was formed during a pastevaporation event and subsequently covered by nutrient deficient water(Priscu, 1995; Priscu et al., 1999). Because the lakes are permanently ice-covered and strongly density stratified, the deep nutrients are transportedslowly upwards by molecular diffusion. Primary productivity (PPR) near thesurface of the lakes is nutrient-limited, and therefore productivity maximaare found lower in the water column where light levels decrease, but nutrientsare more abundant (Priscu, 1995; Priscu et al., 1999). One exception is LakeHoare, where PPR is light limited and nutrient concentrations remain rela-tively unchanged with depth (Figure 3b).
276 JENNIFER LAWSON ET AL.

The PPR data presented in Figure 3b were obtained from pelagic profiles inthe center of the lakes. However, whole-lake productivity, inclusive of benthiccontribution, is only known for Lake Hoare (Moorhead and Hawes, unpub-lished data). In steep-sided lakes like Lake Bonney, the benthic contribution towhole-lake PPR is expected to be very small. The opposite extreme is LakeFryxell where the high area/volume ratio and relatively shallow depth (Table I)suggest that the benthic PPR may dominate whole-lake PPR. Hawes andSchwarz (1999) have estimated in situ benthic production (December 1996) inLake Hoare moats as 140 mg C m)2 d)1 and ranges from 10 to110 mg C m)2 d-1 under the ice. These rates of in situ benthic productivity arevery high relative to those measured for pelagic communities. Priscu (1995)calculated daily integrated PPR as 7.5 mg C m)2 d)1, making the pelagiccomponent less than 10% of the whole-lake PPR in Lake Hoare.
3. Methods
3.1. FIELD METHODS
Water column and sedimentary OM were collected in each of the four TVlakes over three Antarctic summer field seasons (November January 1999–2002). The 1999–2000 season involved collecting sediment surface OM(microbial mat and/or sediment) along the long-axes of the lakes includingassociated water samples from immediately above the sediment/water inter-face (Figure 4). Extensive moat and stream sampling occurred throughoutthe 2000–2001 season. In comparison to the previous two field seasons, the2001–2002 austral summer had widespread glacial melt and large moatdevelopment, estimated to be at least 3–4 times larger than in previous years.Lake levels rose approximately 1 m and there was a 5-fold increase in totalstream flow of all TV gauged streams from 2000–2001 (1.2 · 106 m3) to2001–2002 (5.2 · 106 m3) summers (P.T. Doran, unpublished data). We referto the 2001–2002 season as the ‘‘flood year’’ and the previous two fieldseasons as ‘‘non-flood years’’. During the flood year, stream-proximal andstream-distal depth transects were sampled in each of the four lakes(Figure 5). Within these transects, we sampled POM at 5–8 (depending onlake depth) discrete water depths and BOM at lake bottom.
Ice-cover sediment was collected from the Lake Hoare ice surface inthree locations (east, center, west), along the long axis of the lake. Benthicsurface sediment samples were also collected by dredging from the icesurface or directly by SCUBA-equipped divers. In the deep waters of ELB,sediments were mostly halite crystals; therefore, sediments were scrapedfrom the dredged crystals for analyses. All samples were immediatelywrapped in precombusted aluminum foil, inserted into Whirl-pak bags andfrozen at )20 �C.
ANTARCTIC LACUSTRINE STABLE ISOTOPES 277
Ten sediment traps were deployed in November 2000 on the sedimentsurface at 8 m depth in Lake Hoare (see location on Figure 4b) and retrieved2 years later. These traps were 1 L amberNalgene bottles with affixed legs. Thebottles were poisoned with 5 mg L)1 solutions of benzalkonium chloride andsodium chloride (Acros Organic). Large Mark 78H-21 PARFLUX time seriessediment traps (McLane Research) were deployed at 35 m in the deep basincenters of Lake Bonney in December of 2000 and recovered one year later.These traps were also poisoned with benzalkonium chloride (<5 mg L)1).
At each sampling depth, 3 L of water was collected using Kemmererbottles. Water was slowly transferred from a release valve at the end of theKemmerer bottle into deionized water rinsed 1 L high density polyethylene(HDPE) amber bottles, allowed to overflow, and then capped. In shallowmoat regions, water was collected directly into the three submerged HDPENalgene bottles. In the field, DIC water samples were then filtered intoprecombusted glass serum bottles through precombusted 25 mm WhatmanGF/F syringe filters, poisoned with benzalkonium chloride, and sealed withTeflon-faced septa.
3.2. LABORATORY METHODS
Sediment surface samples were dried at 60 �C for 48 h and sieved through2 mm mesh sieves. McLane sediment trap samples were sieved into threefractions <63 lm, 63–250 lm, and >250 lm. Carbon and nitrogen isotopeanalyses were conducted on the Thermo Finnigan Delta Plus XL MassSpectrometer interfaced with a CE Instruments NC2500 Elemental Analyzerwith an A200 autosampler at the Environmental Isotope Geochemistry Lab,University of Illinois at Chicago. All stable isotope signatures are reported asper mil relative to VPDB and air for carbon and nitrogen, respectively.
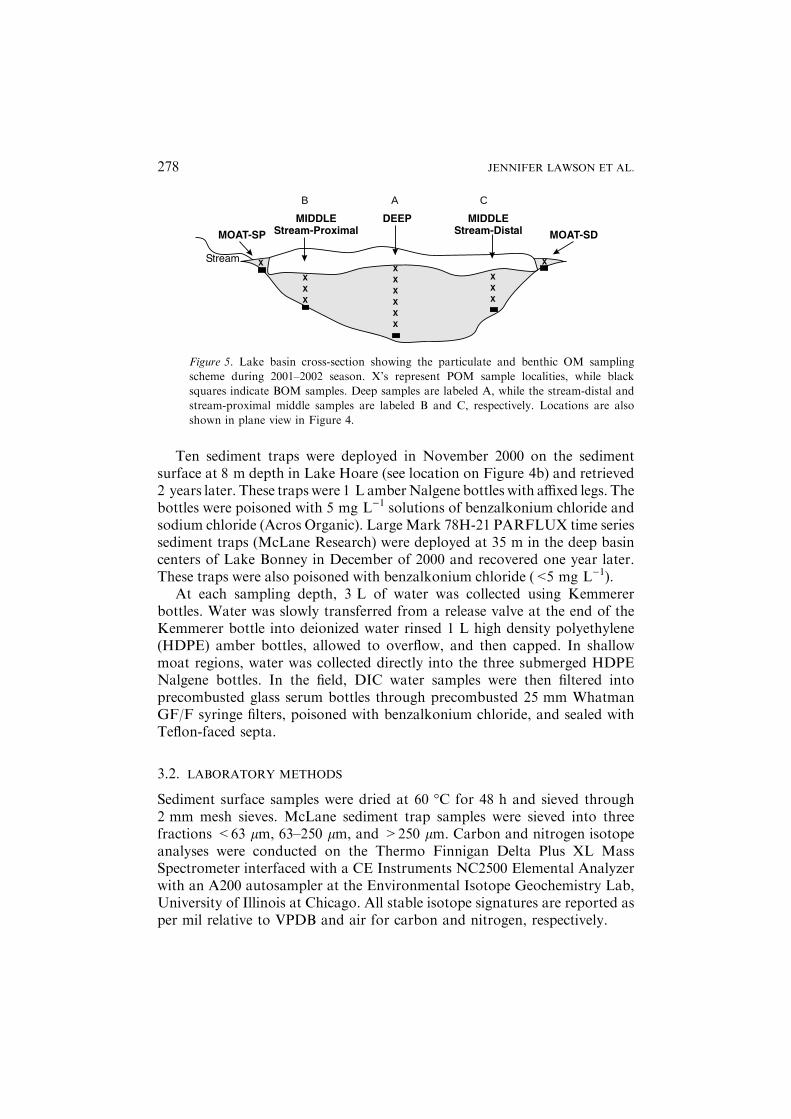
B A C
Figure 5. Lake basin cross-section showing the particulate and benthic OM sampling
scheme during 2001–2002 season. X’s represent POM sample localities, while black
squares indicate BOM samples. Deep samples are labeled A, while the stream-distal and
stream-proximal middle samples are labeled B and C, respectively. Locations are also
shown in plane view in Figure 4.
278 JENNIFER LAWSON ET AL.
Lacustrine BOM samples were tested for sample heterogeneity. Becausegrain sizes in moat samples are coarser than in deep samples, two differentmoat samples and a deep lake basin sample were used to test for differencesin precision of isotopic data between samples with very different granulom-etry. The standard deviation for sandy moat samples (n ¼ 18) was 0.4& ford15N and 1.1& for d13C (n ¼ 19), while in a microbial mat dominated (nosand particles) moat sample, the standard deviation was 0.6& for d15N(n ¼ 18) and 0.9& for d13C (n ¼ 20). The standard deviation for deep BOMwas 0.5& for d15N (n ¼ 20), and 0.6& for d13C (n ¼ 20). The instrumentanalytical precision for d13C is 0.1& and d15N is 0.2&.
For stable carbon isotopic analyses, POM was filtered from an aliquot(700—2700 ml) of lake water sample onto precombusted 47 mm WhatmanGF/F glass fiber filters and then dried at 60 �C for 24 h. These filters weresubsampled by punching 9 mm diameter disks that were subsequently cut andplaced inside 5 · 9 mm silver capsules, acidified with sulfurous acid, and driedagain at 60 �C prior to analyses. Internal POM standards were developed totest for homogeneity and accuracy in field sampling and lab techniques. Weanalyzed several duplicates and portions of the same filter sample. Thesesampling errors fell within the analytical error of the mass spectrometer.
DIC water samples for d13C analyses were cryogenically separated on avacuum extraction line and analyzed at the Stable Isotope Laboratory,Ann Arbor Michigan, on a Finnigan MAT Delta S, with an analyticalprecision of 0.11&.
Microbial species identifications were conducted at Desert ResearchInstitute, Reno, Nevada, with a combination of light and epifluorescentmicroscopy (Olympus BX 60).
3.3. d13C OF SEDIMENT TRAP ORGANIC MATTER
Weighted average carbon isotopic signatures (d13COM) were calculated forELB and WLB sediment trap samples using Equation (1).
d13COM ¼ d13C<63ðC<63Þ þ d13C63�250ðC63�250Þ þ d13C>250ðC>250ÞðC<63 þ C63�250 þ C>250Þ
: ð1Þ
Subscripts represent the grain size fractions (lm) of the sediments andweights of carbon (values inside the parentheses) are in mg. We calculatedaveraged weights by averaging the carbon composition for each individualgrain size fraction per lake and the associated isotopic composition for thegrain size. This method was used to eliminate any bias from using too fewsamples, as only a total of five samples out of a possible 29 had all three grainsizes recovered and analyzed for their d13C values. This also assumes that theaverage isotopic compositions are representative of those particular grain size
ANTARCTIC LACUSTRINE STABLE ISOTOPES 279

fractions. This assumption is valid as each grain size fraction is significantlydistinct from the others. The weighted carbon isotopic average for ELBsediment traps was )13.9 ± 0.7&, while that of WLB was )30.5 ± 0.5&.To check that our isotopic composition averaging of the grain size fractionswas valid, we calculated weighted d13C for samples which we have all threegrain size fractions (Table II) and averaged those results. The ELB and WLBweighted averages are )15.6 ± 2.9& (n ¼ 2), )30.75 ± 0.6& (n ¼ 3),respectively.
4. Results
4.1. INTER-LAKE COMPARISONS OF ORGANIC MATTER
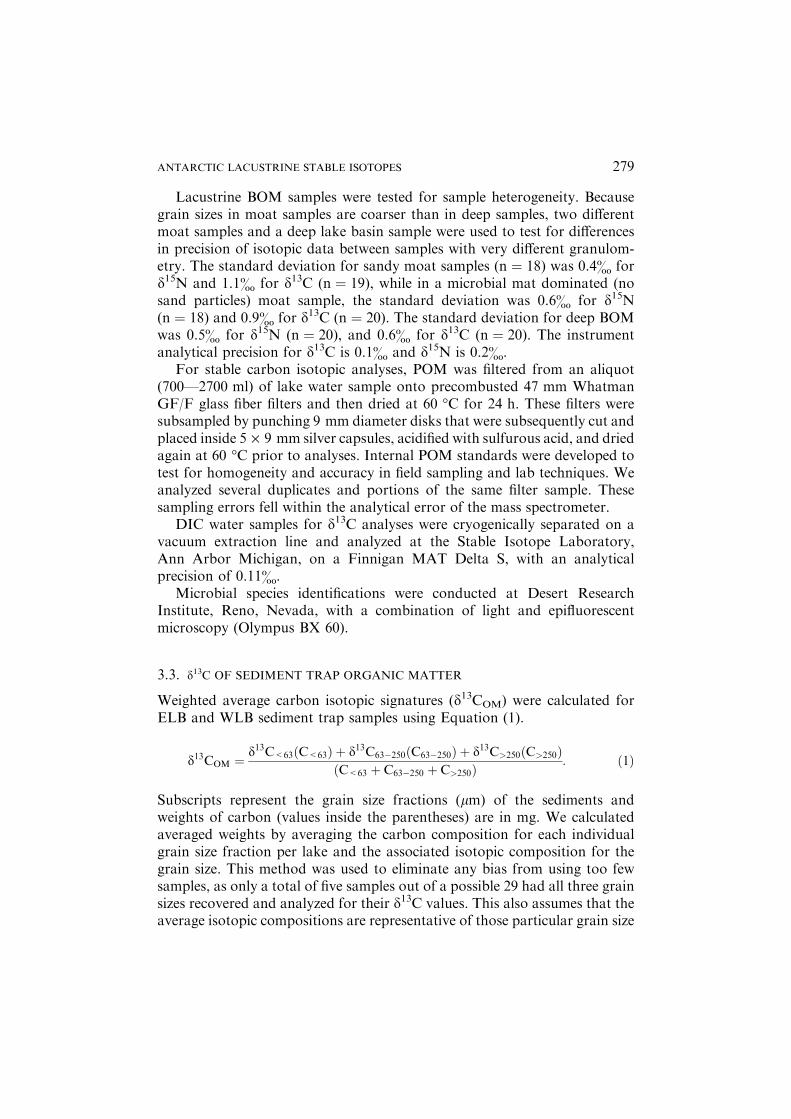
We have expanded on the d13C and d15N ranges of lacustrine OM putforth by Wharton et al. (1993) for Lake Hoare and Burkins et al. (2000)for the MDVs (Figure 6a). Our results show that moat BOM can beclearly distinguished from the more 13C depleted and occasionally more15N enriched BOM of permanently ice-covered parts of the lakes(Figure 6b). Moat d13CPOM is also more enriched ()11.2 to )29.4&) com-pared to the deep lake samples ()25.2 to )38.9&) (Figure 6c). There is arange of �14& for both moat d15NPOM ()12.3 to 2.9&) and deep d15NPOM
()7.4 to 6.1&). It is noteworthy that although moat BOM samples werecollected between 0–2 m, there was no isotopic change with depth in themoats (Figure 7).
The majority of our data for d15N of both BOM and POM fall between5& and )5&. The d15N of aquatic OM is generally between 20& and )17&(e.g., Bernasconi et al., 1997; Hamilton and Lewis, 1992; Kendall et al.,2001). When combining all under-ice d15NPOM from all lakes, there is a weak(r2 ¼ 0.28) but significant (P < 0.0001) increase with depth. Furthermore, t-tests show that deep d15NBOM (mean ¼ )1.1&) is significantly (P ¼ 0.005)different than all other shallower d15NBOM (mean ¼ )2.6&), and deepd15NPOM (mean ¼ )0.8&) is significantly (P ¼ 0.02) different than all othershallower d15NPOM (mean ¼ )1.9&)
The BOM of the moats is mainly microbial mat material with a variety ofcyanobacterial species, dominantly Phormidium, Oscillatoria, Plectonema,and Nostoc (Table III), as also described by Wharton et al. (1983) and Hawesand Schwarz (1999). Samples described in the field as green (G), correspondto Oscillatoria or Nostoc dominated mats, while red (R) mats are formed byPlectonema. Heterotrophic bacteria have yet to be fully characterized butinitial estimates from Lake Fryxell suggest a diverse bacterial assemblage ispresent along with the cyanobacteria, as shown by Karr et al. (2003). There isno distinct pattern relating cyanobacterial species composition and stableisotopic signatures of both carbon and nitrogen (Table III). For example, at
280 JENNIFER LAWSON ET AL.

Table
II.Stable
carbonisotopesignaturesandcarbonweights
ofMcL
anesedim
enttrapsamples
East
LakeBonney
WestLakeBonney
Sample
IDa
d13C
(<63lm)
TotalC
(mg)
(<63lm)
d13C
(63–250lm)
TotalC
(mg)
(63–250lm)
d13C
>250lm
TotalC
(mg)
>250lm
Sample
IDa
d13C
(<63lm)
TotalC
(mg)
(<63lm)
d13C
(63–250lm)
TotalC
(mg)
(63–250lm)
d13C
>250lm
TotalC
(mg)
>250lm
ELB1
0.18
)19.57
2.70
)13.38
25.11
WLB
1)31.29
174.09
)26.73
0.62
)18.35
2.33
ELB2
0.32
)20.89
7.81
)13.63
15.48
WLB
2)31.52
106.12
0.02
)17.14
1.21
ELB3
)27.58
1.15
)19.94
35.85
)12.28
100.49
WLB
3)30.50
119.07
)23.79
0.43
)13.78
3.12
ELB4
)28.28
0.68
)19.95
14.44
)11.91
70.04
WLB
4)30.58
117.11
)21.92
0.24
)12.30
1.27
ELB5
0.86
)19.29
13.98
)11.45
53.44
WLB
5)30.03
28.71
0.15
)13.64
0.87
ELB6
0.25
)19.65
6.26
)11.73
41.32
WLB
6)30.22
35.14
)25.40
0.25
0.40
ELB7
0.09
)22.32
2.18
)13.23
16.74
WLB
7)30.74
17.10
0.18
0.08
ELB8
0.30
)21.22
3.07
)14.34
10.72
WLB
8)30.85
28.97
0.33
0.12
ELB9
0.34
)24.15
1.30
)14.61
11.13
WLB
9)30.96
7.28
0.06
)12.31
0.15
ELB10
0.22
)23.99
5.33
)14.75
29.49
WLB
10
)32.69
7.95
0.15
0.31
ELB11
2.45
)22.13
1.33
)16.59
18.77
WLB
11
)31.89
13.34
0.11
0.03
ELB12
0.08
)24.83
0.68
)15.14
3.39
WLB
12
)31.15
4.65
0.02
0.01
ELB13
0.08
0.24
)20.82
1.36
WLB
13
)31.19
3.25
0.19
ELB14
0.18
)10.51
1.56
WLB
14
)31.57
3.78
WLB
15
2.29
Mean
)27.93
0.54
)21.50
28.50
)13.88
7.32
Mean
)31.08
44.59
)24.46
0.21
)14.59
0.83
Std.
dev.
0.50
0.66
1.97
28.85
2.59
9.78
Std.dev.
0.70
55.50
2.08
0.17
2.55
1.0
Number
214
12
14
14
14
Number
14
15
413
612
Total
7.18
95.17
399.04
668.85
2.75
9.90
aEach
sedim
enttrapsample
recordsfalloutat35m
depth
inboth
ELB
andWLBforapproxim
ately
16–18days.
ANTARCTIC LACUSTRINE STABLE ISOTOPES 281
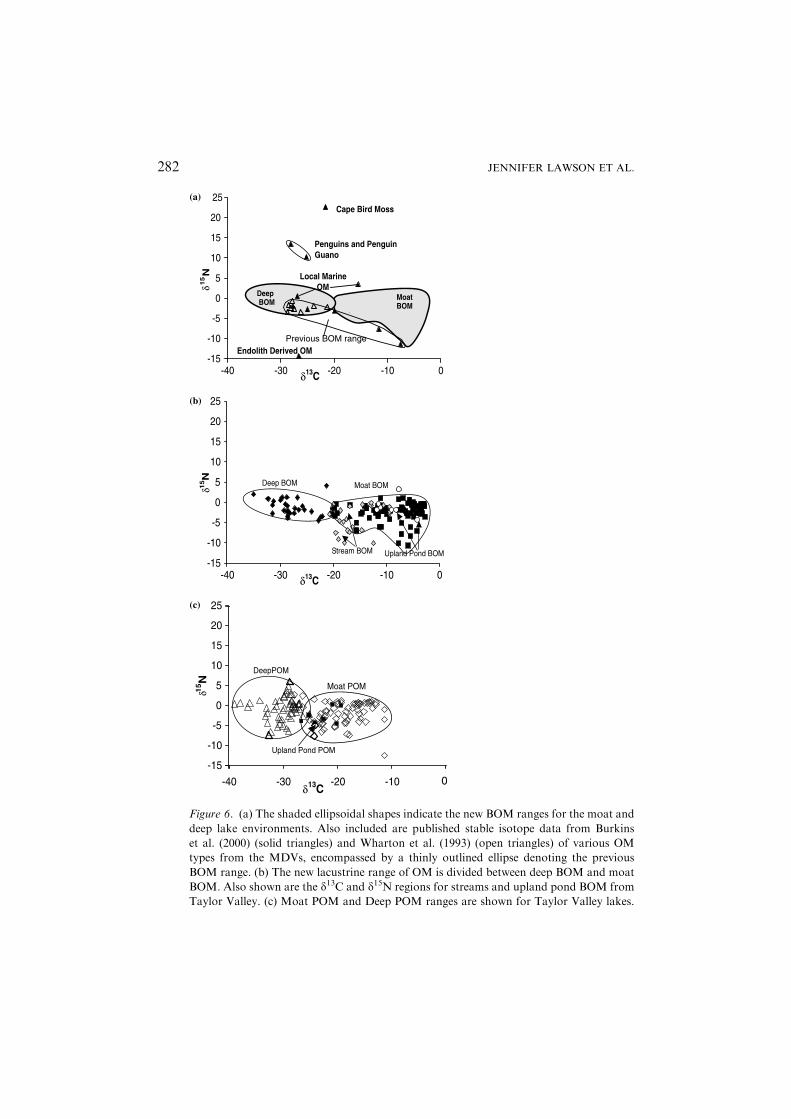
Figure 6. (a) The shaded ellipsoidal shapes indicate the new BOM ranges for the moat and
deep lake environments. Also included are published stable isotope data from Burkins
et al. (2000) (solid triangles) and Wharton et al. (1993) (open triangles) of various OM
types from the MDVs, encompassed by a thinly outlined ellipse denoting the previous
BOM range. (b) The new lacustrine range of OM is divided between deep BOM and moat
BOM. Also shown are the d13C and d15N regions for streams and upland pond BOM from
Taylor Valley. (c) Moat POM and Deep POM ranges are shown for Taylor Valley lakes.
282 JENNIFER LAWSON ET AL.

the site Fryxell-00-21, red and green samples were collected, as there were twocoexisting microbial communities with different colors apparent at the timeof sampling. The carbon and nitrogen isotopic composition of these samplesare indistinguishable (Table IV), as they are within one standard deviationestablished for heterogeneous moat samples (0.9–1.1& for d13C and 0.4&–0.7& for d15N).
ANTARCTIC LACUSTRINE STABLE ISOTOPES 283

Figure 7. All plots (a, b, c, d) show d13C values for BOM (diamonds), POM (tri-
angles), and DIC (open circles). Moat samples 0–5 m are plotted separately from those
samples below the ice-cover. The dotted line indicates the presence of the chemocline (c).
Only POM profiles (A, B, C,) are connected with lines at 6 m and below, as each profile
represents samples taken from the same water column. The yellow symbols represent moat
samples collected during the flood year. (a) Lake Fryxell stable carbon isotope signatures
with depth. (b) Lake Hoare stable carbon stable isotope signatures with depth. The black
line at 13 m denotes the CO2 saturation line, indicating saturation at depth. The brown
square represents the average d13C value of sediment traps at 8 m (n ¼ 10). Three surface
ice-cover sediment (blue stars) samples are plotted in the depth diagram with ice-cover. (c)
WLB stable carbon stable isotope signatures with depth. The brown squares represent the
average d13C values of three sieved fractions from benthic sediment traps at 35 m in the
center of WLB. (d) ELB stable carbon stable isotope signatures with depth. The brown
squares represent the average d13C values of three sieved fractions from benthic sediment
traps at 35 m in the center of ELB.
b
Table III. Cyanobacterial identification of moat microbial mats and associated isotope values.
Moat mat species identification in order of abundance
Lake Samplea Depth
(m)
Primary taxa Secondary
taxa
Tertiary taxa d13C d15N
Fryxell 00-03 0.6 Phormidium Plectonema Nostoc )3.23 )0.5Fryxell 00-21G 0.6 Oscillatoria Plectonema Nostoc )4.46 )2.51Fryxell 00-21R 0.6 Plectonema Nostoc Oscillatoria )4.81 )1.81Fryxell 00-22 0.2 Nostoc Oscillatoria Phormidium )2.76 )0.99Fryxell 00-29 0.1 Unicellular
(Microcystis-
like)
Nostoc Plectonema )6.86 1.05
Fryxell 00-30 0.2 Phormidium Nostoc Oscillatoria )6.21 )2.75Hoare 00-05 0.1 Phormidium )11.5 )2.78Hoare 00-08R 0.04 Plectonema Oscillatoria Unicellular
Cyanobacteria
(gleocapsa)
)15.59 )6.97
Hoare 00-09G 0.04 Nostoc Plectonema Phormidium )12.34 )1.95ELB 00-01 0.3 Phormidium )10.24 )1.59ELB 00-04 1.9 Plectonema Nostoc Oscillatoria )19.22 )2.68WLB 00-11 0.2 Unicellular
(Microcystis-
like)
Phormidium Oscillatoria )10.92 )6.01
WLB 00-06 0.2 Nostoc Phormidium Oscillatoria )4.239 )7.06WLB 00-10dry 0.0 Phormidium Unicellular )6.88 )2.18
aR, G, B, correspond to red, green, or black appearance of mat during field collection. Dry refers
to mat that was desiccated on the shoreline when sampled.
284 JENNIFER LAWSON ET AL.
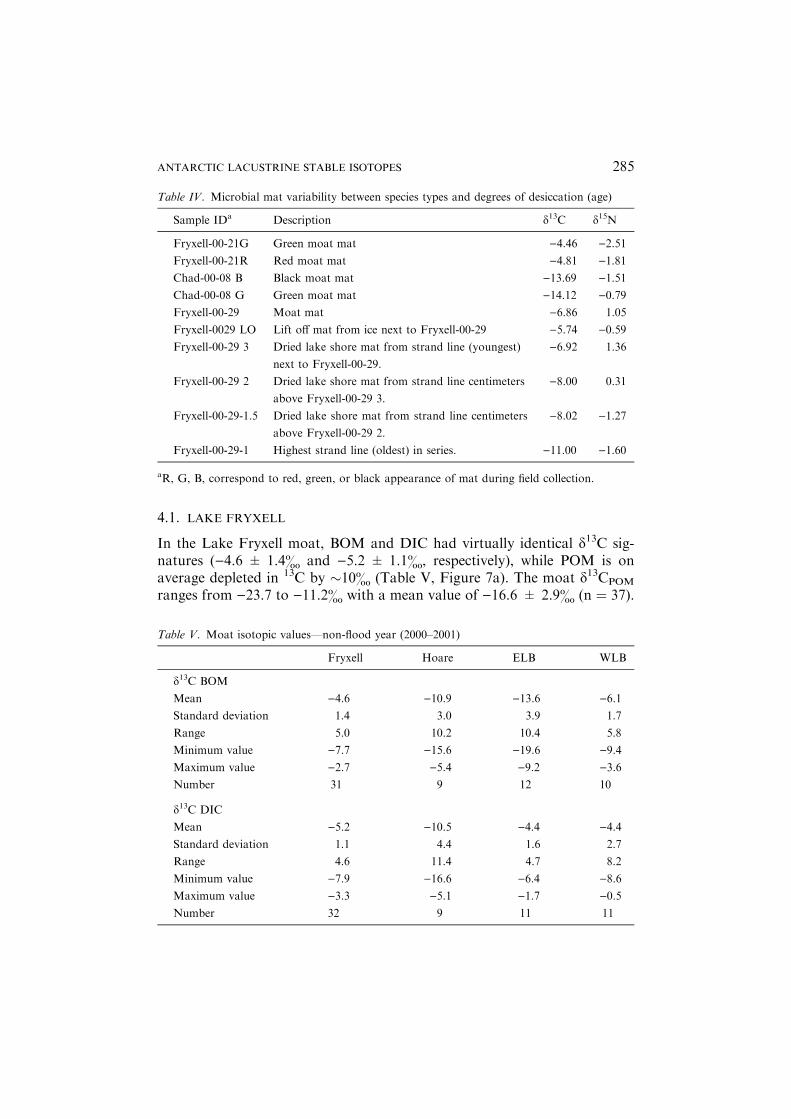
4.1. LAKE FRYXELL
In the Lake Fryxell moat, BOM and DIC had virtually identical d13C sig-natures ()4.6 ± 1.4& and )5.2 ± 1.1&, respectively), while POM is onaverage depleted in 13C by �10& (Table V, Figure 7a). The moat d13CPOM
ranges from )23.7 to )11.2& with a mean value of )16.6 ± 2.9& (n ¼ 37).
Table IV. Microbial mat variability between species types and degrees of desiccation (age)
Sample IDa Description d13C d15N
Fryxell-00-21G Green moat mat )4.46 )2.51Fryxell-00-21R Red moat mat )4.81 )1.81Chad-00-08 B Black moat mat )13.69 )1.51Chad-00-08 G Green moat mat )14.12 )0.79Fryxell-00-29 Moat mat )6.86 1.05
Fryxell-0029 LO Lift off mat from ice next to Fryxell-00-29 )5.74 )0.59Fryxell-00-29 3 Dried lake shore mat from strand line (youngest)
next to Fryxell-00-29.
)6.92 1.36
Fryxell-00-29 2 Dried lake shore mat from strand line centimeters
above Fryxell-00-29 3.
)8.00 0.31
Fryxell-00-29-1.5 Dried lake shore mat from strand line centimeters
above Fryxell-00-29 2.
)8.02 )1.27
Fryxell-00-29-1 Highest strand line (oldest) in series. )11.00 )1.60
aR, G, B, correspond to red, green, or black appearance of mat during field collection.
Table V. Moat isotopic values—non-flood year (2000–2001)
Fryxell Hoare ELB WLB
d13C BOM
Mean )4.6 )10.9 )13.6 )6.1Standard deviation 1.4 3.0 3.9 1.7
Range 5.0 10.2 10.4 5.8
Minimum value )7.7 )15.6 )19.6 )9.4Maximum value )2.7 )5.4 )9.2 )3.6Number 31 9 12 10
d13C DIC
Mean )5.2 )10.5 )4.4 )4.4Standard deviation 1.1 4.4 1.6 2.7
Range 4.6 11.4 4.7 8.2
Minimum value )7.9 )16.6 )6.4 )8.6Maximum value )3.3 )5.1 )1.7 )0.5Number 32 9 11 11
ANTARCTIC LACUSTRINE STABLE ISOTOPES 285

Moat BOM samples from Lake Fryxell ranged from )11.5 to )8.0& andwere more depleted in 13C than the non-flood year moat BOM samples(Figure 7a). POM samples also show a more depleted d13C trend thanaverage moat d13CPOM from the non-flood year (Figure 7a, Table V).
Below the ice-cover, both POM and BOM exhibit depleted d13C values,while the DIC initially becomes more enriched. At 6 m the stream-proximald13CPOM is )31.3&, while the deep transect 6 m d13CPOM is )36.5&. Belowthe chemocline, DIC and BOM become 13C depleted while POM becomes
Table V. Continued
Fryxell Hoare ELB WLB
d13C POM
Mean )16.6 )18.1 )21.2 )24.8Standard deviation 2.9 3.0 3.0 2.7
Range 12.5 10.8 9.6 8.0
Minimum value )23.7 )22.1 )24.3 )29.4Maximum value )11.2 )11.2 )14.8 )21.4
Number 37 11 12 10
13C Fractionation (BOM-DIC)
Mean )0.6 0.4 9.6 1.6
Standard deviation 1.4 5.6 5.2 2.5
13C Fractionation (POM-DIC)
Mean 11.5 6.0 17.2 20.7
Standard deviation 3.7 7.2 2.7 4.7
d15N BOM
Mean )1.1 )3.4 )2.4 )4.0Standard deviation 1.1 2.3 1.5 2.2
Range 4.6 5.7 5.6 6.5
Minimum value )3.5 )7.0 )6.0 )8.3Maximum value 1.1 )1.3 )0.4 )1.8Number 31 9 12 10
d15N POM
Mean )0.4 )4.9 )3.8 )0.1Standard deviation 1.4 3.7 2.6 2.7
Range 4.5 13.6 8.0 7.7
Minimum value )3.3 )12.3 )7.6 )4.8Maximum value 1.2 1.3 0.4 2.9
Number 32 10 9 10
286 JENNIFER LAWSON ET AL.

more enriched with depth. At the lake bottom, d13CPOM and d13CBOM valuesconverge at around )30&, and the DIC is significantly 13C depleted relativeto shallow water DIC.
4.2. LAKE HOARE
Even in the absence of a strong chemocline, Lake Hoare has a deep d13CBOM
and d13CDIC profile similar to that of Lake Fryxell. The d13CBOM isisotopically enriched in the moat and becomes more depleted with depth(Figure 7b). In Lake Fryxell, this BOM trend persists to the deepest part ofthe lake, while in Lake Hoare, the d13CBOM depletion ends at around 20 m.The Lake Hoare moat is highly enriched in 13C relative to the under-iceprofile. The BOM and DIC in Lake Hoare moat is more 13C depleted than inLake Fryxell and the d13CBOM more variable (Table V). Similar to LakeFryxell, Lake Hoare moat d13CDIC is indistinguishable from its d13CBOM.The mean d13CPOM in the moat ()18.1 ± 3.0&, n ¼ 11) is 8&more depletedin 13C than moat DIC. Two of the three more depleted d13CPOM valuesrepresent flood year samples. The lone moat BOM sample from the floodyear is similar to other years’ moat d13CBOM.
From the surface of the ice-cover, three sediment samples yielded d13Cvalues of )16.5&, )15.7&, and )11.0&, representing 13C enrichment in theice-cover sediment. These ice-cover d13C values are similar to those of themoat d13CBOM.
The d13CPOM deep profile for Lake Hoare is relatively invariant withdepth, with values averaging )29.9 ± 0.9&. Lake Hoare lacks other POMtransects, but a single sample, collected from a very shallow (5.5 m) stream-proximal locality, is 6& enriched in 13C relative to deep water POM transect(Figure 7b).
The ten sediment trap samples at 8 m had a mean d13C value of)23.1 ± 0.6&. This value is similar to BOM isotopic signatures at thisdepth, but approximately 5& enriched in 13C compared to POM at the samedepth (Figure 7b).
4.3. WEST LAKE BONNEY
The WLB moat d13CBOM ()6.1 ± 1.7&; n ¼ 10) and d13CDIC
()4.4 ± 2.7&; n ¼ 11) signatures resemble those of Lake Fryxell. Moatd13CPOM range from )21.4 to )29.4&, being more depleted in 13C than in theother TV lakes. The flood year moat POM samples are similar to corre-sponding POM transects (stream-distal or proximal) below the ice-cover, andare more depleted than the average d13CPOM from the non-flood year(Figure 7c). Moat BOM samples from the flood year are approximately 6and 16& more depleted in 13C than moat BOM from the previous year.
ANTARCTIC LACUSTRINE STABLE ISOTOPES 287

Water column profiles under the ice-cover in WLB show that d13CDIC andd13CPOM, as well as d13CBOM are virtually identical and invariant with depth(Figure 7c). The distinct WLB chemocline at 14 m depth has little impact onthe d13C signatures. All POM transects were collected within two consecutivedays.
Isotopic signatures of the sediment trap samples in WLB were grain-sizedependent (Figure 7c, Table VI). The largest grain size fraction (>250 lm) isthe most enriched in 13C ()14.6 ± 2.6&, n ¼ 6), while the finest grain size(<63 lm), is the most depleted ()31.1 ± 0.7&, n ¼ 14; Table VI). The>250 lm fraction has d13C values falling within the range of moat BOMvalues. The fine grain size fraction d13C values are comparable to thed13CPOM and the d13CBOM below the ice-cover.
Figure 8. Photos of the moat area on the north side of West Lake Bonney. Photo (a) was
taken January 11, 2001. Photo (b) was taken January 18, 2002 (flood year). The black line
denotes open moat water showing the change in the size of moat development between the
non-flood (2000–2001) and flood (2001–2002) years.
288 JENNIFER LAWSON ET AL.

4.4. EAST LAKE BONNEY
The ELB moat differs from other TV lakes, in that d13CBOM values ()19.6 to)9.2&) do not overlap with d13CDIC values ()6.4 to )1.7&), which areapproximately 9& more enriched in 13C, on average (Figure 7d). The meanmoat d13CBOM is the most depleted of all TV lakes ()13.6 ± 3.9&; n ¼ 12),while moat DIC is )4.4 ± 1.6& (n= 11; Table V). The moat BOM is�7.5& enriched in 13C relative to moat POM ()21.2 ± 3.0&; n= 12; TableV). The two most depleted d13CBOM ()23.0 and )26.7&) and d13CPOM values()32.4 and )31.1&) in the ELB were sampled during the flood season.
Under the ELB ice-cover, there is a large difference in d13C values betweenDIC and BOM that increases with depth as the BOM becomes isotopicallymore depleted. The deep BOM at 38 m depth, yield carbon isotopic values of)29 to )32&. BOM profiles do not encompass all depths, as the steepbathymetry in ELB makes mid-depth sampling exceptionally difficult.
Besides this enrichment in 13C of the stream-proximal 6 m location, thethree POMprofiles (collected within 3 days of each other) in ELB do not showany other systematic variation due to sample locality (e.g., steam-proximal vs.distal) at depth. d13CPOM in the upper water column (6–15 m) averages�)32&, while d13CPOM at the ELB chemocline is relatively enriched to�)27&. Below the chemocline, d13CPOM averages �)29&. This trend in thed13CPOM profile at ELB contrasts with that observed at the chemocline ofLake Fryxell (Figure 7a). At the deepest portion of ELB the d13CPOM andd13CBOM converge, while the DIC becomes more enriched in 13C.
The mean d13CBOM of the sediment trap size fractions have a similar rangeto those of WLB (Figure 7c, and d, Table II). However, the <63 lm fractionfor ELB (d13CBOM ¼ )27.9 ± 0.5&) is significantly more enriched (3&)than for WLB (d13CBOM ¼ )31.1 ± 0.7&).
5. Discussion
There is a characteristic d13C range for deep BOM ()20.1 to )35.0&) andmoat BOM ()2.7 to )20.2&). This distinction is also observed in d13CPOM
(Figure 7c), except in WLB (Figure 7c, Table IV). In contrast, the d15Nsignatures for lacustrine OM in the MDVs do not seem to be a very usefulparameter to distinguish OM provenance in the lakes. The aquatic d15Nsignatures fall within a relatively narrow range of d15N as compared to OMfrom other MDV terrestrial environments (Figure 6a). However, a fewobservations can be made. First, the d15N signatures of deep BOM exhibitless variation than all other OM sources. Second, deep lake OM seems to beisotopically depleted with respect to d15N than shallow OM. The d15N ofaquatic OM is controlled by the d15N of utilized dissolved inorganic nitrogen(DIN) and fractionations associated with processes that alter the nitrogen
ANTARCTIC LACUSTRINE STABLE ISOTOPES 289

composition of nitrate or ammonium in streams and lakes. Therefore, frac-tionation of d15N from its source must be relatively small in our samples.This also means that DIN sources must be minor and/or growth rates high,for such fractionation effects. These processes are inherently not associatedwith sample position in the lake.
5.1. STABLE ISOTOPE SIGNATURES IN THE MOATS
There is no obvious relationship between cyanobacterial composition and thestable carbon isotopic signature of moat mats in our data. Based on thisobservation, environmental parameters, such as CO2 diffusion across cellmembranes ice-cover extent, and number of sunlight hours, must be themajor controls on carbon fractionation between DIC and BOM in the TVlakes. Mat forming cyanobacteria fix carbon via the C-3 (Calvin-Benson)pathway (Fuchs and Stupperich, 1985), which discriminate against 13C as aresult of RUBISCO activity (O’Leary, 1981). However, in the moats, it islikely that diffusion-limitation in microbial mats is the main factor creatingcarbon isotopic differences with depth. As discussed previously by Doranet al. (1998), photosynthetic rates are high during the 24-hour summer sun-light, creating a situation where DIC assimilation is controlled by the rate atwhich it diffuses into the mat, resulting in a reduced fractionation. Thisdiffusion-limitation is typical of cyanobacterial assemblages and was alsocharacterized by Schidlowski et al. (1984) and DesMarais (1989) in microbialmats of warm hypersaline environments.
In TV moats, POM is 13C depleted relative to BOM, though both benthicand pelagic primary producers grow in waters with the same [CO2]aq.Although the contribution of pelagic photoautotrophy versus detrital inputto moat POM is not precisely known, the significant depletion of moat POMduring flood year relative to non-flood years suggests that the POM isdominated by photoautotrophic contributions. In Lake Fryxell, moat POMsamples collected during the flood year are more 13C depleted than 87% ofthe moat POM samples from the previous non-flood year. Lake Hoare, ELB,and WLB moat POM samples also show an isotopic depletion during theflood season.
It has been shown that POM primarily composed of phytoplankton havea wide range of d13C, from )44 to )20& (e.g., Goericke et al., 1994; Goeringet al., 1990), a range similar to that of d13CPOM found in the TV lakes. Thefractionation of 13C by phytoplankton is primarily controlled by the con-centration of ambient [CO2](aq) (e.g., Degens et al., 1968; Fogel et al., 1992;Freeman and Hayes, 1992; Rau et al., 1996) and growth rate (Bidigare, 1997;Laws et al., 1995). Neumann et al. (1998, 2001) have demonstrated in LakesHoare and Fryxell that an increase in [CO2](aq) during summer glacial-melt,with the addition of stream derived CO2 to the lakes accounts for greater
290 JENNIFER LAWSON ET AL.

fractionation of carbon isotopes of DIC. Phytoplankton generally havehigher specific growth rates than benthic mats (Goericke et al., 1994),therefore, making differences in growth rate unaccountable for the isotopicdifference between moat POM and BOM. Fractionation between DIC andorganic carbon also depends on cell wall permeability, cell size and geometry,as well as the ability of an organism to assimilate inorganic carbon (passivelyversus actively) (Goericke et al., 1994; Popp et al., 1998; Raven andJohnston, 1991). Thus, moat mats are enriched in 13C relative to phyto-plankton, because they must contend with the controlling effect of mucilage(a protective polysaccharide coating) and a colonial morphology, both ofwhich limit the diffusion of CO2 to assimilation sites (Des Marais andCanfield, 1994; Schidlowski et al., 1984).
During flood years, waters in the moat are well-mixed and very turbid,thereby we speculate that, in addition to the effects of higher concentration ofdissolved CO2 resulting from larger surface area for CO2 exchange at thewater-atmosphere boundary, reduced light penetration limits phytoplank-tonic growth, resulting in greater 13C fractionation and more depleted OM inthe moats. These same hypotheses may be applied to explain depleted BOMsamples during the flood year.
5.2. CARBON ISOTOPE PROFILES BELOW THE ICE-COVER
5.2.1. Influence of Flood Year
The isotopic differences observed in the moats between the flood and non-flood years are not observed below the ice-cover (Figure 7). SCUBA-obser-vations detected only minor sedimentation increases under the ice in LakeHoare following the flood year (I. Hawes, personal communication). Fur-thermore, BOM samples collected during all three seasons at similar depthsare isotopically similar. These under-ice isotopic patterns are in agreementwith previously published d13CBOM and d13CDIC profiles for Lake Hoare(Doran et al., 1998; Neumann et al., 1998; Wharton et al., 1993). The d13CDIC
profiles for Lake Fryxell, WLB, and ELB are also in close agreement withthose from 1994–1995 and 1996–1997 seasons, showing with depth thedepletion of d13CDIC in Lake Fryxell and a large enrichment of 13C in ELB(Neumann et al., 1998, 2004). However, our invariant WLB d13CDIC profiledoes not show a �5& enrichment in 13C near the chemocline depth asreported by Neumann et al. (2004)
This constancy, combined with the stability of the water column below theice in each of the lakes, implies that the moats and lake waters below the ice-cover can be considered as relatively isolated systems, in terms of waterexchange and sediment transport, with only minor communication between
ANTARCTIC LACUSTRINE STABLE ISOTOPES 291

the two. This allows comparisons between POM, BOM, and DIC from threedifferent years, independent of flood status.
However, we did test the influence of stream meltwater input on theisotopic composition of POM below the ice-cover (Figure 7). The onlyresponse we observe is amongst samples at 6 m depth where stream-proximalsamples are systematically enriched in 13C (3.5–5&) relative to samplescollected in the center of the basin, except in WLB, where the POM isinvariant across the water column. Turbulent mixing in the open moat waterstransfers to horizontal motions under the ice-cover, with minimal verticalmixing (Spigel and Priscu, 1998). At 6 m, d13CPOM values in stream-proximalareas trend toward those of the moat d13CPOM values. Thus, we proposethat during years of large moat formation, the vertical/turbulent mixingcan extend to at least 6 m depth in localities near moats that have beeninfluenced by streams. This confirms the observation of Spigel and Priscu(1998) who showed that conductivity and temperature profiles at LakeFryxell and ELB are influenced by melt water during higher flow yearsbetween 5 and 6 m.
5.2.2. d13C trends at the Chemocline
The water column above 11 m in Lake Fryxell supports active photosyn-thetic assemblages (Priscu, 1989, 1995; Vincent, 1981). The zone between 9and 11 m is anoxic and photosynthesis is dominated by photosyntheticpurple bacteria (Priscu et al., 1987a, b). The anoxic waters result from ver-tical transport and decay of POM (Neumann et al., 1998, 2001).
However, Doran et al. (1999) measured a 10,200–13,500 yr. 14C age forPOM and 1600–2,700 yr. 14C age for the DIC of Lake Hoare. These agesindicate that the under-ice POM includes some ancient carbon, though theexact proportion of ancient, recycled material is currently unknown.
The negative excursion (3–4& depletion between 8 and 9.5 m depth) in thePOMprofile just above the chemocline (Figure 7a)may result from a variety ofprocesses: (i) respiration by heterotrophs of 13C depleted CO2 and the sub-sequent use of this 13C depleted carbon by photosynthetic primary producersliving just above the chemocline; (ii) stronger discrimination against 13C fromthe biota at 8–9.5 m depth; (iii) lateral mixing during high stream flows andhigh wind events in the moat waters create enriched d13CPOM at 6 m depth(positive shift), creating the appearance of a negative excursion below 6 m;(iv) diffusion of 13C depleted DIC from below the chemocline. This lastprocess can be discounted, as the DIC just below the chemocline is notsignificantly depleted in 13C relative to DIC above the chemocline. The effectof wind-driven mixing seems to be limited to stream-proximal and otherareas located near moats. Because the negative excursion above the chemo-cline is also observed in stream-distal profiles away from moats, it is unlikely
292 JENNIFER LAWSON ET AL.

the product of stream and moat influences. Thus, we are left with processes(i) and (ii) and the latter cannot be addressed at this time due to lack ofknowledge of the biota living just above the chemocline. Process (i) is sup-ported by the fact that aerobic respiration is the dominant pathway of OMdegradation, and consistent with the density stratified water column and anapparent absence of pellet-forming grazers, as decomposing POM is, in part,maintained in the water column (Howes and Schlezinger, 1992). Neumannet al. (1998, 2001), through investigating concentrations and the isotopiccomposition of DIC, also indicate OM mineralization at depth as a signifi-cant contribution to the carbon cycle of Lake Fryxell.
At its chemocline, East Lake Bonney shows a response in d13CPOM
opposite to that in Lake Fryxell. Between 15 and 20 m, there is a 3–4&enrichment in 13CPOM, and subsequent 1–2& depletion below the chemocline(Figure 7). This enrichment may be due to a large utilization by POM sourceorganisms of DIC that enter the trophogenic zone via upward diffusionacross the chemocline (Priscu et al., 1999). Priscu et al. (1996) and Voyteket al. (1999) have concluded that there is chemotrophic fixation of CO2 byaerobic ammonia oxidizing bacteria above the ELB chemocline. The DICbelow the chemocline is likely a remnant carbon pool, a ‘‘legacy’’ from aprevious evapoconcentration climatic event. The presence of photosyntheticsulfur oxidizing bacteria that discriminate less against 13C than cyanobacteriaduring CO2 uptake (e.g., Preuss et al., 1989), could also explain such a po-sitive trend at the chemocline, as light does penetrate into the anoxic zone(Figure 3a) making anoxygenic photoautotrophy possible. However, thereare no reports in ELB of the presence of hydrogen sulfide, a typical protondonor for anoxygenic phototrophic bacteria, and calculated Gibb’s freeenergies (Lee et al., 2004) would not support the necessary reactions.Moreover, there is no biological evidence in support of the presence ofsulfide oxidizing bacteria in ELB. Stable isotopic signatures below thechemocline do not indicate decomposition of POM, as there is not a signif-icant negative shift in the DIC profile with depth. Priscu (1992), using 14CO2
release from 14C-labelled glucose, determined very little decompositionbelow the trophogenic zone in a region where heterotrophic bacterialproduction measured by tritiated thymidine incorporation was negligible,despite high cell densities (�105 cells ml)1). The presence of very lowbacterial activities was again confirmed in a more recent study by Ward et al.(2003). As a result, this positive excursion in d13CPOM cannot be explained atthis point.
5.2.3. d13C at Maximum Depths
In ELB, WLB, Lake Hoare, and Lake Fryxell, d13CPOM and d13CBOM atmaximum depths are the same. The similarity in the d13CPOM and d13CBOM
ANTARCTIC LACUSTRINE STABLE ISOTOPES 293

values suggests that in all lakes the deepest BOM has the largest contributionfrom the particulate component. However, our data indicate that BOM andPOM components in Lake Fryxell and Lake Hoare are mostly independent,while in ELB and WLB, the BOM and POM seem closely related. Therelative proportion of benthic primary productivity to total lake productivitycan explain this difference.
Lake Fryxell and Lake Hoare have large basin-wide benthic contributionsto total lake metabolism (Hawes and Schwarz, 1999; Priscu et al., 1995).Wharton et al. (1993) suggested that carbon fixed in the euphotic zone ofLake Hoare is rapidly mineralized in the water column or at the sediment/water interface, with net losses of nitrogen as compared to carbon. Thissuggests that pelagic primary produced POM represents a small componentof the accumulated OM on the shallow slopes of the lake basin relative toBOM, consistent with differences between d13CPOM and d13CBOM at shal-lower depths. At maximum depth, where benthic primary productivity islikely less than on the slopes, the pelagic primary produced POM dominatesthe accumulated organic matter, consistent with the equal d13CPOM andd13CBOM at maximum depths.
WLB d13CPOM transects and d13CBOM are the same values and invariantwith depth, suggesting that the bulk BOM reflects the POM throughout thewater column. This same relationship may be true for ELB where the onlydifference between d13CBOM and d13CPOM is at 6 m depth (Figure 7d). Asdescribed previously, ELB and WLB are extremely steep-sided, which likelyfavors planktonic over benthic productivity in the lakes, as steep basin slopesprovide a lesser area of illuminated habitat for microbial mat growth. Priscuet al. (1999) modeled the pelagic food web and associated carbon fluxes forELB, showing sediment flux is comprised of both material settling from thewater column and ice-cover. The pelagic component comprises the largest ofthe modeled depth-integrated carbon flux (8556 mg m)2 yr)1) to the buriedcarbon at the lake bottom (Priscu et al., 1999). The dominance of pelagicprimary productivity over benthic primary productivity explains the simi-larity between d13C of POM and BOM, below the chemocline in ELB andWLB.
5.2.4. d13C of Sediment Trap Organic Matter
The weighted carbon isotopic signature for ELB total trapped sediment has ad13C ()13.9 ± 0.7&) not significantly different from those observed for themean d13C of >250 lm grain size fraction ()13.9 ± 2.6&) and ELB moatBOM ()13.6 ± 3.9&). In contrast, the weighted carbon isotopic signature ofWLB trapped sediments ()30.5 ± 0.5&) is not significantly different fromthat of the <63 lm grain size fraction ()31.1 ± 0.7&) as well as those ofELB BOM and POM below 6 m. ELB trapped sediments are dominated by
294 JENNIFER LAWSON ET AL.

the largest grain size fraction, which contains the bulk of the particulatefallout organic carbon (78.4%, n = 13). The intermediate particle size (63–250lm) represents 20.1% (n ¼ 13) of the organic carbon fallout. In contrast,WLB trapped sediments are dominated by the finest grain size fraction(<63 lm), which also represents the bulk of the organic carbon fallout(97.7%, n ¼ 14). The >250 lm grains size fraction provides the next largestinflux of carbon (1.8% n ¼ 14), while the intermediate grain size fraction(63–250 lm) is the least (0.5%, n ¼ 14).
Surface water circulation in Lake Bonney typically follows a west–eastflow path owing to higher hydraulic inputs in WLB (J. Priscu, unpublisheddata). It has also been shown that weak turbulent mixing occurs along thesides and bottoms of the shallow, narrow passage connecting ELB andWLB (Spigel and Priscu, 1998). It can be hypothesized that this turbulencemay be responsible for the inputs of ‘‘moat-like’’ OM into the sedimenttraps in ELB. However, the distance between the sediment trap in ELB andthe narrow channel between WLB and ELB (�3 km) make that hypothesisimprobable. The most plausible hypothesis for the difference betweend13CBOM and d13Ctrap in ELB is the contribution of sediments and OMreleased from the ice-cover in an episodic so-called ‘‘sediment dump’’ event(Nedell et al., 1987; Simmons et al., 1986; Wharton et al., 1989). In support ofthat hypothesis, the average d13C values of OM in the ice-cover sedimentsmeasured at Lake Hoare ()14.4 ± 3.0&, n ¼ 3) are not significantly dif-ferent from the weighted d13C average calculated for ELB trapped sediments()13.9 ± 0.7&).
Lake Hoare sediment traps (placed at 8 m depth) have similar carbonisotopic signatures as POM collected at 5.5 m in the stream proximal profile.The POM at this site is enriched in 13C relative to POM from the deep profile,indicating that waters in shallow under-ice settings may receive contributionfrom moat organic matter. However, none of the 10 sediment traps at thisdepth caught a sediment dump event from the overlying ice-cover, as sedi-ments were all finer than <63 lm.
6. Conclusions
In the four TV lakes studied, moat and under-ice OM have distinctlydifferent carbon isotope compositions, with moat OM being significantlyenriched in 13C relative to OM of deeper environments. There is a sharpd13C value boundary at )20& for BOM and at )26& for POM sepa-rating these two environments. In contrast, this distinction is not observedin the d15N values, with both moat and under-ice OM spanning a rela-tively narrow range. Thus, d13C of OM can be a proxy for sampleposition in the lake in paleolimnological reconstruction of perenniallyice-covered lakes.
ANTARCTIC LACUSTRINE STABLE ISOTOPES 295
In the moat, the carbon isotopic composition of BOM is not apparentlyinfluenced by the composition of cyanobacterial assemblages. The mainfactor influencing the isotopic composition of moat BOM is the CO2 diffu-sion-limitation across cell membranes associated with the polysaccharidesheath and colonial nature of cyanobacterial assemblages. Moat POM,mostly phytoplanktonic, is significantly depleted in 13C relative to BOM.During a year of enhanced glacial melt and formation of wide moats, weobserved that both d13CPOM and d13CBOM signatures become more negativeby 5–15& relative to non-flood years. We hypothesize that this trend in themoats might be the result of a reduced growth rate of photoautotrophicprimary producers in the moat, in response to turbidity-induced light limi-tation and/or increased [CO2](aq).
In the under-ice environment, at a depth of 6 m, the more positive valuesof d13CPOM in stream-proximal sites relative to deep-profiles sites suggest thatlateral mixing of moat waters extends to at least 6 m in areas situated nearlarge moats or stream inputs.
In all lakes, the d13CPOM and d13CBOM signatures at maximum depths aresimilar. This similarity suggests that the BOM in the deepest areas of thelakes receive the largest contribution from POM. However, at shallowerdepths, our data indicate that the BOM and POM systems in Lake Fryxelland Lake Hoare are mostly unconnected, with BOM being more enriched in13C relative to the POM, demonstrating the greater influence of benthicprimary productivity in those two lakes. In contrast, in ELB and WLB, thed13CPOM and d13CBOM seem closely related throughout the water column,suggesting the dominance of the pelagic (POM) component in the carboncycle of these lakes. This is further supported by the sediment trap datafor WLB, which indicate that the water column fallout is dominated byfine (<63 lm) particles with a weighted carbon isotopic composition()30.5 ± 0.5&) similar to those of POM and BOM.
In contrast, sediment trap data for ELB record a water column falloutdominated by the largest grain size fraction (>250 lm) with a weightedisotopic composition ()13.9 ± 0.7&) similar to that of lake ice sediments,but completely different from BOM and POM. These sediments were likelyreleased from the ice-cover during an episodic sediment dump event.
The processes responsible for the stable carbon isotopic excursions ob-served at the chemoclines of Lake Fryxell and ELB are unclear at this time.The chemoclines are spatially limited environments with extreme physio-chemical properties, unique to each lake. Moreover, our knowledge of theorganisms present at the chemocline, though increasing (e.g., Karr et al.,2003), is still limited. Thus, further biological investigation and compoundspecific isotope analyses might be needed before these POM profiles can befully understood.
296 JENNIFER LAWSON ET AL.

Acknowledgements
This work is supported by NSF Long Term Ecological Research programand Office of Polar Programs (OPP 9810219, OPP 0096259) and the NASAExobiology Program (NAG5-9427). We thank Chris Fritsen and SarahMarshall who performed microbial mat species identification. We would alsolike to thank Linnea Heraty and Lora Wingate for analytical support. Wethank Ian Hawes for discussions about benthic productivity and assistancewith sample collection. Field help was provided by Richard Costello,Christine Foreman, Derek Mueller, Carrie Olsen, Maria Uhle, and CraigWolf. Raytheon Polar Services and Petroleum Helicopters Inc., providedlogistical services in the field.
References
Adams E. E., Priscu J. C., Fritsen C. H., Smith S. R. and Brackman S. L. (1998) Permanent ice
covers of the McMurdo dry valley lakes, Antarctica; bubble formation and metamorphism.
In Ecosystem Dynamics in a Polar Desert; the McMurdo Dry Valleys, Antarctica, Vol. 72 (ed.
J. C. Priscu), pp. 281–295. American Geophysical Union.
Andersen D. T., McKay C. P. and Wharton R. A. (1998) Dissolved gases in perennially
ice-covered lakes of the McMurdo dry valleys, Antarctica. Antarctic Sci. 10(2), 124–133.
Andersen D. W., Wharton R. A. J. and Squyres S. W. (1993) Terrigenous clastic sedimentation.
In Physical and Biogeochemical processes in Antarctic Dry Valley Lakes, Vol. 59 (ed. E. I.
Friedmann), pp. 71–81. American Geophysical Union.
Bernasconi S. M., Barbieri A., and Simona M. (1997) Carbon and nitrogen isotope variation in
sedimenting organic matter in Lake Lugano. Limnol. Oceanogr. 42(8), 1755–1765.
Bidigare R. R. (1997) Consistent fractionation of 13C in nature and in the laboratory:
Growth-rate effects in some haptophyte algae. Global Biogeochem. Cycles 11, 279–292.
Bishop J. L., Lougear A., Newton J., Doran P. T., Froeschl H., Trautwein A. X., Korner W. and
Koeberl C. (2001) Mineralogical and geochemical analyses of Antarctic lake sediments: A
study of reflectance and Mossbauer spectroscopy and C, N, and S isotopes with applications
for remote sensing on Mars. Geochimica et Cosmochimica Acta. 65(17), 2875–2897.
Brenner M., Whitmore T., Curtis J. H, Hodell D. A., and CL S. (1999) Stable isotope (delta C-13
and delta N-15) signatures of sedimented organic matter as indicators of historic lake trophic
state. J. Paleolimnol. 22(2), 205–221.
Burkins M. B., Virginia R. A., Chamberlain C. P. and Wall D. H. (2000) Origin and distribution
of soil organic matter in Taylor Valley, Antarctica. Ecol. 81(9), 2377–2391.
Degens E. T., Guillard R. R. L., Sackett W. M. and Helleburst J. A. (1968) Metabolic frac-
tionation of carbon isotopes in marine plankton: Temperature and respiration experiments.
Deep-Sea Res. 15, 1–9.
Des Marais D. J. and Canfield D. E. (1994) The carbon isotope biogeochemistry of microbial
mats. In Microbial Mats: Structure, Development, and Environmental Significance (Ed. P.
Caumette), pp. 289–298. Springer-Verlag.
Des Marais D. J., Cohen Y., Nguyen H., Cheatham T. and Munoz E. (1989) Carbon isotopic
trends in the hypersaline ponds and microbial mats at Guerrero Negro, Baja California Sur,
Mexico: Implications for Precambrian stromatolites. In Microbial Mats: Physiological
Ecology of Benthic Microbial Communities (ed. E. Rosenberg), pp. 191–205. American
Society for Microbiology.
ANTARCTIC LACUSTRINE STABLE ISOTOPES 297

Doran P. T., Berger G. W., Lyons W. B., Wharton R. A., Davisson M. L., Southon J. and
Dibb J. E. (1999) Dating Quaternary lacustrine sediments in the McMurdo Dry Valleys,
Antarctica. Palaeogeograph. Palaeoclimatol. Palaeoecol. 147(34), 223–239.
Doran P. T., McKay C. P., Clow G. D., Dana G. L., Fountain A. and Nylen T. (2002a) Valley
floor climate observations from the McMurdo Dry Valleys, 1986–2000. J. Geophys. Res. -
Atmospheres 107(D24).
Doran P. T., Priscu J. C., Lyons W. B., Powell R., Andersen D. T. and Poreda R. (2004)
Paleolimnology of extreme cold environments. In Long-term environmental change in Arctic
and Antarctic lakes, in press, Kluwer Academic Press.
Doran P. T., Priscu J. C., Lyons W. B., Walsh J. E., Fountain A. G., McKnight D. M.,
Moorhead D. L., Virginia R. A., Wall D. H., Clow G. D., Fritsen C. H., McKay C. P. and
Parsons A. N. (2002b) Antarctic climate cooling and terrestrial ecosystem response. Nature
415(6871), 517–520.
Doran P. T., Wharton R. A., Des Marais D. J. and McKay C. P. (1998) Antarctic paleolake
sediments and the search for extinct life on Mars. J. Geophys Res. 103(E12), 28481–28493.
Fogel M. L., Cifuentas L. A., Velinsky D. J. and Sharp J. H. (1992) Relationship of carbon
availability in estuarine phytoplankton to isotopic composition. Marine Ecol.-Progress Series
82(3), 291–300.
Fountain A., Lyons W. B., Burkins M. B., Dana G. L., Doran P. T., Lewis K. J., McKnight D.,
Moorhead D. L., Parsons A. N., Priscu J. C., Wall D. H., Wharton R. A. J. and Virginia
R. A. (1999) Physical controls on the Taylor Valley Ecosystem, Antarctica. Bioscience 49(12),
961–972.
Freeman K. H. and Hayes J. M. (1992) Fractionation of carbon isotopes by phytoplankton and
estimates of ancient CO2 levels. Global Biogeochem. Cycles 6, 627–644.
Fritsen C. H., Grue A. M. and Priscu J. C. (2000) Distribution of organic carbon and nitrogen in
surface soils in the McMurdo Dry Valleys, Antarctica. Polar Biol. 23(2), 121–128.
Fuchs G. and Stupperich E. (1985) Evolution of CO2 fixation. In Evolution of Prokaryotes, Vol.
FEMS Symposium 29 (ed. S. E. Schleier), pp. 756–251. Academic Press.
Goericke R., Montoya J. P. and Fry B. (1994) Physiology of isotopic fractionation in algae and
cyanobacteria. In Stable Isotopes in Ecology and Environmental Science (Ed. R. H. Michener),
pp. 187–221. Blackwell Scientific Publications.
Goering J., Alexander V. and Haubenstock N. (1990) Seasonal variability of stable carbon and
nitrogen isotope ratios of organisms in a North Pacific bay. Estuarine Coastal Shelf Sci. 30(3),
239–269.
Gu B., Schelske C. L. and Brenner M. (1996) Relationship between sediment and plankton
isotope ratios (d13C and d15N) and primary productivity in Florida lakes. Can. J. of Fish.
Aqua. Sci. 53, 875–883.
Hall B. L. and Denton G. H. (2000a) Extent and chronology of the Ross Sea drift and the Wilson
Piedmont Glacier along the Scott Coast at and since the last glacial maximum. Geografiska
Annaler Series A-Phys. Geogr. 82A(23), 337–363.
Hall B. L. and Denton G. H. (2000b) Radiocarbon chronology of Ross Sea drift, eastern Taylor
Valley, Antarctica: Evidence for a grounded ice sheet in the Ross Sea at the last glacial
maximum. Geografiska Annaler Series A-Phys. Geogr. 82A(23), 305–336.
Hall B. L., Denton G. H. and Hendy C. H. (2000) Evidence from Taylor Valley for a grounded
ice sheet in the Ross Sea, Antarctica. Geografiska Annaler Series A-Phys. Geogr. 82A(23),
275–303.
Hamilton S. K. and Lewis W. M. J. (1992) Stable carbon and nitrogen isotopes in algae and
detritus from the Orinoco river floodplain, Venezuela. Geochimica et Cosmochimica Acta.
56(12), 4237–4246.
298 JENNIFER LAWSON ET AL.

Harvey H. R., Tuttle J. H. and Bell J. T. (1995) Kinetics of phytoplankton decay during sim-
ulated sedimentation: Changes in biochemical composition and microbial activity under oxic
and anoxic conditions. Geochimica et Cosmochimica Acta. 59(16), 3367–3377.
Hawes I. and Schwarz A.-M. (1999) Photosynthesis in an extreme shade environment: Benthic
microbial mats from Lake Hoare, a permanently ice-covered Antarctic lake. J. Phycol. 35,
448–459.
Hecky R. E., Campbell P. and Hendzel L. L. (1993) The stoichiometry of carbon, nitrogen, and
phosphorous in particulate matter of lakes and oceans. Limnol. Oceanogr. 38, 709–724.
Hedges J. I., Baldock J. A., Yves G., Lee C., PetersonM. andWakeham S. G. (2001) Evidence for
non-selective preservation of organic matter in sinking marine particles. Nature 409, 801–803.
Hendy C. H. (2000a) Late Quaternary lakes in the McMurdo Sound region of Antarctica.
Geografiska Annaler Series A-Phys. Geogr. 82A(23), 411–432.
Hendy C. H. (2000b) The role of polar lake ice as a filter for glacial lacustrine sediments.
Geografiska Annaler Series A-Phys. Geogr. 82A(23), 271–274.
Henrichs S. M. and Doyle A. P. (1986) Decomposition of 14C-labeled organic substances in
marine sediments. Limnol. Oceanogr. 319(4), 765–778.
Howes B. L. and Schlezinger D. R. (1992) Carbon cycling in a redox-stratified Antarctic lake,
Lake Fryxell. Antarctic J. US. 27(5), 263–265.
Karr E. A., Sattley W. M., Jung D. O., Madigan M. T. and Achenbach L. A. (2003) Remarkable
diversity of phototrophic purple bacteria in a permanently frozen Antarctic lake. Appl.
Environ. Microbiol. 69(8), 4910–1914.
Kendall C., Silva S. R. and Kelly V. J. (2001) Carbon and nitrogen isotopic compositions of
particulate organic matter in four large river systems across the United States. Hydrological
Processes 15, 1301–1346.
Konley S. T. (2002) Linkages Between Soils and Lake Ice Sediment Biogeochemistry: Taylor
Valley, Southern Victoria Land Antarctica. M.S. Thesis, Montana State University at
Bozeman.
Laws E. A., Popp B. N., Bidigare R. R., Kennicutt M. C. and Macko S. A. (1995) Dependence of
phytoplankton carbon isotopic composition on growth rate and [CO2]aq: Theoretical con-
siderations and experimental results. Geochimica et Cosmochimica Acta. 59(6), 1131–1138.
LaZerte B. D. (1983) Stable carbon isotope ratios: implications for the source sediment carbon
and phytoplankton carbon assimilation in Lake Memphremagog, Quebec. Can. J. Fish.
Aqua. Sci. 40, 1658–1666.
Lee P. A., Mikucki J. A., Foreman C. M., Priscu J. C., DiTullio G. R., Riseman S. F. and de
Mora S. J. (2004) Thermodynamic constraints on microbially mediated processes in lakes of
the McMurdo Dry Valleys, Antarctica. Geomicrobiol. J. 21(3), 221–237.
Lehmann M. F., Bernasconi S. M., Barbieri A. and McKenzie J. A. (2002) Preservation of
organic matter and alteration of its carbon and nitrogen isotope composition during simu-
lated and in situ early sedimentary diagenesis. Geochimica et Cosmochimica Acta. 66(20),
3573–3584.
Lyons W. B., Frape S. K. and Welch K. A. (1999) History of McMurdo Dry Valley lakes,
Antarctica, from stable chlorine isotope data. Geology 27(6), 527–530.
Lyons W. B., Tyler S. W., Wharton R. A., McKnight D. M. and Vaughn B. H. (1998) A Late
Holocene desiccation of Lake Hoare and Lake Fryxell, McMurdo Dry Valleys, Antarctica.
Antarctic Sci. 10(3), 247–256.
Macko S. A. and Ostrom N. E. (1994) Molecular and pollutions studies using stable isotopes. In
Stable Isotopes in Ecology and Environmental Science, Vol. 5–62 (Ed. R. H. Michener), p. 4.
Blackwell Scientific Publications.
McKay C. P., Clow G., Wharton Jr. R. A. and Squyres S. W. (1985) Thickness of ice on
perennially frozen lakes. Nature 313, 561–562.
ANTARCTIC LACUSTRINE STABLE ISOTOPES 299
McKenzie J. A. (1980) Carbon-13 cycle in Lake Greifen: A Model for restricted ocean basins. In
Nature and Origin of Cretaceous carbon-rich facies (ed. S. O. Schlanger), pp. 197–207.
McKnight D. M. and Andrews E. D. (1993a) Hydrologic and geochemical processes at the
stream-lake interface in a permanently ice-covered lake in the McMurdo Dry Valleys, Ant-
arctica. Verhandlungen-Internationale Vereinigung fuer Theoretische und Angewandte Lim-
nologie 25(2), 957–959.
McKnight D. M. and Andrews E. D. (1993b) Potential hydrologic and geochemical conse-
quences of the 1992 merging of lake Chad with Lake Hoare in Taylor Valley. Antarctic J.-
review, 249–251.
Meyers P. A. and Eadie B. J. (1993) Sources, degradation and recycling of organic matter
associated with sinking particles in Lake Michigan. Organic Geochem 20(1), 47–56.
Meyers P. A. and Ishiwatari R. (1993) Lacustrine organic geochemistry—an overview of indi-
cators of organic matter sources and diagenesis in lake sediments. Organic Geochem. 20(7),
867–900.
Miller L. G. and Aiken G. R. (1996) Effects of glacial meltwater inflows and moat freezing on
mixing in an ice-covered Antarctic lake as interpreted from stable isotope and tritium dis-
tributions. Limnol. Oceanogr. 41(5), 966–976.
Nedell S. S., Andersen D. W., Squyres S. W. and Love F. G. (1987) Sedimentation in ice-covered
Lake Hoare, Antarctica. Sedimentology 34, 1093–1106.
Neumann K., Lyons W. B. and Des Marais D. J. (1998) Inorganic carbon-isotope distribution
and budget in the Lake Hoare and Lake Fryxell basins, Taylor Valley, Antarctica. Annals
Glaciol 27, 685–689.
Neumann K., Lyons W. B., Priscu J. C., Des Marais D. J. and Welch K. A. (2004) The carbon
isotopic composition of dissolved inorganic carbon in perennially ice-covered antarctic lakes:
Searching for a biogenic signature. Annals of Glaciol. in press.
Neumann K., Lyons W. B., Priscu J. C. and Donahue R. J. (2001) CO2 concentrations in
perennially ice-covered lakes of Taylor Valley, Antarctica. Biogeochemistry 56, 27–50.
O’Leary M. H. (1981) Carbon isotope fractionation in plants. Phytochemistry 20, 553–567.
Ostrom N. E., Long D. T., Bell E. M. and Beals T. (1998) The origin and cycling of
particulate and sedimentary organic matter and nitrate in Lake Superior. Chem. Geol.
152(12), 13–28.
Popp B. N., Laws E. A., Bidigare R. R., Dore J. R., Hanson K. L. and Wakeham S. G. (1998)
Effect of phytoplankton cell geometry on carbon isotope fractionation. Geochimica et Cos-
mochimica Acta 62(1), 69–77.
Preuss A., Schauder R. and Fuchs G. (1989) Carbon isotope fractionation by autotrophic
bacteria with three different CO2 fixation pathways. Zeitschrift fur Naturforschung 44 C, 397–
402.
Priscu J. C. (1989) Photon dependence of inorganic nitrogen transport by phytoplankton in
perennially ice-covered Antarctic lakes. Hydrobiologia 172, 173–182.
Priscu J. C. (1992) Particulate organic matter decomposition in the water column of Lake
Bonney, Taylor Valley, Antarctica. Antarctic J. US. 27(5), 260–262.
Priscu J. C. (1995) Phytoplankton nutrient deficiency in lakes of the McMurdo Dry Valleys,
Antarctica. Freshwater Biol. 34(2), 215–227.
Priscu J. C. (1998) Ecosystem dynamics in a polar desert; the McMurdo dry valleys, Antarctica.
In Antarctic Research Series, Vol. 72, p. 369. American Geophysical Union.
Priscu J. C., Downes M. T. and McKay C. P. (1996) Extreme supersaturation of nitrous oxide in
a poorly ventilated Antarctic lake. Limnol. Oceanogr. 41(7), 1544–1551.
Priscu J. C., Fritsen C. H., Adams E. E., Giovannoni S. J., Paerl H.W.,McKay C. P., Doran P. T.,
GordonD. A., Lanoil B. D. and Pinckney J. L. (1998) Perennial Antarctic lake ice: An oasis for
life in a polar desert. Science 280(5372), 2095–2098.
300 JENNIFER LAWSON ET AL.

Priscu J. C., Priscu L. R., Howard-Williams C. and Vincent W. F. (1987a) Photosynthate bio-
synthesis by phytoplankton in permanently ice-covered Antarctic lakes under continuous
sunlight. J. Plankton Res. 10(1), 333–340.
Priscu J. C., Priscu L. R., Vincent W. F. and Howard-Williams C. (1987b) Photosynthate dis-
tribution by microplankton in permanently ice-covered Antarctic desert lakes. Limnol.
Oceanogr. 2(1), 260–270.
Priscu J. C., Wolf C. F., Takacs C. D., Fritsen C. H., Laybourn-Parry J., Roberts E. C., Sattler B.
and Lyons W. B. (1999) Carbon transformations in a perennially ice-covered Antarctic lake.
Bioscience 49(12), 997–1008.
Quay P. D., Emerson S. R., Quay B. M. and Devol A. H. (1986) The carbon cycle for Lake
Washington - A stable isotope study. Limnol. Oceanogr. 31, 596–611.
Quay P. D., Wilbur D. O., Richey J. E., Hedges J. I. and Devol A. H. (1992) Carbon cycling in
the Amazon River: implications from the 13C compositions of particles and solutes. Limnol.
Oceanogr. 37, 857–871.
Rau G. H., Riebesell U. and Wolf-Gladrow D. (1996) A model of photosynthetic 13C frac-
tionation by marine phytoplankton based on diffusive molecular CO2 uptake. Marine
Ecology-Progress Series 133, 275–285.
Raven J. A. and Johnston A. M. (1991) Mechanisms of inorganic-carbon acquisition in marine
phytoplankton and their implications for the use of other resources. Limnol. Oceanogr. 36,
1701–1714.
Schidlowski M., Matzigkeit U. and Krumbein W. E. (1984) Superheavy organic carbon from
hypersaline microbial mats. Naturwissenschaften 71, 303–308.
Simmons G. M., Jr., Wharton R. A., Jr., McKay C. P., Nedell S. and Clow G. (1986) Sand/ice
interactions and sediment deposition in perennially ice-covered Antarctic lakes. Antarctic J.
US. 21, 217–220.
Spigel R. H. and Priscu J. C. (1998) Physical limnology of the McMurdo Dry Valley lakes. In
Ecosystem Dynamics in a Polar Desert: The McMurdo Dry Valleys, Antarctica, Vol. 72 (Ed.
J. C. Priscu), pp. 153–187. American Geophysical Union.
Tyler S. W., Cook P. G., Butt A. Z., Thomas J. M., Doran P. T. and Lyons W. B. (1998)
Evidence of deep circulation in two perennially ice-covered Antarctic lakes. Limnol. Ocea-
nogr. 43(4), 625–635.
Vincent W. F. (1981) Production strategies in Antarctic inland waters: Phytoplankton eco-
physiology in a permanently ice-covered lake. 62(5), 1215–1224.
Voytek M. A., Priscu J. C., and Ward B. B. (1999) The distribution and relative abundance of
ammonia-oxidizing bacteria in lakes of the McMurdo Dry Valley, Antarctica. Hydrobiologia
401, 113–130.
Ward B. B., Granger J., Maldonado M. T. and Wells M. L. (2003) What limits bacterial pro-
duction in the suboxic region of permanently ice-covered Lake Bonney, Antarctica? Aquatic
Microbial. Ecol. 31(1), 33–47.
Wharton R. A., Jr., Lyons W. B. and Des Marais D. J. (1993) Stable isotopic biogeochemistry of
carbon and nitrogen in a perennially ice-covered Antarctic lake.Chem. Geol. 107(12), 159–172.
Wharton R. A., Jr., McKay C. P., Parker B. C. and Simmons G. M., Jr. (1986) Oxygen budget of
a perennially ice-covered Antarctic dry valley lake. Limnol. Oceanogr. 31, 437–443.
Wharton R. A., Jr., Parker B. C. and Simmons G. M., Jr. (1983) Distribution, species compo-
sition and morphology of algal mats in Antarctic dry valley lakes. Phycologia 22(4), 355–365.
Wharton R. A., McKay C. P., Mancinelli R. L. and Simmons G. M. (1987) Perennial N2
Supersaturation in an Antarctic Lake. Nature 325(6102), 343–345.
Wharton R. A. J., Simmons G. M. J. and McKay C. P. (1989) Perennially ice-covered Lake
Hoare, Antarctica: physical environment, biology and sedimentation. Hydrobiologia 172,
305–320.
ANTARCTIC LACUSTRINE STABLE ISOTOPES 301