Impact of uncertainty in rainfall estimation on the identification of rainfall thresholds for debris...
12
Impact of uncertainty in rainfall estimation on the identification of rainfall thresholds for debris flow occurrence Efthymios I. Nikolopoulos a, ⁎, Stefano Crema a,b , Lorenzo Marchi b , Francesco Marra a , Fausto Guzzetti c , Marco Borga a a Department of Land, Environment, Agriculture and Forestry, University of Padova, Legnaro, Italy b National Research Council, IRPI, Padova, Italy c National Research Council, IRPI, Perugia, Italy abstract article info Article history: Received 30 October 2013 Received in revised form 10 June 2014 Accepted 11 June 2014 Available online 19 June 2014 Keywords: Debris flow Rainfall estimation Precipitation threshold Raingauge network design Estimation of rainfall intensity–duration thresholds, used for the identification of debris flow/landslide triggering rainfall events, has been traditionally based on raingauge observations. The main drawback of using information from gauges is that the measurement stations are usually located far away from the debris flow initiation areas. In complex terrain where debris flows take place, the spatial variability of rainfall can be very high and this trans- lates in large uncertainty of raingauge-based estimates of debris flow triggering rainfall. This work focuses on the assessment of the impact of rainfall estimation uncertainty on identification and use of rainfall thresholds for debris flow occurrence. The Upper Adige River basin, Northern Italy, is the area of study. A detailed database of more than 400 identified debris flow initiation points during the period 2000–2010 and a raingauge network of 100 stations comprise the database used for this work. The methodology examines the intensity–duration thresholds derived from a set of raingauges that are assumed to be located at debris flow initiation points (DFRs) and an equivalent set of raingauges assumed to have the role of the closest (to debris flow) available mea- surement (MRs). A set of reference rainfall thresholds is used to identify the rainfall events at DFRs that “trig- gered” debris flows (i.e. exceed the threshold). For these same events, the corresponding rainfall thresholds are derived from MR observations. Comparison between the rainfall thresholds derived from DFRs and MRs re- vealed that uncertainty in rainfall estimation has a major impact on estimated intensity–duration thresholds. Specifically, the results showed that thresholds estimated from MR observations are consistently underestimated. Evaluation of the estimated thresholds for warning procedures showed that while detection is high, the main issue is the high false alarm ratio, which limits the overall accuracy of the procedure. Overall per- formance on debris flow prediction was shown to be good for low rainfall thresholds and poor for high rainfall thresholds examined. Lastly, it was found that filtering out rainfall events with duration b 12 h may improve bias in estimated thresholds and performance for high rainfall thresholds. © 2014 Elsevier B.V. All rights reserved. 1. Introduction Debris flows are rapidly flowing, gravity-driven mixtures of roughly equal parts of sediment and water in which a broad distribution of grain size, commonly including gravel and boulders, is mixed vertically (Iverson, 2005). The occurrence of shallow landslides and debris flows (collectively ‘debris flows’, hereinafter) is of concern to hydro- geomorphological and natural-hazard sciences, because of the high ranking of such events among natural disasters, the number of people affected globally, and the number of fatalities caused by the individual events (Petley, 2012; Dowling and Santi, 2013). Analysis of a catalogue of landslides and debris flows compiled by Salvati et al. (2010) for Italy revealed that, in the 59-year period 1950–2008, most of the 2204 landslides that have resulted in at least 4077 casualties were rainfall- induced shallow landslides or debris flows. A common goal of debris flow research is to improve the ability to forecast the occurrence of the events in space and time. Susceptibility maps and models are typically used to estimate where debris flows are likely to occur (Borga et al., 2002; Guzzetti et al., 2005; Baum et al., 2010), while rainfall thresholds are determined to define the meteoro- logical conditions that, when reached or exceeded, are likely to result in debris flows (e.g., Caine, 1980; Wieczorek, 1996; Cannon and Gartner, 2005; Guzzetti et al., 2008; Chen et al., 2011; Jakob et al., 2012). Rainfall thresholds can be defined by adopting physical (process-based, conceptual) or empirical (historical, statistical) ap- proaches (Aleotti, 2004; Wieczorek and Glade, 2005; Guzzetti et al., 2007, 2008; Schneuwly-Bollschweiler and Stoffel, 2012; and references therein), and most commonly take the form of a simple relationship linking rainfall duration to other measures of rainfall, including rainfall Geomorphology 221 (2014) 286–297 ⁎ Corresponding author. Tel.: +39 0498272681; fax: +39 0498272750. E-mail address: [email protected] (E.I. Nikolopoulos). http://dx.doi.org/10.1016/j.geomorph.2014.06.015 0169-555X/© 2014 Elsevier B.V. All rights reserved. Contents lists available at ScienceDirect Geomorphology journal homepage: www.elsevier.com/locate/geomorph
-
Upload
independent -
Category
Documents
-
view
0 -
download
0
Transcript of Impact of uncertainty in rainfall estimation on the identification of rainfall thresholds for debris...

Geomorphology 221 (2014) 286–297
Contents lists available at ScienceDirect
Geomorphology
j ourna l homepage: www.e lsev ie r .com/ locate /geomorph
Impact of uncertainty in rainfall estimation on the identification ofrainfall thresholds for debris flow occurrence
Efthymios I. Nikolopoulos a,⁎, Stefano Crema a,b, Lorenzo Marchi b, Francesco Marra a,Fausto Guzzetti c, Marco Borga a
a Department of Land, Environment, Agriculture and Forestry, University of Padova, Legnaro, Italyb National Research Council, IRPI, Padova, Italyc National Research Council, IRPI, Perugia, Italy
⁎ Corresponding author. Tel.: +39 0498272681; fax: +E-mail address: [email protected] (E.I.
http://dx.doi.org/10.1016/j.geomorph.2014.06.0150169-555X/© 2014 Elsevier B.V. All rights reserved.
a b s t r a c t
a r t i c l e i n f oArticle history:Received 30 October 2013Received in revised form 10 June 2014Accepted 11 June 2014Available online 19 June 2014
Keywords:Debris flowRainfall estimationPrecipitation thresholdRaingauge network design
Estimation of rainfall intensity–duration thresholds, used for the identification of debris flow/landslide triggeringrainfall events, has been traditionally based on raingauge observations. The main drawback of using informationfrom gauges is that themeasurement stations are usually located far away from the debrisflow initiation areas. Incomplex terrain where debris flows take place, the spatial variability of rainfall can be very high and this trans-lates in large uncertainty of raingauge-based estimates of debris flow triggering rainfall. This work focuses onthe assessment of the impact of rainfall estimation uncertainty on identification and use of rainfall thresholdsfor debris flow occurrence. The Upper Adige River basin, Northern Italy, is the area of study. A detailed databaseof more than 400 identified debris flow initiation points during the period 2000–2010 and a raingauge networkof 100 stations comprise the database used for this work. The methodology examines the intensity–durationthresholds derived from a set of raingauges that are assumed to be located at debris flow initiation points(DFRs) and an equivalent set of raingauges assumed to have the role of the closest (to debris flow) availablemea-surement (MRs). A set of reference rainfall thresholds is used to identify the rainfall events at DFRs that “trig-gered” debris flows (i.e. exceed the threshold). For these same events, the corresponding rainfall thresholdsare derived from MR observations. Comparison between the rainfall thresholds derived from DFRs and MRs re-vealed that uncertainty in rainfall estimation has a major impact on estimated intensity–duration thresholds.Specifically, the results showed that thresholds estimated from MR observations are consistentlyunderestimated. Evaluation of the estimated thresholds for warning procedures showed that while detection ishigh, the main issue is the high false alarm ratio, which limits the overall accuracy of the procedure. Overall per-formance on debris flow prediction was shown to be good for low rainfall thresholds and poor for high rainfallthresholds examined. Lastly, it was found that filtering out rainfall events with duration b12 h may improvebias in estimated thresholds and performance for high rainfall thresholds.
© 2014 Elsevier B.V. All rights reserved.
1. Introduction
Debris flows are rapidly flowing, gravity-driven mixtures of roughlyequal parts of sediment andwater inwhich a broad distribution of grainsize, commonly including gravel and boulders, is mixed vertically(Iverson, 2005). The occurrence of shallow landslides and debris flows(collectively ‘debris flows’, hereinafter) is of concern to hydro-geomorphological and natural-hazard sciences, because of the highranking of such events among natural disasters, the number of peopleaffected globally, and the number of fatalities caused by the individualevents (Petley, 2012; Dowling and Santi, 2013). Analysis of a catalogueof landslides and debris flows compiled by Salvati et al. (2010) for Italyrevealed that, in the 59-year period 1950–2008, most of the 2204
39 0498272750.Nikolopoulos).
landslides that have resulted in at least 4077 casualties were rainfall-induced shallow landslides or debris flows.
A common goal of debris flow research is to improve the ability toforecast the occurrence of the events in space and time. Susceptibilitymaps and models are typically used to estimate where debris flowsare likely to occur (Borga et al., 2002; Guzzetti et al., 2005; Baum et al.,2010), while rainfall thresholds are determined to define the meteoro-logical conditions that, when reached or exceeded, are likely to resultin debris flows (e.g., Caine, 1980; Wieczorek, 1996; Cannon andGartner, 2005; Guzzetti et al., 2008; Chen et al., 2011; Jakob et al.,2012). Rainfall thresholds can be defined by adopting physical(process-based, conceptual) or empirical (historical, statistical) ap-proaches (Aleotti, 2004; Wieczorek and Glade, 2005; Guzzetti et al.,2007, 2008; Schneuwly-Bollschweiler and Stoffel, 2012; and referencestherein), and most commonly take the form of a simple relationshiplinking rainfall duration to other measures of rainfall, including rainfall

287E.I. Nikolopoulos et al. / Geomorphology 221 (2014) 286–297
intensity or event-cumulated rainfall (Aleotti, 2004; Guzzetti et al.,2007). Usually, rainfall thresholds for the possible initiation of land-slides are minimum thresholds i.e., they correspond to a low levelabove which the process may take place (Reichenbach et al., 1998;Guzzetti et al., 2007). Following the pioneering works of Caine (1980)and Innes (1983), rainfall thresholds for debris flow occurrence havebeen determined at the local, regional, and global scales (Guzzettiet al., 2008, and references therein).
The general acceptance of rainfall thresholds for debris flow fore-casting and warning emerges from the considerable literature propos-ing rainfall thresholds (e.g., Jibson, 1989; Wilson and Wieczorek,1995; Deganutti et al., 2000; Jakob and Weatherly, 2003; Aleotti,2004; Cannon and Gartner, 2005; Guzzetti et al., 2007, 2008; Chenet al., 2011; Jakob et al., 2012; and references therein). A commonproblem with the operational use of rainfall thresholds for debrisflows is the occurrence of false positives (i.e., rainfall conditions thatshould have resulted in landslides that were not reported) and falsenegatives (i.e., rainfall conditions that should have not resulted in land-slides that were reported; Staley et al., 2013). A high false alarm ratio(i.e., the fraction of forecasted events that did not occur) may reducethe public's willingness to respond to the warnings (Barnes et al.,2007; Staley et al., 2013), but it is unavoidable given the large uncer-tainties inherent in the threshold-based forecasting of debris flow oc-currence. In part, this uncertainty is associated with the fact thatrainfall is not the only causative factor for debris flow initiation(Aleotti and Chowdhury, 1999). Other factors play a role, includinghydrologic, geologic and climatologic conditions, introducing variabilityin the thresholds. Investigators have recognized the issue, and recentefforts were made to quantify the dependence of rainfall thresholdson hydrologic and geologic factors (Frattini et al., 2009; Jaiswal andvan Westen, 2009; Penna et al., 2011; Berti et al., 2012; Peruccacciet al., 2012).
A recognized component of the uncertainty associated with theestimation and use of rainfall thresholds for debris flow forecasting isrelated to the large spatial and temporal variability of the precipitation.Surprisingly, although rainfall estimation uncertainty was long recog-nized as an important factor in defining the thresholds (Caine, 1980),studies investigating explicitly the effect on the estimation of thethresholds are lacking. The rainfall that triggers single ormultiple debrisflows is generally unknown, due to the lack of raingauges at the exactlocation where the debris flows begin. The amount of rainfall resultingin debris flows is most often estimated based on data from the neigh-boring raingauges. Recently, weather radar and satellite-based rainfallestimates are being used in threshold model estimation (Kirschbaumet al., 2012; Rossi et al., 2012), however this study focuses onraingauge-based rain estimates. The raingauge-based estimates maybe affected by significant uncertainties (including biases), especiallywhen the spatial variability of the rainfall is large. This is a particularlysevere problem in orographically complex regions. Accounting for thelarge variability of rainfall in mountainous areas is challenging evenfor modern raingauge networks. In the Alps, where dense networks ofraingauges are available, the typical spacing between the single gaugingstations and the debris flow locations is typically between 4 and 15 km.However, in these areas the distribution of the triggering rainfall variesconsiderably at length scale smaller than 5 km (e.g., Smith et al., 2003;Panziera et al., 2011). The estimation problem is especially severe forthe location of the debris flows, with raingauges that are commonlylocated at low elevation (e.g., in the valley floors) and debris flowsthat originate at high elevations, in the head part of themountain catch-ments (Stoffel et al., 2011).
The literature on rainfall thresholds reports little information on therainfall observations and rainfall estimation procedures used to derivethe thresholds (Borga et al., 2014). A rainfall estimation procedurethat was often used for the purpose of rainfall threshold identificationis the one based on the nearest raingauge. In this procedure, the rainfallmeasured at the nearest raingauge is used to estimate the rainfall that
has resulted in debris flows (Jakob and Weatherly, 2003; Brunettiet al., 2010; Jakob et al., 2012). A number of works have proposedprocedures to filter the effects of rainfall estimation uncertainty on theestimation of a threshold (Jakob and Weatherly, 2003; Guzzetti et al.,2007; Jakob et al., 2012). These procedures include the use of filters onrainfall duration (short rainfall events are not used in the threshold es-timation) and themaximum distance between debris flow location andthe nearest raingauge. The rationale for filtering out very short rainfallevents is that these events are also very localized. Hence, they are char-acterized by larger uncertainties in rainfall estimation with respect tolonger events (Berne et al., 2004; Marra et al., 2014).
Given this background, the objective of thiswork is to investigate theimpact of the uncertainty inherent in the estimation of rainfall on thedefinition of a threshold for possible debris flow occurrence, and onthe operational use of the threshold for prediction purposes. Theseeffects are likely to depend on two factors: the space–time rainfallvariability and the distances between the debris flow locations andthe raingauges on both the horizontal and vertical planes. Three mainproblems are considered: (i) the effect of the rainfall sampling problemon the estimation of the parameters of the threshold model, (ii) the ef-fect of applying a number of procedures to filter the rainfall informationon the threshold model estimation, and (iii) the examination of theimpact of the precipitation sampling problem on the performance ofthe threshold as a predictor of debris flow occurrence. These aspectsare examined here based on a numerical experiment where a subsetof the available raingauges in our study region is assumed to be co-located with debris flow initiation points while the rest of theraingauges are used as the network of measuring raingauges. Datafrom the Upper Adige River basin in the Eastern Italian Alps(7400 km2) are used for the investigation.
The remaining part of the paper is organized as follows. Section 2characterizes the rainfall estimation problem for the case of the thresh-oldmodel estimation. Section 3 describes the study area, and the rainfalland debris flows data used. Section 4 outlines the methodologicalframework used to address the research questions defined above, andpresents the setup and the results of the proposed methodology. InSection 5, we present the results on the impact of rainfall estimationuncertainty on the identification and performance of the thresholdcurves. Lastly, results are discussed and the main findings of the workare summarized in Section 6.
2. Rainfall estimation uncertainty and debris flowthreshold estimation
Most of the rainfall thresholds proposed in the literature for possibledebris flow occurrence are rainfall intensity (I) vs. rainfall duration (D)thresholds (Caine, 1980; Crosta, 1998; Aleotti, 2004; Guzzetti et al.,2007, 2008). Equations relating the intensity (I) and duration (D) ofthe debris flow triggering rainfall event take the general form:
I ¼ αD−β ð1Þ
where I is the mean rainfall intensity, in mm h-1, D is the rainfall dura-tion, in h, and α and β are constants that adapt the power-law modelto the empirical data. Values of β b 1 are common in the literature(e.g., Guzzetti et al., 2007, 2008), implying that the rainfall intensity isdominant over the rainfall duration in the empirical threshold models.Methods used for establishing empirical rainfall thresholds can be prac-tical, or based on rigorous statistical procedures (Guzzetti et al., 2007).Practical methods are based on the visual inspection of the cloud ofpoints that represents the rainfall duration and intensity conditionsthat have resulted in debris flows, and in drawing a threshold line as aheuristic lower boundary to the empirical data. Statistical methods, in-cluding the Bayesian inference method proposed by Guzzetti et al.(2007, 2008) and the frequentist method proposed by Brunetti et al.(2010) and expanded by Peruccacci et al. (2012) permit the

288 E.I. Nikolopoulos et al. / Geomorphology 221 (2014) 286–297
identification of rainfall thresholds in a coherent framework, and resultin thresholds that are reproducible and for which measures of uncer-tainty are estimated (Peruccacci et al., 2012). In general, the uncertaintyaffecting the estimation of the intensity–duration (ID, hereinafter)threshold is the result of physical process heterogeneity and/or rainfallestimation uncertainty. In this work we will focus only on the latter.
Rainfall intensities and durations used to identify the ID thresholdare generally obtained through spatial estimation. When rainfall prop-erties are estimated according to the available raingauges, errors are in-troduced in the assessment of the rainfall intensities and durations overdebris flow locations. The sources of uncertainty in spatial estimation ofrainfall are related to: (i) density and geometry of the gauge networks(Morrissey et al., 1995), (ii) estimation procedures (Tabios and Salas,1985), and (iii) spatial variability of rainfall (Verworn and Haberlandt,2011; Marra et al., 2014). For the specific problem of ID thresholdidentification, errors in rainfall estimates translate in error in the esti-mated ID threshold. Fig. 1 provides a graphical example of the rainfallerror propagation in the estimation of an ID threshold, given an idealcondition of clear separation between rainfall that have triggered(black dots) and have not triggered (white dots) debris flows(Fig. 1a). This ID threshold is termed here ‘true’ threshold. The effectof the rainfall estimation uncertainty on the identification of the IDthreshold (Fig. 1a) is shown in Fig. 1b. Essentially, some rainfall intensi-ties will be underestimated and others will be overestimated, resultingin the collapsing of the clear separation (ideal case) and the mixing ofdebris and no-debris flow events. Given that the ID threshold is estimat-ed as a lower boundary of the estimated debris flow triggering rainfalls,it is expected that the uncertainty in rainfall estimation will lead to a bi-ased identification of the ID threshold. Biases due to orographic
Fig. 1. Conceptual description of the effect of rainfall estimation uncertainty on the IDthreshold model estimation. (a) Ideal condition in which there is a clear separation be-tween rainfall that triggered (black dots) and did not trigger (white dots) debris flows;(b) representation of ideal conditions in (a) affected by uncertainty in rain estimation.
dependence of the debris-flow triggering rainfall may add to this bias.Therefore the effects listed above will translate to biased estimation ofthe α and β parameters in Eq. (1).
However, it is important to note that even a biased ID thresholdmaywork successfully in terms of the ability to predict debris flow occur-rence. This is the case of systematic error in rainfall estimation: the esti-mated ID threshold would be biased but the ranking of the estimatedand true event rainfall would remain unchanged. In this case predic-tions obtained from the biased ID threshold would be unaffected bythe bias (Jakob et al., 2012). It is therefore equally important to evaluatehow the characteristics of the rainfall estimation affect the quality of thedebris flow predictions based on use of the estimated ID thresholdmodel.
3. Study area and data
The data used for this study were obtained in the Upper Adige Riverbasin, a mountainous region covering approximately 7400 km2 inNorthern Italy (Fig. 2). This region has been selected based on threemo-tivations. First, Salvati et al. (2010) have recognized that this area wascharacterized by a significant societal landslide risk in the period1950–2008. Second, a database listing more than 400 debris flows inthe period 2000–2010 is available for the area. Third, the area isequipped with a dense network of raingauges, which is a necessarycondition for the examination of the rainfall sampling problem.
Elevation in the area ranges between 200 and 3900 m a.s.l., withmean elevation around 1800 m a.s.l. The precipitation regime is influ-enced by western Atlantic airflows and southern circulation patterns(Frei and Schär, 1998). The dominant climate pattern in the region iscontinental, with the distribution of the monthly precipitation showingtwo maxima, in August and October. Cold months (from October toApril) are dominated by snow, and widespread precipitation. BetweenMay and September, the precipitation is brought by mesoscale convec-tive systems and localized thunderstorms (Norbiato et al., 2009a; Meiet al., 2014). Part of the western portion of the study area belongs tothe dry internal alpine region, with a mean annual precipitation(MAP) ranging between 400 and 700 mm, the result of sheltering ofthe mountain range to southerly and northerly winds. MAP increasesto 1300mm in the northern portion of the region, where the rainfall re-gime is conditioned by the “stau” effect i.e., the intensification of rainfallwhen warm andmoist air from the Mediterranean Sea is lifted over theAlps, leading to the Foehn effect on the leeward side. The dry-to-moderate rainfall regime is reflected also in the climatology of the rain-fall extremes. Rainfall quantiles corresponding to a 100-year return pe-riod rarely exceed 50 mm at 1-hour duration, and 150 mm at 24-hourduration (Norbiato et al., 2009b).
3.1. Debris flow and rainfall data
In 1998, the local government (Alto Adige — Southern Tyrol Prov-ince) began a systematic collection of information on the occurrenceof debris flows in the Upper Adige River basin. This long-term efforthas resulted in the compilation of the ‘Event Documentation 30’(ED30) database listing information on the location of 442 debrisflows in the period 2000–2010. In the database, the initiation point ofthe individual debris flows is geo-referenced with accuracy up to50m. The database is considered complete, except for a systematic cen-soring of very small (b700m3) failures that remained hidden under theforest canopy, or stopped upstream from the debris flow fans(Brardinoni et al., 2012). This is an unprecedented detail for cataloguesof historical landslide events (Govi and Turitto, 1994; Guzzetti et al.,1994; Guzzetti and Tonelli, 2004; Pavlova et al., 2011). Examination ofthe seasonal distribution of the debris flows listed in the database re-vealed that 90% of the events occurred between June and September,a seasonal period when precipitation is dominated by rainfall, andsnowfall is rare. Based on this evidence, we excluded from the analysis

Fig. 2. Map of the Upper Adige River basin. Shades of color show terrain elevation. Black triangles show location of raingauges.
289E.I. Nikolopoulos et al. / Geomorphology 221 (2014) 286–297
all the events in the catalogue that have occurred between October andMay. The reduced dataset lists 405 debris flows, whose geographical lo-cation is shown in Fig. 3.
A dense network of raingauges measures the precipitation in thestudy area (Fig. 2), including 100 raingauges located inside the basinarea (60 raingauges with data available for at least 90% of the timeover the study period 2000–2010). This corresponds to a density ofabout one raingauge every ~74 km2. The horizontal distance betweentwo neighboring raingauges ranges from 0.44 to 15.3 km, with an aver-age of 5.8 km. The altitude of the raingauges ranges from 200 to 2800m a.s.l., with an average of 1200 m a.s.l. The temporal resolution of
Fig. 3.Map of theUpper Adige River basin. Shades of color show terrain elevation. Green trianglein the period from 2000 to 2010.
the original data is 10min; the data have been aggregated at the hourlyresolution for the analyses described below.
3.2. Estimation of the intensity–duration relationship
To estimate the regional rainfall ID threshold we adopted thefrequentist method proposed by Brunetti et al. (2010). The method al-lows one to define ID rainfall thresholds characterized by different levelsof exceedance probabilities (e.g. 1% and 5% are commonly used exceed-ance levels, see for example Brunetti et al., 2010; Peruccacci et al., 2012).In this work, we used the 1% exceedance probability level to estimate
s/circles show location ofMRs/DFRs. Gray circles show location of debrisflows inventoried

290 E.I. Nikolopoulos et al. / Geomorphology 221 (2014) 286–297
the rainfall threshold, whichmeans that the probability of a debris flowtriggering rainfall event (I and D pair) to be under the estimated IDthreshold is less than 1%. For each recorded debris flow date and loca-tion, the corresponding rainfall event was determined at the closestraingauge, using the available rainfall record, and the values of the rain-fall duration and of themean rainfall intensity were calculated. Calcula-tion of event-based properties required the identification of theindividual rainfall events in the rainfall records. Separation of subse-quent rainfall events was based on the use of an inter-event period of24 consecutive hours without rainfall. Fig. 4 summarizes the I and Dpairs for the 405 debris flows analyzed in this study, and the corre-sponding ID threshold, I = 1.12D−0.49, with I in mm h−1 and D in h.The estimated exponent β = 0.49 is close to the exponents for otherID thresholds proposed in the literature for areas in Northern Italy(Guzzetti et al., 2007 and references therein), but the coefficient α isconsiderably lower suggesting that the rainfall required to trigger debrisflows in the Upper Adige River basin is less than that in other areas ofNorthern Italy. The difference can be the result of a number of factors,including the variability of the physical factors that control debris flowinitiation (e.g., lithology, topography, soil type, and vegetation cover)in the different areas and the less intense rainfall regime in the studyarea. The availability of a very detailed catalogue of debris flows,which includes small events not documented in less complete data-bases, may also lead to differences in the ID estimation.
4. Debris flow initiation points and rainfall measurement:the experiment
Rainfall information at the location of a debris flow initiation point isgenerally unknown and most commonly estimated based on measure-ments obtained at the nearby raingauges (Borga et al., 2014). Thismeans that evaluation of rainfall estimation uncertainty by comparisonof rainfall over raingauge and debris flow location is not possible. There-fore, in order to examine the impact of rainfall sampling on ID thresholdmodel, we developed a numerical experiment that is based only on in-formation from available raingauges. Details on the setup of the exper-iment are provided in the sections below.
4.1. Experimental design
The core setup of the experiment involved two main elements:i) definition of hypothetical locations of debris flow occurrence, and
Fig. 4. Rainfall duration (D, in h) and mean rainfall intensity (I, in mm h−1) values ofrecorded debris flow triggering rainfall events, according to closest available gauge obser-vations. Black line is the estimated ID rainfall threshold at 1% exceedance level.
ii) identification of debris flow triggering rainfall events over theselocations.
Hypothetical locations of debris flows are assumed to be co-locatedwith a subset of available raingauges considered as the debris flowraingauges (labeled DFRs). This means that DFRs do not correspond toactual debris flow locations but simply to the location of availableraingauges for which “true” rainfall is known. In addition, for eachDFR, another raingauge was selected and assumed to be the corre-sponding nearest measurement raingauge (labeled MR).
The second main element of the experimental setup involved thedefinition of the debris flow triggering rainfall events. The triggeringrainfall events are defined in a hypothetical manner. A reference IDthreshold is applied on DFR raingauge observations and used to identifythe hypothetical debris flow (denoted hereinafter in quotes) triggeringrainfall events. Specifically, a predefined power-law ID threshold is as-sumed to be the “true” threshold (conceptually similar to Fig. 1) and isused to identify the “debris flow” triggering events i.e., the rainfallevents that exceeded the reference ID threshold, at the location of theDFRs. In this way, the rainfall comparison between a DFR and its corre-sponding MR for these events permits us to evaluate the uncertaintyaffecting the estimation of debris flow triggering rainfall characteristics.In the sameway, comparison between ID threshold identified accordingto MR observations and “reference” ID reveals how uncertainty in rain-fall estimation propagates to the identification of ID thresholds. This ex-periment has been performed for a number of reference ID thresholds,in order to gain insight into the dependence of the uncertainty impacton “true” ID relationship.
4.2. Selection of DFR and MR locations
An important step in the analysis consisted of the definitions of DFRsand MRs. Considering that the rainfall variability between the locationof the debris flow and the nearest raingauge depends on the geograph-ical (Euclidean) distance and on the difference in elevation, selection ofDFRs and MRs should account for the representativeness of these vari-ables. In other words, selected DFRs and MRs should maintain, as closeas possible, the geometrical relationship (in terms of distance and eleva-tion difference) obtained from the actual record of debris flows andtheir corresponding nearest raingauges. Thus, selection of DFRs andMRs as shown in Fig. 3 was made so that the resulting distribution of(a) the difference in elevation, and (b) the geographical (Euclidean) dis-tance between DFRs andMRs would match the corresponding distribu-tion derived from the individual debris-flow locations in the database,and their nearest raingauges (Fig. 5). The number of pairs thatwe finallyselected was a compromise between the requirement to have a largesample size and the need to accurately describe the observed geometri-cal relationships (between actual debris flow locations and nearestgauges) with those between DFRs and MRs. Operating this way, we se-lected a total of 17 pairs of DFR–MR. Note that the 17 pairs resulted froma combination of 25 (instead of 34) unique gauge locations because inorder to match better the observed geometrical relationships, some ofthe gauges were involved in more than one pair and also played boththe role of a DFR and MR for different pairs (these are represented assuperimposed DFR/MR symbols in Fig. 3).
The final selection of the DFR–MR pairs was made so that the rangeof the observed distances wasmaintained, but the higher-end values ofthe observed elevation differences were not equally well represented.That compromise was necessary to maintain a realistic representationof the observed geometrical relationships, since to match the highestelevation differences, DFR–MR had to be located at a very high (relativeto observed) distance (N14 km). We acknowledge that this limits therepresentativeness of the DFR + MR sample. However, we stress thatthe differences in elevation that were not captured correspond to lessthan 10% of the entire sample. Furthermore, the empirical distributionsresulted from observed and selected elevation/distance properties(Fig. 5) were compared using the two-sample Kolmogorov–Smirnov
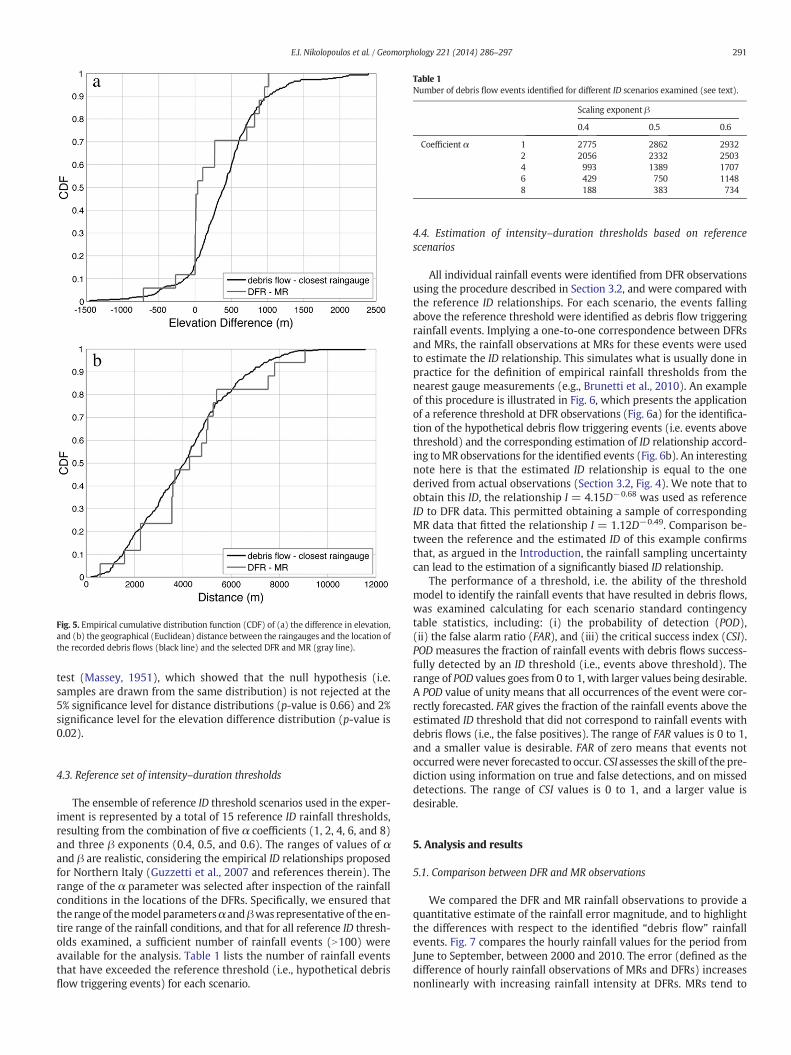
Fig. 5. Empirical cumulative distribution function (CDF) of (a) the difference in elevation,and (b) the geographical (Euclidean) distance between the raingauges and the location ofthe recorded debris flows (black line) and the selected DFR and MR (gray line).
Table 1Number of debris flow events identified for different ID scenarios examined (see text).
Scaling exponent β
0.4 0.5 0.6
Coefficient α 1 2775 2862 29322 2056 2332 25034 993 1389 17076 429 750 11488 188 383 734
291E.I. Nikolopoulos et al. / Geomorphology 221 (2014) 286–297
test (Massey, 1951), which showed that the null hypothesis (i.e.samples are drawn from the same distribution) is not rejected at the5% significance level for distance distributions (p-value is 0.66) and 2%significance level for the elevation difference distribution (p-value is0.02).
4.3. Reference set of intensity–duration thresholds
The ensemble of reference ID threshold scenarios used in the exper-iment is represented by a total of 15 reference ID rainfall thresholds,resulting from the combination of five α coefficients (1, 2, 4, 6, and 8)and three β exponents (0.4, 0.5, and 0.6). The ranges of values of αand β are realistic, considering the empirical ID relationships proposedfor Northern Italy (Guzzetti et al., 2007 and references therein). Therange of the α parameter was selected after inspection of the rainfallconditions in the locations of the DFRs. Specifically, we ensured thatthe range of themodel parametersα andβwas representative of the en-tire range of the rainfall conditions, and that for all reference ID thresh-olds examined, a sufficient number of rainfall events (N100) wereavailable for the analysis. Table 1 lists the number of rainfall eventsthat have exceeded the reference threshold (i.e., hypothetical debrisflow triggering events) for each scenario.
4.4. Estimation of intensity–duration thresholds based on referencescenarios
All individual rainfall events were identified from DFR observationsusing the procedure described in Section 3.2, and were compared withthe reference ID relationships. For each scenario, the events fallingabove the reference threshold were identified as debris flow triggeringrainfall events. Implying a one-to-one correspondence between DFRsand MRs, the rainfall observations at MRs for these events were usedto estimate the ID relationship. This simulates what is usually done inpractice for the definition of empirical rainfall thresholds from thenearest gauge measurements (e.g., Brunetti et al., 2010). An exampleof this procedure is illustrated in Fig. 6, which presents the applicationof a reference threshold at DFR observations (Fig. 6a) for the identifica-tion of the hypothetical debris flow triggering events (i.e. events abovethreshold) and the corresponding estimation of ID relationship accord-ing toMR observations for the identified events (Fig. 6b). An interestingnote here is that the estimated ID relationship is equal to the onederived from actual observations (Section 3.2, Fig. 4). We note that toobtain this ID, the relationship I = 4.15D−0.68 was used as referenceID to DFR data. This permitted obtaining a sample of correspondingMR data that fitted the relationship I = 1.12D−0.49. Comparison be-tween the reference and the estimated ID of this example confirmsthat, as argued in the Introduction, the rainfall sampling uncertaintycan lead to the estimation of a significantly biased ID relationship.
The performance of a threshold, i.e. the ability of the thresholdmodel to identify the rainfall events that have resulted in debris flows,was examined calculating for each scenario standard contingencytable statistics, including: (i) the probability of detection (POD),(ii) the false alarm ratio (FAR), and (iii) the critical success index (CSI).POD measures the fraction of rainfall events with debris flows success-fully detected by an ID threshold (i.e., events above threshold). Therange of POD values goes from 0 to 1, with larger values being desirable.A POD value of unity means that all occurrences of the event were cor-rectly forecasted. FAR gives the fraction of the rainfall events above theestimated ID threshold that did not correspond to rainfall events withdebris flows (i.e., the false positives). The range of FAR values is 0 to 1,and a smaller value is desirable. FAR of zero means that events notoccurredwere never forecasted to occur. CSI assesses the skill of the pre-diction using information on true and false detections, and on misseddetections. The range of CSI values is 0 to 1, and a larger value isdesirable.
5. Analysis and results
5.1. Comparison between DFR and MR observations
We compared the DFR and MR rainfall observations to provide aquantitative estimate of the rainfall error magnitude, and to highlightthe differences with respect to the identified “debris flow” rainfallevents. Fig. 7 compares the hourly rainfall values for the period fromJune to September, between 2000 and 2010. The error (defined as thedifference of hourly rainfall observations of MRs and DFRs) increasesnonlinearly with increasing rainfall intensity at DFRs. MRs tend to

Fig. 6. Intensity–duration graphs showing a) rainfall duration (D, in h) and mean rainfallintensity (I, in mm h−1) values according to the 17 DFR observations. Black solid line cor-responds to reference ID used for identification of debris (dark gray circles) and no debris(light gray circles) flow triggering events. b)D and I values, according to the 17MR obser-vations, for the “debris flow” events identified in (a). Dash line is the estimated ID rainfallthreshold at 1% exceedance level.
Fig. 7. Error (MR–DFR) in hourly rainfall values for different rainfall magnitude classesdefined according to DFR observations. Circles correspond to class-averaged values andvertical bars correspond to ±1 standard deviation.
Fig. 8. Error (MR–DFR) in mean rainfall intensity (I) for different rainfall duration (D)classes. Circles correspond to class-averaged values and vertical bars correspond to ±1standard deviation. Note that error values were calculated only based on “debris flow”
events that were identified using the reference ID: I = 4.15D−0.68.
292 E.I. Nikolopoulos et al. / Geomorphology 221 (2014) 286–297
slightly overestimate the DFR rainfall at low rainfall values (b4 mm),whileMRsprovide strongly underestimated rainfall for highDFR rainfallconditions (N10 mm). Furthermore, the error variance increases withrainfall, suggesting that higher uncertainty is associated with theestimation of high rainfall intensities.
We further examined the difference between the “debris flow”
rainfall events (instead of the hourly values), which is more relevantto uncertainty in ID thresholds. Fig. 8 shows the error in I for the “debrisflow” triggering rainfallmeasured atMRs andDFRs for variousD classes.Results are shown for the reference ID: I=4.15D−0.68 (used to identify“debris flow” events, see Section 4.3) and five different rainfall durationranges (for DFR rainfall, in h) are considered: D ≤ 6, 6 b D ≤ 12, 12 b D≤ 24, 24 b D ≤ 48, and D N 48. The mean and variance of the error in-crease with decreasing duration, suggesting as expected that the shortduration events are associated with higher uncertainty in rainfall esti-mation. Considering that short (long) duration events are associatedwith high (low) rainfall intensities, there is a clear correspondence be-tween the patterns of Figs. 7 and 8. An important note here is that
although on average the error is small (−1.2 mm h−1 for D ≤ 6 h andclose to zero for D N 6 h) the variance is considerable (coefficient of var-iation is larger than 2 in all cases) and increases with decreasing theevent duration. Given that the ID threshold is estimated as a lowerboundary of the estimated debris-flow triggering rainfalls, it is expectedthat uncertainty (i.e. error variance) will have a significant impact onthe estimated ID threshold.
5.2. Impact of rainfall estimation uncertainty on ID thresholds
Following the methodological approach described in Section 2, themodel parameters α̂ and β̂ of the ID thresholds were estimated usingthe frequentist approach proposed by Brunetti et al. (2010). The estimat-ed ID threshold relationship has the general form:
I ¼ α̂D−β̂: ð2Þ

293E.I. Nikolopoulos et al. / Geomorphology 221 (2014) 286–297
Comparison between the model coefficient values for the referenceand estimated thresholdswas based on the calculation of biases, definedas the ratios rα ¼ α̂=α and rβ ¼ β̂=β where rα and rβ are the estimationbias for themultiplicative coefficientα and the exponentβ, respectively.Fig. 9 summarizes the results. The bias for α (Fig. 9a) is in the range0.25–0.5, suggesting a significant underestimation of the estimatedrainfall thresholds due to uncertainty in the rainfall estimation. Overall,there is a slight decrease in the bias (i.e., a larger underestimation) forincreasing α, which is more apparent for the case of β = 0.4. For theother two exponents examined (0.5 and 0.6) the bias converges to~0.32 for values of α greater than 4. The bias for the exponent β(Fig. 9b) is smaller than the bias for the parameter α, and ranges be-tween 0.62 and 1.2. With the exception of β = 0.4, for which the biaschanges from underestimation (0.9) to overestimation (1.2), β isunderestimated for all the examined scenarios. The underestimationof the exponent increases with increasing β and decreasing α. We con-clude that for values of β N 0.5 and for thresholds located at the higherend of the rainfall spectrum (α N 4), the estimation of β of the ID thresh-old relationship is more accurate than for the thresholds located in thelower end of the possible rainfall regime. Overall, the bias in theexponent reflects differences in the spatial structure of short durationand long duration rainfall events; more specifically, it shows the well-known effect of increasing variability of rainfall with reducing the
Fig. 9. Ratio of estimated to theoretical a) multiplier and b) exponent for the varioustheoretical ID relationships examined.
duration of the event (Berne et al., 2004). Variation of the bias withthe severity of the threshold is likely to depend on the percentage ofshort duration rainfall events in the over-the-threshold rainfall events.
5.3. Performance evaluation of ID threshold for the prediction of debris flowoccurrences
As it has been described in Section 4.3, the performance of rainfallthresholds was evaluated by means of three statistics, i.e. POD, FARand CSI. Results on the performance evaluation for all reference IDscenarios are summarized in Fig. 10.
Considering the CSI values, the performance is decreasingnonlinearly with increasing α and decreasing β. This means that thehigher the rainfall quantile corresponding to debris flow triggeringevents, the lower the performance of the threshold. Overall, for lowerα (≤2) the performance is from good to excellent (0.7–0.95 CSI), butit drops to a poor performance (b0.5) for α ≥ 4. It is worth to notethat while POD values remain above 92% for all the examined cases,the high ratio of false detection is responsible for lowering the overallperformance of the system. Note that the dependence of FAR and CSIwith ID is similar (but inverse). This means that the main problemwith the exploitation of an estimated ID threshold is false detection,especially for high rainfall thresholds. In terms of rainfall distributionbetween DFRs and MRs, it means that the high precipitation events(i.e., corresponding to higher quantile) over DFRs correspond to less ex-treme (i.e., lower quantile) precipitation over MRs. Physically, this canbe attributed to high precipitation events concentrated over DFRs butwith lower rainfall values where the MRs are located, a pattern ofprecipitation gradients typically associated with convective rainfall.
5.4. Sensitivity of ID estimation and prediction accuracy on the frequentistexceedance level
Results fromprevious sections have shown that estimated ID thresh-olds at 1% exceedance level are underestimated relative to the referencethresholds. This suggests that the choice of a higher exceedance level(i.e. increase in estimated ID) in the frequentist procedure would reduceunderestimation. It is therefore important to understand how improve-ment in ID estimation relates to the exceedance level used and further-more, what is the effect of this on the performance of the estimated IDthreshold. In this sectionwe examine the influence exerted by the selec-tion of a certain exceedance level on the ID selection and predictionaccuracy.
To investigate these aspects, we applied seven different exceedancelevels in the frequentistmethod (namely 1%, 5%, 10%, 20%, 30%, 40% and50%) to estimate the ID threshold model following the procedure de-scribed in Section 4.3. The experiment was carried out for a referenceID threshold, characterized by α = 4 and β = 0.5 that correspond tothe central values of the set of reference ID thresholds examined inthis work. Estimation of the ID model based on different exceedancelevels essentially results in a set of different IDs that have the sameexponent but different multipliers, one for each exceedance level.Therefore, each exceedance level in the frequentistmethod correspondsto a specific error in the estimation of α. Fig. 11a reports the relationshipbetween the used exceedance level and the relative error in the identi-fication of the IDmodel, showing that the relative error in α (defined asrα − 1) ranges from −64% for an exceedance level of 1% to 10% for anexceedance level of 50% (note that minus in the relative error denotesunderestimation with respect to reference ID). One should note herethat there is no theoretical need for a model identified by using an ex-ceedance level of 50% to be unbiased (rα = 1). In fact, results suggestthat the best (i.e. minimum bias in α parameter) choice of exceedancelevel is 40% for the case examined. However, this depends on the refer-ence ID used thus no generalization could be made on the optimumchoice of exceedance level to be used.

Fig. 10. Probability of detection (POD) (a), false alarm ratio (FAR) (b), and critical successindex (CSI) (c), as a function of the various reference ID relationships examined. Fig. 11.Relationship of exceedance level on the ID selection andprediction accuracy. a) Ex-
ceedance level used in frequentist for ID estimation, b) frequency of debris flow triggeringrainfall events above estimated ID threshold and c) POD, FAR and CSI, as a function of rel-ative error in the estimated parameter α.
294 E.I. Nikolopoulos et al. / Geomorphology 221 (2014) 286–297
Fig. 11b shows the frequency of “debris flow” events (relative tooverall events exceeding the estimated ID) as a function of the relativeerror in the estimation of αwith the frequentistmethod. Fig. 11c reportsthe corresponding statistics POD, FAR and CSI relative to the error in α.
Inspection of Fig. 11b shows that the frequency of debris flow triggeringrainfall increaseswith increasing the exceedance level andmoving fromID underestimation to overestimation, as expected. This means

295E.I. Nikolopoulos et al. / Geomorphology 221 (2014) 286–297
essentially that the higher the estimated threshold, the more likely thata point above the threshold will be a debris flow event. This has a directimpact on FAR, suggesting that the higher the threshold the lower thefalse alarm ratio as shown in Fig. 11c. However, the higher thresholdalso means that more debris flow events will be located lower thanthe threshold and this affects POD. The interplay of POD and FAR fordifferent levels of error results in an overall performance, as shown byCSI, varying only by 15% over the range of errors examined. It is worthnoting from these results that the optimal value of CSI is not achievedfor the unbiased case but for relative error close to 20% underestimationof ID, which corresponds to an exceedance level of approximately 25%(Fig. 11a). One should note also that a 60% underestimation in the esti-mation of α has an equal CSI value with the case of 10% overestimation.In summary, examination of the influence of exceedance level selectionrevealed that a) the use of different exceedance levels results in a rela-tively small variation of model threshold performance, as measured byCSI; b) the relationship between threshold model performances andbias in ID estimation is not monotonic (i.e. similar performances canbe achieved with significantly different biases in ID estimation); andc) an unbiased ID estimate does not imply optimal performance.
5.5. Sensitivity of ID estimation to debris flow–gauge distance and rainfallevent duration
The results presented in the previous sections have shown that rain-fall variability between the debris flow location and the measurementlocation can introduce significant bias in the estimation of ID thresholds.The results from Fig. 6 areworth recallingwhich showed that in order toobtain an ID from MR observations equivalent to the one derived fromthe actual observations in the record (I = 1.12D−0.49, Section 3.2), theID applied over DFRs should be I=4.15D−0.68. Considering that rainfallvariability increases with distance, and that it depends on rainfall char-acteristics (e.g., short-duration convective events are associated withhigher spatial variability than long-durationwidespread rainfall events)we hypothesize that the uncertainty in the ID estimation can be reducedby filtering out the ‘highly uncertain’ cases from the DFR–MR sample.Filtering was carried out based on two different values, including: (i) avalue for the maximum distance between a DFR and MR, and (ii) avalue for the minimum duration of the rainfall event with debrisflows. The threshold on the DFR–MR distance was used to examinethe hypothesis that using only information from gauges at a closedistance (≤5 km) can reduce the estimation bias. The threshold onthe debris flow event duration was used to examine the hypothesisthat by excluding the short duration (≤12 h) rainfall events (generallyassociated with larger spatial variability) the bias in the ID estimation isreduced. We repeated the analysis presented in Sections 5.2 and 5.3 forthree different scenarios summarized in Table 2. Fig. 12 shows the re-sults for the estimation bias of α and β. The performances in the predic-tion of debris flow occurrences are also reported in terms of the CSIstatistics. Comparison of the results shown in Fig. 12 with the resultsfor the unconditional (i.e., no distance and rainfall duration thresholdapplied) case shown in Fig. 9 and the reference case in Fig. 10 is usedto understand the importance of the factors examined in the ID estima-tion bias and performance. The application of the duration threshold(Scenario 1) leads to improvement in the estimation of α only forcases with high values of α (N4). This suggests that the application ofsuch threshold works favorably for high ID relationships. The finding
Table 2Different scenarios examined for thresholds at i) DFR–MR distance and ii) rainfall duration for
Threshold on max distance between DFRs an
Scenario 1 NoneScenario 2 5 kmScenario 3 5 km
is reinforced by the fact that underestimation of exponent β, for thesame scenario, is larger (relative to reference case) for α b 4. The appli-cation of the distance threshold (Scenario 2) shows no significantchangeswith respect to the reference case. This suggests that the degreeof uncertainty in rainfall estimation for raingauges up to 5 kmdistance isequivalent with that for raingauges up to 12 km distance (the max dis-tance involved in our sample). Results for Scenario 3, which involvedapplication of both thresholds, follow generally the pattern of Scenario1 with the exception of bias in parameter α for the case of α = 4 andβ = 0.4 which exhibited a significant improvement when comparedto Scenario 1.
6. Conclusions
The goal of this work was to investigate the impact of the uncertain-ty associated with the estimation of the rainfall responsible for shallowlandslides anddebrisflows in the definition and the exploitation of rain-fall thresholds to forecast the possible occurrence of debris flows. Theresults of our analysis allow some general and specific conclusions.
First, the rainfall depth and duration that resulted in debris flows canbe significantly different from those estimated based on measurementsat nearby raingauges. Comparison between DFRs and MRs shows thatthe error in rainfall estimation is always considerable and it is decreas-ing with increasing the rainfall event duration. Estimation of shortrainfall and high intensity events, which are often also spatially limited,is associated with higher uncertainty than for long duration and lowintensity events.
Second, uncertainty in the estimation of debris flow triggering rain-fall results in a bias of the estimated ID thresholds. This bias is the effectresulting from the identification of the ID threshold as a lower boundaryof the estimated debris-flow triggering rainfalls. Both parameters α andβ are underestimated. Specifically, α is underestimated by ~60–70%consistently over the range of rainfall conditions examined. The under-estimation in the scaling exponent β increases for lower thresholds butis generally lower than the underestimation in α. These findings haveconsequences in the operational use of the ID thresholds.
Third, the performance of ID thresholds, measured by CSI, dependson the threshold, and decreases for higher (more severe) thresholds.POD is found only slightly affected by the level (severity) of the thresh-old, whereas FAR increases significantly with increasing the thresholds.
Fourth, we show that the choice of an exceedance level applied inthe frequentistmethod affects the error in ID estimation and the perfor-mance in debris flowprediction. However, optimumperformance is notachieved for the minimum error in ID and similar performances can beachieved for different levels of error in ID estimation.
Fifth, estimation of ID thresholds based only on long duration(N12 h) events can improve bias and performance of the estimated IDbut only for high (α N 4) rainfall thresholds (the effect is opposite forlow rainfall thresholds). The application of a threshold on themaximumdistance (5 km) between a debris flow location and nearest gauge hasno significant effect on the ID estimation for the range of distancesexamined (up to 12 km).
In this work, we considered the natural variability of rainfall as thesole source of rainfall uncertainty. We acknowledge that measurementerrors are an additional source of uncertainty not considered in thiswork. In addition, we have not considered the uncertainty introducedby the method adopted to determine the threshold model from the
selecting rainfall events for ID threshold estimation.
d MRs Threshold on min duration of rainfall events
12 hNone12 h

Fig. 12. Bias in coefficient α (top), bias in exponent β (middle) and CSI (bottom) for different threshold scenarios reported in Table 2.
296 E.I. Nikolopoulos et al. / Geomorphology 221 (2014) 286–297
empirical rainfall data (in our case, the frequentist method of Brunettiet al., 2010). Peruccacci et al. (2012), working in Central Italy, haveshown that the uncertainty associated with the coefficient α and expo-nentβ that controls the thresholdmodel canbe significant, and dependson the number and distribution of the empirical ID data points.
The conclusions of this work are applicable to different types ofthresholds, including cumulative event rainfall versus rainfall durationthresholds (Guzzetti et al., 2007). Research is underway to analyze theeffect of rainfall estimation uncertainty when the debris flow occur-rence is controlled by both rainfall properties and antecedent soil mois-ture conditions. Moreover, there is scope for analyzing the impact ofrainfall estimation on identification and use of ID thresholds for differ-ent rainfall regimes and for different methodologies of rainfall estima-tion, including use of remotely sensed rainfall observations.
Acknowledgments
We thank the Department “Ripartizione Opere Idrauliche”, Autono-mous Province of Bolzano, for the continuous updating of the debrisflow archive and for funding through the project GESTO (granted bythe Autonomous Province of Bozen-Bolzano). Nikolopoulos acknowl-edges support from EU FP7 Marie Curie Actions IEF (HYLAND projectPIEF-GA-2011-302720).
References
Aleotti, P., 2004. A warning system for rainfall-induced shallow failures. Eng. Geol. 73,247–265.
Aleotti, P., Chowdhury, R., 1999. Landslide hazard assessment: summary review and newperspectives. Bull. Eng. Geol. Environ. 58, 21–44.
297E.I. Nikolopoulos et al. / Geomorphology 221 (2014) 286–297
Barnes, L.R., Gruntfest, E.C., Hayden, M.H., Schultz, D.M., Benight, C., 2007. False alarmsand close calls: a conceptual model of warning accuracy. Weather Forecast. 22,1140–1147.
Baum, R.L., Godt, J.W., Savage, W.Z., 2010. Estimating the timing and location of shallowrainfall-induced landslides using a model for transient, unsaturated infiltration. J.Geophys. Res. 115. http://dx.doi.org/10.1029/2009JF001321 (F03013).
Berne, A., Delrieu, G., Creutin, J.-D., Obled, C., 2004. Temporal and spatial resolution ofrainfall measurements required for urban hydrology. J. Hydrol. 299, 166–179.
Berti, M., Martina, M., Franceschini, S., Pignone, S., Simoni, A., Pizziolo, M., 2012. Probabi-listic rainfall thresholds for landslide occurrence using a Bayesian approach. J.Geophys. Res. 117. http://dx.doi.org/10.1029/2012JF002367 (F04006).
Borga, M., Dalla Fontana, G., Gregoretti, C., Marchi, L., 2002. Assessment of shallowlandsliding by using a physically based model of hillslope stability. Hydrol. Process.16, 2833–2851.
Borga, M., Stoffel, M., Marchi, L., Marra, F., Jakob, M., 2014. Hydrogeomorphic responseto extreme rainfall in headwater systems: flash floods and debris flows. J. Hydrol.http://dx.doi.org/10.1016/j.jhydrol.2014.05.022 (in press).
Brardinoni, F., Church, M., Simoni, A., Macconi, P., 2012. Lithologic and glacially condi-tioned controls on regional debris flow sediment dynamics. Geology 40, 455–458.
Brunetti, M.T., Peruccacci, S., Rossi, M., Luciani, S., Valigi, D., Guzzetti, F., 2010. Rainfallthresholds for the possible occurrence of landslides in Italy. Nat. Hazards Earth Syst.Sci. 10, 447–458.
Caine, N., 1980. The rainfall intensity: duration control of shallow landslides and debrisflows. Geogr. Ann. Ser. A Phys. Geogr. 62, 23–27.
Cannon, S., Gartner, J., 2005. Wildfire-related debris flow from a hazards perspective. In:Jakob, M., Hungr, O. (Eds.), Debris Flow Hazards and Related Phenomena. Springer,Berlin Heidelberg, pp. 363–385.
Chen, J.C., Huang, W.S., Jan, C.D., Tsai, Y.F., 2011. Rainfall conditions for the initiation of de-bris flows during Typhoon Morakot in the Chen-Yu-Lan watershed in central Taiwan.In: Genevois, R., Hamilton, D.L., Prestininzi, A. (Eds.), 5th International Conference onDebris flow Hazards Mitigation: Mechanics, Prediction and Assessment. Casa EditriceUniversità La Sapienza, Roma, pp. 31–36.
Crosta, G., 1998. Regionalization of rainfall thresholds: an aid to landslide hazardevaluation. Environ. Geol. 35, 131–145.
Deganutti, A.M., Marchi, L., Arattano, M., 2000. Rainfall and debris flow occurrence in theMoscardo basin (Italian Alps). In: Wieczorek, G.F., Naeser, N.D. (Eds.), Debris FlowHazards Mitigation — Mechanics, Prediction, and Assessment. Balkema, Rotterdam,pp. 67–72.
Dowling, C., Santi, P., 2013. Debris flows and their toll on human life: a global analysis ofdebris flow fatalities from 1950 to 2011. Nat. Hazards 1–25.
Frattini, P., Crosta, G., Sosio, R., 2009. Approaches for defining thresholds and returnperiods for rainfall-triggered shallow landslides. Hydrol. Process. 23, 1444–1460.
Frei, C., Schär, C., 1998. A precipitation climatology of the Alps from high-resolution rain-gauge observations. Int. J. Climatol. 18, 873–900.
Govi, M., Turitto, O., 1994. Ricerche bibliografiche per un catalogo sulle inondazioni, pienetorrentizie e frane in Valtellina e Valchiavenna. Associazione Mineraria Subalpina,Quaderni di Studi e Documentazione, Quaderno 16 (in Italian).
Guzzetti, F., Tonelli, G., 2004. Information system on hydrological and geomorphologicalcatastrophes in Italy (SICI): a tool for managing landslide and flood hazards. Nat. Haz-ards Earth Syst. Sci. 4, 213–232.
Guzzetti, F., Cardinali, M., Reichenbach, P., 1994. The AVI project: a bibliographical andarchive inventory of landslides and floods in Italy. Environ. Manag. 18, 623–633.
Guzzetti, F., Reichenbach, P., Cardinali, M., Galli, M., Ardizzone, F., 2005. Probabilistic land-slide hazard assessment at the basin scale. Geomorphology 72, 272–299.
Guzzetti, F., Peruccacci, S., Rossi, M., Stark, C.P., 2007. Rainfall thresholds for the initiationof landslides in central and southern Europe. Meteorog. Atmos. Phys. 98, 239–267.
Guzzetti, F., Ardizzone, F., Cardinali, M., Galli, M., Reichenbach, P., Rossi, M., 2008. Distri-bution of landslides in the Upper Tiber River basin, central Italy. Geomorphology96, 105–122.
Innes, J.L., 1983. Debris flows. Prog. Phys. Geogr. 7, 469–501.Iverson, R., 2005. Debris flow mechanics. In: Jakob, M., Hungr, O. (Eds.), Debris flow
Hazards and Related Phenomena. Springer, Berlin Heidelberg, pp. 105–134.Jaiswal, P., Van Westen, C.J., 2009. Rainfall-based temporal probability for landslide
initiation along transportation routes in Southern India. Landslide Processes: FromGeomorphologic Mapping to Dynamic Modeling. France, pp. 139–143.
Jakob, M., Weatherly, H., 2003. A hydroclimatic threshold for landslide initiation on theNorth Shore Mountains of Vancouver, British Columbia. Geomorphology 54,137–156.
Jakob, M., Owen, T., Simpson, T., 2012. A regional real-time debris flow warning systemfor the District of North Vancouver, Canada. Landslides 9, 165–178.
Jibson, R., 1989. Debris flows in southern Puerto Rico. Geol. Soc. Am. Spec. Pap. 236,29–56.
Kirschbaum, D., Adler, R., Hong, Y., Kumar, S., Peters-Lidard, C., Lerner-Lam, A., 2012.Advances in landslide nowcasting: evaluation of a global and regional modelingapproach. Environ. Earth Sci. 66, 1683–1696.
Marra, F., Nikolopoulos, E.I., Creutin, J.D., Borga, M., 2014. Radar rainfall estimation for theidentification of debris-flow occurrence thresholds. J. Hydrol. (conditionallyaccepted).
Massey, F.J., 1951. The Kolmogorov–Smirnov test for goodness of fit. J. Am. Stat. Assoc. 46,68–78.
Mei, Y., Anagnostou, E.N., Nikolopoulos, E.I., Borga, M., 2014. Error analysis of satelliterainfall products in mountainous basins. J. Hydrometeorol. http://dx.doi.org/10.1175/JHM-D-13-0194.1 (in press).
Morrissey,M.L., Maliekal, J.A., Greene, J.S., Wang, J., 1995. The uncertainty of simple spatialaverages using rain gauge networks. Water Resour. Res. 31, 2011–2017.
Norbiato, D., Borga, M., Merz, R., Blöschl, G., Carton, A., 2009a. Controls on event runoffcoefficients in the eastern Italian Alps. J. Hydrol. 375, 312–325.
Norbiato, D., Borga, M., Dinale, R., 2009b. Flash flood warning in ungauged basins by useof the flash flood guidance and model-based runoff thresholds. Meteorol. Appl. 16,65–75.
Panziera, L., Germann, U., Gabella, M., Mandapaka, P.V., 2011. NORA—Nowcasting ofOrographic Rainfall by means of Analogues. Q. J. R. Meteorol. Soc. 137, 2106–2123.
Pavlova, I., Jomelli, V., Grancher, D., Brunstein, D., Vrac, M., 2011. Debris flow occurrenceand meteorological factors in the French Alps: a regional investigation. In:Genevois, R., Hamilton, D.L., Prestininzi, A. (Eds.), 5th International Conference onDebris Flow HazardsMitigation: Mechanics, Prediction and Assessment. Casa EditriceUniversità La Sapienza, Roma, pp. 127–134.
Penna, D., Tromp-Van Meerveld, H.J., Gobbi, A., Borga, M., Dalla Fontana, G., 2011. Theinfluence of soil moisture on threshold runoff generation processes in an alpine head-water catchment. Hydrol. Earth Syst. Sci. 15, 689–702.
Peruccacci, S., Brunetti, M.T., Luciani, S., Vennari, C., Guzzetti, F., 2012. Lithological and sea-sonal control on rainfall thresholds for the possible initiation of landslides in centralItaly. Geomorphology 139–140, 79–90.
Petley, D., 2012. Global patterns of loss of life from landslides. Geology 40, 927–930.Reichenbach, P., Cardinali, M., De Vita, P., Guzzetti, F., 1998. Regional hydrological
thresholds for landslides and floods in the Tiber River Basin (central Italy). Environ.Geol. 35, 146–159.
Rossi, M., Kirschbaum, D., Luciani, S., Mondini, A.C., Guzzetti, F., 2012. TRMM satellite rain-fall estimates for landslide early warning in Italy: preliminary results. Proceedings ofSPIE — The International Society for Optical Engineering, 8523, art. no. 85230D.
Salvati, P., Bianchi, C., Rossi, M., Guzzetti, F., 2010. Societal landslide and flood risk in Italy.Nat. Hazards Earth Syst. Sci. 10, 465–483.
Schneuwly-Bollschweiler, M., Stoffel, M., 2012. Hydrometeorological triggers ofperiglacial debris flows in the Zermatt valley (Switzerland) since 1864. J. Geophys.Res. 117. http://dx.doi.org/10.1029/2011JF002262 (F02033).
Smith, R.B., Jiang, Q., Fearon, M.G., Tabary, P., Dorninger, M., Doyle, J.D., Benoit, R., 2003.Orographic precipitation and air mass transformation: an Alpine example. Q. J. R.Meteorol. Soc. 129, 433–454.
Staley, D., Kean, J., Cannon, S., Schmidt, K., Laber, J., 2013. Objective definition of rainfallintensity–duration thresholds for the initiation of post-fire debris flows in southernCalifornia. Landslides 10, 547–562.
Stoffel, M., Bollschweiler, M., Beniston, M., 2011. Rainfall characteristics for periglacialdebris flows in the Swiss Alps: past incidences—potential future evolutions. Clim.Chang. 105, 263–280.
Tabios, G.Q., Salas, J.D., 1985. A comparative analysis of techniques for spatial interpola-tion of precipitation. JAWRA J. Am. Water Resour. Assoc. 21, 365–380.
Verworn, A., Haberlandt, U., 2011. Spatial interpolation of hourly rainfall — effect ofadditional information, variogram inference and storm properties. Hydrol. EarthSyst. Sci. 15, 569–584.
Wieczorek, G.F., 1996. Landslide Triggering Mechanisms. Landslides: Investigation andmitigation, pp. 76–90.
Wieczorek, G.F., Glade, T., 2005. Climatic factors influencing occurrence of debrisflows. In:Jakob, M., Hungr, O. (Eds.), Debris Flow Hazards and Related Phenomena. Springer,Berlin, pp. 325–362.
Wilson, R.C., Wieczorek, G.F., 1995. Rainfall thresholds for the initiation of debris flows atLa Honda, California. Environ. Eng. Geosci. 1, 11–27.