Impact of PWM Voltage Waveforms in High-Speed Drives - MDPI
30
Citation: D’Amato, D.; Loncarski, J.; Monopoli, V.G.; Cupertino F.; Di Noia, L.P.; Del Pizzo, A. Impact of PWM Voltage Waveforms in High-Speed Drives: A Survey on High-Frequency Motor Models and Partial Discharge Phenomenon. Energies 2022, 15, 1406. https:// doi.org/10.3390/en15041406 Academic Editor: Armando Pires Received: 14 January 2022 Accepted: 11 February 2022 Published: 15 February 2022 Publisher’s Note: MDPI stays neutral with regard to jurisdictional claims in published maps and institutional affil- iations. Copyright: © 2022 by the authors. Licensee MDPI, Basel, Switzerland. This article is an open access article distributed under the terms and conditions of the Creative Commons Attribution (CC BY) license (https:// creativecommons.org/licenses/by/ 4.0/). energies Review Impact of PWM Voltage Waveforms in High-Speed Drives: A Survey on High-Frequency Motor Models and Partial Discharge Phenomenon Davide D’Amato 1, * ,† , Jelena Loncarski 2,† , Vito Giuseppe Monopoli 1,† , Francesco Cupertino 1,† , Luigi Pio Di Noia 3,† and Andrea Del Pizzo 3,† 1 Department of Electrical and Information Engineering, Politecnico di Bari, Via E. Orabona, 4, 70125 Bari, Italy; [email protected] (V.G.M.); [email protected] (F.C.) 2 Department of Electrical, Electronic, and Information Engineering “Guglielmo Marconi”, University of Bologna, Via dell’Università 50, 47522 Cesena, Italy; [email protected] 3 Department of Electrical Engineering and Information Technology, University of Naples Federico II, Via Claudio, 21, 80125 Napoli, Italy; [email protected] (L.P.D.N.); [email protected] (A.D.P.) * Correspondence: [email protected] † These authors contributed equally to this work. Abstract: The insulation system’s dielectric of the electric motor is very often subjected to severe electrical stress generated by the high dv/dt seen at the machine’s terminals. The electrical stress and high reflected wave transient overvoltage are even more evident in case of high-speed machines fed by high-frequency (HF) converters featuring very fast wide-bandgap devices. They are promoting the occurrence of partial discharges and consequently accelerate ageing. As this is serious issue and the main cause of the drive failure, it is important to analyse and characterise the surges at the motor terminals. Several HF models of motors have been proposed in the literature for this purpose. This article presents a survey on HF motor models, which is crucial in understanding and studying the most critical parameter identification and overvoltage mitigation techniques. Moreover, it offers a comparison of the models’ main features as well as a comparison with the experimental voltage waveform at motor terminals. A general overview of the partial discharge (PD) phenomenon is also provided, as it is favoured by HF operation and together with HF motor modelling provides key insights to the insulation ageing issue. In particular, an analysis of the effects of PWM waveform affecting insulation is given, as well as useful methods for developing strategies for the inspection and maintenance of winding insulation. Keywords: HF motor models; partial discharges; accelerated insulation ageing 1. Introduction In the automotive and aerospace industry, to address in a better way the reliability and efficiency requirements for new high-speed electrical drives, it is necessary to imple- ment new power electronic converters using new wide-bandgap semiconductor devices (WBGs) [1–3]. The introduction of new wide-bandgap power electronic devices, such as Gallium Nitride (GaN) and Silicon Carbide (SiC), enhanced the development of the new converters with a higher efficiency and switching frequency and a smaller size. Compared to conventional Silicon-based IGBT converters, with long turn-on and turn-off times and switching frequencies of around 10–30 kHz, the new wide-bandgap semiconductors have the ability to operate at high temperatures with switching frequencies of around 100 kHz and therefore short on/off times, reducing switching losses and increasing the efficiency of the entire power converter [4,5]. These advantages lie in the band gap, which is three times larger than that of Silicon devices. A larger band gap enables lower temperature dependence of the main device pa- rameters, a much higher breakdown voltage, and a much lower R on resistance determining Energies 2022, 15, 1406. https://doi.org/10.3390/en15041406 https://www.mdpi.com/journal/energies
-
Upload
khangminh22 -
Category
Documents
-
view
5 -
download
0
Transcript of Impact of PWM Voltage Waveforms in High-Speed Drives - MDPI

Citation: D’Amato, D.; Loncarski, J.;
Monopoli, V.G.; Cupertino F.; Di
Noia, L.P.; Del Pizzo, A. Impact of
PWM Voltage Waveforms in
High-Speed Drives: A Survey on
High-Frequency Motor Models and
Partial Discharge Phenomenon.
Energies 2022, 15, 1406. https://
doi.org/10.3390/en15041406
Academic Editor: Armando Pires
Received: 14 January 2022
Accepted: 11 February 2022
Published: 15 February 2022
Publisher’s Note: MDPI stays neutral
with regard to jurisdictional claims in
published maps and institutional affil-
iations.
Copyright: © 2022 by the authors.
Licensee MDPI, Basel, Switzerland.
This article is an open access article
distributed under the terms and
conditions of the Creative Commons
Attribution (CC BY) license (https://
creativecommons.org/licenses/by/
4.0/).
energies
Review
Impact of PWM Voltage Waveforms in High-Speed Drives:A Survey on High-Frequency Motor Models and PartialDischarge PhenomenonDavide D’Amato 1,*,†, Jelena Loncarski 2,† , Vito Giuseppe Monopoli 1,† , Francesco Cupertino 1,†,Luigi Pio Di Noia 3,† and Andrea Del Pizzo 3,†
1 Department of Electrical and Information Engineering, Politecnico di Bari, Via E. Orabona, 4, 70125 Bari, Italy;[email protected] (V.G.M.); [email protected] (F.C.)
2 Department of Electrical, Electronic, and Information Engineering “Guglielmo Marconi”,University of Bologna, Via dell’Università 50, 47522 Cesena, Italy; [email protected]
3 Department of Electrical Engineering and Information Technology, University of Naples Federico II,Via Claudio, 21, 80125 Napoli, Italy; [email protected] (L.P.D.N.); [email protected] (A.D.P.)
* Correspondence: [email protected]† These authors contributed equally to this work.
Abstract: The insulation system’s dielectric of the electric motor is very often subjected to severeelectrical stress generated by the high dv/dt seen at the machine’s terminals. The electrical stress andhigh reflected wave transient overvoltage are even more evident in case of high-speed machines fedby high-frequency (HF) converters featuring very fast wide-bandgap devices. They are promotingthe occurrence of partial discharges and consequently accelerate ageing. As this is serious issue andthe main cause of the drive failure, it is important to analyse and characterise the surges at the motorterminals. Several HF models of motors have been proposed in the literature for this purpose. Thisarticle presents a survey on HF motor models, which is crucial in understanding and studying themost critical parameter identification and overvoltage mitigation techniques. Moreover, it offersa comparison of the models’ main features as well as a comparison with the experimental voltagewaveform at motor terminals. A general overview of the partial discharge (PD) phenomenon is alsoprovided, as it is favoured by HF operation and together with HF motor modelling provides keyinsights to the insulation ageing issue. In particular, an analysis of the effects of PWM waveformaffecting insulation is given, as well as useful methods for developing strategies for the inspectionand maintenance of winding insulation.
Keywords: HF motor models; partial discharges; accelerated insulation ageing
1. Introduction
In the automotive and aerospace industry, to address in a better way the reliabilityand efficiency requirements for new high-speed electrical drives, it is necessary to imple-ment new power electronic converters using new wide-bandgap semiconductor devices(WBGs) [1–3]. The introduction of new wide-bandgap power electronic devices, such asGallium Nitride (GaN) and Silicon Carbide (SiC), enhanced the development of the newconverters with a higher efficiency and switching frequency and a smaller size. Comparedto conventional Silicon-based IGBT converters, with long turn-on and turn-off times andswitching frequencies of around 10–30 kHz, the new wide-bandgap semiconductors havethe ability to operate at high temperatures with switching frequencies of around 100 kHzand therefore short on/off times, reducing switching losses and increasing the efficiency ofthe entire power converter [4,5].
These advantages lie in the band gap, which is three times larger than that of Silicondevices. A larger band gap enables lower temperature dependence of the main device pa-rameters, a much higher breakdown voltage, and a much lower Ron resistance determining
Energies 2022, 15, 1406. https://doi.org/10.3390/en15041406 https://www.mdpi.com/journal/energies

Energies 2022, 15, 1406 2 of 30
device conduction losses lower than Si devices [6,7]. Operating at high switching frequen-cies, converters using semiconductors with WBG can be made smaller and lighter, whileincreasing efficiency by reducing harmonic content and acoustic noise, thus improving theperformance of the entire electrical drive. However, these new WBG devices feature verysteep voltage waveform pulses produced by the pulse width modulation (PWM) inverter.When this voltage is used to power an electrical machine, it causes surges at the terminalsof the machine winding, creating an electrical stress on the insulation, which favours partialdischarges (PD) at a higher extent when compared to the Si-based converter powering themachine. Consequently, it is also leading to the premature breakdown of the insulation ofthe machine stator winding [8,9].
Nowadays, there are many occurrences of the premature failures of electric motorsand generators powered by PWM converters. The causes of these breakdowns are still asource of research for many scholars. However, many reports have shown that a PWMsignal can trigger a higher number of partial discharge phenomena in a stator winding,resulting in premature insulation failure. When a breakdown or failure of an electricmotor occurs, it is almost inevitable that the machine will be taken out of service fromthe process in which it is applied, and the resetting of the machine may take place aftera long period of time, thus creating downtimes in a process that causes large economiclosses. The review [10] characterised these losses due to downtime for various industrialsectors with a bar graph showing that the greatest losses are in the automotive sector,where there are many high-speed drives. For these reasons, a great effort is being madeto identify the causes of premature failure of machine insulation, and through predictivemaintenance techniques in which the machine is constantly monitored, an incipient failurecan be immediately detected, and the necessary actions can be scheduled to avoid moreserious process downtime.
In 1951, one of the first studies published by S.B. Warder [11] showed that the voltagesproduced by rectifiers had a harmful effect on the dielectric material of the power cableused in a railway network. These voltages produced a harmonic distribution that generatedovervoltages that triggered internal discharges in the cable insulation. Later, in 1992, itwas shown by Persson [12] that the PWM inverter is the cause of premature insulationbreakdown of the stator winding when the electrical machine is powered through theconverter in an electrical drive.
The overvoltages generated at the machine terminals are mainly caused by the re-flected voltage waves travelling over the connecting cable between the converter and theelectrical machine. Due to the parasitic capacitance of the motor winding insulation, thedistribution of the electric field is not uniform and therefore generates distortions in thevoltage waveform that can lead to a partial discharge dangerous for the insulation. Forthis reason, regulatory organizations such as the National Electrical Manufacturers Asso-ciation (NEMA) and the International Electrotechnical Commission (IEC) have becomeaware of the issues related to the partial discharges and have introduced restrictions andrequirements for motors. A great deal of works have been undertaken to analyse the causesof premature failure of stator winding insulation, and studies have been carried out toestimate conditions so that predictive maintenance can be devised [13–15]. Monitoringsystems analyse the set of the first symptoms that occur before a failure so that maintenancecan be carried out in time. By observing the first symptoms leading up to a failure, it is alsopossible to determine the lifetime of the machine and estimate the risk of failure.
Currently, tests and monitoring techniques for machines are useful tools for the userto organise the entire schedule of machine maintenance and manage downtime optimally,avoiding unexpected failures. Besides, through these studies, it is possible to determinethe main cause that leads to machine malfunction or failure earlier than expected, andthus being able to make changes to the system to prevent it from happening again inthe future. There are different types of tests that can detect faults in different parts ofthe electric motor. Basically, the tests that are performed fall into two categories: on-lineand off-line. Tests conducted when the machine is disconnected from the system are the

Energies 2022, 15, 1406 3 of 30
off-line tests. They can be carried out when the machine is partially disassembled or simplyperformed directly on the terminals of the motor stator winding. Instead, on-line tests arewidely used because they are performed during the nominal operation of the machine, soanalysing variables such as temperature, mechanical vibrations, and electrical quantitiesoccurring during service. Not all types of faults can be analysed with on-line or off-linetechniques, so good predictive maintenance requires several tests to be carried out bothon-line and off-line to assess the entire state of the machine and to obtain useful informationto avoid unexpected faults. To implement effective predictive maintenance techniques, itis essential to take into account the non-uniform voltage distribution at the terminals ofthe winding but also the oscillatory phenomena created when working at high frequencies.For this reason, high-frequency (HF) models of induction motors have been developed inrecent years. These HF models can be seen as a key tool to better understand the differentfeatures of the PWM voltage waveform and their affect on the insulation, together with theovervoltage problems in PWM drives. Furthermore, they can be used for the developmentand benchmarking of the mitigation techniques, which can change the slope of the steeppulses coming from the inverter and suppress the overvoltages, such as for example dv/dtfilter or active gate driving techniques.
This article presents the review of the literature on HF motor models, with the com-parison of the main features and voltages generated at the motor terminals for differentmodels and the experimental voltage waveforms. Moreover, the overview of the PDs isalso provided, from the power electronics point of view, and particularly by analysingthe different characteristics of the PWM voltage waveforms affecting the insulation. Inparticular, it is divided into two major categories: the macroscopic and microscopic effectsof the PDs generated by PWM signals. The microscopic effects are referring to simple sys-tems, such as small samples of dielectric material where it is easy to conduct the tests andanalyse characteristics. The macroscopic effects, on the other hand, consider more complexsystems such as an entirely random wound stator. In these more complex systems, it is ofinterest to study easily accessible quantities, such as the phase current or impedance in thehigh-frequency domain. The key connection between the HF motor modelling and the PDsis the insulation ageing: HF motor models are crucial in understanding and studying themost critical ageing parameters and overvoltage mitigation techniques, as it is favouringPD generation and insulation stress especially in the modern drives; on the other hand,the knowledge on the microscopic and macroscopic effects on the PDs can viably be usedin the development of monitoring and prediction techniques useful to avoid the drivemalfunctioning and accelerated ageing. These are summarised in Figure 1.
Insulation ageing analysis
Partial discharge
High Frequency motor model
Transmission line model
Multi-section model
Lumped-parameter model
Microscopiceffects
Macroscopic effects
Identification, monitoring, prediction, and mitigation techniques
Figure 1. Ageing insulation’s studies presented in this review.
2. Partial Dicharges
The insulation system of the stator winding consists of various parts that ensure thecorrect insulation between the active parts of the winding and that no electrical short-circuits can occur. Figure 2 shows the schematic diagram of the stator winding section ofan induction motor.

Energies 2022, 15, 1406 4 of 30
The insulation between the conductors is necessary to prevent the skin effect occurringbetween the wires and to reduce the Joule losses I2R. The turn insulation between thewindings is necessary to prevent short circuits between them in the coil. Groundwallinsulation, on the other hand, insulates the coil formed by the copper conductors from thestator. These elements are of fundamental importance to ensure the correct operation ofthe machine, but at the same time they constitute the most fragile element of the electricaldrive [15]. The dielectric composing the insulation system is very often characterisedby small defects such as micro-cavities in the material, small air pockets resulting fromimperfect adhesion between conductors, or defects in the construction of the componentscreated during manufacture.
Copper
Stator core
Groundwall insulation
Strand insulationTurn insulation
Figure 2. Insulation system of stator winding.
There are two types of insulation systems, as distinguished in IEC 60034 series: Type Iand Type II. In Type I systems, the low-voltage motors are using organic insulation, andthis kind of system should not experience any PD during their service lifetime. They arenormally random wounds. Here, the ageing mechanisms are considered to be thermo-mechanical rather than electrical. On the other hand, Type II systems have the inor-ganic/organic insulation, but in this case the PDs can be withstood for a long time, providedthat PD magnitudes are not too large. The IEC standard dealing with the Type I systems ispresented in 60034-18-41 [16], while Type II systems are presented in 60034-18-42 [17].
There are different kinds of stresses that can affect the rate of insulation deterioration.In general, they can be divided into four main groups: thermal, electrical, ambient, andmechanical stresses, the TEAM stresses. In the past, mainly the thermal and mechanicalstresses were studied, as they were the most recognized cause of insulation deteriorationand eventually failure. Nowadays, with the WBG development trend and high switchingfrequency operation, the newly introduced electrical stress needs to be considered at a highextent, as it pushes the electrical stress to a high level.
When the insulation system is subjected to an impulsive voltage such as the PWMwaveform provided by the inverter, the electrical winding is subjected to high electricalstress, which is leading to partial discharges, even as it is energized. These discharges areof different types and can occur in several parts of the electrical machine insulation. In [15],for example, partial discharges can occur in the groundwall and in particular in the airpockets. If the electric field created in the conductor exceeds the dielectric strength of the air,which temporarily becomes a conductor, it will produce the discharge. These discharges,once initiated, cause delamination, erosion, and breakage of the insulating enamel, causingthe conductors to come into contact with each other, creating a high short-circuit currentthat flows between the conductors and triggering the over-current protections that makethe machine go out of service [18,19].

Energies 2022, 15, 1406 5 of 30
In principle, partial discharges can be divided into four categories, as seen in theFigure 3.
SURFACE DISCHARGES
CORONA IN AIR TREEING
INTERNAL DISCHARGES
Figure 3. Different types of partial discharges.
Internal partial discharges are the most common and one of the main causes of prema-ture failure of the insulator. During the manufacturing process of the dielectric material,air micro cavities are incorporated in the product, and therefore once the insulator is sub-jected to an external electric field, a difference is created between the electric field of theair present in the micro cavity and that of the dielectric, generating a partial dischargeinside the material. Another discharge that occurs in the dielectric is called treeing due toits branching formation; its origin depends on the local electric field elevation and oncetriggered leads to the complete discharge [20]. Surface discharges are triggered between thesurfaces of two different dielectrics very commonly in rotor winding of electrical machines.
Corona discharges occur when the conductor has sharp irregularities and is exposedto air; at these points a high enough electric field is created to cause ionisation of the air,which once ionised conducts electricity and ignites a spark (electric arc), which corrodesthe insulation, known as the corona effect. In an electric motor, these discharges are mainlytriggered inside the insulation of the groundwall, where there are the possibilities of gapsor air spaces between the wall and the conductor [15,21].
Since the first half of the 1990s to the present, many studies have been conductedto analyse partial discharges, and interesting reports have described the physical char-acteristics of the phenomenon [11,12,22–29]. Certainly, one of the first to deal with thisphenomenon was Kreuger [26] in 1961, with a published study dealing with the identifica-tion of partial discharges and later Kreuger published a classification of partial dischargesin 1993 [27], following the work of Gulski in 1991 [30]. Through the classification process,discharges of unknown origin can be identified by matching the fingerprint of the exam-ined discharge with patterns of known discharges. The method provided by Kreuger [27]has been the foundation for the development of new techniques for the diagnostics andrecognition of partial discharges, most of which are based on neural networks, fuzzy logic,and more or less complex statistical approaches. The statistical approaches are based onthe analysis of a single PD, evaluating and rejecting the noise, in order to better appreciatethe characteristics of the discharge. After that, a series of statistical analyses is conducted,referring to the polarity of the pulse, its amplitude, the distribution of the pulses and alsothe parameters related to the phase angle of the PD trigger, and the phase interval betweenthe start and end of the discharge [31–33]. However, as is well-known, isolation diagnosis

Energies 2022, 15, 1406 6 of 30
is not easy to achieve, largely because the parameters such as amplitude and time of PDs’onset vary stochastically.
Partial discharges have stochastic behaviour because of the stochastic delay time dueto the availability of the initiating electron of the discharge and the memory effect generatedby previous discharges influencing subsequent ones. In particular, once triggered, PDschange the properties of the dielectric material and leave residual charges on the dielectricthat then influence the occurrence of future partial discharges, as explained in detail in thefollowing works [34–36].
The effects that generate PDs can be residual charges in the vicinity of defects [37], areduction in material resistivity [38], a change in surface conductivity [39], or a change inmaterial geometry or roughness. In order to clarify the causes that lead to the occurrenceof partial discharges in solid dielectrics, the concept of partial discharge area has beenintroduced, i.e., the zone comprising the microcavity and the insulation where the residualcharges generated by the previous PDs thicken.
The discharge area is the part of the dielectric where PDs are most likely to occur, andthe magnitude of the discharge varies stochastically due to the causality of the residualsurface charges [37]. The authors in [38] measured the reduction in resistivity of thedielectric material when subjected to a partial discharge and were able to map the changesin dielectric structure and thus the change in the discharge area. This information can beused both to develop new PD models and to prevent full discharge.
The presence of microcavities and defects in the dielectric cause an electric field that isnot uniform throughout the material, and in particular a densification of charge is creatednear the microcavity, which often leads to the generation of partial discharges [18]. Byanalysing the PDs generated in insulation material defects such as epoxy resin voids, itis possible to describe the development of partial discharges during the ageing phasesof the insulation. These studies are carried out by means of stochastic models [28,29,40].Studying the effects of partial discharges helps us to understand the dynamics of thephenomenon and its chemical and physical characteristics. The measurement of PD hasbeen useful in determining the relationship between the type of defect and the generationof the discharge [18,28].
Gutfleisch and Niemeyer [28,29] analysed the PD activity in air gaps of known geome-try in epoxy resin to provide rules for identifying the type of defect and for assessing theageing state of the dielectric. The dielectric was observed for a period of six months, andthe data obtained were examined using phase-resolved partial discharge (PRPD) modelsfor various ageing stages. In this work, a method that takes into account the effects of defectgeometry was proposed to study the discharge activity and associated memory effect withthe resulting distribution of charge produced in the cavity by the PD. The partial discharge,once triggered and extinct, causes temporal effects such as spatial charges and surfacecharges that are attenuated during time. Gutfleisch et al. [29] did not investigate all thestages from the initiation of the partial discharge to the breaking of the isolation, which hasbeen done successfully in [41]. The relationship between PDs and the failure behaviour ofa typical insulation has been proposed in [41].
It has been shown in many later studies that these charges contribute to the genera-tion of further partial discharges, as they examine the memory effects, considered to beresponsible for the stochastic behaviour of the PD [34,35]. The presence of the space chargecontributes to the premature aging of the dielectric and at the same time influences theonset of subsequent partial discharges [36]. A well-detailed review of the memory effectsintroduced by residual charges was provided by Cheng Pan et al. [34].
3. Overview of the PWM Voltage Waveform Affecting the Insulation
In recent years the partial discharge has become of great scientific interest, as ithas been shown that it causes premature breakdown of the stator winding insulation ofelectrical machines powered by power electronic converters. A power electronic converter,usually controlled with pulse width modulation, produces a steep voltage pulses, which

Energies 2022, 15, 1406 7 of 30
has the effect on the motor insulation. This is even more evident with the developmentof the new power semiconductors and especially with the increasing popularity of wide-bandgap devices, and SiC-MOSFET and GaN devices, even though they offer many benefitscompared to Si devices [7,42]. These devices can be used at high speeds due to the lowton and to f f values. It is these low ton and to f f values that cause high dv/dt and di/dt.In the case of long power cable from the inverter to the motor, a significant overshootdue to the reflected wave phenomenon can be observed. For some of the cable lengths,the voltage waveform is reflected continuously across the cable resulting in persistentoscillations at motor terminals. Namely, in Figure 4 is represented the example of dv/dt atmotor terminals, for the cable length of 5 m.
Figure 4. Transient voltage at motor terminals for 5 m lead length.
These overvoltages are favouring the partial discharge phenomenon and could de-grade the reliability and efficiency of motor drive systems. Apart from the effects of theovervoltages on the whole winding, the stress on the inter-turn insulation of the motorwinding should be considered, especially in the case of small rise times. Namely, suchsteep voltages can produce large variations on one coil turn, going beyond the inter-turninsulation design limit considered under sinusoidal operation [9].
It is demonstrated in various works that there is a direct relationship between theovervoltage occurring at the winding terminals of the electrical machine and the length ofthe cable connecting the inverter and the motor. Especially by increasing the length of thecable between the inverter and the motor, the voltage at the ends of the induction motorwinding increases [43–46]. This is due to the reflected waves travelling over the connectingcable, which creates an amplification of the voltage supplying the electrical machine. Infact, when a voltage waveform travels from the inverter to the motor along a transmissionline that does not terminate at its characteristic impedance, it is reflected when it encountersa first discontinuity on its way. Figure 5 shows a diagram of the inverter-motor systemwith their respective impedances.

Energies 2022, 15, 1406 8 of 30
Cables
Motor
Inverter PWM
𝑍!"#$%&$%
𝑍'()*$+
𝑍,-&-%
𝑙
Figure 5. Schematic of a variable frequency drive highlighting the inverter, cable, and motor impedances.
The reflection coefficient is defined as the ratio between the reflected wave and theincoming wave, ρ.
ρ =ure f
uinc=
Z− ZcableZ + Zcable
(1)
Using the diagram in Figure 5, it is possible to represent Formula (1) as follows,considering that the motor impedance is much greater than that introduced by the cableZmotor → ∞.
ρmotor =Zmotor − ZcableZmotor + Zcable
≈ 1 (2)
While the negative reluctance coefficient describes the reflected wave at the inverterterminals, in this case the impedance of the converter is much smaller than that of the cable,and therefore its contribution can be neglected Zinverter → 0.
ρinverter =Zinverter − ZcableZinverter + Zcable
≈ −1 (3)
For the same rated power, the number of turns forming the winding decreases withthe size of the motor; a small motor will have more turns than a larger one. The motor’simpedance, proportional to the frequency and inductance of the machine, will be greaterwhen the motor is small at high speed, so the reflection coefficient will be close to unity, andthe reflected voltage will have the same order of magnitude as that from the source. There-fore, in the new high-speed electric drives equipped with WBG semiconductor devices,these reflected waves will be more and more evident.
Although new power converters based on WBG devices are becoming increasinglypopular, the authors feel there is a lack in the literature of an in-depth survey of PDsfor the electrical drives supplied by these new converters but also in the standardizationpractise. There are many experimental investigations conducted so far and described in thisreview that examine the effects of PWM signals on isolation for both simple (microscopiceffects) and complex systems (macroscopic effects), but for frequencies limited to a fewkHz, and they can not be compared to the operating frequencies of modern WBG devices.However, the studies that have been carried out in the literature, even though they cannotfaithfully represent the real complex systems of the new generation of converters with WBGsemiconductor devices, certainly provide useful results for understanding the phenomenonof insulation ageing.
In his work [43], Jeremy C.G. Wheeler raised the importance of the increased aging ofthe drives supplied by the power converters and in particular the influence of the short risetimes of the pulses coming from the inverter, the voltage overshoot at the motor terminals,

Energies 2022, 15, 1406 9 of 30
and the repetition frequency of the pulses, making reference to the IEC standards. Anexample of the overvoltage for different cable lengths and rise times of the PWM signal ofthe converter is shown in Figure 6, which is also presented in the IEC Standard.
Using the following equation, it is possible to calculate the critical length of the cablelcritical , which leads to the full overvoltage for a known voltage rise time trise:
trise = 2 ∗ tp =2 ∗ lcritical
v→ lcritical =
v ∗ trise2
, (4)
where tp and v are the propagation time and velocity, respectively. For conventionalinverters characterised by PWM signals with PWM rise times greater than 1000 ns, theovervoltage occurs for a cable length of 100 m, whereas for PWM signal rise times less than50 ns generated by modern inverters, the overvoltage occurs for short cables, already withthe cable of about 10 m. Consequently, although an increase in the switching frequencyhas the advantage of reducing the size and weight of the new converters, at the same timeby reducing the pulse rise times, high dv/dt overvoltages are already reached even in thecase of short cables. He also suggested to continue updating the IEC 60034-18-41 and IEC60034-18-42 standards in order to fit the purpose of the purchased converter-fed machinesto their users.
Figure 6. Relationship between the voltage at motor terminals and the cable length for various risetimes of a PWM signal; figure extrapolated from [16,43].
In addition to the reflection of voltage waveforms, the non-uniform distribution ofvoltage along the coil of the winding is considered to be another main cause of the increasedelectrical stress on the insulation system and leading to the generation of partial discharges.The non-uniform voltage distribution along the coil turns is caused by the parasitic ca-pacitance introduced by the insulation, which has a significant value at high frequency.A detailed analysis of the irregular voltage distribution at the winding terminals of anelectric motor powered by a PWM inverter was proposed by Don-Ha Hwang et al. [44]. Ithas been shown by both simulation and experiment that the voltage dv/dt has a higheramplitude when the rise time of the PWM signal is lower; moreover, the first and last coilsof the winding are often placed next to each other by construction and separated by a thinlayer of insulation, and it is in this situation that the highest voltage occurs and can causeinsulation breakdown.
Energies 2022, 15, 1406 10 of 30
Petrarca et al. [47] analysed the dynamics of partial discharges and the electrical stressexperienced by the stator windings using a multi-conductor transmission line model. Dueto the parasitic capacitance of the insulation system, a non-uniform voltage distribution isproduced along the stator windings. This work can be regarded as a valuable contributionto the design of electrical machine insulation.
The effect of insulation degradation of AC electric motors when fed by converters witha PWM voltage waveform will be analysed in the following sections. Firstly, studies of themicroscopic effects of electrical ageing on simple systems will be presented (e.g., as singlewires or dielectric defects of known geometry) by examining the relationships between thecharacteristics of PWM signals and the generation of partial discharges [41,43,44,46–51].Secondly, studies of the macroscopic effects of electrical ageing on complex systems (e.g.,whole stator windings) subjected to thermal and electrical stress will be examined [52–60].
3.1. Microscopic Effects
The components of the insulation system of an electric motor in a high-speed drive aresubjected to repetitive PWM waveform voltages that affect the lifetime of the insulation. Inorder to understand which factors of the PWM signals are most damaging to the insulation,it is necessary to test and analyse the effect of these voltage waveforms in simple systems,i.e., in a single coil of the stator winding, in small samples of dielectric material withdefects of known geometry or with air gaps, etc. IEC Standard 60034-18-41 indicates thecharacteristics of PWM signals that most affect insulation as shown in Table 1 below.
Table 1. Influence of the features of machine terminal voltage on components of Type I insulationsystems.
InsulationComponent
FundamentalFrequency
Impulse VoltageRepetition Rate
Peak/Peak Impulse Voltage(Fundamental Frequency)
Peak/Peak Impulse Voltage(Impulse Frequency) Jump Voltage Rise Time
Turn to turninsulation • •Main wallinsulation • • Phase/phaseinsulation • •
Note: Less significant•More significant.
For example, the peak-to-peak voltage at a fundamental frequency and the peak-to-peak impulse voltage (meaning the peak-to-peak of one level of a multilevel converter) arehighlighted as the most significant in affecting the insulation. Rather than the standardsthat are analysing the peak-to-peak voltages such as for example in Figure 6, in the literaturetreating this topic, the peak-to-peak voltage is usually kept constant in order to test otherfeatures, such as the rise time, the frequency, etc. For this reason, in the next sections, thefollowing features will be included in the analysis and for the comparison: the voltagepolarity, the rise time, and the frequency. Even though the these features are referring tomacroscopic systems, i.e., a Type I machine insulation system, they can viably be adoptedalso in microscopic systems, as it is more easy to access the different parts of the dielectric.
In the literature, there are several works examining the degradation of insulationsystems of AC motors produced by PWM voltage waveform signals. Many researchershave identified a significant correlation between voltage waveforms and the developmentof partial discharges and consequently insulation ageing mechanisms [61].
By analysing the rise times, frequency, and duty cycle of the PWM signals and measur-ing the physical characteristics of the partial discharges, it is possible to derive an estimateof the life of the isolation system. This is precisely what has been done in [41,48,50,51,62–64],where an estimate of the state of the insulation can be obtained as a function of the rise time,the frequency of the PWM signals, and the type of the PWM pulse (unipolar or bipolar).

Energies 2022, 15, 1406 11 of 30
3.1.1. Effect of the Voltage Pulse Polarity
In the literature, the analysis has been conducted on the distinction of the type ofimpulse produced from the power converter, which can be bipolar or unipolar, and theirinfluence on the lifetime of isolation systems. In Kaughold et al. [41,48], both were examinedto analyse the ageing phases of the winding insulation of a high-speed drive inductionmotor. In addition, the authors provide an interesting relationship between PDs and thebreakdown behaviour of an insulator. Bipolar pulses produce a higher electrical stressto the insulator, as shown in Figure 7, where duration and partial discharge probabilitycurves are shown for different voltage levels. The bipolar signal has a higher probability ofgenerating a PD with a lower threshold voltage than the case of the unipolar pulse.
Yin in [50] studied the failure mechanism of winding insulations in inverter-fed motorsalso subjected to insulation samples consisting of 3 mm thin wires with the same geometryto three different pulses: bipolar and unipolar positive and negative. The tests were carriedout on standard 18 HAPTZ samples applying a peak-to-peak voltage Vpp of 2 kV withthe switching frequency of 20 kHz and a rise time of 0.025 µs. From the results, the authorhighlighted three different failure times, and in particular the samples subjected to bipolarpulses showed a shorter failure time than the cases applying unipolar signals. Therefore, abipolar pulse causes a higher electrical stress to the insulation, and one explanation for thisphenomenon is the continuous change of the voltage sign, which generates a counter fieldthat has the same direction as the applied field, generating a higher local field. On the otherhand, samples subjected to a positive unipolar pulse have a higher time to failure thannegative ones with the same applied voltage and material geometry. The author formulateda possible explanation for the difference in the resulting life between the two cases, whichlies in the formation of space charges under positive pulses. As the concentration of spacecharges increases to a certain value, the resulting field is limited by the space charges [50].
In contrast, more recent work by Wang et al. [62] has shown that the different polarityof the voltage square wave signal for frequencies of 5 kHz and 3 kHz does not lead tosignificant differences in insulation lifetime. It was only when testing the samples at afrequency of 1 kHz that a significant difference in lifetime was found between tests carriedout with two different voltage polarities. The authors do not explain the physical reasonbehind this phenomenon but deduce that it resulted from a different duty cycle of theapplied signal (10% for 1 kHz and 30% and 50% for 3 kHz and 5 kHz, respectively).
Unipolar pulses
Alternating pulses
Impulse voltage: 0,1/5 𝜇𝑠, 5 kHzTemperature: 20° C
copper wire
enamel coating
impregnatingresin
0,7 mm
Figure 7. Relationship between partial discharge and breakdown behavior of typical turn insulations;figure extrapolated from experimental data of the work conducted by Kaufhold et al. [41].
Energies 2022, 15, 1406 12 of 30
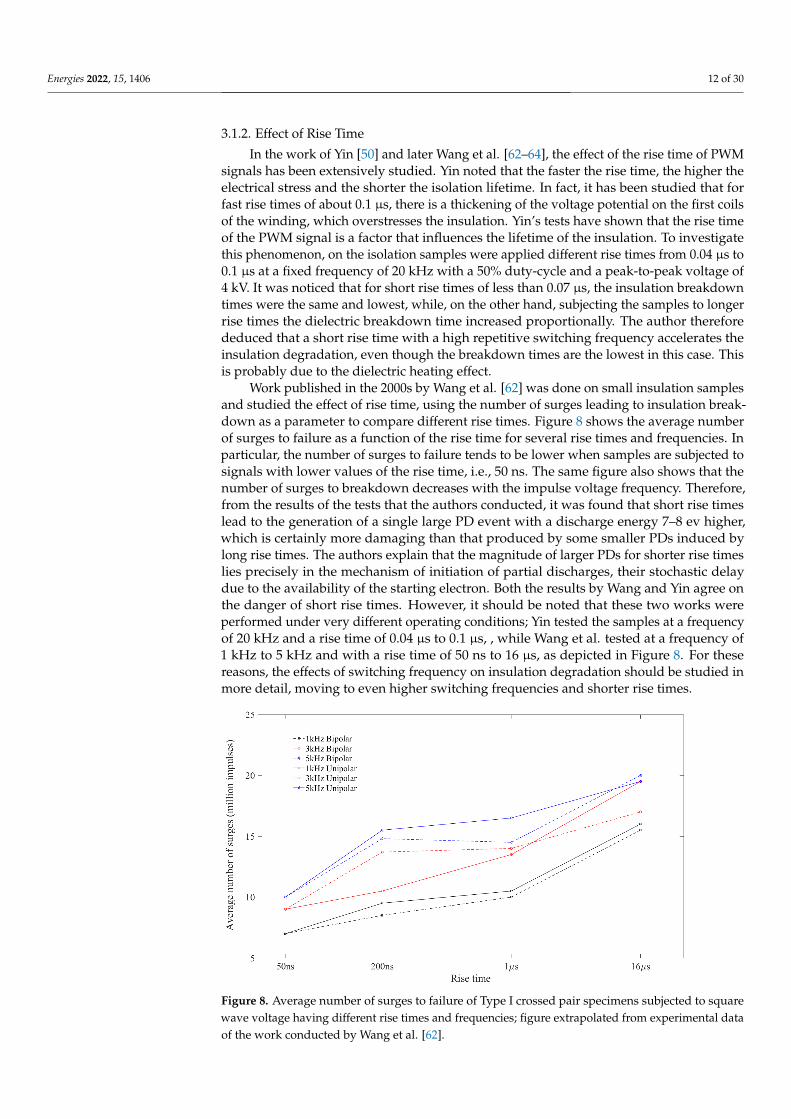
3.1.2. Effect of Rise Time
In the work of Yin [50] and later Wang et al. [62–64], the effect of the rise time of PWMsignals has been extensively studied. Yin noted that the faster the rise time, the higher theelectrical stress and the shorter the isolation lifetime. In fact, it has been studied that forfast rise times of about 0.1 µs, there is a thickening of the voltage potential on the first coilsof the winding, which overstresses the insulation. Yin’s tests have shown that the rise timeof the PWM signal is a factor that influences the lifetime of the insulation. To investigatethis phenomenon, on the isolation samples were applied different rise times from 0.04 µs to0.1 µs at a fixed frequency of 20 kHz with a 50% duty-cycle and a peak-to-peak voltage of4 kV. It was noticed that for short rise times of less than 0.07 µs, the insulation breakdowntimes were the same and lowest, while, on the other hand, subjecting the samples to longerrise times the dielectric breakdown time increased proportionally. The author thereforededuced that a short rise time with a high repetitive switching frequency accelerates theinsulation degradation, even though the breakdown times are the lowest in this case. Thisis probably due to the dielectric heating effect.
Work published in the 2000s by Wang et al. [62] was done on small insulation samplesand studied the effect of rise time, using the number of surges leading to insulation break-down as a parameter to compare different rise times. Figure 8 shows the average numberof surges to failure as a function of the rise time for several rise times and frequencies. Inparticular, the number of surges to failure tends to be lower when samples are subjected tosignals with lower values of the rise time, i.e., 50 ns. The same figure also shows that thenumber of surges to breakdown decreases with the impulse voltage frequency. Therefore,from the results of the tests that the authors conducted, it was found that short rise timeslead to the generation of a single large PD event with a discharge energy 7–8 ev higher,which is certainly more damaging than that produced by some smaller PDs induced bylong rise times. The authors explain that the magnitude of larger PDs for shorter rise timeslies precisely in the mechanism of initiation of partial discharges, their stochastic delaydue to the availability of the starting electron. Both the results by Wang and Yin agree onthe danger of short rise times. However, it should be noted that these two works wereperformed under very different operating conditions; Yin tested the samples at a frequencyof 20 kHz and a rise time of 0.04 µs to 0.1 µs, , while Wang et al. tested at a frequency of1 kHz to 5 kHz and with a rise time of 50 ns to 16 µs, as depicted in Figure 8. For thesereasons, the effects of switching frequency on insulation degradation should be studied inmore detail, moving to even higher switching frequencies and shorter rise times.
Figure 8. Average number of surges to failure of Type I crossed pair specimens subjected to squarewave voltage having different rise times and frequencies; figure extrapolated from experimental dataof the work conducted by Wang et al. [62].

Energies 2022, 15, 1406 13 of 30
Multilevel PWM signals with variable rise times have recently been investigated in [49],as a future solution to reduce the magnitude of PDs or even eliminate them. In particular,an attempt was made to lengthen the duration of the rise times at times when the electricalstress on the insulator is greatest and the magnitude of the PD is reduced considerably. Thetests were carried out using three- and four-level PWM voltage waveforms. The authorproposed a technique to decrease the wear and tear on the insulation system, while theability to use shorter rise times was retained and therefore could be well suited for newWBG semiconductor devices without taking unnecessary risks for the insulation health.
3.1.3. Effect of the Frequency
From the results highlighted in the works of Wang et al. [62–64], it emerges thatstatistically the effect of the frequency of PWM signals has a direct relationship on thegeneration and amplitude of partial discharges. From Wang’s results shown in Figure 9,the failure time is approximately inversely proportional to the increase in the frequencyof the PWM signals. At the higher frequency of 5 kHz the life of the insulation is reducedcompared to tests carried out at lower frequencies. The authors also deduce importantconsiderations regarding the frequency of the pulses. Operating with a low-frequencysignal and therefore long rise and fall times, experimental verification has shown that thePDs generated have a greater amplitude than those obtained at high frequencies. Thereason for this is that longer times favour the trapping of the surface charge left by theprevious PDs, hence larger statistical delays and consequently higher overvoltages.
Figure 9. Relationship between lifetime values and different voltage frequencies; figure extrapolatedfrom experimental data of the work conducted by Wang et al. [62].
These works provide a good basis for understanding the causes that can affect theinsulation system the most, when subjected to PWM square wave signals. The relationshipsbetween the lifetime of the insulation and the characteristics of the PWM signals provideimportant information for safeguarding the insulation and understanding when dischargeactivity may occur during motor operation. However, the frequency, voltage, and rise-timevalues of the signals used in the state-of-the-art analysis are not updated for modern high-speed electric drives. As has been shown, the tests examined in these articles are limitedto a PWM signal with a maximum switching frequency of 20 kHz if not lower, far fromthe frequency commonly used today by new generation converters (up to 100 kHz). There

Energies 2022, 15, 1406 14 of 30
is certainly a lack of analyses and tests carried out at higher frequencies, which can morefaithfully represent the new high-speed drives.
3.2. Macroscopic Effects
In the previous paragraphs, the main phenomena responsible for the initiation ofpartial discharges and the effects of PWM waveforms on samples of dielectrics or twistedwires were introduced to describe the main ageing mechanisms in insulation systems,described as microscopic effects. However, the effects of PDs and the ageing estimation onmore complex systems have been studied in the literature. Research in this area has alsoinvestigated the possibility of estimating the ageing of entire randomly wound stators bymeasuring easily accessible quantities and studying the macroscopic effects of PDs actingon thermal [52,53,56,57] and electrical ageing [58–60], such as variations in impedanceand high-frequency currents. In particular, of interest is to analyse the phase current inboth time domain and high frequency spectra, as well as the high frequency impedance orthe insulation capacitance. In both time and frequency spectra it is possible to notice thechanges in the healthy and degraded insulation.
In this section, the literature aimed at studying the overall ageing of the insulationsystem of entire windings will be reviewed, and on-line and off-line techniques for esti-mating the life state of the insulation will be defined. The considerations made in thissurvey may be a good starting point to modify the current standards and guidelines forelectrical insulation systems used in rotating electrical machines supplied by voltage sourceconverters, such as IEC Std. 60034-18-41 [16] or NEMA Std. MG1-31 [65].
In particular, a comparison of the overvoltages allowed at motor terminals given bythe two standards is shown in Table 2. In order to compare the overvoltages, it is assumedthat the minimum DC bus voltage, i.e., Udc = 1.6 ∗ Vrated, where Vrated is defined as rmsline-to-line rated motor voltage in [65]. PD-free voltage in NEMA standard is intended tocorrespond to the upper limit of the moderate stress category in IEC Std. 60034-18-41; in fact,it is slightly lower than the maximum possible voltage of the B category. On the other hand,for the IEC Std. 60034-18-42 [17] rgw Type II category has been described and is expectedto withstand partial discharge activity in any part of the insulation system throughouttheir service lives. Examples of the enhancements that are produced for various rise timesand cable lengths in the case of a two-level converter are given in Figure 6. Supposing a10 m cable length and the lowest rise time (50 ns), an overvoltage 20.4 ∗ Udc kV/µs can becalculated, which is comparable to the withstand voltage defined by the NEMA Standard.To summarize, the NEMA limits are slightly lower for both insulation categories, i.e.,6–8%. It is to be noted that these standards do not consider lower rise times, which can beobserved in modern WBG-based converters.
Table 2. Comparison of the overvoltages: IEC (Type I) and NEMA standard.
Stress Category Overshoot OF (Upeak/Udc) Rise Time (µs) Overvoltage (kV/µs)
IEC Std.
A—Benign OF ≤ 1.1 0.2 ± 0.1 * max 11UdcB—Moderate 1.1 ≤ OF ≤ 1.5 0.2 ± 0.1 * max 15Udc
C—Severe 1.5 ≤ OF ≤ 2 0.2 ± 0.1 * max 20UdcD—Extreme 2 ≤ OF ≤ 2.5 0.2 ± 0.1 * max 25Udc
NEMA Std.
PD-free voltage OF ≤ 1.39 0.1 13.9Udcwithstand voltage OF ≤ 1.93 0.1 19.3Udc
* tolerance.
An accelerated ageing campaign is required to study the degradation of the statorwinding insulation system. The standard IEEE 1776-2008 [66] provides guidelines anddirectives for accelerated ageing of an insulation system through thermal cycles. In orderfor the test to be performed correctly, the stator winding should be subjected to repeated

Energies 2022, 15, 1406 15 of 30
thermal cycles, mechanical stress, exposure to moisture, and finally a voltage test to analysethe condition of the insulation. The test is repeated for several cycles until a failure isdetermined by the voltage test. These tests aim to evaluate the macroscopic effects ofthermal deterioration of the insulation so that changes in the physical properties of theinsulation can be highlighted.
A work using these thermal ageing campaigns of stator winding coils was providedby Zoeller et al. [52]. Subsequently, the authors, based on their observations from theageing tests, proposed a technique for monitoring the deterioration of the insulation systemof a stator winding. By analysing the phase current transients of the stator winding, theauthors examined the change in dielectric resistance and thus the health of the insulation. Inaddition, ageing campaigns were carried out on stator winding samples, which showed thatthe capacitance introduced by the insulation system is a key parameter in quantifying thedegree of ageing of the dielectric material. Such a monitoring technique is of fundamentalimportance to ensure the reliability of the electrical machine and to optimise the electricaldrive. A general schematic of how these techniques are performed is described in Figure 10.
Cables
Motor
Inverter PWM
PWM Controller
Acquisition System
AA
A
Data analysis
Figure 10. Schematic overview of the test-bench ageing estimation.
Leakage current is a useful quantity to evaluate the state of the insulation becauseit has a direct dependence with the variation in the electrical properties of the dielectricduring ageing. Jensen et al. [53] proposed an online monitoring technique based onthe extended Kalman filter (EKF) and estimated the insulation state without the use ofexpensive equipment by monitoring the leakage current. This state observer performsthe estimation of state variables using a recursive algorithm, i.e., it updates the estimatedvalue with that of the next step. The prediction of state variables is reliable even if noiseaffected measurements are used as input. EKF is probably the most widely used estimationalgorithm for nonlinear systems. The one designed by Jensen et al. processes the measuredleakage currents through series resistors and estimates the remaining useful life (RUL) ofthe machine insulation, obtaining reliable and useful results for monitoring the insulationof the electrical machine during its operation. Although this state observer is easy toimplement, it very often has a very high computational cost, especially when implementedin very non-linear systems. Moreover, relying on the linearization of the state variables,it has a first-order accuracy that can lead to filter instability [67]. Jensen et al. designedthe state observer with a low sampling rate, finding a trade-off between the estimationaccuracy and the computational cost of the technique.
Previous work has studied the macroscopic effects of thermal ageing on complexsystems. However, it is also interesting to analyse other works in the literature that dealwith the effects of electrical ageing on the insulation of the stator winding coils of ACmotors. In [58], the effects of stator insulation ageing in wet and dry conditions and under

Energies 2022, 15, 1406 16 of 30
electrical stress from overvoltages of three times the nominal voltage in a cyclic mannerwere investigated. From the tests the authors were able to estimate the change in insulationresistance and frequency domain spectroscopy (FDS) from which useful information on thecondition of the insulation could be deduced. Analysing the degradation of the insulationof a stator coil during electrical stress allowed the authors in [59] to identify the bendingarea of the coil as one of the points where ageing occurs most rapidly. In order to reducewear and tear on the insulation, it is necessary to increase the bending radius of the copperedge of the conductor. The authors are convinced that the type of manufacturing process ofan electrical machine winding influences the unevenness of insulation degradation.
As seen in the previous paragraphs, the insulation of the stator winding of an electricmachine is one of the most fragile elements and is the most frequent failure in electricmotors [14,15]. During normal operation of an electric motor, the insulation is subjected toelectrical, mechanical, and thermal stresses and in the long run can break down, causingcatastrophic failure. Therefore, the need has arisen to implement insulation conditionmonitoring techniques that also allow preventive machine maintenance to be scheduledwith the aim of achieving optimum maintenance schedules to minimise downtime. Inaddition, a condition monitoring system provides an early indication to maintenancepersonnel so that they can organise the procurement of necessary spare parts before a majormachine failure occurs.
In this regard, several monitoring techniques, both on-line and off-line, have beeninvestigated to assess the remaining useful life (RUL) of the insulation. A comprehensivereview of testing and monitoring methods for stator isolation systems in machines wasprovided by Grubic et al., analysing both the most common off-line and on-line techniquesin the industry [10].
On-line tests are widely used because they are performed during the nominal operationof the machine and are able to examine quantities such as temperature, electromechanicalforces, machine voltages, and currents during normal motor service and thus detect mostfaults in the stator and rotor windings of an electric motor, without ever disconnecting themachine from service. Although these methods are very promising and lead to reliableresults, a large amount of capital is required to implement them due to the large number ofsensors that need to be installed for each motor to be monitored such as high-frequencycurrent transformers (HFCTs) [68].
The tests carried out when the machine is disconnected from the system are off-linetests, and they can be done when the machine is partially disassembled or simply performeddirectly on the terminals of the motor stator winding [54,55]. Yang et al. proposed an off-line analysis method to detect the stator insulation degradation of an inverter-poweredelectrical machine. This method provides an effective and low-cost solution to monitor theinsulation ageing status so that the maintenance of the machine can be efficiently plannedaccording to its current condition. One of the main limitations of off-line techniques is thattests are performed years apart, so if tests are not performed under the same conditions,they do not provide useful results for estimating the remaining life of the insulation or itscurrent condition. In addition, downtime is often long, and the machine is disconnectedfrom the drive for more than a day.
4. Selection of the HF Motor Model
Industrial electric drives are commonly consisting of an electric motor and a powerelectronic converter, offering in this way optimal performance and flexibility. With thedevelopments of the WBG devices and the high-switching operation, the models of theelectric motor that could describe in more details the high-frequency behaviour of themotor have become the crucial point. This kind of model can be seen as a key tool to betterunderstand the overvoltage problems in PWM drives and conducted EMI but also forthe development and benchmarking of the mitigation techniques, which can suppress theovervoltages such as for example the dv/dt filter.
Energies 2022, 15, 1406 17 of 30
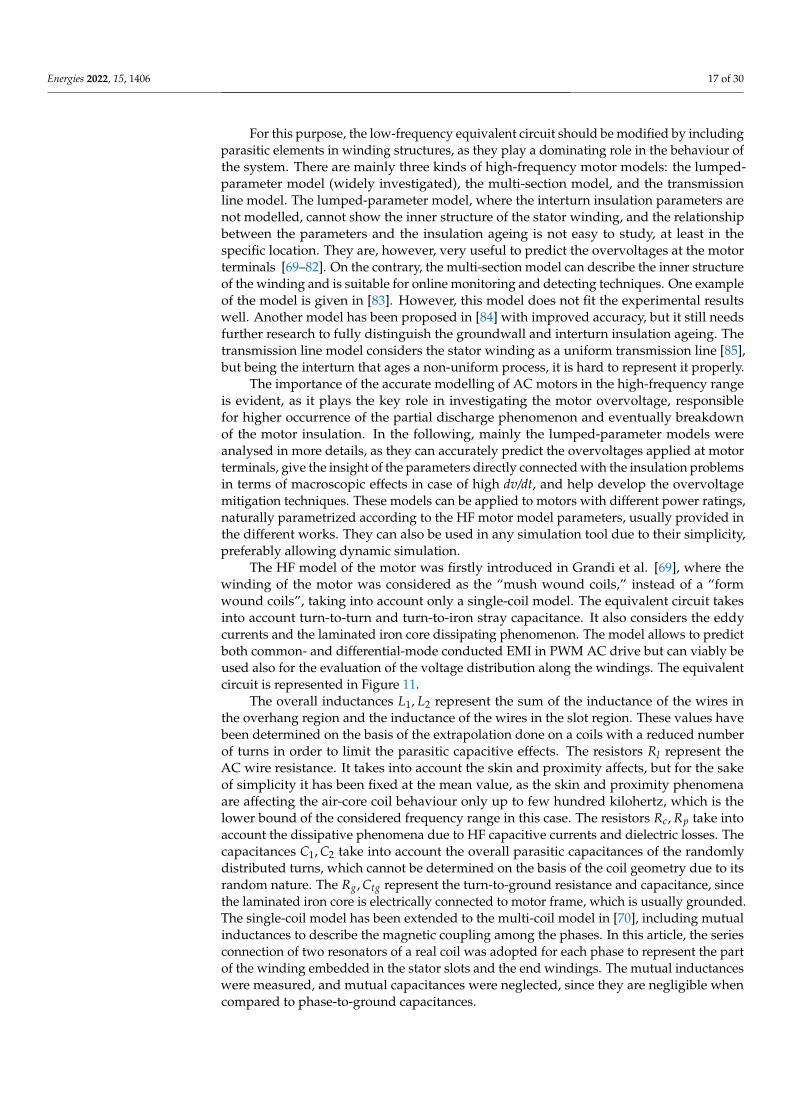
For this purpose, the low-frequency equivalent circuit should be modified by includingparasitic elements in winding structures, as they play a dominating role in the behaviour ofthe system. There are mainly three kinds of high-frequency motor models: the lumped-parameter model (widely investigated), the multi-section model, and the transmissionline model. The lumped-parameter model, where the interturn insulation parameters arenot modelled, cannot show the inner structure of the stator winding, and the relationshipbetween the parameters and the insulation ageing is not easy to study, at least in thespecific location. They are, however, very useful to predict the overvoltages at the motorterminals [69–82]. On the contrary, the multi-section model can describe the inner structureof the winding and is suitable for online monitoring and detecting techniques. One exampleof the model is given in [83]. However, this model does not fit the experimental resultswell. Another model has been proposed in [84] with improved accuracy, but it still needsfurther research to fully distinguish the groundwall and interturn insulation ageing. Thetransmission line model considers the stator winding as a uniform transmission line [85],but being the interturn that ages a non-uniform process, it is hard to represent it properly.
The importance of the accurate modelling of AC motors in the high-frequency rangeis evident, as it plays the key role in investigating the motor overvoltage, responsiblefor higher occurrence of the partial discharge phenomenon and eventually breakdownof the motor insulation. In the following, mainly the lumped-parameter models wereanalysed in more details, as they can accurately predict the overvoltages applied at motorterminals, give the insight of the parameters directly connected with the insulation problemsin terms of macroscopic effects in case of high dv/dt, and help develop the overvoltagemitigation techniques. These models can be applied to motors with different power ratings,naturally parametrized according to the HF motor model parameters, usually provided inthe different works. They can also be used in any simulation tool due to their simplicity,preferably allowing dynamic simulation.
The HF model of the motor was firstly introduced in Grandi et al. [69], where thewinding of the motor was considered as the “mush wound coils,” instead of a “formwound coils”, taking into account only a single-coil model. The equivalent circuit takesinto account turn-to-turn and turn-to-iron stray capacitance. It also considers the eddycurrents and the laminated iron core dissipating phenomenon. The model allows to predictboth common- and differential-mode conducted EMI in PWM AC drive but can viably beused also for the evaluation of the voltage distribution along the windings. The equivalentcircuit is represented in Figure 11.
The overall inductances L1, L2 represent the sum of the inductance of the wires inthe overhang region and the inductance of the wires in the slot region. These values havebeen determined on the basis of the extrapolation done on a coils with a reduced numberof turns in order to limit the parasitic capacitive effects. The resistors Rl represent theAC wire resistance. It takes into account the skin and proximity affects, but for the sakeof simplicity it has been fixed at the mean value, as the skin and proximity phenomenaare affecting the air-core coil behaviour only up to few hundred kilohertz, which is thelower bound of the considered frequency range in this case. The resistors Rc, Rp take intoaccount the dissipative phenomena due to HF capacitive currents and dielectric losses. Thecapacitances C1, C2 take into account the overall parasitic capacitances of the randomlydistributed turns, which cannot be determined on the basis of the coil geometry due to itsrandom nature. The Rg, Ctg represent the turn-to-ground resistance and capacitance, sincethe laminated iron core is electrically connected to motor frame, which is usually grounded.The single-coil model has been extended to the multi-coil model in [70], including mutualinductances to describe the magnetic coupling among the phases. In this article, the seriesconnection of two resonators of a real coil was adopted for each phase to represent the partof the winding embedded in the stator slots and the end windings. The mutual inductanceswere measured, and mutual capacitances were neglected, since they are negligible whencompared to phase-to-ground capacitances.

Energies 2022, 15, 1406 18 of 30
Figure 11. Three-terminal HF equivalent circuit of the coil proposed in [69].
Another early per-phase model can be found in Boglietti et al. [71] based on lumpedparameters, proposing an AC motor model of a single phase, which presents between thephase and the neutral:
• Series connection of the stator/rotor resistance R and the leakage inductance Ld todescribe the low-frequency behaviour, which can be obtained by the locked rotortest with a fundamental frequency. However, the suggested value of the leakageinductance to be used in the HF motor model is not the one obtained by the lockedrotor test but is calculated and estimated on the basis of the high-frequency impedancemeasurements.
• Resistance Re to account for eddy currents inside the magnetic core and the frame,estimated from the high-frequency impedance measurements.
• Capacitance Ct representing the turn-to-turn distributed capacitive coupling, calcu-lated and estimated according to the high frequency impedance measurement. Usuallya very small value, which is much smaller than the winding to ground distributedcapacitive coupling.
Besides these elements, there is a capacitor between the phase and the ground and anequal capacitor between the neutral and the ground to model such distributed capacitivecoupling of the winding. An attempt to merge the HF motor model with the low-frequencydq motor model has been made, but no results have been reported [72]. The same modelhas been used to obtain more results on several types and sizes of industrial AC motors,including induction, synchronous reluctance (without interior permanent magnets), andbrushless motors in [73].
The model presented in [71] and depicted in Figure 12 has also been extended to thecomplete AC PWM drive, from the transformer of the main power source to the electricalmotor [74]. The transformer is represented by the standard short circuit parameters; theinverter is modelled as an ideal voltage source, and a stray capacitance between thesubstrate and the heat sink of each IGBT was measured with an RLC meter. The cable wasrepresented by the single T cell, and for the motor the models developed in [71,72] havebeen used, described only with the input capacitance due to the winding insulation and themotor frame resistance. In the second attempt, the skin effect on the inverter inductanceshas also been accounted for in the final model. The obtained model allows analysing inthe time domain the effects of the high dv/dt applied by the PWM inverter and the leakagecurrents that flow through the stray capacitance of the system.

Energies 2022, 15, 1406 19 of 30
Figure 12. HF phase circuit proposed in [71].
Moreira et al. [75] propose a per-phase model for the motor and cable, with a HFmotor model similar to the models presented in [69,71] as represented in Figure 13:
• The parameter Cg represents the winding-to-ground capacitance. The parameter Rgis added in the circuit to represent the dissipative effects that are present in the motorframe resistance.
• The circuit formed by the parameters Rt, Lt, and Ct is the part of the network respon-sible to capture the second resonance in the frequency response, which is related tothe winding turn-to-turn capacitance.
• The parameter Re is responsible to account for the losses introduced by the eddycurrent inside the magnetic core.
• To estimate the parameters of the high-frequency part of the model, it is suggested toreplace the motor dq model by a lumped-inductance, which represents the leakageinductance of the machine winding.
Figure 13. HF phase circuit proposed in [75].
Moreover, in [75] the importance of the adequate estimation of the cable parametershas also been highlighted, in order to have an accurate computation of the overvolatges. Inthis case, the power cable is represented as a transmission line with lossy characteristicsand is modelled using several lumped parameter segments. These models can be feasiblyintegrated in a MATLAB-based program for the analysis of the overvoltage phenomena inlong-cable PWM drives.
The universal model has been presented by Mirafzal et al. [76] (Figure 14 for a single-phase system), containing the common-mode (CM), the differential-mode (DM), and thebearing circuit models combined into one three-phase equivalent circuit model for widefrequency range analysis. In addition to the single-phase model represented in Figure 14,the three-phase system contains also a bearing current and a shaft voltage model, connected

Energies 2022, 15, 1406 20 of 30
from the neutral terminal to the ground terminal. It takes the IEEE 112 recommendedper-phase low frequency equivalent circuit (market by the grey dotted line) and addsparameters to model the HF characteristics of the induction machine. The single-phasemodel contains the following parameters:
• Stator resistance Rs, obtained from the manufacturer’s tests.• Core loss resistance Rcore, which together with Lm have an effect on rounding the
reflected wave ringing wave shape. The value of Rcore is estimated.• Rotor resistance Rr, rotor inductance Lrl , and slip s determined by using the manufac-
turer T-equivalent circuit values.• Magnetizing inductance Lm and IEEE Standard 112 fundamental frequency circuit
value has been used.• Stator Leakage Inductance Lls and IEEE Standard 112 fundamental frequency circuit
value has also been used for the determination of its value.• Stator First Turn Leakage Inductance ηLls: one of the critical parameters in defining
the DM motor high-frequency impedance, predicting the antiresonance point andsetting the correct EMI leakage current to the ground in the CM circuit. It accounts forthe fact that only a fraction of the total stator leakage inductance is attributed to thehigh-frequency antiresonance point, in particular the first few turns. It is estimatedaccording to winding data and machine geometry.
• Stator-frame capacitance Cs f−e f f ective: effective stator-to-frame capacitance of the firstslot per phase, calculated from the machine geometry.
• Stator Turn-to-Turn Winding Capacitance Csw: this parameter can be determined indifferent ways, for example by the heuristic method as a function of Cs f−e f f ective.
• Stator initial frame-to-ground damping resistance µRs: this component is the ACresistance of the fractional part of the total stator resistance Rs associated with ηLls. Itaffects the peak CM current as well as the damping of oscillations in the CM currentto the ground, and, as it needs further research, it was not accounted for this analysis.
Figure 14. HF phase circuit proposed in [76].
The simulated overvoltage, its waveform shape, and its ringing frequency at themachine terminal are in good agreement with the measured values. However, the peaksimulation values of the CM current are much higher that of the measured CM current,suggesting the fact that the ferrite CM saturating inductance used in the drive was notsimulated. This model has been improved later on in [77], by using more analyticalapproach for the parameters determination.
Another model capable of accurately capturing the high-frequency DM and CMimpedance characteristics has been proposed by Schinkel et al. [78] (Figure 15). It consistsof a fully coupled inductance Lm, a stray inductance Lstr, Re accounting for the iron loss

Energies 2022, 15, 1406 21 of 30
of the stator winding, parasitic capacitances to the stator Cg1 and Cg2, and resistances Rg1and Rg2 on that current paths. These parameters are calculated on the basis of the CM andDM impedance characteristics measured in the frequency domain. The capacitance Cadand resistanceRad form a series resonance together with Lstr, but it is difficult to estimatethem analytically. Trials and adjustments are required with the help of frequency-domainsimulations to achieve satisfactory results.
Figure 15. HF phase circuit proposed in [78].
Yet another model, similar to the one of [78], capable of accurately capturing the HF,DM, and CM impedance characteristics has been proposed by Wang et al. [79] (Figure 16).
Figure 16. HF phase circuit proposed in [79].
The proposed HF motor model uses a similar model structure and parameterizationprocedure. The main difference is the introduction of a series Rt, Lt, Ct branch insteadof a Rad and Cad branch without sacrificing model accuracy. In addition to the HF motormodel, the time-domain frequency-dependent cable model, which includes both the skinand proximity effects and the dielectric losses for the high-frequency range, was includedin the analysis. The following parameters in the HF motor model can be identified:
• Rg1 and Cg1 represent the parasitic resistance and capacitance between the statorwinding and the motor frame, respectively.
• Rg2 and Cg2 represent the parasitic resistance and capacitance between the statorneutral and the motor frame, respectively.
• Ld represents the stator winding leakage inductance.• Re represents the high-frequency iron loss of the stator winding.• Lt and Ct are introduced to capture the second resonance in the motor impedance
characteristic, caused by the skin effect and interturn capacitance of the stator windings.

Energies 2022, 15, 1406 22 of 30
All the parameters from the per-phase equivalent circuit are identified through theDM and CM impedance characteristics measured in the frequency domain.
Degano et al. [80] analysed a similar circuit to one of the [70], with the differenceof one more additional coil-like network, as presented in Figure 17. In fact, the two coil-like network models from [70] presented significant discrepancies when HF impedanceestimations were compared to corresponding HF impedance experimental measurementstaken on the motor. The genetic algorithm (GA) has been implemented to optimize theselection of the circuit parameter values. It is the automatized procedure relying on thematching between the impedance experimental measurements and the values obtained bythe model simulation.
Figure 17. HF phase circuit proposed in [80].
Vidmar et al. [81] proposed a universal HF per-phase machine model suitable fordelta and star connections (Figure 18). The model assumes the distributed line of the statorwinding to be represented by series lumped equivalent circuits. The first few turns ofthe winding are used to model the HF characteristics, as HF components of the supplyvoltage penetrate only at the first few turns. This path consists of resistor Rg representingresistive losses in the CM and DM current path, stray inductance of the machine terminalsand connector wires to winding LC, and the beginning part of the winding-to-stator straycapacitances Cg1. The LF characteristics, as LF components of the supply voltage canfurther penetrate into the winding, are represented by winding stray inductances Ls andLse, eddy-current loss resistances Re and Ree, and the central part of winding-to-stator straycapacitance Cg2. The symmetry necessary for the delta and star connection is obtained bythe identical parameters on both sides of the model, represented by the Rg, LC, Ls, Re, andCg1. Moreover, this model permits modelling of the interturn effects, represented by thelumped parameters RT , CT , and LT .
Figure 18. HF phase circuit proposed in [81].

Energies 2022, 15, 1406 23 of 30
Another, more complex model for a star connection permanent magnet synchronousmachine has been presented by Wu et al. [82]. It consists of three parts, each one contribut-ing to CM impedance or DM impedance in the low and medium frequency ranges.
Table 3 summarizes the properties of nine different HF motor models, includingseveral features such as the frequency range, the type of winding connection, the physicalmeaning, the modelling of the inter-turn effects, analytical expressions for the parameterscalculation, and the model accuracy.
Table 3. HF Motor Model Comparison.
Model [70] [71] [75] [76] [78] [79] [80] [81] [82]
Number of comp./phase 14 6 9 11 9 9 19 17 27Frequency range 10 kHz–2 MHz 1 kHz–1 MHz 1 kHz–1 MHz 10 Hz–10 MHz up to 30 MHz 100 Hz–10 MHz 150 kHz–30 MHz 1kHz–13 MHz 10 kHz–1 MHzY-winding connection x x x x - x x x x4-winding connection x possible x x - - - x -Physical meaning x x x x - x x x xInter-turn effects x x x x - x x x xEquations for parame-ters calculation
- x x x x x - x x
Model accuracy discrepanciesreported
x x except CM cur-rent
non for simplermodel
x x x x
* x→ affirmation; –→ not clearly stated or missing.
It can be noted that models presented in [71,75,81] have similar characteristics, exceptthat in [81] a greater number of parameters is present in the phase model. The modelspresented in [70,80] are missing the explicit expressions for the parameters calculation.In [70] some parameters are missing the expressions for its calculation, and some havebeen obtained by fitting procedure, and in [80] the generic algorithm tuning procedurehas been conducted for the parameters estimation. Models presented in [76,78,79] havethe highest frequency range. In [78] the mismatching at some resonance point of the high-frequency impedance measurement has been reported, but it has been proven that theproposed model is suitable for simulations on the system level including high-frequencybehaviour. Additionally, the extended model has been proposed in order to improve theaccuracy. Almost all models are suitable for the analysis of inter-turn effects, except themodel presented in [78].
Comparison of Dynamic Behaviour of Different HF Motor Models
In order to compare the different models, an induction motor with the parameterslisted in Table 4 was tested. The common mode and differential mode impedances areshown in Figure 19.
Table 4. Parameters of the cable and the motor under test.
Motor Parameter Unit Value
Output power kW 0.37Full load speed rev/min 1370
Rated voltage (Y/∆) V 230/400Rated current (Y/∆) A 1.93/1.11Locked rotor current p.u. 3.6
Full load torque Nm 2.58Insulation class (temp. rise) -K F(80)
Cable Parameter Unit Value
Rcable mΩ/m 195.87Lcable µH/m 0.63Ccable pF/m 63.33
An impedance analyser was employed to measure the machine impedance in a widefrequency range. It can span a frequency range between 100 Hz and 40 MHz, withhigh accuracy. Afterwords, the parametrization according to different motor models

Energies 2022, 15, 1406 24 of 30
(i.e., [71,75,78–80]) was done. Different models were implemented in the LTspice simula-tion tool, having the inverter-cable-motor system per one phase as shown in Figure 20,where the example of the model developed in [80] is given. For both the simulationand the experiment, a two-level SiC-MOSFET-based inverter with switches from Rohm(SCT3022KL) rated for a maximum blocking voltage of 1200 V and a nominal current of95 A at 25 °C was supplying different HF motor models (or the motor given in Table 4in the case of experiment) through a 30 m long cable, to enhance the voltage waveformreflection and achieve high overvoltage at the machine terminals. In the simulation, therealistic dynamic models of power switches obtained from the manufacturer’s experimentaltests (Rohm SCT3022KL) were used. The inverter was operated with a DC-link voltageof 540 V. In the simulation, the cable was modelled as a RLC circuit, with the resistanceRcable, inductance Lcable, and capacitance Ccable. More information on the measured cableparameters used for the simulation are given in Table 4.
(a)
(b)
Figure 19. Measured impedances: (a) common mode, (b) differential mode.
Figure 20. Per phase HF equivalent circuit of the inverter-cable-motor system.
The experimental voltage at motor terminals was compared with the simulationresults done with different HF motor models. The switching frequency used for both thesimulation and the experiment was of 32 kHz, and a total gate resistance of 8 Ω was appliedto the gate of the switching devices.
The result of the comparison is given in Figure 21, where different voltages arepresented together with the inverter phase-to-phase voltages (pink-experimental andturquoise-simulated traces). In general, the good matching between the experimental (bluetrace) and simulated voltage waveforms can be noted. The model presented in [79] hadthe best matching with the experimental waveform when looking to the first oscillation,

Energies 2022, 15, 1406 25 of 30
in terms of peak voltage (960 V) and dv/dt, but later on showed progressively lower val-ues compared to other models whose behaviour was similar, as can also be noted in thezoom shown in Figure 21b. The experimental dv/dt was 1.396 kV/µs, while the simulatedones were 21–59% higher, with the lowest difference for the model presented in [79]. Theother models had similar dv/dt, ranging from 2.26 kV/µs up to 2.35 kV/µs, and similarpeak voltage values (around 1 kV). Additionally, the model presented in [78] showeda good matching with the experimental waveform, even though a simpler model (withonly seven components) was used in the simulation, confirming the fact that the model issuitable for simulations on the system level with HF behaviour. The dv/dt was practicallythe same to those in [75,80], accounting for 19 and 9 components in total, respectively.
It can also be noted that all the overvoltages in this case comply with the IEC andNEMA standards and are rather low. The explanation for this can be seen in the high valuesfor the cable parameters, where a cable as long as 30 m was employed.
Degano et al. in [80] presented the model made up of three resonators: the two externalones model the terminal part of the windings, while the central resonator describes thebehaviour of the active part of the winding, making possible the study of the effects ofsteep voltages coming from the inverter on different parts of the winding, which is notfeasible with other models. In addition to presenting these advantages, ref. [80] also has agood matching with the experimental results, remaining the most close to the experimentalwaveform when looking to Figure 21b. For these reasons, it is the model that represents themost advantages, when compared to other HF motor models.
(a)
(b)Figure 21. Comparison between the experimental voltage at motor terminals and voltages of differentHF models for 32 kHz switching frequency and 30 m long lead (a) the whole waveform and (b) zoomindicated in (a).

Energies 2022, 15, 1406 26 of 30
5. Conclusions and Suggestion for Future Work
Modern drives supplied by wide band-gap devices could be a good solution for manyapplications such as electric traction, as they feature lower losses and higher efficiency,require smaller filters, and consequently have a smaller size compared to standard Si-baseddrives. Nonetheless, the high frequency operation and steep pulses coming from moderninverters cause high dv/dt and large overvoltages seen at motor terminals. Together withthe cable impedance mismatch, the voltage waveform is then reflected between the motorand the inverter causing high oscillations that do not disappear within one switchingperiod. These are favouring the partial discharge phenomenon and consequently alsothe insulation ageing and eventually its breakdown, bringing in this way large processdowntime losses. In this article, the review of the literature on HF motor models waspresented, together with the comparison of the main features in different state-of-the-artmodels. In addition, the comparison of the simulation voltage waveforms, consideringdifferent HF motor models, and the experimental voltage waveform generated at the motorterminals were given, showing the good matching among all the considered motor models.The simulation was conducted in the LTspice simulation tool, which allows the usage ofthe realistic dynamic models of power switching devices obtained from the manufacturer’sexperimental tests. Moreover, the overview of the PDs was also provided, divided viablyinto major categories: the macroscopic and microscopic effects. HF motor models are crucialin understanding and studying the most critical parameters identification and overvoltagemitigation techniques, as it is favouring the PD generation and insulation ageing. On theother hand, the knowledge on the microscopic and macroscopic effects of the PDs canviably be used in the development of monitoring and prediction techniques, which areuseful to avoid the drive malfunctioning. The goal of this review was also to bring attentionto the gaps in the literature in the analysis of modern drives, supplied by WBG deviceswith elevated frequencies. To summarize, the topics that need further improvement include(but are not limited to):
• The connection of the PDs and steep PWM pulses coming from the modern powerelectronics devices working at higher switching frequencies, such as GaN and SiCdevices, both as two-level and multi-level inverters.
• The definition of the critical cable lengths, PD occurance probabilities, critical pulseamplitudes, etc. for the drives supplied by WBG-based inverters.
• The guidelines for PD alleviation for the high-frequency inverters and high-speeddrives application.
• The possible improvement in the insulation system of the machine, considering theeffects of the high-switching frequency operation of the inverters: new dielectricmaterials have to be designed to resist the problems related to HF effects.
• Creation of the new standards and guidelines on the motor overvoltages consideringthe increasing usage of the WBG-based inverters.
• Development of the overvoltage mitigation techniques for WBG-based inverters.• The improvement of the monitoring and prediction techniques for WBG-based high-
speed drives: additional research needs to be carried out to improve current monitor-ing techniques in order to accurately diagnose the state of degradation of the electricalmachine in order to prevent and reduce process downtime caused by unexpectedmotor failures and its cost.
• Further analysis and investigation on the electrical ageing of complex systems, e.g.,more accurate analysis of macroscopic quantities.
• Developments of a simple but accurate models of HF motor, which can accuratelymodel the interturn insulation and spot the presice location of the PD which and canbe integrated in the prediction and monitoring techniques.

Energies 2022, 15, 1406 27 of 30
Author Contributions: Conceptualization, V.G.M., J.L. and D.D.; methodology, V.G.M., J.L. andD.D.; formal analysis, V.G.M., J.L. and D.D.; investigation, V.G.M., J.L. and D.D.; resources, V.G.M.,J.L. and D.D.; data curation, V.G.M., J.L. and D.D.; writing—original draft preparation, V.G.M., J.L.,D.D., L.P.D.N., A.D.P. and F.C.; writing—review and editing, V.G.M., J.L., D.D., L.P.D.N., A.D.P. andF.C.; funding acquisition, V.G.M. and F.C. All authors have read and agreed to the published versionof the manuscript.
Funding: This research was funded by Italian Ministery of University and Research under theProject “PRIN 2017–Propulsori e sistemi avanzati per velivoli completamente elettrici”—Project code:PRIN_2017_MONOPOLI_(2017MS9F49)—CUP D94I19002250001—Project responsible Prof. VitoGiuseppe Monopoli.
Institutional Review Board Statement: Not applicable.
Informed Consent Statement: Not applicable.
Conflicts of Interest: The authors declare no conflict of interest.
References1. Gerada, D.; Mebarki, A.; Brown, N.L.; Gerada, C.; Cavagnino, A.; Boglietti, A. High-speed electrical machines: Technologies,
trends, and developments. IEEE Trans. Ind. Electron. 2014, 61, 2946–2958. [CrossRef]2. Bianchi, N.; Bolognani, S.; Luise, F. Potentials and limits of high- speed PM motors. IEEE Trans. Ind. Appl. 2004, 40, 1570–1578.
[CrossRef]3. Thomas, A.S.; Zhu, Z.Q.; Owen, R.L.; Jewell, G.W.; Howe, D. Multiphase flux-switching permanent-magnet brushless machine
for aerospace application. IEEE Trans. Ind. Appl. 2009, 45, 1971–1981. [CrossRef]4. Ballestín-Fuertes, J.; Muñoz-Cruzado-Alba, J.; Sanz-Osorio, J.F.; Laporta-Puyal, E. Role of Wide Bandgap Materials in Power
Electronics for Smart Grids Applications. Electronics 2021, 10, 677. [CrossRef]5. Millan, J.; Godignon, P.; Perpina, X.; Perez-Tomas, A.; Rebollo, J. A survey of wide bandgap power semiconductor devices. IEEE
Trans. Power Electron. 2014, 29, 2155–2163. [CrossRef]6. Hudgins, J.L. Wide and narrow bandgap semiconductors for power electronics: A new valuation. J. Electron. Mater. 2003, 32,
471–477. [CrossRef]7. Zhang, Z.; Wang, F.; Tolbert, L.M.; Blalock, B.J.; Costinett, D.J. Evaluation of switching performance of SiC devices in PWM
inverter-fed induction motor drives. IEEE Trans. Power Electron. 2015, 30, 5701–5711. [CrossRef]8. Zoeller, C.; Vogelsberger, M.A.; Wolbank, T.M.; Ertl, H. Impact of SiC semiconductors switching transition speed on insulation
health state monitoring of traction machines. IET Power Electron. 2016, 9, 2769–2775. [CrossRef]9. Haq, S.U.; Jayaram, S.H.; Cherney, E.A. Insulation problems in medium-voltage stator coils under fast repetitive voltage pulses.
IEEE Trans. Ind. Appl. 2008, 44, 1004–1012. [CrossRef]10. Grubic, S.; Aller, J.M.; Lu, B.; Habetler, T.G. A Survey of Testing and Monitoring Methods for Stator Insulation Systems in
Induction Machines. In Proceedings of the International Conference on Condition Monitoring and Diagnosis, Beijing, China,21–24 April 2008; pp. 4127–4136.
11. Warder, S.B.; Friedlander, E.; Arman, A.N. The influence of rectifier harmonics in a railway system on the dielectric stability of33-kV cables. Proc. IEEE–Part II Power Eng. 1951, 98, 399–411. [CrossRef]
12. Persson, E. Transient effects in application of PWM inverters to induction motors. IEEE Trans. Ind. Appl. 1992, 28, 1095–1101.[CrossRef]
13. Stone, G.C.; Culbert, I.; Boulter, E.A.; Dhirani, H. Electrical Insulation for Rotating Machines: Design, Evaluation, Aging, Testing, andRepair, 2th ed.; Wiley-IEEE Press: Piscataway, NJ, USA, 2014; pp. 49–54.
14. Culbert, I.; Dhirani, H.; Stone, G.C. Handbook to Assess the Insulation Condition of Large Rotating Machines; Electric Power ResearchInstitute: Palo Alto, CA, USA, 1989, Volume 16.
15. Stone, G.C.; Boulter, E.A.; Culbert, I.; Dhirani, H. Electrical Insulation for Rotating Machines: Design, Evaluation, Aging, Testing, andRepair; IEEE Press Series on Power Engineering; John Wiley and Sons: Hoboken, NJ, USA, 2004.
16. IEC Standard 60034-18-41; Rotating Electrical Machines—Part 18–41: Partial Discharge Free Electrical Insulation Systems (Type I)Used in Rotating Electrical Machines Fed From Voltage Converters—Qualification and Quality Control Tests. IEC: Geneva,Switzerland, 2019.
17. IEC Standard 60034-18-42; Rotating Electrical Machines—Part 18–42: Partial Discharge Resistant Electrical Insulation Systems(Type II) Used in Rotating Electrical Machines Fed from Voltage Converters—Qualification Tests. IEC: Geneva, Switzerland, 2014.
18. Tanaka, T. Internal partial discharge and material degradation. IEEE Trans. Dielectr. Electr. Insul. 1986, 21, 899–905. [CrossRef]19. Montanari, G.C. Bringing an insulation to failure: The role of space charge. IEEE Trans. Dielectr. Electr. Insul. 2011, 18, 339–364.
[CrossRef]20. Dissado, L.A. Understanding electrical trees in solids: From experiment to theory. IEEE Trans. Dielectr. Electr. Insul. 2002, 9,
483–497. [CrossRef]
Energies 2022, 15, 1406 28 of 30
21. IEEE Standard 100-2000; IEEE Standard Dictionary of Electrical and Electronics Terms. IEEE Standards Office: New York, NY,USA, 1997.
22. Bartnikas, R. Detection of PD (corona) in electrical apparatus. IEEE Trans. Elect. Insul. 1990, 25, 111–124. [CrossRef]23. Calvert, J.F. Protecting machines from line surges. Trans. Am. Inst. Elect. Eng. 1934, 53, 139–146. [CrossRef]24. Bartnikas, R. A commentary on PD measurement and detection. IEEE Trans. Elect. Insul. 1987, 22, 629–655. [CrossRef]25. Bartnikas, R. Partial Discharges: Their Mechanism, Detection and Measurement. IEEE Trans. Elect. Insul. 2002, 9, 763–808.
[CrossRef]26. Kreuger, F.H. Detection and Location of Discharges. Ph.D. Thesis, Delft University, Delft, The Netherlands, 1961.27. Kreuger, F.H.; Gulski, E.; Krivda, A. Classification of Partial Discharges. IEEE Trans. Electr. Insul. 1993, 28, 917–931. [CrossRef]28. Niemeyer, L. A Generalized Approach to Partial Discharge Modeling. IEEE Trans. Dielectr. Electr. Insul. 1995, 2, 510–528.
[CrossRef]29. Gutfleisch, F.; Niemeyer, L. Measurement and simulation of PD in epoxy voids. IEEE Trans. Dielectr. Electr. Insul. 1995, 2, 729–743.
[CrossRef]30. Gulski, E. Computer-Aided Recognition of Partial Dicharges Using Statistical Tools. Ph.D. Thesis, Delft University, Delft, The
Netherlands, 1991.31. Hirata, A.; Nakata, S.; Kawasaki, Z.-I. Toward Automatic Classification of Partial Discharge Sources with Neural Networks. IEEE
Trans. Power Deliv. 2006, 21, 526–527. [CrossRef]32. Cavallini, A.; Montanari, G.C.; Contin, A.; Pulletti, F. A new approach to the diagnosis of solid insulation systems based on PD
signal inference. IEEE Electr. Insul. 2003, 19, 23–30. [CrossRef]33. Gulski, E.; Krivda, A. Neural networks as a tool for recognition of partial discharges. IEEE Trans. Electr. Insul. 1993, 28, 984–1001.
[CrossRef]34. Pan, C.; Wu, K.; Gao, Y.; Florkowski, M. Understanding Partial Discharge Behavior from the Memory Effect Induced by Residual
Charges: A Review. IEEE Trans. Dielectr. Electr. Insul. 2020, 27, 1951–1965. [CrossRef]35. Vanbrunt, R.J.; Cernyar, E.W.; Vonglahn, P. Importance of unraveling memory propagation effects in interpreting data on partial
discharge statistics. IEEE Trans. Electr. Insul. 1993, 28, 905–916. [CrossRef]36. Montanari, G.C. Bringing an insulation to failure: The role of space charge. In Proceedings of the 2010 Annual Report Conference
on Electrical Insulation and Dielectric Phenomena, West Lafayette, IN, USA, 17–20 October 2010; pp. 1–25.37. Wu, K.; Pan, C.; Meng, Y.; Cheng, Y. Dynamic behavior of surface charge distribution during partial discharge sequences. IEEE
Trans. Dielectr. Electr. Insul. 2013, 20, 612–619.38. Florkowski, M.; Florkowska, B.; Kuniewski, M.; Zydron, P. Mapping of discharge channels in void creating effective partial
discharge area. IEEE Trans. Dielectr. Electr. Insul. 2018, 25, 2220–2228. [CrossRef]39. Wu, K.; Okamoto, T.; Suzuoki, Y. Effects of discharge area and surface conductivity on partial discharge behavior in voids under
square voltages. IEEE Trans. Dielectr. Electr. Insul. 2007, 14, 461–470. [CrossRef]40. Wu, K.; Suzuoki, Y.; Dissado, L.A. Improved simulation model for PD pattern in voidS considering effects of discharge area. In
Proceedings of the 2003 Annual Report Conference on Electrical Insulation and Dielectric Phenomena (CEIDP), Albuquerque,NM, USA, 19–22 October 2003; pp. 32–35.
41. Kaufhold, M.; Auinger, H.; Berth, M.; Speck, J.; Eberhardt, M. Electrical stress and failure mechanism of the winding insulation inPWM-inverterfed low-voltage induction motors. IEEE Trans. Ind. Electron. 2000, 47, 396–402. [CrossRef]
42. Biela, J.; Schweizer, M.; Waffler, S.; Kolar, J.W. SiC versus Si—Evaluation of potentials for performance improvement of inverterand DC–DC converter systems by SiC power semiconductors. IEEE Trans. Ind. Electron. 2011, 58, 2872–2882. [CrossRef]
43. Wheeler, J.C.G. Effects of converter pulses on the electrical insulation in low and medium voltage motors. IEEE Electr. Insul. 2005,21, 22–29. [CrossRef]
44. Hwang, D.H.; Lee, K.C.; Jeon, J.W.; Kim, Y.J.; Kim, M.H.; Kim, D.H. Analysis of voltage distribution in stator winding of IGBTPWM inverter-fed induction motors. In Proceedings of the IEEE International Symposium on Industrial Electronics (IEEE ISIE),Dubrovnik, Croatia, 20–23 June 2005; Volume 3, pp. 945–950.
45. Cavallini, A.; Fabiani, D.; Montanari, G.C. Power Electronics and Electrical Insulation Systems—Part 1: Phenomenology Overview.IEEE Electr. Insul. 2010, 26, 7–15. [CrossRef]
46. Melfi, M.; Sung, A.M.J.; Bell, S.; Skibinski, G.L. Effect of surge voltage risetime on the insulation of low-voltage machines fed byPWM converters. IEEE Trans. Ind. Appl. 1998, 34, 766–775. [CrossRef]
47. Petrarca, C.; Maffucci, A.; Tucci, V.; Vitelli, M. Analysis of the voltage distribution in a motor stator winding subjected tosteep-fronted surge voltages by means of a multiconductor lossy transmission line model. IEEE Trans. Energy Convers. 2004, 19,7–17. [CrossRef]
48. Kaufhold, M.; Borner, G.; Eberhardt, M.; Speck, J. Failure mechanism of the insulation of low voltage electric machines fed bypulse-controlled inverters. IEEE Electr. Insul. Mag. 1996, 12, 9–16. [CrossRef]
49. Hammarström, T. Multi-Rise Time PWM: A Way to Reduce PD Exposure in Motor Windings. IEEE Trans. Dielectr. Elect. Insul.2020, 27, 613–621. [CrossRef]
50. Yin, W. Failure Mechanism of Winding Insulation in Inverter-Fed Motors. IEEE Electr. Insul. Mag. 1997, 13, 18–23.51. Diab, M.; Zhou, M.; Emersic, C.; Yuan, X.; Cotton, I. Impact of PWM Voltage Waveforms on Magnet Wire Insulation Partial
Discharge in SiC-Based Motor Drives. IEEE Access 2021, 9, 156599–156612. [CrossRef]

Energies 2022, 15, 1406 29 of 30
52. Zoeller, C.; Vogelsberger, M.A.; Fasching, R.; Grubelnik, W.; Wolbank, T.M. Evaluation and current-response-based identificationof insulation degradation for high utilized electrical machines in railway application. IEEE Trans. Ind. Appl. 2017, 53, 2679–2689.[CrossRef]
53. Jensen, W.R.; Strangas, E.G.; Foster, S.N. A method for online stator insulation prognosis for inverter-drivenmachines. IEEE Trans.Ind. Appl. 2018, 54, 5897–5906. [CrossRef]
54. Yang, J.; Lee, S.B.; Yoo, J.; Lee, S.; Oh, Y.; Choi, C. A stator winding insulation condition monitoring technique for inverter-fedmachines. In Proceedings of the IEEE PESC, Cheju Island, Korea, 18–22 June 2006; pp. 1–7.
55. Yang, J.; Cho, J.; Lee, S.B.; Yoo, J.; Kim, H.D. An advanced stator winding insulation quality assessment technique for inverter-fedmachines. IEEE Trans. Ind. Appl. 2008, 44, 555–564. [CrossRef]
56. Stone, G.C.; Gupta, B.K.; Lyles, J.F.; Sedding, H.G. Experience with accelerated aging tests on stator bars and coils. In Proceedingsof the IEEE International Symposium on Electrical Insulation, Toronto, ON, Canada, 3–6 June 1990; pp. 356–360.
57. Farahani, M.; Gockenbach, E.; Borsi, H.; Schaefer, K.; Kaufhold, M. Behavior of machine insulation systems subjected toaccelerated thermal aging test. IEEE Trans. Dielect. Elect. Insul. 2010, 17, 1364–1372. [CrossRef]
58. Fernando, M.A.R.M.; Naranpanawa, W.M.L.B.; Rathnayake, R.M.H.M.; Jayantha, G.A. Condition assessment of stator insulationduring drying, wetting and electrical ageing. IEEE Trans. Dielect. Elect. Insul. 2013, 20, 2081–2090. [CrossRef]
59. Jeftenic, I.; Kartalovic, N.; Brajovic, D.; Loncar, B. Aging of stator coil interconductor insulation of high voltage asynchronousmotor. IEEE Trans. Dielect. Elect. Insul. 2018, 25, 352–359. [CrossRef]
60. Rumi, A.; Lusuardi, L.; Cavallini, A.; Pastura, M.; Barater, D.; Nuzzo, S. Partial Discharges in Electrical Machines for the MoreElectrical Aircraft. Part III: Preventing Partial Discharges. IEEE Access 2021, 9, 30113–30123. [CrossRef]
61. Foulon, N.; Lucas, J.; Barre, G.; Mailfert, R.; Enon, J. Investigation of the failure mechanism of insulation subjected to repetitive fastvoltage surges. In Proceedings of the Electrical Insulation Conference and Electrical Manufacturing and Coil Winding Conference,Rosemont, IL, USA, 25 September 1997; pp. 401–406.
62. Wang, P.; Cavallini, A. The influence of repetitive square wave voltage parameters on enameled wire endurance. IEEE Trans.Dielectr. Electr. Insul. 2014, 21, 1276–1284. [CrossRef]
63. Wang, P.; Cavallini, A.; Montanari, G.C. The influence of square wave voltage duty cycle on PD behavior. In Proceedings ofthe IEEE Conference on Electrical Insulation and Dielectric Phenomena (CEIDP), Ann Arbor, MI, USA, 18–21 October 2015;pp. 338–341.
64. Wang, P.; Cavallini, A.; Montanari, G.C. Characteristics of PD under square wave voltages and their influence on motor insulationendurance. IEEE Trans. Dielectr. Electr. Insul. 2015, 22, 3079–3086. [CrossRef]
65. NEMA Standards Publication No. MG 1-2016, Revision 1 (2018); National Electrical Manufacturers Association: Roslyn, VA, USA,2018.
66. IEEE Standard 1776-2008; IEEE Recommended Practice for Thermal Evaluation of Unsealed Or Sealed Insulation Systems for ACElectric Machinery Employing Form- Wound Pre-Insulated Stator Coils for Machines Rated 15 000 V and Below; IEEE: Piscataway,NJ, USA, 2009.
67. Fabbri, S.; D’Amato, D.; Palmieri, M.; Cupertino, F.; Nienhaus, M.; Grasso, E. Performance Comparison of Different EstimationTechniques of the External Load-torque applied on a PMSM using Direct Flux Control. In Proceedings of the InternationalSymposium on Power Electronics, Electrical Drives, Automation and Motion (SPEEDAM), Sorrento, Italy, 24–26 June 2020;pp. 688–693.
68. Younsi, K.; Neti, P.; Shah, M.; Zhou, J.Y.; Krahn, J.; Weeber, K. On-line Capacitance and Dissipation Factor Monitoring of ACStator Insulation. IEEE Trans. Dielectr. Electr. Insul. 2010, 17, 1441–1452. [CrossRef]
69. Grandi, G.; Casadei, D.; Reggiani, U. Equivalent circuit of mush wound AC windings for high frequency analysis. In Proceedingsof the ’97 P IEEE International Symposium on Industrial Electronics (ISIE), Guimaraes, Portugal, 7–11 July 1997; Volume 1,pp. SS201–SS206.
70. Grandi, G.; Casadei, D.; Reggiani, U. Common- and differential-mode HF current components in AC motors supplied by voltagesource inverters. IEEE Trans. Power Electron. 2004, 19, 16–24. [CrossRef]
71. Boglietti, A.; Carpaneto, E. Induction motor high frequency model. In Proceedings of the 1999 IEEE Industry Applications Con-ference. Thirty-Forth IAS Annual Meeting (Cat. No.99CH36370), Phoenix, AZ, USA, 3–7 October 1999; Volume 3, pp. 1551–1558.
72. Boglietti, A.; Carpaneto, E. An Accurate Induction Motor High-Frequency Model for Electromagnetic Compatibility Analysis.Electr. Power Components Syst. 2001, 29, 191–209.
73. Boglietti, A.; Cavagnino, A.; Lazzari, M. Experimental High-Frequency Parameter Identification of AC Electrical Motors. IEEETrans. Ind. Appl. 2007, 43, 23–29. [CrossRef]
74. Boglietti, A.; Carpaneto, E. An accurate high frequency model of AC PWM drive systems for EMC analysis. In Proceedings of the36th IEEE Industry Applications Conference, Chicago, IL, USA, 30 September–4 October 2001; Volume 2, pp. 1111–1117.
75. Moreira, A.F.; Lipo, T.A.; Venkataramanan, G.; Bernet, S. High-frequency modeling for cable and induction motor overvoltagestudies in long cable drives. IEEE Trans. Ind. Appl. 2002, 38, 1297–1306. [CrossRef]
76. Mirafzal, B.; Skibinski, G.L; Tallam, R.M; Schlegel, D.W.; Lukaszewski, R.A. Universal Induction Motor Model With Low-to-HighFrequency-Response Characteristics. IEEE Trans. Ind. Appl. 2007, 43, 1233–1246. [CrossRef]
77. Mirafzal, B.; Skibinski, G.L.; Tallam, R.M. Determination of Parameters in the Universal Induction Motor Model. IEEE Trans. Ind.Appl. 2009, 45, 142–151. [CrossRef]

Energies 2022, 15, 1406 30 of 30
78. Schinkel, M.; Weber, S.; Guttowski, S.; John, W.; Reichl, H. Efficient HF modeling and model parameterization of inductionmachines for time and frequency domain simulations. In Proceedings of the IEEE Twenty-First Annual Applied Power ElectronicsConference and Exposition APEC, Dallas, TX, USA, 19–23 March 2006; p. 6.
79. Wang, L.; Ho, C.N.M.; Canales, F.; Jatskevich, J. High-Frequency Modeling of the Long-Cable-Fed Induction Motor Drive SystemUsing TLM Approach for Predicting Overvoltage Transients. IEEE Trans. Power Electron. 2010, 25, 2653–2664. [CrossRef]
80. Degano, M.; Zanchetta, P.; Empringham, L.; Lavopa, E.; Clare, J. HF induction motor modeling using automated experimentalimpedance measurement matching.IEEE Trans. Ind. Electron. 2012, 59, 3789–3796. [CrossRef]
81. Vidmar, G.; Miljavec, D. A Universal High-Frequency Three-Phase Electric-Motor Model Suitable for the Delta- and Star-WindingConnections. IEEE Trans. Power Electron. 2015, 30, 4365–4376. [CrossRef]
82. Wu, Y.; Bi, C.; Jia, K.; Jin, D.; Li, H.; Yao, W.; Liu, G. High-frequency modelling of permanent magnet synchronous motor with starconnection. IET Electr. Power Appl. 2018, 12, 539–546. [CrossRef]
83. Neti, P.; Grubic, S. Online Broadband Insulation Spectroscopy of Induction Machines Using Signal Injection. IEEE Trans. Ind.Appl. 2017, 53, 1054–1062. [CrossRef]
84. Zheng, D.; Lu, G.; Zhang, P. A Noninvasive Interturn Insulation Condition Monitoring Method Based on the Common-ModeImpedance Spectrum of Inverter-Fed Machines. IEEE Trans. Ind. Appl. 2021, 57, 4786–4795. [CrossRef]
85. Ryu, Y.; Park, B.; Han, K.J. Estimation of High-Frequency Parameters of AC Machine From Transmission Line Model. IEEE Trans.Magn. 2015, 51, 1–4. [CrossRef]