Impact of noise related waveforms on long term field leakage current measurements
8
Impact of Noise Related Waveforms on Long Term Field Leakage Current Measurements Dionisios Pylarinos High Voltage Lab, Department of Electrical and Computer Engineering, University Of Patras, 26504, Rio, Patras, Greece Kiriakos Siderakis Electrical Engineering Dept., School of Applied Technology, Technological Educational Institute of Crete, P.O.Box 1939, GR. 71 004, Heraklion, Greece Eleftheria Pyrgioti High Voltage Lab, Department of Electrical and Computer Engineering, University Of Patras, 26504, Rio, Patras, Greece Emmanuel Thalassinakis, Public Power Corporation (P.P.C), Terma Kastorias Str, Katsambas, 71307, Heraklion, Greece and Isidoros Vitellas Public Power Corporation (P.P.C), 27 Patision Str, Athens, 10432, Greece ABSTRACT Leakage current (LC) monitoring is widely employed in order to investigate electrical surface activity on high voltage (HV) insulators. Long term field monitoring is required in order to obtain an actual view of the phenomena. Therefore any monitoring system is bound to encounter data size problems. A number of solutions have been proposed to address this problem by extracting different values from the measured waveforms as a performance indication. However, a parameter that is fully representative of the waveform is yet to be determined. Hence, measuring and storing of the actual LC waveform is still required on sites for research and monitoring purposes. In addition, field related noise can result to misinterpretation of the actual activity. In this paper, a number of 26089 waveforms, recorded in a 150 kV Substation on four different post insulators that are part of the grid, are investigated. The monitoring period exceeded six years. Different techniques are applied and evaluated on the data set, employing simple numeric criteria and more advanced techniques such as Fourier and Wavelet analysis. Results are presented towards addressing the problems of noise and data size. The study objective is the incorporation of the results in improved leakage current monitoring systems. Index Terms — Leakage current, signal, noise, monitoring, Fourier transforms, wavelet transforms 1 INTRODUCTION LEAKAGE Current (LC) is a widely applied tool for the monitoring of the electrical phenomena, experienced on outdoor insulators. Different types of insulators can be continuously and simultaneously monitored, through LC monitoring, both in laboratory and field conditions. The shape of the LC waveform is correlated with different types of electrical activity, from low intensity corona discharges up to dry band arcing and flashovers. Field measurements provide the most accurate view of the insulation’s performance and the corresponding electrical activity, considering that surface activity is strongly correlated to the accumulation and distribution of pollutants on the insulators’ surface and certain environmental conditions. However, there are two issues of Manuscript received on 19 May 2010, in final form 8 October 2010.
-
Upload
independent -
Category
Documents
-
view
0 -
download
0
Transcript of Impact of noise related waveforms on long term field leakage current measurements

Impact of Noise Related Waveforms on Long Term Field Leakage Current Measurements
Dionisios Pylarinos
High Voltage Lab, Department of Electrical and Computer Engineering, University Of Patras, 26504, Rio, Patras, Greece
Kiriakos Siderakis
Electrical Engineering Dept., School of Applied Technology, Technological Educational Institute of Crete, P.O.Box 1939, GR. 71 004, Heraklion, Greece
Eleftheria Pyrgioti
High Voltage Lab, Department of Electrical and Computer Engineering, University Of Patras, 26504, Rio, Patras, Greece
Emmanuel Thalassinakis,
Public Power Corporation (P.P.C), Terma Kastorias Str, Katsambas, 71307, Heraklion, Greece
and Isidoros Vitellas
Public Power Corporation (P.P.C), 27 Patision Str, Athens, 10432, Greece
ABSTRACT
Leakage current (LC) monitoring is widely employed in order to investigate electrical surface activity on high voltage (HV) insulators. Long term field monitoring is required in order to obtain an actual view of the phenomena. Therefore any monitoring system is bound to encounter data size problems. A number of solutions have been proposed to address this problem by extracting different values from the measured waveforms as a performance indication. However, a parameter that is fully representative of the waveform is yet to be determined. Hence, measuring and storing of the actual LC waveform is still required on sites for research and monitoring purposes. In addition, field related noise can result to misinterpretation of the actual activity. In this paper, a number of 26089 waveforms, recorded in a 150 kV Substation on four different post insulators that are part of the grid, are investigated. The monitoring period exceeded six years. Different techniques are applied and evaluated on the data set, employing simple numeric criteria and more advanced techniques such as Fourier and Wavelet analysis. Results are presented towards addressing the problems of noise and data size. The study objective is the incorporation of the results in improved leakage current monitoring systems.
Index Terms — Leakage current, signal, noise, monitoring, Fourier transforms, wavelet transforms
1 INTRODUCTION
LEAKAGE Current (LC) is a widely applied tool for the monitoring of the electrical phenomena, experienced on outdoor insulators. Different types of insulators can be continuously and simultaneously monitored, through LC monitoring, both in laboratory and field conditions. The shape
of the LC waveform is correlated with different types of electrical activity, from low intensity corona discharges up to dry band arcing and flashovers. Field measurements provide the most accurate view of the insulation’s performance and the corresponding electrical activity, considering that surface activity is strongly correlated to the accumulation and distribution of pollutants on the insulators’ surface and certain environmental conditions. However, there are two issues of
Manuscript received on 19 May 2010, in final form 8 October 2010.
concern regarding field monitoring: the data size problem and the influence of field noise.
Long term monitoring is required in the field, since the period of electrical activity cannot be reliably predicted. In addition, the study of the surface phenomena requires the measurement and storage of the exact leakage current waveform, which results to the accumulation of vast amounts of data. Further, field conditions exaggerate the noise factor resulting either to isolated noise generated current peaks or waveforms that do not reflect actual activity.
In order to address the data size problem, the extraction of several values from the LC waveform has been suggested. The peak value of leakage current is a parameter that has been widely employed, either as a single criterion [1,2] or in combination with parameters such as the cumulative charge [3,4,5], the number of LC pulses that exceed certain thresholds [3,4] and the frequency content [6, 7]. Parameters calculated from the waveform such as differential values [8, 9], time variation [10], the average LC value combined with PD measurements [11], the onset time and the distortion level [5] and characteristics of V-I curves [3] have also been considered in order to estimate the activity level. Advanced signal analysis techniques such as the level crossing analysis of LC envelope [12, 13], frequency and harmonic content [1, 3, 6, 7, 8, 10, 14, 16], wavelets analysis in combination with pattern recognition techniques [17, 18] and neural networks [9, 19] have also been employed. However, it is not yet possible to define an extracted value that can be fully representative of the waveform shape. In addition, research has been targeted on waveforms that are portraying actual electrical activity, and the impact of field noise has not yet been evaluated.
In this paper, a number of 26089 LC waveforms, recorded on four different insulators in a 150 kV Substation during a period exceeding six years, have been investigated. Field related noise and its impact on data are investigated. Several different techniques, from simple numeric criteria to Fourier and Wavelet transform, are employed on the data set and results are presented towards addressing the noise and data size problems. The study objective is to incorporate the results in the development of an improved field leakage current monitoring system.
2 EXPERIMENTAL SET UP
The leakage current measurements investigated in this paper have been performed in a 150 kV Substation, of the Transmission System of Crete, in Greece. The measurements site suffers from intense pollution due to its proximity to the sea coast (< 200 m). Therefore the Greek Public Power Corporation (P.P.C.) has employed the use of composite and RTV SIR coatings which now cover 100% of the substation’s insulation [20].
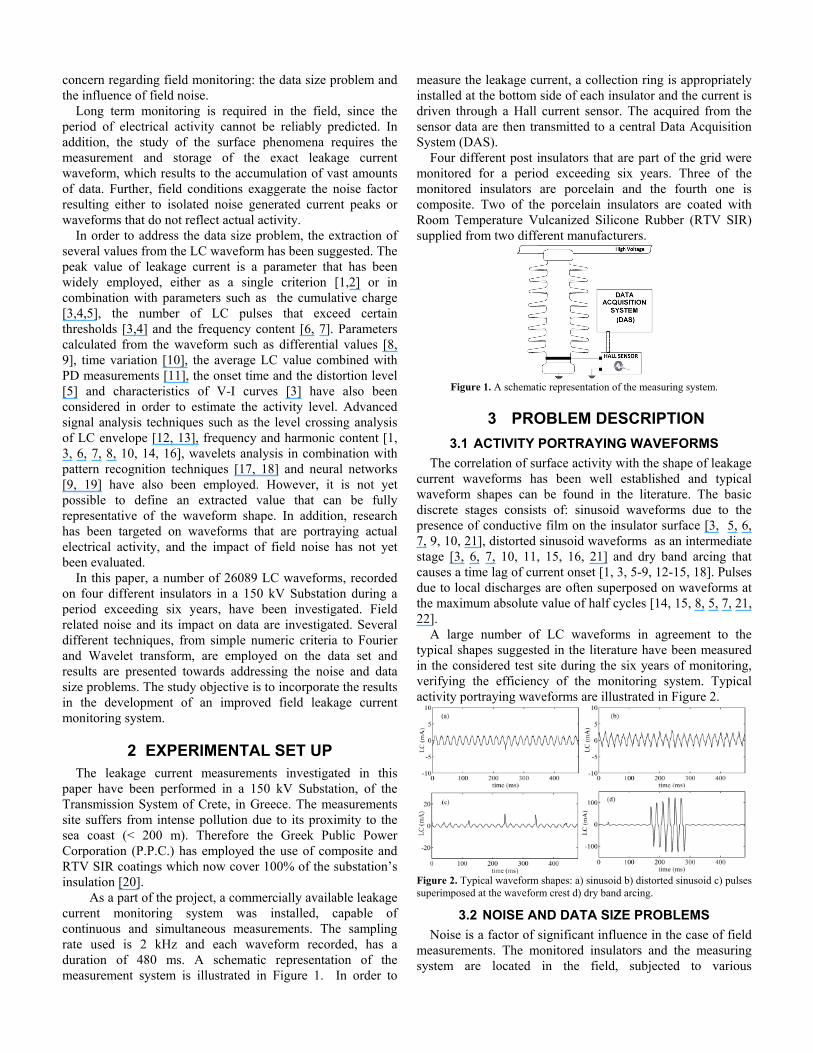
As a part of the project, a commercially available leakage current monitoring system was installed, capable of continuous and simultaneous measurements. The sampling rate used is 2 kHz and each waveform recorded, has a duration of 480 ms. A schematic representation of the measurement system is illustrated in Figure 1. In order to
measure the leakage current, a collection ring is appropriately installed at the bottom side of each insulator and the current is driven through a Hall current sensor. The acquired from the sensor data are then transmitted to a central Data Acquisition System (DAS).
Four different post insulators that are part of the grid were monitored for a period exceeding six years. Three of the monitored insulators are porcelain and the fourth one is composite. Two of the porcelain insulators are coated with Room Temperature Vulcanized Silicone Rubber (RTV SIR) supplied from two different manufacturers.
Figure 1. A schematic representation of the measuring system.
3 PROBLEM DESCRIPTION
3.1 ACTIVITY PORTRAYING WAVEFORMS
The correlation of surface activity with the shape of leakage current waveforms has been well established and typical waveform shapes can be found in the literature. The basic discrete stages consists of: sinusoid waveforms due to the presence of conductive film on the insulator surface [3, 5, 6, 7, 9, 10, 21], distorted sinusoid waveforms as an intermediate stage [3, 6, 7, 10, 11, 15, 16, 21] and dry band arcing that causes a time lag of current onset [1, 3, 5-9, 12-15, 18]. Pulses due to local discharges are often superposed on waveforms at the maximum absolute value of half cycles [14, 15, 8, 5, 7, 21, 22].
A large number of LC waveforms in agreement to the typical shapes suggested in the literature have been measured in the considered test site during the six years of monitoring, verifying the efficiency of the monitoring system. Typical activity portraying waveforms are illustrated in Figure 2.
Figure 2. Typical waveform shapes: a) sinusoid b) distorted sinusoid c) pulses superimposed at the waveform crest d) dry band arcing.
3.2 NOISE AND DATA SIZE PROBLEMS
Noise is a factor of significant influence in the case of field measurements. The monitored insulators and the measuring system are located in the field, subjected to various
environmental factors, high voltage stress and several electrical events occurring during the operation of a HV substation (switching of heavy loads, opening and closing of switches etc). Further, since monitored insulators are part of the grid, access to the measuring system is limited and sensor or cable faults cannot be immediately addressed.
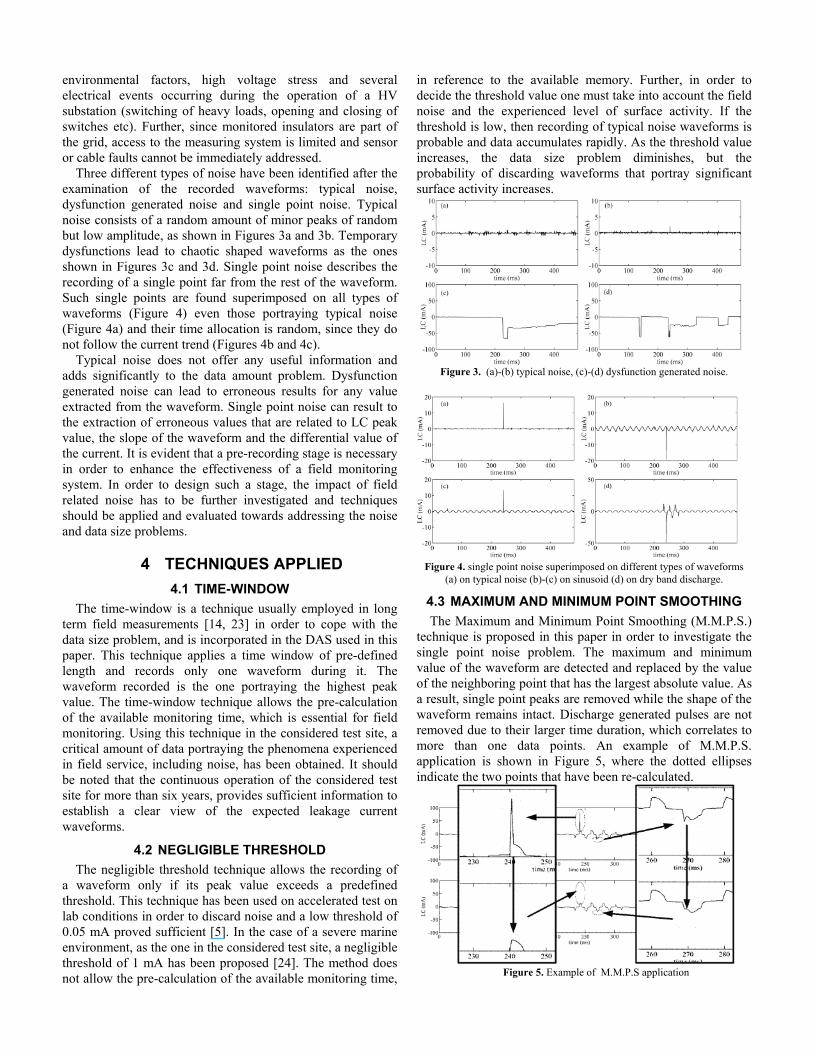
Three different types of noise have been identified after the examination of the recorded waveforms: typical noise, dysfunction generated noise and single point noise. Typical noise consists of a random amount of minor peaks of random but low amplitude, as shown in Figures 3a and 3b. Temporary dysfunctions lead to chaotic shaped waveforms as the ones shown in Figures 3c and 3d. Single point noise describes the recording of a single point far from the rest of the waveform. Such single points are found superimposed on all types of waveforms (Figure 4) even those portraying typical noise (Figure 4a) and their time allocation is random, since they do not follow the current trend (Figures 4b and 4c).
Typical noise does not offer any useful information and adds significantly to the data amount problem. Dysfunction generated noise can lead to erroneous results for any value extracted from the waveform. Single point noise can result to the extraction of erroneous values that are related to LC peak value, the slope of the waveform and the differential value of the current. It is evident that a pre-recording stage is necessary in order to enhance the effectiveness of a field monitoring system. In order to design such a stage, the impact of field related noise has to be further investigated and techniques should be applied and evaluated towards addressing the noise and data size problems.
4 TECHNIQUES APPLIED
4.1 TIME-WINDOW
The time-window is a technique usually employed in long term field measurements [14, 23] in order to cope with the data size problem, and is incorporated in the DAS used in this paper. This technique applies a time window of pre-defined length and records only one waveform during it. The waveform recorded is the one portraying the highest peak value. The time-window technique allows the pre-calculation of the available monitoring time, which is essential for field monitoring. Using this technique in the considered test site, a critical amount of data portraying the phenomena experienced in field service, including noise, has been obtained. It should be noted that the continuous operation of the considered test site for more than six years, provides sufficient information to establish a clear view of the expected leakage current waveforms.
4.2 NEGLIGIBLE THRESHOLD
The negligible threshold technique allows the recording of a waveform only if its peak value exceeds a predefined threshold. This technique has been used on accelerated test on lab conditions in order to discard noise and a low threshold of 0.05 mA proved sufficient [5]. In the case of a severe marine environment, as the one in the considered test site, a negligible threshold of 1 mA has been proposed [24]. The method does not allow the pre-calculation of the available monitoring time,
in reference to the available memory. Further, in order to decide the threshold value one must take into account the field noise and the experienced level of surface activity. If the threshold is low, then recording of typical noise waveforms is probable and data accumulates rapidly. As the threshold value increases, the data size problem diminishes, but the probability of discarding waveforms that portray significant surface activity increases.
Figure 3. (a)-(b) typical noise, (c)-(d) dysfunction generated noise.
Figure 4. single point noise superimposed on different types of waveforms
(a) on typical noise (b)-(c) on sinusoid (d) on dry band discharge.
4.3 MAXIMUM AND MINIMUM POINT SMOOTHING
The Maximum and Minimum Point Smoothing (M.M.P.S.) technique is proposed in this paper in order to investigate the single point noise problem. The maximum and minimum value of the waveform are detected and replaced by the value of the neighboring point that has the largest absolute value. As a result, single point peaks are removed while the shape of the waveform remains intact. Discharge generated pulses are not removed due to their larger time duration, which correlates to more than one data points. An example of M.M.P.S. application is shown in Figure 5, where the dotted ellipses indicate the two points that have been re-calculated.
Figure 5. Example of M.M.P.S application
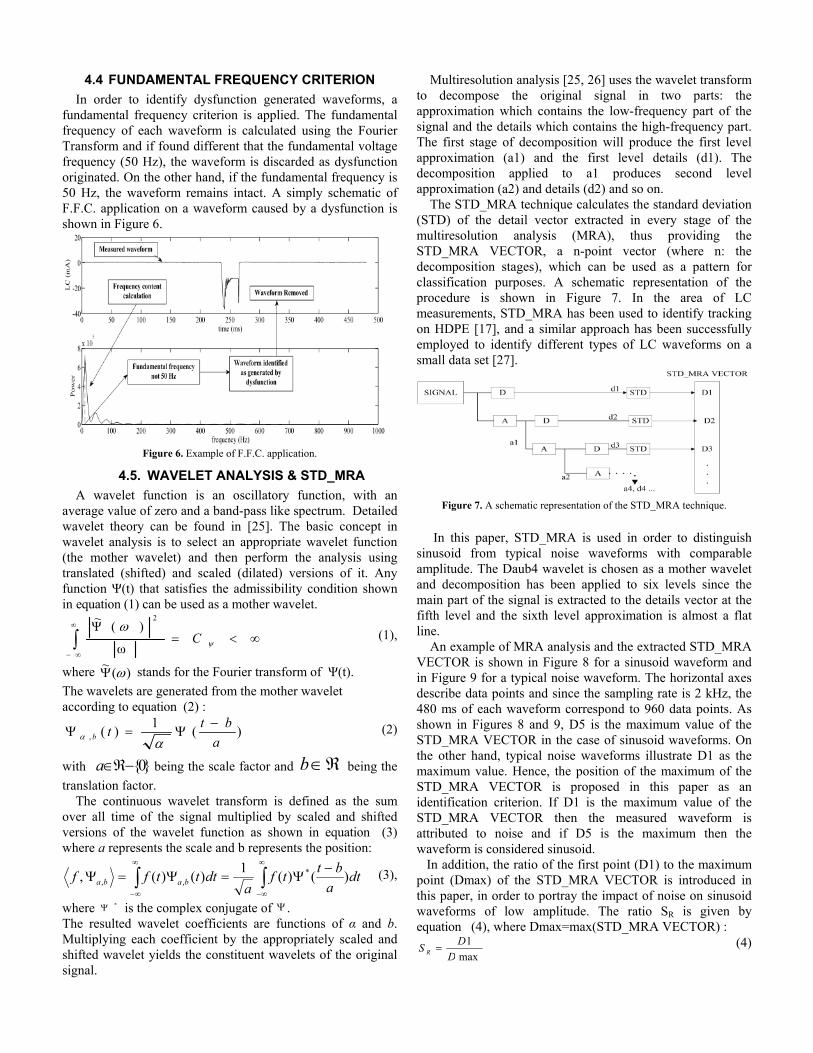
4.4 FUNDAMENTAL FREQUENCY CRITERION
In order to identify dysfunction generated waveforms, a fundamental frequency criterion is applied. The fundamental frequency of each waveform is calculated using the Fourier Transform and if found different that the fundamental voltage frequency (50 Hz), the waveform is discarded as dysfunction originated. On the other hand, if the fundamental frequency is 50 Hz, the waveform remains intact. A simply schematic of F.F.C. application on a waveform caused by a dysfunction is shown in Figure 6.
Figure 6. Example of F.F.C. application.
4.5. WAVELET ANALYSIS & STD_MRA
A wavelet function is an oscillatory function, with an average value of zero and a band-pass like spectrum. Detailed wavelet theory can be found in [25]. The basic concept in wavelet analysis is to select an appropriate wavelet function (the mother wavelet) and then perform the analysis using translated (shifted) and scaled (dilated) versions of it. Any function Ψ(t) that satisfies the admissibility condition shown in equation (1) can be used as a mother wavelet.
C
ω
)(Ψ~ 2
(1),
where )(~ stands for the Fourier transform of Ψ(t).
The wavelets are generated from the mother wavelet according to equation (2) :
)(1
)(, a
bttb
(2)
with being the scale factor and being the
translation factor.
}0{a b
The continuous wavelet transform is defined as the sum over all time of the signal multiplied by scaled and shifted versions of the wavelet function as shown in equation (3) where a represents the scale and b represents the position:
dta
bttf
adtttff baba )()(
1)()(, *
,,
(3),
where is the complex conjugate of . *
The resulted wavelet coefficients are functions of α and b. Multiplying each coefficient by the appropriately scaled and shifted wavelet yields the constituent wavelets of the original signal.
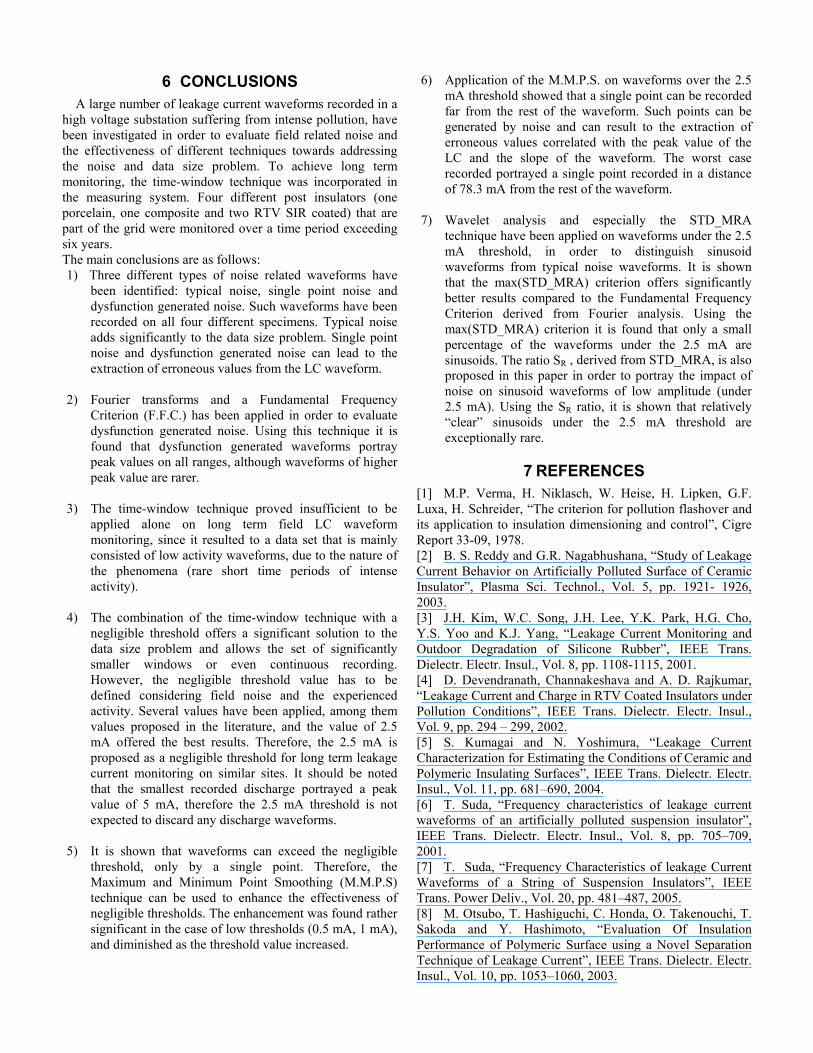
Multiresolution analysis [25, 26] uses the wavelet transform to decompose the original signal in two parts: the approximation which contains the low-frequency part of the signal and the details which contains the high-frequency part. The first stage of decomposition will produce the first level approximation (a1) and the first level details (d1). The decomposition applied to a1 produces second level approximation (a2) and details (d2) and so on.
The STD_MRA technique calculates the standard deviation (STD) of the detail vector extracted in every stage of the multiresolution analysis (MRA), thus providing the STD_MRA VECTOR, a n-point vector (where n: the decomposition stages), which can be used as a pattern for classification purposes. A schematic representation of the procedure is shown in Figure 7. In the area of LC measurements, STD_MRA has been used to identify tracking on HDPE [17], and a similar approach has been successfully employed to identify different types of LC waveforms on a small data set [27].
Figure 7. A schematic representation of the STD_MRA technique.
In this paper, STD_MRA is used in order to distinguish sinusoid from typical noise waveforms with comparable amplitude. The Daub4 wavelet is chosen as a mother wavelet and decomposition has been applied to six levels since the main part of the signal is extracted to the details vector at the fifth level and the sixth level approximation is almost a flat line.
An example of MRA analysis and the extracted STD_MRA VECTOR is shown in Figure 8 for a sinusoid waveform and in Figure 9 for a typical noise waveform. The horizontal axes describe data points and since the sampling rate is 2 kHz, the 480 ms of each waveform correspond to 960 data points. As shown in Figures 8 and 9, D5 is the maximum value of the STD_MRA VECTOR in the case of sinusoid waveforms. On the other hand, typical noise waveforms illustrate D1 as the maximum value. Hence, the position of the maximum of the STD_MRA VECTOR is proposed in this paper as an identification criterion. If D1 is the maximum value of the STD_MRA VECTOR then the measured waveform is attributed to noise and if D5 is the maximum then the waveform is considered sinusoid. In addition, the ratio of the first point (D1) to the maximum point (Dmax) of the STD_MRA VECTOR is introduced in this paper, in order to portray the impact of noise on sinusoid waveforms of low amplitude. The ratio SR is given by equation (4), where Dmax=max(STD_MRA VECTOR) :
max
1
D
DS R (4)

A high SR value means that noise is comparable to the sinusoid part. A low SR shows a low impact of noise which corresponds to a clear and more evident sinusoid part as shown in Figure 10.
Figure 8. STD_MRA applied on a sinusoid waveform.
Figure 9. STD_MRA applied on typical noise waveform.
Figure 10. Waveforms with various SR
5 RESULTS AND DISCUSSION
The original set of data has been recorded using the time-window technique. As shown in Figure 11, the time-window technique results to a data set that is mainly consisted of low activity waveforms. Especially in the case of the composite and the two RTV coated specimens, over 90% of the recorded waveforms illustrate a peak value lower than 1.5 mA. Therefore, time window technique is insufficient to be applied alone on long term field measurements due to the nature of the phenomena (rare short time periods of intense activity). The
combination of the time-window technique with a negligible threshold is able to discard a large percentage of waveforms, offering a significant improvement to the data accumulation problem. As a result, much smaller time-windows or even continuous recording can be applied.
The lower negligible threshold applied is 0.5 mA, just over the typical noise area and is proved insufficient. The value of 1 mA, proposed for similar field conditions, is also proved insufficient, in three out of four monitored insulators. As the threshold value increases, the number of discarded waveforms increases, including an increased number of sinusoid waveforms. Sinusoid waveforms correlate to, rather common low activity and the recording of their shape does not have any research interest. On the contrary, at higher activity levels, the shape of the waveform is required since, due to the presence of discharges, their form varies. Therefore it is important that the selected threshold does not discard discharge waveforms. The smallest recorded discharge portrayed a peak value of 5 mA. Therefore, the higher threshold applied is 2.5 mA, in order to minimize the possibility of discarding any discharge waveforms. In addition, the 2.5 mA threshold offers the best results towards addressing the data size problem and therefore it is proposed in this paper as the negligible threshold.
Figure 11. Waveforms Discarded by Different Thresholds and M.M.P.S.
The waveforms discarded with the application of the 2.5
mA threshold, are further investigated and results are shown in Figure 12. Applying the F.F.C. technique shows that in the case of the COMPOSITE insulator almost all of the waveforms under the threshold have a 50Hz fundamental (only 0.16% of them is discarded), while for the rest of the specimens the discard percentage is notably higher (31.2% for RTV1, 43.37% for PORCELAIN and 57.52% for RTV2). The number of discarded waveforms rises when the max(STD_MRA) criterion is used as shown in Figure 12 (the max(STD_MRA) criterion results to discarding waveforms that have max(STD_MRA)=D1 which means that SR=1).
The application of the max(STD_MRA) criterion results to a moderate increase of the discard percentage in the case of the PORCELAIN insulator (rises to 50.38%), and to a larger increase in the cases of RTV1 (rises to 76.5%) and RTV2 (rises to 91.47%) insulators. In the case of the COMPOSITE insulator the increase is rather exceptional (from 0.16% rises

to 99.1%). Therefore, it is shown that the max(STD_MRA) criterion offers a significant improvement, compared to the F.F.C., towards distinguishing between sinusoids and typical noise waveforms of similar amplitude. Further, it is shown that the waveforms discarded when applying a 2.5 mA negligible threshold are mainly typical noise waveforms with only a small percentage of them being sinusoids.
As illustrated in Figure 12, as the SR ratio decreases, the discard percentage increases. That means that sinusoids that have a low noise influence represent an even smaller percentage. For example if an SR value of 0.3 is selected then the discharge percentage rises to 64.66% for the PORCELAIN insulator, 99.97% for the COMPOSITE insulator, 96.71% for the RTV1 insulator and 99.1% for the RTV2 insulator. Therefore, it is shown that relatively “clear” sinusoids represent an exceptionally small percentage of the waveforms under the 2.5 mA (35.34% for the PORCELAIN, 0.03% for the COMPOSITE, 3.29% for the RTV1 and 0.9% for the RTV2 insulator). It should be noted that the significantly lower discard percentage in the case of the PORCELAIN insulator and the high percentage of sinusoids under the 2.5 mA threshold, can be attributed to the hydrophilic surface of porcelain which favors the forming of conductive film and therefore the appearance of resistive sinusoid leakage current.
Figure 12. Investigation of waveforms under the 2.5 mA threshold.
The M.M.P.S. technique enhances the effectiveness of the negligible threshold, especially when lower (0.5 and 1 mA) thresholds are applied, as shown in Figure 11. The significant increase of the discard percentage for the 1 mA threshold, after the M.M.P.S. application, in three out of four specimens (PORCELAIN, RTV1, RTV2) demonstrates an added flaw of the 1 mA threshold, since a large percentage of waveforms exceeded it by just a single point. On the contrary, the 2.5 mA threshold is not significantly affected by the M.M.P.S. which is an added reason that the 2.5 mA is proposed as the negligible threshold.
Single point noise, besides diminishing the effectiveness of the negligible threshold, can cause the appearance of high peak values. In order to investigate the influence of single point noise on waveforms over the threshold, the peak value difference after the application of M.M.P.S. is calculated and results are presented in Figure 13. A large percentage of the waveforms over the negligible threshold show a decrease of
peak value larger than 2.5 mA after the application of M.M.P.S. (34.53% for the PORCELAIN insulator, 51.85% for the COMPOSITE, 48.95% for RTV1 and 44.98% for RTV2). Most of these waveforms exhibit a decrease between 2.5 mA and 10 mA on all four specimens. However, larger differences have also been recorded as shown in Figure 13. The largest difference was recorded on RTV2 and it was 78.3 mA. Therefore, it is shown that single point noise can result to a peak value that is exceptionally higher than the rest of the waveform. It should be noted that the time-window technique has been applied in order to record the investigated waveforms. That means that an error to the recording of a single point during the whole time window (e.g. a day), can result to the highest peak value in the time window. Therefore, the waveform that includes that point will finally be recorded resulting to a waveform suffering from single point noise.
As far as the dysfunction generated noise is concerned, the results of the F.F.C. application are presented in Figure 14, where the number of waveforms versus the peak value range is illustrated, for waveforms that pass and do not pass the F.F.C. Results show that dysfunction generated waveforms are recorded on all specimens and can exhibit various peak values. However, higher peak values are rarer than lower ones. Further, the number of dysfunction generated waveforms can be significant and even larger than that of the activity portraying waveforms (case of RTV2), and they can exhibit significant higher peak values than the activity waveforms recorded (case of RTV1).
Figure 13. Peak Value Difference after applying M.M.P.S.
Figure 14. Results of the F.F.C. application.
6 CONCLUSIONS
A large number of leakage current waveforms recorded in a high voltage substation suffering from intense pollution, have been investigated in order to evaluate field related noise and the effectiveness of different techniques towards addressing the noise and data size problem. To achieve long term monitoring, the time-window technique was incorporated in the measuring system. Four different post insulators (one porcelain, one composite and two RTV SIR coated) that are part of the grid were monitored over a time period exceeding six years. The main conclusions are as follows: 1) Three different types of noise related waveforms have
been identified: typical noise, single point noise and dysfunction generated noise. Such waveforms have been recorded on all four different specimens. Typical noise adds significantly to the data size problem. Single point noise and dysfunction generated noise can lead to the extraction of erroneous values from the LC waveform.
2) Fourier transforms and a Fundamental Frequency Criterion (F.F.C.) has been applied in order to evaluate dysfunction generated noise. Using this technique it is found that dysfunction generated waveforms portray peak values on all ranges, although waveforms of higher peak value are rarer.
3) The time-window technique proved insufficient to be
applied alone on long term field LC waveform monitoring, since it resulted to a data set that is mainly consisted of low activity waveforms, due to the nature of the phenomena (rare short time periods of intense activity).
4) The combination of the time-window technique with a
negligible threshold offers a significant solution to the data size problem and allows the set of significantly smaller windows or even continuous recording. However, the negligible threshold value has to be defined considering field noise and the experienced activity. Several values have been applied, among them values proposed in the literature, and the value of 2.5 mA offered the best results. Therefore, the 2.5 mA is proposed as a negligible threshold for long term leakage current monitoring on similar sites. It should be noted that the smallest recorded discharge portrayed a peak value of 5 mA, therefore the 2.5 mA threshold is not expected to discard any discharge waveforms.
5) It is shown that waveforms can exceed the negligible
threshold, only by a single point. Therefore, the Maximum and Minimum Point Smoothing (M.M.P.S) technique can be used to enhance the effectiveness of negligible thresholds. The enhancement was found rather significant in the case of low thresholds (0.5 mA, 1 mA), and diminished as the threshold value increased.
6) Application of the M.M.P.S. on waveforms over the 2.5 mA threshold showed that a single point can be recorded far from the rest of the waveform. Such points can be generated by noise and can result to the extraction of erroneous values correlated with the peak value of the LC and the slope of the waveform. The worst case recorded portrayed a single point recorded in a distance of 78.3 mA from the rest of the waveform.
7) Wavelet analysis and especially the STD_MRA technique have been applied on waveforms under the 2.5 mA threshold, in order to distinguish sinusoid waveforms from typical noise waveforms. It is shown that the max(STD_MRA) criterion offers significantly better results compared to the Fundamental Frequency Criterion derived from Fourier analysis. Using the max(STD_MRA) criterion it is found that only a small percentage of the waveforms under the 2.5 mA are sinusoids. The ratio SR , derived from STD_MRA, is also proposed in this paper in order to portray the impact of noise on sinusoid waveforms of low amplitude (under 2.5 mA). Using the SR ratio, it is shown that relatively “clear” sinusoids under the 2.5 mA threshold are exceptionally rare.
7 REFERENCES [1] M.P. Verma, H. Niklasch, W. Heise, H. Lipken, G.F. Luxa, H. Schreider, “The criterion for pollution flashover and its application to insulation dimensioning and control”, Cigre Report 33-09, 1978. [2] B. S. Reddy and G.R. Nagabhushana, “Study of Leakage Current Behavior on Artificially Polluted Surface of Ceramic Insulator”, Plasma Sci. Technol., Vol. 5, pp. 1921- 1926, 2003. [3] J.H. Kim, W.C. Song, J.H. Lee, Y.K. Park, H.G. Cho, Y.S. Yoo and K.J. Yang, “Leakage Current Monitoring and Outdoor Degradation of Silicone Rubber”, IEEE Trans. Dielectr. Electr. Insul., Vol. 8, pp. 1108-1115, 2001. [4] D. Devendranath, Channakeshava and A. D. Rajkumar, “Leakage Current and Charge in RTV Coated Insulators under Pollution Conditions”, IEEE Trans. Dielectr. Electr. Insul., Vol. 9, pp. 294 – 299, 2002. [5] S. Kumagai and N. Yoshimura, “Leakage Current Characterization for Estimating the Conditions of Ceramic and Polymeric Insulating Surfaces”, IEEE Trans. Dielectr. Electr. Insul., Vol. 11, pp. 681–690, 2004. [6] T. Suda, “Frequency characteristics of leakage current waveforms of an artificially polluted suspension insulator”, IEEE Trans. Dielectr. Electr. Insul., Vol. 8, pp. 705–709, 2001. [7] T. Suda, “Frequency Characteristics of leakage Current Waveforms of a String of Suspension Insulators”, IEEE Trans. Power Deliv., Vol. 20, pp. 481–487, 2005. [8] M. Otsubo, T. Hashiguchi, C. Honda, O. Takenouchi, T. Sakoda and Y. Hashimoto, “Evaluation Of Insulation Performance of Polymeric Surface using a Novel Separation Technique of Leakage Current”, IEEE Trans. Dielectr. Electr. Insul., Vol. 10, pp. 1053–1060, 2003.
[9] A.H. El-Hag, A.N. Jahromi and M. Sanaye-Pasand, “Prediction of Leakage Current of Non-ceramic Insulators in Early Aging Period”, Electr. Power Syst. Res., Vol. 78, pp. 1686-1692, 2008. [10] M.A.R.M. Fernando and S.M. Gubanski, “Leakage current patterns on contaminated polymeric surfaces”, IEEE Trans. Dielectr. Electr. Insul., Vol. 69, pp. 688–694, 1999. [11] I.J.S. Lopes, S.H. Jayaram and E.A. Cherney, “A Method For Detecting The Transition from Corona from Water Droplets to Dry-Band Arcing on Silicone Rubber Insulators”, IEEE Trans. Dielectr. Electr. Insul., Vol. 9, pp. 964–971, 2002. [12] F. Amarth, G.G. Karady and R. Sundararajan, “Level Crossing Analysis of Leakage Current Envelope Of Polluted Insulators”, IEEE Power Eng. Rev., Vol. 21, No. 8, pp. 4-5, 2001. [13] F. Amarth, G.G. Karady and R. Sundararajan, “Linear Stochastic Analysis of Polluted Insulator Leakage Current”, IEEE Trans. Power Deliv., Vol. 17, pp. 1063–1069, 2002. [14] M. Sato, A. Nakajima, T. Komukai and T. Oyamada, “Spectral Analysis of Leakage Current On Contaminated Insulators by Auto Regressive Method”, IEEE Conf. Electr. Insul. Dielectr. Phenomena (CEIDP), pp. 64–66, 1998. [15] A.H. El-Hag, S.H. Jayaram and E.A. Cherney, “Fundamental and low frequency harmonic components of leakage current as a diagnostic tool to study aging of RTV and HTV silicone rubber in salt-fog”, IEEE Trans. Dielectr. Electr. Insul., Vol. 10, pp. 128–136, 2003. [16] Waluyo, P.M. Pakpahan, Suwarno and M.A. Djauhari, “Study on Leakage Current Waveforms of Porcelain insulator due to various Artificial Pollutants”, World Academy of Sci., Eng. Techn., Vol. 32, pp. 293–298, 2007. [17] R. Sarathi and S. Chandrasekar, “Diagnostic study of surface condition of the insulation structure using wavelet transform and neural networks”, Electr. Power Syst. Res., Vol. 68, pp. 137–147, 2004. [18] B.X. Du, Y. Liu, H.J. Liu and Y.J. Yang, “Recurrent Plot Analysis of Leakage Current for Monitoring Outdoor Insulator Performance”, IEEE Trans. Dielectr. Electr. Insul., Vol. 16, pp.139-146, 2009. [19] M. Ugur, D.W. Auckland, B.R. Varlow and Z. Emin, “Neural Networks To Analyze Surface Tracking On Solid Insulators”, IEEE Trans. Dielectr. Electr. Insul., Vol. 4, pp. 76 –766, 1997. [20] K. Siderakis and D. Agoris, “Performance RTV Silicone Rubber Coatings Installed in Coastal Systems”, Electr. Power Syst. Res., Vol. 78, No. 2, pp. 248-254, 2008. [21] I.A. Metwally, A. Al-Maqrashi, S. Al-Sumry, S. Al-Harthy, “Performance Improvement of 33 kV line-post insulators in harsh environment”, Electr. Power Syst. Res., Vol. 76, No. 9-10, pp. 778-785, 2006. [22] K.L. Chrzan and F. Moro, “Concentrated Discharges and Dry Bands on Polluted Outdoor insulators”, IEEE Trans. Power Deliv., Vol. 22, pp. 466–471, 2007. [23] J.P. Holtzhausen and W.L. Vosloo, “An Analysis Of Leakage Current Waveforms, Measured On-site, With
Reference To Insulator Pollution Flashover Models”, 13th Intern. Sympos. High Voltage Eng. (ISH), Delft, Netherlands, 2003. [24] W.L. Vosloo, J.P. Holtzhausen, A.H.A. Roediger, “Leakage Current Performance Of Naturally Aged Non-Ceramic Insulators Under A Severe Marine Environment”, IEEE 4th Africon Conf., Vol. 1, pp. 489-495, 1996. [25] S.G. Mallat, A Wavelet Tour Of Signal Processing, Academic Press, 1999. [26] S.G. Mallat, “A Theory for Multiresolution Signal Decomposition: The Wavelet Representation”, IEEE Trans. Pattern Analysis and Machine Intelligence, Vol. 11, pp. 674-693, 1989. [27] D. Pylarinos, E. Pyrgioti, K. Siderakis, E. Thalassinakis and I. Vitellas, “Signal Analysis and Pattern Recognition Techniques on Leakage Current Measurements”, 6th Mediterranean Conf. and Exhibition on Power Generation, Transmission, Distribution and Energy Conversion, (MEDPOWER), Vol. 1, pp. 676-681, 2008.
Dionisios Pylarinos was born in Athens in 1981. He received a Diploma degree in electrical and computer engineering from the University of Patras in 2007. Presently he is a Ph.D. degree candidate at the High Voltage Laboratory of the Department of Electrical and Computer Engineering at the University of Patras. His research interests include outdoor insulation, electrical discharges, signal processing and pattern recognition. Kiriakos Siderakis was born in Heraklion in 1976. He received a Diploma degree in electrical and computer engineering in 2000 and the Ph.D. degree in 2006 from the University of Patras. Presently, he is a Lecturer at the Department of Electrical Engineering, at the Technological Educational Institute of Crete. His research interests include outdoor insulation, electrical discharges, high voltage measurements and high voltage equipment diagnostics and reliability. Eleftheria Pyrgioti was born in 1958 in Greece. She received her Diploma degree in electrical engineering from Patras University in 1981 and the Ph.D. degree from the same University in 1991. She is an assistant professor at the department of Electrical and Computer Engineering at the University of Patras. Her research activity is directed to high voltage, lightning protection, insulation coordination and distributed generation.
Emmanuel Thalassinakis received the Diploma in electrical and mechanical engineering and also the Ph.D. degree from the National Technical University of Athens. After working for the Ministry of the Environment, in 1991 he joined the Public Power Corporation (PPC) where he is now Assistant Director of the Islands Network Operations Department.
Isidoros Vitellas was born in 1954 in Greece. He has a diploma in electrical engineering and the Ph.D. degree in the same field. He is currently Director of the Islands Network Operations Department in PPC (Public Power Corporation) Athens, Greece.