Leakage Current Waveforms and Arcing Characteristics of Epoxy Resin for Outdoor Insulators under...
21
40 ITB J. Eng. Sci. Vol. 40, No. 1, 2008, 40-60 Leakage Current Waveforms and Arcing Characteristics of Epoxy Resin for Outdoor Insulators under Clean and Salt Fogs Suwarno & S.K. Ardianto School of Electrical Engineering and Informatics Bandung Institute of Technology Jl. Ganesha 10 Bandung 40132, INDONESIA Email: [email protected] Abstract. Ceramic outdoor insulators have been used in high voltage transmission lines since long time ago. Due to superiority in their resistance to pollution, recently, polymeric outdoor insulators are widely used. Epoxy resin is one polymer which shows good properties for outdoor insulation. During service, outdoor insulators may severe a certain degree of pollution which may reduce their surface resistance. Leakage current (LC) usually increase and degradation may take place. This paper reports experimental results on the leakage current waveforms and arcing characteristics of epoxy resin under clean and salt fog. The samples used are blocks of epoxy resin with dimension of 250 x 50 x 20 mm 3 . The samples were put in a test chamber with dimension of 900x900x1200 mm 3 with controllable humidity and pollution conditions. Clean and salt fog were generated according to IEC 60-1 and 507. The arcing experiment was done with incline plane test in accordance with IEC 587. AC voltage in the range from 5 kV to 50 kV with frequency of 50 Hz was applied. The LC waveforms up to flash over were measured. The magnitudes as well as harmonic content of the LC were analyzed. The correlation between LC waveforms and dry band arching phenomenon was elaborated. Visual observation of the arc on the sample surfaces was observed using a video camera. Experimental results indicated that LC magnitude on clean samples was slightly affected by humidity (RH). However, under salt fog, RH greatly affected the LC magnitude. The flashover voltage of clean samples under salt fog reduced significantly for fog conductivity of more than 1.2 mS/cm. Kaolin-polluted samples under salt fog showed an Ohmic behaviour. The LC magnitude was high and a large discrepancy of LC magnitude was observed for high applied voltage of larger than 25 kV. The largest LC magnitude was observed on salt-kaolin polluted samples under clean fog at high RH. LC waveforms analysis indicated that in general LC waveforms were distorted from sinusoidal. For clean samples under clean fog, THD of LC decreased with RH but slightly increased with the applied voltage. Large distortion at the peak of LC waveform was observed on kaolin polluted sample under salt fog of 3.6 mS/cm and high RH and high applied voltage. This correlates with corona arc on the sample surface. Similar behaviour was observed on kaolin-salt polluted samples under clean fog. Tracking arc experiment indicated that arc length LC magnitude and arc intensity
Transcript of Leakage Current Waveforms and Arcing Characteristics of Epoxy Resin for Outdoor Insulators under...

40
ITB J. Eng. Sci. Vol. 40, No. 1, 2008, 40-60
Leakage Current Waveforms and Arcing Characteristics
of Epoxy Resin for Outdoor Insulators
under Clean and Salt Fogs
Suwarno & S.K. Ardianto
School of Electrical Engineering and Informatics
Bandung Institute of Technology Jl. Ganesha 10 Bandung 40132, INDONESIA
Email: [email protected]
Abstract. Ceramic outdoor insulators have been used in high voltage
transmission lines since long time ago. Due to superiority in their resistance to
pollution, recently, polymeric outdoor insulators are widely used. Epoxy resin is one polymer which shows good properties for outdoor insulation. During
service, outdoor insulators may severe a certain degree of pollution which may
reduce their surface resistance. Leakage current (LC) usually increase and
degradation may take place. This paper reports experimental results on the
leakage current waveforms and arcing characteristics of epoxy resin under clean
and salt fog. The samples used are blocks of epoxy resin with dimension of 250
x 50 x 20 mm3. The samples were put in a test chamber with dimension of
900x900x1200 mm3 with controllable humidity and pollution conditions. Clean
and salt fog were generated according to IEC 60-1 and 507. The arcing
experiment was done with incline plane test in accordance with IEC 587. AC
voltage in the range from 5 kV to 50 kV with frequency of 50 Hz was applied. The LC waveforms up to flash over were measured. The magnitudes as well as
harmonic content of the LC were analyzed. The correlation between LC
waveforms and dry band arching phenomenon was elaborated. Visual
observation of the arc on the sample surfaces was observed using a video
camera. Experimental results indicated that LC magnitude on clean samples was
slightly affected by humidity (RH). However, under salt fog, RH greatly affected
the LC magnitude. The flashover voltage of clean samples under salt fog reduced
significantly for fog conductivity of more than 1.2 mS/cm. Kaolin-polluted
samples under salt fog showed an Ohmic behaviour. The LC magnitude was high
and a large discrepancy of LC magnitude was observed for high applied voltage
of larger than 25 kV. The largest LC magnitude was observed on salt-kaolin
polluted samples under clean fog at high RH. LC waveforms analysis indicated that in general LC waveforms were distorted from sinusoidal. For clean samples
under clean fog, THD of LC decreased with RH but slightly increased with the
applied voltage. Large distortion at the peak of LC waveform was observed on
kaolin polluted sample under salt fog of 3.6 mS/cm and high RH and high
applied voltage. This correlates with corona arc on the sample surface. Similar
behaviour was observed on kaolin-salt polluted samples under clean fog.
Tracking arc experiment indicated that arc length LC magnitude and arc intensity

Epoxy Resin for Outdoor Insulators under Clean & Salt Fogs 41
increased with the pollutant conductivity. The THD also significantly increased
with pollutant conductivity. At conductivity of less than 0.6 mS/cm the
unsymmetrical LC waveforms were obtained. However, symmetrical LC
waveforms were observed for conductivity of 0.9 and 1.2 mS/cm. The change of
LC magnitude and waveform at different condition of samples may be useful for
the diagnostics of insulator condition.
Keywords: dry band; epoxy resin; humidity; leakage current; waveform; THD; surface
resistance.
1 Introduction
In a power system, insulator plays an important role to isolate among live parts
and between live part and ground and as mechanical protector. The insulators
are widely used at substations, transmission as well as distribution networks [1].
Due to some superior properties such as lightweight, good water repellance and
resistance to pollution, recently, polymeric insulating materials are introduced
to substitute conventionally used insulators like porcelains and glasses [2,3].
During service, several severe conditions such as high humidity, coastal and industrial pollutions as well as biological contaminations may be exposed to the
outdoor insulators [4-6]. For development of outdoor insulator, laboratory test is
useful [7-11].
Laboratrory investigations on a number of polymeric outdoor insulators such as
silicone rummber, Ethylene Prophylene Diene Monomer (EPDM),
Cycloalipatic resin, Polydimethylsiloxane (PDMS) and RTVand silicone compound coatings have been reported [12-17].
Epoxy resin is one of polymeric materials used for high voltage insulators.
Epoxy resin showed a considerable good tracking and errosion resistance and
suitable for outdoor use. There are several reports explained good insulation properties of epoxy resin used in polluted conditions [18,19]. However, almost
no paper has been reported concerning leakage current and its waveforms for
epoxy resin although it is important for insulator diagnostics. This paper reports the experimental results on the leakge current and its waveforms of epoxy resin
under various artificial contaminations using clean and salt fog methods.
2 Experiment
2.1 Sample
The samples used in this experimet were epoxy resin formed from diglycidil ether of bisphenol-A (DGEBA) and metaphenylene-diamine (MPDA) at 27
0 C

Suwarno 42
and 1 atm. The samples were prepared in the form of blocks with dimension of
250 x 50 x 20 mm3
as shown in Figure 1(a) clean and 1(b) kaolin-salt polluted.
For obtaining good contact with electrode, the two ends of the samples were
coated with conductive silver paint. The samples was subjected to various test conditions such as clean fog and salt fog, kaolin pollution and kaolin-salt
pollution under clean or salt fog. Kaolin-salt pollution was obtained by adding
40 g kaolin into 1 liter water. Salt was added into the solution for obtaining the desired conductivity. The conductivity was varied from 0.6 mS/cm – 4.0
mS/cm which represented the degree of pollution from light to heavy derived
from Equivalent Salt Deposit Density (ESDD) according to IEC 507[20].
(a)
(b)
Figure 1 Epoxy resin samples used in experiment (a) clean (b) kalin-salt
polluted.
Epoxy Resin for Outdoor Insulators under Clean & Salt Fogs 43
Power
source
220 V AC
Control desk
HV Transformer
220 V / 100 kV max
R
375 ohm / 60 W
CF
Peak Meas
C = 100 pF
Chamber
sample
SB R shunt
Coaxial cable
Arrester
oscilloscope
GPIB
PC
IU
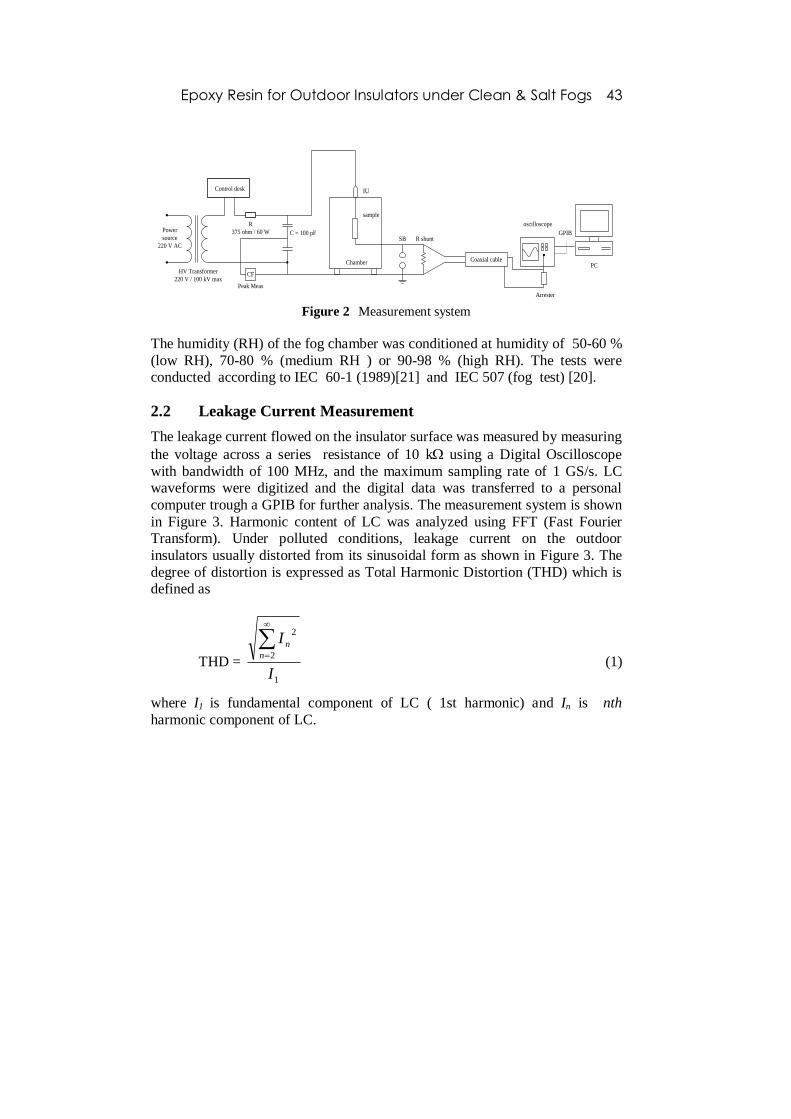
Figure 2 Measurement system
The humidity (RH) of the fog chamber was conditioned at humidity of 50-60 %
(low RH), 70-80 % (medium RH ) or 90-98 % (high RH). The tests were conducted according to IEC 60-1 (1989)[21] and IEC 507 (fog test) [20].
2.2 Leakage Current Measurement
The leakage current flowed on the insulator surface was measured by measuring
the voltage across a series resistance of 10 k using a Digital Oscilloscope
with bandwidth of 100 MHz, and the maximum sampling rate of 1 GS/s. LC waveforms were digitized and the digital data was transferred to a personal
computer trough a GPIB for further analysis. The measurement system is shown
in Figure 3. Harmonic content of LC was analyzed using FFT (Fast Fourier Transform). Under polluted conditions, leakage current on the outdoor
insulators usually distorted from its sinusoidal form as shown in Figure 3. The
degree of distortion is expressed as Total Harmonic Distortion (THD) which is defined as
THD = 1
2
2
I
In
n
(1)
where I1 is fundamental component of LC ( 1st harmonic) and In is nth
harmonic component of LC.

Suwarno 44
-23000
-11500
0
11500
23000
period 20 ms
LC
(m
icro
A)
(a)
0
2000
4000
6000
8000
10000
nth Harmonics
1 2 3 4 5 6 7 8 9 10 11 12 13 14 15 16
LC
(m
icro
A)
THD = 41,71 %
(b)
Figure 3 Typical leakage current on insulator surface (a) and harmonic
components (b).
2.3 Arc Measurement
In order to observe the arc on the samples, an inclined plane method according
to IEC 587 (inclined plane test) [22] was used. The samples were put inclined in
a chamber. The pollution and humidity were adjusted and the AC voltage was applied. Arcing took place on the sample surface was observed using a camera,
and the corresponding leakage current was measured using LC measurement
system as described before.
2.4 Surface Resitance Measurement
In order to know the surface resistance of the samples, the resiatance was
measured using mega ohm meter at operating voltage of 1000 V. The two ends of the samples were coated with silver paint to form electrodes.

Epoxy Resin for Outdoor Insulators under Clean & Salt Fogs 45
3 Experimental Results
3.1 Leakage Current Characteristics of Clean Samples under
Clean Fog
Figure 4 shows the dependences of leakage current on applied voltage for clean
samples under clean fog at low, medium and high humidity. The figure indicates that leakage current increases almost linearly with applied voltage at
clean condition. Increase of humidity result in a slight increase of leakage
current magnitude. The increase of humidity at clean condition slightly reduced
the surface resistance from 145.7 M at low RH ro 134.5 M at medium RH
and 115.8 M at high RH.
0
100
200
300
400
500
0 10 20 30 40 50
Voltage (kV)
LC
(m
icro
A)
Low RH Medium RH % High RH %
Figure 4 Dependences of leakage current on applied voltage under low,
medium and high humidity
3.2 Leakage Current Characteristics of Clean Samples under
Salt Fog
Figure 5 shows the dependences of leakage current on applied voltage for clean samples under salt fog with fog conductivity varied from 0.6 mS/cm to 4.0
mS/cm at low (a), medium (b) and high humidity (c) under applied voltage
ranged from 5 kV to 50 kV. Figure 5 (a) showed that at low RH the magnitude
of leakage current slightly increased with applied voltage. LC magnitude varied
from less than 250 A at applied voltage of 5 kV for all samples to about 2300
A for salt fog conductivity of more than 1.2 mS/cm. No flashover was found at
this condition. Significant increase of LC magnitude was observed compared to those of clean samples under clean fog at all RH. The increase of LC
magnitude was due to smaller surface resistance of the clean samples under salt
fog. The resistance varied form 63.6 m at fog of 0.6 mS/cm to 20.5 m at 4.0 mS/cm.

Suwarno 46
0
500
1000
1500
2000
2500
0 10 20 30 40 50
Voltage (kV)
LC
(m
icro
A
)
0.6 mS/cm 1.2 mS/cm 2.4 mS/cm 3.6 mS/cm 4.0 mS/cm
(a)
0
4000
8000
12000
16000
0 10 20 30 40 50
Voltage (kV)
LC
(m
icro
A
)
0.6 mS/cm 1.2 mS/cm 2.4 mS/cm 3.6 mS/cm 4.0 mS/cm
(b)
Figure 5 Dependences of LC magnitude on applied voltage for clean samples
under salt fog of different conductivity.
Figure 5(b) showed the LC dependency on applied voltage at different fog
conductivities. At fog of 0.6 mS/cm and 1.2 mS/cm LC magnitude increased
almost linearly with applied voltage. No Flashover was observed up to 50 kV.
Non linear dependency of LC magnitude on applied voltage was clearly observed at fog of 2.4 mS/cm and higher with applied voltage of larher than 20
kV. During this condition electric arc appeared with large distortion of LC
waveforms which will be explained later. Flashover was observed at 40 kV for 2.4 mS/cm, 37.8 kV for 3.6 mS/cm and 37 kV for 4.0 mS/cm.
3.3 Leakage Current Characteristics of kaolin-polluted Samples
under salt fog
Figure 6 showed the dependences of LC magnitude on applied voltage for
kaolin polluted samples under salt fog with fog conductivity varied from 0.6 mS/cm to 4.0 mS/cm at (a) low and (b) high humidity. Figure 6(a) showed that
at low RH the magnitude of leakage current slightly increased with applied

Epoxy Resin for Outdoor Insulators under Clean & Salt Fogs 47
voltage and only slight deviation from each other up to applied voltage of 25
kV. LC magnitude varied from less than 500 A at applied voltage of 5 kV for
all samples to about 1100 A at applied voltage of 25 kV. At higher applied
voltage, the increasing rate of LC magnitude increased with the salt fog conductivity. The figure indicated an Ohmic behavior of insulator sample (i.e.
LC almost linearly increased with the applied voltage). No flashover was found
at this condition for applied voltage up to 50 kV. Compared to those from clean samples (i.e. figure 4(a)) the LC magnitude was almost twice. This was caused
by the higher reduction of surface resistivity since kaolin-polluted samples had
higher ability to absorb salt fog compared to clean samples.
0
1500
3000
4500
6000
0 10 20 30 40 50
Voltage (kV)
LC
(m
icro
A)
0.6 mS/cm 1.2 mS/cm 2.4 mS/cm 3.6 mS/cm 4.0 mS/cm
(a)
0
2500
5000
7500
10000
5 10 15 20 25 30
Voltage (kV)
LC
(m
icro
A)
0.6 mS/cm 1.2 mS/cm 2.4 mS/cm 3.6 mS/cm 4.0 mS/cm
(b)
Figure 6 Dependences of LC magnitude on applied voltage of kaolin-polluted
samples under salt fog at (a) low RH and (b) high RH.

Suwarno 48
Figure 6(b) described the dependence of LC magnitude on applied voltage for
kaolin-polluted samples under salt fogs at high RH. LC magnitude increased
with applied voltage and fog conductivity. However, at applied voltage of 30
kV almost constant LC magnitude was observed. This was correlated with the appearance of arc and large distortion of LC waveforms. This will be discussed
later in this paper.
3.4 Leakage Current Characteristics of kaolin-salt polluted
Samples under clean fog
Figure 7 shows typical leakage current magnitude of kaolin-salt polluted insulators as a function of applied voltage under clean fog at (a) low RH and (b)
high RH. Figure 7(a) shows that the discrepancies of LC magnitudes of
different pollution levels at low RH is larger at higher applied voltage. This
indicates that the effect of kaolin-salt pollution becomes stronger at higher voltage. Similar pattern was reported for glass insulator [23]. Figure 7(b)
shows that at high RH the LC magnitude was higher. Under high humidity, the
water molecules were absorbed by pollutant leading to the increase of surface conductivity and LC magnitude [24,25]. However, at high RH large discrepancy
of LC magnitude was not observed at high applied voltage. This was caused by
the fact that at high LC magnitude the drying effect took place and the effect of high RH reduced leading to the reduction of LC magnitude.
Table 1 Surface resistance (Rs) of sample under various conditions.
Sample
Conductivity
(mS/cm)
Rs at Low
RH
(M)
Rs at Medium
RH ()
Rs at High
RH
(M)
Clean sample under
clean fog
- 145.7 134.5 115.8
Clean sample under salt fog
0.6 63.6 21.9 16.6
1.2 43.8 9.6 7.3
2.4 22.8 8.5 3.6
3.6 22.4 7.6 2.6
4.0 20.5 7.5 2.4
Kaolin-polluted under salt fog
0.6 32.8 27.7 11.3
1.2 26.9 20.8 10.4
2.4 14.8 14.3 8.3
3.6 13.9 10.2 6.8
4.0 13.7 8.8 5.7

Epoxy Resin for Outdoor Insulators under Clean & Salt Fogs 49
Sample
Conductivity
(mS/cm)
Rs at Low
RH
(M)
Rs at Medium
RH ()
Rs at High
RH
(M)
Kaolin-salt polluted under clean fog
0.6 4.9 3.4 2.6
1.2 4.1 3.3 2.5
2.4 3.5 3.1 2.4
3.6 3.4 2.9 2.3
4.0 3.3 2.8 2.2
0
4000
8000
12000
16000
0 10 20 30 40 50
Voltage (kV)
LC
(m
icro
A
)
0.6 mS/cm 1.2 mS/cm 2.4 mS/cm 3.6 mS/cm 4.0 mS/cm
(a)
0
3000
6000
9000
12000
15000
18000
0 5 10 15 20 25 30
Voltage (kV)
LC
(m
icro
A
)
0.6 mS/cm 1.2 mS/cm 2.4 mS/cm 3.6 mS/cm 4.0 mS/cm
(b)
Figure 7 Dependence of LC magnitude on applied voltage for kaolin-salt
polluted samples under clean fog at (a) low RH and (b) high RH.

Suwarno 50
3.5 Dependent of Leakage Current Waveforms on Applied
Voltage at Low RH
-20
-10
0
10
20
period 20 ms
LC
(m
icro
A)
-40
-20
0
20
40
period 20 ms
LC
(m
icro
A)
5 kV 10 kV
-60
-30
0
30
60
period 20 ms
LC
(m
icro
A)
15 kV
(a)
-22
-11
0
11
22
period 20 ms
LC
(m
icro
A)
-42
-21
0
21
42
period 20 ms
LC
(m
icro
A)
5 kV 10 kV
-80
-40
0
40
80
period 20 ms
LC
(m
icro
A)
15 kV
(b)
Epoxy Resin for Outdoor Insulators under Clean & Salt Fogs 51
-30
-15
0
15
30
period 20 ms
LC
(m
icro
A)
-60
-30
0
30
60
period 20 ms
LC
(m
icro
A)
5 kV 10 kV
-150
-75
0
75
150
period 20 ms
LC
(mic
roA
)
15 kV
(c)
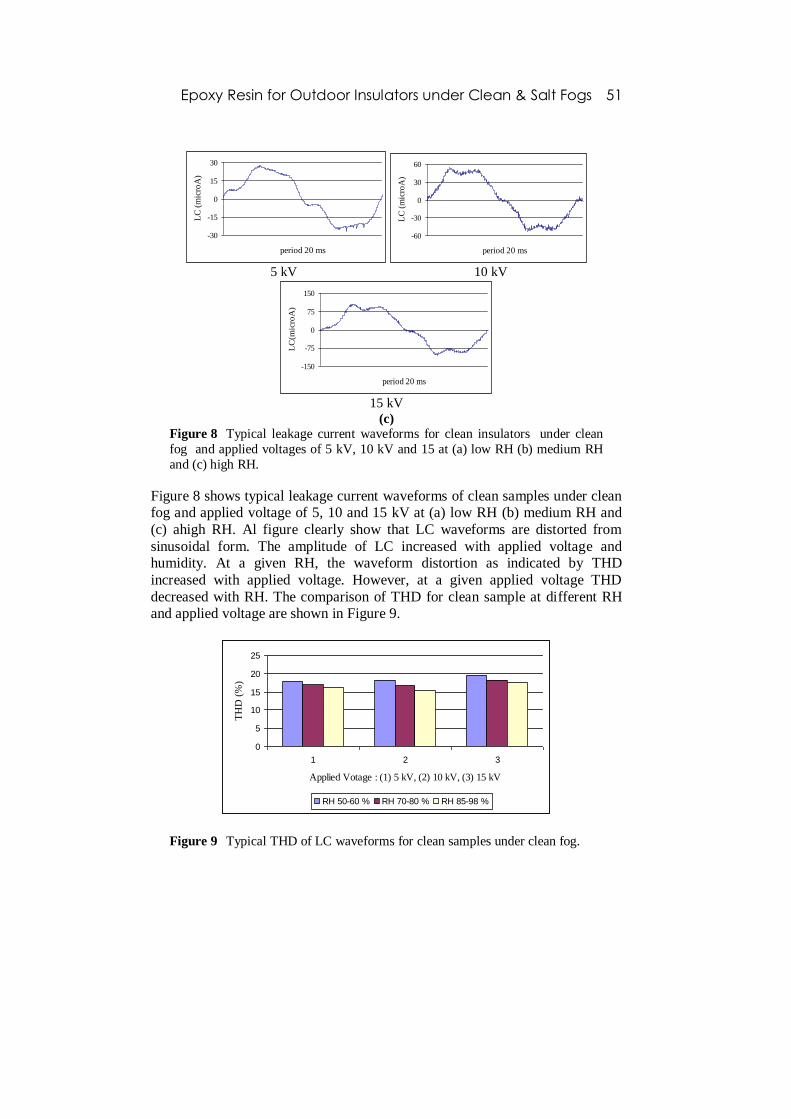
Figure 8 Typical leakage current waveforms for clean insulators under clean
fog and applied voltages of 5 kV, 10 kV and 15 at (a) low RH (b) medium RH
and (c) high RH.
Figure 8 shows typical leakage current waveforms of clean samples under clean fog and applied voltage of 5, 10 and 15 kV at (a) low RH (b) medium RH and
(c) ahigh RH. Al figure clearly show that LC waveforms are distorted from
sinusoidal form. The amplitude of LC increased with applied voltage and humidity. At a given RH, the waveform distortion as indicated by THD
increased with applied voltage. However, at a given applied voltage THD
decreased with RH. The comparison of THD for clean sample at different RH and applied voltage are shown in Figure 9.
0
5
10
15
20
25
1 2 3
Applied Votage : (1) 5 kV, (2) 10 kV, (3) 15 kV
TH
D (
%)
RH 50-60 % RH 70-80 % RH 85-98 %
Figure 9 Typical THD of LC waveforms for clean samples under clean fog.

Suwarno 52
3.6 LC for Kaolin Polluted under Salt Fog 3.6 mS/cm
-700
-350
0
350
700
period 20 ms
LC
(m
icro
A)
-1200
-600
0
600
1200
period 20 ms
LC
(m
icro
A)
5 kV 10 kV
-1500
-750
0
750
1500
period 20 ms
LC
(m
icro
A)
15 kV
(a)
-4000
-2000
0
2000
4000
period 20 ms
LC
(m
icro
A)
-4000
-2000
0
2000
4000
period 20 ms
LC
(m
icro
A)
5 kV 10 kV
-4000
-2000
0
2000
4000
period 20 ms
LC
(m
icro
A)
15 kV
(b)

Epoxy Resin for Outdoor Insulators under Clean & Salt Fogs 53
-10000
-5000
0
5000
10000
period 20 ms
LC
(m
icro
A)
-12000
-6000
0
6000
12000
period 20 ms
LC
(m
icro
A)
5 kV 10 kV
-16000
-8000
0
8000
16000
period 20 ms
LC
(m
icro
A)
15 kV
(c)
Figure 10 Typical LC Waveforms for kaolin polluted samples under salt fog of
3.6 mS/cm at (a) low RH (b) medium RH and (c) high RH.
Figure 10 shows the typical LC Waveforms for kaolin polluted samples under salt fog of 3.6 mS/cm at (a) low RH (b) medium RH and (c) high RH. The
figure clearly indicates that at a given RH the LC amplitude increased with the
applied voltage. At low RH and low applied voltage, the LC waveforms were strongly distorted. The distortion decreased with RH. However, at high RH and
high applied voltage, the THD increased greatly. The THD values of samples
with various values of applied voltages and RH are shown in Figure 11.
0
5
10
15
20
25
30
1 2 3
Applied Voltage : (1) 5 kV, (2) 10 kV, (3) 15 kV
TH
D(%
)
RH 50-60 % RH 70-80 % RH 85-98 %
Figure 11 THD for kaolin polluted under salt fog.

Suwarno 54
3.7 LC for Kaolin-Salt Polluted at 3.6 mS/cm under Clean Fog
-1000
-500
0
500
1000
period 20 ms
LC
(m
icro
A)
-2000
-1000
0
1000
2000
period 20 ms
LC
(m
icro
A)
5 kV 10 kV
-3000
-1500
0
1500
3000
period 20 ms
LC
(m
icro
A)
15 kV
(a)
-800
-400
0
400
800
period 20 ms
LC
(m
icro
A)
-2200
-1100
0
1100
2200
period 20 ms
LC
(m
icro
A)
5 kV 10 kV
-5000
-2500
0
2500
5000
period 20 ms
LC
(m
icro
A)
15 kV
(b)

Epoxy Resin for Outdoor Insulators under Clean & Salt Fogs 55
-14000
-7000
0
7000
14000
period 20 ms
LC
(m
icro
A)
-18000
-9000
0
9000
18000
period 20 ms
LC
(m
icro
A)
5 kV 10 kV
-24000
-12000
0
12000
24000
period 20 ms
LC
(m
icro
A)
15 kV
(c)
Figure 12 Typical LC waveforms for kaolin-salt polluted at 3.6 mS/cm under
clean fog and applied voltage of 5, 10 and 15 kV at (a) low RH (b) medium RH
and (c) high RH
Figure 12 shows typical LC waveforms for kaolin-salt polluted at 3.6 mS/cm under clean fog and applied voltage of 5, 10 and 15 kV at (a) low RH (b)
medium RH and (c) high RH. The figure clearly indicates that LC magnitude of
kaolin-salt polluted samples greatly affected by both applied voltage and
humidity. In general the LC magnitude significantly larger than those from kaolin-polluted samples under salt fog condition at same conductivity but the
distortion of the LC waveforms from its sinusoidal was smaller as indicated by
THD. THD was slightly increased with applied voltage and strongly affected by humidity. At high RH the LC amplitude was large and the waveform distortion
was also high especially at the peak of the LC waveforms. This correlated with
local arc due to corona since corona usually occurs at the highest part/peak of the applied voltage [26]. Harmonic analysis indicated that odd harmonics
components especially 3rd
, 5th and 7
th appeared with relatively high magnitude.
Similar behavior was reported for suspension insulators [27] and post pin
EPDM insulator [28]. This symmetrical LC waveform with dominant odd harmonic components was correlated with the appearance of spark on the
sample surface at high RH which enhanced the distortion of LC waveforms
leading to the increase of THD. The values of THD as function of voltage and RH is shown in Figure 13.
Suwarno 56
0
4
8
12
16
1 2 3
Applied Voltage : (1) 5 kV, (2) 10 kV, (3) 15 kV
TH
D(%
)
RH 50-60 % RH 70-80 % RH 85-98 %
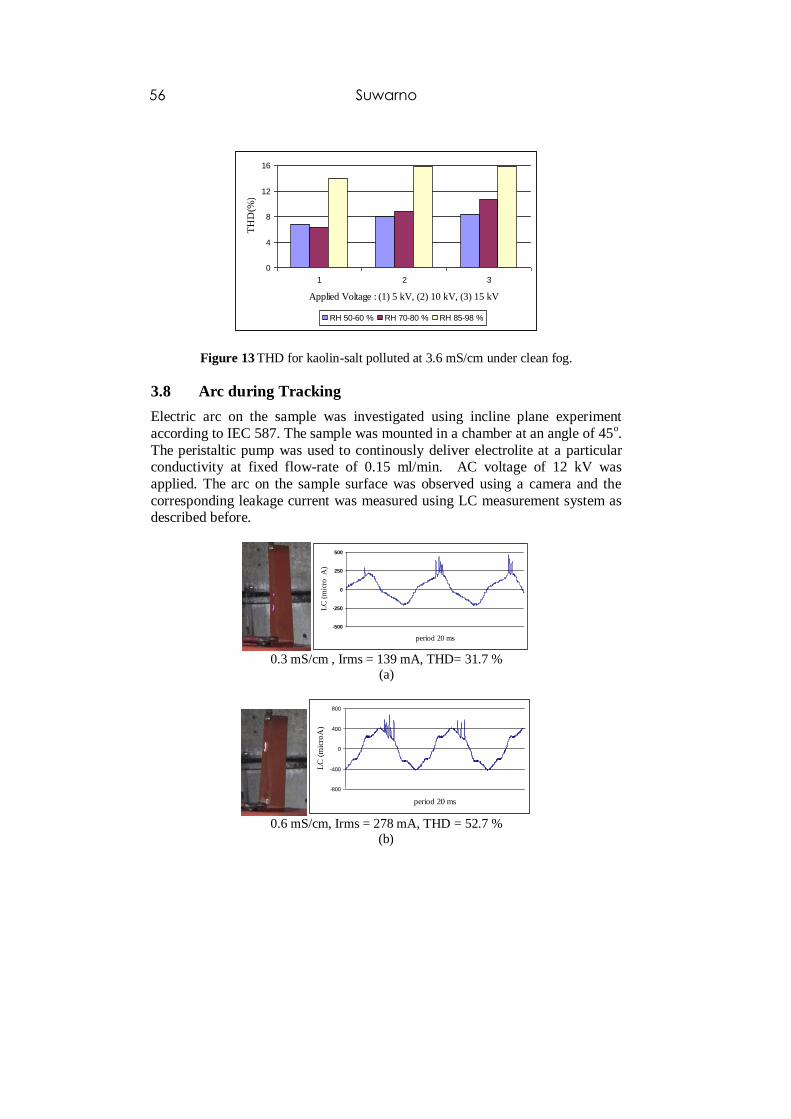
Figure 13 THD for kaolin-salt polluted at 3.6 mS/cm under clean fog.
3.8 Arc during Tracking
Electric arc on the sample was investigated using incline plane experiment
according to IEC 587. The sample was mounted in a chamber at an angle of 45o.
The peristaltic pump was used to continously deliver electrolite at a particular conductivity at fixed flow-rate of 0.15 ml/min. AC voltage of 12 kV was
applied. The arc on the sample surface was observed using a camera and the
corresponding leakage current was measured using LC measurement system as described before.
-500
-250
0
250
500
period 20 ms
LC
(m
icro
A
)
0.3 mS/cm , Irms = 139 mA, THD= 31.7 %
(a)
-800
-400
0
400
800
period 20 ms
LC
(m
icro
A)
0.6 mS/cm, Irms = 278 mA, THD = 52.7 %
(b)
Epoxy Resin for Outdoor Insulators under Clean & Salt Fogs 57
-4000
-2000
0
2000
4000
period 20 ms
LC
(m
icro
A)
0.9 mS/cm, Irms = 873 mA, THD=55.1 %
(c)
(d)
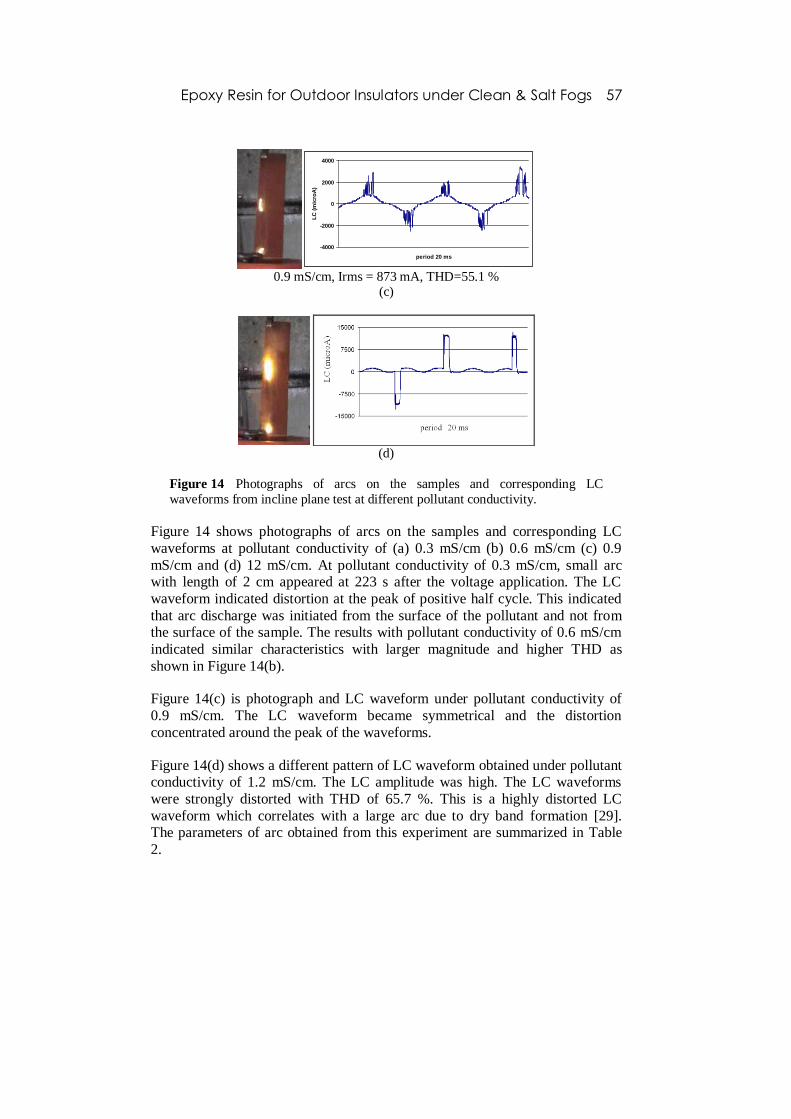
Figure 14 Photographs of arcs on the samples and corresponding LC
waveforms from incline plane test at different pollutant conductivity.
Figure 14 shows photographs of arcs on the samples and corresponding LC
waveforms at pollutant conductivity of (a) 0.3 mS/cm (b) 0.6 mS/cm (c) 0.9
mS/cm and (d) 12 mS/cm. At pollutant conductivity of 0.3 mS/cm, small arc with length of 2 cm appeared at 223 s after the voltage application. The LC
waveform indicated distortion at the peak of positive half cycle. This indicated
that arc discharge was initiated from the surface of the pollutant and not from the surface of the sample. The results with pollutant conductivity of 0.6 mS/cm
indicated similar characteristics with larger magnitude and higher THD as
shown in Figure 14(b).
Figure 14(c) is photograph and LC waveform under pollutant conductivity of
0.9 mS/cm. The LC waveform became symmetrical and the distortion
concentrated around the peak of the waveforms.
Figure 14(d) shows a different pattern of LC waveform obtained under pollutant conductivity of 1.2 mS/cm. The LC amplitude was high. The LC waveforms
were strongly distorted with THD of 65.7 %. This is a highly distorted LC
waveform which correlates with a large arc due to dry band formation [29]. The parameters of arc obtained from this experiment are summarized in Table
2.

Suwarno 58
Table 2 Arc parameters during tracking at incline plane test.
4 Conclusion
Leakage current and arc characteristics for epoxy resin under clean and salt fogs have been investigated. Experimental results indicated that LC magnitude on
clean samples was slightly affected by RH. However, under salt fog, RH greatly
affected the LC magnitude. The flashover voltage of clean samples under salt fog reduced significantly for fog conductivity of more than 1.2 mS/cm. Kaolin-
polluted samples under salt fog showed an Ohmic behaviour. The LC
magnitude was high and a large discrepancy of LC magnitude was observed for high applied voltage of larger than 25 kV. The largest LC magnitude was
observed on salt-kaolin polluted samples under clean fog at high RH. LC
waveforms analysis indicated that in general LC waveforms were distorted from
sinusoidal. For clean samples under clean fog, THD of LC decreased with RH but slightly increased with the applied voltage. Large distortion at the peak of
LC waveform was observed on kaolin polluted sample under salt fog of 3.6
mS/cm and high RH and high applied voltage. This correlates with corona arc on the sample surface. Similar behaviour was observed on kaolin-salt polluted
samples under clean fog. Tracking arc experiment indicated that arc length LC
magnitude and arc intensity increased with the pollutant conductivity. The THD
also significantly increased with pollutant conductivity. At conductivity of less than 0.6 mS/cm the unsymmetrical LC waveforms were obtained. However,
symmetrical LC waveforms were observed for conductivity of 0.9 and 1.2
mS/cm. The change of LC magnitude and waveform at different condition of samples may be useful for the diagnostics of insulator condition.
Arc
Parameter
Conductivity of pollution (mS/cm)
0.3 0.6 0.9 1.2 1.5
Time (s) 223 185 121 98 67
Length (cm) 2 3 3 3,5 5
Intensity (lux) 8,1 9,5 13,4 15,7 18,6
Irms (A) 139 278 873 3798 9384
THD (%) 31.7 52.7 55 65.7 72.9

Epoxy Resin for Outdoor Insulators under Clean & Salt Fogs 59
References
[1] Gorur, R.S., Cherney, E.A. & Burnham, J.T., Outdoor Insulators, Ravi
Gorur Inc, Arizona, 1999. [2] Cherney, E.A. & Stonkus, D.J., Non Ceramic Insulators for Transmission
Lines, IEEE Trans. Power Delivery, 4, pp. 2214-2220, 1989.
[3] Izumi, K. & Kadotani, K., Application of Polymeric Outdoor Insulators
in Japan, IEEE Trans. DEI, 6(5), pp. 595-604, 1999. [4] Gustavsson, T.G., Gubanski, S.M., Hilborg, Karllsson, S., Gedde, U.W.,
Aging of Silicone Rubber under AC and DC Voltage in a Coastal
Environment, IEEE Trans.s on Dielectrics and Electrical Insulation, 8(6), pp. 1029-1039, 2001.
[5] Gubanski, S.M., Dernfalk, A., Wallstrom, S., Carlsson, S., Performance
and Diagnostics of Biologically Contaminated Insulators, Proc. 8th International Conf. On Properties and Appl. Diel. Materials, Bali, June
2006, pp. 23- 30, 2006.
[6] Gautam, B.K., Yamazaki, T., Yamada, K., Matsushita, S., Sakanishi, K.,
Matsuoka, R., Effect of Non-Soluble Contaminations on the Flasover Voltage of Polymeric Insulators, Proc. 8th International Conf. On
Properties and Appl. Diel. Materials, Bali, June 2006, pp. 534- 537, 2006.
[7] Gorur, R.S., Cherney, E.A., Hackam, R., A Comparative Study of Polymer Insulating materials under Salt Fog, IEEE Trans., EI, 21(2), pp.
175-182, 1986.
[8] Lambert, P.J., et al, Final Report on the Clean Fog Test for HVAC Insulators, IEEE Trans., Power Delivery, 2(4), pp. 1317-1326, 1987.
[9] De la O, A., Chang, J., Gorur, R., AC clean fog test on non ceramic
insulating materials and a comparation with porcelain, IEEE Trans.
Power Delivery, 9(4), 1994. [10] Gorur, R.S., Montesinos, J., Varadadesikan, L., Simmons, S., Shah, W., A
Laboratory Test for Tracking and Errosion Resistance of HV Outdoor
Insulation, IEEE Trans. on DEI, 4(6), pp. 767-774, 1997. [11] Yoshimura, N., Kumagai, S., Research in Japan on the Tracking
phenomena of Electrical nsulating Materials, IEEE EI Magazine, 13(5),
pp. 8-18, , 1997.
[12] Naito, K., Matsuoka, R., Irie, T., Kondo, K., Test Method and Results for Recent Outdoor Insulation in Japan, IEEE Trans., DEI, 6(5), pp. 732-
743, 1999.
[13] Kim, S.H., Cherney, E.A., Hackam, R., Artificial Testing and Evaluation of RTV Coatings in Salt Fog Chamber, IEEE Trand, EI, 20(4), pp. 797-
805, 1991.
[14] Gorur, R.S., Sundararajan, Amburgey, O.G., Contamination Performance of Polymeric Insulating materials used for Outdoor Insulation
Applicatrion, IEEE Trans., EI, 24(4), pp. 713-716, 1989.

Suwarno 60
[15] Suwarno, Suppression of Leakage Current and Improving Insulator
voltage withstand using silocone compound coating, 7th Int. Power Eng.
Conf., Singapore, pp. 324-328, 2007.
[16] Suwarno, Wiratmaja, I., Improving the Performances of Outdoor ceramic Insulators under Severe Conditions by Using Silicone Compound
Coatings, WSEAS Transaction on Power System, 1(6), pp. 1001-1008,
June 2006. [17] Jahromi, A.N., Cherney E.A., Jayaram, S.H., Simon, L.C., Aging
Characteristics of RTV SIR Insulating Coatings, IEEE Trans., DEI, 15(2),
pp. 444-452, 2008.
[18] Kumagai, S., Yoshimura, N., Impacts of Thermal Aging and Water Absorption on Surface Electrical and Chemical properties of Epoxy
resin, IEEE Trans., DEI, 7(3), pp424-431, 2000.
[19] Gorur, R.S., Montesinos, J., Electrical Performance of Cycloaliphatic Epoxy Materials and Insulators for Outdoor Use, IEEE Trans. Power
Delivery, 15(4), pp. 1274-1278, 2000.
[20] IEC Pub. 507, Artificial Pollution Tests on High Voltage Insulators to be Used in ac System, 1991.
[21] IEC Pub. 60-1, High Voltage Test techniques, Part I, 1995.
[22] IEC Pub. 587, The Method for Evaluating Resistance to Tracking of
Electrical Insulating Materials under Severe Ambient Conditions, 1984. [23] Mekhladi, A., Namane, D., Bauazabia, S., Beroul, A., Flashover of
Discontinous Pollution Layer on HV Insulators, IEEE Trans.s on
Dielectrics and Electrical Insulation, 6(6), pp. 900-906, 1999. [24] Suwarno, Study on the waveform of leakage current on the 20 kV post-pin
ceramic insulators under various conditions, Proc. Intl. Symp. On Electr.
Insul. Mats., pp. 387-390, 2001
[25] Karady, George, G., Flashover Mechanism of Nonceramic Insulator, IEEE Transactions on Dielectrics and Electrical Insulation, 6(5), October
1999.
[26] Suwarno, Mizutani, T., Pulse Sequence Analysis of Discharges in Air, Liquid and Solid Insulating Materials, KIEE Journal of Electrical
Engineering and Technology, 1(4), pp. 528-533, 2006.
[27] Suda, T., Frequency Characteristics of Leakage Current Waveforms of a String of Suspension Insulators, IEEE Trans. on Power Delivery, 20(1),
pp 481-487, 2005.
[28] Suwarno, Leakage Current Waveforms of Outdoor Polymeric Insulators
and Possibility of Appalication for Diagnostics of Insulator Conditions, KIEE Journal of Electrical Engineering and Technology, 1, pp. 114-119,
2006.
[29] AH El Haq, Jayaram, S.H., Cherney, E.A., Fundamental and Low Frequency Components of LC as a diagnostic Tool to Study Aging of RTV
and HTV SIR in Salt Fog, IEEE Trans.DEI, 10(1), pp. 128-136, 2003.