
Impact of Climate Change on Groundwater Resources
55
1 ABSTRACT We are in a period of climate change brought about by increasing atmospheric concentrations of greenhouse gases. Atmospheric carbon dioxide levels have continually increased since the 1950s. The continuation of this phenomenon may significantly alter global and local climate characteristics, including temperature and precipitation. Changes in regional temperature and precipitation have important implications for all aspects of the hydrologic cycle. Variations in these parameters determine the amount of water that reaches the surface, evaporates or transpires back to the atmosphere, becomes stored as snow or ice, infiltrates into the groundwater system, runs off the land, and ultimately becomes base flow to streams and rivers. Climate change is commonly discussed at national and international levels. It directly affects the water cycle and thus life on Earth. The effect of climate change on surface water has been known for quite some time now, however research is still in its infancy on the effects of climate change on the subsurface water. While climate change affects surface water resources directly through changes in the major long term climate variables such as air temperature, precipitation, and evapotranspiration, the relationship between the changing climate variables and groundwater is more complicated and poorly understood. The greater variability in rainfall could mean more frequent and prolonged periods of high or low groundwater levels, and saline intrusion in coastal aquifers due to sea level rise and resource reduction. Both natural and anthropogenic factors control climate change. Groundwater is a renewable natural resource, and hence it can be replenished by better groundwater management and governance policies. India as a country of more than a billion population and high cattle and other domesticated population has a challenging task of conserving groundwater without affecting the needs and its development progress.
Transcript of Impact of Climate Change on Groundwater Resources
1
ABSTRACT
We are in a period of climate change brought about by increasing atmospheric concentrations of
greenhouse gases. Atmospheric carbon dioxide levels have continually increased since the 1950s. The
continuation of this phenomenon may significantly alter global and local climate characteristics, including
temperature and precipitation. Changes in regional temperature and precipitation have important implications
for all aspects of the hydrologic cycle. Variations in these parameters determine the amount of water that
reaches the surface, evaporates or transpires back to the atmosphere, becomes stored as snow or ice, infiltrates
into the groundwater system, runs off the land, and ultimately becomes base flow to streams and rivers.
Climate change is commonly discussed at national and international levels. It directly affects the water
cycle and thus life on Earth. The effect of climate change on surface water has been known for quite some time
now, however research is still in its infancy on the effects of climate change on the subsurface water. While
climate change affects surface water resources directly through changes in the major long term climate variables
such as air temperature, precipitation, and evapotranspiration, the relationship between the changing climate
variables and groundwater is more complicated and poorly understood. The greater variability in rainfall could
mean more frequent and prolonged periods of high or low groundwater levels, and saline intrusion in coastal
aquifers due to sea level rise and resource reduction.
Both natural and anthropogenic factors control climate change. Groundwater is a renewable natural
resource, and hence it can be replenished by better groundwater management and governance policies. India as
a country of more than a billion population and high cattle and other domesticated population has a challenging
task of conserving groundwater without affecting the needs and its development progress.
2
INTRODUCTION
The Intergovernmental Panel on Climate Change (IPCC) defines climate as the average weather in
terms of the mean and its variability over a certain time span and a certain area and a statistically significant
variation of the mean state of the climate or of its variability lasting for decades or longer, is referred to as
climate change. Climate change poses uncertainties to the supply and management of water resources. The
Intergovernmental Panel on Climate Change (IPCC) estimates that the global mean surface temperature has
increased 0.6 ± 0.20C since 1861, and predicts an increase of 2 to 40C over the next 100 years. Temperature
increases also affect the hydrologic cycle by directly increasing evaporation of available surface water and
vegetation transpiration. Consequently, these changes can influence precipitation amounts, timings and intensity
rates, and indirectly impact the flux and storage of water in surface and subsurface reservoirs (i.e., lakes, soil
moisture, and groundwater). In addition, there may be other associated impacts, such as sea water intrusion,
water quality deterioration, potable water shortage, etc.
The direct effect of climate change on groundwater resources depends upon the change in the volume
and distribution of groundwater recharge. Therefore, quantifying the impact of climate change on groundwater
resources requires not only reliable forecasting of changes in the major climatic variables, but also accurate
estimation of groundwater recharge.
Climate change can have profound effects on the hydrologic cycle through precipitation,
evapotranspiration, and soil moisture with increasing temperatures. The hydrologic cycle will be intensified
with more evaporation and more precipitation. However, the extra precipitation will be unequally distributed
around the globe. Some parts of the world may see significant reductions in precipitation or major alterations in
the timing of wet and dry seasons. Information on the local or regional impacts of climate change on
hydrological processes and water resources is becoming more important. The effects of global warming and
climatic change require multi-disciplinary research, especially when considering hydrology and global water
resources.
3
GROUND WATER RESOURCES
Climate Variability and Change
Climate change affects the components of water cycle such as evaporation, precipitation and
evapotranspiration and thus results in large scale alteration in water present in glaciers, rivers, lakes, oceans, etc.
The effects of climate change on subsurface water relates to the changes in its recharge and discharge rates plus
changes in quantity and quality of water in aquifers. Climate change refers to the long term changes in the
components of climate such as temperature, precipitation, evapotranspiration, etc. The major cause of climate
change is the rising level of greenhouse gases (GHGs) in the atmosphere such as CO2, CH4, N2O, water vapour,
ozone and chlorofluorocarbon. These GHGs absorb 95% of the long wave back radiations emitted from the
surface, thus making the Earth warmer. Except CO2, the effects of other GHGs are minor because of their low
concentration and also because of low residence times (e.g. water vapour and methane). The rise in CO2 level
causing global warming was first proposed by Svante Arrhenius, a Swedish scientist in 1896 and now it is a
widely accepted fact that the concentration of CO2 is the primary regulator of temperature on the Earth and
leads to global warming. The temperature of the Earth is continuously rising; between 1990 and 2005, the
temperature increased by 0.15–0.30C per decade; 11 of the 12 warmest years were noticed during 1995–2006
and in the future a rise of 0.20C per decade is projected. Climate change has an adverse impact on the Indian
groundwater reservoirs and hence, better management and mitigation strategies for minimizing the threats are
necessary.
4
Factors causing climate change
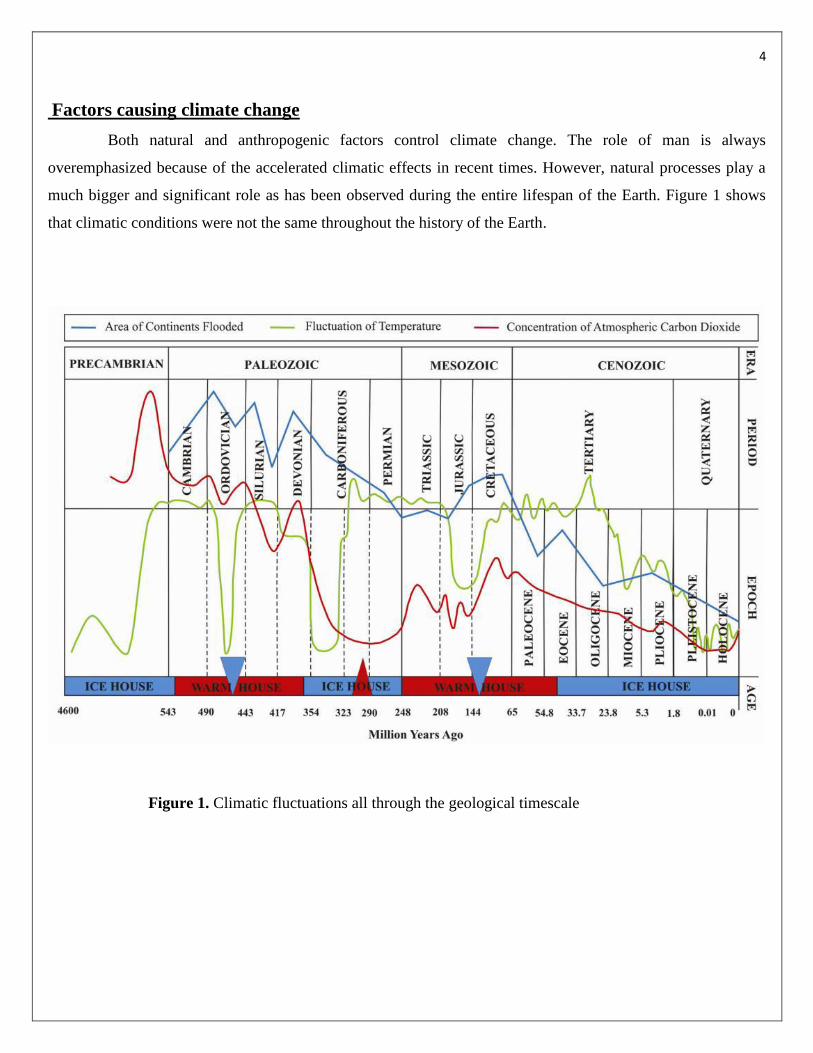
Both natural and anthropogenic factors control climate change. The role of man is always
overemphasized because of the accelerated climatic effects in recent times. However, natural processes play a
much bigger and significant role as has been observed during the entire lifespan of the Earth. Figure 1 shows
that climatic conditions were not the same throughout the history of the Earth.
Figure 1. Climatic fluctuations all through the geological timescale
5
Natural causes
The natural causes of climate change include the Earth’s axial and orbital changes, changes in the
strength of the Sun, plate movements, asteroid collision and chemical weathering each of these factors has been
discussed briefly in the following:
Changes in the strength of the Sun
The strength of the Sun is measured by the number of sunspots visible on its surface. The
concentration of CO2 decreases with the cooling of oceans and increases with their heating, proving that the Sun
is a primary driver of climate on Earth. The first satellite measurement carried out in 1978 pointed out that solar
radiation varies by 0.5% during every 11 years. This factor has been proved by the satellite measurements,
however the 11year span concept is still not well understood and accepted.
Earth’s axial and orbital changes
The change in the tilt of the axis of the Earth affects the amount of solar radiation received on the
surface; it shows a latitudinal difference and thus results in seasons on Earth. The Earth’s axial tilt at present is
23.5 and varies between 22.2 and 24.5. Increase in the tilt amplifies seasonal differences and decrease in the tilt
results in the reduction of seasonal differences and thus affects Earth’s climate.
The Earth’s orbit is also not constant and varies from circular to eccentric, and also changes the
distance between the Sun and Earth, thus resulting in variable solar radiations received by the Earth and in
climate change.
Plate tectonics
Seafloor spreading moves the continents at a steady rate, thus changing the latitudinal positions, which
leads to predictable changes in climate. The position of south magnetic pole during 430 m.y. ago coincides with
the climate change that has been observed, which showed the occurrence of large scale glaciations in the
modern day Sahara Desert. Volcanic eruptions also change the composition of the atmosphere by ejecting SO2,
CO2, water vapour and pyroclastic materials. BLAG hypothesis and uplift weathering hypothesis are used to
explain the relation between the plate tectonics and climate change processes.
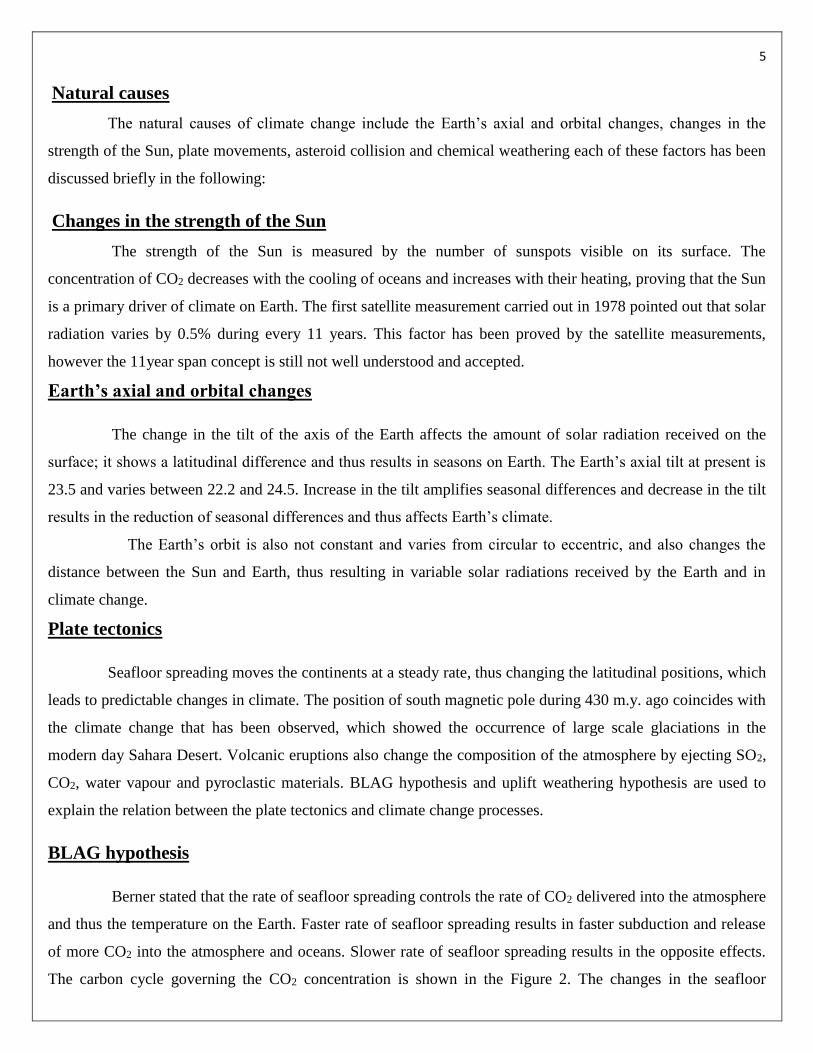
BLAG hypothesis
Berner stated that the rate of seafloor spreading controls the rate of CO2 delivered into the atmosphere
and thus the temperature on the Earth. Faster rate of seafloor spreading results in faster subduction and release
of more CO2 into the atmosphere and oceans. Slower rate of seafloor spreading results in the opposite effects.
The carbon cycle governing the CO2 concentration is shown in the Figure 2. The changes in the seafloor
6
spreading can alter the rate of subduction and magma generation and thus the concentration of CO2 in the
atmosphere
Figure 2. Global carbon cycle and CO2 pool in different reservoirs
Asteroid collision
This has been held responsible for destruction of large forms of life in the geologic past and also
caused instant climate change. However, such large sized (greater than 10 km radius) impacts are rare and
arrive on the Earth only after every 50–100 million years. The Earth has experienced such events during the
Permian Triassic boundary and at the Cretaceous Tertiary boundary which resulted in mass extinctions and in
the beginning of a new era.
Chemical weathering
The changes in CO2 concentration in the atmosphere can be related to the chemical weathering
processes, which include hydrolysis and dissolution. The process of hydrolysis involves weathering of
continental crust (mainly silicate minerals) by the action of carbonic acid such as
H2O + CO2 H2CO3
(Rain) (Atmosphere) (Carbonic acid)
CaSiO3 + H2CO3 CaCO3 + SiO2 +H2O
(Silicate rocks) (Carbonic acid) (Shells of organisms)
7
These reactions show CO2 uptake from the atmosphere getting deposited in the shells of the organisms and as
limestone deposits, thus controlling the CO2 concentration of the environment. Although this process takes
place during long intervals of geologic time, it still accounts for approximately 80% of the 0.15 gigatons of
carbon buried each year in ocean sediments.
The process of dissolution involves the dissolution of the carbonate deposits by the action of carbonic
acid as
H2O + CO2 H2CO3
(Rain) (Atmosphere) (Carbonic acid)
CaCO3 + H2CO3 CaCO3 + H2O + CO2
(Limestone) (Carbonic acid) (Shells of organisms) (Back to atmosphere)
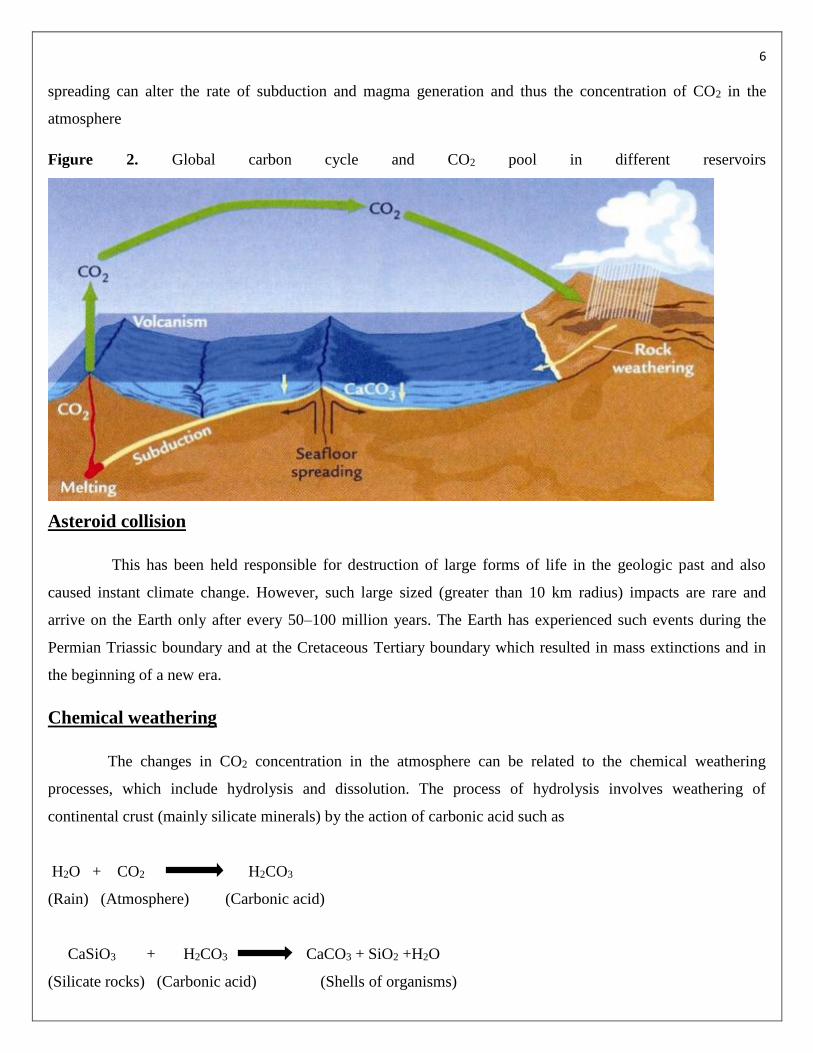
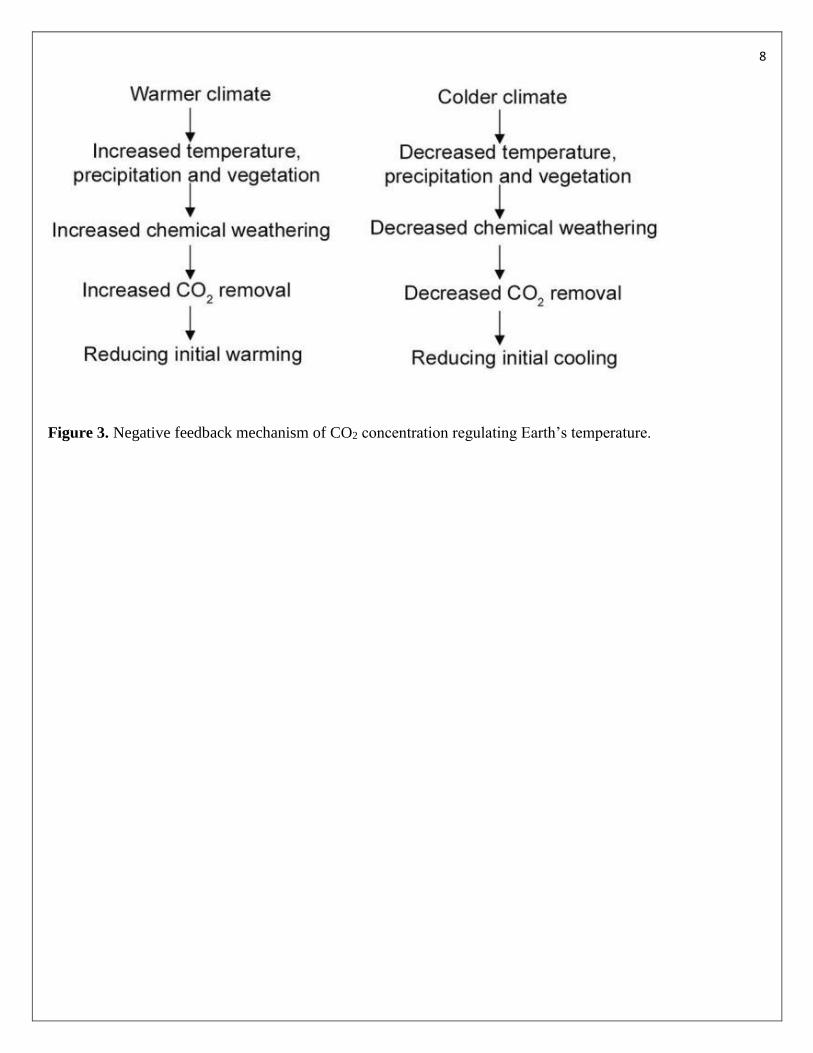
This process of dissolution occurs at a much faster rate than hydrolysis of silicates. Unlike hydrolysis,
it plays no role in the net CO2 removal from the atmosphere. The process of chemical weathering regulates the
Earth’s temperature through a negative feedback mechanism (Figure 3). Chemical weathering is dependent on
temperature, precipitation and vegetation conditions. During warm house, temperature, precipitation and
vegetation increase, which enhances chemical weathering, thus allowing rapid CO2 drawdown from the
atmosphere resulting in reduction in the warming. During icehouse, because of low temperature on the Earth,
chemical weathering shows opposing effects, thus acting as the Earth’s thermostat. The concept of chemical
weathering is best suited to explain the climate change events due to changes in solar insolation and changes in
rate of plate movements.
8
Figure 3. Negative feedback mechanism of CO2 concentration regulating Earth’s temperature.
9
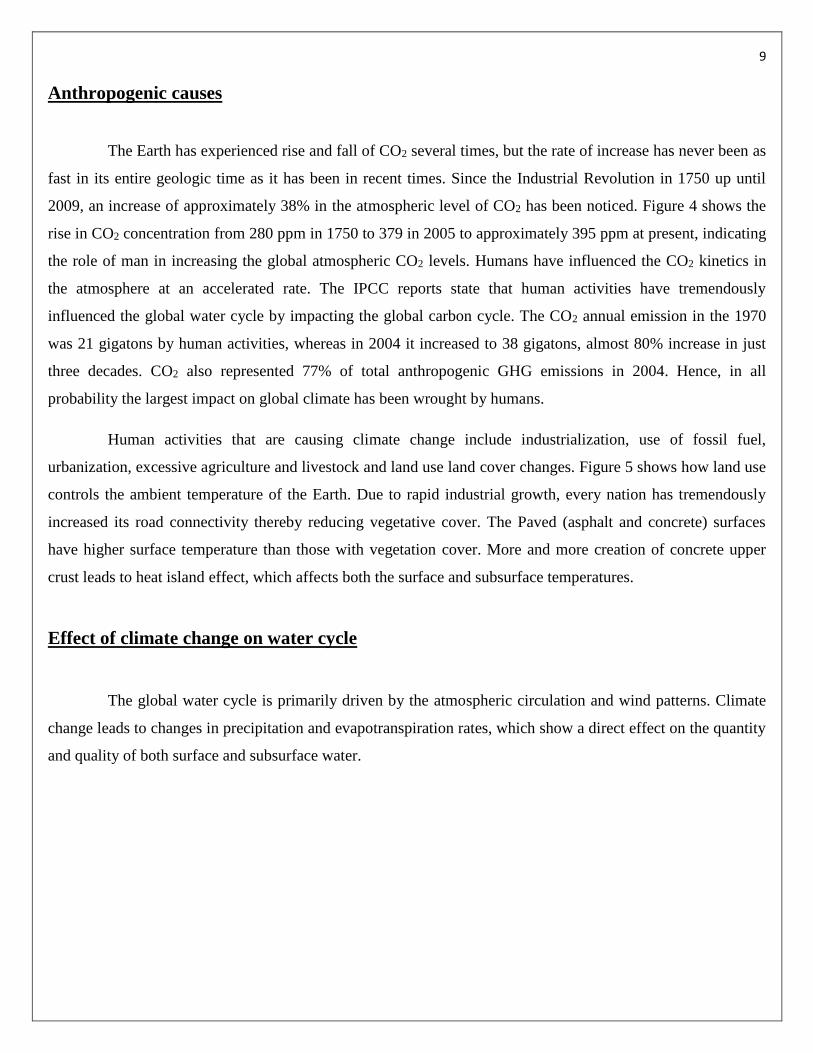
Anthropogenic causes
The Earth has experienced rise and fall of CO2 several times, but the rate of increase has never been as
fast in its entire geologic time as it has been in recent times. Since the Industrial Revolution in 1750 up until
2009, an increase of approximately 38% in the atmospheric level of CO2 has been noticed. Figure 4 shows the
rise in CO2 concentration from 280 ppm in 1750 to 379 in 2005 to approximately 395 ppm at present, indicating
the role of man in increasing the global atmospheric CO2 levels. Humans have influenced the CO2 kinetics in
the atmosphere at an accelerated rate. The IPCC reports state that human activities have tremendously
influenced the global water cycle by impacting the global carbon cycle. The CO2 annual emission in the 1970
was 21 gigatons by human activities, whereas in 2004 it increased to 38 gigatons, almost 80% increase in just
three decades. CO2 also represented 77% of total anthropogenic GHG emissions in 2004. Hence, in all
probability the largest impact on global climate has been wrought by humans.
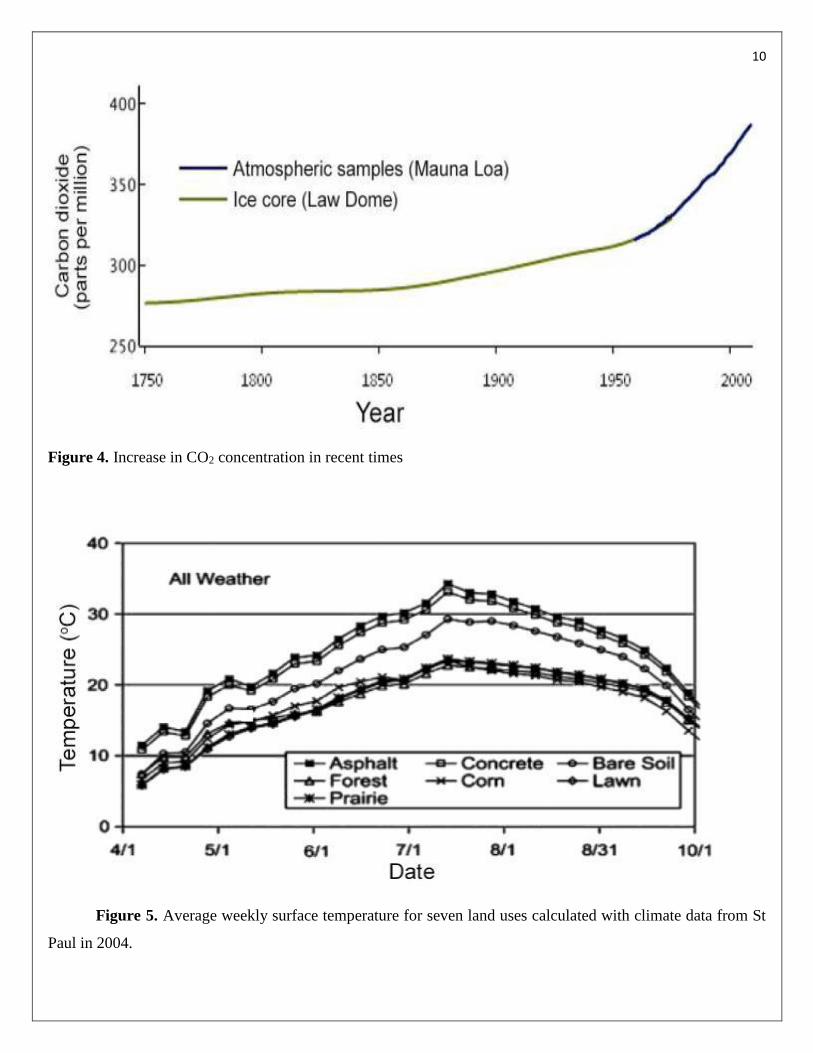
Human activities that are causing climate change include industrialization, use of fossil fuel,
urbanization, excessive agriculture and livestock and land use land cover changes. Figure 5 shows how land use
controls the ambient temperature of the Earth. Due to rapid industrial growth, every nation has tremendously
increased its road connectivity thereby reducing vegetative cover. The Paved (asphalt and concrete) surfaces
have higher surface temperature than those with vegetation cover. More and more creation of concrete upper
crust leads to heat island effect, which affects both the surface and subsurface temperatures.
Effect of climate change on water cycle
The global water cycle is primarily driven by the atmospheric circulation and wind patterns. Climate
change leads to changes in precipitation and evapotranspiration rates, which show a direct effect on the quantity
and quality of both surface and subsurface water.
10
Figure 4. Increase in CO2 concentration in recent times
Figure 5. Average weekly surface temperature for seven land uses calculated with climate data from St
Paul in 2004.
11
Increase in temperature increases the capacity of the atmosphere to hold water and thus precipitation rate may
increase. However, its effect on climate is spatio temporal, being controlled by local or regional factors such as
topography, vegetation, wind velocity, etc. Hence, both an increase and decrease in the precipitation rate is
envisaged. As evapotranspiration is dependent on the vegetation, soils types and on the amount of water
available, it may also be expected to show spatio temporal changes.
Impact of Climate Change on Groundwater Resources
Although the most noticeable impacts of climate change could be fluctuations in surface water levels
and quality, the greatest concern of water managers and government is the potential decrease and quality of
groundwater supplies, as it is the main available potable water supply source for human consumption and
irrigation of agriculture produce worldwide. Because groundwater aquifers are recharged mainly by
precipitation or through interaction with surface water bodies, the direct influence of climate change on
precipitation and surface water ultimately affects groundwater systems.
It is increasingly recognized that groundwater cannot be considered in isolation from the landscape
above the society with which it interacts or from the regional hydrological cycle, but needs to be managed
holistically. In understanding the likely consequences of possible future (climate and non-climate) changes on
groundwater systems and the regional hydrological cycle, an important (but not exclusive) component to
understand is the influence that these factors exert on recharge and runoff.
It is important to consider the potential impacts of climate change on groundwater systems. As part of
the hydrologic cycle, it can be anticipated that groundwater systems will be affected by changes in recharge
(which encompasses changes in precipitation and evapotranspiration), potentially by changes in the nature of
the interactions between the groundwater and surface water systems, and changes in use related to irrigation.
12
(a) Soil Moisture
The amount of water stored in the soil is fundamentally important to agriculture and has an influence
on the rate of actual evaporation, groundwater recharge, and generation of runoff. Soil moisture contents are
directly simulated by global climate models, albeit over a very coarse spatial resolution, and outputs from these
models give an indication of possible directions of change.
The local effects of climate change on soil moisture, however, will vary not only with the degree of
climate change but also with soil characteristics. The water holding capacity of soil will affect possible changes
in soil moisture deficits; the lower the capacity, the greater the sensitivity to climate change. Climate change
also may affect soil characteristics, perhaps through changes in waterlogging or cracking, which in turn may
affect soil moisture storage properties. Infiltration capacity and water holding capacity of many soils are
influenced by the frequency and intensity of freezing.
(b) Groundwater Recharge and Resources
Groundwater is the major source of water across much of the world, particularly in rural areas in
arid and semi-arid regions, but there has been very little research on the potential effects of climate change.
Aquifers generally are replenished by effective rainfall, rivers, and lakes. This water may reach the aquifer
rapidly, through macro pores or fissures, or more slowly by infiltrating through soils and permeable rocks
overlying the aquifer. A change in the amount of effective rainfall will alter recharge, but so will a change in the
duration of the recharge season. Increased winter rainfall, as projected under most scenarios for mid-latitudes,
generally is likely to result in increased groundwater recharge. However, higher evaporation may mean that soil
deficits persist for longer and commence earlier, offsetting an increase in total effective rainfall. Various types
of aquifer will be recharged differently. The main types are unconfined and confined aquifers. An unconfined
aquifer is recharged directly by local rainfall, rivers, and lakes, and the rate of recharge will be influenced by the
permeability of overlying rocks and soils.
Macro pore and fissure recharge is most common in porous and aggregated forest soils and less
common in poorly structured soils. It also occurs where the underlying geology is highly fractured or is
characterized by numerous sinkholes. Such recharge can be very important in some semi-arid areas. In
principle, “rapid” recharge can occur whenever it rains, so where recharge is dominated by this process it will
be affected more by changes in rainfall amount than by the seasonal cycle of soil moisture variability.
Shallow unconfined aquifers along floodplains, which are most common in semi-arid and arid
environments, are recharged by seasonal stream flows and can be depleted directly by evaporation. Changes in
recharge therefore will be determined by changes in the duration of flow of these streams, which may locally
13
increase or decrease, and the permeability of the overlying beds, but increased evaporative demands would tend
to lead to lower groundwater storage. The thick layer of sands substantially reduces the impact of evaporation.
It will be noted from the foregoing that unconfined aquifers are sensitive to local climate change,
abstraction, and seawater intrusion. However, quantification of recharge is complicated by the characteristics of
the aquifers themselves as well as overlying rocks and soils. A confined aquifer, on the other hand, is
characterized by an overlying bed that is impermeable, and local rainfall does not influence the aquifer. It is
normally recharged from lakes, rivers, and rainfall that may occur at distances ranging from a few kilometers to
thousands of kilometers.
Aside from the influence of climate, recharge to aquifers is very much dependent on the
characteristics of the aquifer media and the properties of the overlying soils. Several approaches can be used to
estimate recharge based on surface water, unsaturated zone and groundwater data. Among these approaches,
numerical modelling is the only tool that can predict recharge. Modelling is also extremely useful for
identifying the relative importance of different controls on recharge, provided that the model realistically
accounts for all the processes involved. However, the accuracy of recharge estimates depends largely on the
availability of high quality hydro geologic and climatic data. Determining the potential impact of climate
change on groundwater resources, in particular, is difficult due to the complexity of the recharge process, and
the variation of recharge within and between different climatic zones.
Attempts have been made to calculate the rate of recharge by using carbon-14 isotopes and other
modeling techniques. This has been possible for aquifers that are recharged from short distances and after short
durations. However, recharge that takes place from long distances and after decades or centuries has been
problematic to calculate with accuracy, making estimation of the impacts of climate change difficult. The
medium through which recharge takes place often is poorly known and very heterogeneous, again challenging
recharge modeling. In general, there is a need to intensify research on modeling techniques, aquifer
characteristics, recharge rates, and seawater intrusion, as well as monitoring of groundwater abstractions. This
research will provide a sound basis for assessment of the impacts of climate change and sea-level rise on
recharge and groundwater resources.
Coastal Aquifers
When considering water resources in coastal zones, coastal aquifers are important sources of
freshwater. However, salinity intrusion can be a major problem in these zones. Salinity intrusion refers to
replacement of freshwater in coastal aquifers by saltwater. It leads to a reduction of available fresh groundwater
resources. Changes in climatic variables can significantly alter groundwater recharge rates for major aquifer
14
systems and thus affect the availability of fresh groundwater. Salinization of coastal aquifers is a function of the
reduction of groundwater recharge and results in a reduction of fresh groundwater resources.
Sea-level rise will cause saline intrusion into coastal aquifers, with the amount of intrusion depending
on local groundwater gradients. Shallow coastal aquifers are at greatest risk. Groundwater in low-lying islands
therefore is very sensitive to change. A reduction in precipitation coupled with sea-level rise would not only
cause a diminution of the harvestable volume of water; it also would reduce the size of the narrow freshwater
lense. For many small island states, such as some Caribbean islands, seawater intrusion into freshwater aquifers
has been observed as a result of over pumping of aquifers. Any sea-level rise would worsen the situation.
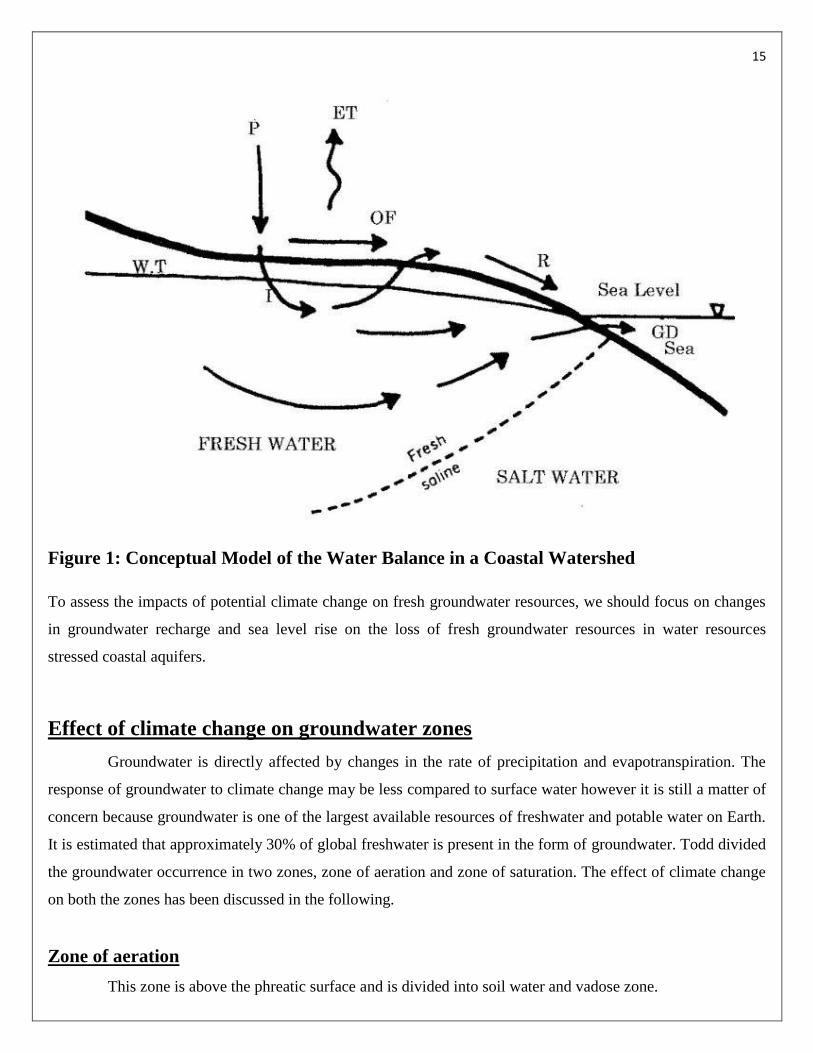
A link between rising sea level and changes in the water balance is suggested by a general description
of the hydraulics of groundwater discharge at the coast. Fresh groundwater rides up over denser, salt water in
the aquifer on its way to the sea (Figure 1), and groundwater discharge is focused into a narrow zone that
overlaps with the intertidal zone. The width of the zone of groundwater discharge measured perpendicular to the
coast, is directly proportional to the discharge rate. The shape of the water table and the depth to the
freshwater/saline interface are controlled by the difference in density between freshwater and salt water, the rate
of freshwater discharge and the hydraulic properties of the aquifer. The elevation of the water table is controlled
by mean sea level through hydrostatic equilibrium at the shore.
15
Figure 1: Conceptual Model of the Water Balance in a Coastal Watershed
To assess the impacts of potential climate change on fresh groundwater resources, we should focus on changes
in groundwater recharge and sea level rise on the loss of fresh groundwater resources in water resources
stressed coastal aquifers.
Effect of climate change on groundwater zones
Groundwater is directly affected by changes in the rate of precipitation and evapotranspiration. The
response of groundwater to climate change may be less compared to surface water however it is still a matter of
concern because groundwater is one of the largest available resources of freshwater and potable water on Earth.
It is estimated that approximately 30% of global freshwater is present in the form of groundwater. Todd divided
the groundwater occurrence in two zones, zone of aeration and zone of saturation. The effect of climate change
on both the zones has been discussed in the following.
Zone of aeration
This zone is above the phreatic surface and is divided into soil water and vadose zone.
16
Soil water zone: This zone is important as it supports vegetation and all biogeochemical reactions. Climate
change has an adverse effect on this zone. Higher temperature leads to higher evapotranspiration rates, resulting
in less moisture content in this zone. Little or no moisture in the soil leads the penetration of solar radiation into
the deeper soils and increased dryness in soils, resulting in severe droughts. The high precipitation in wet
climate change scenario will increase surface runoff and in promoting rapid soil erosion. Less infiltration, high
evapotranspiration and high run-off will have a great impact on the water availability in this zone, which will
affect the entire plant and animal kingdom. Because of change in evapotranspiration patterns in this zone, the
rainfall pattern will also be affected. The transpiration process which holds 80–90% of overall
evapotranspiration on Earth will show various changes depending on the regional vegetation. The increase in
CO2 will increase the stomatal resistance of some plants to resist water and prevent transpiration and thus
rainfall. However, in other plant genera, the CO2 increment will promote plant growth and hence the increase in
area of transpiring tissue may result in higher transpiration and precipitation. Seneviratne et al. have shown that
less soil moisture will increase soil suction making it difficult for plants to uptake moisture from the soil.
Vadose zone
This is the dynamic zone which undergoes complex interactions between hydrologic and geochemical
processes that control the quality and quantity of groundwater percolating down to saturated zone. Changes in
vadose zone due to climate change can be computed by studying the variations in major cations, anions, trace
elements and isotopes from the pore water. The results vary from aquifer to aquifer and from region to region,
and are used to distinguish changes due to climate change and human-induced perturbations. Due to increase in
surface temperature, groundwater temperature will increase. The change in temperature will affect pore water
chemistry, residence time and volume of water in matrix and fractures, and thus the composition of the water.
These changes in the water chemistry will be spatio temporal depending on both the water composition and
underground lithology. The increase in recharge rate will help in mobilizing the contaminants into greater
depths. As an example, in semiarid and arid regions, increased infiltration can mobilize large, pore-water
chloride and nitrate reservoirs affecting the quality of water. The diurnal temperature fluctuations may be
detectable at depths of less than 1 m in the unsaturated zone and seasonal fluctuations at depths of 10 m or
more, indicating that that the climate change effects depend on depth and are slow in the deep vadose zone.
Zone of saturation
Groundwater in the saturated zone is important as it is less polluted and has no effects of
evapotranspiration. The sensitivity of this zone depends on the depth of the water table; shallow aquifers are
more vulnerable to cli-mate change than deeper aquifers. This zone responds to climate change by showing
changes in its amount, quality and flow of water depending on the trends of precipitation, evapotranspiration,
recharge and discharge. The response of the saturated zone will be more in terms of storativity, as this property
17
depends on the volume of water. It is generally observed that climate change has less effect on this zone in
comparison to human activities on groundwater exploitation, such as excessive pumping, reduction in recharge
rate and contamination.
Effect of climate change on discharge
Under a varied climate change scenario, spatio temporal variation in precipitation, evapotranspiration,
and recharge and runoff will directly affect the discharge patterns. Under wet climate scenarios, runoff is
considered as a most sensitive component and the combined effect of increased precipitation and high discharge
will increase the risk of flooding. Under dry climate scenarios, recharge will be the most sensitive component as
evapotranspiration will increase while both recharge and discharge will decrease in all seasons, resulting in
decline in ground water level.
Increased discharge from melting of glaciers in the Himalayas will increase the risk of flooding in the
catchment areas affecting major parts of North India, Pakistan and Bangladesh. Due to changes in discharge, the
quality of groundwater will be adversely affected, since during high discharge all the pollutants will be
mobilized and may reach groundwater level. Increase in groundwater discharge may also lead to increase in sea
level. Increase in the sea level deteriorates the water quality by increasing the salt content in the coastal and
continental aquifers, resulting in health problems and drinking water scarcity.
In the case of a dry climate scenario, generally the water level will fall and this will affect the needs of
the people and may result in increased use of energy to extract water. The conditions will be worst for arid and
semiarid regions of the world. The increase in groundwater pumping and loss of groundwater storage from
aquifers resulted in land subsidence in many Asian cities such as Osaka and Bangkok. In future, the increase in
discharge and decrease in recharge will make land subsidence a much bigger problem.
Effects of climate change on groundwater quality
With the use of modern technology, the water needs can be fulfilled by better exploration and
extraction methods. However, quality assurance of groundwater is much more essential as it relates to the
various uses of water. The groundwater quality relates to the physical, chemical and biological properties of the
aquifers, which are controlled by climatic fluctuations.
As has been mentioned earlier, changes in the recharge rate and the groundwater temperature in the
vadose zone affect its pore water chemistry, contaminant transport and residence time, thus affecting the quality
of water. Under a climate change scenario, the following events can deteriorate the groundwater quality. During

18
the wet scenario, increased infiltration can mobilize large pore-water chloride and nitrate reservoirs in the
vadose zone of semiarid and arid regions. Increase in recharge leads to the dissolution of carbonates; increase in
Ca content may increase the hardness of groundwater. During a dry scenario, the increase in total dissolved
solids may deteriorate the groundwater quality by increased salt content. The higher saline water may also result
in scaling of industrial boilers.
19
EFFECT OF CLIMATE CHANGE ON GROUND WATER RESOURCES OF INDIA
India’s groundwater status and utilization
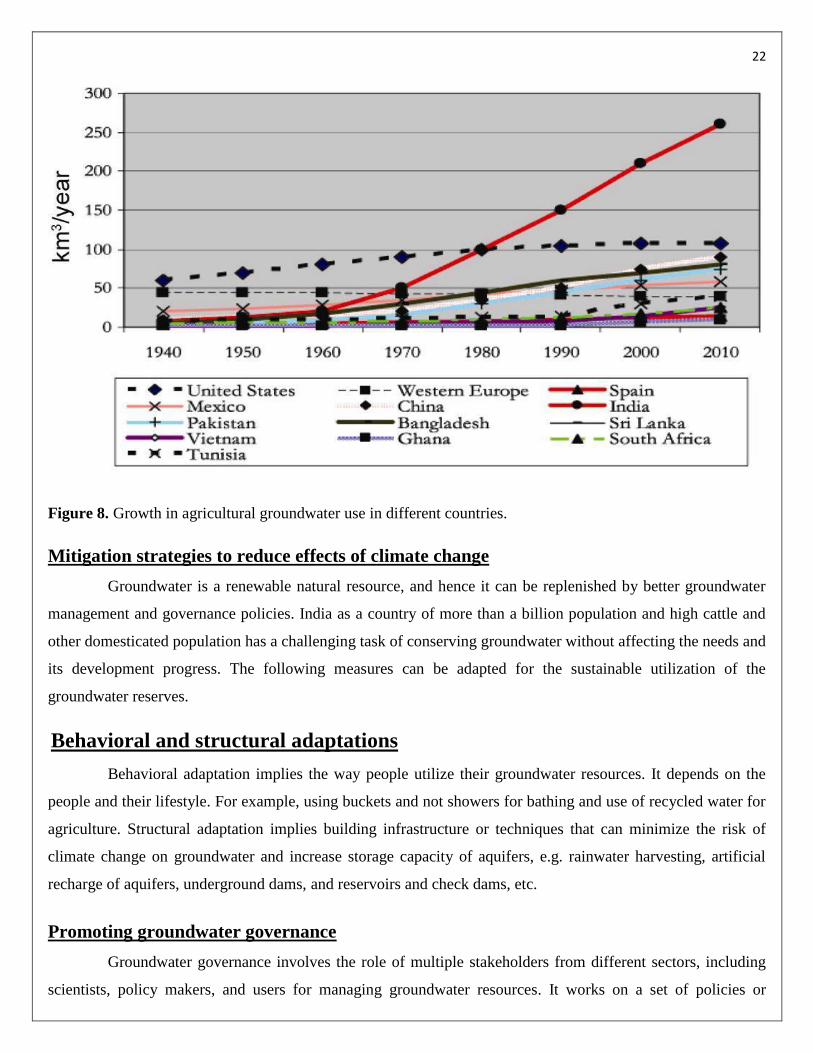
India accounts for 2.45% of land area and 16% of the world population, whereas only 4% of
freshwater resources of the world are available in India, of which 38.5% is groundwater. In the 1940s, India was
utilizing less groundwater compared to USA and Europe, but by 2000, India utilized around 220–230 billion m3
year-1, over twice that the USA (Figure 8). The groundwater resources in India are important, as they supply
80% of domestic needs and more than 45% of total irrigation requirement. The estimated average precipitation
in India is 4000 BCM (billion cubic meters) 1869 BCM flows into rivers and 1123 BCM occurs as utilizable
water, of which surface water has a share of 690 BCM and groundwater contributes 433 BCM.
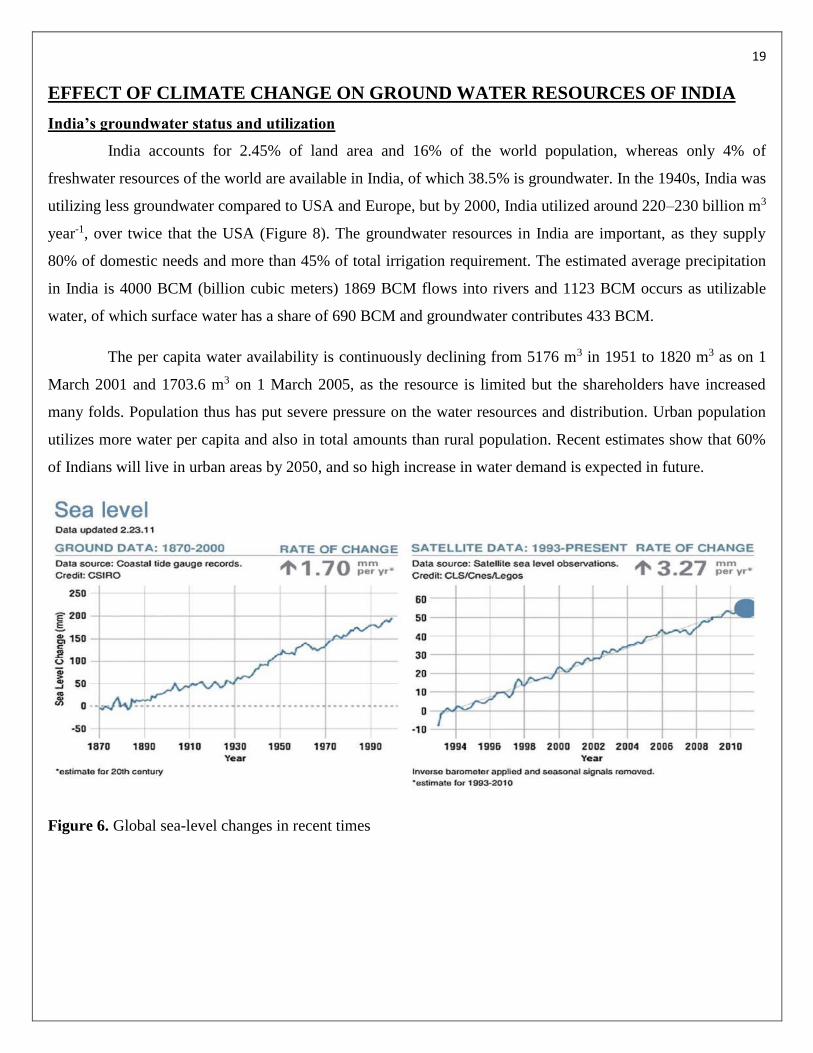
The per capita water availability is continuously declining from 5176 m3 in 1951 to 1820 m3 as on 1
March 2001 and 1703.6 m3 on 1 March 2005, as the resource is limited but the shareholders have increased
many folds. Population thus has put severe pressure on the water resources and distribution. Urban population
utilizes more water per capita and also in total amounts than rural population. Recent estimates show that 60%
of Indians will live in urban areas by 2050, and so high increase in water demand is expected in future.
Figure 6. Global sea-level changes in recent times
20
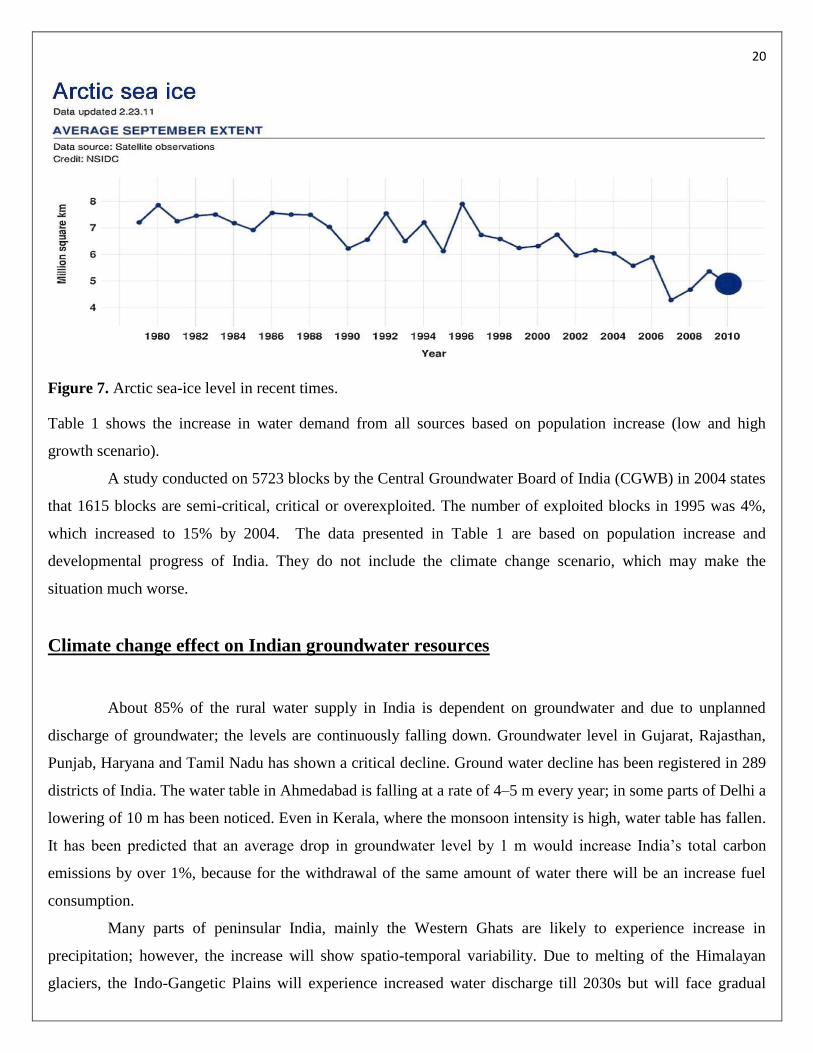
Figure 7. Arctic sea-ice level in recent times.
Table 1 shows the increase in water demand from all sources based on population increase (low and high
growth scenario).
A study conducted on 5723 blocks by the Central Groundwater Board of India (CGWB) in 2004 states
that 1615 blocks are semi-critical, critical or overexploited. The number of exploited blocks in 1995 was 4%,
which increased to 15% by 2004. The data presented in Table 1 are based on population increase and
developmental progress of India. They do not include the climate change scenario, which may make the
situation much worse.
Climate change effect on Indian groundwater resources
About 85% of the rural water supply in India is dependent on groundwater and due to unplanned
discharge of groundwater; the levels are continuously falling down. Groundwater level in Gujarat, Rajasthan,
Punjab, Haryana and Tamil Nadu has shown a critical decline. Ground water decline has been registered in 289
districts of India. The water table in Ahmedabad is falling at a rate of 4–5 m every year; in some parts of Delhi a
lowering of 10 m has been noticed. Even in Kerala, where the monsoon intensity is high, water table has fallen.
It has been predicted that an average drop in groundwater level by 1 m would increase India’s total carbon
emissions by over 1%, because for the withdrawal of the same amount of water there will be an increase fuel
consumption.
Many parts of peninsular India, mainly the Western Ghats are likely to experience increase in
precipitation; however, the increase will show spatio-temporal variability. Due to melting of the Himalayan
glaciers, the Indo-Gangetic Plains will experience increased water discharge till 2030s but will face gradual
21
reductions thereafter. This increase in precipitation may show higher flooding, devastating major parts of India.
At present northern India is losing groundwater at a rate of 549 km3/year (between April 2002 and June 2008).
This rate of high runoff and low recharge will lead to degradation of aquifer in the northern plains of India. A
10C rise in temperature will increase the water demand by 313.12 MCM for arid regions of Rajasthan. As a
result of high temperature, the intensity of cyclones will increase and as India has a long coastline of 7517 km,
the effect will pose a great threat to the population residing in the coastal regions. Sea-water intrusion has been
observed in several coastal states of India, such as Tamil Nadu, Pondicherry and Gujarat, which is not only
engulfing the land but also the groundwater reservoirs.
The changes in precipitation and evapotranspiration trends, droughts, floods and tropical cyclones will
have a negative impact on agricultural production. In India, winter precipitation is projected to decline in the
future, and hence will result in increasing the demand of water for irrigating rabbi crops. Kharif crop production
will also have to cope with heavy floods and droughts. Increased temperature will favour the growth of weeds
and their shifting to the higher latitudes. As a result, environmental stress on crops may increase, which may
become more vulnerable to insects, pathogens and weeds. The effect of weed growth on yield suggests losses in
the range 28–74% in rice and 15–80% in wheat, and these drawbacks shall have an adverse impact on the
nation’s economic growth and GDP. India is highly sensitive to climate change in terms of its effect on water
supply for irrigation needs.
22
Figure 8. Growth in agricultural groundwater use in different countries.
Mitigation strategies to reduce effects of climate change
Groundwater is a renewable natural resource, and hence it can be replenished by better groundwater
management and governance policies. India as a country of more than a billion population and high cattle and
other domesticated population has a challenging task of conserving groundwater without affecting the needs and
its development progress. The following measures can be adapted for the sustainable utilization of the
groundwater reserves.
Behavioral and structural adaptations
Behavioral adaptation implies the way people utilize their groundwater resources. It depends on the
people and their lifestyle. For example, using buckets and not showers for bathing and use of recycled water for
agriculture. Structural adaptation implies building infrastructure or techniques that can minimize the risk of
climate change on groundwater and increase storage capacity of aquifers, e.g. rainwater harvesting, artificial
recharge of aquifers, underground dams, and reservoirs and check dams, etc.
Promoting groundwater governance
Groundwater governance involves the role of multiple stakeholders from different sectors, including
scientists, policy makers, and users for managing groundwater resources. It works on a set of policies or
23
decisions that manages and develops groundwater resources and protects aquifers. Local groundwater
governance can be an effective way of managing groundwater resources as the individual is also involved in it
and if the action is taken at the micro watershed level, it will be an important step in the protection of
groundwater resources.
Defining groundwater risk zones and climate change mapping
Spatio temporal effect of climate change on aquifers should be assessed and based on this risk
assessment of each aquifer should be rated and actions and policies should be designed accordingly. Climate
change mapping on different resources will give better results and answers about the vulnerability and risks
involved over time for a specific area. Research should also be promoted to fetch better results from the positive
effects of climate change, with the aim of reducing the negative effects.
Promoting afforestation
Trees are the sinks for CO2 on the Earth, and to minimize the effect of global warming, afforestation is
the best way, with the aim of reducing deforestation. Land use development planning should emphasize on
planting more trees and increasing recharge area.
CO2 sequestration
Due to unusually large amounts of CO2 added to the atmosphere, carbon cycle is insufficient to
maintain the balance. For example, annual carbon emissions from the use of fossil fuels in USA accounts for
1.6 gigatons, whereas the natural annual uptake is only about 0.5 gigatons, i.e. 1.1 gigatons per year remains in
the atmosphere. This extra CO2 is responsible for global warming, which can be trapped in forests, grasslands,
oceans and in the sedimentary formations such as coals. However, this sequestration processes is also beset with
many environmental issues and concerns.
24
Recent Studies on Impact of Climate Change on Groundwater
Raposo et al. (2013)
He assessed the impact of future climate change on groundwater recharge in Galicia-Costa, Spain.
Climate change can impact the hydrological processes of a watershed and may result in problems with future
water supply for large sections of the population. Results from the FP5 PRUDENCE project suggest significant
changes in temperature and precipitation over Europe. In this study, the Soil and Water Assessment Tool
(SWAT) model was used to assess the potential impacts of climate change on groundwater recharge in the
hydrological district of Galicia Costa, Spain. Climate projections from two general circulation models and eight
different regional climate models were used for the assessment and two climate-change scenarios were
evaluated. Calibration and validation of the model were performed using a daily time-step in four representative
catchments in the district. The effects on modeled mean annual groundwater recharge are small, partly due to
the greater stomatal efficiency of plants in response to increased CO2 concentration. However, climate change
strongly influences the temporal variability of modeled groundwater recharge. Recharge may concentrate in the
winter season and dramatically decrease in the summer autumn season. As a result, the dry-season duration may
be increased on average by almost 30 % for the A2 emission scenario, exacerbating the current problems in
water supply.
Lapworth et al. (2013)
He estimated residence times of shallow groundwater in West Africa. Although shallow groundwater
(<50 mbgl) sustains the vast majority of improved drinking water supplies in rural Africa, there is little
information on how resilient this resource may be to future changes in climate. This study presents results of a
groundwater survey using stable isotopes, CFCs, SF6, and 3H across different climatic zones (annual rainfall
400–2,000 mm/year) in West Africa. The purpose was to quantify the residence times of shallow groundwater
in sedimentary and basement aquifers, and investigate the relationship between groundwater resources and
climate. Stable isotope results indicate that most shallow ground waters are recharged rapidly following rainfall,
showing little evidence of evaporation prior to recharge. Chloride mass balance results indicate that within the
arid areas (<400 mm annual rainfall) there is recharge of up to 20 mm/year. Age tracers show that most
groundwater have mean residence times (MRTs) of 32–65 years, with comparable MRTs in the different
climate zones. Similar MRTs measured in both the sedimentary and basement aquifers suggest similar hydraulic
diffusivity and significant groundwater storage within the shallow basement. This suggests there is considerable
resilience to short term inter annual variation in rainfall and recharge, and rural groundwater resources are likely
to sustain diffuse, low volume abstraction.
25
Mollema and Antonellini (2013)
He investigated seasonal variation in natural recharge of coastal aquifers. Many coastal zones around
the world have irregular precipitation throughout the year. This results in discontinuous natural recharge of
coastal aquifers, which affects the size of freshwater lenses present in sandy deposits. Temperature data for the
period 1960–1990 from LocClim (local climate estimator) and those obtained from the Intergovernmental Panel
on Climate Change (IPCC) SRES A1b scenario for 2070–2100, have been used to calculate the potential
evapotranspiration with the Thornthwaite method. Potential recharge (difference between precipitation and
potential evapotranspiration) was defined at 12 locations: Ameland (The Netherlands), Auckland and
Wellington (New Zealand); Hong Kong (China); Ravenna (Italy), Mekong (Vietnam), Mumbai (India), New
Jersey (USA), Nile Delta (Egypt), Kobe and Tokyo (Japan), and Singapore. The influence of
variable/discontinuous recharge on the size of freshwater lenses was simulated with the SEAWAT model. The
discrepancy between models with continuous and with discontinuous recharge is relatively small in areas where
the total annual recharge is low (258–616 mm/year); but in places with Monsoon-dominated climate (e.g.
Mumbai, with recharge up to 1,686 mm/year), the difference in freshwater-lens thickness between the
discontinuous and the continuous model is larger (up to 5 m) and thus important to consider in numerical
models that estimate freshwater availability.
26
CASE STUDIES
CASE STUDY 1:
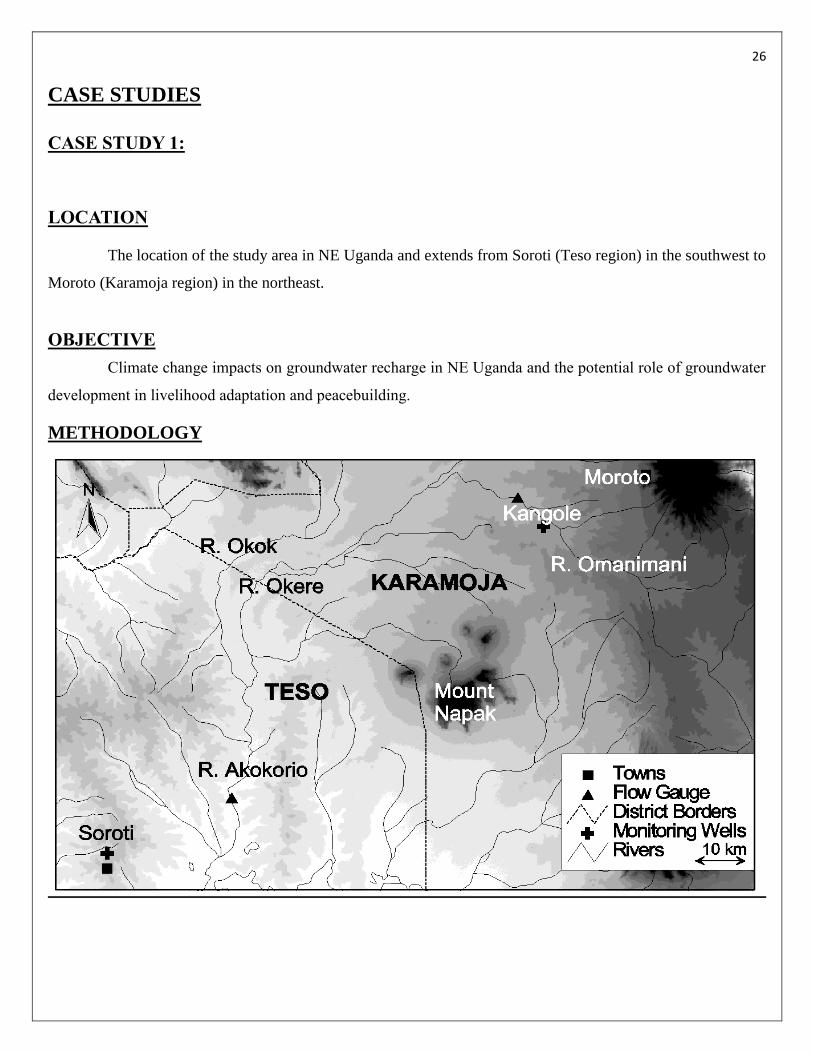
LOCATION
The location of the study area in NE Uganda and extends from Soroti (Teso region) in the southwest to
Moroto (Karamoja region) in the northeast.
OBJECTIVE
Climate change impacts on groundwater recharge in NE Uganda and the potential role of groundwater
development in livelihood adaptation and peacebuilding.
METHODOLOGY
27
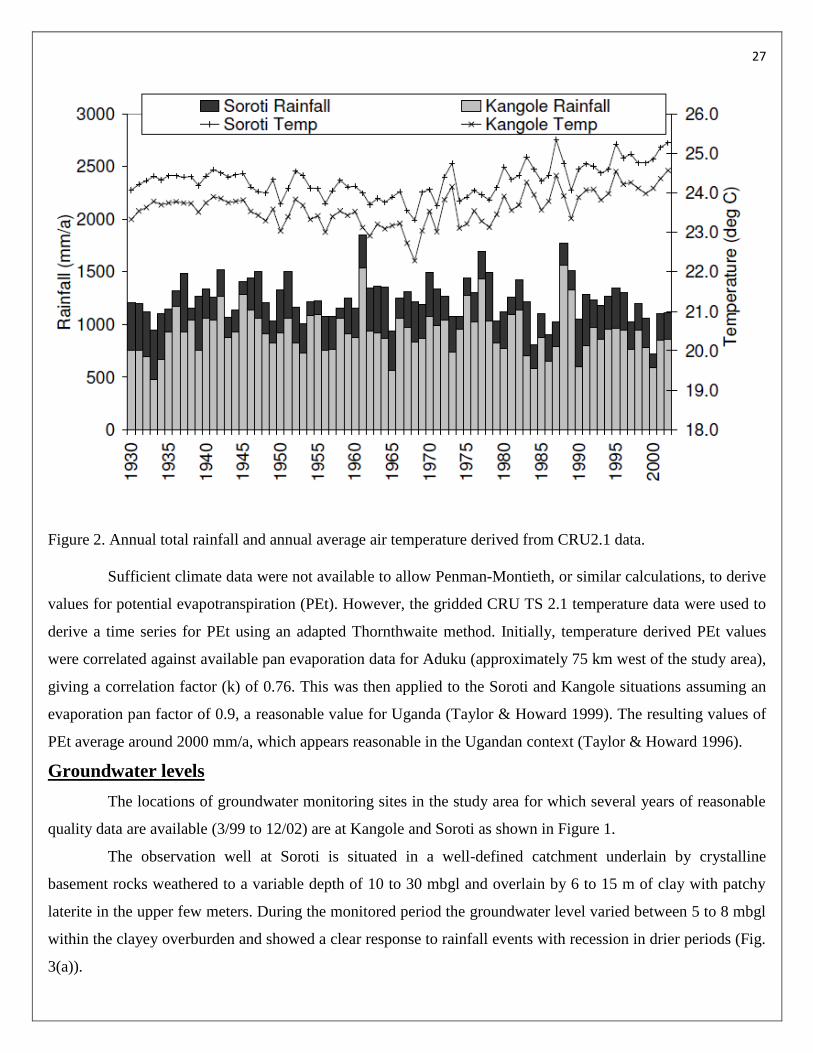
Figure 2. Annual total rainfall and annual average air temperature derived from CRU2.1 data.
Sufficient climate data were not available to allow Penman-Montieth, or similar calculations, to derive
values for potential evapotranspiration (PEt). However, the gridded CRU TS 2.1 temperature data were used to
derive a time series for PEt using an adapted Thornthwaite method. Initially, temperature derived PEt values
were correlated against available pan evaporation data for Aduku (approximately 75 km west of the study area),
giving a correlation factor (k) of 0.76. This was then applied to the Soroti and Kangole situations assuming an
evaporation pan factor of 0.9, a reasonable value for Uganda (Taylor & Howard 1999). The resulting values of
PEt average around 2000 mm/a, which appears reasonable in the Ugandan context (Taylor & Howard 1996).
Groundwater levels
The locations of groundwater monitoring sites in the study area for which several years of reasonable
quality data are available (3/99 to 12/02) are at Kangole and Soroti as shown in Figure 1.
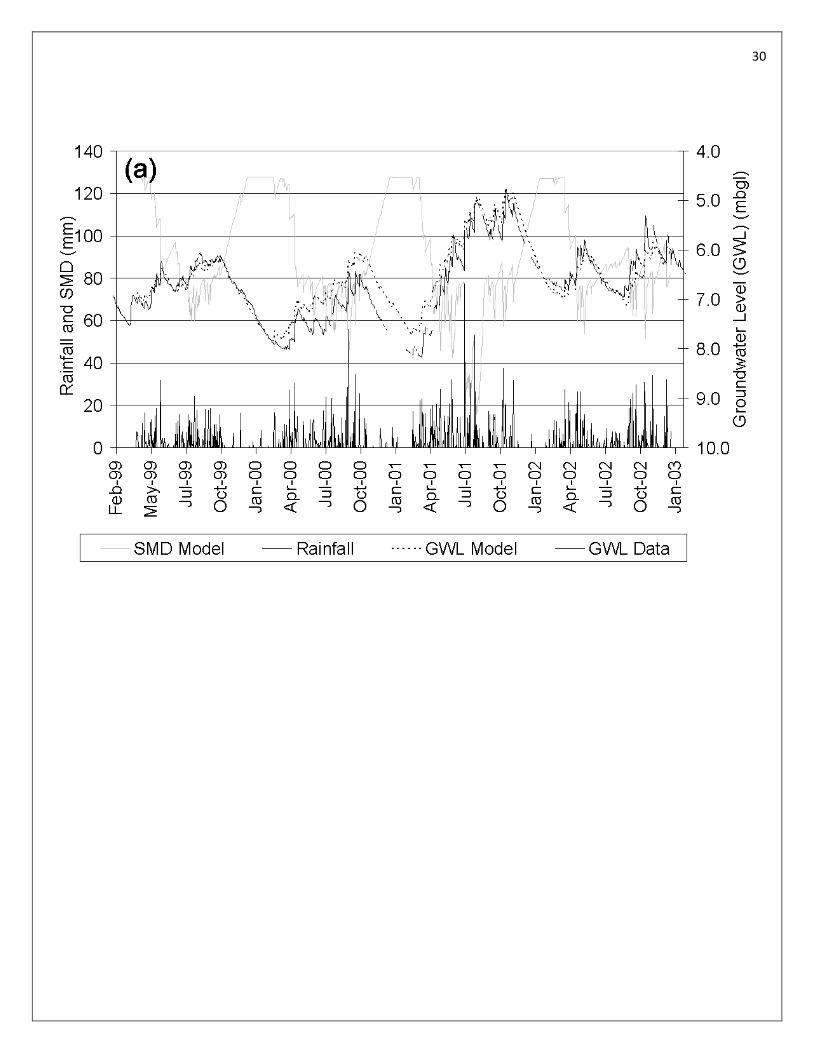
The observation well at Soroti is situated in a well-defined catchment underlain by crystalline
basement rocks weathered to a variable depth of 10 to 30 mbgl and overlain by 6 to 15 m of clay with patchy
laterite in the upper few meters. During the monitored period the groundwater level varied between 5 to 8 mbgl
within the clayey overburden and showed a clear response to rainfall events with recession in drier periods (Fig.
3(a)).
28
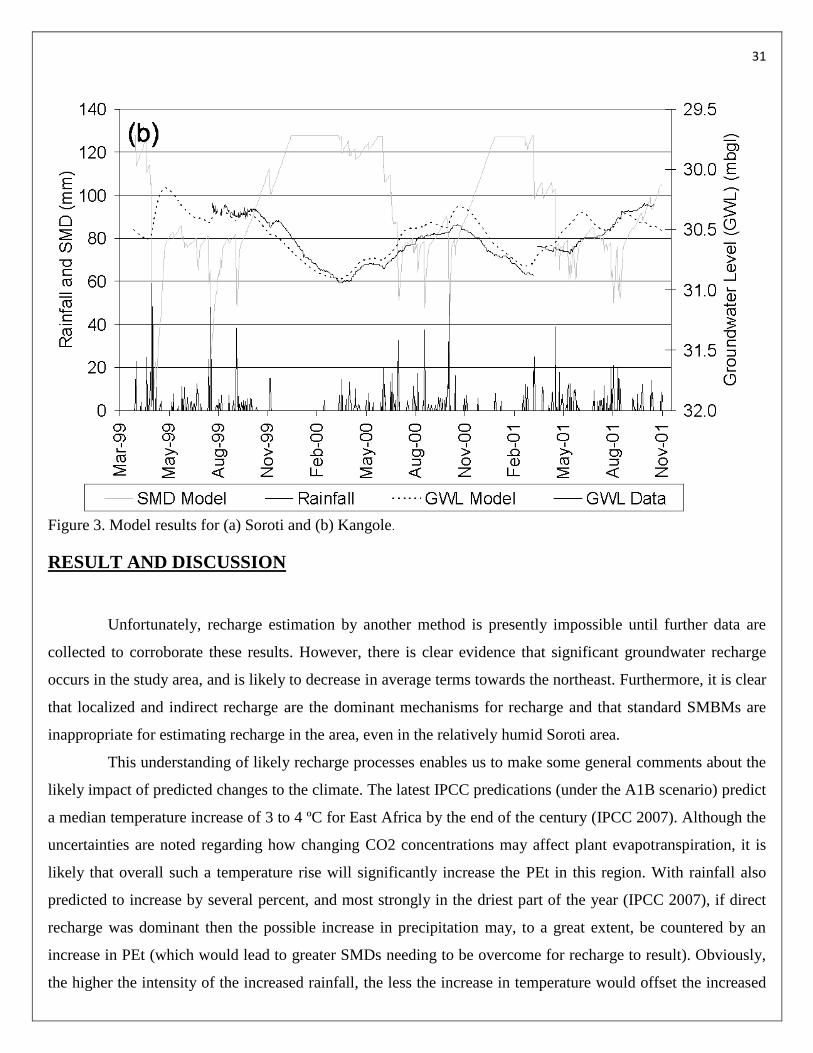
In contrast, the Kangole observation well is situated close to the Omanimani River, a sand river in
which water is commonly held within shallow alluvium for much of the year. It is underlain by crystalline rocks
with alluvial and weathered material to depths of up to 20 mbgl. Groundwater levels show seasonal variations
between 30 to 31 mbgl within the fractured un-weathered zone (Fig. 3(b)). The slow groundwater response to
rainfall is likely to be due to the thick unsaturated zone, perhaps with a seasonally saturated upper alluvium
feeding deeper fractures monitored by the observation well after periods of prolonged or heavy rainfall.
RECHARGE MODELS
Model implementation and results
Soroti
It was assumed that shallow groundwater in the Soroti catchment drains to the nearby stream and that
recession of this base flow and thus, groundwater levels in the groundwater catchment feeding the stream, will
be of an exponential form. Hence, modeled recharge was added to a groundwater store which then drained
according to a linear recession constant (d-1).
Methods for estimating groundwater recharge based on groundwater level fluctuations are prone to
large uncertainties due to the uncertainty in values for specific yield (Sy) (Healy & Cook 2002). However, a
linear recession constant can be related to average aquifer parameters using the aquifer response function
(Erskine & Papaioannou 1997) for catchments in which the vertical flow gradients are small. This enables an
‘average’ catchment groundwater hydrograph response to be modeled using the parameters of Sy, T and a
characteristic length parameter (L). This approach was taken for Soroti and a set of non-unique fits for the
modeled hydrograph was derived based on a realistic range of values for these three parameters and the
recharge model output.
It is clear from a consideration of the rise in groundwater levels after rainfall within the drier parts of
the year that preferential/indirect recharge mechanisms must be significant in this area. This was confirmed by
the numerical model which showed that without adding a component of bypass recharge, a standard SMBM
gave zero recharge for the modeled period. By drastically reducing the root constants and wilting points beyond
realistic values some recharge could be simulated but the groundwater hydrograph could not be matched with
any degree of realism.
A range of ‘best fit’ simulated hydrographs were derived using a value for L of 400 m and values of T
of 5 to 12 m2/d. The resulting recharge estimates assuming Sy of 1%, 2% and 3% were 70 mm/a, 140 mm/a,
210 mm/a respectively. If Sy was increased much beyond this range, a reasonable model fit could not be made
unless T was increased, or L was decreased, out of the expected range. This shows the benefit of using the
29
aquifer response function methodology. The best estimate scenario is shown in Figure 3(a) for the case of Sy =
2%, a reasonable value for the clayey overburden at the site giving an average recharge value of 140 mm/a.
Average rainfall and PEt for the modeled period were 882 mm/a and 2174 mm/a respectively.
Kangole
Owing to the much thicker unsaturated zone at Kangole (30 m) in comparison with Soroti, an
additional store was used to model the groundwater hydrograph in this location. Simulated recharge was added
to a first store to represent the temporary storage of focused runoff in superficial alluvium and permeable
weathered materials. This store was assumed to drain under a linear recession constant into a second store used
to model the groundwater pressure response in the deeper fractured zone in which the monitoring well is
located. The recession of the deep groundwater store was controlled by a second linear recession coefficient.
As for Soroti, to adequately simulate the observed groundwater hydrograph, it was found that bypass
flow was needed. Direct recharge was zero for the modeled period. For Kangole, no attempt was made to relate
the groundwater hydrograph recession to aquifer parameters since the fractured aquifer in this location is highly
complex and unlikely to fit the underlying assumptions inherent in the analysis which utilizes the aquifer
response function.
A set of model results for Kangole are shown in Figure 3(b). This simulation results in a recharge of
approximately 30 mm/a. For the modeled period with rainfall and PEt being 654 mm/a, 2072 mm/a
respectively. Given that this scenario used a maximum likely value of 1% for the Sy of fractured rock this
represents a maximum value of recharge in this location. It should be noted that this value should not be taken
as an average for the area as a whole as it is likely that the fracture system monitored by the observation well is
fed to some extent by water stored in valley alluvium recharged through focused ephemeral stream flow.
Average areal recharge to the wider area is likely to be much lower than this value.
As the fractured rocks in this area are thought not to interconnect and, thereby, not to act as a regional
aquifer, the reasonably strong recession seen in the groundwater levels is intriguing. It is unlikely to be caused
by local abstraction although this cannot be ruled out absolutely. Ground surface levels fall below the elevation
of the groundwater levels recorded in the Kangole monitoring well only around 10 to 15 km away and discharge
to seepage and subsequent evaporation or stream base flow in such locations is possible. It may be that
relatively large recharge in the vicinity of the Omanimani River causes a recharge mound which recedes after
periods of rainfall, into a wider fracture network which has natural or artificial outflows over a very wide area.
More investigation into possible flow patterns within the fracture system of the area is needed to resolve this
uncertainty but it is clear that significant discharge, either natural or artificial, is occurring somewhere in the
system.
30
31
Figure 3. Model results for (a) Soroti and (b) Kangole.
RESULT AND DISCUSSION
Unfortunately, recharge estimation by another method is presently impossible until further data are
collected to corroborate these results. However, there is clear evidence that significant groundwater recharge
occurs in the study area, and is likely to decrease in average terms towards the northeast. Furthermore, it is clear
that localized and indirect recharge are the dominant mechanisms for recharge and that standard SMBMs are
inappropriate for estimating recharge in the area, even in the relatively humid Soroti area.
This understanding of likely recharge processes enables us to make some general comments about the
likely impact of predicted changes to the climate. The latest IPCC predications (under the A1B scenario) predict
a median temperature increase of 3 to 4 ºC for East Africa by the end of the century (IPCC 2007). Although the
uncertainties are noted regarding how changing CO2 concentrations may affect plant evapotranspiration, it is
likely that overall such a temperature rise will significantly increase the PEt in this region. With rainfall also
predicted to increase by several percent, and most strongly in the driest part of the year (IPCC 2007), if direct
recharge was dominant then the possible increase in precipitation may, to a great extent, be countered by an
increase in PEt (which would lead to greater SMDs needing to be overcome for recharge to result). Obviously,
the higher the intensity of the increased rainfall, the less the increase in temperature would offset the increased

32
rainfall. However, given that the recharge processes actually appear to be dominated by indirect and localized
mechanisms, any effects caused by higher temperatures may be more than offset by the predicted increase in
future precipitation leading, overall, to an increase in the available groundwater resource. Clearly, these results
need to be corroborated by further research to confirm these tentative conclusions. The relevance of such
findings, if confirmed, may be vitally important, particularly for Karamoja. Here, a finely tuned system of agro-
pastoralism developed over centuries to make the best of the harsh environment, has, in recent years come
under increasing pressure through socio political changes forcing many previously pastoralist people to become
more dependent on crop production for survival. If this trend continues, increased development of accessible
and sustainable water resources will become increasingly important. The degree to which small scale
groundwater fed irrigation can be developed may be a significant focus for further research. As NE Uganda has
seen protracted conflict and ongoing poverty for many decades, and given the role of natural resources within
the current conflict dynamics, groundwater science may have a significant role to play in peace building within
the region in the coming years.
33
CASE STUDY 2
LOCATION
Grand River watershed (Ontario) Canada.
OBJECTIVE
The impact of climate change on spatially varying groundwater recharge in the Grand River watershed
(Ontario) Canada.
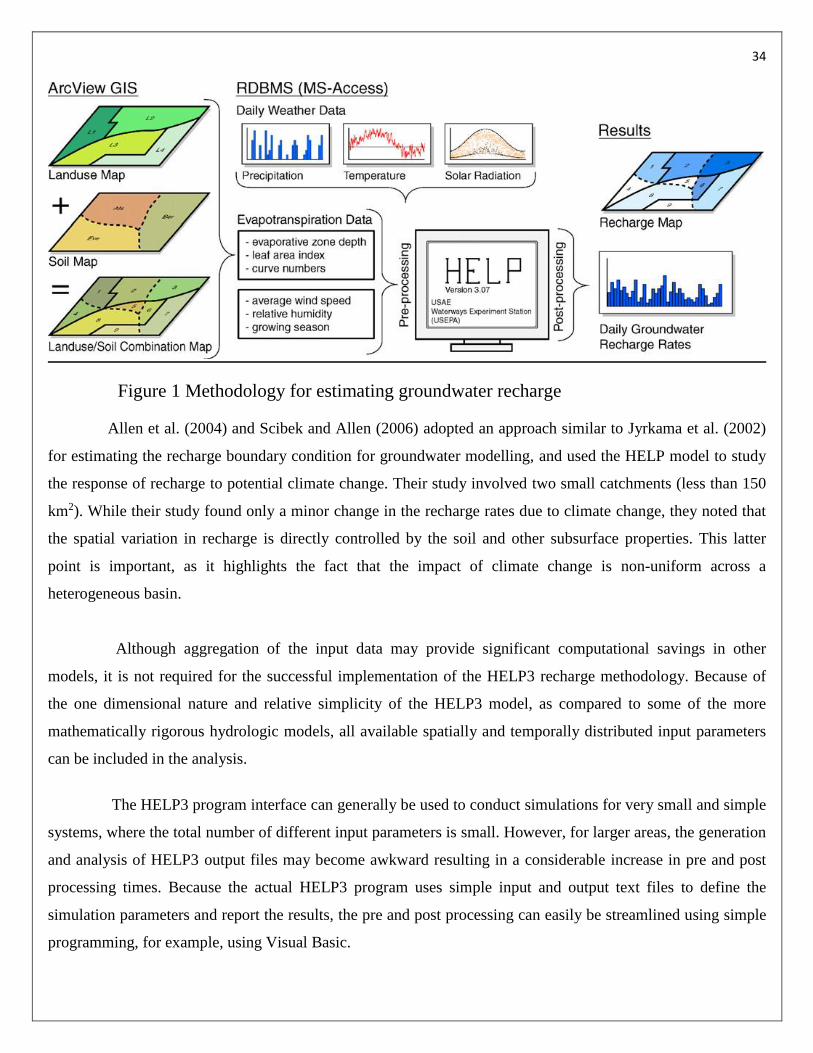
Methodology
In this study, the physically based hydrologic model HELP3 is used to estimate the changes in the
hydrologic cycle of the Grand River watershed in Ontario, Canada. Because numerical modelling at the regional
watershed scale, such as the Grand River, involves the handling of large amounts of input and output data, the
model is linked with ArcView GIS and the database management system MS Access.
HELP3 is a quasi-two-dimensional, deterministic water routing model for computing water balances.
It simulates the daily movement of water into the ground, and accounts for precipitation in any form, surface
storage, runoff, evapotranspiration, snowmelt, vegetative interception and growth, unsaturated flow, and
temperature effects. HELP3 was chosen mainly because it is readily available and easy to use. Furthermore,
HELP3 simulates all of the important processes in the hydrologic cycle, including the effects of snowmelt and
freezing temperatures, which are relevant in the study area. Fig. 1 illustrates a schematic diagram of the
methodology.
The HELP model has been extensively tested by its developers (Peyton and Schroeder, 1988; Schroeder
et al., 1994) and also been compared with Richard’s equation based approaches as well as field results under
various conditions.
Risser et al. (2005) used the HELP3 model to estimate recharge rates in a small watershed in the
eastern United States. They compared the results to other modelling approaches and found that the HELP3
recharge estimates were in closest agreement with direct recharge measurements, even without any calibration
of input parameters.
34
Figure 1 Methodology for estimating groundwater recharge
Allen et al. (2004) and Scibek and Allen (2006) adopted an approach similar to Jyrkama et al. (2002)
for estimating the recharge boundary condition for groundwater modelling, and used the HELP model to study
the response of recharge to potential climate change. Their study involved two small catchments (less than 150
km2). While their study found only a minor change in the recharge rates due to climate change, they noted that
the spatial variation in recharge is directly controlled by the soil and other subsurface properties. This latter
point is important, as it highlights the fact that the impact of climate change is non-uniform across a
heterogeneous basin.
Although aggregation of the input data may provide significant computational savings in other
models, it is not required for the successful implementation of the HELP3 recharge methodology. Because of
the one dimensional nature and relative simplicity of the HELP3 model, as compared to some of the more
mathematically rigorous hydrologic models, all available spatially and temporally distributed input parameters
can be included in the analysis.
The HELP3 program interface can generally be used to conduct simulations for very small and simple
systems, where the total number of different input parameters is small. However, for larger areas, the generation
and analysis of HELP3 output files may become awkward resulting in a considerable increase in pre and post
processing times. Because the actual HELP3 program uses simple input and output text files to define the
simulation parameters and report the results, the pre and post processing can easily be streamlined using simple
programming, for example, using Visual Basic.
35
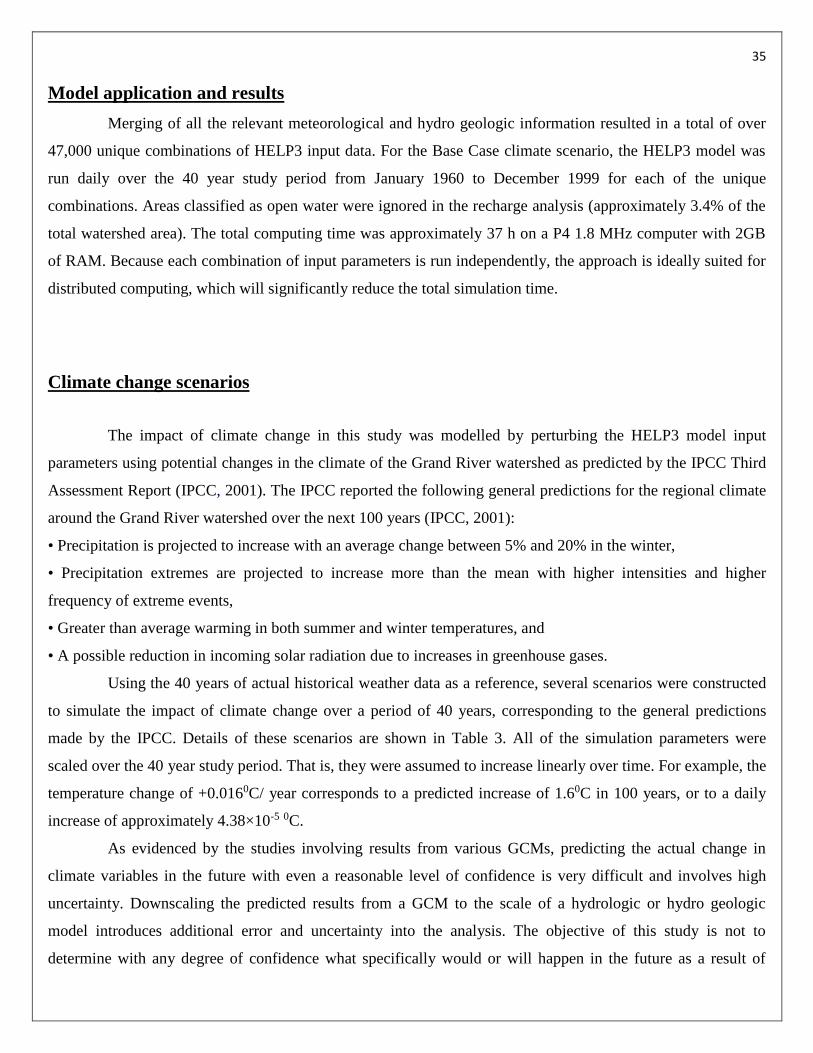
Model application and results
Merging of all the relevant meteorological and hydro geologic information resulted in a total of over
47,000 unique combinations of HELP3 input data. For the Base Case climate scenario, the HELP3 model was
run daily over the 40 year study period from January 1960 to December 1999 for each of the unique
combinations. Areas classified as open water were ignored in the recharge analysis (approximately 3.4% of the
total watershed area). The total computing time was approximately 37 h on a P4 1.8 MHz computer with 2GB
of RAM. Because each combination of input parameters is run independently, the approach is ideally suited for
distributed computing, which will significantly reduce the total simulation time.
Climate change scenarios The impact of climate change in this study was modelled by perturbing the HELP3 model input
parameters using potential changes in the climate of the Grand River watershed as predicted by the IPCC Third
Assessment Report (IPCC, 2001). The IPCC reported the following general predictions for the regional climate
around the Grand River watershed over the next 100 years (IPCC, 2001):
• Precipitation is projected to increase with an average change between 5% and 20% in the winter,
• Precipitation extremes are projected to increase more than the mean with higher intensities and higher
frequency of extreme events,
• Greater than average warming in both summer and winter temperatures, and
• A possible reduction in incoming solar radiation due to increases in greenhouse gases.
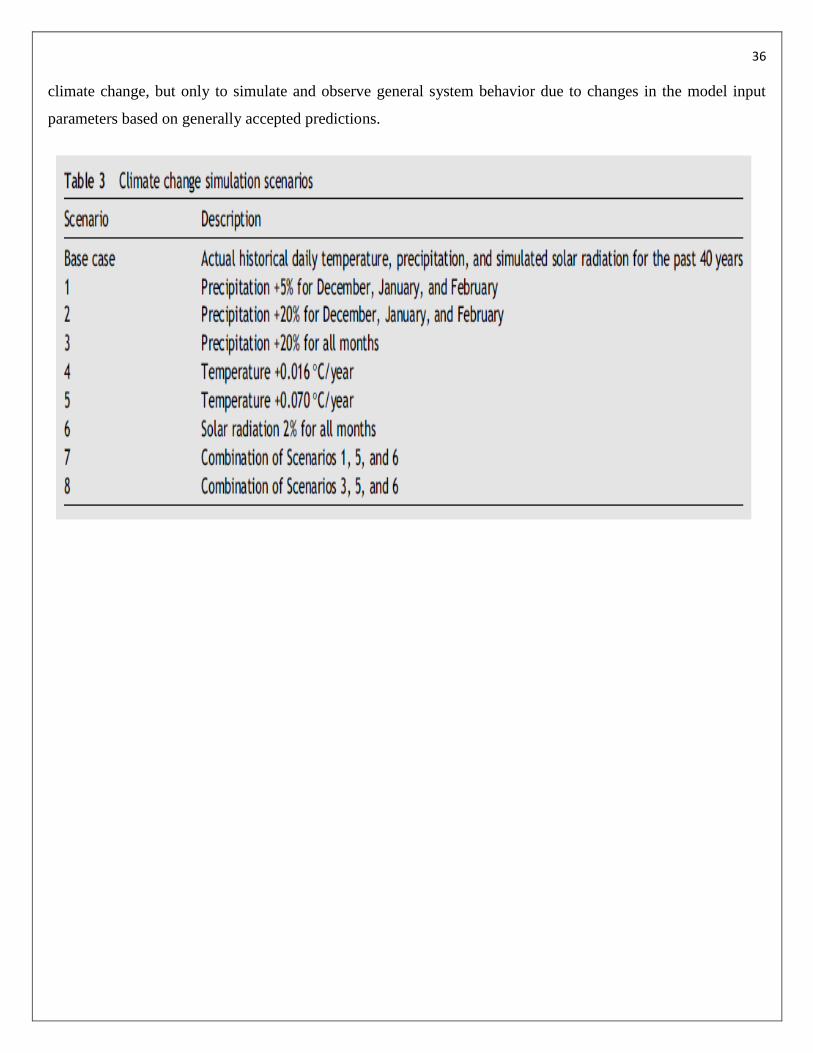
Using the 40 years of actual historical weather data as a reference, several scenarios were constructed
to simulate the impact of climate change over a period of 40 years, corresponding to the general predictions
made by the IPCC. Details of these scenarios are shown in Table 3. All of the simulation parameters were
scaled over the 40 year study period. That is, they were assumed to increase linearly over time. For example, the
temperature change of +0.0160C/ year corresponds to a predicted increase of 1.60C in 100 years, or to a daily
increase of approximately 4.38×10⁻⁵ 0C.
As evidenced by the studies involving results from various GCMs, predicting the actual change in
climate variables in the future with even a reasonable level of confidence is very difficult and involves high
uncertainty. Downscaling the predicted results from a GCM to the scale of a hydrologic or hydro geologic
model introduces additional error and uncertainty into the analysis. The objective of this study is not to
determine with any degree of confidence what specifically would or will happen in the future as a result of
36
climate change, but only to simulate and observe general system behavior due to changes in the model input
parameters based on generally accepted predictions.
37
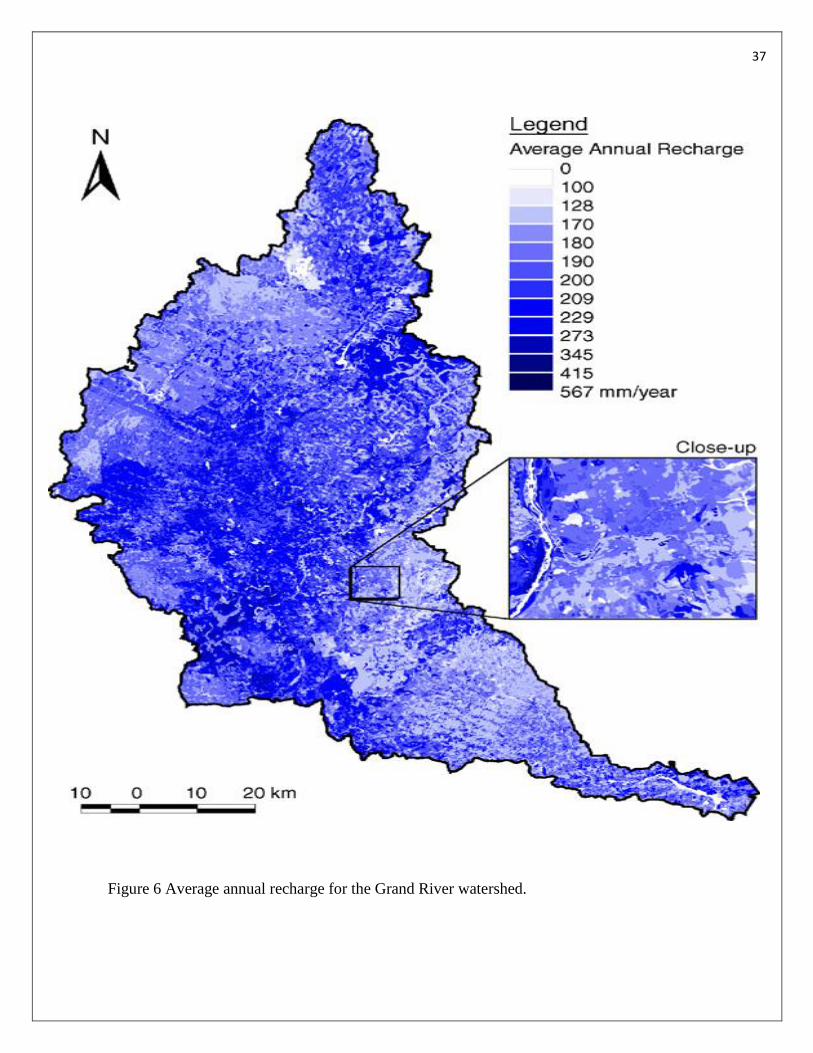
Figure 6 Average annual recharge for the Grand River watershed.
38
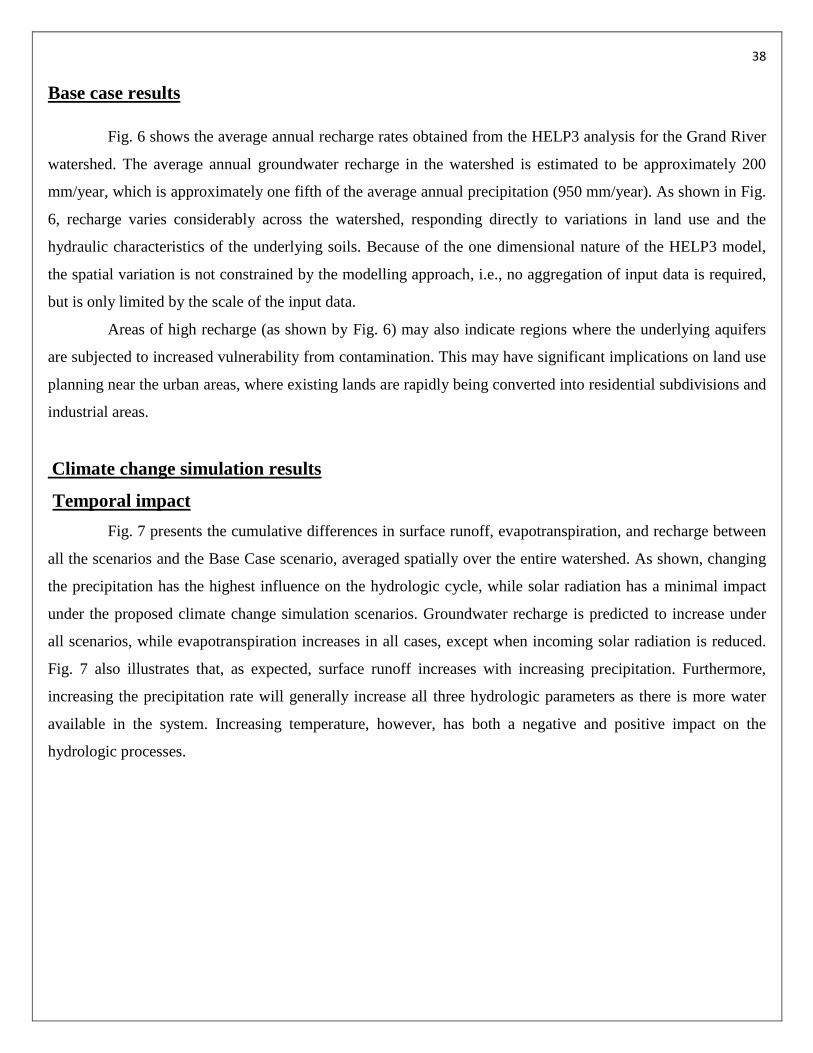
Base case results
Fig. 6 shows the average annual recharge rates obtained from the HELP3 analysis for the Grand River
watershed. The average annual groundwater recharge in the watershed is estimated to be approximately 200
mm/year, which is approximately one fifth of the average annual precipitation (950 mm/year). As shown in Fig.
6, recharge varies considerably across the watershed, responding directly to variations in land use and the
hydraulic characteristics of the underlying soils. Because of the one dimensional nature of the HELP3 model,
the spatial variation is not constrained by the modelling approach, i.e., no aggregation of input data is required,
but is only limited by the scale of the input data.
Areas of high recharge (as shown by Fig. 6) may also indicate regions where the underlying aquifers
are subjected to increased vulnerability from contamination. This may have significant implications on land use
planning near the urban areas, where existing lands are rapidly being converted into residential subdivisions and
industrial areas.
Climate change simulation results
Temporal impact
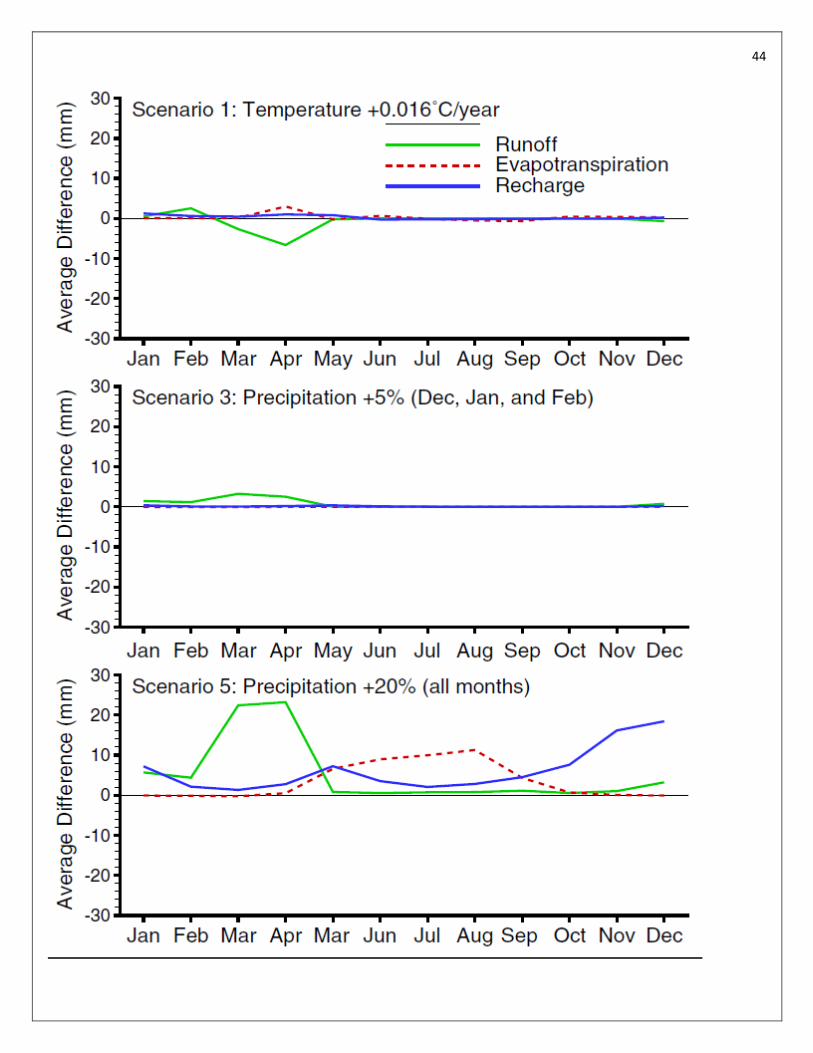
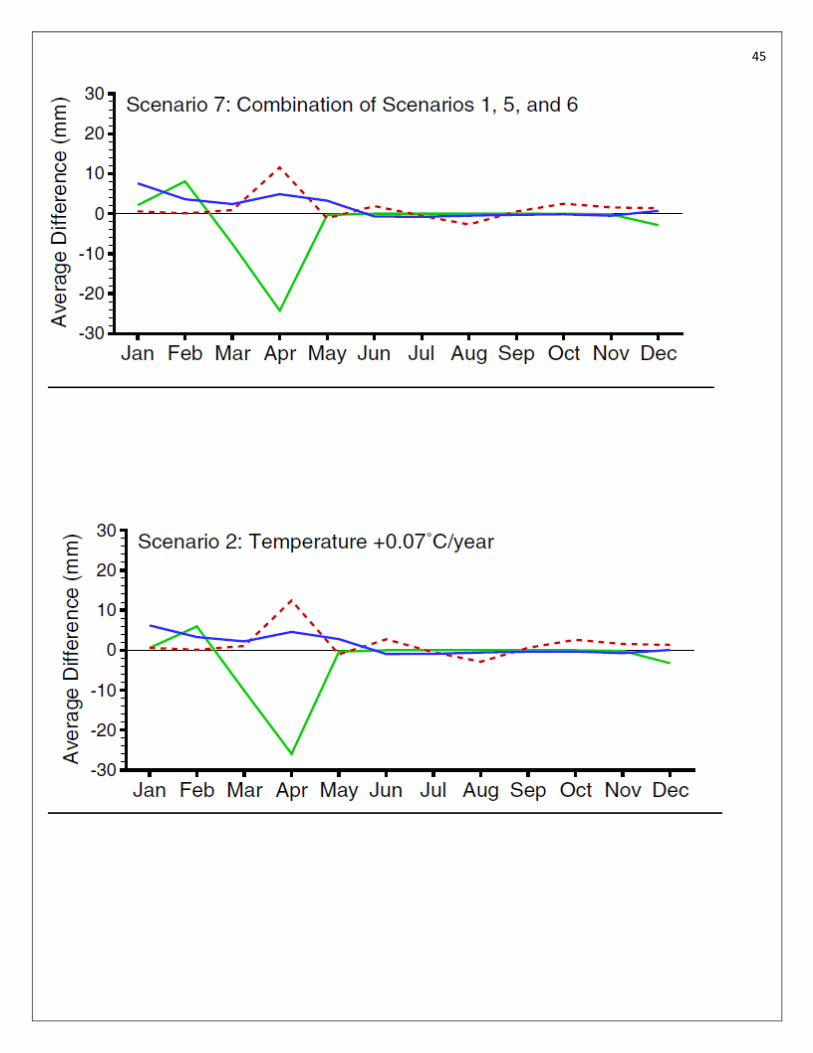
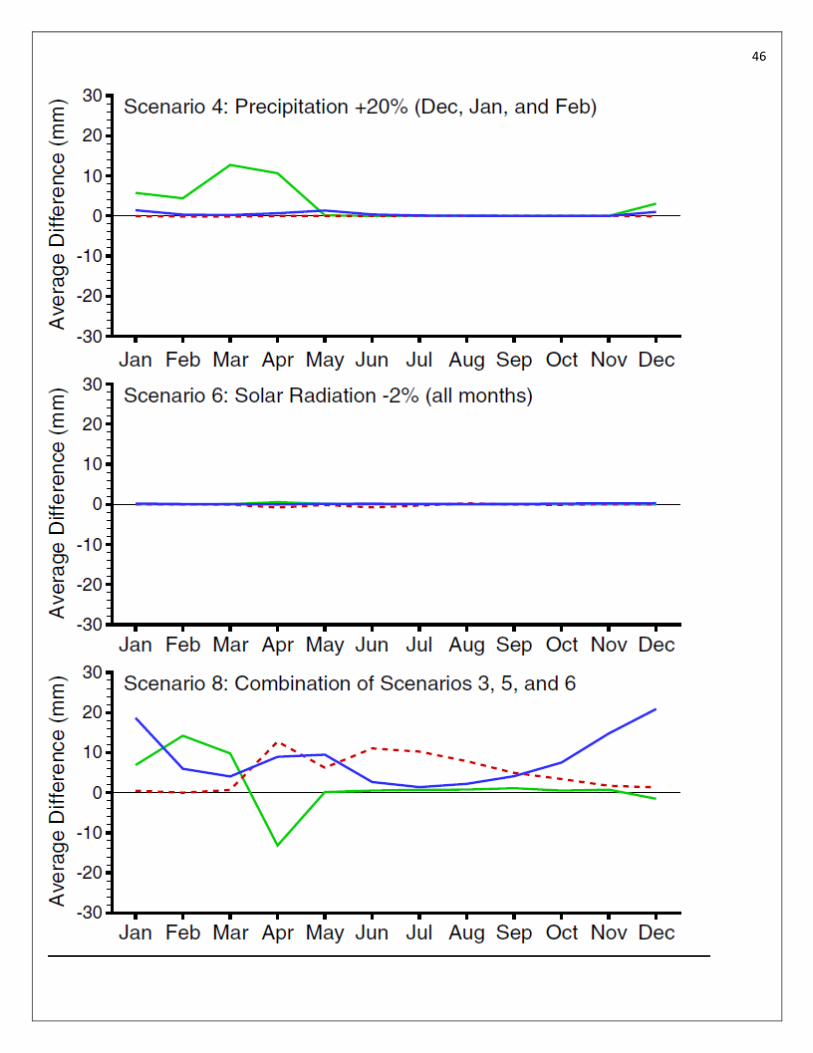
Fig. 7 presents the cumulative differences in surface runoff, evapotranspiration, and recharge between
all the scenarios and the Base Case scenario, averaged spatially over the entire watershed. As shown, changing
the precipitation has the highest influence on the hydrologic cycle, while solar radiation has a minimal impact
under the proposed climate change simulation scenarios. Groundwater recharge is predicted to increase under
all scenarios, while evapotranspiration increases in all cases, except when incoming solar radiation is reduced.
Fig. 7 also illustrates that, as expected, surface runoff increases with increasing precipitation. Furthermore,
increasing the precipitation rate will generally increase all three hydrologic parameters as there is more water
available in the system. Increasing temperature, however, has both a negative and positive impact on the
hydrologic processes.
39
40
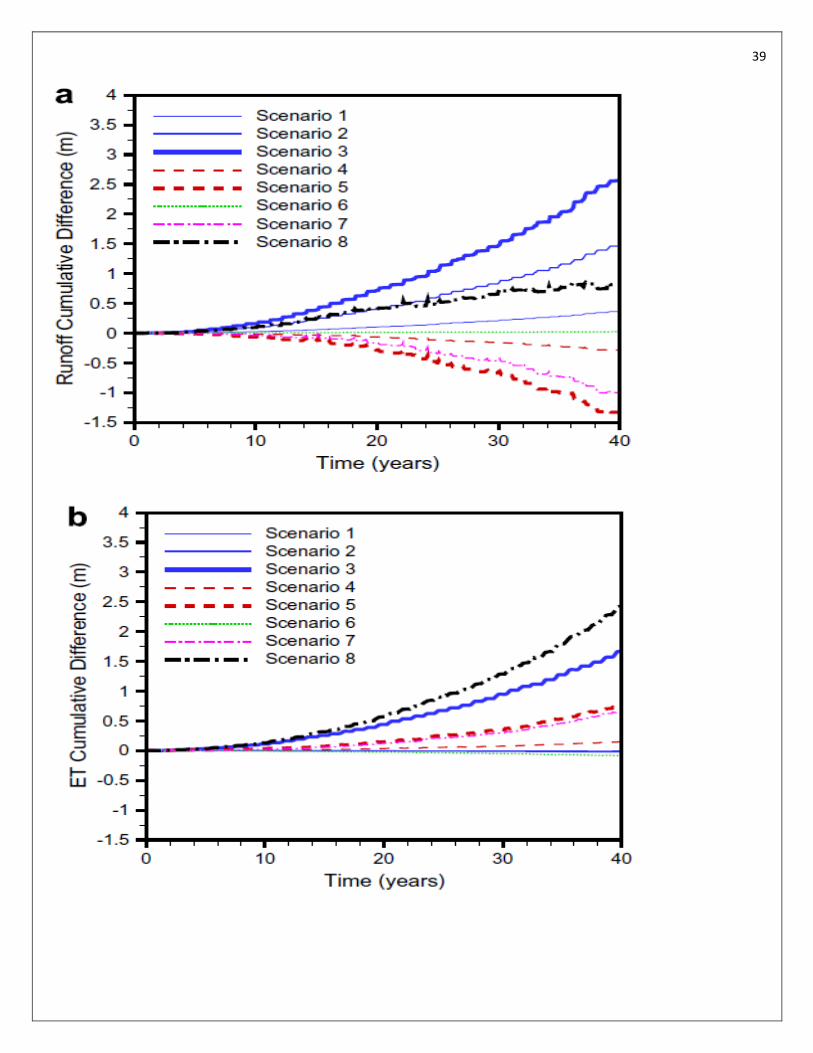
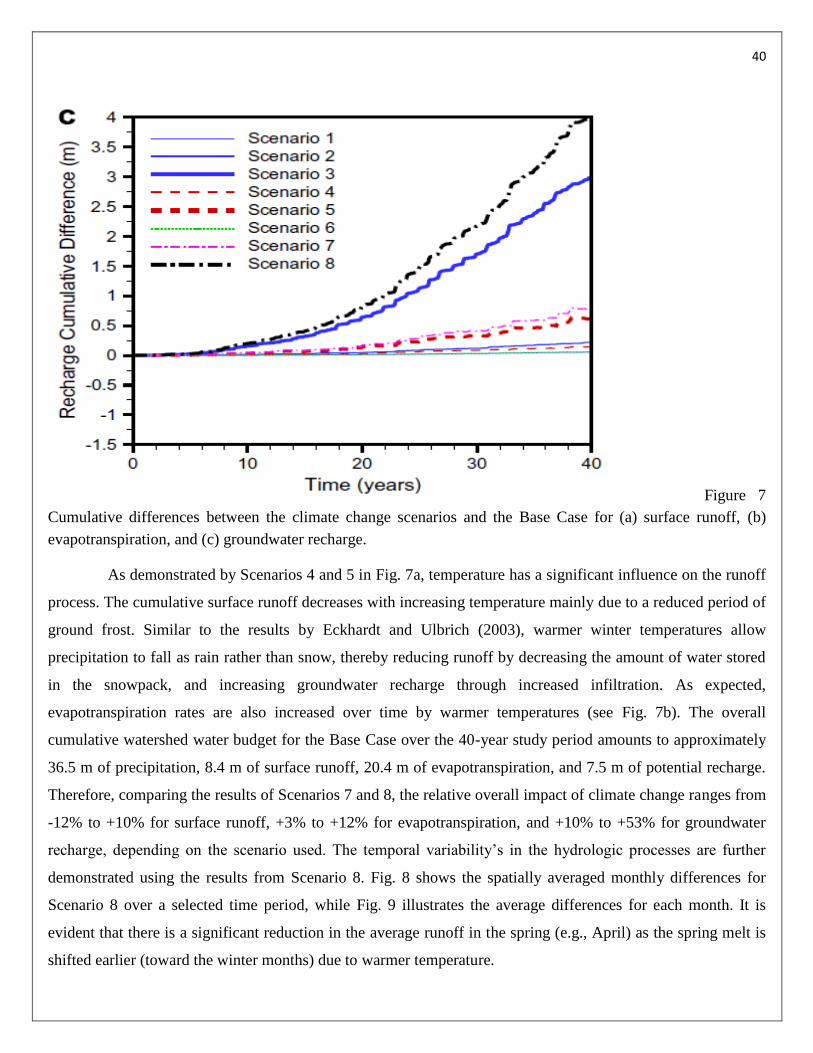
Figure 7
Cumulative differences between the climate change scenarios and the Base Case for (a) surface runoff, (b)
evapotranspiration, and (c) groundwater recharge.
As demonstrated by Scenarios 4 and 5 in Fig. 7a, temperature has a significant influence on the runoff
process. The cumulative surface runoff decreases with increasing temperature mainly due to a reduced period of
ground frost. Similar to the results by Eckhardt and Ulbrich (2003), warmer winter temperatures allow
precipitation to fall as rain rather than snow, thereby reducing runoff by decreasing the amount of water stored
in the snowpack, and increasing groundwater recharge through increased infiltration. As expected,
evapotranspiration rates are also increased over time by warmer temperatures (see Fig. 7b). The overall
cumulative watershed water budget for the Base Case over the 40-year study period amounts to approximately
36.5 m of precipitation, 8.4 m of surface runoff, 20.4 m of evapotranspiration, and 7.5 m of potential recharge.
Therefore, comparing the results of Scenarios 7 and 8, the relative overall impact of climate change ranges from
-12% to +10% for surface runoff, +3% to +12% for evapotranspiration, and +10% to +53% for groundwater
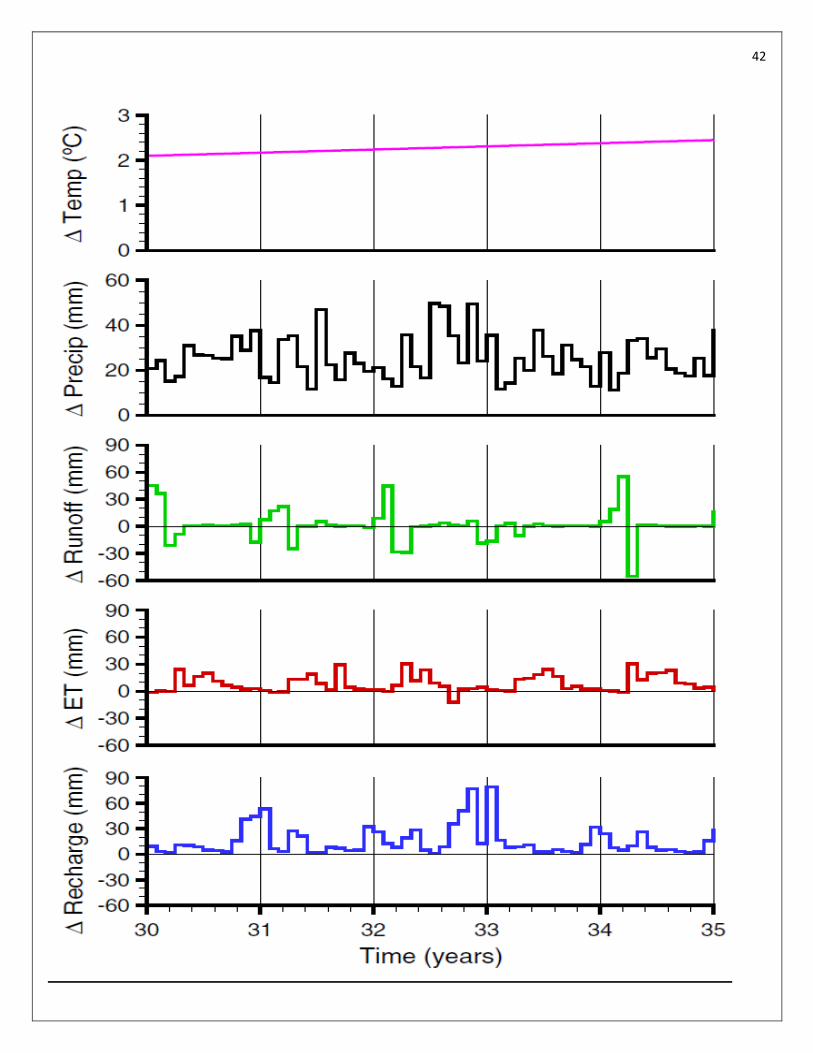
recharge, depending on the scenario used. The temporal variability’s in the hydrologic processes are further
demonstrated using the results from Scenario 8. Fig. 8 shows the spatially averaged monthly differences for
Scenario 8 over a selected time period, while Fig. 9 illustrates the average differences for each month. It is
evident that there is a significant reduction in the average runoff in the spring (e.g., April) as the spring melt is
shifted earlier (toward the winter months) due to warmer temperature.
41
The amount of runoff is consequently increased during January, February and March as moisture is released
from the snowpack (as opposed to being stored or accumulated). Groundwater recharge also increases
significantly during the winter months as more water is able to infiltrate into the ground. Evaporation rates are
increased during the summer months due to higher temperatures and increased amount of available water.
Spatial impact
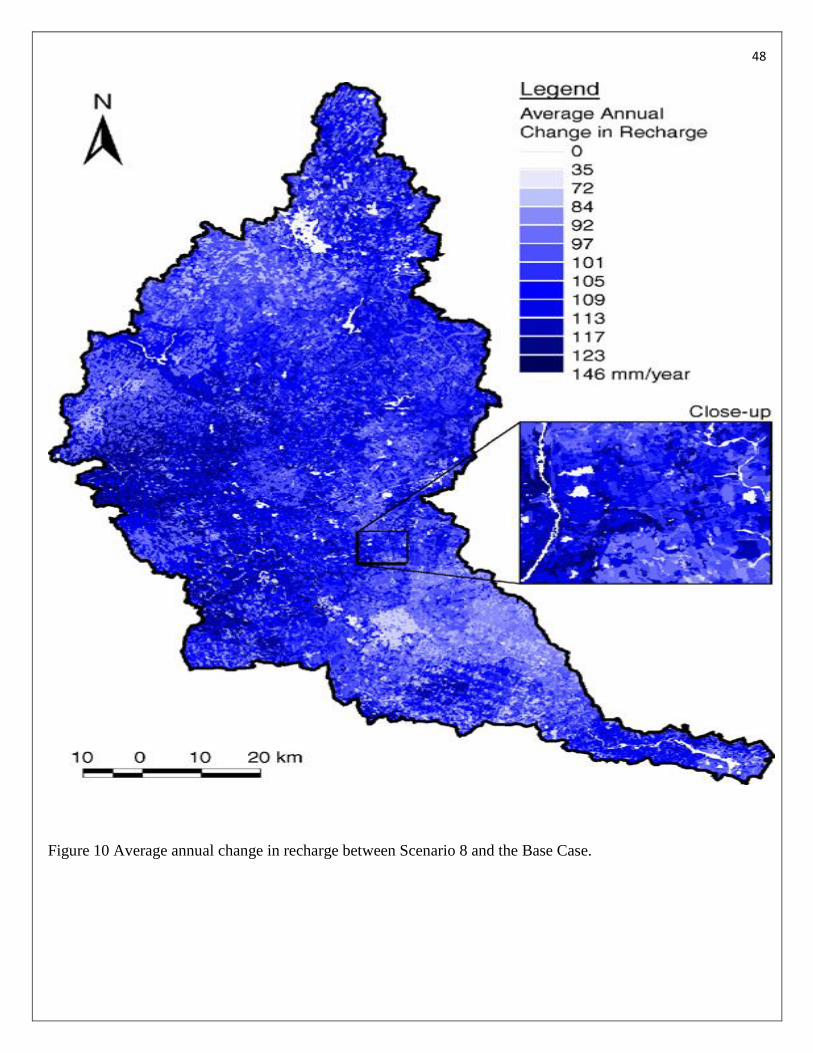
Fig. 10 shows the average annual change in groundwater recharge rates for the entire watershed
between the Base Case and Scenario 8. Although recharge rates may be reduced over short periods at specific
times, Fig. 10 shows how there is an overall increase in recharge rates across the watershed due to potential
climate change. The average rate is predicted to increase by approximately 100 mm/year from 189 mm/year to
289 mm/year over the 40-year study period.
Fig. 10 also clearly illustrates the non-uniform impact of potential climate change across the
watershed. Some areas will be subjected to greater changes in recharge rates, while others will experience lesser
change. The degree of impact is directly controlled by groundwater levels, characteristics of the ground surface,
and the nature of the underlying soils. While quantifying the temporal impact of climate change is important for
long term water resource planning and management, delineating the spatial impact is valuable not only for the
protection of the underlying aquifers, but also in the context of land use allocation and development.
42
43
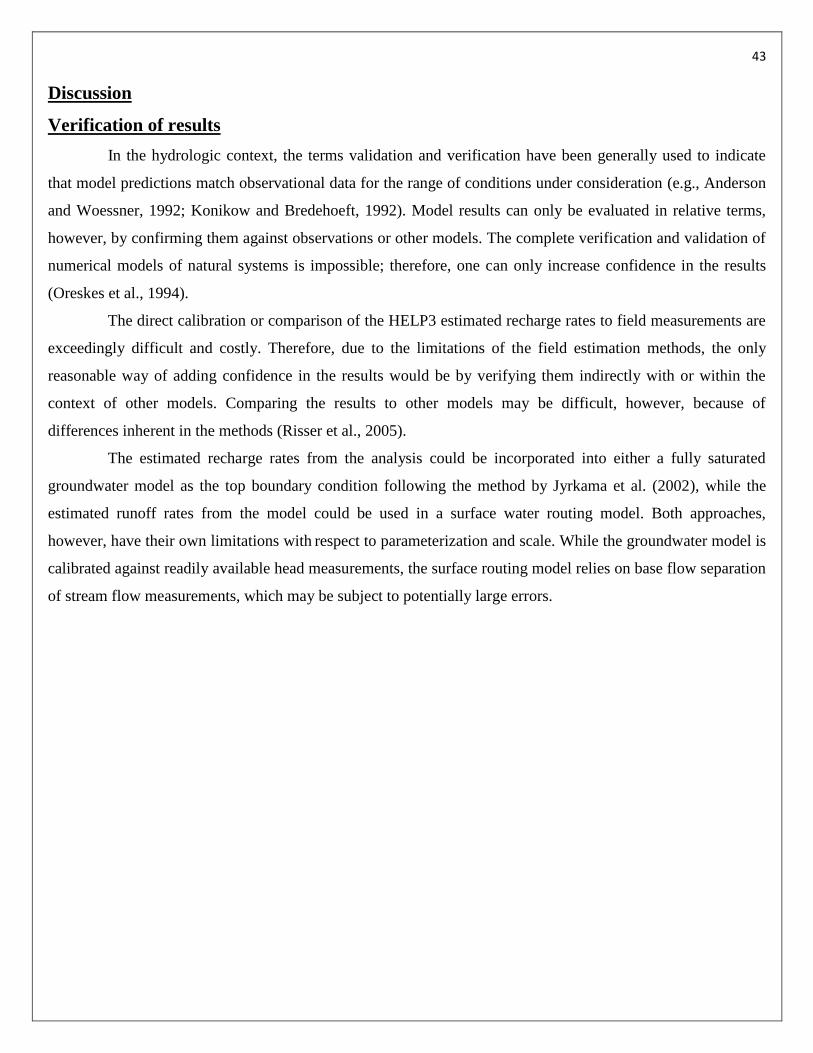
Discussion
Verification of results
In the hydrologic context, the terms validation and verification have been generally used to indicate
that model predictions match observational data for the range of conditions under consideration (e.g., Anderson
and Woessner, 1992; Konikow and Bredehoeft, 1992). Model results can only be evaluated in relative terms,
however, by confirming them against observations or other models. The complete verification and validation of
numerical models of natural systems is impossible; therefore, one can only increase confidence in the results
(Oreskes et al., 1994).
The direct calibration or comparison of the HELP3 estimated recharge rates to field measurements are
exceedingly difficult and costly. Therefore, due to the limitations of the field estimation methods, the only
reasonable way of adding confidence in the results would be by verifying them indirectly with or within the
context of other models. Comparing the results to other models may be difficult, however, because of
differences inherent in the methods (Risser et al., 2005).
The estimated recharge rates from the analysis could be incorporated into either a fully saturated
groundwater model as the top boundary condition following the method by Jyrkama et al. (2002), while the
estimated runoff rates from the model could be used in a surface water routing model. Both approaches,
however, have their own limitations with respect to parameterization and scale. While the groundwater model is
calibrated against readily available head measurements, the surface routing model relies on base flow separation
of stream flow measurements, which may be subject to potentially large errors.
44
45
46
47
HELP3 limitations
HELP3 uses empirical relationships in certain instances which may be unreasonable in some
applications. In addition, the models representing the various hydrologic processes within the program are
subject to their own assumptions and limitations. While lateral discretization is not an issue, since HELP3 is a
one dimensional model, the assumption of purely vertical flow may not be true when there are significant
heterogeneities present in the unsaturated zone. Since the unique input parameter combinations are analyzed
independently, overland flow between adjacent areas is ignored. This assumption is reasonable since adjacent
areas generally experience surface runoff concurrently during a storm event, therefore, water from one area is
unlikely to infiltrate in another because both areas are saturated. Furthermore, overland flow typically moves
considerably faster than groundwater flow, and is generally rare in humid climates due to less intensive rainfall,
well-developed vegetation, and sufficient infiltration capacity of most soils (Knutssen, 1988). Areas with high
topographic relief, however, may have significant lateral flow components which may not be captured by the
recharge methodology.
HELP3 may have difficulty in estimating water balances in arid climates where upward fluxes can be
high. However, it has been shown to work well in humid areas. Compared to other numerical hydrologic
models, HELP3 is easy to use, uses data that is readily available, and is highly efficient computationally.
Models based on Richards’ equation may be preferred by many researchers, however, they are also subject to
many assumptions and limitations. They are often limited by the boundary conditions, and are computationally
expensive due to the discretization requirements by the highly non-linear equations. The simpler water balance
approaches, such as HELP3, can easily be applied to heterogeneous soil columns with physically based
boundary conditions and run over long time periods with comparable accuracy to the Richards’ equation based
approaches. As demonstrated by the results of this study, HELP3 is a valuable tool for assessing not only the
temporal response, but also the spatial impact of climate change on groundwater resources.
48
Figure 10 Average annual change in recharge between Scenario 8 and the Base Case.
49
Summary and conclusions
Understanding the impact of potential changes in the hydrologic cycle in response to climate change is
essential for ensuring the quality and sustainability of our water resources in the future. While the temporal
aspects of climate change influence long-term water resource planning and management, quantifying the spatial
impact is critical not only for the protection of the underlying groundwater resources, but also in the context of
land use allocation and development.
Groundwater resources are related to climate change indirectly through the process of recharge, and
directly through the interaction with surface water bodies such as rivers and lakes. The process of groundwater
recharge is not only influenced by the spatial and temporal variability in the major climate variables, but is also
dependent on the spatial distribution of land-surface properties and the depth and hydraulic properties of the
underlying soils. Quantifying the impact of climate change on groundwater resources requires a physically
based approach for estimating groundwater recharge that includes all of the important processes in the
hydrologic cycle, such as infiltration, surface runoff, evapotranspiration, and snowmelt.
50
CASE STUDY 3
LOCATION
Awash River Basin in Ethiopia at an altitude of about 3000m above mean sea level.
OBJECTIVE
The objective of these study is to develop a better understanding of the impact of climate change on the water
resources of the Awash River Basin, Ethiopia.
METHODOLOGY
The Awash River starts in the highlands of central Ethiopia, at an altitude of about 3000 m above sea
level. After flowing to the southeast for about 250 km, the river enters the Great Rift Valley at an altitude of
1500 m, and then follows the valley for the rest of its course to Lake Abe on the border with the Djibouti
Republic, at an altitude of about 250 m. The total length of the river is about 1200 km and its catchment area is
113700 km2. The Awash River drains the northerly part of the Rift Valley in Ethiopia from approximately 8.5°
N to 12° N (Fig. 1). The Koka Reservoir, about 75 km from Addis Ababa, has been in use since 1961 with a net
available capacity of 1660 km2 and a concrete dam that is 42 m high. The maximum rate of outflow through its
turbines is 360 m3 s-1, and the normal annual outflow is about 120000 m3. Losses by evaporation are about
31500 m3 yr-1, and by percolation about 38000 m3 yr-1.
Data organization
The Awash River Basin was divided into 3 sub catchments: upper (upstream from Koka Dam station),
middle (between Koka and Awash station), and lower (between Awash and Tendaho station) for a better
resolution in the calibration and simulation routines. However, the impact assessment was done over the whole
of the basin by summing up the 3 sub catchments discharges into one. Station based meteorological data were
organized at the sub basin sub basin level for the 3 sub catchments; the inverse distance weighting technique of
the grid method GRASS (Solomon & Cordery 1984) was used to obtain sub catchment average rainfall values
for the 12 mo of the year for the period 1971–1990. A simple arithmetic mean was used to derive sub catchment
average values for the other meteorological parameters. Mean monthly temperature and monthly total rainfall
from 25 and 61 stations, respectively, within the basin and its vicinity, for the period 1971–1990, as well as
temporal averages of relative humidity (15 stations) and sunshine duration (17 stations) obtained from the
National Meteorological Services Agency archive were used as the basic meteorological data. For stations with
missing data, monthly mean and median values were used for temperature and rainfall, respectively.
Observed mean monthly river discharge for 11 sub catchments of Awash River Basin was used as the basic
hydrological data (obtained from the Awash Water Development Study, Ministry of Water Resources). Outputs
from general circulation models (GCMs) of the Canadian Climate Centre (CCCM) and the Geophysical Fluid
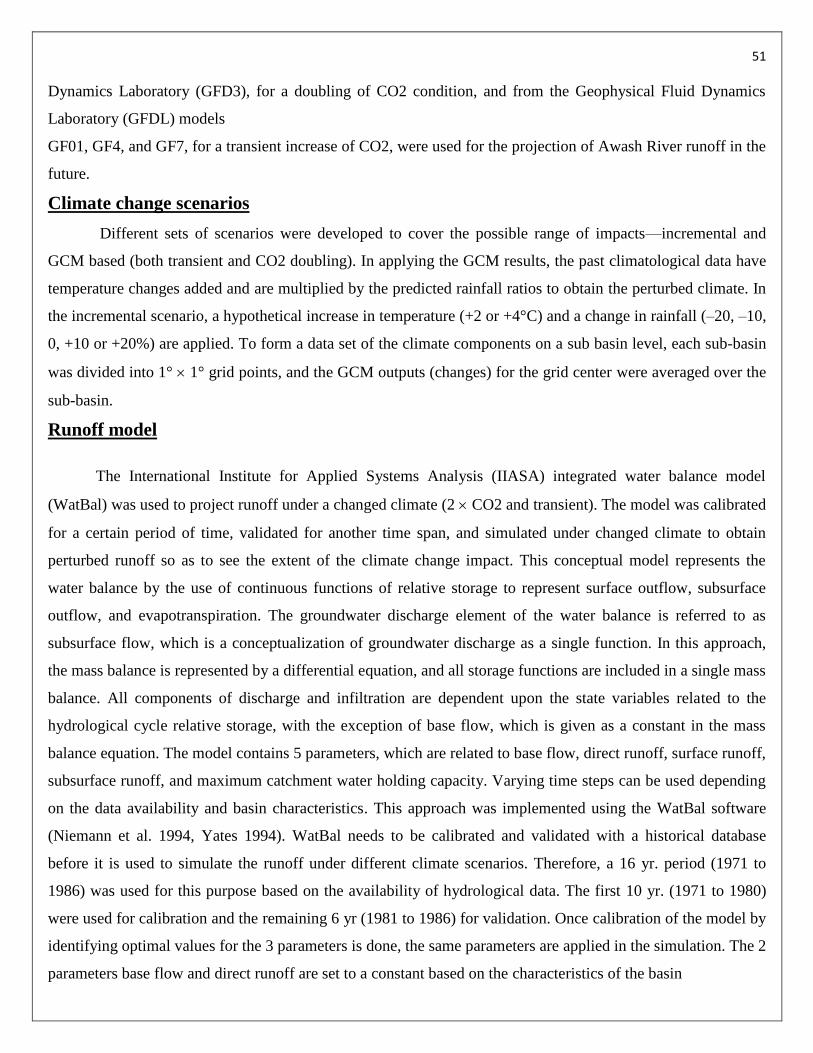
51
Dynamics Laboratory (GFD3), for a doubling of CO2 condition, and from the Geophysical Fluid Dynamics
Laboratory (GFDL) models
GF01, GF4, and GF7, for a transient increase of CO2, were used for the projection of Awash River runoff in the
future.
Climate change scenarios
Different sets of scenarios were developed to cover the possible range of impacts—incremental and
GCM based (both transient and CO2 doubling). In applying the GCM results, the past climatological data have
temperature changes added and are multiplied by the predicted rainfall ratios to obtain the perturbed climate. In
the incremental scenario, a hypothetical increase in temperature (+2 or +4°C) and a change in rainfall (–20, –10,
0, +10 or +20%) are applied. To form a data set of the climate components on a sub basin level, each sub-basin
was divided into 1° 1° grid points, and the GCM outputs (changes) for the grid center were averaged over the
sub-basin.
Runoff model
The International Institute for Applied Systems Analysis (IIASA) integrated water balance model
(WatBal) was used to project runoff under a changed climate (2 CO2 and transient). The model was calibrated
for a certain period of time, validated for another time span, and simulated under changed climate to obtain
perturbed runoff so as to see the extent of the climate change impact. This conceptual model represents the
water balance by the use of continuous functions of relative storage to represent surface outflow, subsurface
outflow, and evapotranspiration. The groundwater discharge element of the water balance is referred to as
subsurface flow, which is a conceptualization of groundwater discharge as a single function. In this approach,
the mass balance is represented by a differential equation, and all storage functions are included in a single mass
balance. All components of discharge and infiltration are dependent upon the state variables related to the
hydrological cycle relative storage, with the exception of base flow, which is given as a constant in the mass
balance equation. The model contains 5 parameters, which are related to base flow, direct runoff, surface runoff,
subsurface runoff, and maximum catchment water holding capacity. Varying time steps can be used depending
on the data availability and basin characteristics. This approach was implemented using the WatBal software
(Niemann et al. 1994, Yates 1994). WatBal needs to be calibrated and validated with a historical database
before it is used to simulate the runoff under different climate scenarios. Therefore, a 16 yr. period (1971 to
1986) was used for this purpose based on the availability of hydrological data. The first 10 yr. (1971 to 1980)
were used for calibration and the remaining 6 yr (1981 to 1986) for validation. Once calibration of the model by
identifying optimal values for the 3 parameters is done, the same parameters are applied in the simulation. The 2
parameters base flow and direct runoff are set to a constant based on the characteristics of the basin

52
RESULTS AND DISCUSSION
Figs. 2 to 4 show results of the observed versus modeled discharge for the validation and calibration periods for
the 3 sub catchments. Table 1 shows the correlation coefficients between modeled and observed discharge with
the average error of estimation for the 3 subcatchments, indicating high correlations between observed and
estimated data. Table 2 shows the optimum parameters obtained after the model run. Using the calibration
parameters in Table 2, the model was employed to forecast runoff under a variety of climate change scenarios to
give the anticipated runoff (water supply) under a changed climate. The correlation coefficients and average
error values did not show a large difference between the validation and calibration portions of the time series,
except for the middle Awash River Basin subcatchments, which may result from some extremely high flows in
the validation time series. Thus, the model performance is assessed to be sufficient for assessing the range of
uncertainty and scale of climate change.
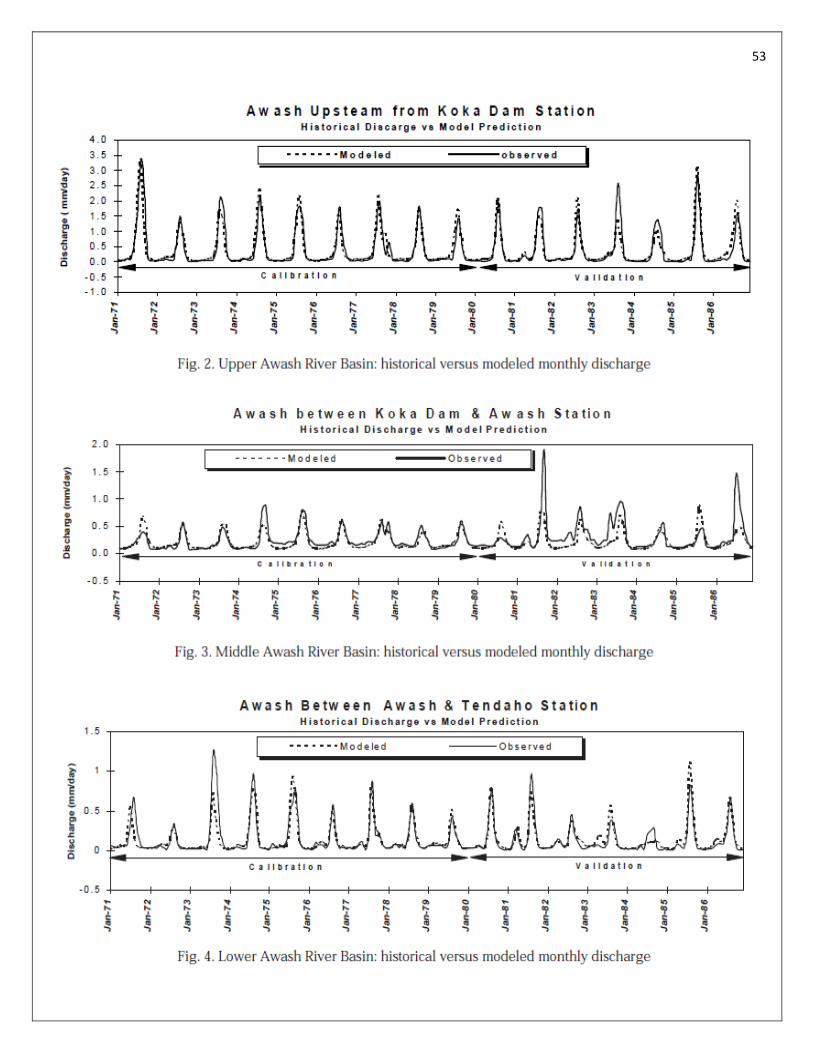
53
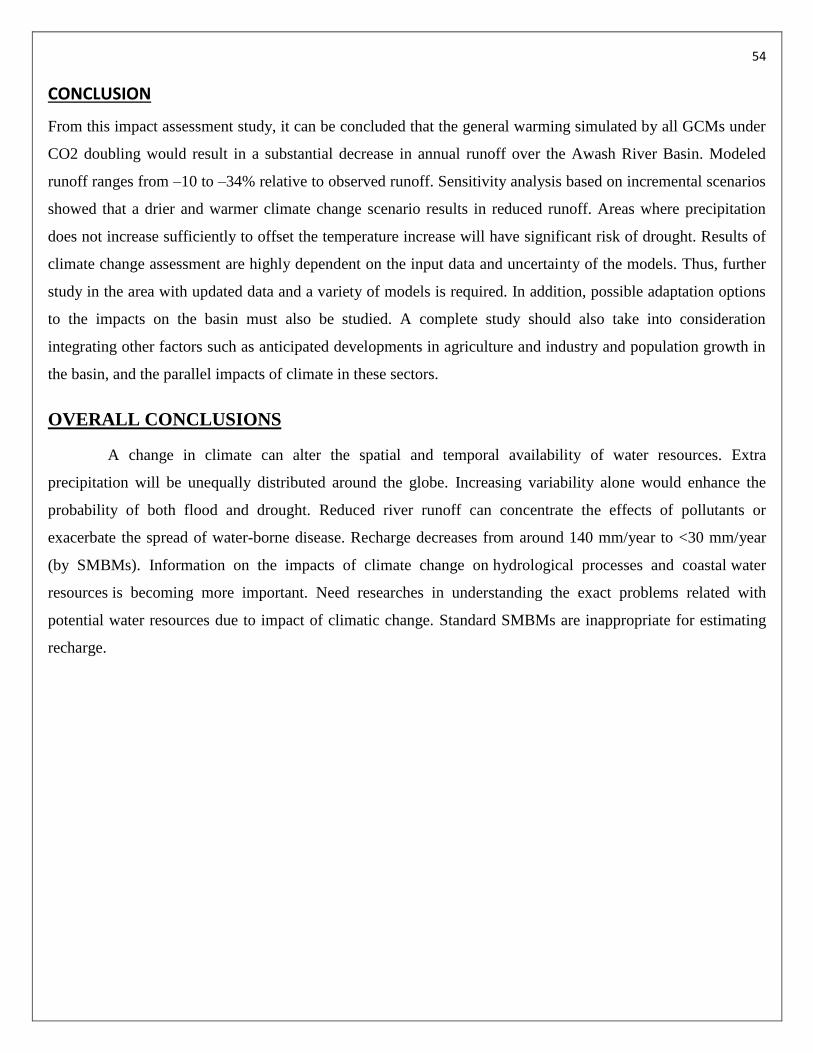
54
CONCLUSION
From this impact assessment study, it can be concluded that the general warming simulated by all GCMs under
CO2 doubling would result in a substantial decrease in annual runoff over the Awash River Basin. Modeled
runoff ranges from –10 to –34% relative to observed runoff. Sensitivity analysis based on incremental scenarios
showed that a drier and warmer climate change scenario results in reduced runoff. Areas where precipitation
does not increase sufficiently to offset the temperature increase will have significant risk of drought. Results of
climate change assessment are highly dependent on the input data and uncertainty of the models. Thus, further
study in the area with updated data and a variety of models is required. In addition, possible adaptation options
to the impacts on the basin must also be studied. A complete study should also take into consideration
integrating other factors such as anticipated developments in agriculture and industry and population growth in
the basin, and the parallel impacts of climate in these sectors.
OVERALL CONCLUSIONS
A change in climate can alter the spatial and temporal availability of water resources. Extra
precipitation will be unequally distributed around the globe. Increasing variability alone would enhance the
probability of both flood and drought. Reduced river runoff can concentrate the effects of pollutants or
exacerbate the spread of water-borne disease. Recharge decreases from around 140 mm/year to <30 mm/year
(by SMBMs). Information on the impacts of climate change on hydrological processes and coastal water
resources is becoming more important. Need researches in understanding the exact problems related with
potential water resources due to impact of climatic change. Standard SMBMs are inappropriate for estimating
recharge.
55
REFERENCES
Beven K (1989) Changing ideas in hydrology—the case of physically-based models. J Hydrol 105:157
172
Daniel G (1977) Aspects of climate and water budget in Ethiopia, Technical monograph, Addis Ababa
University Press, Addis Ababa
Dooge JCI (1992) Hydrologic models and climate change. J Geophys Res 97(D3):2677–2686
CIAT 2004. Void-filled seamless SRTM data V1, 2004. International Centre for Tropical Agriculture
CIAT), available from the CGIAR-CSI SRTM 90m Database: http://srtm.csi.cgiar.org &
www.ambiotek.com/topoview.
Clark, L. 1985. Groundwater abstraction from Basement Complex areas of Africa. Quarterly Journal of
Engineering Geology, London, Vol. 18, 25-34.
Erskine, A. D. & Papaioannou, A. 1997. The use of aquifer response rate in the assessment of
groundwater resources. Journal of Hydrology, vol. 202, 373-391.
Barthel, Roland (2011), An indicator approach to assessing and predicting the quantitative state of
groundwater bodies on the regional scale with a special focus on the impacts of climate change,
Hydrogeology Journal, Volume 19, Issue 3, pp. 525-546.
Brouyere, S., Carabin, G. and Dassargues, A. (2004), Climate change impacts on groundwater
modelled deficits in a chalky aquifer, Geer basin, Belgium, Hydrogeology Journal, Vol. 12, pp.
123-134.
Carneiro, Júlio F., Boughriba, M., Correia, A., Zarhloule, Y., Rimi, A. and EL Houadi, B. (2008),
Climate Change Impact in a Shallow Coastal Mediterranean Aquifer, at Saïdia, Morocco, 20th
Salt Water Intrusion Meeting, 23-27 June 2008, Naples, Florida, USA, pp. 30-33.
Jyrkama, M.I., Sykes, J.F., Normani, S.D., 2002. Recharge estimationfor transient ground water
modeling. Ground Water 40 (6),638–648.
Kane, D.L., Stein, J., 1983. Water movement into seasonally frozensoils. Water Resources Research 19,
1547–1557.