Imaging the Sea Floor - USGS Publications Repository
30
Imaging the Sea Floor U.S. GEOLOGICAL SURVEY BULLETIN 2079
-
Upload
khangminh22 -
Category
Documents
-
view
0 -
download
0
Transcript of Imaging the Sea Floor - USGS Publications Repository

Imaging the Sea Floor
U.S. GEOLOGICAL SURVEY BULLETIN 2079
Area of sea floor imaged by a single pulse from the GLORIA towed vehicle.
FRONT COVER: GLORIA sidescan-sonar mosaic of the sea floor off Oregon and California. The two conspicuous linear features are the Blanco Fracture Zone and the Mendocino Fracture Zone, labeled on the map at right. The blank area just off the coast was not imaged because it is on the continental shelf, which is too shallow for GLORIA to be operated. The image of the land area is from Landsat 2 multispectral scanner, band 5. One inch on the image represents approximately 36 miles.
Features shown on front cover

Imaging the Sea Floor
By John S. Schlee, Herman A. Karl, and M.E. Torresan
U.S. GEOLOGICAL SURVEY BULLETIN 2079
A simplified description of two methods of sonic imaging of the sea floor-GLORIA and Sea Beam-plus sample images of the sea floor off the United States in the Atlantic and Pacific Oceans
UNITED STATES GOVERNMENT PRINTING OFFICE: 1995
U.S. DEPARTMENT OF THE INTERIOR
BRUCE BABBITT, Secretary
U.S. GEOLOGICAL SURVEY
GORDON P. EATON, Director
For sale by U.S. Geological Survey, Information Services Box 25286, Federal Center, Denver, CO 80225
Any use of trade, product, or firm names in this publication is for descriptive purposes only and does not imply endorsement by the U.S. Government.
Published in the Eastern Region, Reston, Va. Manuscript approved for publication November 29, 1993.
Library of Congress Cataloging in Publication Data
Schlee, John Stevens, 1928-lmaging the sea floor I by JohnS. Schlee, Herman A. Karl, and M.E. Torresan.
p. em. - (U.S. Geological Survey bulletin ; 2079) Includes bibliographical references. Supt. of Docs. no.: I 19.3:2079 I. Ocean bottom-Remote sensing. I. Karl, Herman A. II. Torresan, Michael.
III. Title. IV. Series. QE75.B9 no. 2079 [GC87] 557.3 s-dc20 [551.46'084'028] 93-50144
CIP
1.
2. -~ -t
3. 4.
5. 6.
7. 8.
9.
10. 11. 12.
13-14.
15. 16. 17.
CONTENTS
Abstract ............................................................................................ . Introduction . . . . . . . . . . . . . . . . . . . . . . . . . . . . . . . . . . . . . . . . . . . . . . . . . . . . . . . . . . . . . . . . . . . . . . . . . . . . . . . . . . . . . . . . 1
Acknowledgments . . . . . . . . . . . . . . . . . . . . . . . . . . . . . . . . . . . . . . . . . . . . . . . . . . . . . . . . . . . . . . . . . . . . . . . . . . 1 Early Sounding Methods........................................................................ 2 New Techniques for Imaging the Sea Floor . . . . . . . . . . . . . . . . . . . . . . . . . . . . . . . . . . . . . . . . . . . . . . . . . 2
Sea Beam.................................................................................... 2 Sidescan Sonar . . . . . . . . . . . . . . . . . . . . . . . . . . . . . . . . . . . . . . . . . . . . . . . . . . . . . . . . . . . . . . . . . . . . . . . . . . . . . . 3
Selected Views of the Deep Sea Floor.. .. .. .. .. . .. .. .. .. .. .. .. .. .. .. . .. .. .. .. .. .. .. .. .. .. .. .. 7 Part of the Atlantic Continental Rise . . . . . . . . . . . . . . . . . . . . . . . . . . . . . . . . . . . . . . . . . . . . . . . . . . . . 8 Monterey Canyon off California and Zhemchug Canyon off Alaska............ 12 Cascadia Seachannel off Washington and Oregon.................................. 15 Plate Tectonic Crustal Features .. .. . .. .. .. .. .. .. .. .. .. .. .. .. .. .... .. .. .. ... .. .. .. .. . .. . 18 Volcanic and Landslide Features. . . . . . . . . . . . . . . . . . . . . . . . . . . . . . . . . . . . . . . . . . . . . . . . . . . . . . . 20
Conclusions . . . . . . . . . . . . . . . . . . . . . . . . . . . . . . . . . . . . . . . . . . . . . . . . . . . . . . . . . . . . . . . . . . . . . . . . . . . . . . . . . . . . . . 24 References Cited . . . . . . . . . . . . . . . . . . . . . . . . . . . . . . . . . . . . . . . . . . . . . . . . . . . . . . . . . . . . . . . . . . . . . . . . . . . . . . . . 24
FIGURES
Schematic diagram of both the GLORIA and Sea Beam systems showing their towing configurations and the width of the swath that each system images .. .. .. .. .. .. . .. .. .. .. .. .. .. .. .. .. .. .. . .. .. .. . .. .. .. . .. . .. .. .. .. . .. . 2 Schematic diagram of a sidescan-sonar vehicle being towed over the sea floor and the resulting sonograph . . . . . . . . . . . . . . . . . . . . . . . . . . . . . . . . . . . . . . . . . . . . . . . . . . . . . . . . . . . . . . . . . . . . . . . . . . . . . . . . . . . . . . . . . . . . . . . . . . . . . . . . . . . . . . . . . . . . . . 3 Map showing Exclusive Economic Zone of the United States and U.S. insular areas........................... 4 Two high-frequency sidescan-sonar images of the shallow sea floor off Oregon showing a sunken ship and a sunken aircraft . . . . . . . . . . . . . . . . . . . . . . . . . . . . . . . . . . . . . . . . . . . . . . . . . . . . . . . . . . . . . . . . . . . . . . . . . . . . . . . . . . . . . . . . . . . . . . . . . . . . . . . . . 5 Mosaic of high-frequency sidescan-sonar images of part of the Massachusetts Bay sea floor.................. 6 Topographic profile through the submerged part of a typical passive continental margin like that off the U.S. Atlantic Coast........................................................................................................... 7 GLORIA mosaic of the continental slope and upper continental rise off the Middle Atlantic States.. . . . . . . 9 Sea Beam bathymetric map of the lower continental slope and upper continental rise for part of the 2' ;a shown in figure 7 . . . . . . . . . . . . . . . . . . . . . . . . . . . . . . . . . . . . . . . . . . . . . . . . . . . . . . . . . . . . . . . . . . . . . . . . . . . . . . . . . . . . . . . . . . . . . . . . . . . . . . . . . . . . 10 An enlarged part of the GLORIA mosaic shown in figure 7 to provide details for the same area mapped in figure 8 . . . . . . . . . . . . . . . . . . . . . . . . . . . . . . . . . . . . . . . . . . . . . . . . . . . . . . . . . . . . . . . . . . . . . . . . . . . . . . . . . . . . . . . . . . . . . . . . . . . . . . . . . . . . . . . . . . . . . 11 GLORIA mosaic of the sea floor off California showing the upper part of Monterey Canyon.. . . . . . . . . . . . . . . 13 GLORIA mosaic of the continental margin in the Bering Sea off Alaska showing Zhemchug Canyon . . . . . 14 Map showing major sea-floor features off Washington and Oregon pertaining to figures 13 and 14... ...... 16 GLORIA mosaics of the sea floor off Oregon showing-13. Cascadia Seachannel . . . . . . . . . . . . . . . . . . . . . . . . . . . . . . . . . . . . . . . . . . . . . . . . . . . . . . . . . . . . . . . . . . . . . . . . . . . . . . . . . . . . . . . . . . . . . . . . . . 17 14. Blanco Fracture Zone................................................................................................. 19 GLORIA mosaic showing a large part of the North Arch lava field on the sea floor off Oahu, Hawaii . ... 21 Map showing major submarine landslides off the Hawaiian Islands................................................ 22 GLORIA mosaic showing the coalesced Nuuanu and Wailau debris avalanches off Oahu and Molokai, Hawaii......................................................................................................................... 23
m


Imaging the Sea Floor
By JohnS. Schlee, 1 Herman A. Karl, 2 and M.E. Torresan2
ABSTRACT
Between the First and Second World Wars, acoustic methods (sonar) were developed to provide depth soundings of the sea floor. However, only in the last three decades have technologies evolved that permit scientists to survey large areas of the deep sea floor efficiently and to produce accurate maps and images that are analogous to topographic maps and aerial photographs of the sea floor. In the last 10 years, the use of computers to process the data collected by these technologies has greatly improved the quality of the resultant sea-floor maps and images. Scientists use bathymetric maps and images to help them understand the processes that created and shape the sea floor. Examples of these latest technological advances are discussed in nontechnical terms and focus on two specific mapping and imaging systems- the Sea Beam bathymetric mapping system and the GLORIA sidescan-sonar imaging system. Examples of the data collected by these systems are shown for various deep-sea areas off the United States.
INTRODUCTION
More than 70 percent of our planet is covered by water, which blocks a clear view of the sea floor. The largest, longest mountain range in the world-the midoceanic ridge system approximately 40,000 miles long and thousands of feet high-is entirely out of view, submerged except for a few islands like Iceland that extend above sea level. Very little of the deep sea floor has been seen by humans; the only direct observations come from a few thousand dives by research submarines to limited parts of the sea floor. Some bottom photographs and videotapes have been obtained by equipment dangled from surface
1 U.S. Geological Survey, Woods Hole, MA 02543. 2 U.S. Geological Survey, Menlo Park, CA 94025.
ships. Even though the submarine dives give a good closeup view (the windows are only a few feet from the bottom) of a small part of the sea floor, dive participants lack the broad panoramic views of the sea floor we take for granted on land.
From inside a small research submersible like Alvin, in which the passenger sphere is 6 feet in diameter, two scientists look out through 3.5-inch-diameter portholes onto a totally darkened sea floor illuminated only by the lights of the submarine. The circle of lighted sea floor is only a few square yards, and the scientist can look but not touch or feel the world on the other side of the porthole. On land, this would be like trying to get an impression of a totally dark landscape from a car; the observer's view would be limited to a 3.5-inch-diameter clear area in the windshield, and only the headlights would illuminate the darkness.
A panoramic view of the sea floor can be obtained by using remote-sensing techniques from ships; to penetrate the darkness of thousands of feet of water, these techniques use sound waves rather than light to image and make maps of the face of the deep sea floor. The new surveying tools described in the next few pages are the latest techniques to image the sea floor, and they offer us the first broad view of the deep sea floor through computer-aided technology.
Two of the techniques described in this bulletin allow the scientist to construct mosaics of large areas of the sea floor. The mosaics produced by these techniques are similar to aerial photographs and topographic maps of the land surface. On these mosaics, we can see such features as volcanoes, submarine channels, and mountain ranges. The mosaics are important because they help the scientist understand the forces and processes that shape the deep sea floor.
ACKNOWLEDGMENTS
This report has been improved by the reviews, interest, and suggestions of Bradford Butman, David Folger, Bonnie McGregor, and Thomas O'Brien, all of the U.S. Geological Survey (USGS). Simon Cargill (USGS) aided in many ways to get the paper through the publication process.

2 IMAGING THE SEA FLOOR
EARLY SOUNDING METHODS
Prior to the 1930's, most of the sounding of oceanic depths was done with a lead line; a line with a piece of lead attached was lowered to the sea floor, and the length of line was a measure of the water depth. This method was time consuming and laborious and yielded relatively few values. Between the two World Wars, scientists started using sound waves to make continuous profiles of water depth along the ship's track. Sound was put into the water, and it bounced back from the sea floor. The time it takes for the echo to return from the sea floor is proportional to the oceanic depth, and the resulting record gives an echogram or profile of the sea floor below the ship. However, a profile gives only a two-dimensional view (depth and a profile along the ship's track). No information is acquired about what the sea floor is like on either side of the ship's track. Whole canyons and mountains can be missed unless the ship passes directly over them. Echo sounding vastly improved our knowledge of the sea floor, but the true shape of many features could be determined only with difficulty.
During the 1950's, Bruce Heezen and Marie Tharp (Heezen and others, 1959) compiled echograms covering thousands of miles of tracklines for the world's oceans to create the first diagram maps of the deep sea floor. Their maps clearly delineated the continuity of the enormous midoceanic ridge system and showed other features (seamount chains and the midocean channel) poorly known before their maps.
NEW TECHNIQUES FOR IMAGING THE SEAFLOOR
Within the past 20 years, new techniques have been created that let us directly image large areas of the sea floor. These techniques are illustrated by describing two specific systems (fig. 1). The Sea Beam system is an improved way to map sea-floor elevations or bathymetry; the sidescansonar system provides an acoustic image that looks like an aerial photograph of the sea floor.
SEABEAM
Sea Beam was developed by the General Instrument Corporation for the Royal Australian Navy; it is a computeraided improvement of the Narrow Beam Echo Sounder. The system was first installed aboard the French research vessel Jean Charcot in 1977 to provide real-time detailed bathymetric maps (Tyee, 1986). Software and hardware were improved during the 1980's.
The present Sea Beam uses two groups of transducers in strips (9. 2 feet long) under the ship's hull parallel to and
Figure 1. Schematic diagram of both the GLORIA and Sea Beam systems showing their towing configurations and the width of the swath that each system images. Modified from Davis and others (1986, fig. 1).
at right angles to the keel. From these transducers, a sound (acoustic) signal is emitted; return signals are received by hull-mounted transducers positioned across the hull of the ship. The swath width across the sea floor is approximately 0. 8 of the water depth, and thus the system is most useful in the deep ocean beyond the edge of the continental shelf. The system is able to survey an area of approximately 1 ,030 square miles per day. The data from the computer are plotted as contoured swath maps shortly after acquisition. When the ship's track is spaced so that swaths overlap, depth measurements do not have to be projected between profiles. Experienced geologists revise the computerplotted data to construct an accurate bathymetric map of the sea floor. ·
These bathymetric maps are important because they give us an indication of how sea-floor features formed and the processes that have shaped the sea floor. For example, a block-faulted mountain range does not have the same appearance or topography as a chain of submarine volcanoes. Some submarine volcanoes are conical and commonly have a crater or depression at the top of the cone. A slump or landslide caused by the collapse of a submarine hillside can create a tongue-shaped feature. A sharply defined V -shaped canyon and channel system are thought to be cut by sediment-laden water flowing intermittently in turbidity currents.

NEW TECHNIQUES FOR IMAGING THE SEA FLOOR 3
Figure 2. Schematic diagram of a sidescan-sonar vehicle being towed over the sea floor (upper) and the resulting sonograph (lower) with images of trawl door tracks, tilefish burrow, gravel, and a boulder. From Able and others ( 1987).
SIDESCAN SONAR
Sidescan sonars look obliquely off to the side of the ship's track (fig. 1) and do not collect data from the sea floor directly beneath the ship, in contrast to conventional echosounders. Rather than being hull mounted like those in the Sea Beam system, the transducers are mounted in a torpedo-shaped vehicle (called a fish) towed behind the ship. In effect, sidescan sonar provides an image of the sea floor. By selecting the appropriate sidescan system, it is possible to obtain images of features as large as seamounts many miles in diameter and as small as sand ripples having wavelengths of only a few inches.
Sidescan sonar provides an acoustic image or sonograph of the sea floor that is similar to an aerial photograph of the Earth's land surface. As the sidescan-sonar instrument is towed behind the ship along previously determined tracklines, the sonar continuously emits pulses of sound that bounce off strips or swaths of the sea floor (fig. 2). The width of the swaths depends upon the type of sidescan-sonar system and the depth to the sea floor being imaged. Low-frequency systems have wide swaths, and highfrequency systems have narrow swaths. When constructing a mosaic, tracklines are spaced such that adjacent swaths overlap by 10 to 20 percent. The sidescan data are processed by computers, and a digital mosaic of a chosen area of
the sea floor is progressively built by overlapping and joining adjacent swaths.
The mosaic is in shades of gray that range from very dark gray to nearly white; features of the sea floor are defined by varying energy levels of sound returned from the sea floor to yield an acoustic image. The darker shades correspond to low backscatter levels. Many complex factors determine how sound is backscattered and reflected from the sea floor. The differences in the energy of the backscattered sound are related to bottom-sediment grain size and the roughness, hardness, and slope of the sea floor. Consequently, interpretation of the acoustic mosaic is not as straightforward as interpretation of an aerial photograph. Other data sets (cores, sediment samples, sonic profiles, and bottom photographs) must be used to supplement sonar data so that the sonar images can be interpreted as accurately as possible (Johnson and Helferty, 1990; Gardner and others, 1991 ; Schlee and Robb, 1991). These other data provide "ground truth" for checking the interpretation of the sonar image. The sea-floor characteristics reflect the host of geologic processes that have produced the sea-floor environment. The sonographs are used to define features of the study area, to interpret geologic processes operating on the deep sea floor, and to provide information relevant to environmental issues.
Scientists use a variety of sidescan-sonar systems to map the ocean floor. Low-frequency systems that send sound pulses at about 6.5 kilohertz (6.5 kHz or 6 cycles per second) are best suited for regional reconnaissance mapping of broad areas of the sea floor. Mid-range (30-kHz) and high-resolution (100-kHz) sidescan-sonar systems are best suited for most environmental monitoring purposes and for locating manmade objects on the sea floor.
Reconnaissance mapping of very large areas of the sea floor is accomplished with the GLORIA (Geological LOng Range Inclined Asdic) sidescan system developed by the Institute of Oceanographic Sciences (lOS), a Britisn scientific governmental organization (Somers and others, 1978; Laughton, 1981). The GLORIA tow fish is 26 feet long and 2 feet in diameter and weighs 2.25 tons in air. This 6.5-kHz system is capable of being used at speeds of up to 11 miles per hour and imaging swaths of sea floor as wide as 28 miles. Since 1984, the USGS, in cooperation with lOS, has been using GLORIA to survey the offshore areas included in the U.S. Exclusive Economic Zone (EEZ). The U.S. EEZ was claimed by President Reagan in 1983 and consists of submerged areas within 200 nautical miles (230 statute miles) of the United States and its territories (fig. 3). Results from the surveys of the EEZ have been published as atlases of areas off our coast (Bering Sea EEZ-SCAN Scientific Staff, 1991: EEZ-SCAN 84 Scientific Staff, 1986; EEZ-SCAN 85 Scientific Staff, 1987; EEZ-SCAN 87 Scientific Staff, 1991).
The system is ideal for constructing sonographic mosaics that show regional-scale features such as submarine

4 IMAGING THE SEA FLOOR
almyra Atoll
Jarvis Island PACIFIC OCEAN
Island American Samoa
180° 150°W 120° goo 60°
0 2000 4000 KILOMETERS
I I I I I I
0 1000 2000 NAUTICAL MILES
Figure 3. Exclusive Economic Zone of the United States and U.S. insular areas. Outlines on map are approximate. Leaders from figure numbers indicate areas for which images are presented in this bulletin.
fans, fracture zones, and seamounts. With the GLORIA system, approximately 290,000 square miles of sea floor can be surveyed in about 3 months. However, the system cannot be used in water depths shallower than 650 feet and cannot resolve (distinguish) features smaller than about 160 to 500 feet. Consequently, it is not the system to use for monitoring small-scale physical and biological processes and products on the sea floor.
The mid-frequency (30-k.Hz) sidescan systems are able to resolve features as small as a few tens of yards and, under optimum conditions, smaller. For many of these systems, the fish is towed close to the sea floor, and consequently these are called deep-towed systems. These systems typically have swath widths that range from 1,650 feet to 3 miles, and the fish is towed at speeds between 1. 7 and 5. 7 miles per hour, with 4 miles per hour being typical.
, Although these systems cannot map as large an area as GLORIA in a day, mid-range systems, like the highfrequency systems described in the next paragraph, are also capable of detecting small objects on the sea floor. The USGS used a 30-k.Hz system, the SeaMARC 1A, to locate
barrels of radioactive waste offshore from San Francisco Bay (Karl and others, 1992).
The high-frequency (100-k.Hz) sidescan systems typically map swaths having widths of 650 to 1,300 feet (some can map swaths as wide as 3,300 feet) and are capable of resolving objects as small as a few feet. The highfrequency, shallow-water sonar systems, because of their ability to resolve and detect sunken objects, are often used to map the location of pipelines or to locate debris on the sea floor (fig. 4), as well as to map geologic features. In shallow water, the high-frequency sonars have shown complex alternating patterns of sediment type and bottom morphology. In Massachusetts Bay off Boston, for example, a sidescan mosaic of the sea floor made with a 100-k.Hz sidescan instrument shows areas of fine-grained sediments, areas of boulders, and sand-wave fields, which change over spatial scales of a few hundred yards or less (fig. 5). The spatial complexity of the sea floor revealed in this acoustic image would have been impossible to obtain by taking and analyzing individual samples of the sea floor (Butman and others, 1992).

NEW TECHNIQUES FOR IMAGING THE SEA FLOOR 5
Figure 4. Two high-frequency sidescan-sonar images of the shallow sea floor off Oregon showing (A) a sunken ship (courtesy of Klein Associates, Salem, N.H.) and (B) a sunken military aircraft PBY 4 (courtesy of Williamson and Associates, Seattle, Wash.). The bright band across each image is the outgoing sound pulse and marks the ship's track across the continental shelf. The shadow adjacent to the plane is caused by the tail, wings, and fuselage blocking return of a signal from the area of sea floor behind the plane.

6 IMAGING THE SEA FLOOR
Figure 5. Mosaic of high-frequency sidescan-sonar images of part of the Massachusetts Bay sea floor. The depth contours (in feet below mean low water) are superimposed; the contour interval is 5 feet. Numbered ticks at bottom and on left side of figure indicate distance in feet (1 ,000 feet between ticks). The north-trending stripes indicate the ship's track and are not removed by the processing techniques used here. The blank gray
stripes are areas of no data return. Note that high areas of the sea floor are associated with a bright sonar return, indicating gravel and boulders, and that low areas are associated with a darker sonar return, indicating fine-grained sediment. Areas A and B considered for the outfall of treated sewage effluent from Boston are outlined in center of figure and along right edge. From Bothner and others (1992).
SELECTED VIEWS OF THE DEEP SEA FLOOR
SHORELINE
t CONTINENTAL SHELF
0 .....J
~~I ;::<l: 5~ 2 (SCALES IN MILES) >
3 0 5 10 15 20 25 30 35
HORIZONTAL SCALE VERTICAL EXAGGERATION 5:1
7
SEA LEVEL
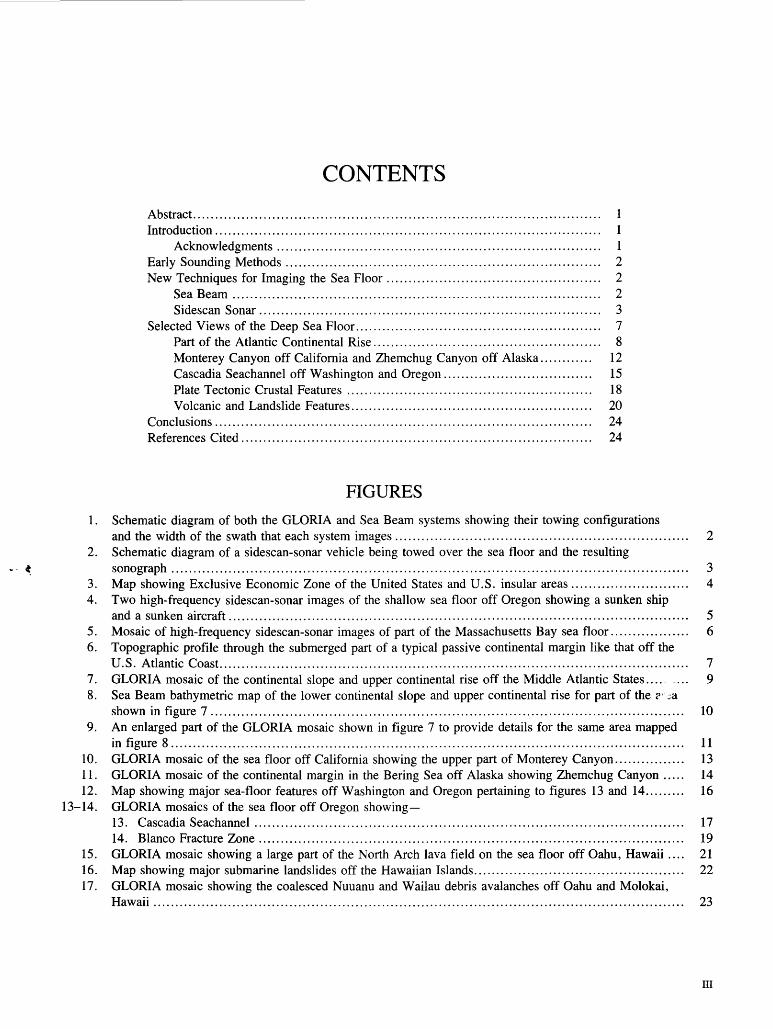
Figure 6. Topographic profile through the submerged part of a typical passive continental margin like that off the U.S. Atlantic Coast. Water depth at the shelf-slope boundary is 650 feet.
SELECTED VIEWS OF THE DEEP SEA FLOOR
Off most land areas like the Eastern United States, the submerged continental margin consists of the shelf, slope, and continental rise (fig. 6) . During the GLORIA cruises, most areas surveyed were deepwater areas like the rise. What do the GLORIA images show about the deep sea floor? The images in the rest of this bulletin provide some examples, and one image is compared with a Sea Beam map of the same area .

8 IMAGING THE SEA FLOOR
PART OF THE ATLANTIC CONTINENTAL RISE
The GLORIA mosaic in figure 7 shows the area seaward of the continental rise off the Middle Atlantic States of New Jersey, Delaware, Maryland, Virginia, and North Carolina in deep water beyond the continental shelf. The deep sea floor shown by the mosaic covers about 49,000 square miles, roughly the area of New York State, from a water depth of 650 feet (edge of the continental shelf) to about 14,750 feet, mainly the gradually deepening area of the continental rise. On the image, you can see broad meandering valleys and channelways (serpentine, light-gray bands) that snake across the mosaic. They have been cut by sediment-laden turbidity currents that flow underwater intermittently down canyons and across the deep sea floor, carrying sand, gravel, and mud downslope to their ultimate resting place in broad, deep plains seaward of the area shown by the mosaic. These turbidity currents have the power to erode valleys and channels, provided the slope is steep enough, and to disrupt and break submarine transoceanic communication cables where they cross active submarine channels.
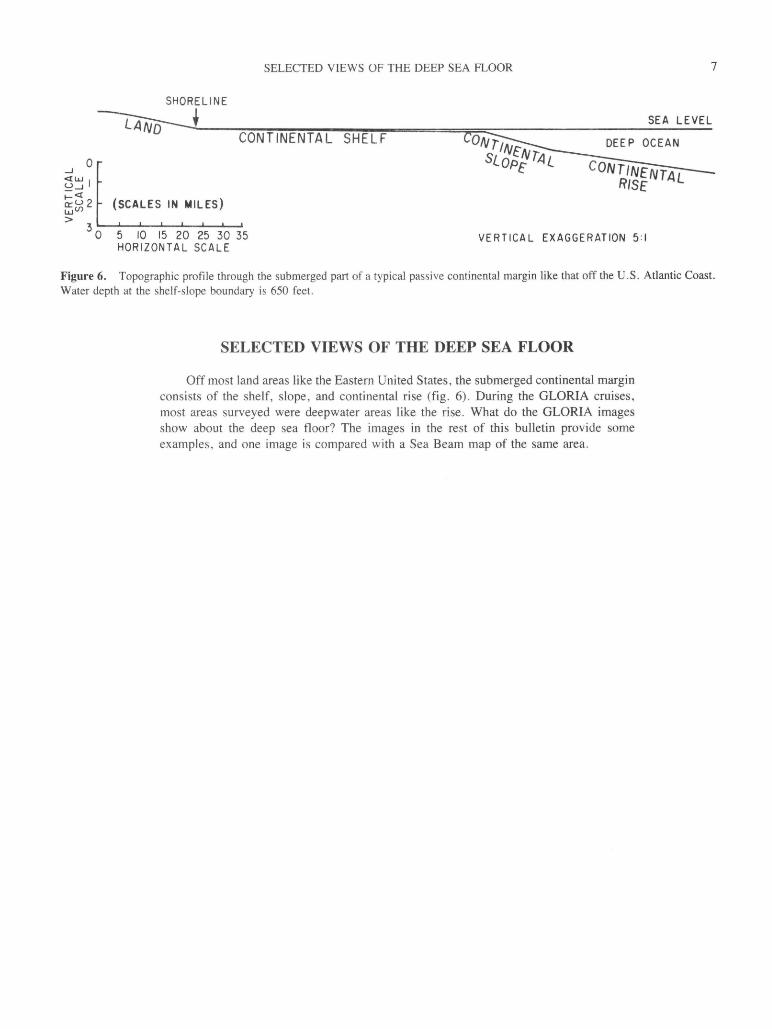
If a small part of the mosaic is enlarged (figs. 8 and 9), you can see that some of the channels or valleys lose their definition once they reach the nearly flat surface of the continental rise (the snakelike patterns appear to end). To see this better, let us look at a Sea Beam map (fig. 8) that depicts in detail a small part of the area shown in the mosaic (fig. 7). The map in figure 8 shows the boundary area between the uppermost, nearly flat continental rise and the
lower part of the continental slope; the surface of the continental slope commonly dips 4 o -6°. The lines on the map connect features at equal depth at an interval of 20 meters (each meter is approximately 3 feet). You can see valleys coming in from the upper left where the contour lines are close together (continental slope). Many of the valleys, gently curved to straight, continue toward the center of the map (where contours are more widely spaced on the upper continental rise, a much flatter part of the sea floor). At least two submarine canyons (Baltimore and Wilmington) continue out onto the rise as meandering (sinuous), well-defined channels a fraction of a mile wide and 50-150 feet below the adjacent rise. Most of the other slope canyons disappear where they enter the rise (widely spaced contours). Even the Baltimore and Wilmington Canyons lose their clear outlines on the rise, as shown toward the right edge of the map. The amount of sediment flowing periodically through most of the slope canyons has not been sufficient to maintain the channels out on the flat area of the rise, and their extensions there have been covered by later sediment.
The GLORIA mosaic of approximately the same area greatly enlarged (fig. 9) shows many of the same features as the Sea Beam map. Both the Baltimore and Wilmington Canyons are evident as linear streaks across the mosaic; some meandering of the channels is apparent too. As on the Sea Beam map, both canyons lose their outlines toward the right side of the mosaic.

SELECTED VIEWS OF THE DEEP SEA FLOOR
76° 74° 72° 70° .---.-----------~.-------------,---------------------------~--------------------------~
36°
Figure 7. GLORIA mosaic of the continental slope and upper continental rise off the Middle Atlantic States of New Jersey, Delaware, Maryland, Virginia, and North Carolina. Areas of figures 8 and 9, showing the base of the continental slope, are indicated. Mosaic from Schlee and Robb (1991 , fig. 2A).
9
38020' 'u w 'u uv - - . ' - 'v -v 73010' 73000' - ' '' ~ ' . '
38°10 I ~~~~t~~J~l~~~~'.C"~\~~~0§~~~ _.rl))_~\\,jr~JJJlt~ _)\\\ ·-c '-,':\_'-\> - ~10~___c:_.--c, Jr~~\\ \~
l"'f~~~Ul'*'/~(V~?~JM£0> -~\~({(~ ~~ilo ~~~ -~<Z0iJ · rAr~--"' ~~w :1 ~, r 0 r-/ ~~~ ) • · · :&..~/~ ~~'!;,// \ ' \ ,---- ~- _ _ ~r;,IJ, ~/; r 1 ., r----s- /-~---;::--.-.: .. "'_~.~ " · · · ·,-~'1 J \ ~\
38°00'
0 10 MILES
0 10 KILOMETERS
Figure 8. Sea Beam bathymetric map of the lower continental slope and upper continental rise near Baltimore and Wilmington Canyons; contours of equal depth (thin black lines) show that water gradually deepens to the right across the upper continental rise (from B.A. McGregor, U.S. Geological Survey, written commun., 1990). Dark
areas (upper left) of many canyons are the lower continental slope (major area of depth transition to the deep sea). Notice that Baltimore and Wilmington Canyons continue out onto the upper continental rise. Location of mapped area is indicated in figure 7.
-0
§: >-0 z 0 ....., 0:: m C/.l m >-~ 0 0 it)

73010'
3B"1o· ~~u:~~~~w:u: !!Hif'"~'-i:~~~~~. w 7 1 .:/ :I*E .~~~1k"':;~·.s11Pi!'~~!!l;: ~~!!k~:'::~ $!·"' ~~~
0 10 MILES I I I I I I I I I I I
0 10 KILOMETERS
Figure 9. An enlargement of the GLORIA mosaic area outlined in figure 7. The same area is included in the Sea Beam bathymetric map (fig. 8) of the lower continental slope and upper continental rise near Baltimore and Wilmington Canyons. These canyons appear as linear streaks across the mosaic.
C/l tTl t'"""' tTl n .....J tTl t:1 < lTi ~ C/l
0 "Tl .....J ::r: tTl t:1 tTl tTl '"0 C/l tTl > "Tl t'"""' 0 0 :;tl
~
~
12 IMAGING THE SEA FLOOR
MONTEREY CANYON OFF CALIFORNIA AND ZHEMCHUG CANYON OFF ALASKA
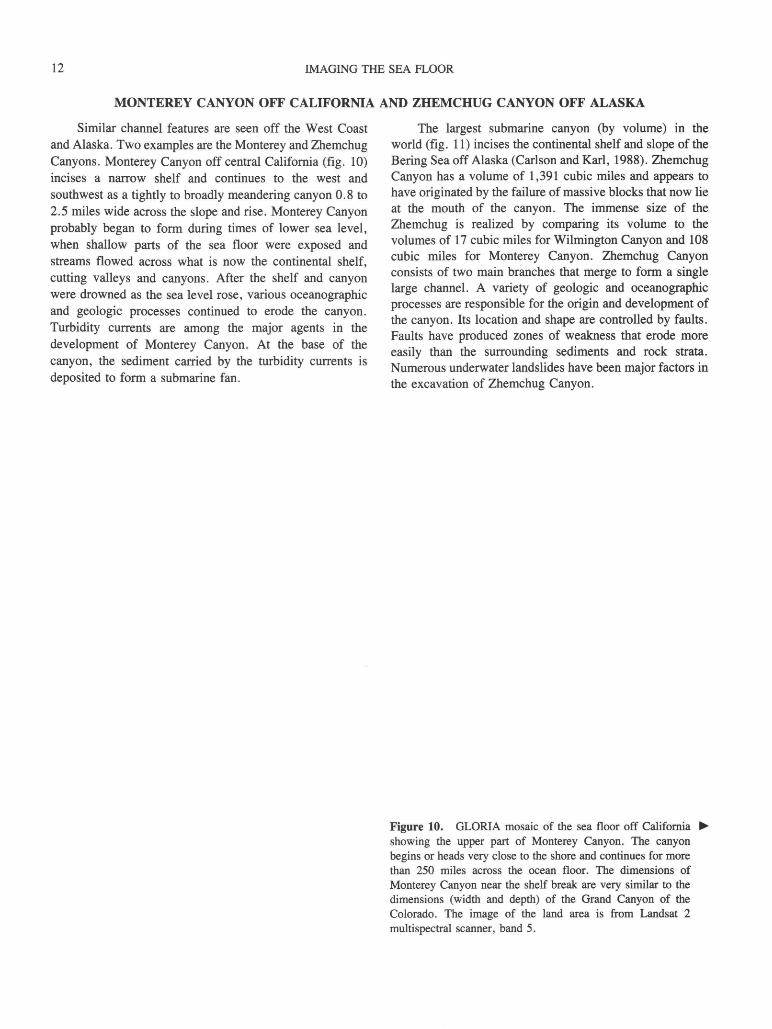
Similar channel features are seen off the West Coast and Alaska. Two examples are the Monterey and Zhemchug Canyons. Monterey Canyon off central California (fig. 10) incises a narrow shelf and continues to the west and southwest as a tightly to broadly meandering canyon 0.8 to 2.5 miles wide across the slope and rise. Monterey Canyon probably began to form during times of lower sea level, when shallow parts of the sea floor were exposed and streams flowed across what is now the continental shelf, cutting valleys and canyons. After the shelf and canyon were drowned as the sea level rose, various oceanographic and geologic processes continued to erode the canyon. Turbidity currents are among the major agents in the development of Monterey Canyon. At the base of the canyon, the sediment carried by the turbidity currents is deposited to form a submarine fan.
The largest submarine canyon (by volume) in the world (fig. 11) incises the continental shelf and slope of the Bering Sea off Alaska (Carlson and Karl, 1988). Zhemchug Canyon has a volume of 1,391 cubic miles and appears to have originated by the failure of massive blocks that now lie at the mouth of the canyon. The immense size of the Zhemchug is realized by comparing its volume to the volumes of 17 cubic miles for Wilmington Canyon and 108 cubic miles for Monterey Canyon. Zhemchug Canyon consists of two main branches that merge to form a single large channel. A variety of geologic and oceanographic processes are responsible for the origin and development of the canyon. Its location and shape are controlled by faults. Faults have produced zones of weakness that erode more easily than the surrounding sediments and rock strata. Numerous underwater landslides have been major factors in the excavation of Zhemchug Canyon.
Figure 10. GLORIA mosaic of the sea floor off California .... showing the upper part of Monterey Canyon. The canyon begins or heads very close to the shore and continues for more than 250 miles across the ocean floor. The dimensions of Monterey Canyon near the shelf break are very similar to the dimensions (width and depth) of the Grand Canyon of the Colorado. The image of the land area is from Landsat 2 multispectral scanner, band 5.

Area of figure
SELECTED VIEWS OF THE DEEP SEA FLOOR
10 20
10 20 30 KILOMETERS
13
30 MILES
14 IMAGING THE SEA FLOOR
58°
Area of ligure"o
10
10
20
Figure 11. GLORIA mosaic of the continental margin in the Bering Sea off Alaska showing Zhemchug Canyon. Enormous submarine canyons dominate the continental margin of the Bering Sea. Zhemchug Canyon is over 250 miles from the
175°
20 30 MILES
30 KILOMETERS
closest shoreline. The canyon is 60 miles wide and more than 1.5 miles deep at the edge of the continental shelf; on the basis of volume, it is the largest submarine canyon in the world.

SELECTED VIEWS OF THE DEEP SEA FLOOR 15
CASCADIA SEA CHANNEL OFF WASHINGTON AND OREGON
Off northern California, Washington, and Oregon, channels issue from the mouths of some canyons and wind their way for many hundreds of miles across the deep sea floor. One such channel is Cascadia Seachannel off Washington and Oregon (figs. 12 and 13). Cascadia Seachannel begins at the mouth of Nitinat Canyon and gently meanders across the abyssal ocean floor until it makes a sharp
right-angle bend to enter the Blanco Fracture Zone (defined below). It leaves the Blanco Fracture Zone to terminate on the Tufts Plain. The origin of large deep-sea channels is controversial. Turbidity currents that episodically flow down the length of the channels undoubtedly contributed to the formation and growth of these channels.

16 IMAGING THE SEA FLOOR
TUFTS PLAIN
_,()
-<~c~, ~
EXPLANATION C'
Spreading ridges and ..0(-1.,._ fracture zone / !;:'
- Seamounts
~ Major troughs
100 MILES
100 KILOMETERS
Contours in meters
Figure 12. Major sea-floor features off Washington and Oregon, including those that are discussed in the text and in figures 13 and 14. Locations of areas imaged in the two figures are shown. Screened areas representing spreading ridges and fracture zones lack thick sediment cover, as shown on GLORIA imagery. Modified from Karl and others (1989, fig. 1).
SELECTED VIEWS OF THE DEEP SEA FLOOR
I 50 KILOMETERS
50 MILES I
Figure 13. GLORIA mosaic of the sea floor off Oregon showing part of the Cascadia Seachannel. The channel originates at the base of the continental slope off Washington and parallels the continental slope southward as far as the Blanco Fracture Zone; there the channel turns west, follows the fracture zone for about 100 miles, exits, and terminates on the Tufts Plain.
17

18 IMAGING THE SEA FLOOR
PLATE TECTONIC CRUSTAL FEATURES
The features described thus far are products of the geological processes of sedimentation, deposition, and erosion. Other features on the sea floor seen on the GLORIA images are the products of volcanism and the processes that build mountains and cause earthquakes. The outermost shell of the Earth, the crust, is made up of many thin crustal segments called plates . The plates are constantly moving. Individual plates are separated from each other by spreading centers (where new sea floor is created), fracture zones (where plates move past each other), and subduction zones (where old sea floor is destroyed as it is pushed under the continents at the deep ocean trenches).
New oceanic crust is created in the median rift valley of the Gorda Ridge (fig. 14) by injections of molten rock (magma) from a region called the mantle, deep within the Earth. As the magma cools, new oceanic crust forms as a series of ridges and valleys that are clearly seen on the sonograph. Successive injections of magma push new crust
away from the rift valley as part of the process called sea-floor spreading, and Gorda Ridge is functionally termed a spreading center. Because new ocean floor is created at the median rift valley, ridges are progressively older farther away from the median rift valley and they are less pronounced because they are covered with thicker deposits of sediment. The area lacking thick sedimentary cover is detectable on GLORIA imagery, which was used to place the pattern for spreading ridges and fracture zones in figure 12. Spreading centers are typically terminated by a special type of fault called a transform fault that trends at near-right angles to the spreading center. For example, the Blanco Fracture Zone is a transform fault at the northern terminus of Gorda Ridge. Earthquakes occur along fracture zones as crustal plates slide past each other on either side of the transform fault and along spreading centers during magma injections.
SELECTED VIEWS OF THE DEEP SEA FLOOR
126°
0 25 MILES
0 25 KILOMETERS
EXPLANATION
D o Median rift valley Volcano
Ridge crest 7 1 Fracture zone _ _...,_....,,_ 7
Figure 14. GLORIA mosaic of the sea floor off Oregon showing the Blanco Fracture Zone at the northern terminus of Gorda Ridge. The Gorda Ridge, a median rift valley flanked by a series of ridges and valleys, separates two crustal plates.
19

20 IMAGING THE SEA FLOOR
VOLCANIC AND LANDSLIDE FEATURES
Some undersea volcanoes are in the middle of plates; in some areas, like the Hawaiian Islands, these volcanoes extend above sea level. The North Arch lava field, and associated Cretaceous ridges and seamounts, and volcanic fissures and vents are shown in figure 15. The total field covers an area of about 9, 700 square miles. The lava flows are extensive and relatively flat. The vents for the extensive flows have not been identified, but they appear to be located near the bases of Cretaceous ridges and isolated volcanoes within the volcanic field. Flows of several different ages are distinguished on the basis of the backscatter contrasts observed on the mosaic; typically, the older flows have lower backscatter. The flows are seen to have traveled off the arch, both to the north and south, in a downslope direction. Individual narrow flows that are seen to occupy topographic lows on the sea floor have traveled up to 60 miles. More than 200 new volcanoes were discovered off the West Coast of the United States during the 1984 GLORIA surveys. Most of the undersea volcanoes seen on the GLORIA images are not active; they are either extinct or dormant.
In addition to the volcanic features, immense landslides have been discovered off the Hawaiian Islands (fig. 16). These submarine landslides are among the largest on Earth and are exposed over an area slightly larger than five times the land area of the Hawaiian Islands; the landslides whose extent is partly shown in figure 17 cover 10,000 square miles (Moore and others, 1989), an area slightly larger than the State of Vermont. The Hawaiian landslides are of two kinds-slumps, which have moved slowly and intermittently, and debris avalanches, which can involve the failure of hundreds of cubic miles of rock and sediment that have disintegrated into relatively small pieces (which may still be quite large) and have moved rapidly and catastrophically. Debris blocks range in size from Tuscaloosa Seamount, the large (greater than 12 miles across) tabular block shown near the center of figure 17 (extending northwest from lat 22°N., long 157°W.), down to small blocks of talus below the resolution of the GLORIA system. The relatively thin, irregular, downslope-trending light returns immediately offshore of the islands are from numerous submerged canyons.
Figure 15. GLORIA mosaic of lavas on the sea floor north of ...,.. the island of Oahu, Hawaii. GLORIA sidescan-sonar surveys conducted in the Exclusive Economic Zone surrounding the Hawaiian Islands discovered the North Arch lava field, an extensive lava flow field north of Oahu. The volcanic field is on the Hawaiian Arch, a 650-foot-high flexural arch formed by the loading of the ocean's crust by the weight of the Hawaiian Islands. The region is characterized by high acoustic backscatter, and the GLORIA images are constructed so that areas of high and low acoustic backscatter are shown by light and dark tones, respectively. Lava flows, ridges, and seamounts typically appear lighter (brighter) than the sediment because they provide a greater acoustic backscatter.

159° 2501JSiiDI ___ _
Area of figure
"' D
SELECTED VIEWS OF THE DEEP SEA FLOOR
EXPLANATION
Ridge, dashed where inferred Volcano Large, old or eroded or rugged seamount, probably Cretaceous; dashed where inferred
21
22 IMAGING THE SEA FLOOR
~-. :'-' :'._.
·~:·:::{:)~:> .. I
I ,
100 KILOMETERS
I I
100 MILES
Figure 16. Major submarine landslides-consisting of slumps and debris avalanches-off the Hawaiian Islands. Area of figure 17, showing Nuuanu and Wailau debris avalanches, is indicated. Extent of landslides is shown by dashed lines. Dot-patterned areas represent hummocky ground associated with debris avalanches;
dots are more widely spaced where topography is subdued. Hachured lines indicate scarps associated with slumps. Thin, downslope-directed lines represent submarine canyons and their subaerial counterparts. Modified from Moore and others (1989, fig . 2).
Figure 17. GLORIA mosaic showing the coalesced Nuuanu ~ and Wailau debris avalanches, which are submarine landslides north of the islands of Oahu and Molokai, Hawaii. The Tuscaloosa Seamount is a large debris block in the landslides. The lighter shades designate regions of greater acoustic backscatter, either because of a steep slope facing the incoming signal or because of the blocky talus of debris avalanche deposits. Mosaic from Moore and others (1989). Location of mosaicked area is shown in figure 16.

SELECTED VIEWS OF THE DEEP SEA FLOOR 23

24 IMAGING THE SEA FLOOR
CONCLUSIONS
GLORIA images show a complex series of landforms dominated by slumping and sedimentation in the North Atlantic and Pacific and by plate tectonics and volcanism in the actively growing part of the deep oceanic basins. Sea Beam maps are relatively new, but some have been published by NOAA (U.S. National Oceanic and Atmospheric Administration, 1991) for some areas of the continental slope in the Gulf of Mexico and off Washington, Virginia, and Alaska. With acoustic technology, geologists are learning about the 70 percent of the Earth's surface that they have never seen, the sea floor. Acoustic technology is lighting the way in the remote darkness. We hope this brief description of the technology and some of the sea-floor features will interest you to look further at the atlases and maps cited in this bulletin.
REFERENCES CITED
Able, K.W., Twichell, D.C., Grimes, C.B., and Jones, R.S., 1987, Sidescan sonar as a tool for detection of demersal fish habitats: Fisheries Bulletin, v. 85, no. 4, p. 725-736.
Bering Sea EEZ-SCAN Scientific Staff, 1991, Atlas of the U.S. Exclusive Economic Zone, Bering Sea: U.S. Geological Survey Miscellaneous Investigations Series I-2053, 145 p., scale 1:500,000.
Bothner, M.H., Parmenter, C.M., Twichell, D.C., Polloni, C.F., and Knebel, H.J., 1992, A geologic map of the sea floor in western Massachusetts Bay, constructed from digital sidescan-sonar images, photography, and sediment samples: U.S. Geological Survey Digital Data Series DDS-3, 1 CD-ROM.
Butman, Bradford, Bothner, M.H., Hathaway, J.C., Jenter, H.L., Knebel, H.J., Manheim, F.T., and Signell, R.P., 1992, Contaminant transport and accumulation in Massachusetts Bay and Boston Harbor: A summary of U.S. Geological Survey studies: U.S. Geological Survey Open-File Report 92-202, 42 p.
Carlson, P.R., and Karl, H.A., 1988, Development of large submarine canyons in the Bering Sea, indicated by morphologic, seismic, and sedimentologic characteristics: Geological Society of America Bulletin, v. 100, p. 1594--1615.
Davis, E.E., Currie, R.G., Sawyer, B.S., and Kosalos, J.G., 1986, The use of swath bathymetric and acoustic image mapping tools in marine geoscience: Marine Technology Society Journal, v. 20, no. 4, p. 17-27.
EEZ-SCAN 84 Scientific Staff, 1986, Atlas of the Exclusive Economic Zone, western conterminous United States: U.S.
Geological Survey Miscellaneous Investigations Series I-1792, 152 p., scale 1:500,000.
EEZ-SCAN 85 Scientific Staff, 1987, Atlas of the U.S. Exclusive Economic Zone, Gulf of Mexico and eastern Caribbean areas: U.S. Geological Survey Miscellaneous Investigations Series I-1864--A,B, 162 p., scale 1:500,000.
EEZ-SCAN 87 Scientific Staff, 1991, Atlas of the U.S. Exclusive Economic Zone, Atlantic continental margin: U.S. Geological Survey Miscellaneous Investigations Series I-2054, 174 p., scale 1:500,000.
Gardner, J.V., Field, M.E., Lee, H., Ewards, B.E., Masson, D.G., Kenyon, N., and Kidd, R.B., 1991, Ground truthing 6.5-kHz side scan sonographs: what are we really imaging?: Journal of Geophysical Research, v. 96, no. B4, p. 5955-5974.
Heezen, B.C., Tharp, Marie, and Ewing, Maurice, 1959, The floor of the Oceans. I. The North Atlantic: Geological Society of America Special Paper 65, 122 p.
Johnson, H.P., and Helferty, Maryann, 1990, The geological interpretation of side-scan sonar: Reviews of Geophysics, v. 28, no. 4, p. 357-380.
Karl, H.A., Hampton, M.A., and Kenyon, N.H., 1989, Lateral migration of Cascadia Channel in response to accretionary tectonics: Geology, v. 17, no. 2, p. 144--147.
Karl, H.A., Schwab, W.C., Drake, D.E., and Chin, J.L., 1992, Detection of barrels that contain low-level radioactive waste in Farallon Island Radioactive Waste Dumpsite using side-· scan sonar and underwater-optical systems-Preliminary interpretation of barrel distribution: U.S. Geological Survey Open-File Report 92-178, 29 p.
Laughton, A.S., 1981, The first decade of GLORIA: Journal of Geophysical Research, v. 86, no. B12, p. 11511-11534.
Moore, J.G., Clague, D.A., Holcomb, R.T., Lipman, P.W., Normark, W.R., and Torresan, M.E., 1989, Prodigious submarine landslides on the Hawaiian Ridge: Journal of Geophysical Research, v. 94, no. B12, p. 17465-17484.
Schlee, J.S., and Robb, J.M., 1991, Submarine processes of the middle Atlantic continental rise based on GLORIA imagery: Geological Society of America Bulletin, v. 103, p. 1090-1103.
Somers, M.L., Carson, R.M., Revie, J.A., Edge, R.H., Barrow, B.J., and Andrews, A.G., 1978, GLORIA II-An improved long range sidescan sonar, in Instrumentation and Communications, [Proceedings of] Technical Session J of Oceanology International 78: London, BPS Publications Ltd., p. 16-24.
Tyee, R.C., 1986, Deep seafloor mapping systems-A review: Marine Technology Society Journal, v. 20, no. 4, p. 4--16.
U.S. National Oceanic and Atmospheric Administration (NOAA), 1991, U.S. bathymetric and fishing maps: National Ocean Service Catalogue 5, 1 sheet.
*U.S. G.P.0.:1995-387-030:66