GAPA N A L Y S I S - USGS Publications Repository
100
GAP A N A L Y S I S BULLETIN No. 8 A Geographic Approach to Planning for Biological Diversity U.S. Department of the Interior U.S. Geological Service CONTINUED ON BACK COVER 1999 CONTENTS DIRECTOR’S CORNER Kevin Gergely .................................................................................................................... 2 FEATURES GAP: The First Ten Years Elisabeth Brackney and Patrick Crist ............................................................................... 3 GAP: The Next Ten Years Michael Jennings, John Mosesso, and J. Michael Scott .................................................. 6 Land Cover Characterization in Gap Analysis: Past, Present, and Future Collin Homer and Patrick Crist ........................................................................................ 8 Experience and Trends in Animal Distribution Modeling Patrick Crist and J. Michael Scott .................................................................................. 11 Identifying the Gaps, Locating the Reserves: Some Thoughts on Getting Gap Analysis into Conservation Practice Patrick Crist and J. Michael Scott .................................................................................. 14 Hawai‘i: A Tropical Insular Approach to Gap Analysis Samuel M. Gon, III, Allen Allison, Ronald J. Cannarella, James D. Jacobi, Michael H. Kido, Stephen E. Miller, and Daniel E. Orodenker .................................... 16 LAND COVER Predictive Modeling of Rare Plant Species Walter Fertig ................................................................................................................... 18 Comparison of Satellite Imagery Interpretation Using Known Association/Alliance-Level Data Vickie J. Smith, Chad J. Kopplin, Jonathan A. Jenks, Bruce K. Wylie, James E. Vogelmann, and Robert W. Klaver .................................................................. 20 Estimating and Mapping the Thematic Accuracy of GAP Land Cover Maps Roland L. Redmond ......................................................................................................... 24 ANIMAL MODELING On Vertebrate Generations and Plant Succession: Incorporating Vegetation Structural Attributes into Vertebrate Modeling Francisco J. Vilella and Richard B. Minnis .................................................................... 25 EMAP Hexagon Coverage Included in South Dakota’s Sportsman’s Atlas Vickie J. Smith, Chad J. Kopplin, and Jonathan A. Jenks .............................................. 29 STEWARDSHIP AND ANALYSIS Kansas GAP: Preparing the Stewardship Layer Holly Barcus, Jennifer Radcliff, and Rajesh Poudyal .................................................... 30
-
Upload
khangminh22 -
Category
Documents
-
view
2 -
download
0
Transcript of GAPA N A L Y S I S - USGS Publications Repository

GAPA N A L Y S I S
B U L L E T I N
No. 8
A Geographic Approach to Planning for Biological Diversity
U.S. Department of the InteriorU.S. Geological Service
CONTINUED ON BACK COVER
1999
CONTENTS
DIRECTOR’S CORNERKevin Gergely ....................................................................................................................2
FEATURESGAP: The First Ten Years
Elisabeth Brackney and Patrick Crist ...............................................................................3GAP: The Next Ten Years
Michael Jennings, John Mosesso, and J. Michael Scott ..................................................6Land Cover Characterization in Gap Analysis: Past, Present, and Future
Collin Homer and Patrick Crist ........................................................................................8Experience and Trends in Animal Distribution Modeling
Patrick Crist and J. Michael Scott ..................................................................................11Identifying the Gaps, Locating the Reserves: Some Thoughts onGetting Gap Analysis into Conservation Practice
Patrick Crist and J. Michael Scott ..................................................................................14Hawai‘i: A Tropical Insular Approach to Gap Analysis
Samuel M. Gon, III, Allen Allison, Ronald J. Cannarella, James D. Jacobi,Michael H. Kido, Stephen E. Miller, and Daniel E. Orodenker ....................................16
LAND COVERPredictive Modeling of Rare Plant Species
Walter Fertig ...................................................................................................................18Comparison of Satellite Imagery Interpretation Using KnownAssociation/Alliance-Level Data
Vickie J. Smith, Chad J. Kopplin, Jonathan A. Jenks, Bruce K. Wylie,James E. Vogelmann, and Robert W. Klaver ..................................................................20
Estimating and Mapping the Thematic Accuracy of GAP Land Cover MapsRoland L. Redmond .........................................................................................................24
ANIMAL MODELINGOn Vertebrate Generations and Plant Succession: IncorporatingVegetation Structural Attributes into Vertebrate Modeling
Francisco J. Vilella and Richard B. Minnis ....................................................................25EMAP Hexagon Coverage Included in South Dakota’s Sportsman’s Atlas
Vickie J. Smith, Chad J. Kopplin, and Jonathan A. Jenks ..............................................29
STEWARDSHIP AND ANALYSISKansas GAP: Preparing the Stewardship Layer
Holly Barcus, Jennifer Radcliff, and Rajesh Poudyal ....................................................30

GAPA N A L Y S I S
GAP Analysis Program Bulletin No. 8, December 1999
TABLE OF CONTENTS CONTINUED
AQUATIC GAPStatus Report: The Missouri Aquatic GAP Pilot Project
Scott P. Sowa ...................................................................................................................32Landscape-Level Mapping of Fish for Pennsylvania Gap Analysis
Wayne Myers, David Argent, Joseph Bishop, Jay Stauffer, Jr.,and Robert Carline .........................................................................................................34
Applying Gap Analysis Towards the Protection of an EndangeredSpecies of Minnow (Notropis topeka) in South Dakota
Steven S. Wall, Carmen M. Blausey, Jonathan A. Jenks,and Charles R. Berry, Jr. ................................................................................................ 35
Update on New York Aquatic GAP Pilot ProjectMarcia S. Meixler and Mark B. Bain .............................................................................39
APPLICATIONSAssessing Data Quality and Information Distribution Prospects for County ConservationPlanning Using New Mexico Gap Analysis Data
Robert A. Deitner, Bruce C. Thompson, and Julie S. Prior-Magee ..............................40Incorporating Protection of Biodiversity into County Land Use Planning:A Gap Analysis – Pilot Project in Pierce County, Washington
Christian Grue, Doug Pflugh, Wood Turner, Pat Iolavera,and Frank Westerlund .....................................................................................................43
Designing Regional Conservation Portfolios: Filling the GapsDavid M. Stoms, Frank Davis, and Sandy Andelman ....................................................48
Landscape Diversity as the Basis for a Reserve Design Initiative in VermontDavid E. Capen, Charles E. Ferree, and Ernest W. Buford ...........................................51
Digital Atlas of Idaho: A GIS Approach to Teaching Natural HistoryStephen Burton and Charles R. Peterson .......................................................................53
A Gap Analysis of the Lewis & Clark Trail: Fort Peck Dam to Great Falls, MontanaPatrick Crist and Michael Jennings ...............................................................................55
Biodiversity Impacts from Urban GrowthChristopher Cogan ..........................................................................................................57
Applications of New York GAP DataCharles R. Smith .............................................................................................................57
STATE PROJECT REPORTS ........................................................................................ 58
NOTES AND ANNOUNCEMENTSGAP Named Winner of Major National Award..............................................................80New Staff at National GAP Office..................................................................................80GIS Data Delivery...........................................................................................................80Announcing National GAP Annual Meeting in Texas....................................................81Recent Publications by GAP Researchers......................................................................81Recent Publications Mentioning GAP............................................................................82
GAPA N A L Y S I S
2 GAP Analysis Program Bulletin No. 8, December 1999
DIRECTOR’S CORNER
their long-term viability. This has allowed us, as scientific profes-sionals, to channel our energy into a process of classifying our naturalresources and then checking at various scales how well they arerepresented in some form of protected status.
In the first 10 years of the Gap Analysis Program, we have takenthis idea from concept initiation through multiple series of refine-ments. While we are still learning from the process, we are withinjust a few years of having a national database of land cover, verte-brate species distributions, and stewardship classifications that willallow for a level of strategic questioning about the management ofbiodiversity in this country that was simply not thought of before.
While we seek more scientific integrity in the reserve identificationprocess, it may be that our common-sense approach will be ourgreatest asset in the next 10 years. The GAP business model (asdiscussed in the article by Brackney and Crist in this issue), whichinvolves developing partnerships with academia, research organi-zations, public land management agencies, and interest groups, hasworked exceedingly well. In some cases, other federal agencieshave struggled to define an administrative model that will movetheir agency towards “an ecosystem approach.” The GAP program,by its nature, has focused on ecosystems, and the administrativeand organizational structure followed logically. It just seemed tomake sense.
This approach should be important in two ways. First, we hopeother federal agencies use and build upon our partnership model.We are seeing this in the Southwest regional GAP effort, in whichthe Bureau of Land Management and the Environmental ProtectionAgency hopefully will take large roles. Second, perhaps these teamswill be the focus for generating support for our program from ourWashington, DC, overseers and will be the hub of the network thatgets information out to those who use it. After all, it is really imple-mentation and use of GAP data that we are ultimately concernedabout.
Michael Jennings and others discuss where GAP should be goingin the next 10 years in their article “GAP: The Next Ten Years.”Improving our scientific and technical capabilities is a big part ofthat vision. They also mention that the vision for the future in-cludes “an aggressive suite of outreach and extension activities toensure that GAP cooperators and clients are able to make full useof the program’s products.” Much of the discussion today in theNational GAP program is about the best ways to do this. I hope ourproject partners will be our greatest asset in this endeavor, and thatthe next 10 years of GAP will be as new and as exciting as the last.With both science and common sense on our side, how can it notbe?
KEVIN GERGELY
National Gap Analysis Program, Moscow, Idaho
The first thing I would like to say is thanks to everyone who hasbeen so generous with their time and attention in my first few monthsof filling in as leader for the National Gap Analysis Program (GAP).I can’t say enough about the professionalism that I’ve experiencedas I’ve talked to people working on state projects, and I appreciatehow you’ve helped me get up to speed on the status of your work.Also, the National GAP staff in Moscow, Idaho, is simply tremen-dous, and they keep this program moving ahead.
While we are more than 10 years into the process of creating anational database of biodiversity, a lot of questions remain to beresolved about the short- and long-term priorities for action. Thereare several reasons. One, we have already begun the second gen-eration of GAP, taking a regional approach in the Southwest, whichbrings with it new challenges. Two, many of our partners are tak-ing a hard look at the GAP products we are developing. They likewhat they see but are asking for more—more definition and accu-racy in the data layers, more species included in the modeling, morearea covered in seamless data coverages. And last, supporters inWashington, DC, are looking for us to make a big splash, to showour data in use, in order to generate support to expand the programin various directions.
With all this going on in the background, it would be easy to getpulled in several directions. We are trying to take deliberate actionand are working on a five-year plan to make sure we stay on coursefor mapping the Lower 48 and find ways to move into the nextgeneration of GAP that has the additional components our support-ers and partners are looking for. It couldn’t be more appropriate atthis time to pause and think about where we’ve been with this pro-gram and where we should try to make it go.
In large part, the first 10 years of GAP were about integrating sci-ence into a common-sense practice of setting up nature reserves.The history of reserve identification and design has been widelydiscussed in the conservation literature. The basic approach reliedupon philosophical or spiritual ideas of what lands should be pro-tected. As a society, we value certain places either for their aes-thetic value or because of some greater, more reverent notion. Withthese ideas, we developed systems of parks, refuges, and publiclands that can be held up as a model for the rest of the world.
When you step back and think about it, you realize what a tremen-dous challenge it was for conservation-minded scientists to try toimprove upon this reserve system. Yet scientific scrutiny requiresus to look past our “common-sense” ideas, and to look for a scien-tifically credible approach to reserve identification, selection, anddesign. In building the GAP program, we have at the same timeadopted a working theory that some level of representation of allthe components of biodiversity in our reserve systems will foster

GAPA N A L Y S I S
GAP Analysis Program Bulletin No. 8, December 1999 3
Rising Projects, Falling BudgetsBudgets rose rapidly, nearly doubling every year from 1990-1995(Figure 1). In 1994, GAP underwent a formal peer review (Zube1994) and an independent review funded by the forest products in-dustry (Flather et al. 1994). Both of these critical reviews recog-nized GAP as a valuable tool but noted it was substantiallyunderfunded. Increasing with the budget was the number of stateprojects, from the Idaho pilot in 1990 to more than 40 in 1995. Theyear 1996, however, saw a decline and then flattening of the GAPbudget, presenting a major challenge to maintaining the multiyearprojects initiated during the previous years (Figure 1). Averagefunding per state was reduced along with budgets for research, ap-plications, and extension activities.
Figure 1. Number of GAP projects versus annual budget 1989-1999. Between1989 and 1995 GAP maintained the number of projects that could be fundedfor approximately $100,000 each. Project numbers increased at the expectedrate of budget increase, but in 1996 the budget dropped to approximately $3.4million and leveled out, requiring a reduction in the average amount availablefor ongoing projects.
GAP has maintained its dedication to the state projects and, withcompletion of the majority of projects during 2000, it looks for-ward to reinstating balanced funding for regionalization, analysis,reporting, research, and extension (Figure 2). See also the accom-panying article “GAP: The next ten years” on this topic.
Getting off the GroundThe term “gap analysis” was first used by Burley in 1988 and putinto practical application in Mike Scott’s now famous Hawaii projectthat identified the “gap” between bird distributions and conserva-tion areas. Species distribution maps and land stewardship mapswere originally produced as Mylar overlays from extensive fieldwork, and The Nature Conservancy used these maps to establishseveral preserves (Scott et al. 1987a). They were the basis for cre-ation of new National Wildlife Refuges in Hawaii. It was JackEstes, a geographer, who suggested a Geographic Information Sys-tem (GIS) approach to put the huge data set into a form that waseasily usable by managers.
When Mike Scott moved to California in 1986 to head up the Cali-fornia Condor recovery program, it became clear to him that toavoid such costly protective measures, species had to be protectedwhile they were still common. At a meeting in Denver, Scott dis-cussed these problems with Blair Csuti, then a regional zoologistwith the Natural Heritage Program. They drew up an outline forgap analysis, to be expanded into the seminal BioScience article(Scott et al. 1987b) that presented the concept of gap analysis.
Scott tried to sell the idea to Defenders of Wildlife and the Fish andWildlife Service. He was able to obtain $36,000 from Idaho Fishand Game and the National Fish and Wildlife Foundation to start agap analysis of Idaho. A breakthrough occurred when a presenta-tion to a Congressional Working Group sparked enough interest toput $300,000 as a line item in the budget of the Idaho CooperativeFish and Wildlife Research Unit to conduct GAP in Idaho underScott’s leadership. Csuti was hired to conduct a gap analysis inOregon. California was the next state to start a GAP project, led byFrank Davis. Davis spent a sabbatical at the Idaho Coop Unit in1992 and co-wrote a detailed description of the Gap Analysis Pro-gram (Scott et al. 1993). Ted LaRoe, then Chief of CooperativeResearch Units, worked tirelessly on behalf of GAP and helped tosubstantially increase funding.
Thus, a national program was born and grew, through the incre-mental grassroots effort of scientists who believed in a proactiveapproach to conserving biodiversity in the U.S.
As GAP developed beyond the prototype stage, its status as a basicresearch project changed, and information collection activities be-gan in more and more states. When the Department of the Interiorscience programs were consolidated into the newly establishedNational Biological Service (NBS) in November 1993, GAP wasplaced in the Division of Inventory and Monitoring. Ultimately,the GAP program, along with the rest of the NBS programs, settledin the U.S. Geological Survey in 1997.
GAP: The First Ten YearsELISABETH BRACKNEY AND PATRICK CRIST
National Gap Analysis Program, Moscow, Idaho

GAPA N A L Y S I S
4 GAP Analysis Program Bulletin No. 8, December 1999
Figure 2. Example budget allocation from 1998.
Partners Make it PossibleThe strong partner collaboration of GAP at the state project level iswell known and certainly has been crucial in many states in provid-ing contributions of funding and in-kind assistance. National part-ners have also played a critical role. Over the years, GAP has re-ceived funding from both the Department of Defense (DoD) andthe Environmental Protection Agency (EPA; Figure 3). These con-tributions not only helped launch many state projects and aquaticpilots, but also aided GAP in the development of the Multi-Resolu-tion Land Characteristics (MRLC) Consortium. The MRLC formedto make joint purchases of Landsat Thematic Mapper (TM) satel-lite imagery covering all of the conterminous 48 states. A jointpurchase in fiscal year (FY) 1994 saved the government millions ofdollars in direct costs as well as an estimated 30 million dollars incombined program costs (Jennings et al. 1995). The MRLC estab-lished a common set of digital land cover data across multiple lev-els of spatial and thematic resolution and developed a strategy forintegrating the land cover data from member programs into a singlenational land cover database. GAP also partnered with the FederalGeographic Data Committee’s (FGDC) Vegetation Subcommitteeto develop federal standards for natural land cover types and wasinstrumental in development of FGDC metadata guidelines.
Currently GAP is working to develop core partner funding for re-gional mapping updates such as Southwest Regional GAP (SW-ReGAP). For example, EPA staff will act as principal investigatoron the project and may contribute significantly to the total cost.
Figure 3. Funding for GAP projects received from EPA and DoDbetween 1994 and 1999.
Successful InnovationsOne goal of the state-based business model for GAP was to engagenumerous investigators at a variety of institutions to create noveldata sets on a scale never before attempted. To a large degree, thishas succeeded. GAP investigators pioneered the development ofairborne video for land cover mapping and accuracy assessment.The application of airborne video for GAP land cover mapping wasbegun by Graham (1993). Since then, Slaymaker (1996) has fur-ther improved the application of airborne video to object interpre-tation. A review of GAP land cover mapping protocols (Eve et al.1998) found that the mapping effort has resulted in several positivedevelopments, such as laying the groundwork for further advancesin land cover mapping, stimulating cooperation and collaborationin mapping, increasing the acceptance and adoption of remote sens-ing and GIS as mapping tools, and assisting in the development ofnumerous new techniques for land cover mapping. In this bulletin,Homer and Crist trace the developments in land cover mappingover the past 10 years in more detail.
Sound methods were also developed for modeling predicted ani-mal distributions, and further work by Haithcoat (Drobney et al.1999) and Edwards (1996) continues to push such modeling to-ward greater thematic detail and precision. (See “Experience andTrends in Animal Distribution Modeling in the Gap Analysis Pro-gram” below). Stewardship mapping and gap analysis methodswere standardized and refined but to date have seen less researchand development, as discussed in the article “Identifying the Gaps,Locating the Reserves: Some Thoughts on Getting Gap Analysisinto Conservation Practice” below. More recently, however, GAPproject leaders and their cooperators have increased their interest

GAPA N A L Y S I S
GAP Analysis Program Bulletin No. 8, December 1999 5
and work in analyses and application to conservation (see Capenand Stoms et al. below).
Guidelines for conducting aquatic Gap Analysis projects were de-veloped by pilot projects in New York (Meixler and Bain 1998) andMissouri (Sowa 1998). Though GAP has not yet been able to gar-ner core funding for the aquatic component, it continues to developmethods that will lead to national standards and protocols when anational strategy emerges.
Putting GAP to UseDespite the fact that GAP is only this year publishing the bulk of itsdata, participants, cooperators, and others representing a wide spec-trum of interests have made significant use of the information inhundreds of applications at a variety of scales. These uses includewildlife management, ecosystem restoration, county planning, landuse planning by private corporations, basic research, generation ofoptions for large-area designations, and environmental assessments.A typical application of GAP data is developing a prototype con-servation planning process for the Columbia Plateau ecoregion. Thegoal of this effort is to find the most efficient method for designingand assembling a portfolio of sites to maintain all viable native spe-cies and community types within the target ecoregion. Such amethod would maximize the biodiversity protected relative to thenumber of conservation sites or extent of land area. GAP data havealso been used for more unusual applications, such as developingnatural systems agricultural practices that provide habitat for birdsthat prey on insect pests and integrating the needs of these birdspecies with those of agricultural production. Another example ofan ancillary application is assessing possible methods to reduce deer/vehicle accidents on Iowa highways. By evaluating land cover ef-fects, areas that have a higher probability of deer/motorist encoun-ters can be identified. These examples and many other GAP appli-cations can be found on the GAP home page at http://www.gap.uidaho.edu/RA.
Where Are We Now?GAP is now active or completed in all 48 conterminous states andHawaii, and interest is high to initiate Alaska and several U.S. terri-tories as funding becomes available. Updates have been conductedin Idaho and Oregon and initiated in five southwestern states. (Forcurrent status and anticipated completion dates of GAP projects inthe U.S. see the map on page 58). By the end of calendar year2000, it is anticipated that 35 states will have been completed andpublished on CD-ROM and the World Wide Web. These include:Arizona, Arkansas, California, Colorado, Connecticut, Delaware,Florida, Idaho, Indiana, Iowa, Louisiana, Maine, Maryland, Mas-sachusetts, Mississippi, Missouri, Montana, Nevada, New Hamp-shire, New Jersey, New Mexico, New York, North Carolina, Okla-homa, Oregon, Pennsylvania, Rhode Island, Tennessee, Texas, Utah,Vermont, Virginia, Washington, West Virginia, and Wyoming.
We can also view GAP progress outside the state context and in anational perspective. For example, 75% of land cover mapping ofthe conterminous 48 states is complete (Figure 4).
Figure 4. Current status of GAP land cover mapping across the U.S.
No one agency can claim to be GAP—it is truly collaboration on anational scale, its success the work of many. Individual GAP re-searchers can be proud of both their contributions to the nationaldatabase and their intellectual contributions that have paved a oncerocky road for current and future researchers. Still, this reflectionon GAP’s past ten years would be incomplete without anacknowledgement of the early leaders and researchers who made itpossible. Mike Scott, Blair Csuti, Frank Davis, and Jack Estes de-veloped the early concepts and founded the pilot projects; SteveCaicco, Tom Edwards, and Jimmy Kagan took on the daunting taskof mapping the first few states with no models to guide them; MikeJennings started and shepherded dozens of projects, guided the pro-gram through several administrative changes, and obtained the co-operation of the major national partners in the important MRLCand National Vegetation Classification initiatives. Credit is alsodeserved for the agency administrators, including Amos Eno, DoyleFrederick, Ted LaRoe, and John Mosesso, who worked within thebureaucracy to support GAP and keep it growing. Finally, we mustacknowledge some tireless friends who guided and lobbied for GAPthroughout the early years, including Sara Vickerman of Defendersof Wildlife and several folks from The Nature Conservancy includ-ing Denny Grossman, Craig Groves, Deborah Jensen, and LarryMaster. There are many other guiding lights, particularly at thestate level, that cannot all be listed here. However, recognition ofthe hundreds of dedicated graduate students is certainly well de-served.
Our discussion continues on the following pages with the thoughtsof Mike Jennings and others on “GAP: The next ten years” andgoes into more depth with articles on the history and future outlookfor land cover mapping, animal distribution modeling, and stew-ardship and analysis.
Literature CitedBurley, F.W. 1988. Monitoring biological diversity for setting
priorities in conservation. Pages 227-230 in E.O. Wilson, edi-tor. Biodiversity. National Academy Press, Washington, D.C.

GAPA N A L Y S I S
6 GAP Analysis Program Bulletin No. 8, December 1999
Drobney, R.D., T. Haithcoat, and D. Diamond. 1999. MissouriGap Analysis - Final Report. University of Missouri-Columbia.198 pp.
Edwards, T.C., Jr., E.T. Deshler, D. Foster, and G.G. Moisen. 1996.Adequacy of wildlife habitat relation models for estimating spa-tial distributions of terrestrial vertebrates. Conservation Biol-ogy 10:263-270.
Eve, M.D., J.A. Wolf, and J.W. Merchant. 1998. A national sur-vey of GAP land cover mapping protocols. Center for AdvancedLand Management Information Technologies, University ofNebraska-Lincoln. 4 pp.
Flather, C.H., K.R. Wilson, D.J. Dean, and W.C. McComb. 1994.The National Gap Analysis Program: A review and inspectionof ecological assumptions. A report to the National Council ofthe Paper Industry for Air and Stream Improvement, Inc. USDAForest Service, Rocky Mountain Forest and Range ExperimentStation, Fort Collins, Colorado. 51 pp.
Graham, L.A. 1993. Airborne video for near-real-time vegetationmapping. Journal of Forestry 91(8):28-32.
Jennings, M.D., E. Brackney, P. Crist, and B. Sorbel. 1995. GapAnalysis Program status report: 1994 and 1995 fiscal years.National Gap Analysis Program, Moscow, Idaho. 158 pp.
Meixler, M.S., and M.B. Bain. 1998. Final report summary: NewYork Aquatic GAP pilot project. Gap Analysis Bulletin 7:21-22.
Scott, J.M., C.B. Kepler, P.A. Stine, and H. Little. 1987a. Protect-ing endangered forest birds in Hawaii: The development of aconservation strategy. Pages 348-363 in Transactions 52nd NorthAmerican Wildlife and Natural Resources Conference.
Scott, J.M., B. Csuti, J.D. Jacobi, and J.E. Estes. 1987b. Speciesrichness - A geographic approach to protecting future biologi-cal diversity. BioScience 37:782-788.
Scott, J.M., F. Davis, B. Csuti, R. Noss, B. Butterfield, C. Groves,H. Anderson, S. Caicco, F. D’Erchia, T.C. Edwards, Jr., J.Ulliman, and G. Wright. 1993. Gap analysis: A geographicapproach to protection of biological diversity. Wildlife Mono-graphs 123.
Slaymaker, D.M., K.M.L. Jones, C.R. Griffin, and J.T. Finn. 1996.Mapping deciduous forests in New England using aerialvideography and multi-temporal Landsat TM imagery. Pages87-101 in J.M. Scott, T.H. Tear, and F. Davis, editors. Gap Analy-sis: A landscape approach to biodiversity planning. AmericanSociety for Photogrammetry and Remote Sensing, Bethesda,Maryland.
Sowa, S.P. 1998. Gap Analysis in riverine environments. GapAnalysis Bulletin 7:18-20.
Zube, E.H., editor. 1994. Peer review panel report of the nationalGap Analysis Program for the National Biological Survey. NBS/Idaho Cooperative Fish and Wildlife Research Unit, Universityof Idaho, Moscow. 25 pp.
GAP: The Next Ten YearsMICHAEL JENNINGS1, JOHN MOSESSO2, AND J. MICHAEL SCOTT3
1USGS Gap Analysis Program, Moscow, Idaho2USGS Office of Biological Information and Outreach, Reston, Virginia3Idaho Cooperative Fish and Wildlife Research Unit, Moscow, Idaho
As human population continues to increase, and the current spe-cies extinction event involves more species and greater areas, bio-geographic information that is both spatially comprehensive and ofappropriate resolution is becoming more important for managingour biological resources effectively. General recognition of thistenet is recent, responding in part to conservation crises and theirrelated large costs, and in part to emerging ecological principlesand knowledge integrated across multiple levels of biotic organiza-tion. Conservation crises have become more frequent, and the costsassociated with them have continued to rise. For example, resolu-tion of the old-growth redwood forest issue in northern Californiahas taken years of litigation and physical confrontation. It cost theState of California and the federal government about $450 millionfor direct acquisition of 10,000 acres—the most expensive acquisi-tion of conservation lands in history—as well as millions in legal
and other expenses to all parties. The cost of dealing with endan-gered species by federal and state agencies was estimated at $314million in 1998 alone. Costs born by private, nonprofit and for-profit organizations are not known, but even if they are within anorder of magnitude of this amount they make up a significant single-year cost. One can expect these amounts to increase substantiallyover the next decade. For example, to reach a recovery rate of 50%for endangered or threatened species would require an additional$300 million per year (Scott and others, unpublished).
Without spatially explicit data, it is unlikely that the forces causinghabitat losses (e.g., invasive species, accelerating rates of resourceuses, infrastructure development, recreation, etc.) can be managedeffectively to reduce biodiversity loss, or that an adequate networkof conservation areas can be successfully designed. Thanks to thefirst decade of GAP, the capability exists today to produce spatiallyexplicit information on the distribution and status of each speciesand vegetation alliance, compiling and organizing the sum of knowl-edge we have about these elements at the same time. With thisinformation, decisions about the myriad of activities affecting the
GAPA N A L Y S I S
GAP Analysis Program Bulletin No. 8, December 1999 7
nation’s biological diversity can now benefit from a common, widelyavailable knowledge base. For example, the information has beenused at the national level for identifying and siting new NationalWildlife Refuges, at the regional level for prioritizing private ac-quisition of conservation lands, at the state level for mitigating newinfrastructure impacts and containing environmental costs, and atthe local level for county planning and land trust conservation ease-ment acquisitions. In sum, a significantly greater level of certaintyis being provided to resource users, managers, planners, and re-searchers.
Given a decade of experience, what should the GAP program achieveover the next ten years? The extent and complexity of our biologi-cal resources are so vast and the amount of our information stillrelatively small that without a cohesive approach to genetic, popu-lation, species, community, and landscape information, it seems un-likely that the Gap Analysis Program will reach its full potential.Without broad-based support for developing such information, theGAP goal of helping our clients understand a reasonable set of fu-ture scenarios affecting our biological resources would be in jeop-ardy.
The Gap Analysis Program is now past the proof-of-concept stage.The scientific basis, multi-organizational capability, and technicalmethodologies needed to fully realize the original vision have ma-tured and are well established. We need to continue working with aframework that can expand and change with improved knowledgeand information on an indefinite basis, as forcing variables such aseconomic trends, climate change, and population growth continueto shape the patterns of life on Earth. However, in order to continuemaking progress in solving the serious and complex problems ofbiodiversity loss, we must focus on key elements of the program,including:
• A long-term plan for updating, maintaining, archiving, and ex-tending GAP information in each state.
• Applying GAP to the 21 phyla other than chordates. Each ver-tebrate species other than fish has been covered by GAP; littlework has been done on species of other phyla.
• Applying the established methods for data development andanalyses in aquatic environments.
• Improving the land stewardship data layer by mapping land usesthat have effects on biodiversity; adopting or developing a finer-grained land stewardship and land use classification.
• Continued improvement of consistency in methods among stateprojects.
• Regionalizing state-level data to cover large multistate regionsand conducting analyses of those data sets.
• Synchronizing second-generation state projects to achieve re-gional consistencies in data and analyses.
• Using the results of GAP projects to test hypotheses. For ex-ample, the species distribution data sets can be applied to ex-plore basic issues in biogeography; important new methods forreserve identification, selection, and design can be tested. Re-
sults from such applications can then provide critical feedbackfor revising GAP techniques.
• An aggressive suite of outreach and extension activities to en-sure that GAP cooperators and clients are able to make full useof GAP products. For example, development of a same-look-and-feel interactive digital atlas usable by educators and thepublic for each state, linked to rangewide element distributionsfor context expression.
• An international component to meet the existing and unmet de-mand for transferring GAP science and technology to other na-tions.
• Continued research and development of promising new scienceand technologies. There are important opportunities for devel-oping more robust and accurate species distribution models; newconcepts are emerging for dealing with accuracy assessment bygraphically representing the uncertainty in the data using an in-tuitive display.
• Strengthening program efficacies within the U.S. GeologicalSurvey (USGS) by taking full advantage of capabilities in theWater Resources Division, National Mapping Division, andGeologic Division.
Of course, continuity of GAP’s successful partner-based organiza-tion, as well as its fundamental approach to mapping componentsof biodiversity, must remain central to the output of useful informa-tion. Assuring scientific credibility by using the peer-review pro-cess must continue as a critical part of how GAP does business.Over the past decade GAP has produced many hundreds of peer-reviewed articles giving the concept and the program legitimacyand recognition within the scientific community. We must con-tinue getting the results of state projects into peer-reviewed jour-nals and into the hands of users by recasting results in formats thatare more quickly absorbed by the public and nonspecialists. With-out these steps a project is not complete.
The extent to which each of these key elements is dealt with effec-tively will depend largely on the amount of funds provided, includ-ing the core USGS funding as well as cooperator funding and otherforms of support. Central to this are ongoing efforts by those imple-menting GAP at the state level to develop support. It is especiallyimportant that their cooperating institutions actively express thevalue of the program to their work and the need for new initiativesthat would strengthen basic and matched funding. The conceptual,science, technology, and cooperative basis to meet the need for ad-vanced biodiversity management are in place, and we believe “smartconservation” can be accomplished with relatively modest fund-ing. GAP has been a large and successful experiment so far. Thebest possible chance to avert the growing biodiversity crises is bybuilding on the initial success of GAP. As Wilson (2000) recentlystated: “Within the broader framework of ecosystem studies, com-munity ecology in particular is about to emerge as one of the mostsignificant intellectual frontiers of the twenty-first century. Althoughit still has only a mouse’s share of the science funding, it standsintellectually in the front ranks with astrophysics, genomics, and

GAPA N A L Y S I S
8 GAP Analysis Program Bulletin No. 8, December 1999
neuroscience. . . . To single-species searches and mapping can beadded the already well-developed technique of gap analysis . . .”
We invite the GAP community to provide us with their sugges-tions, comments, and insights on GAP for the next decade.
Literature CitedWilson, E.O. 2000. On the future of conservation biology. Con-
servation Biology 14(1):1-3.
Land Cover Characterization in Gap Analysis:Past, Present, and Future
COLLIN HOMER1 AND PATRICK CRIST2
1EROS Data Center, Sioux Falls, South Dakota2National GAP Office, Moscow, Idaho
IntroductionThe evolution of land cover characterization in GAP over the last13 years has been truly remarkable. Although relatively coarse bytoday’s standards, early GAP land cover mapping was innovativeand for its time represented the first detailed, statewide mappingeffort. It was driven by biologists’ requirements to map vegetationdiversity and animal habitat covering large areas and to use exist-ing or emerging technology to characterize the landscape. Thismind-set has evolved into an ongoing theme in GAP—a constantpush to characterize the landscape at improved spatial and thematicscales, resulting in rapid development of methodologies and proto-cols.
PastThe first land cover mapping effort conducted for GAP was a pilotproject in Idaho, which began in 1987. This effort created a synthe-sized vegetation map based on information from existing local, re-gional, and state vegetation maps. The map was compared to andrefined based on Landsat Multispectral Scanner (MSS) satelliteimage prints (Scott et al. 1993, Scott and Jennings 1997). In 1989,mapping for the Oregon GAP project utilized visual photo-inter-pretation of satellite image prints to locate boundaries of vegeta-tion classes (Scott et al. 1993). Subsequent third-generation projectssuch as California, Nevada, and Utah mapped vegetation using somecombination of digital image classification, photo-interpretation ofsatellite imagery, and reference to existing maps and ancillary data(Davis et al. 1995, Homer et al. 1997, Scott and Jennings 1997).By this time GAP was on its way to becoming a national program,and the state-based business model was instituted for political andpractical reasons. Consciously, however, it was believed that em-ploying the best people in each state to develop this large-area map-ping process would result in significant innovation and achieve-ment. This indeed has appeared to be the case (Eve and Merchant1998).
Regional and national products were always envisioned and, in 1997,the 11 western states’ land cover products were joined (Wright et
al., in preparation). The effort was limited to cross-walking theclassification schemes and joining the maps into a common datastructure and projection. Despite the high variability in mappingmethods and spatial and thematic detail (Eve and Merchant 1998),there were few serious boundary problems between the states. Stillthe variation, particularly in thematic level of detail, required muchaggregation of types across the region and suggested the need forimproved methods and regional cooperative approaches in futuremapping.
PresentContinuing evolution of technique and technology has led to cur-rent GAP land cover characterization efforts, which are: digitallybased on multi-date Landsat TM 30 m data, involve image stratifi-cation, special clustering, some form of pre- or post-classificationmodeling, and accuracy assessment. Each project still retains aunique mix of technical expertise, capabilities, cooperators, landcover, and goals (Eve and Merchant 1998).
Current tool and data set availability reflect a rapid evolution. Earlyprojects constantly suffered hardware and software limitations. Forexample, the first digital mosaic of Utah had to be created, stored,and classified in pieces because of inadequate disk storage spaceand software. Agreements such as the Multi-Resolution Land Char-acteristics Consortium (MRLC) have helped greatly in developingbase TM imagery and ancillary data sets outside of the project. Pre-MRLC projects had to spend large portions of their budgets andtime in acquiring and rectifying their own imagery and buildingancillary data layers from scratch before mapping could even com-mence.
Most importantly, expertise in land characterization, remote sens-ing (RS), and GIS through GAP has developed into a remarkabletalent pool. GAP land cover mapping efforts have created an im-pressive training ground for hundreds of people (Eve and Merchant1998). The program has served as the catalyst to introduce a widevariety of private and government collaborators to RS/GIS tech-niques, data sets, and capabilities. This legacy of GAP will con-tinue to have profound positive effects in pushing the science ofland cover characterization forward. Not all innovations have beenin remote sensing, however. For some time, GAP researchers have

GAPA N A L Y S I S
GAP Analysis Program Bulletin No. 8, December 1999 9
recognized the difficulty in translating between ecologically-basedclassification systems like UNESCO, followed by the National Veg-etation Classification System (NVCS) (FGDC 1997), and the reali-ties of remote-sensing limitations. Partnerships between GAP andThe Nature Conservancy plant ecologists are increasingly address-ing this issue through the addition of new map objects that are eco-logically consistent with the NVCS, such as Ecological Complexesand Compositional Groups (Pearlstine et al. 1998).
The newest innovation in GAP addresses consistency by conduct-ing mapping updates by multistate regions. The first such projectis Southwest Regional GAP (SW-ReGAP) that includes Arizona,Colorado, Nevada, New Mexico, and Utah and covers an area 93%of the size of Alaska. This project will take advantage of methodsdeveloped by other projects such as the use of multi-date TM imag-ery that helps distinguish similar vegetation by phenological differ-ences. It may also explore the use of airborne imagery such asvideography, digital imaging, and low-elevation, multispectral cam-eras. The most dramatic change, however, is that mapping will bea coordinated effort where preprocessing and clustering of imageryis done regionally by EROS Data Center and Utah State University.Then state labs will label and model the land cover types based on“mapping zones” defined primarily by Bailey’s section-levelecoregions rather than state boundaries (Figure 1; Figure 2 - seeWeb version of Bulletin at http://www.gap.uidaho.edu/Bulletins/8). The objective is a seamless, thematically consistent land covermap of the entire region.
Figure 1. A diagram illustrating the land cover mapping process forthe Southwest Regional Gap Analysis Project. An R following a taskindicates Regional Lab (RS/GIS or EROS) responsibility. An Sindicates State Lab responsibility.
FutureThe increasing momentum of new data sources, refined tools andprocesses, and developing expertise should converge for a brightfuture in land cover characterization. Future efforts will be drivenby improvements in several key areas:
Data - It is an exciting time as we watch the continued expansionof air- and space-borne remote sensing platforms. Several success-ful recent satellite launches (e.g., Landsat 7, Terra, Ikonos) willgreatly expand remote sensing data availability. They provide ad-ditional spectral and spatial information at lower cost, creating newpossibilities in cover-type characterization. More importantly, thisincrease in data will improve the ability to choose both the timingand type of data acquisition, thus enabling a deeper understandingof climate patterns, vegetation seasonality, and closer real-time com-parison of imagery and field data.
However, spectral and spatial improvements will not automaticallycreate more meaningful cover-type classes. There will always re-main ambiguities between spectrally meaningful categories andhuman-defined meaningful categories. This means that ancillarydata will continue to play a large role in successful characteriza-tion. The increasing availability of nationwide, regionally consis-tent information on wetlands, topography, soils, cultural features,and other data will still prove critical to successful efforts in model-ing vegetation community distributions and their attributes.
Tools - The continued rapid development of software and hardwaretools will allow expanded capabilities hardly imagined now. Soft-ware developments will increase functionality in visualization andmanipulation of data sets, automated interpretation processes, dataintegration, standardized file formats, and real-time application.Hardware developments will allow increasing miniaturization, port-ability, capability, and affordability. Future development of othertools in spatial navigation, digital imaging, and data capture prom-ise to revolutionize ground data analysis with remote sensing.
Process - Bringing data and tools together to create more mean-ingful information is probably the most critical future challenge.GAP land cover efforts, to date, have had only the resources to mapsimple, discrete categories of land cover. These serve as only coarsesurrogates for representing wildlife habitat and vegetative diver-sity. Mapping efforts typically only focus on creation of the finallabeled land cover layer, with intermediate, ancillary image andclustered data layers often viewed as “throw-away” steps. A keyshift of the future will bring more focus on building a “data sand-wich” with layers of information seen as components of a databaserather than simple intermediate steps (Estes et al. 1999). Thesecomponents will be applied in different combinations to supply theneeded land cover derivatives of the flexible database. Derivativescan be discrete (a labeled land cover category) or continuous (abiophysical measurement). Combinations of data set derivativescould ultimately be tailored to represent each animal and plant spe-cies’ unique habitat needs. For example, a generalist mammal spe-cies (i.e., coyote) might be adequately represented with broad, dis-crete cover-type categories, while a neotropical bird (i.e., Kirtland’s

GAPA N A L Y S I S
10 GAP Analysis Program Bulletin No. 8, December 1999
warbler) with specialized seasonal requirements might need high-resolution habitat definitions, based on habitat structure and com-position continuums. Likewise, individual plant species distribu-tions and status may be modeled (see Fertig et al. 1998) based onNVC community distribution combined with other ancillary dataof land characteristics. The component-built flexible database willoffer greater utility, expanded flexibility, ease of update (replacethe component, not the entire set), data layer independence (com-ponents stand alone), and manageability.
Regionalization of completed, state-based land cover maps willcontinue, and updates in regionally coordinated projects will be-come the norm. Mapping zones may become institutionalized, andupdates for them may become distinct from state or multistate GAPprojects. Partnerships will also increase. SW-ReGAP is alreadyplanned to have an equal or greater share of the cost paid by otherpartners. Future mapping efforts will be planned as highly robustprojects incorporating a wider variety of data sets, tools, and objec-tives that will involve multiple partners.
ConclusionThe convergence of better data, tools, and processes will result incapabilities that will continue to spur innovation in GAP land covercharacterization. This ability to increasingly combine the tools anddata in processes that characterize the landscape in more diverseand meaningful ways will provide further insight into the interplayof biodiversity and landscape ecology. Future characterization ef-forts will focus more on creation of a database “sandwich” capableof flexible derivatives to meet the wide array of wildlife habitatcharacterization needs. Components in this database can poten-tially be assembled and used independently. More and more of thetime-consuming components of current types of GAP land charac-terization can be “out-sourced,” leaving GAP investigators moretime and resources to focus on biology-related issues and research.Because general land characterizations will be more commonlyavailable, the real challenge of the future will not be the limitationsof the tools but development of science and methods to more accu-rately characterize the distribution and condition of those featuresthat represent biodiversity on the ground.
Literature CitedDavis, F.W., P.A Stine, D.M. Stoms, M.I. Borchert, and A.D. Hol-
lander. 1995. Gap analysis of the actual vegetation of Califor-nia 1. The southwestern region. Madroño 42:40-78.
Estes, J.E., A.S. Belward, J.O. Justice, T.R. Loveland, J. Scepan, J.Townshend, and A. Strahler. 1999. The way forward. Photo-grammetric Engineering and Remote Sensing 65:10891093.
Eve, M.D., and J.W. Merchant. 1998. A national survey of landcover mapping protocols used in the Gap Analysis Program.Published on the Center for Advanced Land Management In-formation Technologies (CALMIT) Internet page at http://www.calmit.unl.edu/gapmap.
Fertig, W., W.A. Reiners, and R.L. Hartman. 1998. Gap analysisfor plant species. Gap Analysis Bulletin 7:24-25.
FGDC. 1997. National Vegetation Classification Standard. Fed-eral Geographic Data Committee, Vegetation Subcommittee,U.S. Geological Survey, Reston, Virginia.
Homer, C.G., R.D. Ramsey, T.C. Edwards, Jr., and A. Falconer,1997. Landscape cover-type modeling using a multi-scene The-matic Mapper mosaic. Photogrammetric Engineering and Re-mote Sensing 63:59-67.
Pearlstine, L., A. McKerrow, M. Pyne, S. Williams, and S. McNulty.1998. Compositional groups and ecological complexes: Amethod for alliance-based vegetation mapping. Gap AnalysisBulletin 7:16-17.
Scott, J.M., F. Davis, B. Csuti, R. Noss, B. Butterfield, C. Groves,H. Anderson, S. Caicco, F. D’Erchia, T. Edwards, J. Ulliman,and G. Wright. 1993. Gap Analysis: A geographic approach toprotection of biological diversity. Journal of Wildlife Manage-ment 57(1) supplement, Wildlife Monographs No. 123.
Scott, J.M., and M.D. Jennings. 1997. A description of the Na-tional Gap Analysis Program. Published on the National GapAnalysis Program Internet home page at http://www.gap.uidaho.edu/About/Overview/GapDescription. Bio-logical Resources Division, U.S. Geological Survey, March1997.
Wright, G., J.M. Scott, S. Mann, and M. Murray. In preparation.Identifying unprotected and at-risk plant communities in theWest. To be submitted to Biological Conservation.

GAPA N A L Y S I S
GAP Analysis Program Bulletin No. 8, December 1999 11
PATRICK CRIST1 AND J. MICHAEL SCOTT2
1National Gap Analysis Program, Moscow, Idaho2Idaho Cooperative Fish and Wildlife Research Unit, Moscow, Idaho
IntroductionModeling the predicted distribution of thousands of animal speciesover large regions, but at detailed spatial resolution, represents assignificant a challenge as land cover mapping, if not more so. Irecall during my first few months with New Mexico GAP, that anacademic scientist challenged our ability to accomplish such a task.His argument was that “you’d never be able to get the GIS data [ofland characteristics] needed for the habitat associations.” Our re-sponse was that we already had all the layers; what was lacking,and continues to be, is the information on species associations withthose land characteristics. As I will discuss, technological progresswill continue to greatly improve our ability to model animal pres-ence/absence and even allow us to begin dealing with concepts suchas abundance, viability, movement, and metapopulations. How-ever, technology is not a replacement for knowledge, and this re-mains the greatest challenge for all modelers.
PastAs described in the land cover article above, Idaho was the firstpilot project for animal distribution mapping in 1987. At that time,it was recognized that the two biggest challenges were gatheringinformation on each species’ habitat associations (Karl et al., inpress [a]) that were mappable, and testing the accuracy of the re-sulting distributions. A decision was made early in the program’shistory to begin mapping terrestrial vertebrates and possibly butter-flies (though little was done for the latter in most states). Therewere several reasons for this decision: they are the better studiedtaxa, making the modeling more tractable; they are popular targetsfor conservation action; and there was some suggestion that they, incombination with vegetation, would be a suitable surrogate forbiodiversity in general. The latter assumption is still a largely un-tested hypothesis. The early state projects tended to restrict model-ing to a species association with land cover, but by the early ’90sprojects were beginning to add other variables such as topography,hydrology, soils, climate, etc. (see, for example, Thompson et al.1996, Edwards et al. 1995). In 1996, I had the pleasure of workingwith one of GAP’s originators, Blair Csuti, to compile GAP’s knowl-edge and experience to date in the form of the GAP Handbook chap-ter on animal distribution modeling (Csuti and Crist 1996). Thequalitative process we presented is summed up by Figure 1.
Figure 1. The animal modeling process diagram from the GAPHandbook (Csuti and Crist 1996).
PresentAs evidenced from Figure 1, GAP has traditionally used a qualita-tive rather than quantitative process to model animal distributions.The fundamental difference between these approaches is that GAPuses known species habitat associations from the literature, exist-ing databases, and expert knowledge to place species where theconditions are mapped to exist, whereas the quantitative processuses mapped land characteristics at known occurrence points to placespecies wherever such conditions exist. GAP researchers have gen-erally believed that sampling for species occurrence has been bi-ased and grossly incomplete; therefore, the points used in the quan-titative approach may give incomplete or biased distributions. Somelimited study has suggested this to be true. For relatively rare spe-
Experience and Trends in AnimalDistribution Modeling

GAPA N A L Y S I S
12 GAP Analysis Program Bulletin No. 8, December 1999
cies with good sampling, the quantitative process provides a moreprecise result than the GAP process, but for more widely distrib-uted species (with which GAP is more concerned), the qualitativemethod provides a better model (K. Smith, pers. comm.). It is safeto say that tests of the various modeling methodologies are insuffi-cient to draw any operational rules, but it appears likely that em-ploying a suite of methods that can be tailored to each taxonomicgroup or guild will generate the most robust results.
The process described by Figure 1 has remained largely unchanged,which in some ways is disappointing. Virtually all completed as-sessments of GAP projects’ distributions show an 80% or betteraccuracy when compared to checklists for managed areas (Scott etal. 1993, Edwards et al. 1996); this may suggest the process is do-ing an acceptable job. Unfortunately, so few independent field-based data sets exist that assessments of accuracy at finer levels ofspatial resolution have been difficult; however, see Thompson et al.(1996), Llewellyn and Peterson (in preparation), and Beard et al.(1999). Work done in Idaho used field observations at 1,628 sitestesting the independent influence of rarity on accuracy of modelpredictions. A second effort tested the change in model accuracywith increasing model complexity (Karl et al., in press [b]). Simi-lar work is being conducted by GAP researchers in Maine (Booneand Krohn 1999).
Anecdotal evidence suggests that GAP is indeed doing well in thisrevolutionary first effort to map so many species over vast areasand at a cost of $100-200/species/state. Those using the traditionalGAP qualitative approach are probably doing as well as quantita-tive modelers with species associated with well-defined environ-mental constraints such as minimum or maximum elevation. Allmodelers have problems finding realistic limits of distributions forgeneralists and usually do poorly with species associated with mi-crohabitat features we cannot map, such as rock outcrops or forestsnags. Species with particular movement and patch-size require-ments or high sensitivity to habitat quality are also increasing ourerrors of commission; however, GAP has a conscious desire to erron the side of commission rather than omission.
Some GAP researchers are beginning to tackle these problems withnew quantitative methods and data sets (Edwards et al. 1996) orwith the use of landscape ecological principles as part of the model(Drobney 1999). It is also important to address the diversity of thetaxa presently being mapped by GAP. The original decision to limittaxa to terrestrial vertebrates has generally been continued by thestates, but only because of financial limitations and not lack of in-terest. GAP intends to be a complete biodiversity program andultimately include all taxa. The inclusion of aquatic taxa has beena long-standing dream with some false starts and, to date, an inabil-ity to garner base funding. We have gradually been overcomingthis, first through the New York watershed pilot project (Bain andMeixler 1998, Meixler and Bain 1999) followed by the Missouristatewide aquatic program (Sowa 1998, 1999). (Also see updateson these projects in this issue.) These projects have been buildingthe methods and protocols to guide future efforts, and many GAP
projects are currently including some limited aquatic aspect andgarnering partner funding to do so. This bodes well for the pro-gram, but only if base funding can be provided to ensure nationalconsistency in the methods, systems, and products.
Some GAP projects have begun incorporating other terrestrial taxasuch as ants. In Florida, Craig Allen has mapped geographic distri-bution of ant species at the county level as determined primarilyfrom published sources (Allen et al. 1998). In South Carolina, asample-based approach to mapping ant diversity was taken. Fromthe results of these sampling efforts both the county-level distribu-tion and habitat affinity of each ant species will be determined (Allenet al. 1998).
Many of these issues were addressed at a recent symposium in Snow-bird, Utah, sponsored by the USGS Idaho Cooperative Fish andWildlife Research Unit in partnership with the U.S. Forest Service,Bureau of Land Management, U.S. Fish and Wildlife Service, andBoise Cascade and Potlatch corporations. The symposium, titled“Predicting Species Occurrence: Issues of Accuracy and Scale” at-tracted 325 participants from 14 countries. While most papers fo-cused on vertebrates, other taxa such as plants, fungi, and inverte-brates were well represented. Areas identified as needing morework were predicting abundance and viability. The majority of thepresentations dealt with species presence/absence despite aggres-sive solicitation of papers on predicting abundance and viability.Tests of accuracy of model predictions using independent field datawere uncommon. Finally, there is a bias worldwide towards pre-dicting bird and large mammal occurrences. However, there is somepioneering work on predicting occurrences of plants going on inAustralia. Papers from this symposium will be published by IslandPress in the spring of 2001 (J.M. Scott and P.J. Heglund, eds.).
FutureI’ll now use the experience from the past and present to organizesome thoughts on where GAP is, or should be, heading in the nextten years to develop better distributions for more taxa.
Taxa: Clearly, an effective biodiversity program must address abroader representation of taxa (Ricketts et al. 1999) including habi-tat representation (aquatic) and size/life history representation (in-vertebrates). The research of Ricketts et al. (1999) suggests, how-ever, that the mix of taxa used by GAP may likely be a suitablesurrogate of species richness for a much broader group.
The modeling work to date has set the stage for new techniques andenergized both our researchers and data users to desire such im-provements. Funding is the greatest constraint, and while currentinterest is high for increasing GAP’s budget, any foreseeable in-creases will still fall far short of including the breadth of taxa thatshould be addressed. This suggests that GAP must become evenmore aggressive in partnering and leveraging funds to achieve greaterrepresentation of taxa in our assessments. Alternatively, at the 1999national GAP meeting, Malcolm Hunter noted that many countriesare choosing to rely on the nonbiotic surrogate of “enduring fea-tures,” believing that mapping individual taxa is impractical, too

GAPA N A L Y S I S
GAP Analysis Program Bulletin No. 8, December 1999 13
slow, and/or a waste of resources (Hunter 1999). When asked howone determines what size or configuration to make a reserve basedon these surrogates, he responded, “for that you need the animals.”While it may be important for gap analysis to include enduringfeatures, we need to expand our biotic surrogates and continue ad-dressing the needs of individual biotic elements to ensure their sur-vival and thus save their ecosystems.
Methods: Above I introduced the qualitative versus quantitative di-chotomy, but it is certainly a false one. GAP has never had a re-quired method for animal distribution modeling; rather we stronglyadvocate the use of the best available methods for producing usableproducts, and we certainly encourage a research dimension in ev-ery project. In the near future we will fund comparative studies,hopefully engaging other researchers and our critics to identifywhich models work, for which taxa, and under what conditions.We also need to pursue more robust models to incorporate viability,abundance, and metapopulation dynamics (see Vilella and Minnis,this issue). In this we will again find ourselves limited by the lackof actual knowledge of species’ life histories, but just as we oncebelieved GIS data was our limiting factor, it is important to havethe tools ready when the information becomes available.
Biotic knowledge: Despite inroads in quantitative methods, quali-tative information on species’ life histories is critical to effectivemodeling, and we may find this even more so when we learn moreabout incorporating concepts like viability and metapopulation dy-namics. GAP projects consistently find a dearth of published knowl-edge on species’ basic habitat associations, let alone life historiesrequired for more robust modeling. Work in Idaho indicated thatthe habitat association information in the literature is biased to-wards large vertebrate species, especially game species (Karl et al.1999). Some projects have begun to do basic field study to estab-lish range extents within their states (see Wall et al., this issue), butthe U.S. desperately needs a systematic program for not only cap-turing information from ongoing field studies but new programs tostudy species in their habitats, particularly the poorly studied taxa.GAP is already playing an important role by compiling nearly thesum of knowledge of many species into modeling databases andthe maps themselves.
ConclusionGAP researchers and cooperators have much to be proud of. Wehave undertaken the largest, broadest effort in U.S. history to com-pile our sum knowledge of thousands of species and convert thisknowledge into spatial renditions of their distributions. Assess-ments, though limited, are demonstrating a consistently high levelof confidence for most species. In this respect the initial GAP ob-jectives are being fulfilled, and we have the enviable position offocusing now on expanding the breadth and depth of our endeavor.Substantial success will not come as easily, however. Significantfunding and partnership increases are required as well as a whole-sale rethinking of the way data are collected, archived, and distrib-uted by the entities charged with doing so. Any GAP researchercan recount visiting agency offices in search of data and being
pointed in the direction of banks of filing cabinets. This must change.
Literature CitedAllen, C.R., L. Pearlstine, and D.P. Wojcik. 1998. Gap analysis
for ant species. Gap Analysis Bulletin 7:10-14.
Bain, M.B., and M.S. Meixler. 1998. Making Gap Analysis workfor New York waters: A state perspective on aquatic GAP. GapAnalysis Bulletin 7:22-23.
Beard, K.H., N. Hengartner, and D.K. Skelly. 1999. Effectivenessof predicting breeding bird distributions using probabilistic mod-els. Conservation Biology 13:1108-1116.
Boone, R.B., and W.B. Krohn. 1999. Modeling the occurrence ofbird species: Are the errors predictable? Ecological Applica-tions 9:835-848.
Csuti, B., and P.J. Crist. 1996. Methods for developing terrestrialvertebrate distribution maps for Gap Analysis. A handbook forconducting Gap Analysis. USGS Gap Analysis Program, Mos-cow, Idaho. http://www.gap.uidaho.edu/handbook/VertebrateDistributionModeling. Version 2, March 12, 1998.
Drobney, R.D., T. Haithcoat, and D. Diamond. 1999. MissouriGap Analysis - Final Report. University of Missouri-Colum-bia. 198 pp.
Edwards, T.C., Jr., C.H. Homer, S.D. Bassett, A. Falconer, R.D.Ramsey, and D.W. Wight. 1995. Utah Gap Analysis: An envi-ronmental information system. Final Project Report 95-1, UtahCooperative Fish and Wildlife Research Unit, Utah State Uni-versity, Logan, Utah.
Edwards, T.C., Jr., E.T. Deshler, D. Foster, and G.G. Moisen. 1996.Adequacy of wildlife habitat relation models for estimating spa-tial distributions of terrestrial vertebrates. Conservation Biol-ogy 10:263-270.
Hunter, M.L. 1999. Banquet presentation at the 9th Annual Na-tional Gap Analysis Program Meeting. August 3, 1999. Duluth,Minnesota.
Karl, J.W., N.M. Wright, P.J. Heglund, and J.M. Scott. 1999.Obtaining environmental measures to facilitate vertebrate habi-tat modeling. Wildlife Society Bulletin 27:357-365.
Karl, J.W., L.K. Bomar, P.J. Heglund, and J.M. Scott. In press (a).Species commonness and the accuracy of habitat relationshipmodels. In J.M. Scott, P.J. Heglund, M. Morrison et al. Pre-dicting species occurrences: Issues of accuracy and scale. Is-land Press, Washington, D.C.
Karl, J.W., P.J. Heglund, E.O. Garton, J.M. Scott, N.M. Wright,and R.L. Hutto. In press (b). Sensitivity of species habitat rela-tionship model performance to model complexity, data resolu-tion, and scales of application. Ecological Applications.
Llewellyn, R.L., and C.R. Peterson. In preparation. Testing gapanalysis models at multiple spatial scales: The distribution ofamphibians and reptiles on Craig Mountain, Idaho.

GAPA N A L Y S I S
14 GAP Analysis Program Bulletin No. 8, December 1999
Meixler, M.S., and M.B. Bain. 1999. Application of Gap Analy-sis to New York State waters. Final project report by the NewYork Cooperative Fish and Wildlife Research Unit, CornellUniversity, Ithaca, New York, to the U.S. Geological Survey,Gap Analysis Program.
Ricketts, T.H., E. Dinerstein, D.M. Olson, and C. Louks. 1999.Who’s where in North America. BioScience (49)5:369-381.
Scott, J.M., F. Davis, B. Csuti, R. Noss, B. Butterfield, C. Groves,H. Anderson, S. Caicco, F. D’Erchia, T.C. Edwards, Jr., J.Ulliman, and G. Wright. 1993. Gap analysis: A geographicapproach to protection of biological diversity. Wildlife Mono-graphs 123.
Sowa, S.P. 1998. Gap Analysis in riverine environments. GapAnalysis Bulletin 7:18-20.
Sowa, S.P. 1999. Implementing the aquatic component of GapAnalysis in riverine environments. Training workbook. Mis-souri Resource Assessment Partnership, Columbia, Missouri.
Thompson, B.C., P.J. Crist, J.S. Prior-Magee, R.A. Deitner, D.L.Garber, and M.A. Hughes. 1996. Gap analysis of biologicaldiversity conservation in New Mexico using geographic infor-mation systems. New Mexico Cooperative Fish and WildlifeResearch Unit, Las Cruces, New Mexico.
Identifying the Gaps, Locating the Reserves:Some Thoughts on Getting Gap Analysis into
Conservation PracticePATRICK CRIST1 AND J. MICHAEL SCOTT2
1National Gap Analysis Program, Moscow, Idaho2Idaho Cooperative Fish and Wildlife Research Unit, Moscow, Idaho
IntroductionGAP seeks two objectives in mapping and categorizing the stew-ardship of the U.S.: 1) to map the conservation network as we de-fine it, and 2) to report the representation of elements of biodiversity(species and plant communities) or lack thereof in the conservationnetwork. The purpose is to characterize who the conservation stew-ards are, where their lands are, and the character of those lands interms of size and intent to maintain biodiversity. The latter involvescategorizing tracts of land according to the well-known four cat-egories of biodiversity maintenance (Crist 2000) to assess the rela-tive protection of, or risk to, the biotic elements found in or pre-dicted to inhabit them. The result is a report, for each of the ele-ments mapped, on the amount and percentage of their distributionfound in each ownership type and protection category.
This information has proven very useful in assessing general pat-terns of protection afforded this country’s biodiversity. For example,when the occurrence of nature reserves is mapped against elevationand soil productivity, the underrepresentation of low elevations andproductive soils is very apparent (Scott et al. in press). Similarly,early results from GAP projects primarily in the West indicate that50-85% of the mapped land cover types have less than 10% of theirarea in nature reserves. While 10% is a widely accepted standardof representation, it is an arbitrary standard. Protection of the fullrange of biodiversity may require 50-75% of the land base to in-clude evolutionary potential of species at one end of the hierarchyto ecosystem processes at the other.
Without trivializing the monumental mapping and modeling effortto create the standard GAP information, when compared to GAP’smission, providing this information is only the initial phase of con-servation planning. In the pioneering GAP monograph (Scott et al.1993), 15 steps of the process were listed, including “13. Identifyminimum areas required for . . . species and vegetation types, 14.Identify landscape corridors connecting vegetation types and cen-ters of species richness,” and “15. Design [the] reserve network.”Clearly some of these tasks are now outside the responsibilities ofan information program, but the U.S. lacks a government programto undertake such tasks, and the land management agencies typi-cally do not feel mandated to do so. Thus it appears the need stillexists to identify the geography of conservation need, not just tabu-lar results (see, for example, Grue et al. and Stoms et al. below).From here I describe the context of GAP’s origins to understandhow we reached the current situation and where we may be or shouldbe headed.
PastGAP began in the U.S. Fish and Wildlife Service (FWS) to gener-ally serve its land management and planning information needs.Specifically GAP sought to help avoid endangered species crisesby aiding the FWS in the identification of elements requiring height-ened scrutiny and ultimately to identify potential reserve locationsfor underrepresented elements of biodiversity. Work in the earlyand mid ‘90s by a variety of researchers suggested that this goalwas no easy feat (for review see Csuti and Kiester 1996, Kiester etal. 1996, Merrill et al. 1995, Wright et al. 1994, also Stoms et al.below). GAP’s early recommendation for using species-richhotspots was found to be a limited surrogate for biodiversity in gen-

GAPA N A L Y S I S
GAP Analysis Program Bulletin No. 8, December 1999 15
eral, and the computational requirements for identifying represen-tative locations were enormous. Improvements in technology andtechnique combined with new concepts of “complementarity” forrepresenting all elements (biotic and nonbiotic) emerged as moresatisfying and robust answers (Pressey et al. 1997), but GAP hasyet to incorporate these concepts into its standard analyses. Thereasons for delay in pursuing more robust analyses range from theperennial lack of funding to support the work at either the state ornational program level to the lack of demand for such informationfrom management agencies that continue reactive managementunder legal duress (D. Osborne, pers. comm.).
PresentBy the end of 2000, GAP will have 37 completed state projectswith data sets describing and quantifying the predicted “gap” statusof nearly all terrestrial vertebrates and plant communities for a largeportion of the nation (74% of the area of the 48 conterminous states).This is a tremendous technical, logistical, and scientific accomplish-ment, but to assess our success in increasing conservation it is illus-trative to look at the FWS’s application of GAP. Despite legisla-tion in 1997 that charges the FWS with guiding the future of itsrefuges towards the “conservation of ecosystems” (U.S. 1997) theFWS, GAP’s original home and client, has not made full use of theGAP data. However, a few successful examples exist. The resultsfrom the early GAP effort in Hawaii (see Brackney and Crist, thisissue) were used to create two new national wildlife refuges, andIndiana-GAP used the data to help design the Grand KankakeeMarsh National Wildlife Refuge (NWR; Clark and Slusher 2000).GAP information could significantly aid the nationwide FWS pro-cesses for identifying potential acquisition projects or the processfor prioritizing them for funding. We also developed a pilot deci-sion support system for refuge planning, “Refuge-GAP”(Herdendorf and Crist 1998), that spurred interest but has been slowto receive any FWS support for further research and development.
Perhaps the most significant block to using the results of gap analy-ses is that few agencies feel compelled to react to “gaps” that arenot legally recognized by the Endangered Species Act (ESA) asthreatened or endangered. GAP’s analyses may be viewed withlimited interest because we do not currently incorporate perceivedshort-term “real” risk in the sense of reduced abundance and clearand imminent threats such as logging of Red-cockaded Woodpeckerhabitat (see Vilella and Minnis, this issue). All of this reflects thefact that GAP did not emerge from national legislation as, for ex-ample, the Superfund Project did to address a widely perceivednational crisis, but has instead been built from the bottom up toaddress the need as seen by biologists and researchers.
National GAP is rapidly developing GIS capability to both region-alize the state data sets and undertake basic gap analysis at the re-gional level and hopefully to engage other researchers in more ro-bust analyses. At present, though, we need to be cognizant of howwell data are being received and used by other agencies. Even so-phisticated GIS users have had substantial difficulty conceptualiz-ing how to integrate GAP’s novel data into decision-making pro-
cesses that have accrued over decades, using either very crude bio-logical information or none at all. Simply publishing the informa-tion has not demonstrated that it will be used, and certainly not forthe purposes for which it was created. In 1996 Crist began collabo-ration with the University of Wyoming GAP team on the develop-ment of decision support systems (DSS), including Refuge-GAPdescribed above. The intent of these systems is to provide integra-tion of GAP data in a format friendly to users’ decision-makingprocesses and not requiring either biological or GIS expertise. DSShas come of age, at least conceptually and in recognition of need,in the arena of natural resources technology but is not yet recog-nized as a normal funding item in most agencies.
FutureIn the immediate future, GAP intends to publish a great deal ofinformation and publicize it well. An important part of that processis publication of results by GAP researchers in the peer-reviewedliterature. These are only first steps of putting the information touse, but they are important to show progress for the investment made.The next practical step will be development of other data productssuch as regional and element rangewide analyses (for examples seeStoms et al. [1998] and current work in Idaho to analyze gaps in theland cover of the 11 western states). Later work will identifycomplementarity-based reserve areas as well as development of moresophisticated DSSs for more user groups.
All of these activities will simply attempt to put current informa-tion to better use. However, it is also time to “negotiate with” aswell as educate our partners. Educating them involves aiding theintegration of GAP results into decision making by explaining thecurrently little-recognized need to consider common species andrangewide gap status. Negotiation will recognize that political re-alities call for us to identify those more urgent conservation issuesthat will continue to take precedence. Clearly our “one-size-fits-all” gap analysis requires change. Our process assumes an equalreaction of all elements to a stewardship condition, while we arewell aware that some species thrive in agriculture and urbanization,and some species perish in anything less than total protection.Schemes for addressing individual element sensitivity have beensuggested (Crist et al. 2000; Redford and Richter 1999; see alsoGon et al., this issue) but such an approach may push the limits ofour knowledge of species requirements and would require an en-tirely new level of partnership with primary land stewards to popu-late the necessary databases. We do believe the process is tractable,however, and probably necessary to provide truly useful informa-tion for the continuing “crisis planning” conducted in the U.S.
ConclusionRecently GAP has funded socioeconomic seed grants to aid us in1) identifying types of products and analyses needed by society,and 2) incorporating socioeconomic factors in gap analyses to ad-dress the “short-term” risk issues. GAP information has alreadybeen used for innumerable applications across the nation, and thoseapplications will increase exponentially as we publish the gigabytes

GAPA N A L Y S I S
16 GAP Analysis Program Bulletin No. 8, December 1999
of information pouring into the national program. Of this we shouldall be proud but also contemplative about why our information hasyet to be used (much) for its primary purpose. Clearly institutionaland societal education and changes are required as they are for allaspects of biodiversity conservation, but the greater (and more man-ageable) burden lies with GAP to conduct the type of analyses andcreate the products and tools that will better serve societal needs.
Literature CitedClark, F.S., and R.B. Slusher. 2000. Using spatial analysis to
drive reserve design: A case study of a national wildlife refugein Indiana and Illinois (USA). Landscape Ecology 15:75-84.
Crist, P.J. 2000. Mapping and categorizing land stewardship. Ahandbook for conducting Gap Analysis. USGS Gap AnalysisProgram, Moscow, Idaho. http://www.gap.uidaho.edu/hand-book/Stewardship. Version 2.0.0. February 16, 2000.
Crist, P.J., T.W. Kohley, and J. Oakleaf. 2000. Assessing land useimpacts on biodiversity using an expert systems tool. Land-scape Ecology 15:47-62.
Csuti, B., and A.R. Kiester. 1996. Hierarchical Gap Analysis foridentifying priority areas for biodiversity. Pages 25-37 in J.M.Scott, T.H. Tear, and F. Davis, editors. Gap Analysis: A land-scape approach to biodiversity planning. American Society forPhotogrammetry and Remote Sensing, Bethesda, Maryland.
Herdendorf, M., and P. Crist. 1998. Refuge-GAP: A GAP deci-sion support system for refuge planning. Gap Analysis Bulletin7:9-10.
Kiester, A.R., J.M. Scott, B. Csuti, R.F. Noss, B. Butterfield, K.Sahr, and D. White. 1996. Conservation prioritization usingGAP data. Conservation Biology 10:1332-1342.
Merrill, T., R.G. Wright, and J.M. Scott. 1995. Ecological criteriato evaluate wilderness planning options in Idaho. Environmen-tal Management 19:815-825.
Pressey, R.L., H.P. Possingham, and J.R. Day. 1997. Effectivenessof alternative heuristic algorithms for identifying indicative mini-mum requirements for conservation reserves. Biological Con-servation 80:207-219.
Redford, K.H., and B.D. Richter. 1999. Conservation ofbiodiversity in a world of use. Conservation Biology 13:1246-1256.
Scott, J.M., F. Davis, B. Csuti, R. Noss, B. Butterfield, C. Groves,H. Anderson, S. Caicco, F. D’Erchia, T.C. Edwards, Jr., J.Ulliman, and R.G. Wright. 1993. Gap Analysis: A geographicapproach to protection of biological diversity. Wildlife Mono-graphs 123:1-41.
Scott, J.M., F.W. Davis, G. McGhie, R.G. Wright, C. Groves, andJ. Estes. In press. Nature reserves: Do they capture the fullrange of America’s biological diversity? Ecological Applica-tions.
Stoms, D.M., M.J. Bueno, F.W. Davis, K.M. Cassidy, K.L. Driese,and J.S. Kagan. 1998. Map-guided classification of regionalland cover with multi-temporal AVHRR data. Photogrammet-ric Engineering and Remote Sensing 64:831-838.
U.S. 1997. National Wildlife Improvement Act of 1997. PublicLaw No. 105-57, Statute 1254 (codified in 16 U.S.C., section688).
Wright, R.G., J.G. McCracken, and J. Hall. 1994. An ecologicalevaluation of proposed new conservation areas in Idaho: Evalu-ating proposed Idaho national parks. Conservation Biology8:207-216.
Hawai‘i: A Tropical Insular Approach toGap Analysis
SAMUEL M. GON, III 1, ALLEN ALLISON2, RONALD J.CANNARELLA 3, JAMES D. JACOBI4, MICHAEL H. KIDO5, STEPHEN
E. MILLER6, AND DANIEL E. ORODENKER7
1The Nature Conservancy of Hawai‘i2Bernice Pauahi Bishop Museum3Hawai‘i State Department of Land and Natural Resources4U.S. Geological Survey, Biological Resources Division5University of Hawai‘i at Manoa6U.S. Fish and Wildlife Service7Hawai‘i Natural Heritage Program
The Hawaiian archipelago is one of the most biologically uniqueplaces in the world. This biodiversity has been greatly diminishedby the impact of human activities. The loss of biodiversity is di-
rectly linked to habitat modification and loss, as well as the grow-ing number and widespread distribution of non-native injuriousspecies. The Hawaiian conservation community has jointly recog-nized the need for detailed land cover classification informationand for species distribution data for key species of concern. Tomeet this need, the Ecosystem Data Group was formed in 1997 tocoordinate information required for the conservation of Hawaiianbiodiversity. The group believes that the methodology of the Na-tional Gap Analysis Program (GAP) can help to meet the needs ofthe conservation community in Hawai‘i. By participating in GAP,Hawaii’s unique biodiversity will be recognized in any national-level conservation activity efforts that evolve from the National GAPeffort.

GAPA N A L Y S I S
GAP Analysis Program Bulletin No. 8, December 1999 17
Because of Hawaii’s unique geography as a tropical island archi-pelago, the national GAP methodology will be augmented in a fewkey areas. First, our analysis of biodiversity will expand the focusbeyond vertebrate indicators to include representative plant and in-vertebrate taxa. We recognize that the spatial resolution for landcover mapping in Hawai‘i will have to be at a higher resolutionthan on the mainland in order to capture significant areas ofbiodiversity, which on a per unit area basis is higher in Hawai‘ithan in any other place in the US. We will also expand the conceptof land stewardship to include protection from emerging threats,particularly the impact of invasive non-native species. Finally, wewill incorporate and integrate Aquatic GAP into our primary ef-forts.
Hawaiian Biodiversity and Its LossApproximately 90% of Hawaii’s 1,000 native species of floweringplants are found nowhere else on earth (Wagner et al. 1999). It isestimated that Hawai‘i has over 10,000 species of endemic insects(Eldredge and Miller 1995). All 80 species of land birds once foundin Hawai‘i are endemic to these islands (Jacobi and Atkinson 1995).Given the extraordinary level of endemism, Hawai‘i is regarded asa globally significant “hot spot” of biodiversity.
However, with the arrival of the Polynesian explorers approximately2,000 years ago and, more recently, with the “discovery” of Hawai‘iby Westerners in 1778, major impacts have been brought to Hawai-ian ecosystems and their unique biota. Today, Hawai‘i is home toapproximately 33% of the nation’s total endangered species(USFWS 1998), and nearly 75% of the recorded extinctions in theUnited States have involved endemic Hawaiian species. This pro-cess continues and may be accelerating. Federal, state, and privateconservation organizations currently working in Hawai‘i agree thatnearly all of Hawaiian native biota should be regarded as threat-ened.
The loss of biodiversity is directly linked to landscape alteration(e.g., agriculture, urbanization, resort development, and recreation)and the growing number of non-native, injurious species. Weeds inparticular are widely regarded as posing the greatest threat tobiodiversity and native ecosystems in Hawai‘i. Nearly half the to-tal land area of the archipelago is now occupied by altered land-scapes or alien-dominated ecosystems that have displaced nativespecies (Pratt and Gon 1998). Alien species now comprise nearly20% of the overall biota in Hawai‘i (Eldredge and Miller 1995).
Hawai‘i GAPThe national GAP program grew out of the Hawai‘i Forest BirdSurvey, which was an innovative project initiated in the 1970s toevaluate the distribution, status, and threats to habitats of endan-gered Hawaiian forest bird populations (Scott et al. 1986, Scott etal. 1987). Since then, research and management efforts in Hawai‘ihave expanded to include taxa other than birds. In 1995, the EcodataGroup (EDG) was established by several federal, state, and privateorganizations to facilitate the sharing of environmental data and tocoordinate data collection efforts statewide. EDG was instrumen-
tal in developing the Hawai‘i GAP project to take advantage of itswell-tested methodologies and rigorous data quality standards.
Hawai‘i GAP will follow closely the standard methodology, with acouple of noteworthy innovations. Most significantly, because muchof Hawaii’s extraordinary biodiversity is expressed in its flora, wewill be looking at the distribution of key plant and invertebrate taxain addition to the distribution of vertebrates when developing ourspecies distribution maps. Second, we will be mapping the biologi-cal elements in our freshwater streams. Finally, we will be map-ping key threats to biodiversity, including the distribution of feralungulates, avian disease, weeds, and fire. While we recognize theimportance of the marine aspects of biodiversity in Hawai‘i, ourinitial GAP effort will not include a marine component. In the courseof the terrestrial/aquatic GAP project, we will consider the feasibil-ity of developing coral reef and nearshore marine coverage and otherimportant biodiversity elements.
ConclusionsStudies in Hawaiian avifauna during the 1970s contributed to thedevelopment of the current GAP framework. It is our hope that wecan continue to further the process of refining the GAP methodol-ogy by including nonvertebrate taxa and environmental threats whenevaluating the implications for conservation of Hawaii’s biodiversity.
Literature CitedEldredge, L., and S. Miller. 1995. How many species are there in
Hawai‘i? B.P. Bishop Museum Occasional Papers 41:3-18.
Jacobi, J.D., and C.T. Atkinson. 1995. Hawaii’s endemic birds.Pages 376-381 in E.T. LaRoe et al., editors, Our Living Re-sources. U.S. Department of the Interior, National BiologicalService, Washington, D.C. 530 pp.
Pratt, L., and S.M. Gon III. 1998. Terrestrial ecosystems. In: S.P.Juvik and J.O. Juvik, editors, Atlas of Hawai‘i. University ofHawai‘i Press.
Scott, J.M., B. Csuti, J.D. Jacobi, and J.E. Estes. 1987. Speciesrichness: a guide to protecting future biological diversity. Bio-science 37(11): 782-788.
Scott, J.M., S. Mountainspring, F.L. Ramsey, and C.B. Kepler.1986. Forest bird communities of the Hawaiian Islands: Theirdynamics, ecology, and conservation. Studies in Avian Biology9. 431 pp.
U.S. Fish and Wildlife Service. 1998. Endangered and threatenedwildlife and plants. 50 CFR 17.11 and 17.12.
Wagner, W.L., D.R. Herbst. and S.H. Sohmer. 1999. Manual ofthe flowering plants of Hawai‘i. B. P. Bishop Museum Spec. Pub.97. University of Hawai‘i Press and Bishop Museum Press.

GAPA N A L Y S I S
18 GAP Analysis Program Bulletin No. 8, December 1999
LAND COVER
Predictive Modeling of Rare Plant Species
To illustrate this technique, I have developed an empirical model ofthe potential distribution of a rare Wyoming endemic, Physariaeburniflora Rollins. This low-growing perennial mustard is re-stricted to barren calcareous ridges and granite outcrops in the NorthPlatte and Sweetwater River drainages in central Wyoming (Figure1). Of 29 known populations, 28 were selected for modeling be-cause these sites could be placed within 0.1 - 2.5 km of their actuallocation. As absence data have not been routinely collected for thisspecies, I used the Rocky Mountain Herbarium’s (RMH) databaseof over 9,000 sampling points in Wyoming to identify areas whereP. eburniflora has not been collected and is thus presumed absent.(RMH researchers have systematically established these collectionsites across the state for the purpose of collecting all plant taxapresent in the immediate area.) Of these putative absence sites,1,270 were randomly selected for modeling. The combined pres-ence and absence data set was randomly split into model-buildingand model-validation pools.
Environmental attributes for each presence and absence point werederived from digital coverages in ArcView version 3.1. For climatedata, I used PRISM mean monthly precipitation data in 4 km rasterformat (Daly et al. 1994) and unpublished PRISM mean monthlytemperature data in 2 km raster format. Topographic data, includ-ing elevation, slope, and aspect, were derived from 30 m DigitalElevation Model (DEM) coverages of the state. An index of land-scape position for each 30 m pixel was calculated using the proto-col of Fels and Matson (1996) and then reclassified into four ter-rain position categories based on overall slope and shape (concave,slope, flat, and convex) (Ken Driese, pers. comm.). Lastly, vectorcoverages of bedrock geology and GAP land cover were used.
Using classification tree analysis in S-plus version 1.1, I developeda model of P. eburniflora distribution using seven environmentalvariables as predictors (mean April and July precipitation, meanJanuary and July temperature, bedrock geology, aspect, and eleva-tion). Classification trees use a recursive partitioning algorithm toidentify the values of continuous and categorical environmentalvariables that best explain the differences in predicted presence orabsence of a species (Breiman et al. 1984). From the model output,I created a potential range map in ArcView by intersecting the envi-ronmental values that best predicted the presence of P. eburniflora(Figure 2). The model correctly classified 13 of the known pres-ence points (93%) and 608 (95.7%) of the known absence points inthe model-building data set and seven (50%) of the known pres-ence points and 614 (96.7%) of the known absence points in thevalidation data set.
#
## #
###
##
##
##
#
##
#
#
##
#
##
#
#
###
A Report on GAP ResearchProject #1434-HQ-97-RU-01542WALTER FERTIG
Department of Botany, University of Wyoming, Laramie
Resource managers and conservation biologists are faced with acritical shortage of information on the potential distribution of rareplant species over large areas. Predictive modeling can be a cost-effective means of identifying and prioritizing likely areas of rareplant habitat for more efficient and productive ground surveys.
Traditionally, rare plant ranges have been inferred from dot distri-bution maps (Figure 1), but these maps may represent only a frac-tion of the species’ actual range or reflect sampling bias. An alter-native is to model the potential range of a species by identifyingcorrelations between the plant’s known distribution and relevantenvironmental variables using geostatistical methods (Franklin1995). These empirical models can be derived from herbarium orNatural Heritage Program location records and state- or regional-scale coverages of substrate, topography, and climate in a Geo-graphic Information System (GIS).
Figure 1. Dot distribution map of the known range of Physariaeburniflora in Wyoming.

GAPA N A L Y S I S
GAP Analysis Program Bulletin No. 8, December 1999 19
Figure 2. Predicted distribution of Physaria eburniflora in Wyomingbased on correlational modeling.
According to the predicted distribution map, potential habitat for P.eburniflora may occur along the flanks of the Bighorn, Wind River,Owl Creek, Medicine Bow, and Uinta mountains in northern, west-ern, and southeastern Wyoming, and on isolated buttes and valleyselsewhere in the state (Figure 2). Surveys to date have shown thatother, closely related Physaria species occur in these areas, per-haps reflecting their superior competitive ability or localized ex-tinction or incomplete dispersal of P. eburniflora.
The predictive ability of correlational models may be hampered byerrors inherent in the input data sets. Imprecise location points,errors in converting map data to digital format, and horizontal andvertical errors in DEMs may all reduce prediction accuracy (Franklin1995). Potentially useful environmental factors such as local soil
pH, soil texture, or extremes in precipitation or temperature areunavailable in statewide coverages or are masked whenmacroclimate data are averaged over diurnal cycles and monthlyperiods. Equally useful spatial data sets for the distribution of pol-linators, seed dispersal vectors, predators, and soil symbionts arealso unavailable. Spatial autocorrelation can inflate the explana-tory power of models when location points for a species are natu-rally clustered, although this problem may be lessened if this spa-tial patterning is related entirely to spatial patterning in the explana-tory environmental variables (Franklin 1998). Lastly, an inadequatenumber of sample points may be available for some extremely rareplants to meet the minimum data input requirements for a statisti-cally useful model. Despite these caveats, GIS-based correlationalmodels can be a powerful tool for developing testable and ecologi-cally meaningful distribution maps of rare species and for identify-ing areas of potential habitat for field surveys.
Literature CitedBreiman, L., J. Friedman, R. Olshen, and C. Stone. 1984. Classi-
fication and regression trees. Chapman and Hall, New York.
Daly, C., R.P. Neilson, and D.L. Phillips. 1994. A statistical-topo-graphic model for mapping climatological precipitation overmountainous terrain. Journal of Applied Meteorology 33:140-158.
Fels, J.E., and K.C. Matson. 1996. A cognitively-based approachfor hydrogeomorphic land classification using digital terrainmodels. Third International Conference/Workshop on Integrat-ing GIS and Environmental Modeling, Santa Fe, New Mexico.
Franklin, J. 1995. Predictive vegetation mapping: Geographicmodelling of biospatial patterns in relation to environmental gra-dients. Progress in Physical Geography 19:474-499.
Franklin, J. 1998. Predicting the distribution of shrub species insouthern California from climate and terrain-derived variables.Journal of Vegetation Science 9:733-748.

GAPA N A L Y S I S
20 GAP Analysis Program Bulletin No. 8, December 1999
Comparison of Satellite Imagery InterpretationUsing Known Association/Alliance-Level Data
MethodsStudy Area - Wind Cave National Park (WCNP) is an 11,450 haparcel in the southern Black Hills of western South Dakota. Thepark is a mosaic of ponderosa pine (Pinus ponderosa) stands andmixed- and shortgrass prairies. The vegetation of the park, includ-ing an approximately 2 km buffer, was classified by USGS-NPS toan association level using aerial photography (Table 2; Figure 1 -see Web version of the Bulletin at http://www.gap.uidaho.edu/Bul-letins/8).
Classification Procedure - Landsat Thematic Mapper (TM) leaf-offsatellite scenes for path 33/row 29 and path 33/row 30 for 1992were acquired through the Multi-Resolution Land CharacteristicsConsortium. These two scenes, which encompass the Black Hillsof South Dakota (including WCNP), were mosaicked and processedthrough an unsupervised classification with 20 iterations resultingin 255 clusters and a 30 m cell size (Lauver and Whistler 1993,Scott et al. 1993, Stoms 1996, Vogelmann et al. 1998).
GIS Summary Interpretation - GIS summary techniques were usedin this study. A GIS summary calculates cross-tabulation statisticsbetween input files (known data entered on zeroed image and clus-tered satellite scene) and creates an output report stating the agree-ment between the known data and individual clusters. GIS summa-ries were generated on the clustered image clipped to the WCNPboundary (GIS Summary I) and on the mosaicked scenes, contain-ing the entire Black Hills (GIS Summary II). Methods followedVogelmann et al. (1998).
Cluster Selection Interpretation - Using Imagine software (ERDAS),the USGS-NPS vegetation coverage was overlaid on the clipped,mosaicked satellite image. Each of the 255 clusters was selected todetermine the vegetation type it represented. Labels were given todesignate the present vegetation types. Once all 255 clusters hadbeen interpreted, any cluster that was designated by only one asso-ciation was assigned to that type. Clusters containing more thanone association were compared and assigned to the association withthe highest percent composition.
Accuracy Assessment - Stratified, random points (908) were se-lected for accuracy assessment based on the number of pixels in agiven category (Krebs 1989, Johnson et al. 1999). A minimum oftwo points was assessed for small classes. Nine classes in the USGS-NPS coverage could not be assessed for accuracy because of size,accessibility, or lack of field information (Cogan et al. 1999). Anerror matrix was generated for the remaining classes (Table 3 - seeWeb version of the Bulletin at http://www.gap.uidaho.edu/Bulle-tins/8).
VICKIE J. SMITH1, CHAD J. KOPPLIN1, JONATHAN A. JENKS1,BRUCE K. WYLIE2, JAMES E. VOGELMANN2, AND ROBERT W.KLAVER1,2
1 Department of Wildlife and Fisheries Sciences, South Dakota StateUniversity, Brookings2 U.S. Geological Survey, EROS Data Center, Sioux Falls, SouthDakota
IntroductionThe U.S. Geological Survey/National Park Service (USGS-NPS)Vegetation Mapping Program was initiated in 1991 to provide na-tional parks with information on their natural resources. Parks areclassified based on the association level of the National VegetationClassification System (NVCS) with a goal of 80% map accuracy.Classification has been completed for three national parks in SouthDakota: Mt. Rushmore, Jewel Cave, and Wind Cave (Cogan et al.1999).
These USGS-NPS maps offer a unique opportunity to evaluate theextent to which satellite imagery can be used to classify land coverbased on the NVCS vegetation classification system (Table 1). Ourobjectives were to determine the degree to which association-levelclassifications could be interpreted from satellite imagery and theaccuracy of these interpretations. We hypothesized that with de-tailed training data for association level or community type, accu-racy of land cover maps would be at least 80%.
Table 1. Natural land cover classification system (Jennings 1996).
Category Example
Class .................. Woodland
Subclass ................ Mainly Evergreen Woodlands
Group ....................... Evergreen Needle-leaved Woodlands
Formation ....................Evergreen Coniferous Woodlandswith Rounded Crowns
Physiognomic
Floristic
Community Alliance .......Juniperus occidentalis
Community Type ...............Juniperus occidentalis/Artemisia tridentata

GAPA N A L Y S I S
GAP Analysis Program Bulletin No. 8, December 1999 21
Table 2. Categories included in original USGS-NPS coverage and comparison to three methods of interpretation.
USGS-NPS Cluster GIS GISCategory Coverage (ha) Selection (ha) Summary I Summary II
(ha) (ha)
Purple-3-awn – Fetid Marigold 861.05 382.32 307.8 320.76Herbaceous Vegetation
Ponderosa Pine Limestone Cliff Sparse Vegetation1 29.77 N/A N/A N/ARedbeds Sparse Vegetation 68.53 42.12 N/A 6.48
Black Hills Rock Outcrop Sparse Vegetation1,3 94.62 N/A N/A N/AShale Barren Slope Sparse Vegetation3 70.87 359.64 29.26 32.4
White Sedimentary Rock Outcrop Sparse Vegetation 269.59 N/A 22.68 22.68Bison Wallows1,2 4.35 N/A N/A N/A
Burned Pine 776.89 942.84 239.76 317.52Emergent Wetland Herbaceous Complex1 54.35 N/A N/A N/A
Little Bluestem – Grama Grass / 4259.70 3304.8 1150.2 1140.48Threadleaf Sedge Herbaceous Vegetation
Western Wheatgrass – Kentucky 10746.36 13011.84 17933.4 17677.44Bluegrass Complex
Introduced Weedy Graminoid1,3 39.80 N/A N/A N/ANeedle-and-thread – Blue Grama / 286.33 243.0 N/A N/A
Threadleaf Sedge Herbaceous VegetationMountain Mahogany – Sideoats Grama I 578.48 197.64 51.84 129.6
Mountain Mahogany – Sideoats Grama II1,3 187.97 N/A N/A N/ALead Plant 162.67 155.52 N/A N/A
Chokecherry Shrubland 700.93 165.24 N/A N/ABeaked Willow Shrubland1,3 7.77 N/A N/A N/A
Western Snowberry Shrubland 757.72 758.16 N/A N/ACreeping Juniper – Little Bluestem 0.11 N/A N/A N/A
Shrubland1,2
Plains Cottonwood – Western Snowberry Forest3 52.72 42.12 N/A N/ABoxelder/Chokecherry Forest1 149.64 N/A N/A N/A
Bur Oak Stand1,3 14.41 N/A N/A N/AGreen Ash – American Elm / Western 11.58 93.96 N/A N/A
Snowberry Forest3
Birch – Aspen Stand1,3 44.50 N/A N/A N/APonderosa Pine Woodland Complex I 2713.99 5495.04 6207.84 6207.84
Ponderosa Pine – Little Bluestem Woodland 4224.28 1707.48 5469.12 5469.12Ponderosa Pine – Chokecherry Forest 1001.03 N/A 3.24 3.24Ponderosa Pine Woodland Complex II 4506.53 5585.76 2993.76 2993.76Young Ponderosa Pine Dense Cover1 995.48 N/A N/A N/A
Transportation, Communications, and Utilities 331.31 N/A 100.44 87.48Crop and Pasture 1744.39 1574.64 1244.16 1302.48
Other Agricultural Lands 112.06 155.52 N/A 32.4Open Water 28.18 16.2 16.2 19.44
Strip Mines and Gravel Pits 41.49 N/A 19.44 6.48
1Not interpreted in any of the three classifications2Removed from coverage because of size when converted from vector to raster format3No accuracy assessment performed

GAPA N A L Y S I S
22 GAP Analysis Program Bulletin No. 8, December 1999
ResultsTwo categories were removed from the GIS summary analysis bythe gridding procedure. These classes, Creeping Juniper/LittleBluestem Shrubland and Bison Wallows, contained less than 5 hain long, narrow corridors. A 30 m grid cell contains 0.09 ha, butneighboring spectral classes can mask small areas and remove themduring the gridding process (Congalton 1997). Neither of thesecategories could be interpreted using the Cluster Selection method(Table 2).
Ten additional categories (less than 190 ha) were not interpreted byany of the three methods (GIS Summary I, GIS Summary II, andCluster Selection Interpretations) listed in Table 2. Although somevegetation types less than 190 ha were interpreted, polygon sizecould be the factor determining whether or not the vegetation typecould be distinguished.
GIS Summary Interpretations - Fifteen of the 35 NPS categorieswere present using GIS Summary I on WCNP (Figure 2 - see Webversion of the Bulletin at http://www.gap.uidaho.edu/Bulletins/8).Seventeen of the 35 NPS categories were present using GIS Sum-mary II on the Black Hills (Table 2; Figure 3 - see Web version ofthe Bulletin).
Cluster Selection Interpretation - Nineteen of the original 35 NPScategories were classified using Cluster Selection (Figure 4 - seeWeb version of the Bulletin at http://www.gap.uidaho.edu/Bulle-tins/8). The Cluster Selection method resulted in classification ofsix classes not found in the GIS Summaries of WCNP and the BlackHills (Table 2).
Accuracy Assessment - Based on preliminary assessment of thetechniques used to classify the imagery, the Cluster Selection Inter-pretation resulted in the highest number of classes and most closelyresembled the USGS-NPS coverage from aerial photography (Table2). We restricted our accuracy assessment to this methodology be-cause others would be less accurate by default. Because the USGS-NPS coverage was only 73.0% accurate, we only determined simi-larity between the classified satellite image and the USGS-NPScoverage.
Four hundred and twenty-nine of 908 pixels were correctly classi-fied to association using this interpretation, resulting in accuracy of47%. User’s accuracy ranged from 0-84%, and producer’s accu-racy ranged from 0-63% (Table 3 - see Web version of the Bulletinat http://www.gap.uidaho.edu/Bulletins/8). However, using thisassociation-level information does accurately separate conifer fromgrassland categories. When categories were grouped to the forma-tion level, overall accuracy increased to 76% (Table 4).
Purple-3-awn- Redbeds SV Burned Pine Grassland Shrubland Evergreen TotalFetid Marigold
Purple-3-awn – 8 0 3 12 0 0 23Fetid Marigold
Redbeds SV 0 0 0 4 0 0 4
Burned Pine 6 0 14 1 0 18 39
Grassland 10 0 18 364 11 18 421
Shrubland 1 0 3 39 2 17 62
Evergreen 3 0 12 30 11 303 359
Total 28 0 50 450 24 356 908
Table 4. Formation-level accuracy assessment.
DiscussionThree categories were overestimated in both of the GIS Summaryinterpretations; these classes were Western Wheatgrass/KentuckyBluegrass Complex, Ponderosa Pine Complex I, and Ponderosa PineComplex II. These three categories comprised 49.2% of all of theland classified in the USGS-NPS coverage. From these results, weconclude that using a GIS summary to interpret land cover overes-timated the dominant vegetation types.
During processing, the GIS summary showed confusion betweensimilar categories in a number of clusters. Confusion occurredwithin herbaceous, pine, sparse vegetation, man-made, and agri-cultural categories. Although recommended accuracy requirements
for GAP are 80% at the alliance level, overall accuracy approached80% only after aggregating categories to the formation level. Ac-curacy assessment included a comparison to the NPS classifiedcoverage, not to actual ground-truth information; hence, accuracyof the original coverage (73.0%) may have interfered with the in-terpretation of satellite imagery obtained from ground vegetation.An accuracy assessment with ground-truth data from vegetation inWCNP may increase accuracy of the classified image; this infor-mation was not available at the time of the study.
Although techniques discussed were not able to distinguish accu-rate alliance information, additional limitations exist with these in-terpretations. The Black Hills contain white spruce at elevations

GAPA N A L Y S I S
GAP Analysis Program Bulletin No. 8, December 1999 23
higher than 1,625 m. WCNP does not contain white spruce; there-fore, we were not able to evaluate this vegetation type using any ofthe three methods. In this case, white spruce would have been clas-sified as Ponderosa Pine in the Black Hills, resulting in additionalinaccuracies in the land cover map. WCNP also is relatively smallin size when compared to the mosaicked scenes of the Black Hills.Using a small area, such as WCNP (11,450 ha), as the sole trainingdata may cause inaccuracies when applied to a large area, such asthe two mosaicked Black Hills scenes (9,232,736 ha). Because ofthese limitations, more known vegetation types would need to beincluded in the Cluster Selection and GIS Summary methods toadequately represent all vegetation types present in the Black Hills.
Recommendations and Further ResearchWhile this study found an average accuracy of only 47% using sat-ellite interpretations to predict alliance-level information, othermethods may have improved results. Ancillary data andmultitemporal satellite scenes can be used to assist in the interpre-tation of categories that are small or that have specific habitat re-quirements. For example, digital soil survey information may helpnarrow the classification of large categories that dominate an inter-pretation. However, these data are not available for the Black Hills.
A second alternative that may enhance accuracy is the use of newersatellite imagery. The MRLC acquisition of satellite imagery forSouth Dakota dates to 1992. The ground-truth information wascollected in 1997, and aerial photography was taken in 1998 to beused as ground-truth information. These temporal differences maycause inaccuracies in classification. A Landsat 7 scene from 14October 1999 for southwestern South Dakota is currently being in-terpreted. Classification of this scene will likely compensate fortemporal changes and will allow the use of 15 m panchromatic reso-lution to aid in interpretation of vegetation pattern.
AcknowledgmentsWe would like to thank Dan Roddy, Wind Cave National Park, foraccess to the USGS-NPS coverage for the park. We thank the EROSData Center for help with methodology used in this study and forsupport. We thank the National GAP Office for funding.
Literature CitedCogan, D., H. Marriott, J. Von Loh, and M.J. Pucherelli. 1999.
USGS-NPS Vegetation Mapping Program: Wind Cave NationalPark, South Dakota. Technical Service Center, Denver, Colo-rado. Technical Memorandum No. 8260-99-03.
Congalton, R.G. 1997. Exploring and evaluating the consequencesof vector-to-raster and raster-to-vector conversion. Photogram-metric Engineering and Remote Sensing 63:425–434.
Jennings, M.D. 1996. Mapping units: Their classification andnomenclature for gap analysis land cover data. Pages 71-78 inJ. M. Scott, T. H. Tear, and F. W. Davis, editors. Gap Analysis:a landscape approach to biodiversity planning. American Soci-ety for Photogrammetry and Remote Sensing, Bethesda, Mary-land.
Johnson, R.R., K.F. Higgins, D.E. Naugle, and J.A. Jenks. 1999.A comparison of sampling techniques to estimate number ofwetlands. Wildlife Society Bulletin 27:103-108.
Krebs, C.J. 1989. Ecological methodology. Harper & Row, NewYork, New York. 654 pp.
Lauver, C.L., and J.L. Whistler. 1993. A hierarchical classifica-tion of Landsat TM imagery to identify natural grassland areasand rare species habitat. Photogrammetric Engineering and Re-mote Sensing 59:627-634.
Scott, J.M., F. Davis, B. Csuti, R. Noss, B. Butterfield, C. Groves,H. Anderson, S. Caicco, F. D’Erchia, T.C. Edwards, Jr., J.Ulliman, and R.G. Wright, 1993. Gap analysis: A geographicapproach to protection of biological diversity. Wildlife Mono-graphs 123:1–41.
Stoms, D.M. 1996. Actual vegetation layer. National Gap Analy-sis Program Handbook. http://www.gap.uidaho.edu/handbook/LandCoverMapping.
Vogelmann, J.E., T. Sohl, and S.M. Howard. 1998. Regional char-acterization of land cover using multiple sources of data. Pho-togrammetric Engineering and Remote Sensing 64:45–47.

GAPA N A L Y S I S
24 GAP Analysis Program Bulletin No. 8, December 1999
Estimating and Mapping the Thematic Accuracyof GAP Land Cover Maps
estimates then were entered into ARC/INFO (GRID module), andmean thematic accuracy was interpolated to a 1 km statewide lat-tice using the routine POINTINTERP (exponential option withneighborhood = 75 km, and decay = 15 km); in other words, meanaccuracy was calculated for each lattice point across the state usingonly the reference data (cover types and accuracy estimates) thatfell within a 75 km search radius. Finally, contour lines connectinglattice points of equal mean thematic accuracy were drawn at 5%intervals. Not surprisingly, the resulting map showed considerablespatial variation in mean thematic accuracy for the 45 cover types.Yet despite the utility of these results, we acknowledge that an in-dependent validation (as recommended by Stoms et al. 1994 andCrist and Deitner 1998) would still be worthwhile, especially todetect and measure errors resulting from the possible omission orinadequate representation of cover types in the sample of existingreference data.
Literature CitedCrist, P., and R. Deitner. 1998. Assessing land cover map accu-
racy. Version 2. Gap Analysis Handbook.
Efron, B., and R.J. Tibshirani. 1993. An introduction to the boot-strap. Chapman and Hall, New York.
Redmond, R.L., M.M. Hart, J.C. Winne, W.A. Williams, P.C.Thornton, Z. Ma, C.M. Tobalske, M.M. Thornton, K.P.McLaughlin, T.P. Tady, F.B. Fisher, and S.W. Running. 1998.The Montana Gap Analysis Project Final Report. Unpublishedreport.
Steele, B.M., J.C. Winne, and R.L. Redmond. 1998. Estimationand mapping of misclassification probabilities for thematic landcover maps. Remote Sensing of the Environment 66: 192-202.
Stoms, D., F. Davis, C. Cogan, and K. Cassidy. 1994. Assessingland cover map accuracy for Gap Analysis. Version 1. GapAnalysis Handbook.
ROLAND L. REDMOND
Montana Cooperative Wildlife Research Unit, University of Montana,Missoula
In keeping with the research and development mission of the GapAnalysis Program, we developed an approach to accuracy assess-ment for land cover in Montana that did not require the collectionof an independent set of reference data. Instead, all available refer-ence data were used not only to train supervised image classifica-tions, but also to assess the resulting classification accuracies via abootstrap procedure. Moreover, because standard classification errormatrices provide little information about the spatial variation in the-matic accuracy, we used Kriging to interpolate probability estimatesfrom each reference point to a statewide lattice, from which a con-tour map of thematic accuracy was produced. Although the methodhas withstood peer review (Steele et al. 1998), no results have beenfield-tested, and readers should be cautious in applying it to theirareas or states. For more details about the procedure and how toconstruct bootstrap classification error matrices, see Steele et al.(1998); additional details about the statewide application can befound in Redmond et al. (1998).
The Montana Gap Analysis Project (MT-GAP) began before thewidespread use of airborne videography. Because of the large sizeof the state and a lack of funds to collect new ground-referencedata, we were limited to the use of whatever existing data wereavailable. Although this amounted to 21,348 plots representing 45cover types, this was not a sufficiently large sample for us to holdback a certain proportion (e.g., 20%) to validate the supervised clas-sifications of 33 TM images covering the state. Thus, we devised amethod of estimating the probability of misclassification at each ofthese reference points using a bootstrap procedure (Efron andTibshirani 1993). This method simulated the process of samplingand classification many times (with replacement), and thereby al-lowed us to estimate the probability that the true cover type wascorrectly classified at each reference point from the number of timesthat the reference observation was correctly classified in all the simu-lations. For MT-GAP, we ran the bootstrap 100 times with replace-ment for each TM image classification. The resulting probability

GAPA N A L Y S I S
GAP Analysis Program Bulletin No. 8, December 1999 25
ANIMAL MODELING
On Vertebrate Generations and PlantSuccession: Incorporating Vegetation Structural
Attributes into Vertebrate Modelingbeen included as habitat, GAP predictions will always tend to over-estimate the species distributions (Smith and Catanzaro 1996).While overestimating the distribution of common species may beacceptable in some cases and is preferable to consistently underes-timating distributions (Edwards et al. 1995), it may represent a prob-lem for rare or patchily distributed species (Smith and Catanzaro1996). Therefore, vegetation type is not the only factor influencinguse by species; other environmental variables are usually incorpo-rated to further refine a species distribution (Csuti 1996). Suchfactors can be either ecological or physical and may include eleva-tion, soil type, rainfall, slope, aspect, and patch or polygon size(see Csuti and Crist [1996] for a thorough explanation of the verte-brate modeling process of GAP).
Refinement of ModelsGAP has significantly contributed to the knowledge and capabili-ties of natural resource conservation through the use of spatial in-formation technologies (Prendergast et al. 1998, Schwartz 1999).As GAP incorporates new software, hardware, and techniques, theoriginal scope of GAP can be expanded. The last 10 years haveseen a growth of knowledge and enhancement of techniques unpar-alleled in the past. This expansion of knowledge has forced GAPto continually revise and upgrade the standards for data products.For example, where once the minimum mapping unit for land covermapping was 100 ha, today it is only 2 ha. Many states are retain-ing and using the 30 m pixel resolution. Similarly, where once weobtained a handful of cover classes that often included many forestalliances, we see the development of detailed techniques such asdecision-rule algorithms (McKerrow 1997) for selection of detailedindividual alliances or ecological complexes from the same satel-lite data used five years earlier.
Many GAP projects have been incorporating various factors to re-fine species distributions. For example, Allen et al. (in press) dem-onstrated the impact of incorporating dispersal distances on overallspecies richness in southern Florida. Mattson (1996) demonstratedthe impacts of human presence and access to the potential distribu-tion of grizzly bear (Ursus arctos) habitat in Idaho.
GAP is viewed as a long-term planning tool; however, there hasbeen some acceptance of the need to continually reevaluate areas
FRANCISCO J. VILELLA AND RICHARD B. MINNIS
USGS/BRD Mississippi Cooperative Fish and Wildlife Research UnitMississippi State University, Mississippi State
Species-Habitat Concept and GapAnalysisThe concept of habitat is understood, even by the lay public, as theplace where an animal resides. As biologists we recognize compo-nents of habitat (i.e., cover, food) contained within this “place.”MacArthur and MacArthur (1961) argued an ornithologist coulddetermine which species were likely to occur in a given locationbased on the following criteria: 1) geographic location of habitat,2) type and structure of habitat, 3) knowledge of geographic range.Similarly, Udvardy (1969) stated “the mapping of vegetation servesas the basis of correlation for animal distributions . . . (and)indicate(s) possible occurrences of animals where they have notbeen studied or have been overlooked.” Finally, Thomas (1979)claimed “plant communities and their seral stages . . . are ecologi-cally important as niches for wildlife species. The niches are aproduct of the plant community, its seral stages, and other environ-mental factors—including soil type, moisture regime, microclimate,slope, aspect, elevation, and temperature.” It is important to specifythis description refers to the Grinnellian concept of ecological niche,which focuses on factors determining the distribution and abun-dance of species (Grinnell 1917). This autecological approach tothe concept of niche is the basis for developing the habitat modelsused by the Gap Analysis Program (GAP).
GAP assesses terrestrial vertebrate biodiversity by mapping the pre-dicted distribution of terrestrial vertebrates in a given region. GAPis designed to use the association of wildlife with vegetation and/orother physical attributes to examine the potential distribution ofvertebrate species and associate it with the existing distribution oflands being managed for biodiversity conservation. Data devel-oped by GAP provide decision support for planning the protectionof all terrestrial vertebrate species within a given region. GAP datasets are probably some of the broadest and most useful for this typeof analysis. But, by assuming that a species occupies all suitablevegetation types within its range and that all suitable types have
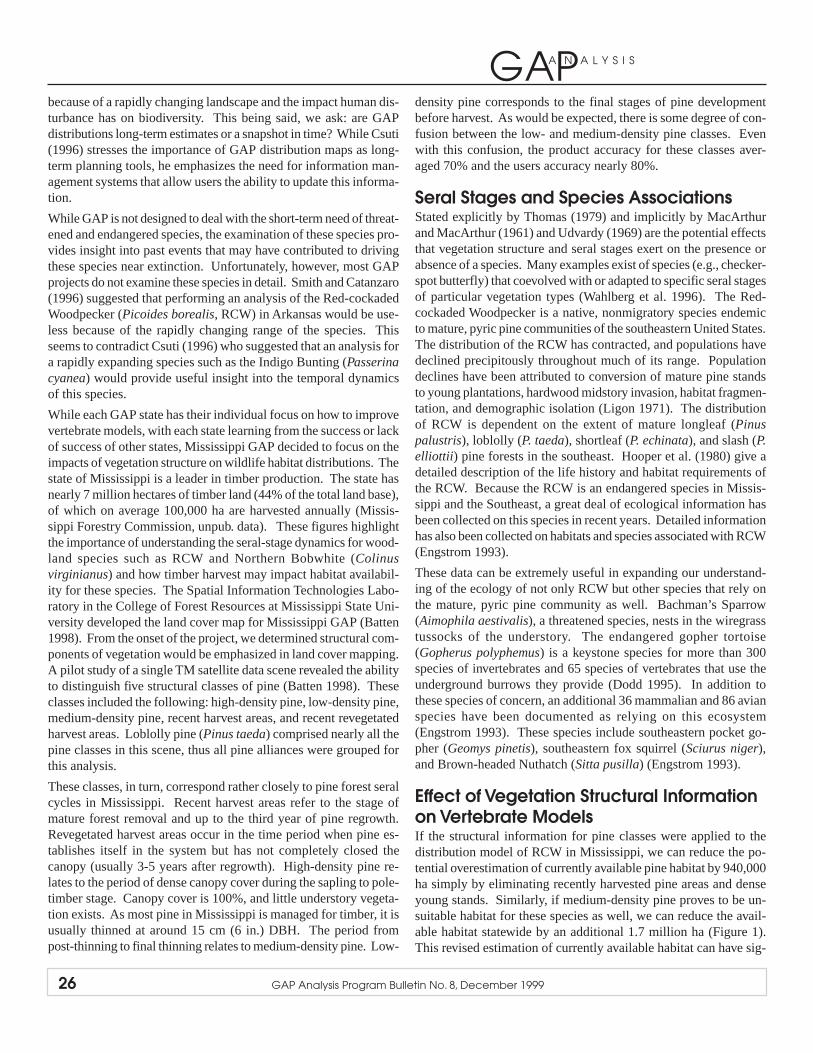
GAPA N A L Y S I S
26 GAP Analysis Program Bulletin No. 8, December 1999
because of a rapidly changing landscape and the impact human dis-turbance has on biodiversity. This being said, we ask: are GAPdistributions long-term estimates or a snapshot in time? While Csuti(1996) stresses the importance of GAP distribution maps as long-term planning tools, he emphasizes the need for information man-agement systems that allow users the ability to update this informa-tion.
While GAP is not designed to deal with the short-term need of threat-ened and endangered species, the examination of these species pro-vides insight into past events that may have contributed to drivingthese species near extinction. Unfortunately, however, most GAPprojects do not examine these species in detail. Smith and Catanzaro(1996) suggested that performing an analysis of the Red-cockadedWoodpecker (Picoides borealis, RCW) in Arkansas would be use-less because of the rapidly changing range of the species. Thisseems to contradict Csuti (1996) who suggested that an analysis fora rapidly expanding species such as the Indigo Bunting (Passerinacyanea) would provide useful insight into the temporal dynamicsof this species.
While each GAP state has their individual focus on how to improvevertebrate models, with each state learning from the success or lackof success of other states, Mississippi GAP decided to focus on theimpacts of vegetation structure on wildlife habitat distributions. Thestate of Mississippi is a leader in timber production. The state hasnearly 7 million hectares of timber land (44% of the total land base),of which on average 100,000 ha are harvested annually (Missis-sippi Forestry Commission, unpub. data). These figures highlightthe importance of understanding the seral-stage dynamics for wood-land species such as RCW and Northern Bobwhite (Colinusvirginianus) and how timber harvest may impact habitat availabil-ity for these species. The Spatial Information Technologies Labo-ratory in the College of Forest Resources at Mississippi State Uni-versity developed the land cover map for Mississippi GAP (Batten1998). From the onset of the project, we determined structural com-ponents of vegetation would be emphasized in land cover mapping.A pilot study of a single TM satellite data scene revealed the abilityto distinguish five structural classes of pine (Batten 1998). Theseclasses included the following: high-density pine, low-density pine,medium-density pine, recent harvest areas, and recent revegetatedharvest areas. Loblolly pine (Pinus taeda) comprised nearly all thepine classes in this scene, thus all pine alliances were grouped forthis analysis.
These classes, in turn, correspond rather closely to pine forest seralcycles in Mississippi. Recent harvest areas refer to the stage ofmature forest removal and up to the third year of pine regrowth.Revegetated harvest areas occur in the time period when pine es-tablishes itself in the system but has not completely closed thecanopy (usually 3-5 years after regrowth). High-density pine re-lates to the period of dense canopy cover during the sapling to pole-timber stage. Canopy cover is 100%, and little understory vegeta-tion exists. As most pine in Mississippi is managed for timber, it isusually thinned at around 15 cm (6 in.) DBH. The period frompost-thinning to final thinning relates to medium-density pine. Low-
density pine corresponds to the final stages of pine developmentbefore harvest. As would be expected, there is some degree of con-fusion between the low- and medium-density pine classes. Evenwith this confusion, the product accuracy for these classes aver-aged 70% and the users accuracy nearly 80%.
Seral Stages and Species AssociationsStated explicitly by Thomas (1979) and implicitly by MacArthurand MacArthur (1961) and Udvardy (1969) are the potential effectsthat vegetation structure and seral stages exert on the presence orabsence of a species. Many examples exist of species (e.g., checker-spot butterfly) that coevolved with or adapted to specific seral stagesof particular vegetation types (Wahlberg et al. 1996). The Red-cockaded Woodpecker is a native, nonmigratory species endemicto mature, pyric pine communities of the southeastern United States.The distribution of the RCW has contracted, and populations havedeclined precipitously throughout much of its range. Populationdeclines have been attributed to conversion of mature pine standsto young plantations, hardwood midstory invasion, habitat fragmen-tation, and demographic isolation (Ligon 1971). The distributionof RCW is dependent on the extent of mature longleaf (Pinuspalustris), loblolly (P. taeda), shortleaf (P. echinata), and slash (P.elliottii ) pine forests in the southeast. Hooper et al. (1980) give adetailed description of the life history and habitat requirements ofthe RCW. Because the RCW is an endangered species in Missis-sippi and the Southeast, a great deal of ecological information hasbeen collected on this species in recent years. Detailed informationhas also been collected on habitats and species associated with RCW(Engstrom 1993).
These data can be extremely useful in expanding our understand-ing of the ecology of not only RCW but other species that rely onthe mature, pyric pine community as well. Bachman’s Sparrow(Aimophila aestivalis), a threatened species, nests in the wiregrasstussocks of the understory. The endangered gopher tortoise(Gopherus polyphemus) is a keystone species for more than 300species of invertebrates and 65 species of vertebrates that use theunderground burrows they provide (Dodd 1995). In addition tothese species of concern, an additional 36 mammalian and 86 avianspecies have been documented as relying on this ecosystem(Engstrom 1993). These species include southeastern pocket go-pher (Geomys pinetis), southeastern fox squirrel (Sciurus niger),and Brown-headed Nuthatch (Sitta pusilla) (Engstrom 1993).
Effect of Vegetation Structural Informationon Vertebrate ModelsIf the structural information for pine classes were applied to thedistribution model of RCW in Mississippi, we can reduce the po-tential overestimation of currently available pine habitat by 940,000ha simply by eliminating recently harvested pine areas and denseyoung stands. Similarly, if medium-density pine proves to be un-suitable habitat for these species as well, we can reduce the avail-able habitat statewide by an additional 1.7 million ha (Figure 1).This revised estimation of currently available habitat can have sig-
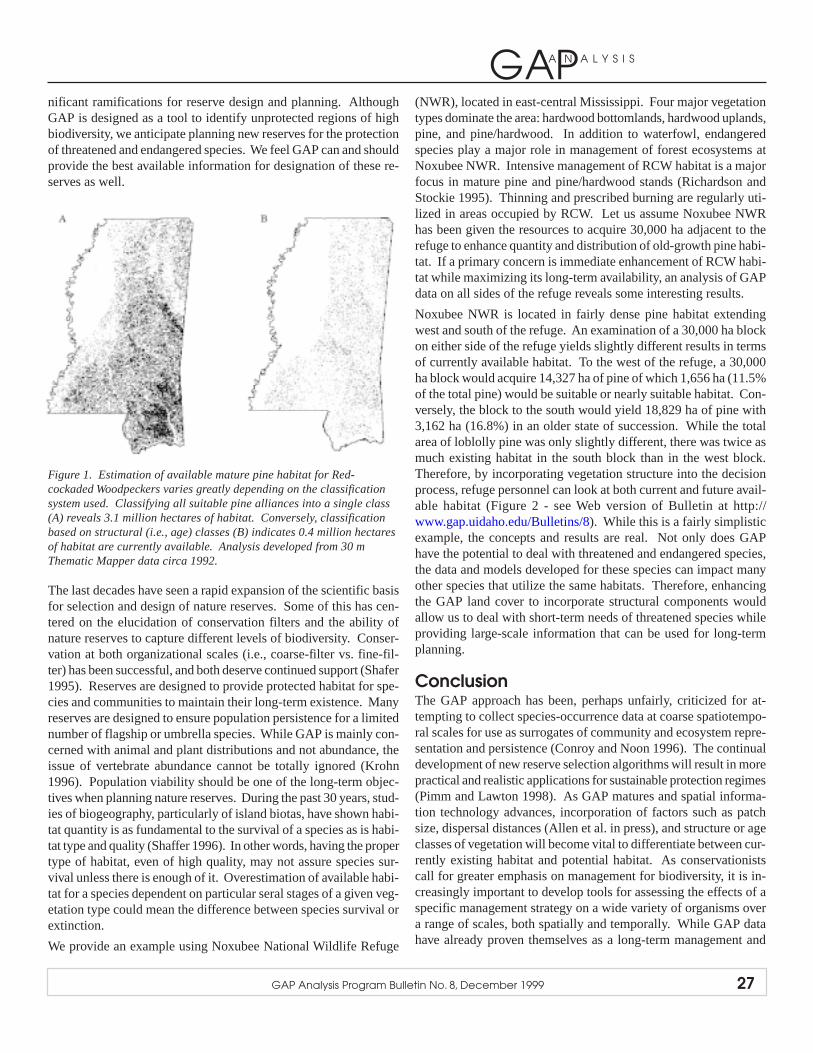
GAPA N A L Y S I S
GAP Analysis Program Bulletin No. 8, December 1999 27
nificant ramifications for reserve design and planning. AlthoughGAP is designed as a tool to identify unprotected regions of highbiodiversity, we anticipate planning new reserves for the protectionof threatened and endangered species. We feel GAP can and shouldprovide the best available information for designation of these re-serves as well.
Figure 1. Estimation of available mature pine habitat for Red-cockaded Woodpeckers varies greatly depending on the classificationsystem used. Classifying all suitable pine alliances into a single class(A) reveals 3.1 million hectares of habitat. Conversely, classificationbased on structural (i.e., age) classes (B) indicates 0.4 million hectaresof habitat are currently available. Analysis developed from 30 mThematic Mapper data circa 1992.
The last decades have seen a rapid expansion of the scientific basisfor selection and design of nature reserves. Some of this has cen-tered on the elucidation of conservation filters and the ability ofnature reserves to capture different levels of biodiversity. Conser-vation at both organizational scales (i.e., coarse-filter vs. fine-fil-ter) has been successful, and both deserve continued support (Shafer1995). Reserves are designed to provide protected habitat for spe-cies and communities to maintain their long-term existence. Manyreserves are designed to ensure population persistence for a limitednumber of flagship or umbrella species. While GAP is mainly con-cerned with animal and plant distributions and not abundance, theissue of vertebrate abundance cannot be totally ignored (Krohn1996). Population viability should be one of the long-term objec-tives when planning nature reserves. During the past 30 years, stud-ies of biogeography, particularly of island biotas, have shown habi-tat quantity is as fundamental to the survival of a species as is habi-tat type and quality (Shaffer 1996). In other words, having the propertype of habitat, even of high quality, may not assure species sur-vival unless there is enough of it. Overestimation of available habi-tat for a species dependent on particular seral stages of a given veg-etation type could mean the difference between species survival orextinction.
We provide an example using Noxubee National Wildlife Refuge
(NWR), located in east-central Mississippi. Four major vegetationtypes dominate the area: hardwood bottomlands, hardwood uplands,pine, and pine/hardwood. In addition to waterfowl, endangeredspecies play a major role in management of forest ecosystems atNoxubee NWR. Intensive management of RCW habitat is a majorfocus in mature pine and pine/hardwood stands (Richardson andStockie 1995). Thinning and prescribed burning are regularly uti-lized in areas occupied by RCW. Let us assume Noxubee NWRhas been given the resources to acquire 30,000 ha adjacent to therefuge to enhance quantity and distribution of old-growth pine habi-tat. If a primary concern is immediate enhancement of RCW habi-tat while maximizing its long-term availability, an analysis of GAPdata on all sides of the refuge reveals some interesting results.
Noxubee NWR is located in fairly dense pine habitat extendingwest and south of the refuge. An examination of a 30,000 ha blockon either side of the refuge yields slightly different results in termsof currently available habitat. To the west of the refuge, a 30,000ha block would acquire 14,327 ha of pine of which 1,656 ha (11.5%of the total pine) would be suitable or nearly suitable habitat. Con-versely, the block to the south would yield 18,829 ha of pine with3,162 ha (16.8%) in an older state of succession. While the totalarea of loblolly pine was only slightly different, there was twice asmuch existing habitat in the south block than in the west block.Therefore, by incorporating vegetation structure into the decisionprocess, refuge personnel can look at both current and future avail-able habitat (Figure 2 - see Web version of Bulletin at http://www.gap.uidaho.edu/Bulletins/8). While this is a fairly simplisticexample, the concepts and results are real. Not only does GAPhave the potential to deal with threatened and endangered species,the data and models developed for these species can impact manyother species that utilize the same habitats. Therefore, enhancingthe GAP land cover to incorporate structural components wouldallow us to deal with short-term needs of threatened species whileproviding large-scale information that can be used for long-termplanning.
ConclusionThe GAP approach has been, perhaps unfairly, criticized for at-tempting to collect species-occurrence data at coarse spatiotempo-ral scales for use as surrogates of community and ecosystem repre-sentation and persistence (Conroy and Noon 1996). The continualdevelopment of new reserve selection algorithms will result in morepractical and realistic applications for sustainable protection regimes(Pimm and Lawton 1998). As GAP matures and spatial informa-tion technology advances, incorporation of factors such as patchsize, dispersal distances (Allen et al. in press), and structure or ageclasses of vegetation will become vital to differentiate between cur-rently existing habitat and potential habitat. As conservationistscall for greater emphasis on management for biodiversity, it is in-creasingly important to develop tools for assessing the effects of aspecific management strategy on a wide variety of organisms overa range of scales, both spatially and temporally. While GAP datahave already proven themselves as a long-term management and

GAPA N A L Y S I S
28 GAP Analysis Program Bulletin No. 8, December 1999
planning tool (Prendergast et al. 1998), we believe the future of gapanalysis lies far beyond a mere complement to single-species man-agement.
Literature CitedAllen, C., L. Pearlstine, and W. Kitchens. In press. Modeling
viable mammal populations in gap analyses. Biological Con-servation.
Batten, S.D. 1998. A procedure for creation of a land use/landcover map of Mississippi. M.S. Thesis, Mississippi State Uni-versity. 84 pp.
Csuti, B. 1996. Mapping animal distribution areas for gap analy-sis. Pages 135-145 in J.M. Scott, T.H. Tear, and F.W. Davis,editors. Gap analysis: A landscape approach to biodiversity plan-ning. American Society for Photogrammetry and Remote Sens-ing, Bethesda, Maryland.
Csuti, B., and P.J. Crist. 1996. Methods for developing terrestrialvertebrate distribution maps for Gap Analysis. A handbook forconducting Gap Analysis. USGS Gap Analysis Program, Mos-cow, Idaho. http://www.gap.uidaho.edu/handbook/VertebrateDistributionModeling. Version 2, March 12, 1998.
Conroy, M., and B.R. Noon. 1996. Mapping of species richnessfor conservation of biological diversity: Conceptual and meth-odological issues. Ecological Applications 6:763-773.
Dodd, C.K. 1995. Reptiles and amphibians in the endangeredlongleaf pine ecosystem. Pages 129-131 in E.T. LaRoe, G.S.Farris, C.E. Puckett, P.D. Doran, and M.J. Mac, editors. Ourliving resources: A report to the nation on the distribution, abun-dance, and health of U.S. plants, animals and ecosystems. Na-tional Biological Service, Department of the Interior. Washing-ton, D.C.
Edwards, T.C., Jr., C.G. Homer, S.D. Bassett, A. Falconer, R.D.Ramsey, and D.W. Wight. 1995. Utah gap analysis: An envi-ronmental information system. Final Project Report 95-1. UtahCooperative Fish and Wildlife Research Unit, Logan, Utah.
Engstrom, R.T. 1993. Characteristic mammals and birds oflongleaf pine forests. Pages 127-138 in S.M. Hermann, editor.Proceedings of the Tall Timbers Fire Ecology Conference No.18: The longleaf pine ecosystem: ecology, restoration, and man-agement.
Grinnell, J. 1917. The niche-relationships of the Californiathrasher. Auk 34:427-433.
Hooper, R.G., A.F. Robinson, Jr., and J.A. Jackson. 1980. TheRed-cockaded Woodpecker: Notes on life history and manage-ment. General Report SA-GR 9, USDA Forest Service, Atlanta,Georgia. 8 pp.
Krohn, W.B. 1996. Predicted vertebrate distributions from gapanalysis: Considerations in the design of statewide accuracy as-sessments. Pages 147-162 in J.M. Scott, T.H. Tear, and F.W.Davis, editors. Gap analysis: A landscape approach to
biodiversity planning. American Society for Photogrammetryand Remote Sensing, Bethesda, Maryland.
Ligon, J.D. 1971. Behavior and breeding biology of the Red-cockaded Woodpecker. Auk 87:255-278.
MacArthur, R.H. and MacArthur, J.W. 1961. On bird species di-versity. Ecology 42:594-598.
Mattson, D.J. 1996. Modeling grizzly bear habitat suitability inIdaho. Gap Analysis Bulletin 5:18-19.
McKerrow, A. 1997. North Carolina status report. Gap AnalysisBulletin 6:50-51.
Pimm, S.L., and J.H. Lawton. 1998. Planning for biodiversity.Science 279:2068-2069.
Prendergast, J.R., R.M. Quinn, and J.H. Lawton. 1998. The gapsbetween theory and practice in selecting nature reserves. Con-servation Biology 13:484-492.
Richardson, D.M., and J. Stockie. 1995. Response of a smallRed-cockaded Woodpecker population to intensive managementat Noxubee National Wildlife Refuge. Pages 98-105 in D.L.Kulhavy, R.G. Hooper, and R. Costa, editors. Red-cockadedWoodpecker: Recovery, ecology, and management. Center forApplied Studies in Forestry, College of Forestry, Stephen F.Austin State University, Nacogdoches, Texas.
Shafer, C.L. 1995. Values and shortcomings of small reserves.BioScience 45(2):80-88.
Shaffer, M. 1996. The promise of gap analysis for understandingbiodiversity. Pages 3-5 in J.M. Scott, T.H. Tear, and F.W. Davis,editors. Gap analysis: A landscape approach to biodiversity plan-ning. American Society for Photogrammetry and Remote Sens-ing, Bethesda, Maryland.
Smith, K.G., and D.G. Catanzaro. 1996. Predicting vertebratedistributions for gap analysis: Potential problems in construct-ing the models. Pages 163-169 in J.M. Scott, T.H. Tear, andF.W. Davis, editors. Gap analysis: A landscape approach tobiodiversity planning. American Society for Photogrammetryand Remote Sensing, Bethesda, Maryland.
Schwartz, M.W. 1999. Choosing the appropriate scale of reservesfor conservation. Annual Review of Ecology and Systematics30:83-108.
Thomas, J.W. 1979. Wildlife habitats in managed forests: TheBlue Mountains of Oregon and Washington. Agricultural Hand-book No. 553. U.S. Forest Service, Washington, D.C. 512 pp.
Udvardy, M.D.F. 1969. Dynamic zoogeography. Van NostrandReinhold Co., New York. 445 pp.
Wahlberg, N., A. Moilanen, and I. Hanski. 1996. Predicting theoccurrence of endangered species in fragmented landscapes.Science 273:1536-1555.

GAPA N A L Y S I S
GAP Analysis Program Bulletin No. 8, December 1999 29
Figure 1. Sportsman’s Atlas view of Deuel County in eastern SouthDakota containing primary and secondary roads, hexagon boundaries,and state and federally owned lands.
EMAP Hexagon Coverage Included in SouthDakota’s Sportsman’s Atlas
VICKIE J. SMITH, CHAD J. KOPPLIN, AND JONATHAN A. JENKS
Wildlife and Fisheries Sciences, South Dakota State University,Brookings
Throughout the South Dakota Gap Analysis Project (SD-GAP), wehave been working with state agencies to provide opportunities foroutreach. Because of a lack of locational data for vertebrates inSouth Dakota, small mammals were sampled throughout the stateduring the summer of 1998 based on the EMAP hexagon grid. Twosites were sampled within each hexagon to obtain presence or ab-sence information for small mammals in that particular hexagon.To coordinate the trapping effort, an ARC/INFO Macro Language(AML) program was created to build county-based maps contain-ing all county roads (primary roads were separated from secondaryroads) and the hexagonal grid, including the hexagon number forreference. Towns could easily be identified from concentrations ofroads.
In an effort to maintain locational databases of various terrestrialvertebrate species, SD-GAP and the South Dakota Department ofGame, Fish and Parks (GF&P) have agreed to include the EMAPhexagonal grid in the next printing of the Sportsman’s Atlas (Fig-ure 1). This atlas is a guide to recreational public lands, includingWaterfowl Production Areas (U.S. Fish and Wildlife Service own-ership), Game Production Areas (South Dakota GF&P ownership),State Parks and Recreation Areas, Federal Recreation Areas, andWater Access Areas (federal- and state-owned). The atlas is acounty-based guide, covering the entire state. Nearly 1,000 copiesof the atlas could be produced specifically for managers. Atlasesare printed as needed and can be purchased through South DakotaGF&P in Pierre, South Dakota.
The EMAP hexagonal grid will allow managers to report observedspecies to the SD-GAP office by hexagon number, reducing theamount of time needed to add new sightings to the locational data-base. This atlas will provide a cost-effective, efficient method forgathering information on vertebrate locations, increase awarenessof the public about GAP, and solicit participation in the upkeep ofthe distributional database for future modeling and distributionmapping efforts.
For more information about the AML used to create the county-based hexagonal maps, please contact Vickie Smith at the SD-GAPoffice at (605) 688-5124 or by e-mail at [email protected] AML may be downloaded from our FTP site at wfs.sdstate.edu.When you obtain the AML, feel free to make changes to the pro-gram to fit your state and your purposes. After making changes,please send updates to [email protected].

GAPA N A L Y S I S
30 GAP Analysis Program Bulletin No. 8, December 1999
STEWARDSHIP AND ANALYSIS
Kansas GAP: Preparing the Stewardship LayerAcquisition and Compilation ofManaged-Area BoundariesOne of the most comprehensive sources of managed-area data inKansas was the Natural Heritage Inventory Program (NHIP) ad-ministered through the Kansas Biological Survey (KBS). This in-ventory became the core set of data from which much of the Kan-sas GAP stewardship layer was derived. The inventory containedowner and manager data, protection status designation, and 1:24,000base maps of the managed areas.
The maps provided by NHIP were largely hand-drawn boundariesplaced onto USGS 1:24,000 topographic maps and based on bound-aries described either in map form or by legal description. Theboundary maps were transferred to Mylar and scanned. The rasterimages were converted to vector form using Scorpion SRV-386 andAutoCAD software. After adding neatline and tic locations inAutoCAD, the files were converted into ARC/INFO coverages andmapjoined. Each coverage was then transformed and projected toa Universal Transverse Mercator (UTM) projection. This transfor-mation allowed for the creation of the base set of managed-areaboundaries for Kansas.
Once the initial coverage was created, the boundary areas weremodified to reflect real-world boundaries. This was accomplishedusing 1:24,000 Digital Orthophoto Quarter Quads (DOQQs).DOQQs have a one-meter ground resolution and are useful for re-vising coverages generated from both Digital Line Graphs and to-pographic maps (DASC 1991). Used as a backcoverage, theorthophotos allowed the originally hand-copied boundaries to beadjusted to match the real-world roadways, fence lines, and waterbodies that they were representing. The DOQQs greatly enhancethe accuracy of the boundary information. Other researchers haveused orthophotos for delimiting natural-area boundaries (Welch etal. 1995). Additional checks and improvements to boundary infor-mation are incorporated as more accurate information becomesavailable.
Collecting Attribute DataThe attribute data required by GAP include owner, manager, andprotection status information. GISSAL has expanded these attributesto include a second owner category, county of location, and acre-age per management status. The second owner category allows usto acknowledge areas that are co-owned such as the Konza PrairieResearch Natural Area of which 89% is owned by The Nature Con-servancy and 11% by Kansas State University (TNC 1998). The
HOLLY BARCUS, JENNIFER RADCLIFF, AND RAJESH POUDYAL
Department of Geography, Kansas State University, Manhattan
With the objective of identifying gaps in biological diversity, theNational Gap Analysis Program (GAP) maps managed areas, landcover, and vertebrate species distribution. The development of aspatial inventory of managed areas, collectively called the steward-ship layer, is critical to meeting this objective. For the Kansas GAPproject, the stewardship layer was developed using a GeographicInformation System (GIS). This article outlines the process andsome of the challenges in developing such an inventory in Kansas.
The development of the stewardship layer was begun by the Geo-graphic Information System Spatial Analysis Laboratory (GISSAL)at Kansas State University in 1995. Creating a stewardship layer isa conceptually straightforward process consisting of essentially threebasic steps (summarized from Crist 1998):
1) Identification of all managed areas
2) Acquisition and compilation of managed-area boundaries andsubunits
3) Collection of attribute data
GISSAL researchers were able to initially identify 258 managed-area units in Kansas. Of these areas, 210 were both larger than the40-acre minimum mapping unit (MMU) established by NationalGAP and had accessible and usable boundary information.
Identifying Managed Areas in KansasMultiple sources were consulted in order to create a comprehen-sive list of managed areas in Kansas. In addition to contributionsmade by Kansas GAP partners, phone books from the local libraryand the Kansas Atlas and Gazetteer were useful sources. An ex-haustive Internet search completed our initial investigation.
Other sources of potential data include Digital Line Graphs (DLG)produced by the USGS at 1:100,000 scale and protected-area bound-aries developed by the World Conservation Monitoring Centre(WCMC) in Cambridge, U.K. (Beardsley and Stoms 1993). TheDLGs include administrative boundaries of national parks, forests,wilderness areas, and Native American reservations. The WCMCboundaries are being digitized into ARC/INFO and include world-wide protected areas at a MMU of 5,000 ha and at a scale of1:1,000,000. These last two sources were not used in the KansasGAP stewardship layer because of the availability of the KansasNational Heritage Inventory Program maps.
GAPA N A L Y S I S
GAP Analysis Program Bulletin No. 8, December 1999 31
county of location and acreage per management status variablesallow us to categorize the managed areas by county or other man-agement regions.
Collecting the attribute data is an ongoing challenge. The NHIPdata set includes a protection status ranking and owner and man-ager information for most areas. For other areas, the information isoften kept by individual managers and is not available from a cen-tralized source. Collecting information entails contacting individualmanagers and translating management status categories used by thedifferent agencies into the four GAP management categories. Co-ordination and communication are key aspects of accomplishingthis task.
Finally, changes to management and protection status are oftendynamic, and keeping tabs on changes is important. All changesaffect the stewardship layer, and developing a procedure for main-taining the integrity of the database over time is a key element inestablishing the GAP stewardship layer as a reliable resource.
Creative Problem Solving: A FewExamplesAt each stage of the development process, challenges were encoun-tered. In addition to the problems already discussed, two otherswarrant further attention. First, assessing map quality from differ-ent sources can be a significant obstacle. Most managed areas havesome type of boundary delineation; however, it may vary from le-gal boundaries described in text to generalized, hand-drawn bound-aries. Each source has its own set of problems. Kansas GAP haschosen to use only boundaries for which maps are available at the1:24,000 scale and can be delimited on USGS topographic maps.This allows us to maintain a particular level of accuracy and reli-ability for the stewardship layer. The ability to rectify these bound-aries to the 1:24,000 DOQQs also significantly improves our confi-dence in the data set.
A point coverage has been created for those areas for which accept-able maps are not available. This point coverage allows attributedata to be collected for these areas. Attribute data include the sizeof the area as well as ownership, management, and protection sta-tus information. GISSAL also offers agencies partnership oppor-tunities to develop GIS databases for managed areas. KDWP, forexample, has partnered with GISSAL to develop databases for wild-life refuges. Part of the development of these databases includescreating an accurate boundary layer. Both KDWP and Kansas GAPbenefit from this endeavor.
A second significant challenge is maintaining an up-to-date data-base of attribute information. GISSAL is developing an Accessdatabase that includes key contact persons, managed-area informa-tion, dates of data acquisition, protection status by both KBS andGAP standards, and other pertinent information provided by GAPpartners. In addition, all data can be related back to the steward-ship coverage through ARC/INFO-generated managed-area id num-bers. Converting the coverage to a shapefile allows the .dbf file tobe opened in Excel. The attribute data can then be manipulated
using either Excel or Access and reattached to the main steward-ship coverage. The ability to move data seamlessly through theseprograms greatly enhances the potential uses of the stewardshipcoverage.
The above problems are representative of other challenges for whichunique and creative solutions are necessary in order to completeand maintain a statewide stewardship layer. Kansas GAP is stilldeveloping its database of managed areas and seeking new ways toenhance the usability and reliability of the data.
ConclusionDeveloping a comprehensive spatial database at the state level pre-sents challenges for both spatial and tabular data acquisition andintegration. This article outlined the basic process being utilizedby Kansas GAP to develop a stewardship layer. Integrating thestewardship layer with land cover and species habitat models is thenext step toward completing a spatial database and delimiting gapsin habitat protection.
Literature CitedBeardsley, K., and D. Stoms. 1993. Compiling a digital map of
areas managed for biodiversity in California. Natural AreasJournal 13:177-190.
Crist, P.J. 1998. Mapping and categorizing land stewardship. AHandbook for Conducting Gap Analysis, National Gap Analy-sis Program, Moscow, Idaho.
Data Access and Support Center (DASC). 1991. Orthophotos.http://gisdasc.kgs.ukans.edu/dasc/metadata/ortho.html.
The Nature Conservancy (Kansas Chapter Staff). 1998. KonzaPrairie Research Natural Area. http://www.tnc.org.
Welch, R., M. Remillard, and R.F. Doren. 1995. GIS databasedevelopment for South Florida’s national parks and preserves.Photogrammetric Engineering & Remote Sensing 61:1371-1381.

GAPA N A L Y S I S
32 GAP Analysis Program Bulletin No. 8, December 1999
AQUATIC GAP
Status Report: The Missouri Aquatic GAPPilot Project
we needed to place our similarity coefficients in a broader context.For instance, using fish data alone, Jacaard similarity coefficientsamong the 66 8-digit HUs that cover Missouri ranged from around0.2 to 1.0. Obviously, HUs that contain all of the same species (i.e.,similarity coefficient = 1.0) should be combined into a single unit.However, what about HUs that have similarity coefficients of 0.9,0.8, 0.7, or even 0.6? To answer this question we need to under-stand the range of similarities and the average similarity amongHUs across the nation. This will allow us to generate statisticalcriteria for identifying HUs with relatively similar aquatic commu-nities and ultimately produce a national coverage of major drain-ages that harbor relatively distinct communities. We will then in-tersect this “major drainage” coverage with the national coverageof Ecological Sections to generate a final coverage of freshwaterbiogeographic units.
We hope to have the national coverage completed by January 2001.However, before we can begin generating a national coverage offreshwater biogeographic units, the fish database has to go throughan expert review, which could take six months or more.
Defining and Mapping Valley SegmentTypesValley segment types are distinct hydrogeomorphic units. Eachvalley segment type will be relatively homogeneous with respect toenergy and nutrient dynamics, flow regime, physical habitat, andposition within the drainage network. These valley segment typesare the lotic counterparts of wetland types and are used in the samemanner that the vegetation classes are used to carry out assessmentsin the terrestrial component of GAP. Our effort to classify streamnetworks into distinct valley segment types largely follows TheNature Conservancy’s Aquatic Community Classification Frame-work (Lammert et al. 1997).
To date we have identified the list of classification variables thatwill be used to delineate valley segment types and have obtainedthe necessary digital data layers that will be used in the classifica-tion process. In December 1999 we finally worked out the manytechnical details of developing this data layer and have completedthe classification process for two 8-digit HUs, the Meramec andCurrent River basins. It is truly exciting to see the end product ofthis classification process. The final digital maps provide us with a
SCOTT P. SOWA
Missouri Resource Assessment Partnership, Columbia, Missouri
Over the last year, significant progress has been made on all of ourmajor objectives. We are on schedule to complete our pilot projectby the contract deadline of September 2001. This project is by farthe most difficult but most rewarding project I have worked on. Ithas forced all of us working on this project to think outside thetypical stream resource management “box,” to educate ourselves inareas unfamiliar to most stream resource professionals, to put newmeaning into the words “agency cooperation,” and to overcome tech-nical challenges that have opened the doors to a new age of aquaticresource conservation. Below is a brief update on the progress wehave made on four major tasks of the project.
Defining and Mapping Assessment UnitsMeasures of species diversity must be expressed relative to biogeo-graphic units of a determined spatial scale if they are to be mean-ingful (Levin 1981). We are currently working with The NatureConservancy to generate a national map of biogeographic units thatcircumscribe relatively distinct freshwater communities. Empiri-cal evidence has shown that both major drainages and ecoregionsdescribe a significant amount of the variation in aquatic communi-ties (Pflieger 1989; Angermeier and Winston 1999; Rabeni andDoisy, in press). Consequently, these biogeographic units will con-sist of major drainages (yet to be delineated) stratified by ecoregions(likely Bailey’s Ecological Sections; Bailey 1995). We are assum-ing that these biogeographic units serve as “ecological and evolu-tionary units” with distinct genetic histories and thus serve as mean-ingful units for partitioning environmental, life history, and geneticvariation in populations and species that have yet to be discoveredthrough intense phylogenetic, life history, and habitat requirementresearch. This national map will hopefully serve as a standardizedbase coverage of freshwater assessment and planning units for theaquatic component of GAP, which can be refined by individual statesthrough expert review.
To build this coverage we will be using a national fish database(and possibly other taxa) to calculate similarity coefficients for eachpair of 4, 6, and/or 8-digit Hydrologic Units (HUs) and also to ex-amine levels of endemism within each of these units. While tryingto complete this same task for Missouri, we quickly realized that

GAPA N A L Y S I S
GAP Analysis Program Bulletin No. 8, December 1999 33
view of these watersheds unlike anyone else has ever seen (Figure1 - see Web version of Bulletin at http://www.gap.uidaho.edu/Bul-letins/8); a continuous stream network broken down into distinctpatches much like viewing a digital image of vegetation alliancesfor an entire ecoregion. We anticipate having a statewide 1:100,000valley segment coverage completed in the next 12 months.
One major unresolved issue is that at the scale of 1:100,000, head-water valley segment types are grossly underrepresented. Currently,we are working with two 1:24,000 digital stream networks. Whileworking with these higher-resolution networks, it has become ap-parent that there is no way to effectively deal with this problemexcept for actually developing the valley segment layer at 1:24,000instead of the coarser 1:100,000. Unfortunately, 1:24,000 digitalhydrography for Missouri will not be completed for another twoyears, and for most other states the waiting period will be evenlonger. The ramifications of this problem are that a) very uniqueheadwater valley segment types will not even be identified, and b)very common headwater valley segment types will be identified asrare and underrepresented in our current network of conservationlands. At a scale of 1:100,000, the only way around these problemsis to remain conscious of their existence and somehow factor thisunderstanding into your conservation assessment.
Mapping Known DistributionsThe community-sampling databases used in generating statewideknown distributions are nearing completion. The fish, mussel, andcrayfish databases have been populated, and each sampling loca-tion has been linked to the Environmental Protection Agency’s RiverReach Files. We also identified the ecological section, subsection,land type association, and the 8-, 11-, and 14-digit HUs in whicheach sample was located. This leaves the snail database as the onlyone yet to be completed.
The fish database contains 3,719 community fish samples that werecollected from 2,484 different stream reaches for a total of 63,166species occurrence records. The mussel database contains 1,156community mussel samples that were collected from 814 differentstream reaches for a total of 12,604 species occurrence records.The crayfish database contains 949 community crayfish samplesthat were collected from 793 different stream reaches for a total of1,855 species occurrence records.
We are using the USGS/Natural Resources Conservation Service(NRCS) Hydrologic Units to generate our statewide distributionmaps. To minimize errors of commission and omission we are spe-cifically using 11-digit HUs for widely distributed species and thesmaller 14-digit HUs for narrowly distributed species. We havefinished developing the preliminary statewide distribution maps foreach fish, mussel, and crayfish species (Figure 2 - see Web versionof Bulletin at http://www.gap.uidaho.edu/Bulletins/8). These mapsare then sent out for professional review. Professional review ofthe fish distribution maps has been completed, and we are currentlyincorporating the revisions into our sampling database and our fi-nal distribution maps. The mussel and crayfish maps are still out
for professional review.
It appears that adequate statewide sampling data exist to generatedetailed (i.e., using 11- or 14-digit HUs) statewide distribution mapsfor both fish and crayfish. Unfortunately, sampling data for mus-sels and snails are much more clumped, with numerous samples incertain 11-digit HUs and only a handful or no samples in others.Because of this clumped sampling distribution, it is likely that thefinal known distribution maps for most mussel and snail specieswill have to be represented at a coarser resolution (perhaps 8-digitHU).
Developing Habitat-Affinity ModelsOur habitat-affinity models are used in conjunction with the valleysegment coverage and the statewide known distributions to predictthe potential species composition of each individual valley segmentin the state. This is analogous to predicting all of the species likelyto inhabit each grid cell in a statewide land cover data layer. Amajor difference is that we have no way of determining the envi-ronmental quality of every single valley segment. For instance, avalley segment could be of the right size, temperature, gradient,and flow for a particular species yet have serious water quality prob-lems that make the environment unsuitable for that species. Conse-quently, our predictions reflect potential species composition un-der pristine conditions as with GAP’s terrestrial vertebrate distribu-tions.
To develop our models we are conducting extensive literature re-views to find habitat-affinity information for each fish, mussel, cray-fish, and snail species found in Missouri (368 total species). Wehave completed the initial literature review for each species in allfour taxonomic groups. More intensive reviews have been com-pleted for both fish and mussels. We have also completed the firstdraft of the habitat-affinity database for fish.
In conducting the literature reviews, two major problems have beenidentified. First, there is simply a lack of habitat-affinity informa-tion for several species. This problem is most prevalent for mus-sels, crayfish, and snails but also exists for several nongame fishspecies. There is an obvious need for increased emphasis on, andfunding for, basic life-history research of freshwater biota. Thesecond problem is that much of the habitat-affinity information thatdoes exist is at the “microhabitat” scale. That is, most research onthe habitat requirements of aquatic species has identified the rangeof depths, velocities, and substrates utilized by a particular species.This would be analogous to research that documents if a bird spe-cies is primarily a ground-dwelling species or utilizes the lower,middle, or upper forest canopy without documenting the particularforest types it inhabits. Such microhabitat data are useful for pre-dicting the distribution of an organism within a particular streamsegment but not the actual stream segments it is likely to inhabit.What we need is substantially more habitat-affinity research atbroader spatial scales that identifies associations between the pres-ence of a species and factors such as stream size, temperature, el-evation, permanence of flow, local and basinwide geology, soils,

GAPA N A L Y S I S
34 GAP Analysis Program Bulletin No. 8, December 1999
and gradient.
For more detailed information on the Missouri Aquatic GAP PilotProject contact:
Scott P. Sowa, Aquatic Resource CoordinatorMoRAP4200 New Haven RoadColumbia, MO 65201573-875-5399 ext. [email protected]
Literature CitedAngermeier, P.L., and M.R. Winston. 1999. Characterizing fish
community diversity across Virginia landscapes: Prerequisite forconservation. Ecological Applications 9(1): 335-349.
Bailey, R.G. 1995. Description of the ecoregions of the UnitedStates. Second edition. U.S. Forest Service, Miscellaneous Pub-lication No. 1391. Washington, D.C.
Lammert, M., J. Higgins, D. Grossman, and M. Bryer 1997. Aclassification framework for freshwater communities: Proceed-ings of The Nature Conservancy’s Aquatic Community Classi-fication Workshop; New Haven, Missouri; April 9-11, 1996. TheNature Conservancy, Arlington, Virginia.
Levin, S.A. 1981. The problem of pattern and scale in ecology.Ecology 73:1942-1968.
Pflieger, W.L. 1989. Aquatic community classification systemfor Missouri. Missouri Department of Conservation, AquaticSeries No. 19. Jefferson City, Missouri.
Rabeni, C.F., and K E. Doisy. In press. The correspondence ofstream benthic invertebrate communities to regional classifica-tion schemes of Missouri. Journal of the North AmericanBenthological Society.
Landscape-Level Mapping of Fish forPennsylvania Gap Analysis
WAYNE MYERS, DAVID ARGENT, JOSEPH BISHOP, JAY STAUFFER,JR., AND ROBERT CARLINE
Pennsylvania State University, University Park, Pennsylvania
As many species living in streams and rivers of Pennsylvania areimperiled, our gap analysis commitment included a landscape-levelconsideration of fish fauna. Our primary concern has been to as-cribe fish habitat to sectors of landscapes that are large enough tobe evident in regional mapping but small enough to inform envi-ronmental and conservation analyses across landscapes. In light ofexploratory work in New York and Missouri, we considered streamreaches to be inappropriately fine scale with respect to both map-ping and effort. Other research work originally conducted for pur-poses of hydrology and fisheries provided a basis upon which tobuild habitat models at somewhat coarser scale for Pennsylvania.
Small watersheds constitute a next level of scale above streamreaches that can serve for purposes of landscape segmentation rel-evant to both hydrology and aquatic organisms. Small watershedsserve the purpose of associating aquatic habitat with portions of thelandscape having most direct influence. Small watersheds also havethe advantage of being mappable as area features rather than linearfeatures, thus providing a tessellation. It has been fortuitous in Penn-sylvania that the Water Resources Division of the U.S. GeologicalSurvey undertook to digitize watersheds of all named streams withinmajor river basins in the region. These data for the basins wereintegrated and harmonized in the Office for Remote Sensing of Earth
Resources (ORSER) of the Environmental Resources Research In-stitute (ERRI) at Penn State University with funding provided bythe Pennsylvania Department of Environmental Protection. Somefurther editing was required for purposes of gap analysis, mostly toresolve issues along the borders of the state. Our final version ofthis layer consists of 9,855 polygon units representing the respec-tive small watersheds.
Geomorphology controls development of drainage networks andcharacter of streams, with influence extending also to physical prop-erties (e.g., turbidity) and chemical properties of water. In order tocapture such differentiation of streams because of geomorphology,a layer of physiographic provinces and sections was overlaid toassign each small watershed as one of 16 physiographic sections.In Pennsylvania, these sections correspond to subregions of the in-teragency ECOMAP effort.
Drainage divides constitute zoogeographic barriers to movementof organisms that are wholly aquatic. The segregating effect of adrainage divide depends on the instream linkage and whether down-stream or upstream passage would traverse inhospitable conditionsfor a particular species. Collection records in Pennsylvania estab-lish that major drainage basins are effectively separate domains forat least some species. It was decided in this regard to recognizeeight basin partitions: Erie, Allegheny, Ohio, Monongahela,Susquehanna, Delaware, Potomac, and Genesee. Accordingly, eachsmall watershed was assigned one of these basin designations as anattribute.

GAPA N A L Y S I S
GAP Analysis Program Bulletin No. 8, December 1999 35
Stream order can serve as a surrogate for stream size, which re-flects macrohabitat for fish species. A special geographic informa-tion resource for Pennsylvania is a digital file of all blueline streams.This file originated with digitizing by the Pennsylvania Departmentof Transportation, but extensive editing and topological adjustmentwas performed by ORSER at Penn State University. The streamfile was displayed over the small watersheds, and each watershedwas interpretively assigned to one of four size classes. First-order(headwater) and second-order streams comprise a small-streamclass. Third- and fourth-order streams comprise a medium-sizeclass. Fifth- and sixth-order streams constitute a large-size class.Seventh- and eight-order streams are combined with lakes as thefourth size class.
A digital elevation model was used to calculate the median slopefor each small watershed, with coding in three classes: low (<1%),medium (1% to 3%), and high (>3%). This variable serves to sepa-rate fish habitat along the longitudinal axis of a stream, as somefishes occupy streams of low gradient whereas others prefer highergradients. Low-gradient streams typically have sand, silt, and claysubstrates. High-gradient streams typically have cobble, boulder,and rock substrates. Medium-gradient streams often have a hetero-geneous mix of substrate types.
A land cover layer was used to assign a human disturbance class
for each small watershed. Human disturbance was considered tobe nonforest area because of agriculture and/or development. Per-centage of such area in a watershed determined its disturbance classas follows: low (<25%), medium (25% to 75%), and high (>75%).This variable provides an indication of microhabitat diversity aswell as allowing for consideration of tolerance to human-inducedlandscape influences.
Each class for a variable was cast as a separate field (column) in aspreadsheet for habitat modeling. Models were developed as a pro-file for each species (row) in terms of these fields. Basin and physi-ographic fields were coded as either 1 or 0 for presence or absence,respectively. The size, gradient, and disturbance characteristics weredesignated in terms of primary habitat (1), secondary habitat (2), orunsuitable (0). Each fish species was categorized as to its highestfrequency of occurrence for a given stream size, which was desig-nated as primary habitat. If secondary habitat or stream sizes weredetermined, they were added to the profile as situations where thefish may occur but with lower frequency.
A large digital database of fish collection records for Pennsylvaniawas instrumental in developing and validating the profile models.An extra field was added for each of the small watersheds to indi-cate whether it had been sampled. Records from over 20,000 col-lection events from 1950 to 1999 were used in the analysis.
Applying Gap Analysis Towards the Protection ofan Endangered Species of Minnow (Notropis
topeka) in South DakotaSTEVEN S. WALL 1, CARMEN M. BLAUSEY1, JONATHAN A.JENKS1, AND CHARLES R. BERRY, JR.21Department of Wildlife and Fisheries Sciences, South Dakota StateUniversity, Brookings2U.S. Geological Survey, South Dakota Cooperative Research Unit,South Dakota State University, Brookings
IntroductionThe Topeka shiner (Notropis topeka) is a minnow (family Cyprin-idae) found in low-order streams in six Great Plains states (Iowa,Kansas, Minnesota, Missouri, Nebraska, South Dakota). The U.S.Fish and Wildlife Service listed the species as endangered in 1999(Tabor 1998). The species has declined because of habitat deterio-ration and predation by stocked fish.
We are applying GAP procedures (Scott et al. 1993) to aid resourcemanagers in protecting the Topeka shiner. Since the South DakotaGAP project began in 1997, we have completed digital maps ofmammal distributions, land cover (eastern South Dakota), and stew-ardship. We are expanding the GAP study to include aquatic eco-
systems, using the Topeka shiner study as a pilot project. We reporthere our progress after one field season.
The goal of our study is to analyze the habitat at locations wherethe Topeka shiner has been historically found, and use the data topredict river reaches where the species may be present or absent.Specific objectives are to:
1. Measure local habitat and landscape features at Topeka shinersites.
2. Compare Topeka shiner habitat features to maps of these fea-tures available in GIS databases.
3. Conduct fish sampling in areas suggested by mapping.
Life History of the Topeka ShinerThe ecology of the Topeka shiner is not well known. Oldest indi-viduals are usually three years of age and have grown to about 7 cmlong. Topeka shiners prey on benthic invertebrates and spawn oversilt-free substrates in spring. A striking characteristic of the spe-cies is the bright reddish-orange coloration of the breeding male.In South Dakota, the shiner has been found in tributaries of the

GAPA N A L Y S I S
36 GAP Analysis Program Bulletin No. 8, December 1999
James, Vermillion, and Big Sioux rivers east of the Missouri River(Figure 1). Topeka shiners also have been recorded from down-stream portions of tributaries to the Missouri River (e.g., GrandRiver) in western South Dakota (Beckman and Elrod 1971).
Figure 1. Watersheds where Topeka shiners were found during 1999field season.
The preferred habitat of Topeka shiners has not been definitivelydetermined, but the species may prefer prairie streams with goodwater quality (Tabor 1998). Topeka shiners have been found inpool habitats that are maintained by perennial flows or groundwa-ter seepage (Pflieger 1975, Cross and Collins 1995). Stream bot-toms range from silt to cobble (Tabor 1998).
Prairie streams of eastern South Dakota typically have highly vari-able flow rates, and some streams are intermittent (Poff and Ward1989). Fish communities in such streams are largely affected byabiotic factors (Poff and Ward 1989), which may be systemic (e.g.,climate) or local (e.g., channel shape). The methods below de-scribe how we plan to apply GAP procedures, using systemic andlocal variables that affect fish distribution, to determine the habitatrequirements of Topeka shiners and the probable distribution of thespecies.
Methods and ProgressThe study can be divided into two parts (Figure 2). One part in-volves the collection and analysis of field data to measure localhabitat and landscape features at locations where the Topeka shinerhas been recently found (Braaten 1993, Cunningham 1999). Thesecond part involves GIS analysis to predict streams where Topekashiners might be found.
Figure 2. Diagram showing the methods to be used for modeling thedistribution of Topeka shiners.
Field Methodology - A total of 31 historical sites were sampledduring the 1999 field season. At each site physical stream habitat,hydrology, water quality conditions, and landscape features weremeasured (see Simonson et al. 1993 and Platts et al. 1983 for meth-odology). Fish were collected by seining. The abiotic and bioticvariables will be analyzed to determine the habitat affinities andthe fish community associations of the Topeka shiner. A similarstudy was conducted by Matthews (1985) to classify sites inhab-ited by eight common midwestern stream fishes. The habitat af-finities will be incorporated into a model to predict the distributionof Topeka shiners.
We found Topeka shiners at 60% of the historic sites visited in 1999.Sample size of Topeka shiners ranged from 1 to 95 per site. Topekashiners were found with 9 to 17 other fish species (Table 1). Thefish community was dominated by cyprinids (minnows). Red shin-ers and sand shiners were present in large numbers at all sites wherewe found Topeka shiners. Predators were not commonly associ-ated with Topeka shiners, with the exception of orange-spotted sun-fish and green sunfish, which may provide silt-free gravel for To-peka shiner spawning (Pflieger 1975).

GAPA N A L Y S I S
GAP Analysis Program Bulletin No. 8, December 1999 37
GIS Analysis - Field data will be combined with climatic andhydrogeomorphic variables for GIS analysis. The procedures weare using closely follow those proposed by Sowa (1999a) for aquaticgap analysis. The first step involves determining what attributes ordriving variables are most important for shaping the distribution ofaquatic communities (Higgins et al. 1999) in eastern South Dakota.Expert opinion indicated that these variables were hydrology, to-pography, geology, climate, and landscape.
The next step involves identifying an assessment element. The as-sessment element that will be used in our study is valley segmenttype (Sowa 1999a), which will be delineated using The NatureConservancy’s hierarchical classification system (Lammert et al.1996). Valley segment types will be delineated by combining hy-drological, topographical, geological, and climatic variables in aGIS environment to predict the potential biological community ofeach specific stream segment for eastern South Dakota.
Once the valley segment types are delineated, the next step involvesselecting valley segments that might contain suitable Topeka shinerhabitat. A list of habitat affinities for the Topeka shiner will begenerated from the associated attributes found in the field andthrough GIS analysis of valley segments where Topeka shiners arepresent. Valley segments that match the habitat affinities of Topeka
shiners will be queried out and classified as having high, moderate,or low potential for Topeka shiners.
The next step involves determining which of these valley segmentsclassified as potential Topeka shiner habitat are in areas that areconsidered “high quality.” The quality of an area will be deter-mined by comparing landscape features such as land cover, landuse, stewardship, water quality, and physical modifications withvalley segments using GIS analysis (Sowa 1999b).
Future PlansOnce we identify valley segments that might have Topeka shinerhabitat, a field survey will be performed to verify the predictivepower of the model and detect any errors of omission or commis-sion. GIS analysis will continue by comparing the location ofstreams and watersheds that could potentially contain Topeka shin-ers with land stewardship maps to identify any “gaps” in the pro-tection of the shiner.
ConclusionSparse collections of a rare animal can hamper a study, so we werehappy to find that Topeka shiners were fairly common and wide-spread. We expect that applying gap analysis techniques to the
JAMES RIVER BASIN VERMILLION RIVER BASIN BIG SIOUX RIVER BASINMid. Pearl Shue Pearl Enemy Twelve Mile Firesteel W. Fork Vermillion Turkey Ridge Blind Six Mile W. Pipestone Pipestone Split Rock
Topeka shiner x x x x x x x x x x x x xPlains topminnow xBlack bullhead x x x x x x x x x x x xTadpole madtom x x x x x x xChannel catfish x xStonecat xOrange-spotted sunfish x x x x x x x x x x x xGreen sunfish x x x x x x x xLargemouth bass x x xBluegill xBlack crappie xWhite crappie xNorthern pike x x x xBlacknose dace xLongnose dace xJohnny darter x x x x x xBlackside darter xRed shiner x x x x x x x x x x x x xCommon shiner x x x x x x x x x xSand shiner x x x x x x x x x x x x xBigmouth shiner x x x x x x x x x xEmerald shiner xFathead minnow x x x x x x x x x x x xBluntnose minnow x x x xBrassy minnow x x x x x x xPlains minnow xCreek chub x x x x x x x x x x x xWhite sucker x x x x x x x x x x x x xShorthead redhorse x x x xCommon carp x x x x x x x x xRiver carpsucker xCentrall stoneroller x x x x x x x
Table 1. Fish community found in watersheds where Topeka shiners were present.

GAPA N A L Y S I S
38 GAP Analysis Program Bulletin No. 8, December 1999
Topeka shiner data will be fruitful. However, the flat topographyand lack of some basic geologic, hydrologic, and water quality datamay make aquatic gap analysis difficult. Federal and state agen-cies have specific needs that can be met by GAP products. Theidentification of streams and watersheds that contain high-qualityTopeka shiner habitat will help determine critical habitat and fur-ther determine the distribution of the shiner. The recognition of“gaps” in land/water use management will enable agencies to de-cide where best to implement conservation priorities to effectivelyprotect the Topeka shiner. Finally, maps classifying streams as high-,moderate-, or low-quality habitat for Topeka shiners will allowagencies to streamline the endangered species consultation process.
Literature CitedBeckman, L.G., and J.H. Elrod. 1971. Apparent abundance and
distribution of young-of-the-year fishes in Lake Oahe, 1965-1969. Reservoir Fisheries and Limnology. Special PublicationNo. 8 of the American Fisheries Society, pp. 333-347.
Braaten, P.J. 1993. The influence of habitat structure and envi-ronmental variability on habitat use by fish in the VermillionRiver, South Dakota. M.S. Thesis, South Dakota State Univer-sity, Brookings. 99 pp.
Cross, F.B., and J.T. Collins. 1995. Fishes in Kansas. Universityof Kansas Natural History Museum, Educational Series No. 3.315 pp.
Cunningham, G.R. 1999. A survey for the Topeka shiner (Notropistopeka) within the Big Sioux, Vermillion, and James river ba-sins in South Dakota. Eco-Centrics. Omaha, Nebraska. 73 pp.
Higgins, J., M. Lammert, and M. Bryer. 1999. The NatureConservancy’s aquatic community classification framework: TheNature Conservancy Freshwater Initiative, strategy one – aquaticecology. Implementing the Aquatic Component of GAP Analy-sis in Riverine Environments: A Training Workshop, Columbia,Missouri, March 8-10, 1999. Sponsored by The National GapAnalysis Program and hosted by The Missouri Resource As-sessment Partnership in collaboration with The Nature Conser-vancy. Section 3, pp. 1-31.
Lammert, M., J. Higgins, D. Grossman, and M. Bryer. 1996. Aclassification framework for freshwater communities. Proceed-ings of The Nature Conservancy’s Aquatic Community Classi-fication Workshop, New Haven, Missouri, April 9-11, 1996. TheNature Conservancy, Arlington, Virginia. 16 pp.
Matthews, W.J. 1985. Distributions of midwestern fishes on mul-tivariate environmental gradients, with emphasis on Notropislutrensis. The American Midland Naturalist 113:225-237.
Pflieger, W.L. 1975. The Fishes of Missouri. Missouri Dept. ofConservation. Western Publishing Company. pp. 160-162.
Platts, W.S., W.F. Megahan, and G.W. Minshall. 1983. Methodsfor evaluating stream, riparian, and biotic conditions. Gen. Tech.
Rep. INT-138. USDA Forest Service, Intermountain Forestand Range Experiment Station, Ogden, Utah. 71 pp.
Poff, N.L., and J.V. Ward. 1989. Implications of stream flow vari-ability and predictability for lotic community structure: A re-gional analysis of stream flow patterns. Canadian Journal ofFisheries and Aquatic Sciences 46:1805-1818.
Scott, J.M., F. Davis, B. Csuti, R. Noss, B. Butterfield, C. Groves,H. Anderson, S. Caicco, F. D’Erchia, T.C. Edwards, Jr., J.Ulliman, and R.G. Wright. 1993. Gap Analysis: A geographicapproach to protection of biological diversity. Wildlife Mono-graphs 123:1-41.
Simonson, T.D., J. Lyons, and P.D. Kanehl. 1993. Guidelines forevaluating fish habitat in Wisconsin streams. Gen. Tech. Rep.NC-164. U.S. Department of Agriculture, Forest Service, NorthForest Experiment Station, St. Paul, Minnesota. 36 pp.
Sowa, S.P. 1999a. Establishing initial conservation priorities.Implementing the Aquatic Component of GAP Analysis in Riv-erine Environments: A Training Workshop, Columbia, Missouri,March 8-10, 1999. Sponsored by The National Gap AnalysisProgram and hosted by The Missouri Resource Assessment Part-nership in collaboration with The Nature Conservancy. Section4, pp. 1-14.
Sowa, S.P. 1999b. Revising initial conservation priorities and iden-tifying specific sites for conservation. Implementing the AquaticComponent of Gap Analysis in Riverine Environments: A Train-ing Workshop; Columbia, Missouri, March 8-10, 1999. Spon-sored by The National Gap Analysis Program and hosted byThe Missouri Resource Assessment Partnership in collabora-tion with The Nature Conservancy. Section 6, pp. 1-9.
Tabor, V.M. 1998. Final rule to list the Topeka shiner as endan-gered. Federal Register 63(240):69008-69021.

GAPA N A L Y S I S
GAP Analysis Program Bulletin No. 8, December 1999 39
Update on New York Aquatic GAP Pilot Project
of the automated method: point source pollution, surficial geology,bedrock geology, depth to bedrock, and priority water status. Pre-viously collected fish collections were used with all ten landscapeattributes to statistically optimize the prediction of high fish diver-sity habitat on a stream segment basis. Species-specific optimiza-tions for fish were also performed using the same methodology.
Standardized collections of habitat, fish, and macroinvertebrate datawere performed at 39 stream sites in the Allegheny River water-shed in the summer of 1998 for use in testing the predictions. Theautomated method succeeded at predicting stream size and streamgradient with accuracy, and our adaptation of the nonpoint-sourcepollution model was able to predict relative pollutant levels for to-tal nitrogen but was less successful for total phosphorus, suspendedsediment, and biological oxygen demand. Tests of predicted habi-tat quality and riparian forest cover indicated more than chanceagreement with observed data. Significant correlation existed be-tween predicted and observed fish diversity using both automatedand calibrated methods in the Allegheny River watershed.Macroinvertebrate diversity predictions, only performed using au-tomated methods, were also well correlated with observed diver-sity in the Allegheny River watershed. Predictions at the 1:100,000scale in the Allegheny River watershed were uniformly higher inaccuracy than those from the 1:24,000 scale in the French Creekwatershed for both fish and macroinvertebrate diversity using bothautomated and calibrated methods. Species-specific optimizationsfor fish using calibrated methods revealed weak correlations withobserved species occurrences, demonstrating a need for more re-fined methodologies for species-level predictions. It is clear thatthe community-level modeling procedures presented here have po-tential as coarse but feasible methods in identifying high-diversityhabitats that should receive priority conservation attention at thewatershed scale.
MARCIA S. MEIXLER AND MARK B. BAIN
New York Cooperative Fish and Wildlife Research Unit, Cornell Univer-sity, Ithaca, New York
This is an update report on the pilot GIS project for aquatic systemsthat began in 1995 to define a methodology and determine the fea-sibility of predicting biodiversity distribution. Similar to gap analysisin terrestrial environments, gap analysis for aquatic systems usesremotely sensed data for habitat mapping, infers aquatic biodiversitydistribution from habitat data, and provides large-scale informationfor targeting conservation measures. The pilot project has been alow-level effort (e.g., a one-person project) for four years. Theaquatic GAP pilot project was developed in the Allegheny River,Fall Creek (1:100,000 scales), and French Creek (1:24,000 scale)watersheds of New York to study habitat classification in multiplelocations throughout the state and at two spatial scales.
The basic aquatic GAP model predicts relative levels of fish andmacroinvertebrate diversity and identifies stream reaches with highbiodiversity without management or protection. This was accom-plished by classifying stream segments into habitat types using fiveattributes: stream size, habitat quality, water quality, stream gradi-ent, and riparian forest cover. Stream segments were then classi-fied into one of eighteen habitat types for fish diversity predictionand one of eight habitat types for macroinvertebrate diversity pre-diction using the five attributes. The first round of habitat charac-terization (used 1995-1997) involved static, manually intensive clas-sifications from topographic and Mylar land use overlay maps. Inan effort to deviate from such limiting classification, we developedcomputerized macros to automate classification from digital eleva-tion models, land use, road and railroad coverages (termed the au-tomated method). This provided equal or better accuracy, increasedflexibility, and enabled us to calibrate the model using previouslycollected data. Through extensive literature searches, fish specieswere associated with habitat types using information on preferencesand tolerances for stream size, degree of habitat specialization, andtolerance to water pollution. Macroinvertebrate families were as-sociated with habitat types using information on feeding guild, lifehabit, and tolerance to water pollution. Predictions of habitat typesand associated fish species and macroinvertebrate family diversitylevels were performed and gaps in protection located.
An additional method of habitat characterization (termed the cali-brated method) was developed for fish diversity prediction usingdiscriminant analysis. Five landscape attributes were added to those

GAPA N A L Y S I S
40 GAP Analysis Program Bulletin No. 8, December 1999
APPLICATIONS
Assessing Data Quality and InformationDistribution Prospects for County ConservationPlanning Using New Mexico Gap Analysis Data
of data. Products are available at http://www.gap.uidaho.edu/Projects.]
Data Quality AssessmentAn initial assessment of the NM-GAP data set was prepared in out-line form and sent to the people involved with the initial project.We also asked national GAP and the University of New MexicoEarth Data Analysis Center (EDAC) to comment on data quality.We did not receive substantive critical comments in response tothese inquiries; so that document was the starting point for our da-tabase improvement. During our project, national GAP was pro-ducing NM-GAP data on CDs, but that process was independent ofNM-GAP, and we were not directly involved in any digital modifi-cations made during production. National GAP corrected sometopological problems in the original vector coverages. Use of thedata by others and us predictably identified some errors in the data.The most substantial was that our original coverages actually usedthe NAD27 datum rather than NAD83 as was reported to us by theuniversity’s Geography Department, our original partner in spatialanalyses and data product development. Metadata were changed toreflect this error.
Accuracy assessment for the NM-GAP land cover map was ad-equate for directly describing overall quality of the map but wasnot adequate to identify sources of errors. We ignored spatial errorduring map assessment, but this probably caused problems withobservers attempting to view polygons in the field because someboundaries were not distinct. We also discovered that there is sub-stantial subjectivity to land cover designation. Different peopleassign different land cover types to the same parcel of land. Thiscould be for several reasons, all unknown in magnitude and impli-cations. Future use of the National Vegetation Classification Sys-tem and mapping at finer resolution likely will ameliorate many ofthese problems.
The theory of development of the animal algorithm (expressingspecies distribution as a logical function of landscape attributes andbeing able to develop these relations with the advice of experts)seems to work. The execution of algorithms needs improvement.In particular, vector modeling should be abandoned. It should be
A Report on GAP ResearchProject #14-45-0009-1572
ROBERT A. DEITNER2,3, BRUCE C. THOMPSON1,2, AND JULIE S.PRIOR-MAGEE1,2
1U.S. Geological Survey2New Mexico Cooperative Fish and Wildlife Research Unit3Department of Fishery and Wildlife Sciences, New Mexico StateUniversity, Las Cruces
The New Mexico Gap Analysis Project (NM-GAP) was completedin December 1996. As one of the early projects to complete suchdata sets and analysis, we sought to evaluate the quality and utilityof the resulting products, have staff available for consultation withother GAP projects and potential users, and investigate other pos-sible uses of Gap Analysis products for conservation planning. Ourobjectives were to 1) assess data quality and accuracy patterns for42 mapped land cover classes in existing digital map files, 2) pro-vide digital files and cooperative assistance to edge-match 42 NewMexico land cover class assignments and predicted distributionsfor 584 New Mexico animal species relative to comparable infor-mation for Arizona, Colorado, Oklahoma, Texas, and Utah, and 3)analyze predicted distributions of 584 animal species relative to 36classes of land stewardship, four classes of management status, and33 county boundaries for public conservation planning applications.
Data Sharing and Edge-MatchingEarly on, we contacted personnel from Gap Analysis projects in allstates surrounding New Mexico. We provided technical contactinformation, made NM-GAP data sets available, and offered assis-tance in transfer and comparative analysis of mutual data sets. Therewas minimal response from the other projects. It appeared thatthose projects generally were not yet prepared to examine appre-ciable edge-matching questions during the time frame of our re-search. This remains an important communication challenge asGAP projects progress on staggered completion schedules. [Editor’snote: The national GAP office continues to undertake regionalization

GAPA N A L Y S I S
GAP Analysis Program Bulletin No. 8, December 1999 41
executed on one platform only, and ways to make it faster and moreuser-friendly should be explored.
Our review of data quality indicated a high degree of confidence inthe herpetozoan and mammal distribution predictions but a lesserdegree of confidence in the birds. We extensively reviewed the birddistributions (324 species year-round and 257 breeding species state-wide) with two statewide experts and two graduate research assis-tants familiar with New Mexico birds. We focused on species forwhich there was consistency in suggested revisions among expertreviewers. Ultimately, we altered only 21 species’ predictive algo-rithms (20 birds, one mammal). Most of the 21 species changeswere in watersheds, not in habitat relations. The swift fox (Vulpesvelox) algorithm was altered because of a misinterpretation of ini-tial expert opinion that was not discovered until after the originalNM-GAP report was filed.
We devoted particular attention to labeling of attributes in the stew-ardship map. Our original stewardship map was based on the Bu-reau of Land Management’s Public Land Survey System (PLSS)map (1995) with additional polygons that we generated to repre-sent special management tracts not contained in the original map.The attribute table was given to us without metadata, so it took a bitof detective work to discern that the fields indicated the originalPLSS identification of landowner and management status, a de-scription of the tract (polygon) if it was derived by our lab, and itsfinal ownership and management status. National GAP examinedthe coverage for topological problems, and during this process wediscovered a few corrupt polygons, some spurious quadrant bound-aries, and a few polygons placed incorrectly outside the state bound-ary. We made the underlying vector map into two grids with thesame topology as the land cover maps. In the future, the grid ver-sion should consist of one coverage that identifies the polygons aswell as owner and management status.
Our stewardship coverage is useful for identifying broad categoriesof ownership, but specific tracts or complex land management agree-ments are difficult or impossible to identify. Utility of this cover-age could be greatly enhanced if data structures allowed easy ex-traction of specific land tracts. For example, individual wildernessareas and wildlife refuges are not indicated by name or identifier ineither the PLSS map or our modifications. Other difficulties existas some tracts are subject to complicated agreements between agen-cies that cloud classifications to single land stewards. An exampleis a military installation variously composed of military land, otherfederal withdrawn land, and agreement or contract lands. Seriousearly planning is necessary to ensure such tracts are thoroughlyunderstood and attributed properly in the GIS to extract desiredland summaries later. Similar considerations apply to a variety offederal and state land holdings.
Land Cover and Animal ConservationAssessmentFor the 18 most sensitive land cover classes on the New Mexicolandscape, most have substantial percentages of their distribution
on lands under U.S. Forest Service (USFS), Bureau of Land Man-agement (BLM) , private, state trust, or tribal stewardship. Combi-nations of U.S. Forest Service, BLM, and private land stewards ac-count for >60% of the occurrence of 16 of the 18 sensitive classes.For the sensitive wooded, higher-elevation land cover classes, USFSand private land stewards likely have the most opportunity to affectconservation of these types, whereas BLM, tribal, state trust, andprivate land stewards are more implicated in conservation opportu-nities for sensitive shrubland and grassland types. Sensitive ripar-ian land cover classes overwhelmingly occur on private lands, withsome types having appreciable occurrence on BLM and Bureau ofReclamation lands.
The 35 most sensitive vertebrate animal species, as defined by pre-liminary gap analysis practices, occur primarily on a combinationof private, BLM, and state trust lands. The greatest percentage ofoccurrence is estimated to be under private land stewardship for 25of the species and BLM for 10 species. The second greatest per-centage of occurrence for 18 of the species is on state trust lands.Thus, a combination of private, BLM, and state trust lands appearimplicated in appreciable conservation opportunities for these spe-cies. The frequency and extent of occurrence of the 35 most sensi-tive vertebrate species on refuges operated by the U.S. Fish andWildlife Service currently are insufficient to meet conservation in-terests for any of the species. Of the 35 species, 15 are estimated tooccur on refuges in New Mexico. Just seven species occur on morethan one refuge, and none of those species has >1% of its distribu-tion on a national refuge.
Extension to County PlannersInformation on the ecological and land steward context for eachcounty is needed to judge the merits of how conservation planningin individual counties may aid in providing benefits to the at-risknatural land cover classes and sensitive species. We provided twodocuments to county planners. The first, “A Proactive Approach toConservation Planning: How New Mexico Counties Can Use GapAnalysis Project Data,” provided the counties with: 1) basic infor-mation on the Gap Analysis Program; 2) factors to consider whenusing NM-GAP data; 3) examples of uses of GAP data at the countylevel; and 4) information on how to obtain NM-GAP data via theInternet and CD-ROM. The second document, “NM-GAP DataNeeds Inquiry for County Planners,” contained questions regard-ing the county’s potential use of NM-GAP data. These questionsrelated to: 1) the specific type of data the county would find mostuseful in its planning activities, 2) the county’s interest in data forspecific species or land cover classes, 3) the current mapping sys-tem used by the county (e.g., GIS program or hand-drawn maps),and 4) how NM-GAP data could be made easily available and use-ful to the county planning office given its technical capabilities anddata needs.
We contacted 33 county planners or county officials responsiblefor planning. Eight counties scattered across the state responded tothe data needs inquiry (Table 1). The response of county planners,while not showing enthusiastic interest in using NM-GAP data state-
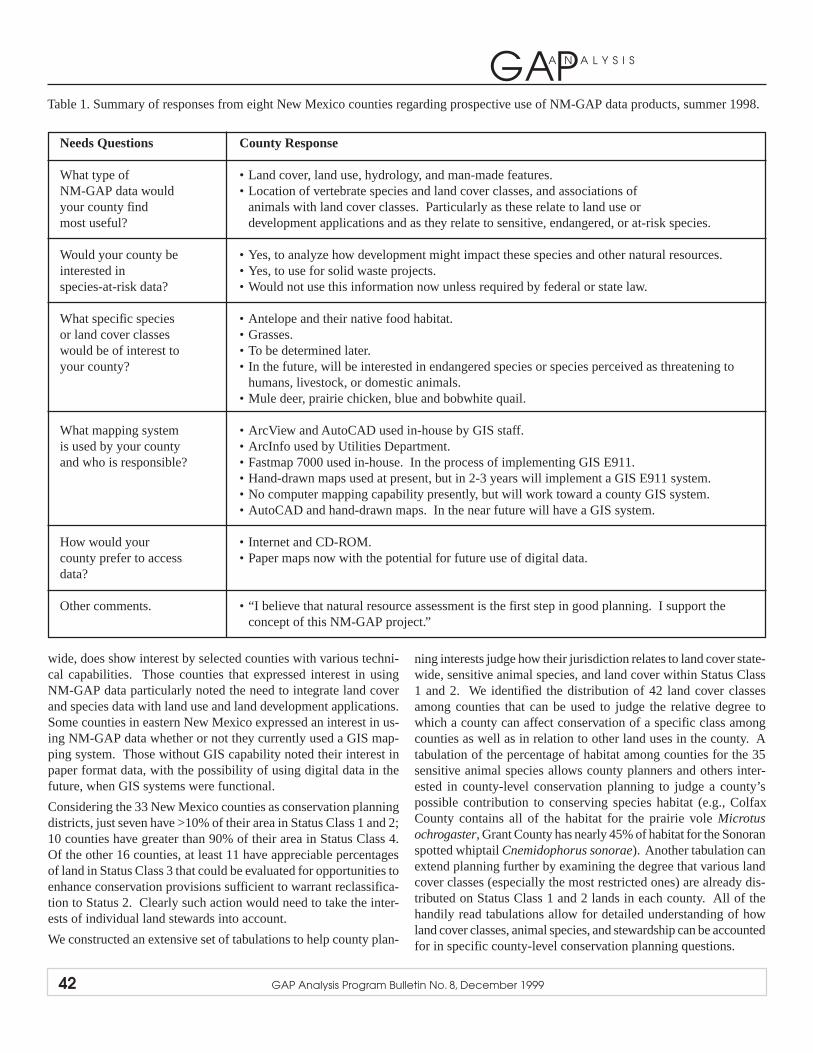
GAPA N A L Y S I S
42 GAP Analysis Program Bulletin No. 8, December 1999
wide, does show interest by selected counties with various techni-cal capabilities. Those counties that expressed interest in usingNM-GAP data particularly noted the need to integrate land coverand species data with land use and land development applications.Some counties in eastern New Mexico expressed an interest in us-ing NM-GAP data whether or not they currently used a GIS map-ping system. Those without GIS capability noted their interest inpaper format data, with the possibility of using digital data in thefuture, when GIS systems were functional.
Considering the 33 New Mexico counties as conservation planningdistricts, just seven have >10% of their area in Status Class 1 and 2;10 counties have greater than 90% of their area in Status Class 4.Of the other 16 counties, at least 11 have appreciable percentagesof land in Status Class 3 that could be evaluated for opportunities toenhance conservation provisions sufficient to warrant reclassifica-tion to Status 2. Clearly such action would need to take the inter-ests of individual land stewards into account.
We constructed an extensive set of tabulations to help county plan-
ning interests judge how their jurisdiction relates to land cover state-wide, sensitive animal species, and land cover within Status Class1 and 2. We identified the distribution of 42 land cover classesamong counties that can be used to judge the relative degree towhich a county can affect conservation of a specific class amongcounties as well as in relation to other land uses in the county. Atabulation of the percentage of habitat among counties for the 35sensitive animal species allows county planners and others inter-ested in county-level conservation planning to judge a county’spossible contribution to conserving species habitat (e.g., ColfaxCounty contains all of the habitat for the prairie vole Microtusochrogaster, Grant County has nearly 45% of habitat for the Sonoranspotted whiptail Cnemidophorus sonorae). Another tabulation canextend planning further by examining the degree that various landcover classes (especially the most restricted ones) are already dis-tributed on Status Class 1 and 2 lands in each county. All of thehandily read tabulations allow for detailed understanding of howland cover classes, animal species, and stewardship can be accountedfor in specific county-level conservation planning questions.
Needs Questions County Response
What type of • Land cover, land use, hydrology, and man-made features.NM-GAP data would • Location of vertebrate species and land cover classes, and associations ofyour county find animals with land cover classes. Particularly as these relate to land use ormost useful? development applications and as they relate to sensitive, endangered, or at-risk species.
Would your county be • Yes, to analyze how development might impact these species and other natural resources.interested in • Yes, to use for solid waste projects.species-at-risk data? • Would not use this information now unless required by federal or state law.
What specific species • Antelope and their native food habitat.or land cover classes • Grasses.would be of interest to • To be determined later.your county? • In the future, will be interested in endangered species or species perceived as threatening to
humans, livestock, or domestic animals.• Mule deer, prairie chicken, blue and bobwhite quail.
What mapping system • ArcView and AutoCAD used in-house by GIS staff.is used by your county • ArcInfo used by Utilities Department.and who is responsible? • Fastmap 7000 used in-house. In the process of implementing GIS E911.
• Hand-drawn maps used at present, but in 2-3 years will implement a GIS E911 system.• No computer mapping capability presently, but will work toward a county GIS system.• AutoCAD and hand-drawn maps. In the near future will have a GIS system.
How would your • Internet and CD-ROM.county prefer to access • Paper maps now with the potential for future use of digital data.data?
Other comments. • “I believe that natural resource assessment is the first step in good planning. I support theconcept of this NM-GAP project.”
Table 1. Summary of responses from eight New Mexico counties regarding prospective use of NM-GAP data products, summer 1998.

GAPA N A L Y S I S
GAP Analysis Program Bulletin No. 8, December 1999 43
Incorporating Protection of Biodiversity intoCounty Land Use Planning: A Gap Analysis Pilot
Project in Pierce County, Washington
BackgroundGap analysis is a process by which lands of high conservation pri-ority are identified. The process uses land cover, wildlife/habitatrelationship models, and other data to predict the distribution ofwildlife species in a given geographic area. By overlaying landcover and vertebrate distributions onto land ownership, cover typesand vertebrate species with poor representation on protected landsare identified. Gap analysis is designed to be a proactive approachto conservation, identifying important wildlife habitats or speciesbefore they become threatened by habitat degradation or loss.
A Report on GAP ResearchProject #1434-HQ-97-RU-01583
CHRISTIAN GRUE1, DOUG PFLUGH2, WOOD TURNER2, PAT
IOLAVERA2, AND FRANK WESTERLUND2
1Washington Cooperative Fish and Wildlife Research Unit, School ofFisheries, University of Washington, Seattle, Washington2Department of Urban Design and Planning, University of Washington,Seattle, Washington
ImplicationsFrom our data review, we believe the following actions warrantattention in further work with the NM-GAP data and in the nextgeneration of gap analysis in the Southwest.
• Specific attention is needed to derive an efficient process formanaging animal algorithms, especially in attempts to consoli-date predictive work among past project databases. We recom-mend against using vector-based processing.
• Greater specificity is needed in assigning and tracking steward-ship categories. Simply compiling previous maps evolved forother purposes does not allow desired capability to extract theaccurate boundaries of tracts or stewardship categories of inter-est.
• Critically examine how preclustering operations relate to as-signment of land cover boundaries for recognizable natural fea-tures.
• Recognize how far in time and computing capability a county’splanning functions are from effective use of GAP products.Similarly, recognize the opportunity that exists, at least in NewMexico, to work with counties in the formative stages of de-signing and delivering data products that they can immediatelyadapt to county-level planning operations.
Suggested ReadingsDeitner, R.A., B.C. Thompson, and J.S. Prior-Magee. 1999. As-
sessing inter-project data compatibility and information distri-bution for conservation planning using New Mexico Gap Analy-sis data. Research Completion Report to USGS National Gap
Analysis Program, Research Work Order No. 29, New MexicoCooperative Fish and Wildlife Research Unit, New Mexico StateUniversity, Las Cruces.
Edwards, T.C., Jr., E.T. Deshler, D. Foster, and G.G. Moisen. 1996.Adequacy of wildlife habitat relation models for estimating spa-tial distributions of terrestrial vertebrates. Conservation Biol-ogy 10:263-270.
Forester, D.J., G.E. Machlis, and J.E. McKendry. 1996. Extend-ing gap analysis to include socioeconomic factors. Pages 39-53 in J.M. Scott, T.H. Tear, and F.W. Davis, editors. Gap analy-sis: A landscape approach to biodiversity planning. AmericanSociety for Photogrammetry and Remote Sensing, Bethesda,Maryland.
Johnson, N.C. 1995. Biodiversity in the balance: Approaches tosetting geographic conservation priorities. Biodiversity Sup-port Program, consortium of World Wildlife Fund, The NatureConservancy, and World Resources Institute, Washington, D.C.
Scott, J.M., T.H. Tear, and F.W. Davis, editors. 1996. Gap analy-sis: A landscape approach to biodiversity planning. AmericanSociety for Photogrammetry and Remote Sensing, Bethesda,Maryland.
Thompson, B.C., P.J. Crist, J.S. Prior-Magee, R.A. Deitner, D.L.Garber, and M.A. Hughes. 1996. Gap analysis of biologicaldiversity conservation in New Mexico using geographic infor-mation systems. Research Completion Report to USGS Na-tional Gap Analysis Program, Research Work Order No. 13, NewMexico Cooperative Fish and Wildlife Research Unit, NewMexico State University, Las Cruces.

GAPA N A L Y S I S
44 GAP Analysis Program Bulletin No. 8, December 1999
A gap analysis of Washington State was recently completed by theWashington Gap Analysis Project (WA-GAP) (Cassidy et al. 1997).However, additional work is needed to make this process an effec-tive tool for local land use planning. Although the data from WA-GAP have been summarized and analyzed at a statewide level, theanalysis was conducted using ecoregions and vegetation zones,which are not easily applied to local land use planning and habitatconservation. Data must be significantly manipulated, analyzed,and reinterpreted before they can be applied to the local land useplanning process.
The Department of Urban Design and Planning (UDP) at the Uni-versity of Washington (through its Remote Sensing ApplicationsLaboratory), in cooperation with WA-GAP, is conducting an ongo-ing program to develop procedures and materials supporting theapplication of WA-GAP data and methodology to local land useplanning in Washington State. The intent of this work is to givelocal planners, elected officials, and the public the tools they needto incorporate biodiversity protection into their planning programs.The initial pilot project of the program took place in Spokane Countyin eastern Washington during 1997 and 1998 (Stevenson 1998, 1999;Westerlund 1998). UDP and WA-GAP identified Pierce County asan excellent location for a westside pilot project because of thecounty’s broad range of habitat types and development densities,current conservation issues, and existing planning and GIS infra-structure. Funding and support for this project were provided byPierce County, Washington State Department of Fish and Wildlife(WDFW), U.S. Fish and Wildlife Service, the USGS BiologicalResources Division (National Gap Analysis Program and Coopera-tive Research Units), and the Rocky Mountain Elk Foundation.
Our Pierce County pilot project was conducted in collaboration withPierce County and WDFW and was executed in two phases. Theprimary objective of Phase 1 (January - May 1999) was to review,validate, and augment the county’s Open Space ImplementationCommittee’s draft Open Space and Greenbelt Corridor Map by in-corporating terrestrial biodiversity and salmonid habitat issues. Theanalysis and products of this phase were broad in scale and appro-priate for policy-level decision making. The objectives of Phase 2(May - December 1999) were to develop the open space andgreenbelt system recommendations to a higher level of detail, presenta methodology for establishing and implementing a priority systemfor habitat conservation and restoration, and prepare project docu-mentation in both hard copy and digital formats.
The project team consisted of the authors and Kelly Cassidy andKaren Dvornich (WA-GAP and NatureMapping), Katherine Rose,Grant Griffin, Karen Trueman (Pierce County), and Michelle Tirhi(WDFW).
WA-GAP Conservation Priorities for PierceCountyThe Puget Trough and Southwest Cascades ecoregions comprisethe majority of Pierce County. The lowland vegetation zones of thePuget Trough ecoregion (Puget Sound Douglas Fir, Woodland/Prai-
rie Mosaic, Willamette Valley, and Cowlitz River) were identifiedas among those with the highest priority for conservation in thestate. These areas have been heavily converted to both agricultureand development. The remaining forests are now a patchwork ofhardwood, mixed, and early-seral conifer forest. There are only afew small areas of moderate richness of at-risk species, becausemost at-risk species have been extirpated from these zones. A ma-jor priority of these zones is management of the handful of verte-brate species or subspecies that cannot “retreat” into less-impacted,higher-elevation vegetation zones.
The mid-elevation Western Hemlock vegetation zone (also foundin both the Puget Trough and Southwest Cascades ecoregions) wasidentified as a moderately high priority for conservation. This zonehas not been as severely impacted by development and agricultureas the lower elevation zones but has a low protection status and hasseen extensive logging. Areas of high amphibian and mammal rich-ness occur here, and the remaining mid- to late-seral forests sup-port large numbers of at-risk amphibian, mammal, and bird spe-cies. Less than 10% of the zone remains in late-seral forest; anadditional 20% is estimated to be mid-seral. This statewide per-spective provided a framework for applying the WA-GAP data andmethodology to local land use planning issues in Pierce County.
The Pierce County ProjectPhase I - The objectives of Phase I were to: 1) update the WA-GAPland cover classification to a 1998 base line, 2) generate predictedspecies distributions for all breeding native vertebrates based onthis classification, 3) identify lands in Pierce County of high con-servation priority, and 4) develop a biodiversity network that in-cluded the lands identified in 3) and that complemented the PierceCounty Open Space and Greenbelt Corridor Map. The study areafor the pilot project included all of Pierce County plus adjacentlands within the watersheds partially contained in the county.
The original WA-GAP land cover map for the study area (based on1991 Landsat TM imagery) was updated in a three-tier process.On-screen interpretation of unclassified 1998 Landsat TM data wasused to determine large-scale land conversions resulting from hu-man activities: new development, clearcut forests, and regeneratedclearcuts. Existing county coverages facilitated interpretation.National Wetlands Inventory digital data were used to identifysmaller wetlands missed during the original interpretation. Theoriginal WA-GAP classification scheme, which assigned primary,secondary, and tertiary land cover, was simplified to a single (“pri-mary”) classification. This process resulted in disaggregation ofsome large land cover units. The nominal minimum mapping unitfor the updated classification was 40 hectares.
The predicted species distribution models (a series of AMLs devel-oped by WA-GAP) overlaid species ranges on the land cover clas-sification data and compared each within-range habitat polygon withthe appropriate habitat matrix. The results were compiled in a dataset indicating presence or absence for each species in the four taxo-nomic groups considered (mammals, birds, amphibians, and rep-

GAPA N A L Y S I S
GAP Analysis Program Bulletin No. 8, December 1999 45
tiles). Presence was confined to habitat rated as “primary, core,and good quality” (Cassidy et al. 1997). This resulted in a conser-vative prediction of presence appropriate to the resolution availablefrom the 30-meter resolution Landsat TM.
A value for richness for each taxonomic group (number of nativespecies predicted to occur) was calculated for each habitat poly-gon. Habitat polygons with a richness value greater than one stan-dard deviation above the mean for a taxonomic group were consid-ered “rich” in subsequent analyses. An example of species distri-bution richness (in this case, mammals) is presented in Figure 1.
Figure 1. Predicted mammal species richness within study area.
The identification of lands important for biodiversity protectioncoupled the concept of richness described above with “representa-tion.” Our goal was to ensure that each species predicted to occur inthe study area would be represented in a minimal set of habitatpolygons. The minimal set of habitat polygons was selected throughan interactive process (run as an AML) beginning with the richestland cover units and most frequently occurring species. Each itera-tion added a unique set of habitat polygons that provided habitatsuitable for a unique set of species (e.g., mammals in Figure 2). Asthis process was conducted independently for each taxon, redun-dancy was anticipated to provide for more than the minimum selec-tion for most species.
This representative set was examined, and areas excessively frag-mented or isolated were trimmed from the set (where possible with-out compromising representation). The resultant set of land cover
units depicted the “core areas” whose preservation as functionalhabitat was considered essential to biodiversity protection withinthe study area for each taxon. Figure 3 depicts the resultantBiodiversity Management Areas (BMAs) for mammals. BMAs—the basic component of the proposed biodiversity management net-work—were generated by applying a 0.4 km buffer to the core ar-eas. This buffer (based on recommendations from WDFW) wasintended to isolate the core areas from adjacent land uses and pos-sible impacts. Characterizations of the BMAs were compiled thatidentified the species predicted to occur (highlighting species iden-tified by WA-GAP as being “at-risk”) and the land cover typespresent. These characterizations were used in Phase II and will beused in future work by the county to develop land managementplans and regulatory guidelines that will balance appropriate useof the areas and preservation of the essential habitat qualities.
The BMAs were integrated into a contiguous network using “con-nections” to provide movement corridors for large and/or migra-tory species and to avoid population isolation. Where possible,these connections were routed through areas of high richness. Ar-eas of intense development (as interpreted from road and parceldata) were avoided. WDFW Priority Habitat and Species (PHS)data and the distributions of threatened salmon species were alsoconsidered (the final network contains 59% of the PHS observa-tion points within the county). The connections were delineatedindependently for each taxon and then adjusted to take advantageof redundant alignments.
Figure 2. Core areas for mammal biodiversity protection.

GAPA N A L Y S I S
46 GAP Analysis Program Bulletin No. 8, December 1999
The final BMA network and connections (Figure 4) were reviewedby biologists (assembled by WDFW) familiar with the study area.This group verified the network and suggested additional areas forinclusion—habitats not considered by WA-GAP (e.g., critical win-tering areas for some bird species) or dependent on features smallerthan the resolution of the land cover data (e.g., snags for eagle nests).The additional areas were incorporated into the network as con-nections.
The network composed of Biodiversity Management Areas andconnections was presented to the county as a recommendation forexpansion of the proposed Open Space and Greenbelt Corridor Mapunder review. Forty-five percent of the network overlapped withthe county’s proposed map. The portion of the network within thecounty boundaries contains an area equal to 29% of the county.The network captured 60% of the remaining natural cover of theWoodland/Prairie Mosaic, rated as “highest conservation priority”by WA-GAP. Land stewardship status within the network is Status1 and 2 (most protected) - 28%, Status 3 (extractive uses permitted)- 13%, and Status 4 (least protected) - 59%. In October 1999, theCounty Council adopted the revised Open Space and GreenbeltCorridor Map.
Phase 2 - In this phase of the project, we characterized the BMAsin terms of the species predicted to occur, conducted a preliminaryspecies-viability analysis, examined opportunities to protect/en-
hance habitat on Status 4 (primarily private lands) using existingstate and county regulations, and refined the boundaries of the BMAswithin four case study areas representing varying amounts of ur-banization and agriculture.
Characterizations (lists of species including salmonids and theirstatus) were developed for each BMA to guide future specializedwildlife surveys to confirm species/habitat presence. Of particularinterest were “trigger” species, the predicted presence of whichgoverned the selection of a particular BMA during the representa-tive set analysis (Phase 1). In addition, profiles (habitat needs andmanagement considerations) were developed for each “at risk” wild-life and salmonid species predicted to occur within the BMAs.
The preliminary species-viability analysis was based on the acre-age predicted to be available within the BMA network (excludingcorridors) for each of the terrestrial vertebrates included in the pilotproject. Following review by WDFW, University of Washington,and Project personnel, 11 species were identified as potentially nothaving sufficient acreage to maintain populations. Several of thesespecies were identified as having only “peripheral” (as opposed to“core”; Cassidy et al. 1997) habitat in Pierce County, limited habi-tat remaining in the county (e.g., Woodland/Prairie Mosaic), beingrestricted to remote, highly protected areas outside the BMAs (e.g.,Wolverine [Gulo gulo]), or species associated with aquatic habitatsnot adequately surveyed by WA-GAP or the state (e.g., River Otter
Figure 3. BMAs and connections for mammals. Figure 4. Biodiversity management network for Pierce County.

GAPA N A L Y S I S
GAP Analysis Program Bulletin No. 8, December 1999 47
[Lutra canadensis]).
Redefining “Status 4” lands was important to the county, as nearly60% of the BMA network was in private or military ownership.Our new classification divided Status 4 lands into 4-a (most highlyprotected), 4-b (moderately protected), 4-c (slightly protected), andInconsequential (little or no effective protection provided) basedon existing state and county regulations (Iolavera 1999). We thenevaluated the existing state and county policies and regulations forhabitat protection as they pertained to the redefinition of Status 4lands. These included provisions of the Washington Growth Man-agement Act, Shoreline Management Act, and State EnvironmentalPolicy Act; elements of the Pierce County Comprehensive Plan re-lated to open space, shorelines, wetlands, and wildlife conservationareas; and local regulatory and incentive tools including zoning,impact fees, conservation easements, and vegetation protection or-dinances. Recommendations were made for revisions and addi-tions to these policies and regulations to enhance biodiversity pro-tection (Iolavera 1999).
The last component of Phase 2 was to demonstrate to the countyhow one could refine BMA boundaries based on a higher-resolu-tion analysis of land cover within portions of four BMAs. This isan important step in moving toward acquisition of lands for openspace or the implementation of open-space designation mechanisms.We used 1991 orthorectified photographs, a 1998 high-resolutionland cover classification, a restricted zoning overlay, and WDFWPHS data to primarily eliminate areas along the original boundariesof the BMAs where urban development or other land uses not com-patible with habitat existed that were not visible at the resolutionused in Phase 1. Similar land uses within the BMA study areaswere not removed if they were surrounded by largely high-quality,unfragmented vegetative cover. These refinements resulted in re-ductions of 3, 14, 19, and 61% of the original size of the four BMAswithin the study areas (see Figure 5). In the case of the 61% reduc-tion between Phase 1 and 2, the area removed largely representedthe 0.4 km buffer that was drawn around the core habitat in themost highly developed BMA. This suggests that, in some cases,attempts to designate buffers may require more educational out-reach to private landowners than actual open space acquisition.
Copies of the Pierce County report and CD are available for pur-chase from the Washington Cooperative Fish and Wildlife ResearchUnit (206-543-6475).
Literature CitedCassidy, K.M., C.E. Grue, M.R. Smith, and K.M. Dvornich, editors.
1997. Washington State Gap Analysis - Final Report. Washing-ton Cooperative Fish and Wildlife Research Unit, University ofWashington, Seattle, Washington. Volumes 1-5 (1,450 pp.).
Iolavera, P.R. 1999. Pierce County, Washington, GAP applicationpilot project: Expanding the GAP land stewardship categoriza-tion for use at the county planning level. M.S. thesis, Departmentof Urban Design and Planning, University of Washington, Seattle,Washington. 103 pp.
Stevenson, M. 1998. Applying Gap Analysis to county land useplanning in Washington State. Gap Analysis Bulletin 7:30-32.
Stevenson, M. 1999. A different look at the land. Planning (Ameri-can Planning Association magazine) 7:65-68.
UDP. 2000. Pierce County GAP application project: A biodiversityplan for Pierce County, Washington. Department of Urban De-sign and Planning, University of Washington, Seattle, WA. 196pp.
Westerlund, F. 1998. Wildlife corridors and landscape linkages: Anapproach to biodiversity planning for Spokane County, Washing-ton. Department of Urban Design and Planning, University ofWashington, Seattle, Washington. 91 pp.
Figure 5. Phase 2 refinement of boundaries of BMA within Tanwaxstudy area.

GAPA N A L Y S I S
48 GAP Analysis Program Bulletin No. 8, December 1999
Designing Regional Conservation Portfolios:Filling the Gaps
2. those with insufficient documentation and/or inadequate test-ing of computer code; or
3. those with overly simplistic decision rules (e.g., “greedy” orrarity-based heuristics).
In 1998, TNC funded a team of investigators (Frank Davis, SandyAndelman, and David Stoms) at the University of California-SantaBarbara to:
• Develop a conservation siting model for regional conservationanalysis that explicitly incorporates spatial design criteria intothe portfolio design process.
• Test and apply the new modeling approach in a structured deci-sion process involving local TNC staff to develop hypotheticalconservation portfolios in two different ecoregions.
• Produce a training manual, including worked examples usingTNC data and ecoregions, and train TNC staff in applying theregional conservation-planning tools.
The result is a “toolbox” that can solve ecoregion-sized planningproblems on a Windows-based personal computer. The heart of thetoolbox is a portfolio design model, written by Ian Ball and HughPossingham from the University of Adelaide in Australia. This soft-ware, based on a simulated annealing algorithm, has been integratedwith a GIS (ArcView) interface for visualizing potential portfoliosand allocating sites prior to running the model. The model hasalready been applied in two TNC ecoregions—the Idaho Batholithand the Northern Sierra Nevada. GAP data were used in both casesto set some of the representation goals. In addition, the model pro-vides options for influencing the spatial configuration of an alter-native portfolio. The toolbox makes it relatively easy for TNC staffto explore a range of alternatives and identify the effects of theirchoices in representation goals, assumptions about costs, impor-tance of spatial clustering of selected sites, and so on. A planningteam must still review the initial solutions and modify them usinglocal knowledge, judgment, and other evidence not considered inthe modeling approach.
The ToolboxEcoregional planning entails identifying a set of sites that collec-tively capture viable examples of all native species and communi-ties from among a larger set of “planning units” within the ecoregion.The first step in applying the toolbox is to determine which conser-vation elements, such as cover types, are to be represented in theportfolio and at what level of representation. It is also possible toweight some elements as more important than others. Representa-
DAVID M. STOMS, FRANK DAVIS, AND SANDY ANDELMAN
University of California, Santa Barbara
Problem StatementGap analysis identifies the current level of representation of landcover types and vertebrate species in designated biodiversity man-agement areas. That is, it helps define the identity and magnitudeof the gaps. The next step is to work toward filling the gaps, whichtypically includes identifying a network of nature reserves. Re-serve network design is a hard problem, however, because the num-ber of conservation elements and planning units is large (typicallyhundreds of elements and hundreds to thousands of sites). Over thepast 15 years researchers have developed computer-based ap-proaches to make the reserve selection process more systematicand explicit. These approaches respond to the perceived need forreserve siting to be as efficient or cost-effective as possible, giventhe competing social and economic demands for land and resources.They also address the concern that reserve system design should berepeatable, so that the reserve systems can be readily reevaluatedand modified over time as conditions change and new informationis acquired. These approaches assist planners in sorting throughthe large volume of data to identify good initial solutions to this“hard and wicked” problem. However, at present these models re-main primarily research tools, beyond the reach of most agenciesand nongovernmental organizations that plan and implement re-serve networks.
Recently, The Nature Conservancy (TNC) began a new planninginitiative with the aim of developing “portfolios” of conservationsites for each ecoregion in the U.S., the Caribbean, and LatinAmerica that collectively conserve viable examples of all nativespecies and plant communities. Both the use of ecologically de-fined planning regions and the adoption of biotic representation asan explicit conservation objective posed many new institutional,scientific, and technical challenges to TNC, which historically hasoperated on a state-by-state basis and has focused on rare and threat-ened species and plant communities.
Based on discussions with various TNC staff involved withecoregional planning efforts, none of the existing reserve selectionapproaches, in their current form, was well-suited to TNC’s plan-ning needs. From TNC’s perspective, the major limitations of cur-rent tools fall into three general categories:
1. those that require high-end computing power, specialized soft-ware, and/or a high level of technical GIS expertise;

GAPA N A L Y S I S
GAP Analysis Program Bulletin No. 8, December 1999 49
tion goals can be the specified number of population occurrencesof a species or total area of a land cover type that must be includedin the regional portfolio to fill the gaps.
The second step is to delineate and characterize the set of planningunits in an ecoregion. There is no simple answer to what are theright spatial units to use as planning units. It is a complicated ques-tion, influenced by the size of the ecoregion, the primary ecologi-cal processes, data sources and resolution, and political issues. Wehave frequently used watersheds, at various hierarchical divisions,as planning units. Whatever the choice of units, data must be com-piled about several variables for each unit. Data are required forthe composition of cover types (such as GAP data) or otherbiodiversity elements and are optional for costs, length of the bound-aries of planning units, and preallocations of a starting portfolio(sites required to be in or out of the portfolio). The compositionalinformation is used by the toolbox to determine each planning unit’spotential contribution toward meeting the representation goals. Thecost and boundary information is used in minimizing portfolio costand in controlling spatial clustering of the portfolio sites. Costscan be a function of area or any other units you like.
Defining the starting portfolio is an important consideration, andgenerally planners will want to consider several alternatives. Forexample, they may consider an alternative that starts by fixing ex-isting national parks and other formally designated reserves. Ele-ment occurrences in these areas will automatically be counted to-wards meeting the representation goals. A different alternativewould be to create a portfolio without assuming any starting re-serves or to consider existing public reserves plus other planningunits that are known to have significant biological resources andthat planners want to make sure are included in the final portfolio.This step can be done with a word processor or through the ArcViewselection tools. In each alternative the toolbox will then fill anyremaining gaps.
The model seeks to minimize Total Portfolio Cost as measured by aweighted sum of actual cost (or area) of the selected set of sites, apenalty for not meeting representation goals for elements, and ameasure of spatial compactness and connectivity. The actual solu-tions depend on how site cost is measured, on the target levels andthe penalty cost for each element (these are set separately for eachelement), and on how heavily one weights spatial contiguity as anadditional cost factor. The selection procedure uses an iterativemethod known as simulated annealing. The model selects a set ofplanning units at random and then randomly evaluates the effect ofadding or deleting randomly selected planning units. After a verylarge number of iterations, the model converges towards a goodsolution. It does not guarantee to find an “optimal” solution. Typi-cally the model is run multiple times, with a different initial ran-dom solution, and saves the best solution of those multiple runs.Another useful feature is to tally the total number of times eachplanning unit was selected in a series of runs, which suggests whichunits tend to be part of most efficient alternatives.
The graphical user interface is built on the ArcView software buthas been customized for the toolbox. All actions, except for pre-paring the data input files, are handled through menus, buttons, orregular ArcView functionality. The reserve selection software pro-duces output to files that can be displayed as maps, charts, or tableswithin the toolbox. The most basic output is the set of planningunits selected for a given alternative. This can be displayed as atheme in the ArcView project, either as the best solution from mul-tiple runs or as the total number of times each planning unit wasselected in a series of runs. The summary information from a se-ries of runs can be viewed as a table, allowing comparison of thecosts, number of planning units selected, total boundary length, andthe number of conservation elements that fell short of their targetlevels. The distribution of individual elements can be displayed inrelation to an alternative portfolio to show the spatial pattern ofrepresentation for that element. Conversely, the composition ofindividual planning units can be examined (Figure 1) to see whatthey contributed (or might contribute if preallocated) to the repre-sentation goals.
The series of three maps below (Figure 2) shows the effect of ad-justing a model parameter (BLM) on the amount of spatial contigu-ity, while representation goals and other parameters are kept thesame. The model tries to minimize the outer perimeter length ofthe set of clusters of planning units. For a given total area, this isaccomplished by aggregating planning units into larger, more com-pact clusters. The upper left map has no clustering enforced; anyapparent clustering is the result of the composition of the planningunits and the representation goals. The upper right and lower mapshave increasing clustering enforced by increasing the value of BLM.
Figure 1. A tabular display of the biodiversity elements and their aerialextent in a selected planning unit.

GAPA N A L Y S I S
50 GAP Analysis Program Bulletin No. 8, December 1999
Product AvailabilityThe software has been given to TNC and has been used in twoecoregions to date. TNC staff have been trained in the use of thetoolbox so that they can train other TNC planning teams. Severalother nongovernmental organizations and some governmental agen-cies have also shown interest. Further details about the toolbox areavailable at http://www.biogeog.ucsb.edu/projects/tnc/toolbox.html.
Figure 2. Maps depicting the effect of the model parameter that controlsthe degree of spatial clustering of selected units.

GAPA N A L Y S I S
GAP Analysis Program Bulletin No. 8, December 1999 51
Landscape Diversity as the Basis for a ReserveDesign Initiative in Vermont
weighted differences in elevation between that point and all otherelevation points within a specified radius. The LPI was “calibrated”for each region and divided into discrete classes that described rec-ognized landforms. A matrix of slope classes by LPI classes pro-duced 14 landform descriptions that could be mapped. Then weadded four other categories from existing data, one for wetlandsand three for classes of surface waters, for a total of 18 landformlabels.
Also from DEM data, we defined five elevation zones with recog-nized links to the distribution of forest types in Vermont. Addi-tional data came from digital maps of bedrock geology (1:250,000)and surficial geology (1:62,500). In both cases, we developed anecologically-based crosswalk that reduced the number of classes tonine bedrock categories and eight surficial units. The final stepwas to overlay these four GIS coverages and to label each pixel ofa 30-meter by 30-meter grid with codes for landform, elevation zone,bedrock type, and surficial class. This code—a product of fourdescriptors of the landscape—is referred to as a Landscape Diver-sity Unit (LDU). Although there are several thousand potentialLDU labels, there were only several hundred actual labels in eachbiophysical region. The mean size for LDUs was 3.9 ha; the rangewas from 0.09 ha to 1,957 ha. The smallest size represented singlecells that were anomalies of GIS overlays and were filtered fromthe database.
Representative LandscapesWe used grids of hexagonal cells to sample LDUs in each biophysi-cal region. Each sample cell represented 5% of the area of theregion, a decision based on a suggested minimum size for a func-tional reserve. Grid cells were custom-built for each biophysicalregion and were shaped to best approximate configuration of theregion; they ranged from 26,000 to 60,000 ha among the regions.We used an algorithm based on richness and complementarity toselect a set of hexcells that most efficiently represented landscapediversity. The first cell selected was the richest, followed by fivemore cells that represented the best complements, such that the sixcells selected gave the most efficient representation of LDUs (Fig-ure 1). The decision to stop at six sample cells was again related topracticalities of reserve design; here the rule was based on the no-tion that it would not be realistic to identify more than 30% (sixcells) of the landscape as potential reserve.
DAVID E. CAPEN, CHARLES E. FERREE, AND ERNEST W.BUFORD
Spatial Analysis Laboratory, School of Natural Resources, Universityof Vermont, Burlington
IntroductionThe Vermont Biodiversity Project has been conducted hand-in-handwith the Vermont/New Hampshire Gap Analysis Project but at finerresolution and with an objective of using measures of landscapediversity as indicators of community and species diversity. Thereis ample rationale in the published literature for this approach. Oneline of support comes from evidence that biological diversity is pre-dicted well by physical diversity, and that this relationship holds atvarious scales (e.g., Lapin and Barnes 1995, Burnett et al. 1998,Nichols et al. 1998). Another argument for physical diversity isthat land conservation efforts should consider temporal scales thatacknowledge shifts in ranges of species and communities in responseto ecosystem processes and changes in climate (Hunter et al. 1988,Hunter 1991).
In the Vermont Biodiversity Project, our goal was representation.We sought to delineate a system of potential reserves that includedall elements of landscape diversity. We began with an analysis ofbiological (tree species) and physical data (climate, geology) thatled to the delineation of seven biophysical regions in the state. Withineach region we then employed a methodology that assured repre-sentation by most or all elements of physical diversity.
We were constrained by the need to use data that were available forthe entire state. Soils or ecological land types would have beenideal, but neither has been mapped statewide. The only consistentsources of data were digital elevation models (DEMs), bedrockgeology, surficial geology, hydrography, and wetlands. From thesespatial data, we derived Landscape Diversity Units (LDUs) andsampled for richness and representation.
Landscape Diversity UnitsThe most significant component of landscape diversity was the deri-vation of landforms (Fels and Matson 1997). Using 30-meter DEMdata, we first derived five slope classes. We then calculated a land-scape position index (LPI) for each DEM point using a focal func-tion. This function assigns to each cell the mean of the distance-
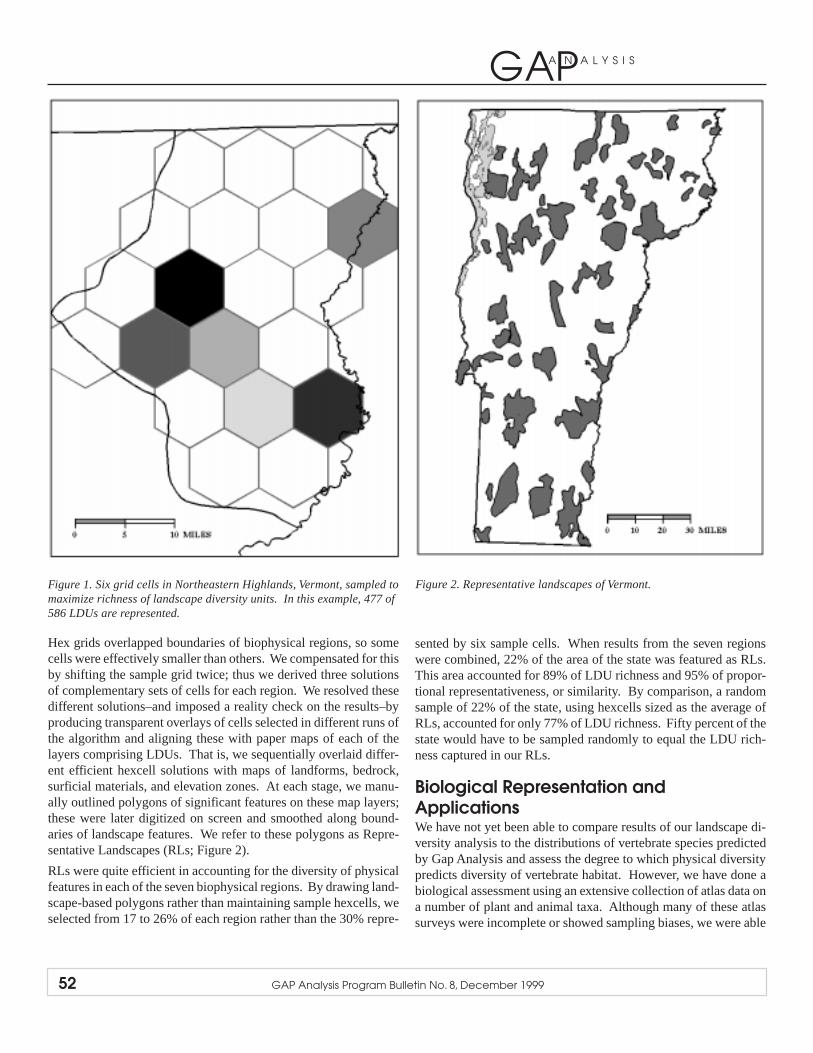
GAPA N A L Y S I S
52 GAP Analysis Program Bulletin No. 8, December 1999
Figure 1. Six grid cells in Northeastern Highlands, Vermont, sampled tomaximize richness of landscape diversity units. In this example, 477 of586 LDUs are represented.
Hex grids overlapped boundaries of biophysical regions, so somecells were effectively smaller than others. We compensated for thisby shifting the sample grid twice; thus we derived three solutionsof complementary sets of cells for each region. We resolved thesedifferent solutions–and imposed a reality check on the results–byproducing transparent overlays of cells selected in different runs ofthe algorithm and aligning these with paper maps of each of thelayers comprising LDUs. That is, we sequentially overlaid differ-ent efficient hexcell solutions with maps of landforms, bedrock,surficial materials, and elevation zones. At each stage, we manu-ally outlined polygons of significant features on these map layers;these were later digitized on screen and smoothed along bound-aries of landscape features. We refer to these polygons as Repre-sentative Landscapes (RLs; Figure 2).
RLs were quite efficient in accounting for the diversity of physicalfeatures in each of the seven biophysical regions. By drawing land-scape-based polygons rather than maintaining sample hexcells, weselected from 17 to 26% of each region rather than the 30% repre-
sented by six sample cells. When results from the seven regionswere combined, 22% of the area of the state was featured as RLs.This area accounted for 89% of LDU richness and 95% of propor-tional representativeness, or similarity. By comparison, a randomsample of 22% of the state, using hexcells sized as the average ofRLs, accounted for only 77% of LDU richness. Fifty percent of thestate would have to be sampled randomly to equal the LDU rich-ness captured in our RLs.
Biological Representation andApplicationsWe have not yet been able to compare results of our landscape di-versity analysis to the distributions of vertebrate species predictedby Gap Analysis and assess the degree to which physical diversitypredicts diversity of vertebrate habitat. However, we have done abiological assessment using an extensive collection of atlas data ona number of plant and animal taxa. Although many of these atlassurveys were incomplete or showed sampling biases, we were able
Figure 2. Representative landscapes of Vermont.

GAPA N A L Y S I S
GAP Analysis Program Bulletin No. 8, December 1999 53
to compare statewide records for 1,617 species referenced to the251 towns in Vermont. Eighty-three percent of the species wererepresented by records that corresponded with representative land-scape polygons; we captured only 76% of the species records byrandom samples of an equivalent area.
We believe that there are a number of ways that analyses of physi-cal diversity such as we have described might be useful in GapAnalysis. In the eastern United States, where land cover is oftenshaped more by historical land use than by natural processes, land-forms—as we have derived them—might serve as better predictorsof habitat diversity than maps of land cover derived from Landsatimagery. Furthermore, landforms can be used as a means of en-hancing interpretation of such imagery or used in combination withland cover maps to predict the location and extent of natural com-munities. Some preliminary efforts at such predictions of naturalcommunities in New Hampshire have been promising (M. Ander-son, TNC, Boston, personal communication).
We hope this note will encourage others to further investigate theuse of physical diversity as a means of representing biological di-versity. Given the dearth of information on the distribution of spe-cies and communities, the uncertainty of making predictions of thesedistributions, and the importance of considering long-term processesin the establishment of nature reserves, landscape diversity may bea cost-effective means for planning conservation of biological di-versity.
Literature CitedBurnett, M.R., P.V. August, J.H. Brown, Jr., and J.T. Killingbeck.
1998. The influence of geomorphological heterogeneity onbiodiversity: I. A patch-scale perspective. Conservation Biol-ogy 12:363-370.
Fels, J.E., and K.C. Matson. 1997. A cognitively-based approachfor hydrogeomorphic land classification using digital terrainmodels. Proceedings, Third International Conference on Inte-grating GIS and Environmental Modeling. National Center forGeographic Information and Analysis, Santa Barbara, Califor-nia.
Hunter, M.L., G.L. Jacobson, and T. Webb III. 1988. Paleoecol-ogy and the coarse-filter approach to maintaining biological di-versity. Conservation Biology 2:375-385.
Hunter, M.L. 1991. Coping with ignorance: The coarse-filter strat-egy for maintaining biodiversity. Pages 266-281 in K. Kohm,editor. Balancing on the brink of extinction. Island Press, Wash-ington, D.C.
Lapin, M., and B.V. Barnes. 1995. Using the landscape ecosys-tem approach to assess species and ecosystem diversity. Con-servation Biology 9:1148-1158.
Nicholls, W.F., K.T. Killingbeck, and P.V. August. 1998. The in-fluence of geomorphological heterogeneity on biodiversity. II.A landscape perspective. Conservation Biology 12:371-379.
Digital Atlas of Idaho: A GIS Approach toTeaching Natural History
STEPHEN BURTON AND CHARLES R. PETERSON
Idaho State University, Pocatello
Several products from the Gap Analysis Program are being used ina new education project called the Digital Atlas of Idaho. The pri-mary goal of the Digital Atlas of Idaho is to integrate data fromgeology and biology to help Idaho students and educators learnabout natural history using information specific to Idaho. Thisproject was funded by an Idaho State Board of Education (SBOE)Technology Incentive Grant and is a joint venture between IdahoState University (ISU), Boise State University, the Idaho Geologi-cal Survey, the Idaho Museum of Natural History, and the U.S. For-est Service. In this document, we describe the Digital Atlas of Idahoand how Gap Analysis products have been used in its development.
The Digital Atlas of Idaho makes large amounts of spatial and naturalhistory information about Idaho readily available in a Web-based
form. Students and teachers will have access to the atlas throughWeb browsers such as Netscape Communicator and Internet Ex-plorer, making the atlas compatible with Windows, Mac, and UNIXoperating systems. A beta version of the Digital Atlas of Idaho isalready viewable at http://imnh.isu.edu/digitalatlas. We are alsoproviding the atlas on a CD-ROM to teachers, free of charge, sothey can use the atlas in the classroom without an Internet connec-tion.
Containing information about geology, biology, hydrology, clima-tology, and historical geography, this teaching resource is probablythe single most comprehensive guide to Idaho’s natural history. Inthe biology section of the atlas (Figure 1), species accounts are pro-vided for over 400 species of animals in Idaho, including butter-flies, amphibians, reptiles, birds, and mammals. Each account con-tains information about a species’ range, predicted distribution, habi-tat, diet, ecology, reproduction, and conservation status.
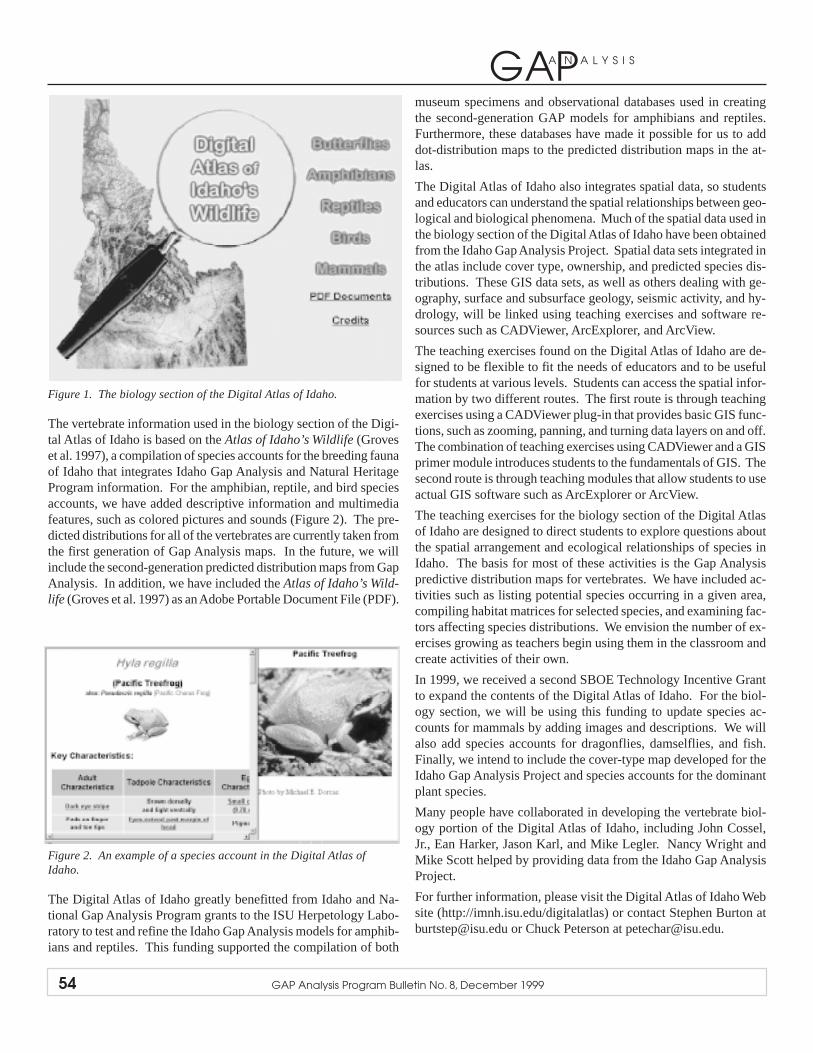
GAPA N A L Y S I S
54 GAP Analysis Program Bulletin No. 8, December 1999
Figure 1. The biology section of the Digital Atlas of Idaho.
The vertebrate information used in the biology section of the Digi-tal Atlas of Idaho is based on the Atlas of Idaho’s Wildlife (Groveset al. 1997), a compilation of species accounts for the breeding faunaof Idaho that integrates Idaho Gap Analysis and Natural HeritageProgram information. For the amphibian, reptile, and bird speciesaccounts, we have added descriptive information and multimediafeatures, such as colored pictures and sounds (Figure 2). The pre-dicted distributions for all of the vertebrates are currently taken fromthe first generation of Gap Analysis maps. In the future, we willinclude the second-generation predicted distribution maps from GapAnalysis. In addition, we have included the Atlas of Idaho’s Wild-life (Groves et al. 1997) as an Adobe Portable Document File (PDF).
Figure 2. An example of a species account in the Digital Atlas ofIdaho.
The Digital Atlas of Idaho greatly benefitted from Idaho and Na-tional Gap Analysis Program grants to the ISU Herpetology Labo-ratory to test and refine the Idaho Gap Analysis models for amphib-ians and reptiles. This funding supported the compilation of both
museum specimens and observational databases used in creatingthe second-generation GAP models for amphibians and reptiles.Furthermore, these databases have made it possible for us to adddot-distribution maps to the predicted distribution maps in the at-las.
The Digital Atlas of Idaho also integrates spatial data, so studentsand educators can understand the spatial relationships between geo-logical and biological phenomena. Much of the spatial data used inthe biology section of the Digital Atlas of Idaho have been obtainedfrom the Idaho Gap Analysis Project. Spatial data sets integrated inthe atlas include cover type, ownership, and predicted species dis-tributions. These GIS data sets, as well as others dealing with ge-ography, surface and subsurface geology, seismic activity, and hy-drology, will be linked using teaching exercises and software re-sources such as CADViewer, ArcExplorer, and ArcView.
The teaching exercises found on the Digital Atlas of Idaho are de-signed to be flexible to fit the needs of educators and to be usefulfor students at various levels. Students can access the spatial infor-mation by two different routes. The first route is through teachingexercises using a CADViewer plug-in that provides basic GIS func-tions, such as zooming, panning, and turning data layers on and off.The combination of teaching exercises using CADViewer and a GISprimer module introduces students to the fundamentals of GIS. Thesecond route is through teaching modules that allow students to useactual GIS software such as ArcExplorer or ArcView.
The teaching exercises for the biology section of the Digital Atlasof Idaho are designed to direct students to explore questions aboutthe spatial arrangement and ecological relationships of species inIdaho. The basis for most of these activities is the Gap Analysispredictive distribution maps for vertebrates. We have included ac-tivities such as listing potential species occurring in a given area,compiling habitat matrices for selected species, and examining fac-tors affecting species distributions. We envision the number of ex-ercises growing as teachers begin using them in the classroom andcreate activities of their own.
In 1999, we received a second SBOE Technology Incentive Grantto expand the contents of the Digital Atlas of Idaho. For the biol-ogy section, we will be using this funding to update species ac-counts for mammals by adding images and descriptions. We willalso add species accounts for dragonflies, damselflies, and fish.Finally, we intend to include the cover-type map developed for theIdaho Gap Analysis Project and species accounts for the dominantplant species.
Many people have collaborated in developing the vertebrate biol-ogy portion of the Digital Atlas of Idaho, including John Cossel,Jr., Ean Harker, Jason Karl, and Mike Legler. Nancy Wright andMike Scott helped by providing data from the Idaho Gap AnalysisProject.
For further information, please visit the Digital Atlas of Idaho Website (http://imnh.isu.edu/digitalatlas) or contact Stephen Burton [email protected] or Chuck Peterson at [email protected].

GAPA N A L Y S I S
GAP Analysis Program Bulletin No. 8, December 1999 55
Literature CitedGroves, C.R., B. Butterfield, A. Lippincott, B. Csuti, and J.M. Scott.
1997. Atlas of Idaho’s wildlife: Integrating Gap Analysis andNatural Heritage information. Idaho Department of Fish andGame, Nongame Endangered Wildlife Program. 372 pp.
A Gap Analysis of the Lewis & Clark Trail: FortPeck Dam to Great Falls, Montana
PATRICK CRIST AND MICHAEL JENNINGS
National Gap Analysis Program, Moscow, Idaho
In the summer of 1999, the National GAP office was contacted bythe Department of the Interior to see what type of analyses we couldproduce for a portion of the Lewis & Clark Trail. We previouslyhad produced a stewardship map of the western half of the trail, andnow we were charged with conducting a gap analysis and prelimi-nary biodiversity core reserve identification project in three weekstime. The data source was Montana GAP and included land coverderived from TM satellite imagery, predicted animal species distri-butions, and land stewardship. The data layers were then clipped tothe study area boundary, which was essentially a 20-mile buffer oneach side of the Missouri River from Fort Peck Dam to Great Falls,Montana (Figure 1).
Figure 1. Study area boundary.
Because of the very limited time available, the next step was tonarrow the number of species considered from the large numberoriginally mapped for the area. The criteria for selection were:
• The species is a terrestrial vertebrate mapped by Montana GAP.
• Less than 10% of the species’ distribution in Montana falls oncurrent reserve lands (GAP status 1 or 2).
• Species are state-threatened status S–3 or lower.
Thirty-six terrestrial vertebrates were identified that met the crite-ria above. The species distributions were clipped to the study areaboundary and then combined for the reserve selection process.
The reserve selection demonstration used an iterative“complementarity analysis” with the objective of finding the com-bination of places that represent at least one occurrence of everyspecies included in each taxonomic group. Jason Karl of the Uni-versity of Idaho’s Landscape Dynamics Lab developed the ARC/INFO programming to conduct the analysis. This began with se-lection of the largest land cover patch containing the most at-riskspecies. Then the next largest patch containing the most at-riskspecies was selected, and so on until a collection of potential re-serve locations was identified to represent all at-risk terrestrial ver-tebrates in each major taxonomic group. Time constraints did notallow further analysis that would incorporate other considerations,such as species viability, reserve connectivity and configuration formetapopulations, or socioeconomic factors. Those additional analy-ses would be included in a longer-term reserve selection and designprocess.
The three maps (Figure 2) depict the preliminary proposed reserveareas for the three taxonomic groups in relation to the fourbiodiversity management categories used by GAP. Status 1 & 2areas, shown in dark grey below, are existing reserves such as na-tional parks and wilderness areas; status 3 areas, shown in lightgray, are public multiple-use lands; and status 4 areas, shown inwhite, have no known management for biodiversity. The potentialreserves identified on these maps fall within status 3 & 4 lands.They show opportunities for avoiding possible future conservationcrises by changing the management of these areas.

GAPA N A L Y S I S
56 GAP Analysis Program Bulletin No. 8, December 1999
Figure 2. Potential future reserves for a) birds, b) mammals, and c)amphibians and reptiles.
Within the potential reserves identified, the U.S. Fish and WildlifeService is the largest owner of public lands. In this case the USFWSwould bear the largest agency responsibility for biodiversity stew-ardship. Most of the potential reserves that were identified, how-ever, fall within status 3 & 4 lands, suggesting the need for a changein land ownership or management for these areas.
ConclusionsThis project was a rapid gap assessment and reserve selection con-ducted over three weeks. There are many limitations to the results,but the project demonstrates the utility of Gap Analysis data andmethods to evaluate current biodiversity management status, iden-tify biotic elements that require increased management and protec-tion, and identify potential new reserve locations. A more robustanalysis would include the full complement of plant communitiesand species mapped by GAP as well as “enduring features” and
evaluation of species viability, connectivity, and quality. Reserveselection would incorporate evaluation of parcel-level land owner-ship, specific management practices, and socioeconomic consider-ations.
AcknowledgementsProject conducted by the National Gap Analysis office in coopera-tion with Conservation Imaging, Inc. and the Landscape DynamicsLaboratory of the University of Idaho Cooperative Fish and Wild-life Research Unit. GAP data produced by the Wildlife SpatialAnalysis Lab, MTCFWRU, University of Montana (Redmond etal. 1999).
Authors: Michael Jennings, GAP Director; Patrick Crist, NationalGAP Coordinator; Philip Tanimoto, Conservation Imaging; JasonKarl, Landscape Dynamics Lab; Jeremy Knudsen, GAP.

GAPA N A L Y S I S
GAP Analysis Program Bulletin No. 8, December 1999 57
Biodiversity Impacts from Urban Growthscale dependencies, allowing a wide range of normally incompat-ible data to be integrated. Using the county as the area of analysis,sites of potential conflict between biodiversity and predicted ur-banization are forecast at the landscape level. The model approachfacilitates a consistent use of multiscale data and analyses.
Preliminary results are encouraging, showing that quantitative, re-peatable assessments of biodiversity are possible at multiple spatialscales. Following an analysis of potential urban growth scenarios,it appears that a consistent set of species are likely to be impacted,in spite of significant variation in growth model parameters. Typi-cally, the 50-year forecast models identify conflicts with speciesnot currently protected under state or federal regulations. This typeof local, species-specific forecasting will be invaluable to conser-vation biologists for anticipating and hopefully avoiding future lossesof biodiversity. This work is supported by a grant from the USGSGap Analysis Program for the integration of socioeconomic factorswith Gap Analysis and biodiversity planning.
A Report on GAP ResearchProject #00HQAG0009CHRISTOPHER COGAN
Department of Geography, University of California-Santa Barbara
The analysis of conflicts between biodiversity and urbanization re-quires several types of input data, collected at varying spatial scales.Urban planners working at the county level need both fine-graindata such as endangered species locations and, simultaneously,coarse-filter ecoregional information and socioeconomic indicators.Whereas much ecological research is done at relatively fine spatialscales, other work uses tools such as remote sensing to study habi-tats more broadly. A major problem in constructing effective deci-sion support systems for biodiversity planning is thus the integra-tion of data assessed over multiple spatial and temporal scales.
Work is in progress to develop a biodiversity model that minimizes
Applications of New York GAP DataCHARLES R. SMITH
New York Cooperative Fish and Wildlife Research Unit, CornellUniversity, Ithaca, New York
During the last year the New York GAP Project has continued to par-ticipate in the Hudson River Estuary Biodiversity Conservation Initia-tive under contract with the New York State Department of Environ-mental Conservation. In cooperation with the NY Natural HeritageProgram, a gap analysis is under way for the Hudson River Valley(HRV), and a verbal interim report was presented in May 1999.
In the context of the NY Gap Analysis Project, our work in the HRVfocuses on several biodiversity content and context questions, impor-tant for evaluating the contributions of the HRV to statewide biodiversityand relevant to planning for biodiversity conservation in the HRV.Among the questions we are addressing are the following:
Comparison of HRV with the rest of New York State: 1) How manyand which terrestrial vertebrates and vegetative community associa-tions (or superalliances) are found in the HRV? 2) What proportion ofthe “fine-filter” elements (i.e., species) and “coarse-filter” elements(i.e., vegetative associations or superalliances) of NY biodiversity arerepresented in the HRV? 3) Are there any terrestrial vertebrate speciesor vegetative community associations (or superalliances) found onlyin the HRV and nowhere else in NY? If so, what are they, and whereare they found in the HRV?
Comparison of HRV counties with each other: 1) What is the rankingof counties in the HRV for elements of biodiversity represented withintheir boundaries at both fine-filter and coarse-filter levels, from mostdiverse to least diverse? 2) Which county has the most amphibian spe-
cies? reptile species? bird species? mammal species? 3) Within theHRV, which species and vegetation types are well represented on pub-lic lands, and which taxa are poorly or not at all represented on publiclands? 4) What is the ranking of public lands in the HRV for the ele-ments of biodiversity represented within their boundaries, at both fine-filter and coarse-filter levels, from most diverse to least diverse?
These kinds of questions are in addition to the traditional gap analysisquestions, which also will be addressed for the HRV: 1) Where are thecenters of high terrestrial vertebrate and vegetative diversity, and whereare they located relative to public lands? 2) Are there “gaps” where wehave regions of high biodiversity in the absence of public land status?
Additional funding was approved for new, complementary, GAP-re-lated projects which began in April 1999. All projects are focused onapplications of gap analysis and remote sensing methodologies to theHRV. These projects include development of a spectral signature andstatus assessment for expanses of Purple Loosestrife, an invasive, ex-otic plant species widely distributed in HRV wetlands; development ofprocedures for integrating assessment of habitat-specific relative abun-dance values for breeding birds within land cover types in the HRV,using the GAP land cover map; and an assessment of threats tobiodiversity from urban and suburban development, based on applica-tions of socioeconomic information derived from U.S. Census data.We also have continued to provide GIS support and analytical servicesfor landscape conservation efforts in the HRV, including maintainingthe growing biodiversity database for the region, analyzing data as re-quired for implementation of biodiversity conservation strategies, re-fining the land cover map for the region, and providing information tocommunities in the region to aid in local conservation efforts.

GAPA N A L Y S I S
58 GAP Analysis Program Bulletin No. 8, December 1999
STATE PROJECT REPORTS(Status as of fall 1999)
All completed products and reports will be available through the National GAP Web site at http://www.gap.uidaho.edu/Projects/Data.asp.Drafts and other products may be obtained from the state project PI as noted.
ArizonaVersion 1 project near completion; Version 2 update under way
Anticipated completion date: June 2000; update: July 2004
Contacts: Kathryn A. Thomas, Project LeaderUSGS Forest and Rangeland Ecosystem Science CenterColorado Plateau Field Station, [email protected], (520) 556-7466 x235
Sarah R. Jacobs, AZ-GAP Update CoordinatorUSGS Forest and Rangeland Ecosystem Science CenterColorado Plateau Field Station, [email protected], (520) 556-7466 x240
Original AZ-GAP Project:
The Arizona GAP land cover map, with 54 land cover categories, isfinished and is available at http://srnr.arizona.edu/nbs/gap. The as-
AlabamaOrganizing
Anticipated completion date: December 2004
Contact: James B. GrandAlabama Cooperative Fish and Wildlife Research UnitAuburn University, [email protected], (334) 844-4796
A Gap Analysis Project for Alabama was initiated December 8,1999, with a Cooperator’s Workshop. The anticipated start date isMarch 2000.
AlaskaNot started
updateupdate

GAPA N A L Y S I S
GAP Analysis Program Bulletin No. 8, December 1999 59
sessment of this map was completed through a partnership of Uni-versity of Arizona and Northern Arizona University. The land stew-ardship map is completed and ready to be incorporated into thefinal GAP report. Gap analysis for Arizona has been completed;the tables and graphs are now being finalized. The AZ-GAP finalreport is near completion. Our anticipated date of delivery is theend of February 2000. We anticipate that all the data will be on theWeb site (listed above) by the end of March.
Southwest Regional GAP Project:
Land cover: Arizona, Nevada, Utah, Colorado, and New Mexicoare embarking on a multiyear project to update GAP in the South-west as a coordinated regional effort. The Southwest regional projectwill develop new digital map databases, focusing first on the landcover map. A consistent approach for mapping land cover is essen-tial for success of a regional gap analysis. Consistency across stateboundaries can be accomplished by using a standardized classifi-cation system (rather than each state having a unique system) andmapping zones (rather than state boundaries).
A standardized classification system, the National Vegetation Clas-sification System (NVCS), will facilitate use of the land cover mapthroughout the Southwest. The NVCS is regarded as a major steptoward enhancing our ability to understand, protect, and managethe natural resources of the United States. It provides a hierarchi-cal framework for describing vegetation and a convention for iden-tifying and naming additional vegetation types. A description ofthe NVCS is available at http://consci.tnc.org/library/pubs/class/index.html. A set of preliminary alliance names have been devel-oped in Arizona, but it is expected that the project will expand andfurther define alliances for Arizona.
Arizona will use satellite imagery from the latest earth satellite ob-servation system, Landsat 7 Enhanced Thematic Mapper Plus, todelineate preliminary land cover polygons. It is anticipated that theimproved spatial resolution (15 m) from the newly added panchro-matic band will increase accuracy and definition in land cover map-ping. Prior to classification, the imagery will undergo preprocess-ing and stratification at a regional laboratory.
Mapping zones will create a seamless land cover map for the South-west by dividing the area into ecological rather than administrativeunits. The use of mapping zones will maximize information ex-traction from the satellite imagery by separating the imagery intosmaller, more homogeneous areas prior to classification.
Animal modeling: Arizona will cooperate to produce a prelimi-nary consolidated list of terrestrial vertebrate species and prelimi-nary distribution maps for the Southwest region. The SW GapAnalysis Update five-state team met in January 2000 to develop theinterstate strategy for vertebrate distribution modeling.
ArkansasComplete (see http://www.cast.uark.edu/gap/)
CaliforniaComplete (see http://www.biogeog.ucsb.edu/projects/gap/gap_home.html)
ColoradoNear completion
Anticipated completion date: June 2000
Contact: Donald L. SchruppColorado Division of Wildlife, [email protected], (303) 291-7277
Land cover: Land cover base coverage is complete and undergo-ing accuracy assessment. Interpretation of air video for accuracyassessment is also complete; preliminary traditional and fuzzy ac-curacy estimates have been calculated for both overall map accu-racy and accuracy of individual types. Interpretation of these sta-tistics is under way.
Animal modeling: Animal models have been generated for 597species, reviewed by cooperators, and applied to generate the spe-cies/stewardship tables for CO-GAP’s final report.
Land stewardship: The land stewardship coverage for CO-GAPwas finalized with edits based on Bureau of Land Management’sAreas of Critical Environmental Concern.
Analysis: Standard state report tables have been generated and ana-lyzed for the CO-GAP final report. Table information was used toprepare the analysis chapters for the final report, and the chapterswere distributed for team review. Copies were distributed for finalcooperator review in November 1999.
Reporting and data distribution: Development and delivery offinal CO-GAP deliverables to the National GAP Office is on targetfor March 2000.
Other accomplishments and innovations: Materials for the CO-GAP home page (http://ndis.nrel.colostate.edu/cogap/cogaphome.html) are being developed concurrently withdeliverables for the National GAP Office. The CO-GAP home pageis targeted for public access in February 2000 (http://ndis.nrel.colostate.edu/cogap/cogaphome.html).
Additionally, Colorado has joined with Arizona, Nevada, NewMexico, and Utah in initiating the Southwest ReGAP project toextend state GAP project work to the landscape level for use inbiodiversity planning efforts in the Southwest. Lee O’Brien will bethe Colorado state coordinator for the SW-ReGAP initiative. Thefive states have already begun to develop a collective list of theirspecies models and plan to meet in January 2000 to develop anintegrated workplan.

GAPA N A L Y S I S
60 GAP Analysis Program Bulletin No. 8, December 1999
Connecticut(see Massachusetts, Connecticut, and Rhode Island)
Delaware(see Maryland, Delaware, and New Jersey)
FloridaNear completion
Anticipated completion date: June 2000
Contact: Leonard PearlstineFlorida Cooperative Fish and Wildlife Research UnitUniversity of Florida, [email protected], (352) 846-0630
Land cover: A 70-class (59 natural classes) land cover classifica-tion from 1993/94 Landsat Thematic Mapper imagery is complete.All of the classification has been reviewed by the Florida Fish andWildlife Conservation Commission except for two Landsat scenesof the Florida panhandle that are currently under review. Accuracyassessment is also being conducted by evaluating low altitude,geocoded videography and digital photography.
Animal modeling: Habitat-affinity matrices have been completedand matched to the final land cover classification. The ARC/INFOAML programs to conduct spatial modeling of species distribu-tions have been completed and tested. Wildlife habitat models willbe run for all species and should be completed by December 1999.
Land stewardship mapping: The Florida Natural Areas Inventory(FNAI) of The Nature Conservancy Heritage Program has inde-pendently compiled GIS coverages of conservation lands for Florida.GAP ownership and management codes have been added as at-tributes to the FNAI coverage. FNAI is working with FL-GAP totranslate their protection status rankings to the ranking scheme re-quired for GAP.
Analysis: We are awaiting completion of the Florida land steward-ship coverage to begin analysis of the land cover types. Analysis ofthe wildlife habitat models will be conducted as the models arecompleted. Expected date of completion for the analysis is lateDecember 1999.
Reporting and data distribution: The land cover and wildlife mod-eling methodology sections of the final report are nearing comple-tion. Draft products can be viewed at the FL-GAP Web site atwww.wec.ufl.edu/coop/gap. As products are completed, they willbe available on the FL-GAP Web site.
Publications:
Allen, C., L. Pearlstine, and W. Kitchens. (Accepted). Modelingviable mammal populations in gap analyses. Biological Con-servation.
GeorgiaUnder way
Anticipated completion date: October 2001
Contact: Elizabeth KramerNatural Resource Spatial Analysis LaboratoryInstitute of Ecology, University of Georgia, [email protected], (706) 542-2968
Land cover: The Georgia Gap Analysis Project began in July 1998.From January 1999 to January 2000 significant progress has beenmade in all areas of the project. Specifically, we have:
1. Developed a protocol and progressed in creating a general landcover map of the state on a county-by-county basis. To date, 36counties (out of 159) have been completed. Figure 1 below showsthe progress of the state land cover mapping initiative.
Figure 1. Status of the general land cover map for Georgia.
2. Ground-checked two of the above counties with a reported over-all accuracy of 87%.
3. Continued to refine the list of vegetation alliances to be mappedin the second iteration of the land cover mapping effort. In someinstances this required aggregating several alliances into a singlemapping unit.

GAPA N A L Y S I S
GAP Analysis Program Bulletin No. 8, December 1999 61
4. Began development of rules to be used in predicting aggregatedvegetation alliances.
5. Continued training seven image processors to implement the veg-etation mapping protocol.
Over the next 12 months, we anticipate completing the general landcover map of the state and will implement models of the distribu-tion of vegetation alliances. Additionally, we will engage in a se-ries of ground-truth surveys to assess the accuracy of these maps.We are also working with Dana Slaymaker of the University ofMassachusetts to develop a new color infrared digital video sys-tem, which we will use to gather high-resolution land cover data inthe spring/summer and fall of 2000.
Animal modeling: To date, a list of Georgia’s vertebrates has beencompiled, and a literature search is under way to determine habitatrequirements for vertebrate species known to breed or winter inGeorgia. These requirements are being entered into a relationaldatabase and will be cross-walked to the general land cover classi-fication and, when possible, to the more detailed vegetation alli-ance classification. From this database, individual species modelswill be built to determine spatial distributions of the vertebrates inquestion. Locational information on rare species across all taxawill be obtained from the Natural Heritage Program’s element oc-currences database from the Georgia Department of Natural Re-sources. Additionally, agreements are being set up with the Geor-gia Museum of Natural History to obtain a copy of the database ofdistributional records for all vertebrates in their collection, includ-ing fish. GA-GAP has also implemented a pilot program focusingon the development of methods for aquatic gap analysis.
Land stewardship mapping: With funds provided by the U.S. En-vironmental Protection Agency, Region 4, land stewardship map-ping has been completed, and a CD-ROM of the data has been pro-vided to the National GAP office. See the section on data distribu-tion for details on how to obtain a copy of this database. To date, 14agencies and many individuals have requested and received copiesof the Georgia Conservation Lands database.
Analysis: We have begun a preliminary analysis of the distributionand status of protected lands in the state, addressing such questionsas the proportion and spatial distribution of: protected lands in eachcategory of GAP status, protected lands in each ecoregion, pro-tected lands that allow timber harvesting, and a breakdown of theprotected lands by managing authority. This analysis will continueover the next 12 months as the land cover maps and vertebrate dis-tribution maps are developed.
Reporting and data distribution: Maintenance of the Georgia con-servation lands database has been turned over to Chris Canalos ofthe Georgia Department of Natural Resources, Wildlife ResourcesDivision, phone: (706) 557-3032, fax: (706) 557-3033, e-mail:[email protected]. The database and its associ-ated metadata can be downloaded from the Georgia GIS data clear-inghouse (http://www.gis.state.ga.us/) or received via anonymousFTP from the NARSAL Lab at the Institute of Ecology, Universityof Georgia (UGA), following these instructions:
1. ftp greer.ecology.uga.edu, 2. cd pub, 3. bin, 4. prompt, 5. mgetconservation.*, 6. bye.
Other accomplishments and innovations: GA-GAP will providethe base map for the Georgia Land Use Trends analysis program(GLUT), a 1-million-dollar project funded by The Turner Founda-tion. The GLUT project will also be run by Dr. Elizabeth A. Kramerof UGA’s Institute of Ecology in cooperation with UGA’s CarlVinson Institute of Government. The project will retroactively cre-ate a series of land cover maps for the state of Georgia representingfive increments for the past 25 years to show how Georgia’s rapidgrowth has affected land use in urban and rural areas.
HawaiiOrganizing
Anticipated completion date: December 2004
Contact: Samuel M. Gon IIIThe Nature Conservancy of Hawaii, [email protected], (808) 537-4508 x241
Land cover: Initial drafts of land cover have been completed fornative vegetation. The goal is to develop more detailed units forboth native and non-native vegetation. Masks for urban and majoragricultural lands are planned. (Note: A graphic of Hawaii landcover can be viewed in the Web version of the Bulletin at http://www.gap.uidaho.edu/Bulletins/8.)
Animal modeling: Compilations of Natural Heritage Program oc-currence records for endangered birds are complete. We intend toconvene working groups to develop range maps for birds, bats, andselected native invertebrates.
Land stewardship mapping: Major land ownership patterns forthe state are completed. We will develop management classesthrough working group meetings and assign these attributes to ex-isting managed land units.
Analysis: We intend to adapt analysis algorithms of other states toapply to the higher resolution needed for small tropical insular sys-tems. We will convene the analysis working group on this matter.
IdahoVersion 1 published in the peer-reviewed literature. Version 2 up-date near completion.
Anticipated completion date: June 2000
Contact: Leona K. BomarIdaho Cooperative Fish and Wildlife Research Unit, [email protected], (208) 885-5788http://www.wildlife.uidaho.edu/idgap.htm

GAPA N A L Y S I S
62 GAP Analysis Program Bulletin No. 8, December 1999
Land cover: The ID-GAP land cover layer and final report chapterare complete. The land cover classification recognizes 81 covertypes and is mapped at a resolution of 0.09 ha with a 2 ha MMU.
Animal modeling: Wildlife habitat relationship models have beencompleted for 375 terrestrial vertebrates in Idaho. The models arestored as georeferenced TIFF images with a native resolution of0.09 ha.
Land stewardship mapping: The revised Idaho land stewardshipdatabase is also complete. This data set represents a significantimprovement over the original Idaho land stewardship layer by in-creasing spatial resolution to a 2 ha MMU and incorporating manyof the smaller managed areas in Idaho.
Analysis: Analysis of the protection status of Idaho’s land covertypes is complete. Analysis of wildlife habitat distributions will becompleted in early December 1999.
Reporting and data distribution: The final report for ID-GAP isawaiting completion of the wildlife habitat distribution analysis.All data, metadata, and documentation are currently available fordownload from the URL above or by contacting the Idaho Coop-erative Fish and Wildlife Research Unit.
Other accomplishments and innovations: We have conducted agap analysis of geomorphologic and climatic features in Idaho. Wewill compare the results of this analysis with those from land coverand wildlife habitat analyses.
IllinoisUnder way
Anticipated completion date: December 2001
Contacts: Jocelyn L. Aycrigg, GAP CoordinatorIllinois Natural History Survey, [email protected], (217) 244-2111
Linda Schwab, Assistant GAP CoordinatorIllinois Natural History [email protected], (217) 265-8425
Land cover: A general land cover classification for the state wascompleted in October 1995. This classification identified 19 landcover classes: four urban, three forest and woodland, three agricul-ture, two grassland, five wetland, and two other categories (waterand barren areas). The alliance-level GAP vegetation classifica-tion is being performed by stratifying along land cover classes.Classification protocols are similar to protocols for UM-GAP (seeBulletin No. 5, p. 35). Classification to the community/alliancelevel has been completed for southern Illinois. We have concen-trated our efforts on the western side of the state along the Missis-sippi River near East St. Louis. We have obtained ancillary datasuch has DEMs and forest inventory information, which have as-sisted us in our classification. We plan to classify TM scenes north-
ward along the Mississippi River as well as in northeastern Illinoisin the coming year. Furthermore, we will explore methods for con-ducting accuracy assessment in anticipation of completing the veg-etation classification.
Animal modeling: We have created a list of amphibians, reptiles,and mammals to be mapped. We are using specimens collected bythe Illinois Natural History Survey (INHS) and the University ofIllinois Museum of Natural History to obtain locational records foreach species. We have also obtained museum records from theSmithsonian, American Museum of Natural History, Chicago FieldMuseum, Kansas State Museum of Natural History, and Museumof Vertebrate Zoology at Berkeley. Furthermore, we have obtainedinput from wildlife habitat biologists throughout the state regard-ing species known to occur in their district. We have completedmapping the amphibian, reptile, and mammal collection of the Illi-nois Natural History Survey and the University of Illinois Museumof Natural History. We are currently mapping the mammal collec-tions of Illinois from other museums. We plan to conduct an expertreview of the amphibian and reptile range maps as well as finish upthe habitat associations. We will also continue gathering habitatassociation information for each mammal species. Informationgathered previously for the Illinois Fish and Wildlife InformationSystem will be helpful in developing habitat associations. We willuse the breeding bird survey for Illinois and the Illinois BreedingBird Atlas to create a list of bird species to be mapped and begindelineating ranges for those species.
Land stewardship mapping: We have developed a land steward-ship map for Illinois, attributed general ownership categories, andassigned management status levels. The GAP coding scheme forland units has been assigned to each property. The database needsto be reviewed to determine if all properties have been included.
Analysis: We have completed some preliminary analyses usingamphibian, reptile, and mammal locational data to create speciesrichness maps using the EMAP hexagons. We have also startedsome analyses of species that occur only in southern Illinois, forwhich we have a completed alliance-level classification. We willcontinue to do more analyses as our species and vegetation map-ping progresses.
Reporting and data distribution: In the coming year, we will fin-ish the statewide alliance-level classification of vegetation and con-tinue our work on the species modeling. We will start writing seg-ments of the report in the coming year.
Other accomplishments and innovations: A Web page for theIllinois Gap Analysis Project has been created and can be viewed atwww.inhs.uiuc.edu//cwe/gap/gapintro.html. We were able to ob-tain new cooperators with the assistance of the Illinois Departmentof Natural Resources. The U.S. Department of Agriculture’s Na-tional Agricultural Statistics Service and the Illinois Department ofAgriculture have agreed to work with us to obtain and classify state-wide TM imagery.
Presentations on the Illinois Gap Analysis Project were given to thesenior agency managers of the Illinois Department of Natural Re-
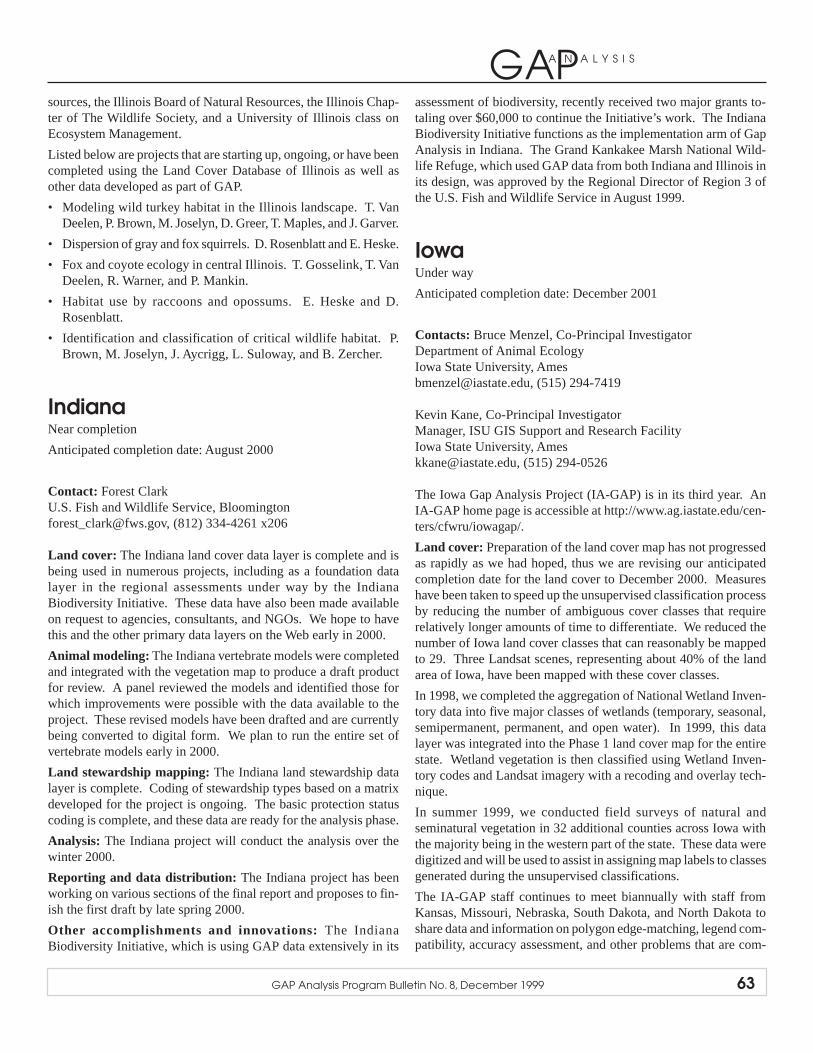
GAPA N A L Y S I S
GAP Analysis Program Bulletin No. 8, December 1999 63
sources, the Illinois Board of Natural Resources, the Illinois Chap-ter of The Wildlife Society, and a University of Illinois class onEcosystem Management.
Listed below are projects that are starting up, ongoing, or have beencompleted using the Land Cover Database of Illinois as well asother data developed as part of GAP.
• Modeling wild turkey habitat in the Illinois landscape. T. VanDeelen, P. Brown, M. Joselyn, D. Greer, T. Maples, and J. Garver.
• Dispersion of gray and fox squirrels. D. Rosenblatt and E. Heske.
• Fox and coyote ecology in central Illinois. T. Gosselink, T. VanDeelen, R. Warner, and P. Mankin.
• Habitat use by raccoons and opossums. E. Heske and D.Rosenblatt.
• Identification and classification of critical wildlife habitat. P.Brown, M. Joselyn, J. Aycrigg, L. Suloway, and B. Zercher.
IndianaNear completion
Anticipated completion date: August 2000
Contact: Forest ClarkU.S. Fish and Wildlife Service, [email protected], (812) 334-4261 x206
Land cover: The Indiana land cover data layer is complete and isbeing used in numerous projects, including as a foundation datalayer in the regional assessments under way by the IndianaBiodiversity Initiative. These data have also been made availableon request to agencies, consultants, and NGOs. We hope to havethis and the other primary data layers on the Web early in 2000.
Animal modeling: The Indiana vertebrate models were completedand integrated with the vegetation map to produce a draft productfor review. A panel reviewed the models and identified those forwhich improvements were possible with the data available to theproject. These revised models have been drafted and are currentlybeing converted to digital form. We plan to run the entire set ofvertebrate models early in 2000.
Land stewardship mapping: The Indiana land stewardship datalayer is complete. Coding of stewardship types based on a matrixdeveloped for the project is ongoing. The basic protection statuscoding is complete, and these data are ready for the analysis phase.
Analysis: The Indiana project will conduct the analysis over thewinter 2000.
Reporting and data distribution: The Indiana project has beenworking on various sections of the final report and proposes to fin-ish the first draft by late spring 2000.
Other accomplishments and innovations: The IndianaBiodiversity Initiative, which is using GAP data extensively in its
assessment of biodiversity, recently received two major grants to-taling over $60,000 to continue the Initiative’s work. The IndianaBiodiversity Initiative functions as the implementation arm of GapAnalysis in Indiana. The Grand Kankakee Marsh National Wild-life Refuge, which used GAP data from both Indiana and Illinois inits design, was approved by the Regional Director of Region 3 ofthe U.S. Fish and Wildlife Service in August 1999.
IowaUnder way
Anticipated completion date: December 2001
Contacts: Bruce Menzel, Co-Principal InvestigatorDepartment of Animal EcologyIowa State University, [email protected], (515) 294-7419
Kevin Kane, Co-Principal InvestigatorManager, ISU GIS Support and Research FacilityIowa State University, [email protected], (515) 294-0526
The Iowa Gap Analysis Project (IA-GAP) is in its third year. AnIA-GAP home page is accessible at http://www.ag.iastate.edu/cen-ters/cfwru/iowagap/.
Land cover: Preparation of the land cover map has not progressedas rapidly as we had hoped, thus we are revising our anticipatedcompletion date for the land cover to December 2000. Measureshave been taken to speed up the unsupervised classification processby reducing the number of ambiguous cover classes that requirerelatively longer amounts of time to differentiate. We reduced thenumber of Iowa land cover classes that can reasonably be mappedto 29. Three Landsat scenes, representing about 40% of the landarea of Iowa, have been mapped with these cover classes.
In 1998, we completed the aggregation of National Wetland Inven-tory data into five major classes of wetlands (temporary, seasonal,semipermanent, permanent, and open water). In 1999, this datalayer was integrated into the Phase 1 land cover map for the entirestate. Wetland vegetation is then classified using Wetland Inven-tory codes and Landsat imagery with a recoding and overlay tech-nique.
In summer 1999, we conducted field surveys of natural andseminatural vegetation in 32 additional counties across Iowa withthe majority being in the western part of the state. These data weredigitized and will be used to assist in assigning map labels to classesgenerated during the unsupervised classifications.
The IA-GAP staff continues to meet biannually with staff fromKansas, Missouri, Nebraska, South Dakota, and North Dakota toshare data and information on polygon edge-matching, legend com-patibility, accuracy assessment, and other problems that are com-

GAPA N A L Y S I S
64 GAP Analysis Program Bulletin No. 8, December 1999
mon to GAP in the Great Plains Region.
Vertebrate modeling: Species lists for mammals, birds, reptiles,and amphibians are compiled and include state, federal, and globalstatus codes for each species. These lists, which are ready for ex-pert review, appear on the IA-GAP Web site. Selected scientistsfrom across the state are being invited to serve as expert reviewersof the species lists and habitat models. During 1999 we continuedto assemble historical data from museum and private collectionsand to compile information from the literature on species occur-rence, geographic ranges, and optimal habitat requirements.
Modeling of Iowa vertebrates has begun. Our goal is to completethe modeling effort by December 2000 and begin the preparationof distribution maps in January 2001, soon after the land cover mapis complete.
Land stewardship: We continued to acquire data on legal bound-aries of federal, state, and county lands in Iowa. Acquisition ofcounty properties has consumed the most time; of 99 counties, 60have been completely digitized, 20 are near completion, and datafor an additional 8 counties have been acquired but not digitized.Data have been requested from the remaining 11 counties. Stateland boundaries were initially digitized by the Iowa Department ofNatural Resources in 1991. This database has been recently up-dated by the Department of Natural Resources (DNR) to includenew acquisitions and other changes up to mid-1999 and will bemade available to IA-GAP in January 2000. Boundary informationfor federal lands has been obtained from the U.S. Fish and WildlifeService and the U.S. Army Corps of Engineers. We anticipatecompletion of the land stewardship layer for IA-GAP in summer2000.
Other accomplishments: Extension wildlife staff at Iowa State Uni-versity, Department of Animal Ecology, with the help of an educa-tional grant from the Iowa Resource Enhancement and Protectionprogram, conducted eight NatureMapping training workshops acrossthe state in 1999; 110 people were trained. The program has beenenthusiastically received by a diverse group of people, includingschool teachers and environmental educators, landowners, nonprofitconservation groups, businesses, and agencies. A database and IowaNatureMapping Web site are currently under development.NatureMapping data will be sent for accuracy assessment to IowaState University via the NatureMapping Web site, then stored in apublicly accessible database at the State of Iowa GIS Office server.Additional funding is being sought to carry NatureMapping to an-other level during the coming year.
In spring 1999, EPA Region 7 agreed to partially fund a pilot studyto develop field and analytical techniques for accuracy assessmentusing ground surveys and the pixel (30 x 30 m) as the basic sam-pling unit. The statistics laboratory at Iowa State University is de-veloping a protocol for sampling design and data analysis to beused in a regionwide approach for accuracy assessment of land covermaps. In March 1999, coordinators from Missouri, Iowa, Kansas,and Nebraska met with EPA administrator Marla Downing and stat-isticians Sarah Nusser, Iowa State University, and Steve Stehman,
State University of New York-Syracuse, to discuss procedures forthe pilot field study conducted in 1999. We selected a four-countyarea in NE Iowa to conduct our portion of the pilot study and col-lected data from 145 sites in September and October 1999. Eachrandomly selected pixel was located using a real-time GPS unit.Each pixel in a nine-pixel matrix (target pixel in the center) wasassessed for vegetation and land cover and assigned a class corre-sponding to one of the 29 map labels. The results of the pilot studyare expected to be available by March 2000, when a decision willbe made whether to proceed with a regionwide accuracy assess-ment.
KansasUnder way
Anticipated completion date: April 2001
Contact: Glennis KaufmanKansas State University, [email protected], (785) 532-6622
Land cover: Currently, mapping of the state has been completed tothe cropland/natural vegetation stage. All of the land cover hasbeen classed to the alliance level, but we continue to refine the coverclasses. The land cover layer will be completed in December 1999.During the following nine months, accuracy assessment of the landcover layer will be ongoing with a heavy investment of time occur-ring during summer 2000. Figure 1 demonstrates current progress(see Web version of the Bulletin at http://www.gap.uidaho.edu/Bul-letins/8).
Animal modeling: Currently, species lists of terrestrial vertebratesto be mapped are finalized following expert review. Range distri-bution maps are being generated based on museum collections,publications, and current observations. We estimate that 85% ofthe literature has been collected for vertebrate models, and we arein the process of building wildlife habitat relationship models bothfor the state and Great Plains region. Ancillary databases also arebeginning to be discussed and built for use in the predicted habitatrelationship models. During the next nine months, all wildlife habitatrelationship models will be completed. Drafts of predicted speciesdistributions will be completed and sent out for expert review. Fol-lowing expert review, final species distribution maps will be gener-ated.
Land stewardship mapping: Currently, the land stewardship layeris near completion. Polygon boundaries are done for 210 managedareas throughout the state. As more land is purchased for conserva-tion in the state, we will update the layer to keep it current. Anumber of attributes (e.g., owner, county of location) already is inthe database that goes along with polygons. We are in the processof querying land unit managers in cooperating agencies about thelevel of protection in each area and will add this attribute informa-
GAPA N A L Y S I S
GAP Analysis Program Bulletin No. 8, December 1999 65
tion as it is obtained. Our goal is to complete the stewardship layerby June 2000.
Analysis: Analysis will be conducted by the end of 2000.
Reporting and data distribution: Reporting and data distributionare expected to be initiated by fall 2000, and we anticipate askingfor an extension to complete the final report.
Other accomplishments and innovations: We have created a GreatPlains ACCESS database for modeling of vertebrates within theGreat Plains states (North Dakota, South Dakota, Nebraska, Kan-sas, and Iowa). This database should allow us to produce seamlessmaps of the predicted distributions of Great Plains vertebrates inthe future.
KentuckyUnder way
Anticipated completion date: June 2002
Contacts: Tom Kind (land cover)Murray State [email protected], (270) 762-3110
Terry L. Derting (animal modeling)Murray State [email protected], (270) 762-6327
Keith Wethington (land stewardship mapping)Kentucky Department of Fish and Wildlife Resources, [email protected], (502) 564-7109
Land cover: All data layers for one physiographic province, theShawnee Hills of the Interior Low Plateaus, have been produced.Layers include interpreted air video points, classified TM data, con-vexity/concavity, slope, aspect, and National Wetlands Inventory(NWI). A draft of a detailed vegetation map containing naturalvegetation map units for the Shawnee Hills has been produced, us-ing a decision tree process, and is under review. Air video flightlines in other portions of the state have been ground-truthed, andair video has been recently collected over the eastern part of thestate. The short-term goal for the coming year includes incorporat-ing urban (high and low density), agriculture (pastureland/grass,cropland), and mined lands (bare ground, revegetated) into the draftmap. Completing a draft map of the entire state is the major goalfor the coming year.
Animal modeling: Considerable progress was made in 1999 to-ward modeling vertebrate distributions in Kentucky. We finalizedthe list of terrestrial vertebrate species to be modeled after its re-view by our state experts. Our final species list includes 51 reptile,52 amphibian, 63 mammal, and 198 bird species (364 species to-tal). Range maps of current distributions were delineated. A Webpage for the review of the range maps was constructed with the aid
of the Kentucky Department of Fish and Wildlife Resources(KDFWR), and the review process for the ranges has been com-pleted. Final range maps will be completed in December 1999.We are completing our database of the habitat association for eachspecies. We are also establishing a Web page, with the aid ofKDFWR, for the review of our habitat association information. Thehabitat associations will be posted for review by the end of 1999.
In addition to the required tasks of Gap Analysis, we are using thespecies range maps to map species richness in the ecoregions andphysiographic provinces of Kentucky. We have presented our analy-ses of species richness at the 2nd Annual Biodiversity Conferenceat Western Kentucky University and the 1999 Kentucky Academyof Science meeting at Eastern Kentucky University. Through meet-ings such as these we maintain open communication with biolo-gists, educators, and other interested parties in the state.
The database of final habitat associations will be produced during2000. Also, we will produce an initial wildlife/habitat relationshipmodel for each species. We plan on making draft maps of the pre-dicted occurrence of species depending upon the status of the veg-etation mapping for Kentucky.
Land stewardship mapping: Work on the stewardship layer hasfocused on assessment of data available. Agencies at the federal,state, and local government levels as well as nongovernment orga-nizations were contacted. Available information regarding data for-mat (digital or analog), management status, contact names, etc. wereobtained. Existing digital coverages will be acquired and convertedto a common projection during 2000. The large amount of nondigitalownership data makes it improbable that all managed lands in Ken-tucky will be included in the final analysis. A method for prioritiz-ing the conversion of analog to digital data, focusing on conserva-tion lands, will be developed.
LouisianaNear completion
Anticipated completion date: June 2000
Contact: Jimmy Johnston (project leader)USGS/National Wetlands Research Center, [email protected], (318) 266-8556
Steve Hartley (land cover, analysis)USGS/National Wetlands Research Center, [email protected], (318) 266-8543
Land cover: The land cover section for the final report is 98%complete, with an anticipated completion date of December 1999.Data directory structure for final CD distribution was completed inOctober 1999. We are working on the metadata for ancillary datasets.

GAPA N A L Y S I S
66 GAP Analysis Program Bulletin No. 8, December 1999
Animal modeling: Species distribution maps were reviewed andcorrected. Final digital data were delivered to the project office inAugust 1999. Hyper-distribution maps were created for all fourmajor vertebrate groups (mammals, birds, reptiles, and amphibians)in October 1999. Data directory structure for final CD distributionwas completed in October 1999. The animal modeling section forthe final report is 98% complete, with an anticipated completiondate of December 1999. We are still working on the metadata.
Land stewardship mapping: The data directory structure for finalCD distribution was completed in October 1999 for Louisiana’sland stewardship and management. The Land Stewardship andManagement section for the final report is 98% complete, with ananticipated completion date of March 2000.
Analysis: The analysis of land cover types and vertebrate speciesby land stewardship and management status was completed in Oc-tober 1999. Data directory structure for final CD distribution wasalso completed in October 1999. The Analysis section for the finalreport is currently under way, with an anticipated completion dateof December 1999.
Reporting and data distribution: Currently, the National WetlandsResearch Center is in the process of writing the final report, with ananticipated completion date of April 2000.
MaineComplete (see http://wlm13.umenfa.maine.edu/progs/unit/gap)
Maryland, Delaware, & NewJerseyNear completion
Anticipated completion date: October 2000
Contact: Ann Rasberry (land cover)Maryland Department of Natural Resources, [email protected], (410) 260-8558
Rick McCorkle (animal modeling)Delaware Bay Estuary ProjectU.S. Fish & Wildlife [email protected], (302) 653-9152 x17
Timothy A. Palmer (land stewardship)Maryland Department of Natural [email protected], (410) 260-8559
Land cover: During 1999 the land cover mapping made signifi-cant progress (see map in Web version of Bulletin at http://www.gap.uidaho.edu/Bulletins/8). The Delmarva Peninsula, thepiedmont, southern New Jersey, and eastern mountains of Mary-
land have been completed as draft maps. The remainder of Mary-land and New Jersey will be completed early in 2000, and accuracyassessment will begin at that point.
Attempts to install the necessary hardware to import our video intoa GIS format are under way. This will enable additional video to beused in the classification process where GPS capture was intermit-tent during video flights (e.g., over the mountains in western Mary-land).
A project Web page has been developed and will be available soonvia link to the national GAP Web page. Status of the project as wellas availability of products may be determined from informationfound at that location.
Animal modeling: In 1999, most of the vertebrate modeling workinvolved finalizing habitat layers, completing development of thedatabase, and fine-tuning the modeling software. In addition toland cover-derived habitats, the habitat layers used in the modelinginclude wetland/riparian buffers, elevation, forest area (measuredby thickness), riparian forest width, forest isolation, edge habitats,road density, land use (e.g., pasture), aquatic habitats, special habi-tat features (e.g., cliffs), and other special habitats that are gener-ally smaller than the land cover MMU (e.g., vernal pools). Thefeasibility of developing other potentially important habitat layers(e.g., soils) is still being evaluated.
The database includes tables for species-unique codes, speciesmodeling status, species range, species/habitat associations by taxa,forest metrics relationships (e.g., for forest interior dwelling birds),species guilds, species taxonomy, habitat types, habitat cross-walks(e.g., to alliance), species/landform relationships, species/wetlandbuffer relationships, species-special habitat features relationships,and several other tables to be used in the modeling or for variousqueries. The database was developed in Personal Oracle8 and hasbeen successfully imported to MSAccess. The modeling softwarewas developed through ArcView Avenue scripting to enable as muchautomation of the modeling as possible and includes some nicecustom query capabilities. Draft models and distribution maps willbe sent out for expert review during the winter of 1999/2000, andfinal models will be run by April 2000.
Land stewardship mapping: During 1999 the stewardship layerfor the Maryland portion of the project was completed. The Dela-ware portion is essentially complete; the work is under review as ofNovember 1999. For New Jersey, private conservation lands datahave been collected, but the public lands data are still outstanding.The land stewardship layer is expected to be completed for Dela-ware by the end of 1999 and for New Jersey in early 2000.
Analysis: GAP investigators expect to complete analysis of the pro-tection and management status of biodiversity in Maryland andDelaware by spring 2000 and expect the New Jersey analysis to becompleted by late summer 2000.
Reporting and data distribution: The final report writing for Mary-land, Delaware, and New Jersey has begun and should be com-pleted by October 2000. The GIS layers for Maryland and Dela-

GAPA N A L Y S I S
GAP Analysis Program Bulletin No. 8, December 1999 67
ware will be distributed in ARC/INFO/ArcView format, with asso-ciated data tables in Microsoft Access format, on CD-ROM. Asimilar approach will probably be used in New Jersey. The statusand availability of these products will be reported via the GAP Webpage.
Other accomplishments and innovations: By developing our ver-tebrate modeling scripts in ArcView’s Avenue, we have providedboth a user-friendly interface for accessing data tables and customcontrol over the modeling process. Users can query for species/habitat relationships or maps of species distributions, or survey thebase GIS layers used in the modeling; lists of species occupancycan also be generated from input of habitat information. In addi-tion, users can query the community alliance and wildlife habitattables, generating a list of potential alliances/habitat by input ofplant species, location, or physical characteristics of the site. Ef-forts are under way to make this software package portable for even-tual distribution of the GAP data sets.
Data sets are being used for considerable analysis even in their draftform. Examples include identifying areas with high potential forsupporting forest interior neotropical migrant songbirds on theDelmarva Peninsula, priority sites for forest restoration and/or ac-quisition, and a multiagency federal, state, and private collabora-tion on the Delmarva Peninsula (the Delmarva Conservation Corri-dor Initiative).
Massachusetts, Connecticut, &Rhode IslandComplete; update under way
Anticipated completion date: June 2000
Contact: Curtice Griffin and John FinnUniversity of Massachusetts, [email protected] (413) [email protected] (413) 545-1819
Land cover: An accuracy assessment of the land cover map com-pleted in 1997 is now under way. Preliminary results indicated thatthere were significant classification errors, especially in the CapeCod region. An error model is being developed from the accuracyassessment project. A revised land cover map will be developedfrom this error model. Additionally, development of a new landcover map is planned within the next 18 months as part of an NSF-funded project with the Department of Computer Science at theUniversity of Massachusetts.
Animal modeling: With completion of the expert review of mam-mal range maps during summer 1998, all vertebrate models arecomplete. Predicted habitats for all 273 vertebrates modeled in theSouthern New England region were identified and coarse speciesrichness maps developed for each taxonomic group. Additionally,
habitats were identified throughout the Connecticut River water-shed for priority species of neotropical migratory birds. We plan toredo the vertebrate habitat maps once the revised land cover map isavailable.
Land stewardship mapping: All conservation lands in the regionare mapped and classified according to conservation status. Thedatabase for Connecticut was not as well developed as for Massa-chusetts and Rhode Island. Over 15% of Southern New England isclassified as conservation lands, and about 7% of the land area wasclassed in the categories 1 & 2.
Analysis: Species richness analyses have been completed. The fi-nal gap analysis will be complete by June 2000.
Reporting and data distribution: All data layers are currently avail-able on the Southern New England Gap Analysis home page (http://outsider.fnr.umass.edu/gaphome.html). We plan to distribute thevertebrate models and predicted habitat data layers as an ArcViewproject. Revision of the land cover map will begin in April 2000.The final vegetation map will not be distributed on CD until revi-sions are complete. A manual for incorporating GPS-logged aerialvideography into land cover mapping efforts is under developmentand will be distributed on CD-ROM in May 2000. The final reportand a report on accuracy assessment will be available in June 2000.
Other accomplishments and innovations: Conducted two one-day workshops for regional planners on “Gap Analysis in the Con-necticut River Watershed: Landscape-based Approaches for Con-serving Biodiversity.“ The workshops were funded in part by theSilvio O. Conte National Fish and Wildlife Refuge and the Univer-sity of Massachusetts.
MichiganUnder way
Anticipated completion date: September 2002
Contact: Mike DonovanMichigan Department of Natural ResourcesMichigan Resource Information System, [email protected], (517) 335-3445
Land cover: Classification of the Northern Lower Peninsula is ex-pected to be completed in the second quarter of FY 2000. Classifi-cation of the Southern Lower Peninsula will begin in the first quar-ter of FY 2000. Classification of the Eastern Upper Peninsula isexpected in the second or third quarter of FY 2000. The WesternUpper Peninsula is completed in a preliminary version that uponreview may require revision.
Animal modeling: The animal modeling effort will begin in FY2000 with an expected collaboration with Michigan State Univer-sity.

GAPA N A L Y S I S
68 GAP Analysis Program Bulletin No. 8, December 1999
Land stewardship mapping: The stewardship layer was begun in1996 and continues. Completion is expected in summer of 2000.
Analysis: Gap analysis is scheduled to begin in FY 2001.
Reporting and data distribution: Land cover and stewardship datawill begin to be served by UMESC in the second and third quarterof FY 2000.
MinnesotaUnder way
Anticipated completion date: September 2002
Contact: David HeinzenMinnesota Department of Natural ResourcesResource Assessment Unit, Grand [email protected], (218) 327-4449 x222
Land cover: The state has been divided into 29 spectrally consis-tent classification units (SCCUs) based on a procedure described inthe Upper Midwest GAP Image Processing Protocol. Ten classi-fied SCCUs, complete with accuracy assessment, are scheduled fordelivery to UMESC in the first quarter of FY 2000.
Animal modeling: A working group of species experts has beenformed by the Wildlife Section of the Minnesota DNR. Work to-wards the development of the vertebrate species distribution mod-els will begin in FY 2000.
Land stewardship mapping: Preliminary public ownership/stew-ardship mapping is completed. The map is based on an ARC/INFOvector coverage of the Public Land Survey. Section corners aregeoreferenced. From those, a polygon grid of 40-acre tracts hasbeen generated. Each 40-acre polygon is then attributed for owner,manager, stewardship category, etc. In FY 2000 UMESC will cross-walk the MN DNR public owner categories to the official GAPcategories. Independent verification and cross-referencing of theMinnesota DNR lands stewardship classification will begin in FY2000.
Analysis: Gap analysis is scheduled to begin in FY 2001.
Reporting and data distribution: Land cover and stewardship datawill begin to be served by UMESC in the second and third quarterof FY 2000.
MississippiNear completion
Anticipated completion date: January 2001
Contact: Francisco J. Vilella (principal investigator)MS Cooperative Fish and Wildlife Research UnitMississippi State [email protected], (662) 325-0784
Richard B. Minnis (coordinator)MS Cooperative Fish and Wildlife Research UnitMississippi State [email protected], (662) 325-3158
Land cover: Land cover mapping has been completed. The finalmap product has been aggregated to 43 classes. Among them are anumber of classes discerning structure or age of the overstory veg-etation. Particularly, four classes have been obtained that relate tothe age of Mississippi’s pine ecosystems. Although this informa-tion is not required for the current mapping standards, the person-nel from the Spatial Information Technologies Laboratory at Mis-sissippi State University believed they could extract this informa-tion from the TM images. These data have proven very useful inrefining vertebrate distributions for species such as Red-cockadedWoodpecker (Picoides borealis) and Bobwhite Quail (Colinusvirginianus). Accuracy assessment is nearly complete and shouldbe finalized by December 1999. Map classes have been associatedwith NVCS alliances for each of the five ecoregions in the state.Metadata construction is in progress.
Animal modeling: Wildlife habitat relationship models are beingapplied to the final vegetation layer. Finished models are underreview by vertebrate committees. Amphibian and mammalian spe-cies are finished pending final review. Bird species are still underscrutiny by the review team. Ancillary data from 900 bird pointcounts conducted in Mississippi’s national forests and a large col-lection of museum records have aided in the refinement of habitatrelationships and distributions. Models are expected to be final-ized and reviewed by early spring 2000.
Land stewardship mapping: The land stewardship layer for thestate is complete. The Mississippi Department of Wildlife, Fisher-ies, and Parks provided MS-GAP with GPS-located boundaries forall state and federal lands. Additional properties, such as TNC andtribal lands, have also been incorporated. Metadata construction isnear completion for these data.
Analysis: Macros have been written to perform the final analysesfor the project. Testing of the macros on preliminary distributionshas proven effective. All analyses should be complete by late spring2000.
Reporting and data distribution: The final report is being writtenas phases of the project near completion. The land cover section isnearly complete and will be finalized with the accuracy assessment.Sections on stewardship and vertebrate distributions are currentlyin progress with completion expected in late spring 2000.
Other accomplishments and innovations: Through the processof data acquisition and sharing and development of strong workingrelationships with MS-GAP cooperators, a movement has startedin the state to provide “life after GAP.” Cooperative research ef-forts to apply knowledge and expertise in the field of spatial tech-nology to natural resource management (such as applying spatialtechnologies to conservation law enforcement, aiding Partners-in-Flight with establishing priority lands, and optimizing locations for

GAPA N A L Y S I S
GAP Analysis Program Bulletin No. 8, December 1999 69
aquaculture facilities) have prompted an initiative to be placed be-fore the Mississippi legislature. The initiative, called the “NaturalResource Decision Support System,” would provide recurring fundsto support three new employees at Mississippi State University.These persons would provide biannual updates and refinements tothe MS-GAP land cover and provide support to agencies in termsof applying spatial technologies and existing spatial data to helpsolve current natural resource problems. This initiative would pro-vide needed information to policy makers and resource managersto make scientifically based and ecologically sound managementdecisions.
MissouriComplete. Publication products under development.
Contact: Timothy L. HaithcoatGeographic Resources Center and Missouri Spatial DataInformation Service, University of Missouri, [email protected], (573) 882-1404
Land cover: Complete. Phase I land cover was completed by theMissouri Resource Assessment Partnership. This was then gener-alized from the original 30 m cell size to the 2 ha minimum map-ping unit used for vertebrate modeling. Also, 5, 10, 20, 40, and 100ha land cover bases were created using an in-house generalizationAML to try to maintain some of the linear features and connectiv-ity present in Missouri’s file. Phase II land cover contains 46 classesand will be provided in summer 2000 as an update on the NationalGAP home page.
Animal modeling: Complete. Among the 348 vertebrates mod-eled were 66 mammals, 164 birds, 74 reptiles, and 44 amphibians.These models were created using the base land cover map of 2 haand derivative products such as ecotones, core interiors, regional-ized areas, and riparian measures. Other data layers were devel-oped to aid in the modeling, such as wetland components, prairies,soils, precipitation, temperature, population density, road density,as well as many other feature types such as caves, springs, etc. Anadditive weighting model was developed for each species, whichcalculated an index to occurrence. It is somewhat similar to a BayesTheorem approach in that it uses subjective weights in an additivefashion. These weights represent what the literature, biologists,and the modeler believe to be the likelihood of a species occurring,given that a specific habitat or landscape component exists.
Land stewardship mapping: Complete. The stewardship layerwas created by the Missouri Resource Assessment Partnership.Public lands comprise only 6.7% of Missouri with 4.7% under fed-eral and 2% under state jurisdiction. The average size of these hold-ings is very small. Less than 1% of Missouri falls within areasdesignated as management status 1 or 2. All areas greater than 16ha were analyzed for biodiversity components.
Analysis: Complete. Species biodiversity as measured by speciesrichness was calculated on five spatial extents. These includedcounty, EMAP hexagons, 7.5-minute quadrangle, quadlet (1/6 ofquadrangle), and public land survey section. These results werecomprehensively reviewed against the Missouri Fish and WildlifeInformation Systems county lists for all terrestrial species to pro-vide a measure of reliability and consistency. A more refined re-view was conducted against the results of the Breeding Bird Atlasproject at the quadlet level for all bird species. This was followedby the analysis of these richness indices and individual species pre-dicted occurrences within the context of stewardship. Species tiedto grassland complexes are the most at risk, followed by those spe-cies that require larger contiguous areas. Wetlands have high rich-ness, but there are few areas outside preserves where these habitatsexist in Missouri. Focus for Missouri’s future biodiversity effortsmust be on private land holders as they control over 90% of thestate.
Reporting and data distribution: Completed. The draft final re-port was submitted in January 2000. Data distribution from theseanalyses will be posted on the Missouri Spatial Data InformationService (MSDIS) at http://msdis.missouri.edu. A link will be cre-ated on this site to the AMLs and programs written in support ofthis effort.
Other accomplishments and innovations: The methods used inthe generalization of the land cover are fairly unique as they weredeveloped to try to capture the linear “travelways” present acrossmany of Missouri’s landscapes. The program was developed inAML and utilizes ARC/INFO processing in both grid and vectorenvironments. Programs were developed to take advantage of thematrix (i.e., agricultural, grassland, or forested) within which theprocess was being run. In addition, regional variables were createdto allow for the maintenance of polygons within which only diago-nal connectivity exists.
The methods developed for vertebrate modeling expand the usabil-ity of the data sets by acknowledging and incorporating the factthat these data are fuzzy and that “habitat” is not always associatedwith a single cover type but rather a suite of cover types in juxtapo-sition that can provide for all the species’ needs. The modelingapproach of mapping this as a continuum of response (occurrence)and then not clipping these results to a range map but rather cali-brating these measures to a range greatly expands the users’ flex-ibility with these data as well as not perpetuating sampling errorsor biases that can permeate the range information.
MontanaComplete (see http://www.wru.umt.edu/reports/gap/)

GAPA N A L Y S I S
70 GAP Analysis Program Bulletin No. 8, December 1999
NebraskaUnder way (http://www.calmit.unl.edu/gap/)
Anticipated completion date: October 2001
Contacts: Geoffrey M. HenebryCALMIT, University of [email protected], (402) 472-6158
James W. MerchantCALMIT, University of [email protected], (402) 472-7531
Land cover: We have completed a preliminary statewide classifi-cation and are in the process of refining the product. We have beenworking with Iowa, South Dakota, and Kansas on accuracy assess-ment strategies. We conducted a pilot study of accuracy assess-ment during summer 1999 and are currently planning for the sum-mer 2000 accuracy assessment field campaign. In addition, we areworking with the USDA/NRCS to get county-level land cover draftmaps out to NRCS field offices across the state to solicit commentsfrom local experts. Plans for next 12 months: finalize land covermapping, including integration of NWI data, and conduct land coveraccuracy assessment.
Animal modeling: We have completed assembly of species listsfor the state. The herpetiles list has undergone expert review andhas been revised. The bird and mammal lists are currently in expertreview. We have initiated model development for reptiles and am-phibians; based on preliminary results we are incorporating climateand soils data as complementary environmental variables. We arecooperating with the Great Plains Regional GAP modeling groupto develop common models and modeling methodology. We con-tinue to work with the Nebraska State Museum on integrating theirspecies occurrence records into a format usable in GAP. As theland cover products from the Rainwater Basin and CooperativeHydrology Study (COHYST) projects become available, we willapply the animal models to these data, which are based on morerecent TM images (1997-98), to assess the effects of multi-datethematic data on predicted species occurrences. Plans for next 12months: Finalize bird and mammal species lists, ingest relevantmuseum data, complete herpetile and mammal models, initiate birdmodels, select and apply accuracy assessment methods to each ani-mal model, Web-publish animal models as they are completed tosolicit comments and review.
Land stewardship mapping: A preliminary product is currentlyundergoing review and refinement. We continue to work closelywith the Nebraska Games and Parks Commission in this aspect ofthe project. Plans for next 12 months: finalize stewardship data-base.
Analysis: Analysis is pending completion of animal models. Plansfor next 12 months: Initiate analyses as animal models are com-pleted.
Reporting and data distribution: Metadata assembly, data lin-eage, and methods documentation are ongoing.
Other accomplishments and innovations:
1. Ongoing assessment of elk habitat in northwest Nebraska in co-operation with the NE Game and Parks Commission and the Schoolof Natural Resource Sciences.
2. Cooperating with Rainwater Basin Joint Venture (U.S. Bureau ofReclamation – $180,000; NE Game and Parks Commission) in landcover mapping using 1997-98 TM data.
3. Cooperating with the COHYST of the Central Platte, which issponsored by five natural resource districts, two public power dis-tricts, NE Game and Parks Commission, NE Natural ResourcesCommission, and the NE Department of Water Resources ($87,000).The project will produce improved land cover mapping includingcrop-level discrimination across a region covering one-third ofNebraska using 1997-1998 TM data and digital orthophotos.
NevadaFirst-generation GAP data will be provided through the NationalGAP Web site by summer 2000; this preliminary project will nothave a standard report.
Version 2 update under way
Contact: Bruce JonesU.S. EPA, Las [email protected], (702) 798-2671
Land cover: Nevada is participating in the regional GAP updatefor the Southwest. During the year 2000, organizational tasks in-clude listing potential cooperators and their contributions, compil-ing relevant literature, collecting masking data, interacting with re-gional plant ecologist on alliance descriptions, and interacting withthe regional office (Utah State University Remote Sensing/GISLaboratories, Logan) on initial mapping procedure and concurrentfield season.
Animal modeling, land stewardship mapping, and analysis: Or-ganizing during the year 2000.
Reporting and data distribution: Anticipated for spring 2004.
New Hampshire(see Vermont and New Hampshire)
New Jersey(see Maryland, Delaware, and New Jersey)

GAPA N A L Y S I S
GAP Analysis Program Bulletin No. 8, December 1999 71
New MexicoVersion 1 complete (see http://rgis.unm.edu/price.htm). Version 2update under way
New Mexico is included in a five-state (AZ, CO, NV, NM, UT)regional effort to update and expand information from GAP projectsconducted for the individual states in the 1990s. Mapping of bioticelements and land stewardship will follow established GAP meth-ods but will be conducted cooperatively for the region, without re-gard to state boundaries. The current New Mexico project is in thestart-up phase for this multiyear Southwestern Regional Gap Analy-sis Project (SW-ReGAP). Project responsibilities in New Mexicofocus on reinitiating the cooperative network, assisting a regionallab with imagery analysis, and acquiring selected vegetation andanimal occurrence data. Specifically we will 1) develop the part-nership infrastructure for land cover mapping and other data setpreparation, 2) identify training site data for land cover mapping,3) assist a regional lab with selecting ancillary data for the fullproject, 4) prepare a rule base for making land cover mapping deci-sions, 5) consolidate existing animal distribution models forecoregional task assignment, 6) evaluate recent changes to land stew-ardship data, and 7) create and maintain regionwide Web pages,FTP site, and list server to facilitate regional cooperation and dataexchange.
Results of this project will be used to develop New Mexico’s con-tribution to the full multiyear SW-ReGAP. This step is critical toensure that appropriate research staff and facilities are brought tobear on the ecoregional conservation assessment. Further, thisproject will provide the starting point for the first-ever conserva-tion evaluation of animals and plant communities throughout theSouthwest that crosses state jurisdictional boundaries.
To develop the infrastructure necessary to complete the long-termproject, we are incorporating personnel from several departmentswithin New Mexico State University (animal and range sciences,biology, fishery and wildlife sciences, geography, entomology, plantpathology, and weed science) as well as the agricultural experimentstation, the physical sciences laboratory, and the Army ResearchLaboratory at White Sands Missile Range. These experts are pro-viding input for this portion of the project by identifying trainingsite data, ancillary data, scene selection, and creation of the rulebase. The SW-ReGAP home page (http://leopold.nmsu.edu/fwscoop/swregap) will provide information for both project per-sonnel and cooperators and the general public.
New YorkNear completion
Anticipated completion date: June 2000
Contact: Charles R. SmithNew York Cooperative Fish and Wildlife Research UnitCornell University, [email protected], (607) 255-3219
Land cover: Accuracy assessment, as described in last year’s sta-tus report, continued in 1999. We evaluated map accuracy at threedifferent levels in the nested hierarchy of the National VegetationClassification System (NVCS). Using conventional accuracy as-sessment methods, our land cover map accuracy at an NVCS levelapproximately equivalent to Anderson Level I is 74.4%. At theNVCS subclass level, our map accuracy is 56.5%, and at the levelof NVCS superalliance, our accuracy is 42.0%. Values for mapaccuracies using the more computationally intensive “fuzzy” accu-racy methods were generally a few percentage points better thanvalues derived by conventional accuracy assessment methods.
Animal modeling: We are continuing a successful and productivecooperation with the ongoing NY Amphibian and Reptile Atlas,sponsored by the New York State Department of EnvironmentalConservation (NYSDEC), with field work ending in 1999 (http://www.dec.state.ny.us/website/dfwmr/wildlife/herp/index.html). Wehave received updated information on current distributions of am-phibians and reptiles from the herpetological atlas project throughthe 1998 field season. Association matrices, relating vertebratespecies occurrences to each of the 45 land cover types we haveidentified were completed, reviewed by teams of experts, and as-sessed for accuracy during the third quarter of 1999. Predictedoccurrences of terrestrial vertebrates were assessed for accuracyusing known occurrences of species from recent museum data (mam-mals only), recent herpetological atlas field data, checklists of birdsfrom state parks, breeding bird occurrence data from the NY Breed-ing Bird Atlas, and checklists of birds and other vertebrates fromfederal refuges. The NY-GAP Project also is cooperating withNYSDEC and the Federation of New York State Bird Clubs to as-sure that new information collected as part of the Second NY Breed-ing Bird Atlas Project, scheduled to begin in 2000, can be incorpo-rated fully into the NY-GAP database for future gap analysis appli-cations.
Land stewardship mapping: During 1999 we substantially refined,expanded, and updated our existing land stewardship coverage toreflect significant acquisitions of new public lands and increasedavailability of accurate statewide land stewardship information indigital form. Included in the land stewardship coverage at this timeare boundaries for all state wildlife management areas, state for-ests, state parks, New York City reservoir watersheds with restrictedaccess, Adirondack Park Preserve, Catskill Park Preserve, Depart-ment of Defense lands, national parks and historic sites, federalwildlife refuges, and large preserves managed by The Nature Con-
GAPA N A L Y S I S
72 GAP Analysis Program Bulletin No. 8, December 1999
servancy, represented by approximately 8,000 polygons. Assign-ment of management status categories to these areas was completedduring the last half of 1999, and stewardship codes were assignedin consultation with staff from NYSDEC and the New York StateOffice of Parks, Recreation, and Historic Preservation.
Analysis: Accuracy assessments for maps of predicted vertebratedistributions were completed during the last quarter of 1999. Over-all map accuracy for predicted vertebrate distributions, at theecoregional scale, is 84.2%, with 86.2% for amphibians, 83.6% forreptiles, 89.2% for birds, and 77.9% for mammals. Gap analysisfor the statewide database will be initiated and completed duringthe last quarter of 1999 and the first quarter of 2000.
Reporting and data distribution: A draft final report will be sub-mitted to the National Gap Analysis Program Office for review inMarch 2000. After review, a final report will be completed andsubmitted by late June 1999. Data distribution is expected to beprimarily on CD-ROM, with limited hard copy distribution, andfrom Web pages. Data distribution by NYSDEC is expected to beaccomplished on a regional basis using a central server linked toGIS workstations in each of the nine regional offices of NYSDEC.The creation of the Cornell University Geospatial Information Re-pository (CUGIR; http//cugir.mannlib.cornell.edu), a major NationalSpatial Data Infrastructure node, also offers opportunities for addi-tional modes of data display and distribution not available previ-ously. Once produced by USGS, CD-ROM products will be of-fered for sale through the NY Cooperative Fish and Wildlife Re-search Unit.
Other accomplishments and innovations: See note on page 57of this issue.
New York Aquatic Gap AnalysisComplete
Contacts: Marcia Meixler, Project LeaderNY Aquatic Gap Analysis, Cornell [email protected], (607) 255-2038
Mark Bain, PI, NY Aquatic Gap AnalysisCornell [email protected], (607) 255-2840
Habitat characterization for Aquatic GAP: Habitat was charac-terized using the parameters stream size, habitat quality, water qual-ity, gradient, and riparian forest cover. The first three parameterswere combined to form a habitat characterization from which fishdiversity was predicted. The latter three parameters were used formacroinvertebrate diversity predictions. The first round of habitatcharacterization involved static, manually intensive classificationsfrom topographic and Mylar land use overlay maps. In an effort todeviate from such limiting classification, the NY Aquatic Gap Analy-
sis group developed computerized macros to automate classifica-tion from digital elevation models, land use, and road and railroadcoverages. This provided equal or better accuracy, increased flex-ibility, and enabled us to calibrate the model using previously col-lected data. The calibrated habitat characterization incorporatedfive additional GIS layers (surficial geology, bedrock geology, depthto bedrock, point-source pollution, priority waters) and involvedoptimization using discriminant analysis procedures.
Analysis: Field data were collected in the summer of 1998 on fishspecies diversity, macroinvertebrate family diversity, stream widthand depth, substrate, general habitat assessment, water chemistry,and gradient at 39 sites. This information was used to test the fiveparameters in habitat characterization and overall diversity of fishand macroinvertebrates.
Reporting and data distribution: The NY Aquatic Gap Analysisgroup maintains a Web site for dissemination of up-to-date infor-mation on model methodology and results. This site can be foundat http://www.dnr.cornell.edu/hydro2/aquagap.htm. In addition, acomprehensive report was compiled in October 1999 for the U.S.Geological Survey discussing the methods, results, products, analy-ses, and conclusions to date.
North CarolinaUnder way
Anticipated completion date: December 2000
Contact: Alexa McKerrowNorth Carolina Cooperative Fish and Wildlife Research UnitNorth Carolina State University, [email protected], (919) 513-2853
Land cover: In 1999 we expanded the vegetation mapping effortsinland with two separate efforts: one in the southern mountains andthe other in the sandhill region. In addition, field data collectionand video interpretation were completed for the piedmont. We havecontinued to utilize the decision-rule process for mapping, with theaddition of variables derived from the digital elevation models forthe mountains. By spring 2000 we will be completing the state-wide land cover map by following the protocols developed in eachof the smaller-scale mapping efforts.
Animal modeling: Draft county and hexagon range maps are cur-rently available for review by experts in the state. With the help ofthe North Carolina Natural Heritage Program and the North Caro-lina State Museum we will be finalizing those data layers by early2000. In addition to soliciting one-on-one reviews and holding jointmeetings for review of the range and habitat association data lay-ers, we are developing a Web site to support that process as well asfinal data delivery needs. By February 2000 final ranges and habi-tat associations will be available for incorporation into the finalanalysis.
GAPA N A L Y S I S
GAP Analysis Program Bulletin No. 8, December 1999 73
Land stewardship mapping: Several separate state efforts havebeen undertaken to develop the data layers required to develop theland stewardship layer. A reasonable base data layer with respectto boundaries exists for state-owned lands and wildlife refuges. Fed-eral lands will require a considerable effort to bring them up todate. We have been in communication with the North CarolinaNatural Heritage Program, North Carolina Center for GeographicInformation and Analysis, and the Fish and Wildlife EcologicalServices Raleigh Field Office and are hoping to develop a coopera-tive agreement to develop a set of data layers that will meet each ofthe individual programs’ needs in addition to those of the NorthCarolina GAP Project. We are hoping to have a fulltime staff mem-ber assigned to this task by January 2000.
Analysis: Final analysis will be initiated in June 2000.
Reporting and data distribution: Reporting and data distributionwill begin in March 2000, starting with the basic data layer devel-opment and concurrent with the final analysis.
North DakotaUnder way
Anticipated completion date: October 2003
Contact: Larry StrongNorthern Prairie Wildlife Research Center, [email protected], (701) 253-5524
Land cover: Three dates of Thematic Mapper (TM) imagery(spring, summer, and fall) for each of 14 path-row orbit combina-tions were acquired to provide complete coverage for North Da-kota (ND). A seven-class land cover classification for ND was pro-duced by building upon the recent efforts of Ducks Unlimited (DU)and U.S. Fish and Wildlife Service (FWS) in the Prairie PotholeRegion of ND. Guided K-means clustering and maximum likeli-hood classification of spring and fall TM images were performedto produce a land cover classification compatible with the DU/FWSland cover map for areas south and west of the Missouri River.Vegetation surveys were conducted on thirty 28.6 x 28.6 km studyareas distributed among eight ecoregions in the summer of 1999.Within ecoregions, study areas were chosen to maximize: 1) accessto public lands, 2) the amount of natural and seminatural vegeta-tion, and 3) variability of surface geology and soil types. GlobalPositioning Systems were used to delineate vegetation polygons onpublic lands. A large number of vegetation polygons on privateland were delineated on 1:31,680 scale color prints of TM imageryfrom roadside surveys conducted after ground surveys of publiclands in the study areas. Vegetation community element of occur-rence records from ND Natural Heritage Program’s Biological Con-servation Database were obtained and converted to a georeferencedvector object. Access to the ND State Lands Range Inventory Da-tabase for school lands was granted, and efforts are under way toconvert the data to a georeferenced vector object. Several digital
vegetation and land cover classifications for selected areas in NDwere obtained from ND-GAP cooperators. Training data sets willbe constructed for a more detailed vegetation and land cover classi-fication using the three dates of TM imagery and elevation, cli-mate, soils, and geology data in a classification tree analysis.
Animal modeling: Checklists of all vertebrate species in NorthDakota have been completed and reviewed by expert reviewers.For herpetiles and birds, locational data have been assembled intoGIS coverages, and range maps have been completed and subjectedto expert review. Literature reviews have started, and wildlife-habitatrelationship (WHR) models have been completed and reviewed fortwo species, respectively. For mammals, most locational data havebeen assembled into GIS coverages, and large mammal range mapshave been completed and reviewed. Small mammal range mapshave been sent to expert reviewers. Literature reviews have started,and WHR models have been completed and reviewed for three spe-cies. Efforts in the next 12 months will include the creation ofmammal range maps, literature reviews for most of the vertebratespecies, generation of WHR models and requests for expert review,and the development of environmental data sets for modeling spe-cies distributions.
Land stewardship mapping: Land stewardship data were obtainedfrom the Army Corps of Engineers, Bureau of Land Management,Bureau of Reclamation, and National Park Service. Land steward-ship data have been requested from the FWS, the Forest Service,and the ND Game and Fish Department. The FWS has an aggres-sive effort to construct land stewardship data for North Dakota andwill make the data available for GAP. We obtained a CD-ROM ofthe ND Department of Transportation base map data, which includescoverages for federal and state public lands in ND. During 2000we will continue to acquire existing digital data from appropriateagencies.
OhioUnder way
Anticipated completion date: May 2003
Contact: Donna N. MyersU.S. Geological Survey, [email protected], (614) 430-7768
Thomas WaiteThe Ohio State University, [email protected], (614) 430-7768
Land cover: The Ohio GAP project has undergone a change inpersonnel. Completion of the land cover map is being negotiatedwith The Ohio State University’s Center for Mapping. The goal forthe 12 months from January 2000 will be to begin production of theland cover map using 1999 MRLC data obtained from the OhioLinkprogram.
GAPA N A L Y S I S
74 GAP Analysis Program Bulletin No. 8, December 1999
Animal modeling: A new PI for animal modeling, Dr. ThomasWaite, of The Ohio State University, Department of EvolutionaryEcology and Organismal Biology, has been selected. Graduate stu-dent Troy Wilson has compiled a species list of terrestrial verte-brate taxa in Ohio from existing information sources. The goal forthe next 12 months will be to develop a database of information onspecies distributions, location information, references, and habitataffinities. Data sources on species occurrence and distribution havebeen identified for the Ohio Aquatic GAP project. Ohio AquaticGAP will use the valley segment classification system to identifystream valley segment types in Ohio. The classification is plannedto be completed by January 2000.
Land stewardship mapping: The Ohio Department of Natural Re-sources (DNR) is compiling a land ownership map for Ohio. OH-GAP will coordinate efforts with the Ohio DNR to produce a landstewardship map by December 2000.
Reporting and data distribution: A fact sheet will be completedby March 2000.
OklahomaNear completion
Anticipated completion date: June 2000
Contact: William L. Fisher, Assistant Unit LeaderOklahoma Cooperative Fish and Wildlife Research Unit,[email protected], (405) 744-6342
Land cover: The final land cover map is complete and under re-view.
Animal modeling: Modeling of the distribution of the 427 terres-trial vertebrate species is under way.
Land stewardship mapping: The final land stewardship map iscomplete.
Analysis: Overlay analysis to identify potential gaps in biodiversityconservation will begin following completion of animal distribu-tion modeling.
Reporting and data distribution: Planning is under way.
OregonNear completion
Anticipated completion date: June 2000
Contact: Jimmy Kagan, Director/Ecologist and GAP PIOregon Natural Heritage [email protected], (503) 731-3070 x332
Current (1993) land cover: An original land cover map (Version1) was completed for Oregon in 1992. A second-generation landcover map (Version 2) has been recently completed (August 1998,using 1993 imagery) and is currently available. Metadata are avail-able for this second-generation cover, but the accuracy assessmentis incomplete, and the classification is not tied to the NVCS. Anassociated vegetation manual has been completed for the new map.A description of the mapping process is included in chapter 2 of theOR-GAP final report.
Historic (~ 1850) land cover: A statewide historic land coveragewas created by OR-GAP, modified from a coverage developed bythe Oregon Biodiversity Project. The coverage approximates a1:100,000 scale, and metadata are complete. The historic land covercategories are tied to the NVCS and have been cross-walked to thewildlife habitats developed for the current land coverage (Version2). Descriptions of the mapping process and classification are in-cluded in chapter 3 of the OR-GAP final report.
Animal modeling: Animal modeling has been completed for Or-egon three times, the first time using the Version 1 GAP vegetationmap. The result of this project is the book Atlas of Oregon Wildlifeby Csuti et al. The initial models relied on hexagon distributionsprepared for all native wildlife species. Since these were completedover eight years ago, we updated the hexagon distribution coversfor all wildlife species in March 1999. Version 2 models (ARC/INFO programs - AMLs) were developed for all vertebrate speciesusing the updated hexagon distributions and the Version 2 land cover,with an updated wildlife habitat relationship matrix to reflect thedifferences between the first- and second-generation land cover-ages. The updated modeled distributions received limited peer re-view through local experts. As the Version 2 maps are fairly similarto the thoroughly reviewed Version 1, OR-GAP feels the reviewhas been sufficient. OR-GAP also developed historic models usingsimilar techniques with modified hexagon distributions (based onhistoric distribution, including extirpated species) and the historicland coverage. The details of the current and historic modelingprocess are included in chapter 4 of the final state report.
Land stewardship mapping: The land stewardship cover is com-plete and was used to develop the gap analysis. The coverage andmetadata for 1999 (used in the analysis) are posted at the OR StateGIS Service Center. An updated version of the cover will be pro-duced in 2000. A summary of the stewardship mapping and cat-egorization effort was included as chapter 5 in the draft final Or-egon report.
Analysis: Analysis using the Version 2 data is completed. A sum-mary of the analysis is included in chapter 6 of the OR-GAP draftstate report.
Reporting and data distribution: The draft final state report isbeing peer-reviewed by the national GAP staff and by Oregon peerreviewers. A limited number of hard copies of the final report willbe produced. The final report and the basic coverages will be postedat or linked to the Oregon GAP home page, which will be main-tained at either the Oregon Natural Heritage Program or the Or-

GAPA N A L Y S I S
GAP Analysis Program Bulletin No. 8, December 1999 75
egon Department of Fish and Wildlife office in Portland. We in-tend to develop links to allow downloading these coverages frommany sources. The basic coverages that are currently posted in-clude the stewardship cover, the first- and second-generation GAPvegetation covers, and a presettlement vegetation coverage. Allfinal GAP products, databases, and coverages will also be includedon the CD-ROM, with an ArcView application we developed thatcreates historic and existing species distributions.
During the next 10 months of the project, using funds from the U.S.Fish and Wildlife Service and the state of Oregon, we will distrib-ute GAP data to watershed councils, local governments, and otherdecision makers in Oregon. We will also train others in the use ofthe data and in assessment methods and tools. We intend to pro-vide GAP data, Oregon Natural Heritage Program threatened andendangered species data, and analysis to assist in watershed, basin,or ecoregional planning efforts. We are working with the North-west Office of the Defenders of Wildlife to distribute GAP data andalso to assure the updated GAP coverages are included on theirCD-ROM product, Oregon’s Living Landscape, an Interactive In-troduction to Oregon’s Biodiversity. This CD-ROM was producedas part of the Oregon Biodiversity Project, in which both the Or-egon Natural Heritage Program and the Oregon Gap Analysis Pro-gram were partners.
Other accomplishments and innovations: As part of our associa-tion with the Oregon Biodiversity Project, an application was de-veloped that allows both GAP and Natural Heritage data to be sum-marized on a watershed basis. This application was developed bythe Defenders of Wildlife staff and is included on their CD-ROM.We are working on developing a similar, Web-based application.We are hoping to adapt the Colorado State University Internet sitefor distributing OR-GAP and Oregon Natural Heritage Programdata.
PennsylvaniaNear completion
Anticipated completion date: June 2000
Contact: Wayne L. MyersPenn State University, University [email protected], (814) 863-0002
Land cover: Land cover maps have been completed with general-ized categories. Accuracy assessment is pending.
Animal modeling: Models are completed and have been reviewed.Fish, bird, and mammal models were run for mapping; herp mod-els are running.
Land stewardship mapping: Stewardship mapping has been com-pleted.
Analysis: is in progress for reporting.
Reporting and data distribution: Expect draft ready for reviewby national GAP by February 29, 2000. Web service will be pro-vided by Pennsylvania Spatial Data Access (PASDA) at Penn StateUniversity.
Rhode Island(see Massachusetts, Connecticut, and Rhode Island)
South CarolinaUnder way
Anticipated completion date: March 2001
Contact: Elise V. SchmidtSouth Carolina Cooperative Research UnitClemson University, [email protected], (803) 734-9097
Land cover: We have completed the initial land cover map for thestate and are now in the process of incorporating ancillary data. Weare using data from the National Wetlands Inventory and NRCSsoil surveys to further refine our initial classification of 28 landcover types. There are other digital databases available that will beused to add additional land cover types. The land cover is expectedto be complete by August 2000.
Animal modeling: The database for animal distribution and habi-tat affinities is complete and has been reviewed by state experts.We are now compiling the expert reviewer comments to determinewhere more research needs to be conducted. SC-GAP has datafrom state and university museums as well, which are ready to beincorporated. A user interface is being developed for limited ac-cess to the database through the Internet, so that the experts canreview the final maps and database. We will complete sampling forant diversity in all physiographic regions and most land cover typesin the state within the year 2000. Ant diversity will be a part of ouranimal modeling. The animal database is expected to be completeby August 2000.
Land stewardship mapping: The land stewardship database iscomplete except for a small portion of properties. We are workingwith involved parties to ensure correct classification of GAP statuson public lands in South Carolina.
Analysis: The gap analysis is expected to begin in August 2000and be completed by December 2000.

GAPA N A L Y S I S
76 GAP Analysis Program Bulletin No. 8, December 1999
South DakotaUnder way
Anticipated completion date: May 2001
Contact: Jonathan A. Jenks, GAP PISouth Dakota State University, [email protected], (605) 688-4783
Vickie J. Smith, GAP CoordinatorSouth Dakota State University, [email protected], (605) 688-5124
Land cover: Land cover classification was completed for easternSouth Dakota in June 1999. Twelve categories were separated, in-cluding two alliance classifications, which were delineated usingon-screen digitizing, and four wetland categories from the NationalWetland Inventory (NWI). An image of land cover for eastern SouthDakota can be viewed at http://wfs.sdstate.edu/sdgap/eastland.htm.Currently, two of nine western South Dakota scenes have been clas-sified using alliance training data from the USGS/TNC VegetationMapping Program for Wind Cave National Park. Within the twoscenes, 19 categories are present, including 13 association-levelcategories. Assessment is under way to determine the accuracy ofthis method of classification. Completion of the South Dakota landcover map is expected by May 2000. Accuracy assessment using astratified random sample for the state will begin during the summerof 2000.
Animal modeling: Distribution maps are completed, reviewed, andrevised for 88 mammal species. They can be viewed at http://wfs.sdstate.edu/sdgap/mammals.html. Small mammal/vegetationassociations are being determined at Wind Cave National Park.These data will be used in accuracy assessments of small-mammaldistributions. Maps are nearly completed for 43 herp species, andthe avian species list is under review. South Dakota is workingcooperatively with four surrounding states (North Dakota, Kansas,Iowa, and Nebraska) to create regional models for all vertebratespecies. Currently, 16 species have been modeled for the region.Literature review has been conducted for nearly 80% of the speciesto be modeled by South Dakota.
Land stewardship mapping: We have added state parks and rec-reation areas, The Nature Conservancy holdings, and state wildliferefuges to our stewardship map in the past year. We are attemptingto acquire information for a three-mile-wide section along the bor-ders of Montana and Wyoming. Permission has been granted toinclude only two of the seven Indian reservation boundaries in ourstewardship map. Our current stewardship map can be viewed athttp://wfs.sdstate.edu/sdgap/stewardmap.htm.
Aquatic GAP: Plans are under way to hire a graduate student inearly 2000. River reach files have been acquired, and watershedboundaries have been formulated for three major river systems ineastern South Dakota, through a project researching presence of
Topeka shiners in eastern South Dakota streams (see article on page35 of this issue). Habitat information has been collected on his-toric locations of the Topeka shiner. These data will be used as apilot project for Aquatic GAP to formulate predictions of the cur-rent Topeka shiner distribution in these stream systems.
TennesseeCompletion date unknown, please contact coordinator below.
Contact: Jeanette Jones, Project CoordinatorTennessee Wildlife Resources Agency, [email protected], (615) 781-6534
Sue Marden, Vertebrate EcologistTennessee Wildlife Resources [email protected], (615) 781-6637
Land cover: The detailed vegetation map is completed. The veg-etation map was produced using classification techniques appliedto Landsat TM imagery and aerial videography. Accuracy assess-ment was performed using a subset of points set aside from theaerial videography interpretation. Final figures for accuracy as-sessment are being tabulated. Completion of metadata and prepa-ration of data for final delivery to National GAP remain to be done.
Animal modeling: Predicted species distributions and species rich-ness data have been produced for Tennessee’s 364 terrestrial verte-brate species. The species distribution data are in the process ofbeing written onto CDs to send to National GAP.
Land stewardship mapping: The land stewardship layer is com-pleted. Lands mapped are current through December 1997. Thepublic lands coverage has been updated, while land managementstatus needs to be assigned before any further analysis.
Analysis: Gap analysis has been completed.
Reporting and data distribution: The final report is near comple-tion. Data are being written to CD-ROMs for delivery to NationalGAP. Plans are to present TN-GAP data as part of the TennesseeWildlife Resources Agency (TWRA) Web page.
Other accomplishments and innovations: The TennesseeBiodiversity Program (established by the Tennessee ConservationLeague [TCL]) and TWRA’s GIS division are continuing to worktogether to provide planners and community leaders, landowners,natural resource professionals, and educators with information onTennessee’s natural resources. TWRA provides TN-GAP data andrelated GIS data layers as ArcView files to county planners andcommunity leaders. Managing Natural Resources - A PlanningGuide for the Elk River Watershed of South Central Tennessee andNorthern Alabama was published in 1999 by TWRA, TCL, Ten-nessee Valley Authority, and National GAP as a planning guide fordeveloping and carrying out natural resource conservation and man-agement programs.

GAPA N A L Y S I S
GAP Analysis Program Bulletin No. 8, December 1999 77
TexasUnder way
Anticipated completion date: December 2000
Contact: Nick C. ParkerTexas Cooperative Fish and Wildlife Research UnitTexas Tech University, [email protected], (806) 742-2851
Land cover: The land cover map for Texas has been completed; allscenes have been stitched together. Data from field work, com-pleted in all 254 counties in Texas, were used to classify the scenes.Data from videography were used for accuracy assessment. Over-all accuracy of the classified product was above 80%. Approxi-mately 6,000 photographs with UTM coordinates were taken in thefield. These photographs are in a database and are being preparedfor distribution through the Web.
Vertebrate modeling: We have identified 637 terrestrial vertebratespecies as being native to and breeding in Texas. GIS layers repre-senting the range extents for each of these species have been devel-oped from existing range maps. In addition, a database consistingof 34,441 location records for mammals and birds has been devel-oped. Habitat profiles have also been prepared for all 637 speciesbeing modeled, and statewide GIS layers have been created fromthe following profile variables: precipitation, temperature, soils, hy-drology, ecoregions, and elevation. Preliminary distribution mod-els for herpetofauna and mammals have been completed. Fifty per-cent of the preliminary distribution models for birds have been com-pleted.
Analysis: Under way.
Reporting and data distribution: Draft maps were provided to 89landowners in West Texas to solicit their evaluations for use in ac-curacy assessment. Draft maps have also been prepared for TexasState Parks, the National Park Service, the U.S. Border Patrol,USDA, and cooperators in Texas and Mexico.
Other accomplishments: Data prepared for West Texas are beingused to prepare selected species-specific maps (e.g., prairie dogtowns and Scaled Quail distribution).
UtahUpdate under way
Anticipated completion date: June 2004
Contact: Doug R. RamseyRemote Sensing/GIS LaboratoriesUtah State University, [email protected], (435) 797-4484
The first-generation Utah Gap Analysis project has been completed.An update is under way. We are part of Southwest Regional GAP,which includes Nevada, Colorado, New Mexico, and Arizona. Todate we have been updating the ancillary data layers and research-ing the feasibility of adding a soil component to our ancillary dataset. We have also been reviewing the vegetation reference datacollected in our first gap analysis for use in the update. As part of aregional effort we have been helping each state define mappingzones. The purpose of the mapping zones is to divide the landscapeinto similar units of landform features, soils, and biotic elements.
Older Utah GAP products are still readily available for both UNIXand PC computer systems. We also have a CD-ROM on Intermoun-tain Region Land Cover Characterization that incorporates GAPdata from Nevada, Southern Idaho, Western Wyoming, and Utah.
Land cover: Modeling land cover characteristics will not beginuntil all vegetation reference data are collected for a mapping zone.The collection of data is scheduled to begin in spring 2000.
Animal modeling: Dr. Thomas C. Edwards of the Utah Coopera-tive Fish and Wildlife Research Unit will undertake the wildlifehabitat modeling for Utah. Dr. Edwards can be reached by phoneat (435) 707-2529, by fax at (435) 797-4025, and by e-mail [email protected].
Land stewardship mapping: Individual management units for thestate of Utah will be updated for public and private lands.
Analysis: All data layers are scheduled for analysis completion by2004.
Reporting and data distribution: All products derived from Utah’sGap Analysis as well as Southwest GAP are scheduled for comple-tion by 2004.
Vermont and New HampshireNear completion
Anticipated completion date: June 2000
Contact: David CapenSchool of Natural Resources, University of Vermont, [email protected], (802)656-2684
Land cover: Land cover mapping for both Vermont and New Hamp-shire is complete. Edge-matching between New Hampshire andMaine gave acceptable results.
Animal modeling: Refining models and processing additional an-cillary data for about 25% of vertebrate species; modeling is com-plete for other species.
Land stewardship mapping: Complete for both states, includingprivate conservation parcels and hundreds of ownerships protectedby easements.

GAPA N A L Y S I S
78 GAP Analysis Program Bulletin No. 8, December 1999
Analysis: In progress; macros for most steps have been developedand tested. Final analysis awaits refinement of selected habitatmodels.
Reporting and data distribution: Reports will be submitted forreview in early 2000; data distribution should follow later in theyear.
Other accomplishments and innovations: Both Vermont and NewHampshire have undertaken statewide reserve selection projects thathave complemented the Gap Analysis effort. Each of these projectshas incorporated physical factors of the landscape into their analy-ses. We believe that this approach, coupled with the land covermaps of GAP, offers a more sensitive and more comprehensivemeans of identifying hotspots of diversity than does the modelingof vertebrate distributions.
VirginiaNear completion
Anticipated completion date: June 2000
Contact: Scott D. KlopferGIS and Remote Sensing Project CoordinatorFish and Wildlife Information Exchange, [email protected], (540) 231-7348
Land cover: The final VA-GAP land cover map was completed inspring 1999. This map is currently available through anonymousFTP from the Fish and Wildlife Information Exchange (FWIE)server at ftp.fwie.fw.vt.edu. The final map contains 26 land coverclasses and two forest complex classes. For more information onVA-GAP’s land cover mapping efforts, please contact Scott Klopfer([email protected]).
Animal modeling: Vertebrate modeling is near completion.
Land stewardship mapping: The stewardship map for VA-GAPis complete and available for download at ftp.fwie.fw.vt.edu. Thiscoverage contains all federal, state, and some privately owned landsin Virginia. For more information regarding these efforts, pleasecontact Scott Klopfer ([email protected]).
Analysis: The quantitative accuracy assessment of the vegetationmap is completed. The accuracy of the final land cover map wasfound to be between 67% (conservative estimate) and 87%. Analy-sis of species distributions and protection gaps is near completion.
Reporting and data distribution: Many of the basic data sets usedby VA-GAP are available to the public via FTP. Our Web-baseddata distribution node is expected to be complete by spring 2000.The final VA-GAP report is in progress, and plans for a statewideVA-GAP data use workshop are under way.
Other accomplishments and innovations: VA-GAP continues toserve as a means of communication for federal and state agencies
in Virginia. The results of our accuracy assessment indicate thatour abiotic factor (a.k.a. “enduring feature”) modeling/remote sens-ing hybrid classification method was able to provide us with accu-rate land cover classifications.
WashingtonComplete (see http://www.wa.gov/wdfw/wlm/gap/dataprod.htm)
West VirginiaNear completion
Anticipated completion date: September 2000
Contact: Charles YuillWest Virginia UniversityNatural Resource Analysis Center, [email protected], (304) 293-4832 x4492
Land cover: Complete; additional verification continuing.
Animal modeling: Near completion. Models and range maps arecomplete. Modeling under way using revised final land cover.Herpetiles are complete. Range maps are on project map server.
Land stewardship mapping: Complete; updated to 9/1/99.
Analysis: Near completion.
Reporting and data distribution: Near completion. Final reportfor project is under way. A report for wide distribution has beeninitiated and will be published from state funding sources. All map-ping will be placed on map server, and CDs will be produced. Datadistribution is under way for available products; EPA, USGS, andTNC have obtained products to date.
Other accomplishments and innovations: A grant was obtainedto fund the West Virginia Land Status and Trends Project, a five-year project that will update WV-GAP and conduct detailed assess-ments of forests, agricultural/open lands, landscapes of special con-cern, and land use conversions in West Virginia. The project willalso refine and apply data using landscape ecology metrics withinthe Watershed Characterization and Modeling System (WCMS) ina landscape atlas project for The Canaan Valley Institute (a multistateNGO focusing on watersheds).

GAPA N A L Y S I S
GAP Analysis Program Bulletin No. 8, December 1999 79
WisconsinUnder way
Anticipated completion date: September 2002
Contact: Tim WeissWisconsin Department of Natural ResourcesBureau of Wildlife Management, [email protected], (608) 267-9428
Land cover: Classification of the state followed the Upper Mid-west Gap Image Processing Protocol and is now completed. Cross-walking the remote sensing land cover classes to the National Veg-etation Classification System will begin in FY 2000.
Animal modeling: Vertebrate modeling will be undertaken by theUpper Midwest Environmental Sciences Center (UMESC) in co-operation with the state DNR beginning in FY 2000.
Land stewardship mapping: Public land ownership/stewardshipmapping is being undertaken by the Wisconsin DNR and is par-tially completed. Federal lands and state lands are mapped to date;county lands remain to be mapped.
Analysis: Gap analysis will be undertaken by UMESC and is sched-uled to begin in FY 2001.
Reporting and data distribution: Land cover data will begin tobe served by UMESC in the second and third quarter of FY 2000.
WyomingComplete (see http://sdvc.uwyo.edu/wbn/gap.html)
GAPA N A L Y S I S
80 GAP Analysis Program Bulletin No. 8, December 1999
NOTES AND ANNOUNCEMENTS
range management. She received a master’s degree in Forestry fromWest Virginia University, while she worked on the initial land covermapping efforts for WV-GAP. Her 15 years in the Forest Servicegave her experience in natural resource management, planning, andresearch. Now, for GAP, her responsibilities include doing qualityassurance for the GIS data during project closeout, preparing theGIS data for CD publication and Web serving, and eventually (oncewe catch up on the backlog of state projects) merging the data forregional assessments and pursuing more applications for GAP data.If you have questions on GIS data standards or would like to shareyour experiences in any of these areas, contact her at (208) 885-3720 or by e-mail ([email protected]).
GIS Data DeliveryTo facilitate the quality assurance process for delivery of GAP GISdata, Ree Brannon developed a directory structure and an examplechecklist for the layers, which are posted in the Standards sectionof the Handbook (http://www.gap.uidaho.edu/handbook/Standards).As she reviews state projects, this structure may be modified. TheStandards section will undergo a major review for consistency.
We still require data delivery on CDs, and the directory structureallows you to organize your CDs. Some general comments fromexperience working with states that have submitted final projects:
• Try to keep all of one theme together on one CD (for example,all land cover layers). Your vertebrate grids will be the largestbundle of data, if they don’t all fit on one CD, divide by majortaxonomic groups (e.g., birds on one CD, mammals and herpson another).
• The organization for metadata may seem redundant. Each datalayer must be accompanied by its metadata (the *.html file) inthe same directory. Plus, you must include copies of all metadatain the directory called meta_master. The Standards will be ed-ited to require three forms of metadata (*.txt, *.html, and *.sgml).These are readily created in MetaMaker. For BRD units, this isbusiness as usual (as Executive Order 12906 has been on thebooks since 1994). For others, it is important to understand thatany generation of spatial data done with federal dollars requiresmetadata. The redundancy in format is to provide one file forerror checking (*.txt), one for presentation on the Internet(*.html), and one for indexing elements for the spatial data clear-inghouse (*.sgml). Remember, metadata describe the evolu-tion of the spatial data set being documented. If there are com-panion files to the GIS data (reports, spreadsheet, another GISlayer), use metadata to reference them.
GAP Named Winner of Major NationalAwardThe national environmental nonprofit Renew America recently an-nounced that the USGS Gap Analysis Program has been selectedfor a National Award for Environmental Sustainability in the cat-egory of Wildlife/Biodiversity. The prestigious awards are beinggiven by Renew America to 16 programs throughout the nation.
The National Awards for Environmental Sustainability honor com-panies, communities, and individuals that are leading the change tosustainability through their programs. Award winners were selectedfrom a pool of nearly 200 programs that have been recognized byRenew America and the National Awards Council for Environmen-tal Sustainability, a coalition of 60 leading businesses and environ-mental and community groups. “These award winners representsome of the ‘best of the best’ of this country’s environmental pro-grams. They are shining examples of how citizens across Americacan support our nation’s environmental and economic goals everyday,” said Anna Slafer, Executive Director of Renew America.
On April 17, 2000, Gap Analysis was honored at the Renew AmericaAwards Ceremony that helped kick off “Earth Week” in the nation’scapital. Dana Reeve, actress and author of Care Packages: Lettersto Christopher Reeve from Strangers and Other Friends, hostedthis year’s Awards Ceremony.
John Mosesso, GAP Program Manager, commented that, “GAP isproviding resource managers and planners across the nation withbasic scientific information regarding the status of biodiversitywithin their states. … Good information allows good decisions thathelp keep common species common.”
The winners were selected by representatives of the National AwardsCouncil for Environmental Sustainability (NACES). Coordinatedby Renew America, NACES comprises 60 national environmental,nonprofit, government, and business organizations, including theNational Audubon Society, The Nature Conservancy, The HumaneSociety of the United States, AT&T, U.S. EPA, the National Geo-graphic Society, and the Smithsonian Institution.
The Gap Analysis Program will be listed and described along withthis year’s finalists in Renew America’s Environmental SuccessIndex, a comprehensive database of more than 1,400 successfulenvironmental programs throughout the United States. It is avail-able free on the World Wide Web (www.crest.org/renew_america).
New Staff at National GAP OfficeRee Brannon is our new GIS Analyst in the National GAP office.She comes to us with a background in natural resources, GIS, andremote sensing. Ree’s undergraduate background is in biology and

GAPA N A L Y S I S
GAP Analysis Program Bulletin No. 8, December 1999 81
• We are publishing reports and data for two kinds of users, thosewho just want to browse and view results and those who maywant to use data for analysis. Hence the requirement for graph-ics that can be viewed without GIS capability.
• The standards and directory structure were created to expediteproduct review and to simplify future regionalization activities.If you do not follow these guidelines (by changing names ormerging data files), this may result in delays or requests to re-submit the data. Whereas metadata describe the legacy and de-velopment of a spatial data set, use READMEs to describe thefiles in one directory. This helps if a user needs to know whatcodes mean in a grid or coverage, or a crosswalk for speciesgrids names and common/scientific names of the species.
• Here are some commonly overlooked files that need to be in-cluded: crosswalks from codes to text names, documentation ofsource data (species literature, source of conservation status callsin stewardship layer), digital form of Table of Contents, the ex-tended land cover map (10 km beyond state boundary), and de-scriptive READMEs.
Ultimately, the best advice is to put yourself in the shoes of the userto determine if you have done the best job making the data usableand understandable. If you have comments, suggestions, or ques-tions, contact Ree Brannon at (208) 885-3720 or [email protected].
Ree BrannonNational Gap Analysis Program, Moscow, Idaho
Announcing National GAP AnnualMeeting in TexasThe 10th Annual National Gap Analysis Program Meeting will beheld August 13-17, 2000, in San Antonio, Texas. It will be hostedby the Texas Cooperative Fish and Wildlife Research Unit and theNatural Science Research Laboratory at Texas Tech University. Thefocus of this year’s meeting is looking back on the first 10 years ofGAP and forward to the next 10 years. Special emphasis at thismeeting is also placed on biological informatics and the Mexicancomponent of GAP. Concurrent sessions and workshops will covervegetation mapping, predicting species distributions, mapping con-servation lands, accuracy assessments, conducting gap analyses,building partnerships, interactive social science, and outreach.
The meeting is open to GAP investigators, their staff, project col-laborators, and others interested in GAP methods and results. Ad-ditional information on the conference can be found on the GAPhome page at http://www.gap.uidaho.edu/Meetings/2000 or by con-tacting Becky Sorbel at (208) 885-3555 or [email protected].
Elisabeth BrackneyNational Gap Analysis Program, Moscow, Idaho
Recent Publications by GAP ResearchersBain, M.B., A.L. Harig, D.P. Loucks, R.R. Goforth, and K.E. Mills.
1999. Criteria for aquatic ecosystem protection and restora-tion: Approaches using biological and physicochemical struc-ture. Proceedings of the Conference on Power Generation Im-pacts on Aquatic Resources, U.S. Department of Energy andthe Electric Power Research Institute, Palo Alto, California, 10pp.
Bain, M.B. Spatial and temporal attributes of streams and fishlimiting the prediction accuracy of species-habitat models. ForPredicting Plant and Animal Occurrences: Issues of Scale andAccuracy. Island Press, Washington, DC. Submitted July 1999.
Bain, M.B., A.L. Harig, D.P. Loucks, R.R. Goforth, and K.E. Mills.In review. Criteria for aquatic ecosystem protection and resto-ration: Approaches using biological and physicochemical struc-ture. Journal of Environmental Science and Policy.
Boone, R.B., and W.B. Krohn. 1999. Modeling the occurrence ofbird species: Are the errors predictable? Ecological Applica-tions 9:835-848.
Boone, R.B., and W.B. Krohn. 2000. Predicting broad-scale oc-currences of vertebrates in patchy landscapes. Landscape Ecol-ogy 15:63-74.
Crist, P.J., T.W. Kohley, and J. Oakleaf. 2000. Assessing land-useimpacts on biodiversity using an expert systems tool. Land-scape Ecology 15:47-62.
Deitner, R.A., B.C. Thompson, and J.S. Prior-Magee. 1999. As-sessing inter-project data compatibility and information distri-bution for conservation planning using New Mexico Gap Analy-sis data. New Mexico Cooperative Fish and Wildlife ResearchUnit, Las Cruces, New Mexico. 25 pages + Appendices A-G.
Groves, C.R., L.S. Kutner, D.M. Stoms, M.P. Murray, J.M. Scott,M. Schafale, A.S. Weakley, and R.L. Pressey. 2000. Owningup to our responsibilities: Who owns lands important forbiodiversity? Pages 275-297 in B.A. Stein, L.S. Kutner, andJ.S. Adams, editors. Precious heritage: The status of biodiversityin the United States. Oxford University Press, New York.
Hepinstall, J.A., S.A. Sader, W.B. Krohn, R.B. Boone, and R.I.Bartlett. 1999. Development and testing of a vegetation andland cover map of Maine. Technical Bulletin 173. Maine Agri-cultural and Forest Experiment Station, University of Maine,Orono, Maine. 104 pp.
Jennings, M.D. 2000. Gap analysis: Concepts, methods, and re-cent results. Landscape Ecology 15:5-20.
Karl, J.W., N.M. Wright, P.J. Heglund, and J. M. Scott. 1999.Obtaining environmental measures to facilitate vertebrate habi-tat modeling. Wildlife Society Bulletin 27:357-365.
Krohn, W.B., R.B. Boone, and S L. Painton. 1999. Quantitativedelineation and characterization of hierarchical biophysical re-gions of Maine. Northeastern Naturalist 6:139-164.

GAPA N A L Y S I S
82 GAP Analysis Program Bulletin No. 8, December 1999
Loucks, D.P, M.B. Bain, and R.J. Pendall. Socioeconomic, physi-cal, and ecological processes in watersheds characterized bysprawl development, limited water, and quality impairment:Research needs, approaches, and opportunities. Natural Re-sources Forum. Submitted June 1999.
Meixler, M.S., and M.B. Bain. 1999. Application of Gap Analy-sis to New York State waters. Final project report by the NewYork Cooperative Fish and Wildlife Research Unit, CornellUniversity, Ithaca, New York, to the U.S. Geological Survey,Gap Analysis Program.
Meixler, M.S., and M.B. Bain. Accuracy of a GIS model that inte-grates fish species and stream habitat at the river basin scale.For Predicting Plant and Animal Occurrences: Issues of Scaleand Accuracy. Island Press, Washington, DC. Submitted July1999.
Scott, J.M. 1999. A representative biological reserve system forthe United States? Society for Conservation Biology Newslet-ter 6(2):1, 9.
Scott, J.M. 1999. Vulnerability of forested ecosystems in the Pa-cific Northwest to loss of area. Pages 33-42 in J.A. Rochelle,L.A. Lehmann, and J. Wisniewski, editors. Forest fragmenta-tion: Wildlife and management implications. Brill, Leiden, TheNetherlands.
Scott, J.M., B. Csuti, R.G. Wright, P.J. Crist, and M.D. Jennings.1999. Regional approaches to managing and conservingbiodiversity. Pages 55-70 in R.K. Baydack, H. Campa III, andJ. B. Haufler, editors. Practical approaches to the conservationof biological diversity. Island Press, Washington, D.C. 313 pp.
Scott, J.M., F.W. Davis, G. McGhie, R.G. Wright, C. Groves, andJ. Estes. Nature reserves: Do they capture the full range ofAmerica’s biological diversity? Ecological Applications. Ac-cepted.
Scott, J.M., E.A. Norse, H. Arita, A. Dobson, J.A. Estes, M. Fos-ter, B. Gilbert, D.B. Jensen, R.L. Knight, D. Mattson, and M.E.Soule. 1999. The issue of scale in selecting and designing bio-logical reserves. Pages 19-35 in M.E. Soulé and J. Terborgh,editors. Continental conservation: Scientific foundations of re-gional reserve networks. Island Press, Washington, D.C. 227pages.
Stevenson, M. 1999. A different look at the land. Planning. July:8.
Recent Publications Mentioning GAPMaybury, K.P., editor. 1999. Seeing the forest and the trees: Eco-
logical classification for conservation. The Nature Conservancy,Arlington, Virginia. 37 pp.
Peterson, D.J., S. Resetar, J. Brower, and R. Diver. 1999. Forestmonitoring and remote sensing: A survey of accomplishmentsand opportunities for the future. RAND Science and Technol-ogy Policy Institute, MR-1111.0-OSTP. 92 pp.
Prendergast, J.R., R.M. Quinn, and J.H. Lawton. 1999. The gapsbetween theory and practice in selecting nature reserves. Con-servation Biology 13:484-492.
Ricketts, T.H., E. Dinerstein, D.M. Olson, and C. Loucks. Who’swhere in North America? Patterns of species richness and theutility of indicator taxa for conservation. BioScience 49:369-381.
Wilson, E.O. 2000. On the future of conservation biology. Con-servation Biology 14:1-3.
The Gap Analysis Bulletin is published annually by the USGS Biological Resources Division’s Gap Analysis Program. The editors forthis issue are Elisabeth S. Brackney, Patrick J. Crist, and Kevin J. Gergely. To receive the bulletin, write to: Gap Analysis Bulletin, USGS/BRD/Gap Analysis Program, 530 S. Asbury Street, Suite 1, Moscow, ID 83843, fax: (208) 885-3618, e-mail: [email protected]. Adigital version of the Bulletin, containing additional graphics, is available on the Internet at http://www.gap.uidaho.edu/Bulletins/8/default.htm.
Suggested citation: Brackney, E.S., P.J. Crist, and K.J. Gergely, editors. 1999. Gap Analysis Bulletin No. 8. USGS/BRD/Gap AnalysisProgram, Moscow, Idaho.
GAPA N A L Y S I S
GAP Analysis Program Bulletin No. 8, December 1999 83

Return to Bulletin
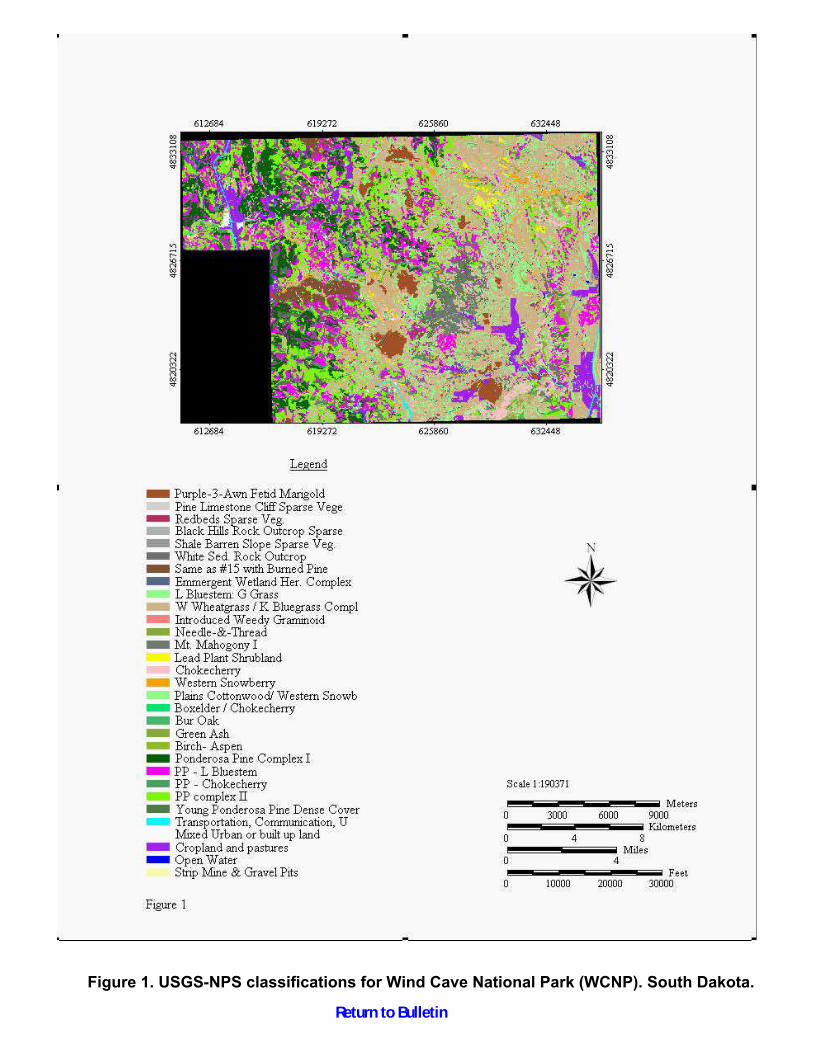
Figure 1. USGS-NPS classifications for Wind Cave National Park (WCNP). South Dakota.
Return to Bulletin

Table 3. Error matrix for 13 categories derived from Cluster Selection method of interpretation.Purple-3-awn – FetidMarigold
RedbedsSparse
Veg
BurnedPine
LittleBluestem –
Grama Grass
WesternWheatgrass– KentuckyBluegrass
Needle-and-Thr
ead
MountainMahogany
LeadPlant
ChokecherryShrubland
WesternSnowberryShrubland
PonderosaPine
Complex I
PonderosaPine – LittleBluestem
PonderosaPine
Complex II
Total
Purple-3-awn –Fetid Marigold
8 3 12 23
RedbedsSparse Veg
3 1 4
Burned Pine 6 14 1 4 6 8 39
Little Bluestem –Grama Grass
4 9 28 57 1 1 2 1 103
WesternWheatgrass –
KentuckyBluegrass
6 9 41 223 6 3 2 5 2 7 6 310
Needle-and-Thread
3 5 8
MountainMahogany
1 3 3 3 4 3 17
Lead Plant 1 4 5
Chokecherry 1 10 1 1 1 1 2 17
WesternSnowberry
1 15 1 6 23
Ponderosa PineComplex I
81 2 13 96
Ponderosa Pine /Little Bluestem
6 5 8 2 5 16 21 61 124
Ponderosa PineComplex II
3 6 1 14 1 5 41 14 54 139
Total 28 0 50 87 353 10 3 4 2 15 145 57 154 908
Return to Bulletin

..Figure 2. Classification of WCNP using a GIS Summary on entire Black Hills
Return to Bulletin

Figure 3. Classification of WCnp using a GIS summary on entire Black Ills efore clipping on WCNP boundary.
Return to Bulletin

Figure 4. Classification of WCNP{ using the Cluster Selection Interpretation.
nn
Return to Bulletin

Figure 2. Theoretical contribution of adding 30,000 ha of old-growth pine habitat to NoxubeeNational Wildlife Refuge for conservation of Red-cockaded Woodpecker habitat is illustratedwith a moving graphic. Different locations examined resulted in varying amounts of mature pine(1,656 ha western location, 3,162 ha southern location). Land cover is generalized for illustration.
Figure 2: Theoretical contribution of adding 30,000 ha of p;d-growth pine toNoxumee Wildlife Reguge for conservation of Red-cockaded Woodpecker habitat is illustrated with a moving graphic. Different locations examined resulted in varying amounts of mature pine 1,656 ha western location, 3,162 ha southern location). Land cover is generalized for illustration.
Return to Bulletin
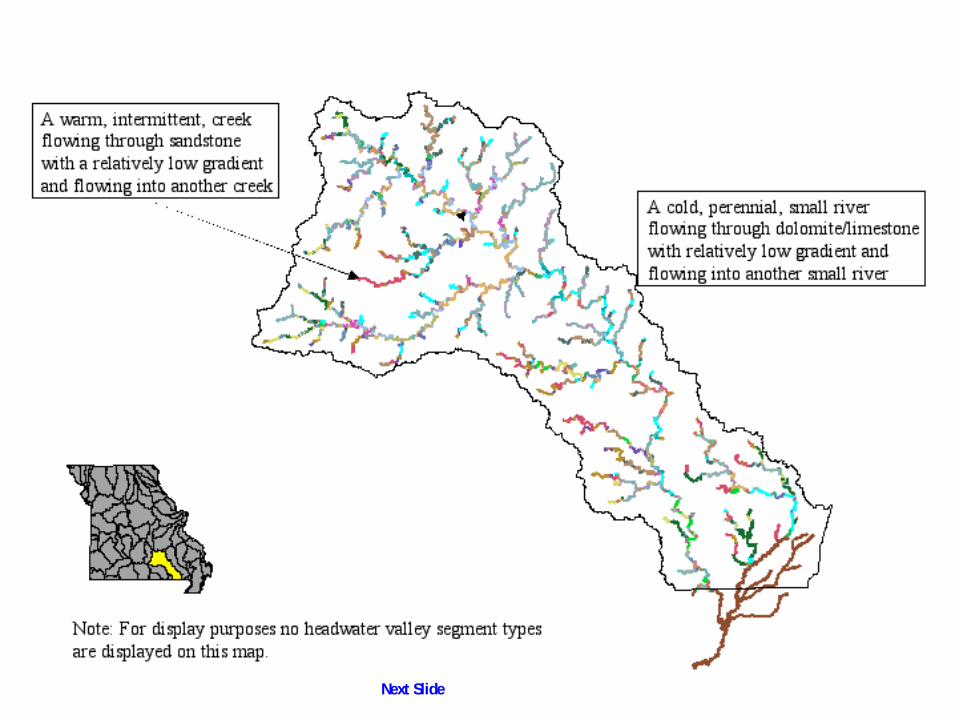
Next Slide
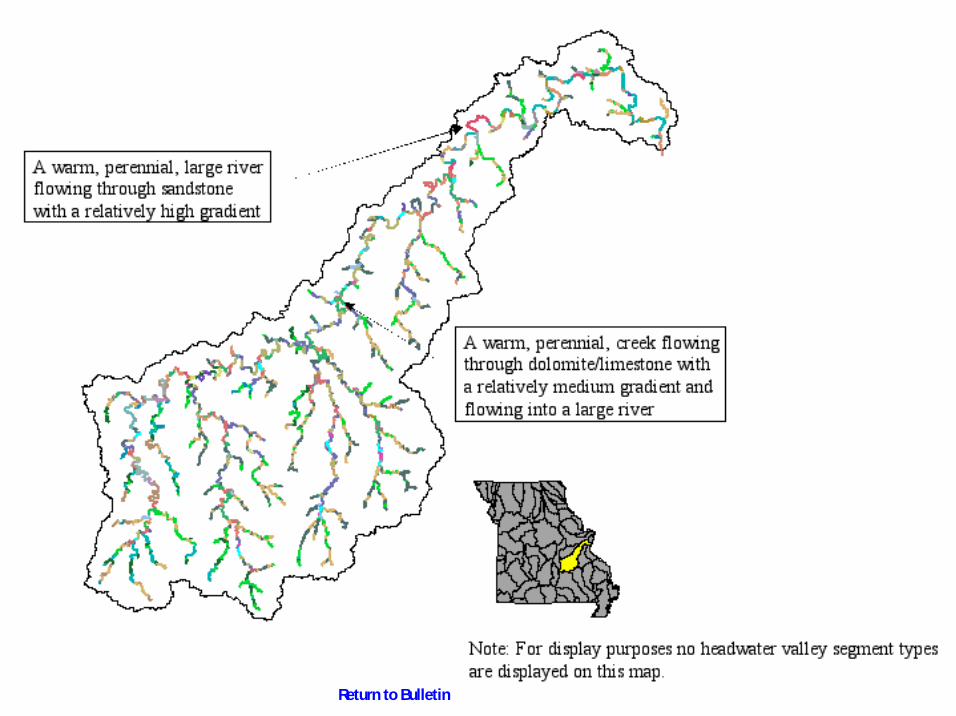
Return to Bulletin
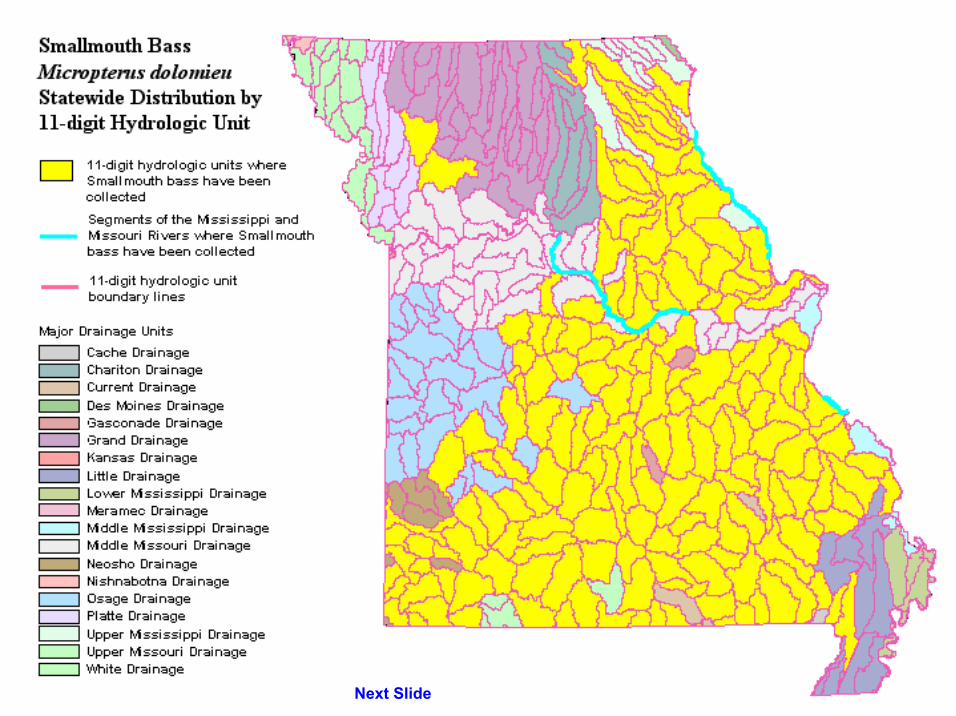
Next Slide

Next Slide

Return to Bulletin

Back to Bulletin


Return to Bulletin

GAPA N A L Y S I S
84 GAP Analysis Program Bulletin No. 8, December 1999
TABLE OF CONTENTS CONTINUED
PRINTED ON RECYCLED PAPER
US
GS
GA
P A
naly
sis
Pro
gram
530
S. A
sbur
y, S
uite
1M
osco
w, I
D 8
3843
RE
TU
RN
SE
RV
ICE
RE
QU
ES
TE
D
Pre
sort
ed S
tand
ard
U.S
. Pos
tage
PA
IDM
osco
w, I
D 8
3843
Perm
it #
120
AQUATIC GAPStatus Report: The Missouri Aquatic GAP Pilot Project
Scott P. Sowa ................................................................................................................... 32Landscape-Level Mapping of Fish for Pennsylvania Gap Analysis
Wayne Myers, David Argent, Joseph Bishop, Jay Stauffer, Jr.,and Robert Carline .........................................................................................................34
Applying Gap Analysis Towards the Protection of an EndangeredSpecies of Minnow (Notropis topeka) in South Dakota
Steven S. Wall, Carmen M. Blausey, Jonathan A. Jenks,and Charles R. Berry, Jr. ................................................................................................ 35
Update on New York Aquatic GAP Pilot ProjectMarcia S. Meixler and Mark B. Bain .............................................................................39
APPLICATIONSAssessing Data Quality and Information Distribution Prospects for County ConservationPlanning Using New Mexico Gap Analysis Data
Robert A. Deitner, Bruce C. Thompson, and Julie S. Prior-Magee ..............................40Incorporating Protection of Biodiversity into County Land Use Planning:A Gap Analysis – Pilot Project in Pierce County, Washington
Christian Grue, Doug Pflugh, Wood Turner, Pat Iolavera,and Frank Westerlund .....................................................................................................43
Designing Regional Conservation Portfolios: Filling the GapsDavid M. Stoms, Frank Davis, and Sandy Andelman ....................................................48
Landscape Diversity as the Basis for a Reserve Design Initiative in VermontDavid E. Capen, Charles E. Ferree, and Ernest W. Buford ...........................................51
Digital Atlas of Idaho: A GIS Approach to Teaching Natural HistoryStephen Burton and Charles R. Peterson .......................................................................53
A Gap Analysis of the Lewis & Clark Trail: Fort Peck Dam to Great Falls, MontanaPatrick Crist and Michael Jennings ...............................................................................55
Biodiversity Impacts from Urban GrowthChristopher Cogan ..........................................................................................................57
Applications of New York GAP DataCharles R. Smith .............................................................................................................57
STATE PROJECT REPORTS ........................................................................................ 58
NOTES AND ANNOUNCEMENTSGAP Named Winner of Major National Award ..............................................................80New Staff at National GAP Office ..................................................................................80GIS Data Delivery ...........................................................................................................80Announcing National GAP Annual Meeting in Texas ....................................................81Recent Publications by GAP Researchers ......................................................................81Recent Publications Mentioning GAP ............................................................................82