Biophysics of protein evolution and evolutionary protein biophysics
Upload
independentCategory
view
0download
0
Imaging the localized protein interactions between Pit-1 and the CCAAT/enhancer
binding protein alpha (C/EBPα) in the living pituitary cell nucleus
Richard N. Day1, Ty C. Voss1, John F. Enwright III1,4, Cynthia F. Booker1, Ammasi Periasamy2
Fred Schaufele3
1Departments of Medicine and Cell Biology, University of Virginia Health Sciences Center,
Charlottesville, Virginia, 22908, USA
2W.M. Keck Center for Cellular Imaging, Department of Biology, University of Virginia,
Charlottesville, VA 22904
3Metabolic Research Unit and Department of Medicine, Box 0540, University of California, San
Francisco, California, 94143-0540, USA
4Present address: Department of Biology, Austin College, Suite 61582, Sherman, TX 75090
Running Title: Pit-1 and C/EBPα interact in subnuclear domains
Key words:
Green fluorescent protein, fluorescence microscopy, resonance energy transfer, nuclear structure
Correspondence should be addressed to Richard N. Day.

Day et al. Revised ME 02-0136
2
ABSTRACT
The homeodomain (HD) protein Pit-1 cooperates with the basic-leucine zipper (b-ZIP) protein
CCAAT/enhancer binding protein alpha (C/EBPα) to control pituitary-specific prolactin (PRL) gene
transcription. We previously observed that C/EBPα was concentrated in regions of centromeric
heterochromatin in pituitary GHFT1-5 cells and that co-expressed Pit-1 re-distributed C/EBPα to the
subnuclear sites occupied by Pit-1. Here, we used fluorescence resonance energy transfer (FRET)
microscopy to show when C/EBPα was recruited by Pit-1, the average distance separating the
fluorophores labeling the proteins was less than 7 nm. A mutation in the Pit-1 homeodomain, or
truncation of the C/EBPα transactivation domain disrupted the redistribution of C/EBPα by Pit-1.
FRET analysis revealed that the mutant Pit-1 still associated with C/EBPα, and the truncated C/EBPα
still associated with Pit-1, but these interactions were preferentially localized in regions of centromeric
heterochromatin. In contrast, a truncation in C/EBPα that prevented DNA binding also blocked its
association with Pit-1, suggesting that the binding of C/EBPα to DNA is a critical first step in
specifying its association with Pit-1. These findings indicated that the protein domains that specify the
interaction of Pit-1 and C/EBPα are separable from the protein domains that direct the positioning of the
associated proteins within the nucleus. The intimate association of Pit-1 and C/EBPα at certain sites
within the living cell nucleus could foster their combinatorial activities in the regulation of pituitary-
specific gene expression.

Day et al. Revised ME 02-0136
3
INTRODUCTION
It is the combinatorial interactions between the pituitary-specific homeodomain (HD) protein Pit-1 and
other gene regulatory proteins that controls the transcription of the prolactin (PRL) and growth hormone
(GH) genes in anterior pituitary cells (1, 2). The pituitary cell-selective programs of gene expression
initiated by Pit-1 require the assembly of particular nuclear protein complexes that function to modify
chromatin structure and recruit the general transcription apparatus to target genes. Previous
observations showed that both Pit-1 and the CCAAT/Enhancer Binding Protein alpha (C/EBPα) bind to
the promoters of the PRL and GH genes where they cooperate to control transcription (3, 4). Recently,
the use of the genetically encoded fluorescent proteins (FPs) as in vivo labels has begun to provide
insight into how proteins are positioned within the nucleus of living cells (5-8). It is thought that the
positioning of proteins at distinct subnuclear sites may function to foster the cooperative protein
interactions necessary for the assembly of gene-specific protein complexes (9-17). Here, we use this
approach to visualize the relative spatial positioning of C/EBPα and Pit-1 in the nucleus of single living
pituitary cells.
In prior studies, we showed that when GFP-C/EBPα was expressed in the somatolactotrope
progenitor GHFT1-5 cell-line, that it was preferentially positioned to regions of centromeric
heterochromatin in the nucleus of mouse pituitary GHFT1-5 cells (18-20). This pattern was identical to
that of the endogenous C/EBPα protein observed in mouse 3T3-L1 cells (20, 21). Significantly, we
found that the co-expression of Pit-1 with C/EBPα resulted in the redistribution of C/EBPα from
regions of centromeric heterochromatin to the intranuclear sites occupied by Pit-1. This recruitment
activity of Pit-1 for C/EBPα was disrupted by a point mutation in Pit-1 HD that is commonly associated
with combined pituitary hormone deficiency (CPHD) syndrome in humans (20). These observations
Day et al. Revised ME 02-0136
4
indicated a potential role for Pit-1 in organizing the distribution of C/EBPα in the nucleus of pituitary
cells.
It was important to determine how the co-expressed Pit-1 protein affected the redistribution of
C/EBPα in the pituitary cell nucleus. The actions of Pit-1 could result from its direct interaction with
C/EBPα, or from their mutual association within a nuclear protein complex. Alternatively, the
expression of Pit-1 could have global effects on nuclear structure that indirectly alter the positioning of
C/EBPα. The investigation of the spatial relationship between proteins using light microscopy is
limited by the diffraction of light to approximately 200 nm, and objects that are closer together than this
will appear as a single object. Therefore, considerable distances may actually separate proteins that
appear to be co-localized by fluorescence microscopy. However, a 50-fold improvement in the spatial
resolution of the light microscope can be attained by using the technique of fluorescence resonance
energy transfer (FRET). FRET microscopy detects the result of the radiationless transfer of energy from
a donor fluorophore to nearby acceptor fluorophores, and color variants of the genetically encoded FPs
are suitable as donor and acceptor pairs (22-30). Because the efficiency of energy transfer varies
inversely with the sixth power of the distance separating the donor and acceptor fluorophores, the
distance over which FRET can occur is limited to less than 7 nm (22-30).
In the present study, we used the approach of acceptor photobleaching FRET microscopy to
demonstrate the close physical association of Pit-1 and C/EBPα in the nucleus of living pituitary cells.
We observed significant nuclear-localized FRET signals from cells in which the co-expressed Pit-1
redistributed C/EBPα, indicating that the average distance separating the fluorophores labeling the
proteins was less than 7 nm. We show that mutations in both Pit-1 and C/EBPα, which disrupt the
redistribution activity, still closely associated with their wild type partners in regions of centromeric
heterochromatin. These observations indicated that the Pit-1 HD and conserved regions in the

Day et al. Revised ME 02-0136
5
transcriptional activation domain of C/EBPα were required for the recruitment of C/EBPα to the nuclear
sites occupied by Pit-1. In contrast, we observed that a truncation of C/EBPα that prevented the binding
to DNA failed to associate with Pit-1, suggesting that interactions with DNA are critical for specifying
the formation of a complex involving Pit-1 and C/EBPα. These results show the close spatial
relationship of Pit-1 and C/EBPα at specific sites within the living cell nucleus that may foster the
combinatorial activities of these proteins in the regulation of pituitary gene expression.

Day et al. Revised ME 02-0136
6
RESULTS
The amino-terminal transactivation regions of C/EBPα are required for interactions with Pit-1
Pit-1 and C/EBPα act cooperatively to induce PRL transcription (4, 20). When co-expressed in pituitary
cells, C/EBPα was recruited to the nuclear sites occupied by Pit-1, and disruption of the Pit-1 HD
blocked the recruitment activity for C/EBPα (20). Here, we determined the domains of C/EBPα that
are necessary for its cooperative actions with Pit-1 and the recruitment from regions of centromeric
heterochromatin.
Deletion of the various conserved regions (CR, ref. 31) of C/EBPα were prepared. C/EBPα
lacking CR1 (amino acids 3-68), CR2 (amino acids 68-96), and CR1, CR2 and CR3 (amino acids 3-154)
were each characterized for their cooperative actions with Pit-1 at the PRL promoter (Figure 1A). Since
mouse GHFT1-5 cells express a low level of Pit-1 (3), we assessed the functional interactions involving
C/EBPα and Pit-1 at the PRL promoter in non-pituitary, human HeLa cells. HeLa cells were transfected
with the indicated expression plasmids encoding each of the C/EBPα deletion mutants either alone or in
combination with Pit-1. Western blot analysis of extracts prepared from the transfected cells showed
that each of the deletion mutants was expressed at levels equivalent to C/EBPα (inset, Figure 1A),
indicating that the activity observed for each of the mutant proteins was not a result of altered
expression or stability. On average, Pit-1 induced -204 rPRL promoter activity 20-fold in the HeLa
cells, and the combination of Pit-1 and the full-length C/EBPα resulted in approximately 40-fold
activation (Figure 1A). The deletion of the first 68 residues of C/EBPα had no effect on its cooperative
activity with the co-expressed Pit-1 (48-fold activation, Figure 1A), demonstrating that CR-1 was
unnecessary for this interaction. Conversely, C/EBP ∆68-96 was impaired in the activation of the PRL
promoter when expressed alone (2-fold activation), and was deficient in the cooperative activation with

Day et al. Revised ME 02-0136
7
co-expressed Pit-1 (Figure 1A). The protein lacking CR-1, CR-2 and CR-3 (C/EBP∆3-154) had similar
activity, also failing to interact cooperatively with Pit-1 in inducing PRL transcription (Figure 1A).
These data showed that the CR-2 domain of C/EBPα was critical for the cooperative activation of Pit-1-
dependent PRL transcription.
The C/EBPα deletion mutants were then expressed as fusions to GFP in mouse 3T3-L1 cells,
and protein extracts prepared from the transfected cells were subjected to EMSA using a consensus
C/EBPα response element (C/EBP RE). Each of the amino-terminal truncations of C/EBPα retained
full DNA-binding specificity (not shown), and the results in Figure 1B compare the DNA-binding
activities of the full length GFP-C/EBPα to the GFP-C/EBP∆3-154 deletion, which lacked the CR-1,
CR-2 and CR-3 domains. Both proteins formed a single complex (arrowheads, lanes 2 and 5), and 100-
fold excess of unlabeled oligonucleotide competed completely for binding of the proteins to the labeled
probe (lanes 3 and 6). The decreased mobility of the shifted complex upon addition of an antibody
recognizing the CR-1 domain demonstrated the presence of C/EBPα. These results are consistent with
other studies showing the carboxy-terminal bZIP domain of C/EBPα is sufficient to direct DNA binding
(32-36).
The amino-terminal region of C/EBPα is also required for Pit-1 mediated redistribution
The potential role of the amino-terminal domains of C/EBPα in mediating the intranuclear recruitment
by Pit-1 was then examined in living pituitary cells. The deletion mutants of C/EBPα were each fused
to the blue fluorescent protein (BFP) and co-expressed with GFP-Pit-1 in GHFT1-5 cells. Deletion of
the CR-1 (C/EBP ∆3-68), which was fully functional in activation of Pit-1-dependent PRL transcription
(Figure 1A), had no effect on its redistribution by the co-expressed GFP-Pit-1 (Figure 2A). In striking
contrast, the C/EBPα deletion mutant devoid of the CR-1, CR-2 and CR-3 domains (C/EBP ∆3-154)
was not recruited to the nuclear sites occupied by GFP-Pit-1 (Figure 2B). Instead, there was a marked

Day et al. Revised ME 02-0136
8
tendency for the GFP-Pit-1 to co-localize in the foci occupied by BFP-C/EBP ∆3-154 (Figure 2B).
Identical to our previous result (20), we observed by immunohistochemical staining that the endogenous
Pit-1 in GHFT1-5 cells localized in a reticular pattern throughout the nucleus (Figure 2C). The
endogenous protein was not concentrated in regions of centromeric heterochromatin stained by Hoechst
33342 (H33342). When GHFT1-5 cells expressing the GFP-C/EBP∆154 protein were stained for Pit-1,
however, we observed that some of the endogenous protein was redistributed to the centromeric
heterochromatin sites in (Figure 2D). Control experiments showed this was not because of overlap of
green fluorescence into the red channel, and there was no nuclear staining observed for cells incubated
with secondary antibody alone (data not shown). This result showed that the behavior of the transiently
expressed GFP-Pit-1 protein accurately reflected that of the endogenous transcription factor. With our
previous observations (20) the results indicated that Pit-1 and C/EBPα act cooperatively to induce PRL
transcription, and these actions require both the Pit-1 HD and the amino-terminal activation domains of
C/EBPα. These results also imply, but do not conclusively prove that Pit-1 and C/EBPα associate in the
living cell nucleus.
To determine whether Pit-1 and C/EBPα were in close spatial association with one-another, we
used the approach of FRET microscopy. FRET microscopy detects the result of the radiationless transfer
of excitation energy from a donor fluorophore to a nearby acceptor that can occur only over a distance
of less than about 7 nm (22-30). When there is FRET between two fluorophores, the donor signal is
quenched and there is sensitized emission from the acceptor (see Figure 3A). The detection of
sensitized FRET emission above the spectral background signal that is contributed by both the donor
and acceptor fluorophores, requires very accurate measurements (24, 28-30). Importantly, because the
donor emission is quenched, FRET can also be detected by measuring the increase in donor fluorescence

Day et al. Revised ME 02-0136
9
(de-quenching) following photobleaching of the acceptor (Figure 3B). The de-quenching of donor
emission following acceptor photobleaching provides a direct measure of the FRET efficiency (25-28).
In this study, we used the combination of BFP and yellow fluorescent protein (YFP) as donor
and acceptor for FRET microscopy. There were three reasons for selecting these particular fluorescent
probes. First, in spite of its low quantum yield and sensitivity to photobleaching, the BFP variant used
here provides an adequate signal from the nucleus, where the autofluorescence background is low.
Because of the high autofluorescence outside the nucleus, this color variant would not be a good choice
for studies of cytoplasmic protein interactions. Second, the overlap of the BFP emission and YFP
excitation spectra is sufficient for energy transfer, but the spectral background for this pair is much
reduced when compared to the CFP/YFP combination commonly used for these types of studies (25,
26). Third, the YFP variant is more sensitive to photobleaching than either GFP or the Discosoma sp.
red fluorescent protein (25), making it a good choice for acceptor photobleaching FRET. The Förster
distance for the BFP and YFP pair, the distance at which energy transfer is 50% efficient, is 3.8 nm (37),
and falls to less than 5% efficiency at distance of 7 nm.
Selectivity of acceptor photobleaching
The ability to selectively photobleach the YFP fluorophore in the presence of the co-expressed BFP is
essential for acceptor photobleaching FRET. To demonstrate this, we co-expressed nuclear localized,
but non-interacting BFP- and YFP-tagged proteins in the same living cells. Fluorescence microscopy
was used to identify individual pituitary GHFT1-5 cells co-expressing YFP fused to the co-repressor
protein silencing mediator of retinoic acid and thyroid hormone receptors (YFP-SMRT), and BFP fused
to the bZIP DNA-binding domain of C/EBPα (BFP-C/EBP∆244). The YFP-SMRT protein localized to
discrete foci in the pituitary cell nuclei that were spatially separated from those formed by C/EBP∆244
(Figure 4A).

Day et al. Revised ME 02-0136
10
The distinct intranuclear positioning of these two non-interacting proteins was used to
characterize the selectivity of the acceptor photobleaching applied in the FRET experiments described
below. Figure 4A shows the pre-bleach reference images of YFP-SMRT and BFP-C/EBP∆244 (Don1)
in the nucleus of the same cell. Merger of the YFP- and BFP-images demonstrated that the fluorescence
signals from the two differently labeled proteins were localized to multiple, non-overlapping foci
(Figure 4A, merge). The YFP-SMRT was then selectively bleached by exposure to 500 nm light for 5
minutes, resulting in a greater than 90% reduction in the YFP signal (Figure 4B). A second image of
BFP-C/EBP∆244 (Don2) was then acquired in the same focal plane and under identical conditions as
the first BFP image. Comparison of the BFP signals before and after the YFP photobleaching showed
there was only a slight decrease in the BFP signal (see histogram, Figure 4B). This result clearly
demonstrated the selectivity of the acceptor photobleaching method.
The specificity of acceptor photobleaching FRET
We next evaluated the ability of acceptor photobleaching FRET microscopy to both detect FRET
signals, and to discriminate the FRET signals from other background signals. We previously used
acceptor photobleaching FRET to detect the dimer interactions of the isolated bZIP domain of C/EBPα
(C/EBP∆244) in the nucleus of pituitary GHFT1-5 cells (26). When expressed in GHFT1-5 cells, we
observed that, in contrast to full length C/EBPα, the truncated protein was almost exclusively localized
to centromeric heterochromatin in the pituitary GHFT1-5 cells (see Figure 3 in ref. 20). Because of this
very restricted intranuclear positioning, we were able to distinguish FP-labeled C/EBP∆244 from the co-
expressed, but non-centromeric localized hERα when they were expressed in the same cell. This
allowed us to directly compare acceptor photobleaching FRET signals originating from sites containing
both donor and acceptor to adjacent regions containing predominantly donor.

Day et al. Revised ME 02-0136
11
Figure 4C shows the nucleus of a GHFT1-5 cell co-expressing YFP- C/EBP∆244, BFP-
C/EBP∆244 and hERα-BFP. The C/EBP∆244 fusion proteins were localized to discrete foci, whereas
hERα-BFP adopted a granular distribution throughout the nucleoplasm (Figure 4C, Don1). The YFP
labeling C/EBP∆244 was selectively photobleached and a second image of the BFP-C/EBP∆244 and
hERα-BFP was then acquired at the same focal plane and under identical conditions to the first. The
change in the BFP signal after YFP photobleaching was quantified at each pixel by digitally subtracting
the pre-bleach BFP image from the post-bleach image (Figure 4C, Don2 - Don1). The pixel-by-pixel
changes in the de-quenched donor signal were then mapped in the intensity profile (Figure 4C, right
panel). The color-coded look up table represents the change in donor signal with black indicating no
change and yellow indicating the maximum change in gray level intensity, which is indicated in the
Figure.
Following YFP photobleaching, digital subtraction of the pre-bleach donor image from the post-
bleach image revealed that the increase in BFP signal was restricted to the foci where YFP- C/EBP∆244
and BFP-C/EBP∆244 were co-localized. These regional changes in fluorescence intensity were also
quantified by measuring the signal at ten identically sized regions of interest (ROI) within the foci or in
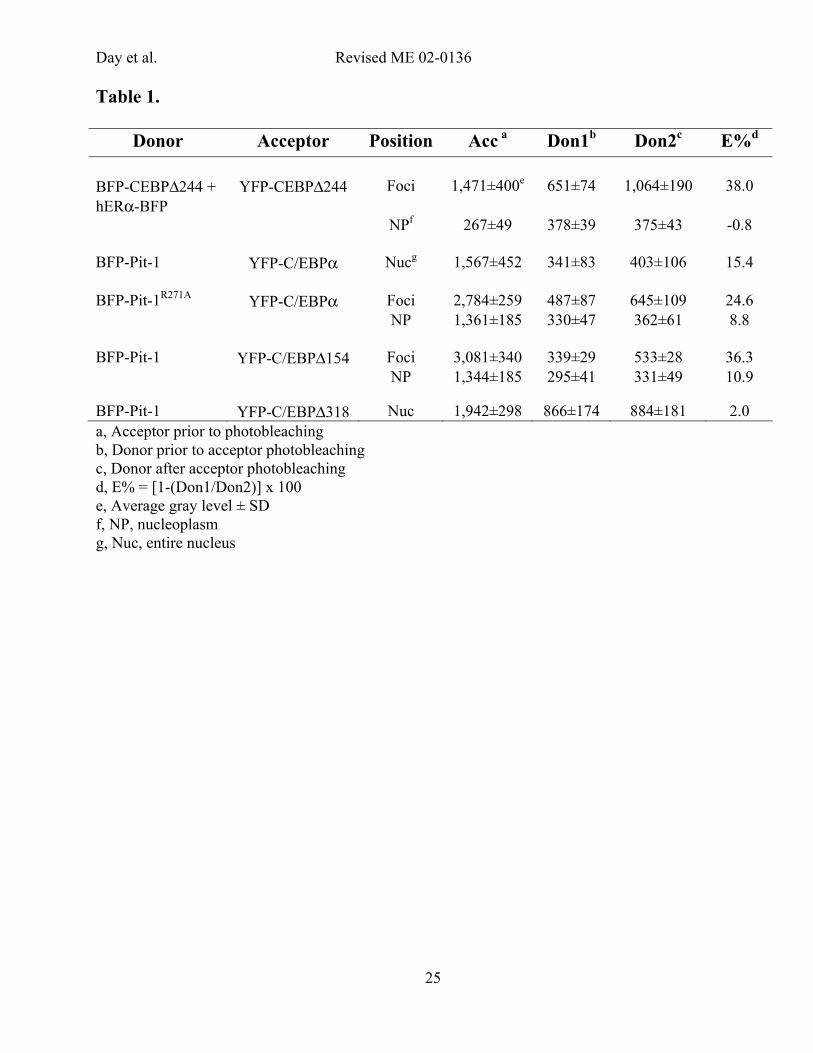
the surrounding nucleoplasm in both the Don1 and Don2 images (Table 1). Prior to YFP
photobleaching, the average donor signal within the foci was similar to the BFP signal in the
nucleoplasm surrounding the foci (651 vs 378, Table). The majority of the acceptor signal, however,
originated from the foci (1,471 vs. 267, Table 1). After photobleaching of the acceptor, the average BFP
signal in the foci was increased by 38 %. In contrast, there was a slight decrease in the average signal
from hERα-BFP in the nucleoplasm (-0.8 %, Table 1), which likely reflects some bleaching of BFP
during the acquisition of the two donor images. Thus, despite similar levels of BFP-labeled proteins
throughout the entire nucleus, only the donor proteins directly associated with the YFP- C/EBP∆244 in

Day et al. Revised ME 02-0136
12
the foci exhibited de-quenching. These results show the highly selective de-quenching expected for the
dimerized C/EBP∆244 proteins (26), and demonstrated the ability of acceptor photobleaching FRET to
detect these protein interactions in the presence of a high background signal.
Detecting the interactions of Pit-1 and C/EBPα in the nucleus of the living cell
The acceptor photobleaching FRET approach was then used to characterize further the association of
Pit-1 and C/EBPα in living GHFT1-5 cells. As demonstrated previously (20), when co-expressed with
BFP-Pit-1, the YFP-C/EBPα was redistributed to the nuclear sites occupied by BFP-Pit-1 (Figure 5A).
After selective photobleaching of the YFP fluorophore, acquisition of a second BFP-Pit-1 image
revealed an increase in BFP-Pit-1 fluorescence intensity. The pixel-by-pixel change in the donor
intensity after acceptor photobleaching was determined by digital subtraction (Don2 - Don1) and this
change in signal is shown in the intensity profile (Figure 5A, right). The average donor signal
throughout the entire nucleus was increased by 15.4 % (Table 1). The de-quenching of the BFP-Pit-1
signal after photobleaching of the YFP linked to C/EBPα provides evidence that average distance
separating the fluorophores was less than 7 nm.
We previously demonstrated that a point mutation in the Pit-1 HD, which resulted in a protein
with dominant inhibitory activity, disrupted the ability of Pit-1 to recruit C/EBPα. Instead, we observed
that the mutant Pit-1 protein was partially localized to the heterochromatin foci occupied by C/EBPα
(20). Here, we used the acceptor photobleaching FRET approach to examine the interaction of the
mutant Pit-1 protein with C/EBPα at these subnuclear sites in pituitary GHFT1-5 cells (Figure 5B).
When YFP-C/EBPα and BFP-Pit-1R271A were co-expressed, there was a tendency for the BFP-Pit-1R271A
to localize to the intranuclear foci occupied by YFP-C/EBPα (Figure 5B). After acceptor
photobleaching, we observed an increase in the BFP-Pit-1R271A signal throughout the nucleus, with the
most prominent change being localized to the foci (Figure 5B, right). These localized changes in the
Day et al. Revised ME 02-0136
13
BFP-Pit-1R271A signal were quantified, and the results are shown in Table 1. The YFP-C/EBPα was
enriched 2-fold in the foci (Table 1; 2,784 vs 1,361), and BFP-Pit-1was enriched 1.5-fold (Table 1; 487
vs 330) in the foci relative to the nucleoplasm. The ratio of acceptor to donor was 5.7 and 4.1 in the foci
and nucleoplasm, respectively. Although the ratio of acceptor to donor was similar in both regions, the
BFP-Pit-1R271A signal associated with YFP-C/EBPα in the foci was increased 24.6 %, compared to 8.8
% change in signal in the nucleoplasm (Table 1). These results indicate that BFP-Pit-1R271A and YFP-
C/EBPα were associated throughout the nucleus. However, the differences in donor de-quenching
observed for the two subnuclear domains show that either the fraction of Pit-1R271A interacting with
C/EBPα, or the spatial relationship between the proteins, were different in the two nuclear locations.
Similar results were obtained from GHFT1-5 cells co-expressing the YFP-C/EBP∆3-154
deletion and BFP-Pit-1. When co-expressed in the same GHFT1-5 cells, we observed the co-
localization of BFP-Pit-1 and YFP-C/EBP∆3-154 throughout the nucleus, with some accumulation of
Pit-1 in the intranuclear foci (Figure 2 and Figure 5C). After photobleaching of the YFP fluorophore,
there was a marked increase in BFP-Pit-1 signal associated with C/EBP∆3-154 in the foci (Figure 5C,
right). Quantification of the BFP-Pit-1 signal showed that the average BFP-Pit-1 signal associated with
YFP-C/EBP∆3-154 in the foci increased 36 %, compared to a 10.9 % change in signal in the
nucleoplasm (Table 1). The acceptor photobleaching FRET results for both Pit-1R271A and C/EBP∆3-
154 indicate that the fluorophores labeling the proteins are in closer proximity when the proteins are
localized to the heterochromatin foci than when the proteins are in the nucleoplasm.
To demonstrate that these FRET signals were not due to the fluorophores being co-localized in
the restricted volume of the nucleus, we next examined the co-expression of Pit-1 and a truncated
C/EBPα protein defective in DNA binding. In a previous study, we showed that truncation of the C-
terminal 40 amino acid residues that form the leucine zipper region of C/EBPα (C/EBP∆318) disrupts

Day et al. Revised ME 02-0136
14
DNA binding (19). When co-expressed with BFP-Pit-1, the YFP-C/EBP∆318 protein was incompletely
localized to the nucleus, but there was substantial spatial overlap with the nuclear localized BFP-Pit-1
(Figure 5D). Importantly, the levels of donor and acceptor proteins achieved in the nucleus were
comparable to that for the other protein pairs tested (Table 1). In stark contrast to the results obtained
with C/EBPα and C/EBP∆154, however, the selective bleaching of YFP-C/EBP∆318 yielded only a 2%
change in the BFP-Pit-1 signal (Figure 5D, right and Table 1).
To confirm and extend these observations of single cells, we then analyzed multiple cells
expressing each of these protein partners. It is important to note that the vast majority of cells with
balanced expression of the indicated protein partners displayed the same subnuclear distributions as
those illustrated in Figure 5. The analysis of 16 different cells expressing YFP-C/EBP∆318 and BFP-
Pit-1 showed that the average change in the donor signal was 1.7 % (Figure 6). By comparison, cells
expressing the combination of YFP-C/EBPα and BFP-Pit-1 showed an average increase in donor signal
of 10.9 % though out the nuclei (Figure 6). When Pit-1 and C/EBPα were colocalized in the subnuclear
foci, as was the case for Pit-1R271A and C/EBP∆154, the average increase donor signal measured for 10
different cells was 18 % and 29 %, respectively (Figure 6). In contrast, the change in donor signal
localized outside the foci was approximately 10 % (Figure 6). Taken together, these results demonstrate
the specific associations of Pit-1 and C/EBPα as part of common nuclear protein complexes in the living
cell nucleus.

Day et al. Revised ME 02-0136
15
DISCUSSION
In sum, our results have demonstrated the cooperative actions of Pit-1 and C/EBPα that function in the
control of PRL transcription. In the previous study, we used the direct visualization of FP-labeled Pit-1
and C/EBPα to demonstrate that, when co-expressed, Pit-1 recruited C/EBPα from regions of
centromeric heterochromatin to the intranuclear sites occupied by Pit-1 (20). The recruitment activity of
Pit-1 was disrupted by deletion of the homeodomain and, significantly, by a point mutation in the
homeodomain earlier identified in humans with CPHD. These results indicated that the Pit-1
homeodomain played a critical role in the recruitment with C/EBPα, either through direct protein-
protein interactions, or by association with common protein partners. Further, these results suggest that
the dominant inhibitory activity of the CPHD Pit-1 mutant could be a consequence of the disruption of
the intranuclear positioning of the protein and, potentially other interacting protein partners.
The present study extended these observations to show that the amino-terminal activation
domain of C/EBPα mediated the transcriptional cooperativity with Pit-1, and was required for the
intranuclear recruitment by Pit-1. Based upon sequence alignment across species, Erickson et al. (31)
identified four conserved regions, CR1-4, in the transactivation domain of C/EBPα. We found that
deletion of C/EBPα CR1 had no effect on its cooperative actions with Pit-1 at the PRL promoter, or on
the ability of Pit-1 to recruit the truncated C/EBPα in living pituitary cells (Figure 1). This result is
consistent with the earlier observation that a C/EBPα CR1 deletion retained full activity when assayed
for its ability to induce differentiation in 3T3-L1 cells (31). In contrast, deletion of the CR2 and CR3
domains resulted in the loss of this differentiation function in 3T3-L1 cells (31). We observed here that a
C/EBPα deletion removing CR1-3 (C/EBP∆3-154) was deficient in the transcriptional cooperativity
with Pit-1. Significantly, the truncated C/EBP∆3-154, which bound DNA with appropriate specificity

Day et al. Revised ME 02-0136
16
and localized to the centromeric heterochromatin, was not reorganized by the co-expressed Pit-1.
Instead, we observed a tendency for Pit-1 to become co-localized with the C/EBP ∆3-154 in the regions
of heterochromatin (Figure 2 and Figure 5). We also observed that the endogenous Pit-1 protein in
GHFT1-5 cells was redistributed to centromeric heterochromatin sites occupied by C/EBP ∆3-154.
These results were remarkably similar to our earlier observations with the dominant inhibitory Pit-1R271A
mutant, which failed to reorganize C/EBPα and also became co-localized at sites of centromeric
heterochromatin (Figure 5 and ref. 20). Taken together, these results indicated that an association
between Pit-1 and C/EBPα, either directly or as part of a common protein complex, mediates both
intranuclear positioning and transcriptional cooperativity.
The intranuclear positioning of Pit-1 and C/EBPα
If this association required just the Pit-1 homeodomain and the C/EBPα CR2/CR3 domains, then we
would expect that deletion of either of these domains should prevent the co-localization of the proteins.
The CR deletions, however, did not block the co-localization, but rather changed where these proteins
were assembled in the nucleus. These results imply that protein domains specifying co-localization are
separable from the protein domains that direct the final positioning of the protein complex within the
nucleus. In this regard, the DNA binding activities of both Pit-1and C/EBPα appear critical to
specifying their intranuclear positioning. The positioning of both C/EBPα and C/EBP∆3-154 to regions
of centromeric heterochromatin (18-20) likely results from the binding of the conserved carboxy-
terminal bZIP domain to multiple repeated sequences in centromeric satellite DNA (21). Disruption of
the leucine-zipper dimerization domain prevents the formation of the scissors-grip structure that is
necessary for DNA binding (32-34), and we showed that the truncated C/EBP∆318 does not bind to a
consensus C/EBPα DNA element (19). We observed here that YFP-C/EBP∆318 expressed in GHFT1-5
cells was not localized to regions of centromeric heterochromatin. This mutant also failed to interact

Day et al. Revised ME 02-0136
17
with the co-expressed Pit-1 (Figure 5 and 6), suggesting that DNA binding may be a necessary first step
in specifying the association with Pit-1.
Likewise, Pit-1 is also known to interact with different classes of DNA elements. For example,
Gaiddon et al. (38) found that Pit-1 could bind specifically to the serum response element in the c-fos
gene promoter. We showed in the previous paper that Pit-1 and C/EBPα could both bind to a common
DNA element derived from viral promoter and enhancer regions (20). Structural studies have shown
considerable flexibility in the conformations Pit-1 adopts on different DNA elements (39, 40) and this
appears to be a common theme among transcription factors (41). Thus, the binding of Pit-1 or C/EBPα
to different classes of DNA elements could specify protein conformations that direct their interactions
with particular protein partners, resulting in their co-localization. However, because of the limited
optical resolution of the light microscope, the observed co-localization of FP-tagged Pit-1 and C/EBPα
only established that the proteins were separated by less than approximately 200 nm.
Detecting protein interactions using acceptor photobleaching FRET microscopy
To determine whether Pit-1 and C/EBPα were in close spatial association, we took advantage of the
spectral properties of the FP labels and applied FRET microscopy. When using intensity-based imaging,
the detection of sensitized FRET emission upon donor excitation is limited by the spectral background
contributed by both the donor and acceptor fluorophores (22-24, 28, 30). An alternative approach is to
measure the de-quenching of donor emission following photobleaching of the acceptor (25-29). This
approach requires only the detection of the donor signal, which is less prone to artifacts resulting from
the spectral background. Further, each individual cell acts as its own internal standard, allowing small
changes in donor signal to be quantified (28). Finally, the increase in the donor signal provides a direct
measure of FRET efficiency (25-28). Because FRET efficiency decreases as the sixth power of the
distance separating the donor and acceptor, significant donor de-quenching will only occur if the
fluorophores are separated by less than 7 nm.

Day et al. Revised ME 02-0136
18
We verified the acceptor photobleaching FRET approach for our living cell model in two
different ways. First, we demonstrated that the signal from a nuclear localized BFP-fusion protein was
not altered by the photobleaching of another nuclear localized, but non-interacting YFP-fusion protein
(Figure 4). Second, we showed that protein interactions detected by acceptor photobleaching FRET
could be readily distinguished from the signals originating from other non-interacting proteins. When
co-expressed in the same cell, the YFP- and BFP-C/EBP∆244 proteins localized to distinct nuclear foci,
whereas the hERα-BFP was dispersed in a granular pattern throughout the nucleoplasm (Figure 4, and
ref. 20). Although the donor signals originating from the foci and nucleoplasm prior to acceptor
photobleaching were similar, only the signal from the BFP-tagged proteins associated with YFP-
C/EBP∆244 in the foci was increased (de-quenched) after acceptor photobleaching. The fluorescence
from the non-interacting hERα-BFP at adjacent sites in the nucleoplasm was not increased. Together,
these results demonstrated the selectivity of acceptor photobleaching and showed that only donor signal
associated with acceptor underwent de-quenching.
The intimate association of Pit-1 and C/EBPα
Using the acceptor photobleaching FRET approach, we determined that when C/EBPα was recruited
from the centromeric heterochromatin to the sites occupied by Pit-1, the two proteins were in close
physical association. The de-quenching of the BFP-Pit-1 signal upon photobleaching of YFP labeling
C/EBPα (Figure 5) provided evidence that the fluorophores were spatially positioned on average less
than 7 nm apart. This intimate association between Pit-1 and C/EBPα was not simply due to their co-
localization in the restricted space within the nucleus. When co-expressed, Pit-1 and a leucine-zipper
domain deletion of C/EBPα (∆318) also had substantial spatial overlap in the nucleus, with donor and
acceptor protein levels comparable to that for the other protein pairs tested (Figure 5 and Table 1). In
contrast to the results obtained with C/EBPα, the selective bleaching of YFP-C/EBP∆318 yielded less

Day et al. Revised ME 02-0136
19
than 2% change in the BFP-Pit-1 signal when measured in 16 different cells (Figure 6). We showed
earlier that C/EBP∆318 is defective in DNA binding (19). The failure of this mutant protein to interact
with Pit-1 suggests that the binding of C/EBPα to DNA is necessary for their association. The detection
of FRET between Pit-1 and C/EBPα indicates that the average distance separating the fluorophores was
less than 7 nm, but can not prove a direct protein-protein interaction. The association of Pit-1 and
C/EBPα could result from the interactions of these proteins with a common protein partner. Indeed,
both proteins interact with CBP (18, 19, 40), and we observed earlier that GFP-CBP was co-localized
with C/EBPα when expressed in GHFT1-5 cells (18).
We also observed that the mutant variants of Pit-1 and C/EBPα proteins, which were still able to
associate with their wild type partners, were also in close physical proximity (Figure 5 and ref. 20). As
was shown previously (20), the mutant BFP-Pit-1R271A had a marked propensity to localize at the sites of
centromeric heterochromatin occupied by YFP-C/EBPα (Figure 5B). Similarly, there was also a
tendency for both co-expressed and endogenous Pit-1 to co-localize to these sites with the expressed
C/EBP∆3-154 (Figures 2 and 5). In both cases, however, this distribution was incomplete and there was
a significant concentration of the proteins co-localized in the nucleoplasm surrounding the subnuclear
foci. Following acceptor photobleaching the BFP signal in both the foci and nucleoplasm were
increased, but in both cases the change in signal associated with the foci was more robust. For both Pit-
1R271A and C/EBP∆154, we observed that the average change in the nucleoplasm measured in 10
different cells was approximately 10 %, which was very similar to the results obtained for the wild type
proteins (Figure 6). In contrast, the interaction of C/EBP∆154 or Pit-1R271A with their wild type partners
in the centromeric heterochromatin foci resulted in an average increase in donor signal of 29 % and 18
%, respectively.

Day et al. Revised ME 02-0136
20
The difference in FRET efficiencies from the foci and the nucleoplasm of the same cell could
reflect a difference in the fraction of proteins that were available to form complexes in the two
subnuclear regions. For example, the fraction of Pit-1 available to interact with C/EBPα in the
nucleoplasm might be reduced by its interactions with other cellular proteins. This would result in an
increase in background donor fluorescence, reducing the apparent change in the donor signal upon
acceptor photobleaching. Alternatively, the spatial relationship between the fluorophores labeling the
Pit-1 and C/EBPα proteins might be significantly different for proteins localized in the two subnuclear
regions. For example, both Pit-1 and C/EBPα may be bound to arrays of repeated DNA sites in the
centromeric heterochromatin, as was suggested for C/EBPα (21). The arrangement of repeated DNA
elements in centromeric heterochromatin could allow several acceptor proteins to fall within the Förster
radius of each donor and increase FRET efficiency. A second possibility is that there are changes in the
conformation of the protein complex when bound to particular DNA sites. For example, C/EBPα and
Pit-1 may adopt a different conformation when associated with centromeric heterochromatin that
positions the fluorophores in closer proximity, resulting in an increased FRET efficiency. The fact that
the C/EBP∆154 protein had consistently higher de-quenching values suggests that placement of the
fluorophore nearer to the bZIP domain allowed it to be in closer proximity to the fluorophore linked to
Pit-1.
It should be noted that the FPs based upon the Aequorea GFP can weakly associate when at high
concentrations, although GFP was crystallized as a monomer (42). While it is possible that the co-
localization of FP-labeled proteins in a restricted volume, such as the nucleus, could favor this weak
interaction, several observations suggest this is not the case. First, we showed that when co-expressed,
YFP-SMRT and BFP-C/EBP∆244 each localized to distinct and spatially separate foci in the pituitary
cell nucleus (Figure 4). If the FPs associated with one-another as dimers, one would not expect these

Day et al. Revised ME 02-0136
21
discrete patterns of subnuclear localization. Second, we showed that the C/EBP∆318 deletion, which is
defective in DNA binding (19), failed to associate with Pit-1 despite their co-localization within the
nucleus (Figures 5 and 6). Third, there are examples in the literature of different FRET-based indicator
proteins in which a donor and acceptor fluorophore are tethered to one-another through a short linker
peptide (25, 42-45). In most cases, a change in the linker conformation resulting from its modification,
or the binding of a substrate, induces a FRET signal. These indicators could not work in this manner if
the juxtaposed FPs were already dimerized.
Pit-1 and the organization of the pituitary cell nucleus
Our results indicate that subtle changes in protein sequence, such as the Pit-1R271A CPHD mutant, may
dramatically affect its association with other nuclear proteins, as well as the final intranuclear
positioning of these protein complexes. These results could reflect changes in DNA binding affinity or
the altered conformation of the mutant Pit-1 protein that favor its interaction with C/EBPα bound to the
repeated satellite DNA elements, but not to other chromatin sites. If we are to understand disease
processes and design therapeutic strategies, we must establish the rules that govern the organization of
the nuclear environment. The distribution of transcription factors in the living cell is dynamic, and their
positioning in the nucleus reflects the balance of their interactions with other protein partners and their
association with the chromatin. We showed here the steady-state interactions of two transcription
factors on the nanometer scale in the intact pituitary cell nucleus. The approach of acceptor
photobleaching FRET microscopy, however, is an end-point assay that requires that the higher-order
protein complexes be relatively stable. The detection of the dynamic interactions of these higher-order
protein complexes within the 3-dimensional volume of the living cell nucleus is difficult to achieve
using these intensity-based imaging techniques. Future studies characterizing these dynamic
interactions will require both high spatial and temporal resolution. These types of measurements can be
achieved using the combination of fluorescence life-time imaging microscopy and FRET (29, 46). The

Day et al. Revised ME 02-0136
22
application of these live cell-imaging techniques will be essential to establish how the subnuclear
targeting of Pit-1 and its interacting partners contribute to the combinatorial code directing pituitary-
specific gene expression.

Day et al. Revised ME 02-0136
23
MATERIALS AND METHODS
Construction of expression vectors, transfection of cell lines and reporter gene assays
The construction of plasmids and maintenance of cell lines were described in the previous paper (20).
GHFT1-5, 3T3-L1 or HeLa cells were transfected with the indicated plasmid DNA(s) by electroporation
as described previously (26). The total amount of DNA was kept constant using empty vector DNA.
Western blotting and electrophoretic mobility shift assay
The western blot analysis of the expressed proteins was described previously (20, 47). Electrophoretic
mobility shift assays were performed on whole cell extracts prepared from transiently transfected 3T3-
L1 cells as described previously (47). A duplex oligonucleotide corresponding to a consensus C/EBP
binding site: 5’- GATCGAGCCCCATTGCGCAATCTATATTCG (Geneka Biotechnology, Inc.,
Montreal, Canada) was end-labeled using [γ - 32P] ATP and T4 polynucleotide kinase and used as probe.
Acceptor photobleaching FRET microscopy and image analysis.
Pituitary GHFT1-5 cells were transfected with the indicated expression plasmid DNA encoding the FP-
fusion proteins, and inoculated into culture dishes containing 25-mm coverglass, and then subjected to
fluorescence microscopy as described previously (18-20, 22, 24, 26). The fluorescence images were
acquired using an Olympus inverted IX-70 equipped with a 60x aqueous-immersion objective lens. The
filter combinations were 500/15 nm excitation, 525nm dichroic mirror, and 545/25 nm emission for
YFP, and 365/15 nm excitation, 390 nm dichroic mirror, and 460/50 nm emission for BFP (Chroma
Technology Corporation, Brattelboro, VT). Grayscale images with no saturated pixels were obtained
using a cooled digital interline camera (Orca-200, Hamamatsu, Bridgewater, NJ). All images were
collected at a similar gray-level intensity by controlling the excitation intensity using neutral density
filtration, and by varying the on-camera integration time. The acceptor photobleaching method used
here was described previously (25-29). A reference image of acceptor (YFP) fluorescence was first

Day et al. Revised ME 02-0136
24
acquired followed by the acquisition of the first donor image (Don 1). For photobleaching of the YFP
acceptor, approximately 5 minute exposure of the specimen to unfiltered 500 nm excitation light
typically achieved greater than 90% decrease in the YFP signal. Following the photobleach period, a
second acceptor reference was acquired to document photobleaching. A second donor image (Don 2)
was then acquired at the same focal plane and under identical conditions as the first, using the BFP filter
set. The image of the donor before acceptor photobleaching (Don 1) was digitally subtracted from donor
after acceptor bleaching (Don 2) to demonstrate the change in donor signal. To quantify these changes
in donor fluorescence in different regions of the nucleus, the average signal was determined for 10
different ROI identically positioned in the pre- and post-bleach donor images. All ROIs were of
identical size. Digitial subtraction of the Don 1 image from the Don 2 image using the ISEE software
(Inovision Corporation, Raleigh, NC) generated the de-quenched donor images. The intensity profile
maps using the same look up table represent the pixel-by-pixel change in the grey level intensity in each
of the de-quenched donor images. For the printed images the background was subtracted and the
resulting image files were processed for presentation using Canvas 7.0 (Deneba, Inc., Miami, FL) and
rendered at 300 dots per inch.
Day et al. Revised ME 02-0136
25
Table 1.
Donor Acceptor Position Acc a Don1b Don2c E%d BFP-CEBP∆244 + hERα-BFP
YFP-CEBP∆244
Foci
1,471±400e
651±74
1,064±190
38.0
NPf 267±49 378±39 375±43 -0.8 BFP-Pit-1 YFP-C/EBPα Nucg 1,567±452 341±83 403±106 15.4 BFP-Pit-1R271A YFP-C/EBPα Foci 2,784±259 487±87 645±109 24.6 NP 1,361±185 330±47 362±61 8.8 BFP-Pit-1 YFP-C/EBP∆154 Foci 3,081±340 339±29 533±28 36.3 NP 1,344±185 295±41 331±49 10.9 BFP-Pit-1 YFP-C/EBP∆318 Nuc 1,942±298 866±174 884±181 2.0 a, Acceptor prior to photobleaching b, Donor prior to acceptor photobleaching c, Donor after acceptor photobleaching d, E% = [1-(Don1/Don2)] x 100 e, Average gray level ± SD f, NP, nucleoplasm g, Nuc, entire nucleus

Day et al. Revised ME 02-0136
26
Acknowledgements This work was supported by NIH DK47301 (RND), F32 DKGM10093 (JFE) and F32 DK60315-01
(TCV). We thank Ignacio DeMarco and Jesse Bible for technical assistance.

Day et al. Revised ME 02-0136
27
REFERENCES
1. Gutierrez-Hartmann A 1994 INSIGHT: Pit-1/GHF-1: a pituitary-specific transcription factor
linking general signaling pathways to cell-specific gene expression. Mol Endocrinol 8:1447-
1449.
2. Dasen JS, Rosenfeld MG 1999 Combinatorial codes in signaling and synergy: lessons from
pituitary development. Curr Opin Genet Dev 9:566-574.
3. Schaufele F 1996 CCAAT/enhancer-binding protein alpha activation of the rat growth hormone
promoter in pituitary progenitor GHFT1-5 cells. J Biol Chem 271:21484-21489
4. Jacob KK, Stanley FM 1999 CCAAT/enhancer-binding protein alpha is a physiological regulator
of prolactin gene expression. Endocrinol 140:4542-4550
5. Pombo A, Cuello P, Schul W, Yoon JB, Roeder RG, Cook PR, Murphy S 1998 Regional and
temporal specialization in the nucleus: a transcriptionally-active nuclear domain rich in PTF,
Oct1 and PIKA antigens associates with specific chromosomes early in the cell cycle. EMBO J
17:1768-1778
6. Lamond AI, Earnshaw WC 1998 Structure and function in the nucleus. Science 280:547-553.
7. Misteli T 2000 Protein dynamics: implications for nuclear architecture and gene expression.
Science 291:843-847
8. Stenoien DL, Mancini MG, Patel K, Allegretto EA, Smith CL, Mancini MA 2000 Subnuclear
trafficking of estrogen receptor-a and steroid receptor coactivator-1. Mol Endocrinol 14:518-534
9. van Wijnen AJ, Bidwell JP, Fey EG, Penman S, Lian JB, Stein JL, Stein GS 1993 Nuclear
matrix association of multiple sequence-specific DNA binding activities related to SP-1, ATF,
CCAAT, C/EBP, OCT-1, and AP-1. Biochemistry 32:8397-8402
10. Thanos D, Maniatis T 1995 Virus induction of human IFN beta gene expression requires the
assembly of an enhanceosome. Cell 83:1091-1100

Day et al. Revised ME 02-0136
28
11. Zeng C, McNeil S, Pockwinse S, Nickerson J, Shopland L, Lawrence JB, Penman S, Hiebert S,
Lian JB, van Wijnen AJ, Stein JL, Stein GS 1998 Intranuclear targeting of AML/CBFalpha
regulatory factors to nuclear matrix-associated transcriptional domains. Proc Natl Acad Sci USA
95:1585-1589
12. Iborra FJ, Jackson DA, Cook PR 1996 The path of transcripts from extra-nucleolar synthetic
sites to nuclear pores: transcripts in transit are concentrated in discrete structures containing SR
proteins. J Cell Sci 111:2269-2282
13. Nardozza TA, Quigley MM, Getzenberg RH 1996 Association of transcription factors with the
nuclear matrix. J Cell Biochem 61:467-477
14. Kim TK, Maniatis T 1997 The mechanism of transcriptional synergy of an in vitro assembled
interferon-β enhanceosome. Mol Cell 1:119-129
15. Merika M, Williams AJ, Chen G, Collins T, Thanos D 1998 Recruitment of CBP/p300 by the
IFNb enhanceosome is required for synergistic activation of transcription. Mol Cell 1:277-287
16. Munshi N, Merika M, Yie J, Senger K, Chen G, Thanos D 1998 Acetylation of HMGI(Y) by
CBP turns off IFNb expression by disrupting the enhanceosome. Mol Cell 1:457-467
17. Misteli T 2001 The concept of self-organization in cellular architecture. J Cell Biol 155:181-186
18. Schaufele F, Enwright JF III, Wang X, Teoh C, Srihari R, Erickson R, MacDougald OA, Day
RN 2001 CCAAT/enhancer binding protein alpha assembles essential cooperating factors in
common subnuclear domains. Mol. Endocrinol 15:1665-1676
19. Liu W, Enwright JF, Hyun W, Day RN, Schaufele F 2002 CCAAT/Enhancer Binding Protein
alpha uses distinct domains to prolong pituitary cells in the Growth 1 and DNA Synthesis phases
of the cell cycle. BMC Cell Biol 3:6

Day et al. Revised ME 02-0136
29
20. Enwright III JF, Kawecki MA, Schaufele F, Day RN A Pit-1 homeodomain mutant blocks the
intranuclear recruitment of the CCAATT/enhancer binding protein alpha (C/EBPα) required for
prolactin gene transcription. Mol Endocrinol (2003) In Press [Accompanying Manuscript]
21. Tang QQ, Lane MD 1999 Activation and centromeric localization of CCAAT/enhancer-binding
proteins during the mitotic clonal expansion of adipocyte differentiation. Genes Dev 13:2231-
2241
22. Day RN 1998 Visualization of Pit-1 transcription factor interactions in the living cell nucleus by
fluorescence resonance energy transfer microscopy. Mol Endocrinol 12:1410-1419.
23. Periasamy A, Day RN 1999 Visualizing protein interactions in living cells using digitized GFP
imaging and FRET microscopy. Methods Cell Biol 58:293-314.
24. Weatherman RV, Chang C-Y, Clegg, NJ, Carroll DC, Day RN, Baxter JD, McDonnell DP,
Scanlan TS, Schaufele F 2002 Ligand-selective interactions of estrogen receptor detected in
living cells by Fluorescence Resonance Energy Transfer. Mol Endocrinol 16:487-496.
25. Miyawaki A, Tsien RY 2000 Monitoring protein conformations and interactions by fluorescence
resonance energy transfer between mutants of green fluorescent protein. Methods Enzymol
327:472-500.
26. Day RN, Periasamy A, Schaufele F 2001 Fluorescence Resonance Energy Transfer Microscopy
of Localized Protein Interactions in the Living Cell Nucleus. Methods 25:4-18.
27. Kenworthy AK 2001 Imaging protein-protein interactions using fluorescence resonance energy
transfer microscopy. Methods 24:289-296.
28. Siegel RM, Chan FK-M, Zacharias DA, Swofford R, Holmes KL, Tsien RY, Lenardo MJ 2000
Measurement of Molecular Interactions in Living Cells by Fluorescence Resonance Energy
Transfer Between Variants of the Green Fluorescent Protein. Science's STKE
http://stke.sciencemag.org/cgi/content/full/OC_sigtrans;2000/38/pl1.

Day et al. Revised ME 02-0136
30
29. Wouters FS, Verveer PJ, Bastiaens PI 2001 Imaging biochemistry inside cells. Trends Cell Biol
11:203-11.
30. Mahajan NP, Linder K, Berry G, Gordon GW, Heim R, Herman B 1998 Bcl-2 and Bax
interactions in mitochondria probed with green fluorescent protein and fluorescence resonance
energy transfer. Nat Biotechnol 16:547-552.
31. Erickson RL, Hemati N, Ross SE, MacDougald OA 2001 p300 coactivates the adipogenic
transcription factor CCAAT/Enhancer-binding Protein. J Biol Chem 276:16348-16355
32. Baxevanis AD, Vinson CR 1993 Interactions of coiled coils in transcription factors: where is the
specificity? Curr Opin Gen Dev 3:278-285.
33. Wedel A, Ziegler-Heitbrock, HW 1995 The C/EBP family of transcription factors.
Immunobiology 193:171-185.
34. Vinson CR, Sigler PB, McKnight SL 1989 Scissors-grip model for DNA recognition by a family
of leucine zipper proteins. Science 246:911-916.
35. Williams SC, Angerer ND, Johnson PF 1997 C/EBP proteins contain nuclear localization signals
imbedded in their basic regions. Gene Expr 6:371-385
36. Nerlov C, Ziff EB 1995 CCAAT/enhancer binding protein-alpha amino acid motifs with dual
TBP and TFIIB binding ability co-operate to activate transcription in both yeast and mammalian
cells. EMBO J 14:4318-4328.
37. Patterson GH, Piston DW, Barisas BG 2000 Forster distances between green fluorescent protein
pairs. Anal Biochem 284:438-440.
38. Gaiddon C, de Tapia M, Loeffler JP (1999) The tissue-specific transcription factor Pit-1/GHF-1
binds to the c-fos serum response element and activates c-fos transcription. Mol Endocrinol.
13:742-751

Day et al. Revised ME 02-0136
31
39. Jacobson EM, Peng L, Leon-del-Rio A, Rosenfeld MG, Aggarwal AK (1997) Structure of Pit-
1 POU domain bound to DNA as a dimer: unexpected arrangement and flexibility. Genes &
Dev 11:198-212
40. Scully KM, Jacobson EM, Jepsen K, Lunyak V, Viadiu H, Carriere C, Rose DW, Hooshmand F,
Aggarwal AK, Rosenfeld MG (2000) Allosteric effects of Pit-1 DNA sites on long-term
repression in cell type specification. Science. 290:1127-1131.
41. Lefstin JA, Yamamoto KR 1998 Allosteric effects of DNA on transcriptional regulators. Nature
392:885-888.
42. Tsien RY 1998 The green fluorescent protein. Annu Rev Biochem. 67:509-544.
43. Nagai Y, Miyazaki M, Aoki R, Zama T, Inouye S, Hirose K, Iino M, Hagiwara M 2000 A
fluorescent indicator for visualizing cAMP-induced phosphorylation in vivo. Nat Biotechnol.
18:313-316.
44. Zhang J, Ma Y, Taylor SS, Tsien RY 2001 Genetically encoded reporters of protein kinase A
activity reveal impact of substrate tethering. PNAS 98: 14997-15002.
45. Ting AY, Kain KH, Klemke RL, Tsien RY 2001 Genetically encoded fluorescent reporters of
protein tyrosine kinase activities in living cells. Proc Natl Acad Sci U S A 98:15003-15008.
46. Elangovan, M., Day, R.N., Periasamy, A. 2002. Nanosecond fluorescence resonance energy
transfer-fluorescence lifetime imaging microscopy to localize the protein interactions in a single
living cell. Journal of Microscopy 205: 3-14.
47. Day RN, Liu J, Sundmark V, Kawecki M, Berry D, Elsholtz HP 1998 Selective inhibition of
prolactin gene transcription by the ETS-2 repressor factor. J Biol Chem. 273:31909-31915.

Day et al. Revised ME 02-0136
32

Day et al. Revised ME 02-0136
33
Figure Legends
Figure 1. The CR-2 domain of C/EBPα is required for induction of Pit-1 dependent transcription. (A)
HeLa cells were transfected with the -204 rPRL promoter linked to the Luc reporter gene and the
indicated protein expression vectors. The cells were co-transfected with plasmids encoding either the
full-length rat C/EBPα or the indicated truncations (10 µg, black bars) or 5 µg of the Pit-1 expression
plasmid (gray bars) or the combination of both (hatched bars). (Inset) Western blot showing the
expressed C/EBPα proteins: lane 1, full length C/EBPα; lane 2, C/EBPα (∆3-68); lane 3, C/EBPα (∆68-
96); lane 4, C/EBPα (∆3-154). Luciferase activity was determined after 24 hr and was corrected for
total protein. The error is the S.E.M. from three independent experiments, each in triplicate and
normalized to reporter alone. (B) Electrophoretic mobility shift assay (EMSA) showing GFP-C/EBPα
(lanes 1-4) and GFP-C/EBP∆3-154 have similar DNA-binding characteristics. Cell extracts were
prepared from 3T3-L1 cells expressing the indicated protein and samples were incubated with a labeled
C/EBPα RE as described in Materials and Methods. Following gel electrophoresis a single DNA-
protein complex was observed for each protein (arrowheads). Binding specificity was demonstrated by
competition with an 100-fold excess of unlabeled oligonucleotide (lanes 3, 6). The presence of the full
length C/EBPα in the complex was verified by a shift in mobility resulting from the addition of an
antibody specific for C/EBPα (double arrow, lane 4).
Figure 2. Both expressed and endogenous Pit-1 co-localized with C/EBPα. (A, B) When co-expressed,
GFP-Pit-1 recruited BFP-C/EBP∆3-68, but not BFP-C/EBPD3-154, to the intranuclear domains
occupied by Pit-1. Sequential images were acquired of GHFT1-5 cells co-expressing (A) BFP-
C/EBP∆3-68 and GFP-Pit-1, or (B) BFP-C/EBP∆3-154 and GFP-Pit-1, as described in Materials and

Day et al. Revised ME 02-0136
34
Methods. The calibration bars indicate 10 µm. (C) Immunohistochemical staining of endogenous Pit-1
in a mouse GHFT1-5 cell. The endogenous Pit-1 was detected with antisera to Pit-1 and a Texas red-
linked secondary antibody, and staining with H33342 revealed regions of heterochromatin. The red Pit-
1 and blue H33342 fluorescence images were merged, and an intensity profile obtained for both Texas
red emission (red line) and H33342 fluorescence (blue line) at the position indicted by the line was
plotted (right panel). (D) Immunohistochemical detection of Pit-1 in a mouse GHFT1-5 cell expressing
the truncated GFP-C/EBP∆154. Staining for the endogenous Pit-1 was detected in the red channel, the
expressed GFP-C/EBP∆154 was detected in the green channel, and chromatin stained with H33342 was
detected in the blue channel. The different fluorescence images were merged, and an intensity profile
obtained for all three colors at the position indicted by the line was plotted (right panel).
Figure 3. FRET microscopy improves the optical resolution. The diffraction of light limits the
resolution of the microscope to 200 nm, and objects that are closer together than this will appear as a
single object. (A) It is possible to realize a 50-fold increase in spatial resolution by using the technique
of fluorescence resonance energy transfer (FRET) microscopy. FRET is the radiationless transfer of
energy from a donor fluorophore (D) to nearby acceptors (A), resulting in (1) quenching of the donor
signal, and (2) sensitized emission from the acceptor. The efficiency of the energy transfer decreases
dramatically with distance, limiting FRET to distances less than 7 nm. (B) Because the donor emission
is quenched with FRET, detecting the (3) de-quenching of the donor signal after (4) selective
photobleaching of the acceptor provides a direct measurement of FRET efficiency.
Figure 4. The photobleaching of YFP is selective. (A) Pituitary GHFT1-5 cells were co-transfected
with plasmids encoding the co-repressor protein SMRT, tagged with YFP, and the C/EBP∆244 deletion
mutant fused to BFP. Sequential images of the nucleus of a cell co-expressing the proteins were

Day et al. Revised ME 02-0136
35
acquired at the same focal plane using the filters described in Materials and Methods. The calibration
bar indicates 10 µm. The images were merged to show that the proteins were each localized to discrete
subnuclear foci. (B) The YFP-SMRT was photobleached by 5 min. exposure to 500 nm light. Post-
bleach images were acquired at the same focal plane and under identical conditions to document the
bleaching of YFP, and to show that this had no effect on the BFP signal (histogram). (C) Acceptor
photobleaching FRET measurements detect only specific protein associations. Pituitary GHFT1-5 cells
were co-transfected with plasmids encoding both YFP- and BFP- C/EBP∆244, and hERα-BFP, and
cells were identified that expressed all three labeled proteins. The pre-bleach images of the acceptor,
YFP-C/EBP∆244 (left panel), and the combined fluorescence from the donor, BFP-C/EBP ∆244 (foci)
and the nucleoplasmic-localized hERα-BFP (Don 1) are shown. The YFP fluorophore was bleached by
greater than 90% and a second donor image (Don2) was acquired at the same focal plane and under
identical conditions as the first. The pixel-by-pixel change in gray level intensity of the donor signal
was obtained by digital subtraction of the Don1 image from the Don2 image. The intensity profile (right
panel) represents the change in the gray level intensities in the de-quenched donor image (Don2 -
Don1). The calibration bar shows the range of gray level intensities in the de-quenched image with
black indicating 0 and yellow indicating the maximum gray level value (shown next to the calibration
bar). Note that the increase in donor intensity was limited to the foci.
Figure 5. Acceptor photobleaching FRET microscopy detects the interactions of Pit-1 and C/EBPα.
Pre-bleach acceptor (YFP) and donor (BFP) images are shown for each of the panels A-D. A second
donor image (Don2) was acquired at the same focal plane and under identical conditions as the first
(Don1) image after acceptor (YFP) photobleaching. The de-quenched donor signal (Don 2 - Don 1)
was then determined as described in the legend for Figure 4. For each de-quenched donor image, the

Day et al. Revised ME 02-0136
36
pixel-by-pixel change in gray level intensity is shown in the intensity profile (right panels), with black
indicating 0 and yellow indicating the maximum gray level value (shown next to each calibration bar).
(A) The pre-bleach acceptor and donor images showing the recruitment of YFP-C/EBPα by BFP-Pit-1
(Don1), the bar indicates 10 µm. The de-quenched donor (Don 2-Don 1) intensity profile is shown in the
right panel. (B) The pre-bleach acceptor and donor images showing subnuclear distribution of YFP-
C/EBPα and the mutant Pit-1R271A labeled with BFP (Don1). The de-quenched donor (Don 2-Don 1)
intensity profile is shown in the right panel. (C) The pre-bleach acceptor and donor images showing
subnuclear distribution of YFP-C/EBP∆154 and BFP-Pit-1 (Don1). The de-quenched donor (Don 2-Don
1) intensity profile is shown in the right panel. (D) The pre-bleach acceptor and donor images showing
subnuclear distribution of YFP-C/EBP∆318 and BFP-Pit-1 (Don1). The de-quenched donor (Don 2-Don
1) intensity profile is shown in the right panel.
Figure 6. The FRET efficiency (E %) for paired Pit-1 and C/EBPα protein variants measured in
multiple cells. The indicated number (n) of cells, each expressing the donor and acceptor pairs shown
below the graph, were analyzed for changes in donor fluorescence following acceptor photobleaching.
For protein pairs distributed throughout nucleus (open bars), the average gray level intensity was
determined for the entire nucleus in both the pre- and post-bleach donor images. The average E % (±
S.E.M.) was then determined using the equation shown in the footnotes for Table 1. For protein pairs
that were distributed to both foci and nucleoplasm, the average donor gray level intensity was
determined for 10 different ROI in each region that were identically positioned in both the pre- and post-
bleach donor images. All ROIs were of identical size. The E % for the foci (gray bars) or nucleoplasm
(black bars) in each cell was determined and the average E % (± S.E.M.) for the indicated number of
cells is plotted.

B.
⇒
1 2 3 4 5 6
GFP-C/EBPαGFP-C/EBP∆3-154
C/EBP RE 100X Ab 100X
Figure 1 A,B,
-204 rPRL Luciferase (Fold Activity)0 10 20 30 40 50
Control plasmidC/EBP plasmid Pit-1 plasmidC/EBP + Pit-1 plasmids
1 2 3 4
CR1 2 3 4 basic ZIP
WT-C/EBPα
C/EBP∆3-154
C/EBP∆3-68
C/EBP∆68-96
A.
Revised ME 02-0136 version 2

A.
BFP-C/EBP∆3-68 GFP-Pit-1
BFP-C/EBP∆3-154 GFP-Pit-1
Anti Pit-1, H33342
Overlay
GFP-CEBP ∆154Anti Pit-1
B.
C.
D.
Figure 2 A-D Revised ME 02-0136 version 2
Position
Position

Figure 3A,BRevised ME 02-0136 version 2

Figure 4 A,B,C
YFP-SMRT BFP-C/EBP∆244 Merge
Pre-Bleach
Post-Bleach
A.
B. BFPPre-BleachPost-Bleach
0 Gray Level
103
102
10
14096
Don1
Don2
Pixels
Revised ME 02-0136 version 2
YFP-C/EBP∆244 BFP-C/EBP∆244hERα-BFP
0
Don2-Don1Intensity Profile
Don1Pre-Bleach Acc678C.

0
YFP-C/EBPα BFP-Pit-1A.Don1
YFP-C/EBPα BFP-Pit-1R271AB.
YFP-C/EBP∆154 BFP-Pit-1 C.
0
Pre-Bleach Acc
YFP-C/EBP∆318 BFP-Pit-1 D.
Don2-Don1
0
0
Figure 5 A,B,C,D
Intensity Profile
240
479
287
275
Revised ME 02-0136 version 2

E%
10
20
0
5
15
25
Donor Pit-1 Pit-1 Pit-1 Pit-1271
Acceptor CEBP∆318 CEBPα CEBP∆154 CEBPα
n=16
n=11
n=10
n=10
NucleusFociNucleoplasm[
Figure 6Revised ME 02-0136 version 2
Copyright © 2022 FDOKUMEN