Struct2Net: Integrating Structure into Protein-Protein Interaction Prediction
13
Struct2Net: Integrating Structure into Protein-Protein Interaction Prediction Rohit Singh, Jinbo Xu, and Bonnie Berger Pacific Symposium on Biocomputing 11:403-414(2006)
Transcript of Struct2Net: Integrating Structure into Protein-Protein Interaction Prediction

Struct2Net: Integrating Structure into Protein-Protein Interaction Prediction
Rohit Singh, Jinbo Xu, and Bonnie Berger
Pacific Symposium on Biocomputing 11:403-414(2006)
STRUCT2NET: INTEGRATING STRUCTURE INTO
PROTEIN-PROTEIN INTERACTION PREDICTION
ROHIT SINGH! JINBO XU!‡ BONNIE BERGER†‡
Computer Science and Artificial Intelligence LaboratoryMassachusetts Institute of Technology
Cambridge MA 02139E-mail: {rsingh, j3xu, bab}@theory.csail.mit.edu
This paper presents a framework for predicting protein-protein interactions (PPI)that integrates structure-based information with other functional annotations, e.g.GO, co-expression and co-localization, etc. Given two protein sequences, thestructure-based interaction prediction technique threads these two sequences toall the protein complexes in the PDB and then chooses the best potential match.Based on this match, structural information is incorporated into logistic regressionto evaluate the probability of these two proteins interacting. This paper also de-scribes a random forest classifier which can e!ectively combine the structure-basedprediction results and other functional annotations together to predict protein in-teractions. Experimental results indicate that the predictive power of the structure-based method is better than many other information sources. Also, combining thestructure-based method with other information sources allows us to achieve a bet-ter performance than when structure information is not used. We also tested ourmethod on a set of approximately 1000 yeast genes and, interestingly, the predictedinteraction network is a scale-free network. Our method predicted some potentialinteractions involving yeast homologs of human disease-related proteins.Supplementary Information: http://theory.csail.mit.edu/struct2net
1. Introduction
Proteins are the workhorses of the cell, performing a wide variety of func-tions. Most often, they perform these functions by interacting with otherproteins. Indeed, many diseases can be traced to undesirable or malfunc-tioning protein-protein interactions (e.g.: viral-host interactions14, prionformation11). Clearly, the study of such interactions is very important.
Protein-protein interactions (PPIs) can be studied from two di!erent per-spectives. In the traditional view of PPIs, the aim has been to understandthe physical mechanism of interaction between two proteins by using experi-mental and/or computational methods to study each interaction individually.!These authors contributed equally to the work†Corresponding author‡Also in the MIT Dept. of Mathematics
1
In contrast, the more-recent “high-throughput” view of PPIs treats proteinssimply as logical entities and visualizes their interactions as a network, aim-ing to understand the system of interactions as a whole. This paper describesa computational technique that applies insights gleaned from the older per-spective to independently supplement experimental methods designed for thenewer, systems-level perspective of PPIs.
We consider the problem of predicting if two proteins interact, given theirsequence information and, optionally, other genomic and proteomic informa-tion. Such computational prediction of PPIs can supplement experimentalmethods for elucidating PPIs. When mapping very large interactomes (e.g.,human), such PPI predictions– even if only partially accurate– would be valu-able in prioritizing the set of interactions to experimentally test. Moreover,experimental techniques are quite error-prone; as prediction methods gainaccuracy, they can be used to double-check the results of the experiments.Contributions: This paper proposes to use structure-based methods, inconjunction with high-throughput information, to predict interactions. Wedescribe a fully-automated structure-based method for computing the likeli-hood of an interaction, solely from sequence data. A key idea here is that ifa potential interaction is su"ciently favorable energetically, it is likely to betrue. As part of our method, we introduce a novel algorithm for computingthe most-likely structure of the complex formed by two given proteins anddescribe the use of logistic regression2 for evaluating if the putative complexcorresponds to a true interaction. Furthermore, to the best of our knowl-edge, this paper is the first to describe a framework for predicting PPIs thatintegrates structure-based insights with other functional annotation (e.g.,co-expression, GO description). Finally, our methods predict new potentialinteractions involving yeast homologs of human disease-related proteins.Algorithm Overview: We employ a structure-based method to answerthe following question: “assuming two given proteins interact, what is theinteraction energy of the formed complexa?” The method exploits homologybetween the given protein-pair and complexes with known structure. Thenwe use logistic regression to identify those pairs for which the interactionenergy is low enough and, hence, an interaction is likely. To combine PPIpredictions made by our structure-based method with other kinds of func-tional information we have used a random-forest classifier7 (see Fig 1).Related Work: Existing work on predicting PPIs has mostly followed a“guilt-by-association” approach, the idea being that if two proteins share
aIn this paper, when referring to protein complexes, we consider only those with exactlytwo components.
functional characteristics (co-expression, similar GO annotations etc.) theyare likely to interact15. These methods employ a variety of functional infor-mation, using them to classify an interaction as ‘true’ or ‘false’. Many di!er-ent machine learning techniques have been used for classification: Bayesiannetworks5, random forests12, probabilistic decision trees18, and kernel canon-ical analysis17. Qi et al.12, in particular, incorporated a large variety of func-tional information. More recently, Lin et al.8 have ranked various informa-tion sources to identify the strongest predictors of an interaction. However,some of these approaches5,8 also use high-throughput experimental PPI dataitself as a predictorb. In contrast, our goal is to predict PPIs completely in-
dependently of experimental PPI data. In other work, Deng et al.3 haveused sequence-based domain signatures, derived from low-throughput data,to identify interacting domains between proteins. None of these methodsincorporate structure-based approaches.
Our work is di!erent from existing work in the introduction of structure-based methods as additional predictors of PPIs. The use of such methodsprovides several advantages. First, these methods can provide insight intohow, if at all, an interaction happens, unlike guilt-by-association methodswhich do not. Second, for many protein pairs very little functional annota-tion is available and structure-based methods might often be the only avail-able predictors. Third, as we show, these methods can be used in additionto existing methods, allowing us to improve upon current performance. Wenote that Lu, Lu & Skolnick13 have explored the use of purely structure-based methods to predict PPIs. In comparison, our structure-based methodhas several advantages (described later) and we describe how it can be inte-grated with other information sources.
A possible concern might be that current structure prediction methodsare not su"ciently accurate and may not work well for every protein-pair.In response, we note that our framework is modular so that better methodscan be substituted in, as they become available. Second, our method ishomology-based and will improve in performance and coverage as the recentNIH-funded push to elucidate more structures gains momentum.
Another concern might be that just because two protein structures inter-act in-silico, they might not interact in-vivo. This risk can be mitigatedby combining inferences based on structural-techniques with other kindsof data. Also, note that this concern is equally applicable to existing ap-proaches. Similarly, like many previous approaches, we restrict ourselvesbThe usual reasoning in such cases is that high-throughput PPI determination methodsare noisy enough that they only indicate an interaction, not confirm it.

to pairwise protein interactions, even though more than two proteins maysimultaneously interact in vivo.
2. Problem Formulation
We now provide a precise formulation of the two problems we address here:Problem [StructOnly] Given two proteins p and q, and their associatedsequences Sp and Sq, compute the probability that p and q interact.Problem [Struct&OtherInfo] Given two proteins, p and q, their associ-ated sequences Sp and Sq, and optional annotation information {X1
p ,X2p , . . .}
and {X1q ,X2
q , . . .}, compute the probability that p and q interact.In StructOnly, note that we only require the protein sequences, and
not structures. If necessary, the protein sequences can themselves be in-ferred from the corresponding gene sequences. In Struct&OtherInfo,di!erent kinds of annotation information can be incorporated, as available.Our method for solving this problem can be used with as many informationsources as desired, but here we have restricted ourselves to a few:# Name Description
1 Coexpression Similarity between expression levels of the corresponding genes2 Colocalization Co-localization information for the two proteins3 GO Similarity between Gene Ontology(GO) terms for the two genes4 MIPS Similarity between MIPS terms for the corresponding genes5 Domain Seq. motifs indicating the presence of interacting domains6 Coessentiality Whether one, both, or none of the corresponding genes are essential
Table 1: The various kinds of functional annotation used in Struct&OtherInfo.These benchmark annotations have previously been found to be particularly relevant inPPI predictions (see Supp. Info. for details).
3. Algorithms
3.1. Problem #1: StructOnly
Here, we follow a two-staged process (see Fig 1(a)). The advantage of thistwo-staged process is that as structure-based methods improve in accuracy,better ones can be plugged into the first stage.3.1.1. Stage 1: Computing Interaction Energies
Here we introduce DBLRAP (“DouBLe RAPTOR”), a novel algorithm thatexploits the idea that if the homologs of a pair of proteins interact in a specificway, the latter will also interact in a similar way. The algorithm consists oftwo major components: (1) construction of the complex template database,and (2) threading the two sequences to each potential complex template.
The complex template database is derived from the latest SCOP9
database (i.e., SCOP v1.67) as follows: we first check if two protein do-mains can form a complex as per the following rule. For any pair of SCOP
AALGTYKIHW... GEDLKIIHS...
Homology with known protein complexes
Sequences:
Logistic Regression
Scores: -910.1 -540 2.3
0.94Prob. of Interaction
Stag
e 1
Stag
e 2
0.94
Random Forests
TRUE/FALSE
GO
MIP
S
Co-e
xpre
ssio
n
Co-e
ssen
tialit
y
Co-lo
catio
n
Dom
ain
(a) (b)
8.9-760
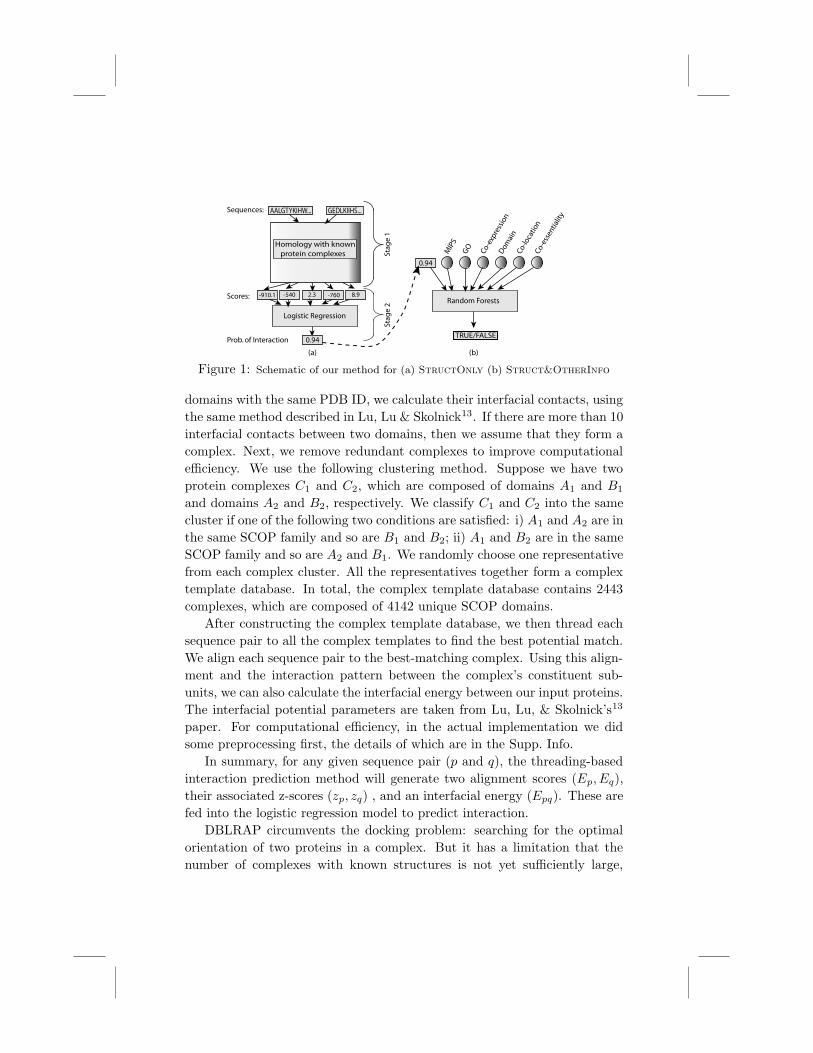
Figure 1: Schematic of our method for (a) StructOnly (b) Struct&OtherInfo
domains with the same PDB ID, we calculate their interfacial contacts, usingthe same method described in Lu, Lu & Skolnick13. If there are more than 10interfacial contacts between two domains, then we assume that they form acomplex. Next, we remove redundant complexes to improve computationale"ciency. We use the following clustering method. Suppose we have twoprotein complexes C1 and C2, which are composed of domains A1 and B1
and domains A2 and B2, respectively. We classify C1 and C2 into the samecluster if one of the following two conditions are satisfied: i) A1 and A2 are inthe same SCOP family and so are B1 and B2; ii) A1 and B2 are in the sameSCOP family and so are A2 and B1. We randomly choose one representativefrom each complex cluster. All the representatives together form a complextemplate database. In total, the complex template database contains 2443complexes, which are composed of 4142 unique SCOP domains.
After constructing the complex template database, we then thread eachsequence pair to all the complex templates to find the best potential match.We align each sequence pair to the best-matching complex. Using this align-ment and the interaction pattern between the complex’s constituent sub-units, we can also calculate the interfacial energy between our input proteins.The interfacial potential parameters are taken from Lu, Lu, & Skolnick’s13
paper. For computational e"ciency, in the actual implementation we didsome preprocessing first, the details of which are in the Supp. Info.
In summary, for any given sequence pair (p and q), the threading-basedinteraction prediction method will generate two alignment scores (Ep, Eq),their associated z-scores (zp, zq) , and an interfacial energy (Epq). These arefed into the logistic regression model to predict interaction.
DBLRAP circumvents the docking problem: searching for the optimalorientation of two proteins in a complex. But it has a limitation that thenumber of complexes with known structures is not yet su"ciently large,
though it is increasing. An alternative approach would be to use homologyonly to predict structures for individual proteins and then use methods forprotein docking to compute and score the optimal relative orientation ofthe two structures. In theory, this approach should have greater coverage:homology-based structure prediction is possible, and reasonably accurate,for many proteins now. However, our limited exploration indicated that thismethod does not work very well, possibly because docking programs are notyet su"ciently good.3.1.2. Stage 2: From Energy Values to Interaction Probabilities
We use binary logistic regression2 to classify whether a set of scores corre-sponds to an interaction or not. In binary logistic regression, the goal is topredict a binary output variable Y , given a set of r predictor variables X ={X1,X2, . . . ,Xr}. For an instance i, suppose yi and xi = {xi1, xi2, . . . , xir}are the random variables corresponding to Y and X, respectively. Let!i = P (yi = 1|xi). In this model, the dependence of !i on xi is expressed bythe logit function:
logit(!i) = log(!i
1 ! !i) = " + #txi = " + #1xi1 + #2xi2 + . . . + #rxir (1)
This can be rewritten as:
P (yi = 1|xi)
P (yi = 0|xi)= e!+"t
xi or P (yi = 1|xi) =e!+"t
xi
1 + e!+"txi
(2)
Logistic regression was performed by the standard Iterative Re-weightedLeast Squares algorithm (the R package: http://www.r-project.org).
We now describe how we have set up the logistic regression problemfor our case. The output variable Y is the probability of interaction oftwo proteins p and q. The predictor variables come from the first stage.For proteins p and q, DBLRAP provides their interfacial energy Epq, theirrespective alignment scores Ep and Eq, as well as associated z-scores zp andzq. In addition to these, we also put in $pq = Np + Nq and %pq =
!
NpNq,where Np and Nq are the sequence lengths of p and q. Finally we introduce,as separate predictor variables, various functions and combinations of theexisting terms: e.g. Ep
Np, Eq
Nq, Epq
#pq, Epq
$pq,!
Epq, etc.We intentionally built an initial model with an excessively large set of
predictor variables: one of our goals was to identify the most informativesubset of predictors, using Akaike Information Criterion (AIC) to deter-mine the subset with the optimal trade-o! between prediction accuracy andsubset-size. The AIC score for a logistic regression model is defined by:
AIC = !2log-likelihood + 2k/N
where k = number of predictor variables, N = number of instances in thedataset, and the log-likelihood of data under the model is computed using Eq.2. The subset of predictor variables with the lowest AIC score was chosen.
The use of logistic regression for prediction confers certain advantages.It allows us to combine multiple scores (interaction energies, z-scores etc.),possibly from di!erent methods. Functions of these scores can also be con-sidered. We can then use logistic regression to identify the most relevantsubset of predictors. Compared to Lu, Lu, & Skolnick13, who only comparedthe interfacial energy against some threshold, the use of logistic regressionallows us to make more sophisticated decisions.
3.2. Problem# 2: Struct&OtherInfo
For classification purposes one can associate, with each pair of proteins pand q, a data-vector Dpq = (d1, . . . , d6) that contains information from thesix non-structure-based information sources described in Table 1. To addstructure-based information to this, we simply add one more feature d7 toDpq. Here, d7 is the probability of interaction between proteins p and q ascomputed using logistic regression. Given some training data consisting ofknown true and likely false interactions, we then train a random forest toclassify a possible interaction based on its data-vector (see Fig 1b).Random Forests: Random forests7 (RF) generalize the intuition behinddecision trees. Given a dataset D of N data-vectors D1, . . . ,DN , & decisiontrees are constructed. For each tree, only a subset of the feature-space isused to train the tree using the data D. For example, for tree T12, only thefeatures d1, d3, and d7 might be used to create it. Given a test data-vectorDt, the predicted class is determined by running down Dt on each tree andthen taking the majority vote over the predicted classes. Random forests canhandle missing data. The procedure for handling missing data is somewhatinvolved; please see the original reference7 for details.
Our use of random forests is rather straightforward. Our feature spaceconsists of the 7 features described earlier.We then trained a random forestwith 500 trees over this space.
Though random forests have only recently been introduced, they havequickly become very popular. They have many desirable characteristics:they rarely overfit the data; they allow classification when features are notindependent; they allow for missing values. Lastly, their output is easy toanalyze in terms of identifying the strongest predictors and the relationshipsbetween the di!erent features. We also note that their usefulness in predic-tion and analysis of PPIs has previously been demonstrated12.
Dataset Interactions Motivation behind PostPos. Notes Neg. creating the dataset Filtering
Interctns.100 From high-quality 400 Low-throughput 69
Lt low-throughput interactions provideexperiments “gold-standard” pos.s
508 Between 1000 proteins 2000 Existing guilt-by-assoc. 332HtFewAnnot with little functional methods do not work
annotation well with these489 Between proteins with 300 Test how to combine 160
HtManyAnnot a lot of functional structure-based methodsannotation with other info.
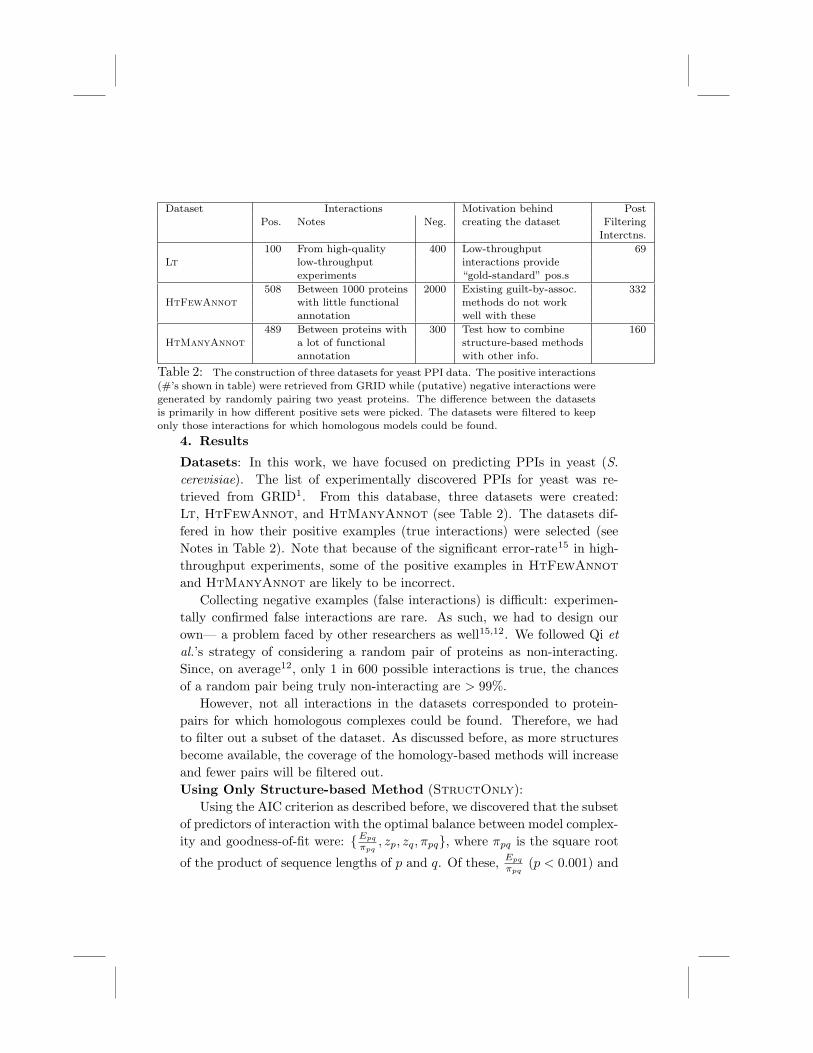
Table 2: The construction of three datasets for yeast PPI data. The positive interactions(#’s shown in table) were retrieved from GRID while (putative) negative interactions weregenerated by randomly pairing two yeast proteins. The di!erence between the datasetsis primarily in how di!erent positive sets were picked. The datasets were filtered to keeponly those interactions for which homologous models could be found.
4. Results
Datasets: In this work, we have focused on predicting PPIs in yeast (S.
cerevisiae). The list of experimentally discovered PPIs for yeast was re-trieved from GRID1. From this database, three datasets were created:Lt, HtFewAnnot, and HtManyAnnot (see Table 2). The datasets dif-fered in how their positive examples (true interactions) were selected (seeNotes in Table 2). Note that because of the significant error-rate15 in high-throughput experiments, some of the positive examples in HtFewAnnot
and HtManyAnnot are likely to be incorrect.Collecting negative examples (false interactions) is di"cult: experimen-
tally confirmed false interactions are rare. As such, we had to design ourown— a problem faced by other researchers as well15,12. We followed Qi et
al.’s strategy of considering a random pair of proteins as non-interacting.Since, on average12, only 1 in 600 possible interactions is true, the chancesof a random pair being truly non-interacting are > 99%.
However, not all interactions in the datasets corresponded to protein-pairs for which homologous complexes could be found. Therefore, we hadto filter out a subset of the dataset. As discussed before, as more structuresbecome available, the coverage of the homology-based methods will increaseand fewer pairs will be filtered out.Using Only Structure-based Method (StructOnly):
Using the AIC criterion as described before, we discovered that the subsetof predictors of interaction with the optimal balance between model complex-ity and goodness-of-fit were: {Epq
$pq, zp, zq,%pq}, where %pq is the square root
of the product of sequence lengths of p and q. Of these, Epq
$pq(p < 0.001) and
zp, zq (p < 0.05) were the more significant predictors.In hindsight, it does seem reasonable that Epq/%pq is a stronger predictor
of interaction than Epq itself: for large proteins, even relatively weak interac-tions will have a large (negative) interfacial energy, simply because of therebeing more interacting entities. Thus, it makes sense that the energy scoreshould be normalized by the sequence length of the two proteins.
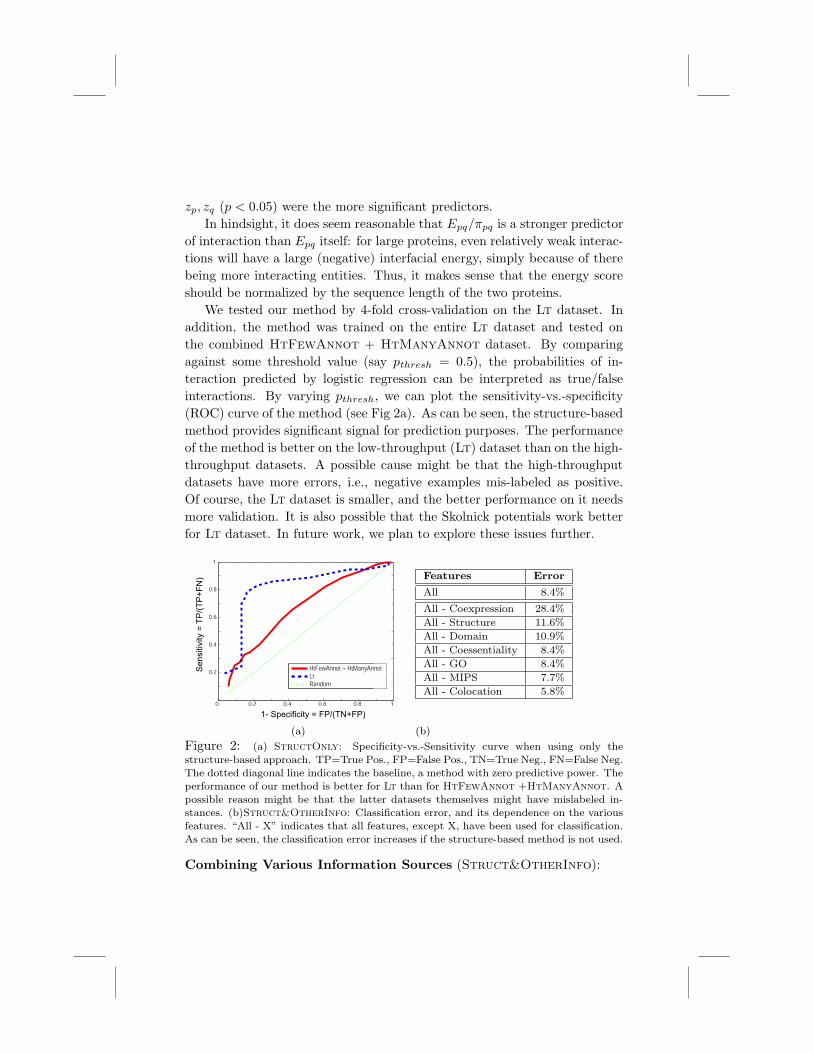
We tested our method by 4-fold cross-validation on the Lt dataset. Inaddition, the method was trained on the entire Lt dataset and tested onthe combined HtFewAnnot + HtManyAnnot dataset. By comparingagainst some threshold value (say pthresh = 0.5), the probabilities of in-teraction predicted by logistic regression can be interpreted as true/falseinteractions. By varying pthresh, we can plot the sensitivity-vs.-specificity(ROC) curve of the method (see Fig 2a). As can be seen, the structure-basedmethod provides significant signal for prediction purposes. The performanceof the method is better on the low-throughput (Lt) dataset than on the high-throughput datasets. A possible cause might be that the high-throughputdatasets have more errors, i.e., negative examples mis-labeled as positive.Of course, the Lt dataset is smaller, and the better performance on it needsmore validation. It is also possible that the Skolnick potentials work betterfor Lt dataset. In future work, we plan to explore these issues further.
0 0.2 0.4 0.6 0.8 1
0.2
0.4
0.6
0.8
1
1- Specificity = FP/(TN+FP)
Sensi
tivity
= T
P/(
TP
+F
N)
HtFewAnnot + HtManyAnnotLtRandom
(a)
Features Error
All 8.4%
All - Coexpression 28.4%All - Structure 11.6%All - Domain 10.9%All - Coessentiality 8.4%All - GO 8.4%All - MIPS 7.7%All - Colocation 5.8%
(b)
Figure 2: (a) StructOnly: Specificity-vs.-Sensitivity curve when using only thestructure-based approach. TP=True Pos., FP=False Pos., TN=True Neg., FN=False Neg.The dotted diagonal line indicates the baseline, a method with zero predictive power. Theperformance of our method is better for Lt than for HtFewAnnot +HtManyAnnot. Apossible reason might be that the latter datasets themselves might have mislabeled in-stances. (b)Struct&OtherInfo: Classification error, and its dependence on the variousfeatures. “All - X” indicates that all features, except X, have been used for classification.As can be seen, the classification error increases if the structure-based method is not used.
Combining Various Information Sources (Struct&OtherInfo):
We tested our entire framework on the HtManyAnnot dataset, adataset specifically chosen for proteins with lots of functional annotationavailable. We used 5-fold cross-validation to evaluate our method, using thecross-validation error (CVE) as the quality metric.c
With average sensitivity = 94.1% and specificity = 92.1%, the overallperformance of our method is better than that of existing work, e.g., Zhanget al.’s18 (sensitivity = 81% at specificity = 80%, approximately)d. Evenwhen experimental PPI data itself has been used as one of the predictorsby others (e.g., Lin et al.8: sensitivity = 98%, specificity = 92%, approxi-mately), our method— which is completely independent of experimental PPIinformation— performs comparably.
One interesting question is: “do structure-based methods contribute tothe predictive power, compared to other features?” To quantify a feature’simportance, we removed it from the mix and recomputed the CVE. Thedi!erence between this CVE and the baseline CVE (with all the featurespresent) indicates the increase in accuracy o!ered by including that feature.As the table in Fig 2 shows, coexpression is the most important feature,followed by the information provided by our method. Some of the otherfeatures, e.g. colocation, do not seem to be particularly important.
4.1. Novel Predictions
Predictions on Less-Characterized Proteins: The proteins in the Ht-
FewAnnot have very little functional annotation and very few known PPIs(see Supp. Info. for more details). For these, there isn’t enough func-tional annotation for “guilt-by-association” methods to work; in contrast,our structure-based method will still work.
We tested all possible pairs in this set for interaction, using our structure-based method, without any additional functional annotation. The probabil-ities of interaction, as computed by logistic regression, were used to rankthe pairs and the top 2000 pairs were chosen. The network formed bythese predicted set of interactions (see Supp. Info. for the predicted set)shows some intriguing properties. It has a scale-free character15, just likethe experimentally-determined yeast PPI network, i.e., the node degree dis-tribution follows the power law. Moreover, the two power-law coe"cientscComputing 5-fold cross-validation error (CVE): data was randomly partitioned into fiveequal parts. Four of the parts constituted the training set while the fifth one made upthe test set. The error was computed as the classification error on this test set. Byrepeating this error computation for each of the classes, five error values were computedand averaged to compute the CVE.dWe compared against Zhang et al.’s performance in the case when they did not useexperimental PPI data as a predictor

are comparable (1.9 for predicted network; 2.3 for the yeast interactome).In the predicted network, the protein CHS2 is a hub (86 interactions),
and the set of its partners is enriched for genes involved in amino acid andamine transporter activity. So, we hypothesized that this protein wouldhave similar functions. This turns out to be true— CHS2 is involved intransferring N-acetylglucosamine to chitin. It is also relevant in disease-treatment; some recent work on developing antiprotozoal drugs has focusedon targeting the chitin-synthesis pathway6. Similarly, for DSF2—a hithertouncharacterized gene—the set of its predicted interaction partners is enrichedfor genes related to DNA transposition and retrotransposons (p < 0.001),indicating DSF2’s possible function.Disease-Related Proteins: In the predictions, we also specifically lookedfor homologs of human disease-related genes. We describe a few findingshere; the rest are in Supp. Info.
The human homolog of RAD28 has been implicated in Cockayne Syn-drome (related to malfunctions in DNA-repair machinery). Currently, thereare only two known PPIs involving RAD28. Our method predicts 19 addi-tional PPIs, and 6 of the predicted partners are involved in DNA repair.
Similarly, the human homolog of PAT1 is Adrenoleukodystrophy– a neu-rodegenerative disease caused by a malfunctioning fatty-acid transporter pro-tein. There are only three known PPIs involving PAT1; our method predicts26 more. Moreover, the set of its interaction partners is enriched for proteinsinvolved in lipid and fatty acid transport (p < 0.01).Genome-scale Predictions: We used the structure-based method, with-out any additional functional annotation, to perform an all-vs-all predictionof the interactions in the yeast genome (see Supp. Info. for predictions). Thepredicted network has a scale-free character similar to the known yeast inter-actome and has about 9% overlap with it. This is significantly better thanoverlap achieved by Lu, Lu & Skolnick’s13 method and is comparable to theoverlap between large-scale experimental PPI datasets.
5. Discussion
We have described how structure-based methods can be integrated with othergenomic and proteomic information for predicting PPIs. Structure-basedmethods can be used by themselves when other functional annotation isnot available. When used in conjunction with functional annotation, theiraddition improves prediction accuracy over existing methods.
Our future e!orts will focus on (1) applying this method to mammaliangenomes, (2) incorporating other kinds of functional annotation (e.g., corre-
lated mutations10), and (3) using docking programs as an additional way ofcomputing interfacial energies. As mentioned before, our brief explorationindicated that current docking programs did not perform satisfactorily. How-ever, more work might suggest ways to improve them for our purposes.Acknowledgments: The authors thank Dr. Ying Xu and Dr. Fengluo Maoat the Univ. of Georgia for allowing us the use of their Linux cluster.
References
1. B.J. Breitkreutz, C. Stark, M. Tyers. The GRID: the General Repository forInteraction Datasets Genome Biol, 4(3):R23, 2003
2. T. Hastie and R. Tibshirani. Generalized Additive Models. Chapman and Hall3. M. Deng, S. Mehta, F. Sun, and T. Chen. Inferring domain-domain interactions
from protein-protein interactions. Genome Research, 12(10):1540–8, 2002.4. A. Jaimovich, G. Elidan, H. Margalit, and N. Friedman. Towards an Integrated
Protein-Protein Interaction Network. Proceedings of RECOMB, 2005.5. R. Jansen et al. A Bayesian networks approach for predicting protein-protein
interactions from genomic data. Science, 302(5644):449–53, 2003.6. E.L. Jarroll and K. Sener. Potential drug targets in cyst-wall biosynthesis by
intestinal protozoa. Drug Resist Update, 6(5), 2003.7. L. Breiman. Random Forests. Machine Learning Journal, 45(1), 2001.8. N. Lin, B. Wu, R. Jansen, M. Gerstein, H. Zhao. Information assessment on
predicting protein-protein interactions. BMC Bioinformatics 18;5:154, 2004.9. A. Murzin, S. Brenner, T. Hubbard, C. Chothia. SCOP:A structural classifi-
cation of proteins database J Mol Biol 247, 536-540, 199510. F. Pazos et al. Correlated mutations contain information about protein-
protein interaction J Mol Biol, 271(4):511-23, 199711. D.L. Price, D.R. Borchelt, and S.S. Sisodia. Alzheimer Disease and the Prion
Disorders Proc Natl Acad Sci USA, 90(14):6381-4, 199312. Y. Qi, J. Klein-Seetharaman, and Z. Bar-Joseph. Random Forest Similarity
for Protein-Protein Interaction Prediction. PSB, 2005.13. H. Lu, L. Lu, and J. Skolnick. Development of Unified Statistical Potentials
Describing Protein- Protein Interactions Biophysical J, 84:1895-1901, 2003.14. P. Uetz, S.V. Rajagopala, Y.A. Dong, and J. Haas. From ORFeomes to protein
interaction maps in viruses. Genome Research, 14(10B):2029–33, 2004.15. C. von Mering et al. Comparative assessment of large-scale data sets of
protein-protein interactions. Nature, 417(6887):399–403, 2002.16. J. Xu, M. Li, D. Kim, and Y. Xu. RAPTOR: optimal protein threading by
linear programming. J. of Bioinformatics and Comp. Biol., 1(1):95–117, 2003.17. Y. Yamanishi et al. Extraction of correlated gene clusters from multiple ge-
nomic data. Bioinformatics, 19:323–30, 2003.18. L.V. Zhang, S.L Wong, O.D. King, F.P. Roth. Predicting co-complexed protein
pairs using genomic and proteomic data integration. BMC Bioinformatics,5(38), 2004.