Genetic algorithm feature-based resampling for protein structure prediction
8
Genetic Algorithm Feature-Based Resampling for Protein Structure Prediction Trent Higgs, Bela Stantic, Md Tamjidul Hoque and Abdul Sattar Abstract— Proteins carry out the majority of functionality on a cellular level. Computational protein structure prediction (PSP) methods have been introduced to speed up the PSP process due to manual methods, like nuclear magnetic resonance (NMR) and x-ray crystallography (XC) taking numerous months even years to produce a predicted structure for a target protein. A lot of work in this area is focused on the type of search strategy to employ. Two popular methods in the literature are: Monte Carlo based algorithms and Genetic Algorithms. Genetic Algorithms (GA) have proven to be quite useful in the PSP field, as they allow for a generic search approach, which alleviates the need to redefine the search strategies for separate sequences. They also lend themselves well to feature- based resampling techniques. Feature-based resampling works by taking previously computed local minima and combining features from them to create new structures that are more uniformly low in free energy. In this work we present a feature- based resampling genetic algorithm to refine structures that are outputted by PSP software. Our results indicate that our approach performs well, and produced an average 9.5% root mean square deviation (RMSD) improvement and a 17.36% template modeling score (TM-Score) improvement. I. I NTRODUCTION P ROTEINS carry out the majority of functionality within an organism on a cellular level. A protein is formed by a string of amino acids folding into a specific three- dimensional shape, which determines the biological task it will perform. An example of this would be the hemoglobin, which performs the task of carrying oxygen to the blood stream. These biological tasks are important in the biology domain, but when it comes to computer science the more exciting aspect in terms of proteins is the numerous three- dimensional shapes and sizes they adopt to perform these biological tasks. To elicit these three-dimensional shapes, a process known as protein structure prediction (PSP) is carried out. To speed up the PSP process, due to manual methods like nuclear magnetic resonance (NMR) and x-ray crystallogra- phy (XC) taking numerous months or years to produce a predicted structure, several computational methods have been proposed. These methods can be grouped into three main categories, comparative or homology modeling, threading or fold recognition, and ab initio or de nova. Comparative modeling and threading work by aligning a protein target sequence with one or more template sequences. Ab initio, Trent Higgs, Bela Stantic, and Abdul Sattar are with the Institute for Integrated and Intelligent Systems (IIIS), Griffith University, Queensland, Australia; emails: {T.Higgs, B.Stantic, A.Sattar}@griffith.edu.au. Md Tamjidul Hoque is with Discovery Biology, Eskitis Institute for Cell & Molecular Therapies Griffith University, Queensland, Australia; email: [email protected]. which is considerably different from the other two meth- ods, is based on Afinsen’s ‘Thermodynamic Hypothesis’ [1]. This states that a protein’s native structure is at its lowest free energy minimum. Both comparative modeling and threading use protein sequences stored in databases to find suitable template sequence matches, however they produce very inaccurate models if the template sequence- similarity to the protein to be folded is < 30%. The ab initio approach (which means ’from the origin’) tries to produce a protein’s three-dimensional structure like nature does - from its sequence alone. Our research predominately uses the ab initio approach. The ab initio method in PSP has been looked at from many different perspectives, and therefore has a large amount of work utilising different search approaches. These include numerous versions of Monte Carlo (MC) [2], [3], Ant Colony Optimisation [4], and Simulated Annealing (SA) [5]. Statisti- cal approaches such as Chain Growth (CG) [6], and Contact Interaction (CI) [7] have also been developed. However, most of these search approaches have the problem that as the sequence length increases the accuracy of the predicted structure decreases. Despite this, further research into bio- inspired algorithms [8], [9], such as Genetic Algorithms, have proven to be quite promising in solving the PSP problem [10], [11], [12]. GAs allow for a generic search strategy that can be applied to various cases, which alleviates the need to redefine the search strategies for separate sequences. It can also generate more successful descendants than random search. The most obvious problem with GAs is that after numerous generations the diversity within the population decreases, causing the GA to get stuck in local minima, and therefore producing sub- optimal solutions. A technique that can be applied to the GA PSP search strategy is feature-based resampling. Feature-based resam- pling lends itself well to GAs as they can take features from various protein structures and recombine them to produce more native-like conformations. Feature-based resampling can be broken down into two concepts: (1) resampling, and (2) feature-based. Resampling by nature is taking an already searched search space, and using the output from that search as input into another search. Feature-based refers to taking various features from the initial search that are more native- like in nature and creating new structures with those features. In this paper we present a feature-based resampling GA to refine structures from an initial PSP run. This is done by using the output (i.e. decoys) of a PSP software as the initial population for the search. Our GA utilises operators 978-1-4244-8126-2/10/$26.00 ©2010 Crown
Transcript of Genetic algorithm feature-based resampling for protein structure prediction
Genetic Algorithm Feature-Based Resampling forProtein Structure Prediction
Trent Higgs, Bela Stantic, Md Tamjidul Hoque and Abdul Sattar
Abstract— Proteins carry out the majority of functionality ona cellular level. Computational protein structure prediction (PSP)methods have been introduced to speed up the PSP process dueto manual methods, like nuclear magnetic resonance (NMR)and x-ray crystallography (XC) taking numerous months evenyears to produce a predicted structure for a target protein.A lot of work in this area is focused on the type of searchstrategy to employ. Two popular methods in the literatureare: Monte Carlo based algorithms and Genetic Algorithms.Genetic Algorithms (GA) have proven to be quite useful inthe PSP field, as they allow for a generic search approach,which alleviates the need to redefine the search strategies forseparate sequences. They also lend themselves well to feature-based resampling techniques. Feature-based resampling worksby taking previously computed local minima and combiningfeatures from them to create new structures that are moreuniformly low in free energy. In this work we present a feature-based resampling genetic algorithm to refine structures thatare outputted by PSP software. Our results indicate that ourapproach performs well, and produced an average 9.5% rootmean square deviation (RMSD) improvement and a 17.36%template modeling score (TM-Score) improvement.
I. INTRODUCTION
PROTEINS carry out the majority of functionality withinan organism on a cellular level. A protein is formed
by a string of amino acids folding into a specific three-dimensional shape, which determines the biological task itwill perform. An example of this would be the hemoglobin,which performs the task of carrying oxygen to the bloodstream. These biological tasks are important in the biologydomain, but when it comes to computer science the moreexciting aspect in terms of proteins is the numerous three-dimensional shapes and sizes they adopt to perform thesebiological tasks. To elicit these three-dimensional shapes,a process known as protein structure prediction (PSP) iscarried out.
To speed up the PSP process, due to manual methods likenuclear magnetic resonance (NMR) and x-ray crystallogra-phy (XC) taking numerous months or years to produce apredicted structure, several computational methods have beenproposed. These methods can be grouped into three maincategories, comparative or homology modeling, threadingor fold recognition, and ab initio or de nova. Comparativemodeling and threading work by aligning a protein targetsequence with one or more template sequences. Ab initio,
Trent Higgs, Bela Stantic, and Abdul Sattar are with the Institute forIntegrated and Intelligent Systems (IIIS), Griffith University, Queensland,Australia; emails: {T.Higgs, B.Stantic, A.Sattar}@griffith.edu.au.
Md Tamjidul Hoque is with Discovery Biology, Eskitis Institute for Cell& Molecular Therapies Griffith University, Queensland, Australia; email:[email protected].
which is considerably different from the other two meth-ods, is based on Afinsen’s ‘Thermodynamic Hypothesis’[1]. This states that a protein’s native structure is at itslowest free energy minimum. Both comparative modelingand threading use protein sequences stored in databasesto find suitable template sequence matches, however theyproduce very inaccurate models if the template sequence-similarity to the protein to be folded is < 30%. The ab initioapproach (which means ’from the origin’) tries to produce aprotein’s three-dimensional structure like nature does - fromits sequence alone. Our research predominately uses the abinitio approach.
The ab initio method in PSP has been looked at frommany different perspectives, and therefore has a large amountof work utilising different search approaches. These includenumerous versions of Monte Carlo (MC) [2], [3], Ant ColonyOptimisation [4], and Simulated Annealing (SA) [5]. Statisti-cal approaches such as Chain Growth (CG) [6], and ContactInteraction (CI) [7] have also been developed. However,most of these search approaches have the problem that asthe sequence length increases the accuracy of the predictedstructure decreases. Despite this, further research into bio-inspired algorithms [8], [9], such as Genetic Algorithms, haveproven to be quite promising in solving the PSP problem[10], [11], [12].
GAs allow for a generic search strategy that can be appliedto various cases, which alleviates the need to redefine thesearch strategies for separate sequences. It can also generatemore successful descendants than random search. The mostobvious problem with GAs is that after numerous generationsthe diversity within the population decreases, causing the GAto get stuck in local minima, and therefore producing sub-optimal solutions.
A technique that can be applied to the GA PSP searchstrategy is feature-based resampling. Feature-based resam-pling lends itself well to GAs as they can take features fromvarious protein structures and recombine them to producemore native-like conformations. Feature-based resamplingcan be broken down into two concepts: (1) resampling, and(2) feature-based. Resampling by nature is taking an alreadysearched search space, and using the output from that searchas input into another search. Feature-based refers to takingvarious features from the initial search that are more native-like in nature and creating new structures with those features.
In this paper we present a feature-based resampling GAto refine structures from an initial PSP run. This is doneby using the output (i.e. decoys) of a PSP software as theinitial population for the search. Our GA utilises operators
978-1-4244-8126-2/10/$26.00 ©2010 Crown
that have been used in numerous low-resolution approaches(e.g. Hydrophobic-Hydrophilic model), and we will be usingRosetta’s energy function for fitness calculations. Our resultsindicate that this approach performs well and produced, onaverage, predictions that were closer to the native conforma-tion when compared to the structures it started with.
The remainder of this paper is organised as follows. InSection II state-of-the-art PSP approaches will be discussed,Section III will look at PSP resampling techniques, SectionIV will outline the methodology that we have applied,Section V explains the experimental setup, Section VI willpresent and discuss the results we gained from our experi-mentation, and in Section VII we will draw our conclusions.
II. PSP APPROACHES
PSP, on a computational level, has produced numeroussearch strategies to tackle this hard optimisation problem -to predict a protein’s three-dimensional conformation. Thereare a number of achievements in this area and in this sectionwe will describe some of the typical approaches: RAMP,TASSER, and Rosetta. Rosetta will be explained in moredetail as it is used heavily in our experiments.
RAMP [5], [13] is a PSP software that utilises the hi-erarchial approach, which is solely based on the ab initiomethod. This approach uses a simple tetrahedral latticethat exhaustively enumerates through all possible compactconformations. From this large pool of conformations itwill select the best 10,000 conformations using a lattice-based scoring function. These 10,000 conformations are thenused as templates for constructing all-atom models by fittinga four-state off-lattice to the lattice conformations to addproper secondary structure refinement (due to the tetrahedrallattice only capturing overall protein chain connectivity notthe finer details of secondary structure).
TASSER (Threading ASSEmbly Refinement) [3], [14],[15] uses a threading modeling approach and was designed tobe able to recognise the majority of non-evolutionary relatedprotein folds within the Protein Data Bank (PDB). This wasso it could refine the structures it generated in regards to theinitial template, and to be able to have better predictions forthe loops. TASSER consists of three main processes, theseare: template identification, structure assembly, and modelselection.
Rosetta [2], [16] uses a Monte Carlo search to minimizean energy function based on ’Afinsen’s ThermodynamicHypothesis’ that a protein’s structure in nature is oftenthe conformation that has the lowest free energy [1]. Eachstructure that is being predicted by Rosetta’s search strategygoes through a two-stage process: (1) an initial search using alow-resolution representation of the protein structure wherethe side chains are depicted as centroids, and (2) a high-resolution refinement stage where all atoms are placed anda fitness function that is closer to the true physical energy isutilised [17]. The low-resolution fitness function is limited,and is usually unable to determine the native conformationbetween native-like structures and local minima. Despite this,the main global conformation of the protein structure comes
together in the low-resolution search stage where the high-resolution search stage will alter this global conformation insmall ways to mainly allow the placement of side chains.
The low-resolution search stage in Rosetta uses fragmentreplacement moves. This is done by taking a sequence ofcontinuous resides of three or nine in length and replacingtheir backbone torsion angles with the torsion angles ofa fragment obtained from the PDB. This is one of themain innovations that enables a lot of Rosetta’s success inPSP. Instead of spending large amounts of computation timesearching individual torsion angles, Rosetta can easily shiftbetween structures that are locally viable.
For each target protein that Rosetta is to be run on afragment pool is created ahead of time. This fragment poolcontains for every frame of three or nine residues in thetarget protein a set of 200 fragments obtained from thePDB. Fragments are selected based on two main criteria.The first being the sequence-similarity between the targetprotein sequence within the frame and the sequence ofthe fragment in the PDB. The second criteria for fragmentselection is matching secondary structure. This is done bycomparing the predicted secondary structure for the targetprotein’s fragment with the actual secondary structure of thefragment contained within the PDB. This pool is used forevery predicted structure created for a certain target protein,and fragment replacement moves are pulled out of it atrandom. Once a fragment replacement has occurred localminimisation is applied and the move is either accepted orrejected.
All of the methods mentioned above are state-of-the-art inthe PSP field. However, they all still struggle with producingaccurate predicted models. This is even more apparent as thelength of the protein increases. Another aspect PSP methodsstruggle with is finding the true global minimum of the en-ergy function. It is very difficult to find the global minimumof the energy function in PSP, compared to any other knowncritical search space, as it is very high-dimensional andcontains a large amount of local minima. The main strategya lot of PSP software (e.g. Rosetta) use to combat thisissue is to perform a large amount of random restarts. Theinherent problem with this kind of strategy is that informationabout previous local minima is thrown away. Samples fromprevious conformation space may suggest regions of lowerenergy, which may be beneficial to pursue further samplingaround. This leads to the intuition of resampling techniques,which are explained in the next section.
III. PSP RESAMPLING TECHNIQUES
The main purpose of resampling techniques is to take analready sampled search space and then refine it. In regardsto PSP, this can be looked at as taking already computedlocal minima and finding samples of conformation spacewithin it that indicate regions which contain consistentlylower energy, and focusing further sampling or searchingaround those regions. There are two main types of resamplingused in PSP: structure-based resampling, and feature-basedresampling [17].
N
Cβ
CCα
O
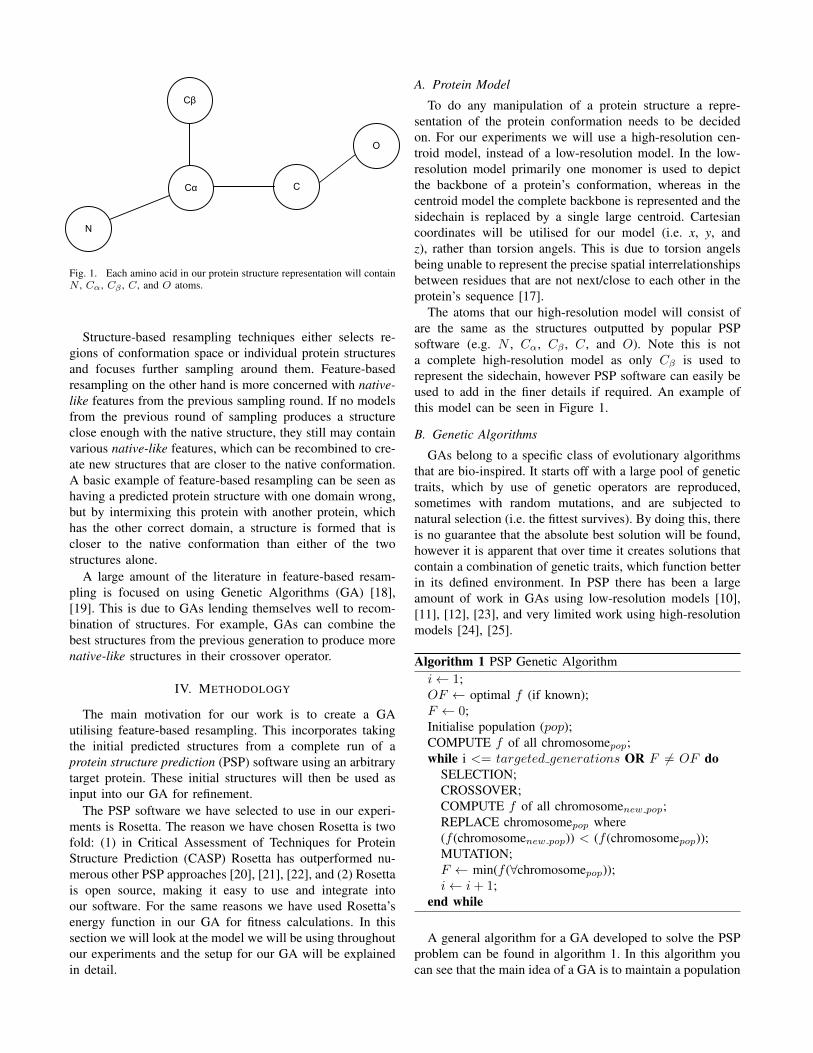
Fig. 1. Each amino acid in our protein structure representation will containN , Cα, Cβ , C, and O atoms.
Structure-based resampling techniques either selects re-gions of conformation space or individual protein structuresand focuses further sampling around them. Feature-basedresampling on the other hand is more concerned with native-like features from the previous sampling round. If no modelsfrom the previous round of sampling produces a structureclose enough with the native structure, they still may containvarious native-like features, which can be recombined to cre-ate new structures that are closer to the native conformation.A basic example of feature-based resampling can be seen ashaving a predicted protein structure with one domain wrong,but by intermixing this protein with another protein, whichhas the other correct domain, a structure is formed that iscloser to the native conformation than either of the twostructures alone.
A large amount of the literature in feature-based resam-pling is focused on using Genetic Algorithms (GA) [18],[19]. This is due to GAs lending themselves well to recom-bination of structures. For example, GAs can combine thebest structures from the previous generation to produce morenative-like structures in their crossover operator.
IV. METHODOLOGY
The main motivation for our work is to create a GAutilising feature-based resampling. This incorporates takingthe initial predicted structures from a complete run of aprotein structure prediction (PSP) software using an arbitrarytarget protein. These initial structures will then be used asinput into our GA for refinement.
The PSP software we have selected to use in our experi-ments is Rosetta. The reason we have chosen Rosetta is twofold: (1) in Critical Assessment of Techniques for ProteinStructure Prediction (CASP) Rosetta has outperformed nu-merous other PSP approaches [20], [21], [22], and (2) Rosettais open source, making it easy to use and integrate intoour software. For the same reasons we have used Rosetta’senergy function in our GA for fitness calculations. In thissection we will look at the model we will be using throughoutour experiments and the setup for our GA will be explainedin detail.
A. Protein Model
To do any manipulation of a protein structure a repre-sentation of the protein conformation needs to be decidedon. For our experiments we will use a high-resolution cen-troid model, instead of a low-resolution model. In the low-resolution model primarily one monomer is used to depictthe backbone of a protein’s conformation, whereas in thecentroid model the complete backbone is represented and thesidechain is replaced by a single large centroid. Cartesiancoordinates will be utilised for our model (i.e. x, y, andz), rather than torsion angels. This is due to torsion angelsbeing unable to represent the precise spatial interrelationshipsbetween residues that are not next/close to each other in theprotein’s sequence [17].
The atoms that our high-resolution model will consist ofare the same as the structures outputted by popular PSPsoftware (e.g. N , Cα, Cβ , C, and O). Note this is nota complete high-resolution model as only Cβ is used torepresent the sidechain, however PSP software can easily beused to add in the finer details if required. An example ofthis model can be seen in Figure 1.
B. Genetic Algorithms
GAs belong to a specific class of evolutionary algorithmsthat are bio-inspired. It starts off with a large pool of genetictraits, which by use of genetic operators are reproduced,sometimes with random mutations, and are subjected tonatural selection (i.e. the fittest survives). By doing this, thereis no guarantee that the absolute best solution will be found,however it is apparent that over time it creates solutions thatcontain a combination of genetic traits, which function betterin its defined environment. In PSP there has been a largeamount of work in GAs using low-resolution models [10],[11], [12], [23], and very limited work using high-resolutionmodels [24], [25].
Algorithm 1 PSP Genetic Algorithmi← 1;OF ← optimal f (if known);F ← 0;Initialise population (pop);COMPUTE f of all chromosomepop;while i <= targeted generations OR F 6= OF do
SELECTION;CROSSOVER;COMPUTE f of all chromosomenew pop;REPLACE chromosomepop where(f (chromosomenew pop)) < (f (chromosomepop));MUTATION;F ← min(f (∀chromosomepop));i← i+ 1;
end while
A general algorithm for a GA developed to solve the PSPproblem can be found in algorithm 1. In this algorithm youcan see that the main idea of a GA is to maintain a population
1
20
(A) Fitness, F= -5
1
‘→’ indicates crossover area
→
→
(B) F= -2
120
→
(C) F= -9
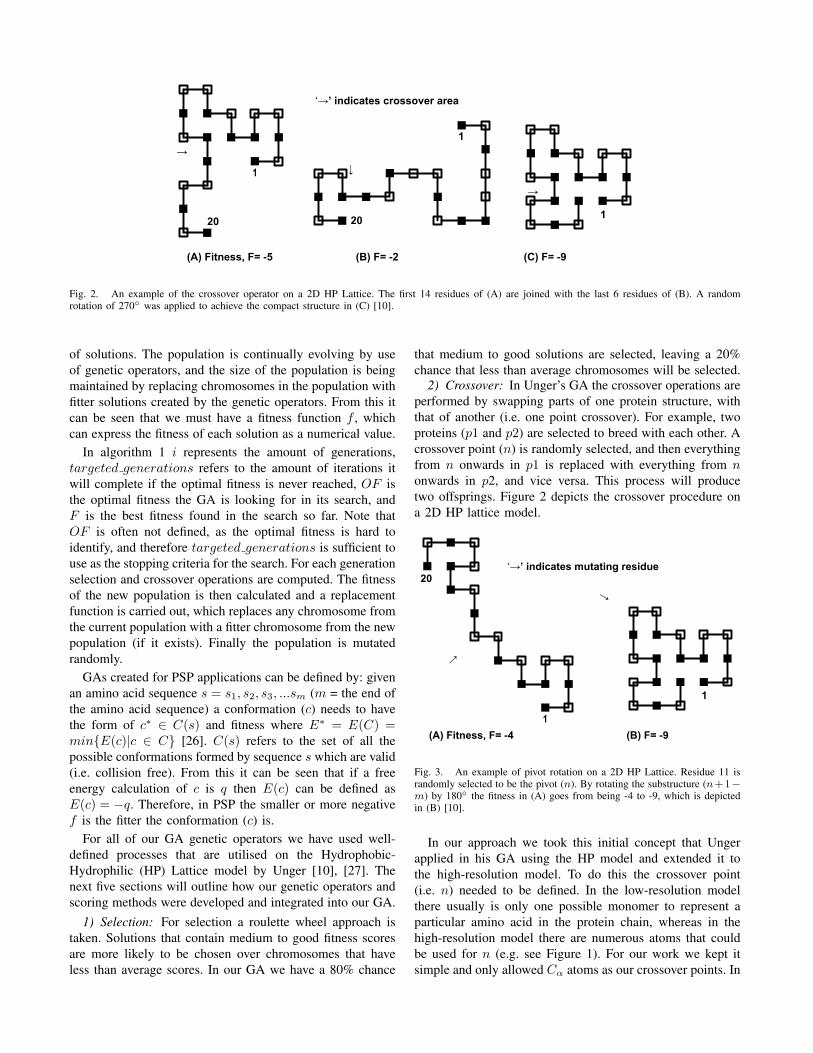
Fig. 2. An example of the crossover operator on a 2D HP Lattice. The first 14 residues of (A) are joined with the last 6 residues of (B). A randomrotation of 270◦ was applied to achieve the compact structure in (C) [10].
of solutions. The population is continually evolving by useof genetic operators, and the size of the population is beingmaintained by replacing chromosomes in the population withfitter solutions created by the genetic operators. From this itcan be seen that we must have a fitness function f , whichcan express the fitness of each solution as a numerical value.
In algorithm 1 i represents the amount of generations,targeted generations refers to the amount of iterations itwill complete if the optimal fitness is never reached, OF isthe optimal fitness the GA is looking for in its search, andF is the best fitness found in the search so far. Note thatOF is often not defined, as the optimal fitness is hard toidentify, and therefore targeted generations is sufficient touse as the stopping criteria for the search. For each generationselection and crossover operations are computed. The fitnessof the new population is then calculated and a replacementfunction is carried out, which replaces any chromosome fromthe current population with a fitter chromosome from the newpopulation (if it exists). Finally the population is mutatedrandomly.
GAs created for PSP applications can be defined by: givenan amino acid sequence s = s1, s2, s3, ...sm (m = the end ofthe amino acid sequence) a conformation (c) needs to havethe form of c∗ ∈ C(s) and fitness where E∗ = E(C) =min{E(c)|c ∈ C} [26]. C(s) refers to the set of all thepossible conformations formed by sequence s which are valid(i.e. collision free). From this it can be seen that if a freeenergy calculation of c is q then E(c) can be defined asE(c) = −q. Therefore, in PSP the smaller or more negativef is the fitter the conformation (c) is.
For all of our GA genetic operators we have used well-defined processes that are utilised on the Hydrophobic-Hydrophilic (HP) Lattice model by Unger [10], [27]. Thenext five sections will outline how our genetic operators andscoring methods were developed and integrated into our GA.
1) Selection: For selection a roulette wheel approach istaken. Solutions that contain medium to good fitness scoresare more likely to be chosen over chromosomes that haveless than average scores. In our GA we have a 80% chance
that medium to good solutions are selected, leaving a 20%chance that less than average chromosomes will be selected.
2) Crossover: In Unger’s GA the crossover operations areperformed by swapping parts of one protein structure, withthat of another (i.e. one point crossover). For example, twoproteins (p1 and p2) are selected to breed with each other. Acrossover point (n) is randomly selected, and then everythingfrom n onwards in p1 is replaced with everything from nonwards in p2, and vice versa. This process will producetwo offsprings. Figure 2 depicts the crossover procedure ona 2D HP lattice model.
1
20
→
‘→’ indicates mutating residue
(A) Fitness, F= -4
1
→
(B) F= -9
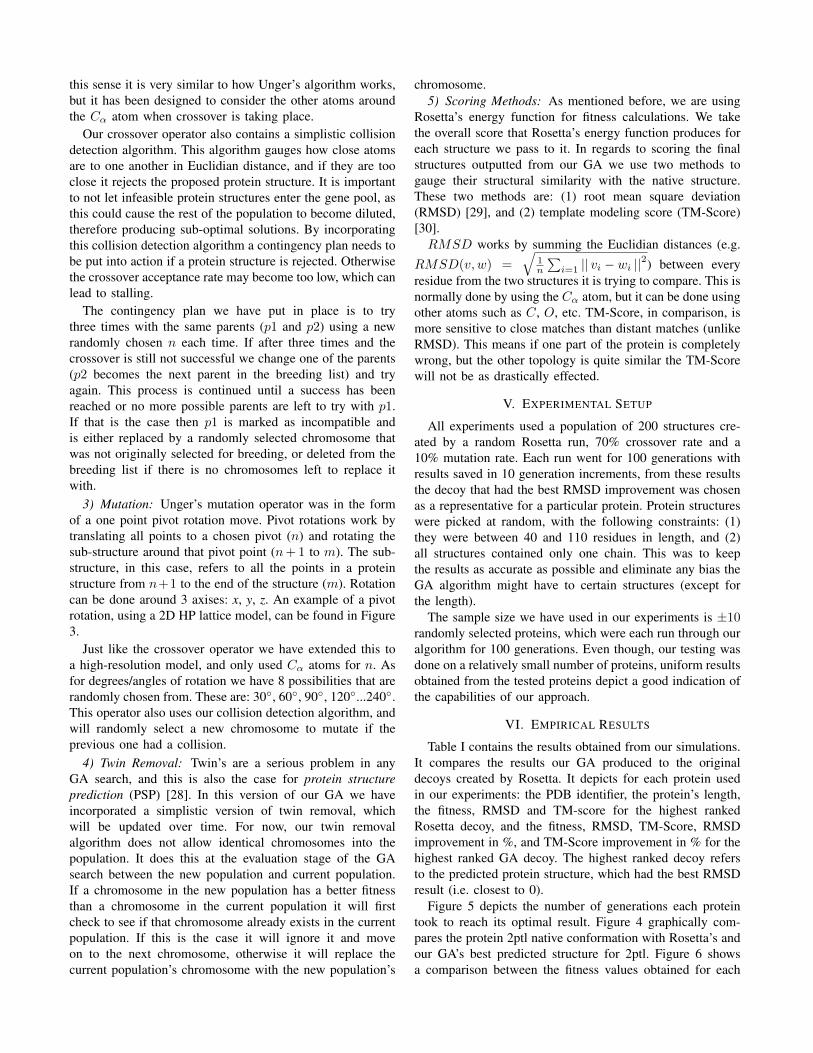
Fig. 3. An example of pivot rotation on a 2D HP Lattice. Residue 11 israndomly selected to be the pivot (n). By rotating the substructure (n+1−m) by 180◦ the fitness in (A) goes from being -4 to -9, which is depictedin (B) [10].
In our approach we took this initial concept that Ungerapplied in his GA using the HP model and extended it tothe high-resolution model. To do this the crossover point(i.e. n) needed to be defined. In the low-resolution modelthere usually is only one possible monomer to represent aparticular amino acid in the protein chain, whereas in thehigh-resolution model there are numerous atoms that couldbe used for n (e.g. see Figure 1). For our work we kept itsimple and only allowed Cα atoms as our crossover points. In
this sense it is very similar to how Unger’s algorithm works,but it has been designed to consider the other atoms aroundthe Cα atom when crossover is taking place.
Our crossover operator also contains a simplistic collisiondetection algorithm. This algorithm gauges how close atomsare to one another in Euclidian distance, and if they are tooclose it rejects the proposed protein structure. It is importantto not let infeasible protein structures enter the gene pool, asthis could cause the rest of the population to become diluted,therefore producing sub-optimal solutions. By incorporatingthis collision detection algorithm a contingency plan needs tobe put into action if a protein structure is rejected. Otherwisethe crossover acceptance rate may become too low, which canlead to stalling.
The contingency plan we have put in place is to trythree times with the same parents (p1 and p2) using a newrandomly chosen n each time. If after three times and thecrossover is still not successful we change one of the parents(p2 becomes the next parent in the breeding list) and tryagain. This process is continued until a success has beenreached or no more possible parents are left to try with p1.If that is the case then p1 is marked as incompatible andis either replaced by a randomly selected chromosome thatwas not originally selected for breeding, or deleted from thebreeding list if there is no chromosomes left to replace itwith.
3) Mutation: Unger’s mutation operator was in the formof a one point pivot rotation move. Pivot rotations work bytranslating all points to a chosen pivot (n) and rotating thesub-structure around that pivot point (n+1 to m). The sub-structure, in this case, refers to all the points in a proteinstructure from n+1 to the end of the structure (m). Rotationcan be done around 3 axises: x, y, z. An example of a pivotrotation, using a 2D HP lattice model, can be found in Figure3.
Just like the crossover operator we have extended this toa high-resolution model, and only used Cα atoms for n. Asfor degrees/angles of rotation we have 8 possibilities that arerandomly chosen from. These are: 30◦, 60◦, 90◦, 120◦...240◦.This operator also uses our collision detection algorithm, andwill randomly select a new chromosome to mutate if theprevious one had a collision.
4) Twin Removal: Twin’s are a serious problem in anyGA search, and this is also the case for protein structureprediction (PSP) [28]. In this version of our GA we haveincorporated a simplistic version of twin removal, whichwill be updated over time. For now, our twin removalalgorithm does not allow identical chromosomes into thepopulation. It does this at the evaluation stage of the GAsearch between the new population and current population.If a chromosome in the new population has a better fitnessthan a chromosome in the current population it will firstcheck to see if that chromosome already exists in the currentpopulation. If this is the case it will ignore it and moveon to the next chromosome, otherwise it will replace thecurrent population’s chromosome with the new population’s
chromosome.5) Scoring Methods: As mentioned before, we are using
Rosetta’s energy function for fitness calculations. We takethe overall score that Rosetta’s energy function produces foreach structure we pass to it. In regards to scoring the finalstructures outputted from our GA we use two methods togauge their structural similarity with the native structure.These two methods are: (1) root mean square deviation(RMSD) [29], and (2) template modeling score (TM-Score)[30].
RMSD works by summing the Euclidian distances (e.g.RMSD(v, w) =
√1n
∑i=1 || vi − wi ||2) between every
residue from the two structures it is trying to compare. This isnormally done by using the Cα atom, but it can be done usingother atoms such as C, O, etc. TM-Score, in comparison, ismore sensitive to close matches than distant matches (unlikeRMSD). This means if one part of the protein is completelywrong, but the other topology is quite similar the TM-Scorewill not be as drastically effected.
V. EXPERIMENTAL SETUP
All experiments used a population of 200 structures cre-ated by a random Rosetta run, 70% crossover rate and a10% mutation rate. Each run went for 100 generations withresults saved in 10 generation increments, from these resultsthe decoy that had the best RMSD improvement was chosenas a representative for a particular protein. Protein structureswere picked at random, with the following constraints: (1)they were between 40 and 110 residues in length, and (2)all structures contained only one chain. This was to keepthe results as accurate as possible and eliminate any bias theGA algorithm might have to certain structures (except forthe length).
The sample size we have used in our experiments is ±10randomly selected proteins, which were each run through ouralgorithm for 100 generations. Even though, our testing wasdone on a relatively small number of proteins, uniform resultsobtained from the tested proteins depict a good indication ofthe capabilities of our approach.
VI. EMPIRICAL RESULTS
Table I contains the results obtained from our simulations.It compares the results our GA produced to the originaldecoys created by Rosetta. It depicts for each protein usedin our experiments: the PDB identifier, the protein’s length,the fitness, RMSD and TM-score for the highest rankedRosetta decoy, and the fitness, RMSD, TM-Score, RMSDimprovement in %, and TM-Score improvement in % for thehighest ranked GA decoy. The highest ranked decoy refersto the predicted protein structure, which had the best RMSDresult (i.e. closest to 0).
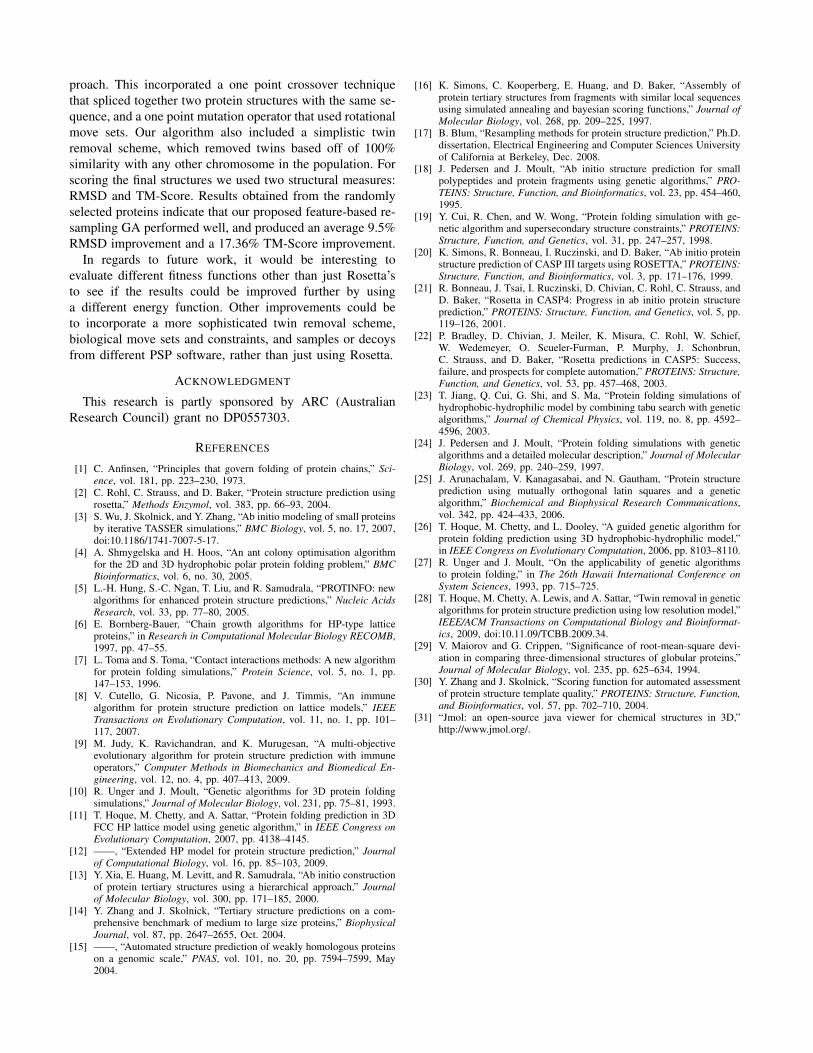
Figure 5 depicts the number of generations each proteintook to reach its optimal result. Figure 4 graphically com-pares the protein 2ptl native conformation with Rosetta’s andour GA’s best predicted structure for 2ptl. Figure 6 showsa comparison between the fitness values obtained for each
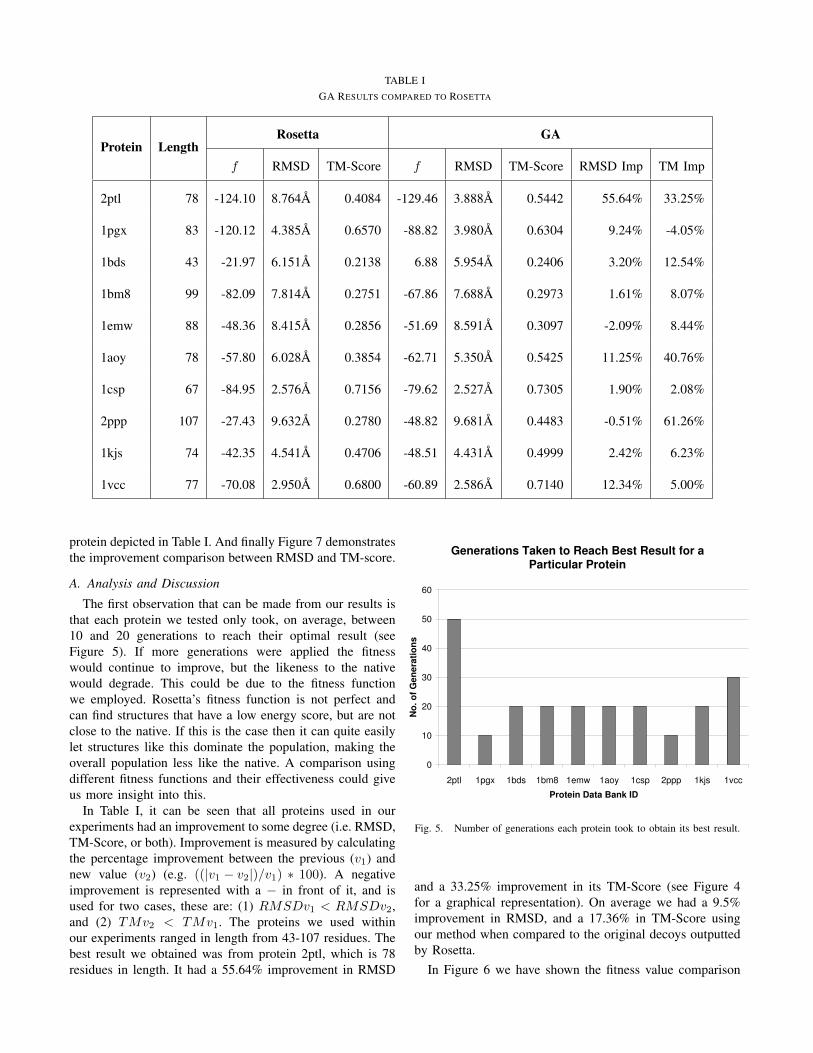
TABLE IGA RESULTS COMPARED TO ROSETTA
Protein LengthRosetta GA
f RMSD TM-Score f RMSD TM-Score RMSD Imp TM Imp
2ptl 78 -124.10 8.764A 0.4084 -129.46 3.888A 0.5442 55.64% 33.25%
1pgx 83 -120.12 4.385A 0.6570 -88.82 3.980A 0.6304 9.24% -4.05%
1bds 43 -21.97 6.151A 0.2138 6.88 5.954A 0.2406 3.20% 12.54%
1bm8 99 -82.09 7.814A 0.2751 -67.86 7.688A 0.2973 1.61% 8.07%
1emw 88 -48.36 8.415A 0.2856 -51.69 8.591A 0.3097 -2.09% 8.44%
1aoy 78 -57.80 6.028A 0.3854 -62.71 5.350A 0.5425 11.25% 40.76%
1csp 67 -84.95 2.576A 0.7156 -79.62 2.527A 0.7305 1.90% 2.08%
2ppp 107 -27.43 9.632A 0.2780 -48.82 9.681A 0.4483 -0.51% 61.26%
1kjs 74 -42.35 4.541A 0.4706 -48.51 4.431A 0.4999 2.42% 6.23%
1vcc 77 -70.08 2.950A 0.6800 -60.89 2.586A 0.7140 12.34% 5.00%
protein depicted in Table I. And finally Figure 7 demonstratesthe improvement comparison between RMSD and TM-score.
A. Analysis and Discussion
The first observation that can be made from our results isthat each protein we tested only took, on average, between10 and 20 generations to reach their optimal result (seeFigure 5). If more generations were applied the fitnesswould continue to improve, but the likeness to the nativewould degrade. This could be due to the fitness functionwe employed. Rosetta’s fitness function is not perfect andcan find structures that have a low energy score, but are notclose to the native. If this is the case then it can quite easilylet structures like this dominate the population, making theoverall population less like the native. A comparison usingdifferent fitness functions and their effectiveness could giveus more insight into this.
In Table I, it can be seen that all proteins used in ourexperiments had an improvement to some degree (i.e. RMSD,TM-Score, or both). Improvement is measured by calculatingthe percentage improvement between the previous (v1) andnew value (v2) (e.g. ((|v1 − v2|)/v1) ∗ 100). A negativeimprovement is represented with a − in front of it, and isused for two cases, these are: (1) RMSDv1 < RMSDv2,and (2) TMv2 < TMv1. The proteins we used withinour experiments ranged in length from 43-107 residues. Thebest result we obtained was from protein 2ptl, which is 78residues in length. It had a 55.64% improvement in RMSD
Generations Taken to Reach Best Result for a
Particular Protein
0
10
20
30
40
50
60
2ptl 1pgx 1bds 1bm8 1emw 1aoy 1csp 2ppp 1kjs 1vcc
Protein Data Bank ID
No
. o
f G
en
era
tio
ns
Fig. 5. Number of generations each protein took to obtain its best result.
and a 33.25% improvement in its TM-Score (see Figure 4for a graphical representation). On average we had a 9.5%improvement in RMSD, and a 17.36% in TM-Score usingour method when compared to the original decoys outputtedby Rosetta.
In Figure 6 we have shown the fitness value comparison

Fig. 4. (A) contains model 1 of the native conformation for 2ptl from the PDB, (B) contains Rosetta’s best predicted structure for 2ptl, and (C) containsour GA’s best predicted structure for 2ptl. Note that both predicted structures have been rotated to match as close as possible with the native conformation.All protein images were generated with Jmol [31].
between Rosetta’s best predicted structures to ours. Theseresults show that the fitness value has a limited effect onhow good a structure is. This can be inferred by there beinga 50% split between the GA structures having and not havingbetter fitness values when compared to Rosetta’s originalfitness values. It can also be seen that on average there isnot too much difference between the fitness values for thesame protein between the two approaches (i.e. Rosetta andGA), which can be seen in Figure 6. This, like the numberof generations, could also be further investigated by applyingdifferent fitness functions and evaluating their effectivenessusing our GA feature-based resampling approach.
Fitness Comparison
-140
-120
-100
-80
-60
-40
-20
0
20
2ptl 1pgx 1bds 1bm8 1emw 1aoy 1csp 2ppp 1kjs 1vcc
Protein Data Bank ID
Fit
ne
ss
Va
lue
Rosetta
GA
Fig. 6. Fitness comparison between Rosetta and GA for each proteindepicted in Table I.
The last aspect we looked at was the RMSD improvementcompared with that of the TM-Score improvement. As men-tioned before, we had an overall average 9.5% improvementfor RMSD and a 17.36% improvement for TM-score. InFigure 7 we have depicted the improvement values forRMSD and TM-Score. RMSD values are classified as animprovement if the new value produced is closer to 0 thanthe previous value. TM-Score on the other hand is based on
RMSD and TM-Score Improvement
-10
0
10
20
30
40
50
60
70
2ptl 1pgx 1bds 1bm8 1emw 1aoy 1csp 2ppp 1kjs 1vcc
Protein Data Bank ID
Imp
rov
em
en
t V
alu
e
RMSD
TM-Score
Fig. 7. RMSD and TM-Score improvement comparison.
whether or not the new value produced is closer to 1 than theprevious value. As our averages show, Figure 7 depicts thatwe achieved better improvement values for TM-Score thanRMSD. TM-Score calculates the similarity of two proteinsbased on topology and puts more emphasis on close matchesrather than distant matches. This makes it a lot more sensitivethan the RMSD measure, and in some cases more accurate.
VII. CONCLUSION
In this paper we have developed a feature-based resam-pling approach for protein structure prediction (PSP) utilisingGenetic Algorithms (GA). GAs lend themselves well to PSPas they can be created as a generalised search that does notrequire its main search operators to be modified for particularcases or domains. It also naturally incorporates the abilityto perform feature-based resampling in its search procedure.Feature-based resampling works by taking previously com-puted local minima and combing features from them to createnew structures that are more uniformly low in free energy.
Our GA was created by utilising similar crossover, andmutation operators that were defined in Unger’s GA ap-
proach. This incorporated a one point crossover techniquethat spliced together two protein structures with the same se-quence, and a one point mutation operator that used rotationalmove sets. Our algorithm also included a simplistic twinremoval scheme, which removed twins based off of 100%similarity with any other chromosome in the population. Forscoring the final structures we used two structural measures:RMSD and TM-Score. Results obtained from the randomlyselected proteins indicate that our proposed feature-based re-sampling GA performed well, and produced an average 9.5%RMSD improvement and a 17.36% TM-Score improvement.
In regards to future work, it would be interesting toevaluate different fitness functions other than just Rosetta’sto see if the results could be improved further by usinga different energy function. Other improvements could beto incorporate a more sophisticated twin removal scheme,biological move sets and constraints, and samples or decoysfrom different PSP software, rather than just using Rosetta.
ACKNOWLEDGMENT
This research is partly sponsored by ARC (AustralianResearch Council) grant no DP0557303.
REFERENCES
[1] C. Anfinsen, “Principles that govern folding of protein chains,” Sci-ence, vol. 181, pp. 223–230, 1973.
[2] C. Rohl, C. Strauss, and D. Baker, “Protein structure prediction usingrosetta,” Methods Enzymol, vol. 383, pp. 66–93, 2004.
[3] S. Wu, J. Skolnick, and Y. Zhang, “Ab initio modeling of small proteinsby iterative TASSER simulations,” BMC Biology, vol. 5, no. 17, 2007,doi:10.1186/1741-7007-5-17.
[4] A. Shmygelska and H. Hoos, “An ant colony optimisation algorithmfor the 2D and 3D hydrophobic polar protein folding problem,” BMCBioinformatics, vol. 6, no. 30, 2005.
[5] L.-H. Hung, S.-C. Ngan, T. Liu, and R. Samudrala, “PROTINFO: newalgorithms for enhanced protein structure predictions,” Nucleic AcidsResearch, vol. 33, pp. 77–80, 2005.
[6] E. Bornberg-Bauer, “Chain growth algorithms for HP-type latticeproteins,” in Research in Computational Molecular Biology RECOMB,1997, pp. 47–55.
[7] L. Toma and S. Toma, “Contact interactions methods: A new algorithmfor protein folding simulations,” Protein Science, vol. 5, no. 1, pp.147–153, 1996.
[8] V. Cutello, G. Nicosia, P. Pavone, and J. Timmis, “An immunealgorithm for protein structure prediction on lattice models,” IEEETransactions on Evolutionary Computation, vol. 11, no. 1, pp. 101–117, 2007.
[9] M. Judy, K. Ravichandran, and K. Murugesan, “A multi-objectiveevolutionary algorithm for protein structure prediction with immuneoperators,” Computer Methods in Biomechanics and Biomedical En-gineering, vol. 12, no. 4, pp. 407–413, 2009.
[10] R. Unger and J. Moult, “Genetic algorithms for 3D protein foldingsimulations,” Journal of Molecular Biology, vol. 231, pp. 75–81, 1993.
[11] T. Hoque, M. Chetty, and A. Sattar, “Protein folding prediction in 3DFCC HP lattice model using genetic algorithm,” in IEEE Congress onEvolutionary Computation, 2007, pp. 4138–4145.
[12] ——, “Extended HP model for protein structure prediction,” Journalof Computational Biology, vol. 16, pp. 85–103, 2009.
[13] Y. Xia, E. Huang, M. Levitt, and R. Samudrala, “Ab initio constructionof protein tertiary structures using a hierarchical approach,” Journalof Molecular Biology, vol. 300, pp. 171–185, 2000.
[14] Y. Zhang and J. Skolnick, “Tertiary structure predictions on a com-prehensive benchmark of medium to large size proteins,” BiophysicalJournal, vol. 87, pp. 2647–2655, Oct. 2004.
[15] ——, “Automated structure prediction of weakly homologous proteinson a genomic scale,” PNAS, vol. 101, no. 20, pp. 7594–7599, May2004.
[16] K. Simons, C. Kooperberg, E. Huang, and D. Baker, “Assembly ofprotein tertiary structures from fragments with similar local sequencesusing simulated annealing and bayesian scoring functions,” Journal ofMolecular Biology, vol. 268, pp. 209–225, 1997.
[17] B. Blum, “Resampling methods for protein structure prediction,” Ph.D.dissertation, Electrical Engineering and Computer Sciences Universityof California at Berkeley, Dec. 2008.
[18] J. Pedersen and J. Moult, “Ab initio structure prediction for smallpolypeptides and protein fragments using genetic algorithms,” PRO-TEINS: Structure, Function, and Bioinformatics, vol. 23, pp. 454–460,1995.
[19] Y. Cui, R. Chen, and W. Wong, “Protein folding simulation with ge-netic algorithm and supersecondary structure constraints,” PROTEINS:Structure, Function, and Genetics, vol. 31, pp. 247–257, 1998.
[20] K. Simons, R. Bonneau, I. Ruczinski, and D. Baker, “Ab initio proteinstructure prediction of CASP III targets using ROSETTA,” PROTEINS:Structure, Function, and Bioinformatics, vol. 3, pp. 171–176, 1999.
[21] R. Bonneau, J. Tsai, I. Ruczinski, D. Chivian, C. Rohl, C. Strauss, andD. Baker, “Rosetta in CASP4: Progress in ab initio protein structureprediction,” PROTEINS: Structure, Function, and Genetics, vol. 5, pp.119–126, 2001.
[22] P. Bradley, D. Chivian, J. Meiler, K. Misura, C. Rohl, W. Schief,W. Wedemeyer, O. Scueler-Furman, P. Murphy, J. Schonbrun,C. Strauss, and D. Baker, “Rosetta predictions in CASP5: Success,failure, and prospects for complete automation,” PROTEINS: Structure,Function, and Genetics, vol. 53, pp. 457–468, 2003.
[23] T. Jiang, Q. Cui, G. Shi, and S. Ma, “Protein folding simulations ofhydrophobic-hydrophilic model by combining tabu search with geneticalgorithms,” Journal of Chemical Physics, vol. 119, no. 8, pp. 4592–4596, 2003.
[24] J. Pedersen and J. Moult, “Protein folding simulations with geneticalgorithms and a detailed molecular description,” Journal of MolecularBiology, vol. 269, pp. 240–259, 1997.
[25] J. Arunachalam, V. Kanagasabai, and N. Gautham, “Protein structureprediction using mutually orthogonal latin squares and a geneticalgorithm,” Biochemical and Biophysical Research Communications,vol. 342, pp. 424–433, 2006.
[26] T. Hoque, M. Chetty, and L. Dooley, “A guided genetic algorithm forprotein folding prediction using 3D hydrophobic-hydrophilic model,”in IEEE Congress on Evolutionary Computation, 2006, pp. 8103–8110.
[27] R. Unger and J. Moult, “On the applicability of genetic algorithmsto protein folding,” in The 26th Hawaii International Conference onSystem Sciences, 1993, pp. 715–725.
[28] T. Hoque, M. Chetty, A. Lewis, and A. Sattar, “Twin removal in geneticalgorithms for protein structure prediction using low resolution model,”IEEE/ACM Transactions on Computational Biology and Bioinformat-ics, 2009, doi:10.11.09/TCBB.2009.34.
[29] V. Maiorov and G. Crippen, “Significance of root-mean-square devi-ation in comparing three-dimensional structures of globular proteins,”Journal of Molecular Biology, vol. 235, pp. 625–634, 1994.
[30] Y. Zhang and J. Skolnick, “Scoring function for automated assessmentof protein structure template quality,” PROTEINS: Structure, Function,and Bioinformatics, vol. 57, pp. 702–710, 2004.
[31] “Jmol: an open-source java viewer for chemical structures in 3D,”http://www.jmol.org/.