Comparing correlated kappas by resampling: Is one level of agreement significantly different from...
10
J. p~3'chiat. Res., Vol. 30. No. 6, pp. 483 492, 1996 -- sPer-amon ('opt, right ~ 1996 Elsevier Science Ltd. All rights reserved Printed in Great Britain 0022 3956/96 $15.00+0.00 PII: S0022-3956(96)00033-7 COMPARING CORRELATED KAPPAS BY RESAMPLING: IS ONE LEVEL OF AGt'~EEMENT SIGNIFICANTLY DIFFERENT =ROM ANOTHER? DEAN P. McKENZIE,* a~NDREW J. MACKINNON,* NORMAND PI~LADEAU,t PATF ICK ONGHENA,~: PETER C. BRUCE,§ DAV1D M. CLARKE¶ SUSAN HAR RIGAN** and PATRICK D. McGORRY** *Department of Psychological Medicine, Mot ash University, and Mental Health Research Institute Melbourne, Victoria, Australia; tUnit6 de Recherch ~Psychosociale, H6pital Douglas Verdun, Quebec, Canada; ++Departement Pedagogsche Wetenschappen, Katt olieke Universiteit Leuven, Belgium; §College of Business and Management, University of Maryland, Marylan I, U.S.A.; ¶Department of Psychological Medicine, Monash University, Australia; **Department of Psychiatry, University of Melbourne, Australia (Received 27 March 1995; revise l 5 March 1996; accepted 26 July 1996) Summary-- Researchers comparing diagnostic systems or screening tests frequently need to compare indices of agreement such as the kappa coeffi~ lent. While asymptotic methods exist for comparing kappas derived from independent samples, n, satisfactory approach exists for comparing kappas derived from the same or related samples. Re sampling methods for comparing kappa coefficients obtained from the same sample are presented Easily undertaken using readily available software, these methods are illustrated by application to : small sample of psychiatric data, as well as to several thousand samples of simulated data. An acc. ptable type I error rate was exhibited. Resampling techniques -- easily implemented and makin ; few assumptions -- deserve wider application in psychiatric research. Copyright ~t'?.1996 Elsevi "~r Science Ltd, lntr )duction First proposed by Cohen in 1960 (Cohen, 1960), the kappa coefficient is commonly employed to assess agreement between jud ;es or raters (Streiner, 1995). As is pointed out by Valiquette et al. (1994), "if two judges c mnot agree, all other reliability considerations, such as internal consistency or temporal sl ability, become totally irrelevant" (p. 60). The assessment of diagnostic accuracy should r ot stop with the calculation of kappa (Faraone & Tsuang, 1994). Nor is kappa without its p "oblems (Byrt et al., 1993; Cicchetti & Feinstein, 1990; Feinstein & Cicchetti, 1990). Neverth~ less, "kappa is now the touchstone for assessing the quality of diagnostic procedures" (Fara one & Tsuang, 1994, p. 654). There are several different forms of kapp~ including weighted kappa, and kappa intended for use with multiple raters (Bloch & KraeJner, 1989; Valiquette et al., 1994). The present discussion is concerned with the use of kappa as a measure of agreement between two Correspondence to: D. P. McKenzie, Biostatistics al d Psychometrics Unit, Mental Health Research Institute, Locked Bag 11, P.O. Parkville, Victoria, Australia, 3052. , .83
-
Upload
independent -
Category
Documents
-
view
4 -
download
0
Transcript of Comparing correlated kappas by resampling: Is one level of agreement significantly different from...

J. p~3'chiat. Res., Vol. 30. No. 6, pp. 483 492, 1996 - - s P e r - a m o n ('opt, right ~ 1996 Elsevier Science Ltd. All rights reserved
Printed in Great Britain 0022 3956/96 $15.00+0.00
PII: S0022-3956(96)00033-7
C O M P A R I N G C O R R E L A T E D K A P P A S B Y R E S A M P L I N G :
IS O N E L E V E L O F A G t ' ~ E E M E N T S I G N I F I C A N T L Y
D I F F E R E N T = R O M A N O T H E R ?
DEAN P. McKENZIE,* a~NDREW J. MACKINNON,* NORMAND PI~LADEAU,t PATF ICK ONGHENA,~: PETER C. BRUCE,§
DAV1D M. CLARKE¶ SUSAN HAR RIGAN** and PATRICK D. McGORRY** *Department of Psychological Medicine, Mot ash University, and Mental Health Research Institute
Melbourne, Victoria, Australia; tUnit6 de Recherch ~ Psychosociale, H6pital Douglas Verdun, Quebec, Canada; ++Departement Pedagogsche Wetenschappen, Katt olieke Universiteit Leuven, Belgium; §College of Business
and Management, University of Maryland, Marylan I, U.S.A.; ¶Department of Psychological Medicine, Monash University, Australia; **Department of Psychiatry, University of Melbourne, Australia
(Received 27 March 1995; revise l 5 March 1996; accepted 26 July 1996)
Summary-- Researchers comparing diagnostic systems or screening tests frequently need to compare indices of agreement such as the kappa coeffi~ lent. While asymptotic methods exist for comparing kappas derived from independent samples, n, satisfactory approach exists for comparing kappas derived from the same or related samples. Re sampling methods for comparing kappa coefficients obtained from the same sample are presented Easily undertaken using readily available software, these methods are illustrated by application to : small sample of psychiatric data, as well as to several thousand samples of simulated data. An acc. ptable type I error rate was exhibited. Resampling techniques - - easily implemented and makin ; few assumptions - - deserve wider application in psychiatric research. Copyright ~t'?. 1996 Elsevi "~r Science Ltd,
lntr )duction
First proposed by Cohen in 1960 (Cohen, 1960), the kappa coefficient is commonly employed to assess agreement between jud ;es or raters (Streiner, 1995). As is pointed out by Valiquette et al. (1994), "if two judges c mnot agree, all other reliability considerations, such as internal consistency or temporal sl ability, become totally irrelevant" (p. 60). The assessment of diagnostic accuracy should r ot stop with the calculation of kappa (Faraone & Tsuang, 1994). Nor is kappa without its p "oblems (Byrt et al., 1993; Cicchetti & Feinstein, 1990; Feinstein & Cicchetti, 1990). Neverth~ less, "kappa is now the touchstone for assessing the quality of diagnostic procedures" (Fara one & Tsuang, 1994, p. 654).
There are several different forms of kapp~ including weighted kappa, and kappa intended for use with multiple raters (Bloch & KraeJner, 1989; Valiquette et al., 1994). The present discussion is concerned with the use of kappa as a measure of agreement between two
Correspondence to: D. P. McKenzie, Biostatistics al d Psychometrics Unit, Mental Health Research Institute, Locked Bag 11, P.O. Parkville, Victoria, Australia, 3052.
, .83

484 D.P. McKenzie et al.
raters, or between a screening instrument and a psychiatric diagnostic system (e.g., Clarke et al., 1993); or between two psychiatric diagnostic systems (e.g., McGorry et al., 1995).
Kappa is often used purely as a descriptive statistic (Bloch & Kraemer, 1989). It may, however, be desirable to estimate the sampling variation of a single kappa, or to ascertain whether one kappa is significantly larger than another. Fleiss (1981) presents formulae for calculating the standard error of kappa and for comparing kappas obtained from separate or independent samples. However, methods for the comparison of correlated kappas - - coefficients obtained from the same sample - - do not appear in the literature.
The comparison of correlated kappas may be useful to establish which of two screening instruments has better agreement with a particular diagnostic system (e.g. Clarke et al., 1993; in press; McKenzie et al., 1992). Another possible application might involve assessment of patterns of differential agreement between alternative diagnostic systems (e.g., Chen et al., 1992; Hill et al., 1996; McGorry et al., 1995). For example, Hill et al. (1996) compared agreement between Research Diagnostic Criteria (RDC) (Spitzer et al., 1975) and ICD-10 diagnoses of schizophrenia, with that between RDC and Schneiderian (Schneider, 1959) diagnoses of schizophrenia.
None of the above studies statistically compared kappa values but instead performed descriptive comparisons (Hill et al., 1996), or statistically compared alternative measures such as percentage agreement (McKenzie et al., 1992) or correlation coefficients (Clarke et al., in press). Note that two percentage of agreement measures may be similar, whereas the two corresponding kappas may be different (Feinstein & Cicchetti, 1990).
Resamplin 9 techniques
There are no parametric tests for the comparison of correlated kappas. Even if there were, such tests would of necessity make assumptions of the data and the sampling distribution of the test statistic. A general statistical technique known as resampling will, therefore, be presented and employed to compare correlated kappas. Resampling techniques involve the repeated "resampling", or taking of samples, from a population of data in order to build a frequency or probability distribution of a statistic. As repeated sampling from a population is generally infeasible, resampling techniques attempt to estimate population values by generating a large number of samples from the population proxy, the original sample (Westfall & Young, 1993).
Resampling techniques "can be used to assess the significance of virtually any test statistic under the most minimal assumptions" (Noreen, 1989, p. 6). Good (1994), Ludbrook (1994), Ludbrook (1995), Noreen (1989) and Westfall and Young (1993) discuss two types of resampling - - permutation tests and the bootstrap. There is another type of resampling technique, the jackknife (e.g., Bloch & Kraemer, 1989; Kraemer, 1980, Kraemer, 1992; Mosteller & Tukey, 1968). This technique has received scant or no attention in the texts cited above. The bootstrap can be regarded as an extension of the jackknife (Efron, 1979; Efron & Tibshirani, 1993), while the latter has been found to give more biased results than the bootstrap (Dalgleish, 1994; Efron& Tibshirani, 1993). The present paper will, therefore, concentrate on permutation tests and the bootstrap.

Comparing Correlated Kappas by Resampling 485
Monte Carlo permutation tests
Before defining random, or Monte Carlo, permutation tests, it is necessary to define exact randomization or permutation tests, the results of which are only approximated by parametric tests such as the analysis of variance and the t-test (Fisher, 1935; Pitman, 1937). Exact permutation tests involve the computing of a relevant statistic (e.g., kappa) for every possible permutation of a sample of data. The number of times that these statistics exceed, or equal the value of the statistic obtained for the original sample, is recorded. If this number, divided by the total number of permutations, is less than or equal to 0.05, then the null hypothesis (of no effect or no association) is rejected. Fisher's exact test (see e.g., Fleiss, 1981) is a commonly used example of an exact permutation test. The standard Pearson chi-squared test is an example of an approximate or asymptotic procedure.
Generating all possible permutations can be practically impossible, even with the use of powerful computers. In the case of measures of agreement such as kappa, the null hypothesis is that there is no association between variables X (e.g., Rater 1) and Y (e.g., Rater 2). All pairings of the two variables would, therefore, be equally probable (Edgington, 1995). There are N factorial ways in which N observations on variable Y can be permuted, relative to variable X. Thus, if there are 10 observations, there are 3,628,800 possible permutations. If there are 13 observations, however, there are over six billion possible permutations.
The use of parametric or Normal theory tests can be thought of as a "statistical shortcut", that does not require the generation of millions of permutations, but which makes various assumptions of the data. The resampling procedures described below require 100's or 1 000's, rather than millions, of permutations, and make few assumptions of the data.
Highly efficient algorithms such as those implemented in the StatXact statistics package (Babinec & M ehta, 1995; Cytel Software Corporation, 1995: Mehta, 1994: Mehta & Patel, 1995) have been developed in order to perform exact permutation tests for various statistics. However, if sample sizes are too large to be analysed using available exact permutation tests, then random, or Monte Carlo, permutation tests (e.g., Bakeman et al., 1996; Dwass, 1957: Edgington, 1995; Good, 1994: Manly, 1991: Mehta, 1994)may be employed. Monte Carlo permutation tests involve sampling without replacement. In other words, each obser- vation that appeared in the original sample will be selected in the "resampled'" sample. However, only a random sample or subset of the possible permutations is employed. Simulations by a variety of researchers (Edgington, 1995: Noreen, 1989; Westfall & Young, 1993) have shown that 1 000 random or Monte Carlo permutations is, in general, sufficient for significance testing at the 0.05 level.
If researchers are to employ resampling techniques, computer software must be readily available (Ludbrook, 1995). Program code for Monte Carlo permutation programs is provided by Edgington (1995), Manly (1991) and Noreen (1989). The Resampling Stats computer program (Pollack et al., 1994; Simon and Bruce, 1995; Simon & Resampling Stats, Inc., 1996) performs Monte Carlo permutation tests, as does the StatXact program (Cytel Software Corporation, 1995). Monte Carlo permutation tests can also be performed using the SCRT program (Onghena & Van Damme, 1994), or the MULTTEST procedure in the SAS package (Onghena & May, 1995). Exact permutation, or Monte Carlo permu- tation, tests have been applied to psychiatric data by Hoffman et al. (1994) and Karniski et al. (1994).

486 D.P. McKenzie et al.
The bootstrap
The bootstrap (Simon, 1969; Efron, 1979; Efron & Tibshirani, 1993; Kaplan & Grant, i 995) involves sampling with replacement from the sample being studied. For example, if the technique was employed with a sample of size 10, 10 integers each of which could take on values between 1 and 10 - - would be randomly generated. Thus, the first sample might consist of the integers (1,1,1,3,5,6,7,8,8,9). If agreement measures such as kappa are calculated, these integers serve as indices to the X-Y (e.g., Rater 1 and Rater 2) pairs. In the present example, therefore, the variables for observation one would appear three times in the bootstrap sample. Variables for observation two would not appear at all, those for observation three would appear once, and so on.
Noreen (1989) and Willemain (1994) provide general subroutines for bootstrap testing. The Resampling Stats (Simon & Resampling Stats, Inc., 1996) computer program performs bootstrap testing, as do BOJA (e.g., Dalgleish, 1995); SAS MULTTEST (Westfall & Young, 1993) and SIMSTAT (Peladeau & LaCouture, 1993; Provalis Research, 1996). Lee & Fung (1993) give details of a program for generating bootstrapped confidence intervals for individual kappas.
Bootstrap and Monte Carlo permutation tests have recently been examined by Good (1994), and Ludbrook (1994), Ludbrook (1995). The bootstrap has been applied to psy- chiatric data by Adwin et al. (1991) and Cole et al. (1994).
Psychiatric example
In order to illustrate how correlated kappas can be compared using the bootstrap and Monte Carlo permutation tests, programs written in Resampling Stats (Simon & Resam- pling Stats, Inc., 1996) command language were applied to a small sample of psychiatric data.
Data
Fifty general hospital patients, admitted to the Monash Medical Centre in Melbourne, were randomly drawn from a larger sample described by Clarke et al. (1993). For illustrative purposes, agreement between two different screening tests and a diagnosis of depression was compared. The screening tests consisted of the Beck Depression Inventory (BDI) (Beck et al., 1961) and the General Health Questionnaire (GHQ) (Goldberg & Williams, 1988), with caseness determined empirically using the Cutoff (McKenzie & Clarke, 1992) program. Diagnosis was concerned with the presence or absence of depression, the definition of which included DSM-III-R Major Depression, Dysthymia, Adjustment Disorder with Depressed Mood, and Depression NOS. The raw data are provided in Table 1. The agreement between a diagnosis of depression, and caseness according to the screening tests, is shown in Table 2.
As the two example kappas (0.54 for Depression - - BDI and 0.75 for Depression - - GHQ) were obtained from the same sample, they are not able to be compared using methods such as that described by Fleiss (1981). Therefore, the kappas were compared using the bootstrap and Monte Carlo permutation procedures.

Comparing Correlated Kappas by Resampling 4 8 7
Table 1
Sample Psychiatric Dataset ( N = 5 0 ) .
Depress ion B D I G H Q n
+ + + 7
-- + + 1 -- + -- 1 + - + 4
- - - - -} - 2
+ - 2
- -- 33
B D I = caseness on Beck Depress ion Inventory G H Q = caseness on General Health Questionnaire + = present - = absent n = number of patients with a particular combinat ion o f
diagnosis and caseness N = sample size.
Procedure
Computer programs for generating bootstrap samples, and Monte Carlo permutations, were developed using Resampling Stats, running on an Intel 486DX-50 microprocessor. In the case of the bootstrap, a similar procedure to that employed by Cohen (1989) to compare correlated correlation coefficients, was used. As the diagnosis was common to both screening tests, 1 000 sets of 50 Depression (X), BDI (Y) and GHQ (Z) triplets were sampled with replacement.
The difference between the X-Y and X-Z kappas was then calculated, and 90% (5th and 95th percentiles for the bootstrapped kappa differences), 95% (2.Sth and 97.5th) and 99% (0.5th and 99.5th percentiles) confidence intervals generated.
In the case of the Monte Carlo permutation tests, the variable representing Depression (X) was randomly shuffled 999 times. In other words, kappas were obtained for 999 random pairings of X with (Y Z). The number of times that the difference between the original iX Y, X-Z) kappa values was equalled or exceeded by the difference between the randomly permuted values was then obtained. This value, incremented by one (see e.g., Noreen, 1989; Manly, 1991; Onghena & May, 1995) was divided by 1 000 (999 random permutations plus one, for the original difference between kappas). If the resulting proportion is less than or
Table 2
Correlated Kappas: A,qreement between a Diagnosis of Depression and Case- ness Accordin9 to Two Screenin9 Tests, (BDI and GHQ), N = 50.
B D 1 G H Q + - + -
Depress ion + 7 6 + 11 2
- 2 35 3 34 Kappa = 0 . 5 4 K a p p a = 0 . 7 5
488 D . P . McKenzie et al.
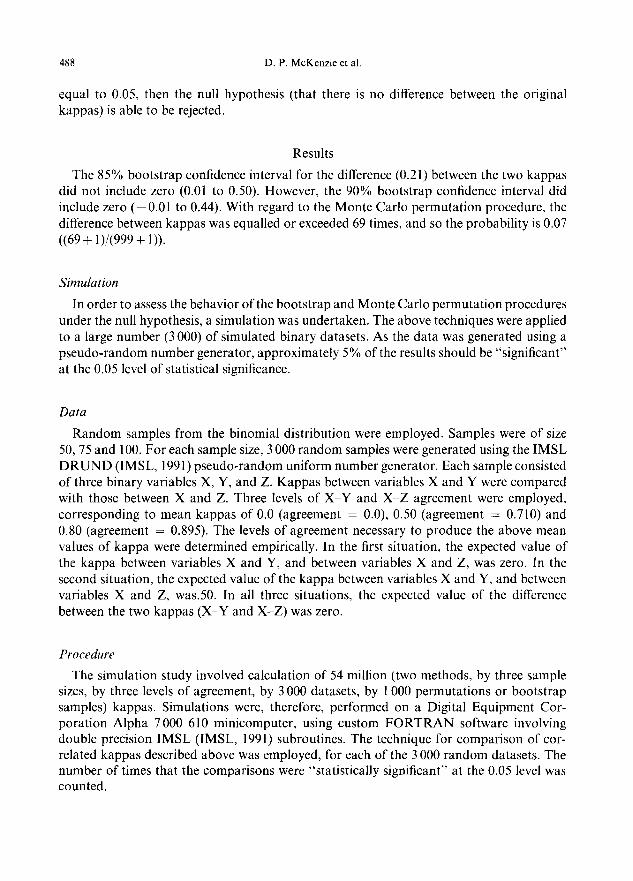
equal to 0.05, then the null hypothesis (that there is no difference between the original kappas) is able to be rejected.
Results
The 85% bootstrap confidence interval for the difference (0.21) between the two kappas did not include zero (0.01 to 0.50). However, the 90% bootstrap confidence interval did include zero (-0.01 to 0.44). With regard to the Monte Carlo permutation procedure, the difference between kappas was equalled or exceeded 69 times, and so the probability is 0.07 ((69 + 1)/(999 + 1)).
Simulation
In order to assess the behavior of the bootstrap and Monte Carlo permutation procedures under the null hypothesis, a simulation was undertaken. The above techniques were applied to a large number (3 000) of simulated binary datasets. As the data was generated using a pseudo-random number generator, approximately 5% of the results should be "significant" at the 0.05 level of statistical significance.
Data
Random samples from the binomial distribution were employed. Samples were of size 50, 75 and 100. For each sample size, 3 000 random samples were generated using the IMSL DRUND (IMSL, 1991) pseudo-random uniform number generator. Each sample consisted of three binary variables X, Y, and Z. Kappas between variables X and Y were compared with those between X and Z. Three levels of X-Y and X-Z agreement were employed, corresponding to mean kappas of 0.0 (agreement = 0.0), 0.50 (agreement = 0.710) and 0.80 (agreement = 0.895). The levels of agreement necessary to produce the above mean values of kappa were determined empirically. In the first situation, the expected value of the kappa between variables X and Y, and between variables X and Z, was zero. In the second situation, the expected value of the kappa between variables X and Y, and between variables X and Z, was.50. In all three situations, the expected value of the difference between the two kappas (X-Y and X-Z) was zero.
Procedure
The simulation study involved calculation of 54 million (two methods, by three sample sizes, by three levels of agreement, by 3 000 datasets, by 1 000 permutations or bootstrap samples) kappas. Simulations were, therefore, performed on a Digital Equipment Cor- poration Alpha 7000 610 minicomputer, using custom FORTRAN software involving double precision IMSL (IMSL, 1991) subroutines. The technique for comparison of cor- related kappas described above was employed, for each of the 3 000 random datasets. The number of times that the comparisons were "statistically significant" at the 0.05 level was counted.
Comparing Correlated Kappas by Resampling 489
Results
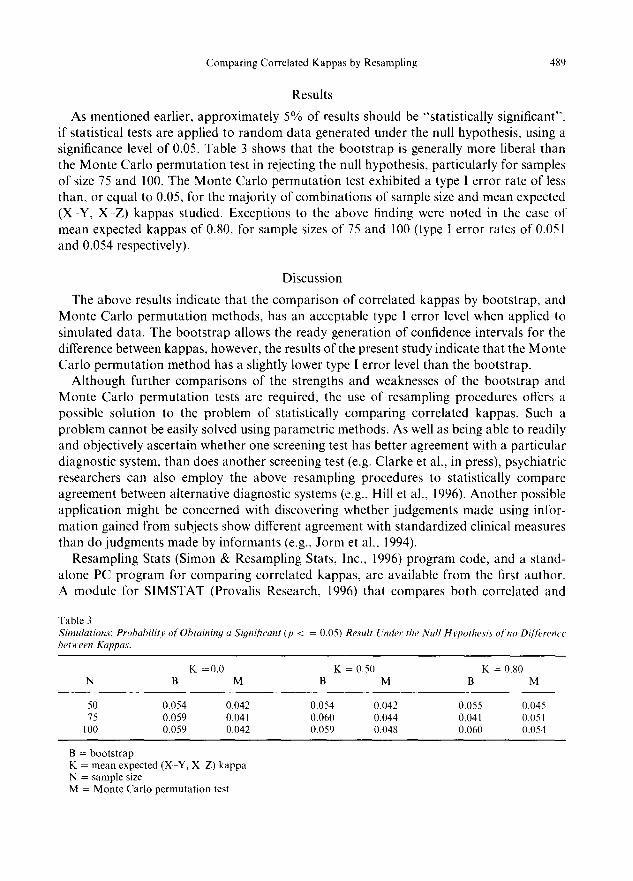
As mentioned earlier, approximately 5% of results should be "statistically significant", if statistical tests are applied to random data generated under the null hypothesis, using a significance level of 0.05. Table 3 shows that the bootstrap is generally more liberal than the Monte Carlo permutation test in rejecting the null hypothesis, particularly for samples of size 75 and 100. The Monte Carlo permutation test exhibited a type I error rate of less than, or equal to 0.05, for the majority of combinations of sample size and mean expected (X-Y, X-Z) kappas studied. Exceptions to the above finding were noted in the case of mean expected kappas of 0.80, for sample sizes of 75 and 100 (type I error rates of 0.051 and 0.054 respectively).
Discussion
The above results indicate that the comparison of correlated kappas by bootstrap, and Monte Carlo permutation methods, has an acceptable type I error level when applied to simulated data. The bootstrap allows the ready generation of confidence intervals for the difference between kappas, however, the results of the present study indicate that the Monte Carlo permutation method has a slightly lower type I error level than the bootstrap.
Although further comparisons of the strengths and weaknesses of the bootstrap and Monte Carlo permutation tests are required, the use of resampling procedures offers a possible solution to the problem of statistically comparing correlated kappas. Such a problem cannot be easily solved using parametric methods. As well as being able to readily and objectively ascertain whether one screening test has better agreement with a particular diagnostic system, than does another screening test (e.g. Clarke et al., in press), psychiatric researchers can also employ the above resampling procedures to statistically compare agreement between alternative diagnostic systems (e.g., Hill et al., 1996). Another possible application might be concerned with discovering whether judgements made using infor- mation gained from subjects show different agreement with standardized clinical measures than do judgments made by informants (e.g., Jorm et al., 1994).
Resampling Stats (Simon & Resampling Stats, Inc., 1996) program code, and a stand- alone PC program for comparing correlated kappas, are available from the first author. A module for SIMSTAT (Provalis Research, 1996) that compares both correlated and
Table 3 Sbnulations: Probability of Obtaining a Sigui[icant (p < - 0.05) Result Under the Null Hypothesis o['no Di[]erence between Kappas.
K =0.0 K = 0.50 K = 0.80 N B M B M B M
50 0.054 0.042 0.054 0.042 0.055 0.045 75 0.059 0.041 0.060 0.044 0.041 0.05 l
100 0.059 0.042 0.059 0.048 0.060 0.054
B = bootstrap K = mean expected (X Y, X Z) kappa N = sample size M = Monte Carlo permutation test

490 D.P. McKenzie et al.
uncorrelated kappas, as well as other measures of agreement, is currently under devel- opment. Although resampling is computer-intensive, the time required to run the procedures need not be prohibitive, especially as fast microcomputers become more widely used. The time taken by Resampling Stats to generate 1000 bootstrap samples, for the above psy- chiatric dataset of 50 patients, was 22 seconds on an Intel 486DX-50 microprocessor. Further testing showed that files containing 100 and 200 randomly generated values took 25 and 29 seconds respectively.
As well as allowing the comparison of correlated kappas, resampling techniques may also offer solutions to other problems in psychiatric research that are not readily addressed using conventional procedures. Examples of such problems include the analysis of multiple hallucinated "voices" (Hoffman et al., 1994), and brain topographic maps (Karniski et al., 1994). Resampling techniques may also be employed in multiple hypothesis testing (Westfall & Young, 1993), model selection (Sauerbrei & Schumacher, 1992) and validation (Thomp- son, 1995), power analyses (Peladeau & LaCouture, 1993), and analyses involving missing data (Efron, 1994).
Even if a parametric method of comparing correlated kappas is developed, it will make assumptions of the data and involve large sample approximations. Resampling procedures are generally able to give more accurate results than parametric tests when applied to data for which parametric assumptions are not tenable (Westfall & Young, 1993), and yet generally perform as well as parametric tests when applied to data meeting such assumptions (e.g., Good, 1994). Resampling procedures allow checks to be made on the results of parametric methods.
Resampling procedures are not a universal panacea to problems of psychiatric data analysis. However, the careful use of such procedures may encourage psychiatric researchers to actively generate permutation or sampling distributions of statistical measures, as a check on and adjunct to, parametric procedures. It is hoped that the use of resampling will cause researchers to understand how statistical significance and confidence intervals are computed. In this fashion, resampling procedures may aid in the development of what might be termed "personal statistics".
May & Hunter (1993) and Walsh & Resnikoff (1990) encourage the use of Monte Carlo permutation and bootstrap methods respectively, in the analysis of clinical data. The latter researchers observe that the use of the bootstrap "frees the clinicians to do what he or she does best - - assess and interpret 'real world' problems" (p. 929). It is strongly suggested that resampling procedures, such as those for the comparison of correlated kappas, become part of the psychiatric researchers' armamentarium.
Acknowh, dgements The authors gratefully acknowledge the constructive comments made by three anonymous reviewers.
References
Adwin, C. M., Spiro, A., & Clark, G., Hall, N. (1991). Thymic peptides, stress and depressive symptoms in older men: a comparison of different statistical techniques for small samples. Brain, Behavior and Irnmunity, 5, 206- 218.
Babinec, T., & Mehta, C. (1995). Achieving meaningful results from small outcome studies. Behavioral Health Management, 15, 25-27.
Comparing Correlated Kappas by Resampling 491
Bakeman, R., Robinson, B. F., & Quera, V. (1996). Testing sequential association: estimating exact p values using sampled permutations. Psychological Methods, 1, 4-15.
Beck, A. T., Ward, C. H., Mendelson, M., Mock, J., & Erbaugh, J. (1961). An inventory for measuring depression. Archives o/'General Psychiato', 4, 53-63.
Bloch, D. A., & Kraemer, H. C. (1989). 2 × 2 kappa coefficients : measures of agreement or association. Biometrics. 45, 269-287.
Byrt, T., Bishop, J., & Carlin, J. B. (1993). Bias, prevalence and kappa. Journal ~['Clinical Epidemiolo,qy, 46, 423 429.
Chen, H. Y., Luo, H. C., & Phillips, M. R. (1992). Computerized psychiatric diagnoses based on Euclidean distances: a Chinese example. Aeta Psychiatrica Scandinaviea, 85, 11 14.
Cicchetti, D. V., & Feinstein, A. R. (1990). High agreement but low kappa: I1. Resolving the paradoxes. Journal of Clinical Epidemiology, 43, 551 --558.
Clarke, D. M., Smith, G. C., & Herrman, H. E. (1993). A comparative study of screening instruments for mental disorders in general hospital patients. International Journal qfPo,chiato" in Medicine, 23, 323 337.
Clarke, D. M., McKenzie, D. P., Marshall, R. J., & Smith, G. C. The construction of a brief case-finding instrument for depression in the physically ill. lnteqrative Psychiatry, in press.
Cohen, A. (1989). Comparison of correlated correlations. Statistics in Medicine, 8, 1485-1495. Cohen, J. (1960). A coefficient of agreement for nominal scales. Educational and Psyehological Measurement, 20,
37 46. Cole, B. F., Gelber, R. D., & Anderson, K. M. (1994). Parametric approaches to quality-adjusted survival
analyses. International Breast Cancer Study Group. Biometrics. 50, 621-631. Cytel Software Corporation (1995). StatXaet-3. version 3.0.1. [computer program]. Cambridge, MA. Dalgleish, L. I. (1994). Discriminant analysis: statistical inference using the jackknife and bootstrap procedures.
Psychological Bulletin, 116, 498 508. Dalgleish, L. 1. (1995). Software review: bootstrapping and jackknifing with BOJA. Statisties and Computinq. 5,
165 174. Dwass, M. (1957). Modified randomization tests for nonparametric hypotheses. Annals o/'Mathematical Statistics.
28, 181 187. Edgington, E. S. (1995). Randomization tests. 3rd edn. New York: Marcel Dekker. Efron, B. (1979). Computers and the theory of statistics: thinking the unthinkable. SIAM Review, 21,460~80. Efron, B. (1994). Missing data, imputation and the bootstrap [with discussion[. Journal of the American Statistical
Association, 89, 463-~79, Efron, B. & Tibshirani, R. J. (1993). An introduction to the bootstrap. New York: Chapman and Hall. Faraone, S. V., & Tsuang, M. T. (1994). Measuring diagnostic accuracy in the absence of a "gold standard".
American Journal c?[" Psyehiato', 151,650-657. Feinstein, A. R., & Cicchetti, D. V. (1990). High agreement but low kappa. 1: the problem of two paradoxes.
Journal o/Clinical Epidemioloqy, 43, 543 549. Fisher, R. A. (1935). The Design qfExperiments. Edinburgh: Oliver and Boyd. Fleiss, J. L. (1981). Statistical Methods[~r Rates and Proportions. 2nd edn. New York: Wiley. Goldberg, D. P. & Williams, P. (1988). A User's Guide to the Ge~leral Health Questionnaire. Windsor, England:
NFER-Nelson. Good, P. (1994). Permutation Tests: A Practical Guide to ResampL:n9 Methods lor Testiny ttypothescs. New York:
Springer-Verlag. Hill, C., Keks, N., Roberts, S., Opeskin, K., Dean, B., Mackinnon, A., & Copolov, D. (1996). Problem of
diagnosis in postmortem brain studies of schizophrenia. American Journal ~fPsychiatry, 153, 533-537. Hoffman, R. E., Oates, E., Hafner, R. J., Hustig, H. H., & McGlashan, T. H. (1994). Semantic organization of
hallucinated "voices" in schizophrenia. American Journal of Psychiato', 151, 1229-1230. IMSL (1991). U,~ers's Manual, STA T/Librao': FORTRAN Subroutines l~r Statistical AnaO~sis. Version 2. [com-
puter program]. Houston, TX: IMSL. Jorm, A. F., Christensen, H., Henderson, A. S., Korten, A. E., Mackinnon, A. J., & Scott, R. (1994). Complaints
of cognitive decline in the elderly: a comparison of reports by subjects and informants in a community survey. Psyeholo.qical Medicine, 24, 365 374.
Kaplan, R. M. & Grant, 1. (1995). Statistics and experimental design. In H 1. Kaplan & B. J. Saddock (Eds), Comprehensive Textbook of P~Lvchiatry (pp. 412~429). 6th edn. Vol 1. Baltimore, MD: Williams and Wilkins.
Karniski, W., Blair, R. C., & Snider, A. D. (1994). An exact statistical method for comparing topographic maps, with any number of subjects and electrodes. Brain Topography, 6, 203-210.
Kraemer, H. C. (1980). Extension of the kappa coefficient. Biometrics, 36, 207 216. Lee, J., & Fung, K. P. (1993). Confidence interval of the kappa coefficient by bootstrap resampling [letter].
Psychiatry Re.search. 49, 97 98.

492 D.P. McKenzie et al.
Ludbrook, J. (1994). Advantages of permutation (randomization) tests in clinical and experimental pharmacology and physiology. Clinical and Experimental Physiology, 21,673-686.
Ludbrook, J. (19953. Issues in biomedical statistics: comparing means by computer-intensive tests. Australian and New Zealand Journal of Surgery, 65, 812 819.
Manly, B. F. J. (1991). Randomization and Monte Carlo Methods in Bioloqy. New York: Chapman and Hall. May, R. B., & Hunter, M. A. (1993). Some advantages of permutation tests. Canadian Ps:vchology, 34, 401~407. McGorry, P. D., Mihalopolous, C., Henry, k., Dakis, J., Jackson, H. J., Flaum, M., Harrigan, S., McKenzie, D.,
Kulkarni, J., & Karoly, R. (1995). Spurious precision: procedural validity of diagnostic assessment in psychotic disorders. American Journal of P~vchiatry, 152, 22(~223.
McKenzie, D. P., & Clarke, D. M. (1992). Cutoff: a FORTRAN program for establishing thresholds for screening indices. Educational and Psychological Measurement, 52, 891 893.
McKenzie, D. P., Clarke, D. M., & Low, k. H. (19923. A method of constructing parsimonious diagnostic and screening tests, lnternationalJournal~?fMethods in Psychiatric Research, 2, 71 79.
Mehta, C. R. (1994). The exact analysis of contingency tables in medical research. Statistical Methods in Medical Research, 3, 135 156.
Mehta, C. R., & Patel, N. R. (1995). Exact logistic regression: theory and examples. Statistics in Medicine, 14, 2143 2160.
Mosteller, F. & Tukey, J. W. (1968). Data analysis including statistics. In G. Lindzey & E. Aronson (Eds), The Handbook of Social Psychology (pp. 80 203). Vol 2. Reading, MA: Addison-Wesley.
Noreen, E. W. (1989). Computer-intensive Methodsjbr Testin9 ttvpotheses: An Introduction. New York: Wiley. Onghena, P., & May, R. B. (1995). Pitfalls in computing and interpreting randomization test p-values: a com-
mentary on Chen and Dunlap. Behavior Research Methods, Instruments and Computers, 27, 408~11. Onghena, P., & Van Damme, G. (1994). SCRT 1.1: single-case randomization tests. Behavior Research Methods,
Instruments and Computers, 26, 368 372. Peladeau, N., & LaCouture, Y. (19933. SIMSTAT: bootstrap computer simulation and statistical program for
1BM personal computers. Behavior Research Methods, Instruments and Computers, 25, 410-413. Pitman, E. J. R. (19373. Significance tests which may be applied to samples from any populations. Journal qfthe
Royal Statistical Society series B, 4, 119-130. Pollack, S., Bruce, P., Borenstein, M., & Lieberman, J. (1994). The resampling method of statistical analysis.
Psychopharmacology, 30, 227-234. Provalis Research (1996). SIMSTA T.lbr Windows User's Guide [computer program]. Montreal, Quebec: Provalis
Research. Sauerbrei, W., & Schumacher, M. (1992). A bootstrap resampling procedure for model building: application to
the Cox regression model. Statistics in Medicine, 11, 2093 2109. Schneider, K. (1959). Clinical Psychopathologcy. (Tr. M. W. Hamilton). London: Grune and Stratton. Simon, J. L, (1969). Basic Research Methods in Social Science. New York: Random House. Simon, J. L., & Bruce, P. (19953. The new biostatistics of resampling. MD Computing, 12, 115-121. Simon, J. L. & Resampling Stats, Inc. (1996). Resamplin9 StatsJor Windows. Version 4.0.3. [computer program].
Arlington, VA: Resampling Stats, Inc. Spitzer, R. L.. Endicott, J. & Robins, E. (1975). Research Diagnostic Criteria (RDC).['or a Selected Group 0["
Functional Disorders. 2nd ed. New York: New York State Psychiatric Institute, Biometrics Research. Streiner, D. L. (1995). Learning how to differ: agreement and reliability statistics in psychiatry. Canadian Journal
~fPsychiatry, 40, 60 66. Thompson, B. ( 19953. Exploring the replicability of a study's results: bootstrap statistics for the multivariate case.
Educational and Psychological Measurement, 55, 84-94. Valiquette, C. A. M., Lesage, A. D., & Cyr, M., Toupin, J. (1994). Computing Cohen's kappa coefficients using
SPSS MATRIX. Behavior Research Methods, Instruments and Computers, 26, 60 61. Walsh, J. F., & Resnikoff, M. (1990). Bootstrapping: a tool for clinical research. Journal Of Clinical Psycholoqy,
46, 928 930. Westfall, P. H. & Young, S. S. (1993). Resampling-based Multiple Testing: E~:amples and Method~Jbr p-t,alue
Adjustment. New York: Wiley. Willemain, T. R. (1994). Bootstrap on a shoestring: resampling using spreadsheets. The American Statistician, 48,
4~42.