Identification of Novel Alternative Splice Isoforms of Circulating Proteins in a Mouse Model of...
29
Identification of Novel Alternative Splice Isoforms of Circulating Proteins in a Mouse Model of Human Pancreatic Cancer Rajasree Menon 1 , Qing Zhang 2 , Yan Zhang 1 , Damian Fermin 1 , Nabeel Bardeesy 3 , Ronald A. DePinho 4 , Chunxia Lu 5 , Samir M. Hanash 2 , Gilbert S. Omenn 1 , David J. States 1 1 Center for Computational Medicine and Biology, University of Michigan, Ann Arbor, MI; 2 Fred Hutchinson Cancer Research Center, Seattle, WA; 3 Center for Cancer Research, Massachusetts General Hospital, Boston, MA; 4 Center for Applied Cancer Science, Dana-Farber Cancer Institute and Harvard Medical School, Boston, MA; 5 Pediatric Endocrinology, University of Michigan, Ann Arbor, MI. Running Title: Novel splice isoforms in a pancreatic cancer model Key words: Alternative splice variant protein, proteomics, Pancreatic cancer Funding: This work was supported in part by NCI/SAIC contract N01-CO-12400/Sub-k 323XS110A on Mouse Models of Human Cancers, MTTC GR 687 for Proteomics Alliance for Cancer Research, R01 LM008106 Automated Genome Annotation, MMHCC U01 CA84313, NCI PDAC P01 IPOICA117969-01, U54 DA021519 National Center for Integrative Biomedical Informatics, P41 RR018627 National Resource for Pathways and Proteomics, and U01 CA 084982 NCI Early Detection Research Network. 1
Transcript of Identification of Novel Alternative Splice Isoforms of Circulating Proteins in a Mouse Model of...
Identification of Novel Alternative Splice Isoforms of
Circulating Proteins in a Mouse Model of Human Pancreatic
Cancer
Rajasree Menon1, Qing Zhang2, Yan Zhang1, Damian Fermin1, Nabeel Bardeesy3, Ronald A. DePinho4, Chunxia Lu5, Samir M. Hanash2, Gilbert S. Omenn1, David J. States1
1 Center for Computational Medicine and Biology, University of Michigan, Ann Arbor, MI; 2Fred Hutchinson Cancer Research Center, Seattle, WA; 3Center for Cancer Research, Massachusetts General Hospital, Boston, MA; 4Center for Applied Cancer Science, Dana-Farber Cancer Institute and Harvard Medical School, Boston, MA; 5
Pediatric Endocrinology, University of Michigan, Ann Arbor, MI. Running Title: Novel splice isoforms in a pancreatic cancer model Key words: Alternative splice variant protein, proteomics, Pancreatic cancer Funding: This work was supported in part by NCI/SAIC contract N01-CO-12400/Sub-k 323XS110A on Mouse Models of Human Cancers, MTTC GR 687 for Proteomics Alliance for Cancer Research, R01 LM008106 Automated Genome Annotation, MMHCC U01 CA84313, NCI PDAC P01 IPOICA117969-01, U54 DA021519 National Center for Integrative Biomedical Informatics, P41 RR018627 National Resource for Pathways and Proteomics, and U01 CA 084982 NCI Early Detection Research Network.
1
Abstract To assess the potential of tumor-associated alternatively spliced gene products as a source
of biomarkers in biological fluids, we have analyzed a large dataset of mass spectra
derived from the plasma proteome of a mouse model of human pancreatic ductal
adenocarcinoma. MS/MS spectra were interrogated for novel splice isoforms using a
non-redundant database containing an exhaustive 3-frame translation of Ensembl
transcripts and gene models from ECgene. This integrated analysis identified 420
distinct splice isoforms, of which 92 did not match any previously annotated mouse
protein sequence. We chose seven of those novel variants for validation by reverse
transcription polymerase chain reaction (RT-PCR). The results were concordant with the
proteomic analysis. All seven novel peptides were successfully amplified in pancreas
specimens from both wild-type and mutant mice. Isotopic labeling of cysteine-containing
peptides from tumor-bearing mice and wild-type controls enabled relative quantification
of the proteins. Differential expression between tumor-bearing and control mice was
notable for peptides from novel variants of muscle pyruvate kinase, malate
dehydrogenase 1, glyceraldehyde-3-phosphate dehydrogenase, proteoglycan 4,
minichromosome maintenance, complex component 9, high mobility group box 2 and
hepatocyte growth factor activator. Our results show that, in a mouse model for human
pancreatic cancer, novel and differentially expressed alternative splice isoforms are
detectable in plasma and may be a source of candidate biomarkers.
2

Introduction Alternative splicing plays an important role in protein diversity without significantly
increasing genome size. Aberrations in alternative splice variants contribute to a number
of diseases including cancers (1, 2). For example, Thorsen et al (2) identified cancer-
specific splicing events in colon, bladder, and prostate tissues, with diagnostic and
prognostic implications. The several alternatively spliced sequence databases now
publicly available differ in their annotation and modeling methods and contain many
transcripts not present in reference resources like Ensembl or Refseq (3). The ECgene
database is one of the largest alternatively spliced sequence databases (4). Entries in this
database are scored as high, medium, or low confidence reflecting the amount of
cumulative evidence in support of the existence of a particular alternatively spliced
sequence. Evidence is collected from clustering of ESTs, mRNA sequences and gene
model predictions. We modified the ECgene database to include three-frame translations
of the cDNA sequences (5) to determine the occurrence of novel splice variant proteins.
An important development in recent years is substantial improvement in tandem mass
spectrometry instrumentation for proteomics, allowing in-depth analysis and confident
identifications even for proteins coded by mRNA transcript sequences expressed at low
levels (6-8).
Pancreatic ductal adenocarcinoma (PDAC) is among the most lethal of human cancers
due to absence of methods for early diagnosis and chemoresistance of advanced disease.
The KrasG12D/Ink4a/Arf mouse model of PDAC was engineered with signature mutations
that recapitulate the histopathologic progression of the human disease in a highly
reproducible and synchronous fashion (9, 10). Here we exploit this model to test the
hypothesis that cancer-specific alternative splice variants can be identified by in-depth
mass spectrometric analysis of plasma proteins from this mouse model of pancreatic
cancer. In this study, we have interrogated our modified ECgene database to identify both
novel and known splice variants among circulating proteins. In addition, our analysis of
quantitative expression ratios reveals variant proteins that are differentially expressed in
pancreatic cancer.
3
Materials and Methods
Mass spectrometry data
Our search for alternative spliced forms used data from extensive proteomic analysis of
plasma from 7 weeks old male wild type mice and KRasG12D /Ink4a-Arf mouse model of
PDAC (10). Approximately 1/3 of the Kras Ink4a/Arf mice present with the most
common pathology observed in human cases – glandular. Plasma from Kras Ink4a/Arf
mice with exclusively glandular tumor areas were used in this study. The samples were
processed by Intact Protein Fractionation and Analysis System (11) protocol which
incorporates immunodepletion to eliminate the most abundant plasma proteins, thus
removing 90% of the protein mass. Immunodepletion was followed by isotopic labeling
of protein cysteine residues with acrylamide, heavy (D3) for mutant and light (D0) for
wild type samples. The mass difference between a D3 labeled and a D0 labeled cysteine
residue is 3.01884 daltons. Samples from wild type and PDAC bearing mice were then
pooled and the intact proteins were fractionated into 12 anion exchange (AX) fractions
followed by 13 or more reverse phase (RP) fractions for each AX fraction yielding a total
of 163 fractions. Individual fractions were digested with trypsin and analyzed using a
ThermoFinnigan LTQ-FT mass spectrometer. Mass spectra from the LTQ-FT experiment
were acquired as RAW files. The mzXML files containing the spectral information were
extracted from RAW files using ReAdW.exe program (http://tools.proteomecenter.org).
The mzXML files were then searched against a modified ECgene database (for alternate
splice variant analysis) using X!Tandem (12) software.
Modified ECgene Database
Alternative splicing can generate multiple transcripts from the same gene which are
translated to splice isoforms (also known as splice variant proteins). Our target alternative
splice variant protein database, the modified ECgene database, was constructed by
combining Ensembl 40 and ECgene database (mm8, build 1). Taking alternative splicing
events into specific consideration, ECgene combines genome-based EST clustering and
the transcript assembly procedure to construct gene models that encompass all alternative
splicing events. The reliability of each isoform is assessed from the nature of cluster
4
members and from the minimum number of clones required to reconstruct all exons in the
transcript (13). The ECgene database contains a total of 417,643 splice variants. In the
Ensembl 40 database, there is a total of 21,839 mouse genes with 28,110 transcripts, of
which 10,922 alternative transcripts are derived from 4,651 genes.
Transcript sequences from the ECgene and Ensembl 40 databases were translated in three
reading frames. Within each dataset, the first instance of each protein sequence longer
than 14 amino acids was recorded. The resulting proteins from both database translations
were then combined and filtered for redundancy. For this filtering, proteins derived from
Ensembl transcripts were preferentially recorded over those generated from ECgene
records. A collection of common protein contaminant sequences was added to this set.
Lastly, all sequences were reversed and appended to the set of forward sequences as an
internal control for false identifications. This last step resulted in doubling the total
number of entries in the modified ECgene database with a final total of 10,381,156
protein sequences.
Post search analyses
Trans Proteomic Pipeline (TPP)
For statistical purposes, the X!Tandem search results were post processed with
PeptideProphet and ProteinProphet software using TPP (version 3.2)
(http://tools.proteomecenter.org). First, we analyzed search results from each fraction
separately using PeptideProphet, and then processed all PeptideProphet files together
using ProteinProphet. Relative quantification of isotopically labeled peptides was
performed using the Q3Ratio (14) and XPRESS (15) applications in TPP. The relative
abundance of a peptide can be calculated, by reconstructing the light and heavy elution
profiles of the precursor ions and by determining the elution areas of each peak. From
Q3Ratio and XPRESS analyses, we obtained the average expression ratio
(mutant/wildtype) for those peptides that were unique to the splice variant protein
identified and had labeled cysteine residue.
5
Michigan Peptide to Protein Integration (MPPI)
In addition to the TPP analysis, we implemented a second analysis based on selecting all
peptide identifications with X!Tandem expect score of <= 0.001. We applied an
integration process to these peptide identifications which greatly reduced the set of
proteins and retained all of the peptide identifications. The integration process was as
follows:
1) A list of all peptide matches was created.
2) The peptide list was ordered by the number of spectra matching each peptide.
3) Peptide with largest number of matching spectra was selected.
4) A list of all proteins containing this peptide was made.
5) The protein list was sorted by the number of spectra matching peptides derived
from the protein.
6) The protein with the largest number of matching spectra and which was identified
by largest number of distinct peptides was selected. When equal numbers of
identifying spectra were present, Ensembl proteins were given preference because
these transcripts have been independently reviewed and Ensembl identifiers can
readily be linked to additional annotation.
7) All peptides contained within this protein were removed from the peptide list.
8) Steps 3-7 were repeated until no peptides remained in the peptide list.
Protein identifications based on a single peptide from this MPPI analysis were retained
only if identified by at least ten distinct spectra. For further analyses we used the union of
protein identifications from TPP analysis with ProteinProphet probability > 0.9 and the
MPPI. To remove redundant protein identifications, we ran another round of MPPI using
all peptides found in either TPP or first phase MPPI (Figure 1).
Sequence analysis for novel proteins
The peptide sequences for which the alternative splice variant proteins were identified,
were searched against the mouse genome (Build 37) using UCSC BLAT (16) browser
and against NR using NCBI blastp (17). In some cases, when the peptide sequences are
short, the blat or blastp programs were not able to align correctly. To handle these cases
6
and verify search results, we further searched the peptide sequences against nr protein
sequences by SQL pattern match. Proteins whose peptide sequences aligned perfectly to
an existing canonical mouse coding sequence were removed from the list of alternatively
spliced protein identifications. The identifications that remain after this round of blat and
blastp analysis must be novel as all their peptides did not precisely match to any known
mouse proteins. We subsequently checked whether any peptides of these novel
identifications matched either partially or completely to any known protein sequences
using blastp. If a match is observed, those identifications were considered as novel splice
variants of known genes.
Validation of the novel peptides by RT-PCRs In order to corroborate the identifications of novel splice variants, peptide sequences with
splice variations from seven novel variants were selected for validation by reverse
transcription polymerase chain reaction (RT-PCR) (Figure 4). We chose these seven
peptide sequences as they were identified by multiple high scoring spectra (X!Tandem
expect value < 0.001) (Supplementary Table 8) and are much less annotated than splice
variants of apolipoproteins, complement component proteins, hemopexin and vitamin D
binding protein, which were also identified. The primers were designed using the Primer3
software (http://frodo.wi.mit.edu) from the cDNA sequences of these 7 proteins in the
ECGene database (Supplementary Table 8). Total RNA was extracted from frozen
pancreatic tissue of wild type and mutant mice using TRIzol reagent (Invitrogen, CA,
USA) in accordance with the manufacturer's instructions. RNA purification was
performed using the RNeasy Mini Kit (Qiagen Inc., Valencia, CA) and Rnase-Free Dnase
digestion (Qiagen Inc., Valencia, CA). Qiagen one Step RNA PCR Kit (AMV) was used
for RT-PCR amplification of the seven novel peptides from total RNA. Primers for
amplifying gamma actin (Forward: 5′- GCGCAAGTACTCTGTGTGGA -3′; Reverse: 5′-
ACATCTGCTGGAAGGTGGAC-3′) were used to amplify the house keeping gene as a
positive control and standard for quantification.
After incubation at 50 °C for 30 min, 1 cycle of 94 °C for 15 min and 40 cycles of 94 °C
30 sec, 50 °C 30 sec, 72 °C 1 min followed by 72 °C 10 min for final extension were
7
performed using the thermal cycler MJ PTC 200 (BioRad, USA). Amplicons were run on
2% agarose gel and visualized under UV light. Images were captured using a gel imaging
system (biostep GmbH, Germany).
Quantitative RT-PCR
Four of these seven novel peptides chosen above for RT-PCR showed differential
expression by TPP expression ratio analyses. These peptides include pyruvate kinase
variant, malate dehydrogenase 1 variant, PCTAIRE-motif protein kinase 2 variant and
solute carrier family 19 (sodium/hydrogen) variant. The mRNA expression levels of these
four novel peptides were measured by quantitative real-time PCR using a QuantiTect
SYBER Green PCR (Qiagen) and ABI Prism 7000 Sequence Detector (Applied
Biosystems). The expression of gamma actin was determined as an internal control. The
PCR amplification reaction and the detection of PCR product was monitored by
measuring the increase in fluorescence intensity caused by the binding of SYBER Green
dye to double-stranded (ds) DNA. The same RT-PCR primers (Supplementary Table 8)
were used in this method. PCR amplification was performed using the following profile:
1 cycle at 50°C for 30min, 1 cycle at 95°C for 10min, and 40 cycles at 94°C for 15s,
60°C for 1min. Calculations for relative quantification were performed as outlined in
User Bulletin #2: ABI Prism 7700 Sequence Detection System (PE Applied Biosystems)
(18).
Since we had access to only a single sample of pancreatic tissue from the wild type and
mutant mice, respectively, we are unable to do biological sample replicates. However, we
performed the quantitative RT-RCR three times using the same two samples to assess
technical errors.
Functional annotation
The gene ontology (GO) annotation file for Mus musculus, was downloaded from
http://www.geneontology.org/GO.current.annotations.shtml site and the GO terms
associated with the parent gene symbols of the splice variants were studied. The
functional annotations of the splice isoforms were done by searching the parent gene
8
names using FuncAssociate (19). FuncAssociate is a web-based tool that accepts as input
a list of genes, and returns a list of GO attributes that are over - (or under-) represented
among the genes in the input list. Only those over- (or under-) representations that are
statistically significant, after correcting for multiple hypotheses testing, are reported.
Results
Summary of protein identifications
The mass spectra derived from plasma protein analysis were searched against the
modified ECgene database using X!Tandem. The empirical false discovery rate (FDR)
calculated based on peptide identifications from reverse protein sequences was < 0.5%
for all peptide identification scoring bins with X!tandem expect score < 0.001
(Supplementary Figure 1). Protein and peptide identifications from the X!Tandem search
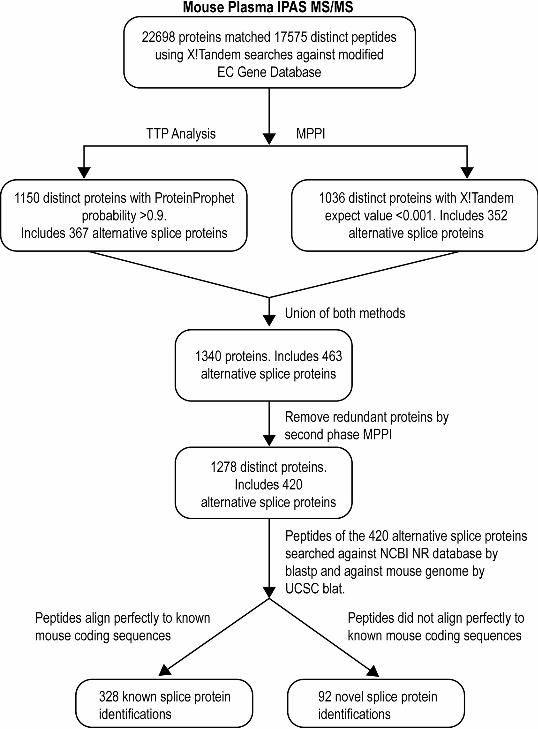
and post-search TPP/MPPI analysis are summarized in Table 1. Figure 1 summarizes the
analysis workflow. TPP analysis of the search results yielded 1150 proteins with
ProteinProphet probability >= 0.9 (FDR for proteins < 1.5%). In parallel, using our MPPI
method (expect < 0.001), we identified a total of 1063 proteins (FDR for proteins < 1.5
%). There were 870 biological proteins identifications and 3 reverse sequences found in
common by both approaches. Thus, the empirical FDR for proteins identified by both
methods is <0.3%. The union of the TPP and MPPI methods resulted in 1340 protein
identifications. There were 467 biological proteins and 22 reverse sequences identified by
either TPP or MPPI but not by both. Thus, the empirical FDR for proteins identified by
either but not both methods is <5%. The reverse sequence proteins identified by TPP and
MPPI analyses were different; since we took the union of protein identifications from
both methods, the false discovery rate at the protein identification level increased.
Taking the union of the two methods introduces some redundancy in identifications so
we applied a second round of MPPI on these 1340 proteins yielding 1278 distinct protein
identifications with 25 proteins from reverse sequence. Of the 1278 protein
identifications, 420 were splice variant proteins (Supplementary Table 1).
9
Novel alternative splice variant protein identifications
To identify novel spliced sequences, we searched the peptide sequences of the 420
alternative splice proteins against the Mouse genome using blat and against NR database
using blastp (see Methods); 92 of 420 alternative splice proteins were identified by
unique peptides that did not align completely with any known mouse coding sequence
(Figure1, Supplementary Table 2). These proteins are considered novel identifications.
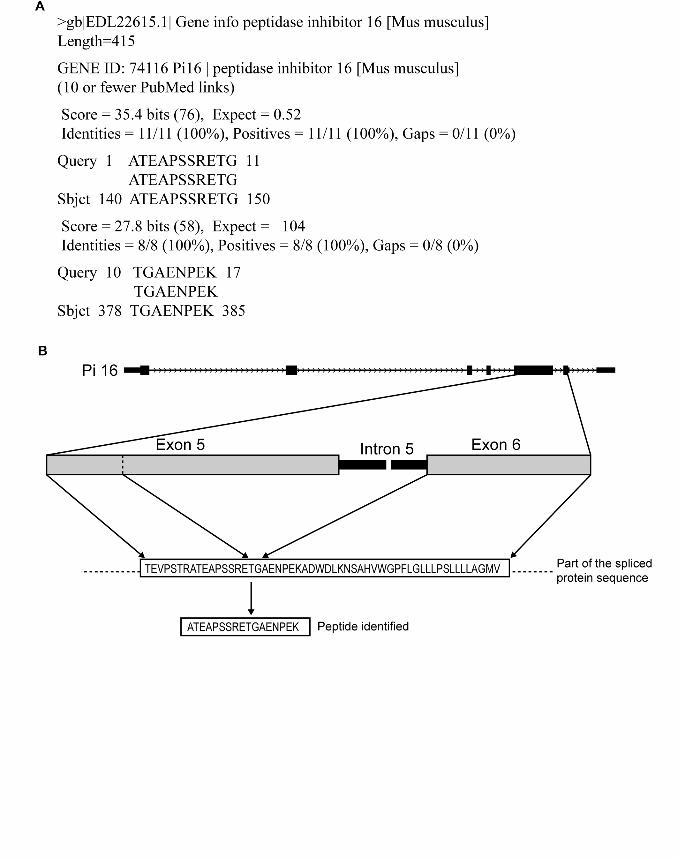
Of these 92 identifications, 84 were novel alternative splice variants of known genes. An
example is the identification of novel variant for peptidase inhibitor 16 (pi16) by the
unique peptide ‘ATEAPSSRETGAENPEK’. Figure 2 shows the alignment of this
peptide to the known pi16 sequence by blastp. The alignment suggests a partial deletion
(230 amino acids) of the exon sequence due to a splicing event resulting in the novel
variant.
For 8 identifications from the 92 novel proteins, neither the complete protein sequence
nor the peptides identified matched even partially to any known mouse proteins by blastp.
(parent gene name and gene symbol is given as null in Supplementary Table 2). However,
we found that the complete protein sequences of these 8 proteins matched perfectly to
various mouse genomic regions (Supplementary Table 3).
Both known and novel variant forms of many genes were found in the 420 protein set.
For example, we found seven variants of alpha-2-HS-glycoprotein including three known
and four novel variant forms. A particularly interesting example is the identification of
known and novel isoforms of muscle pyruvate kinase; the novel alternative splice variant,
‘M9C5102_13_s4154_e5807_1_rf0_c1_n0| ’, was identified by the unique peptide
‘CLAAALIVLTESGR’ from five different spectra. This peptide sequence did not align
to the coding sequence of annotated mouse muscle pyruvate kinase protein. However, it
aligned to human, rat and chicken muscle pyruvate kinase M1 isoform (Figure 3a). The
previously known mouse gene product for muscle pyruvate kinase (pkm2) gene, which is
homologous to the M2 isoform of human and rat pkm2, was identified by 25 distinct
peptides, 22 of which were shared by the novel mouse variant protein. Figure 3b shows
identifications of unique peptides of a known isoform mouse malate dehydrogenase
10
protein and its novel splice form from different clusters of reverse phase fractions; the
isoform exhibits faster mobility by reversed phase chromatography.
Tumor related novel alternative splice variant proteins
By combining the Q3Ratio and XPRESS analyses, we calculated expression ratios for the
cysteine containing unique peptides with splice variation from tumor bearing mice
relative to controls for 28 of 92 novel splice variant proteins (Table 2). The unique
peptides from sixteen variants were identified by multiple spectra, which enabled us to
calculate the 95% confidence intervals for their expression ratios. Splice variants of
malate dehydrogenase 1, muscle pyruvate kinase, proteoglycan 4, complement
component factor H, major urinary protein, vitamin d binding protein and alpha-2-HS-
glycoprotein had the 95% confidence intervals for their expression ratios greater than 1
(Table 2). However, expression ratios of unique peptides of twelve variants were
calculated from single spectrum. Six of these proteins showed greater than two-fold
expression ratios; splice variants of high mobility group box 2 protein and
minichromosome maintenance complex component 9 are in this group. The other six
proteins include novel variants of alpha fetoprotein, peroxiredoxin 2 and solute carrier
family 19 member1.
Alpha fetoprotein, Apolipoprotein e, Ceruloplasmin, Fibronectin, Glyceraldehyde 3
phosphate dehydrogenase, Hemopexin, Peptidylprolyl isomerase, and Tubulin alpha are
among proteins previously identified as involved in pancreatic cancer (20-22). It is
noteworthy that in our 92 novel proteins, we identified the presence of additional novel
alternative splice variants of these proteins.
RT-PCR validations The identifications of novel alternative splice variants were further validated by checking
the mRNA expressions of seven peptide sequences with splice variations (Supplementary
Table 8) by RT-PCR. The results were concordant with our proteomic analysis. All seven
novel peptide coding sequences were amplified in both wild type and mutant samples
(Figure 4a). Amplified sequences ranged in size from 63 -75 bp (Figure 4a). In addition,
11

we did the QT-PCR on four peptides which showed differential expression by TPP
analysis (Figure 4b). The expression profile for novel variants of pkm2 and pctk2 were
similar to what we observed by TPP analysis. However, the expression profiles of novel
variant of mdh1 and sol19a1 were opposite to what we observed from TPP analysis. We
saw decreased mRNA expression of the novel mdh1 peptide in mutant sample versus the
wild type. Even though the unique peptide for sol19a1 variant was identified by multiple
spectra, the expression ratio was calculated by Q3Parser from a single spectrum.
Functional annotations of novel alternative splice variant proteins Gene Ontology (GO) terms associated with the parent gene symbols of the novel splice
variants of known proteins are given in Supplementary Table 4. As expected, many
proteins were extracellular. However, we observed splice variants of such nuclear
proteins as high-mobility group box 2, DEAD box polypeptide 6, nuclear factor
interleukin 3 regulated, and peptidylprolyl isomerase like 2. In the molecular function
category, more splice variants were associated with metal ion binding and endopeptidase
inhibitor activity. Under biological processes, many variants were involved in transport.
Supplementary Table 5 summarizes the list of genes with over-represented GO attributes
using FuncAssociate.
Known alternative splice variant proteins
As mentioned earlier, 420 of the 1278 protein identifications were alternative splice
variant proteins. By sequence analysis of the peptides identified from these 420 proteins,
92 were found as novel splice proteins. The peptides from the remaining 328 protein
identifications matched to sequences from known mouse coding sequences. Variant
proteins of many genes previously reported as involved in pancreatic cancer are in this
list (Supplementary Table 6a). In addition, variants of genes that were reported by other
studies to be involved in other types of cancers are found in this set (Supplementary
Table 6b).
12

Relative expression analysis by Xpress and Q3Proteinparser produced expression ratios
for 81 proteins out of 328 known splice variants (Supplementary Table 7). 48 of them
had greater than two fold expression at 95% or more confidence interval in mutant
samples relative to wild type. According to the analysis, the unique peptide that identified
secreted and transmembrane 1A (sectm1a) showed the highest fold change in mutant
samples. This protein was reported to have potential importance in hematopoietic and/or
immune system processes (23).
Ten possible pancreatic cancer biomarkers were chosen by a parallel study on the same
mouse model plasma samples (24). Variants of three of these genes are found in our list
of 420 splice variant proteins: lipocalin2 (lcn2), regenerating islet-derived 3 (reg3a) and
TNF receptor superfamily, member 1A (tnfrsf1a). According to our expression analysis,
tnfrsf1a showed > 2-fold change in expression in tumor samples compared to wild type.
Discussion
Alternative splicing allows a single gene to generate multiple mRNAs, which can be
translated into functionally and structurally diverse proteins (25). One gene can have
multiple variants coexisting at different concentrations, so estimating the relative
abundance of each variant may be important for the study of its biological role (25). As
reported here, 1278 distinct proteins (Figure 1) were identified from the union of TPP and
MPPI analyses; 92 proteins were novel proteins. Successful RT-PCR amplifications of all
seven selected novel peptide coding sequences from both wild type and mutant samples
validated our protein identifications (Figure 4).
In 28 of the 92 novel variants identified, expression ratios were quantified for mutant and
wild-type plasma samples (Table 2). The main reasons why expression ratios could not
be quantified in other cases are the small proportion of cysteine-containing peptides (site
of labeling) in the 92 splice variants identified; 774 of 2513 peptides from 92 splice
variants contain cysteine residues. Further, the XPRESS and Q3Ratio quantification
software reported only ‘heavy’ or ‘light’ expression for many peptides; to quantify the
relative expression ratio, both values are needed. The quantifications of mRNA
13
expression by QT-PCR were concordant with protein expression for two of the four
peptides verified. The inverse correlation observed mRNA-protein expression in the other
two peptides might be due to numerous factors, including negative feedback by the
protein variant on mRNA synthesis, post-transcriptional control of protein translation,
and protein modifications. There are several studies showing varying correlation between
mRNA and protein abundance ratios (26, 27). Guo et al (28), in their correlation analyses
on mRNA-protein expression in freshly isolated human circulating monocytes, found
some genes with moderate and varied correlations, suggesting that mRNA expression
might be sometimes useful, but is not reliable in predicting protein expression levels.
Many of the known protein variants that we identified have been reported as involved in
pancreatic or other types of cancer, some with significant differential expression, such as
acyl co-A acetyltransferase, chromogranin b, granulin, insulin like growth factor binding
protein 2 and regenerating islet-derived 3 alpha (Supplementary Table 6 for citations,
Supplementary Table 7 for expression ratios).
The focus of our work is on the novel variants, of which we annotate eight. First, we
highlight three novel splice proteins with > 2-fold increase in mutant plasma compared to
wild type which may have potential role in progression of pancreatic cancer: pyruvate
kinase (pkm2), proteoglycan 4 (prg4) and malate dehydrogenase 1 (mdh1). The 95%
confidence intervals for their > 2-fold expression ratios exclude unity.
Pyruvate kinase, a glycolytic enzyme, catalyzes transfer of a phosphoryl group from
phosphoenolpyruvate (PEP) to ADP, generating ATP. Most adult tissues express the M1
isoform of pyruvate kinase whereas embryonic tissues and tumors express the M2
isoform. Christofk et al (29, 30) demonstrated that the M2 isoform of muscle pyruvate
kinase accounts for the long known distinctive Warburg effect of shift to aerobic
glycolysis in tumor cells. The novel mouse peptide sequence ‘CLAAALIVLTESGR’
with which we identified the novel splice variant of muscle pyruvate kinase was from
five different spectra, authenticating the occurrence of this variant. In addition, our study
shows that the mRNA and peptide expressions of this novel variant were positively
14
correlated for this gene and show increased expression in mutant samples compared to
wild type. The peptide sequence is identical to the human, rat and chicken pyruvate
kinase M1 variant (Figure 3a). A second variant of pyruvate kinase, M2 type pyruvate
kinase, was also identified in our 420 alternative splice isoform list. All the 25 peptides
identified in this protein aligned completely with known mouse coding sequence. Studies
by Kumar et al (31) and Ventrucci et al (32) report tumor type pkm2 as a metabolic
marker specifically for pancreatic cancer.
Prg4 has been identified as megakaryocyte stimulating factor and articular superficial
zone protein. Prg4 has characteristic motifs including somatomedin B and hemopexin
domains, a chondroitin sulfate-attachment site and mucin-like repeats (33). The specific
role of prg4 in the articular joint has previously been reported; however, the presence of
multi-functional motifs and the identification of a novel variant suggest that prg4
functions in several distinctive biological processes. Faca et al (24) observed an increased
gene expression of isoform E of prg4 in human pancreatic cancer samples.
Mdh1 is an enzyme in the citric acid cycle that catalyzes the conversion of malate into
oxaloacetate and vice versa. It also plays a role in gluconeogenesis. Impaired oxidative
metabolism may contribute to malignant growth (34). Mdh1 has been reported as over-
expressed in thyroid oncocytic tumors (35). Over-expression of the novel variant of mdh1
in our study suggests that cellular energy pathways may play an important functional role
in tumor progression..
The novel peptide ‘CELAEQMTSLLER’ was identified by eight different spectra. Both
mRNA and protein expression of this peptide were down regulated in mutant samples
when compared to that of wild type. Blasting this peptide sequence against NCBI-nr
database showed that part of the peptide ‘ELAEQMT’ aligned perfectly with mouse
PCTAIRE-motif protein kinase 2 (pctk2). Valladares et al (36) showed over-expression
of pctk2 in breast cancer samples from Mexican women. The PCTAIRE protein kinases
comprise a distinct subfamily of the cell division controller 2 (cdc2) related
serine/threonine-specific protein kinases. Deregulation of cell-cycle control is thought to
15
be a crucial event in malignant transformation. Guo et al (37) demonstrate an important
role of cdc25b in cell-cycle progression, raising the possibility that inhibition of cdc25b
may have therapeutic potential in pancreatic cancer.
Another novel variant with increased expression in our peptide expression analysis is
minichromosome maintenance complex component 9 variant. MCM proteins are well-
known regulators of the cell cycle. Mcm9 binds to chromatin in an ORC-dependent
manner and is required for the recruitment of the Mcm2-7 helicase onto chromatin (38).
Further, MCM family members 2 and 5 are markers of aggressive cervical and other
cancers (39). Mcm9 and mdh1 have not been reported as involved in pancreatic cancer.
It would be interesting to investigate potential roles of these novel variants in pancreatic
cancers.
A splice variant of high mobility group box 2 (hmgb2) showed > 2-fold increase in
expression in mutant samples. Hmgb2 is involved in DNA repair. It has not been reported
as upregulated in pancreatic cancer, but this gene is located at 4q32-34, a region
identified as a potential locus for familial pancreatic cancer in a large American family
(40).
Another interesting protein is the novel splice variant of hepatocyte growth factor
activator (hgfa), a serine protease that converts the inactive single-chain precursor of
hepatocyte growth factor (hgf) to the active heterodimer in response to tissue injury (41).
Results from Lee et al (42) suggest that extracellular receptor kinase activation by hgf
might be important in pancreatic cancer metastasis.
We found many novel splice variants to glyceraldehyde-3-phosphate dehydrogenase
(gapdh), another critical enzyme in glycolysis. Gapdh mRNA levels are over-expressed
in many cancers; relative levels correlate with pathologic stage in prostate cancer (43-45).
Chen et al (21) observed > 2-fold increase of gapdh in pancreatic cancer tissue using
isotope-coded affinity tag (ICAT) technology followed by mass spectrometry.
16

The ECgene (http://genome.ewha.ac.kr/ECgene/) database uses the ECgene gene
prediction algorithm to identify splice variants by EST clustering. Three levels of
confidence (high, medium and low) were set on the gene models based on mRNA
evidence (13). The custom built ECgene database used for our study has another layer of
complexity which is the 3-frame translation of ECgene sequences of predicted gene
models, which makes it feasible to identify novel proteins. We found 8 proteins where no
peptides matched to any known mouse protein sequences by blastp analysis
(Supplementary Table 3); Three proteins (M14C7677_1_s356_e431_1_rf1_c1_n0|,
M5C5274_1_s2_e95_1_rf0_c1_n0|, and M1C10834_9_s770_e824_1_rf2_c1_n0| ) had
differential expression in mutant samples relative to wild type. Further investigation of
these novel proteins in pancreatic cancer appears warranted.
One focus in cancer biomarker discovery is driven by the approach that the most
promising plasma biomarkers will be secreted proteins (46). Gene Onotology analysis of
the novel splice variants by FuncAssociate showed extracellular as a top-ranking attribute
(Supplementary Table 5). Interestingly, the unique peptide with which we identified the
novel protein M5C6460_1_s86_e1988_1_rf0_c1_n0| had a 71% sequence similarity to
the peptide sequence of the extracellular protein, alpha fetoprotein, a 'gold-standard' in
the field of tumor markers (47). According to FuncAssociate analysis, endopeptidase
inhibitor/endoproteinase inhibitor/proteinase inhibitor activity (GO: 0004866) is a top-
ranking Gene Ontology attribute. Imbalanced protease activity has long been recognized
in progression of cancers and inflammation (48). Other high-ranking biological processes
are glucose metabolism and lipid transport. There are many studies linking impaired
glucose metabolism and pancreatic cancer (49, 50). Supplementary Table 4 shows
aldolase c, gapdh, mdh1 and pkm2 as genes involved in glucose metabolism. The
differential expression for novel alternative splice variants of gapdh, and mdh1 suggest
involvement of these splice variants in tumors.
The combined proteomic and bioinformatic approach in this study has identified many
novel splice variant proteins, including many with differential expression in plasma from
mutant mice with KrasG12D/Ink4a/Arf mediated pancreatic cancer versus wild type mice.
17
These differentially-expressed splice variant proteins may influence many cancer-related
mechanisms. The data suggest that alternative splice variant proteins are a potentially rich
source of candidate biomarkers for cancers.
Acknowledgement The authors thank Dr. Thomas Blackwell for giving helpful suggestions in statistical
analysis.
References 1. Klinck R, Bramard A, Inkel L, et al. Multiple alternative splicing markers for ovarian cancer. Cancer Res 2008;68(3):657-63. 2. Thorsen K, Sorensen KD, Brems-Eskildsen AS, et al. Alternative splicing in colon, bladder, and prostate cancer identified by exon-array analysis. Mol Cell Proteomics 2008:M700590-MCP200. 3. Larsson TP, Murray CG, Hill T, Fredriksson R, Schioth HB. Comparison of the current RefSeq, Ensembl and EST databases for counting genes and gene discovery. FEBS Letters 2005;579(3):690-8. 4. Kim P, Kim N, Lee Y, Kim B, Shin Y, Lee S. ECgene: genome annotation for alternative splicing. Nucl Acids Res 2005;33(suppl_1):D75-9. 5. Fermin D, Allen B, Blackwell T, et al. Novel gene and gene model detection using a whole genome open reading frame analysis in proteomics. Genome Biology 2006;7(4):R35. 6. Wang R, Prince JT, Marcotte EM. Mass spectrometry of the M. smegmatis proteome: Protein expression levels correlate with function, operons, and codon bias. Genome Res 2005;15(8):1118-26. 7. Ideker T, Thorsson V, Ranish JA, et al. Integrated Genomic and Proteomic Analyses of a Systematically Perturbed Metabolic Network. Science 2001;292(5518):929-34. 8. Hanash SM, Pitteri SJ, Faca VM. Mining the plasma proteome for cancer biomarkers. Nature 2008;452(7187):571-9. 9. Bardeesy N, Aguirre AJ, Chu GC, et al. From the Cover: Both p16Ink4a and the p19Arf-p53 pathway constrain progression of pancreatic adenocarcinoma in the mouse. Proceedings of the National Academy of Sciences 2006;103(15):5947-52. 10. Aguirre AJ, Bardeesy N, Sinha M, et al. Activated Kras and Ink4a/Arf deficiency cooperate to produce metastatic pancreatic ductal adenocarcinoma in the mouse. Genes Dev 2003:1158703. 11. Wang H, Clouthier SG, Galchev V, et al. Intact-protein-based High-resolution Three-dimensional Quantitative Analysis System for Proteome Profiling of Biological Fluids. Mol Cell Proteomics 2005;4(5):618-25. 12. Craig R, Beavis RC. TANDEM: matching proteins with tandem mass spectra. Bioinformatics 2004;20(9):1466-7.
18
13. Kim N, Shin S, Lee S. ECgene: Genome-based EST clustering and gene modeling for alternative splicing. Genome Res 2005;15(4):566-76. 14. Faca V, Coram M, Phanstiel D, et al. Quantitative Analysis of Acrylamide Labeled Serum Proteins by LC-MS/MS. J Proteome Res 2006;5(8):2009-18. 15. Han DK, Eng J, Zhou H, Aebersold R. Quantitative profiling of differentiation-induced microsomal proteins using isotope-coded affinity tags and mass spectrometry. Nat Biotech 2001;19(10):946-51. 16. Kent WJ. BLAT---The BLAST-Like Alignment Tool. Genome Res 2002;12(4):656-64. 17. McGinnis S, Madden TL. BLAST: at the core of a powerful and diverse set of sequence analysis tools. Nucl Acids Res 2004;32(suppl_2):W20-5. 18. Livak K. ABI Prism 7700 Sequence Detection System. . User Bulletin 2 PE Applied Biosystems 1997. 19. Berriz GF, King OD, Bryant B, Sander C, Roth FP. Characterizing gene sets with FuncAssociate. Bioinformatics 2003;19(18):2502-4. 20. Gronborg M, Kristiansen TZ, Iwahori A, et al. Biomarker Discovery from Pancreatic Cancer Secretome Using a Differential Proteomic Approach. Mol Cell Proteomics 2006;5(1):157-71. 21. Chen R, Brentnall TA, Pan S, et al. Quantitative Proteomics Analysis Reveals That Proteins Differentially Expressed in Chronic Pancreatitis Are Also Frequently Involved in Pancreatic Cancer. Mol Cell Proteomics 2007;6(8):1331-42. 22. Matsueda K, Yamamoto H, Yoshida Y, Notohara K. Hepatoid carcinoma of the pancreas producing protein induced by vitamin K absence or antagonist II (PIVKA-II) and α-fetoprotein (AFP). Journal of Gastroenterology 2006;41(10):1011-9. 23. Slentz-Kesler KA, Hale LP, Kaufman RE. Identification and Characterization of K12 (SECTM1), a Novel Human Gene That Encodes a Golgi-Associated Protein with Transmembrane and Secreted Isoforms. Genomics 1998;47(3):327-40. 24. Faca VM, Song KS, Wang H, et al. A Mouse to Human Search for Plasma Proteome Changes Associated with Pancreatic Tumor Development. PLoS Medicine 2008;5(6):e123. 25. Wang H, Hubbell E, Hu J-s, et al. Gene structure-based splice variant deconvolution using a microarry platform. Bioinformatics 2003;19(suppl_1):i315-22. 26. Gygi SP, Rochon Y, Franza BR, Aebersold R. Correlation between Protein and mRNA Abundance in Yeast. Mol Cell Biol 1999;19(3):1720-30. 27. Washburn MP, Koller A, Oshiro G, et al. Protein pathway and complex clustering of correlated mRNA and protein expression analyses in Saccharomycescerevisiae. Proceedings of the National Academy of Sciences of the United States of America 2003;100(6):3107-12. 28. Yanfang Guo PXSLFDGGXYLXCLLSWYCHJLTJXXZSL. How is mRNA expression predictive for protein expression? A correlation study on human circulating monocytes. Acta Biochimica et Biophysica Sinica 2008;40(5):426-36. 29. Christofk HR, Vander Heiden MG, Harris MH, et al. The M2 splice isoform of pyruvate kinase is important for cancer metabolism and tumour growth. Nature 2008;452(7184):230-3. 30. Christofk HR, Vander Heiden MG, Wu N, Asara JM, Cantley LC. Pyruvate kinase M2 is a phosphotyrosine-binding protein. Nature 2008;452(7184):181-6.
19
31. Kumar Y, Gurusamy K, Pamecha V, Davidson B. Tumor m2-pyruvate kinase as tumor marker in exocrine pancreatic cancer a meta-analysis. Pancreas 2007;35(2):114-9. 32. Ventrucci M, Cipolla A, Racchini C, Casadei R, Simoni P, Gullo L. Tumor M2-Pyruvate Kinase, a New Metabolic Marker for Pancreatic Cancer. Digestive Diseases and Sciences 2004;49(7):1149-55. 33. Ikegawa S, Sano M, Koshizuka Y, Nakamura Y. Isolation, characterization and mapping of the mouse and human PRG4 (proteoglycan 4) genes. Cytogenetic and Genome Research 2000;90(3-4):291-7. 34. Ristow. Oxidative metabolism in cancer growth. Current opinion in clinical nutrition and metabolic care 2006;9(4):339-45. 35. Baris O, Savagner F, Nasser V, et al. Transcriptional Profiling Reveals Coordinated Up-Regulation of Oxidative Metabolism Genes in Thyroid Oncocytic Tumors. J Clin Endocrinol Metab 2004;89(2):994-1005. 36. Valladares A, Hernández NG, Gómez FS, et al. Genetic expression profiles and chromosomal alterations in sporadic breast cancer in Mexican women. Cancer Genetics and Cytogenetics 2006;170(2):147-51. 37. Guo J, Kleeff J, Li J, et al. Expression and functional significance of CDC25B in human pancreatic ductal adenocarcinoma. Oncogene;23(1):71-81. 38. Lutzmann M, Méchali M. MCM9 Binds Cdt1 and Is Required for the Assembly of Prereplication Complexes. Molecular Cell 2008;31(2):190-200. 39. Gonzalez MA, Tachibana KE, Laskey RA, Coleman N. Control of DNA replication and its potential clinical exploitation. Nat Rev Cancer 2005;5(2):135-41. 40. Earl J, Yan L, Vitone LJ, et al. Evaluation of the 4q32-34 Locus in European Familial Pancreatic Cancer. Cancer Epidemiol Biomarkers Prev 2006;15(10):1948-55. 41. Miyazawa K, Shimomura T, Kitamura N. Activation of Hepatocyte Growth Factor in the Injured Tissues Is Mediated by Hepatocyte Growth Factor Activator. J Biol Chem 1996;271(7):3615-8. 42. Lee K, Hyun M, KIm J-R. Growth factor-dependent activation of the MAPK pathway in human pancreatic cancer: MEK/ERK and p38 MAP kinase interaction in uPA synthesis. Clinical & Experimental Metastasis 2003;20(6):499-505. 43. Tokunaga K, Nakamura Y, Sakata K, et al. Enhanced Expression of a Glyceraldehyde-3-phosphate Dehydrogenase Gene in Human Lung Cancers. Cancer Res 1987;47(21):5616-9. 44. Schek N, Hall BL, Finn OJ. Increased Glyceraldehyde-3-phosphate Dehydrogenase Gene Expression in Human Pancreatic Adenocarcinoma. Cancer Res 1988;48(22):6354-9. 45. Rondinelli R, Epner D, Tricoli J. Increased glyceraldehyde-3-phosphate dehydrogenase gene expression in late pathological stage human prostate cancer. Prostate Cancer 1997;1(2):66-72. 46. Diamandis EP, van der Merwe D-E. Plasma Protein Profiling by Mass Spectrometry for Cancer Diagnosis: Opportunities and Limitations. Clin Cancer Res 2005;11(3):963-5. 47. Mizejewski GJ. Biological role of α-fetoprotein in cancer: prospects for anticancer therapy. Expert Review of Anticancer Therapy 2002;2(6):709-35. 48. Badola S, Spurling H, Robison K, et al. Correlation of serpin-protease expression by comparative analysis of real-time PCR profiling data. Genomics 2006;88(2):173-84.
20

49. Gapstur SM, Gann PH, Lowe W, Liu K, Colangelo L, Dyer A. Abnormal Glucose Metabolism and Pancreatic Cancer Mortality. JAMA 2000;283(19):2552-8. 50. Permert J, Ihse I, Jorfeldt L, Von Schneck H, Arnqvist H, Larsson J. Pancreatic cancer is associated with impaired glucose metabolism. European Journal of Surgery 1993;159(2):101-7.
21
1
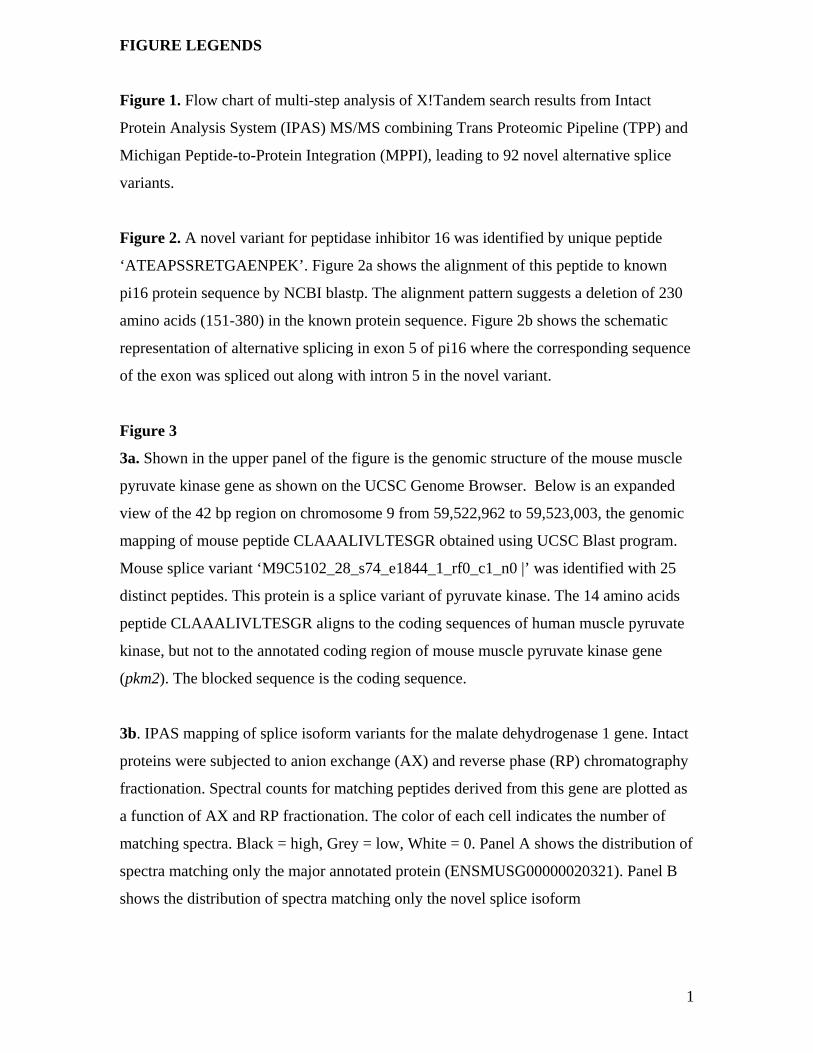
FIGURE LEGENDS
Figure 1. Flow chart of multi-step analysis of X!Tandem search results from Intact
Protein Analysis System (IPAS) MS/MS combining Trans Proteomic Pipeline (TPP) and
Michigan Peptide-to-Protein Integration (MPPI), leading to 92 novel alternative splice
variants.
Figure 2. A novel variant for peptidase inhibitor 16 was identified by unique peptide
‘ATEAPSSRETGAENPEK’. Figure 2a shows the alignment of this peptide to known
pi16 protein sequence by NCBI blastp. The alignment pattern suggests a deletion of 230
amino acids (151-380) in the known protein sequence. Figure 2b shows the schematic
representation of alternative splicing in exon 5 of pi16 where the corresponding sequence
of the exon was spliced out along with intron 5 in the novel variant.
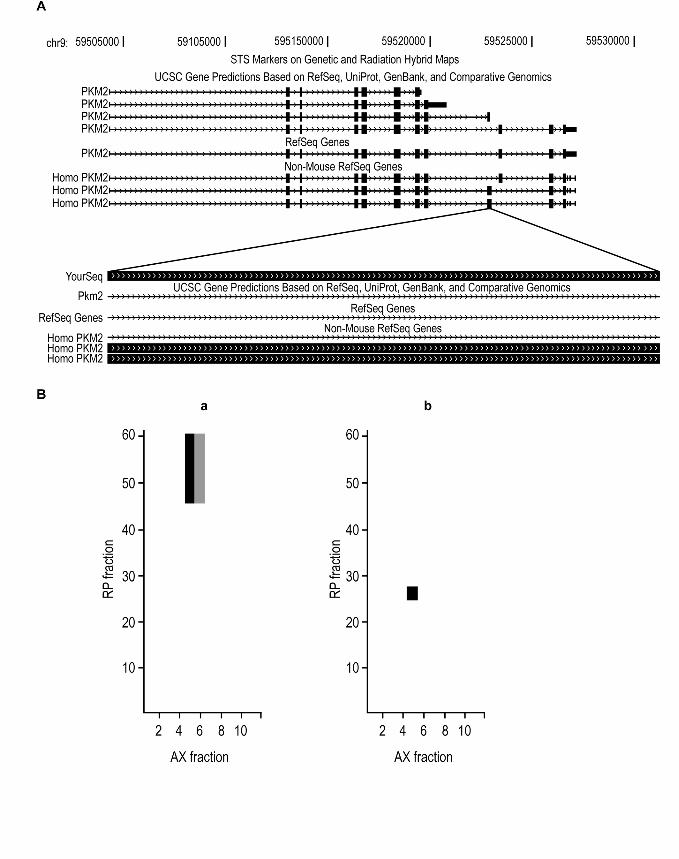
Figure 3
3a. Shown in the upper panel of the figure is the genomic structure of the mouse muscle
pyruvate kinase gene as shown on the UCSC Genome Browser. Below is an expanded
view of the 42 bp region on chromosome 9 from 59,522,962 to 59,523,003, the genomic
mapping of mouse peptide CLAAALIVLTESGR obtained using UCSC Blast program.
Mouse splice variant ‘M9C5102_28_s74_e1844_1_rf0_c1_n0 |’ was identified with 25
distinct peptides. This protein is a splice variant of pyruvate kinase. The 14 amino acids
peptide CLAAALIVLTESGR aligns to the coding sequences of human muscle pyruvate
kinase, but not to the annotated coding region of mouse muscle pyruvate kinase gene
(pkm2). The blocked sequence is the coding sequence.
3b. IPAS mapping of splice isoform variants for the malate dehydrogenase 1 gene. Intact
proteins were subjected to anion exchange (AX) and reverse phase (RP) chromatography
fractionation. Spectral counts for matching peptides derived from this gene are plotted as
a function of AX and RP fractionation. The color of each cell indicates the number of
matching spectra. Black = high, Grey = low, White = 0. Panel A shows the distribution of
spectra matching only the major annotated protein (ENSMUSG00000020321). Panel B
shows the distribution of spectra matching only the novel splice isoform
2
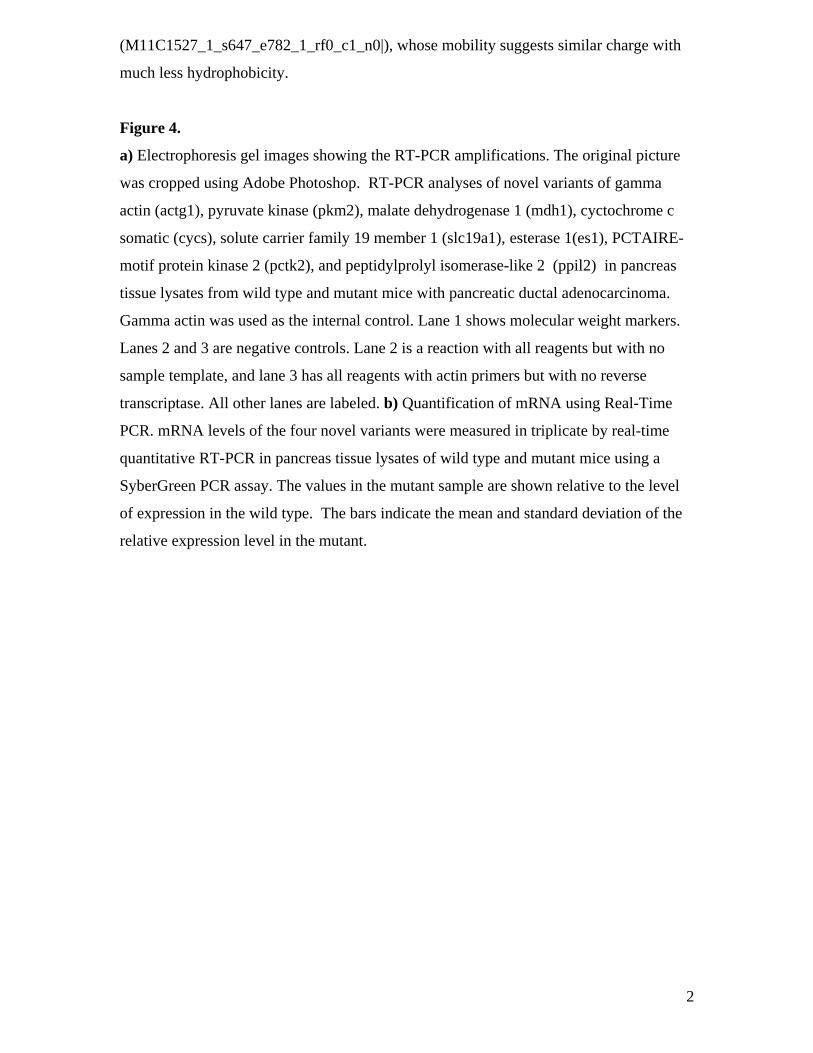
(M11C1527_1_s647_e782_1_rf0_c1_n0|), whose mobility suggests similar charge with
much less hydrophobicity.
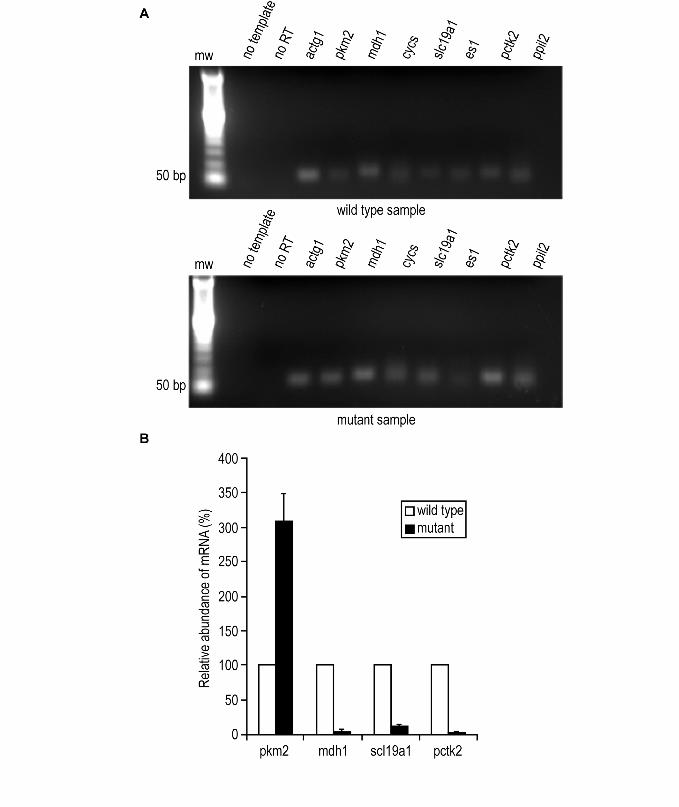
Figure 4.
a) Electrophoresis gel images showing the RT-PCR amplifications. The original picture
was cropped using Adobe Photoshop. RT-PCR analyses of novel variants of gamma
actin (actg1), pyruvate kinase (pkm2), malate dehydrogenase 1 (mdh1), cyctochrome c
somatic (cycs), solute carrier family 19 member 1 (slc19a1), esterase 1(es1), PCTAIRE-
motif protein kinase 2 (pctk2), and peptidylprolyl isomerase-like 2 (ppil2) in pancreas
tissue lysates from wild type and mutant mice with pancreatic ductal adenocarcinoma.
Gamma actin was used as the internal control. Lane 1 shows molecular weight markers.
Lanes 2 and 3 are negative controls. Lane 2 is a reaction with all reagents but with no
sample template, and lane 3 has all reagents with actin primers but with no reverse
transcriptase. All other lanes are labeled. b) Quantification of mRNA using Real-Time
PCR. mRNA levels of the four novel variants were measured in triplicate by real-time
quantitative RT-PCR in pancreas tissue lysates of wild type and mutant mice using a
SyberGreen PCR assay. The values in the mutant sample are shown relative to the level
of expression in the wild type. The bars indicate the mean and standard deviation of the
relative expression level in the mutant.
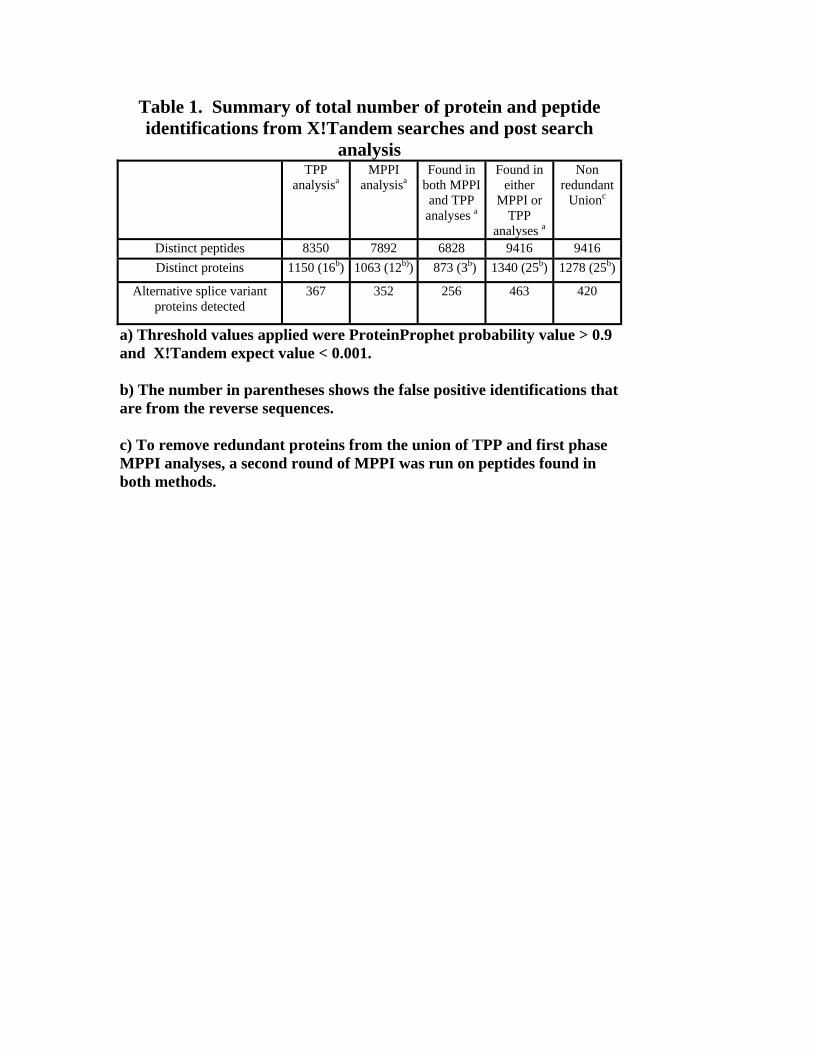
Table 1. Summary of total number of protein and peptide identifications from X!Tandem searches and post search
analysis TPP
analysisa MPPI
analysisa Found in
both MPPI and TPP
analyses a
Found in either
MPPI or TPP
analyses a
Non redundant
Unionc
Distinct peptides 8350 7892 6828 9416 9416 Distinct proteins 1150 (16b) 1063 (12b)) 873 (3b) 1340 (25b) 1278 (25b)
Alternative splice variant proteins detected
367 352 256 463 420
a) Threshold values applied were ProteinProphet probability value > 0.9 and X!Tandem expect value < 0.001. b) The number in parentheses shows the false positive identifications that are from the reverse sequences. c) To remove redundant proteins from the union of TPP and first phase MPPI analyses, a second round of MPPI was run on peptides found in both methods.
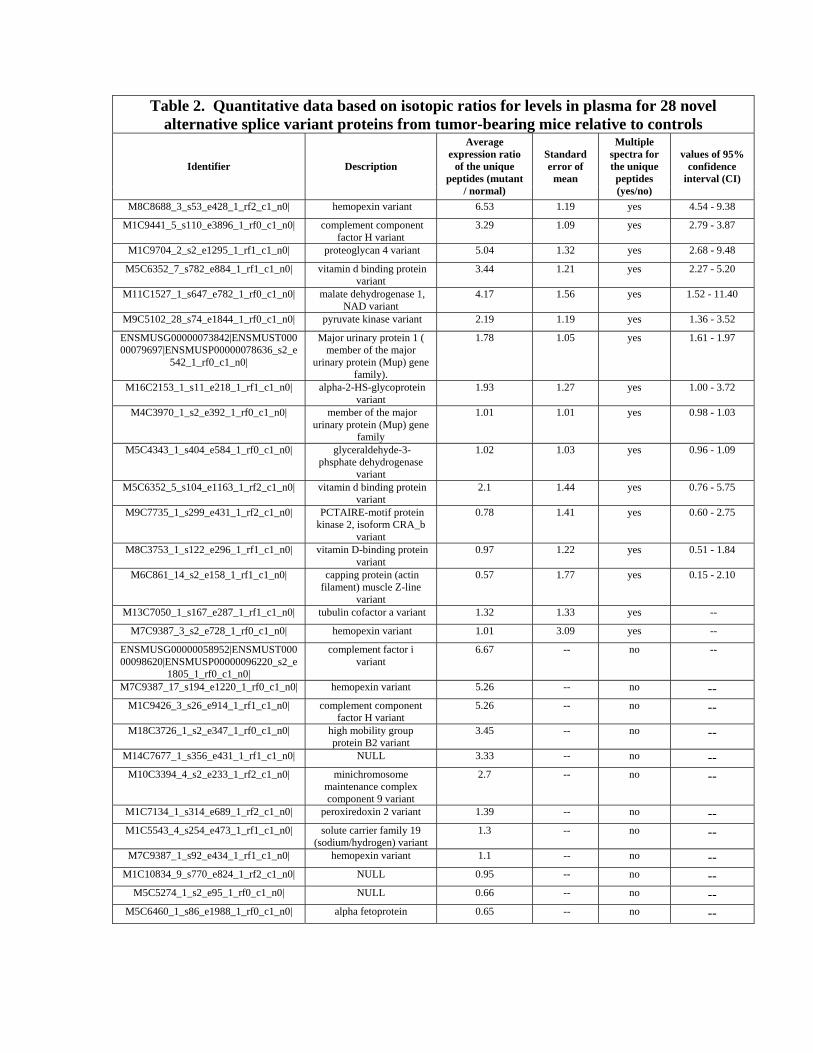
Table 2. Quantitative data based on isotopic ratios for levels in plasma for 28 novel alternative splice variant proteins from tumor-bearing mice relative to controls
Identifier Description
Average expression ratio
of the unique peptides (mutant
/ normal)
Standard error of
mean
Multiple spectra for the unique peptides (yes/no)
values of 95% confidence
interval (CI)
M8C8688_3_s53_e428_1_rf2_c1_n0| hemopexin variant 6.53 1.19 yes 4.54 - 9.38
M1C9441_5_s110_e3896_1_rf0_c1_n0| complement component factor H variant
3.29 1.09 yes 2.79 - 3.87
M1C9704_2_s2_e1295_1_rf1_c1_n0| proteoglycan 4 variant 5.04 1.32 yes 2.68 - 9.48
M5C6352_7_s782_e884_1_rf1_c1_n0| vitamin d binding protein variant
3.44 1.21 yes 2.27 - 5.20
M11C1527_1_s647_e782_1_rf0_c1_n0| malate dehydrogenase 1, NAD variant
4.17 1.56 yes 1.52 - 11.40
M9C5102_28_s74_e1844_1_rf0_c1_n0| pyruvate kinase variant 2.19 1.19 yes 1.36 - 3.52
ENSMUSG00000073842|ENSMUST00000079697|ENSMUSP00000078636_s2_e
542_1_rf0_c1_n0|
Major urinary protein 1 ( member of the major
urinary protein (Mup) gene family).
1.78 1.05 yes 1.61 - 1.97
M16C2153_1_s11_e218_1_rf1_c1_n0| alpha-2-HS-glycoprotein variant
1.93 1.27 yes 1.00 - 3.72
M4C3970_1_s2_e392_1_rf0_c1_n0| member of the major urinary protein (Mup) gene
family
1.01 1.01 yes 0.98 - 1.03
M5C4343_1_s404_e584_1_rf0_c1_n0| glyceraldehyde-3-phsphate dehydrogenase
variant
1.02 1.03 yes 0.96 - 1.09
M5C6352_5_s104_e1163_1_rf2_c1_n0| vitamin d binding protein variant
2.1 1.44 yes 0.76 - 5.75
M9C7735_1_s299_e431_1_rf2_c1_n0| PCTAIRE-motif protein kinase 2, isoform CRA_b
variant
0.78 1.41 yes 0.60 - 2.75
M8C3753_1_s122_e296_1_rf1_c1_n0| vitamin D-binding protein variant
0.97 1.22 yes 0.51 - 1.84
M6C861_14_s2_e158_1_rf1_c1_n0| capping protein (actin filament) muscle Z-line
variant
0.57 1.77 yes 0.15 - 2.10
M13C7050_1_s167_e287_1_rf1_c1_n0| tubulin cofactor a variant 1.32 1.33 yes --
M7C9387_3_s2_e728_1_rf0_c1_n0| hemopexin variant 1.01 3.09 yes --
ENSMUSG00000058952|ENSMUST00000098620|ENSMUSP00000096220_s2_e
1805_1_rf0_c1_n0|
complement factor i variant
6.67 -- no --
M7C9387_17_s194_e1220_1_rf0_c1_n0| hemopexin variant 5.26 -- no -- M1C9426_3_s26_e914_1_rf1_c1_n0| complement component
factor H variant 5.26 -- no --
M18C3726_1_s2_e347_1_rf0_c1_n0| high mobility group protein B2 variant
3.45 -- no --
M14C7677_1_s356_e431_1_rf1_c1_n0| NULL 3.33 -- no -- M10C3394_4_s2_e233_1_rf2_c1_n0| minichromosome
maintenance complex component 9 variant
2.7 -- no --
M1C7134_1_s314_e689_1_rf2_c1_n0| peroxiredoxin 2 variant 1.39 -- no -- M1C5543_4_s254_e473_1_rf1_c1_n0| solute carrier family 19
(sodium/hydrogen) variant 1.3 -- no --
M7C9387_1_s92_e434_1_rf1_c1_n0| hemopexin variant 1.1 -- no -- M1C10834_9_s770_e824_1_rf2_c1_n0| NULL 0.95 -- no --
M5C5274_1_s2_e95_1_rf0_c1_n0| NULL 0.66 -- no -- M5C6460_1_s86_e1988_1_rf0_c1_n0| alpha fetoprotein 0.65 -- no --